Análisis del portátil Alienware x17 R2: Rendimiento máximo de 175 W GeForce RTX 3080 Ti
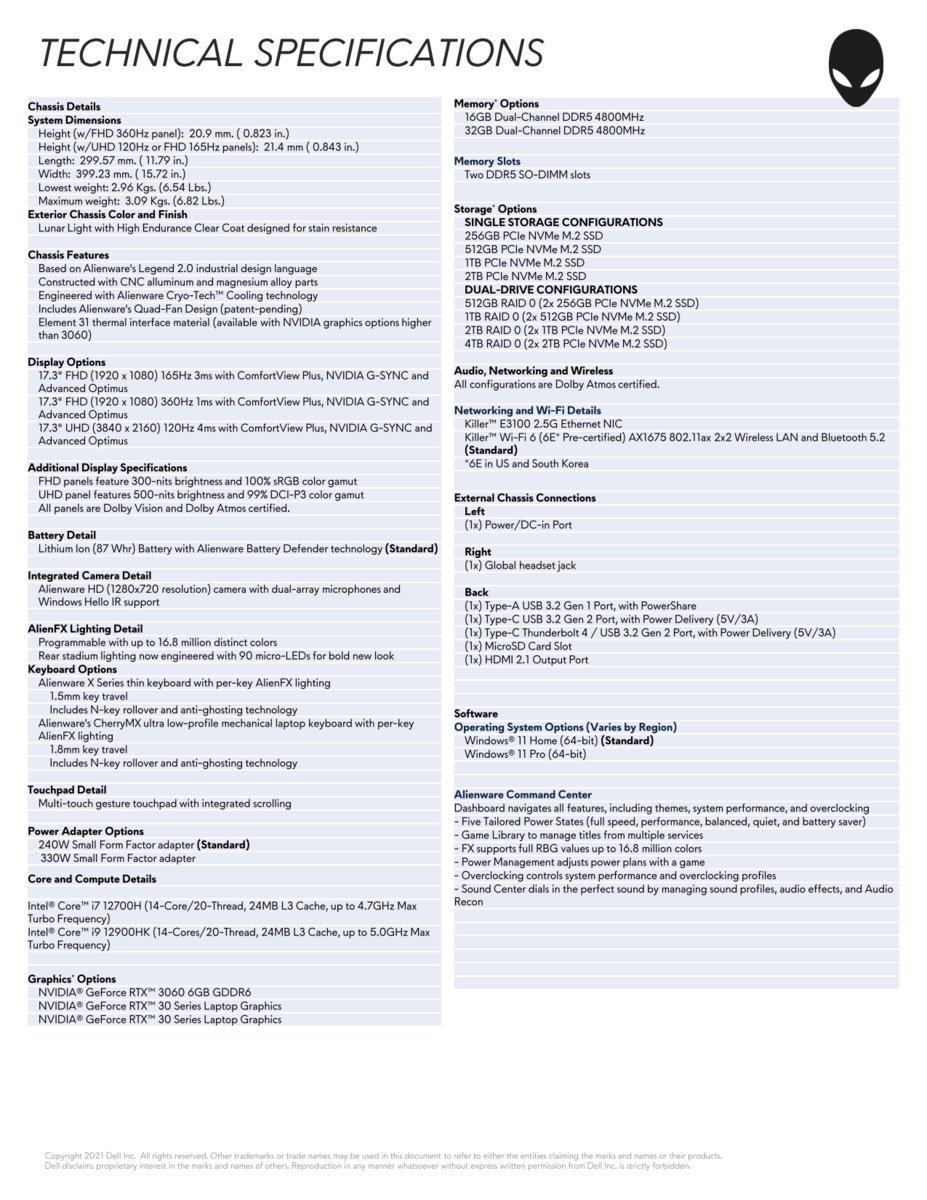
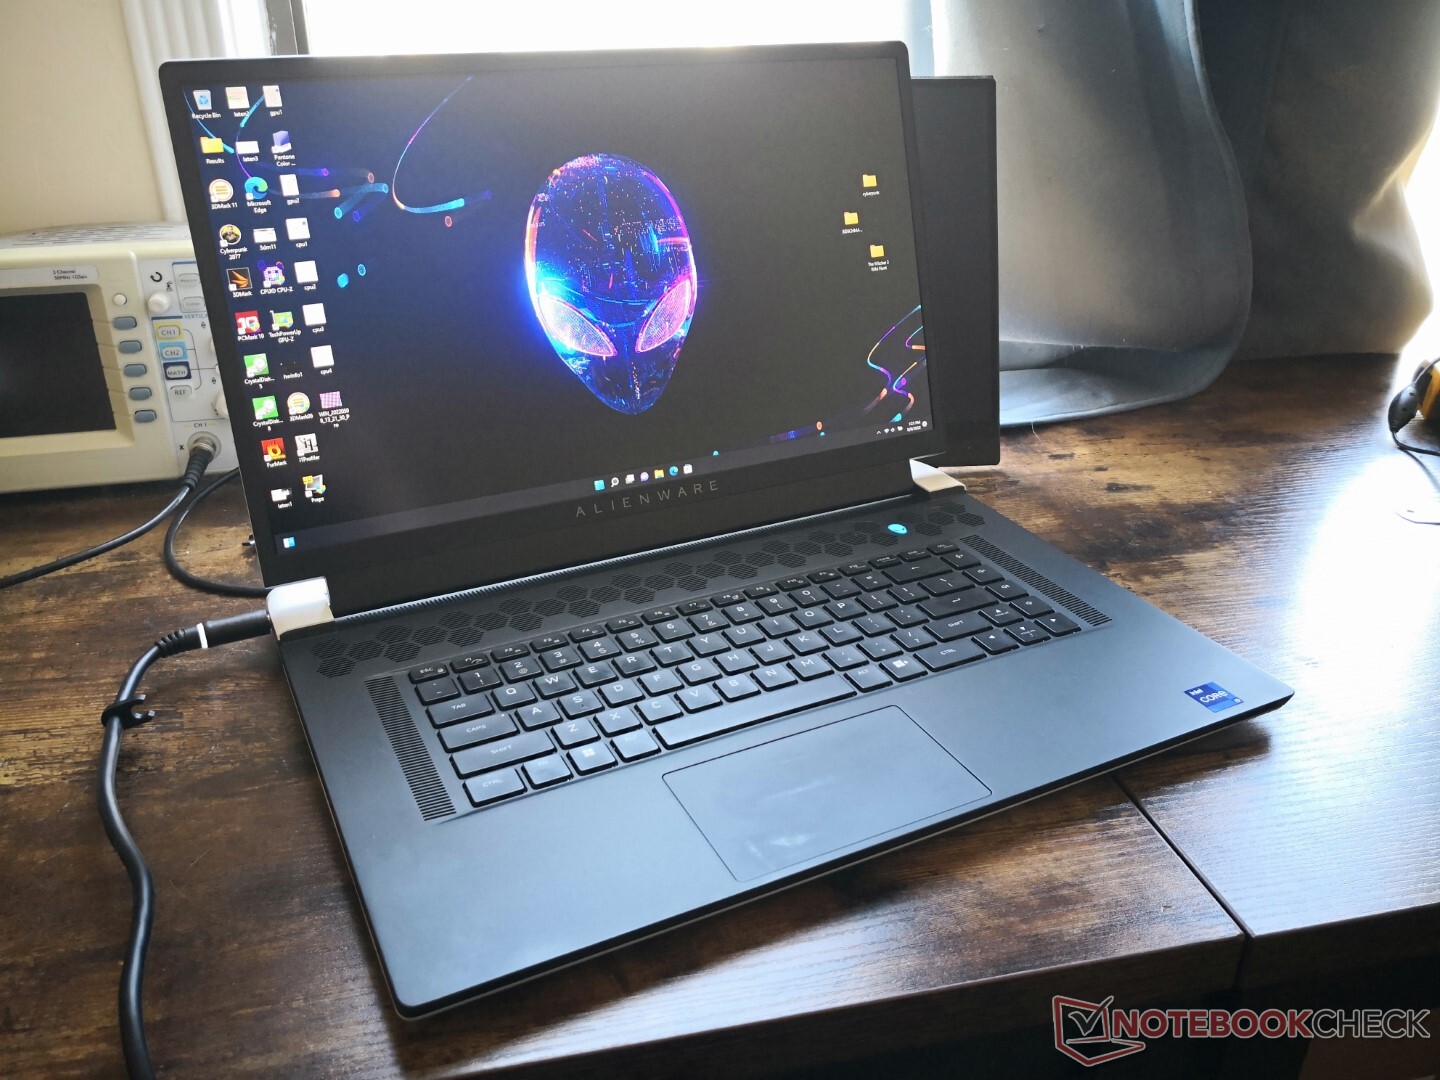
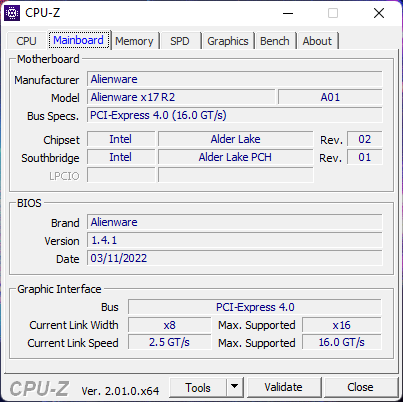
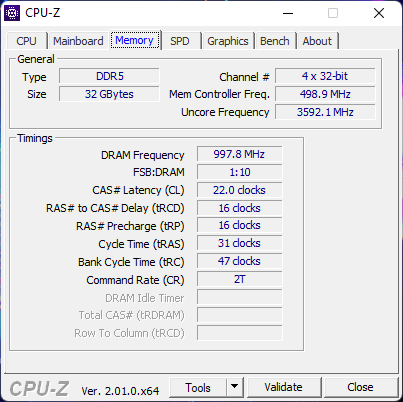
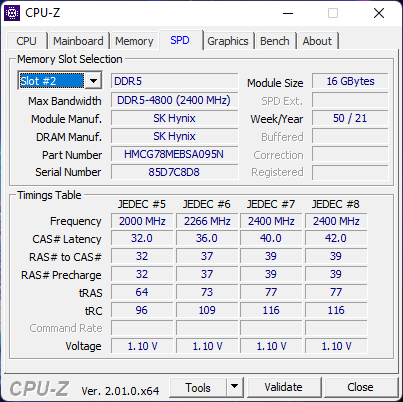
Dell presentó su serie Alienware x17 a finales del año pasado con un diseño de chasis completamente nuevo para distinguirlo de la serie Alienware m17 existente. Para este año, el fabricante ha refrescado la línea con el lanzamiento del Alienware x17 R2 completo con CPUs Intel Alder Lake-P de 12ª generación y gráficos GeForce RTX 3070/3080 Ti para reemplazar las opciones Tiger Lake-H y RTX 3070/3080 de 11ª generación del año pasado, respectivamente. También hay otras actualizaciones, como la memoria RAM más rápida (DDR4-3466 a DDR5-4800), nuevas opciones de pantalla y soporte para MUX y Advanced Optimus.
Aparte de las actualizaciones internas mencionadas anteriormente, el Alienware x17 R2 utiliza el mismo chasis que el Alienware x17 R1. Recomendamos consultar nuestro análisis del x17 R1 ya que nuestros comentarios existentes sobre el chasis, el teclado mecánico Cherry, y los puertos también son relevantes en el x17 R2.
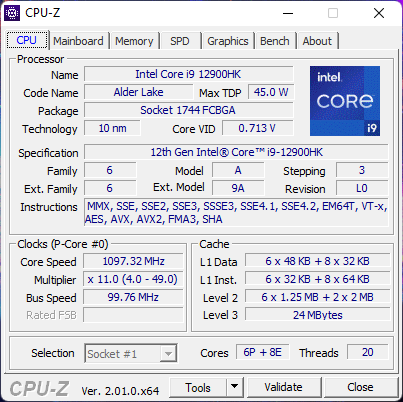
Consulte las especificaciones técnicas oficiales a continuación para conocer todas las opciones configurables. Nuestra unidad de prueba específica es un SKU de gama alta con el Core i9-12900HK, pantalla 1080p de 360 Hz y gráfica GeForce RTX 3080 Ti de 175 W por algo menos de 4000 dólares. Entre los competidores en este espacio se encuentran otros portátiles de juego ultrafinos de 17,3 pulgadas como el MSI GS77, Razer Blade 17y el Asus Zephyrus S17.
Más análisis de Alienware:
Posibles contendientes en la comparación
Valoración | Fecha | Modelo | Peso | Altura | Tamaño | Resolución | Precio |
|---|---|---|---|---|---|---|---|
| 89.2 % v7 (old) | 05/2022 | Alienware x17 R2 P48E i9-12900HK, GeForce RTX 3080 Ti Laptop GPU | 3.1 kg | 20.9 mm | 17.30" | 1920x1080 | |
| 89 % v7 (old) | 09/2021 | Alienware x17 RTX 3080 P48E i7-11800H, GeForce RTX 3080 Laptop GPU | 3.2 kg | 21.4 mm | 17.30" | 3840x2160 | |
| 90.1 % v7 (old) | 07/2021 | Asus ROG Zephyrus S17 GX703HSD i9-11900H, GeForce RTX 3080 Laptop GPU | 2.8 kg | 19.9 mm | 17.30" | 2560x1440 | |
| 87.2 % v7 (old) | 04/2022 | MSI Stealth GS77 12UHS-083US i7-12700H, GeForce RTX 3080 Ti Laptop GPU | 2.9 kg | 20.8 mm | 17.30" | 2560x1440 | |
| 87.4 % v7 (old) | 10/2020 | MSI GT76 Titan DT 10SGS i9-10900K, GeForce RTX 2080 Super Mobile | 4.2 kg | 42 mm | 17.30" | 3840x2160 | |
| 83.2 % v7 (old) | 10/2021 | Gigabyte A7 X1 R9 5900HX, GeForce RTX 3070 Laptop GPU | 2.5 kg | 34 mm | 17.30" | 1920x1080 |
Caso
Aunque se comercializa como un portátil de juegos ultradelgado, el chasis del Alienware x17 R2 sigue siendo notablemente más pesado y grande que otras alternativas como el Asus Zephyrus S17, el MSI GS77 o el Razer Blade 17. A cambio, el sistema Alienware es capaz de llevar una GPU más potente de 175 W, mientras que la mayoría de los otros portátiles de juego ultradelgados están limitados a 140 W o menos.
Lector de tarjetas SD
| SD Card Reader | |
| average JPG Copy Test (av. of 3 runs) | |
| MSI GT76 Titan DT 10SGS (Toshiba Exceria Pro M501 UHS-II) | |
| Asus ROG Zephyrus S17 GX703HSD | |
| Alienware x17 R2 P48E (AV Pro V60) | |
| Alienware x17 RTX 3080 P48E (AV Pro V60) | |
| MSI Stealth GS77 12UHS-083US (AV Pro V60) | |
| maximum AS SSD Seq Read Test (1GB) | |
| Asus ROG Zephyrus S17 GX703HSD | |
| Alienware x17 RTX 3080 P48E (AV Pro V60) | |
| Alienware x17 R2 P48E (AV Pro V60) | |
| MSI GT76 Titan DT 10SGS (Toshiba Exceria Pro M501 UHS-II) | |
| MSI Stealth GS77 12UHS-083US (AV Pro V60) | |
Comunicación
Cámara web
La webcam sigue siendo de 720p sin obturador físico de privacidad en comparación con los 1080p del último Razer Blade 17. Es compatible con Windows Hello.

")
")
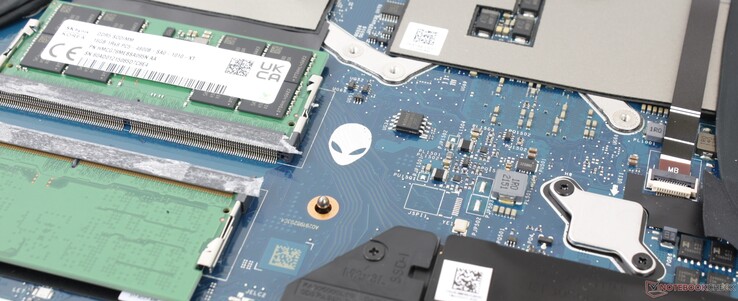
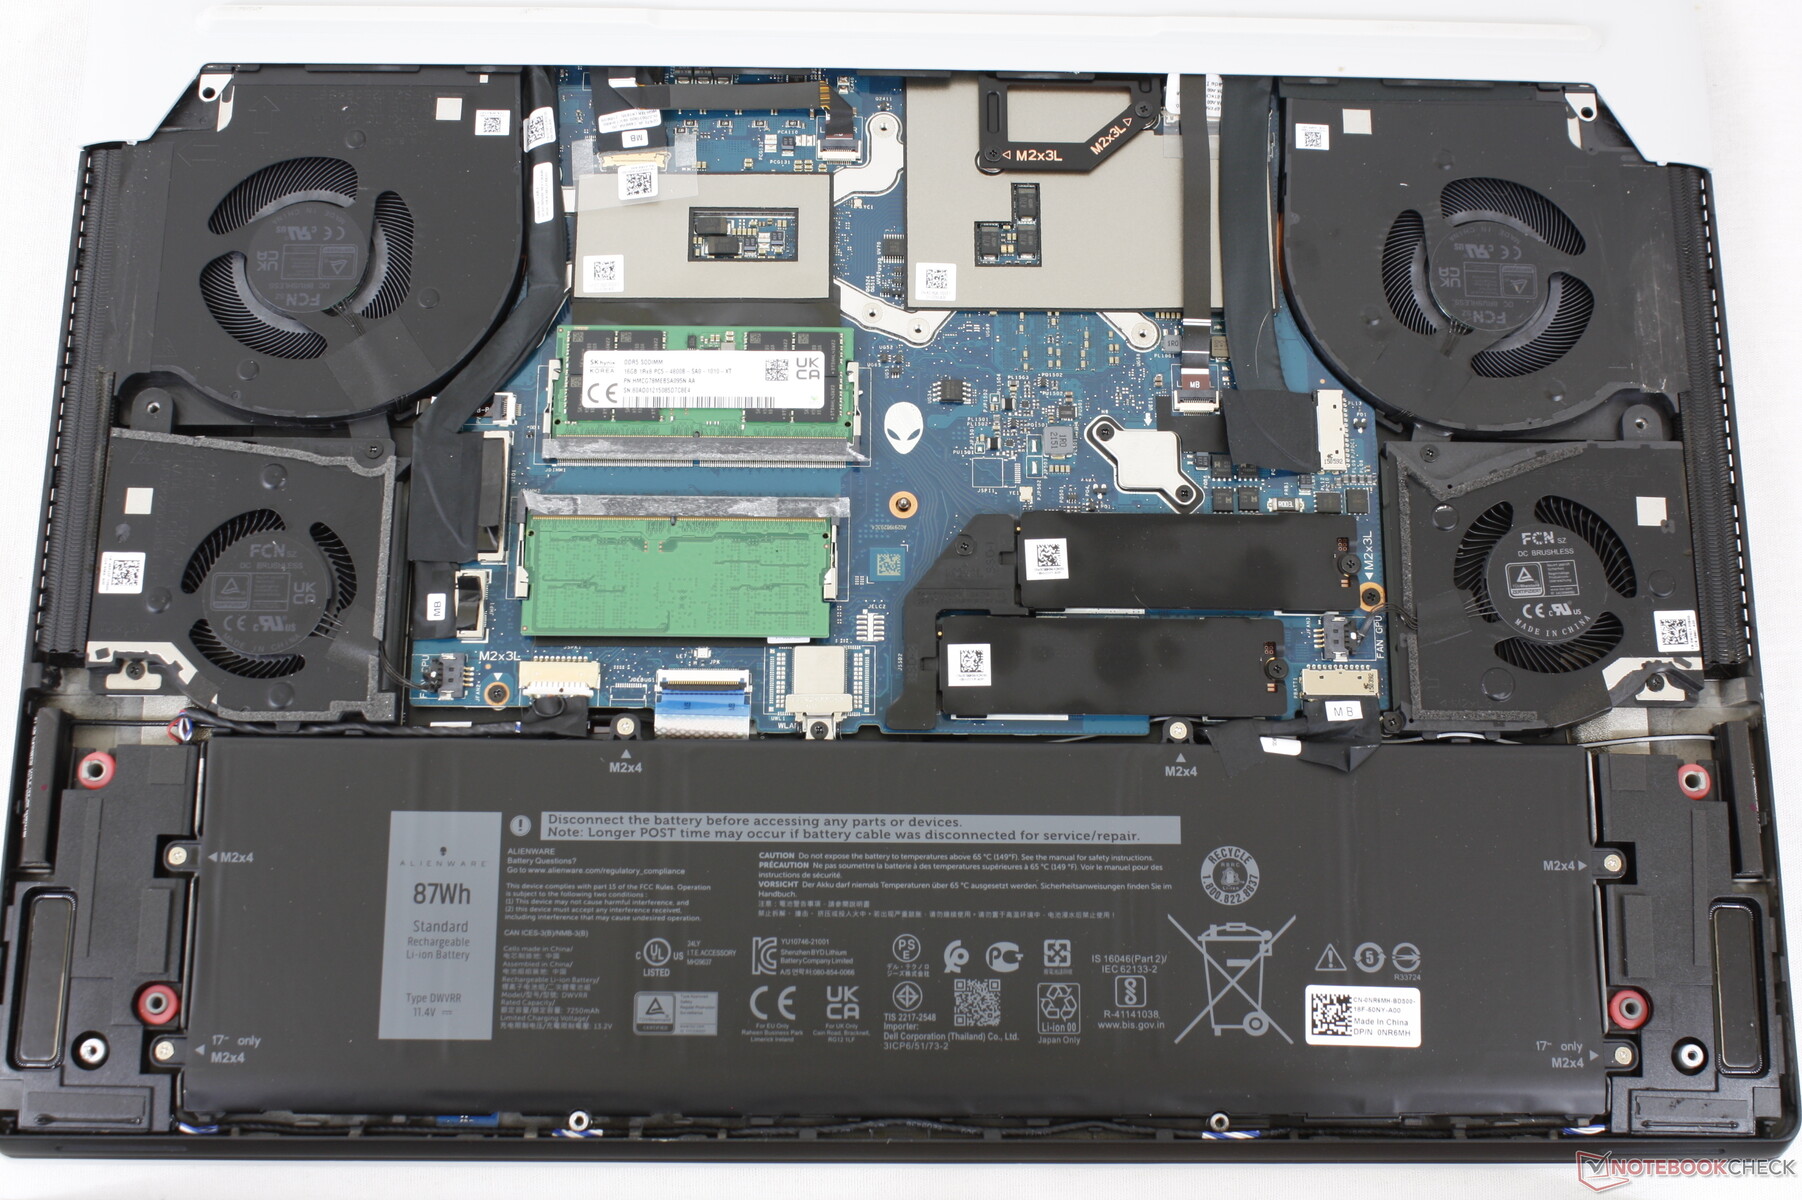
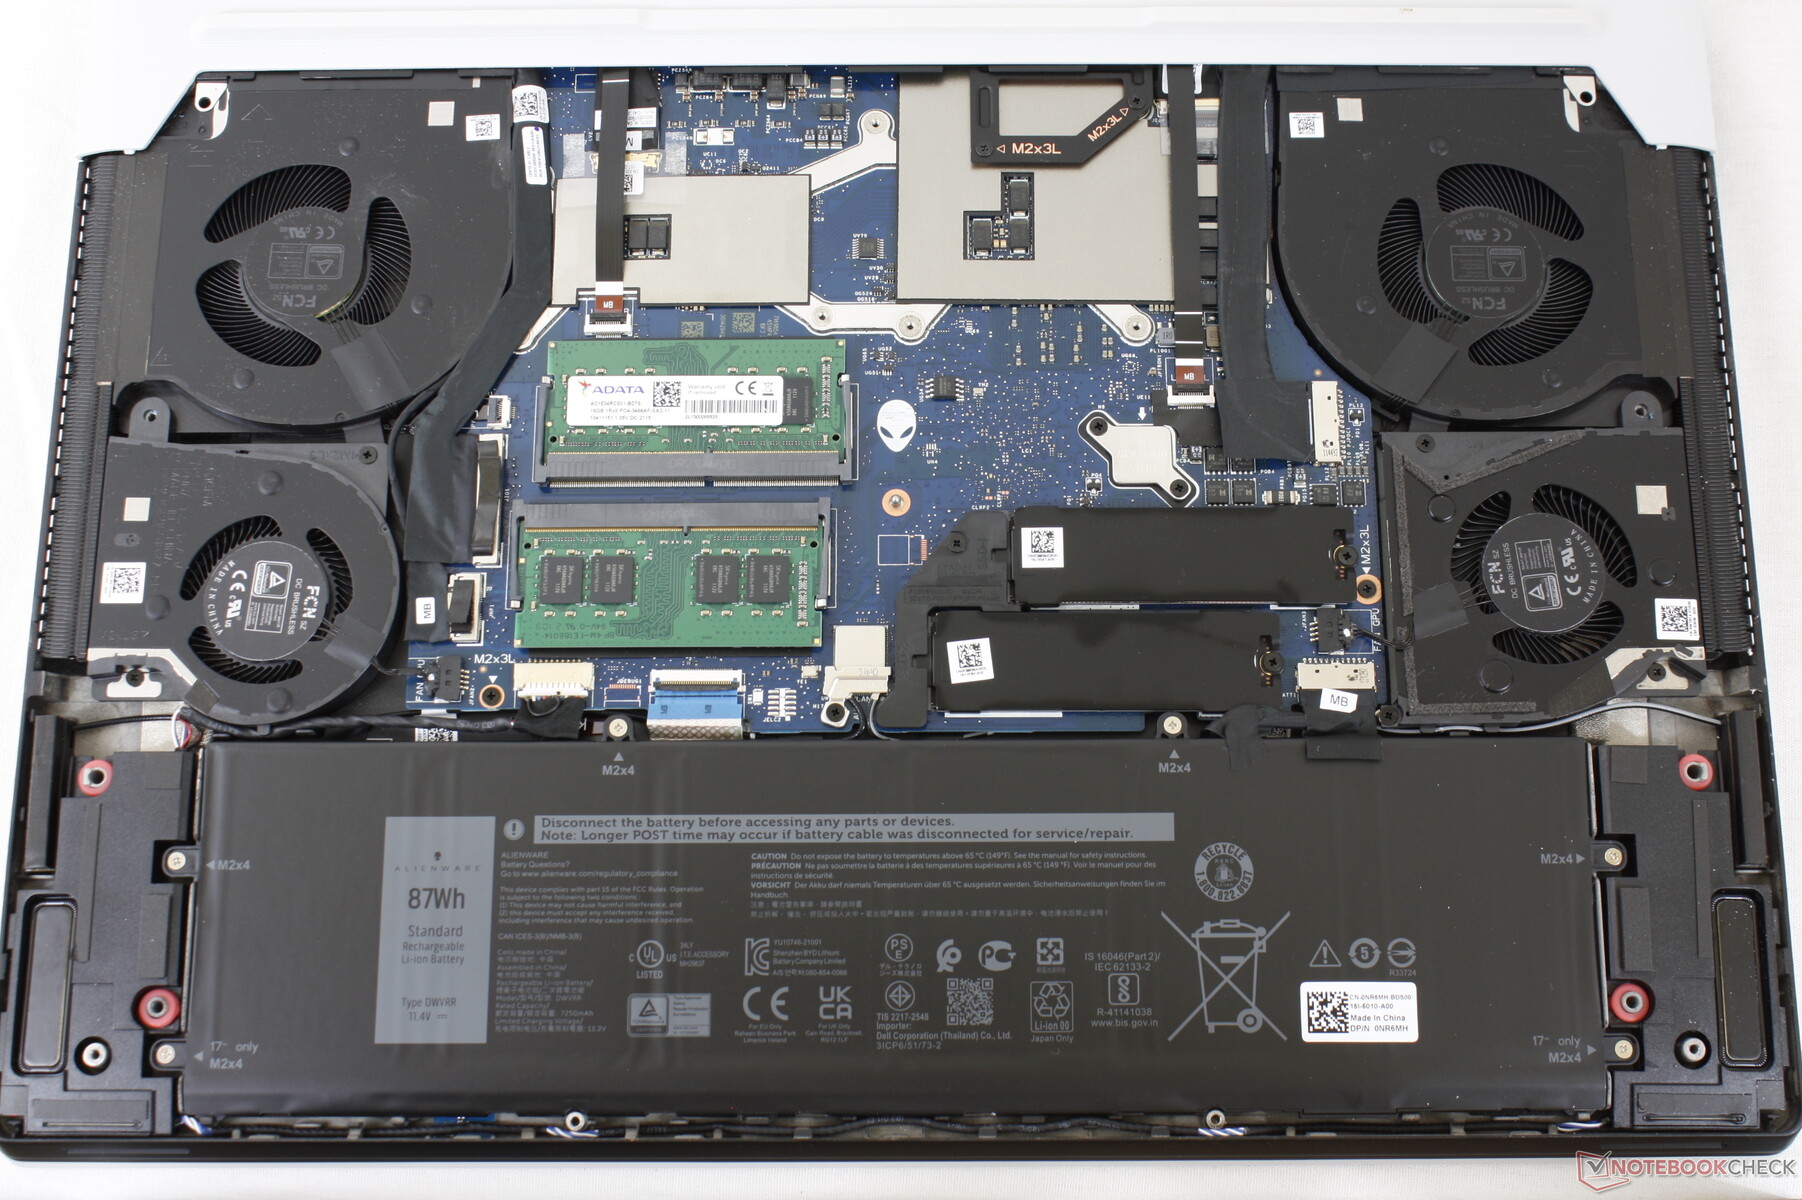
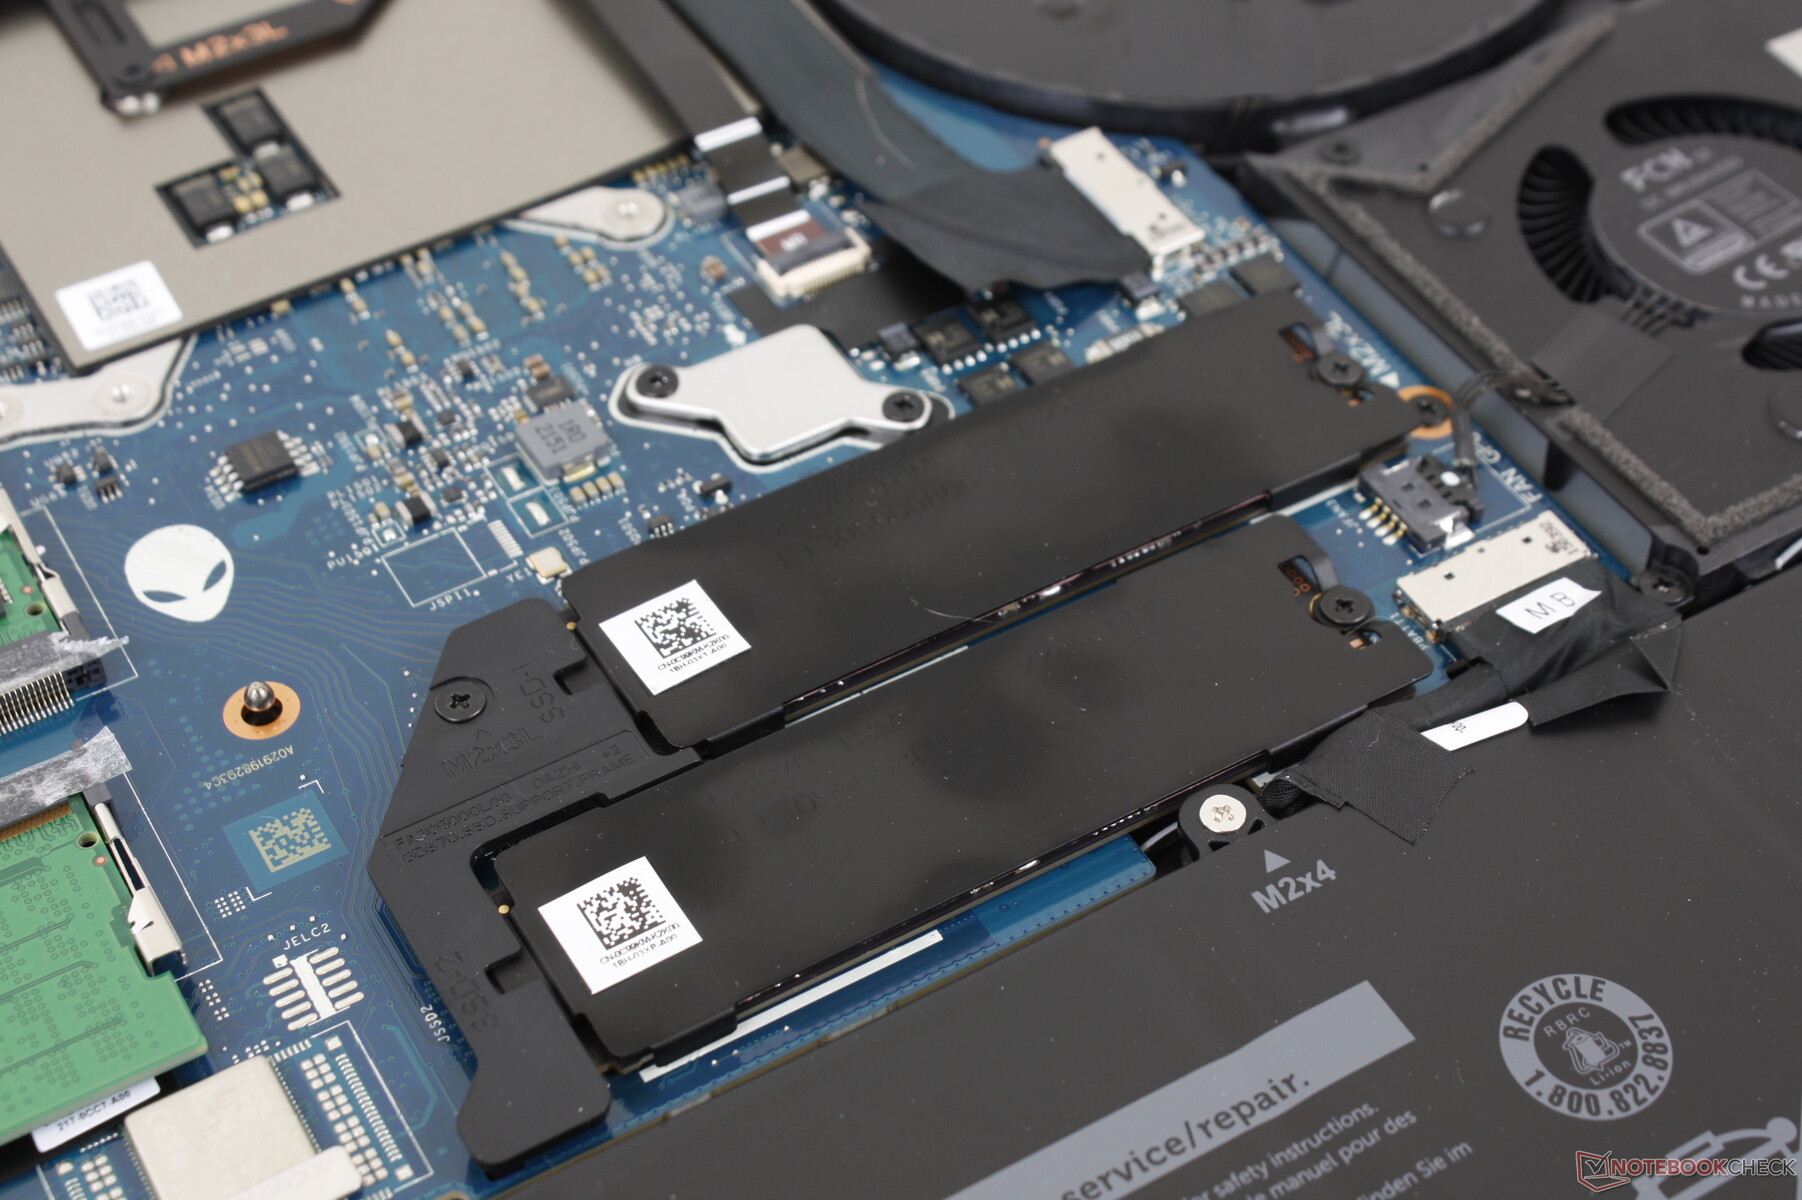
Mantenimiento
Mostrar
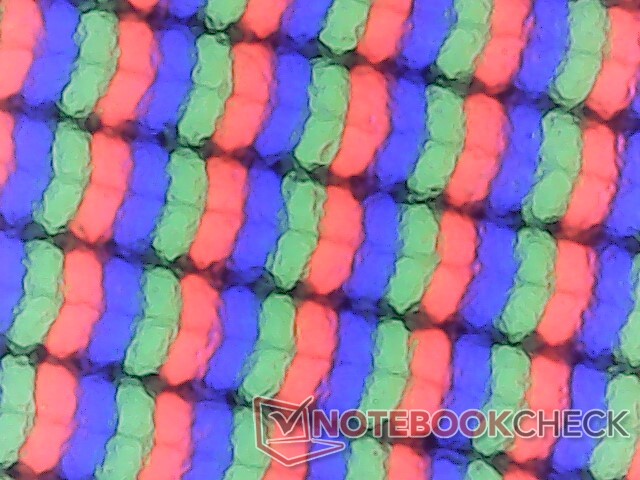
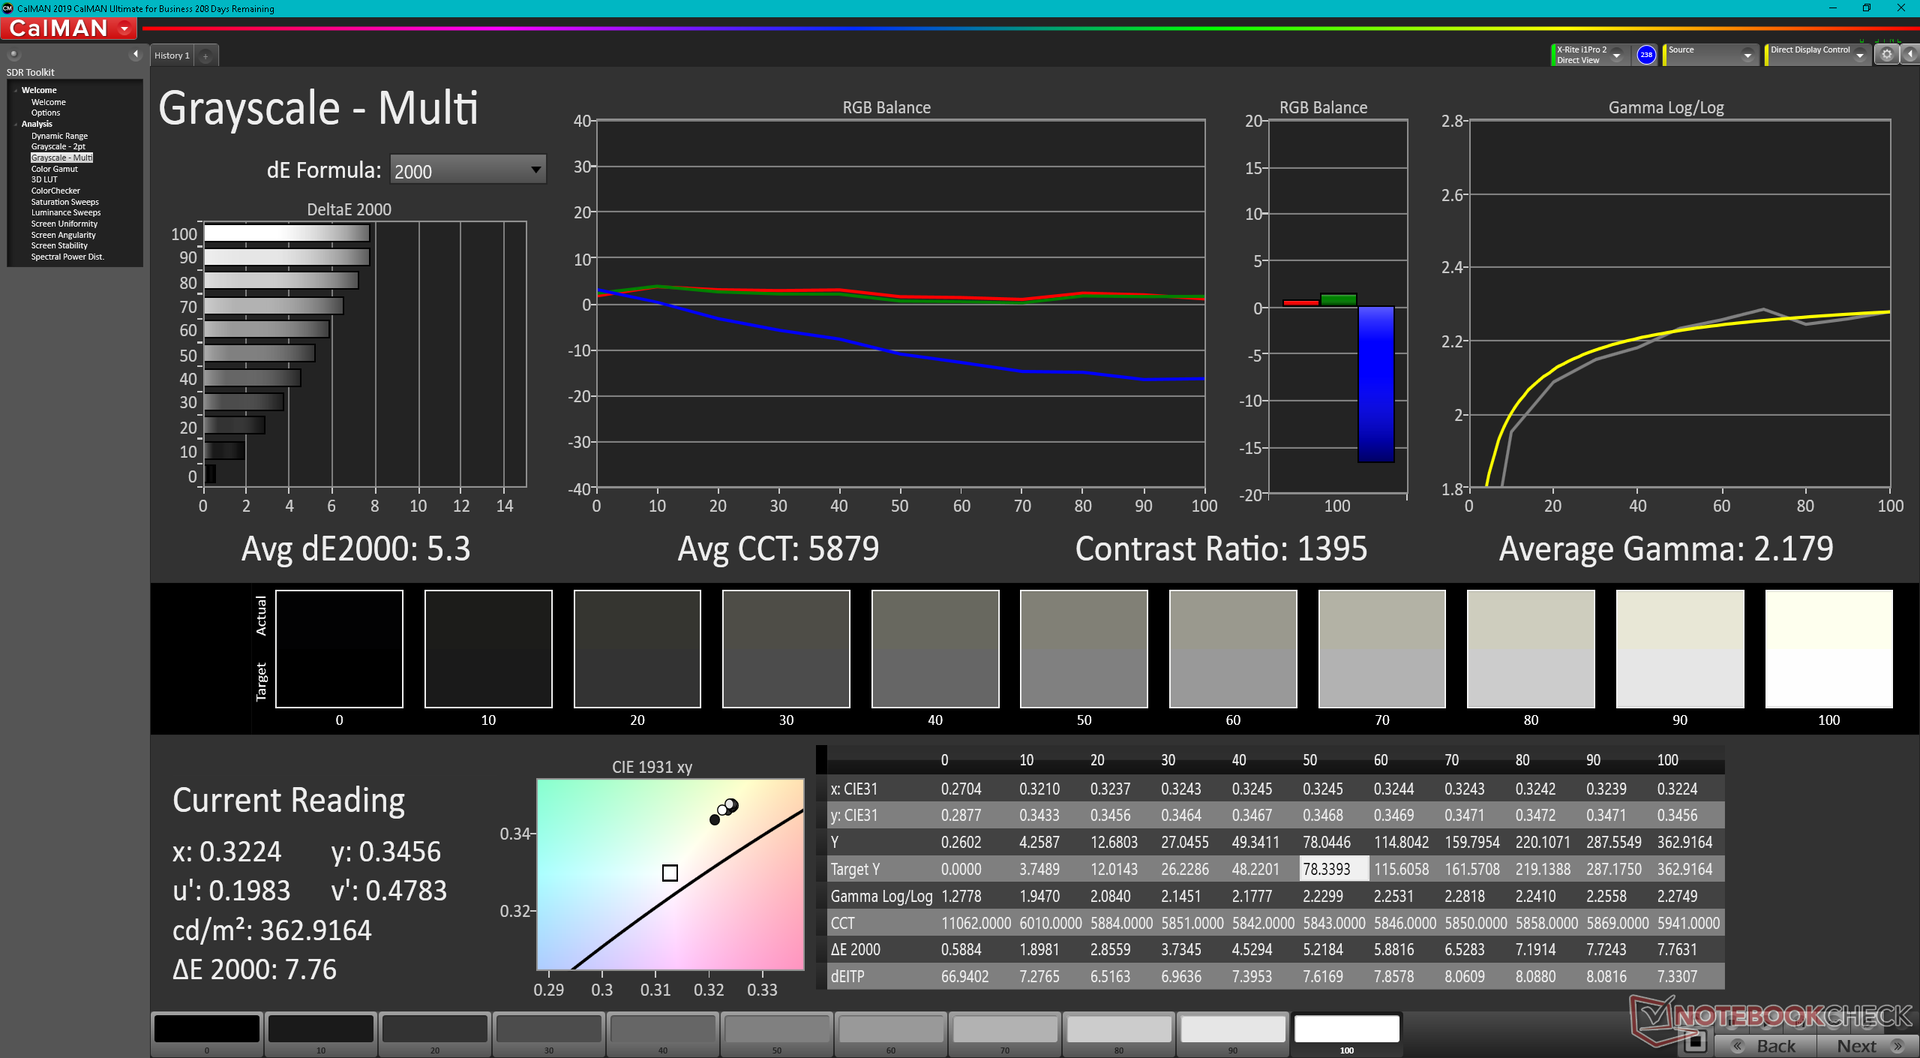
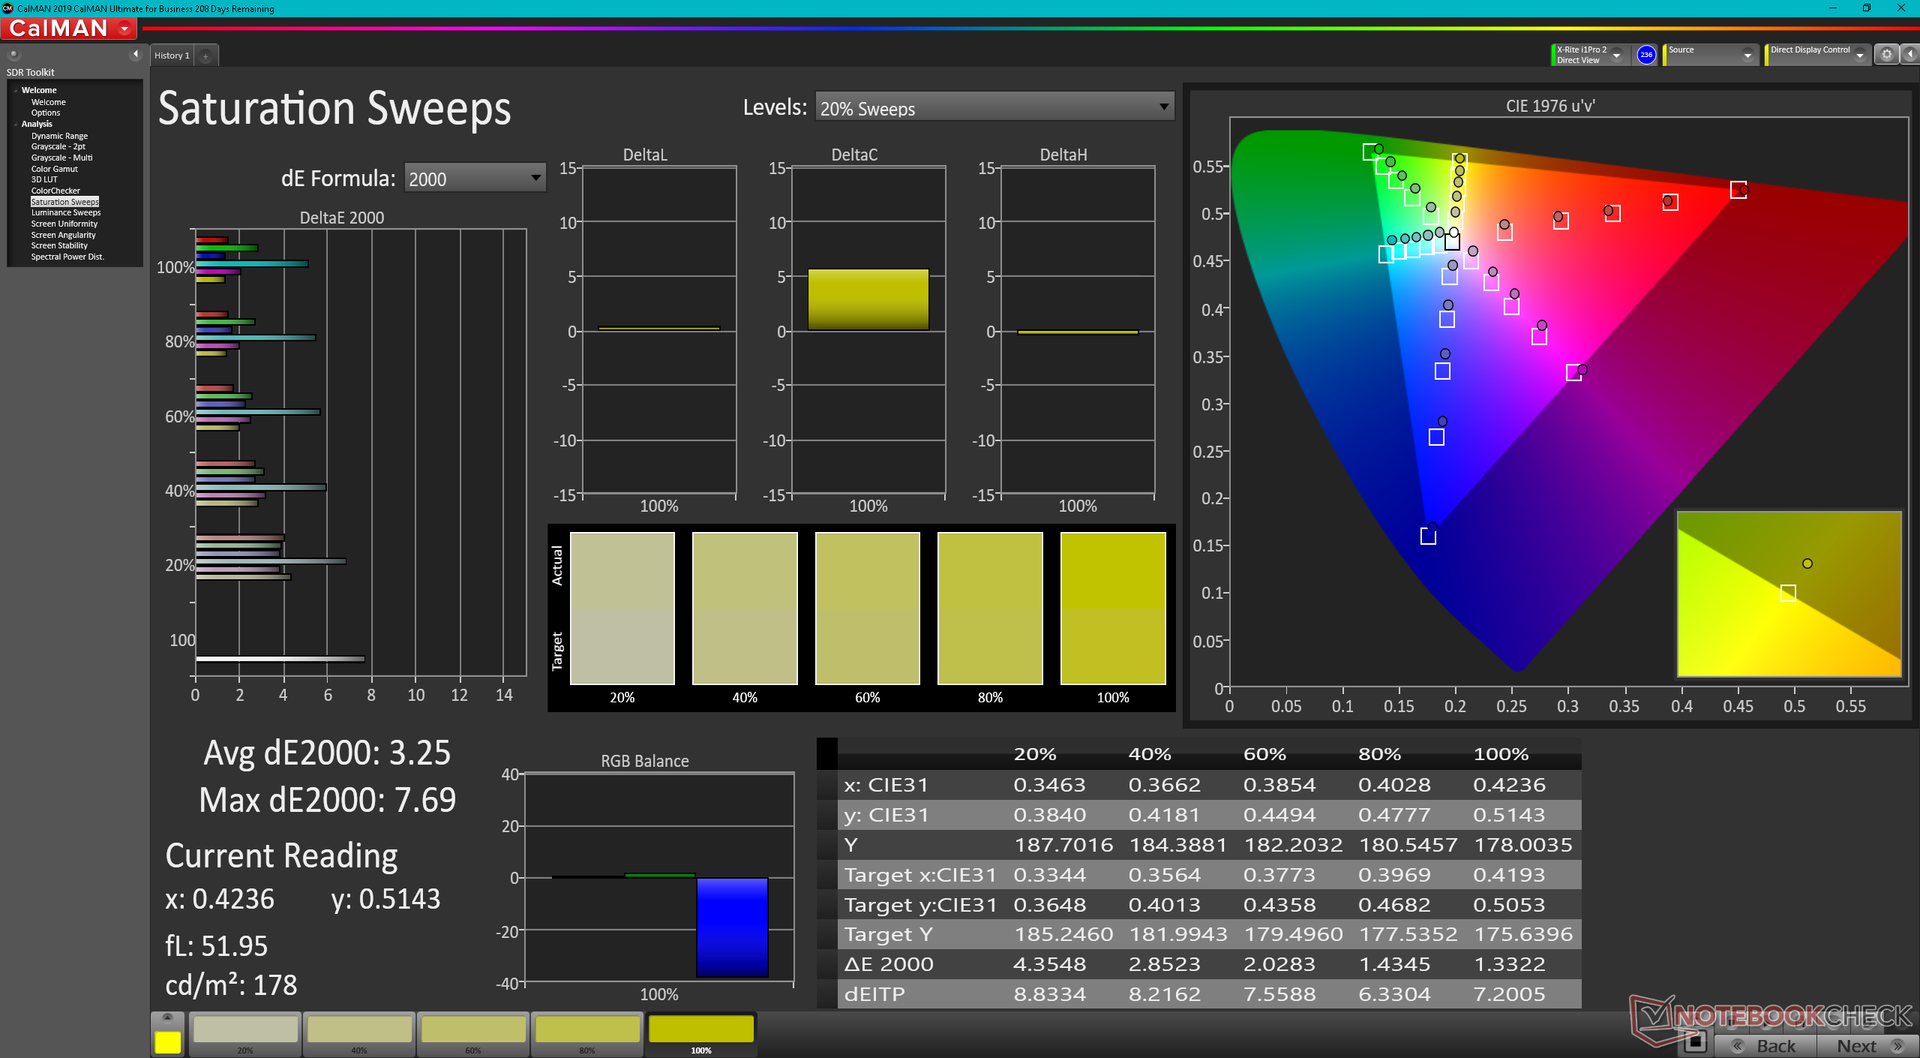
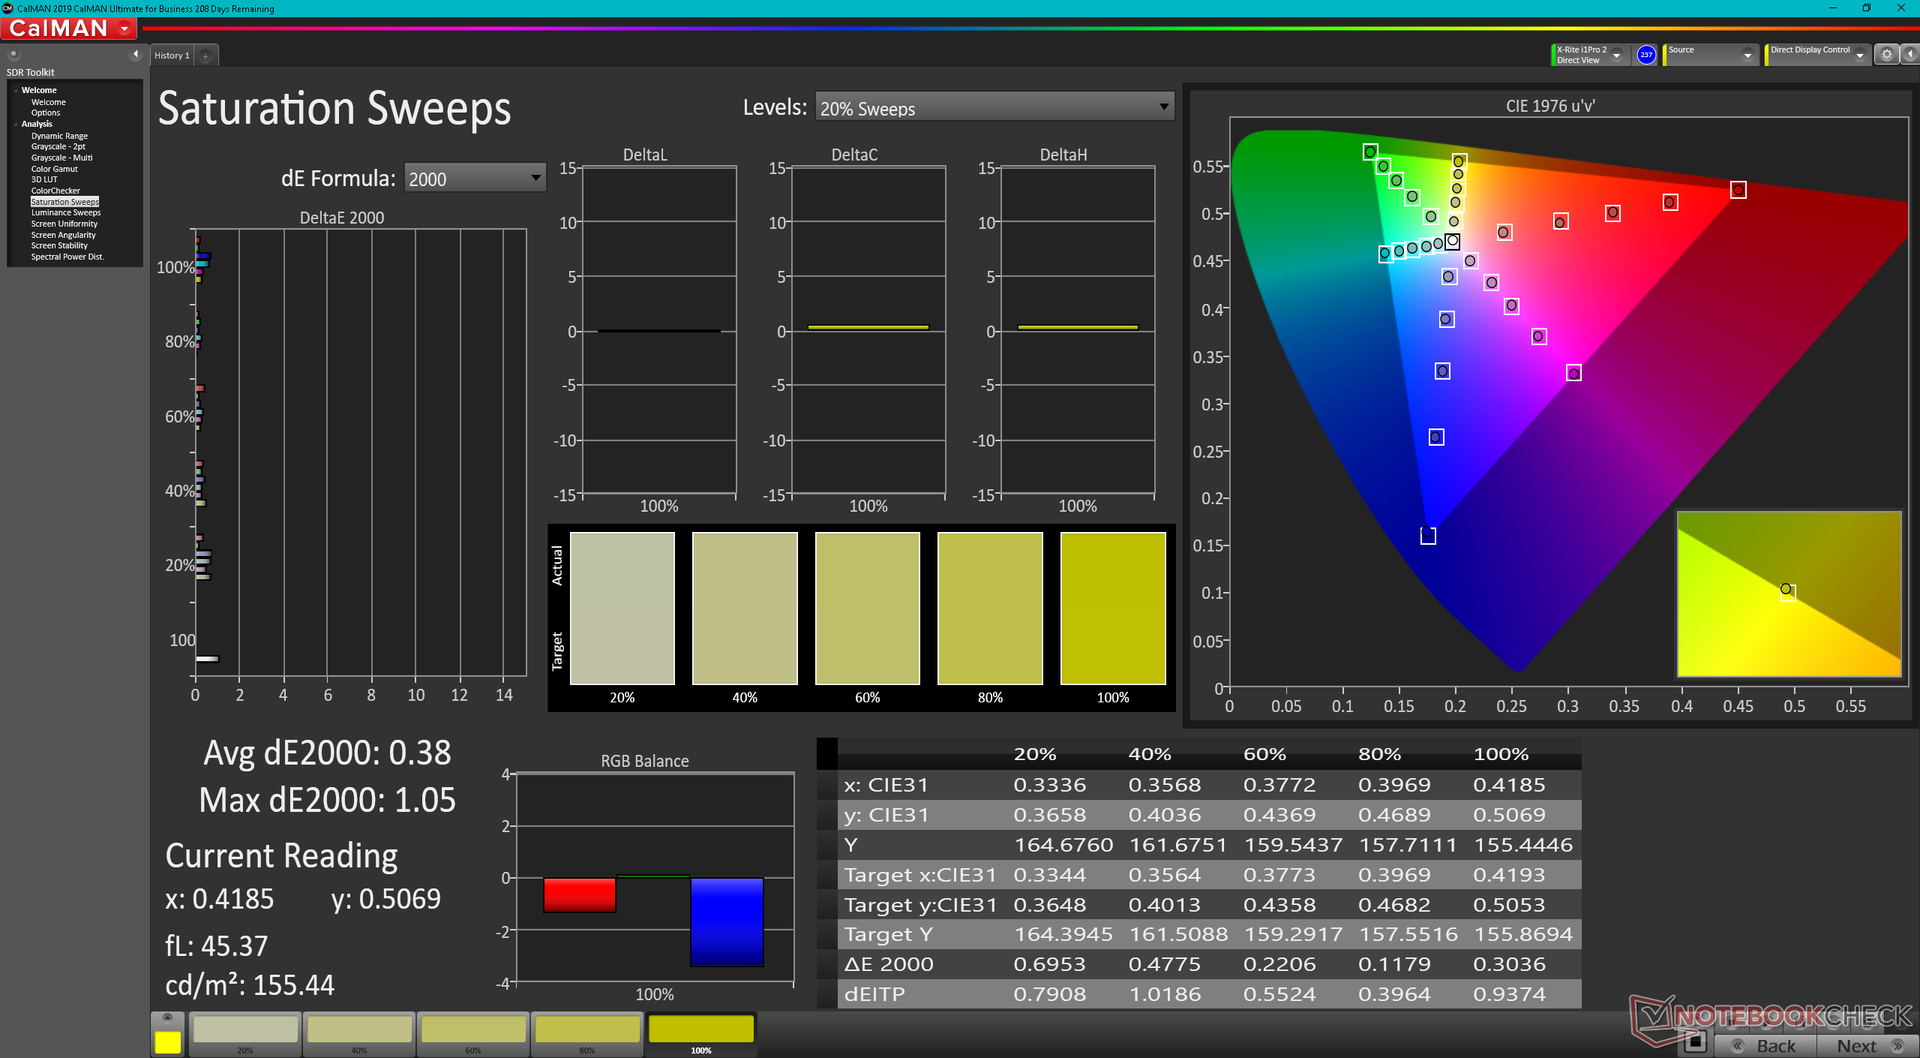
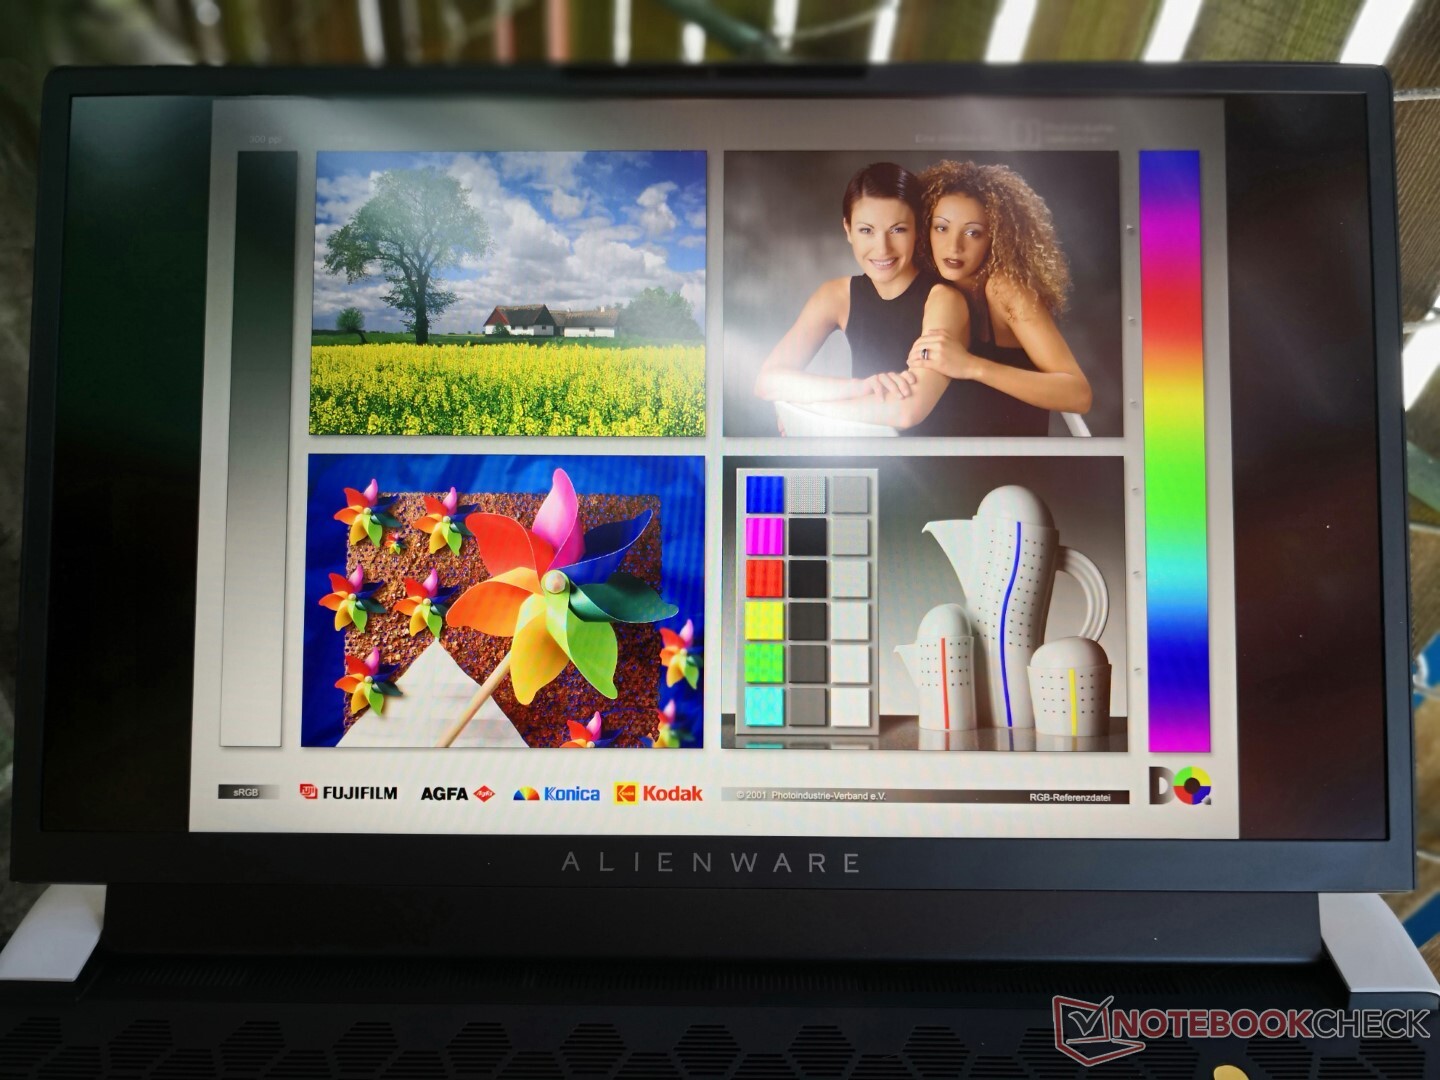
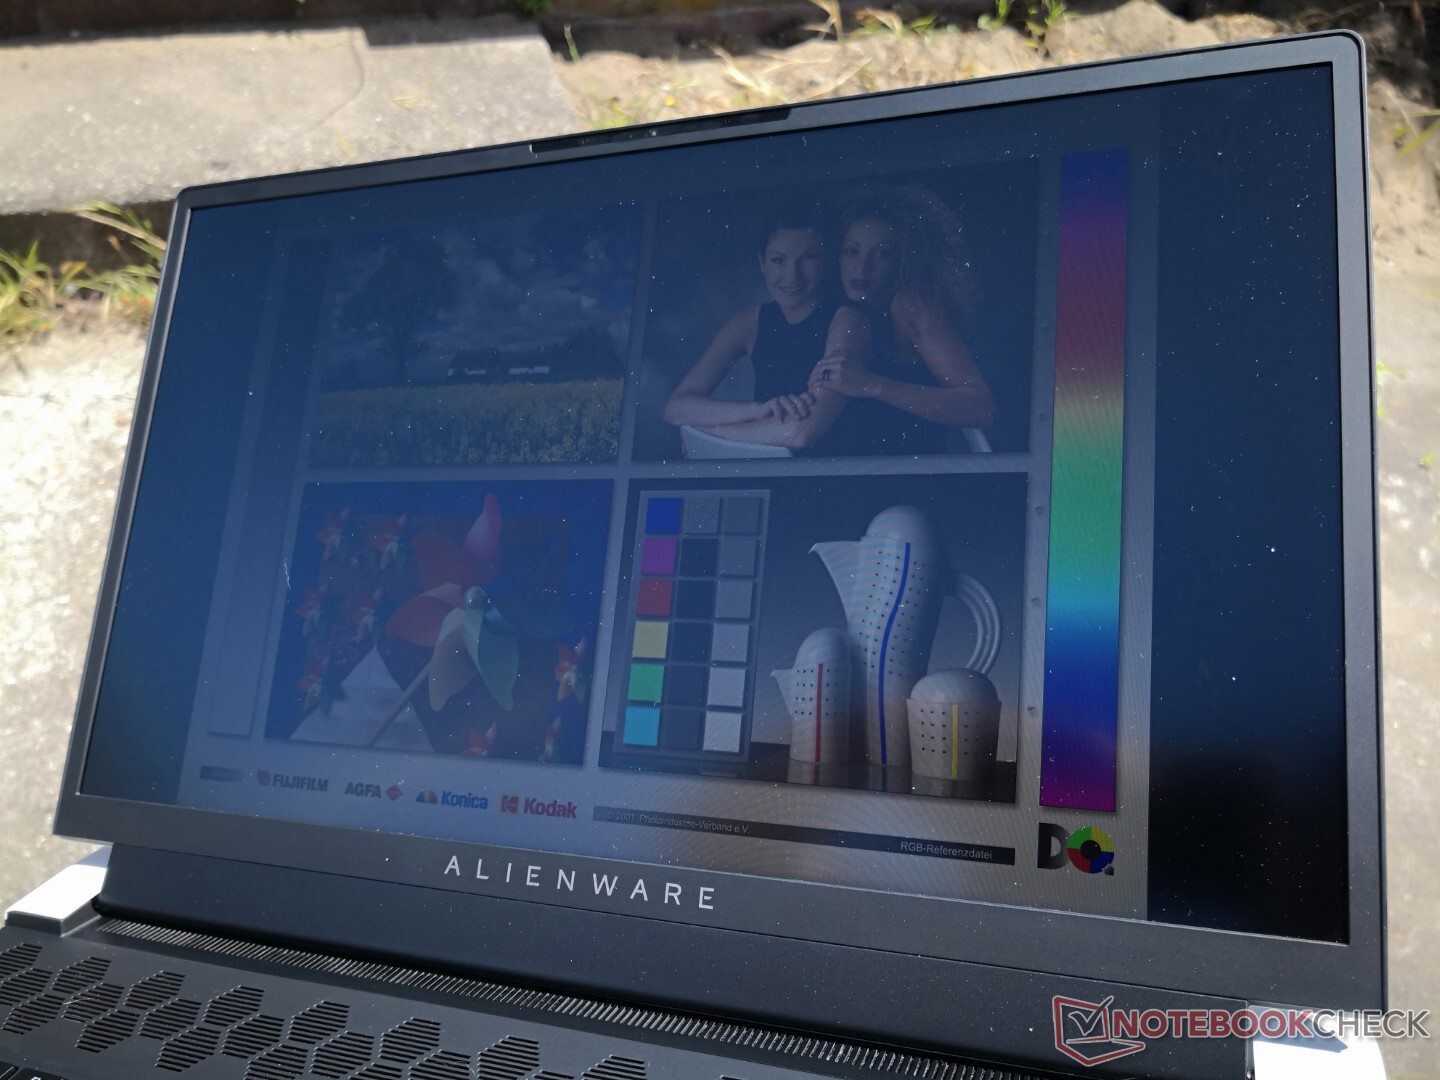
Nuestro panel IPS AU Optronics B173HAN cumple con casi todos los requisitos típicos, incluyendo una rápida tasa de refresco de 360 Hz, rápidos tiempos de respuesta en blanco y negro y gris, y una cobertura sRGB completa para ser apto tanto para juegos como para la mayoría de la edición de gráficos. Otros fabricantes de portátiles con opciones de pantalla de 17,3 pulgadas 1080p 360 Hz probablemente utilizarán el mismo panel de AU Optronics que se encuentra en nuestro Alienware. También hay una opción de gama alta de 4K a 120 Hz con soporte G-Sync.
Actualmente no hay opciones OLED, que habrían ofrecido una cobertura de color DCI-P3 más amplia y niveles de negro más profundos que la solución IPS habitual.
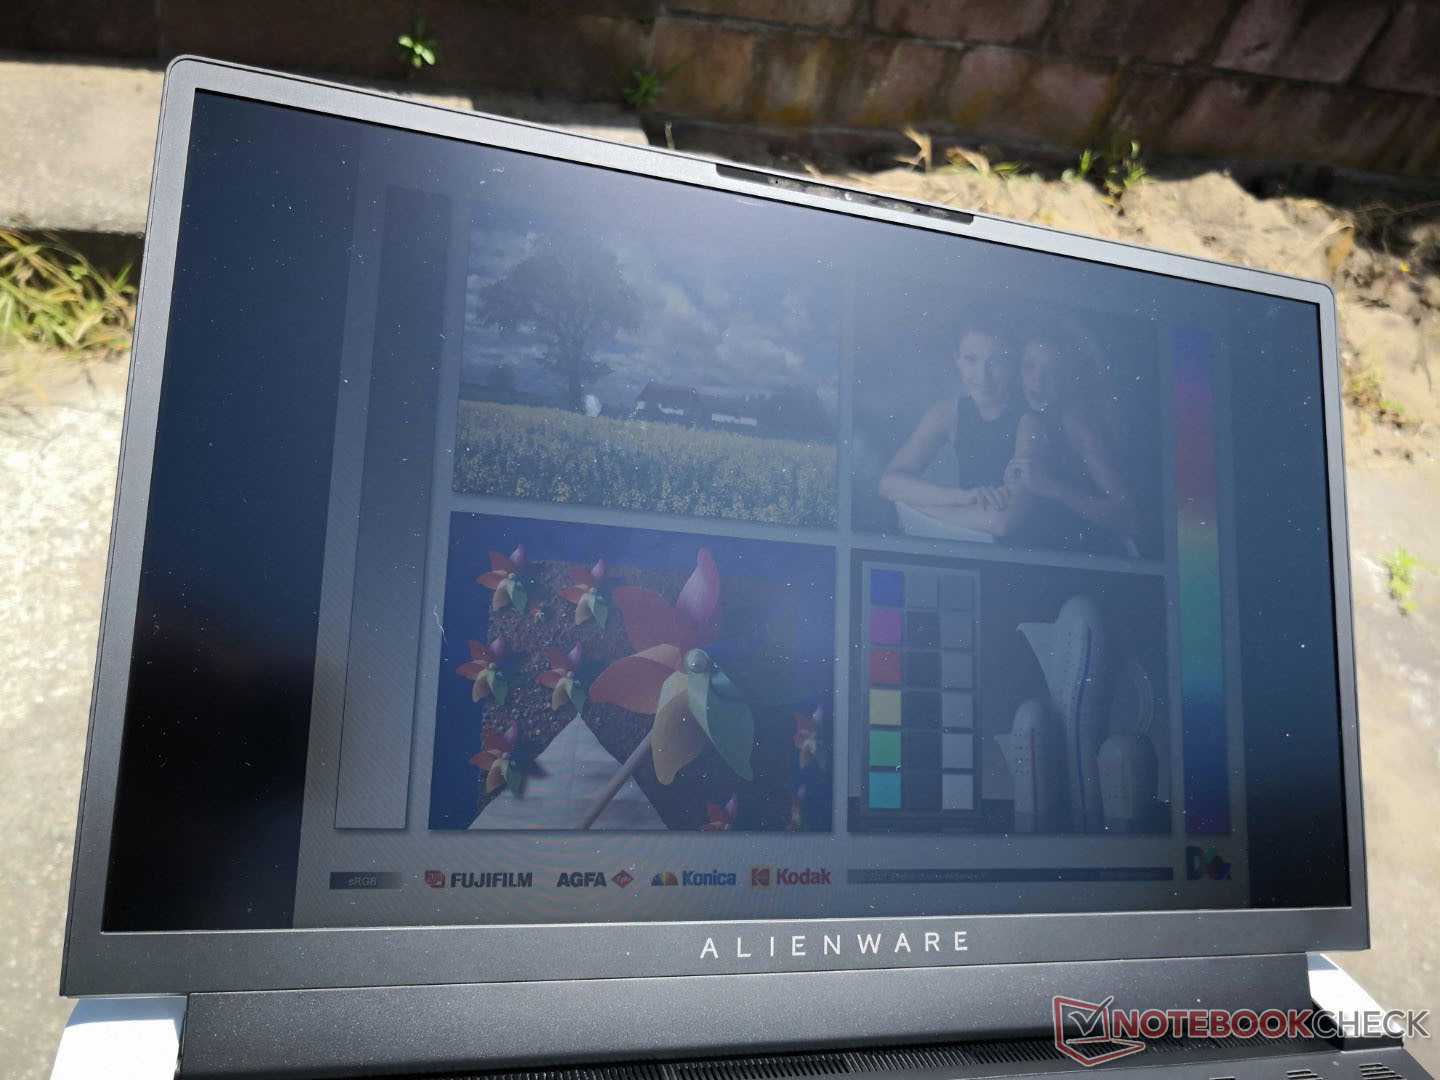
Curiosamente, nuestro panel FHD no es tan brillante como el panel 4K UHD del x17 R1 original. Podemos medir un brillo máximo de 365 nits aquí comparado con los 439 nits del 4K x17 R1.
| |||||||||||||||||||||||||
iluminación: 85 %
Brillo con batería: 365.4 cd/m²
Contraste: 1260:1 (Negro: 0.29 cd/m²)
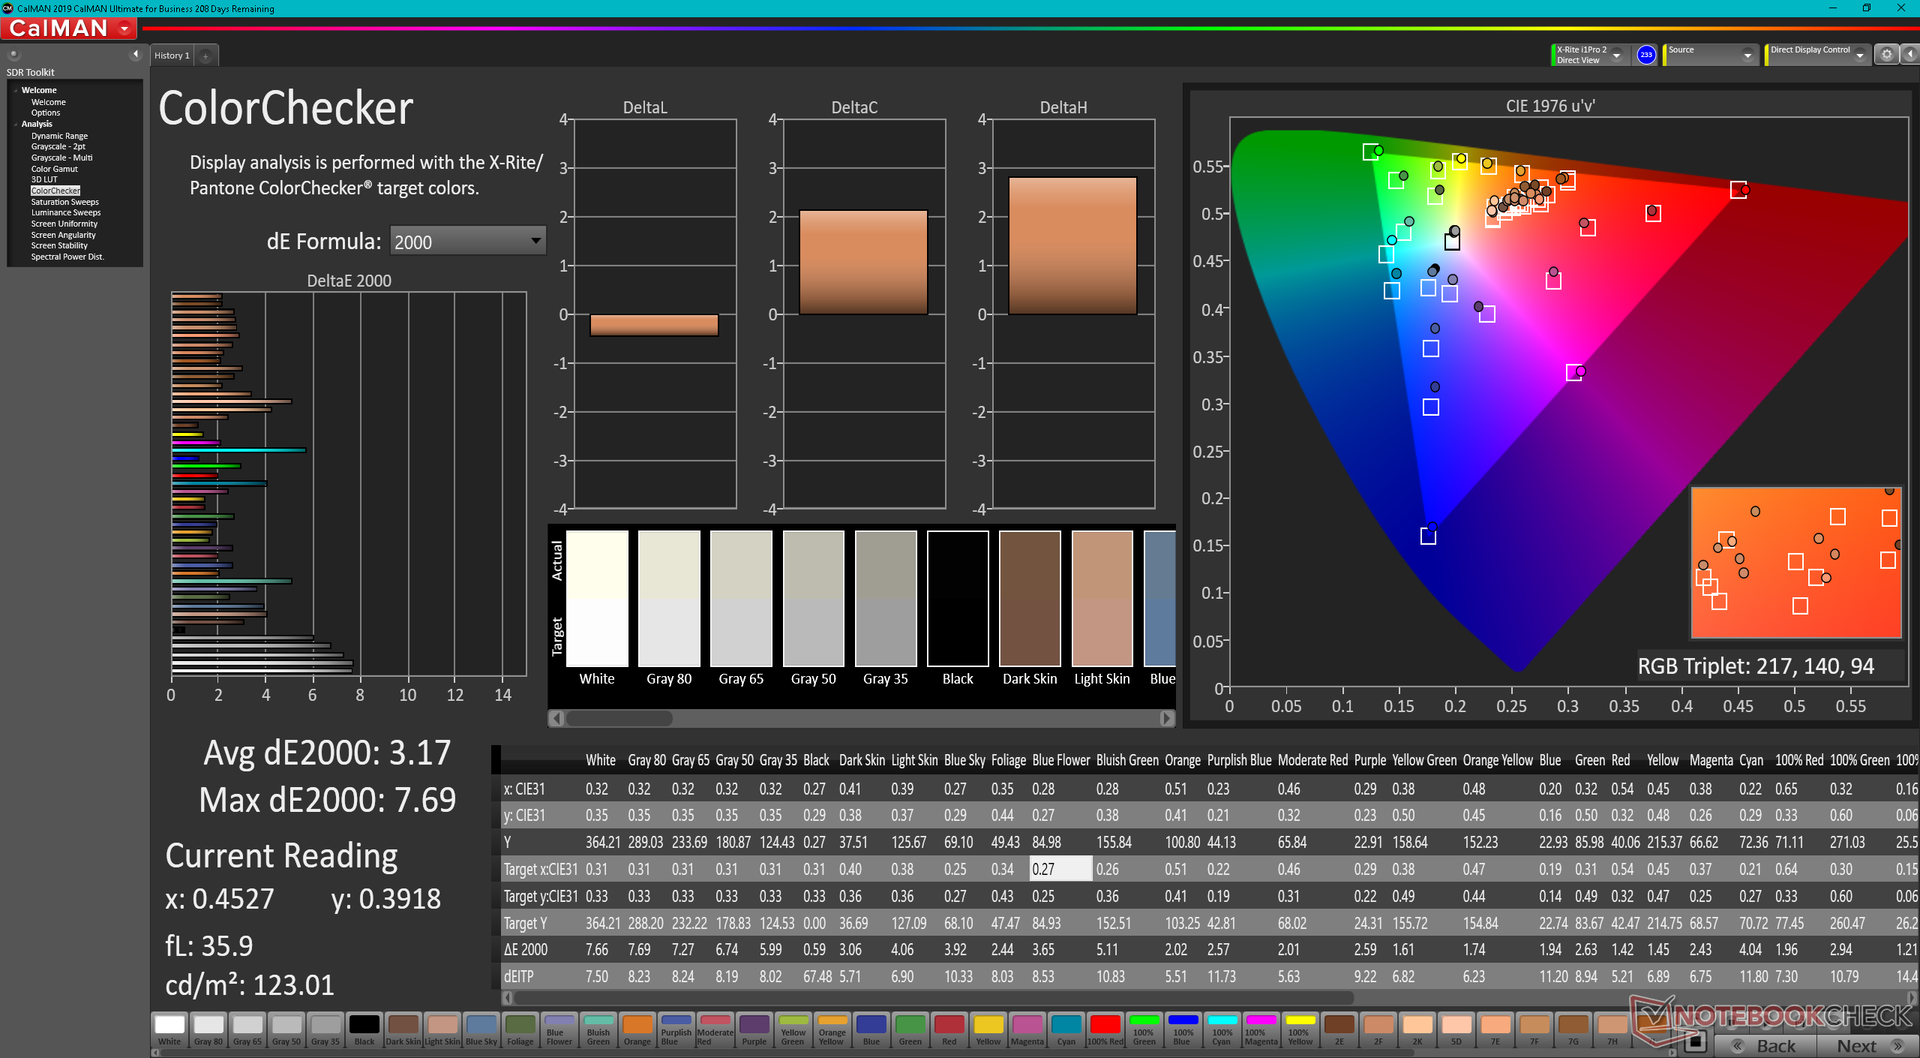
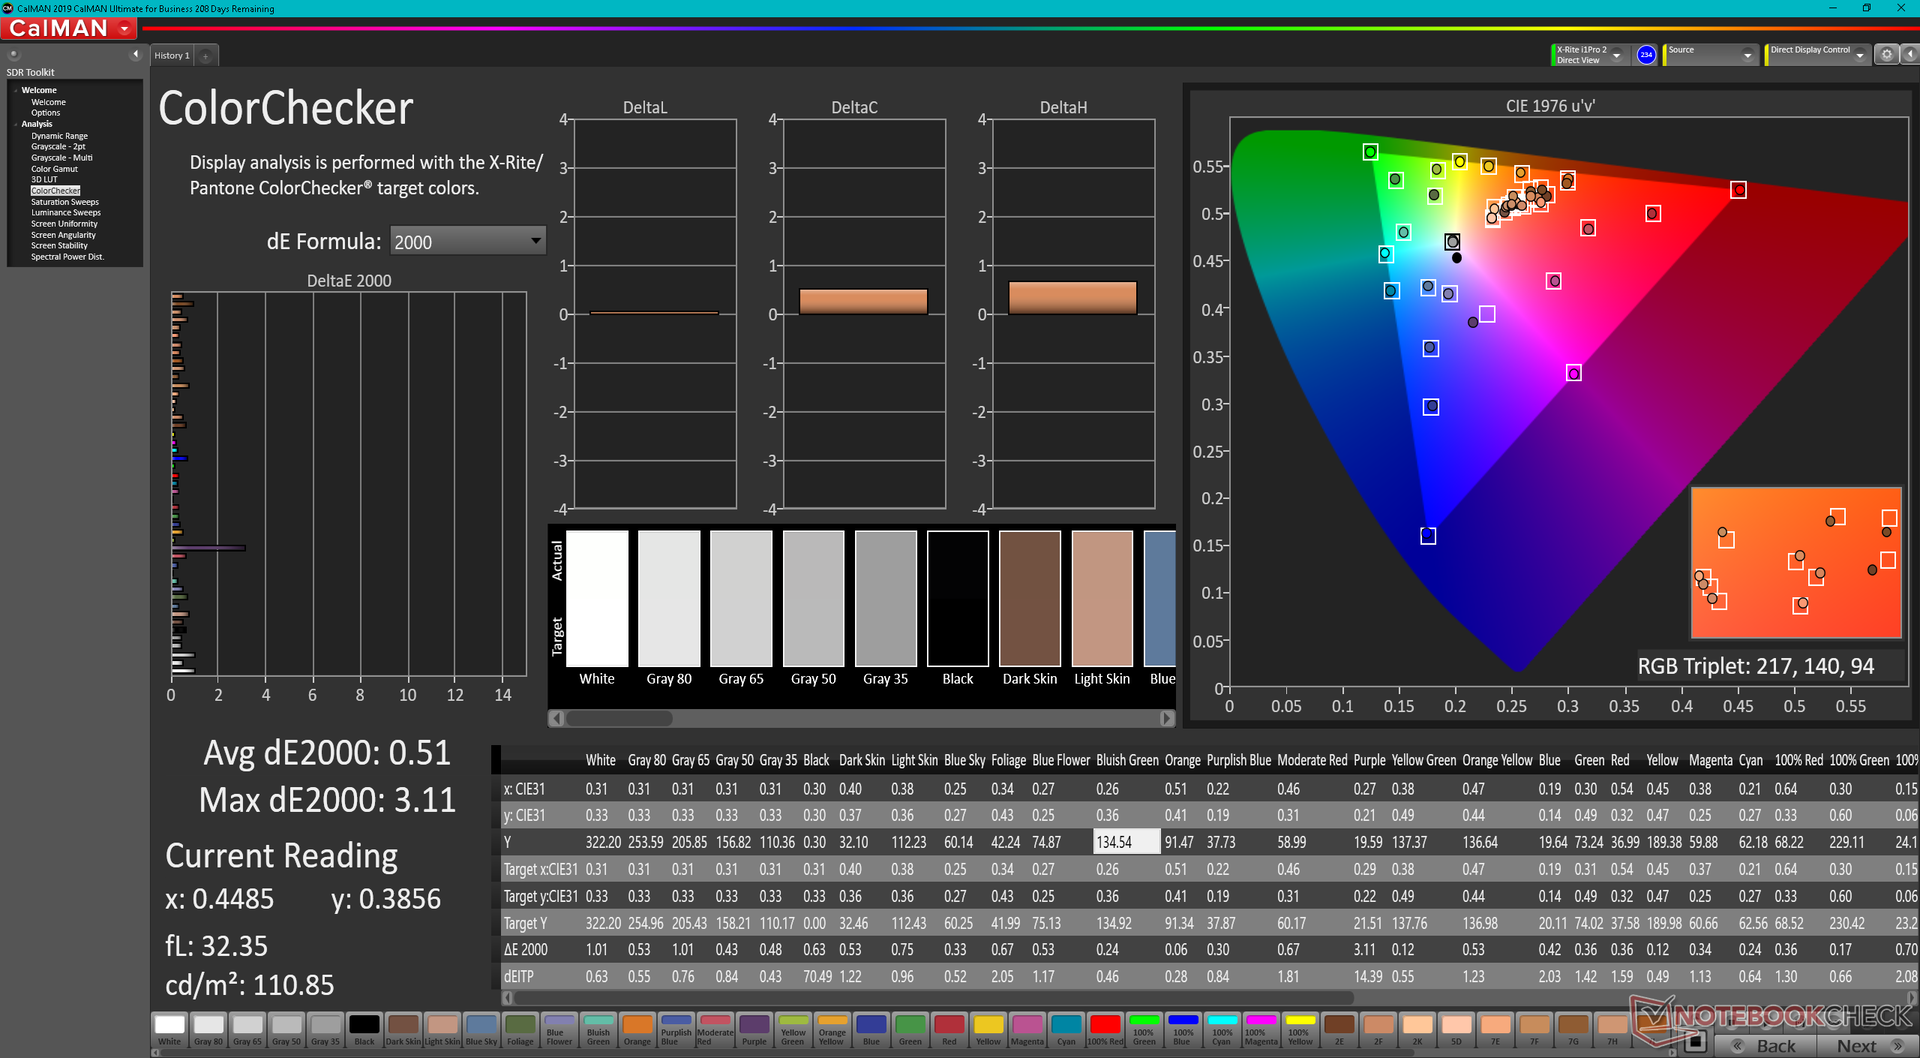
ΔE ColorChecker Calman: 3.17 | ∀{0.5-29.43 Ø4.71}
calibrated: 0.51
ΔE Greyscale Calman: 5.3 | ∀{0.09-98 Ø4.96}
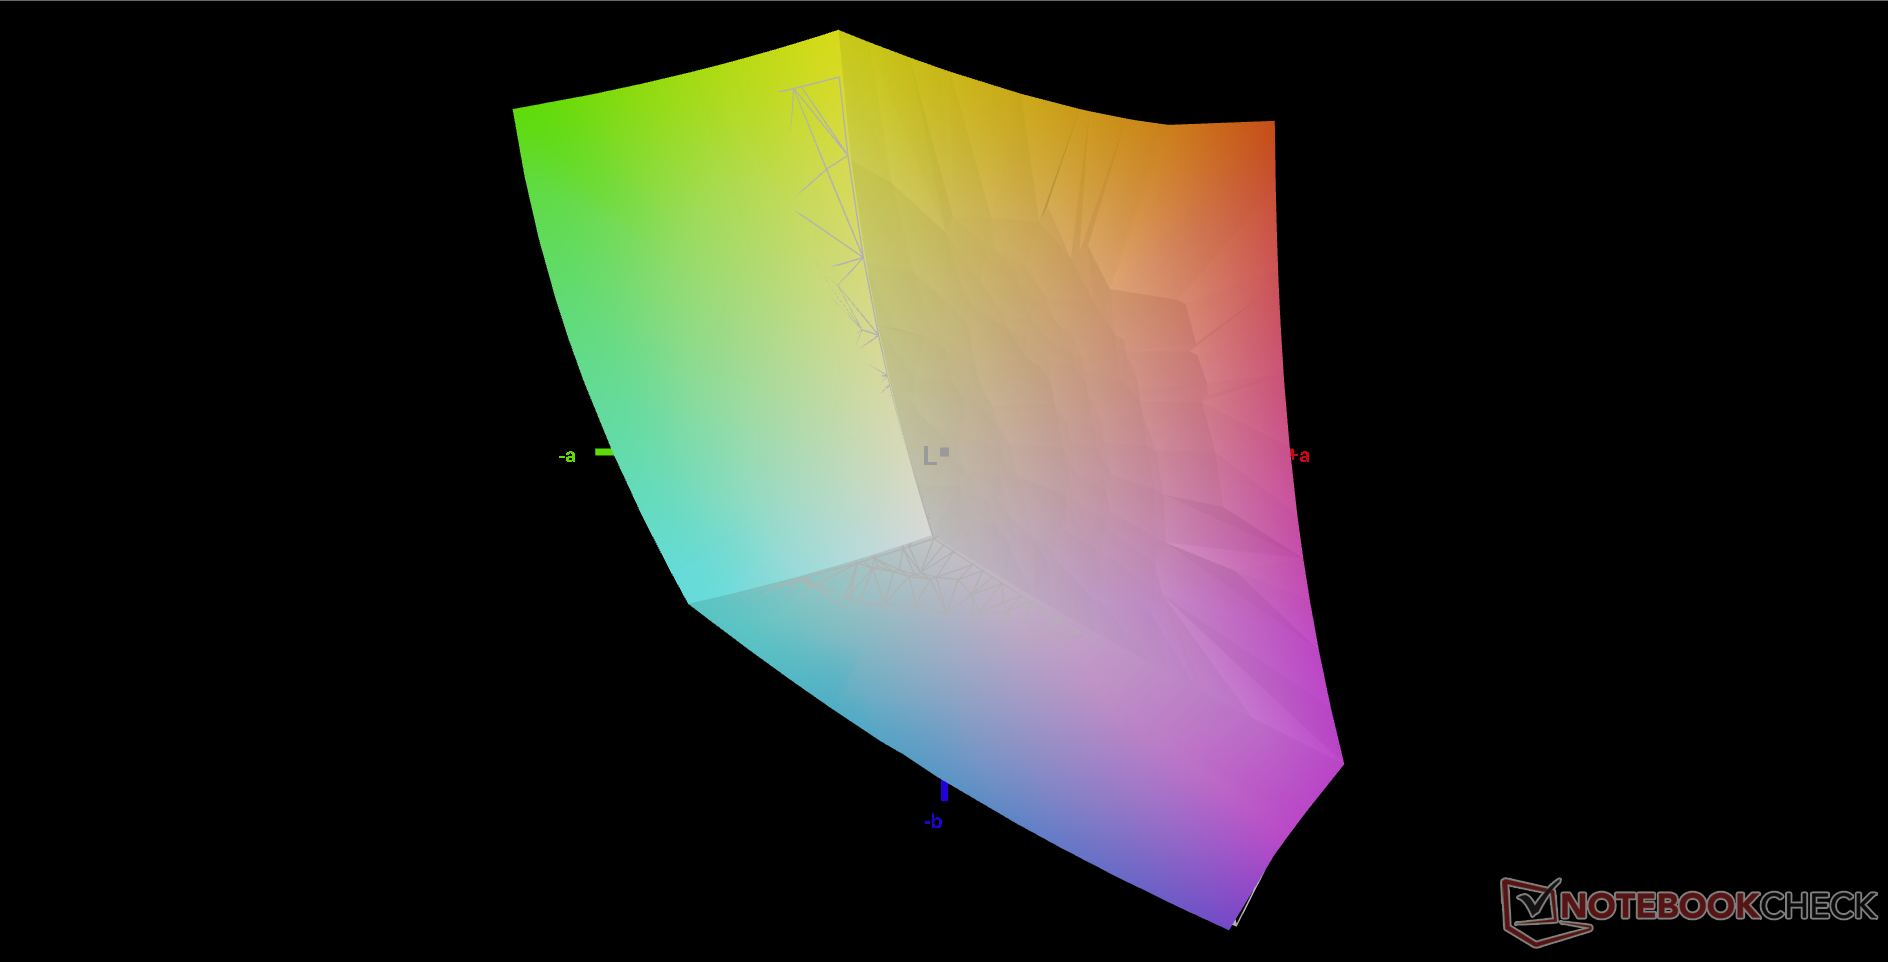
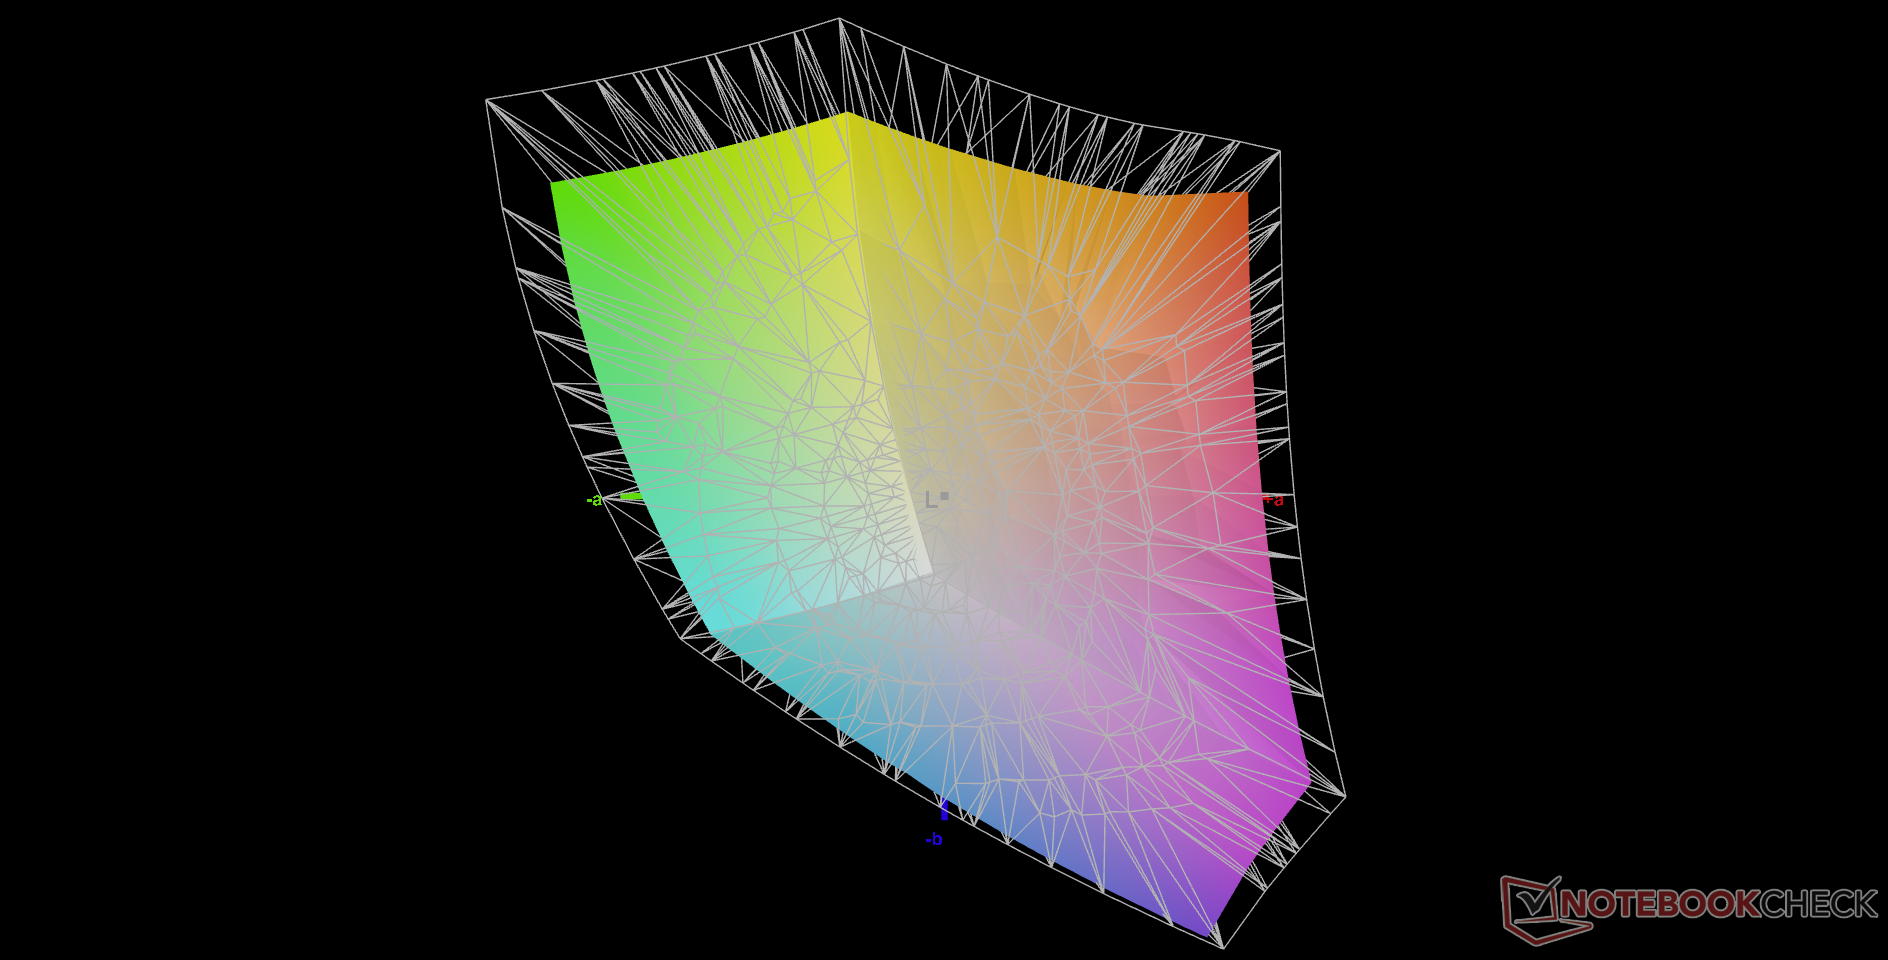
79.6% AdobeRGB 1998 (Argyll 3D)
99.8% sRGB (Argyll 3D)
79.2% Display P3 (Argyll 3D)
Gamma: 2.18
CCT: 5879 K
| Alienware x17 R2 P48E AU Optronics B173HAN, IPS, 1920x1080, 17.3" | Alienware x17 RTX 3080 P48E AU Optronics B173ZAN, IPS, 3840x2160, 17.3" | Asus ROG Zephyrus S17 GX703HSD BOE099D (BOE CQ NE173QHM-NY3), IPS, 2560x1440, 17.3" | MSI Stealth GS77 12UHS-083US BOE NE173QHM-NZ1, IPS, 2560x1440, 17.3" | MSI GT76 Titan DT 10SGS AU Optronics B173ZAN03.3, IPS, 3840x2160, 17.3" | Gigabyte A7 X1 AU Optronics AUO8E8D, IPS, 1920x1080, 17.3" | |
|---|---|---|---|---|---|---|
| Display | 12% | 8% | 10% | 8% | -17% | |
| Display P3 Coverage (%) | 79.2 | 88.3 11% | 94.2 19% | 96.2 21% | 82.5 4% | 61.5 -22% |
| sRGB Coverage (%) | 99.8 | 100 0% | 98.7 -1% | 99.7 0% | 98 -2% | 90.9 -9% |
| AdobeRGB 1998 Coverage (%) | 79.6 | 100 26% | 84.4 6% | 85.8 8% | 96.6 21% | 63.2 -21% |
| Response Times | -15% | 37% | -41% | -57% | -23% | |
| Response Time Grey 50% / Grey 80% * (ms) | 12.4 ? | 14.4 ? -16% | 4.8 61% | 17.6 ? -42% | 23.2 ? -87% | 16 ? -29% |
| Response Time Black / White * (ms) | 9.2 ? | 10.4 ? -13% | 8 13% | 12.8 ? -39% | 11.6 ? -26% | 10.8 ? -17% |
| PWM Frequency (Hz) | ||||||
| Screen | -6% | -29% | -12% | -55% | -39% | |
| Brightness middle (cd/m²) | 365.4 | 438.7 20% | 322 -12% | 334.8 -8% | 419.5 15% | 325 -11% |
| Brightness (cd/m²) | 344 | 435 26% | 288 -16% | 305 -11% | 413 20% | 318 -8% |
| Brightness Distribution (%) | 85 | 91 7% | 72 -15% | 79 -7% | 93 9% | 95 12% |
| Black Level * (cd/m²) | 0.29 | 0.48 -66% | 0.3 -3% | 0.34 -17% | 0.4 -38% | 0.29 -0% |
| Contrast (:1) | 1260 | 914 -27% | 1073 -15% | 985 -22% | 1049 -17% | 1121 -11% |
| Colorchecker dE 2000 * | 3.17 | 4.34 -37% | 3.05 4% | 4.1 -29% | 3.4 -7% | 4.33 -37% |
| Colorchecker dE 2000 max. * | 7.69 | 7.3 5% | 5.23 32% | 7.28 5% | 7.4 4% | 8.6 -12% |
| Colorchecker dE 2000 calibrated * | 0.51 | 0.72 -41% | 1.92 -276% | 3.28 -543% | 1.95 -282% | |
| Greyscale dE 2000 * | 5.3 | 2.4 55% | 3.11 41% | 5.6 -6% | 2 62% | 5.5 -4% |
| Gamma | 2.18 101% | 2.09 105% | 2.13 103% | 2.16 102% | 2.14 103% | 2.142 103% |
| CCT | 5879 111% | 6413 101% | 6553 99% | 6314 103% | 6858 95% | 7893 82% |
| Color Space (Percent of AdobeRGB 1998) (%) | 84 | 84.6 | ||||
| Color Space (Percent of sRGB) (%) | 99 | 97.9 | ||||
| Media total (Programa/Opciones) | -3% /
-4% | 5% /
-12% | -14% /
-11% | -35% /
-42% | -26% /
-32% |
* ... más pequeño es mejor
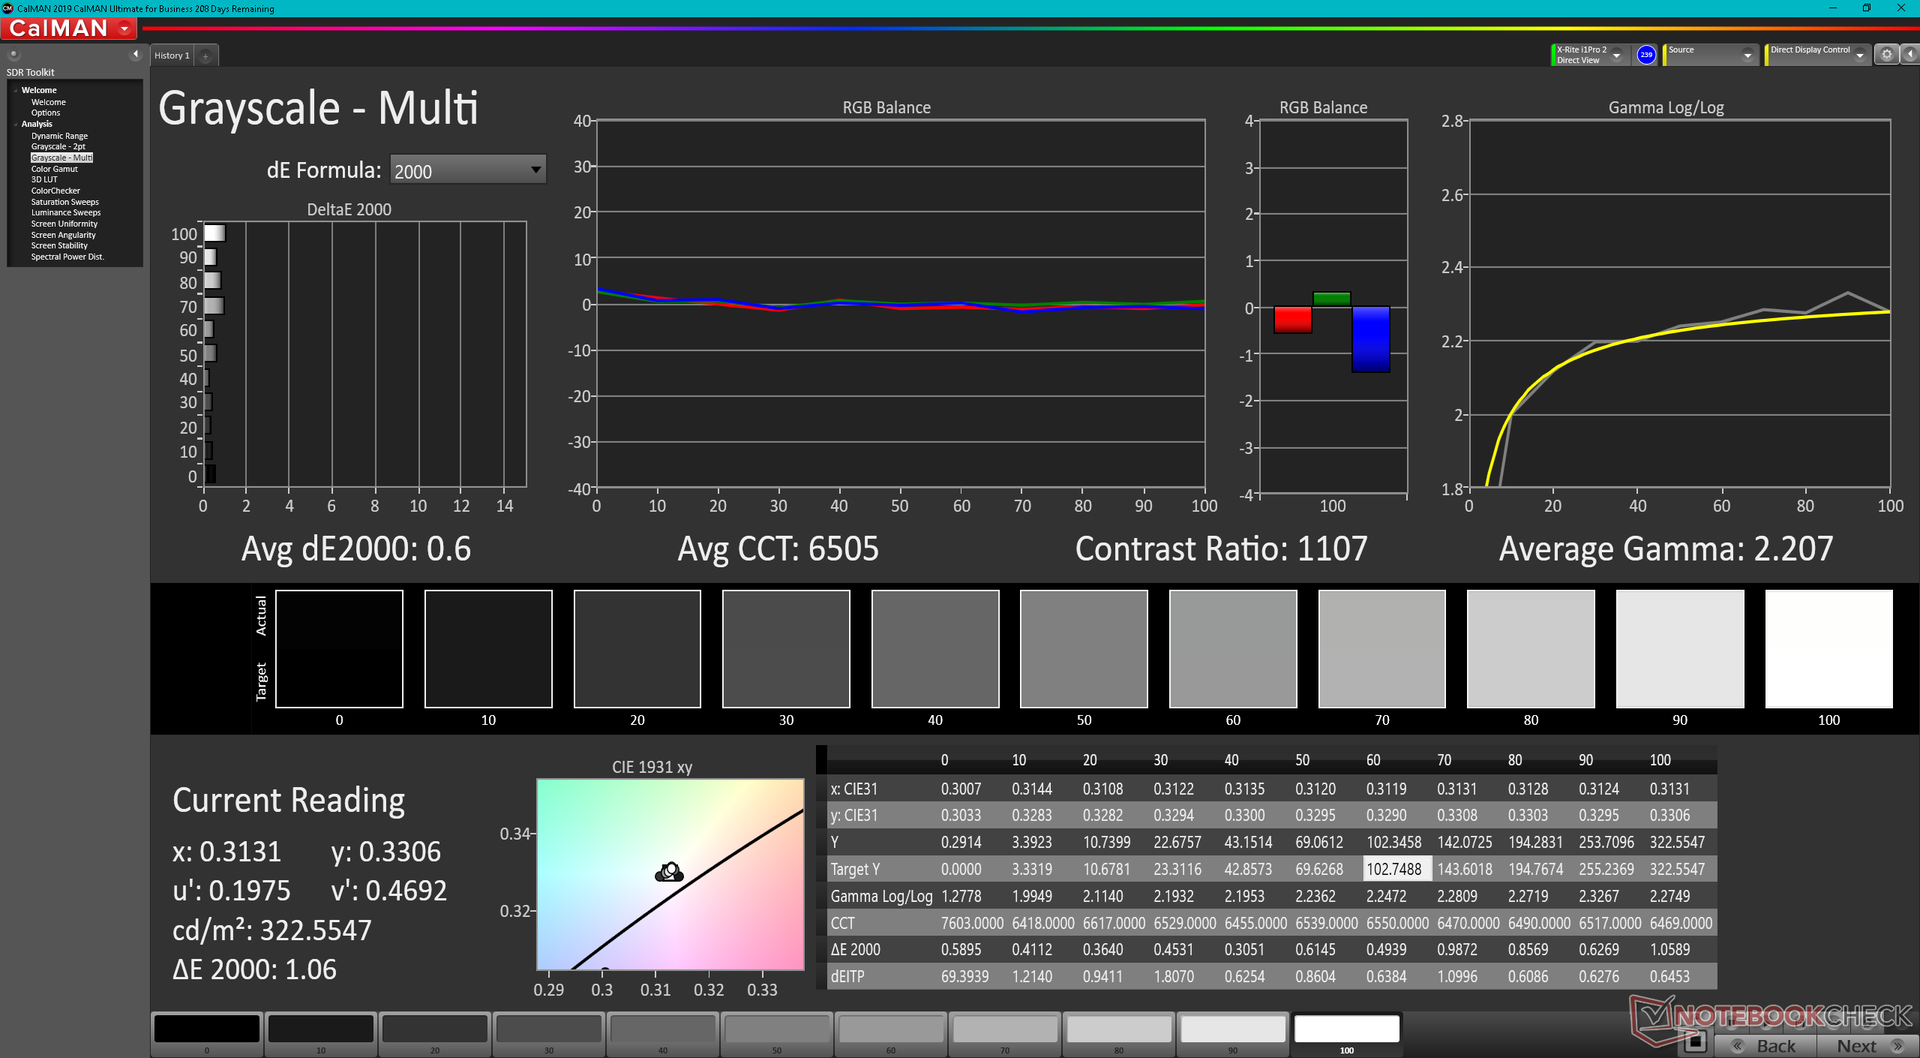
La pantalla no está muy bien calibrada al sacarla de la caja, especialmente porque la temperatura del color es demasiado cálida. Sin embargo, una vez calibrada correctamente con sRGB, podemos conseguir valores medios de escala de grises y deltaE de color de sólo 0,6 y 0,51, respectivamente.
Tiempos de respuesta del display
| ↔ Tiempo de respuesta de Negro a Blanco | ||
|---|---|---|
| 9.2 ms ... subida ↗ y bajada ↘ combinada | ↗ 5.2 ms subida | 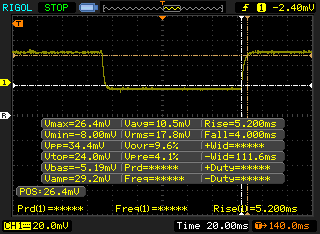 |
| ↘ 4 ms bajada | ||
| La pantalla mostró tiempos de respuesta rápidos en nuestros tests y debería ser adecuada para juegos. En comparación, todos los dispositivos de prueba van de ##min### (mínimo) a 240 (máximo) ms. » 26 % de todos los dispositivos son mejores. Esto quiere decir que el tiempo de respuesta medido es mejor que la media (19.8 ms) de todos los dispositivos testados. | ||
| ↔ Tiempo de respuesta 50% Gris a 80% Gris | ||
| 12.4 ms ... subida ↗ y bajada ↘ combinada | ↗ 6.4 ms subida | 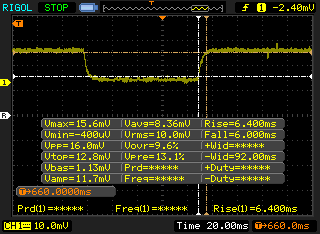 |
| ↘ 6 ms bajada | ||
| La pantalla mostró buenos tiempos de respuesta en nuestros tests pero podría ser demasiado lenta para los jugones competitivos. En comparación, todos los dispositivos de prueba van de ##min### (mínimo) a 636 (máximo) ms. » 26 % de todos los dispositivos son mejores. Esto quiere decir que el tiempo de respuesta medido es mejor que la media (31 ms) de todos los dispositivos testados. | ||
Parpadeo de Pantalla / PWM (Pulse-Width Modulation)
| Parpadeo de Pantalla / PWM no detectado | 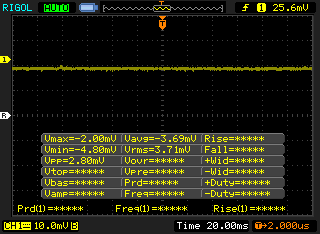 | ||
Comparación: 52 % de todos los dispositivos testados no usaron PWM para atenuar el display. Si se usó, medimos una media de 7757 (mínimo: 5 - máxmo: 343500) Hz. | |||
Rendimiento
Condiciones de la prueba
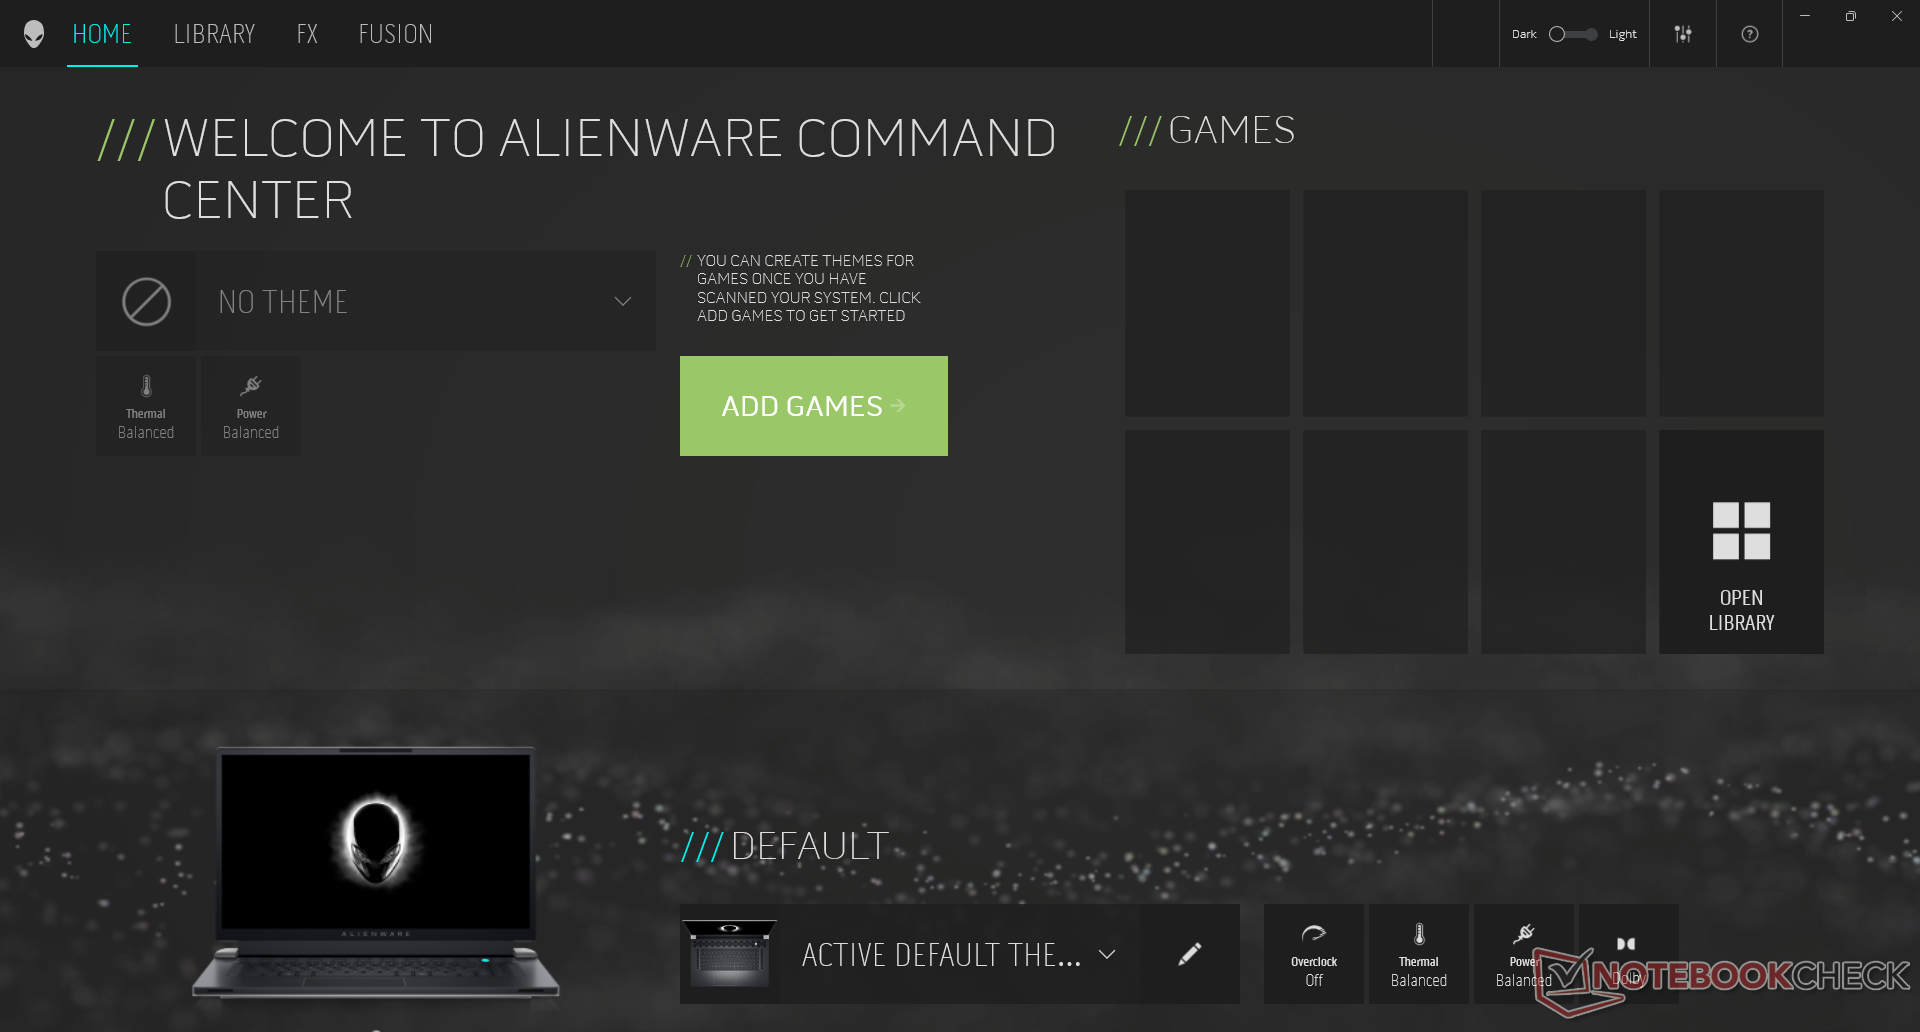
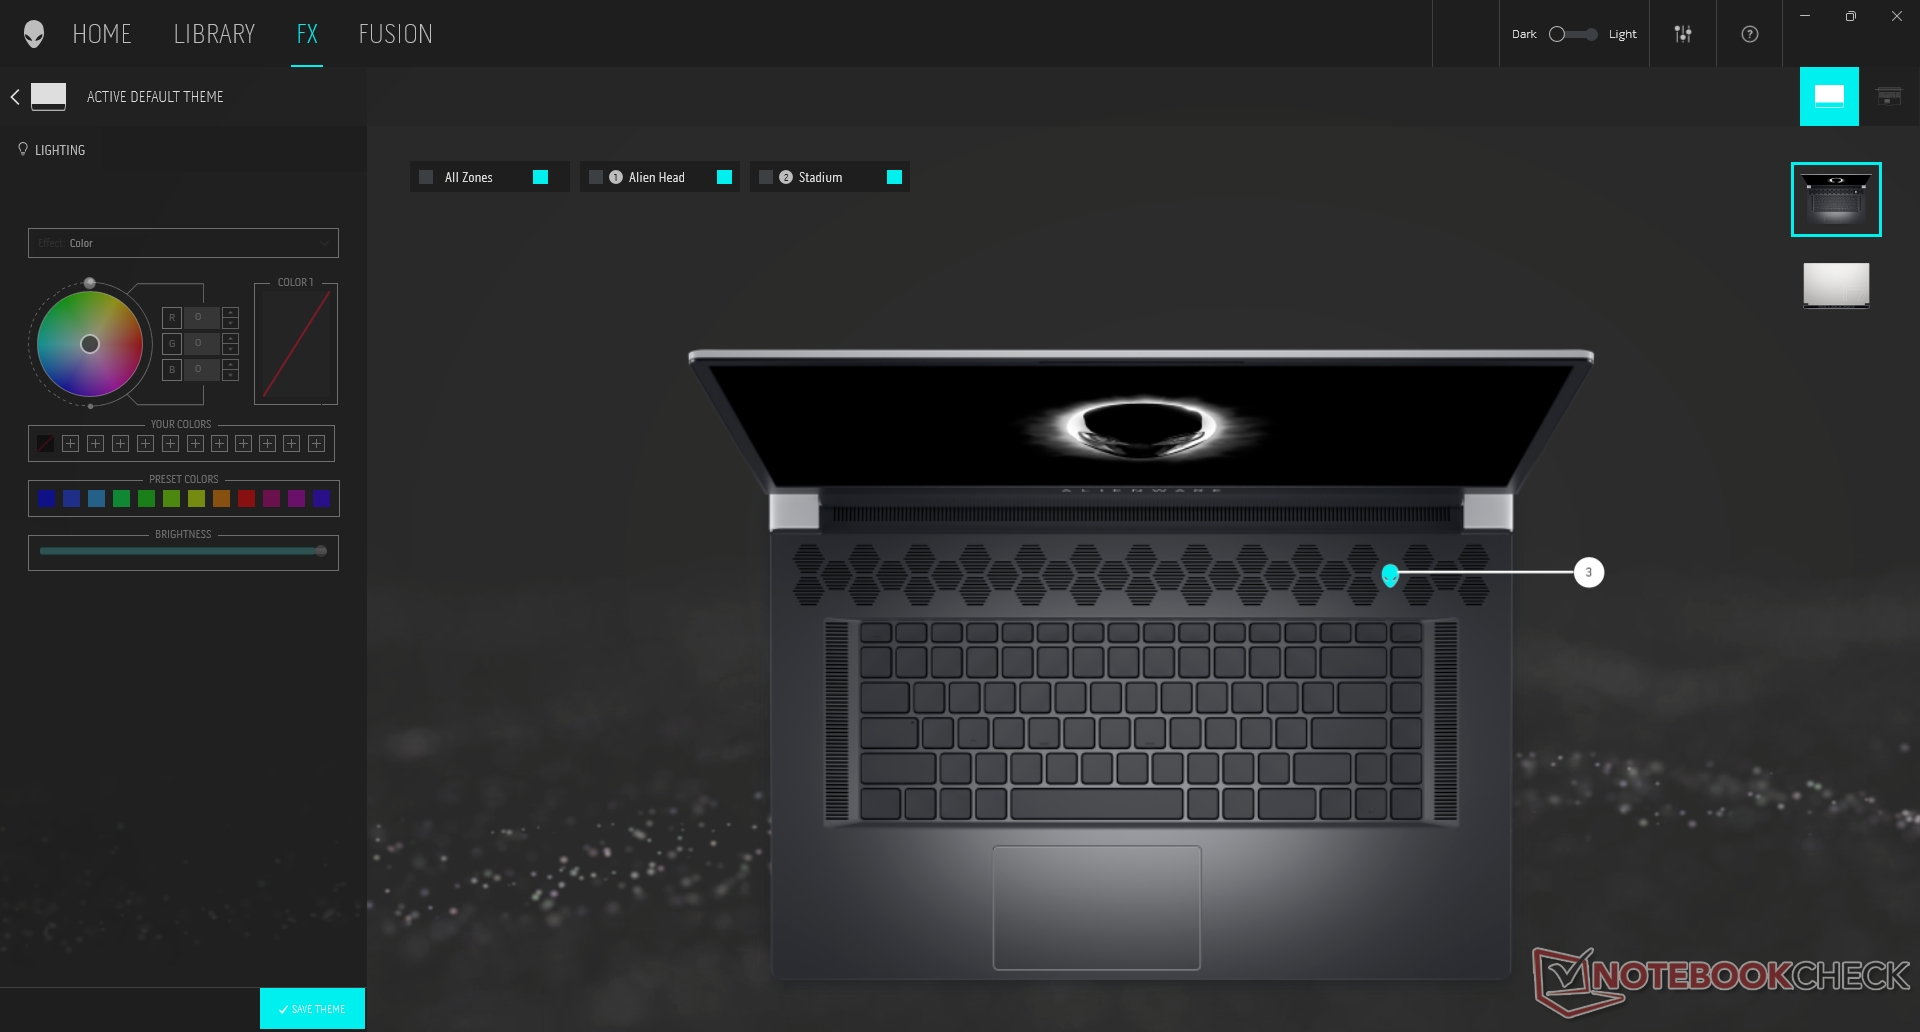
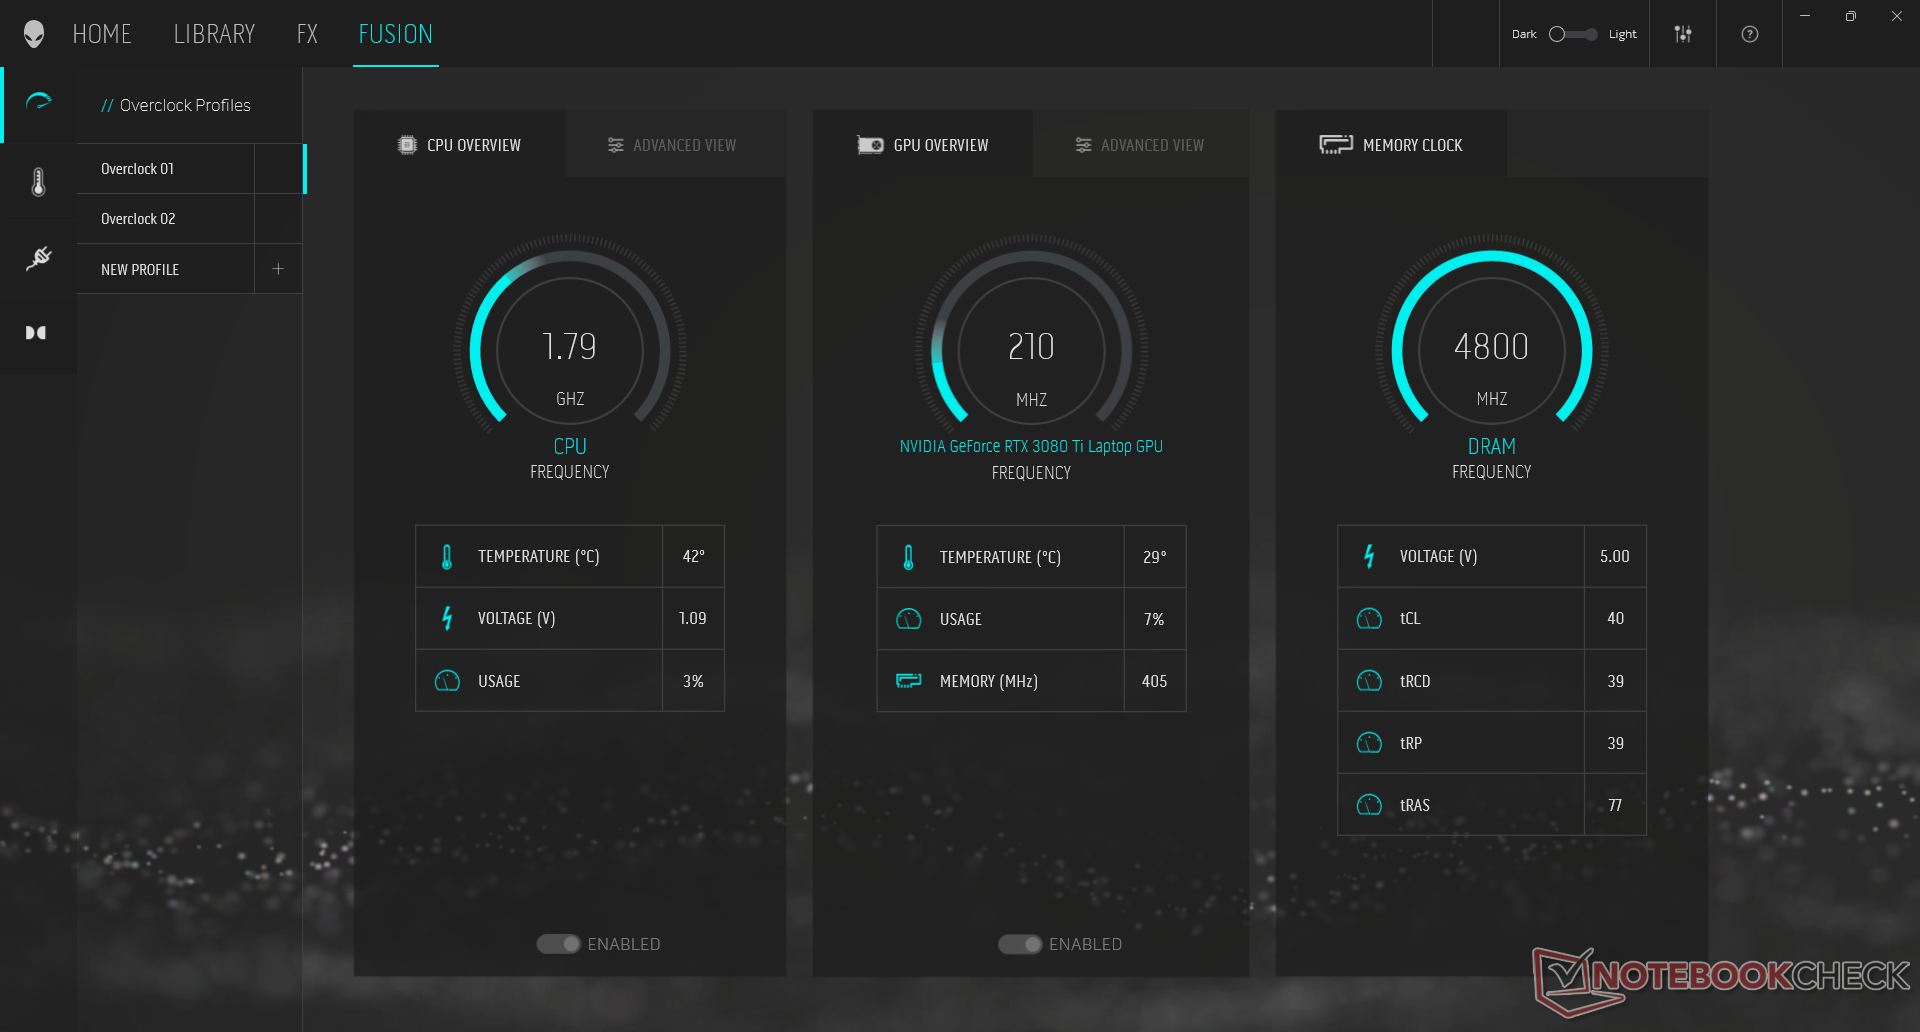
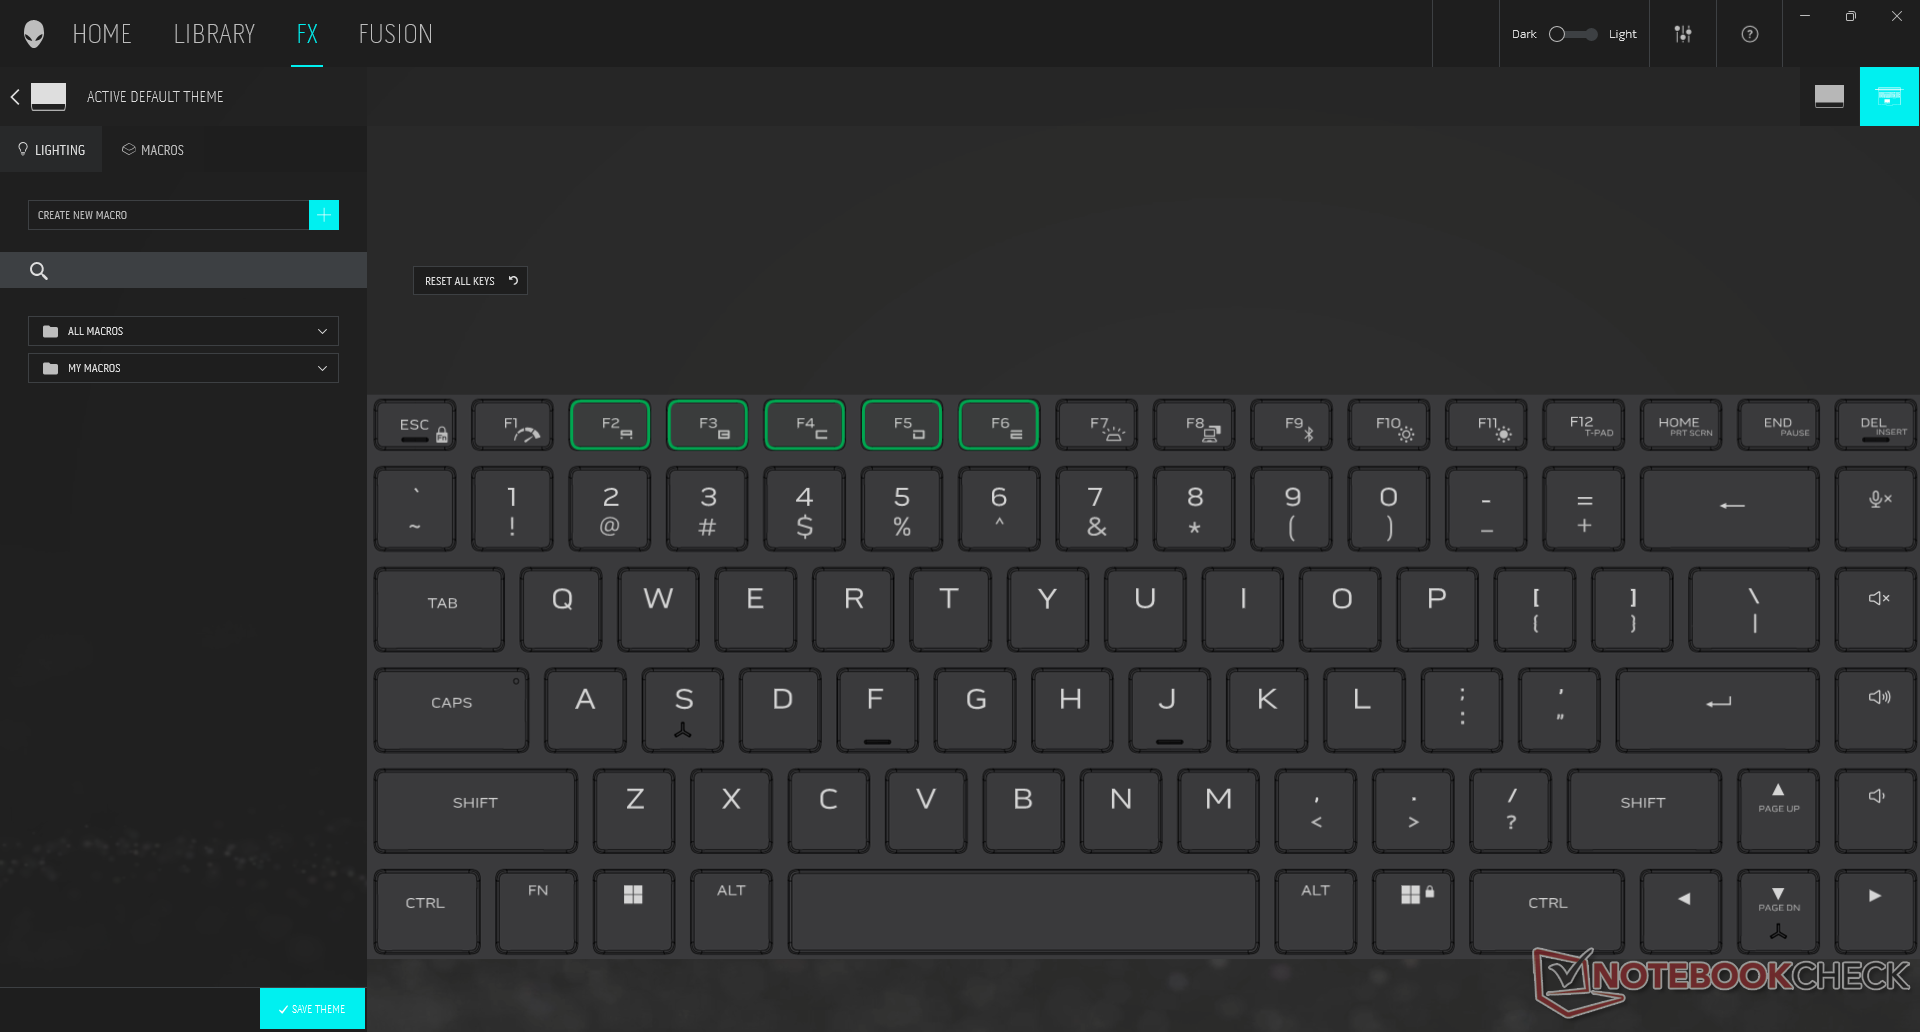
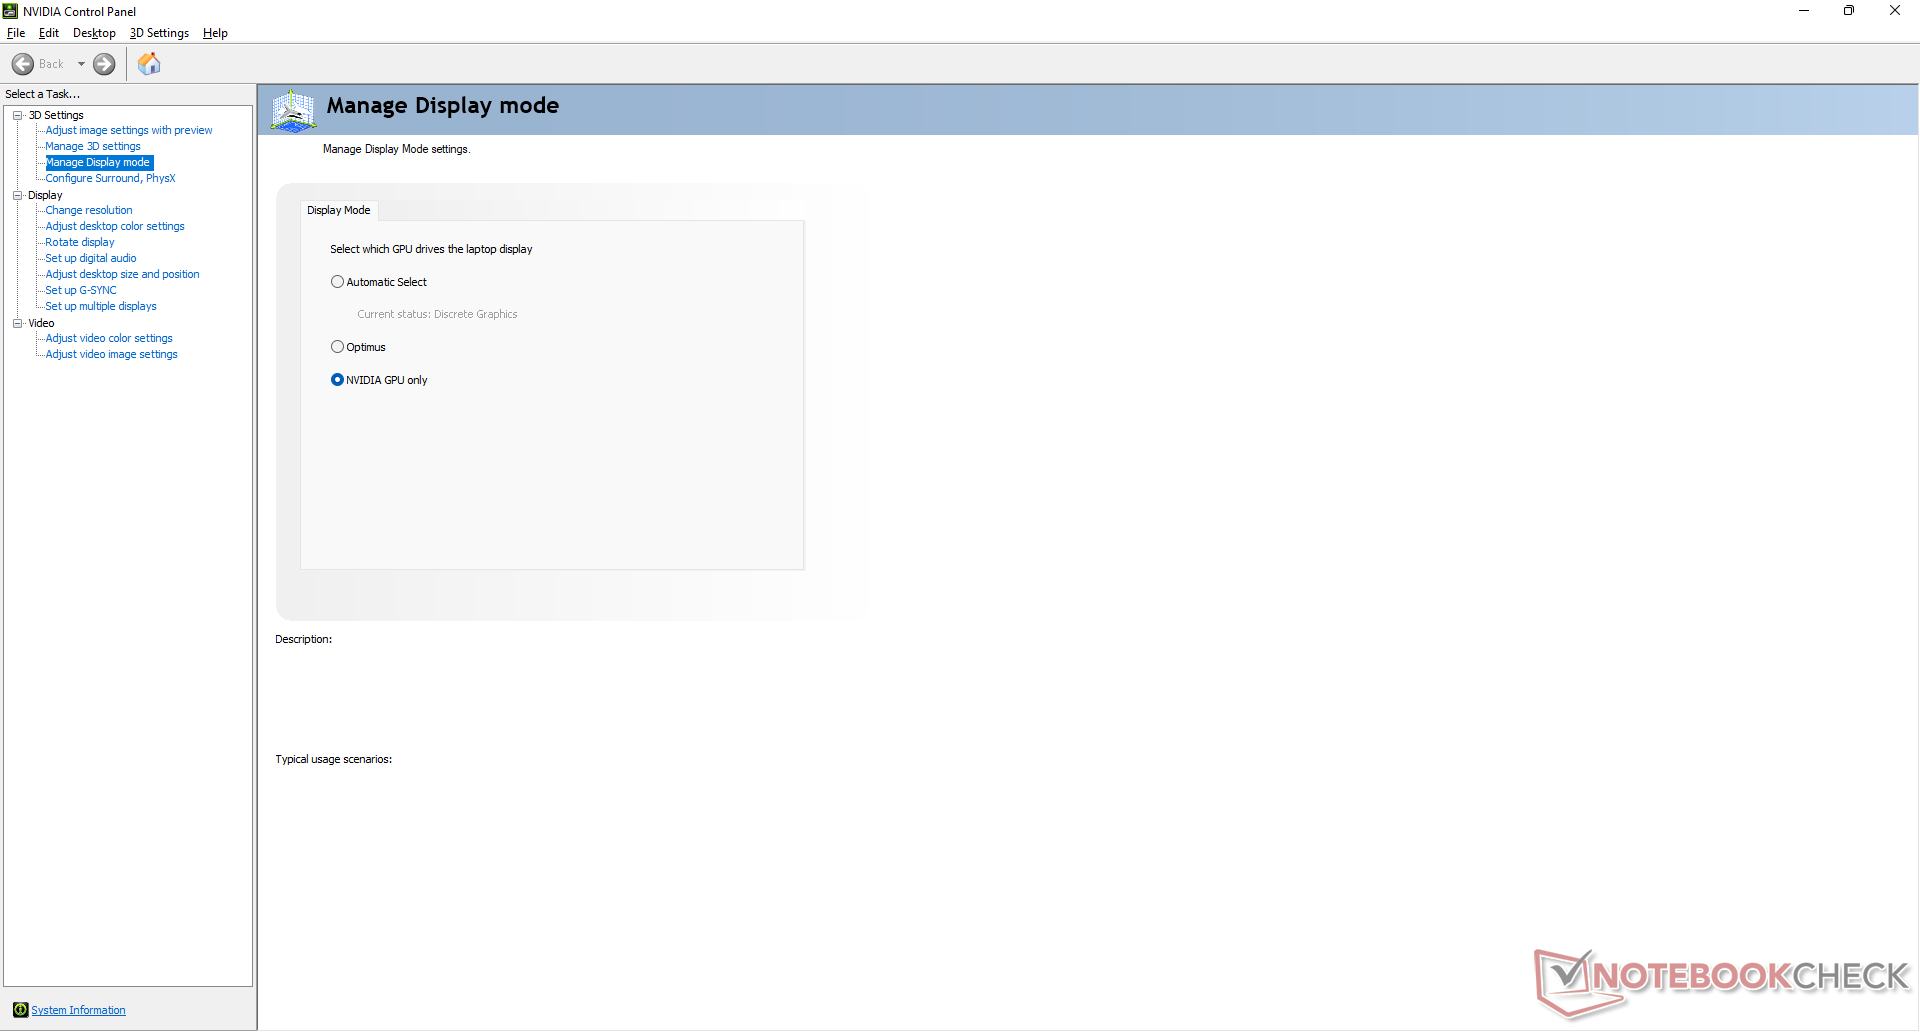
Pusimos nuestra unidad en modo de alto rendimiento y con la GPU discreta activa antes de ejecutar cualquier prueba de rendimiento para obtener las puntuaciones más altas posibles. El modo de alto rendimiento se puede cambiar fácilmente a través de Fn+F1, mientras que el interruptor MUX se puede acceder a través del panel de control de Nvidia. Recomendamos encarecidamente que los usuarios se familiaricen con el software Alienware Command Center, ya que aquí se encuentran los perfiles de energía, los ajustes RGB, la monitorización en tiempo real y otras funciones.
Procesador
El rendimiento bruto de la CPU es entre un 10 y un 15 por ciento más rápido que el de la media de portátiles de nuestra base de datos con el mismo Core i9-12900HK. Es una mejora decente con respecto al Core i7-12800H o la última generación de Core i7-11800H en hasta un 30% cada uno en cargas de trabajo multihilo. La última CPU Zen 3+ de AMD, el Ryzen 9 6900HXtambién es sistemáticamente más lenta en las pruebas de CineBench, pero supera al Core i9-12900HK en ciertas pruebas de AIDA64.
Cinebench R15 Multi Loop
Cinebench R23: Multi Core | Single Core
Cinebench R15: CPU Multi 64Bit | CPU Single 64Bit
Blender: v2.79 BMW27 CPU
7-Zip 18.03: 7z b 4 | 7z b 4 -mmt1
Geekbench 5.5: Multi-Core | Single-Core
HWBOT x265 Benchmark v2.2: 4k Preset
LibreOffice : 20 Documents To PDF
R Benchmark 2.5: Overall mean
| Cinebench R20 / CPU (Multi Core) | |
| AMD Radeon RX 6800 XT | |
| Corsair One i300 | |
| Alienware x17 R2 P48E | |
| Medio Intel Core i9-12900HK (1828 - 7366, n=14) | |
| Razer Blade 14 Ryzen 9 6900HX | |
| Alienware x17 RTX 3080 P48E | |
| Razer Blade 17 (i7-12800H, RTX 3070 Ti) | |
| Gigabyte A7 X1 | |
| Razer Blade Pro 17 2021 (QHD Touch) | |
| Lenovo Legion Y740-17IRHg-81UJ001VGE | |
| Cinebench R20 / CPU (Single Core) | |
| Corsair One i300 | |
| Alienware x17 R2 P48E | |
| Razer Blade 17 (i7-12800H, RTX 3070 Ti) | |
| Medio Intel Core i9-12900HK (316 - 739, n=14) | |
| AMD Radeon RX 6800 XT | |
| Razer Blade 14 Ryzen 9 6900HX | |
| Alienware x17 RTX 3080 P48E | |
| Gigabyte A7 X1 | |
| Razer Blade Pro 17 2021 (QHD Touch) | |
| Lenovo Legion Y740-17IRHg-81UJ001VGE | |
| Cinebench R23 / Multi Core | |
| Corsair One i300 | |
| AMD Radeon RX 6800 XT | |
| Alienware x17 R2 P48E | |
| Medio Intel Core i9-12900HK (4796 - 19282, n=14) | |
| Razer Blade 17 (i7-12800H, RTX 3070 Ti) | |
| Razer Blade 14 Ryzen 9 6900HX | |
| Alienware x17 RTX 3080 P48E | |
| Gigabyte A7 X1 | |
| Razer Blade Pro 17 2021 (QHD Touch) | |
| Cinebench R23 / Single Core | |
| Corsair One i300 | |
| Alienware x17 R2 P48E | |
| Razer Blade 17 (i7-12800H, RTX 3070 Ti) | |
| Medio Intel Core i9-12900HK (819 - 1940, n=15) | |
| AMD Radeon RX 6800 XT | |
| Razer Blade 14 Ryzen 9 6900HX | |
| Alienware x17 RTX 3080 P48E | |
| Gigabyte A7 X1 | |
| Razer Blade Pro 17 2021 (QHD Touch) | |
| Cinebench R15 / CPU Multi 64Bit | |
| AMD Radeon RX 6800 XT | |
| Corsair One i300 | |
| Alienware x17 R2 P48E | |
| Razer Blade 17 (i7-12800H, RTX 3070 Ti) | |
| Medio Intel Core i9-12900HK (965 - 2944, n=14) | |
| Razer Blade 14 Ryzen 9 6900HX | |
| Alienware x17 RTX 3080 P48E | |
| Gigabyte A7 X1 | |
| Razer Blade Pro 17 2021 (QHD Touch) | |
| Lenovo Legion Y740-17IRHg-81UJ001VGE | |
| Cinebench R15 / CPU Single 64Bit | |
| Corsair One i300 | |
| Alienware x17 R2 P48E | |
| Razer Blade 17 (i7-12800H, RTX 3070 Ti) | |
| AMD Radeon RX 6800 XT | |
| Razer Blade 14 Ryzen 9 6900HX | |
| Gigabyte A7 X1 | |
| Medio Intel Core i9-12900HK (119 - 279, n=14) | |
| Alienware x17 RTX 3080 P48E | |
| Razer Blade Pro 17 2021 (QHD Touch) | |
| Lenovo Legion Y740-17IRHg-81UJ001VGE | |
| Blender / v2.79 BMW27 CPU | |
| Lenovo Legion Y740-17IRHg-81UJ001VGE | |
| Razer Blade Pro 17 2021 (QHD Touch) | |
| Gigabyte A7 X1 | |
| Medio Intel Core i9-12900HK (172.5 - 483, n=13) | |
| Razer Blade 14 Ryzen 9 6900HX | |
| Razer Blade 17 (i7-12800H, RTX 3070 Ti) | |
| Alienware x17 RTX 3080 P48E | |
| Alienware x17 R2 P48E | |
| Corsair One i300 | |
| AMD Radeon RX 6800 XT | |
| 7-Zip 18.03 / 7z b 4 | |
| AMD Radeon RX 6800 XT | |
| Corsair One i300 | |
| Alienware x17 R2 P48E | |
| Razer Blade 17 (i7-12800H, RTX 3070 Ti) | |
| Razer Blade 14 Ryzen 9 6900HX | |
| Medio Intel Core i9-12900HK (25736 - 75564, n=14) | |
| Gigabyte A7 X1 | |
| Alienware x17 RTX 3080 P48E | |
| Razer Blade Pro 17 2021 (QHD Touch) | |
| Lenovo Legion Y740-17IRHg-81UJ001VGE | |
| 7-Zip 18.03 / 7z b 4 -mmt1 | |
| AMD Radeon RX 6800 XT | |
| Corsair One i300 | |
| Razer Blade 14 Ryzen 9 6900HX | |
| Alienware x17 R2 P48E | |
| Razer Blade 17 (i7-12800H, RTX 3070 Ti) | |
| Gigabyte A7 X1 | |
| Medio Intel Core i9-12900HK (2898 - 6186, n=14) | |
| Alienware x17 RTX 3080 P48E | |
| Razer Blade Pro 17 2021 (QHD Touch) | |
| Lenovo Legion Y740-17IRHg-81UJ001VGE | |
| Geekbench 5.5 / Multi-Core | |
| Corsair One i300 | |
| AMD Radeon RX 6800 XT | |
| Alienware x17 R2 P48E | |
| Razer Blade 17 (i7-12800H, RTX 3070 Ti) | |
| Medio Intel Core i9-12900HK (5869 - 14294, n=13) | |
| Razer Blade 14 Ryzen 9 6900HX | |
| Razer Blade Pro 17 2021 (QHD Touch) | |
| Gigabyte A7 X1 | |
| Lenovo Legion Y740-17IRHg-81UJ001VGE | |
| Geekbench 5.5 / Single-Core | |
| Corsair One i300 | |
| Alienware x17 R2 P48E | |
| Razer Blade 17 (i7-12800H, RTX 3070 Ti) | |
| Medio Intel Core i9-12900HK (843 - 1918, n=13) | |
| AMD Radeon RX 6800 XT | |
| Razer Blade 14 Ryzen 9 6900HX | |
| Gigabyte A7 X1 | |
| Razer Blade Pro 17 2021 (QHD Touch) | |
| Lenovo Legion Y740-17IRHg-81UJ001VGE | |
| HWBOT x265 Benchmark v2.2 / 4k Preset | |
| AMD Radeon RX 6800 XT | |
| Corsair One i300 | |
| Alienware x17 R2 P48E | |
| Razer Blade 14 Ryzen 9 6900HX | |
| Alienware x17 RTX 3080 P48E | |
| Medio Intel Core i9-12900HK (5.33 - 21.6, n=14) | |
| Razer Blade 17 (i7-12800H, RTX 3070 Ti) | |
| Gigabyte A7 X1 | |
| Razer Blade Pro 17 2021 (QHD Touch) | |
| Lenovo Legion Y740-17IRHg-81UJ001VGE | |
| LibreOffice / 20 Documents To PDF | |
| Gigabyte A7 X1 | |
| AMD Radeon RX 6800 XT | |
| Razer Blade 14 Ryzen 9 6900HX | |
| Medio Intel Core i9-12900HK (34.8 - 89.1, n=14) | |
| Alienware x17 RTX 3080 P48E | |
| Razer Blade Pro 17 2021 (QHD Touch) | |
| Razer Blade 17 (i7-12800H, RTX 3070 Ti) | |
| Alienware x17 R2 P48E | |
| Corsair One i300 | |
| R Benchmark 2.5 / Overall mean | |
| Lenovo Legion Y740-17IRHg-81UJ001VGE | |
| Razer Blade Pro 17 2021 (QHD Touch) | |
| Alienware x17 RTX 3080 P48E | |
| Medio Intel Core i9-12900HK (0.4155 - 0.994, n=14) | |
| Gigabyte A7 X1 | |
| Razer Blade 14 Ryzen 9 6900HX | |
| AMD Radeon RX 6800 XT | |
| Razer Blade 17 (i7-12800H, RTX 3070 Ti) | |
| Alienware x17 R2 P48E | |
| Corsair One i300 | |
* ... más pequeño es mejor
AIDA64: FP32 Ray-Trace | FPU Julia | CPU SHA3 | CPU Queen | FPU SinJulia | FPU Mandel | CPU AES | CPU ZLib | FP64 Ray-Trace | CPU PhotoWorxx
| Performance rating | |
| Razer Blade 14 Ryzen 9 6900HX | |
| Gigabyte A7 X1 | |
| Alienware x17 R2 P48E | |
| MSI Stealth GS77 12UHS-083US | |
| Medio Intel Core i9-12900HK | |
| AIDA64 / FP32 Ray-Trace | |
| Razer Blade 14 Ryzen 9 6900HX | |
| Gigabyte A7 X1 | |
| Alienware x17 R2 P48E | |
| Medio Intel Core i9-12900HK (2677 - 13948, n=15) | |
| MSI Stealth GS77 12UHS-083US | |
| AIDA64 / FPU Julia | |
| Razer Blade 14 Ryzen 9 6900HX | |
| Gigabyte A7 X1 | |
| Medio Intel Core i9-12900HK (12762 - 70764, n=15) | |
| Alienware x17 R2 P48E | |
| MSI Stealth GS77 12UHS-083US | |
| AIDA64 / CPU SHA3 | |
| Alienware x17 R2 P48E | |
| Razer Blade 14 Ryzen 9 6900HX | |
| Gigabyte A7 X1 | |
| MSI Stealth GS77 12UHS-083US | |
| Medio Intel Core i9-12900HK (841 - 3504, n=15) | |
| AIDA64 / CPU Queen | |
| Alienware x17 R2 P48E | |
| Razer Blade 14 Ryzen 9 6900HX | |
| Gigabyte A7 X1 | |
| MSI Stealth GS77 12UHS-083US | |
| Medio Intel Core i9-12900HK (60202 - 107161, n=15) | |
| AIDA64 / FPU SinJulia | |
| Razer Blade 14 Ryzen 9 6900HX | |
| Gigabyte A7 X1 | |
| Alienware x17 R2 P48E | |
| MSI Stealth GS77 12UHS-083US | |
| Medio Intel Core i9-12900HK (3225 - 10402, n=15) | |
| AIDA64 / FPU Mandel | |
| Razer Blade 14 Ryzen 9 6900HX | |
| Gigabyte A7 X1 | |
| Alienware x17 R2 P48E | |
| Medio Intel Core i9-12900HK (7417 - 34233, n=15) | |
| MSI Stealth GS77 12UHS-083US | |
| AIDA64 / CPU AES | |
| Razer Blade 14 Ryzen 9 6900HX | |
| Gigabyte A7 X1 | |
| Alienware x17 R2 P48E | |
| MSI Stealth GS77 12UHS-083US | |
| Medio Intel Core i9-12900HK (32382 - 112498, n=15) | |
| AIDA64 / CPU ZLib | |
| Alienware x17 R2 P48E | |
| MSI Stealth GS77 12UHS-083US | |
| Medio Intel Core i9-12900HK (314 - 1209, n=15) | |
| Razer Blade 14 Ryzen 9 6900HX | |
| Gigabyte A7 X1 | |
| AIDA64 / FP64 Ray-Trace | |
| Razer Blade 14 Ryzen 9 6900HX | |
| Gigabyte A7 X1 | |
| Alienware x17 R2 P48E | |
| Medio Intel Core i9-12900HK (1501 - 7616, n=15) | |
| MSI Stealth GS77 12UHS-083US | |
| AIDA64 / CPU PhotoWorxx | |
| MSI Stealth GS77 12UHS-083US | |
| Medio Intel Core i9-12900HK (24446 - 42462, n=15) | |
| Alienware x17 R2 P48E | |
| Razer Blade 14 Ryzen 9 6900HX | |
| Gigabyte A7 X1 | |
Rendimiento del sistema
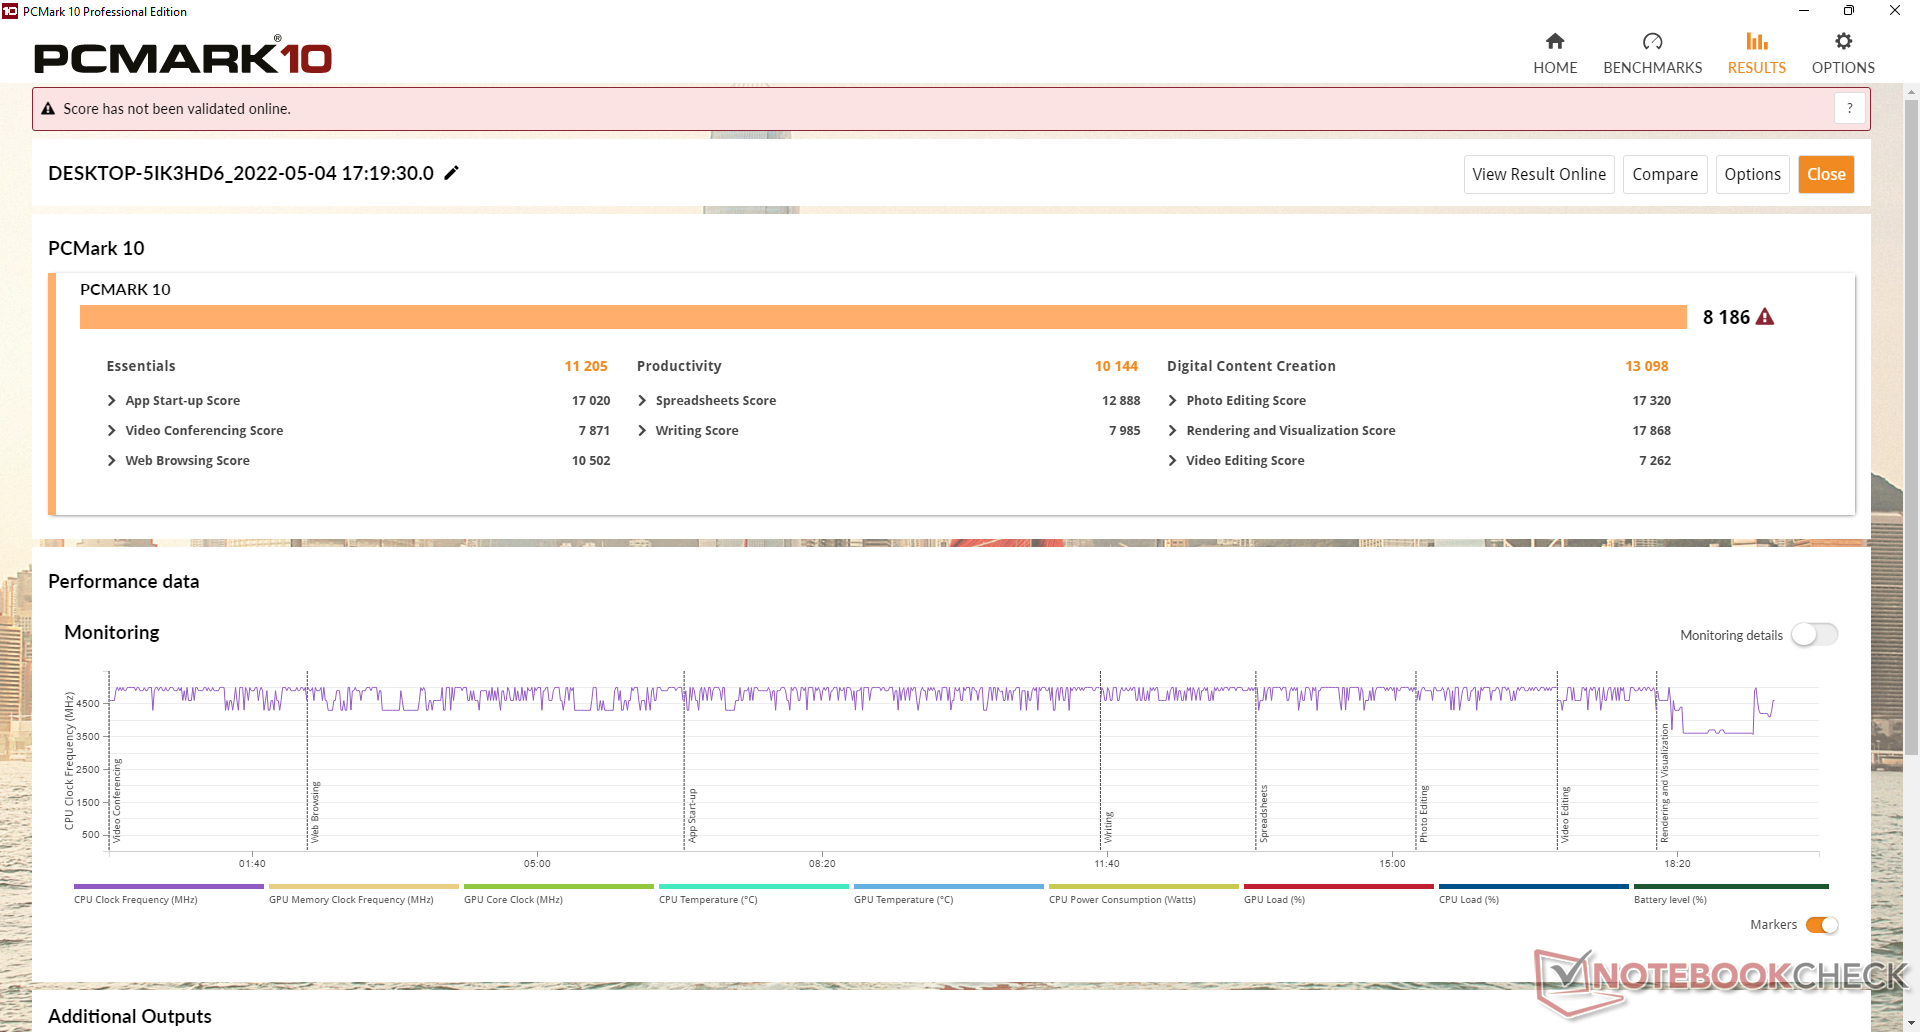
Los resultados de PCMark son sistemáticamente superiores a los que registramos en el x17 R1 del año pasado por márgenes relativamente ligeros.
Merece la pena señalar que el portátil consume mucha energía incluso en modo de espera o reposo. Registramos un consumo de casi 12 W cuando está en modo de reposo en comparación con los <2 W de la mayoría de los otros portátiles. Además, los ventiladores de nuestra unidad de prueba a veces estaban activos incluso en modo de reposo y la unidad a veces también tenía problemas para despertarse correctamente.
CrossMark: Overall | Productivity | Creativity | Responsiveness
| PCMark 10 / Score | |
| Alienware x17 R2 P48E | |
| Medio Intel Core i9-12900HK, NVIDIA GeForce RTX 3080 Ti Laptop GPU (7149 - 8186, n=5) | |
| Alienware x17 RTX 3080 P48E | |
| MSI Stealth GS77 12UHS-083US | |
| MSI GT76 Titan DT 10SGS | |
| Asus ROG Zephyrus S17 GX703HSD | |
| Gigabyte A7 X1 | |
| PCMark 10 / Essentials | |
| Alienware x17 R2 P48E | |
| Medio Intel Core i9-12900HK, NVIDIA GeForce RTX 3080 Ti Laptop GPU (9870 - 11205, n=5) | |
| Asus ROG Zephyrus S17 GX703HSD | |
| MSI GT76 Titan DT 10SGS | |
| MSI Stealth GS77 12UHS-083US | |
| Alienware x17 RTX 3080 P48E | |
| Gigabyte A7 X1 | |
| PCMark 10 / Productivity | |
| Alienware x17 R2 P48E | |
| Medio Intel Core i9-12900HK, NVIDIA GeForce RTX 3080 Ti Laptop GPU (9173 - 10422, n=5) | |
| Alienware x17 RTX 3080 P48E | |
| MSI Stealth GS77 12UHS-083US | |
| Gigabyte A7 X1 | |
| Asus ROG Zephyrus S17 GX703HSD | |
| MSI GT76 Titan DT 10SGS | |
| PCMark 10 / Digital Content Creation | |
| Alienware x17 R2 P48E | |
| Medio Intel Core i9-12900HK, NVIDIA GeForce RTX 3080 Ti Laptop GPU (10951 - 13098, n=5) | |
| MSI GT76 Titan DT 10SGS | |
| Alienware x17 RTX 3080 P48E | |
| MSI Stealth GS77 12UHS-083US | |
| Asus ROG Zephyrus S17 GX703HSD | |
| Gigabyte A7 X1 | |
| CrossMark / Overall | |
| Alienware x17 R2 P48E | |
| Medio Intel Core i9-12900HK, NVIDIA GeForce RTX 3080 Ti Laptop GPU (970 - 2138, n=5) | |
| CrossMark / Productivity | |
| Alienware x17 R2 P48E | |
| Medio Intel Core i9-12900HK, NVIDIA GeForce RTX 3080 Ti Laptop GPU (921 - 2038, n=5) | |
| CrossMark / Creativity | |
| Alienware x17 R2 P48E | |
| Medio Intel Core i9-12900HK, NVIDIA GeForce RTX 3080 Ti Laptop GPU (1007 - 2210, n=5) | |
| CrossMark / Responsiveness | |
| Medio Intel Core i9-12900HK, NVIDIA GeForce RTX 3080 Ti Laptop GPU (1012 - 2234, n=5) | |
| Alienware x17 R2 P48E | |
| PCMark 10 Score | 8186 puntos | |
ayuda | ||
| AIDA64 / Memory Copy | |
| MSI Stealth GS77 12UHS-083US | |
| Medio Intel Core i9-12900HK (42967 - 62959, n=15) | |
| Alienware x17 R2 P48E | |
| Gigabyte A7 X1 | |
| AIDA64 / Memory Read | |
| MSI Stealth GS77 12UHS-083US | |
| Medio Intel Core i9-12900HK (44419 - 66989, n=15) | |
| Alienware x17 R2 P48E | |
| Gigabyte A7 X1 | |
| AIDA64 / Memory Write | |
| MSI Stealth GS77 12UHS-083US | |
| Medio Intel Core i9-12900HK (42144 - 65268, n=15) | |
| Alienware x17 R2 P48E | |
| Gigabyte A7 X1 | |
| AIDA64 / Memory Latency | |
| Alienware x17 R2 P48E | |
| MSI Stealth GS77 12UHS-083US | |
| Gigabyte A7 X1 | |
| Medio Intel Core i9-12900HK (79.9 - 109, n=15) | |
| Asus ROG Zephyrus S17 GX703HSD | |
| Alienware x17 RTX 3080 P48E | |
* ... más pequeño es mejor
Latencia del CPD
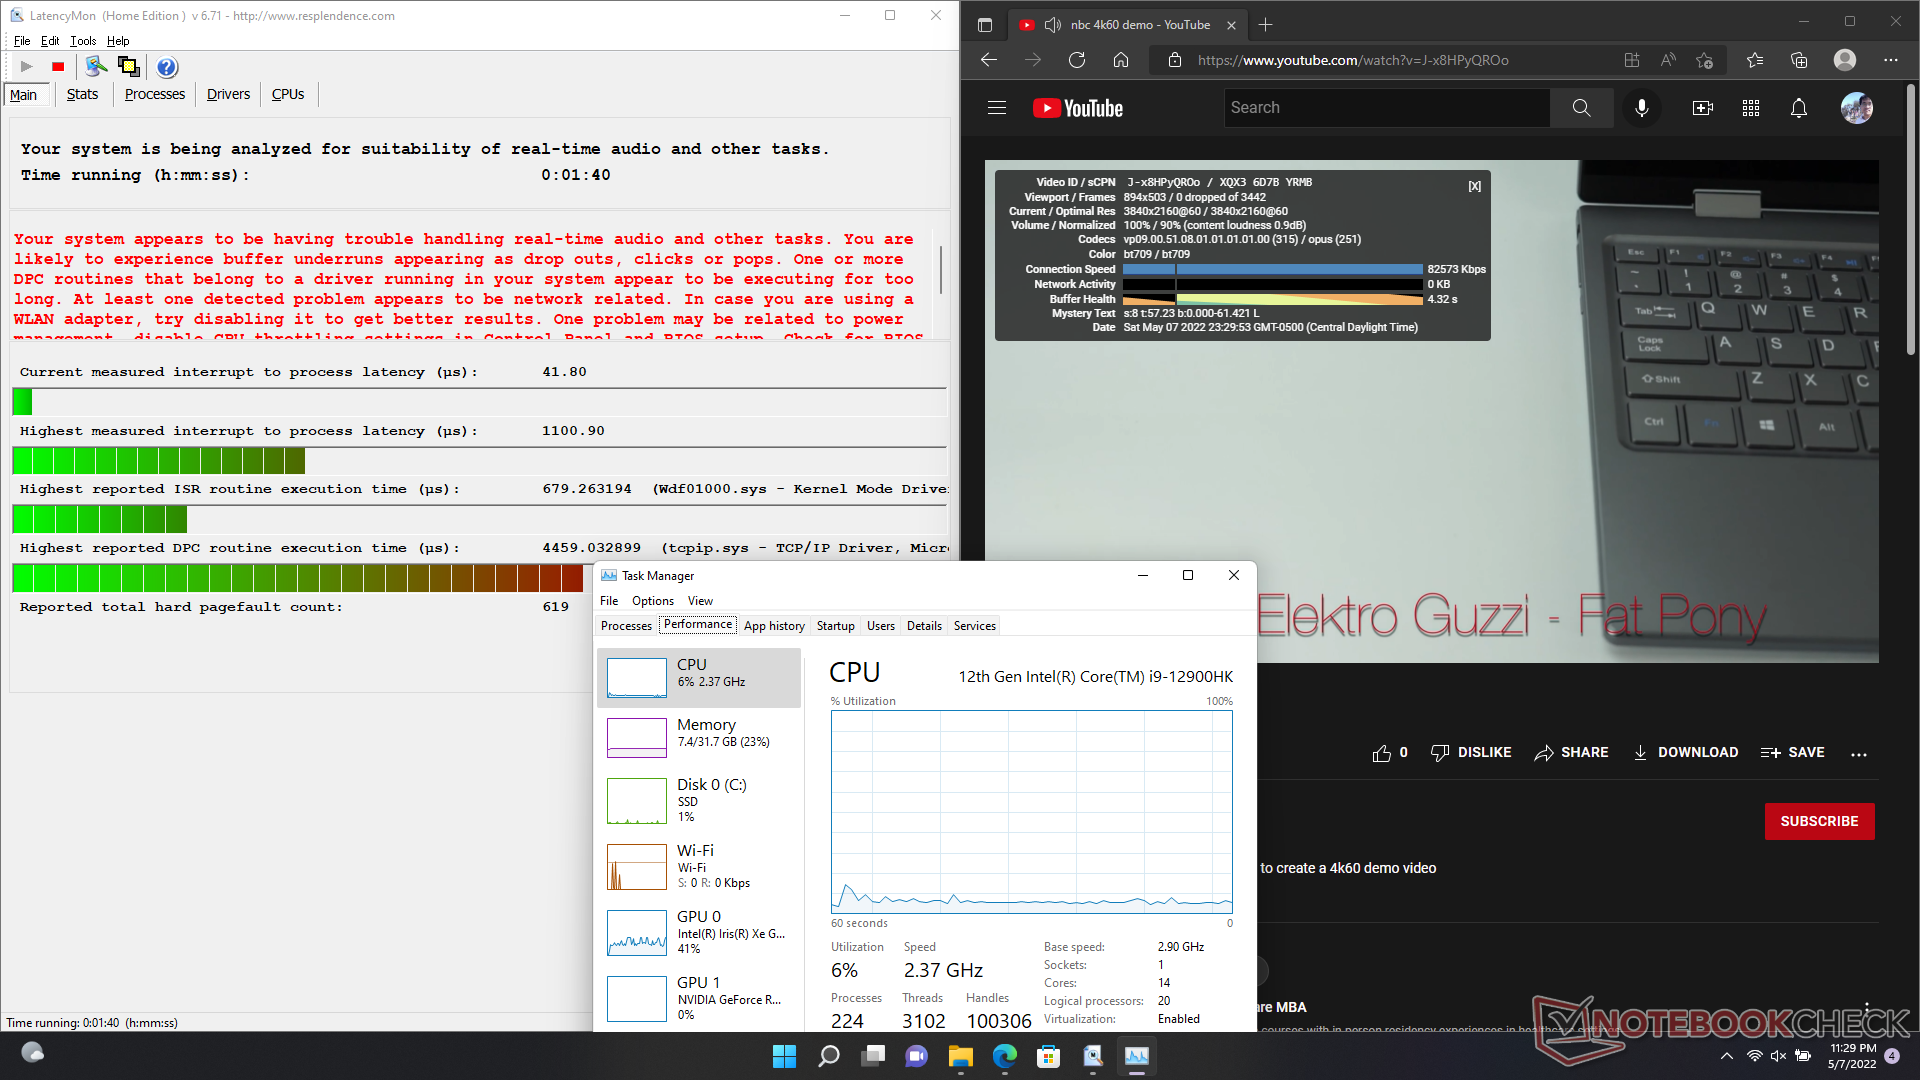
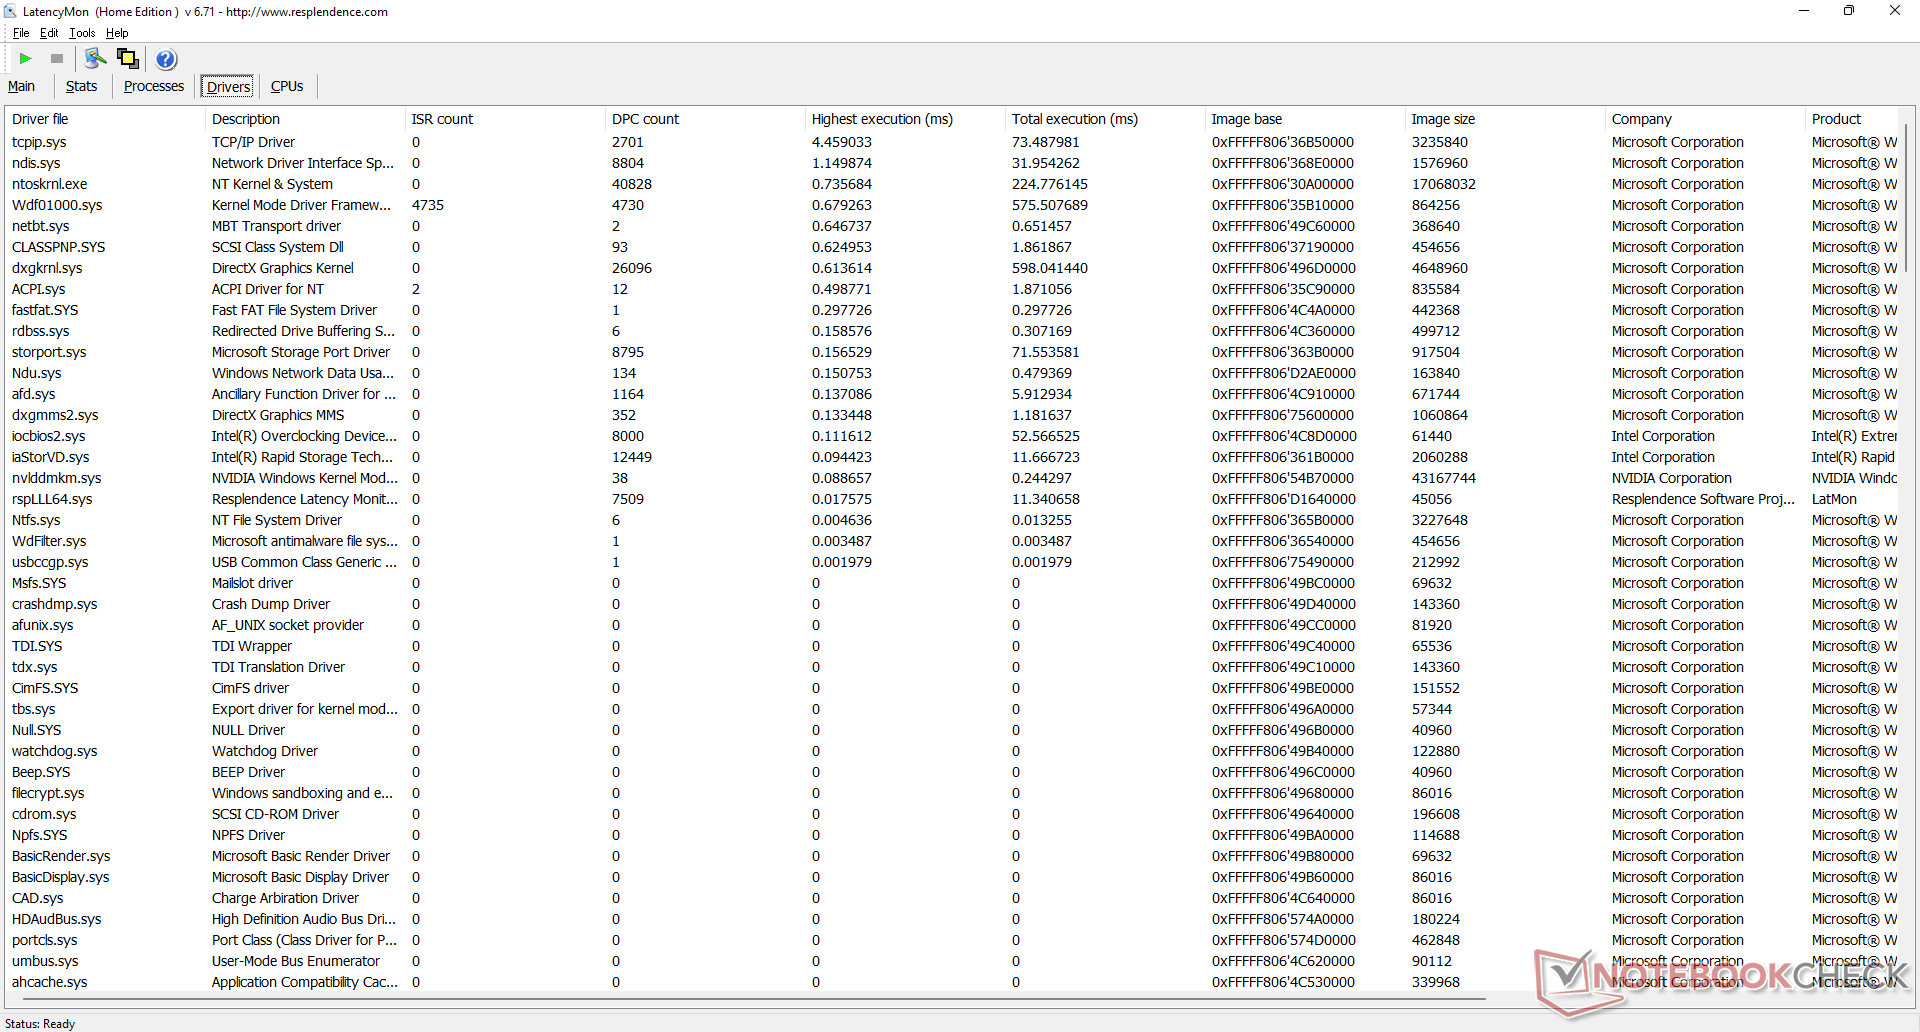
LatencyMon revela problemas de CPD al abrir varias pestañas del navegador de la página principal. la reproducción de vídeo 4K a 60 FPS es, por lo demás, fluida y sin pérdida de fotogramas.
| DPC Latencies / LatencyMon - interrupt to process latency (max), Web, Youtube, Prime95 | |
| MSI GT76 Titan DT 10SGS | |
| Alienware x17 RTX 3080 P48E | |
| MSI Stealth GS77 12UHS-083US | |
| Asus ROG Zephyrus S17 GX703HSD | |
| Alienware x17 R2 P48E | |
| Gigabyte A7 X1 | |
* ... más pequeño es mejor
Dispositivos de almacenamiento
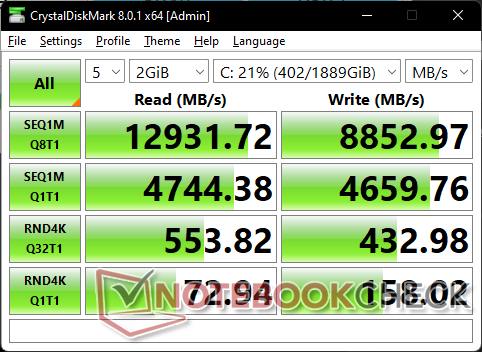
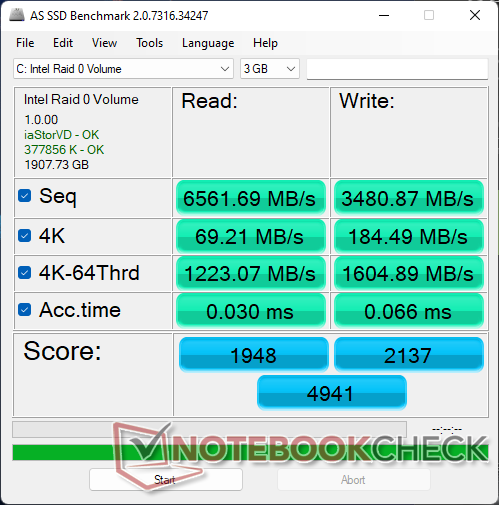

* ... más pequeño es mejor
Disk Throttling: DiskSpd Read Loop, Queue Depth 8
Rendimiento de la GPU
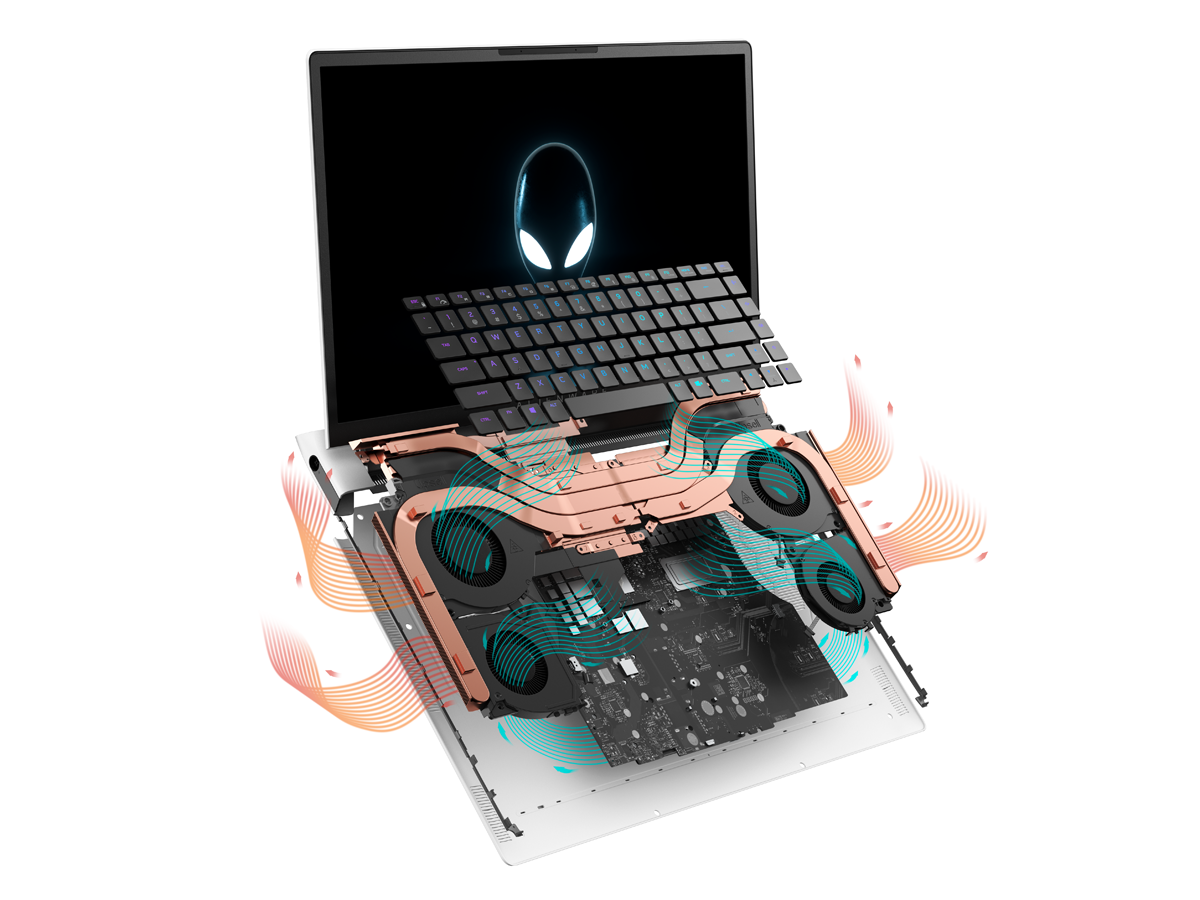
Con su altísimo objetivo TGP de 175 W, el rendimiento gráfico es uno de los más rápidos en cualquier portátil para juegos. El 2022 Razer Blade 15por ejemplo, viene con la misma GeForce RTX 3080 Ti Aunque con un objetivo TGP inferior de 110 W para un rendimiento entre un 25 y un 30 por ciento más lento. Se observan déficits similares al comparar la GPU del Alienware con la misma GPU del MSI GS77 también. Cuando se combina con la CPU más rápida que la media, los usuarios pueden esperar que las tasas de fotogramas sean ligeramente superiores a las de la mayoría de los otros portátiles para juegos equipados con gráficos GeForce RTX 3080.
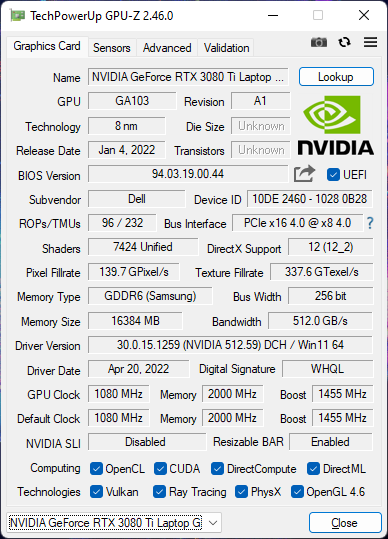
La RTX 3080 Ti móvil de nuestro Alienware x17 R2 es más parecida a la escritorio GeForce RTX 3070. A rTX 3080 Ti de sobremesa puede ofrecer un rendimiento casi un 50 por ciento más rápido que nuestra versión móvil de Alienware.
Hay que tener en cuenta que el rendimiento gráfico es más lento si se ejecuta en modo equilibrado en lugar de en modo de máximo ventilador. Fire Strike La puntuación de los gráficos sería entre un 8 y un 9 por ciento más baja si se utiliza el perfil de energía equilibrado.
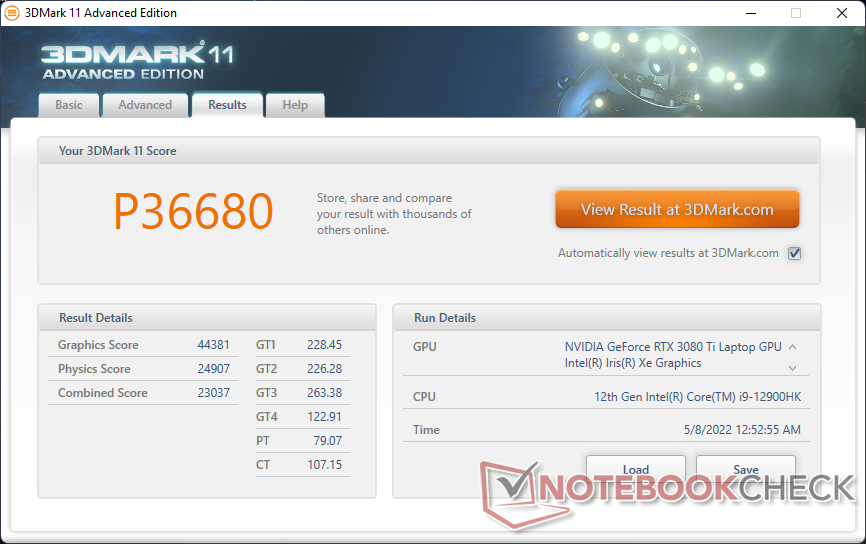
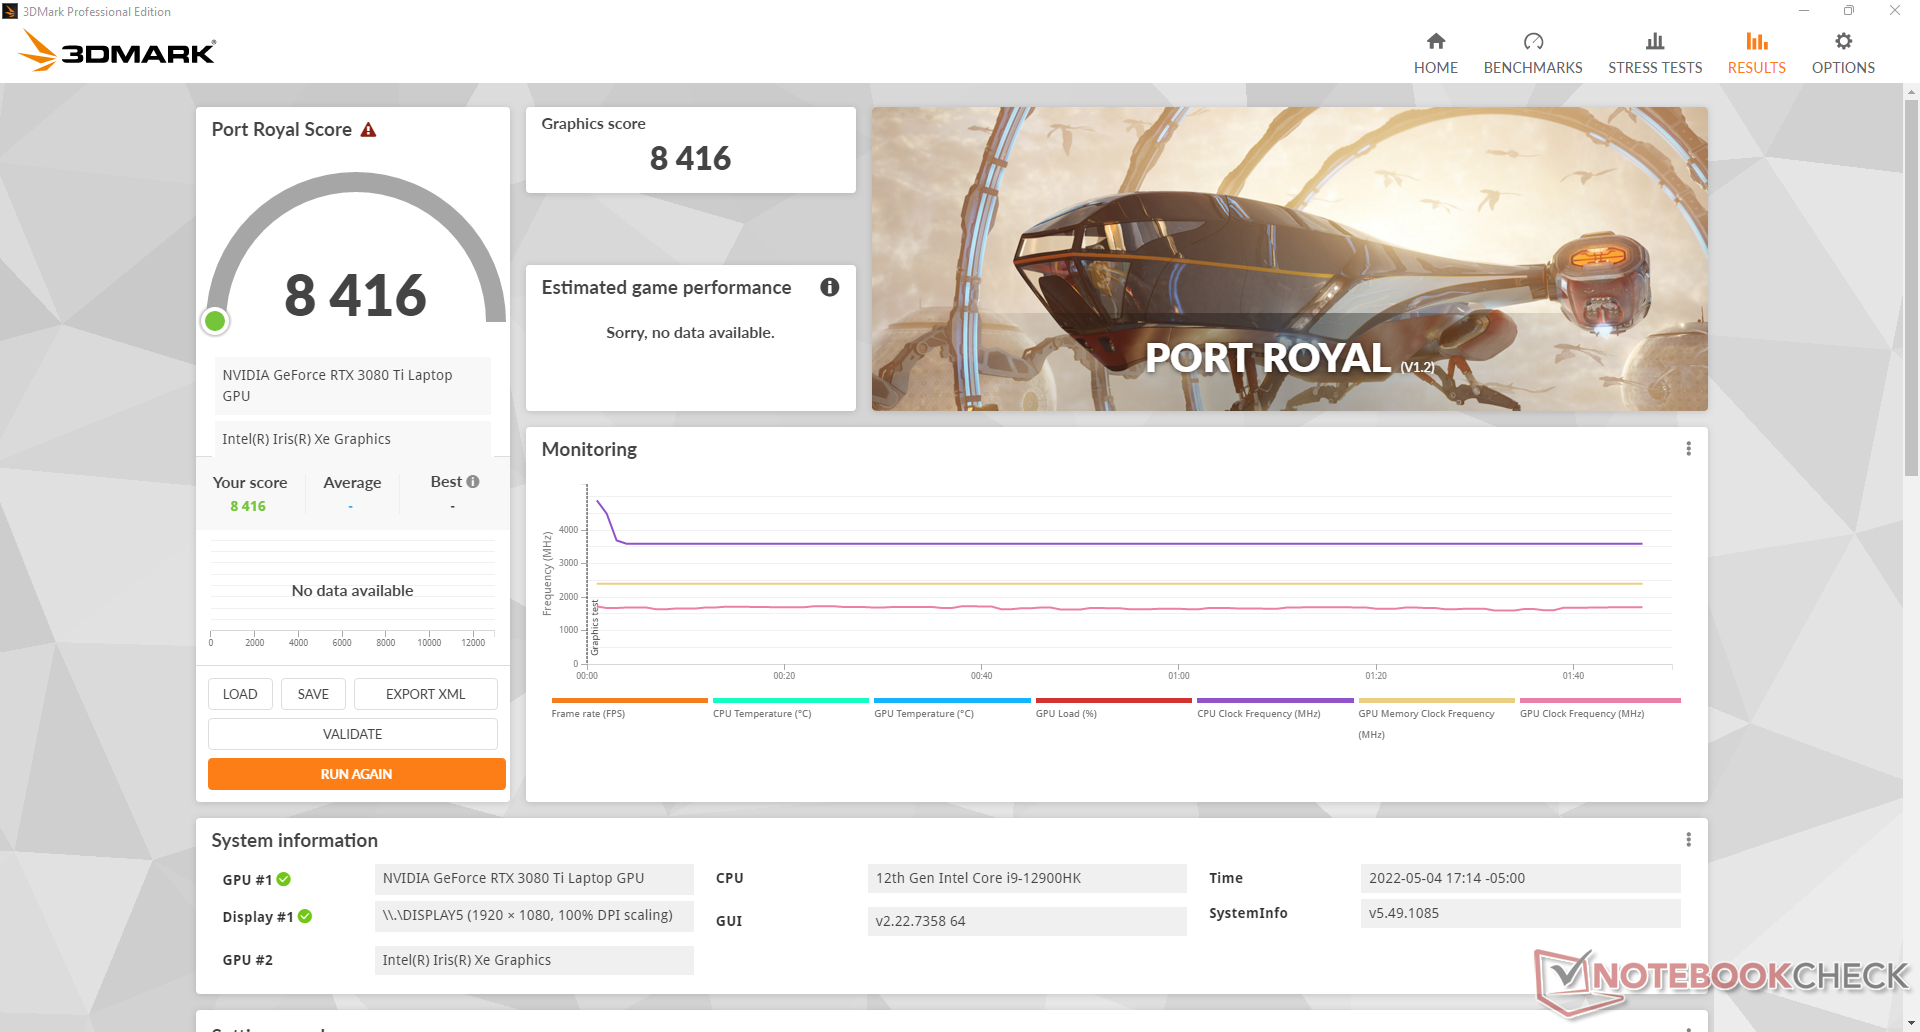
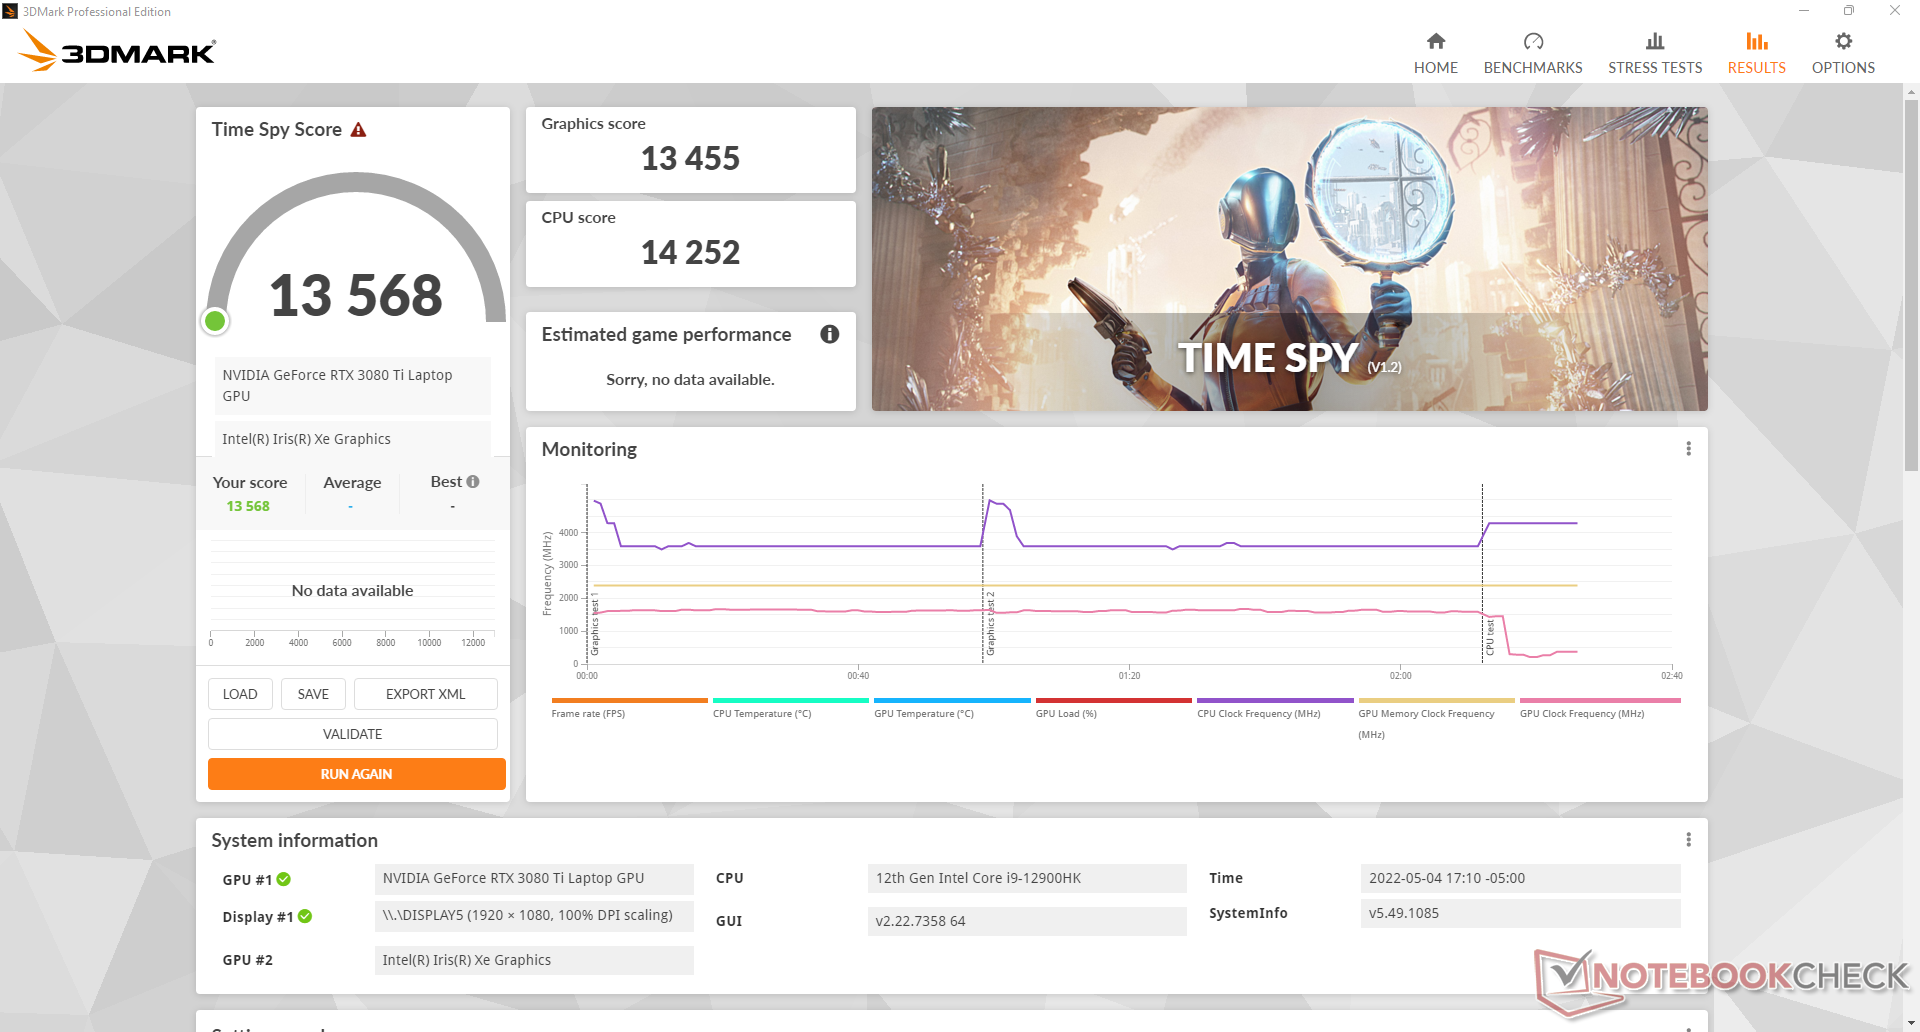
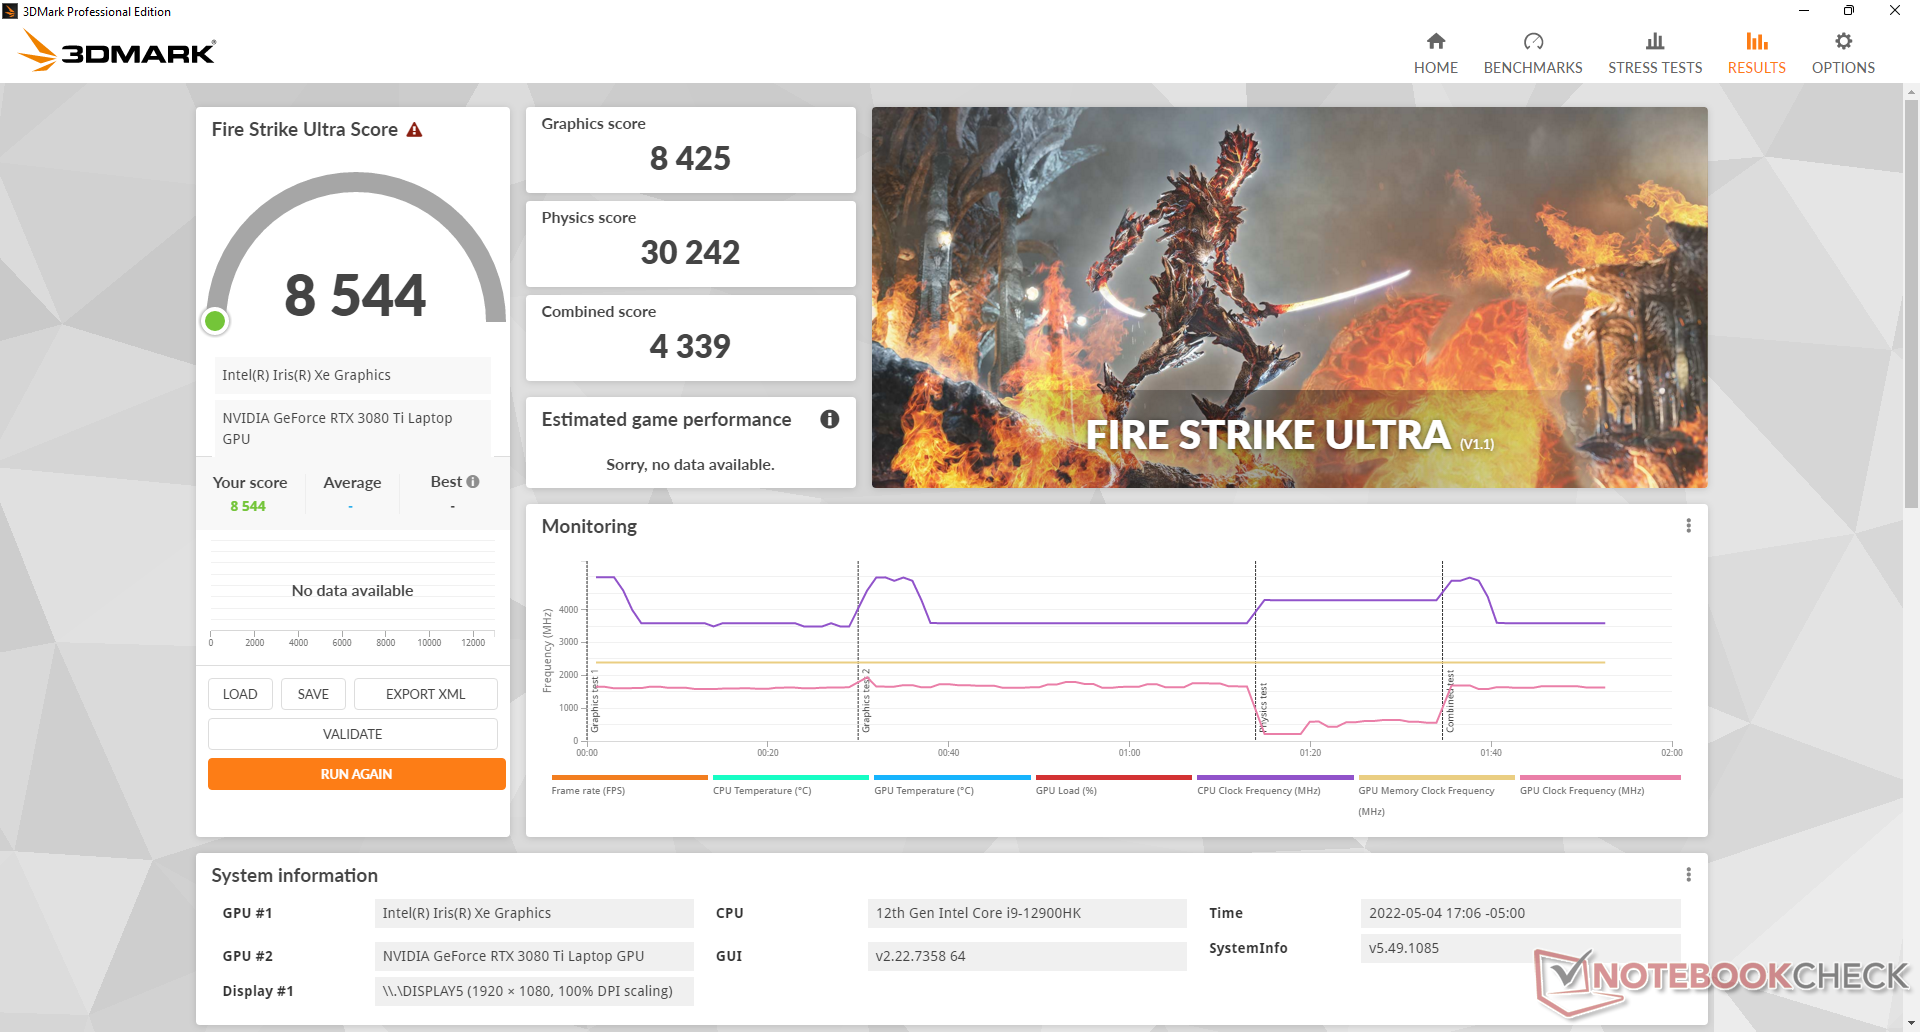
| 3DMark 11 Performance | 36680 puntos | |
| 3DMark Cloud Gate Standard Score | 63911 puntos | |
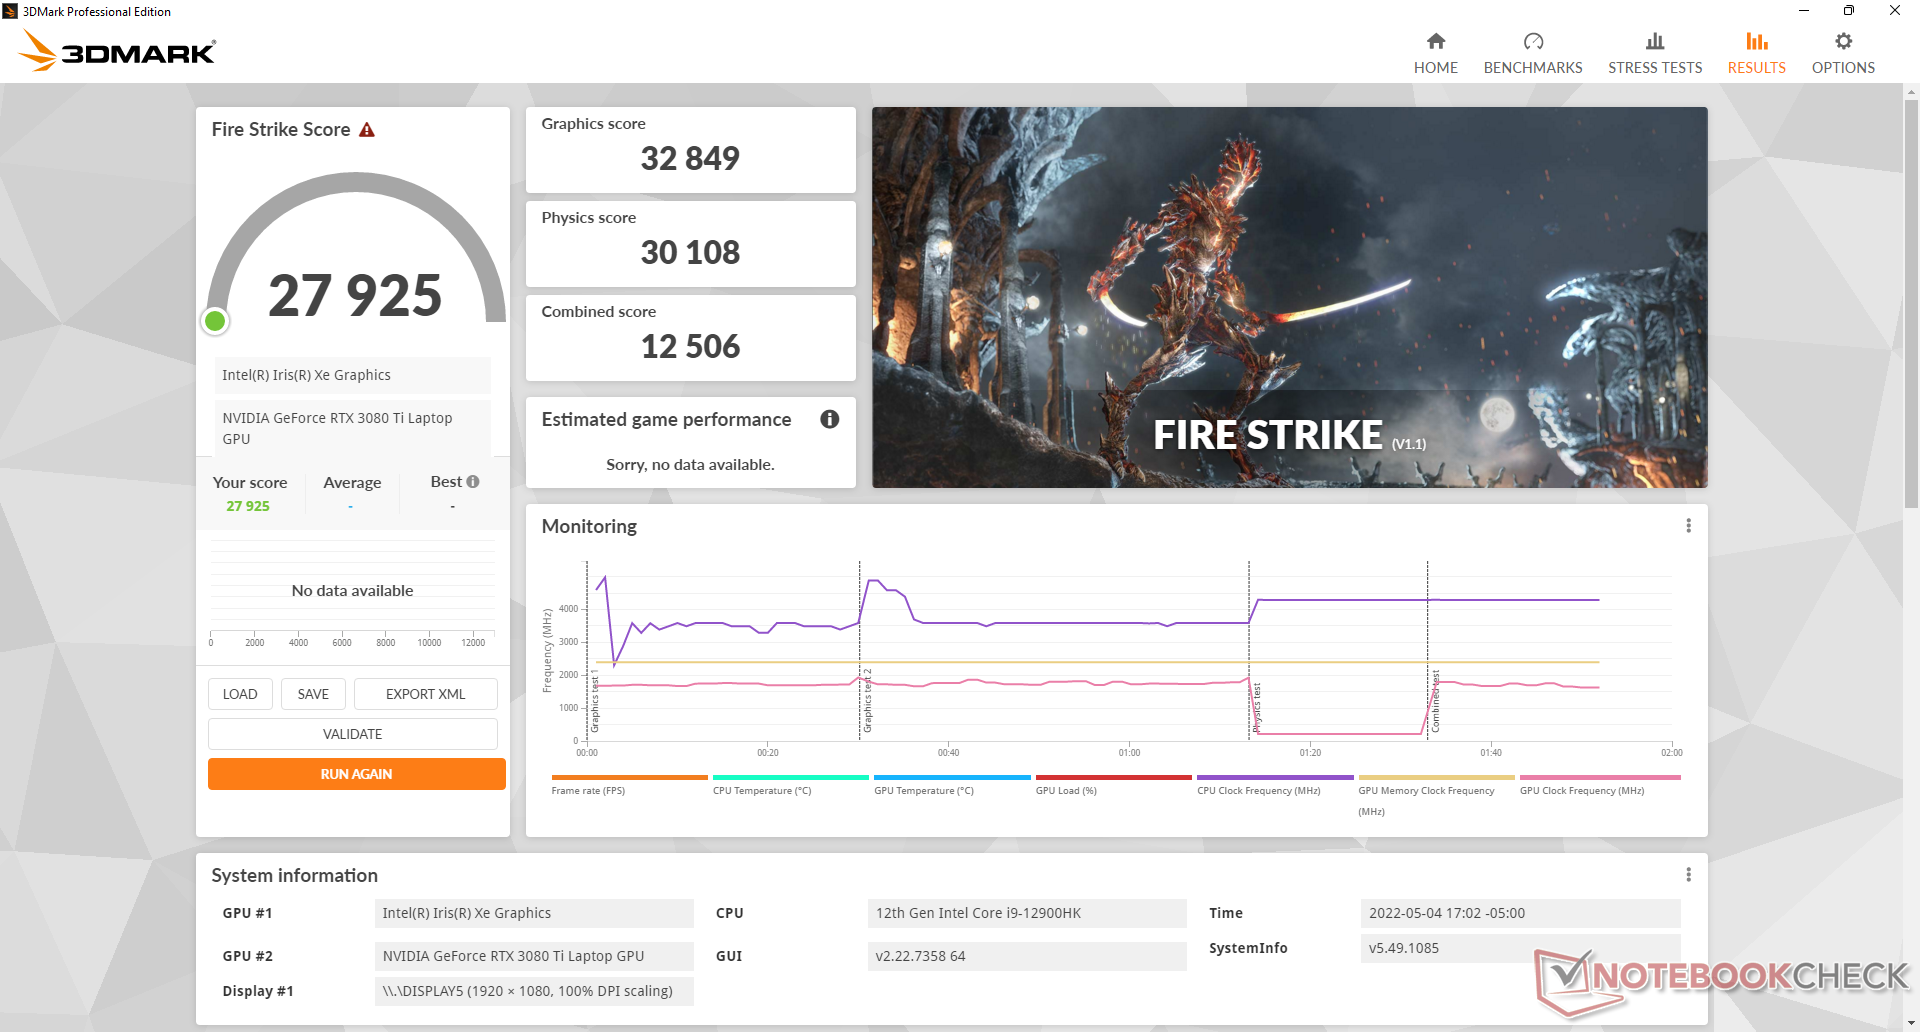
| 3DMark Fire Strike Score | 27925 puntos | |
| 3DMark Time Spy Score | 13568 puntos | |
ayuda | ||
Witcher 3 FPS Chart
| bajo | medio | alto | ultra | |
|---|---|---|---|---|
| GTA V (2015) | 187 | 185.1 | 180.8 | 126.3 |
| The Witcher 3 (2015) | 500.9 | 388.5 | 267.7 | 128 |
| Dota 2 Reborn (2015) | 186.1 | 172.3 | 166.6 | 158.9 |
| Final Fantasy XV Benchmark (2018) | 215 | 167.8 | 127.8 | |
| X-Plane 11.11 (2018) | 161 | 143.9 | 112.9 | |
| Strange Brigade (2018) | 474 | 300 | 243 | 213 |
| Cyberpunk 2077 1.6 (2022) | 167.7 | 142 | 116.2 | 115.7 |
Emisiones
Ruido del sistema
El ruido del ventilador depende de la configuración del Centro de Comando de Alienware. Los ventiladores del Alienware tienden a pulsar con frecuencia cuando están en modo equilibrado o superior, por lo que se recomienda el modo silencioso cuando se navega, se envía correo electrónico o se hace streaming. Nuestra unidad rara vez superaba los 32 dB(A) cuando se ejecutaban cargas tan poco exigentes como para ser perceptible pero no molesto.
Cuando se juega en modo equilibrado, el ruido del ventilador se estabiliza en torno a los 43,3 dB(A) frente a los 52,5 dB(A) del modo de ventilador máximo. Los usuarios pueden querer jugar en modo equilibrado por el ruido del ventilador significativamente más silencioso a pesar del mencionado déficit de rendimiento que conlleva.
Ruido
| Ocioso |
| 23.1 / 23.1 / 23.1 dB(A) |
| Carga |
| 31.9 / 52.5 dB(A) |
 | ||
30 dB silencioso 40 dB(A) audible 50 dB(A) ruidosamente alto |
||
min: | ||
| Alienware x17 R2 P48E GeForce RTX 3080 Ti Laptop GPU, i9-12900HK, 2x Samsung PM9A1 1TB (RAID 0) | Alienware x17 RTX 3080 P48E GeForce RTX 3080 Laptop GPU, i7-11800H, 2x WDC PC SN730 SDBPNTY-1T00 (RAID 0) | Asus ROG Zephyrus S17 GX703HSD GeForce RTX 3080 Laptop GPU, i9-11900H, Samsung PM9A1 MZVL22T0HBLB | MSI Stealth GS77 12UHS-083US GeForce RTX 3080 Ti Laptop GPU, i7-12700H, Micron 3400 1TB MTFDKBA1T0TFH | MSI GT76 Titan DT 10SGS GeForce RTX 2080 Super Mobile, i9-10900K, 2x WDC PC SN730 SDBPNTY-1T00 (RAID 0) | Gigabyte A7 X1 GeForce RTX 3070 Laptop GPU, R9 5900HX, ESR512GTLCG-EAC-4 | |
|---|---|---|---|---|---|---|
| Noise | -7% | -2% | -8% | -18% | -28% | |
| apagado / medio ambiente * (dB) | 22.7 | 24.9 -10% | 23 -1% | 24.5 -8% | 26.4 -16% | 24 -6% |
| Idle Minimum * (dB) | 23.1 | 24.9 -8% | 23 -0% | 24.5 -6% | 27.5 -19% | 25 -8% |
| Idle Average * (dB) | 23.1 | 24.9 -8% | 23 -0% | 24.5 -6% | 27.5 -19% | 29 -26% |
| Idle Maximum * (dB) | 23.1 | 29.6 -28% | 23 -0% | 30.8 -33% | 29.8 -29% | 35 -52% |
| Load Average * (dB) | 31.9 | 31.1 3% | 41 -29% | 34.6 -8% | 30.9 3% | 58 -82% |
| Witcher 3 ultra * (dB) | 52.5 | 49.7 5% | 45 14% | 46.2 12% | 60.7 -16% | 57 -9% |
| Load Maximum * (dB) | 52.5 | 54.8 -4% | 52 1% | 56.8 -8% | 66.6 -27% | 59 -12% |
* ... más pequeño es mejor
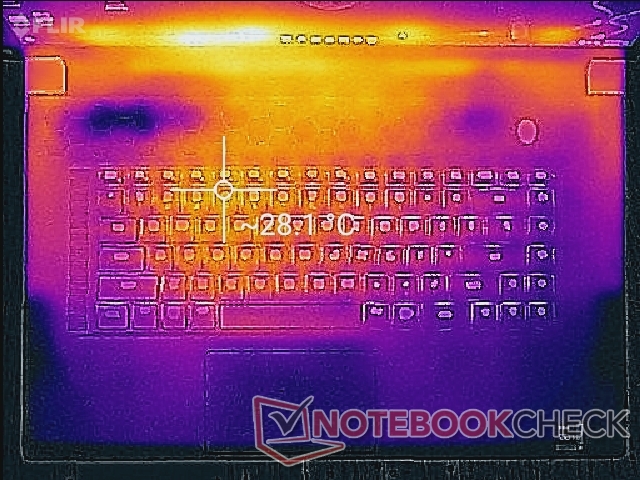
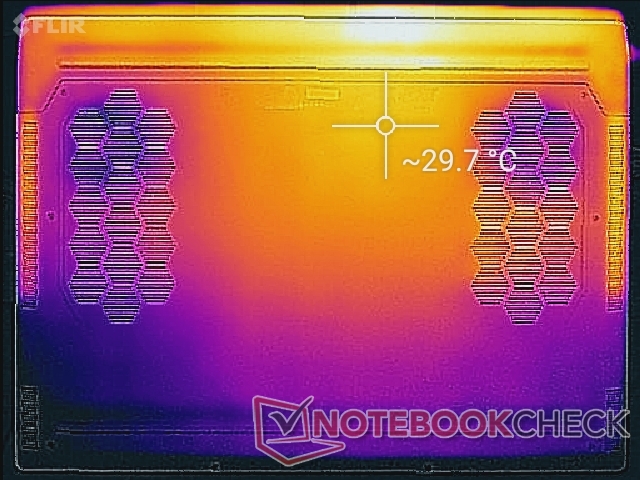
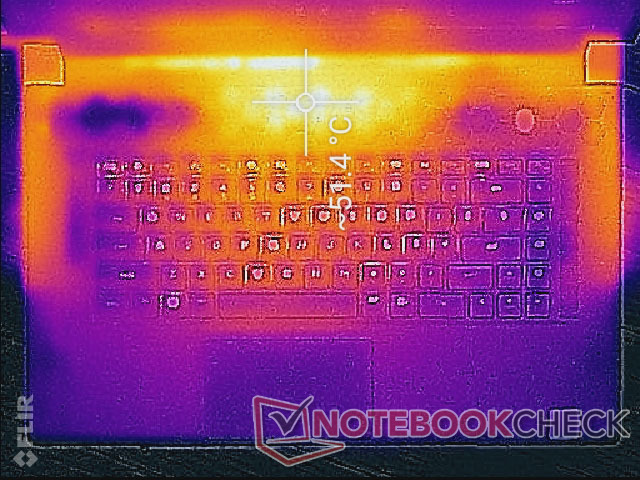
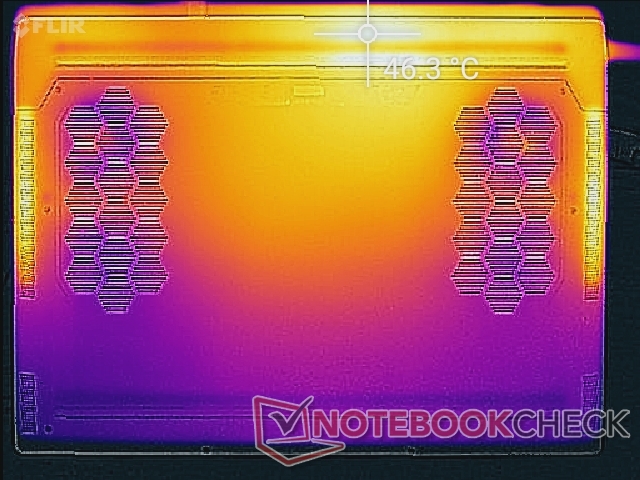
Temperatura
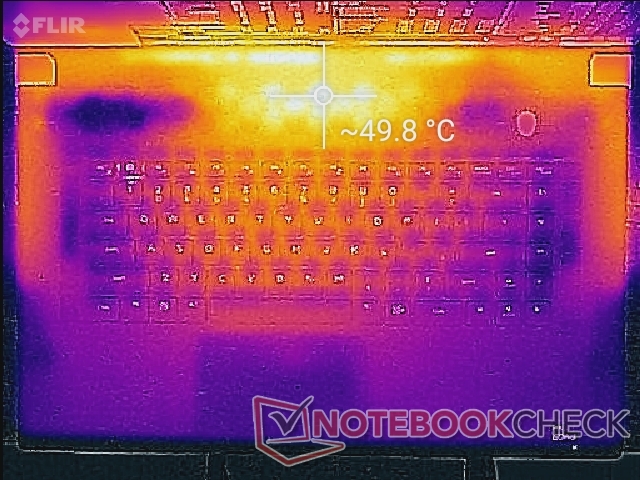
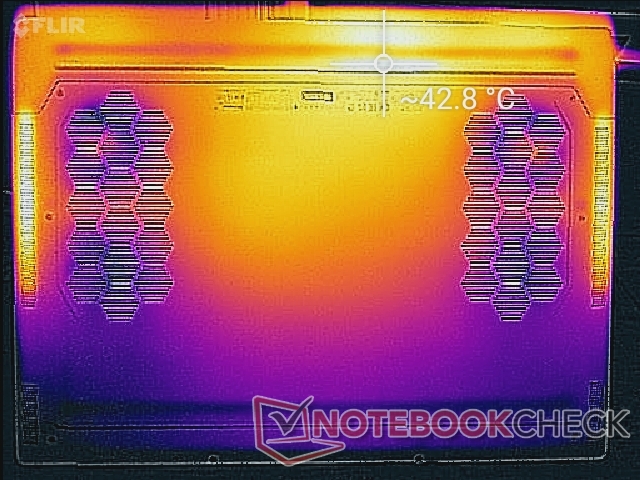
Las temperaturas de la superficie son, en general, más frescas de lo que esperábamos dados los extremos niveles de rendimiento a los que apunta Dell con un diseño tan delgado. Los puntos calientes pueden alcanzar más de 45 C o 50 C cuando se ejecutan cargas altas, pero estas áreas están hacia la parte trasera del chasis y lejos de las teclas del teclado y los reposamanos. El sistema se calienta, pero nunca de forma incómoda cuando se juega.
Hay que tener en cuenta que hay muchas rejillas de ventilación en casi todos los lados del sistema. Con las temperaturas de la CPU que llegan a ser tan altas cuando están bajo carga, será importante no bloquear ninguna abertura siempre que sea posible.
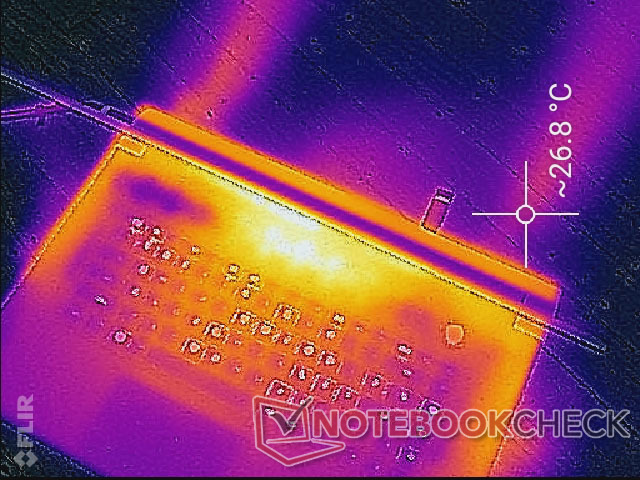
(-) La temperatura máxima en la parte superior es de 49.6 °C / 121 F, frente a la media de 40.4 °C / 105 F, que oscila entre 21.2 y 68.8 °C para la clase Gaming.
(±) El fondo se calienta hasta un máximo de 42.4 °C / 108 F, frente a la media de 43.2 °C / 110 F
(+) En reposo, la temperatura media de la parte superior es de 26.1 °C / 79# F, frente a la media del dispositivo de 33.9 °C / 93 F.
(±) Jugando a The Witcher 3, la temperatura media de la parte superior es de 34.7 °C / 94 F, frente a la media del dispositivo de 33.9 °C / 93 F.
(+) El reposamanos y el panel táctil están a una temperatura inferior a la de la piel, con un máximo de 29.2 °C / 84.6 F y, por tanto, son fríos al tacto.
(±) La temperatura media de la zona del reposamanos de dispositivos similares fue de 28.8 °C / 83.8 F (-0.4 °C / -0.8 F).
| Alienware x17 R2 P48E Intel Core i9-12900HK, NVIDIA GeForce RTX 3080 Ti Laptop GPU | Alienware x17 RTX 3080 P48E Intel Core i7-11800H, NVIDIA GeForce RTX 3080 Laptop GPU | Asus ROG Zephyrus S17 GX703HSD Intel Core i9-11900H, NVIDIA GeForce RTX 3080 Laptop GPU | MSI Stealth GS77 12UHS-083US Intel Core i7-12700H, NVIDIA GeForce RTX 3080 Ti Laptop GPU | MSI GT76 Titan DT 10SGS Intel Core i9-10900K, NVIDIA GeForce RTX 2080 Super Mobile | Gigabyte A7 X1 AMD Ryzen 9 5900HX, NVIDIA GeForce RTX 3070 Laptop GPU | |
|---|---|---|---|---|---|---|
| Heat | -14% | -18% | -16% | 7% | 2% | |
| Maximum Upper Side * (°C) | 49.6 | 58.4 -18% | 59 -19% | 50.6 -2% | 36.4 27% | 44 11% |
| Maximum Bottom * (°C) | 42.4 | 49 -16% | 53 -25% | 59.6 -41% | 43 -1% | 49 -16% |
| Idle Upper Side * (°C) | 29.2 | 33.6 -15% | 35 -20% | 30 -3% | 28 4% | 27 8% |
| Idle Bottom * (°C) | 32 | 34.6 -8% | 35 -9% | 37.4 -17% | 33.4 -4% | 30 6% |
* ... más pequeño es mejor
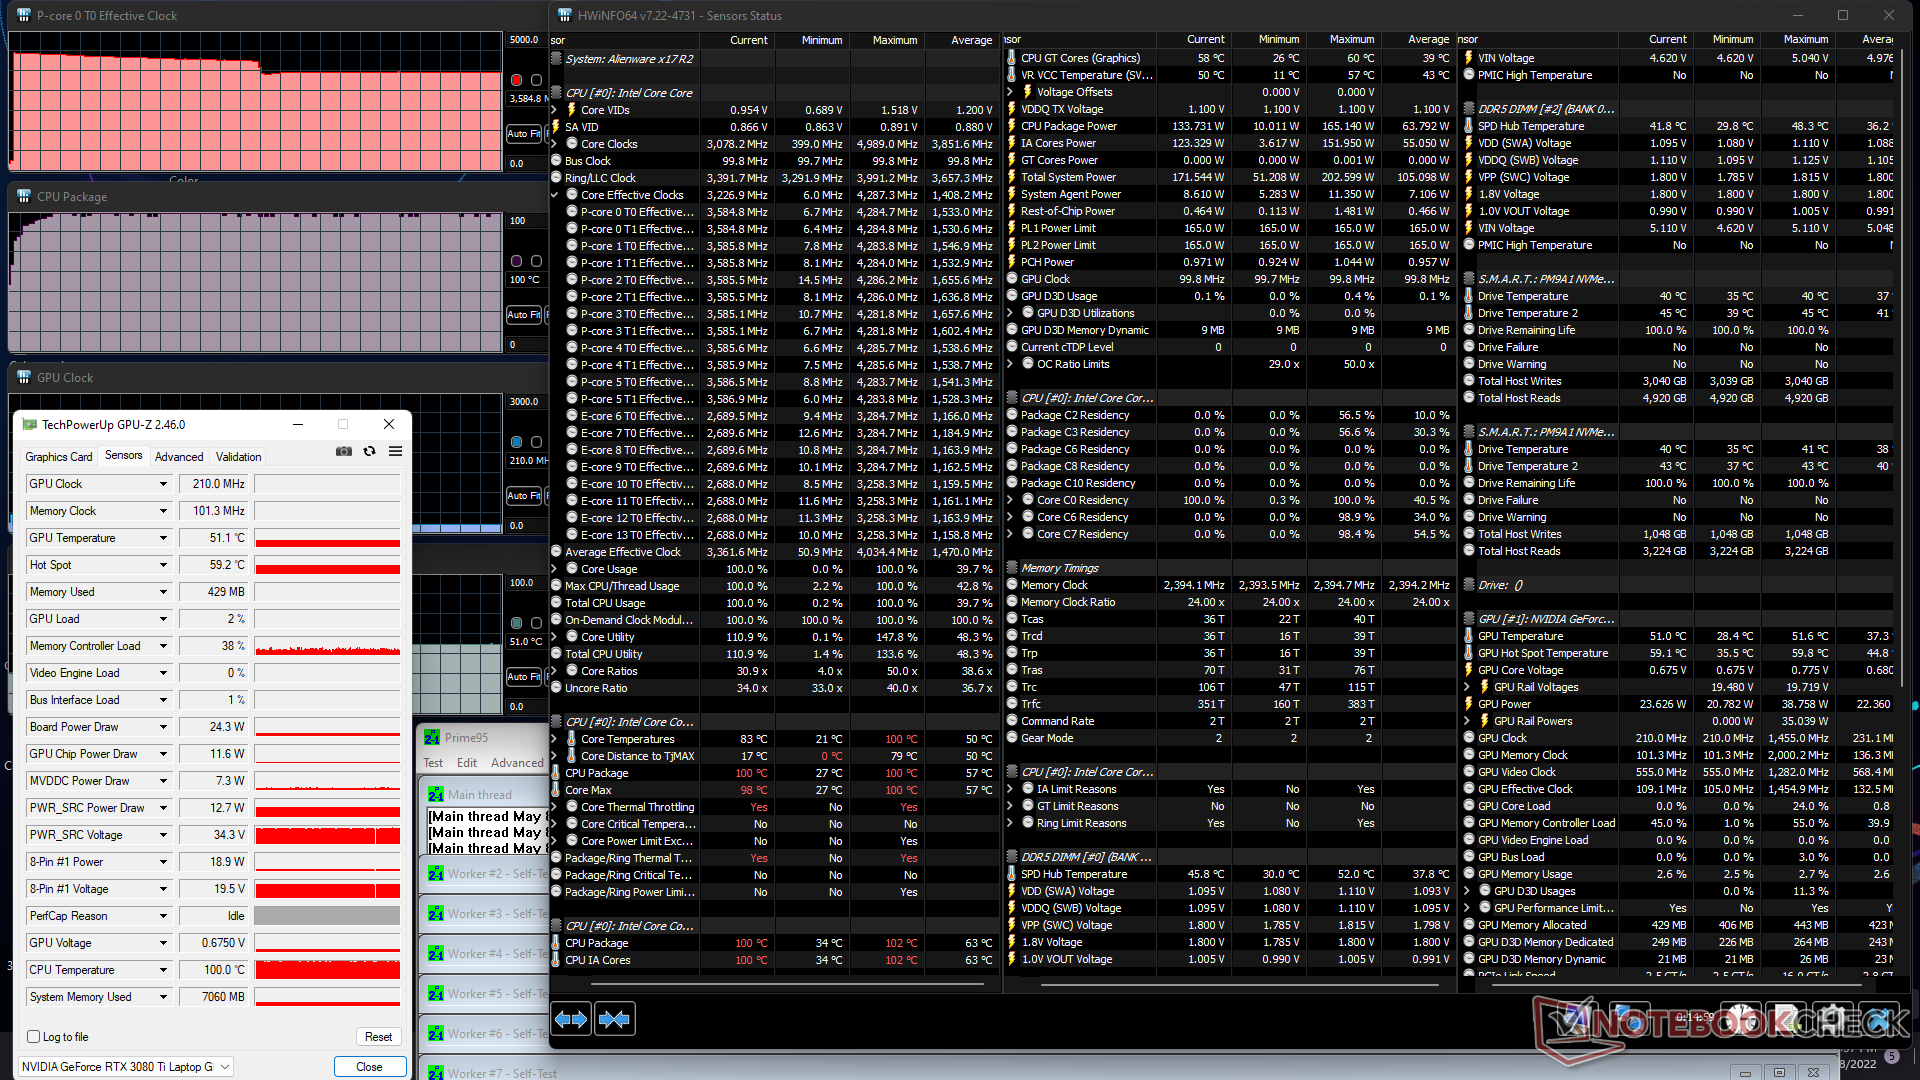
Prueba de esfuerzo
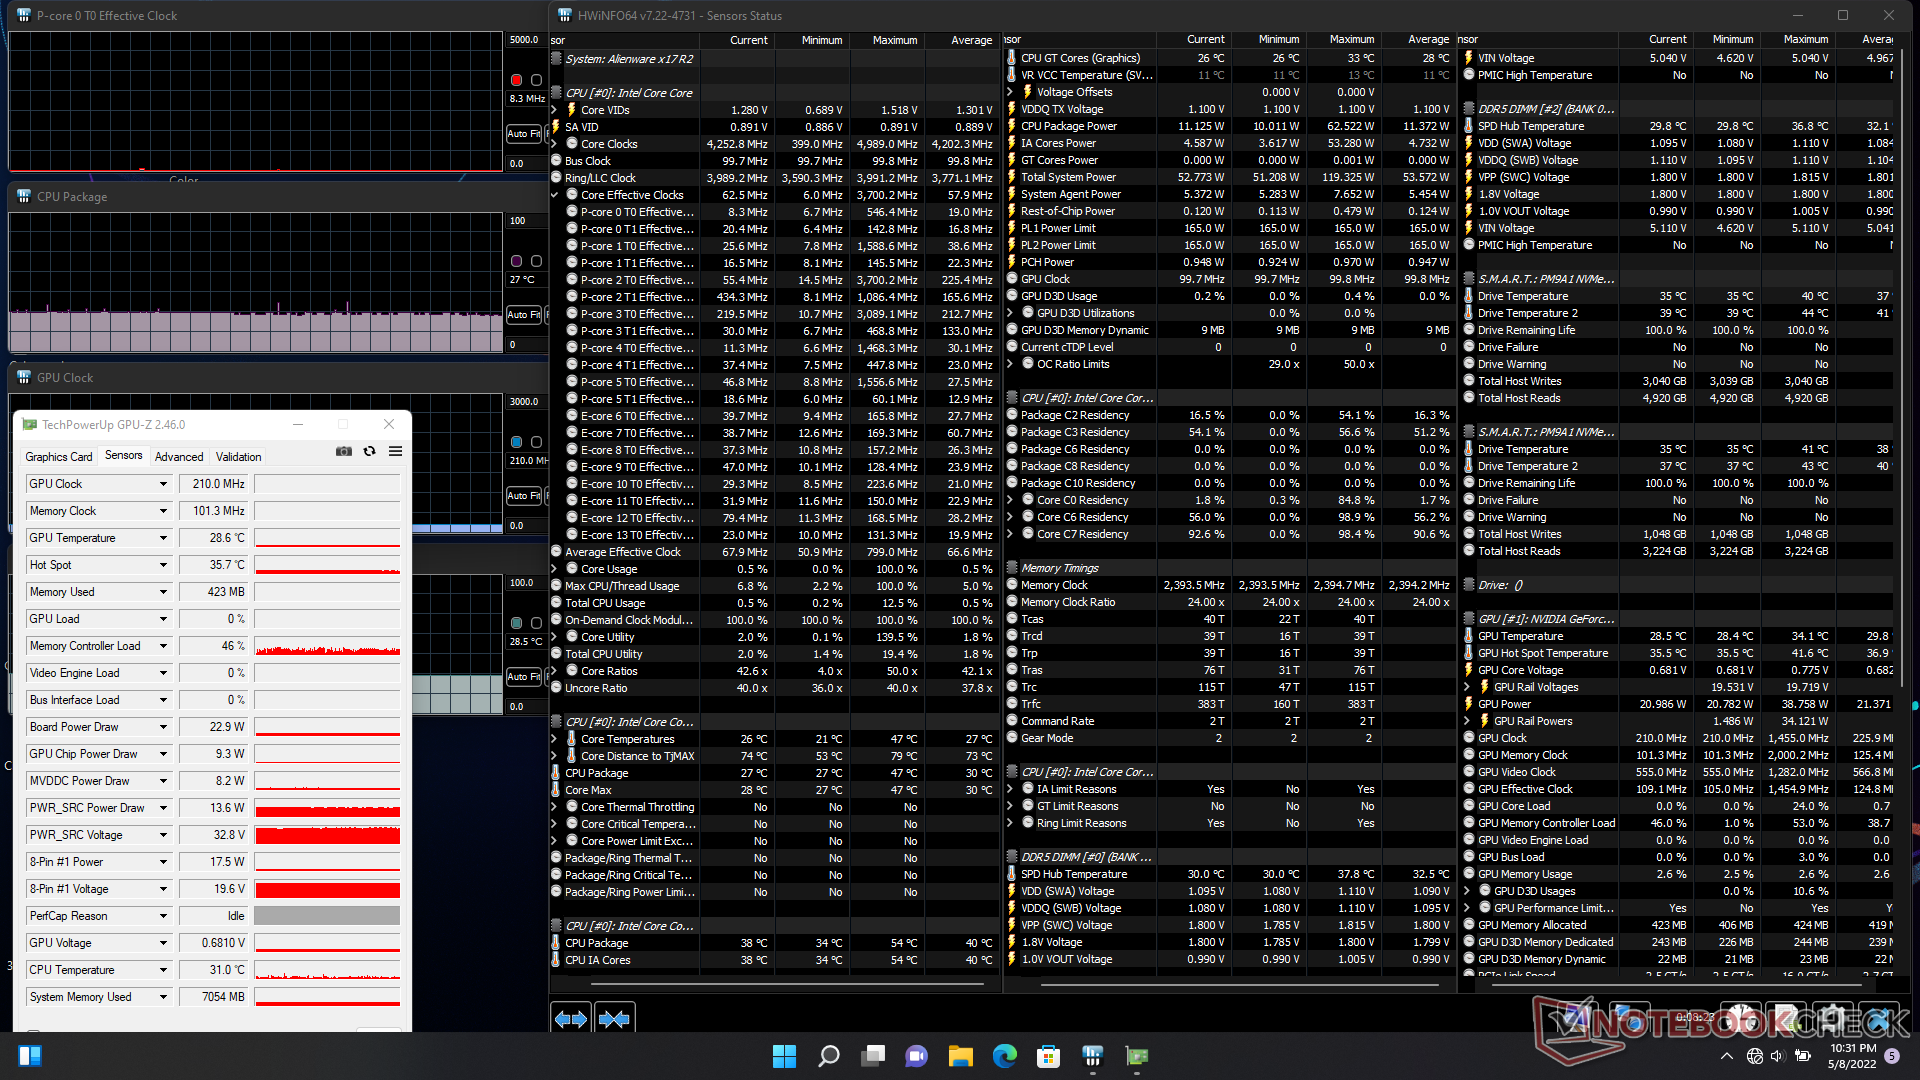
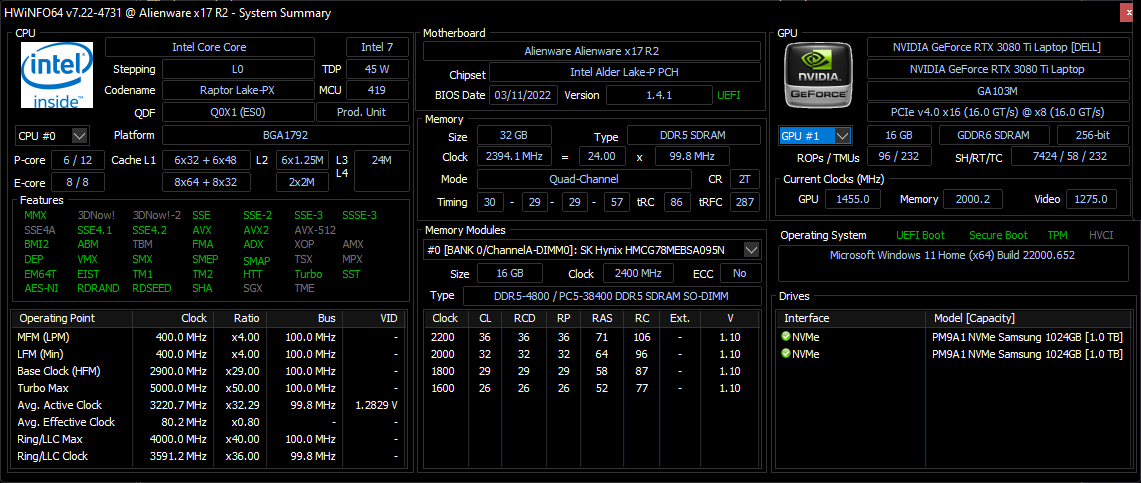
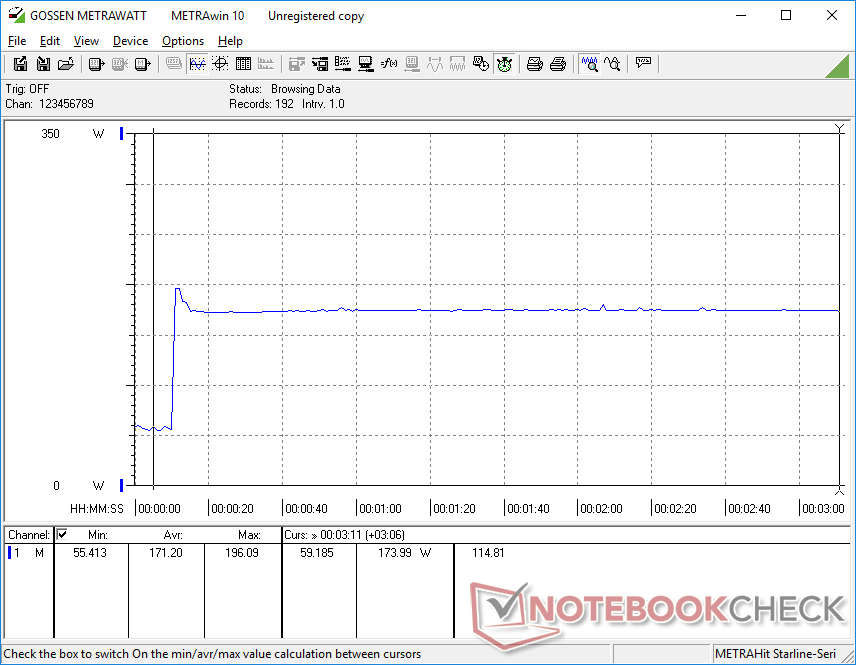
Cuando se ejecuta Prime95, las velocidades de reloj de la CPU aumentan a 4,3 GHz durante un par de segundos antes de alcanzar una temperatura del núcleo de 100 C. Las velocidades de reloj se estabilizan finalmente en 3,6 GHz mientras se mantiene una temperatura del núcleo justo por debajo de 100 C. Mientras tanto, el consumo de energía del paquete de la CPU llega a 165 W durante el inicio de la prueba antes de estabilizarse en 134 W debido a las limitaciones térmicas. Está claro que la CPU funciona tan rápido y como puede dados los límites de la solución de refrigeración de Alienware. En comparación, el Core i7-12700H del MSI GS77 se estabilizaría en un rango más lento de 2,7 a 3 GHz en condiciones similares.
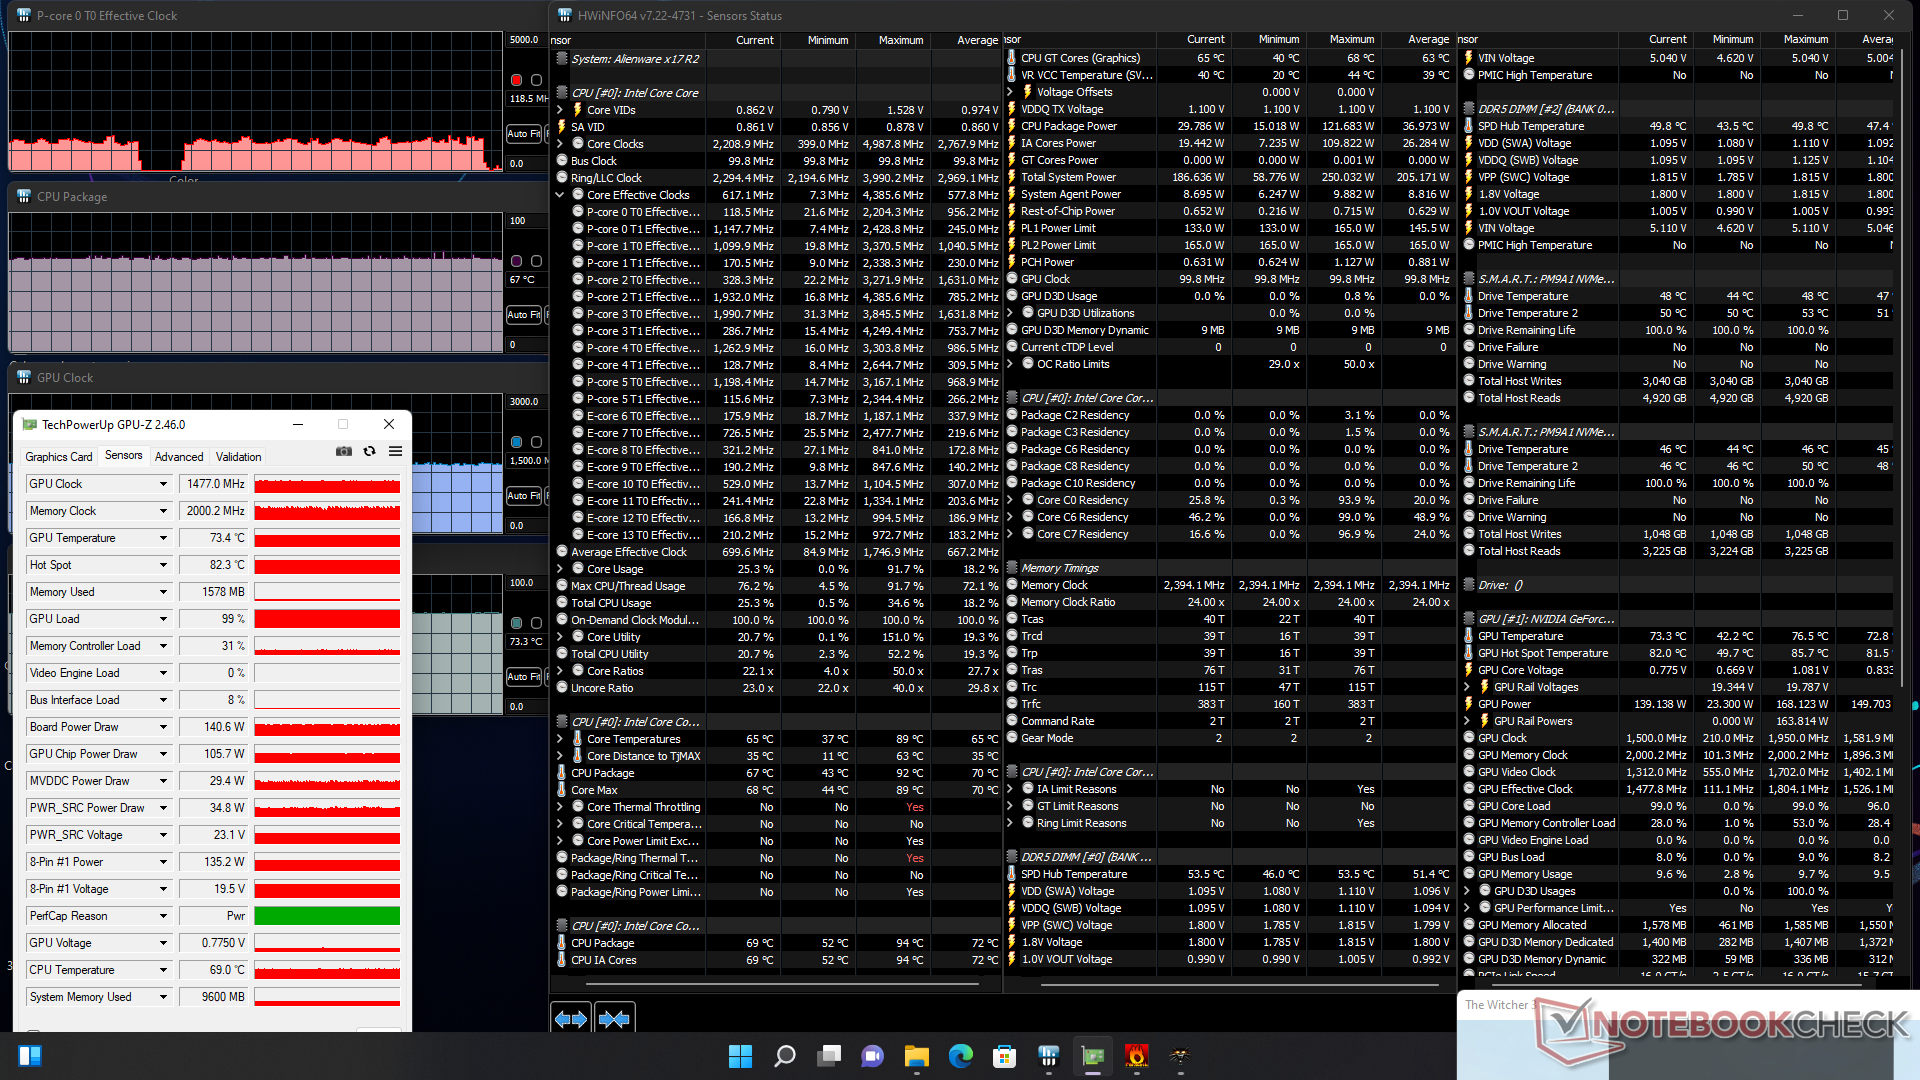
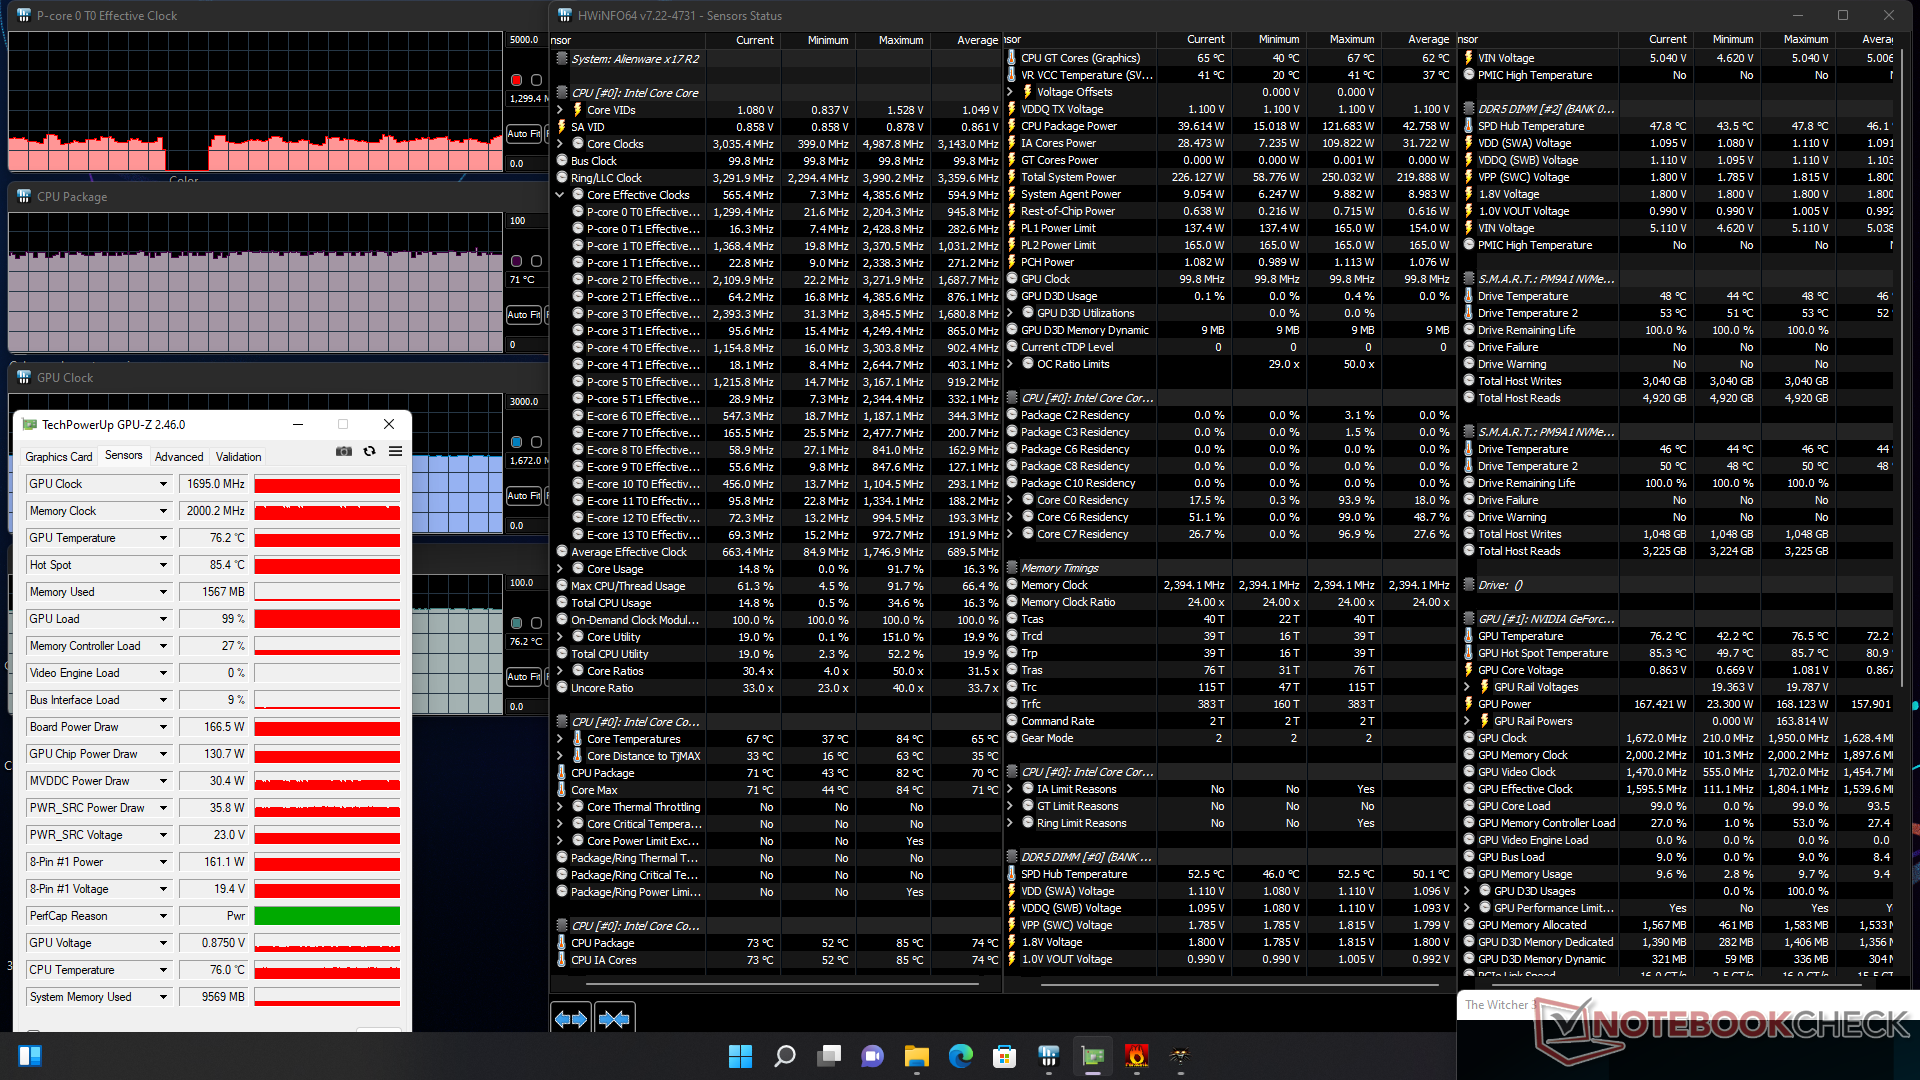
La velocidad de reloj de la GPU, el reloj de la memoria y el consumo de energía de la placa se estabilizarían en 1695 MHz, 2000 MHz y 167 W, respectivamente, al funcionar Witcher 3 en el modo de ventilador máximo. Si se utiliza el modo equilibrado, el reloj de la GPU y el consumo de energía de la placa se reducen a 1477 MHz y 141 W, respectivamente. Por tanto, los usuarios deben soportar el modo de máximo ruido del ventilador si quieren aprovechar todo el potencial de rendimiento del x17 R2. Si se ejecuta esta misma prueba en el MSI GS77, la velocidad de reloj de la GPU y el reloj de la memoria serían más lentos: 1432 MHz y 1750 MHz, respectivamente.
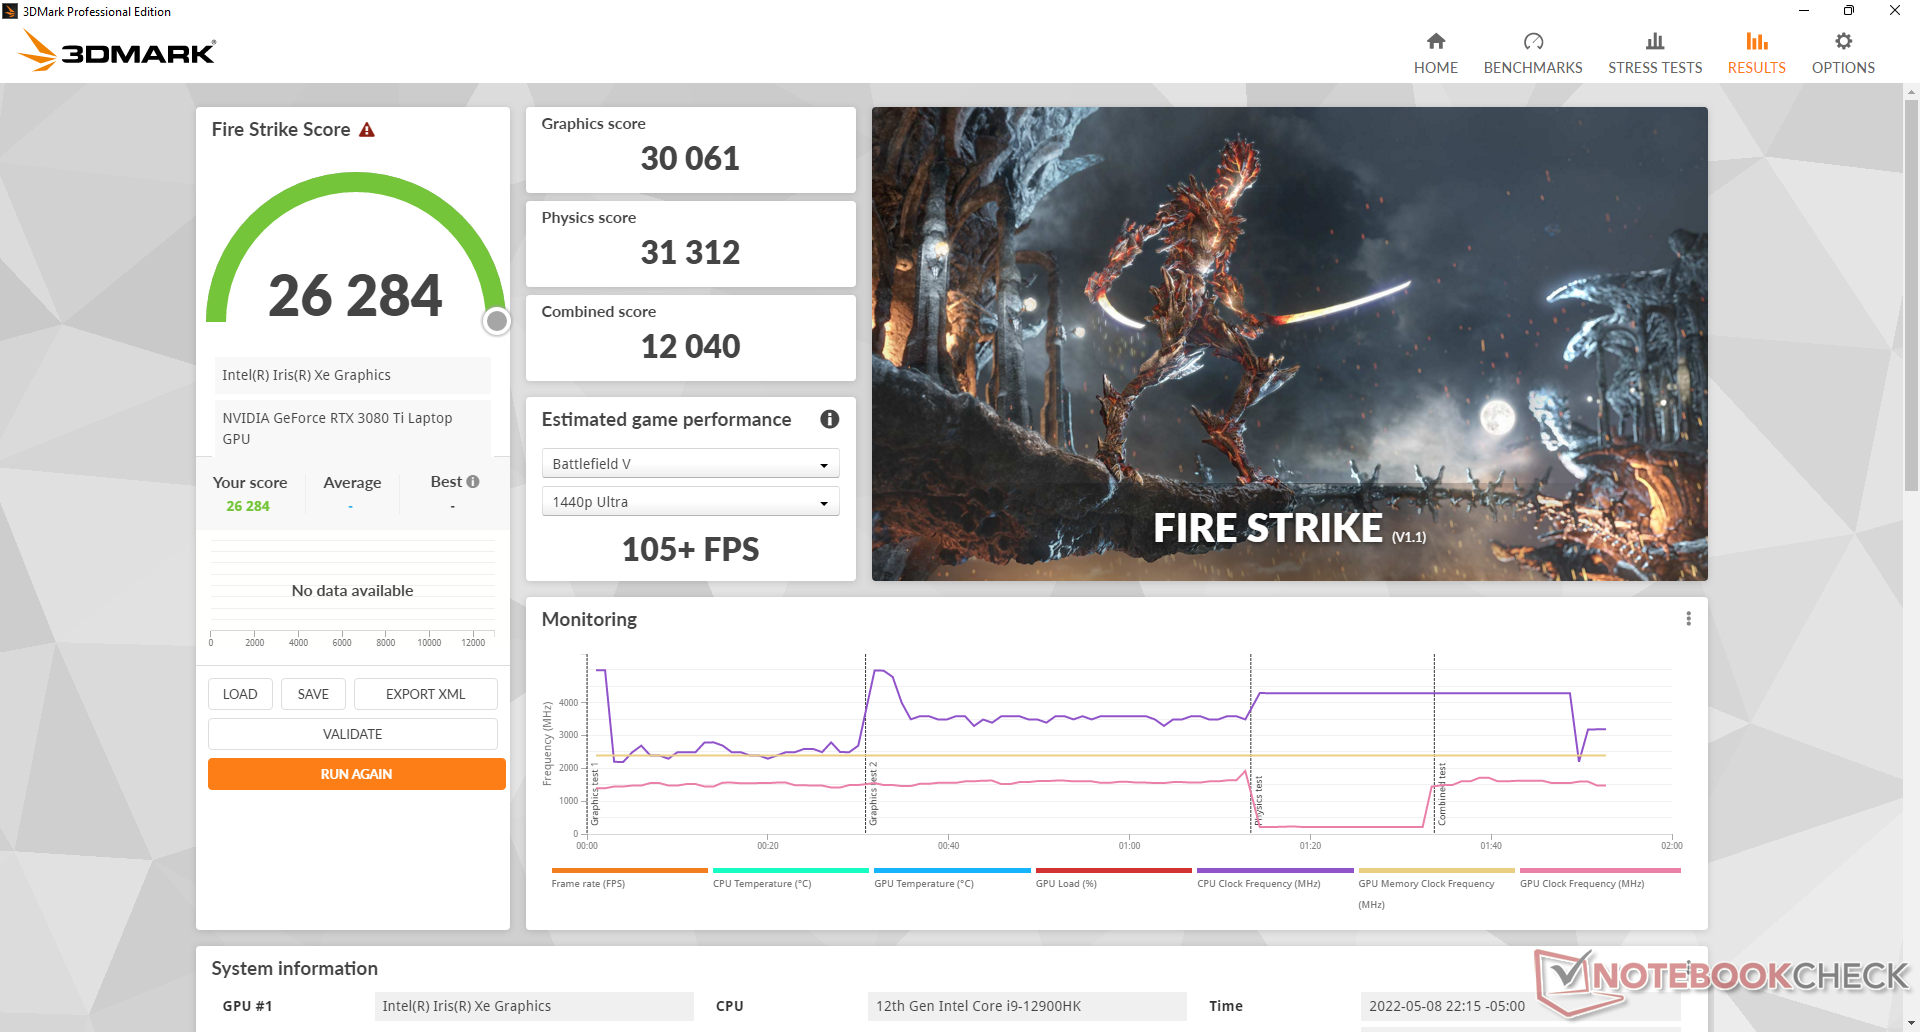
Funcionar con batería limitará el rendimiento de forma significativa. Una prueba de Fire Strike en baterías devolvería puntuaciones de Física y Gráficos de 27369 y 12095 puntos, respectivamente, comparado con 30108 y 32849 puntos cuando está conectado a la red.
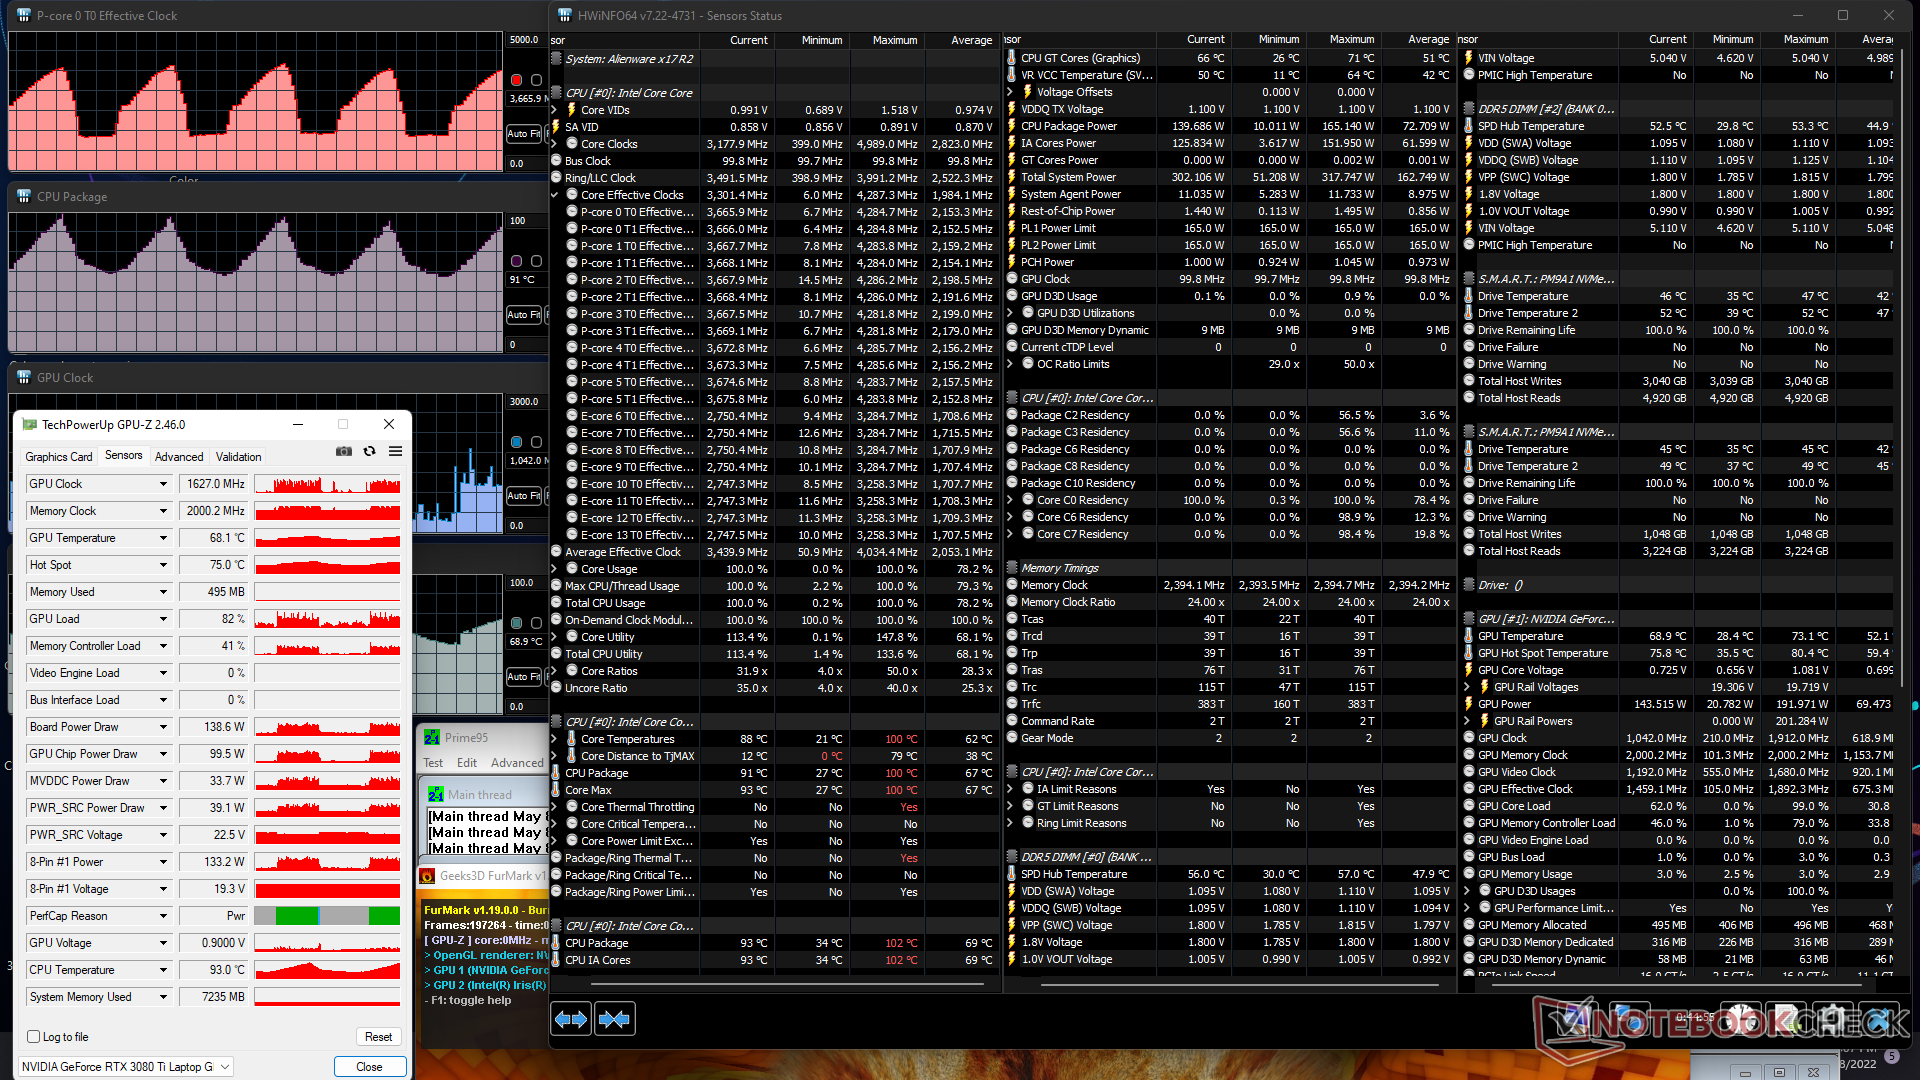
| Reloj dela CPU (GHz) | Reloj de la GPU (MHz) | Temperatura media dela CPU (°C) | Temperatura media de la GPU (°C) | |
| Sistema en reposo (modo de ventilador máximo) | -- | -- | 27 | 29 |
| Estrés de Prime95 (modo de ventilador máximo) | 3,6 | -- | -- | 100 |
| Estrés de Prime95+ FurMark(modo de ventilador máximo) | 1,4 - 3,7 | 337 - 1770 | 53 - 100 | 49 - 71 |
| Witcher 3 Estrés (modoequilibrado) | ~0,6 | 1477 | 67 | 73 |
| Witcher 3 Tensión (modo deventilador máximo) | ~1,3 | 1695 | 71 | 76 |
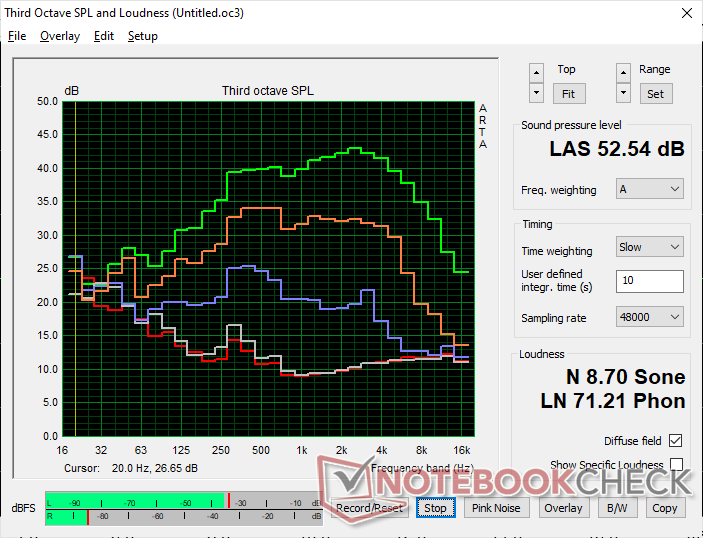
Altavoces
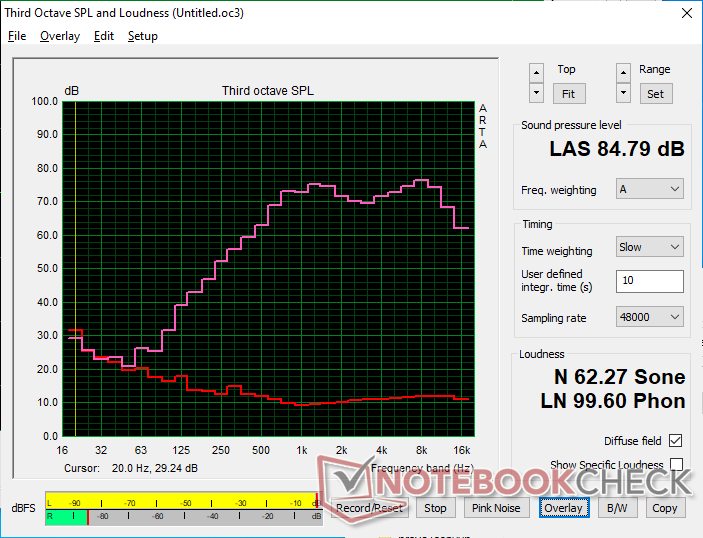
Alienware x17 R2 P48E análisis de audio
(+) | los altavoces pueden reproducir a un volumen relativamente alto (#84.3 dB)
Graves 100 - 315 Hz
(±) | lubina reducida - en promedio 9.7% inferior a la mediana
(+) | el bajo es lineal (5.5% delta a la frecuencia anterior)
Medios 400 - 2000 Hz
(+) | medios equilibrados - a sólo 1.6% de la mediana
(+) | los medios son lineales (3% delta a la frecuencia anterior)
Altos 2 - 16 kHz
(±) | máximos más altos - de media 5% más altos que la mediana
(±) | la linealidad de los máximos es media (7.6% delta a frecuencia anterior)
Total 100 - 16.000 Hz
(+) | el sonido global es lineal (9.3% de diferencia con la mediana)
En comparación con la misma clase
» 3% de todos los dispositivos probados de esta clase eran mejores, 2% similares, 95% peores
» El mejor tuvo un delta de 6%, la media fue 18%, el peor fue ###max##%
En comparación con todos los dispositivos probados
» 3% de todos los dispositivos probados eran mejores, 1% similares, 96% peores
» El mejor tuvo un delta de 4%, la media fue 23%, el peor fue ###max##%
Apple MacBook Pro 16 2021 M1 Pro análisis de audio
(+) | los altavoces pueden reproducir a un volumen relativamente alto (#84.7 dB)
Graves 100 - 315 Hz
(+) | buen bajo - sólo 3.8% lejos de la mediana
(+) | el bajo es lineal (5.2% delta a la frecuencia anterior)
Medios 400 - 2000 Hz
(+) | medios equilibrados - a sólo 1.3% de la mediana
(+) | los medios son lineales (2.1% delta a la frecuencia anterior)
Altos 2 - 16 kHz
(+) | máximos equilibrados - a sólo 1.9% de la mediana
(+) | los máximos son lineales (2.7% delta a la frecuencia anterior)
Total 100 - 16.000 Hz
(+) | el sonido global es lineal (4.6% de diferencia con la mediana)
En comparación con la misma clase
» 0% de todos los dispositivos probados de esta clase eran mejores, 0% similares, 100% peores
» El mejor tuvo un delta de 5%, la media fue 17%, el peor fue ###max##%
En comparación con todos los dispositivos probados
» 0% de todos los dispositivos probados eran mejores, 0% similares, 100% peores
» El mejor tuvo un delta de 4%, la media fue 23%, el peor fue ###max##%
Gestión de la energía
Consumo de energía
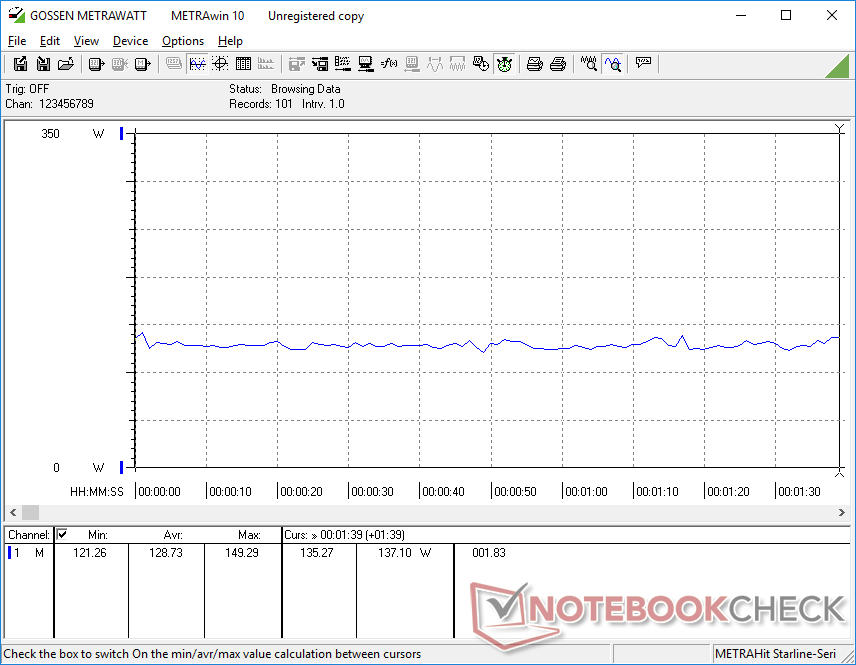
Los portátiles Alienware siempre han consumido más energía que las alternativas de la competencia y el x17 R2 no es diferente. El simple hecho de estar en reposo en el escritorio puede demandar hasta 60 W cuando se ajusta al modo de Alto Rendimiento, que es más que la mayoría de los Ultrabooks de la serie U cuando están bajo carga. El altísimo consumo es probablemente responsable de la escasa duración de la batería registrada en la siguiente sección.
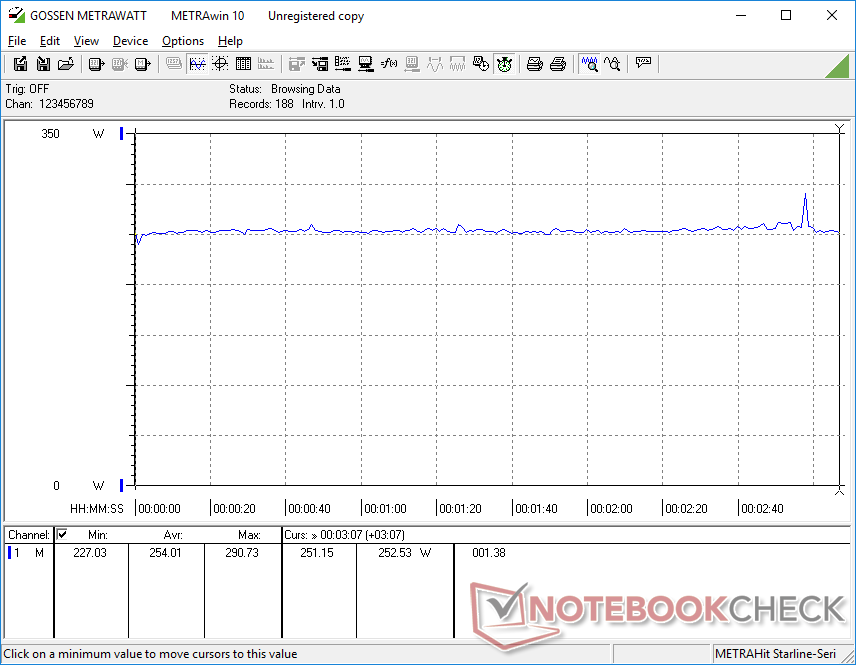
Ejecutando Witcher 3 consume un 54% más de energía que en el MSI GS77 aunque ambos estén equipados con CPUs Core-H de 12ª generación y la misma GPU GeForce RTX 3080 Ti. A cambio, el sistema Alienware es capaz de ofrecer hasta un 15 por ciento y un 25 por ciento más de rendimiento de la CPU y de los gráficos, respectivamente, que el MSI de la competencia.
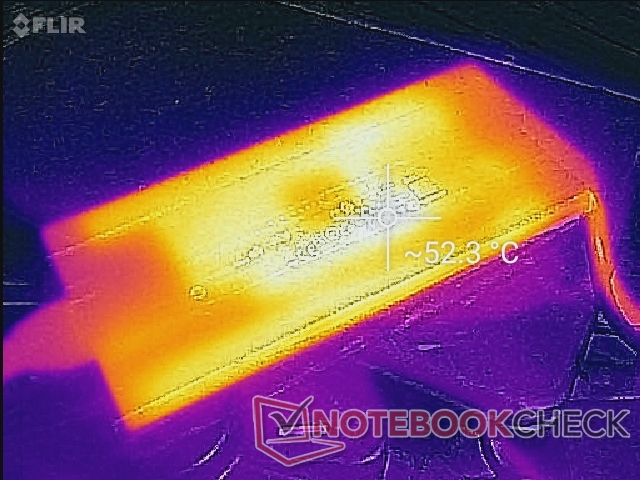
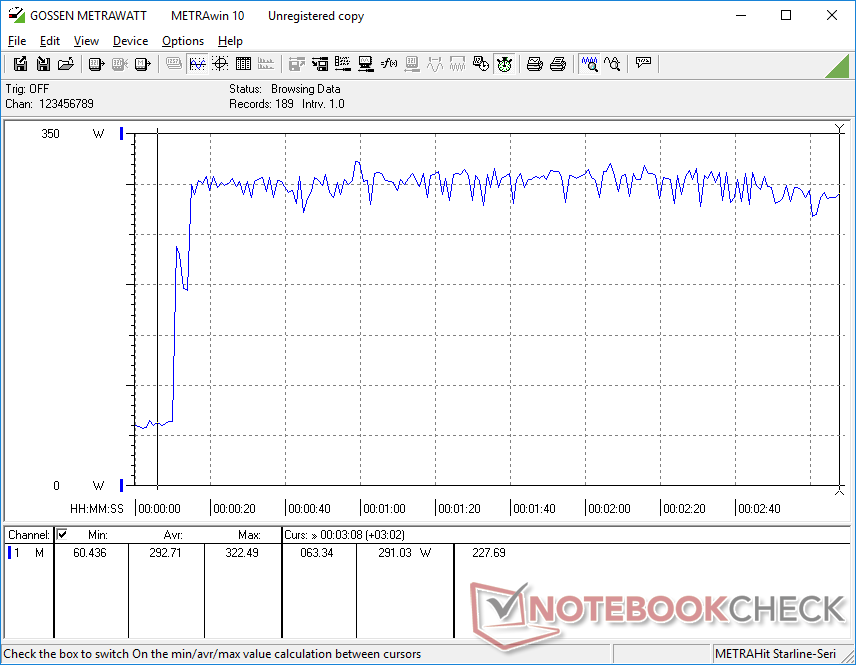
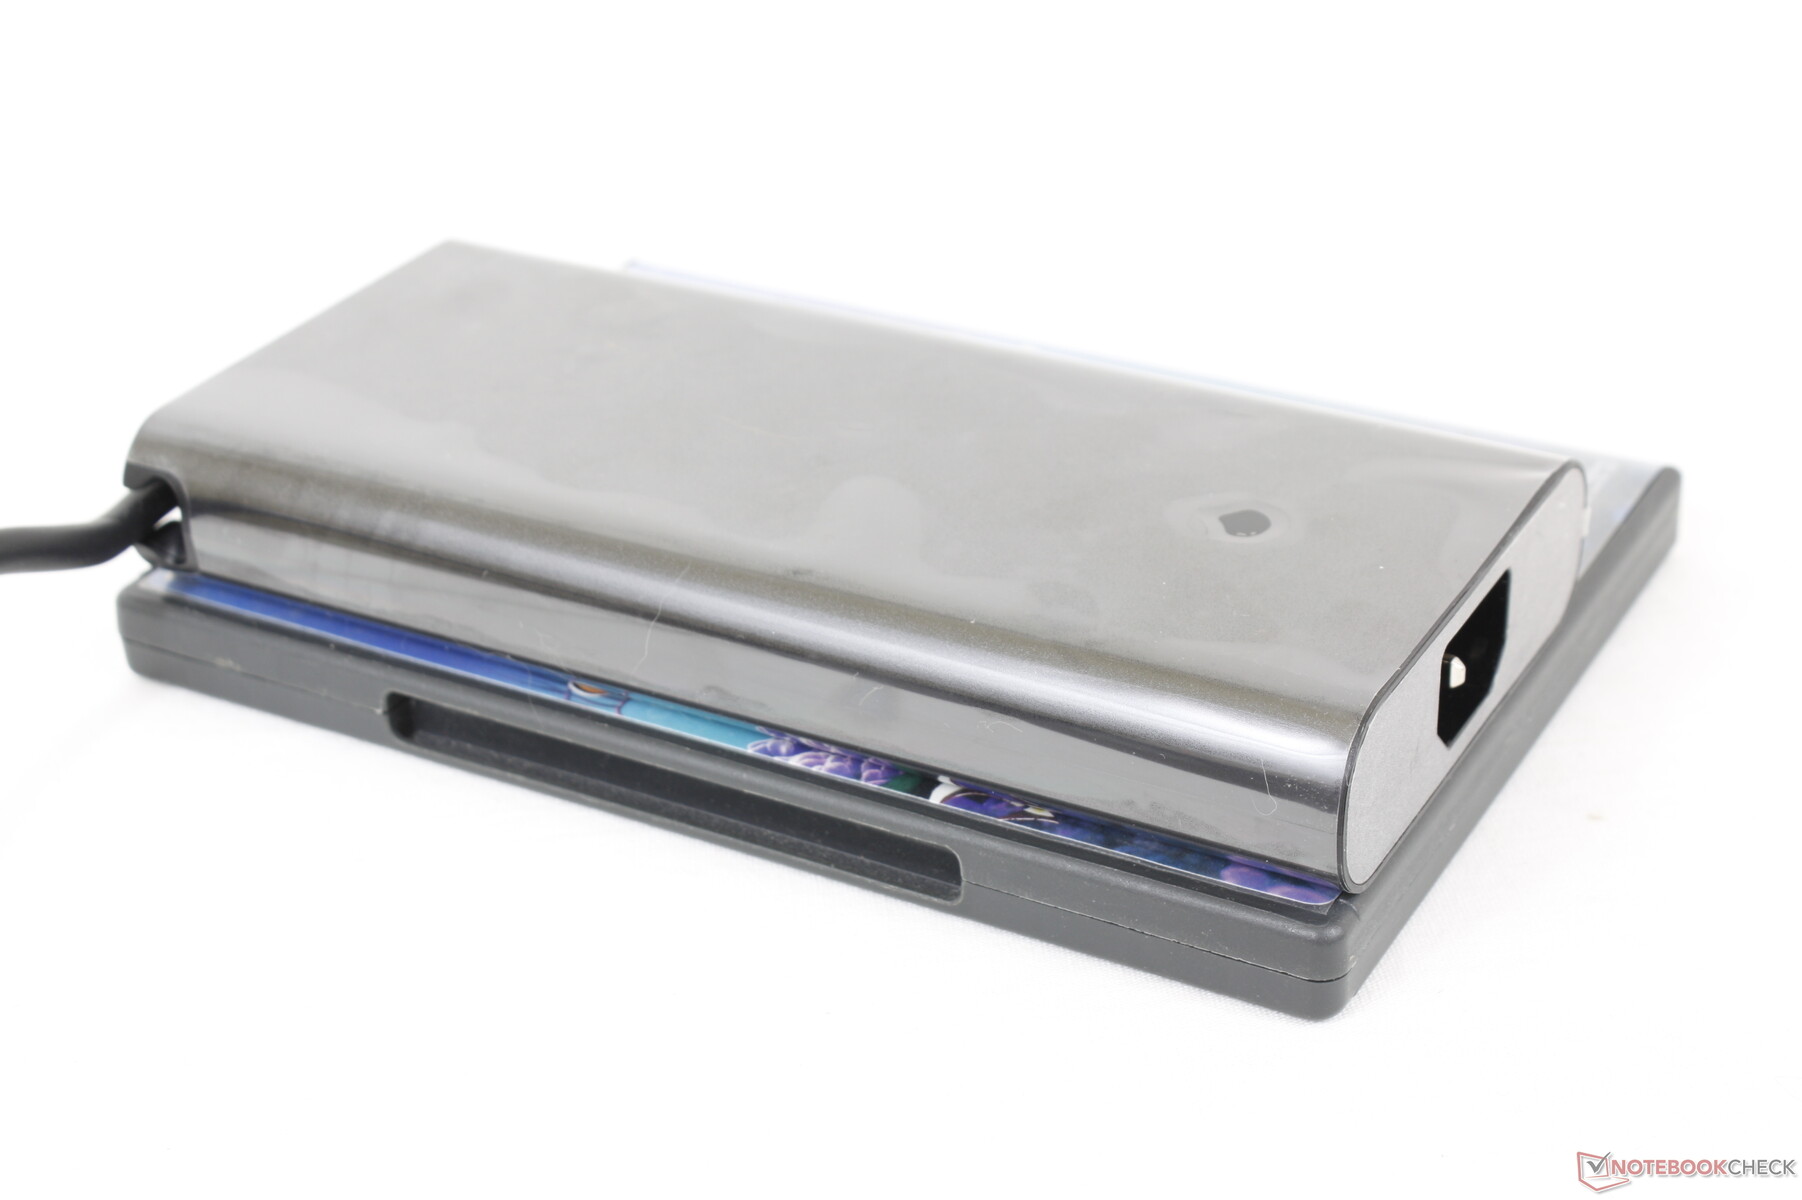
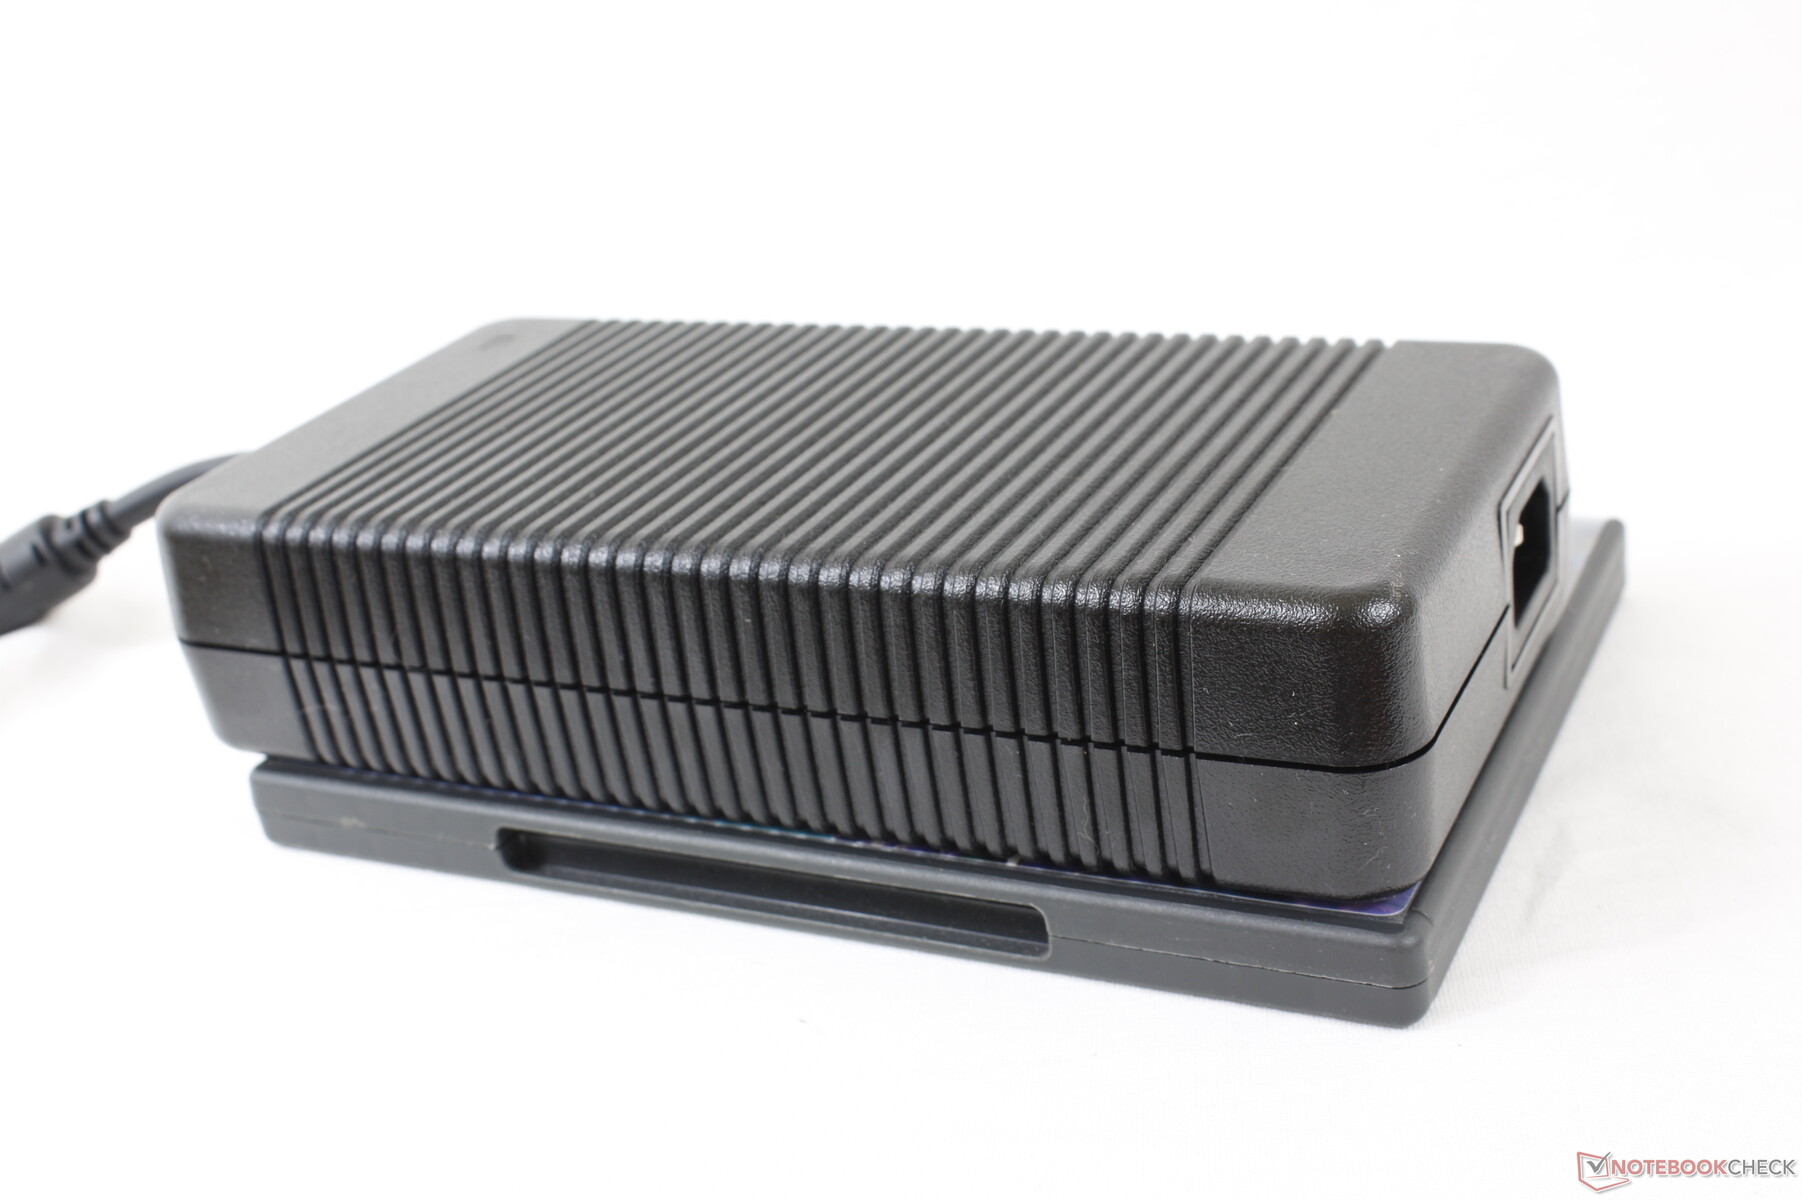
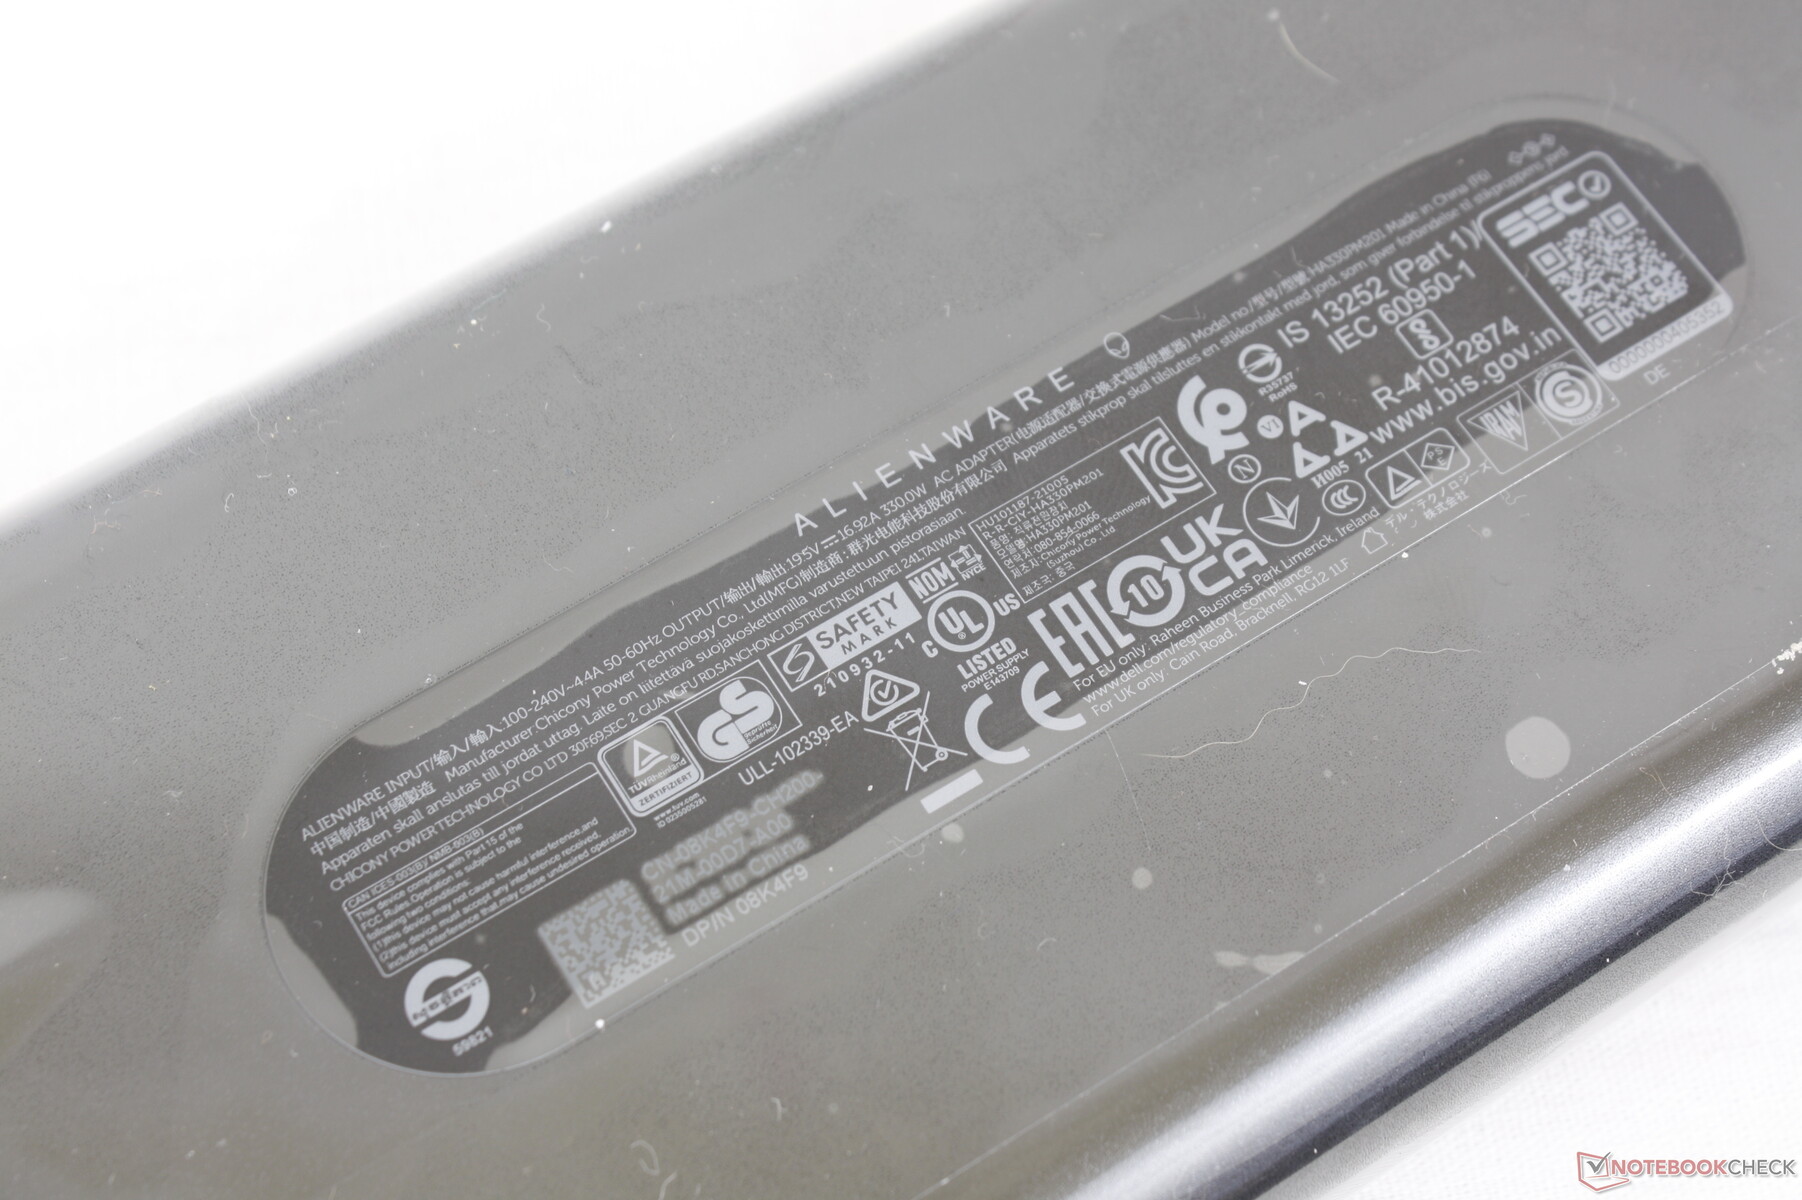
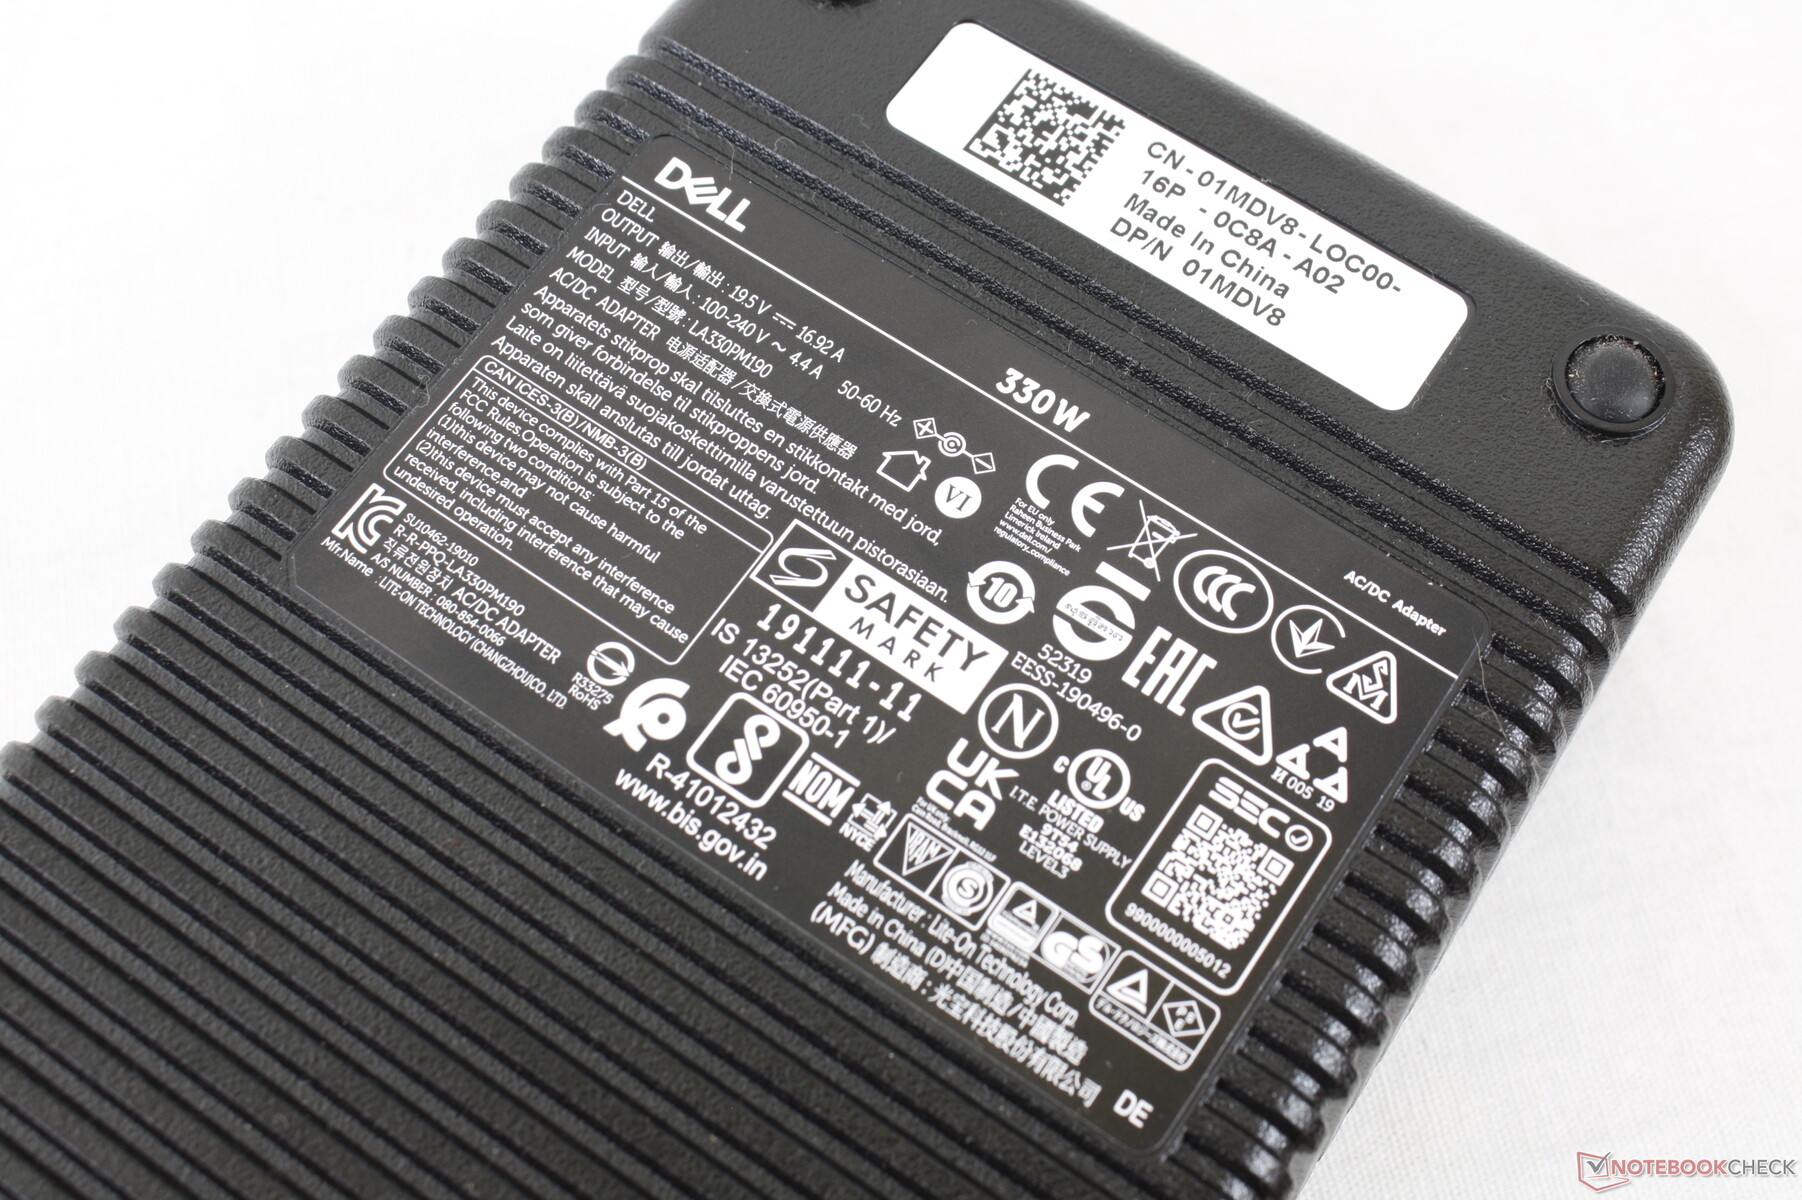
Podemos registrar un consumo máximo de 323 W del adaptador de CA de 330 W cuando tanto la CPU como la GPU están al 100% de utilización. El adaptador de CA es más pequeño esta vez si lo comparamos con el que venía con el x17 R1 del año pasado (~18,3 x 8,7 x 2,5 cm frente a ~20 x 9,9 x 4,3 cm). Ten en cuenta que la mayoría de los otros portátiles para juegos se envían con adaptadores de CA más pequeños de bastante menos de 280 W. Las configuraciones menores del Alienware x17 R2 pueden venir con adaptadores de CA aún más pequeños.
| Off / Standby | |
| Ocioso | |
| Carga |
|
Clave:
min: | |
| Alienware x17 R2 P48E i9-12900HK, GeForce RTX 3080 Ti Laptop GPU, 2x Samsung PM9A1 1TB (RAID 0), IPS, 1920x1080, 17.3" | Alienware x17 RTX 3080 P48E i7-11800H, GeForce RTX 3080 Laptop GPU, 2x WDC PC SN730 SDBPNTY-1T00 (RAID 0), IPS, 3840x2160, 17.3" | Asus ROG Zephyrus S17 GX703HSD i9-11900H, GeForce RTX 3080 Laptop GPU, Samsung PM9A1 MZVL22T0HBLB, IPS, 2560x1440, 17.3" | MSI Stealth GS77 12UHS-083US i7-12700H, GeForce RTX 3080 Ti Laptop GPU, Micron 3400 1TB MTFDKBA1T0TFH, IPS, 2560x1440, 17.3" | MSI GT76 Titan DT 10SGS i9-10900K, GeForce RTX 2080 Super Mobile, 2x WDC PC SN730 SDBPNTY-1T00 (RAID 0), IPS, 3840x2160, 17.3" | Gigabyte A7 X1 R9 5900HX, GeForce RTX 3070 Laptop GPU, ESR512GTLCG-EAC-4, IPS, 1920x1080, 17.3" | |
|---|---|---|---|---|---|---|
| Power Consumption | 22% | 22% | 30% | -15% | 38% | |
| Idle Minimum * (Watt) | 24.1 | 10.2 58% | 21.7 10% | 20 17% | 25.9 -7% | 12 50% |
| Idle Average * (Watt) | 28.5 | 21.2 26% | 27 5% | 21.4 25% | 38 -33% | 14 51% |
| Idle Maximum * (Watt) | 60 | 48.4 19% | 33 45% | 27 55% | 53.2 11% | 19 68% |
| Load Average * (Watt) | 128.7 | 118.7 8% | 108 16% | 100.5 22% | 123.8 4% | 118 8% |
| Witcher 3 ultra * (Watt) | 254 | 249 2% | 195 23% | 165 35% | 312.5 -23% | 205 19% |
| Load Maximum * (Watt) | 323 | 262 19% | 210 35% | 247.1 23% | 459.8 -42% | 229 29% |
* ... más pequeño es mejor
Power Consumption Witcher 3 / Stresstest
Power Consumption external Monitor
Duración de la batería
La duración de la batería es una de las peores que hemos visto en un portátil para juegos. Incluso en reposo en el escritorio con la configuración de brillo más baja, el perfil de energía más bajo y la gráfica Optimus activa sólo durará algo menos de 4 horas. Espera sólo 2 horas de navegación WLAN en el mundo real comparado con más de 7 horas del Asus ROG Zephyrus S17.
La carga de vacío a plena capacidad tarda unos 100 minutos. Los usuarios también pueden recargar con adaptadores USB-C de terceros.
| Alienware x17 R2 P48E i9-12900HK, GeForce RTX 3080 Ti Laptop GPU, 87 Wh | Alienware x17 RTX 3080 P48E i7-11800H, GeForce RTX 3080 Laptop GPU, 87 Wh | Asus ROG Zephyrus S17 GX703HSD i9-11900H, GeForce RTX 3080 Laptop GPU, 90 Wh | MSI Stealth GS77 12UHS-083US i7-12700H, GeForce RTX 3080 Ti Laptop GPU, 99 Wh | MSI GT76 Titan DT 10SGS i9-10900K, GeForce RTX 2080 Super Mobile, 90 Wh | Gigabyte A7 X1 R9 5900HX, GeForce RTX 3070 Laptop GPU, 48.96 Wh | |
|---|---|---|---|---|---|---|
| Duración de Batería | 91% | 257% | 154% | 20% | 93% | |
| Reader / Idle (h) | 3.9 | 7 79% | 10.8 177% | |||
| WiFi v1.3 (h) | 2 | 5.9 195% | 7.5 275% | 6.2 210% | 2.4 20% | 4.7 135% |
| Load (h) | 0.8 | 0.8 0% | 2.7 238% | 1.4 75% | 1.2 50% | |
| H.264 (h) | 7.2 | |||||
| Witcher 3 ultra (h) | 1 |
Pro
Contra
Veredicto - Un TGP más alto significa un mayor rendimiento
Cuando Nvidia anunció la GeForce RTX 3080 Ti para portátiles, nos decepcionó descubrir que algunos modelos tendrían como objetivo unos valores TGP muy bajos, de sólo unos 100 W. Aunque este enfoque permitiría diseños superfinos, también sacrificaba el rendimiento por el camino, ya que la GPU estaría efectivamente infra-reaccionada. El Alienware x17 R2 reconoce este inconveniente y, en su lugar, apunta a un TGP significativamente más alto, de 175 W, para obtener un aumento de rendimiento de aproximadamente el 30 por ciento con respecto a los portátiles que funcionan con la GeForce RTX 3080 Ti de ~100 W, como el Razer Blade 15 o Gigabyte Aero YE5. Resultados similares se pueden encontrar a través de la CPU también. Este único aspecto del Alienware es quizás el mayor factor diferenciador entre él y otros portátiles de juego ultradelgados.
Por supuesto, el enfoque de "rendimiento a toda costa" tiene sus inconvenientes. El consumo de energía, en particular, está por las nubes y la duración de la batería se resiente por ello, incluso con los ajustes de rendimiento más bajos. El sistema también es notablemente más pesado y más grande, respectivamente, que otros portátiles de juego ultradelgados, aunque el chasis siga considerándose ultradelgado. También hay que acostumbrarse a la posición de los puertos.
si quieres maximizar el rendimiento sin tener que conformarte con enormes portátiles para juegos como la Serie MSI GT, La serie ROG Chimera de Asuso el Alienware Area-51m entonces vale la pena considerar el Alienware x17 R2 y su sorprendentemente satisfactorio teclado mecánico.
Precio y disponibilidad
El Alienware x17 R2 ya está disponible en en Amazon en múltiples SKUs aunque ninguno es nuestra configuración exacta. Alternativamente, los usuarios pueden comprar directamente de Dell.
Alienware x17 R2 P48E
- 05/11/2022 v7 (old)
Allen Ngo
Price comparison

