Análisis del MSI Summit E16 Flip: portátil 2-en-1 con lápiz, pantalla 16:10 y RTX 3050 Ti
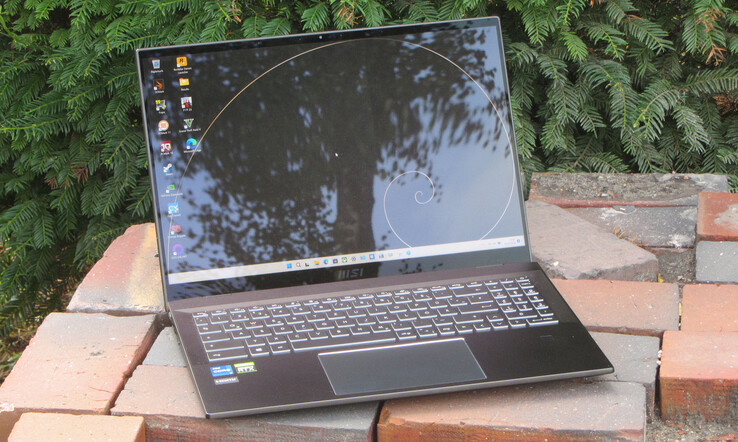
Con el Summit E16 Flip, MSI ofrece un portátil 2 en 1 cuya característica distintiva es la combinación de una pantalla táctil de 16 pulgadas en formato 16:10 y una GPU de gama media. Nuestra base de datos no incluye ningún competidor directo, ya que los convertibles correspondientes no suelen ofrecer GPUs dedicadas. Un conjunto ampliado de competidores incluye dispositivos como el Asus ExpertBook B2 Flip B2502FBA, elSamsung Galaxy Book Pro 360 15 NP950QDBy el Dell Inspiron 16 7620 2 en 1.
Posibles contendientes en la comparación
Valoración | Fecha | Modelo | Peso | Altura | Tamaño | Resolución | Precio |
|---|---|---|---|---|---|---|---|
| 84.2 % v7 (old) | 10/2022 | MSI Summit E16 Flip A12UDT-031 i7-1280P, GeForce RTX 3050 Ti Laptop GPU | 1.9 kg | 16.85 mm | 16.00" | 2560x1600 | |
| 83.3 % v7 (old) | 09/2022 | Asus ExpertBook B2 Flip B2502FBA-N80141X i7-1260P, Iris Xe G7 96EUs | 1.9 kg | 19.9 mm | 15.60" | 1920x1080 | |
| 85.7 % v7 (old) | 06/2022 | Dell Inspiron 16 7620 2-in-1 i7-1260P, Iris Xe G7 96EUs | 2.1 kg | 18.41 mm | 16.00" | 1920x1200 | |
| 86.6 % v7 (old) | 03/2022 | Samsung Galaxy Book Pro 360 15 NP950QDB-KC3DE i5-1135G7, Iris Xe G7 80EUs | 1.4 kg | 11 mm | 15.60" | 1920x1080 |
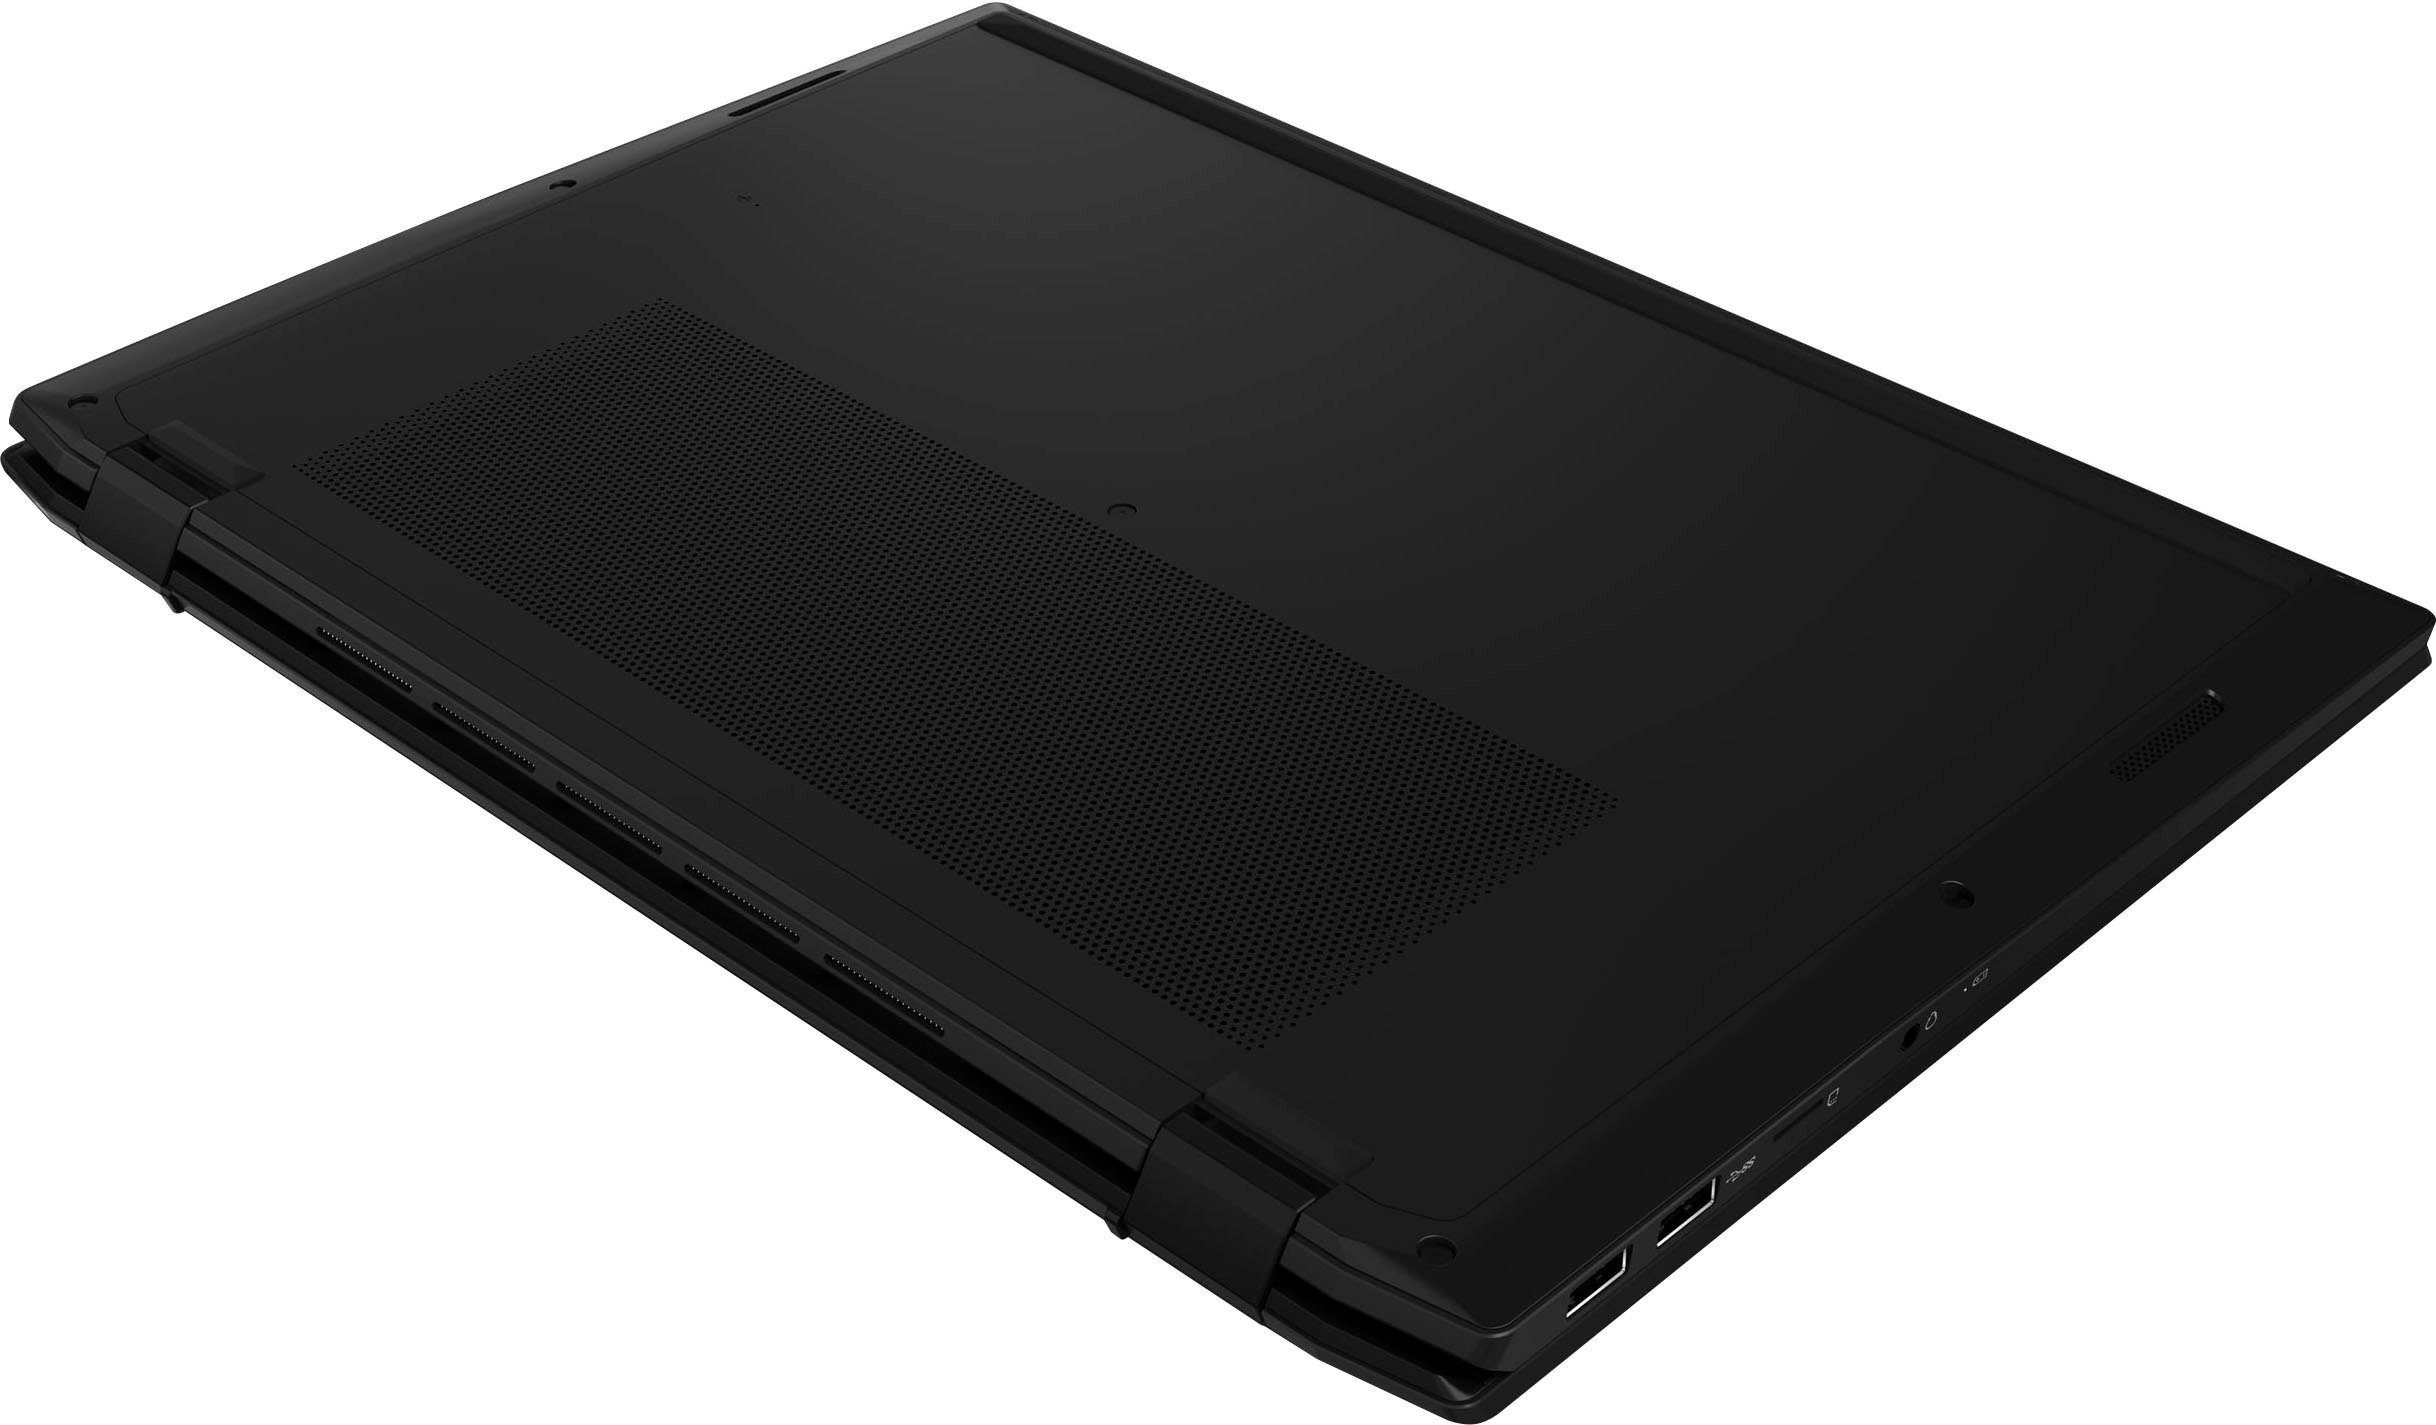
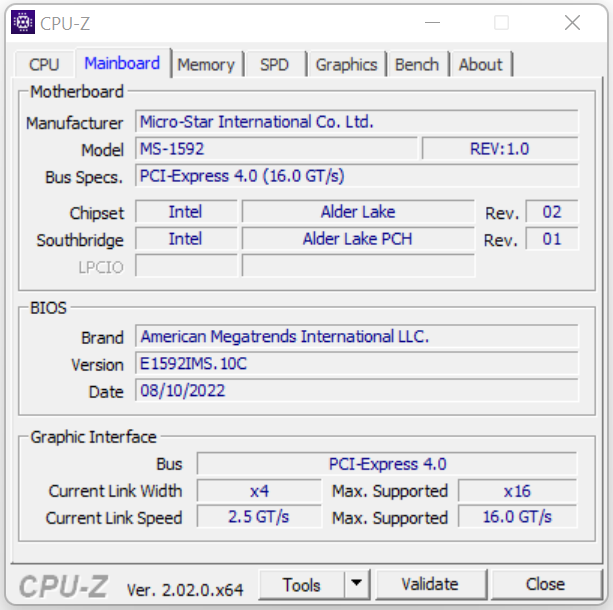
Caja y equipo - MSI Flip ofrece Thunderbolt 4
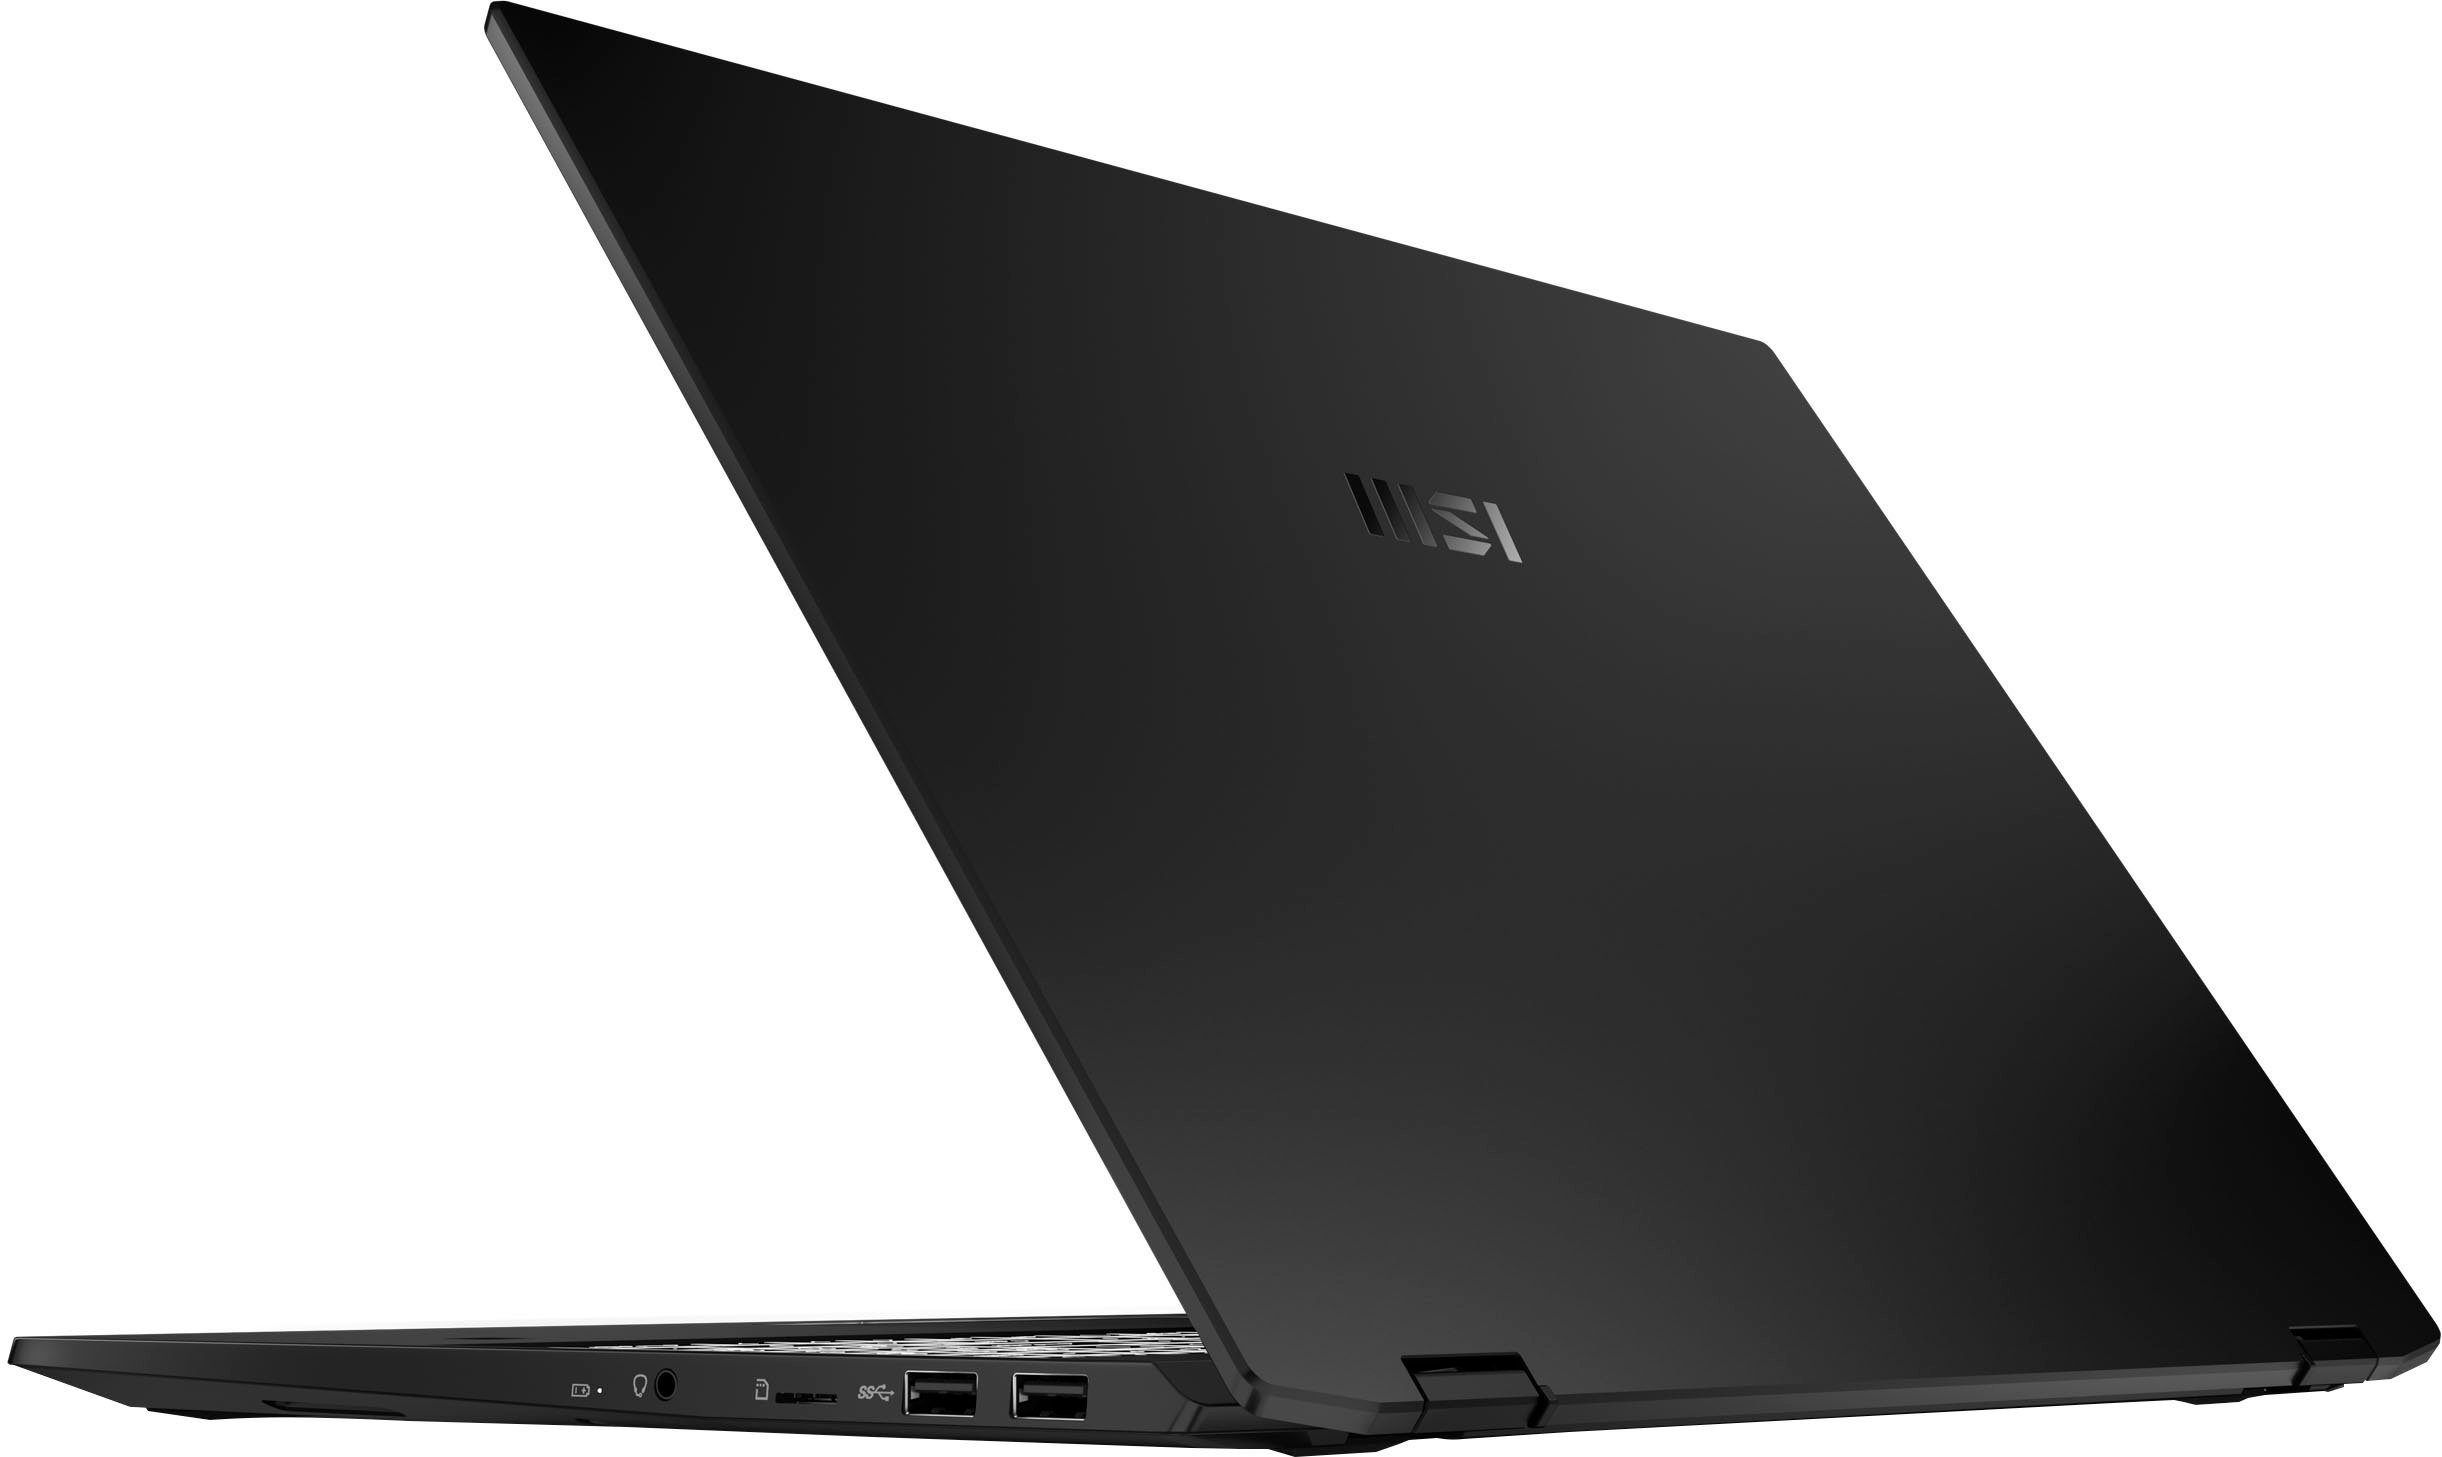
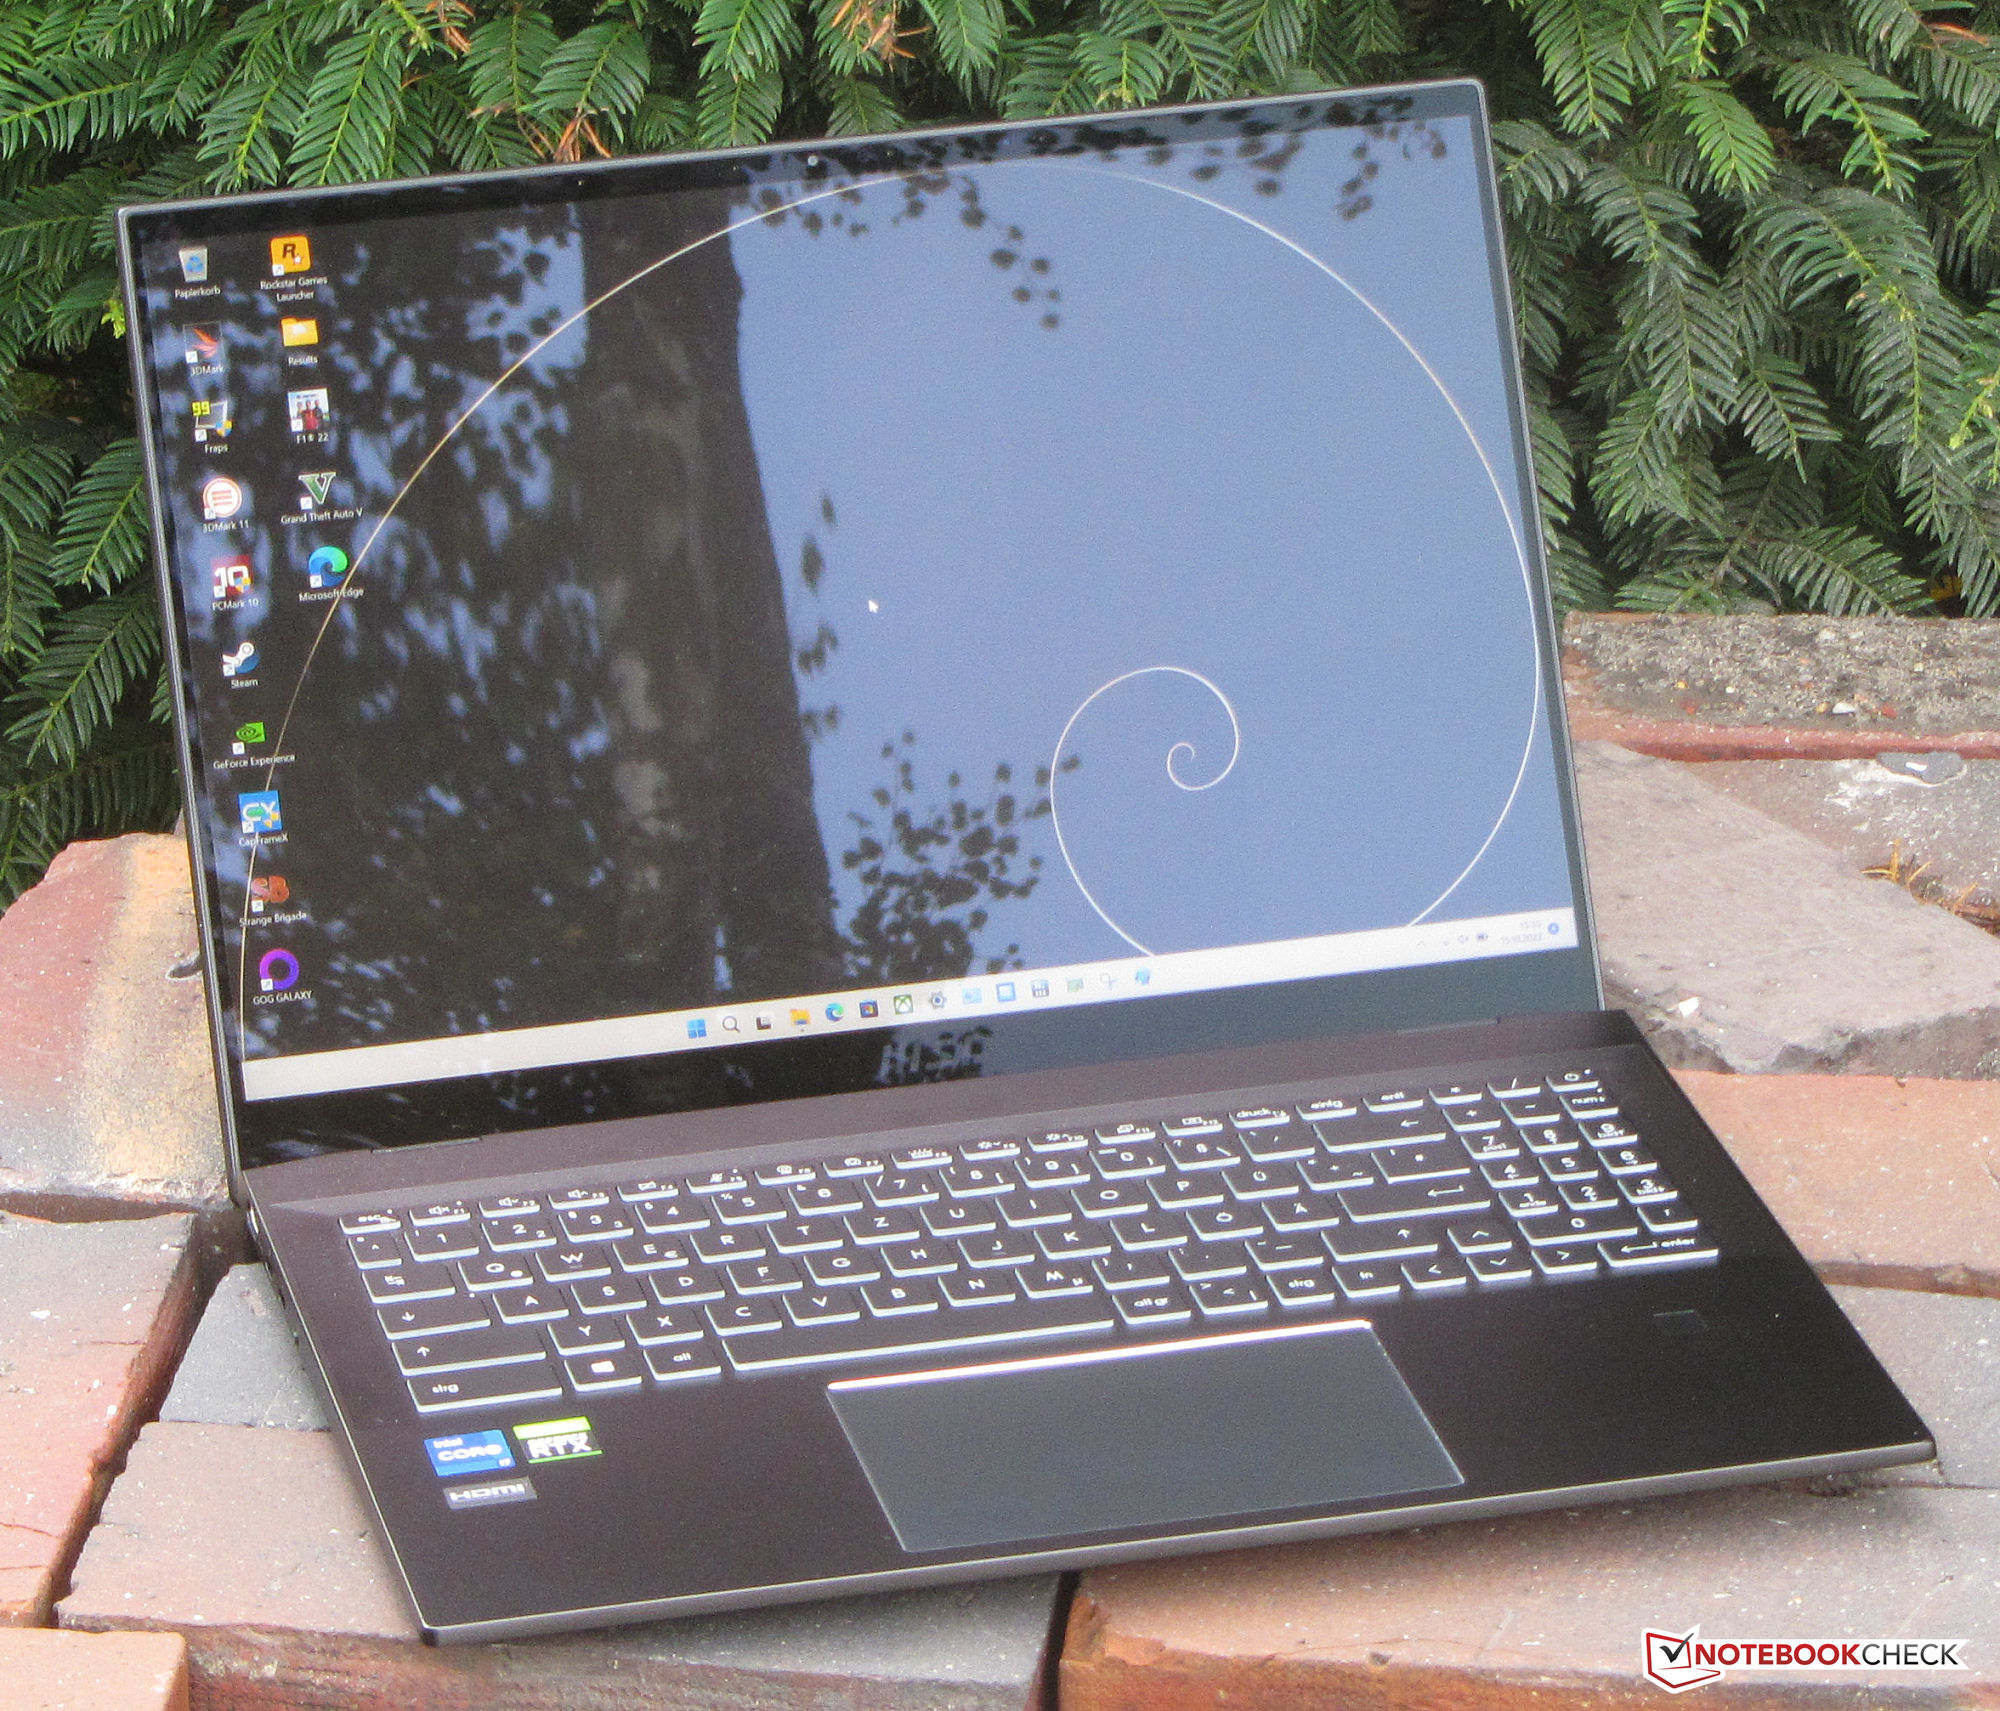
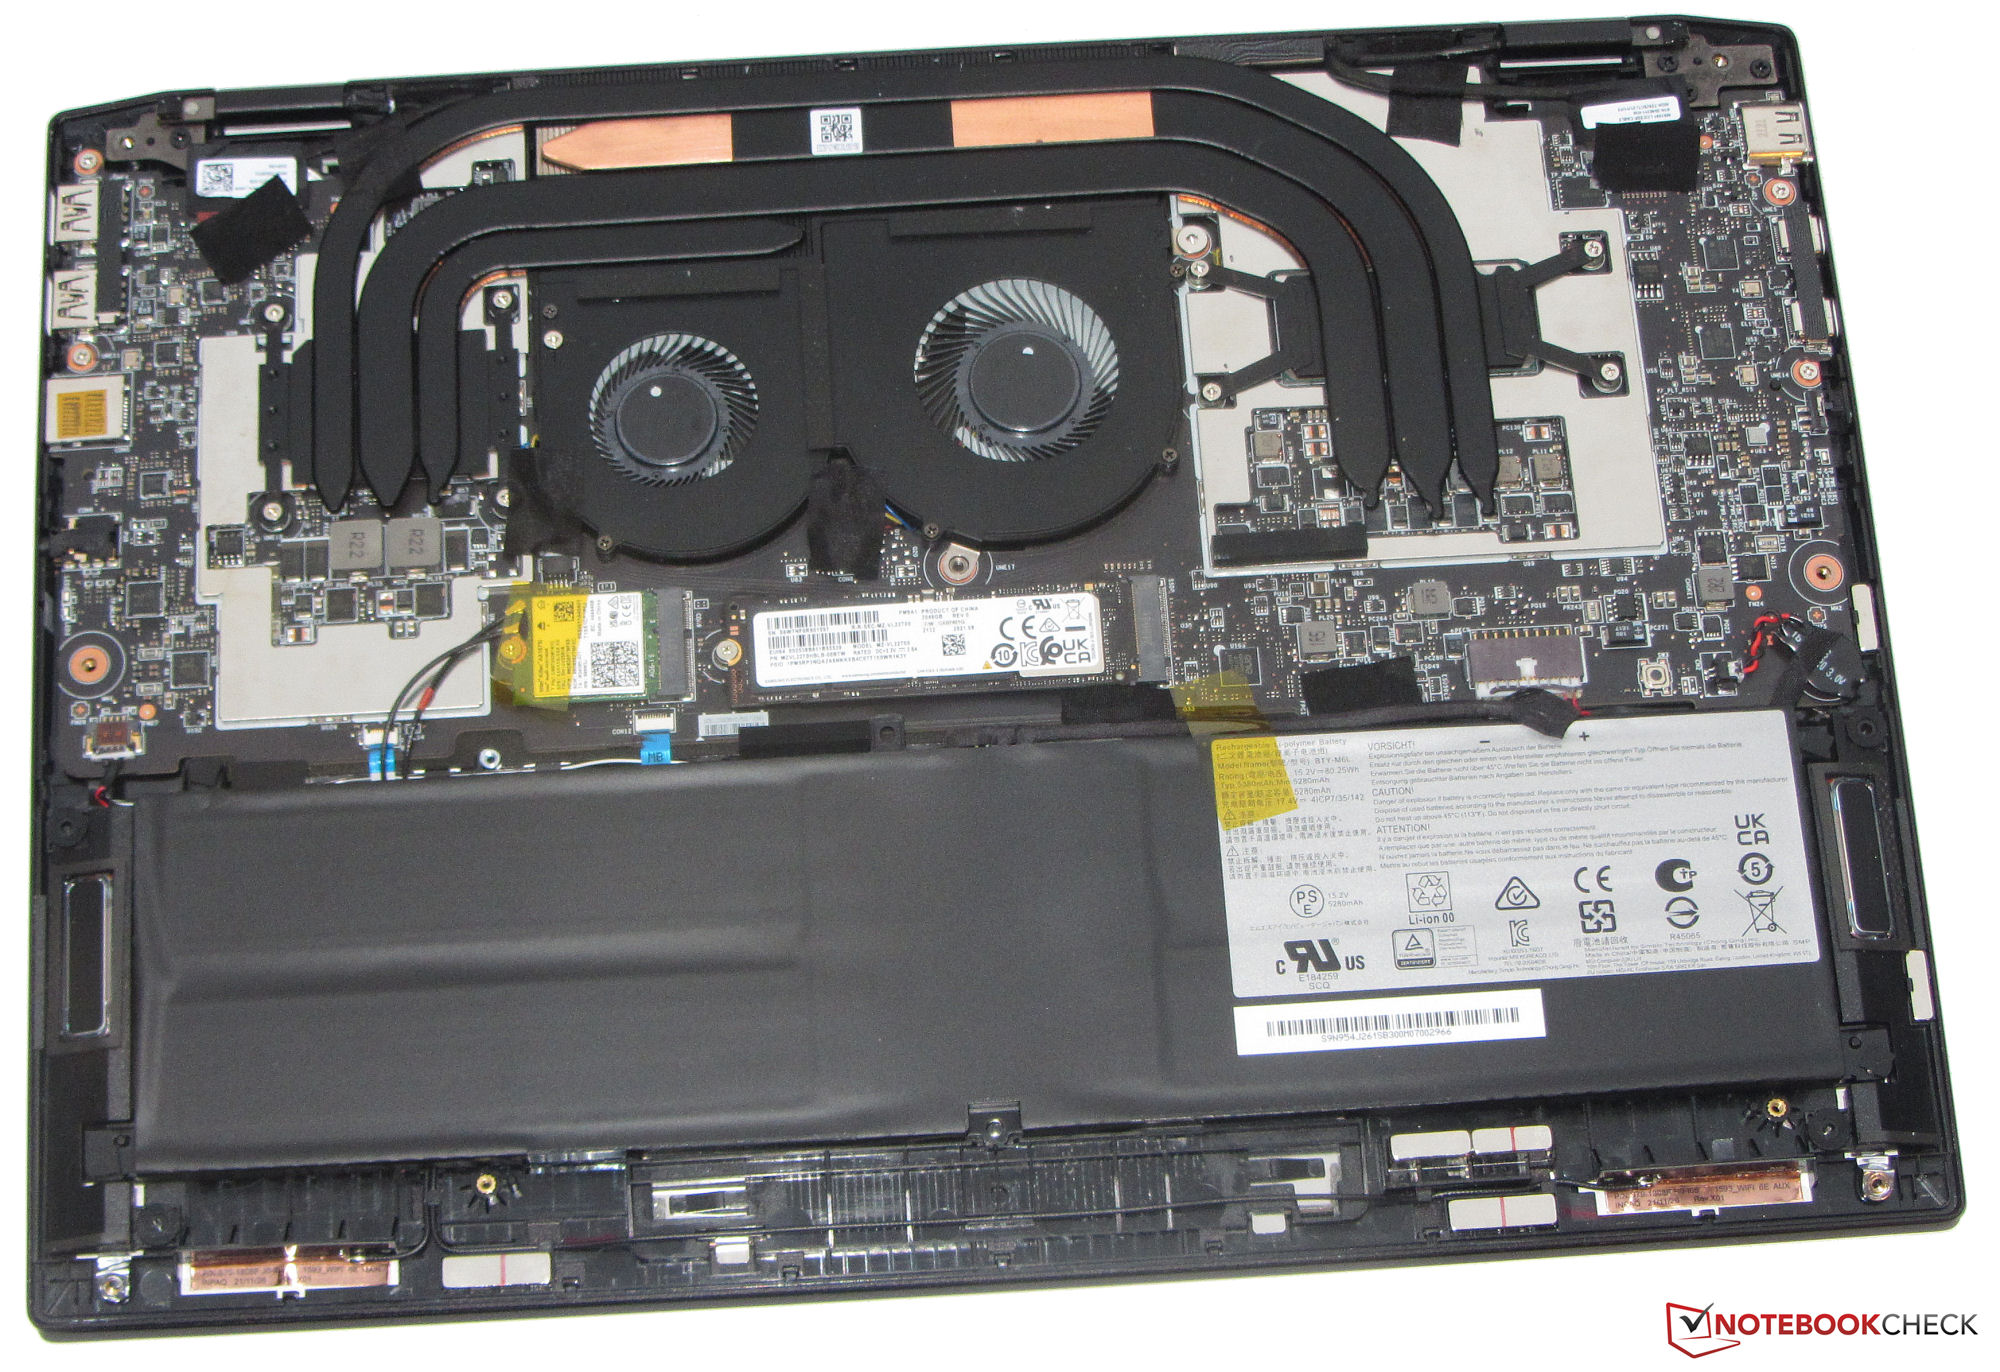
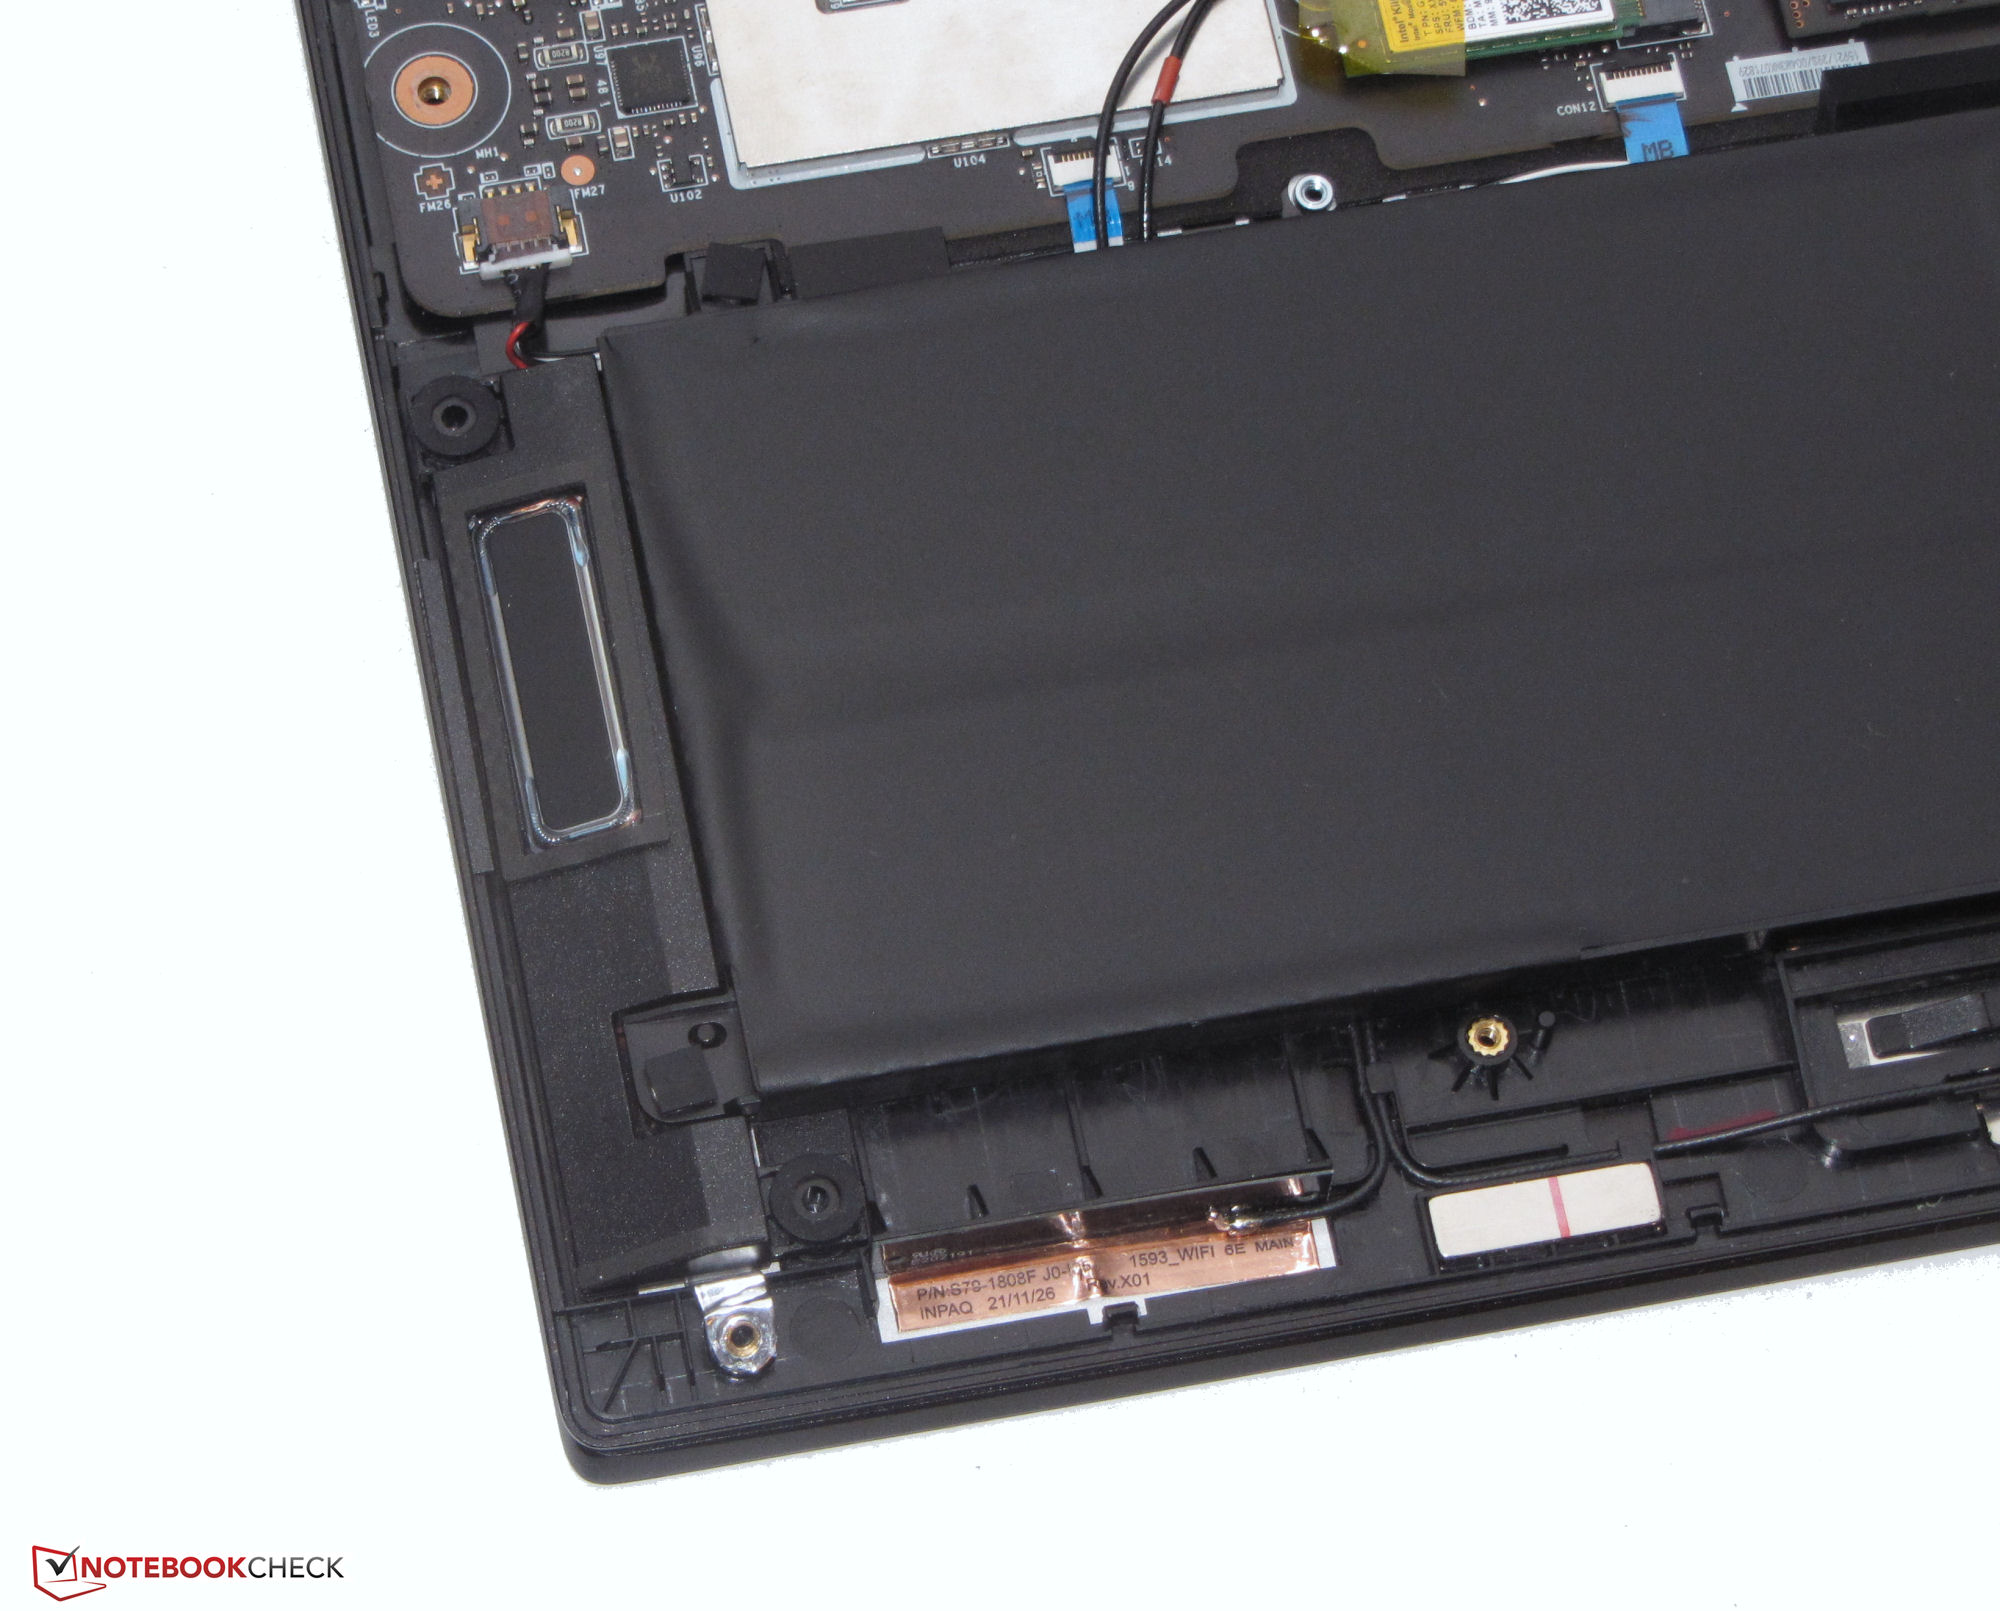
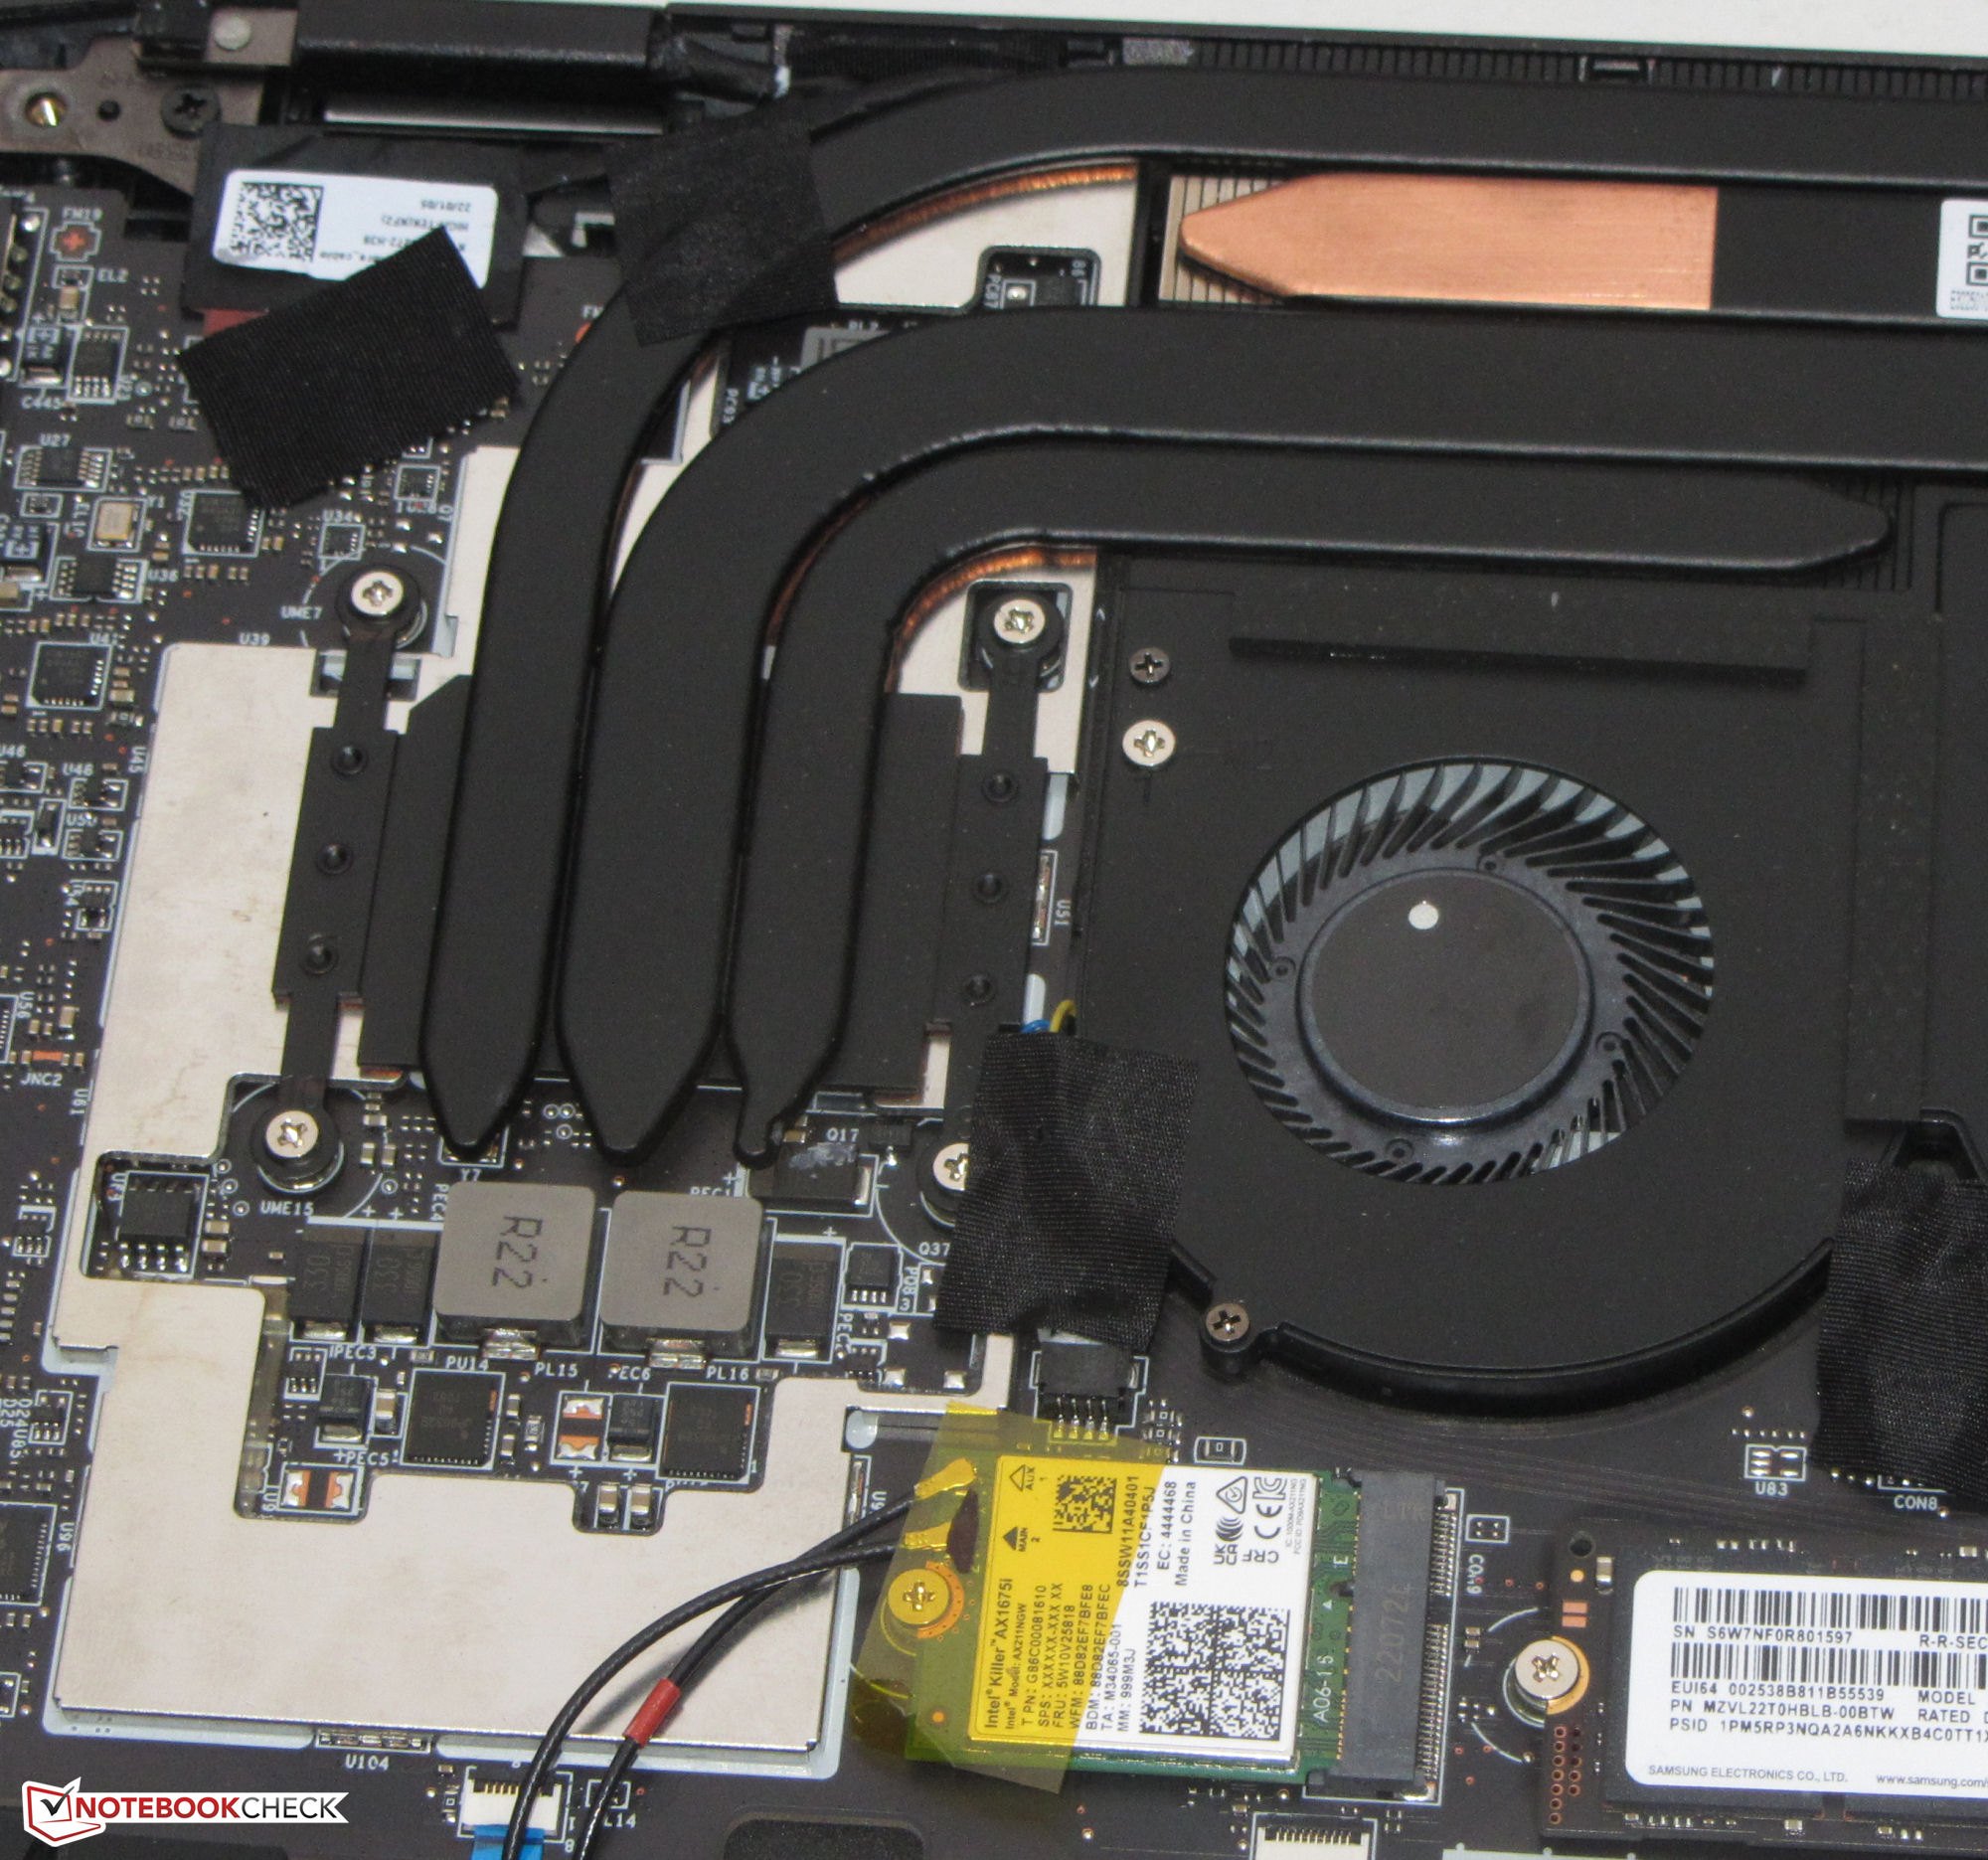
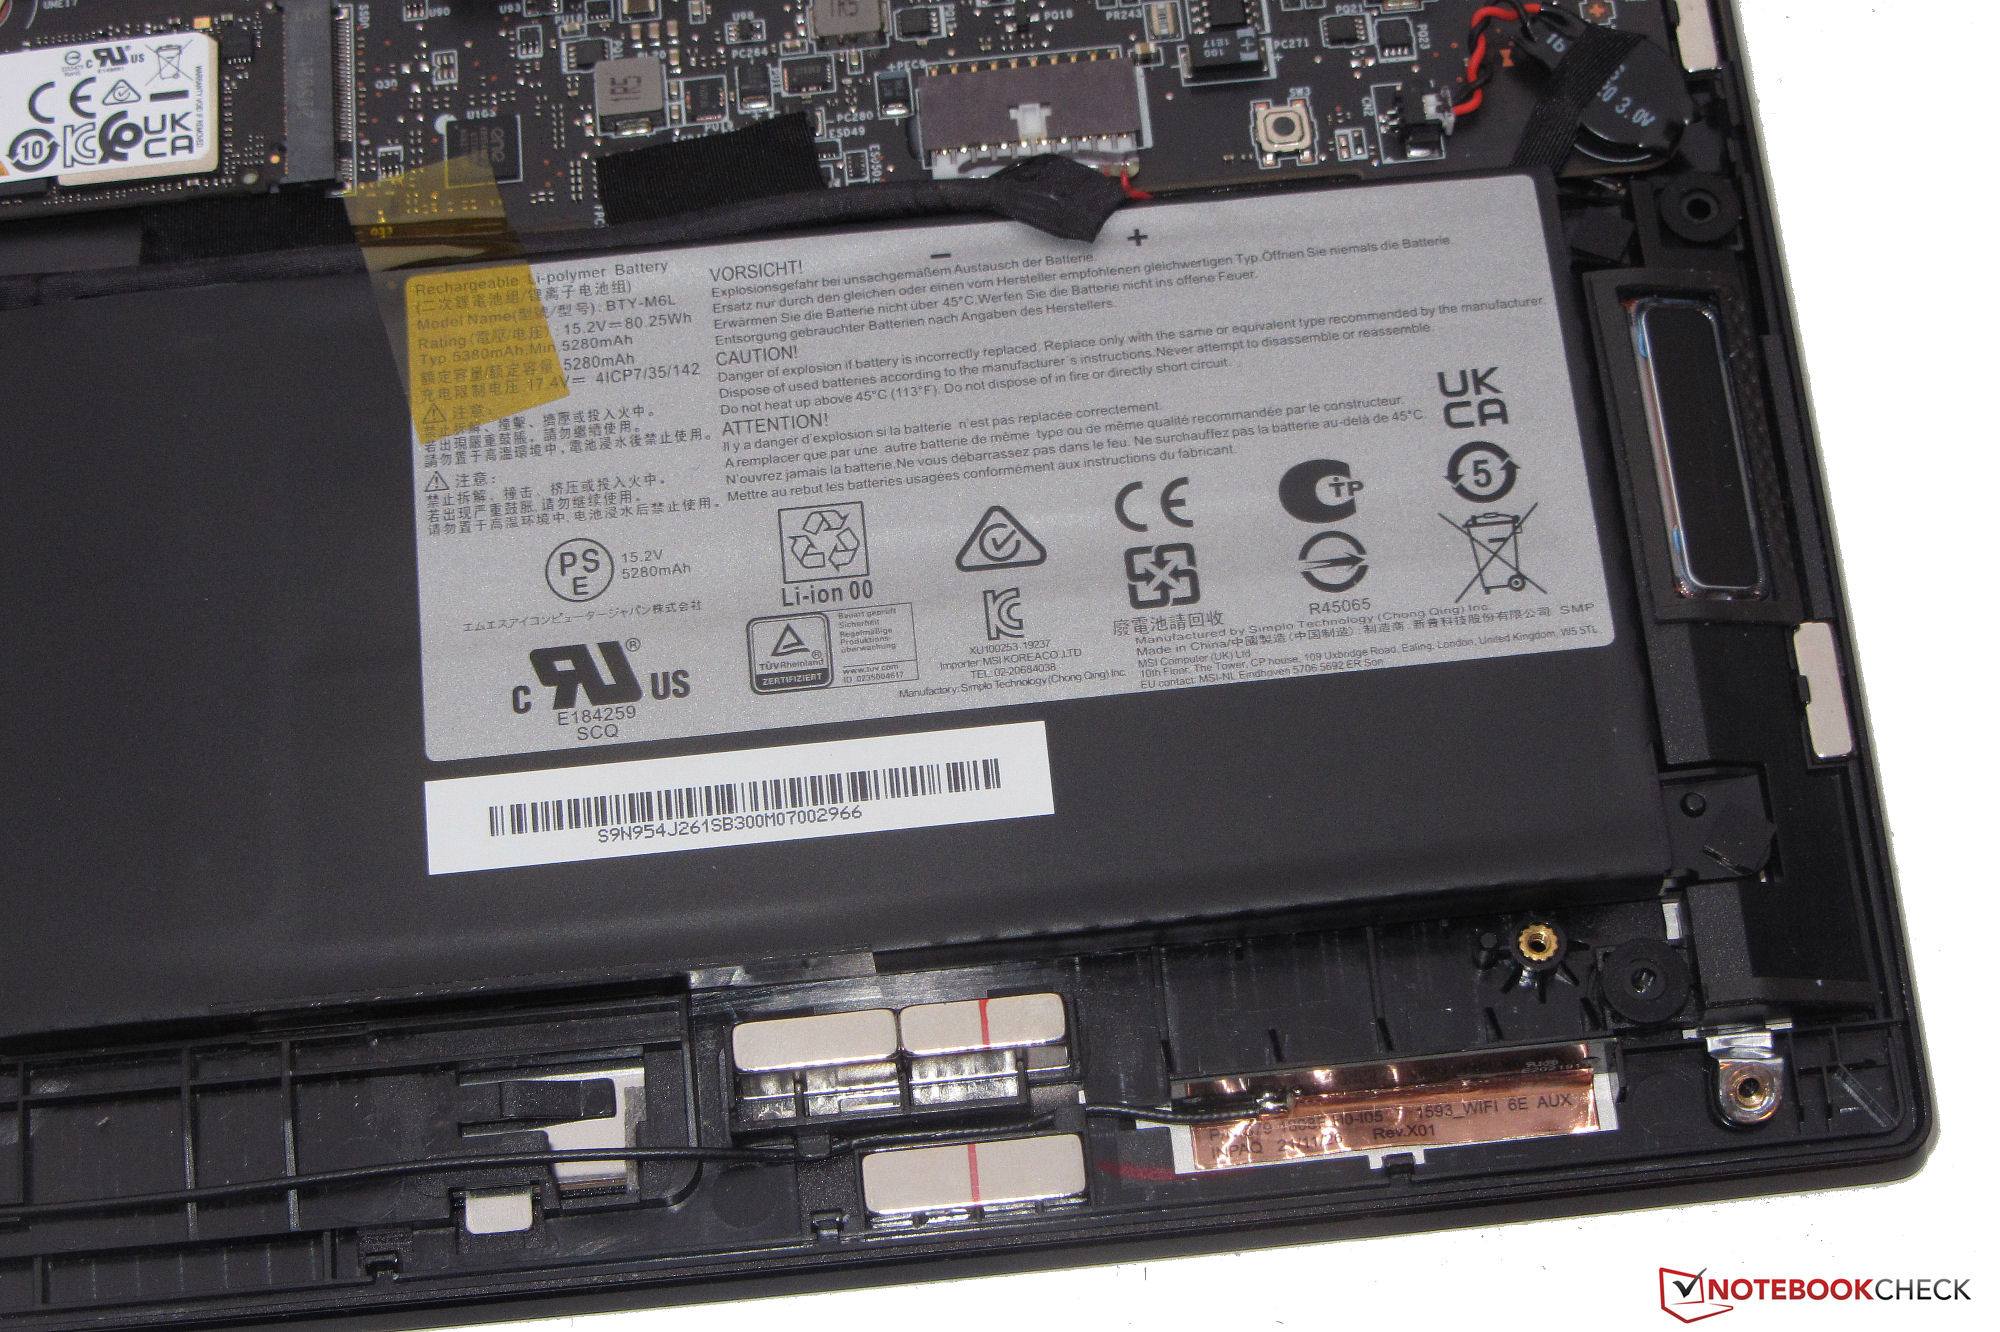
La delgada carcasa metálica negra de la E16 no presenta ningún fallo de fabricación. No encontramos ningún hueco excesivo ni salientes de material. Aunque la tapa y la unidad base pueden estar ligeramente deformadas, esto permanece dentro de los límites. Las superficies lisas y mate de la carcasa son ligeramente propensas a mostrar huellas dactilares. La batería, que está atornillada en lugar de pegada, así como el resto de las partes internas son accesibles tras una fácil extracción del fondo de la carcasa
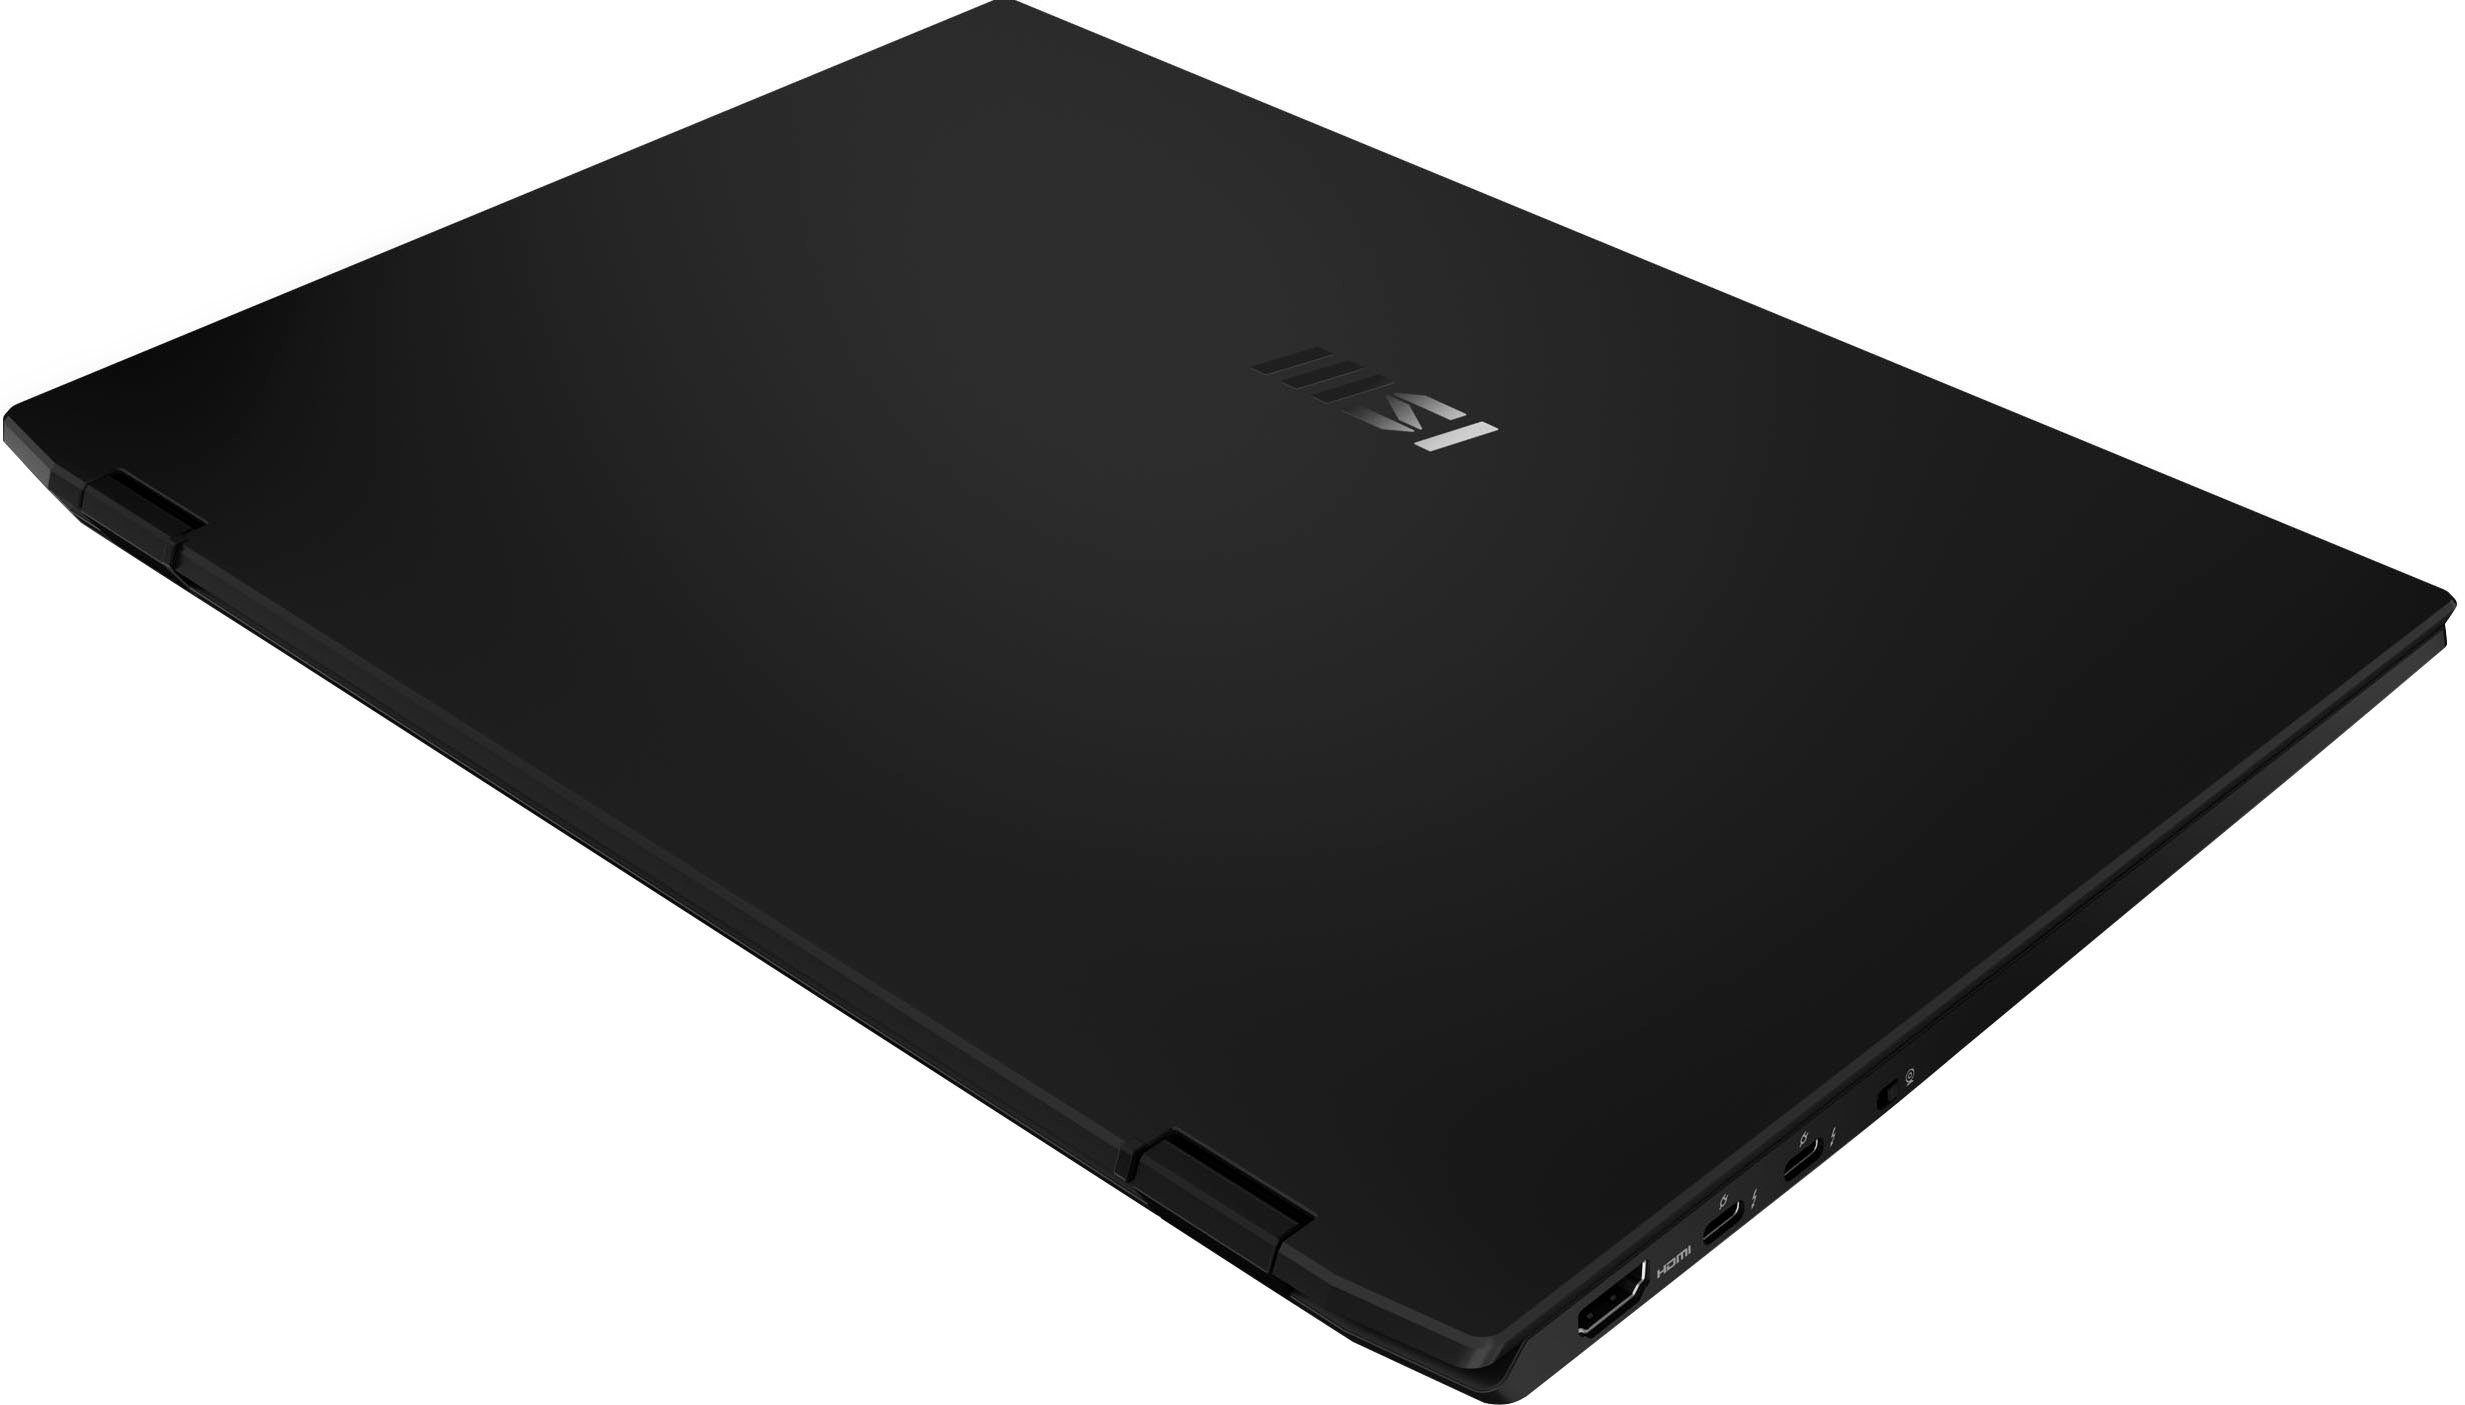
El E16 incluye dos conexiones USB-A (USB 3.2 Gen 2) y dos conexiones USB-C (Thunderbolt 4; Power Delivery, Displayport). El portátil de 16 pulgadas ofrece un total de tres salidas de vídeo (2x DP, 1x HDMI). El lector de tarjetas de almacenamiento microSD pertenece a los representantes más rápidos de su clase (utilizando nuestra tarjeta de almacenamiento de referencia AV PRO SD 128 GB V60). La cámara web integrada (2,1 MP, IR, máx. 1920 x 1080 píxeles) no tiene una cubierta mecánica. En su lugar, hay un botón de encendido/apagado en el lado izquierdo de la carcasa
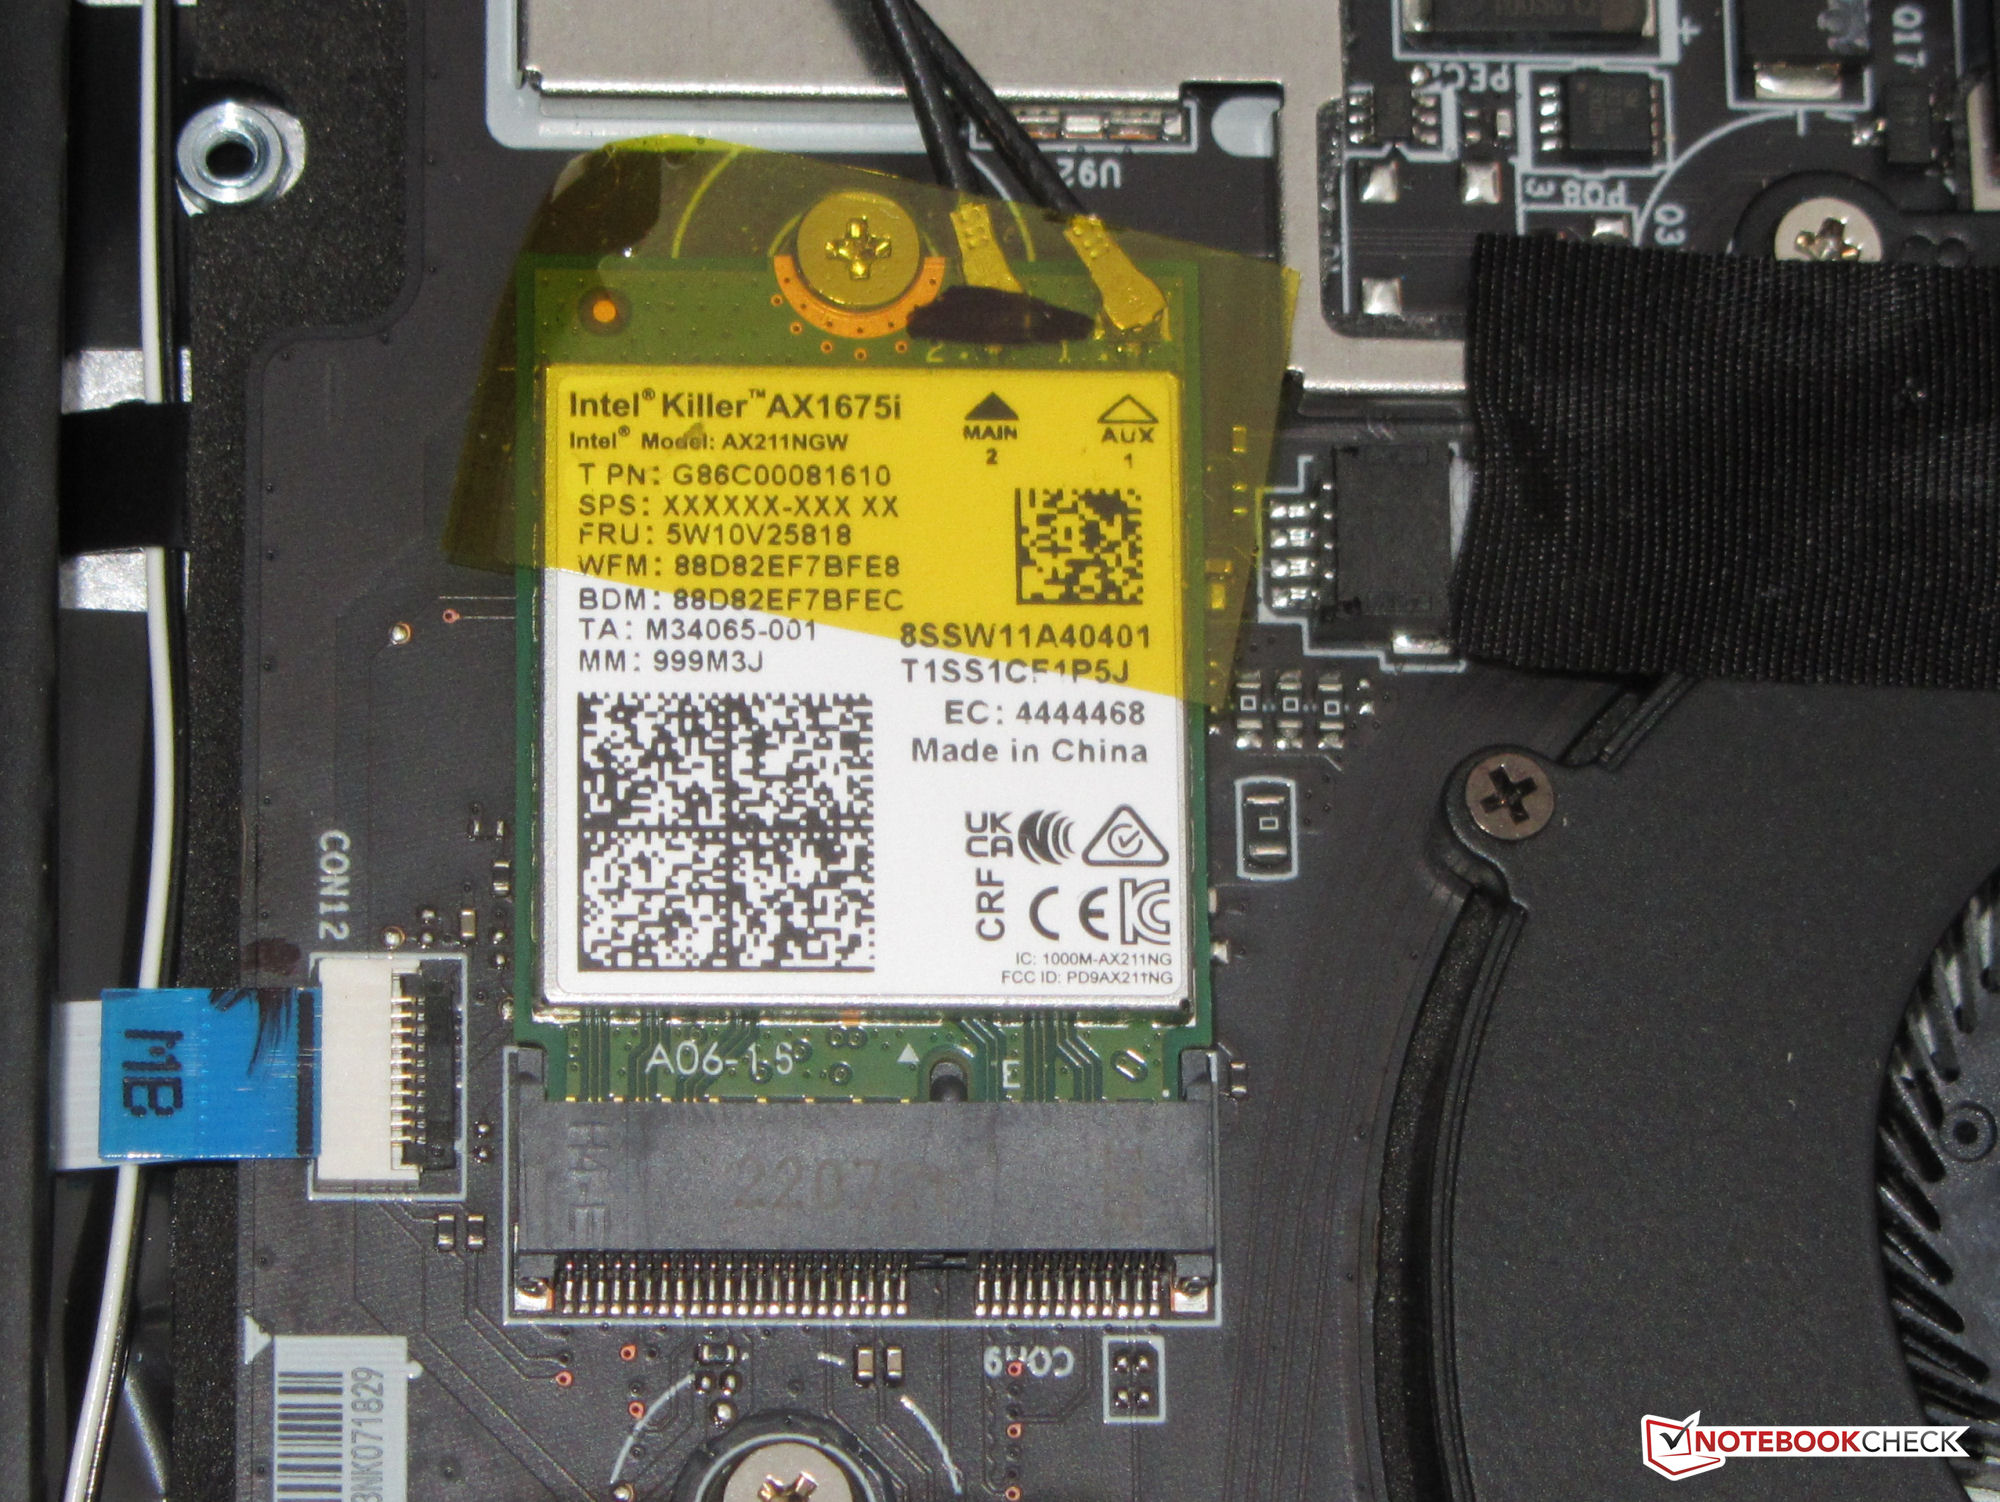
Las tasas de transferencia WLAN que determinamos en condiciones óptimas (sin dispositivos WLAN adicionales cerca y con el portátil y el PC servidor muy cerca) resultan excelentes y corresponden a las capacidades del chip WiFi (Killer Wi-Fi 6E AX1675i; 802.11 ax).


| SD Card Reader | |
| average JPG Copy Test (av. of 3 runs) | |
| MSI Summit E16 Flip A12UDT-031 (AV Pro SD microSD 128 GB V60) | |
| Media de la clase Convertible (29.4 - 141, n=20, últimos 2 años) | |
| Samsung Galaxy Book Pro 360 15 NP950QDB-KC3DE (AV Pro SD microSD 128 GB V60) | |
| Dell Inspiron 16 7620 2-in-1 (Toshiba Exceria Pro SDXC 64 GB UHS-II) | |
| maximum AS SSD Seq Read Test (1GB) | |
| MSI Summit E16 Flip A12UDT-031 (AV Pro SD microSD 128 GB V60) | |
| Media de la clase Convertible (67.5 - 254, n=19, últimos 2 años) | |
| Dell Inspiron 16 7620 2-in-1 (Toshiba Exceria Pro SDXC 64 GB UHS-II) | |
| Samsung Galaxy Book Pro 360 15 NP950QDB-KC3DE (AV Pro SD microSD 128 GB V60) | |


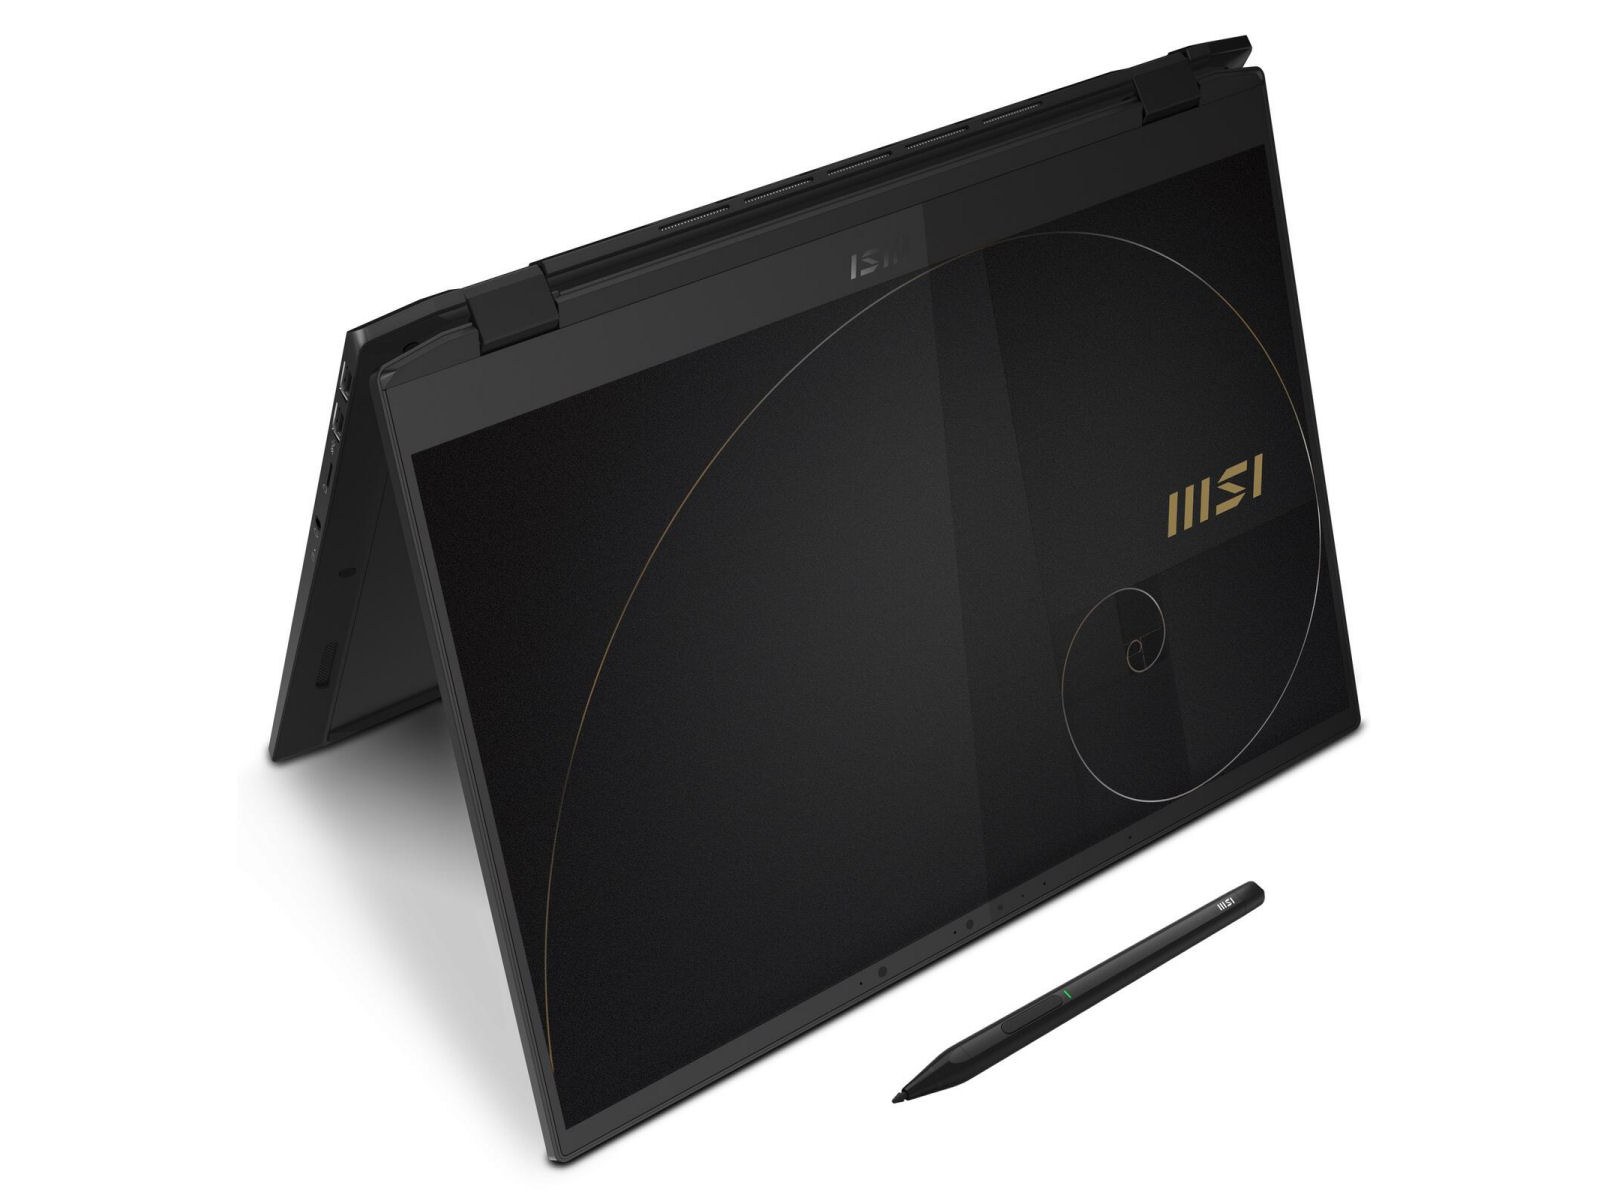
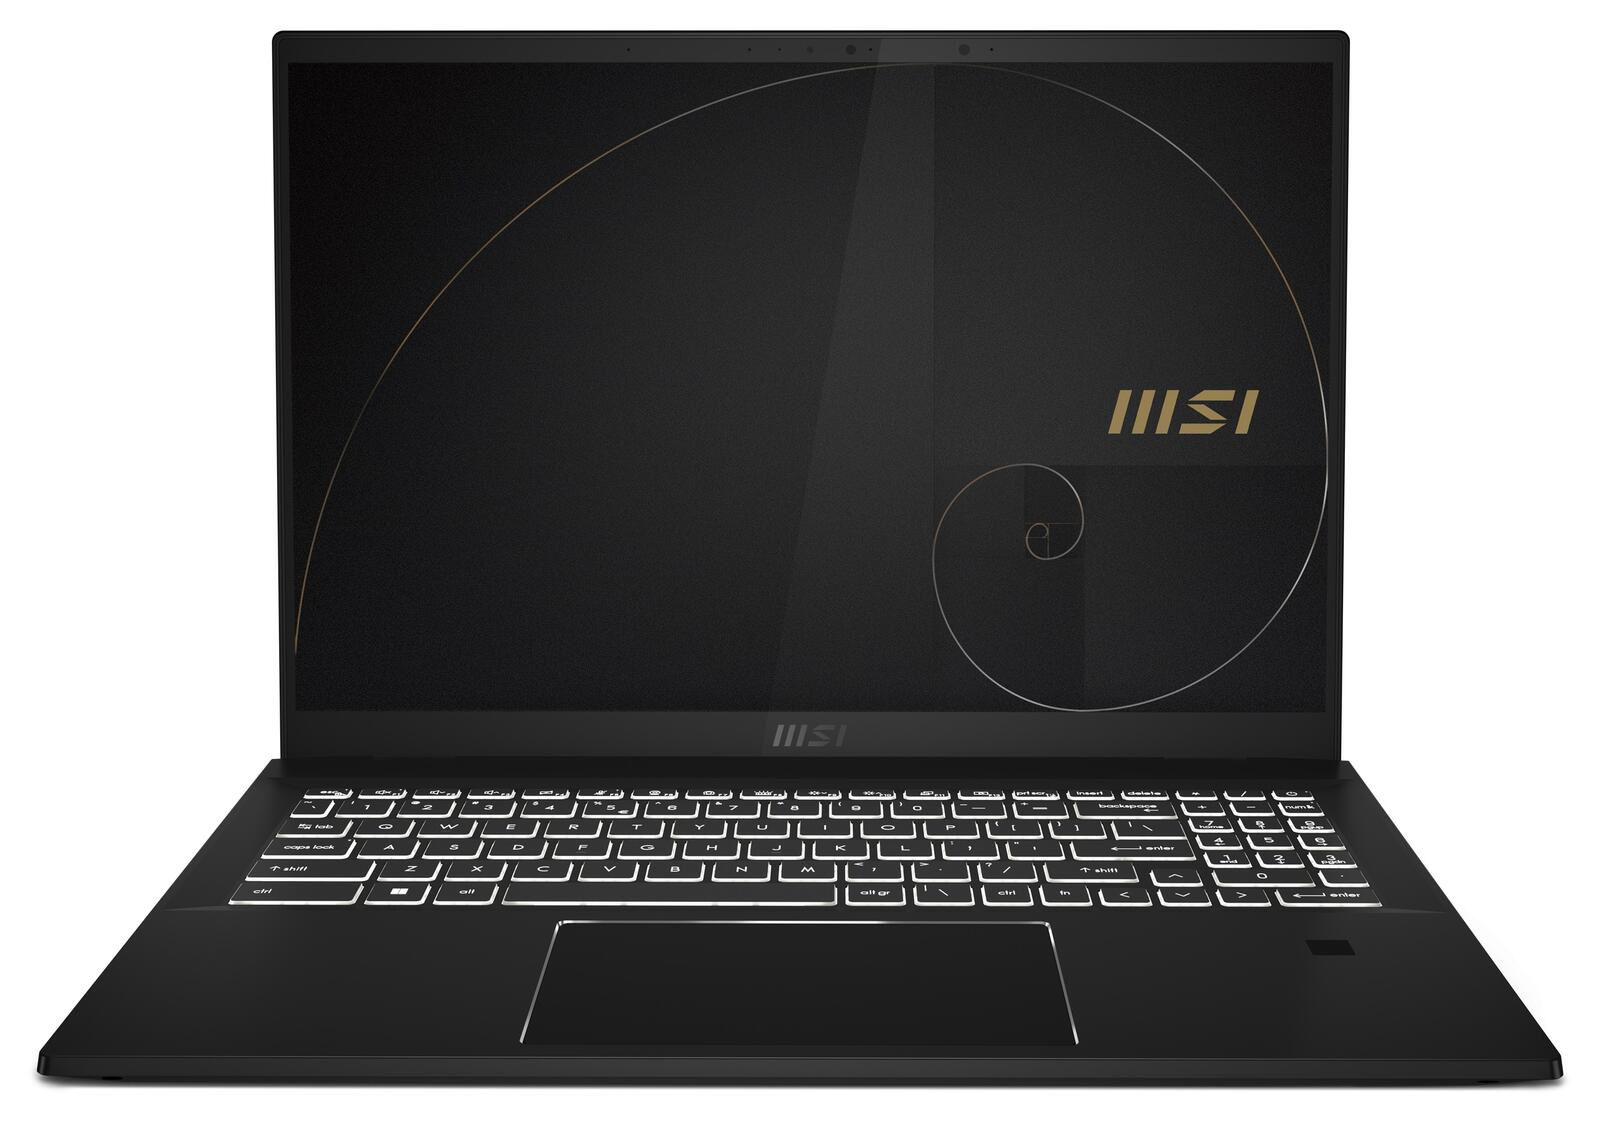
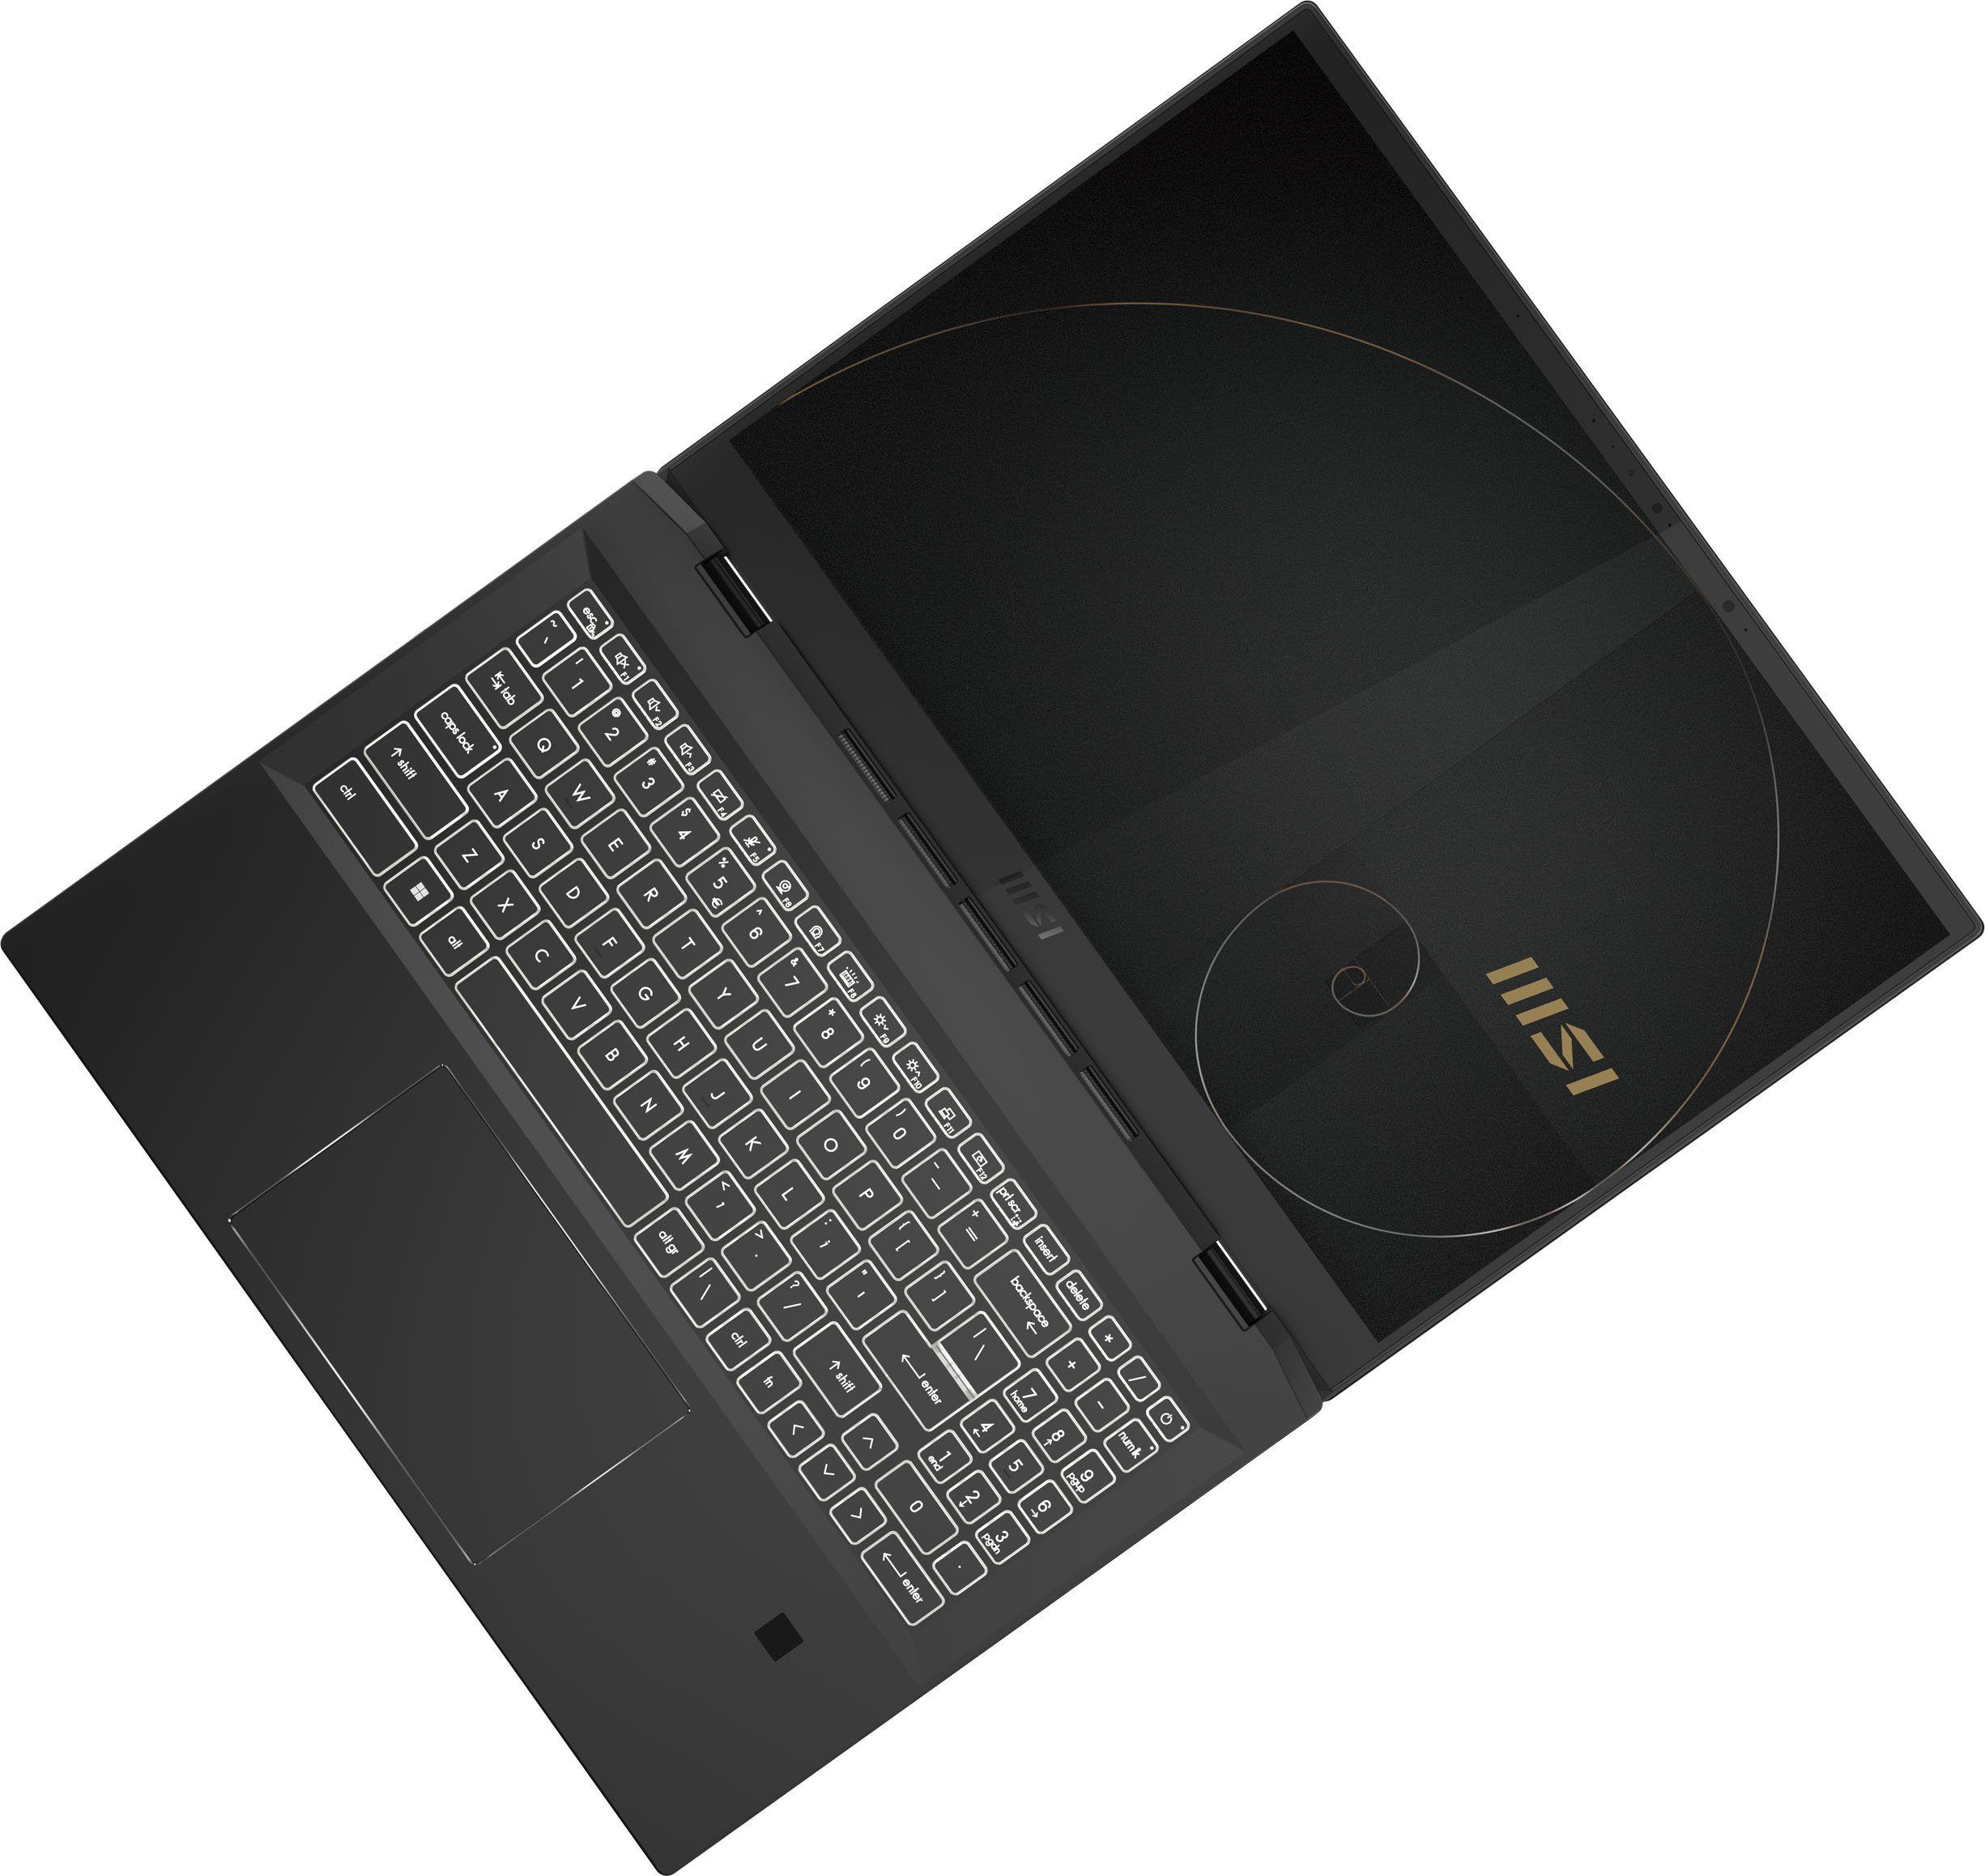
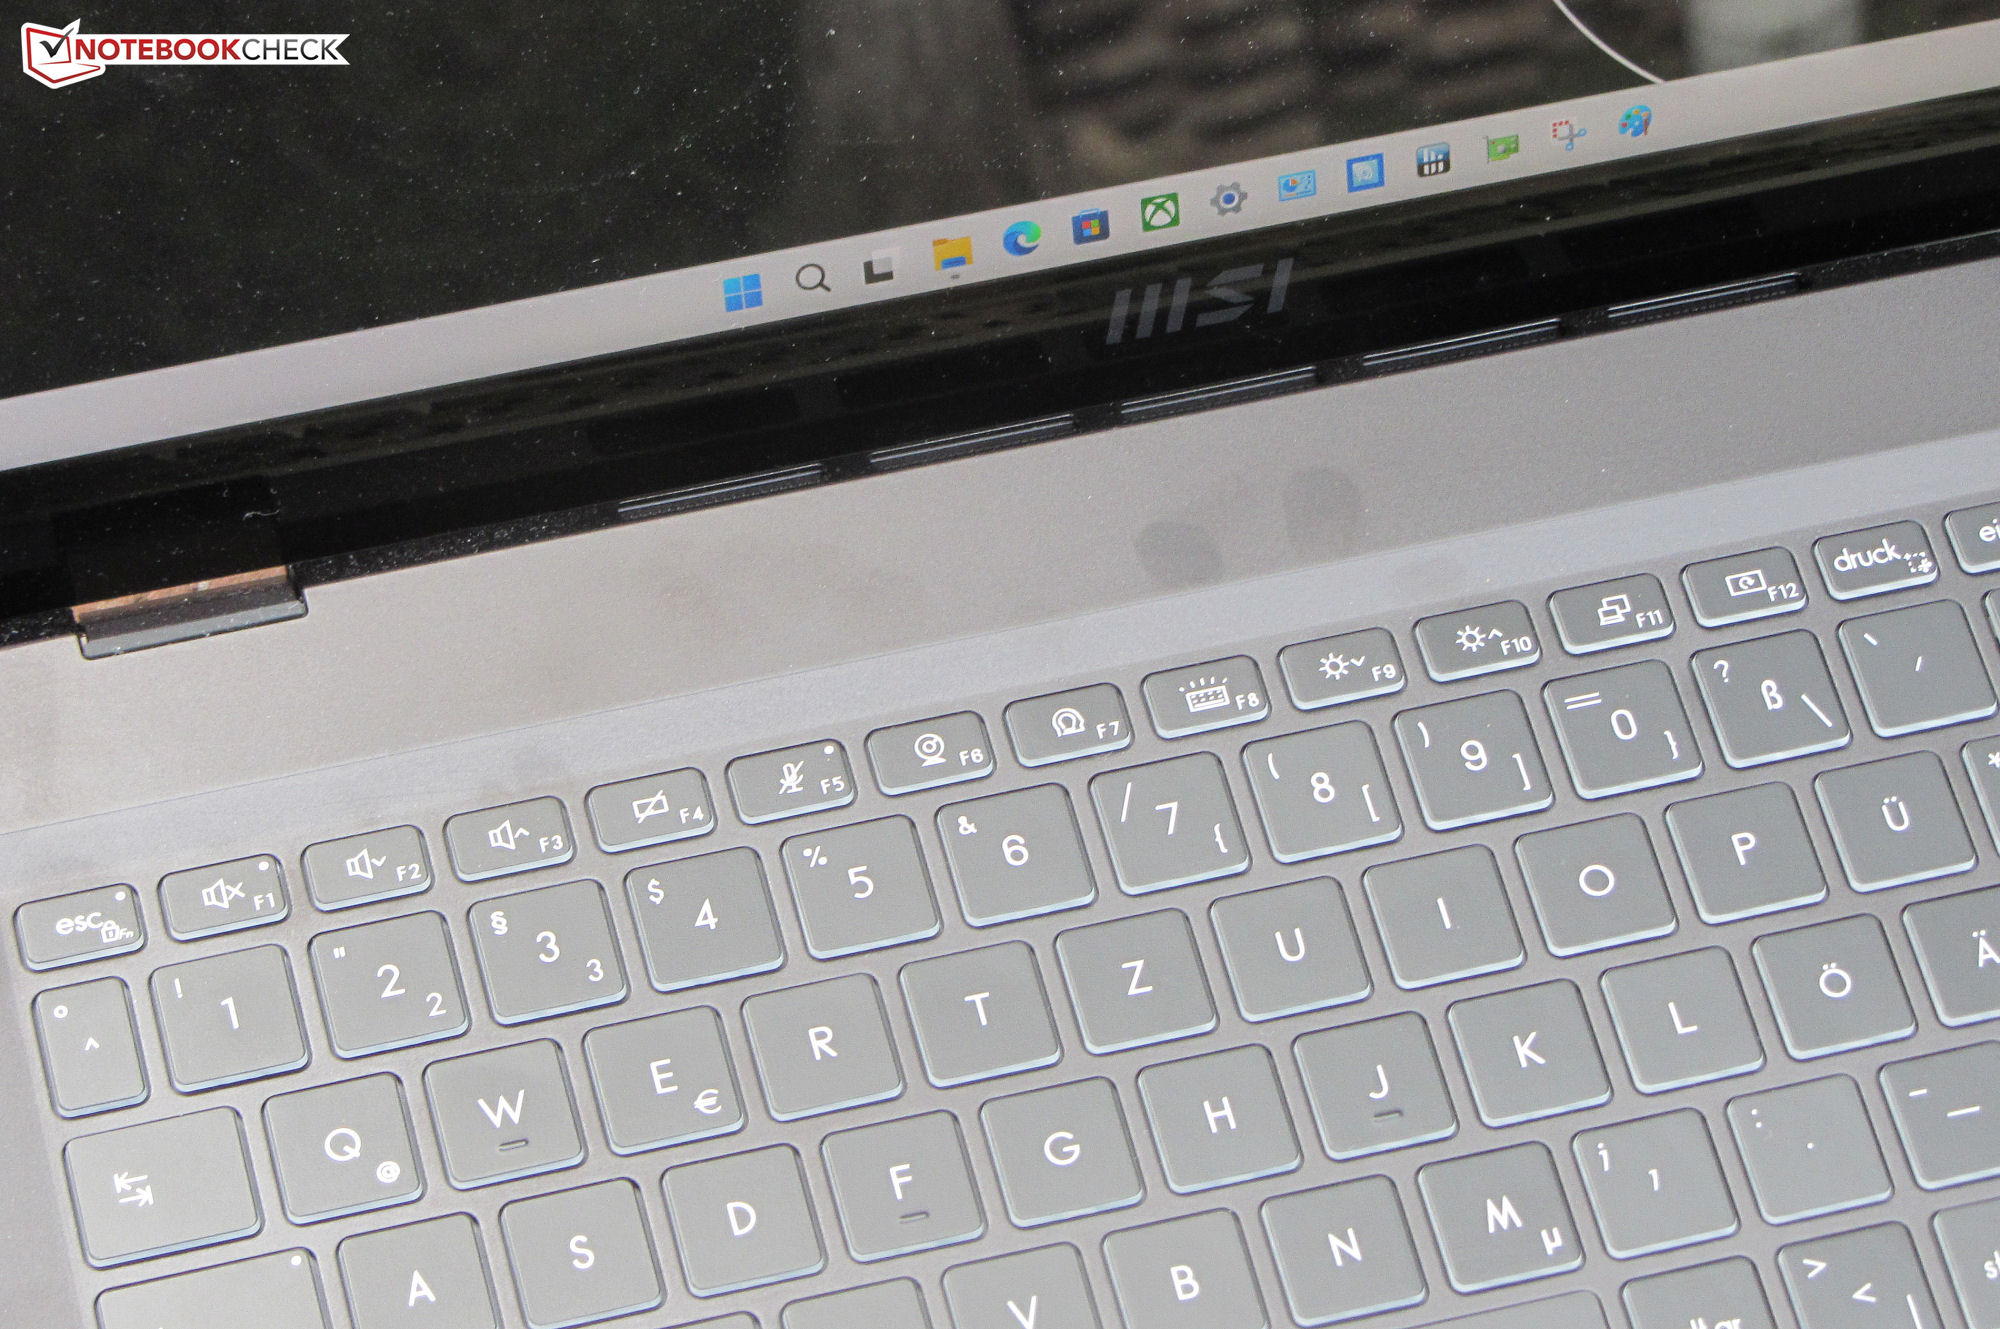
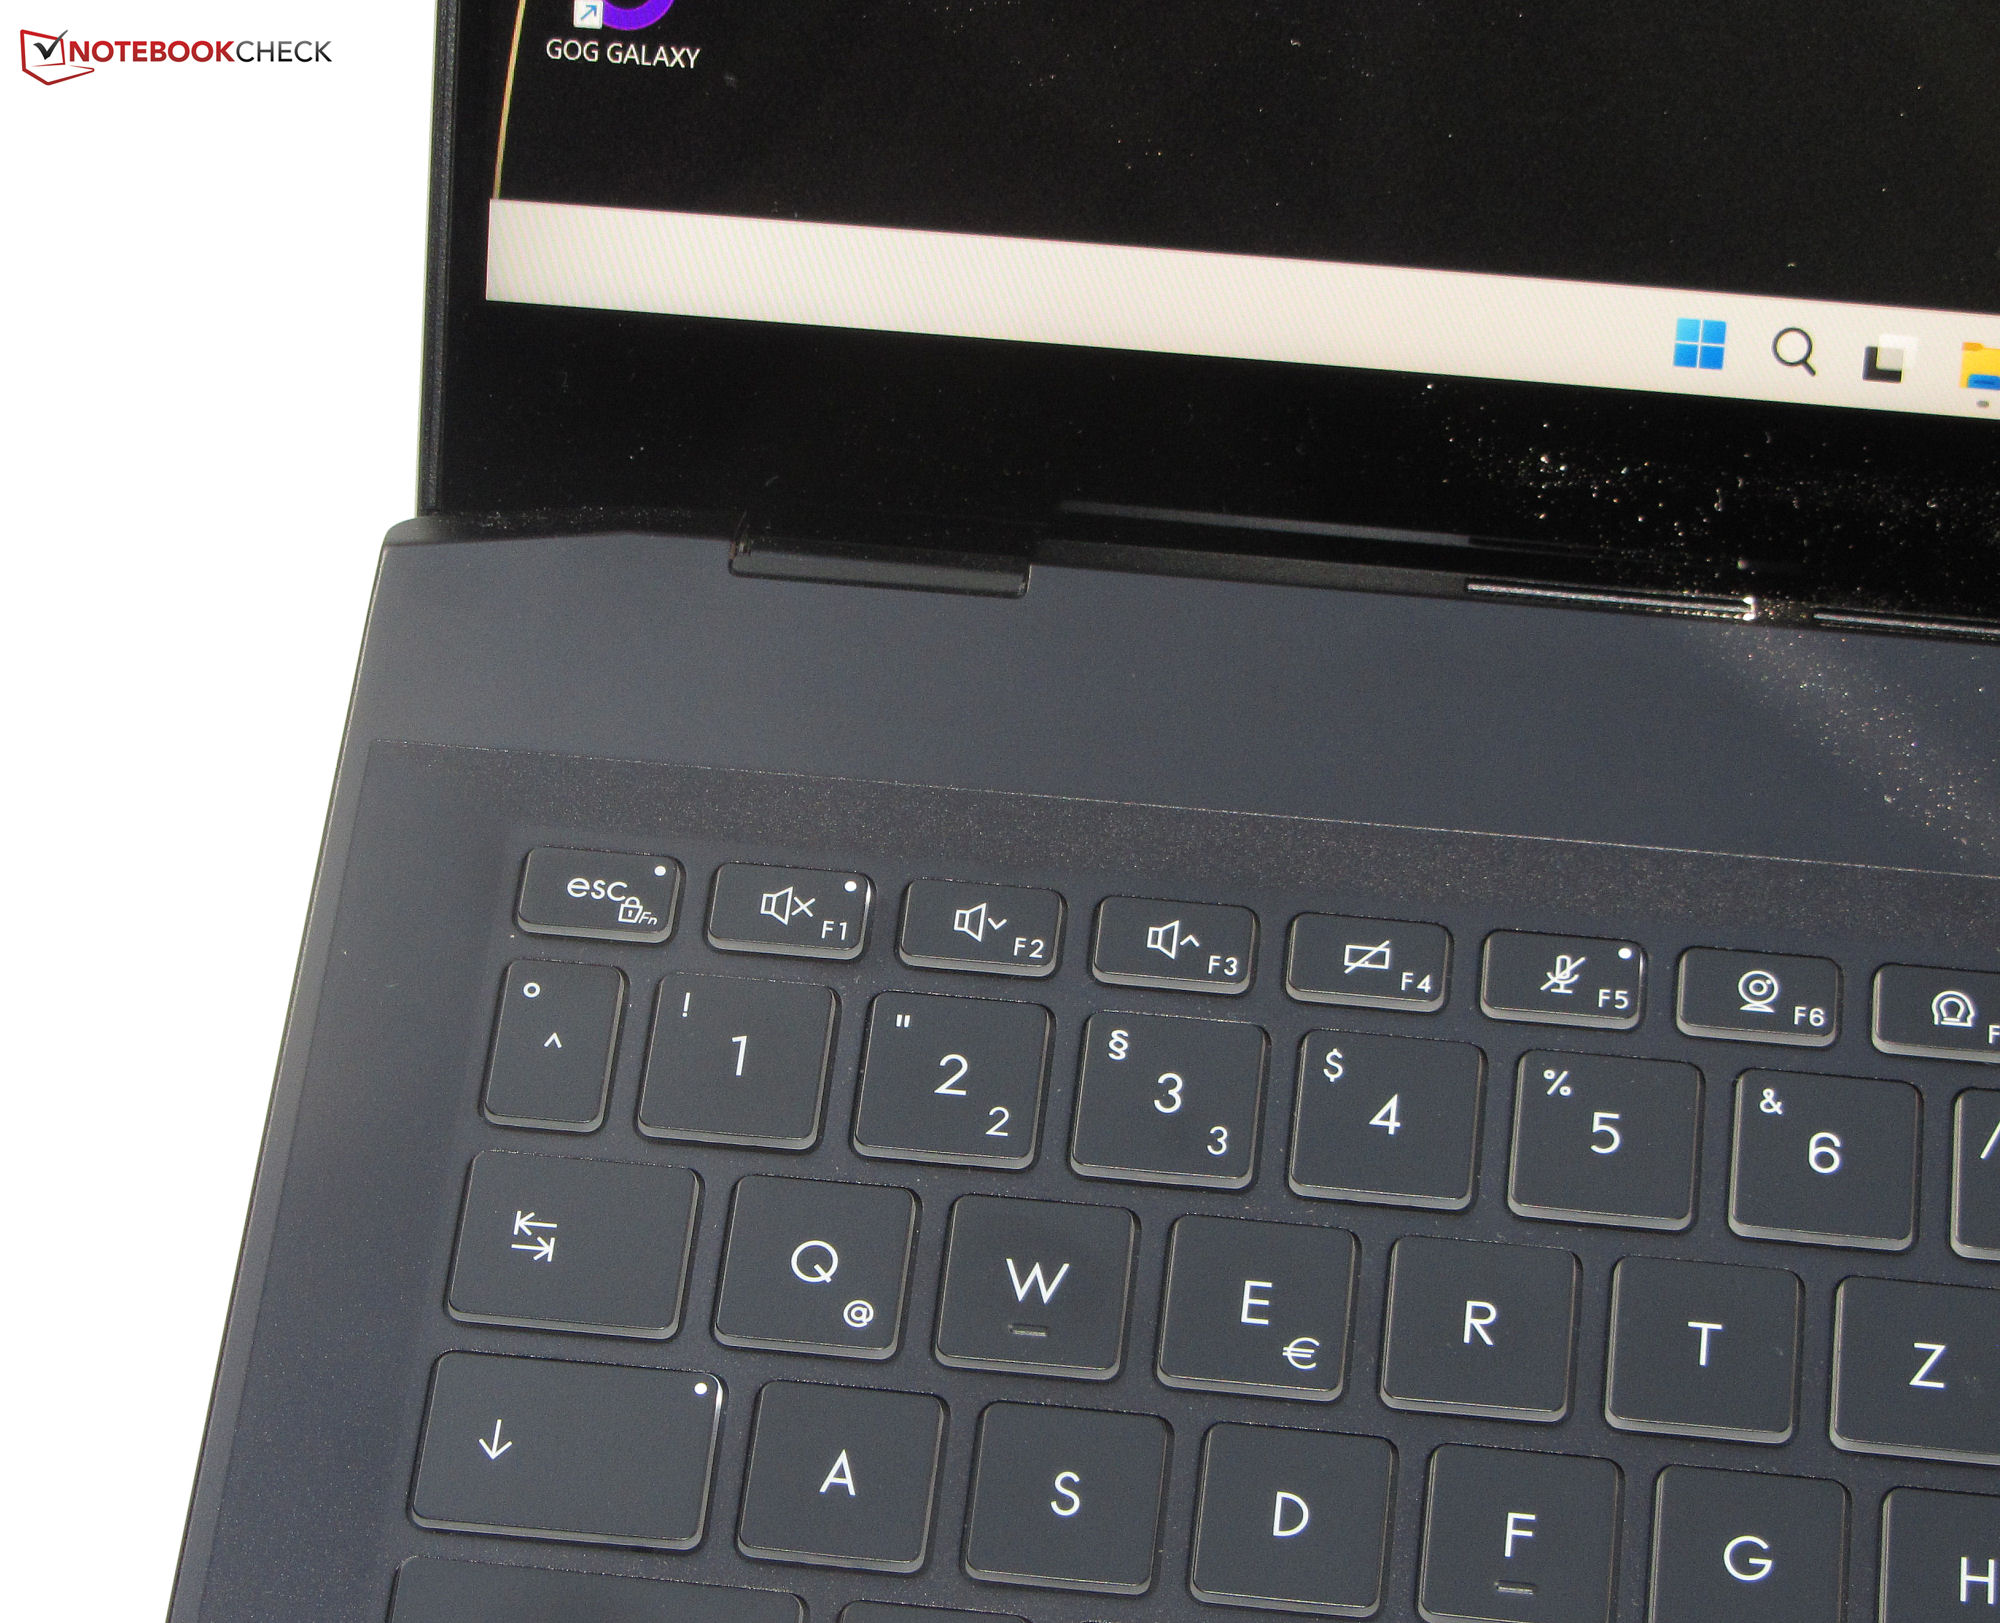
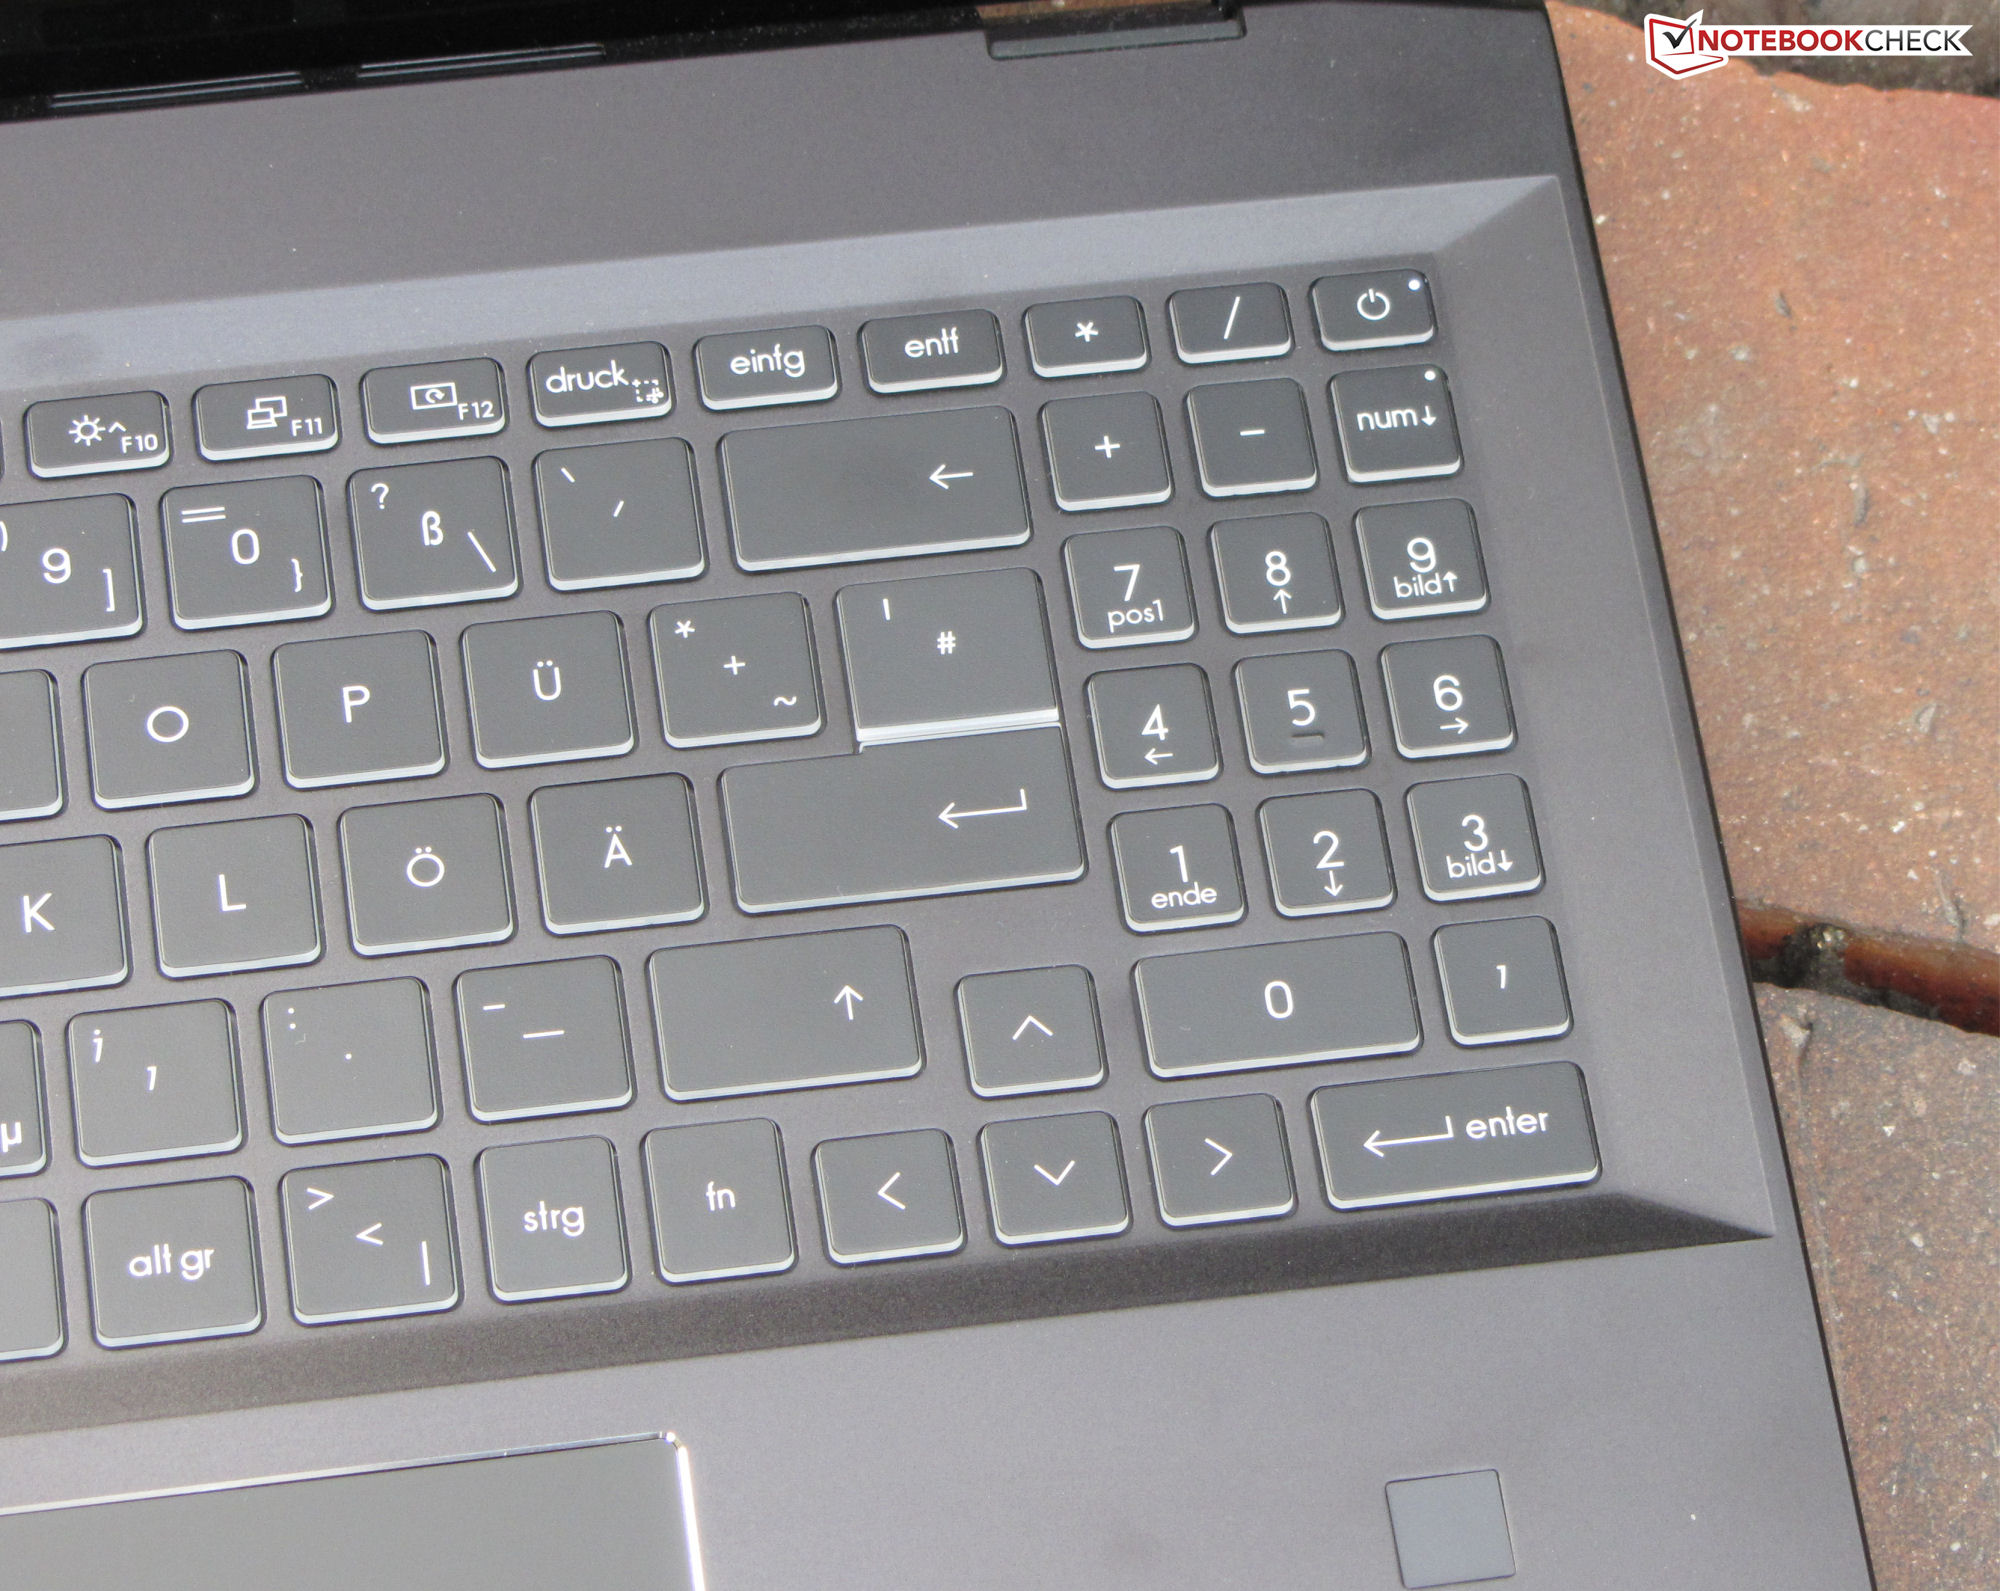
Dispositivos de entrada - El Summit 16 incluye un lápiz de entrada
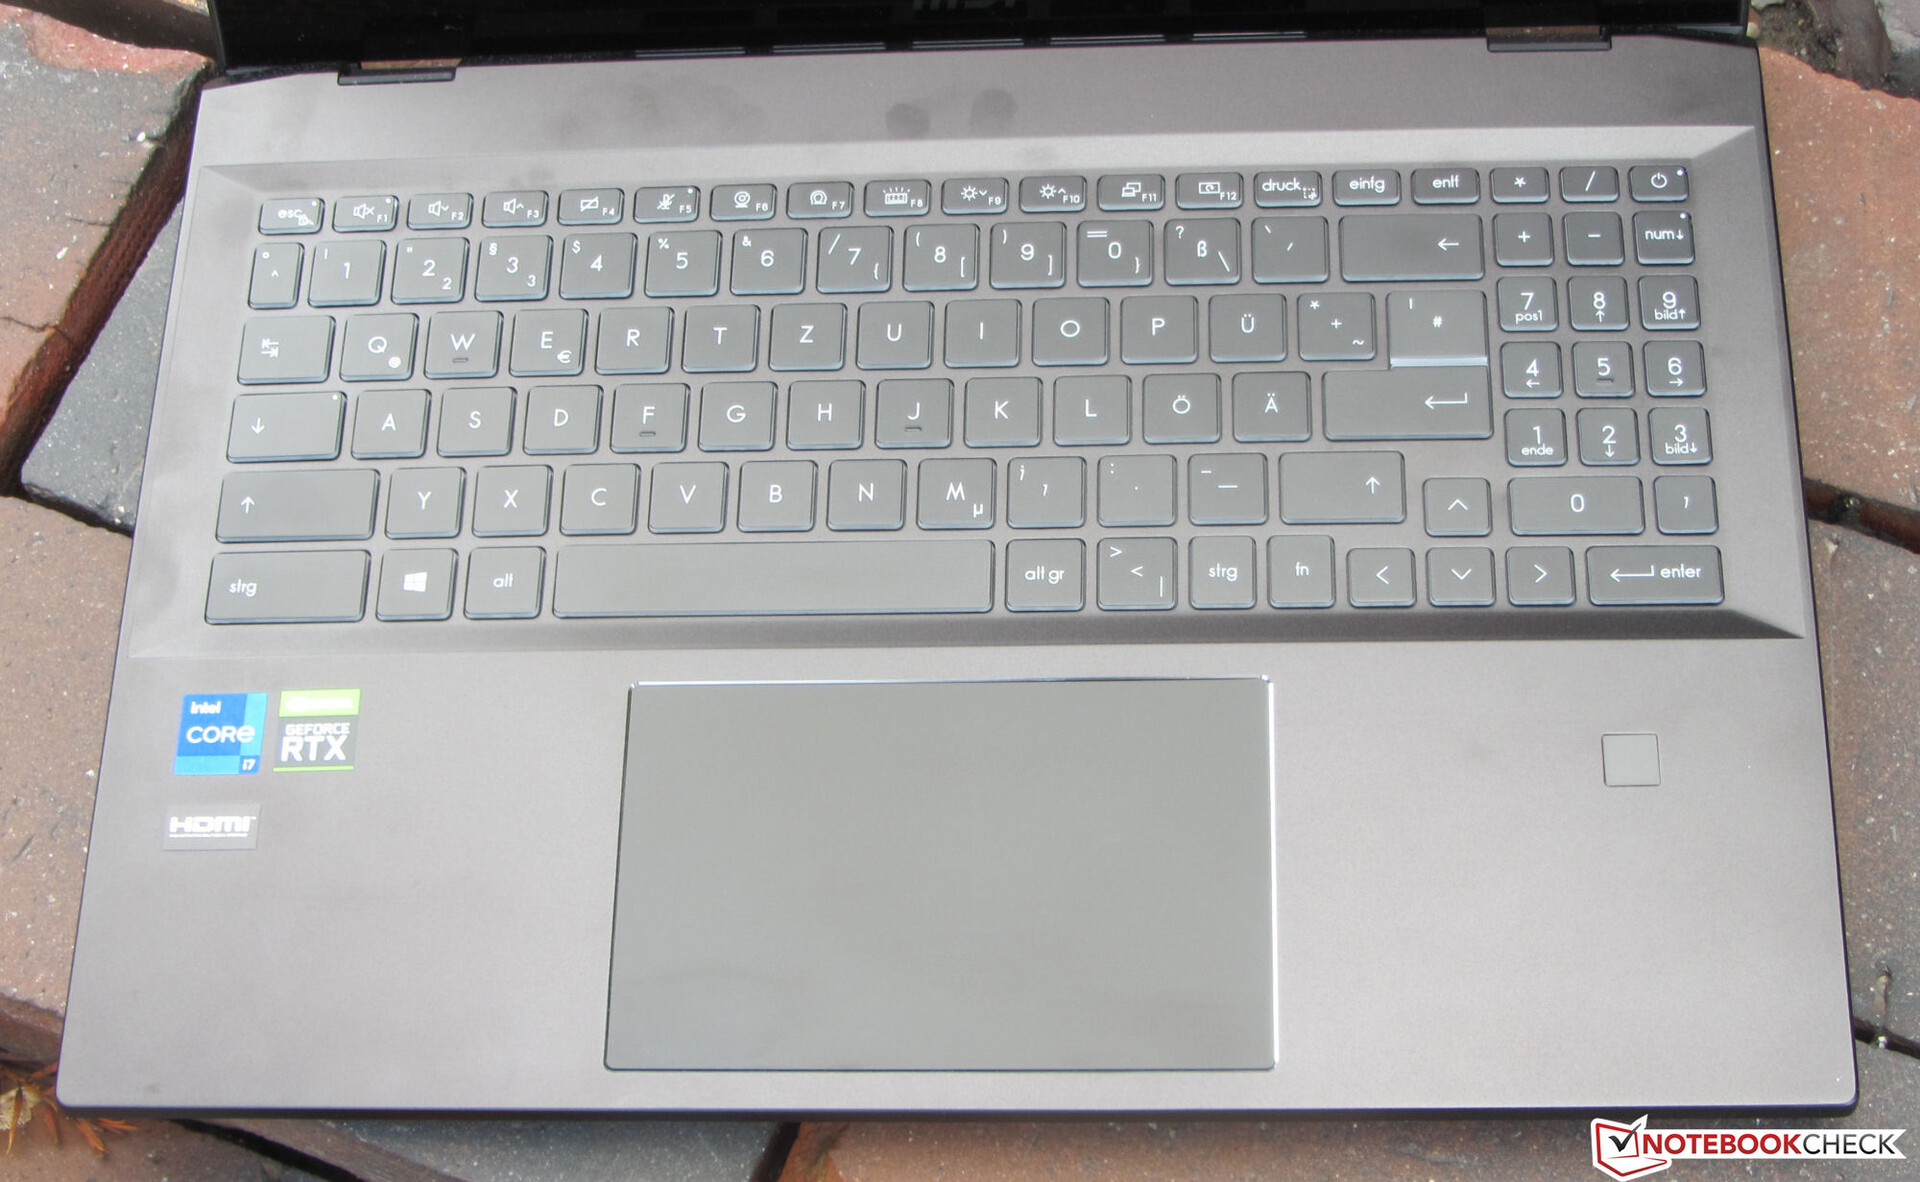
Las teclas planas y suaves del teclado chiclet (con iluminación de tres pasos) ofrecen un recorrido corto y un punto de presión claro. Nos gusta su resistencia. Mientras se escribe, el teclado tiene una mínima cesión como mucho, por lo que no creó ninguna molestia. En general, MSI ofrece aquí un teclado adecuado para las tareas cotidianas.
La suave superficie del ClickPad multitáctil (~13 x 8.2 cm, ~5.1 x 3.2 in) facilita el deslizamiento de los dedos. El ClickPad también responde a las entradas en las esquinas. Tiene un recorrido corto y un punto de presión claro.
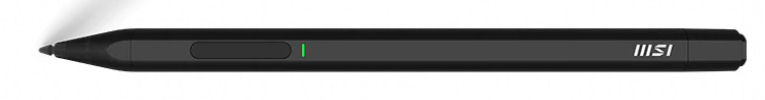
La pantalla táctil (10 puntos táctiles) se puede manejar con los dedos o con el lápiz de entrada MSI incluido (1P 14; MPP 2.0). Este último se siente bien en la mano, y la punta del lápiz se desliza fácilmente por la pantalla. El bolígrafo puede fijarse magnéticamente al lado izquierdo de la unidad base. La batería integrada se carga a través del cable USB-A a USB-C incluido. También se incluyen puntas de lápiz adicionales.
Pantalla - IPS onboard
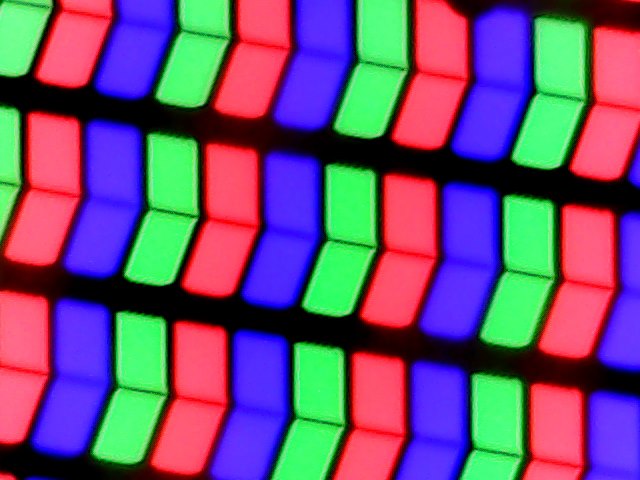
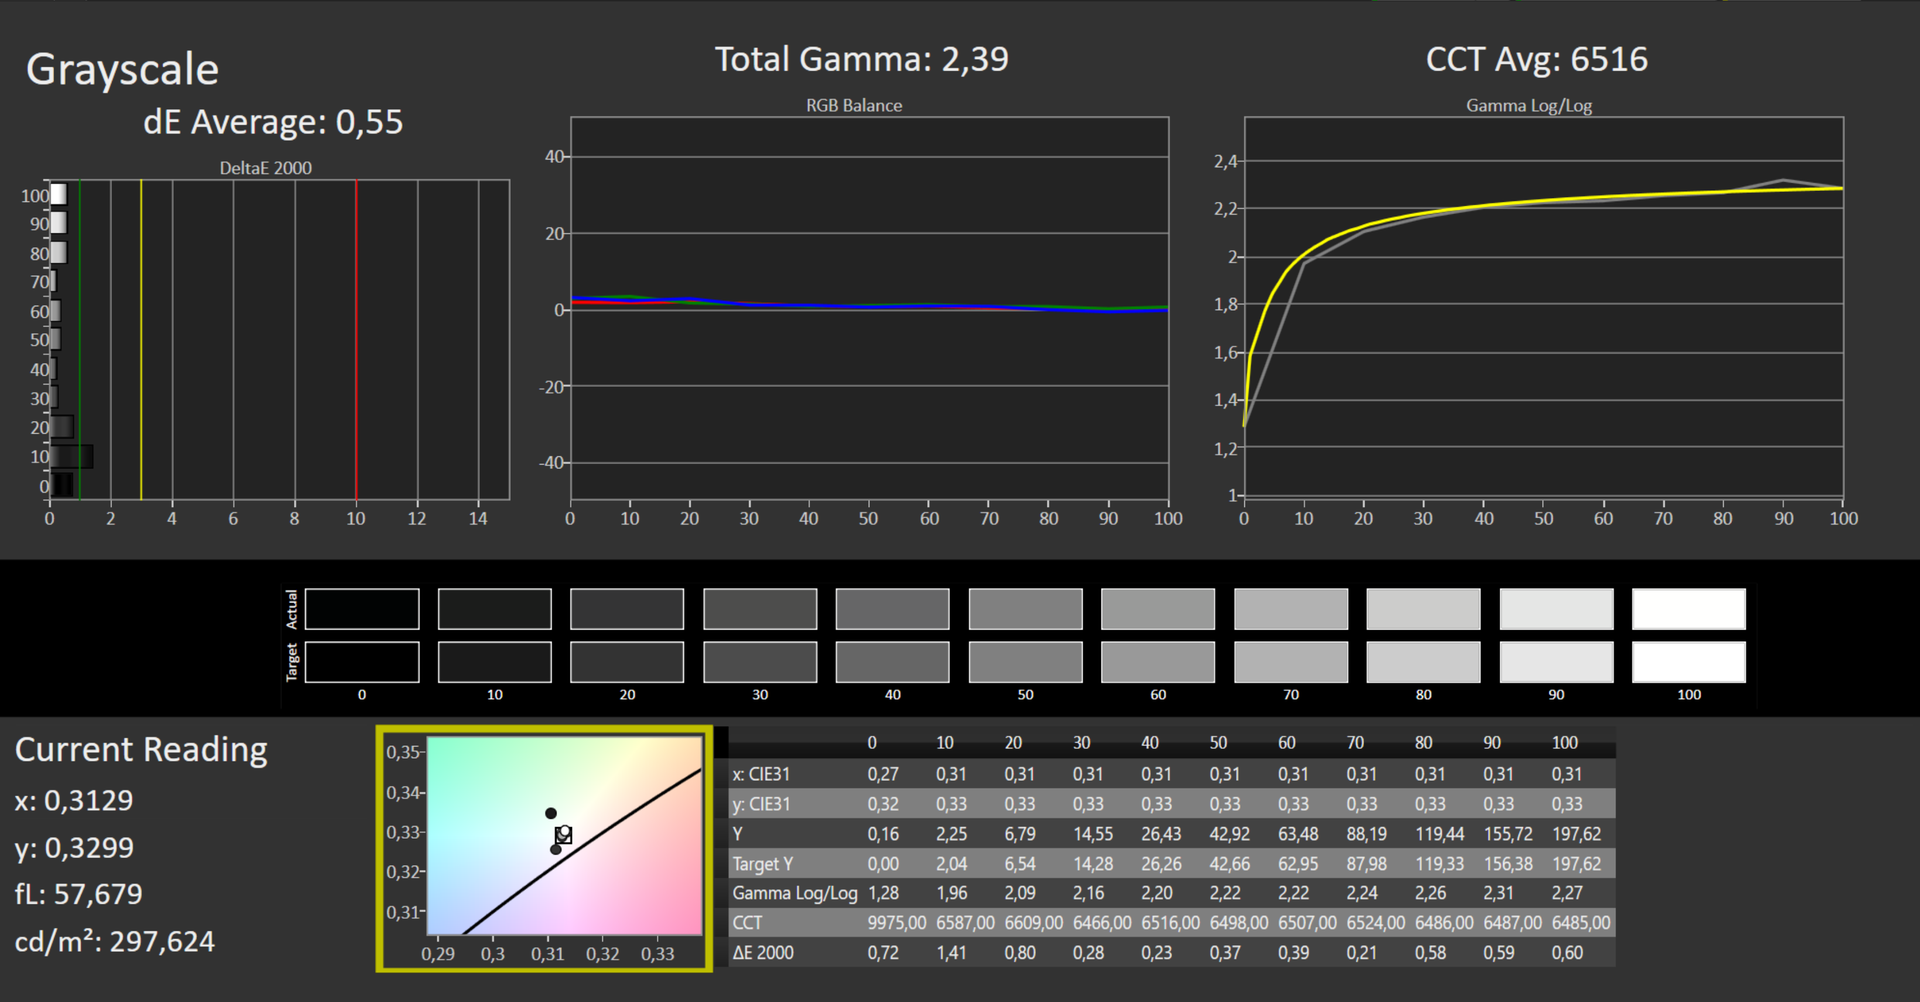
Mientras que el contraste de 1121:1 de la pantalla reflectante de 16 pulgadas (2560 x 1600 píxeles) cumple el objetivo (> 1000:1), el brillo máximo resulta un poco bajo con 294,3 cd/m². Consideramos buenos los valores por encima de 300 cd/m². El panel de 165 Hz ofrece tiempos de respuesta cortos. No notamos ningún parpadeo PWM.
| |||||||||||||||||||||||||
iluminación: 89 %
Brillo con batería: 314 cd/m²
Contraste: 1121:1 (Negro: 0.28 cd/m²)
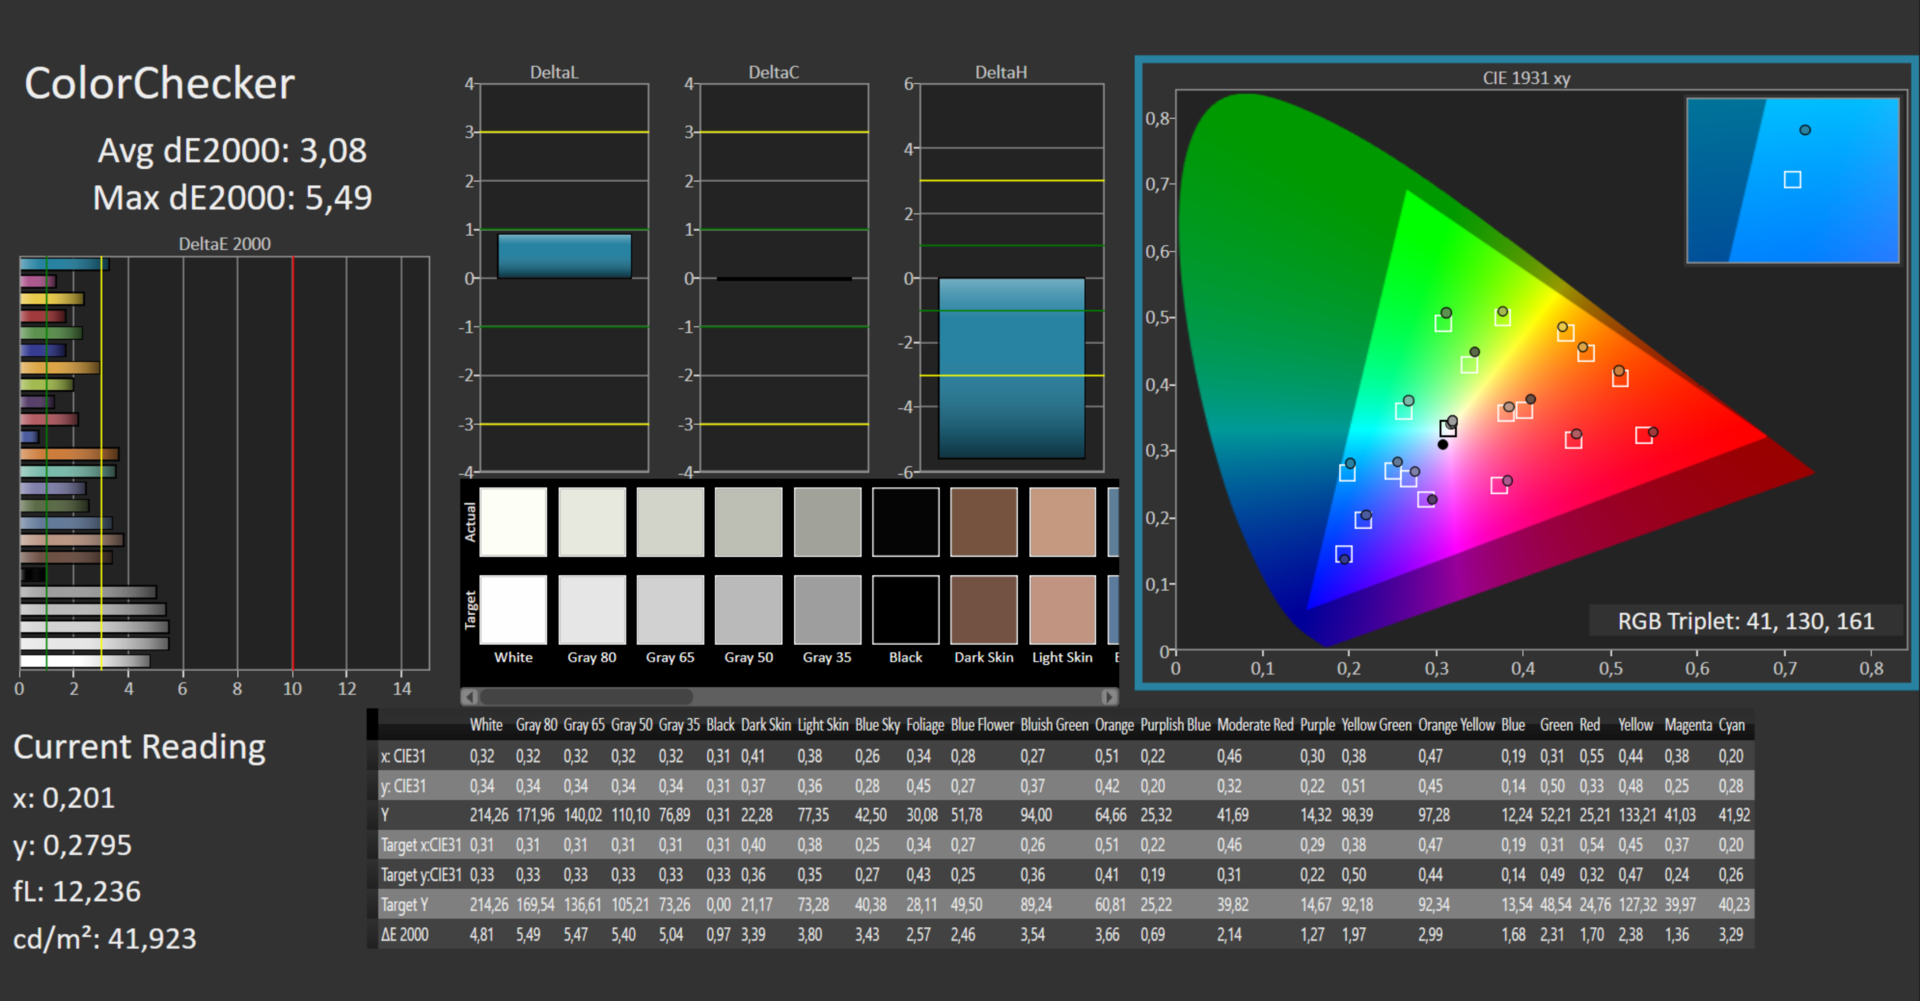
ΔE ColorChecker Calman: 3.08 | ∀{0.5-29.43 Ø4.71}
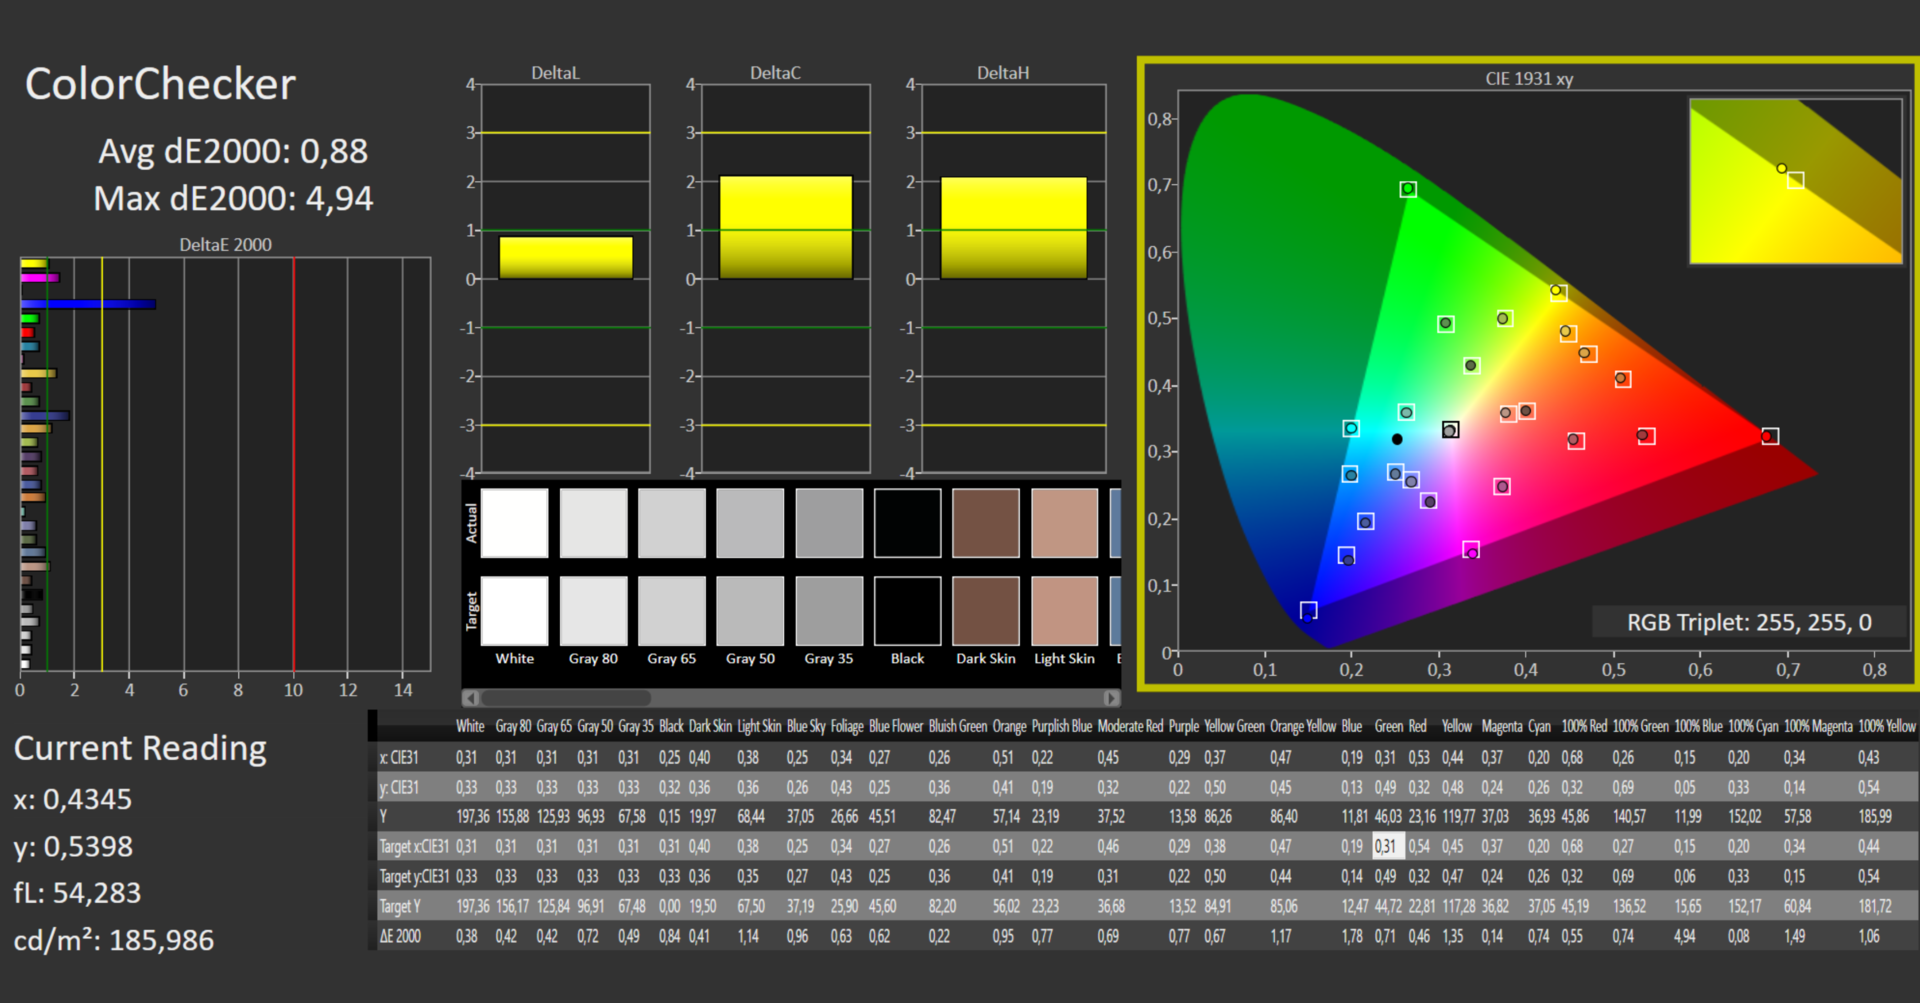
calibrated: 0.88
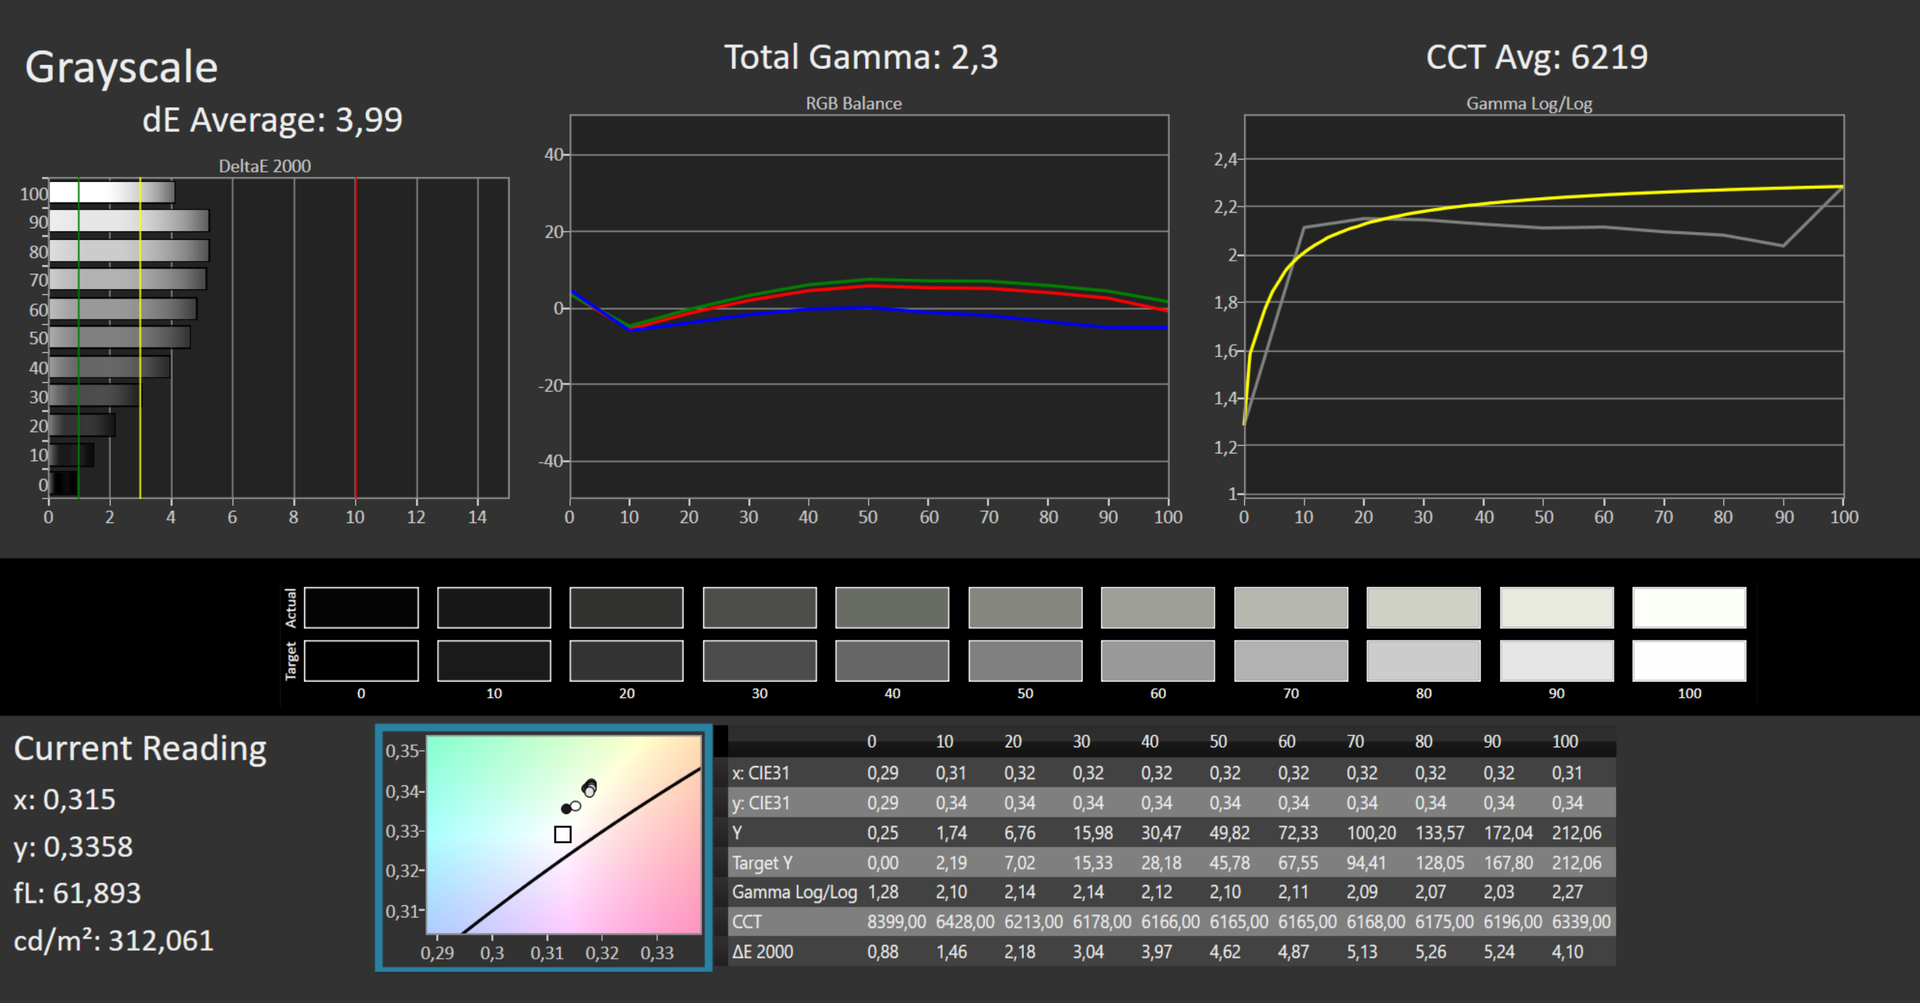
ΔE Greyscale Calman: 3.99 | ∀{0.09-98 Ø4.96}
86.5% AdobeRGB 1998 (Argyll 3D)
100% sRGB (Argyll 3D)
98.9% Display P3 (Argyll 3D)
Gamma: 2.3
CCT: 6219 K
| MSI Summit E16 Flip A12UDT-031 AU Optronics B16QAN02.N, IPS, 2560x1600, 16" | Asus ExpertBook B2 Flip B2502FBA-N80141X AU Optronics B156HAN02.1, IPS, 1920x1080, 15.6" | Samsung Galaxy Book Pro 360 15 NP950QDB-KC3DE SDC4159, OLED, 1920x1080, 15.6" | Dell Inspiron 16 7620 2-in-1 BOE NV16N45, IPS, 1920x1200, 16" | |
|---|---|---|---|---|
| Display | -54% | 5% | -19% | |
| Display P3 Coverage (%) | 98.9 | 37.2 -62% | 99.9 1% | 67 -32% |
| sRGB Coverage (%) | 100 | 55.8 -44% | 100 0% | 95.9 -4% |
| AdobeRGB 1998 Coverage (%) | 86.5 | 38.4 -56% | 97.6 13% | 69.3 -20% |
| Response Times | -101% | 82% | -139% | |
| Response Time Grey 50% / Grey 80% * (ms) | 13 ? | 32 ? -146% | 2 ? 85% | 32 ? -146% |
| Response Time Black / White * (ms) | 9 ? | 14 ? -56% | 2 ? 78% | 20.8 ? -131% |
| PWM Frequency (Hz) | 60 | |||
| Screen | -68% | 48% | -20% | |
| Brightness middle (cd/m²) | 314 | 239 -24% | 290 -8% | 320.7 2% |
| Brightness (cd/m²) | 294 | 221 -25% | 290 -1% | 309 5% |
| Brightness Distribution (%) | 89 | 89 0% | 99 11% | 90 1% |
| Black Level * (cd/m²) | 0.28 | 0.51 -82% | 0.05 82% | 0.36 -29% |
| Contrast (:1) | 1121 | 469 -58% | 5800 417% | 891 -21% |
| Colorchecker dE 2000 * | 3.08 | 5.66 -84% | 1.84 40% | 4.18 -36% |
| Colorchecker dE 2000 max. * | 5.49 | 20.35 -271% | 3.83 30% | 8.48 -54% |
| Colorchecker dE 2000 calibrated * | 0.88 | 2.69 -206% | 0.77 12% | |
| Greyscale dE 2000 * | 3.99 | 3.89 3% | 1.24 69% | 6.3 -58% |
| Gamma | 2.3 96% | 2.43 91% | 2.2 100% | 2.21 100% |
| CCT | 6219 105% | 6183 105% | 6686 97% | 6258 104% |
| Media total (Programa/Opciones) | -74% /
-70% | 45% /
44% | -59% /
-37% |
* ... más pequeño es mejor
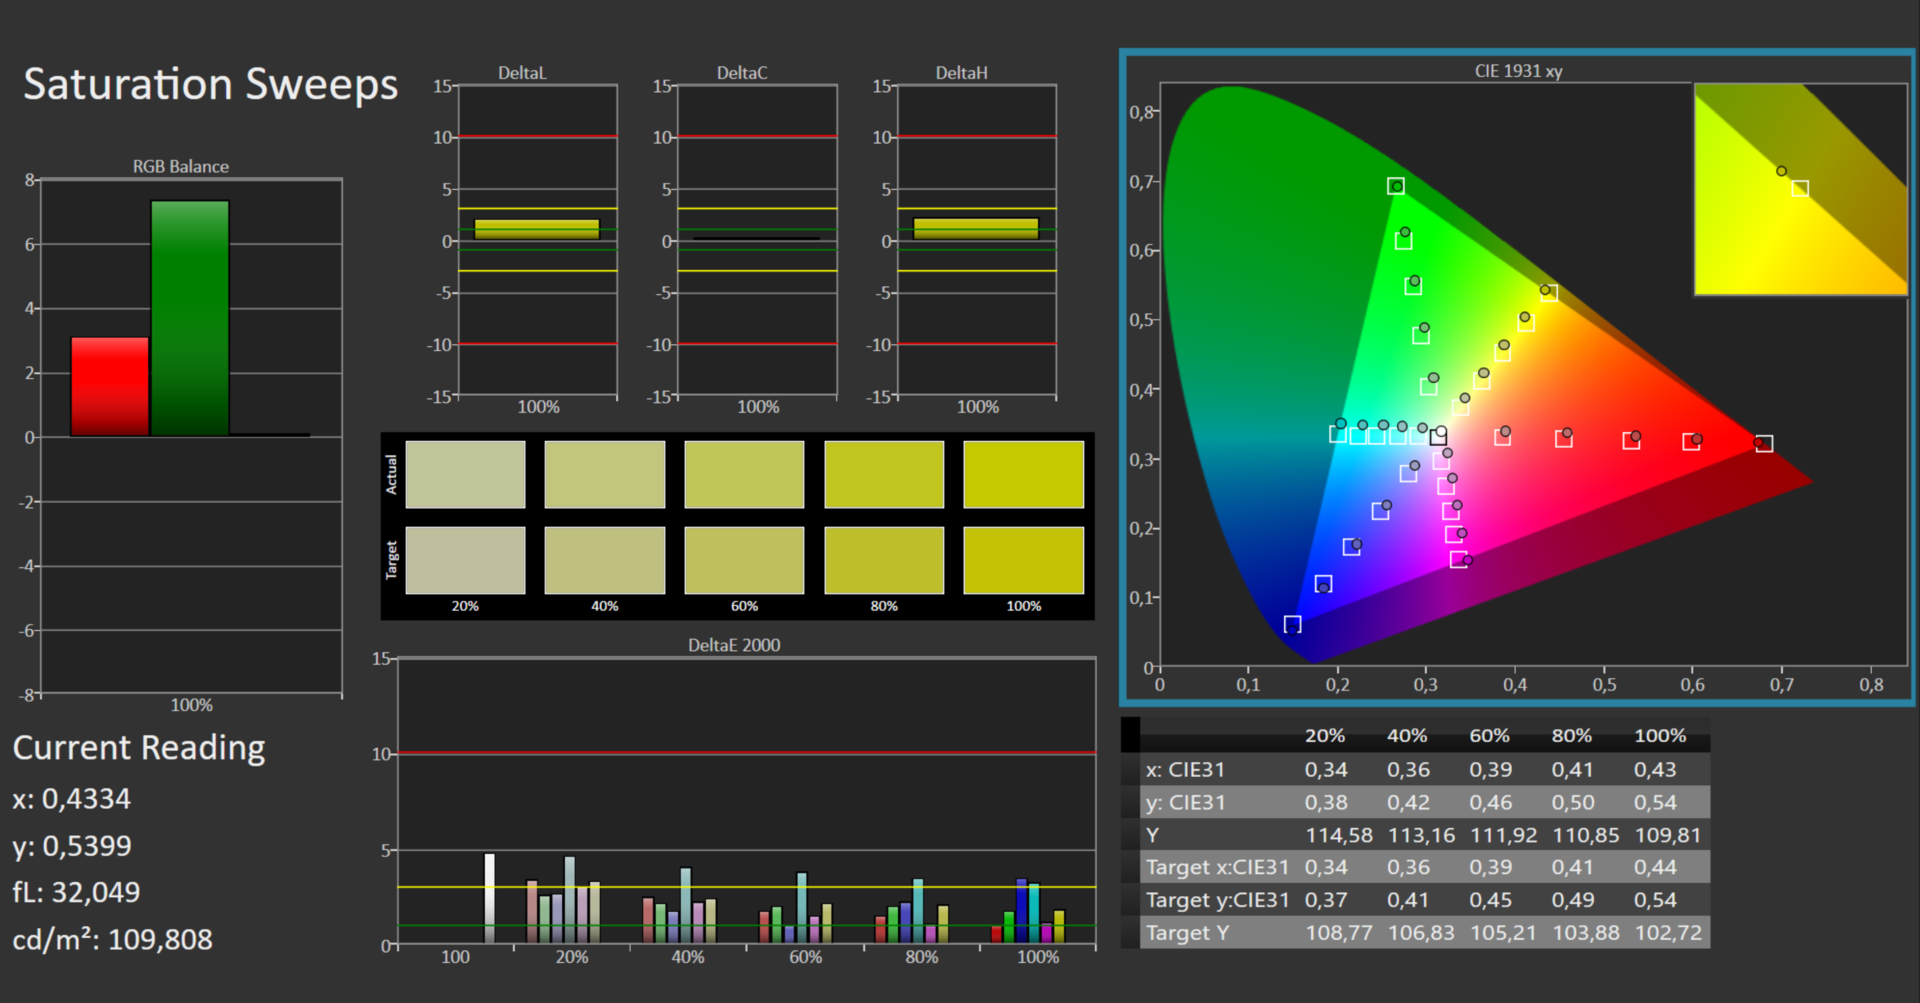
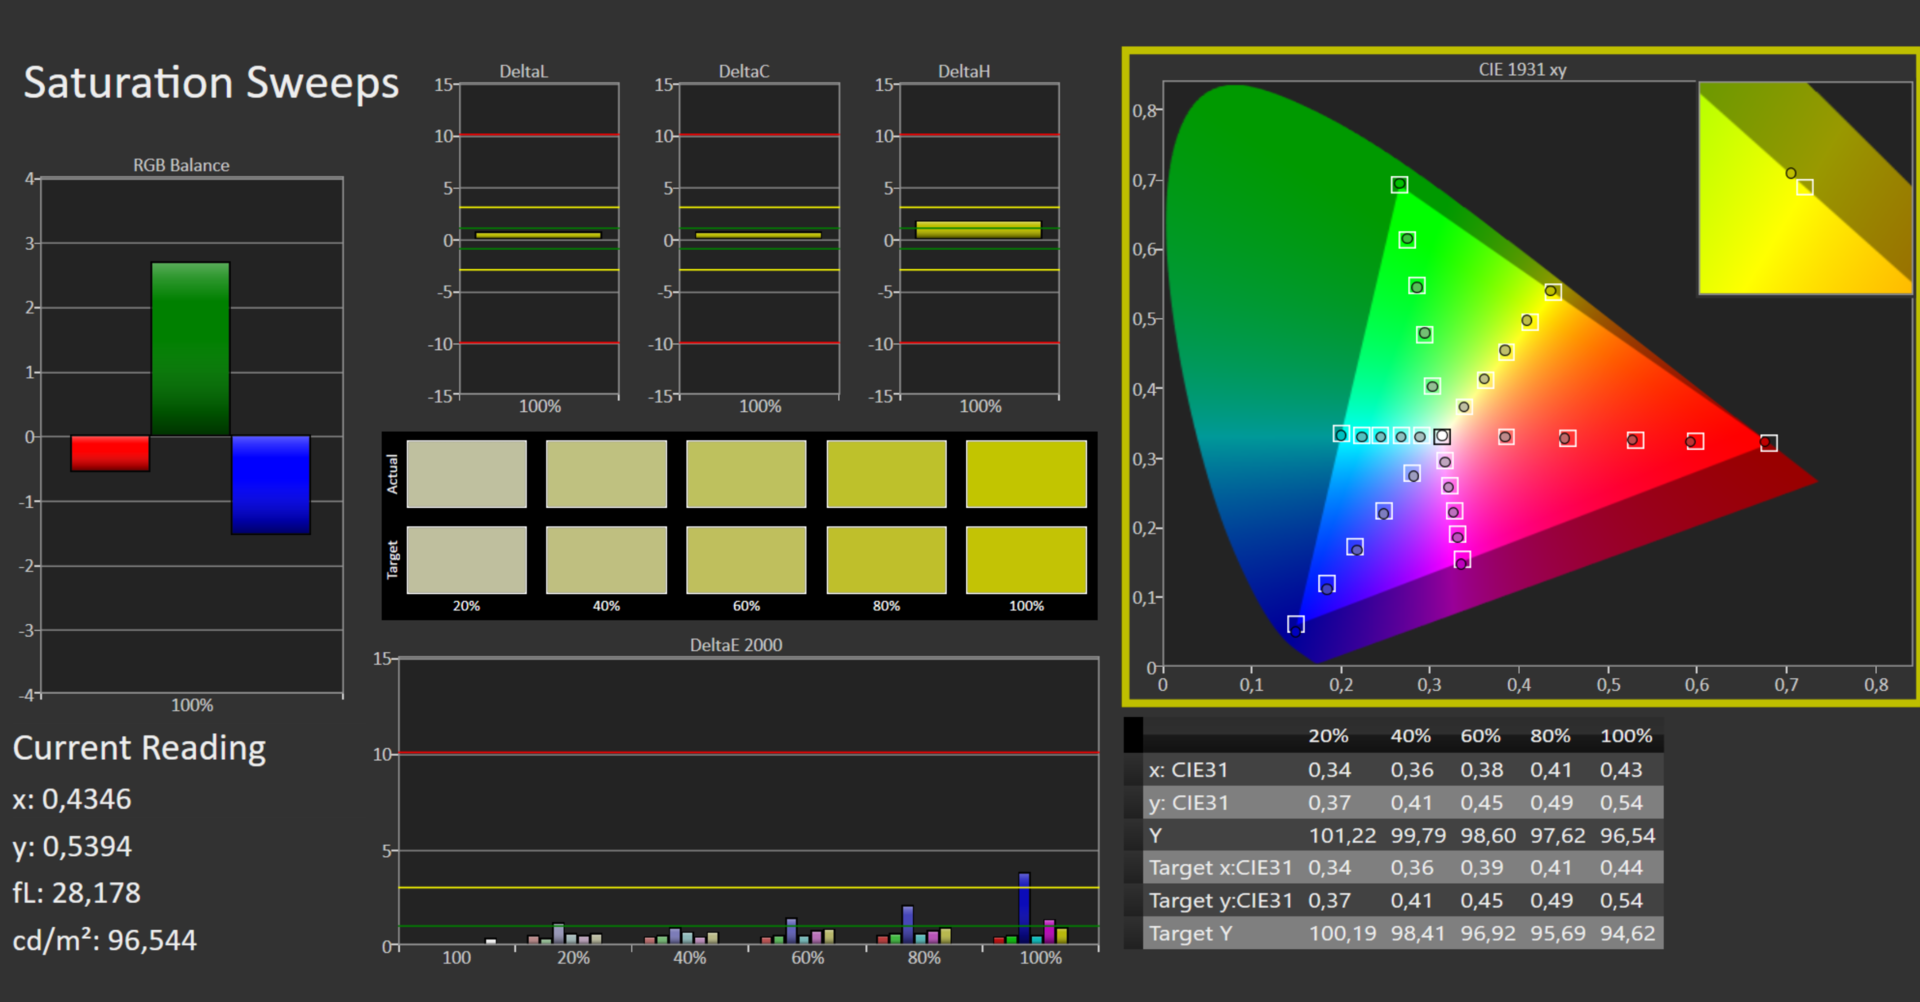
En el estado de entrega, la pantalla muestra los colores con mucha precisión. Con un valor de 3,08, la desviación del color apenas alcanza el objetivo de DeltaE < 3. Una calibración reduce la desviación a 0,88 y garantiza una visualización más equilibrada de la escala de grises. El espacio de color sRGB se reproduce por completo, el espacio de color DCI P3 casi por completo y el espacio de color Adobe RGB al 87%.
Puedes descargar y utilizar el perfil de color que hemos creado de forma gratuita. El enlace está en el cuadro de información de la pantalla
Tiempos de respuesta del display
| ↔ Tiempo de respuesta de Negro a Blanco | ||
|---|---|---|
| 9 ms ... subida ↗ y bajada ↘ combinada | ↗ 5 ms subida |  |
| ↘ 4 ms bajada | ||
| La pantalla mostró tiempos de respuesta rápidos en nuestros tests y debería ser adecuada para juegos. En comparación, todos los dispositivos de prueba van de ##min### (mínimo) a 240 (máximo) ms. » 25 % de todos los dispositivos son mejores. Esto quiere decir que el tiempo de respuesta medido es mejor que la media (19.8 ms) de todos los dispositivos testados. | ||
| ↔ Tiempo de respuesta 50% Gris a 80% Gris | ||
| 13 ms ... subida ↗ y bajada ↘ combinada | ↗ 6 ms subida |  |
| ↘ 7 ms bajada | ||
| La pantalla mostró buenos tiempos de respuesta en nuestros tests pero podría ser demasiado lenta para los jugones competitivos. En comparación, todos los dispositivos de prueba van de ##min### (mínimo) a 636 (máximo) ms. » 27 % de todos los dispositivos son mejores. Esto quiere decir que el tiempo de respuesta medido es mejor que la media (31 ms) de todos los dispositivos testados. | ||
Parpadeo de Pantalla / PWM (Pulse-Width Modulation)
| Parpadeo de Pantalla / PWM no detectado |  | ||
Comparación: 52 % de todos los dispositivos testados no usaron PWM para atenuar el display. Si se usó, medimos una media de 7757 (mínimo: 5 - máxmo: 343500) Hz. | |||
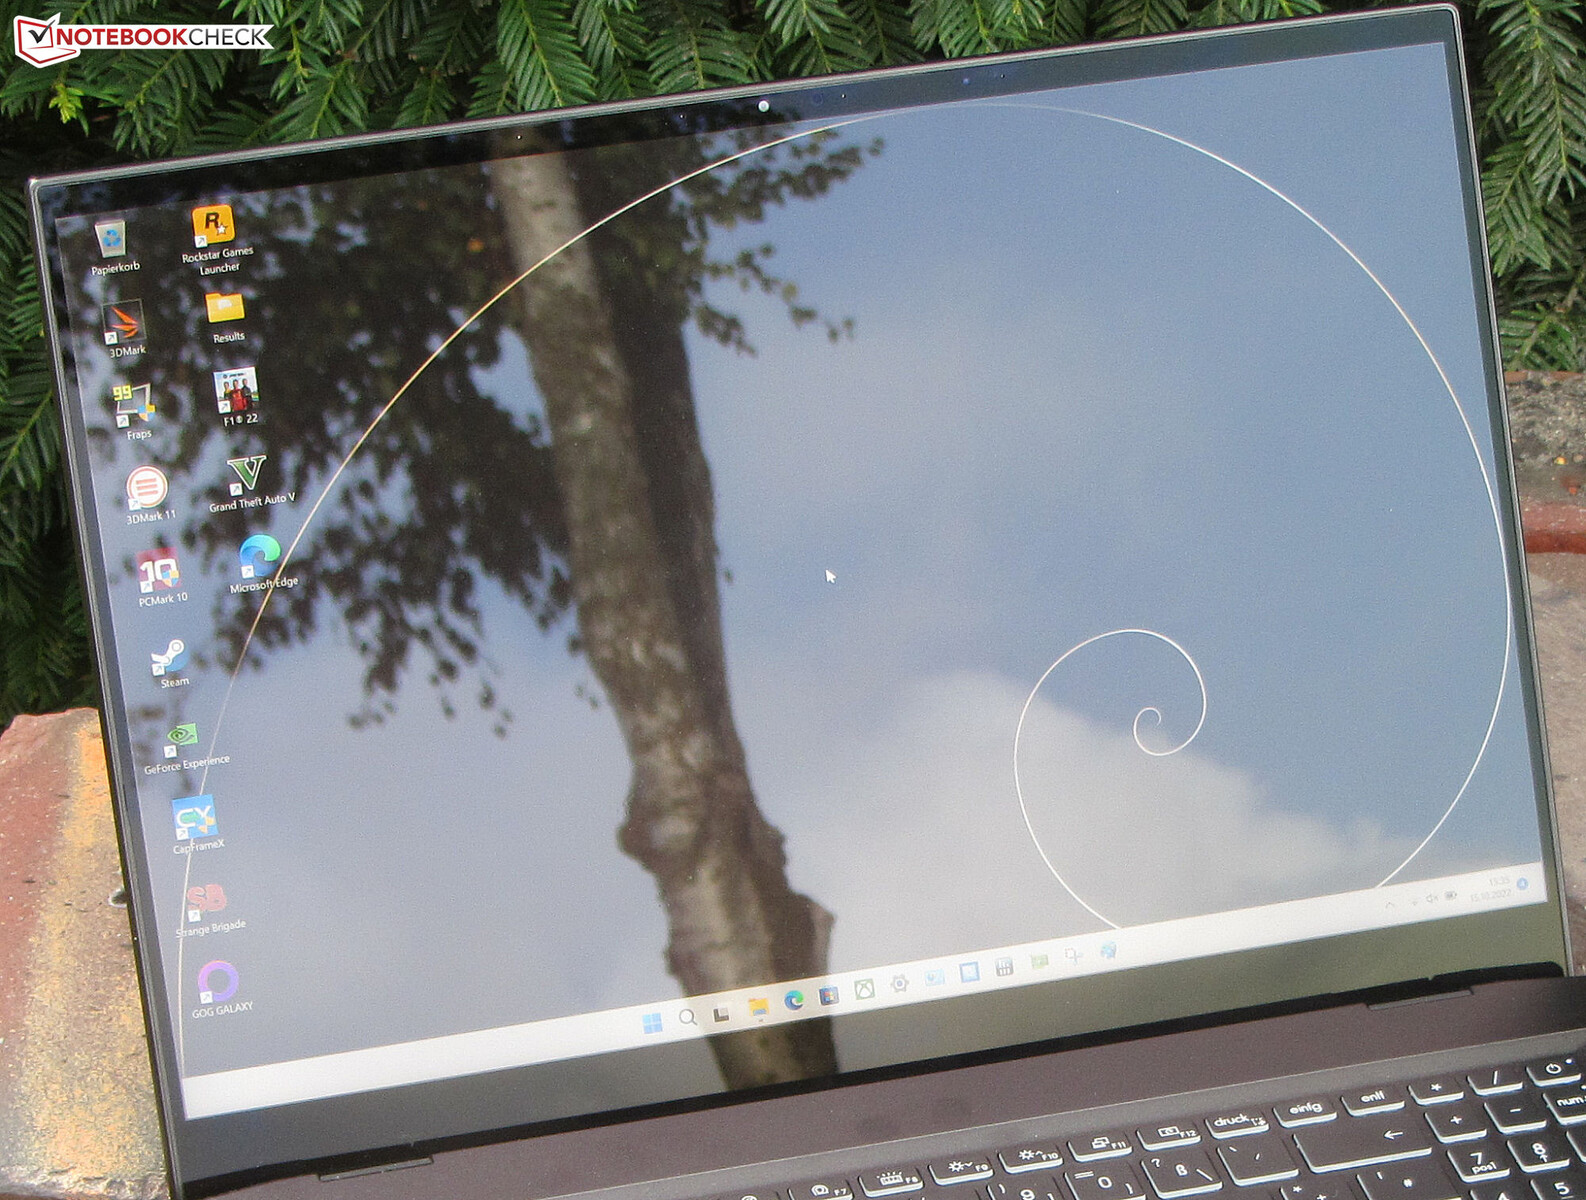
Los ángulos de visión del panel IPS son estables y se puede leer desde cualquier posición. En exteriores, la superficie reflectante de la pantalla dificulta su lectura.
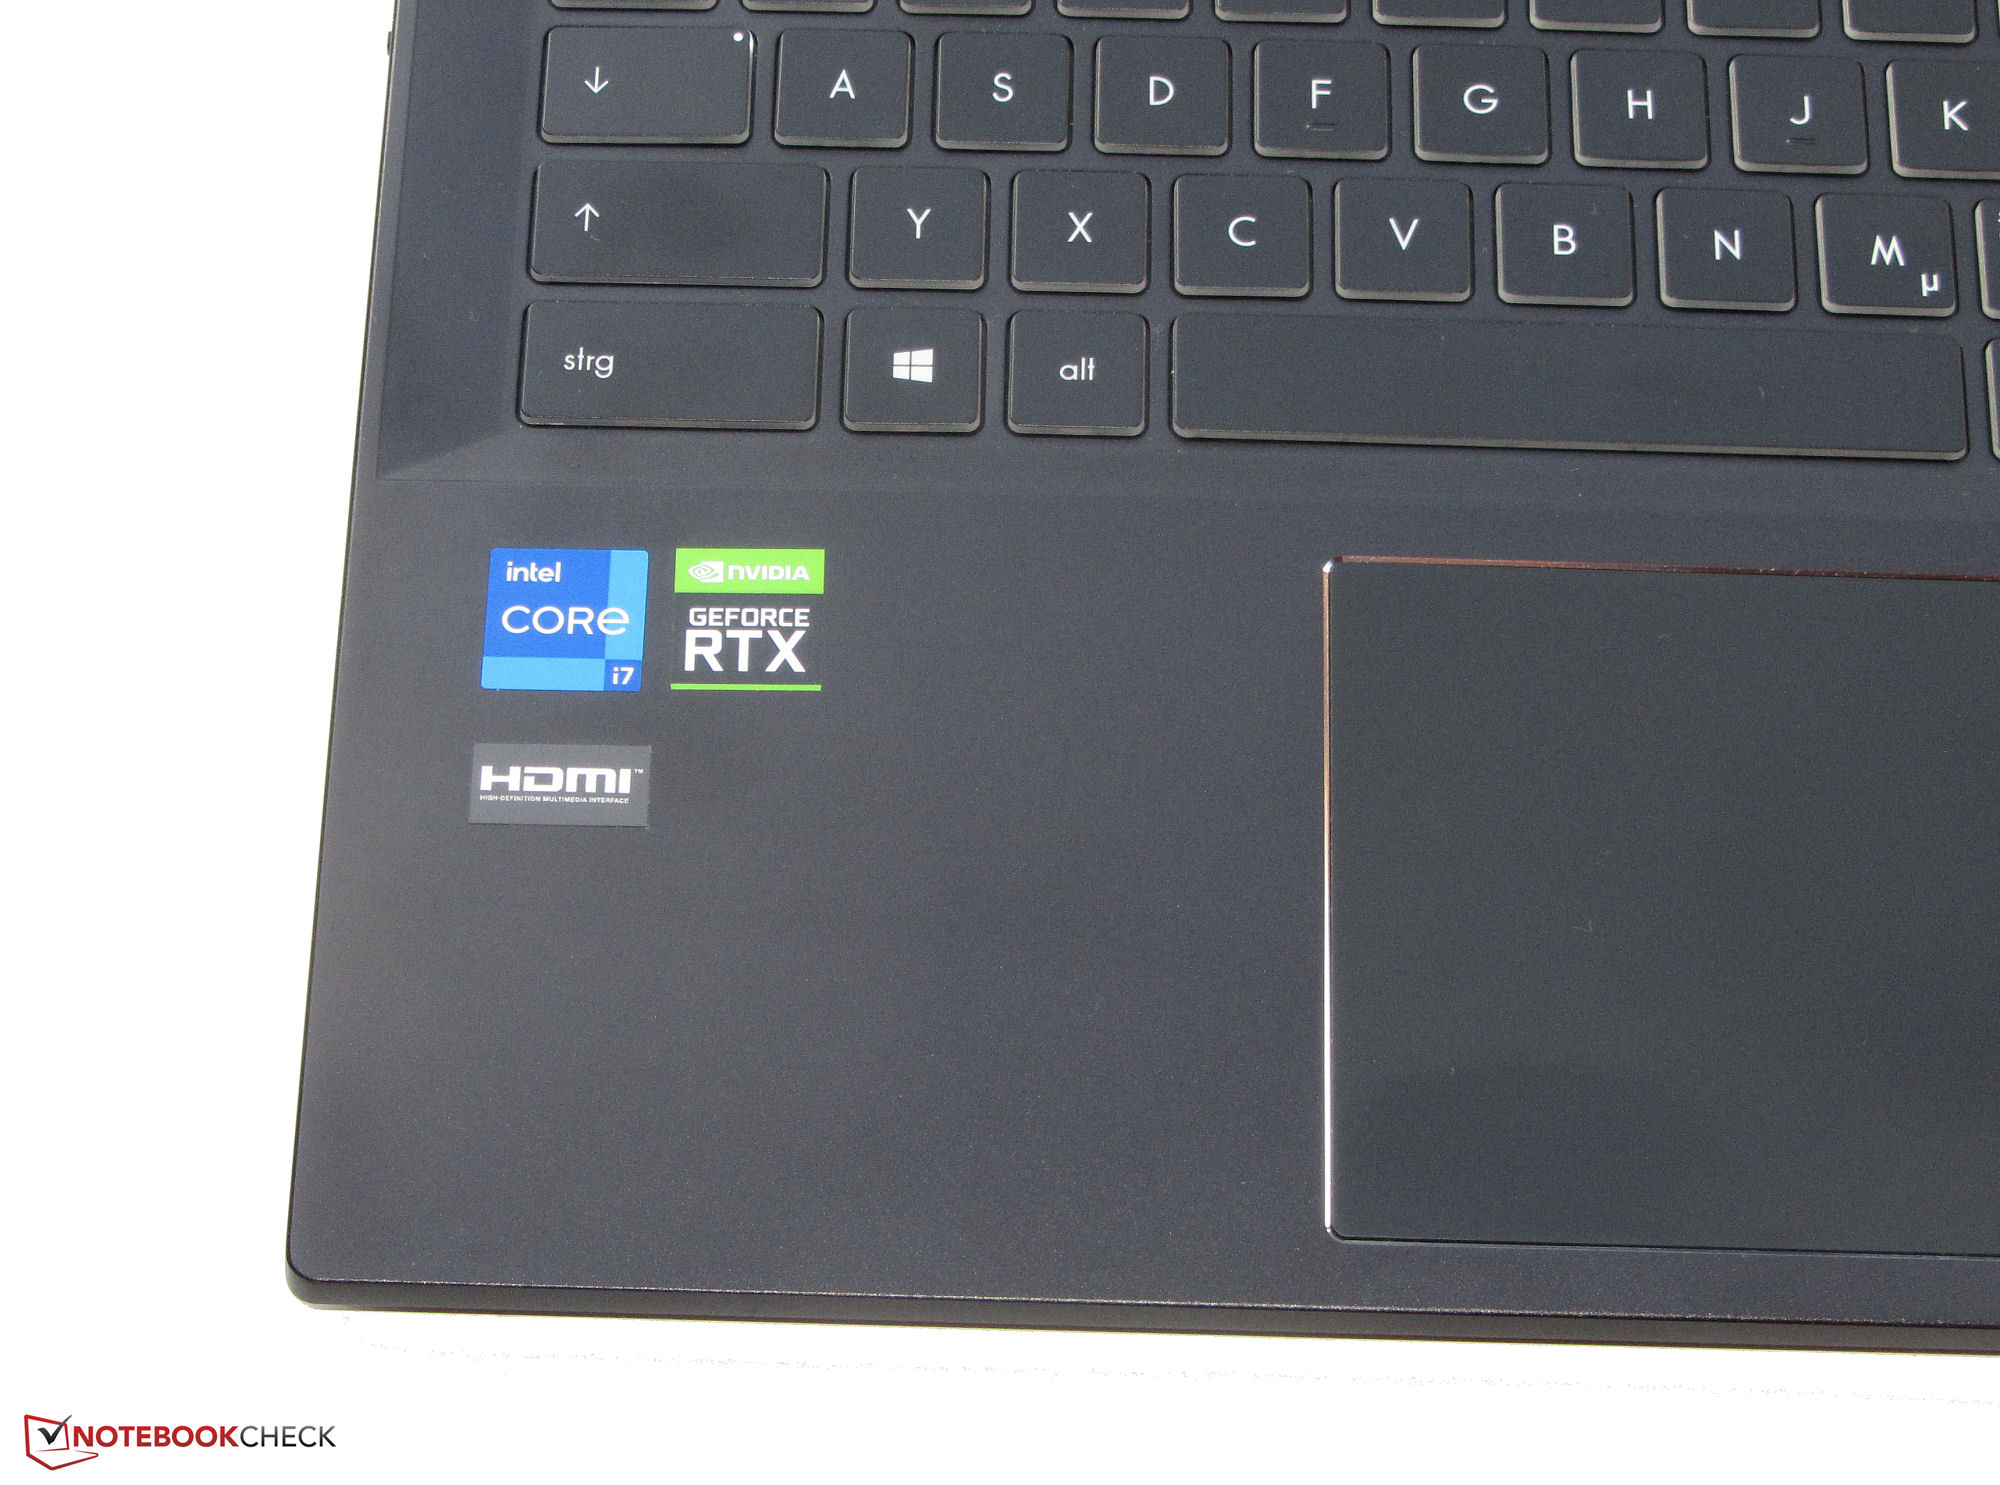
Rendimiento - Alder Lake se encuentra con Ampere
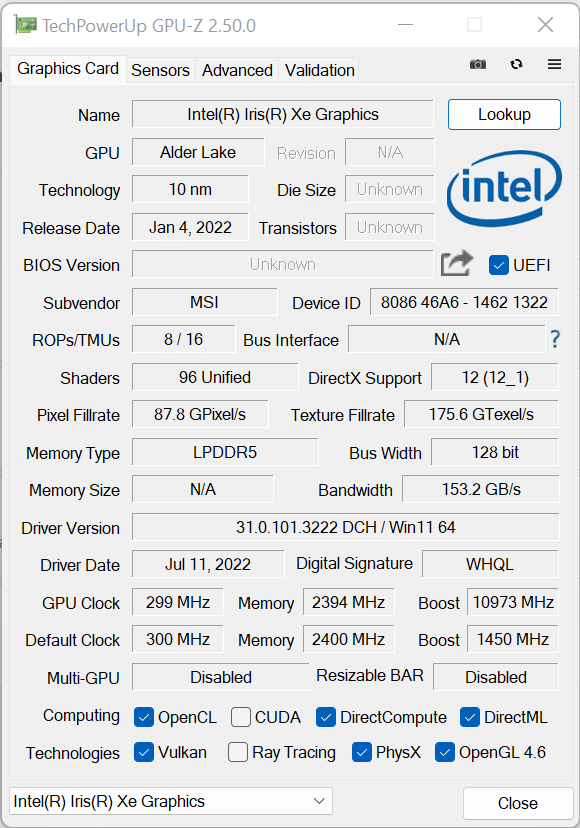
El Summit E16 Flip ofrece un rendimiento informático más que suficiente para las tareas de Office e Internet. Una GPU dedicada acelera las aplicaciones de uso intensivo de gráficos y permite jugar a juegos de ordenador.
Condiciones de la prueba
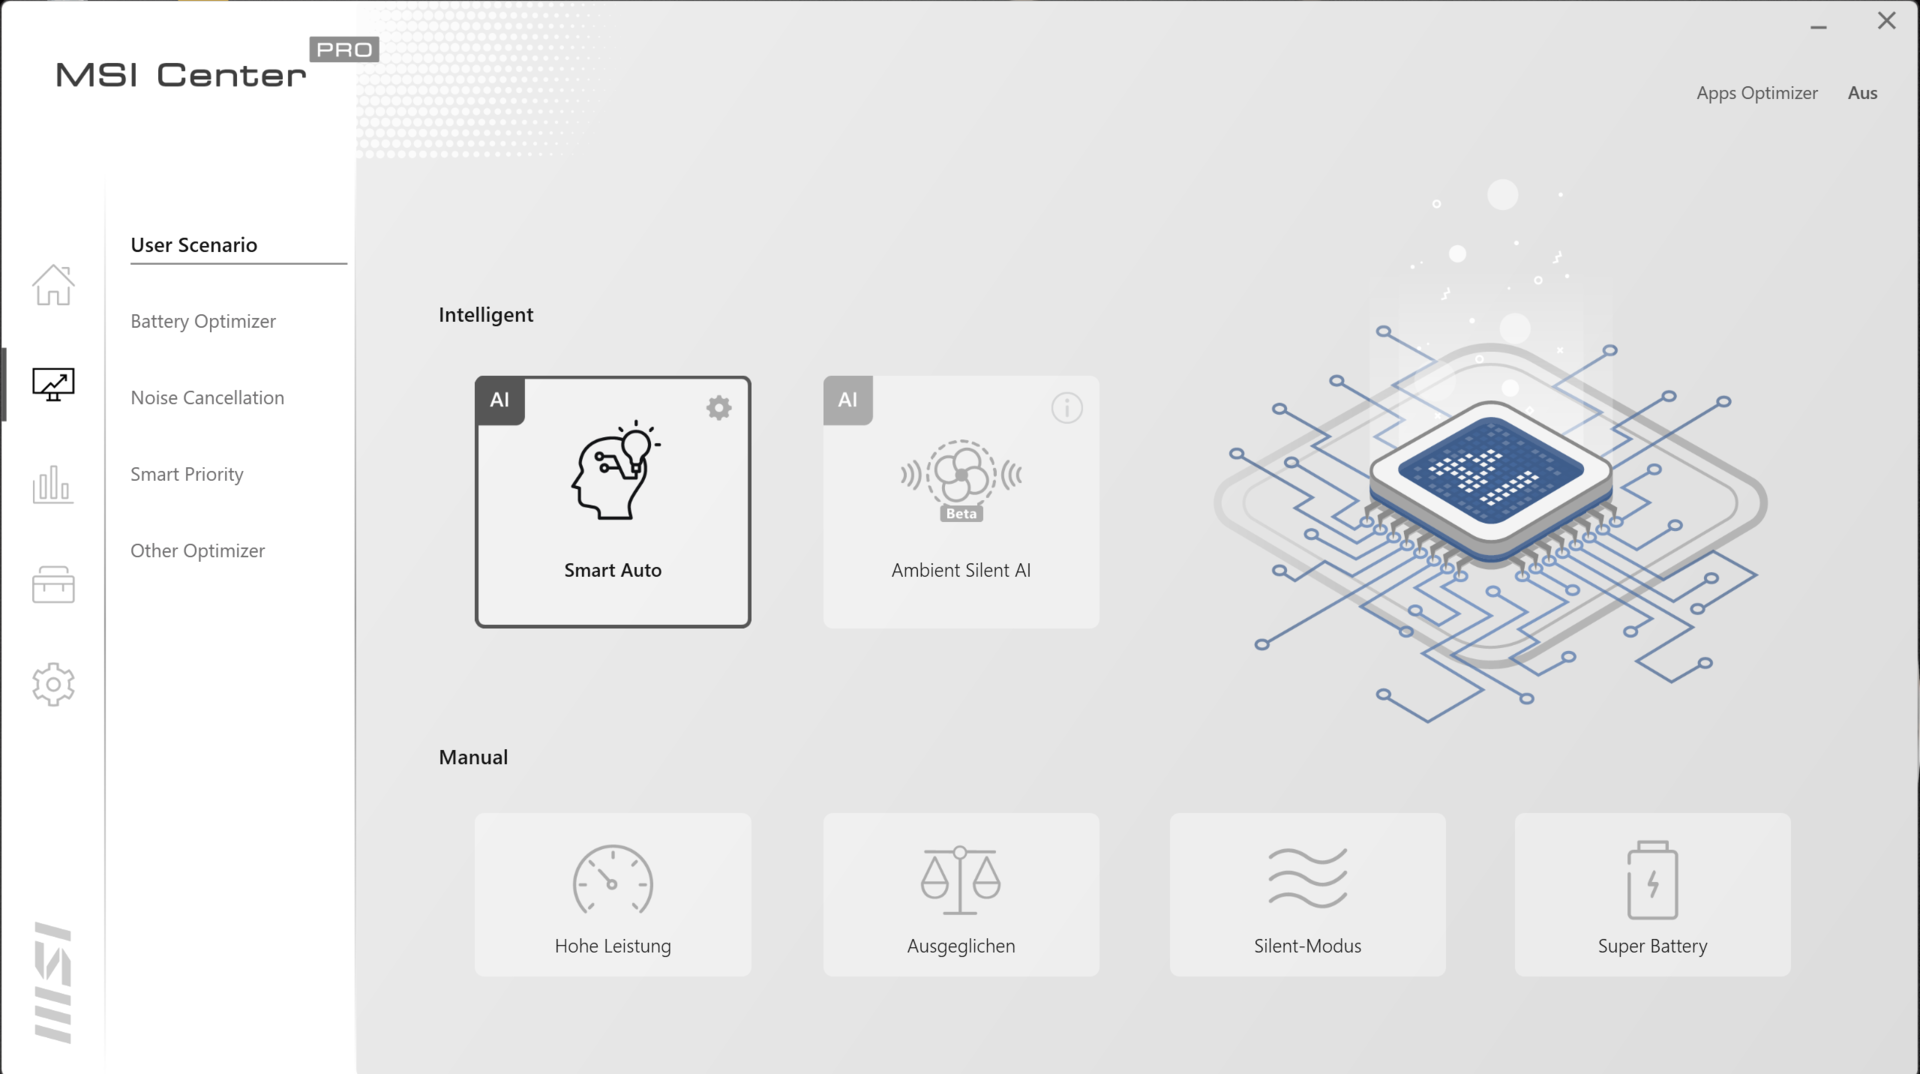
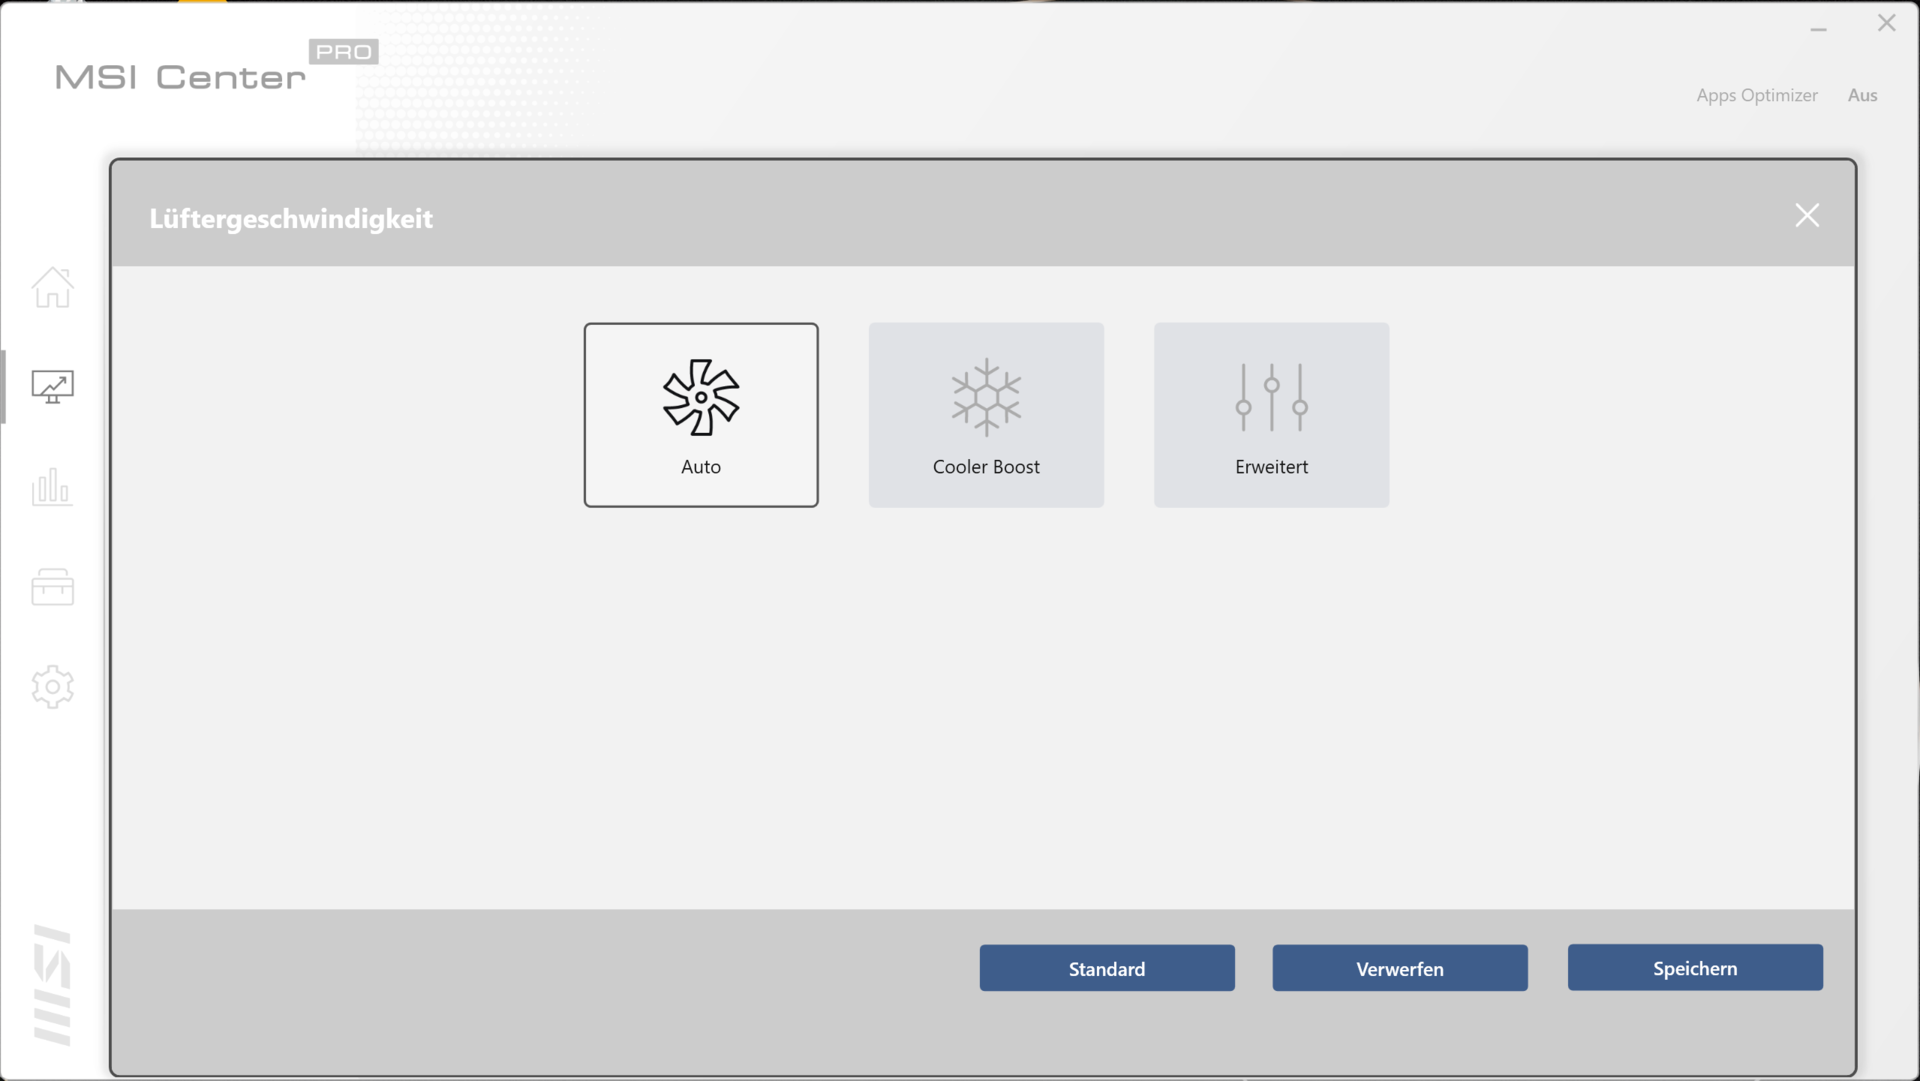
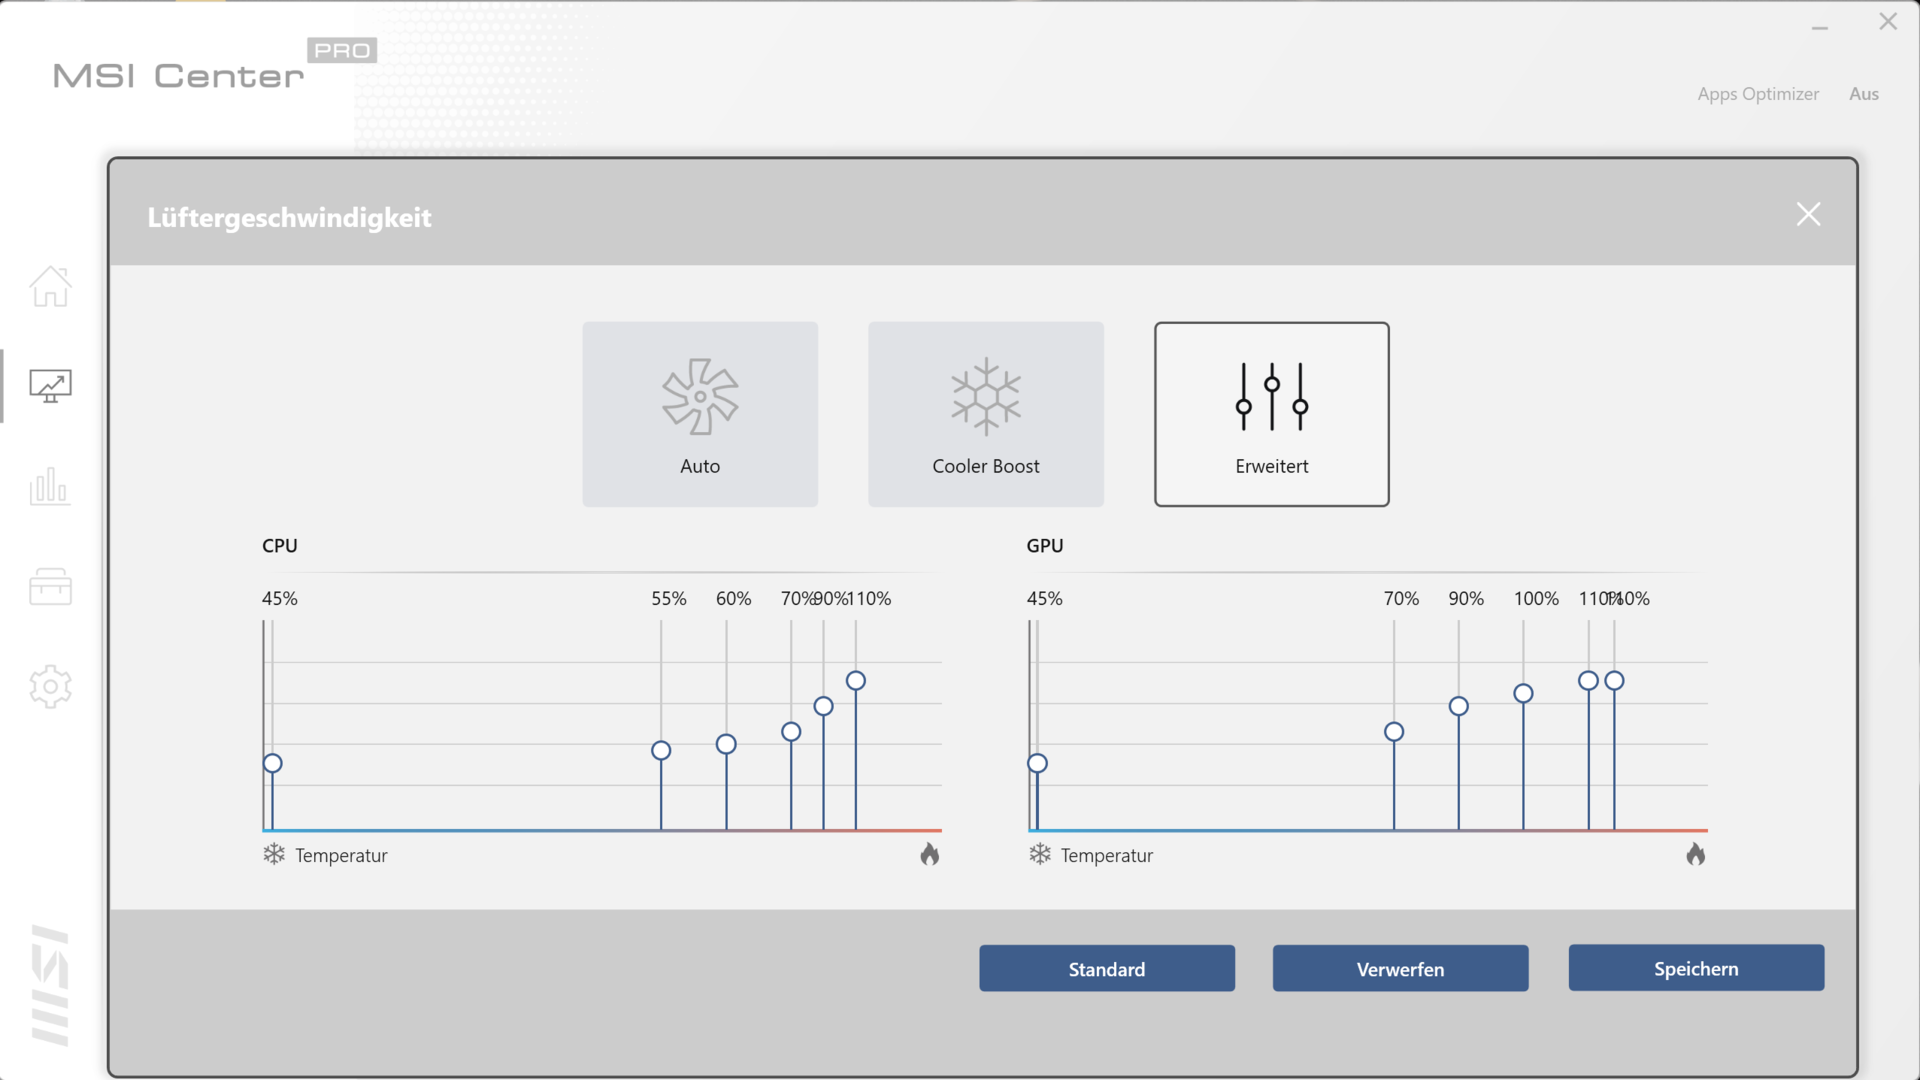
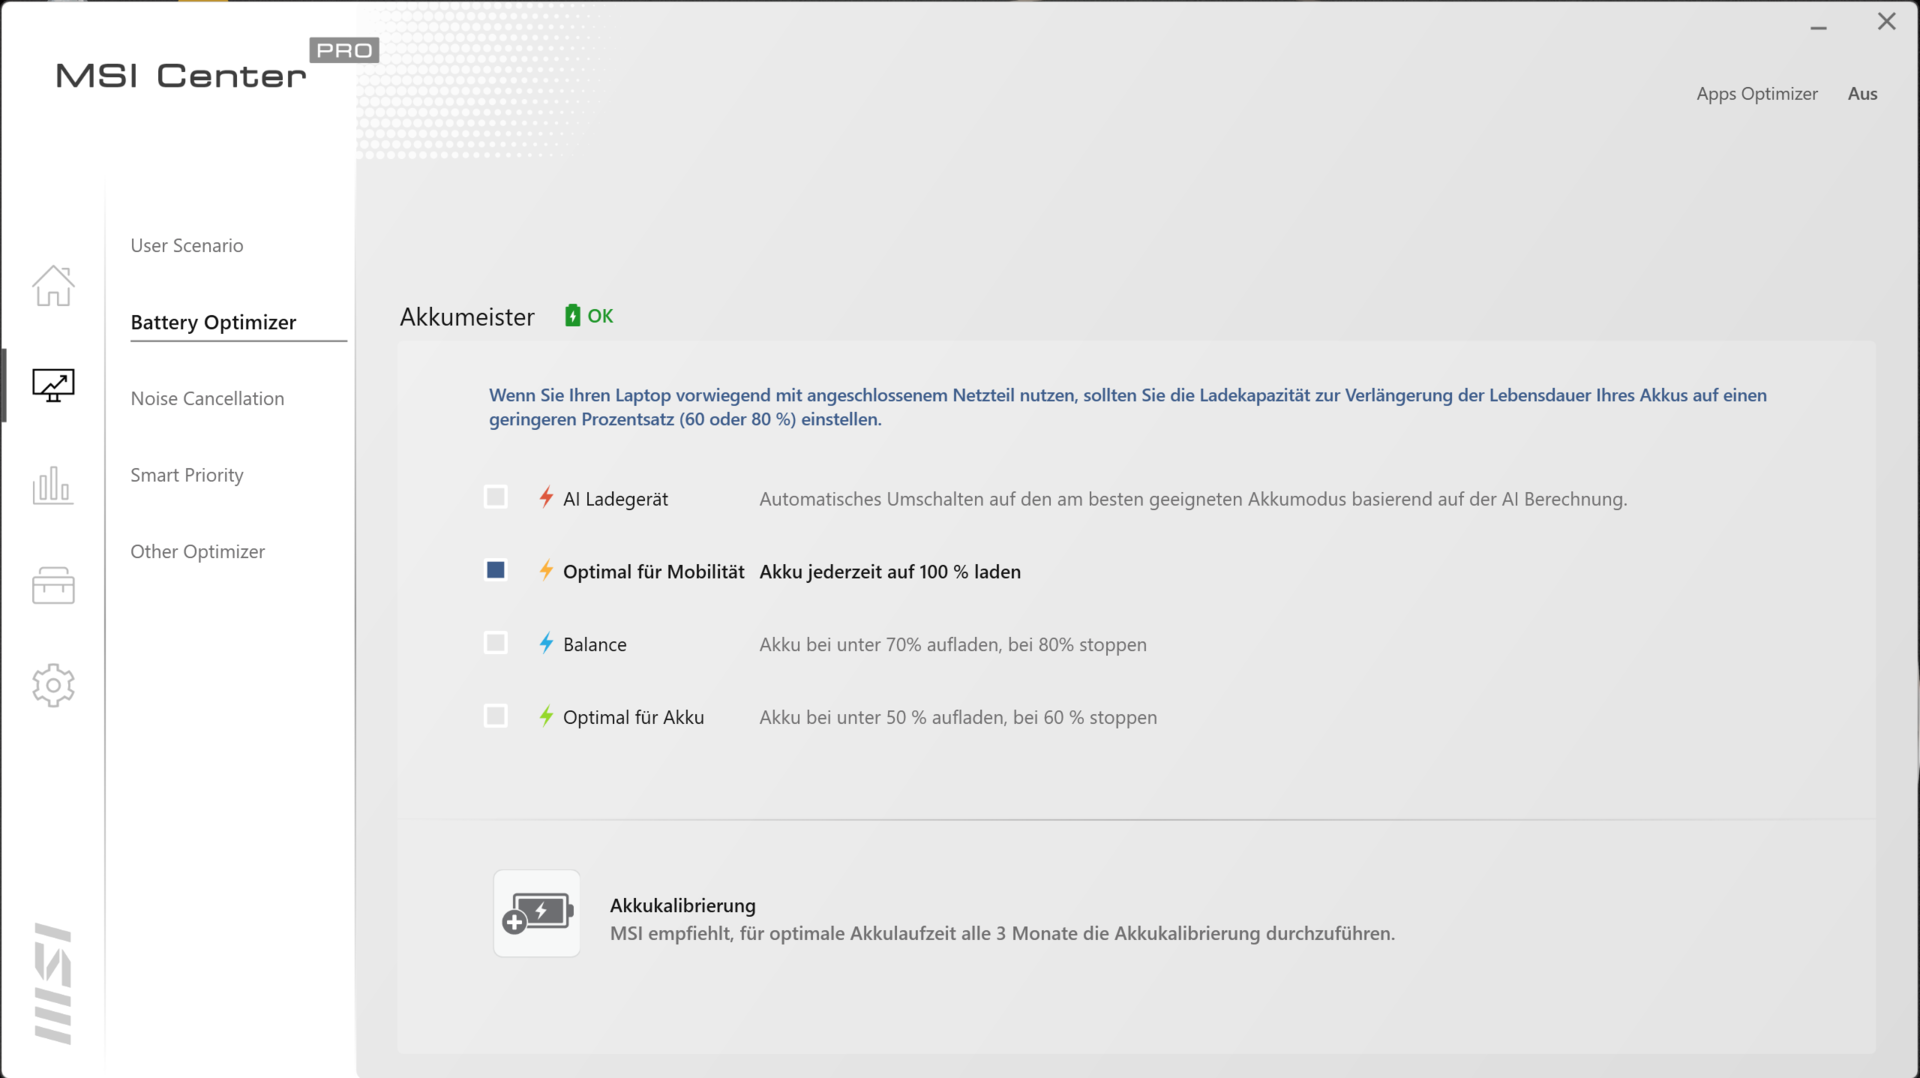
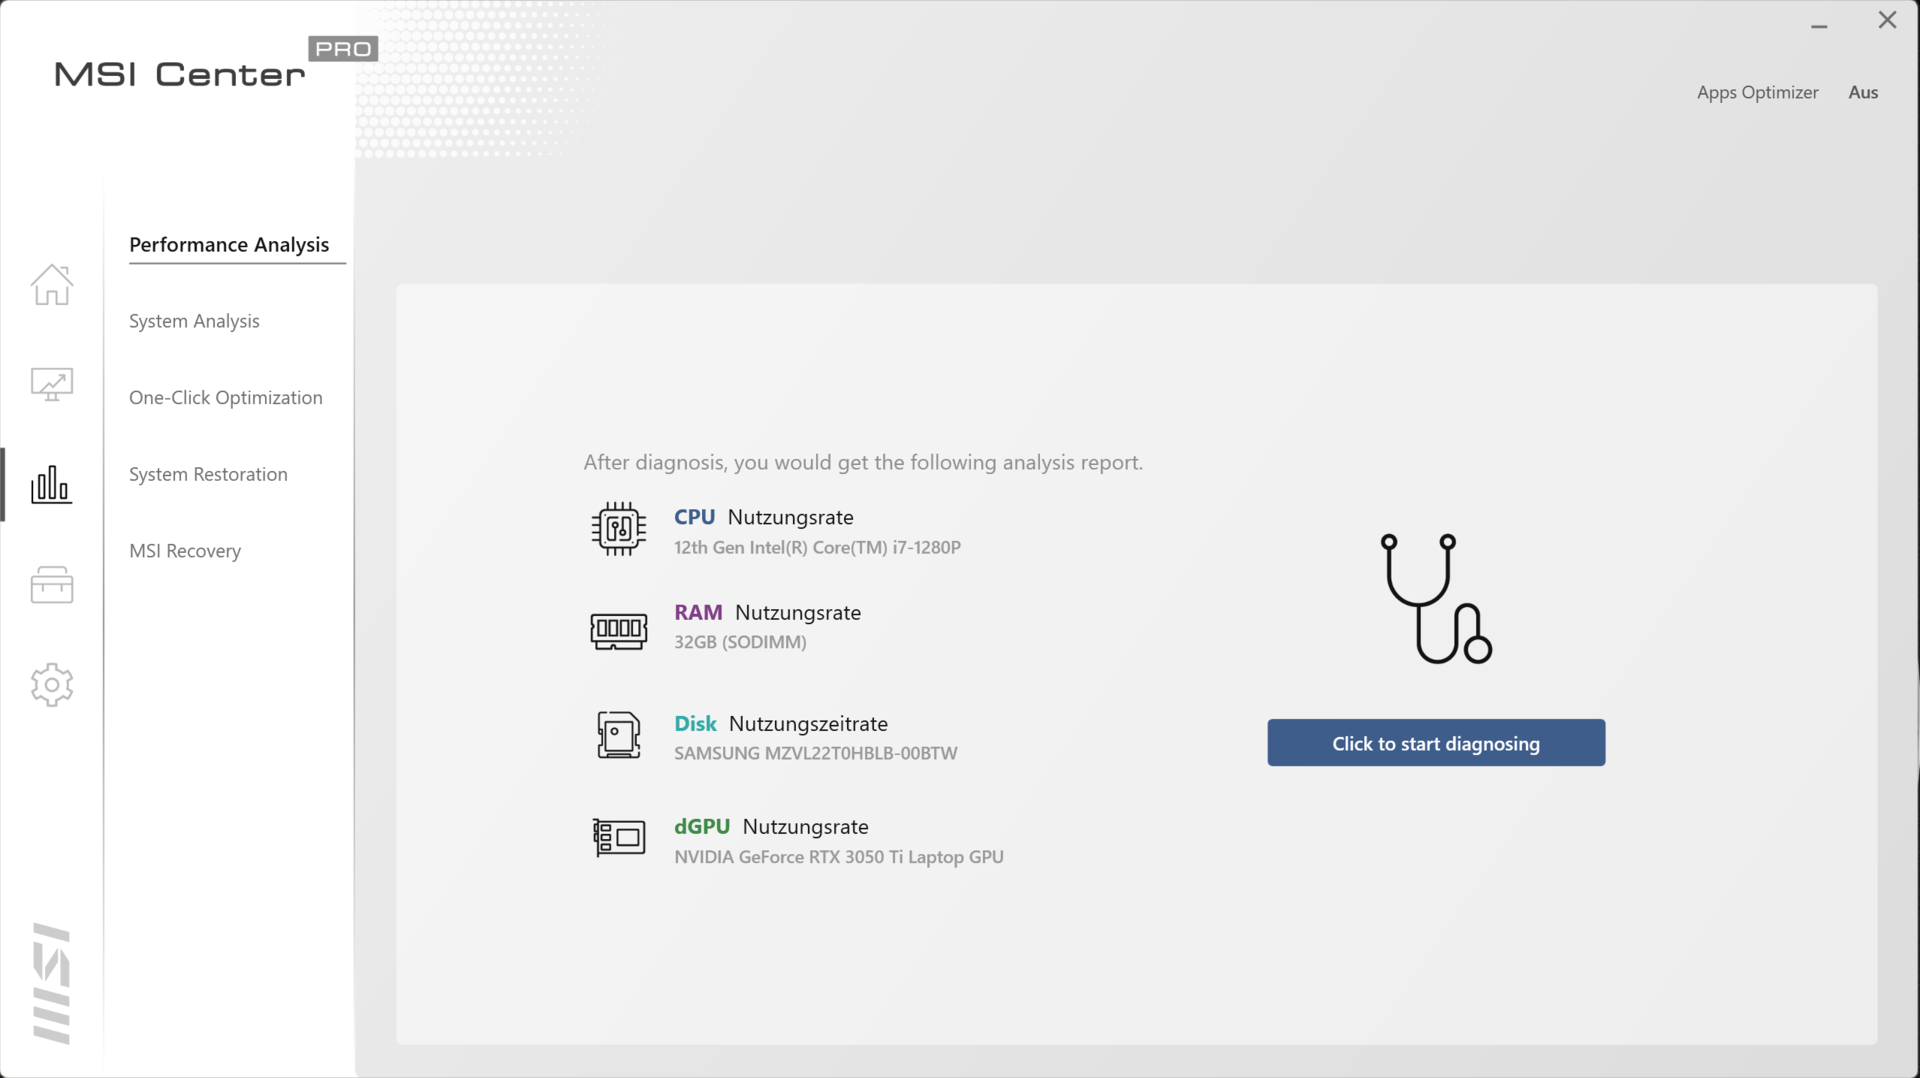
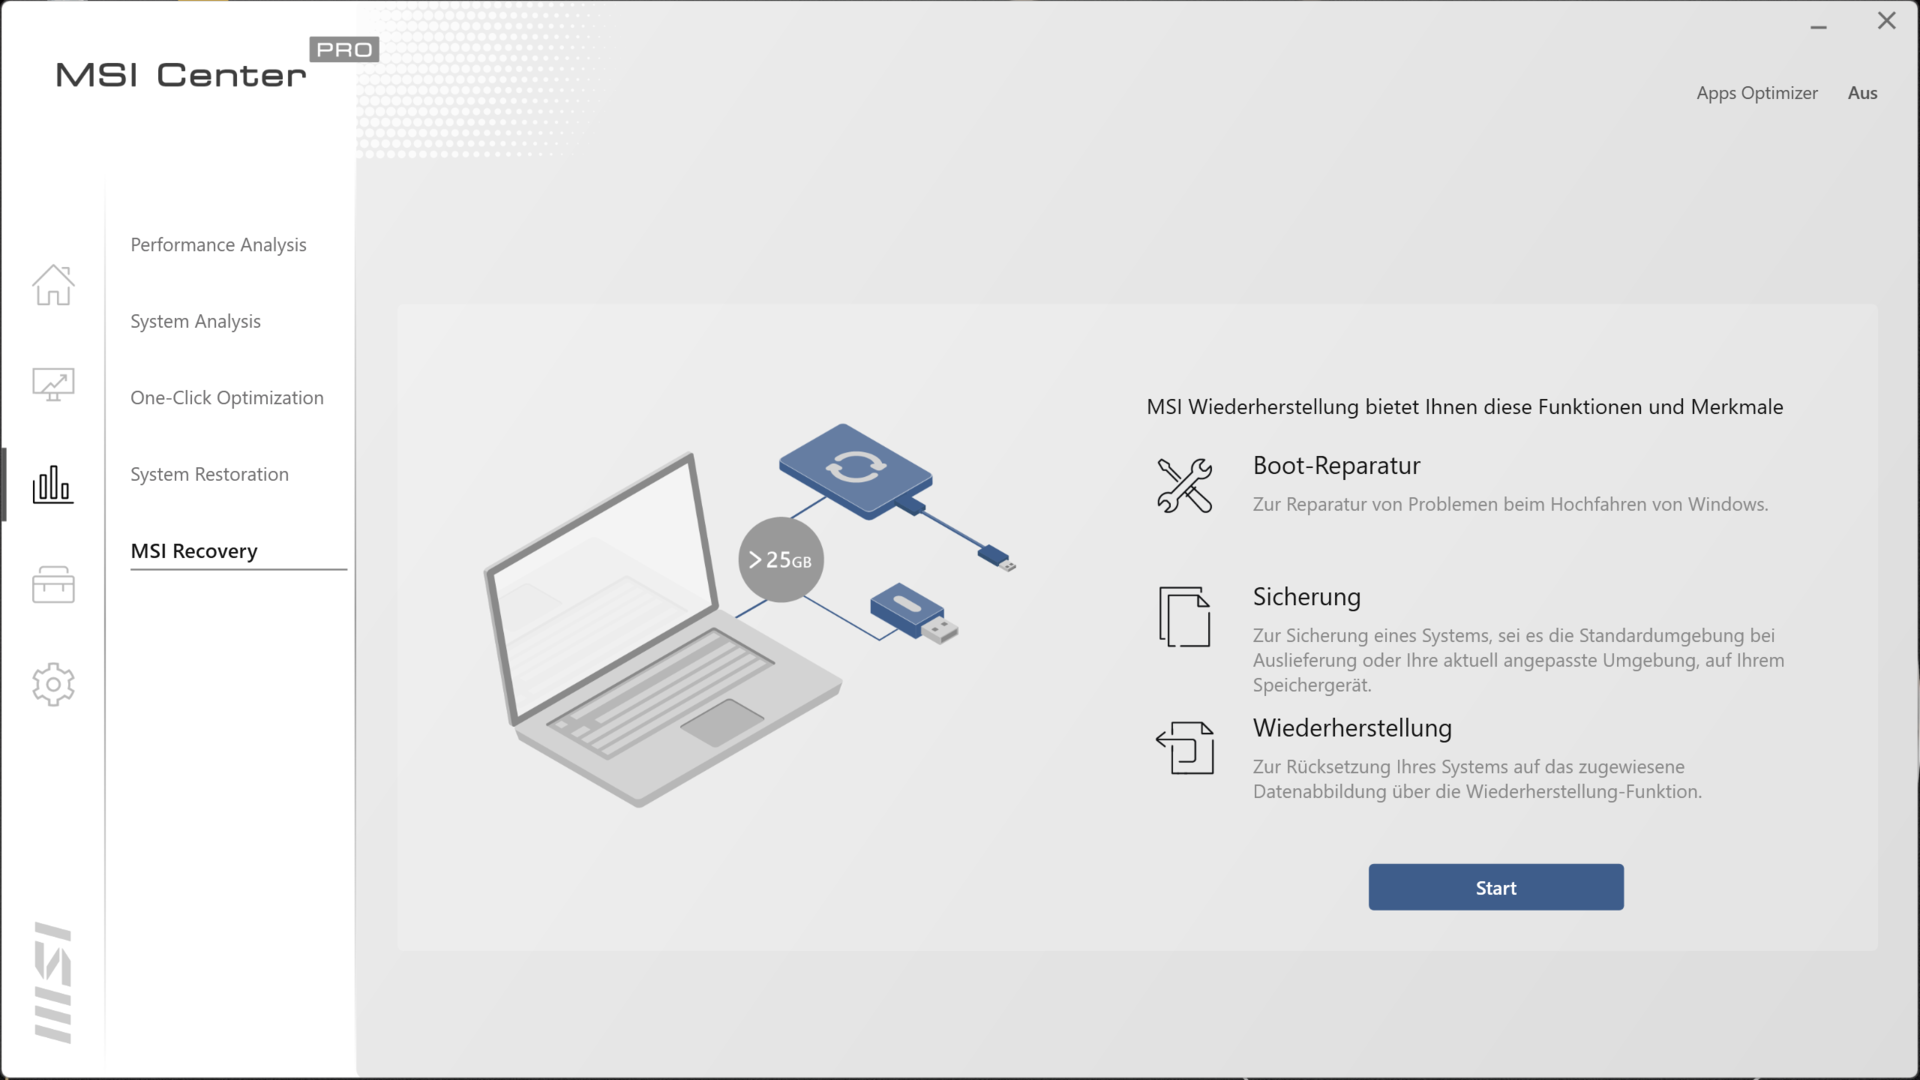
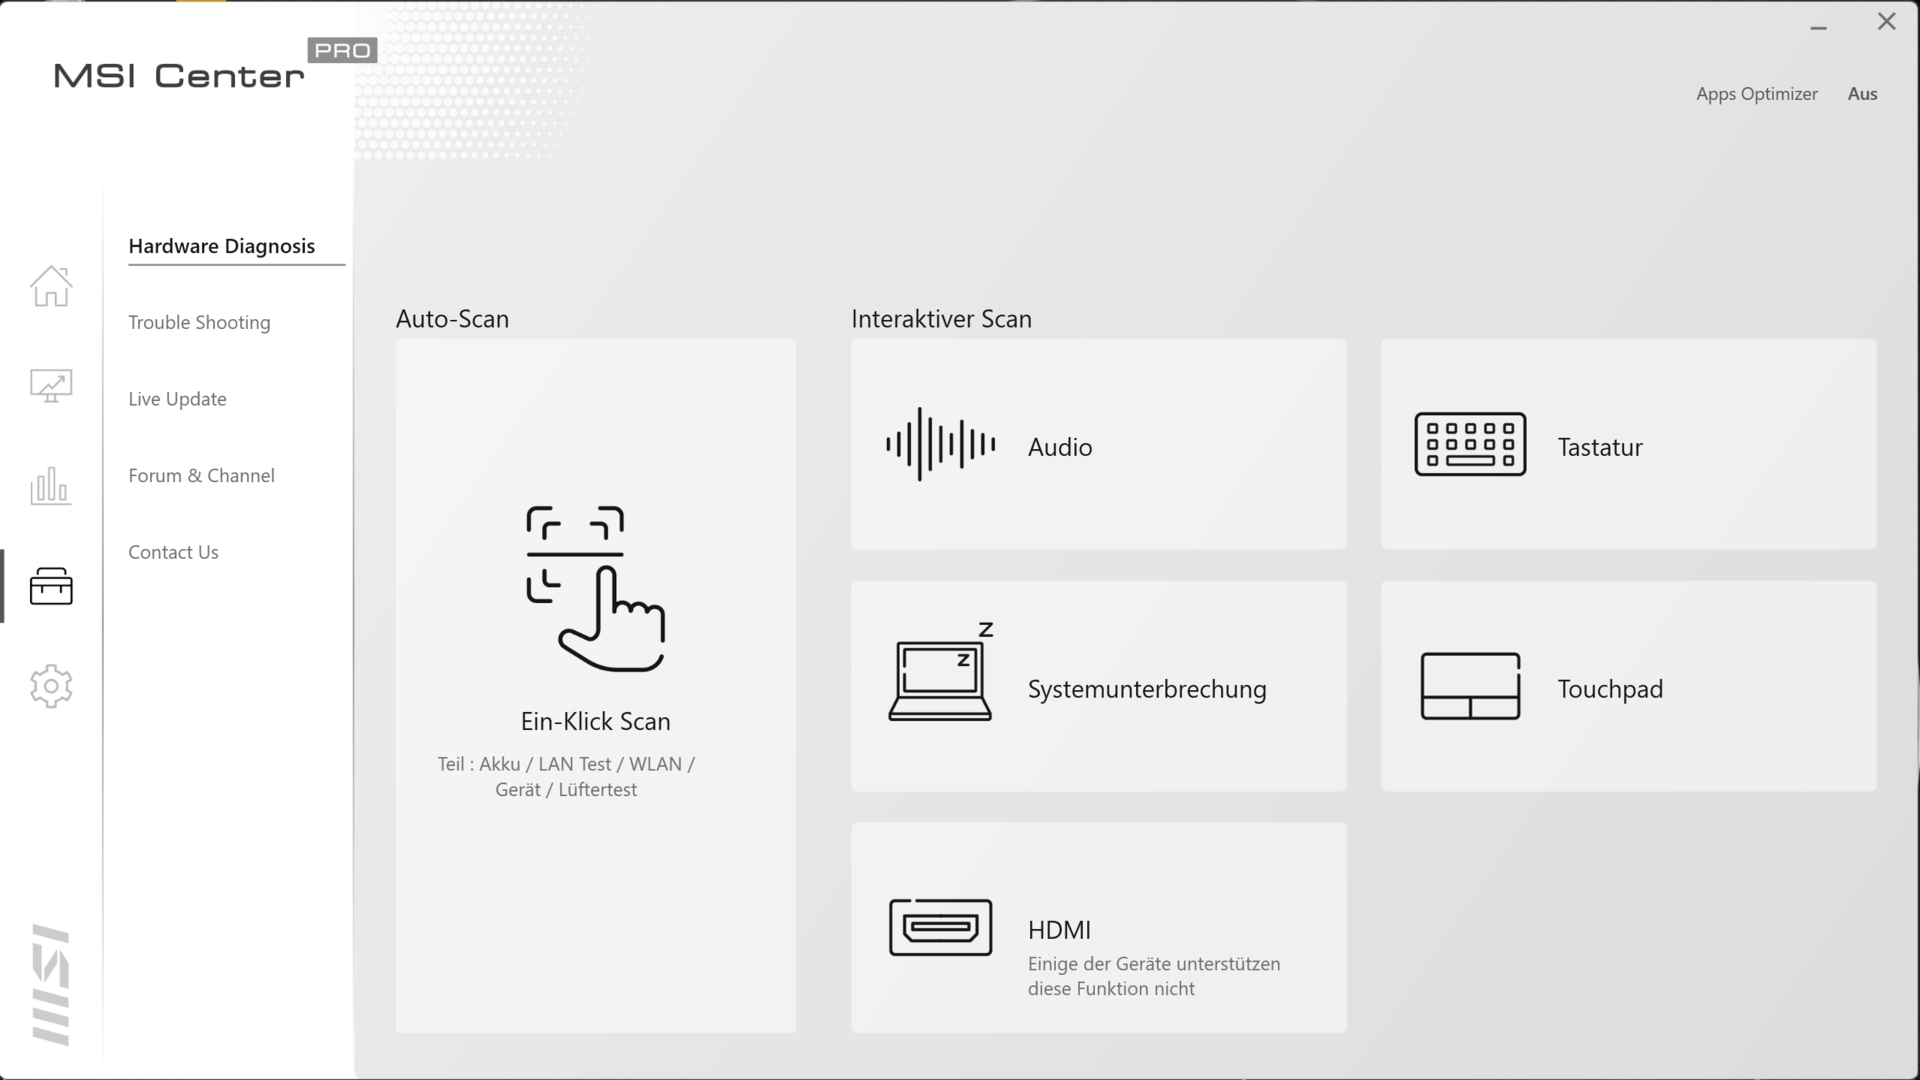
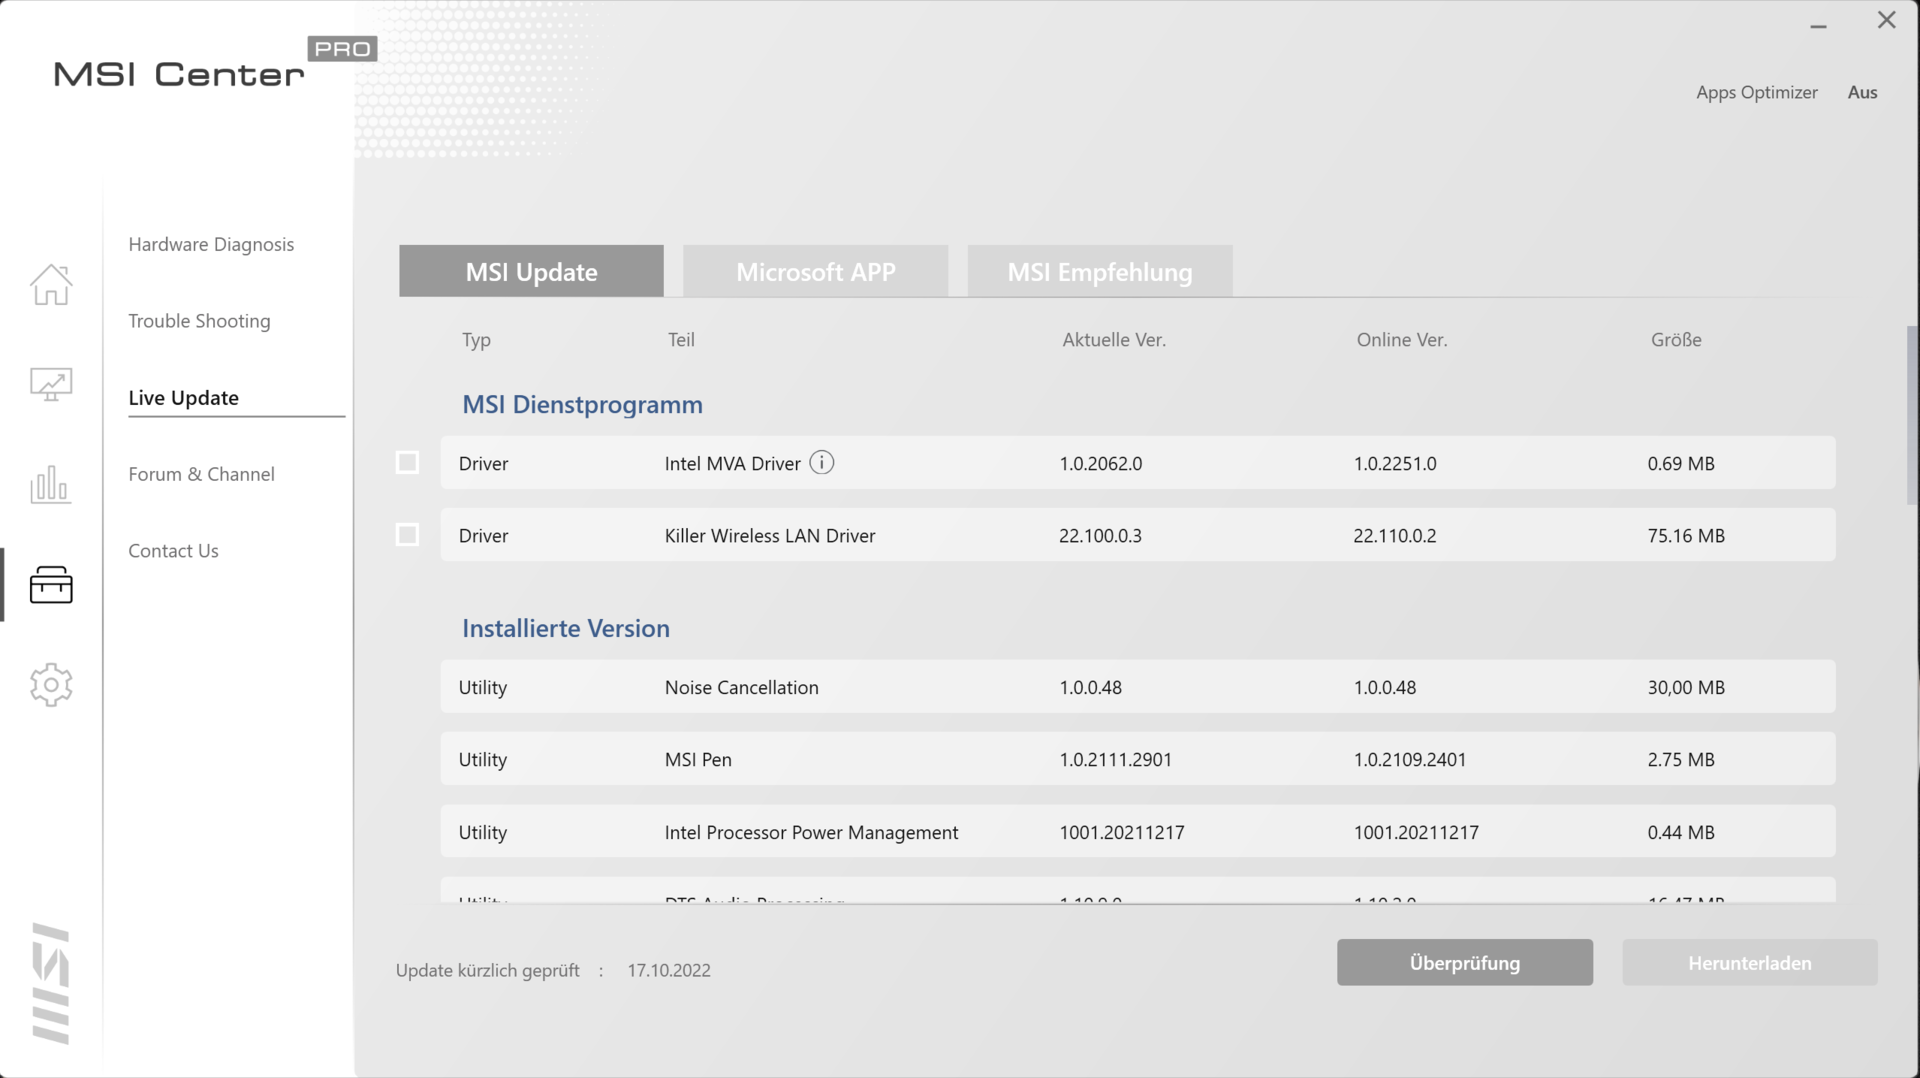
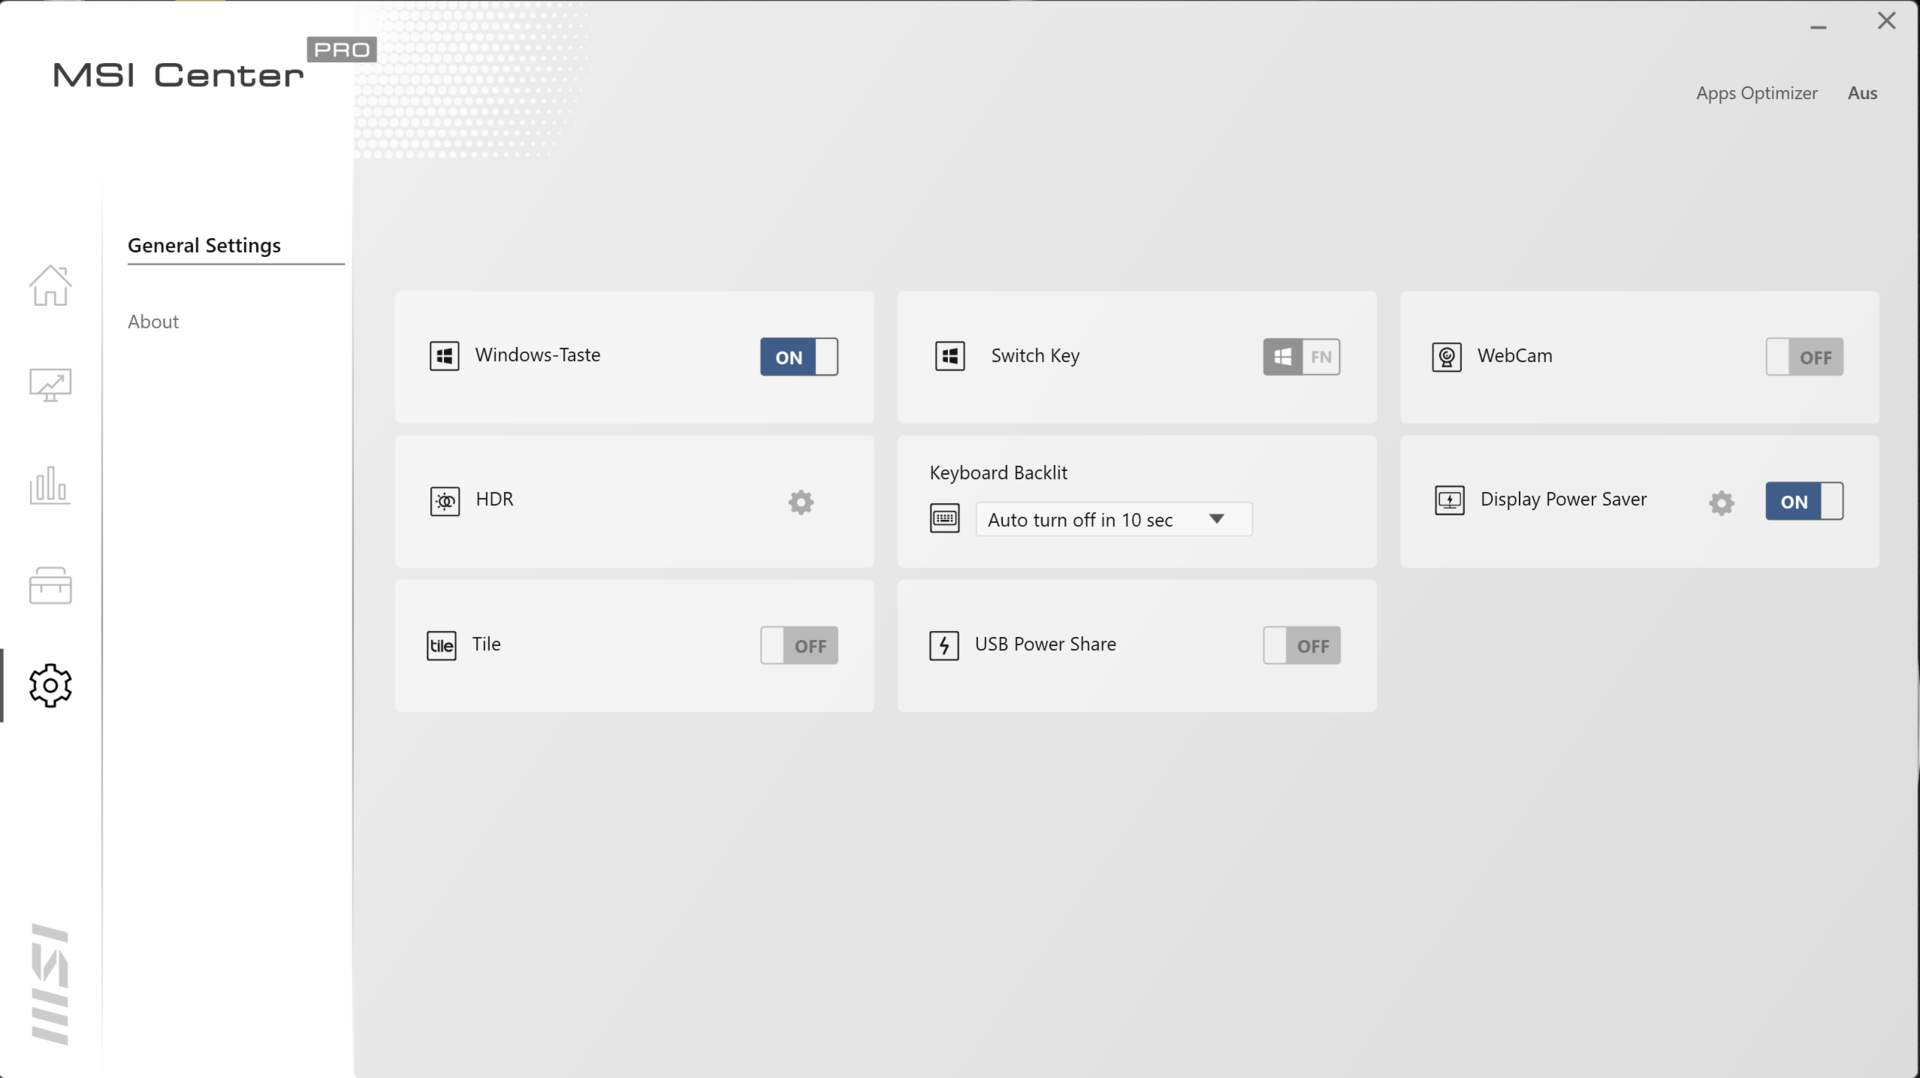
El software MSI Center Pro preinstalado (ver imágenes) y la tecla F7 permiten cambiar entre los cuatro perfiles de energía (Alto Rendimiento, Equilibrado, Modo Silencioso, Super Batería) del portátil. Cuando se utiliza la función"Smart Auto", basada en la IA, como en nuestro caso, el MSI Center elige automáticamente el perfil que se ajusta al escenario. Los perfiles sólo influyen en el rendimiento de la CPU y no en el de la GPU.
Procesador
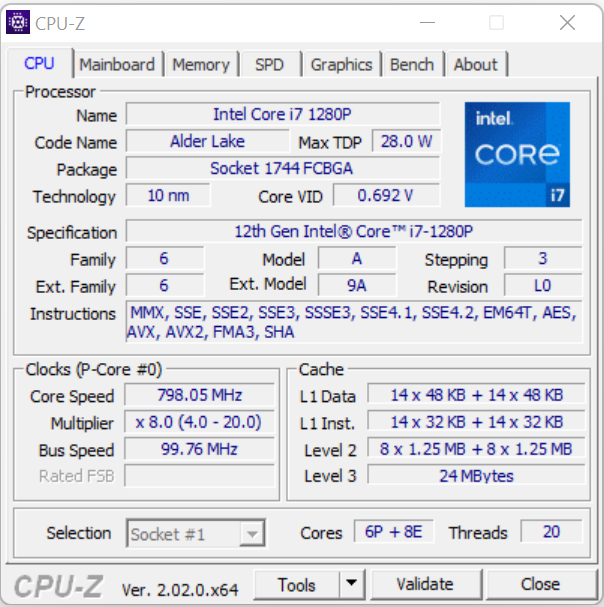
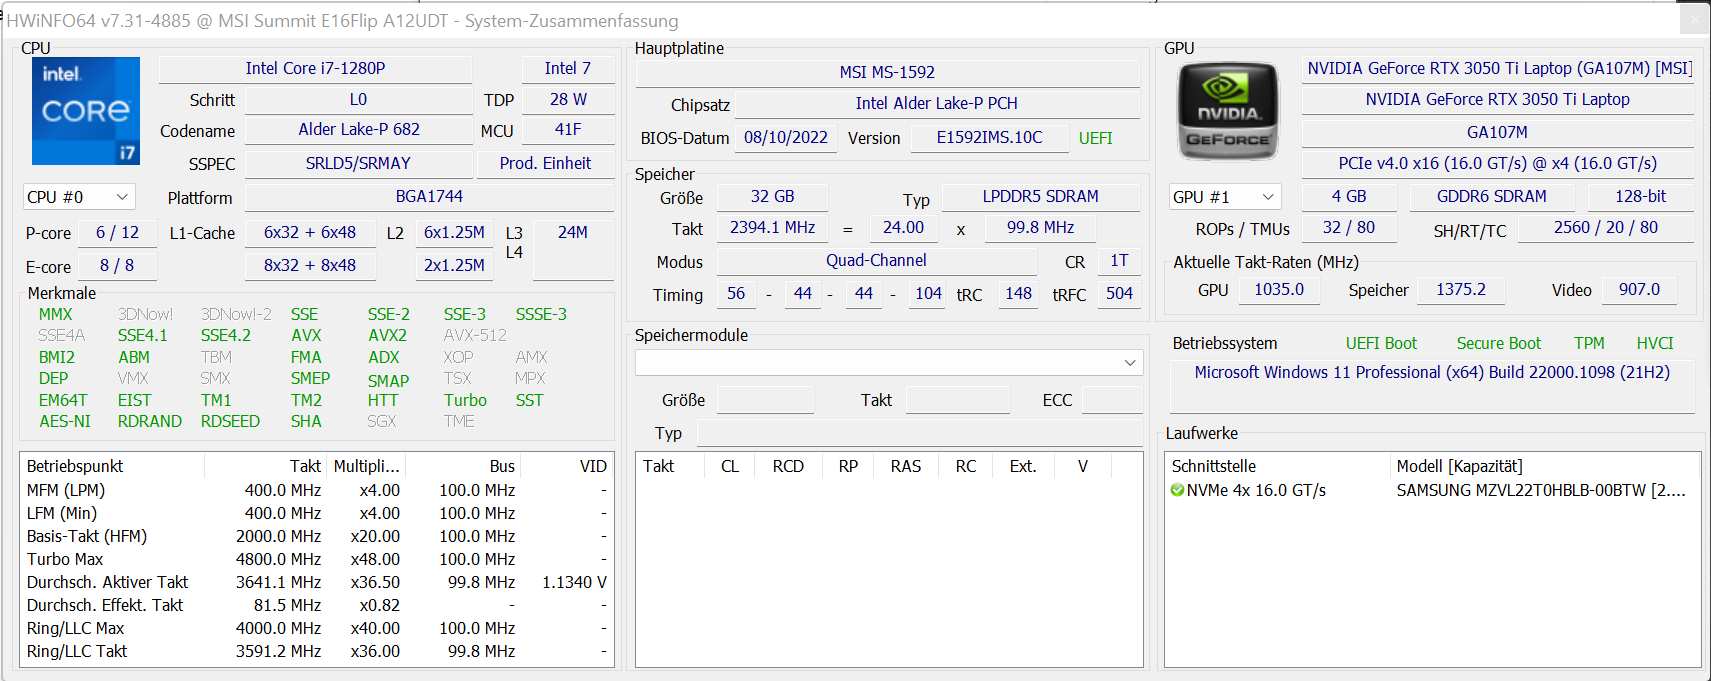
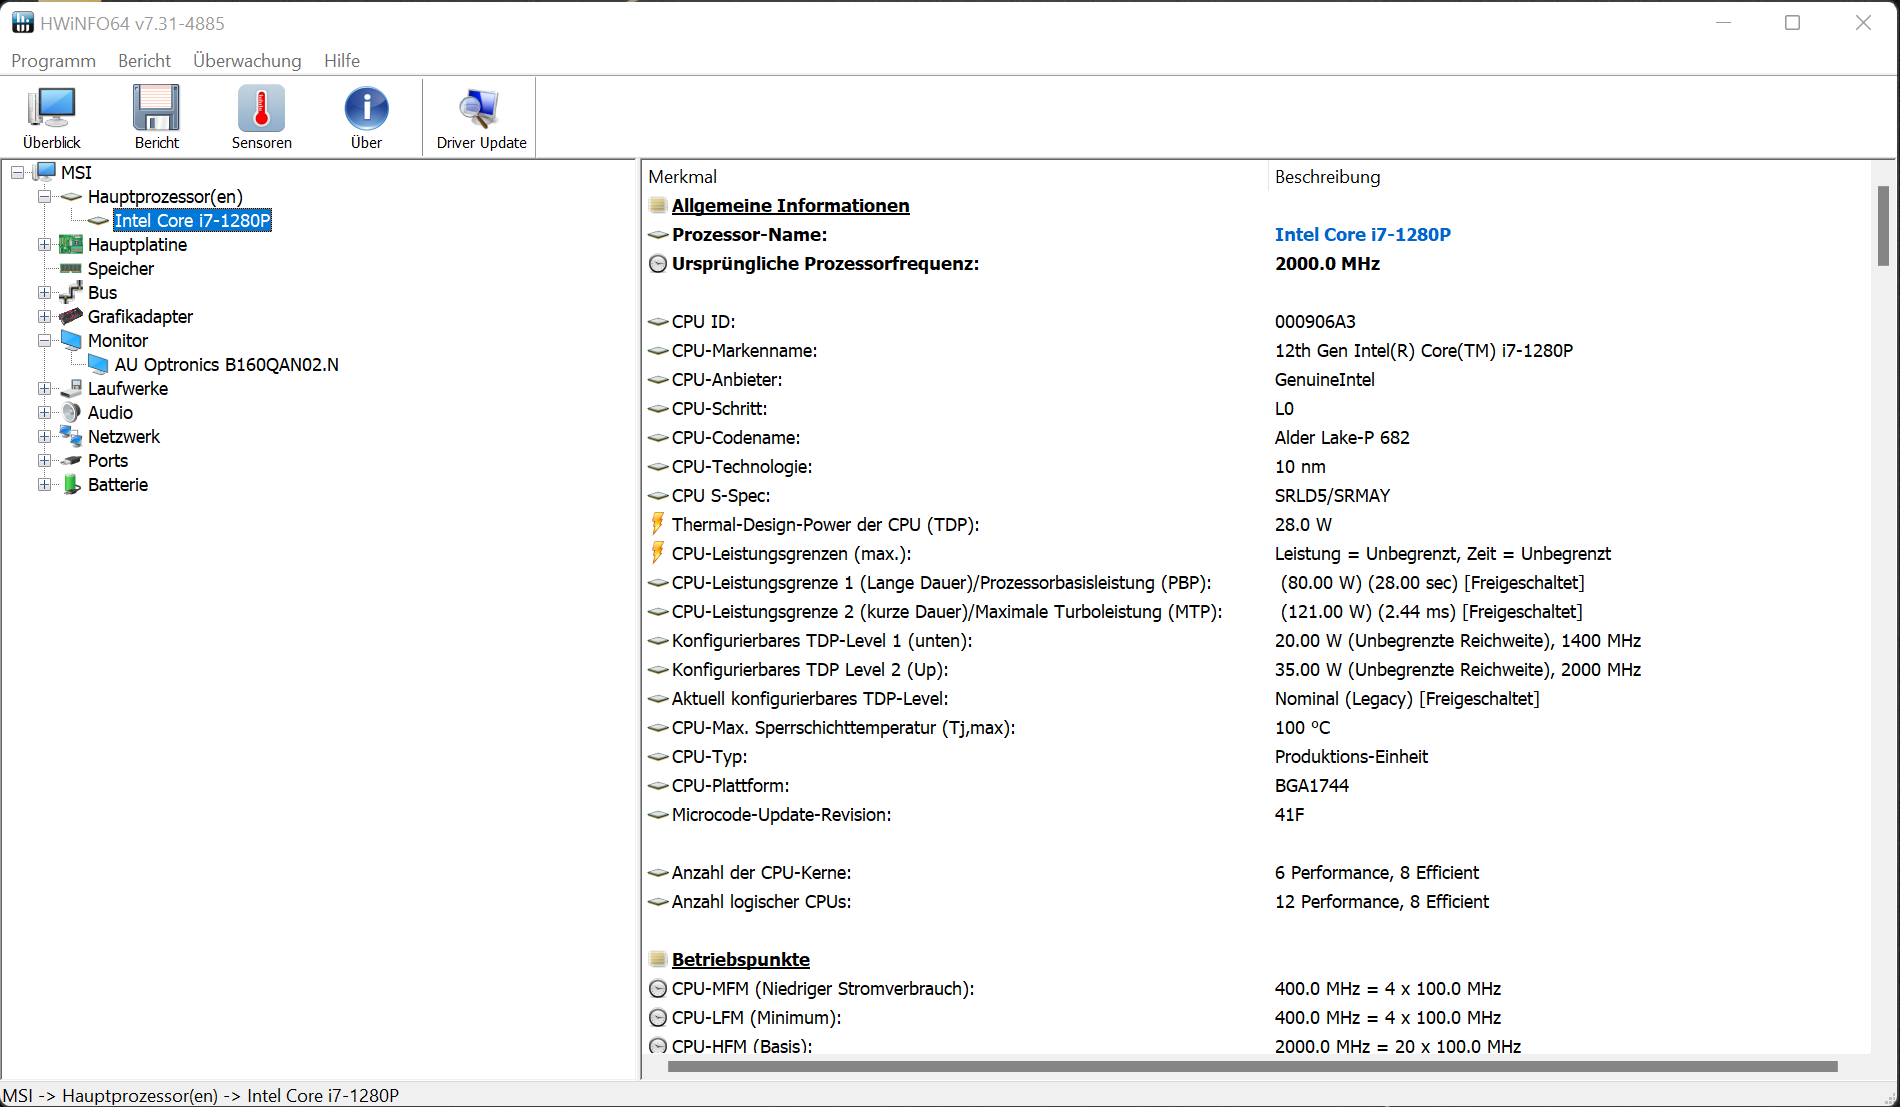
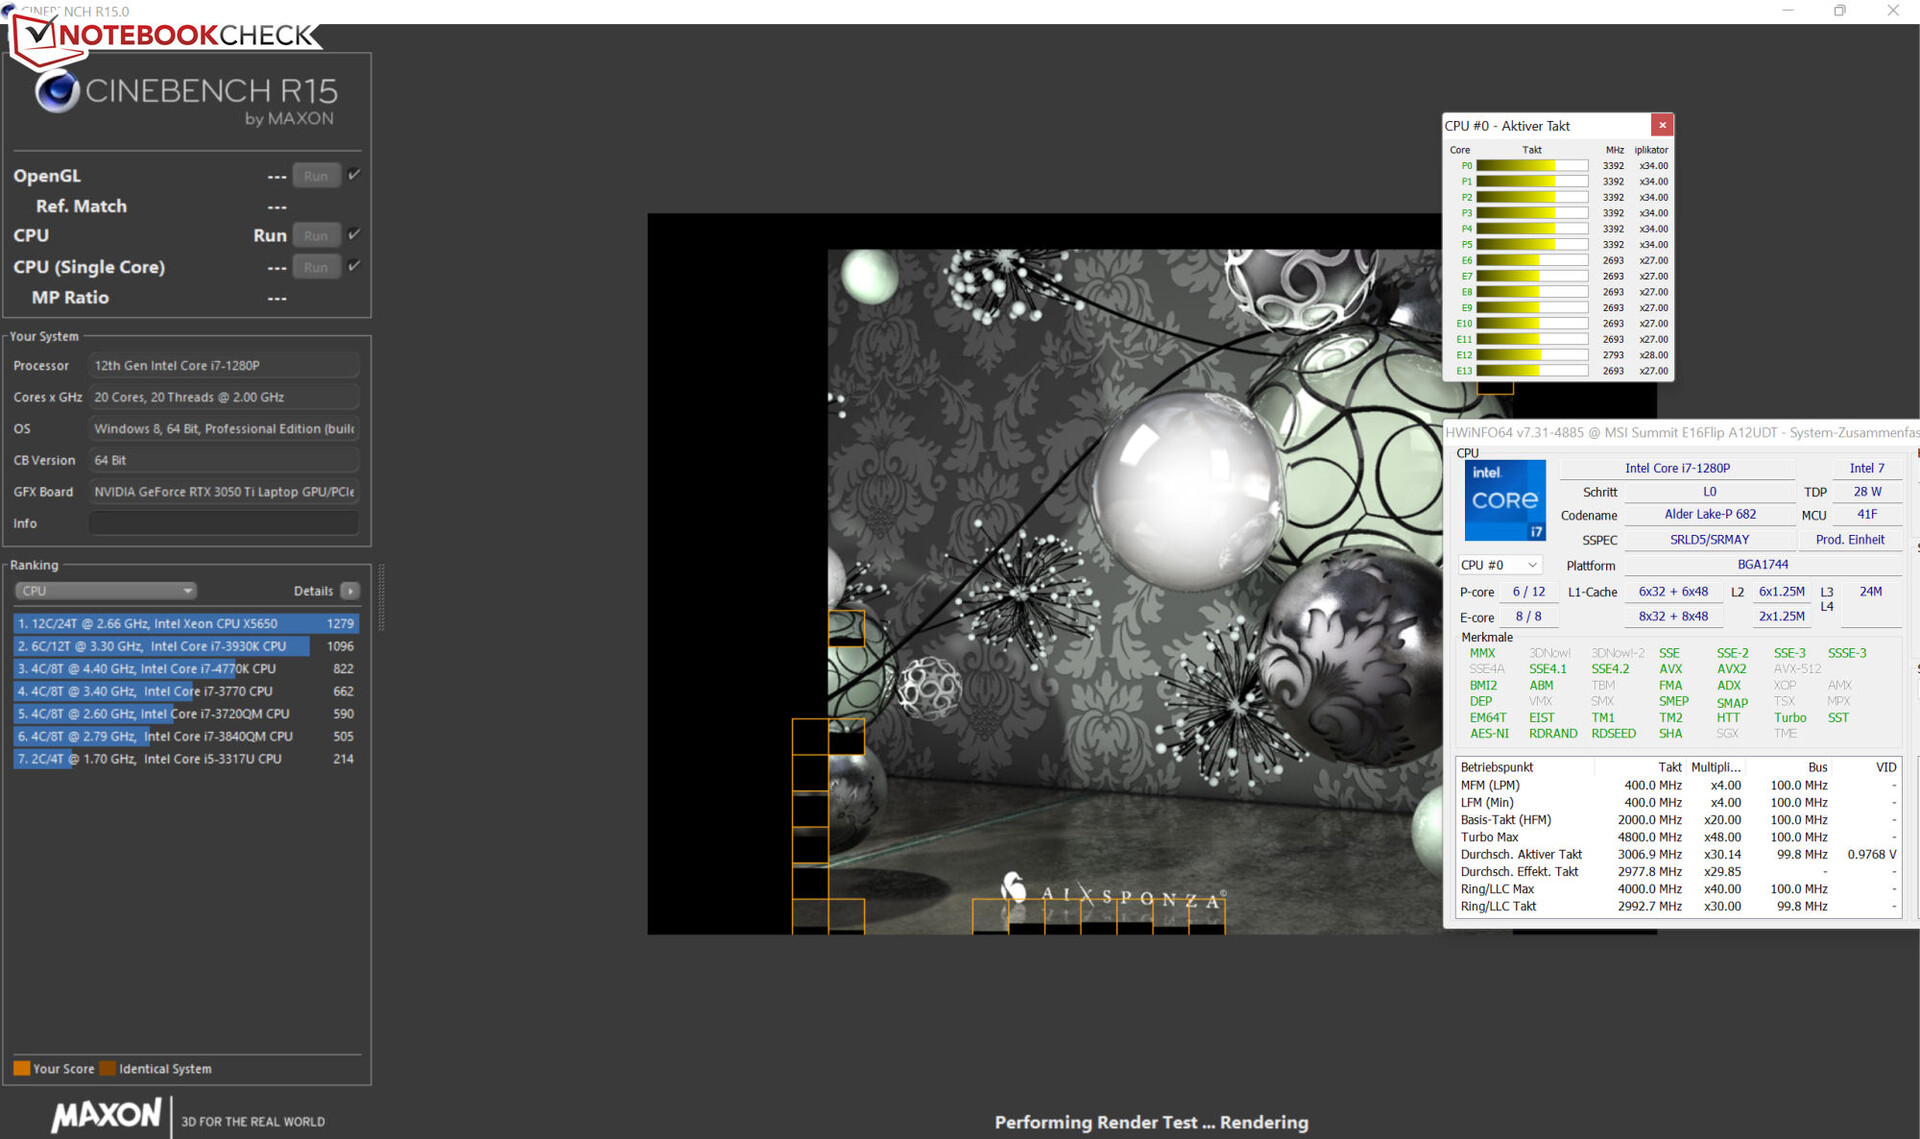
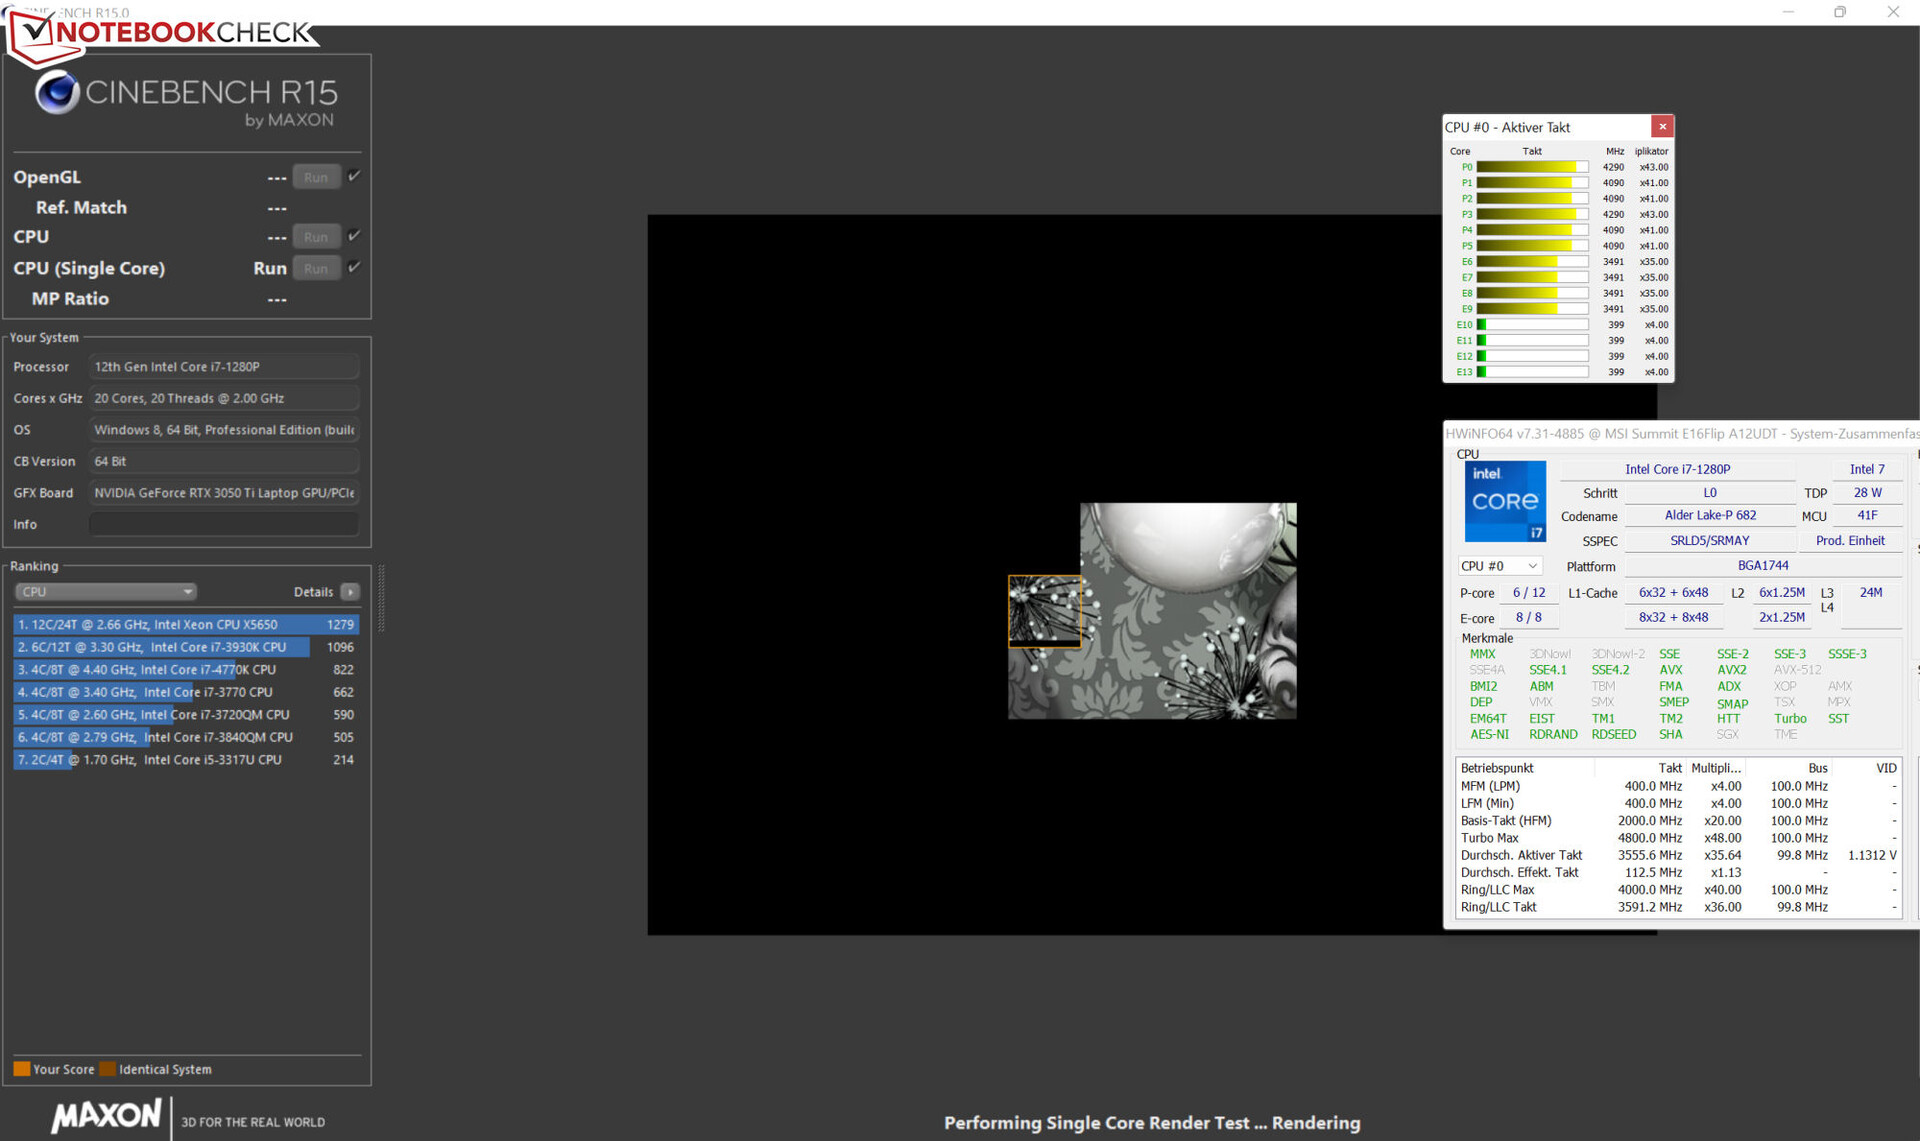
El Alder LakeCore-i7-1280Pconsta de 6 núcleos de rendimiento (hyperthreading, de 2,4 a 4,8 GHz) y 8 núcleos de eficiencia (sin hyperthreading, de 1,8 a 3,7 GHz), lo que da como resultado un total de 20 núcleos lógicos de CPU.
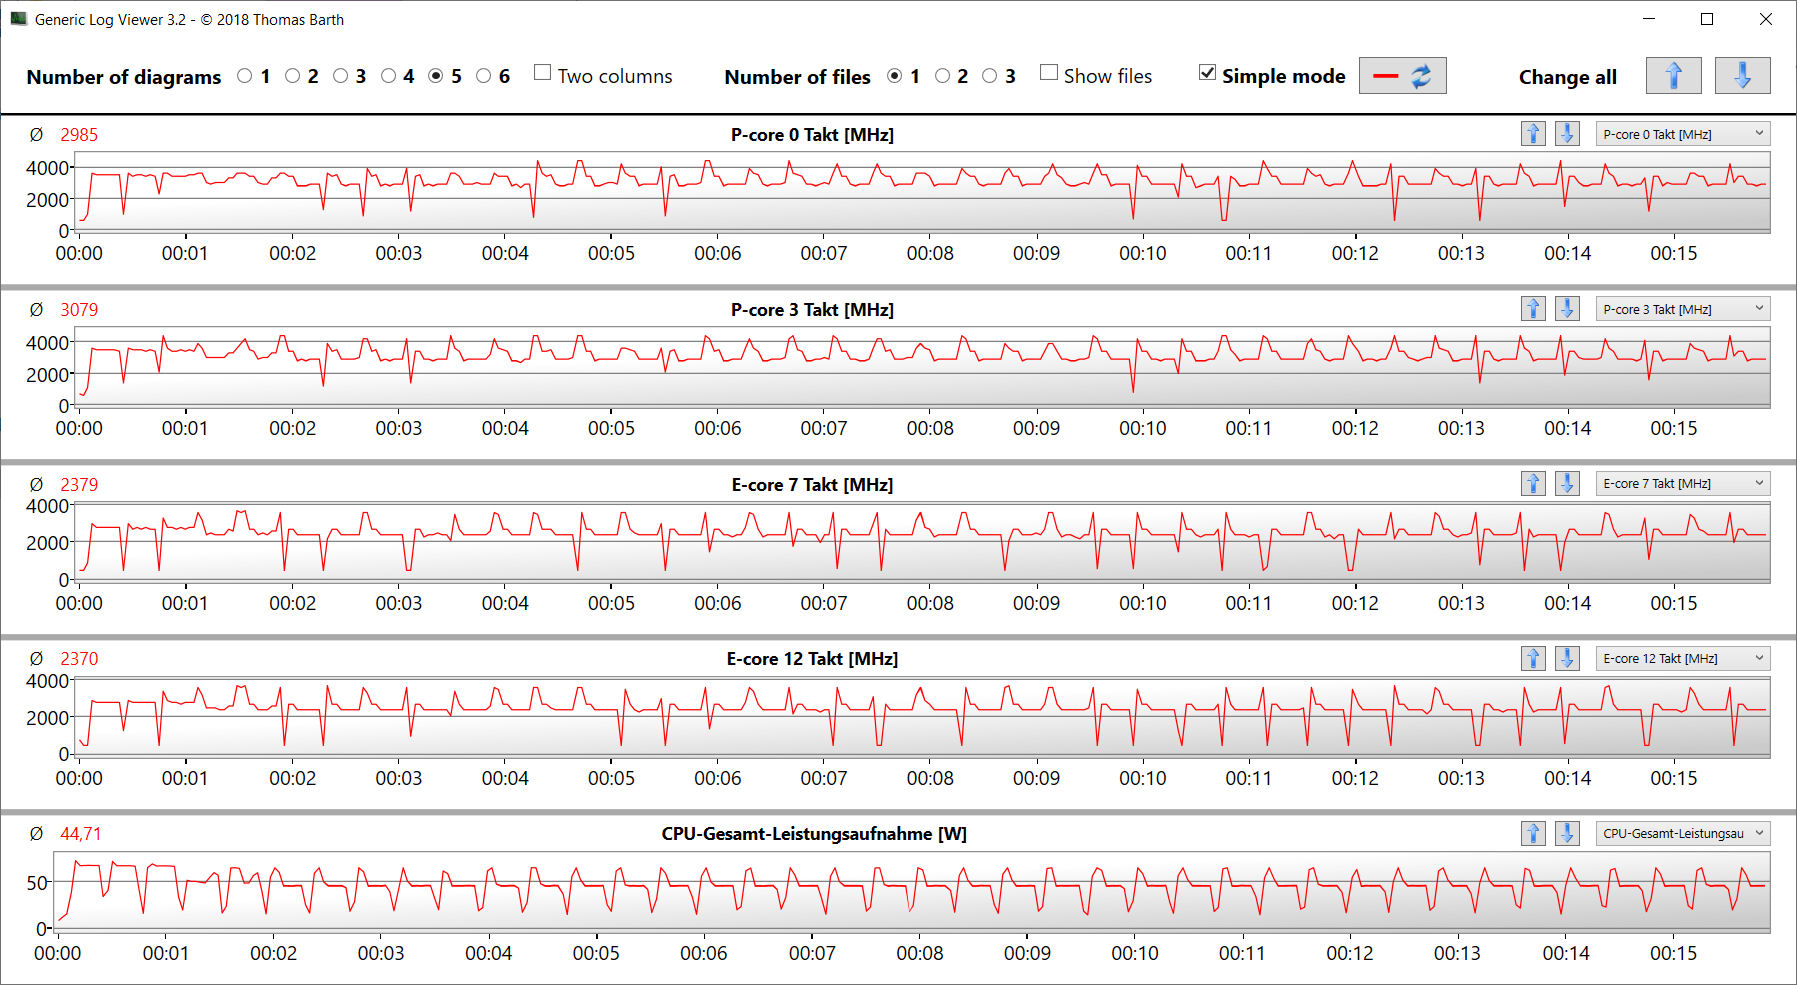
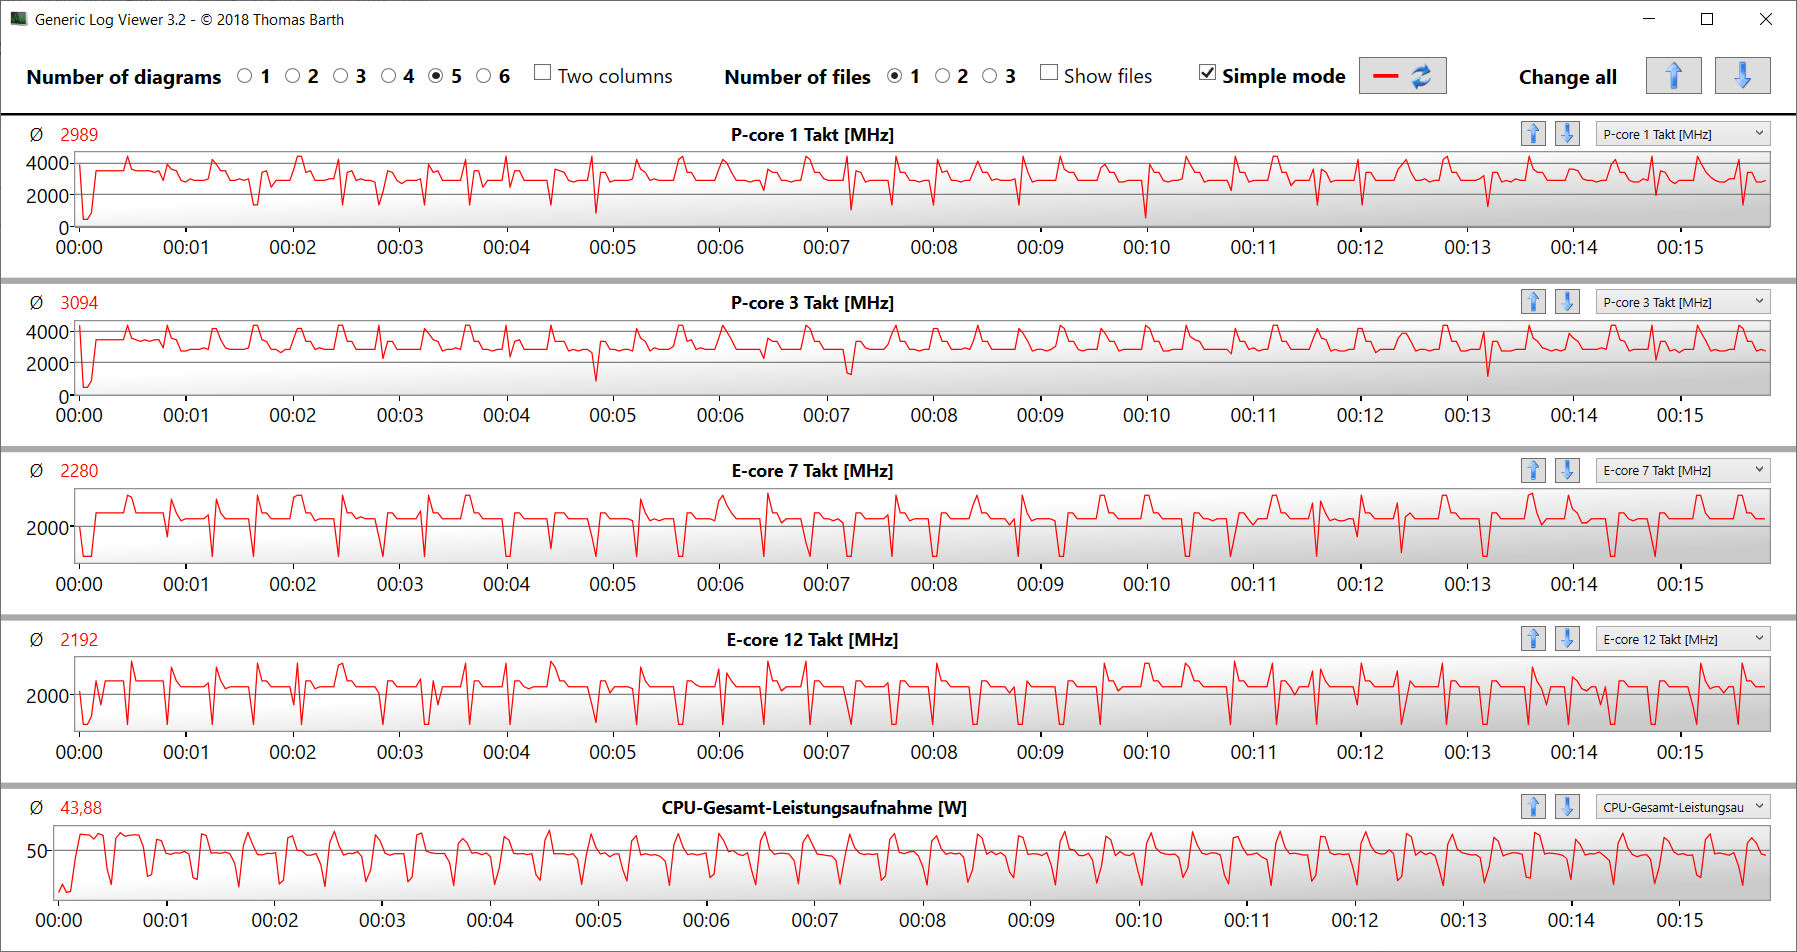
El procesador pasa la prueba multihilo del benchmark Cinebench R15 con velocidades de reloj en el rango Turbo medio (P: 3,3 - 3,4 GHz, E: 2,8 - 2,9 GHz). La prueba de un solo hilo utiliza la velocidad de reloj Turbo completa (P: 3,5 - 4,8 GHz, E: 400 MHz - 3,5 GHz). En funcionamiento en batería, las velocidades de reloj son mínimamente inferiores. Aquí utilizamos el perfil "Alto rendimiento". Cuando se utilizan los otros tres perfiles de potencia, las velocidades de reloj son significativamente más bajas en las partes
Mientras que la prueba de bucle CB15 confirma el uso constante de la velocidad Turbo de la CPU, la velocidad de reloj cae ligeramente después de la tercera ejecución.
Cinebench R15 Multi Constant Load Test
* ... más pequeño es mejor
AIDA64: FP32 Ray-Trace | FPU Julia | CPU SHA3 | CPU Queen | FPU SinJulia | FPU Mandel | CPU AES | CPU ZLib | FP64 Ray-Trace | CPU PhotoWorxx
| Performance rating | |
| MSI Summit E16 Flip A12UDT-031 | |
| Media de la clase Convertible | |
| Medio Intel Core i7-1280P | |
| Samsung Galaxy Book Pro 360 15 NP950QDB-KC3DE | |
| Dell Inspiron 16 7620 2-in-1 | |
| Asus ExpertBook B2 Flip B2502FBA-N80141X | |
| AIDA64 / FP32 Ray-Trace | |
| Media de la clase Convertible (1480 - 64158, n=47, últimos 2 años) | |
| MSI Summit E16 Flip A12UDT-031 | |
| Medio Intel Core i7-1280P (7466 - 13068, n=6) | |
| Samsung Galaxy Book Pro 360 15 NP950QDB-KC3DE | |
| Asus ExpertBook B2 Flip B2502FBA-N80141X | |
| Dell Inspiron 16 7620 2-in-1 | |
| AIDA64 / FPU Julia | |
| MSI Summit E16 Flip A12UDT-031 | |
| Media de la clase Convertible (11392 - 184800, n=47, últimos 2 años) | |
| Medio Intel Core i7-1280P (38904 - 66081, n=6) | |
| Asus ExpertBook B2 Flip B2502FBA-N80141X | |
| Samsung Galaxy Book Pro 360 15 NP950QDB-KC3DE | |
| Dell Inspiron 16 7620 2-in-1 | |
| AIDA64 / CPU SHA3 | |
| MSI Summit E16 Flip A12UDT-031 | |
| Media de la clase Convertible (797 - 8291, n=47, últimos 2 años) | |
| Medio Intel Core i7-1280P (1826 - 2992, n=6) | |
| Samsung Galaxy Book Pro 360 15 NP950QDB-KC3DE | |
| Dell Inspiron 16 7620 2-in-1 | |
| Asus ExpertBook B2 Flip B2502FBA-N80141X | |
| AIDA64 / CPU Queen | |
| MSI Summit E16 Flip A12UDT-031 | |
| Medio Intel Core i7-1280P (80180 - 100358, n=6) | |
| Dell Inspiron 16 7620 2-in-1 | |
| Media de la clase Convertible (14686 - 148874, n=38, últimos 2 años) | |
| Asus ExpertBook B2 Flip B2502FBA-N80141X | |
| Samsung Galaxy Book Pro 360 15 NP950QDB-KC3DE | |
| AIDA64 / FPU SinJulia | |
| MSI Summit E16 Flip A12UDT-031 | |
| Media de la clase Convertible (1120 - 29155, n=47, últimos 2 años) | |
| Medio Intel Core i7-1280P (5880 - 8571, n=6) | |
| Dell Inspiron 16 7620 2-in-1 | |
| Asus ExpertBook B2 Flip B2502FBA-N80141X | |
| Samsung Galaxy Book Pro 360 15 NP950QDB-KC3DE | |
| AIDA64 / FPU Mandel | |
| MSI Summit E16 Flip A12UDT-031 | |
| Media de la clase Convertible (4929 - 97193, n=47, últimos 2 años) | |
| Medio Intel Core i7-1280P (18907 - 32766, n=6) | |
| Samsung Galaxy Book Pro 360 15 NP950QDB-KC3DE | |
| Asus ExpertBook B2 Flip B2502FBA-N80141X | |
| Dell Inspiron 16 7620 2-in-1 | |
| AIDA64 / CPU AES | |
| Samsung Galaxy Book Pro 360 15 NP950QDB-KC3DE | |
| MSI Summit E16 Flip A12UDT-031 | |
| Medio Intel Core i7-1280P (40691 - 99367, n=6) | |
| Media de la clase Convertible (5271 - 190280, n=47, últimos 2 años) | |
| Dell Inspiron 16 7620 2-in-1 | |
| Asus ExpertBook B2 Flip B2502FBA-N80141X | |
| AIDA64 / CPU ZLib | |
| MSI Summit E16 Flip A12UDT-031 | |
| Medio Intel Core i7-1280P (540 - 880, n=6) | |
| Media de la clase Convertible (218 - 2017, n=47, últimos 2 años) | |
| Dell Inspiron 16 7620 2-in-1 | |
| Asus ExpertBook B2 Flip B2502FBA-N80141X | |
| Samsung Galaxy Book Pro 360 15 NP950QDB-KC3DE | |
| AIDA64 / FP64 Ray-Trace | |
| Media de la clase Convertible (1169 - 34297, n=47, últimos 2 años) | |
| MSI Summit E16 Flip A12UDT-031 | |
| Medio Intel Core i7-1280P (4006 - 7184, n=6) | |
| Samsung Galaxy Book Pro 360 15 NP950QDB-KC3DE | |
| Asus ExpertBook B2 Flip B2502FBA-N80141X | |
| Dell Inspiron 16 7620 2-in-1 | |
| AIDA64 / CPU PhotoWorxx | |
| Media de la clase Convertible (14193 - 85327, n=47, últimos 2 años) | |
| Medio Intel Core i7-1280P (36663 - 48416, n=6) | |
| MSI Summit E16 Flip A12UDT-031 | |
| Samsung Galaxy Book Pro 360 15 NP950QDB-KC3DE | |
| Asus ExpertBook B2 Flip B2502FBA-N80141X | |
| Dell Inspiron 16 7620 2-in-1 | |
Rendimiento del sistema
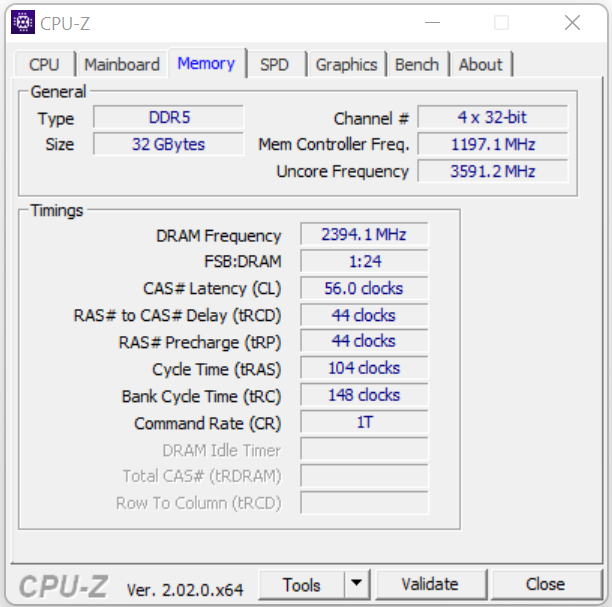
El sistema, que funciona sin problemas, ofrece un rendimiento más que suficiente para las aplicaciones de Office e Internet. El núcleo gráfico dedicado también permite ejecutar tareas intensivas de gráficos. Las tasas de transferencia de la memoria de trabajo están a un nivel normal para el almacenamiento LPDDR5-4800 (modo de doble canal, soldado, sin bancos de almacenamiento). Esto va acompañado de muy buenos resultados en PC-Mark.
CrossMark: Overall | Productivity | Creativity | Responsiveness
| PCMark 10 / Score | |
| Media de la clase Convertible (3229 - 10123, n=45, últimos 2 años) | |
| Medio Intel Core i7-1280P, NVIDIA GeForce RTX 3050 Ti Laptop GPU (5984 - 6379, n=2) | |
| MSI Summit E16 Flip A12UDT-031 | |
| Dell Inspiron 16 7620 2-in-1 | |
| Samsung Galaxy Book Pro 360 15 NP950QDB-KC3DE | |
| Asus ExpertBook B2 Flip B2502FBA-N80141X | |
| PCMark 10 / Essentials | |
| Media de la clase Convertible (7233 - 12222, n=45, últimos 2 años) | |
| Medio Intel Core i7-1280P, NVIDIA GeForce RTX 3050 Ti Laptop GPU (9687 - 10227, n=2) | |
| MSI Summit E16 Flip A12UDT-031 | |
| Samsung Galaxy Book Pro 360 15 NP950QDB-KC3DE | |
| Dell Inspiron 16 7620 2-in-1 | |
| Asus ExpertBook B2 Flip B2502FBA-N80141X | |
| PCMark 10 / Productivity | |
| Media de la clase Convertible (5062 - 17914, n=45, últimos 2 años) | |
| Medio Intel Core i7-1280P, NVIDIA GeForce RTX 3050 Ti Laptop GPU (7521 - 9165, n=2) | |
| MSI Summit E16 Flip A12UDT-031 | |
| Samsung Galaxy Book Pro 360 15 NP950QDB-KC3DE | |
| Asus ExpertBook B2 Flip B2502FBA-N80141X | |
| Dell Inspiron 16 7620 2-in-1 | |
| PCMark 10 / Digital Content Creation | |
| Media de la clase Convertible (2496 - 16551, n=45, últimos 2 años) | |
| MSI Summit E16 Flip A12UDT-031 | |
| Medio Intel Core i7-1280P, NVIDIA GeForce RTX 3050 Ti Laptop GPU (7518 - 7980, n=2) | |
| Dell Inspiron 16 7620 2-in-1 | |
| Asus ExpertBook B2 Flip B2502FBA-N80141X | |
| Samsung Galaxy Book Pro 360 15 NP950QDB-KC3DE | |
| CrossMark / Overall | |
| Medio Intel Core i7-1280P, NVIDIA GeForce RTX 3050 Ti Laptop GPU (1652 - 1671, n=2) | |
| MSI Summit E16 Flip A12UDT-031 | |
| Media de la clase Convertible (524 - 2274, n=48, últimos 2 años) | |
| Dell Inspiron 16 7620 2-in-1 | |
| Asus ExpertBook B2 Flip B2502FBA-N80141X | |
| CrossMark / Productivity | |
| Medio Intel Core i7-1280P, NVIDIA GeForce RTX 3050 Ti Laptop GPU (1583 - 1618, n=2) | |
| MSI Summit E16 Flip A12UDT-031 | |
| Media de la clase Convertible (554 - 1942, n=48, últimos 2 años) | |
| Asus ExpertBook B2 Flip B2502FBA-N80141X | |
| Dell Inspiron 16 7620 2-in-1 | |
| CrossMark / Creativity | |
| Media de la clase Convertible (550 - 2949, n=48, últimos 2 años) | |
| MSI Summit E16 Flip A12UDT-031 | |
| Medio Intel Core i7-1280P, NVIDIA GeForce RTX 3050 Ti Laptop GPU (1752 - 1761, n=2) | |
| Dell Inspiron 16 7620 2-in-1 | |
| Asus ExpertBook B2 Flip B2502FBA-N80141X | |
| CrossMark / Responsiveness | |
| Medio Intel Core i7-1280P, NVIDIA GeForce RTX 3050 Ti Laptop GPU (1550 - 1594, n=2) | |
| MSI Summit E16 Flip A12UDT-031 | |
| Asus ExpertBook B2 Flip B2502FBA-N80141X | |
| Media de la clase Convertible (381 - 1719, n=48, últimos 2 años) | |
| Dell Inspiron 16 7620 2-in-1 | |
| PCMark 10 Score | 5984 puntos | |
ayuda | ||
| AIDA64 / Memory Copy | |
| Media de la clase Convertible (23880 - 161475, n=47, últimos 2 años) | |
| Medio Intel Core i7-1280P (56337 - 73486, n=6) | |
| MSI Summit E16 Flip A12UDT-031 | |
| Samsung Galaxy Book Pro 360 15 NP950QDB-KC3DE | |
| Asus ExpertBook B2 Flip B2502FBA-N80141X | |
| Dell Inspiron 16 7620 2-in-1 | |
| AIDA64 / Memory Read | |
| Media de la clase Convertible (19931 - 131960, n=47, últimos 2 años) | |
| Medio Intel Core i7-1280P (63221 - 73719, n=6) | |
| MSI Summit E16 Flip A12UDT-031 | |
| Samsung Galaxy Book Pro 360 15 NP950QDB-KC3DE | |
| Asus ExpertBook B2 Flip B2502FBA-N80141X | |
| Dell Inspiron 16 7620 2-in-1 | |
| AIDA64 / Memory Write | |
| Media de la clase Convertible (17473 - 216896, n=47, últimos 2 años) | |
| Samsung Galaxy Book Pro 360 15 NP950QDB-KC3DE | |
| Medio Intel Core i7-1280P (58729 - 68247, n=6) | |
| MSI Summit E16 Flip A12UDT-031 | |
| Asus ExpertBook B2 Flip B2502FBA-N80141X | |
| Dell Inspiron 16 7620 2-in-1 | |
| AIDA64 / Memory Latency | |
| MSI Summit E16 Flip A12UDT-031 | |
| Media de la clase Convertible (6.9 - 536, n=47, últimos 2 años) | |
| Medio Intel Core i7-1280P (93.1 - 153.3, n=6) | |
| Samsung Galaxy Book Pro 360 15 NP950QDB-KC3DE | |
| Asus ExpertBook B2 Flip B2502FBA-N80141X | |
* ... más pequeño es mejor
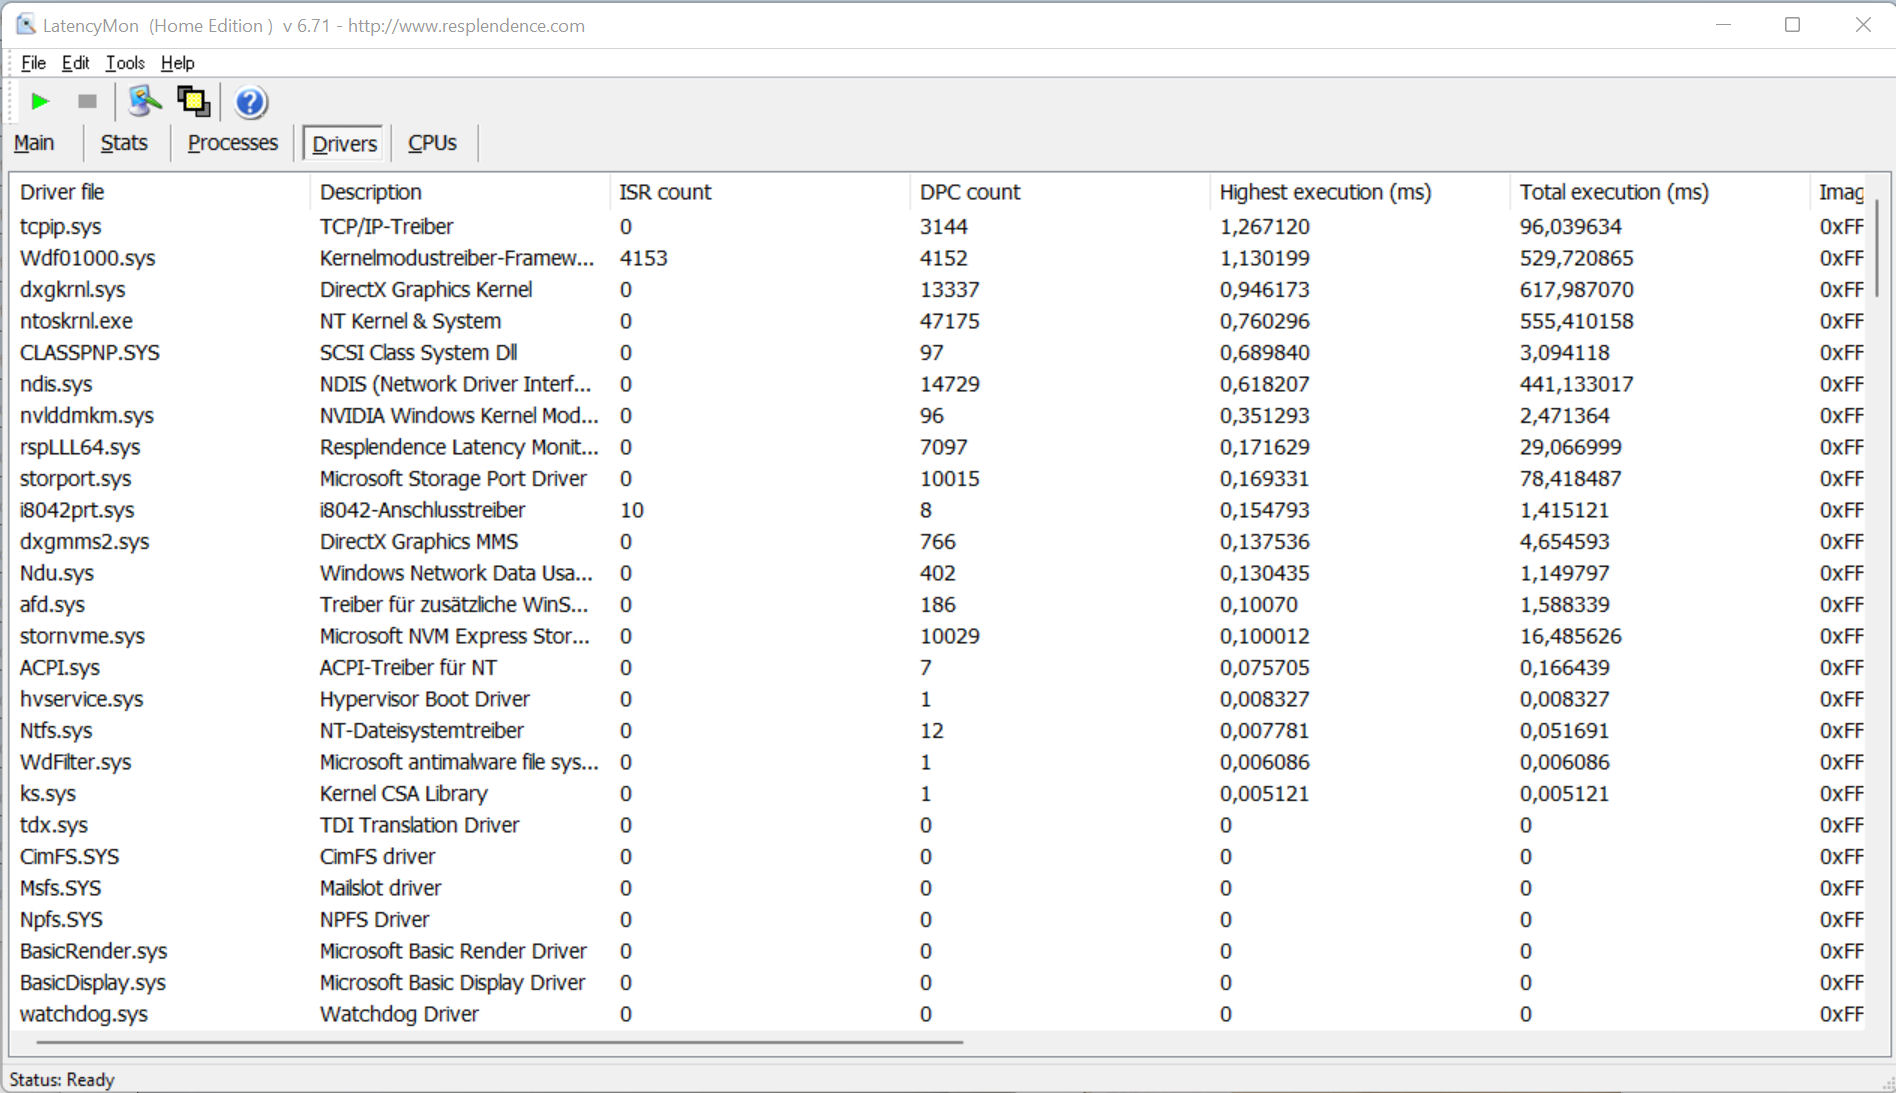
Latencias del CPD
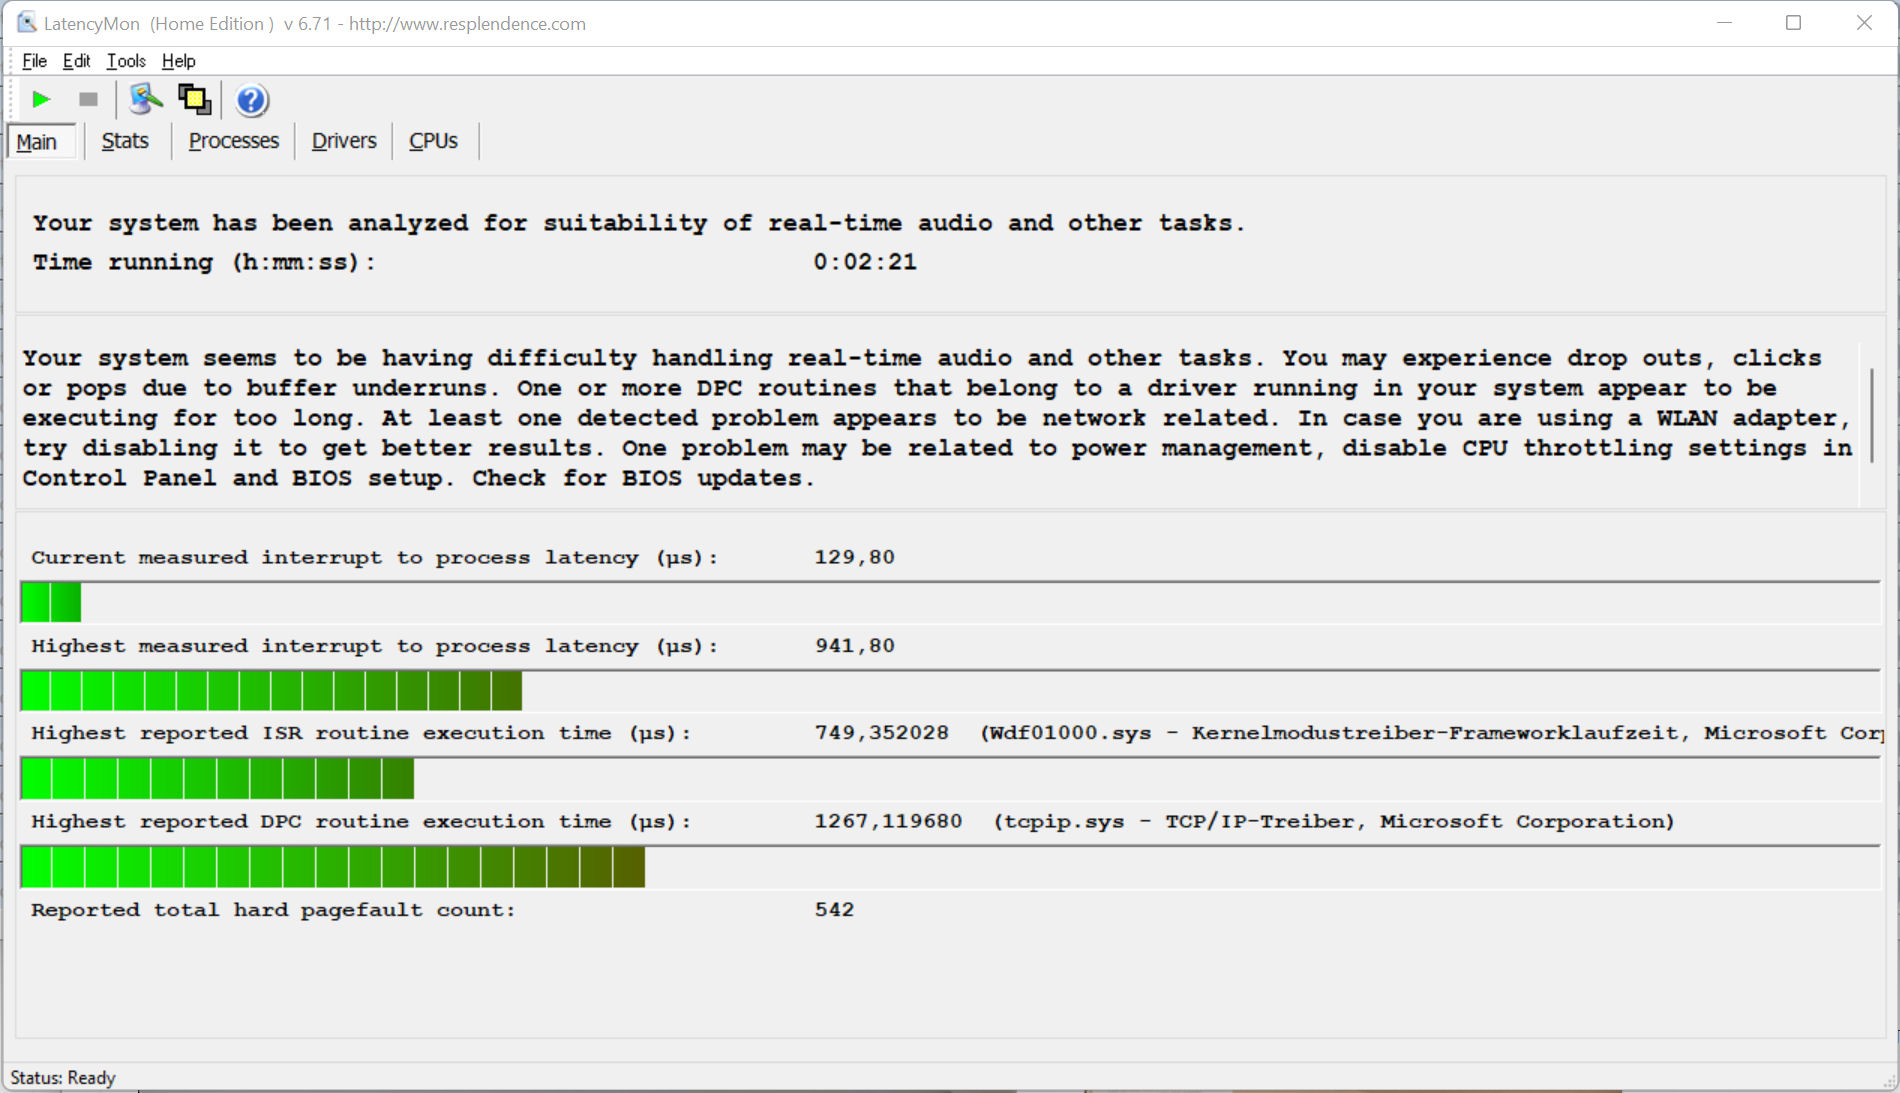
La prueba estandarizada del Monitor de Latencia (navegación web, reproducción de vídeos 4k, Prime95 High Load) revela algunos comportamientos llamativos en las latencias del DCP. El sistema no parece ser adecuado para el procesamiento de vídeo y audio en tiempo real. Algunas futuras actualizaciones de software podrían traer algunas mejoras o incluso empeorar las cosas.
| DPC Latencies / LatencyMon - interrupt to process latency (max), Web, Youtube, Prime95 | |
| Samsung Galaxy Book Pro 360 15 NP950QDB-KC3DE | |
| MSI Summit E16 Flip A12UDT-031 | |
| Asus ExpertBook B2 Flip B2502FBA-N80141X | |
| Dell Inspiron 16 7620 2-in-1 | |
* ... más pequeño es mejor
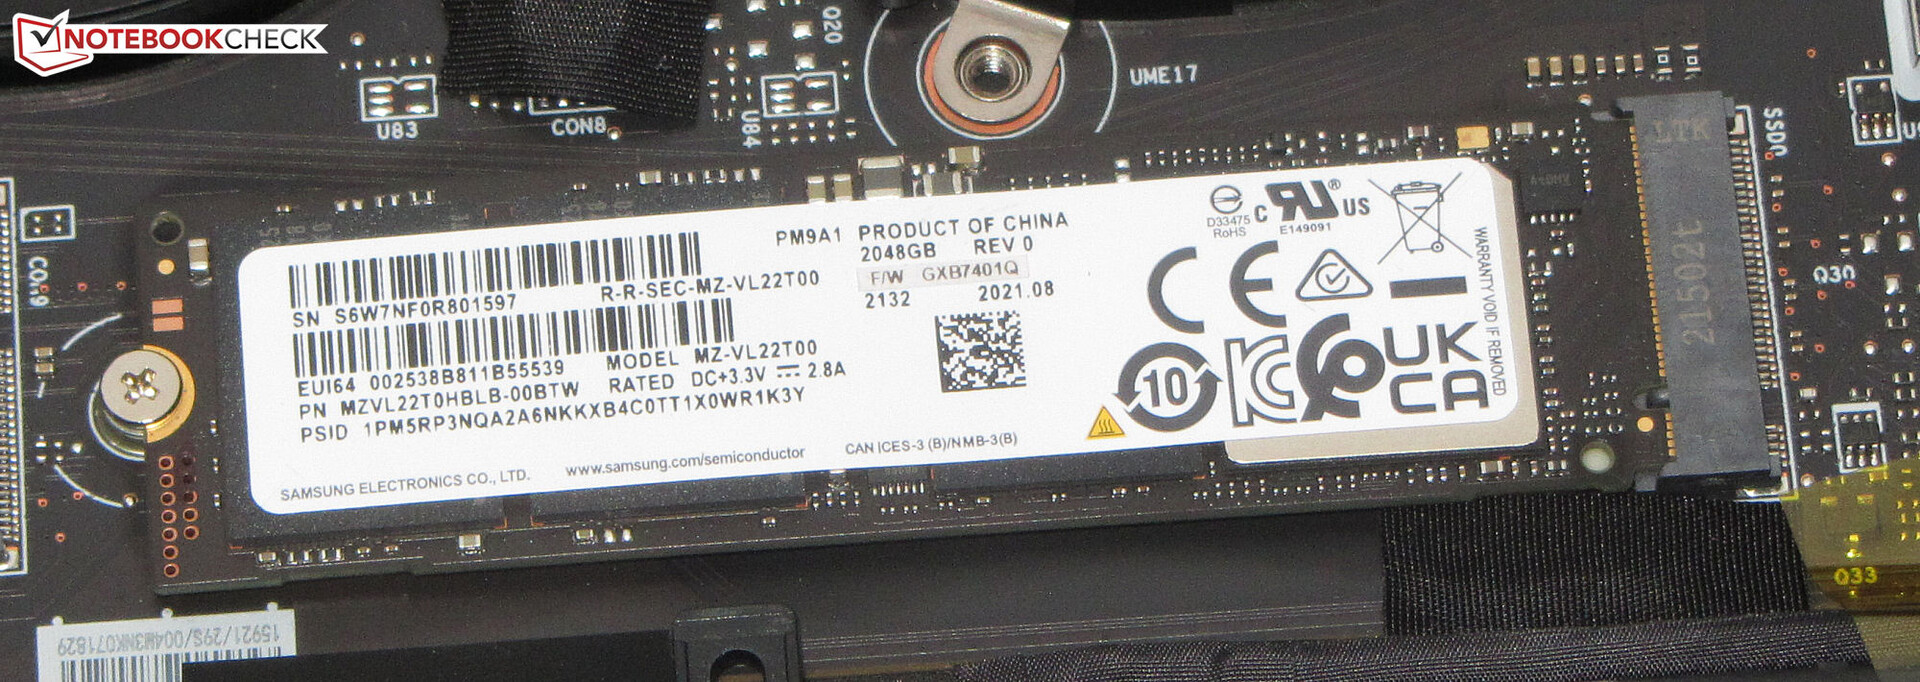
Solución de almacenamiento
Un SSD PCIe 4 (M.2-2280) de Samsung con una capacidad de almacenamiento de 2 TB sirve como unidad de sistema. Las tasas de transferencia resultan excelentes.

* ... más pequeño es mejor
Constant Performance Reading: DiskSpd Read Loop, Queue Depth 8
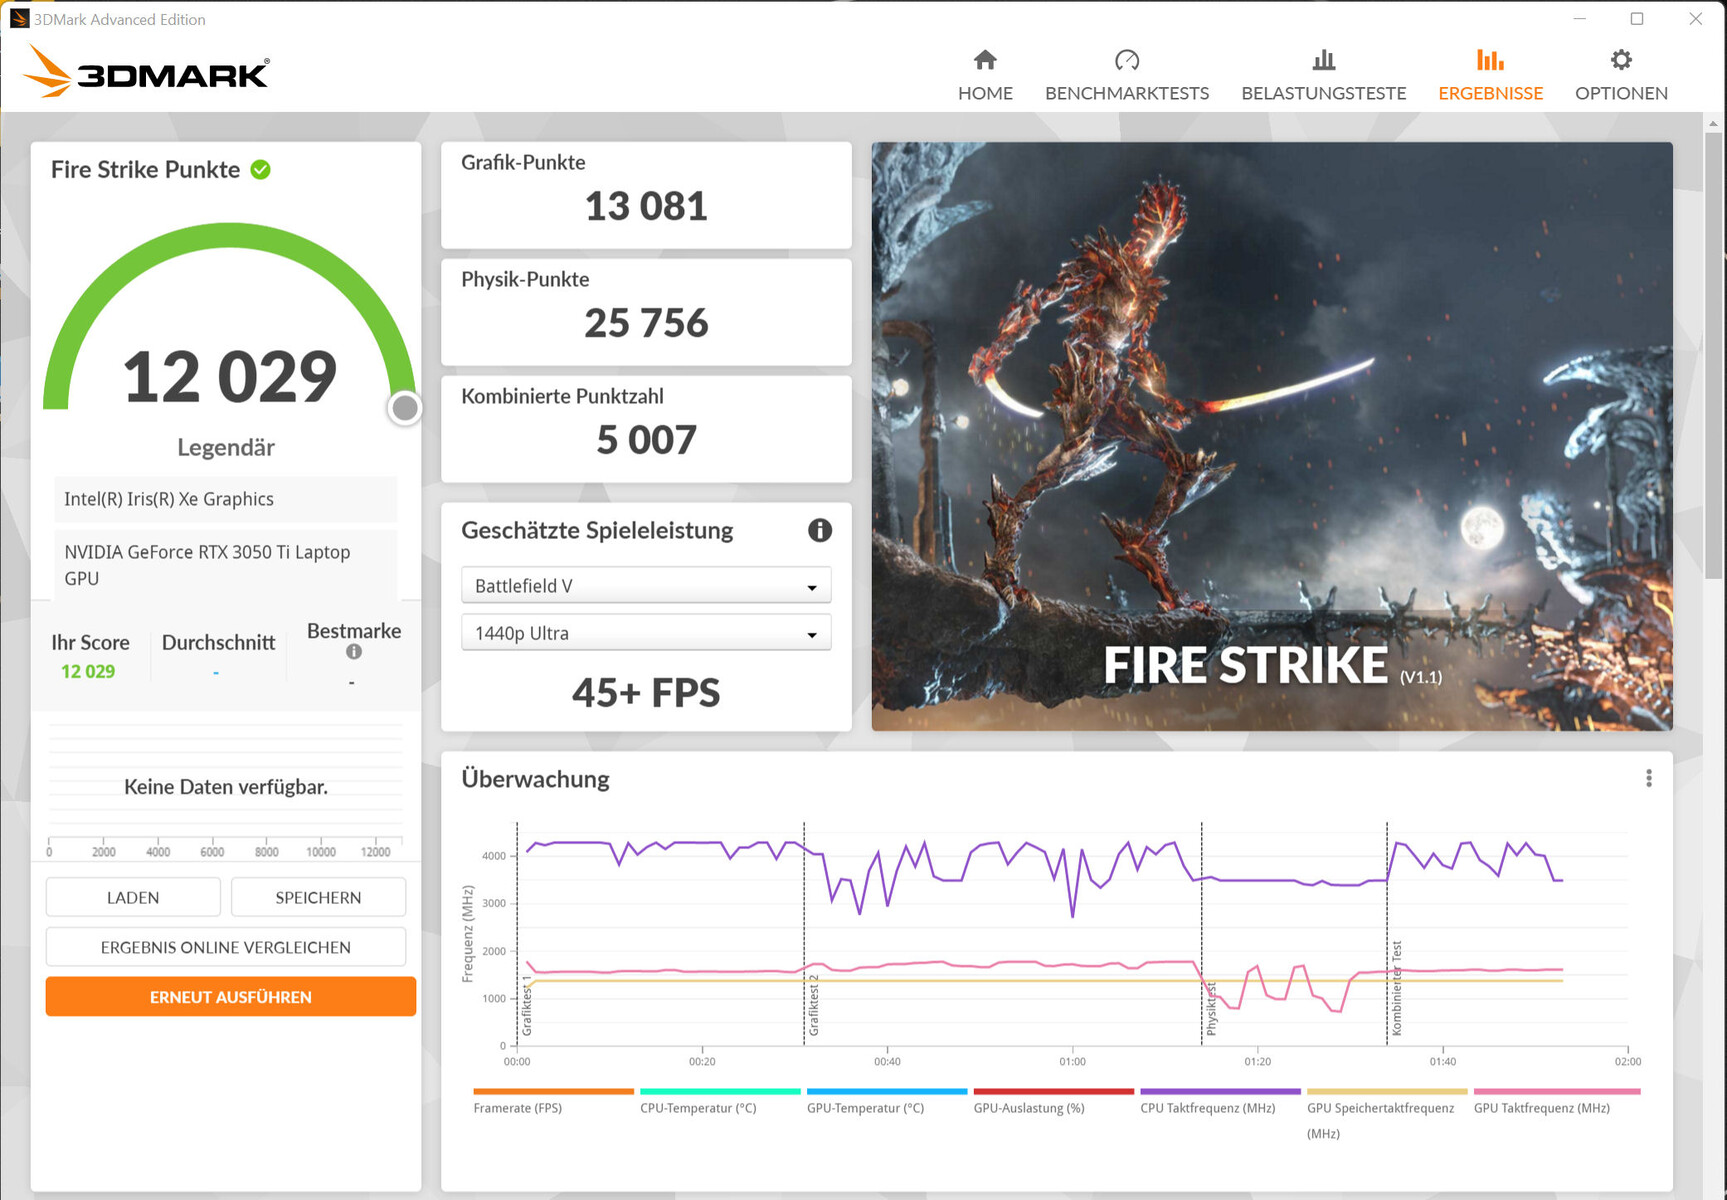
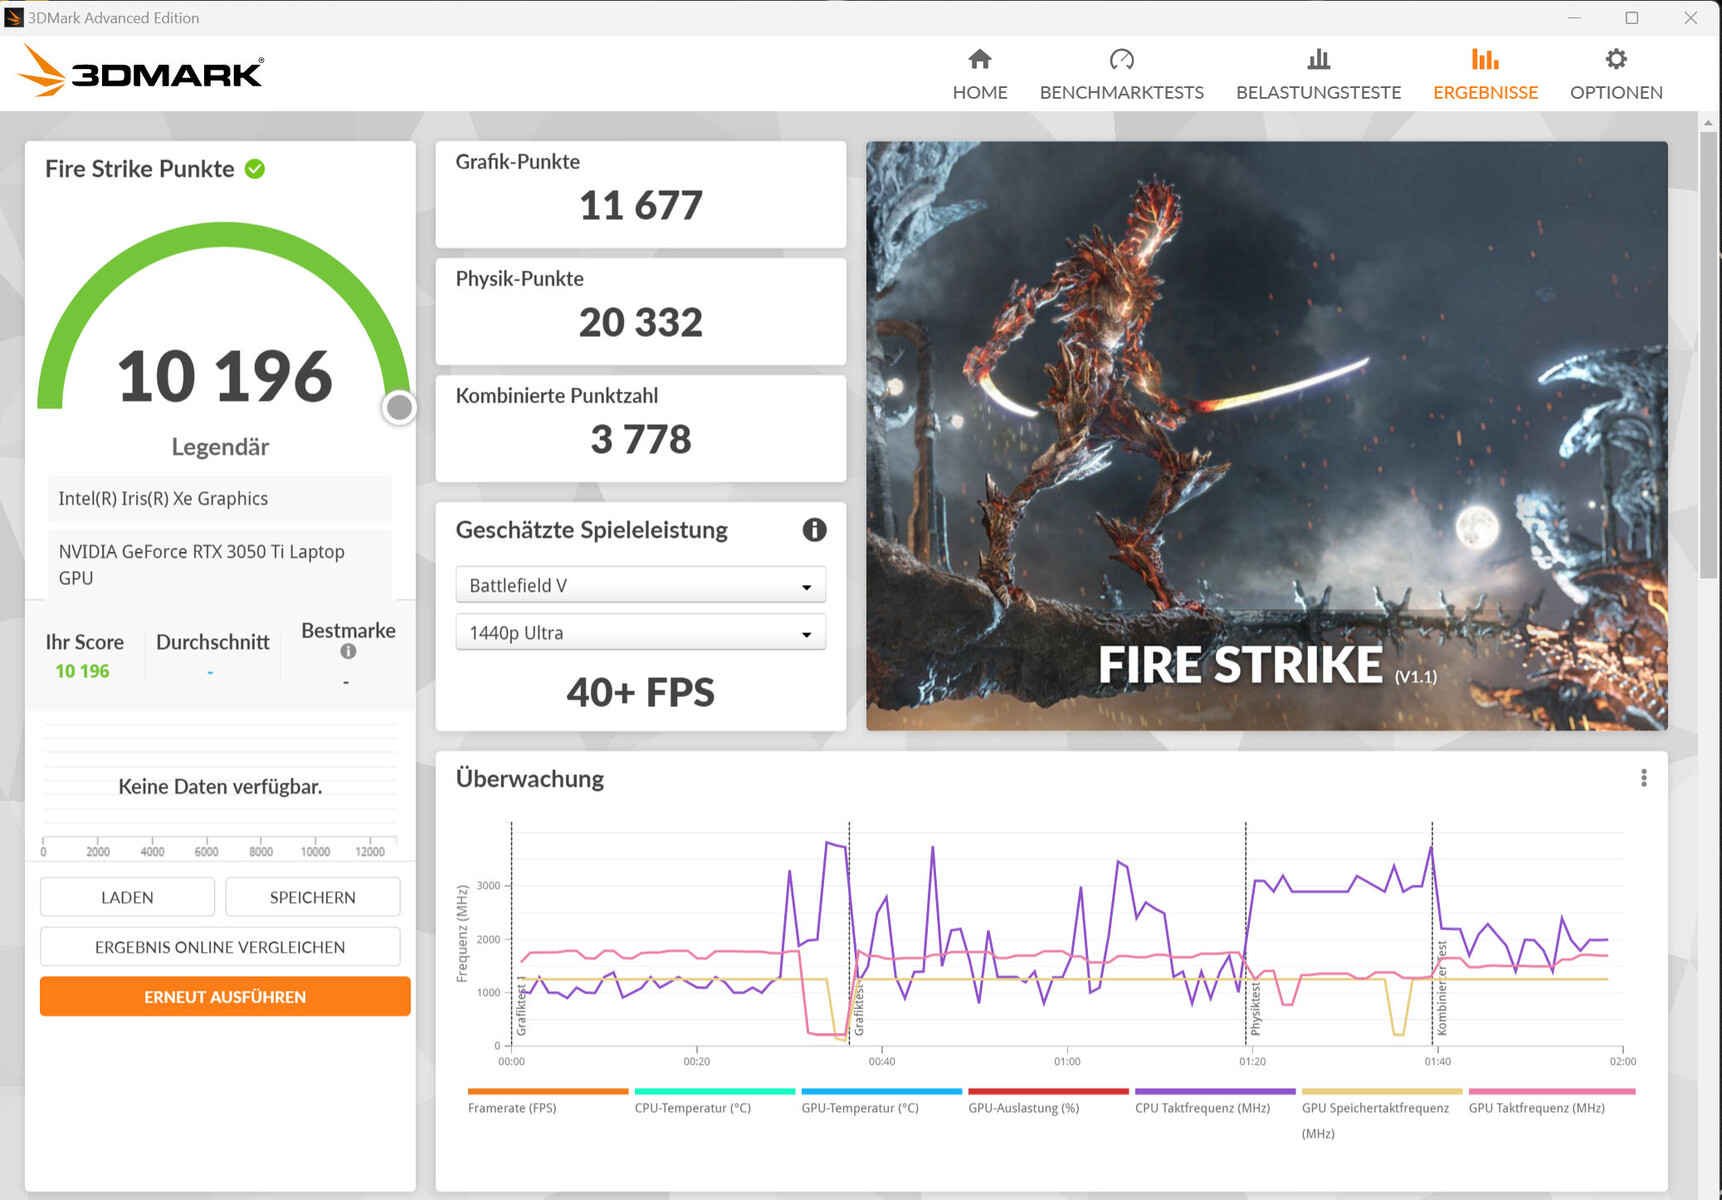
Tarjeta gráfica
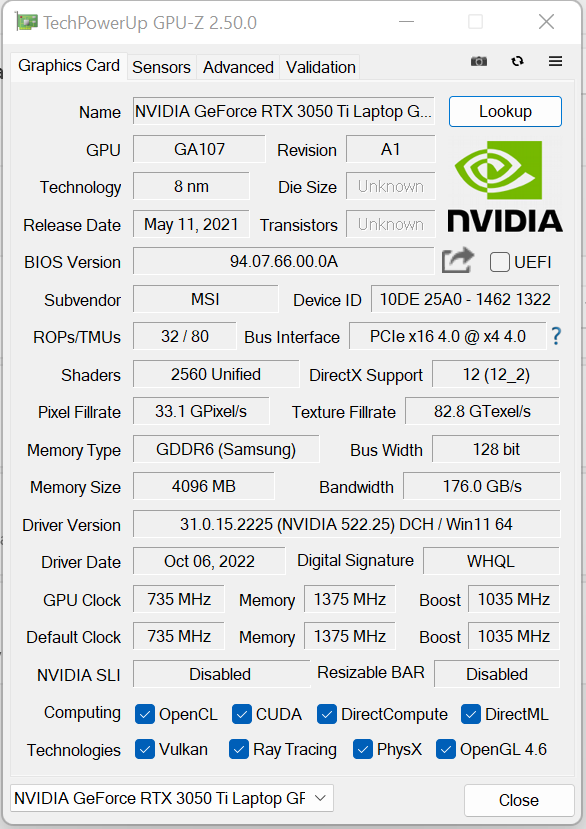
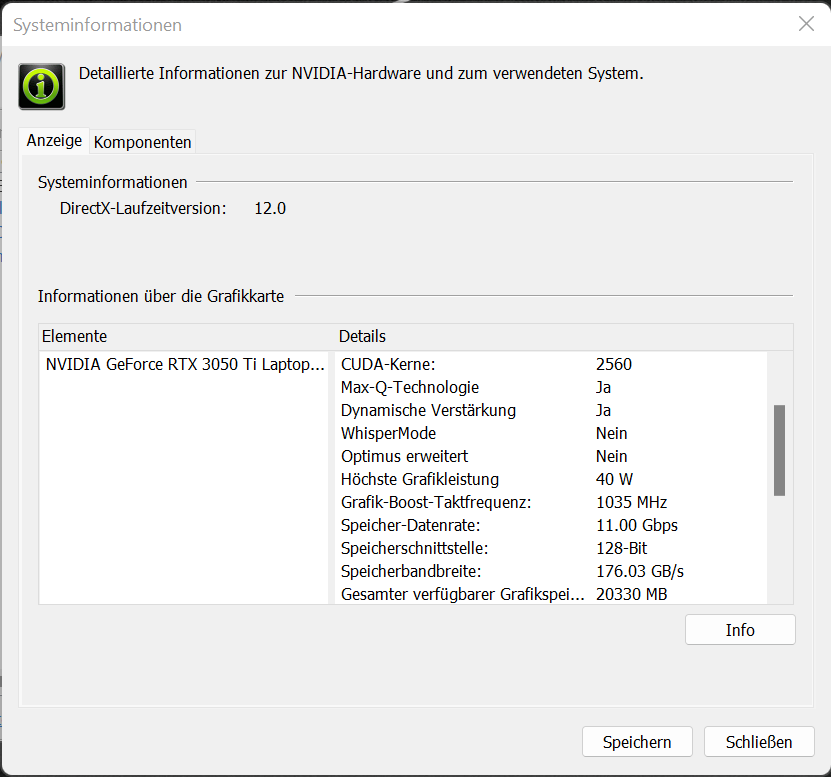
A pesar de un ajuste TGP de 40 vatios en la parte inferior de las posibilidades, la GeForce RTX 3050 Ti para portátilesgPU (VRAM: 4 GB GDDR6) ofrece resultados de benchmark y velocidades de cuadro que se acercan a la media de la RTX 3050 Ti determinada hasta ahora. Sin embargo, la TGP no se aprovecha del todo, como muestra la prueba Witcher 3.
El portátil permite jugar en FHD con ajustes altos o máximos. Usar la resolución completa de la pantalla suele requerir reducir los ajustes. El convertible no ofrece un modo dGPU.

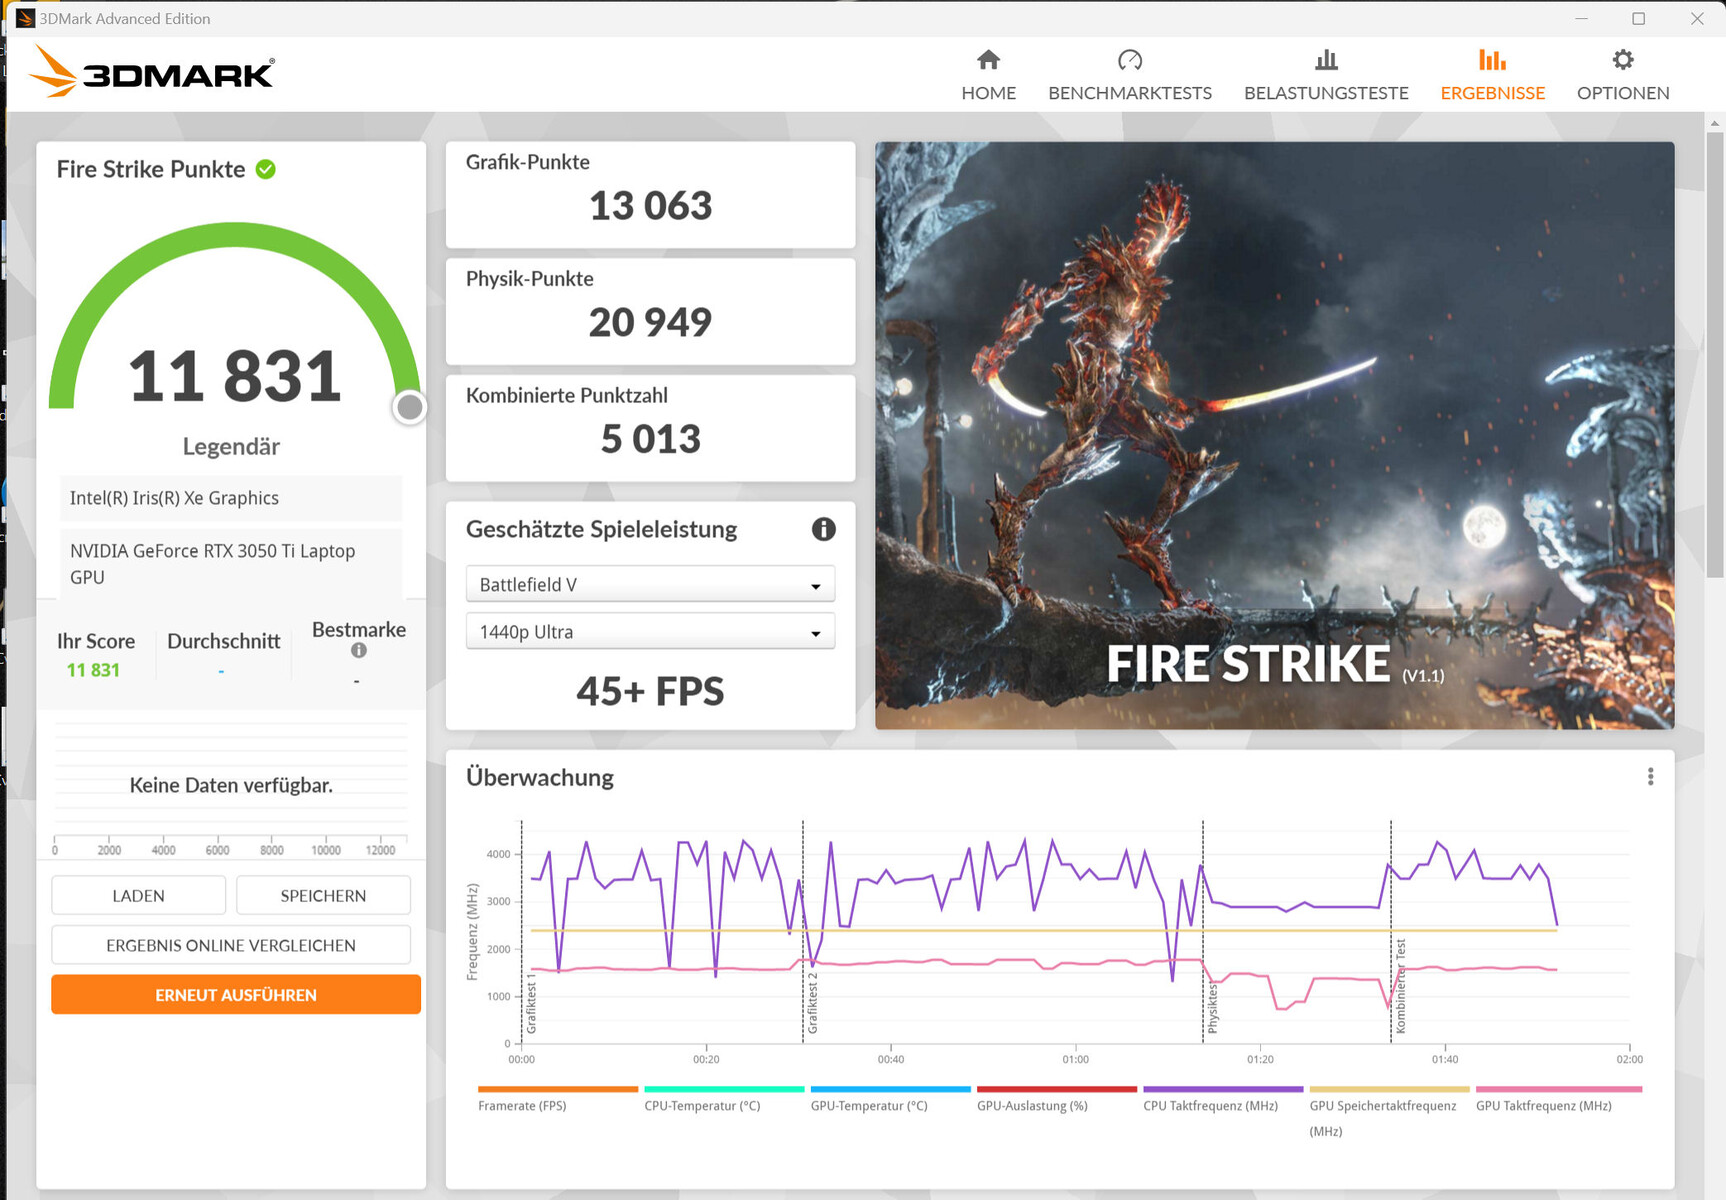
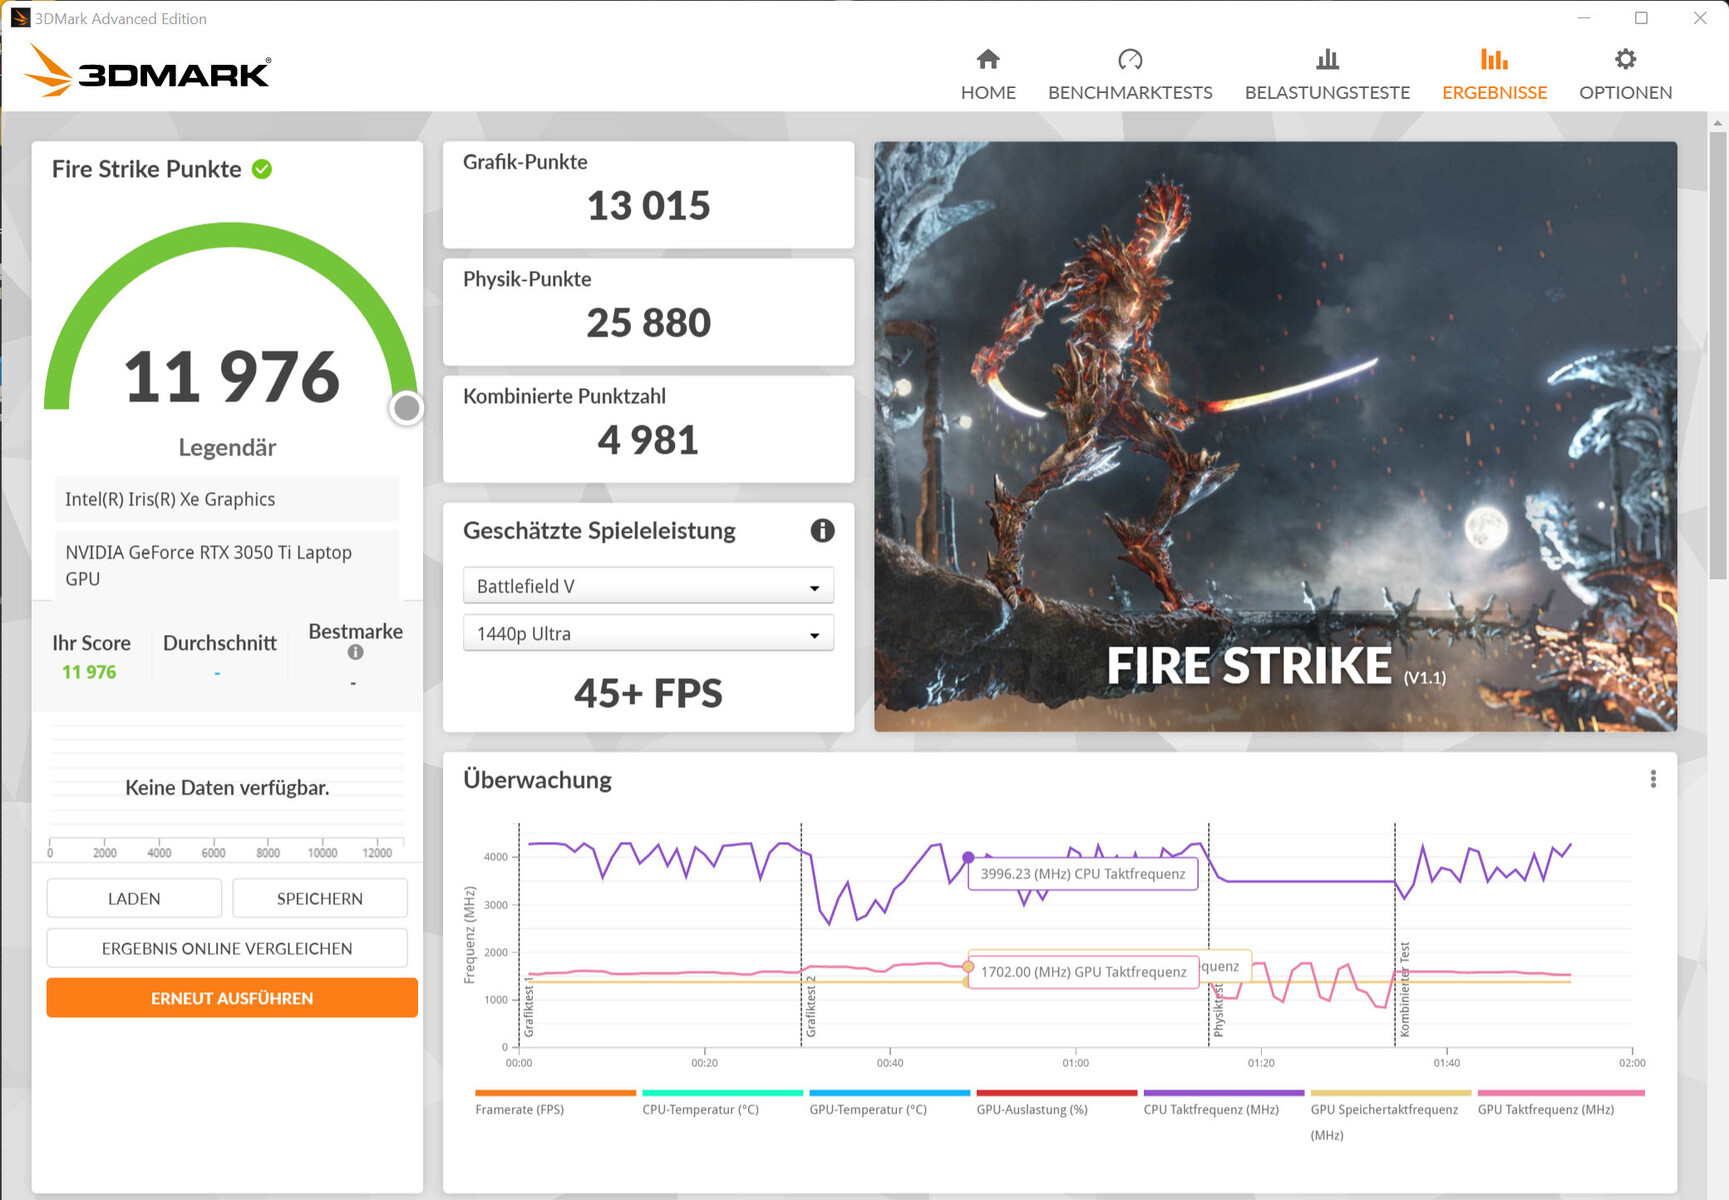
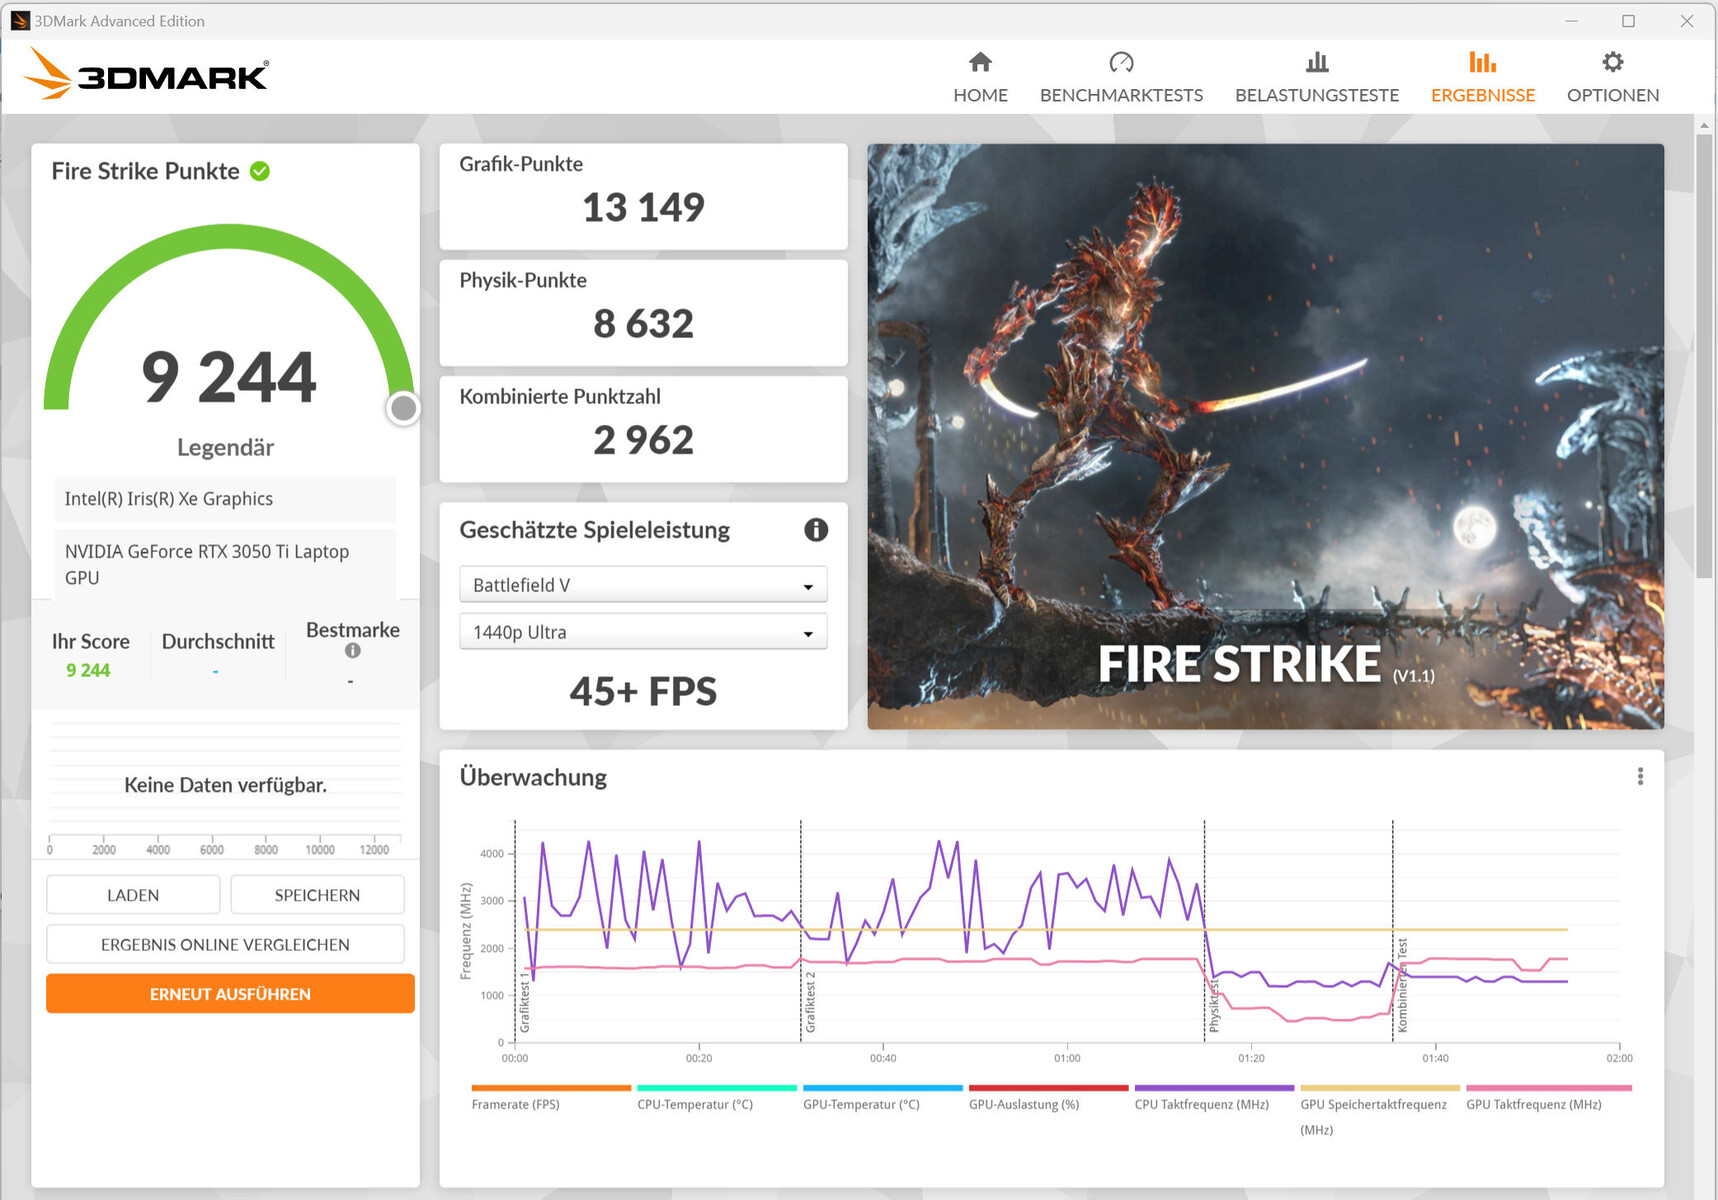
| 3DMark 11 Performance | 17757 puntos | |
| 3DMark Cloud Gate Standard Score | 42521 puntos | |
| 3DMark Fire Strike Score | 12029 puntos | |
| 3DMark Time Spy Score | 5563 puntos | |
ayuda | ||
| Blender | |
| v3.3 Classroom OPTIX/RTX | |
| MSI Summit E16 Flip A12UDT-031 | |
| v3.3 Classroom CUDA | |
| MSI Summit E16 Flip A12UDT-031 | |
| v3.3 Classroom CPU | |
| Asus ExpertBook B2 Flip B2502FBA-N80141X | |
| Media de la clase Convertible (159 - 2067, n=48, últimos 2 años) | |
| MSI Summit E16 Flip A12UDT-031 | |
* ... más pequeño es mejor
| The Witcher 3 - 1920x1080 Ultra Graphics & Postprocessing (HBAO+) | |
| Dell Inspiron 16 Plus 7620 | |
| Asus Zenbook Pro 15 OLED UM535Q | |
| Medio NVIDIA GeForce RTX 3050 Ti Laptop GPU (19 - 58.5, n=29) | |
| MSI Summit E16 Flip A12UDT-031 | |
| Media de la clase Convertible (13.4 - 101, n=3, últimos 2 años) | |
| Dell Inspiron 16 7620 2-in-1 | |
| Asus ExpertBook B2 Flip B2502FBA-N80141X | |
| F1 22 - 1920x1080 High Preset AA:T AF:16x | |
| Medio NVIDIA GeForce RTX 3050 Ti Laptop GPU (48 - 113, n=7) | |
| MSI Summit E16 Flip A12UDT-031 | |
| Media de la clase Convertible (23 - 70.3, n=10, últimos 2 años) | |
The Witcher 3 FPS Chart
| bajo | medio | alto | ultra | QHD | |
|---|---|---|---|---|---|
| GTA V (2015) | 179.7 | 173.8 | 114.3 | 57.1 | 41.4 |
| The Witcher 3 (2015) | 186.1 | 109.3 | 63.7 | 46.4 | |
| Dota 2 Reborn (2015) | 134.8 | 122.8 | 117.9 | 114.1 | |
| Final Fantasy XV Benchmark (2018) | 104.9 | 59.2 | 44.9 | 35.1 | |
| X-Plane 11.11 (2018) | 125.7 | 105.9 | 88.1 | ||
| Strange Brigade (2018) | 270 | 114.8 | 104.9 | 88.2 | 66.2 |
| F1 22 (2022) | 122.2 | 107.9 | 79.2 | 29.3 | 13.7 |
Emisiones y gestión de la energía - El portátil 2 en 1 hace mucho ruido bajo carga
Emisiones acústicas
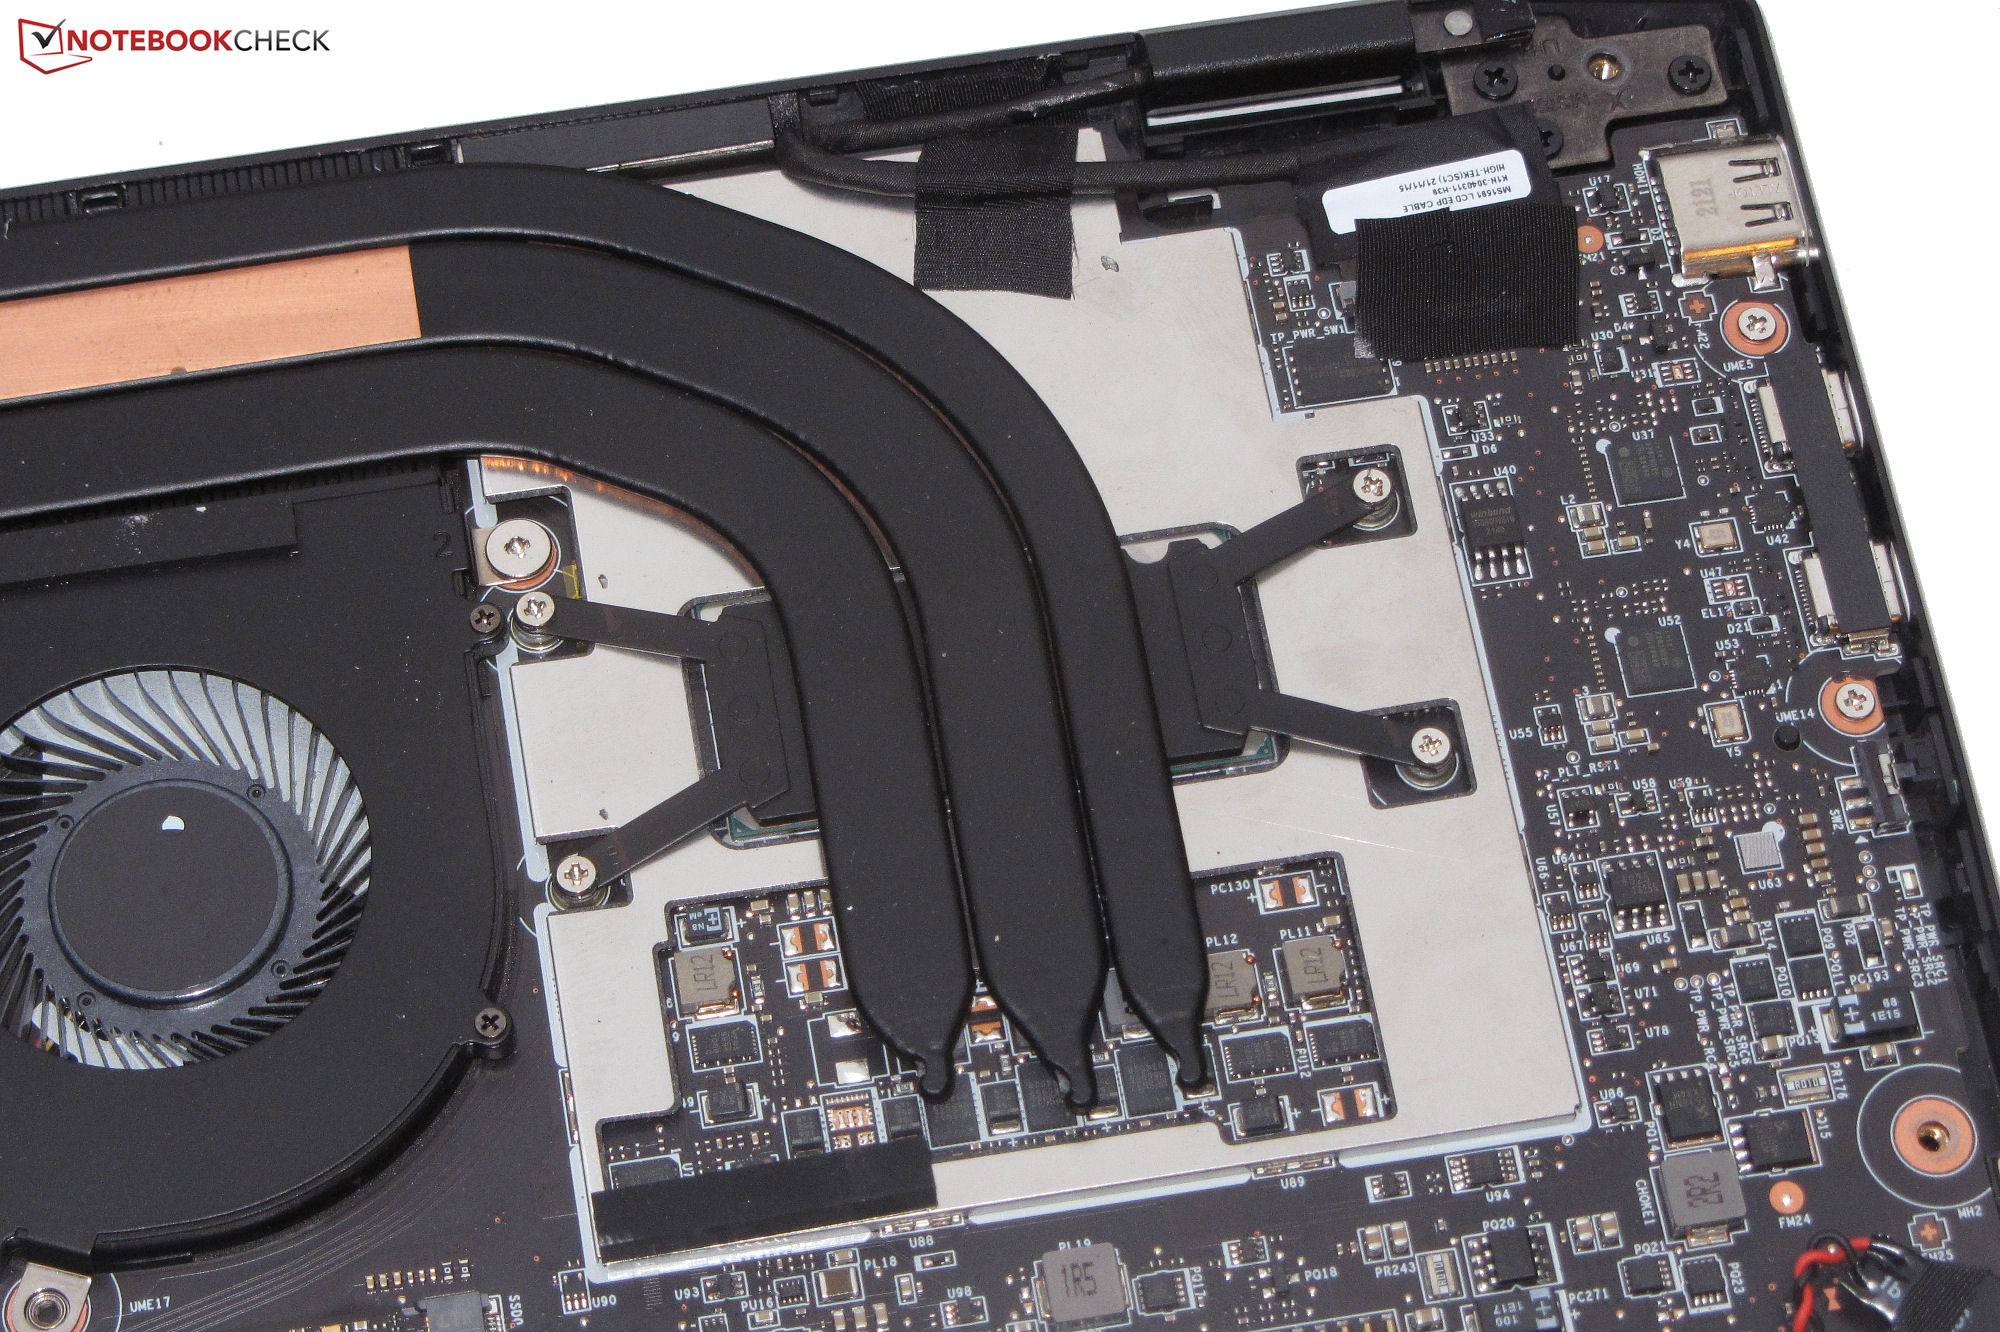
En el funcionamiento cotidiano (Oficina, Internet), los dos ventiladores no producen una cantidad excesiva de ruido y pueden incluso permanecer en silencio ocasionalmente. Sin embargo, bajo carga media y alta, se vuelven bastante ruidosos con un nivel de ruido máximo de 49,3 dB(A) o 48,2 dB(A) durante la prueba de estrés.
Para un funcionamiento más silencioso, el portátil ofrece los perfiles "Modo silencioso" y "Súper batería", pero esto va a costa del rendimiento informático. La batería "Super Battery" garantiza el menor nivel de ruido, pero también ofrece el menor nivel de rendimiento.
Ruido
| Ocioso |
| 25 / 25 / 28.9 dB(A) |
| Carga |
| 49.3 / 48.2 dB(A) |
 | ||
30 dB silencioso 40 dB(A) audible 50 dB(A) ruidosamente alto |
||
min: | ||
| MSI Summit E16 Flip A12UDT-031 GeForce RTX 3050 Ti Laptop GPU, i7-1280P, Samsung PM9A1 MZVL22T0HBLB | Asus ExpertBook B2 Flip B2502FBA-N80141X Iris Xe G7 96EUs, i7-1260P, Samsung PM9A1 MZVL21T0HCLR | Samsung Galaxy Book Pro 360 15 NP950QDB-KC3DE Iris Xe G7 80EUs, i5-1135G7, Samsung PM991 MZVLQ256HAJD | Dell Inspiron 16 7620 2-in-1 Iris Xe G7 96EUs, i7-1260P, Toshiba KBG40ZNS512G NVMe | |
|---|---|---|---|---|
| Noise | -1% | 10% | 16% | |
| apagado / medio ambiente * (dB) | 25 | 26 -4% | 25 -0% | 23.2 7% |
| Idle Minimum * (dB) | 25 | 26.6 -6% | 25 -0% | 23.5 6% |
| Idle Average * (dB) | 25 | 27 -8% | 25 -0% | 23.5 6% |
| Idle Maximum * (dB) | 28.9 | 27 7% | 25 13% | 23.5 19% |
| Load Average * (dB) | 49.3 | 46.7 5% | 32.7 34% | 29.4 40% |
| Load Maximum * (dB) | 48.2 | 46.7 3% | 42 13% | 39.7 18% |
| Witcher 3 ultra * (dB) | 35.6 |
* ... más pequeño es mejor
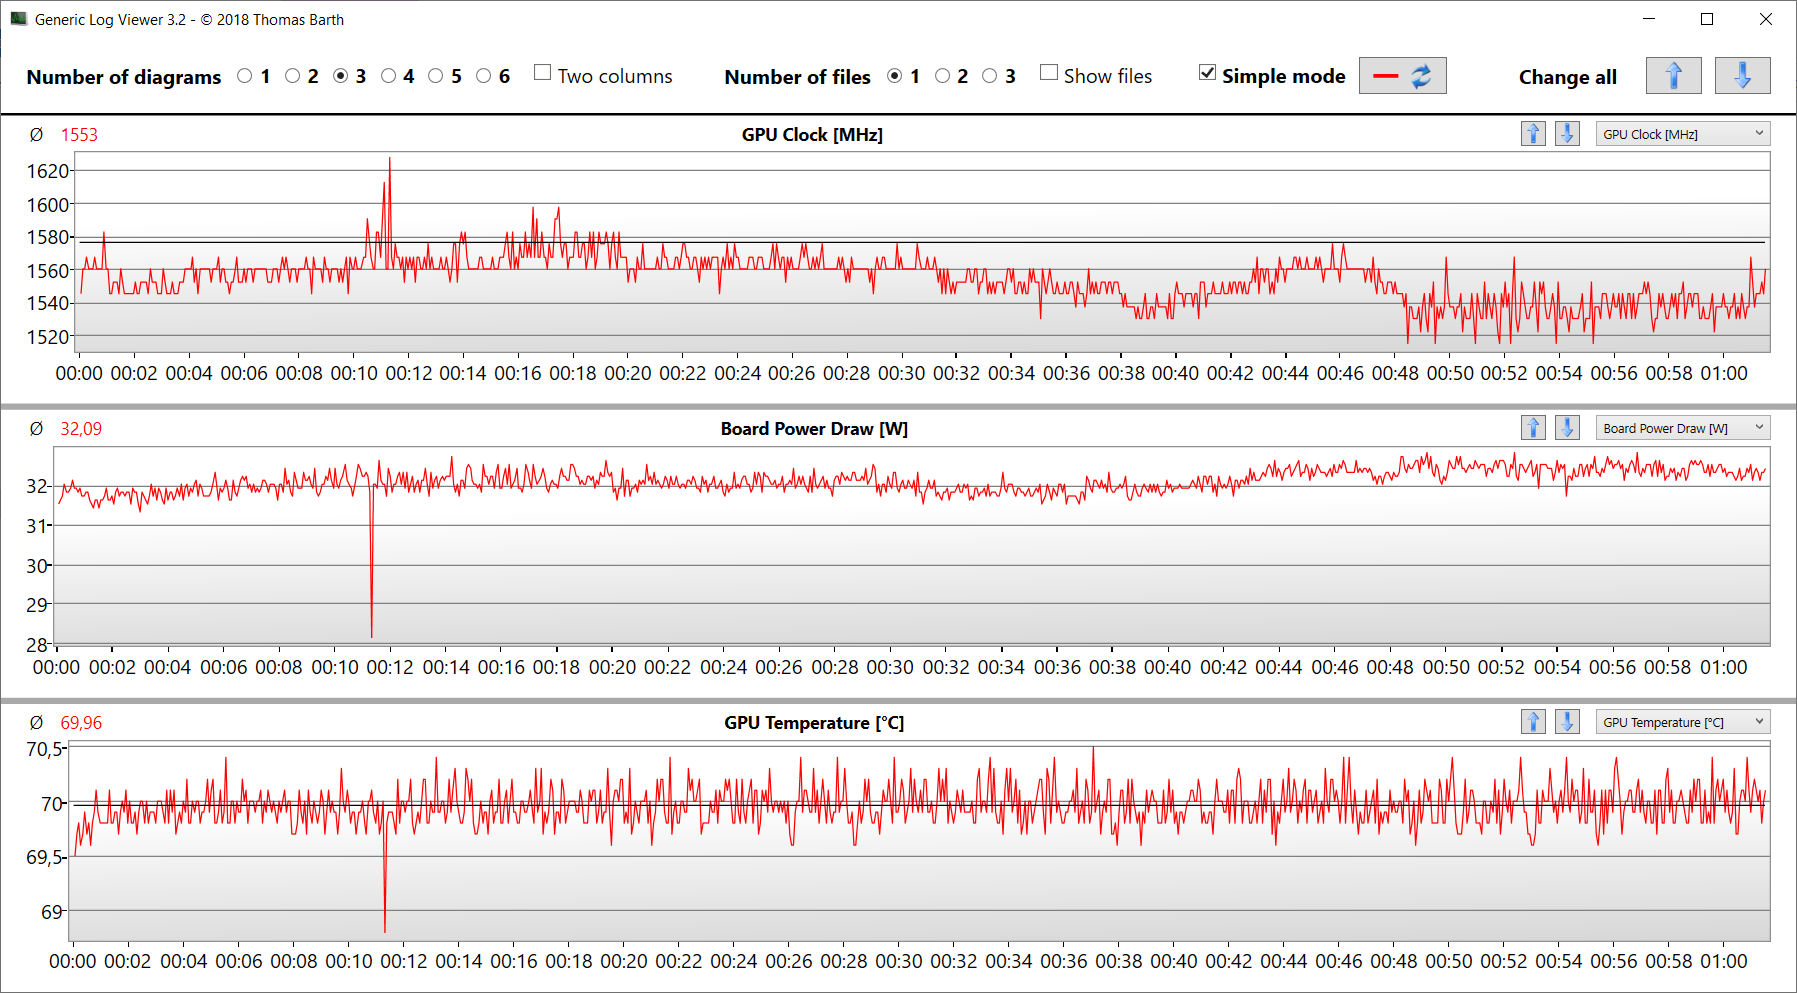
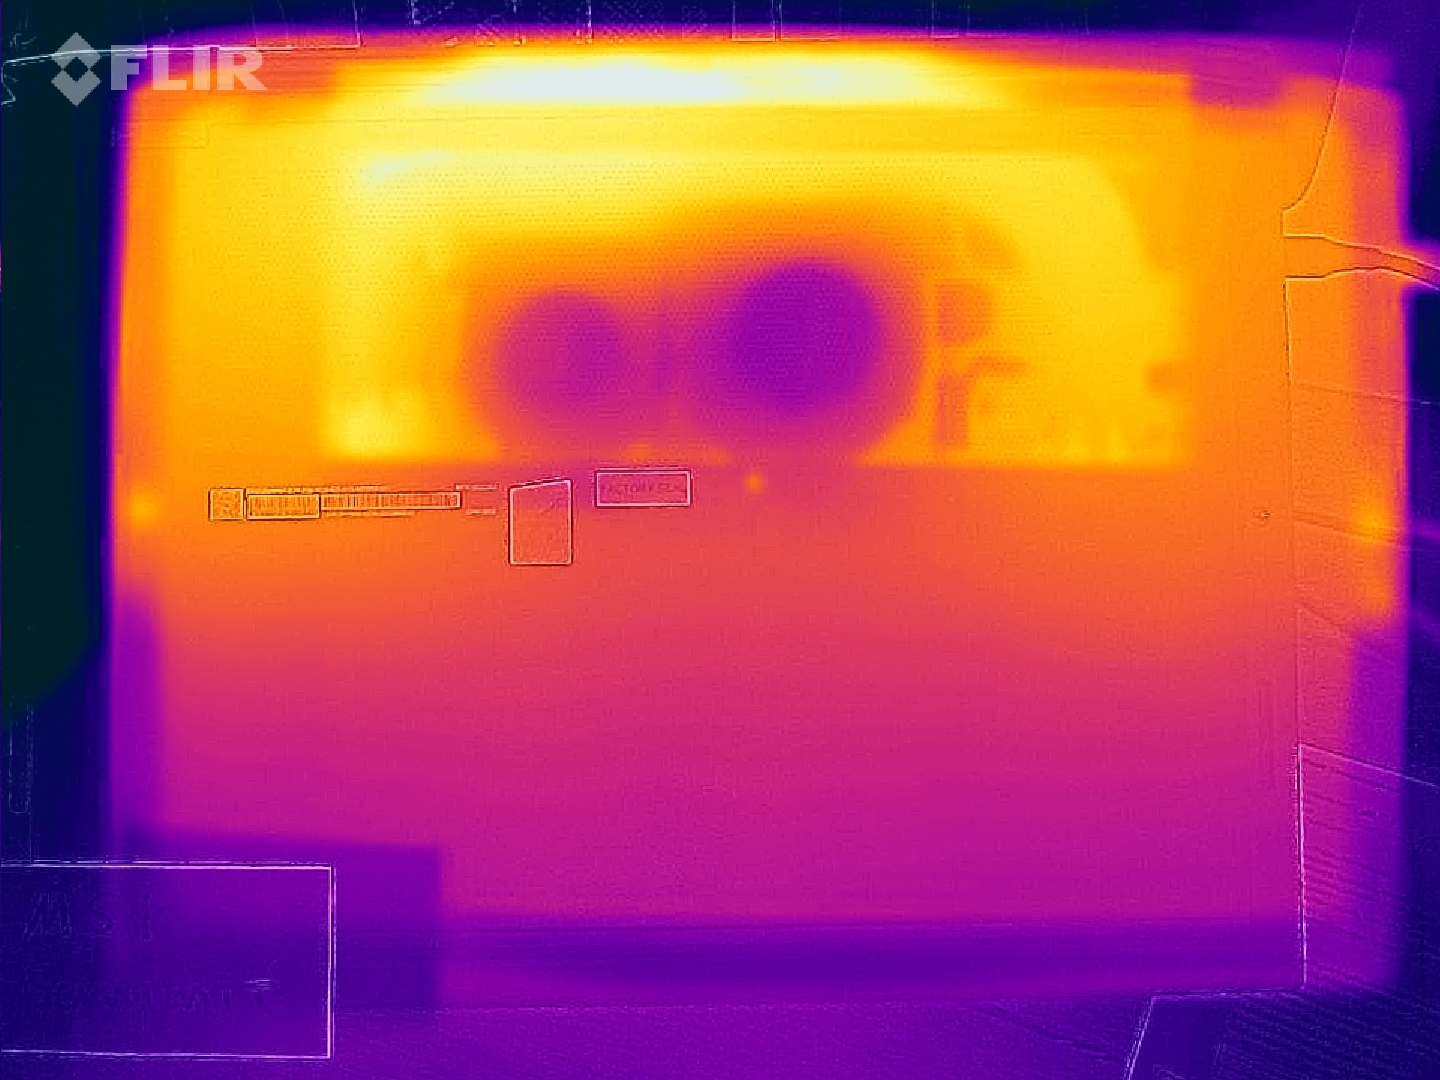
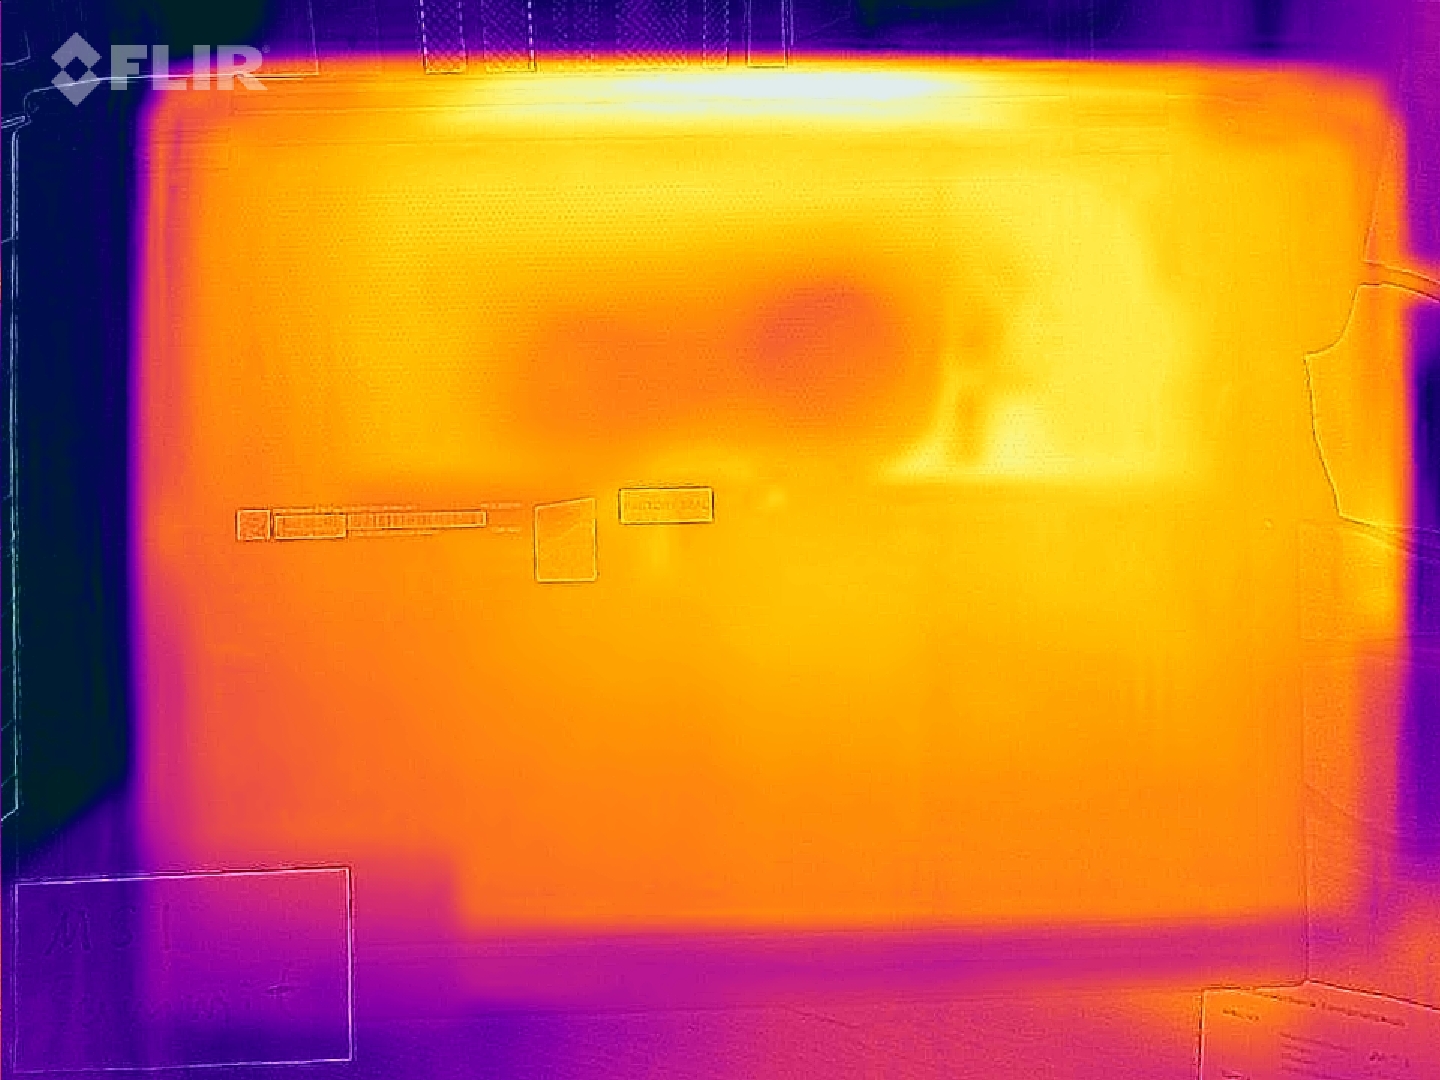
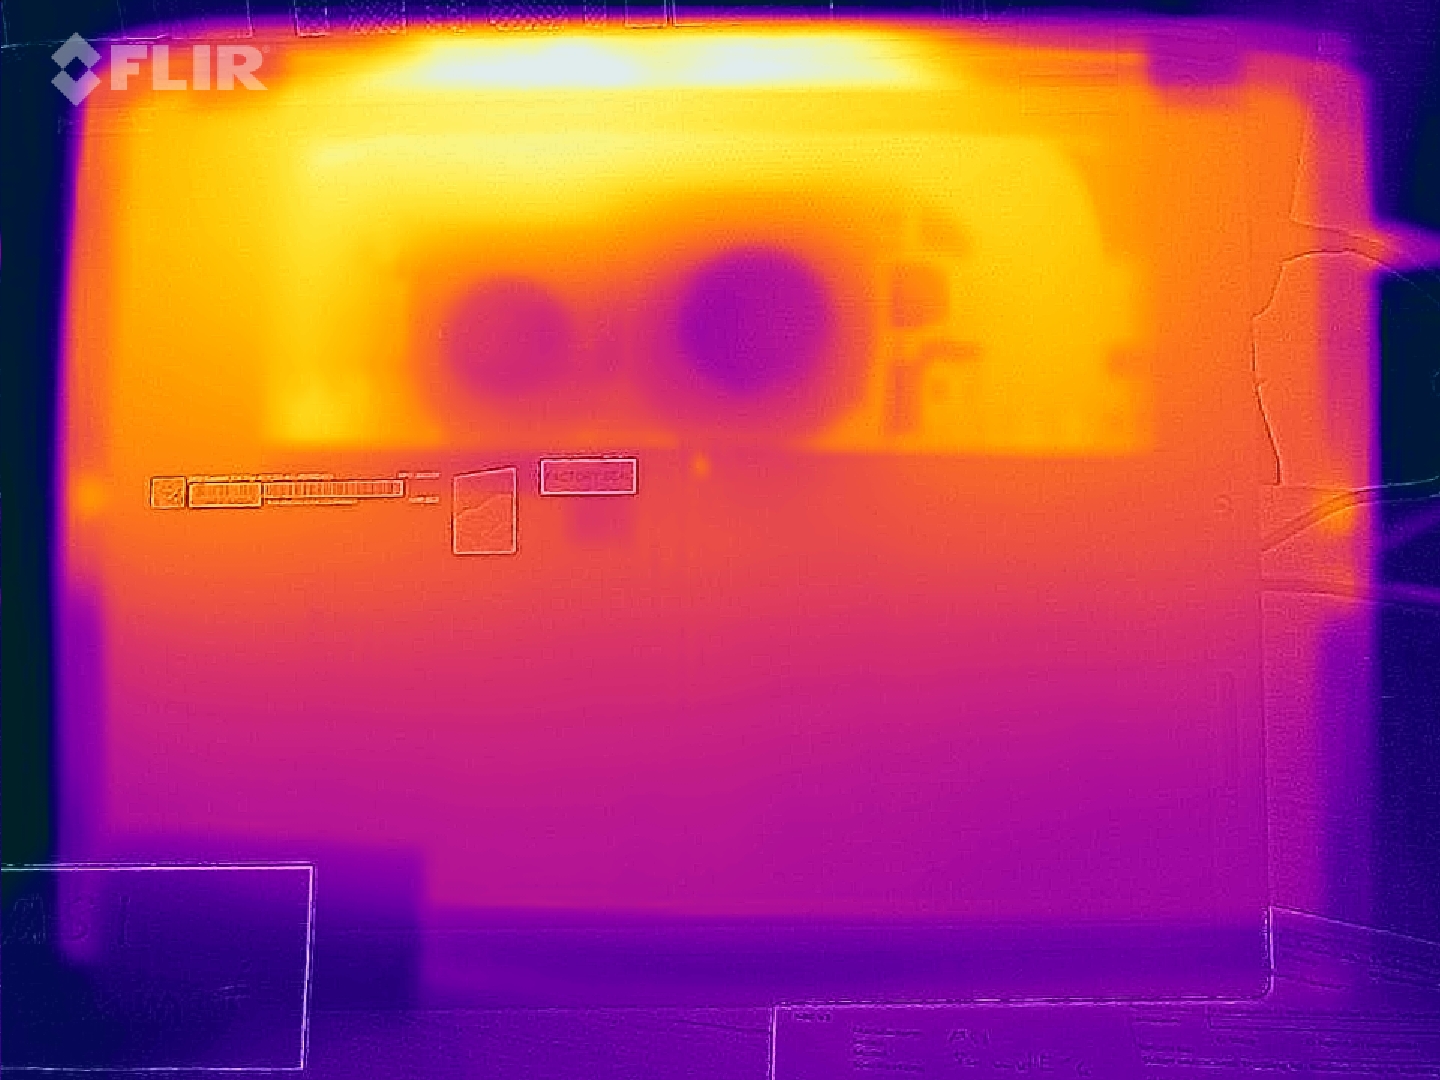
Temperaturas
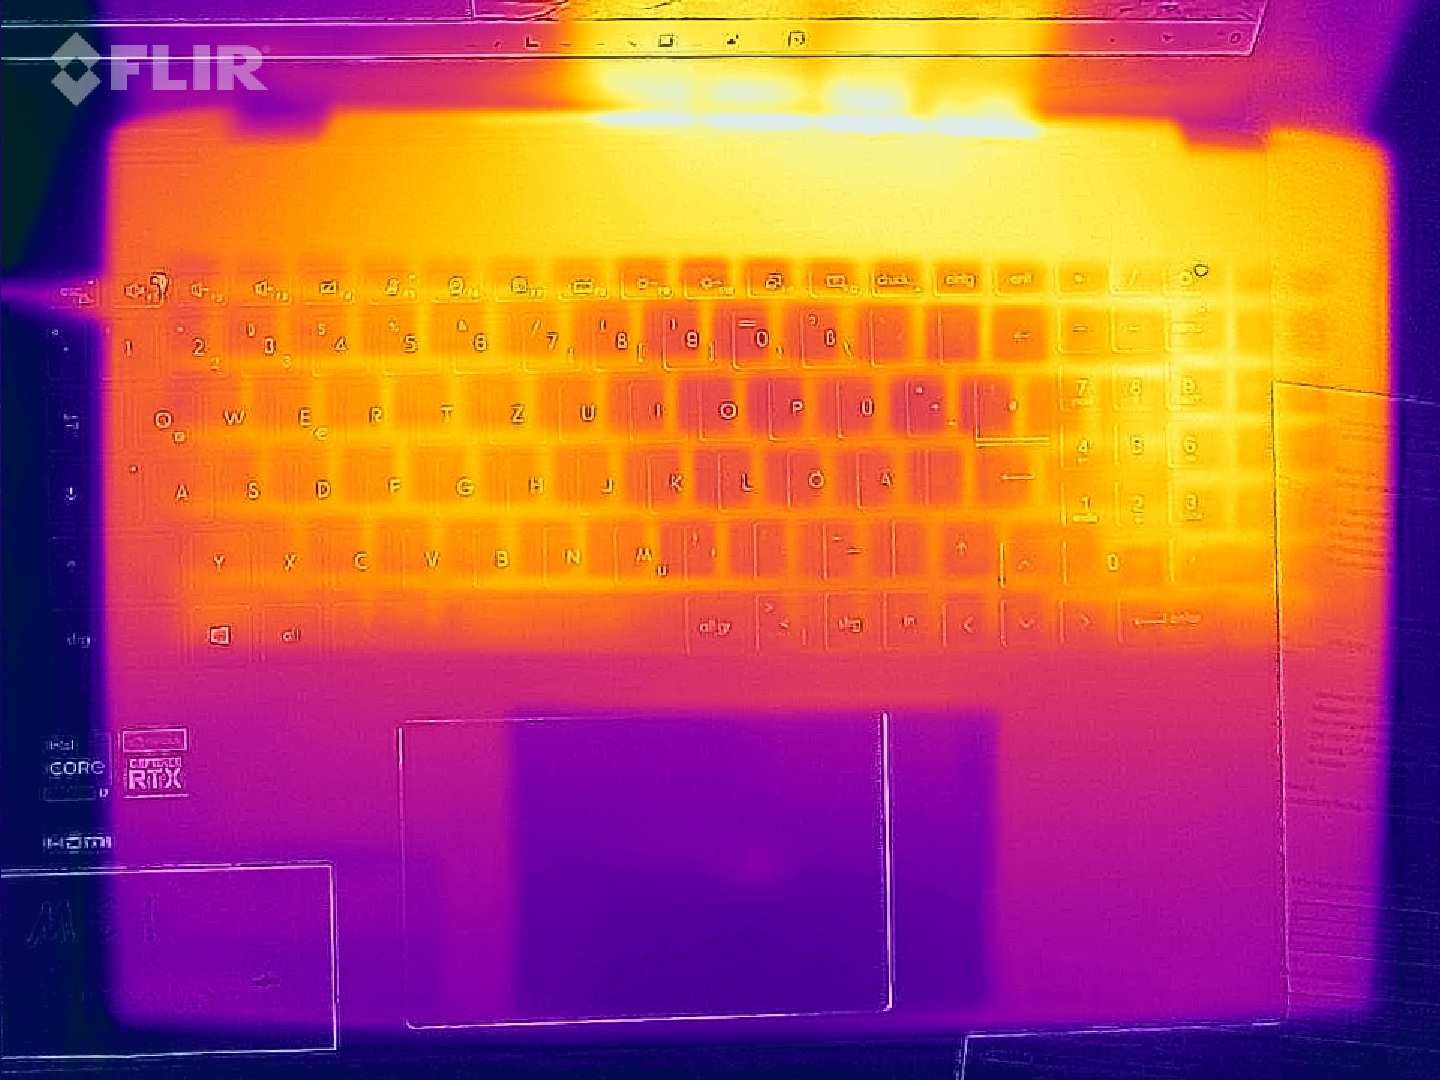
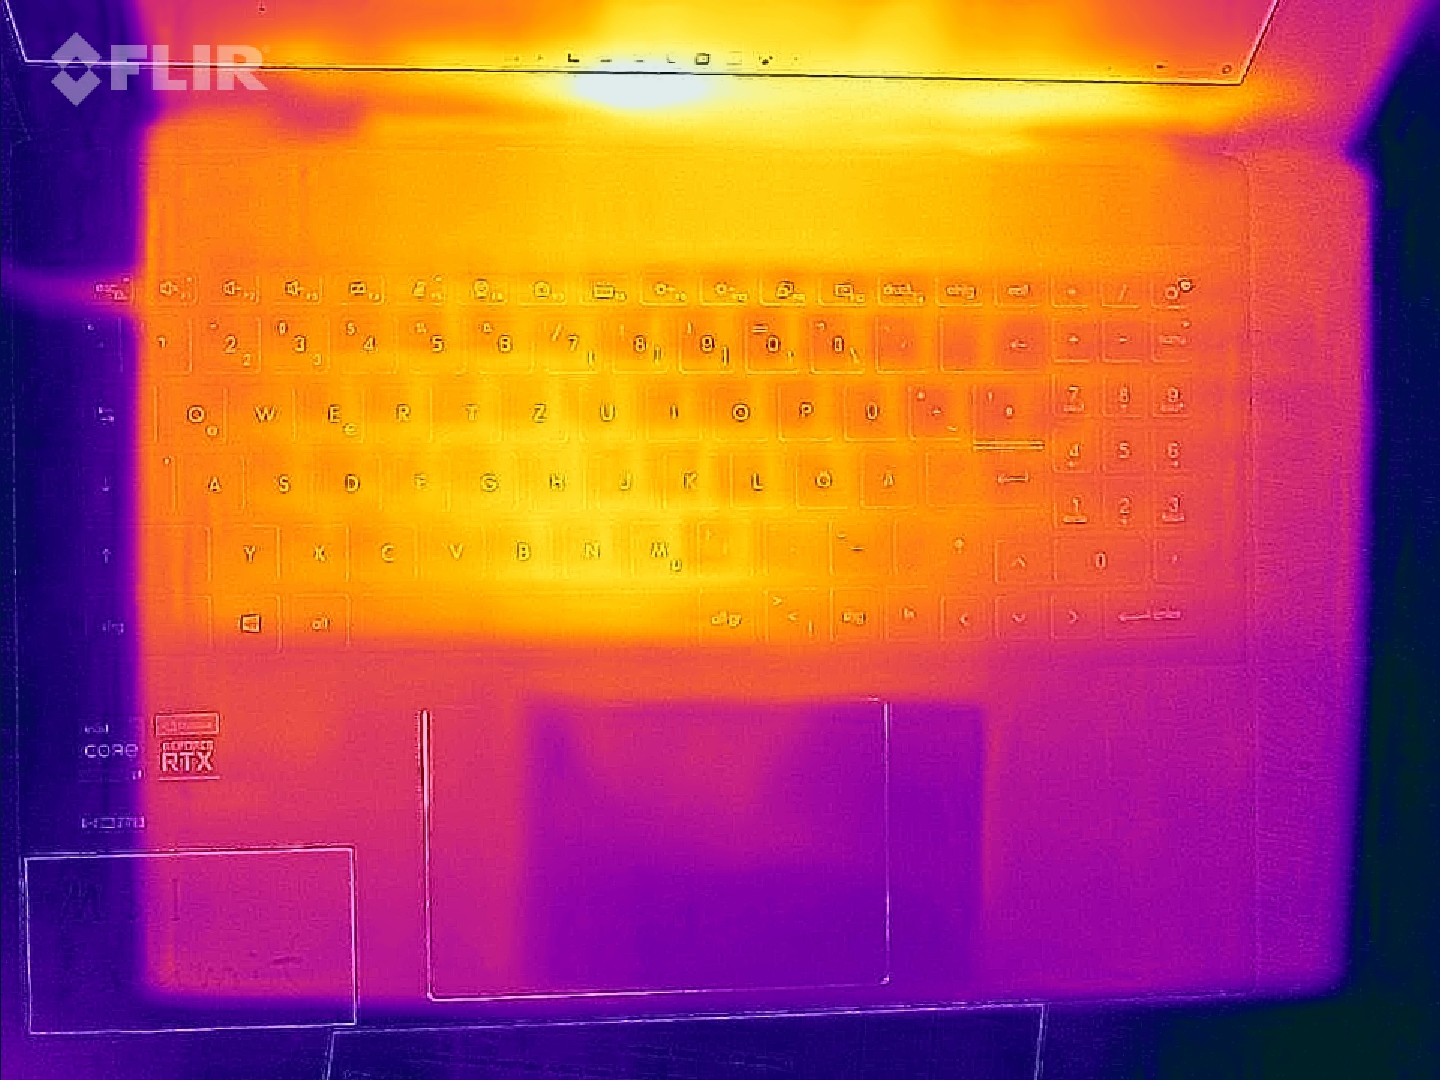
Bajo carga (test de estrés, The Witcher 3), el portátil se calienta notablemente pero no en exceso. Por lo demás, las temperaturas se mantienen dentro del rango verde.
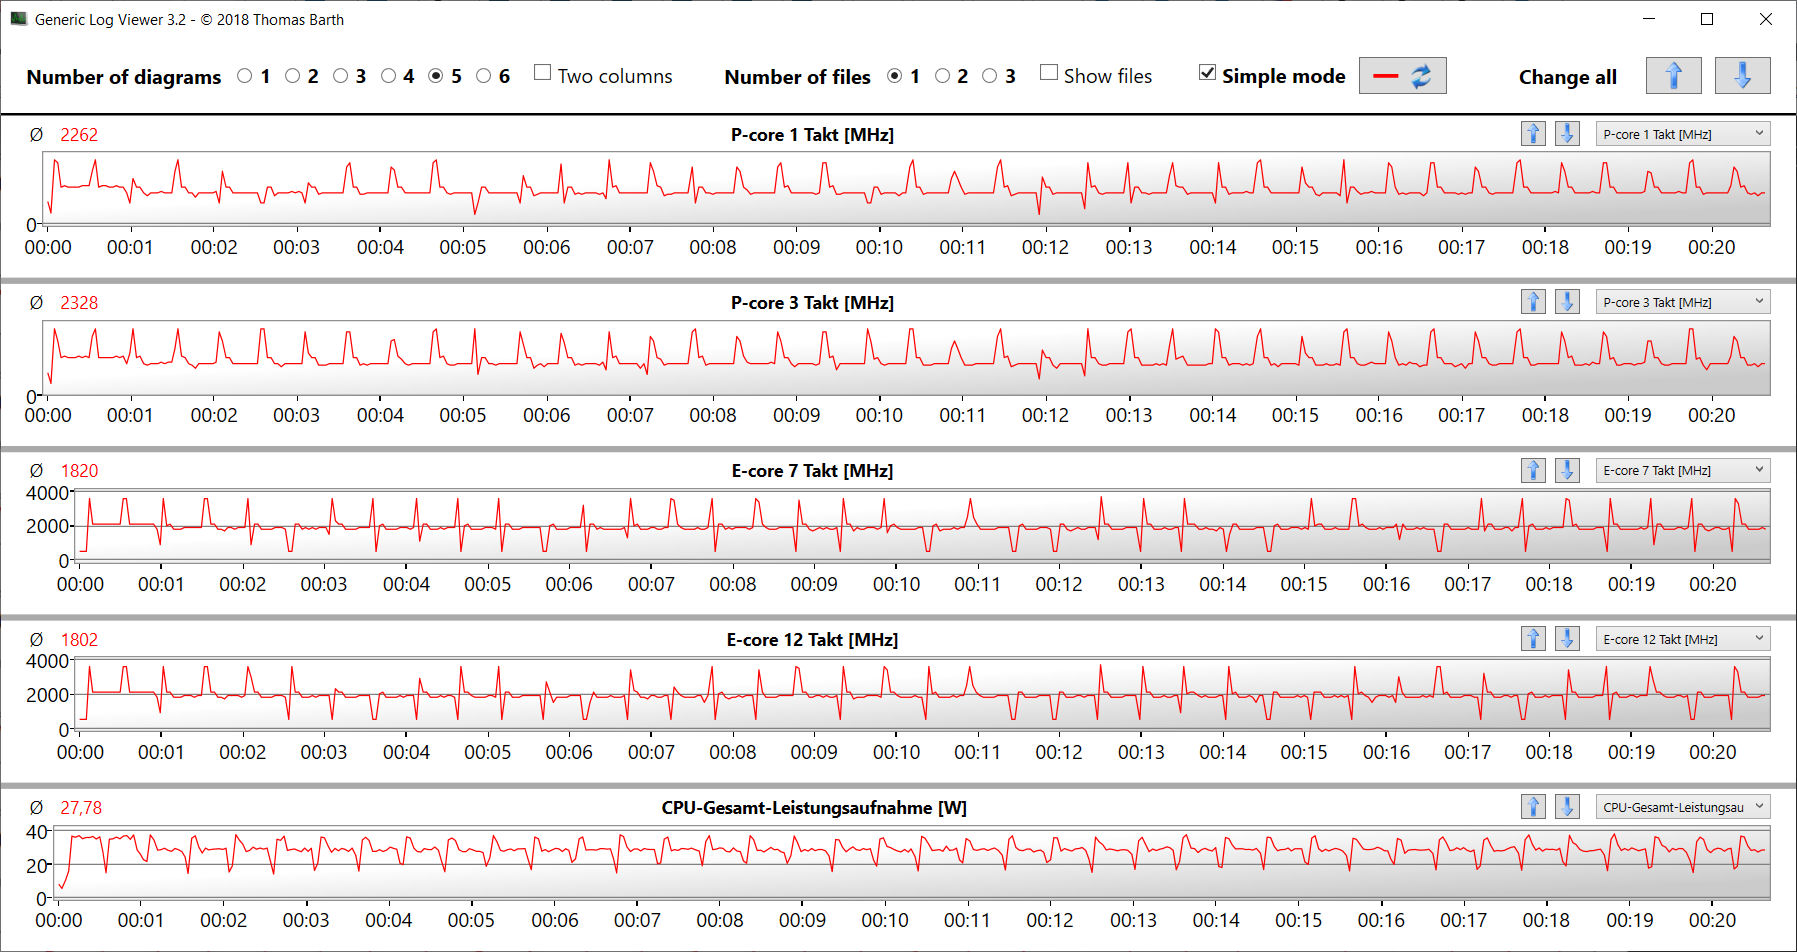
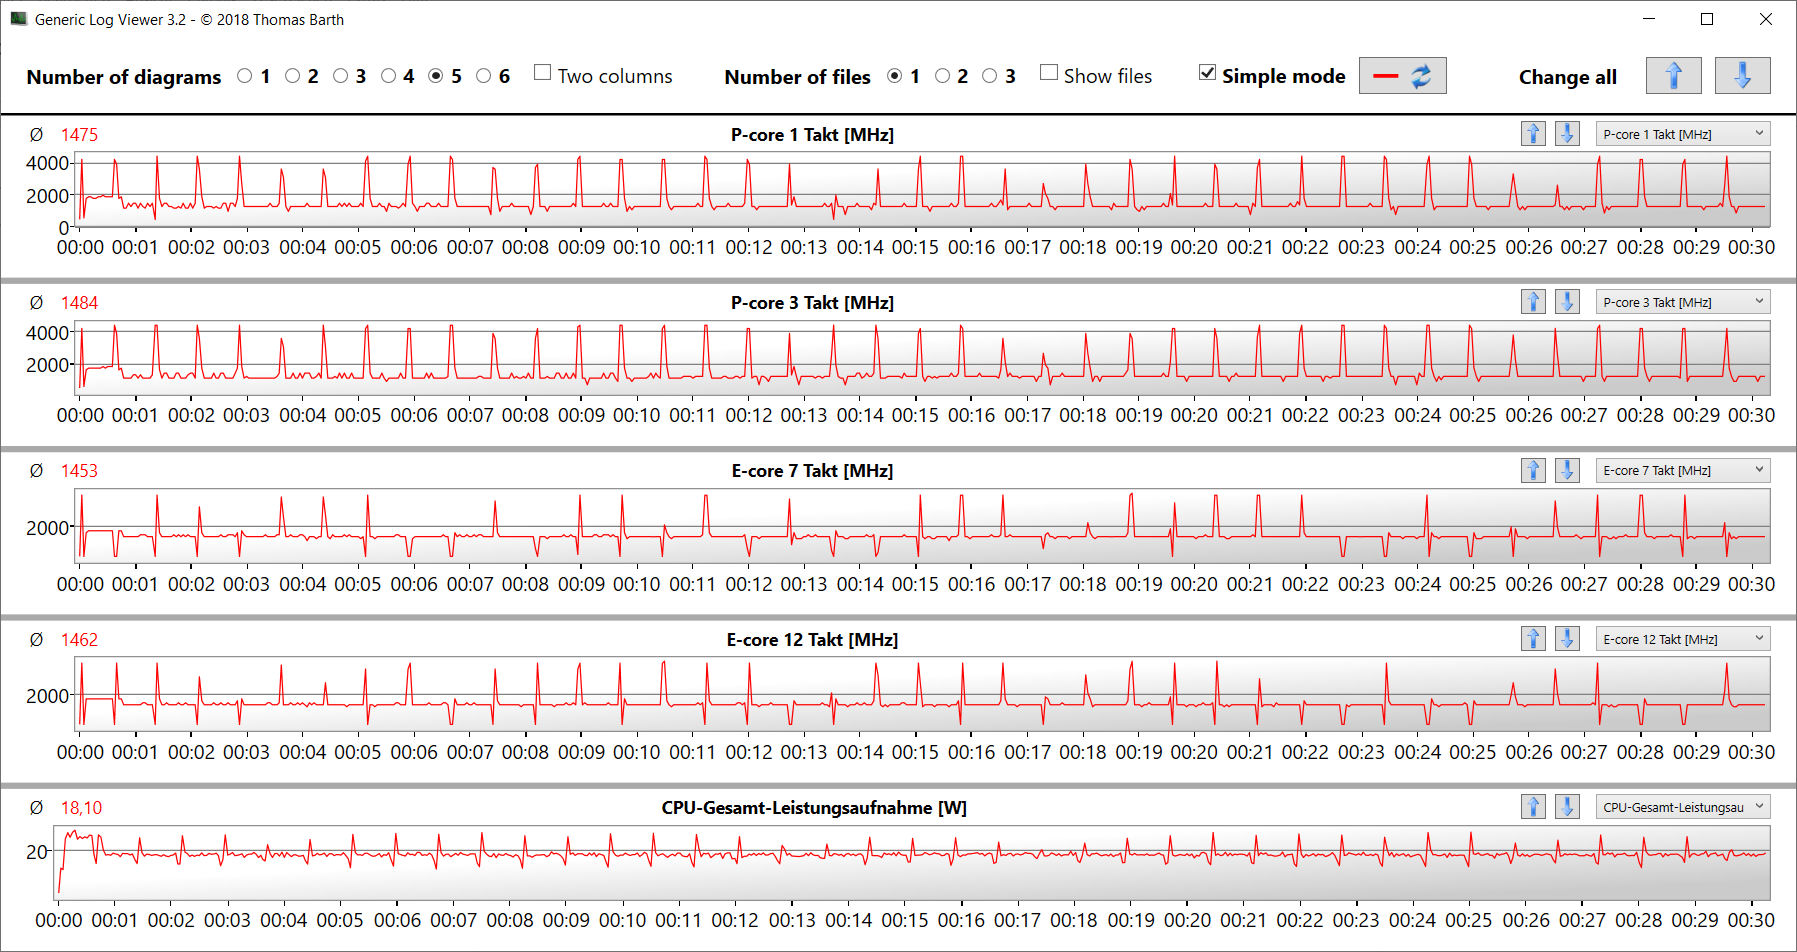
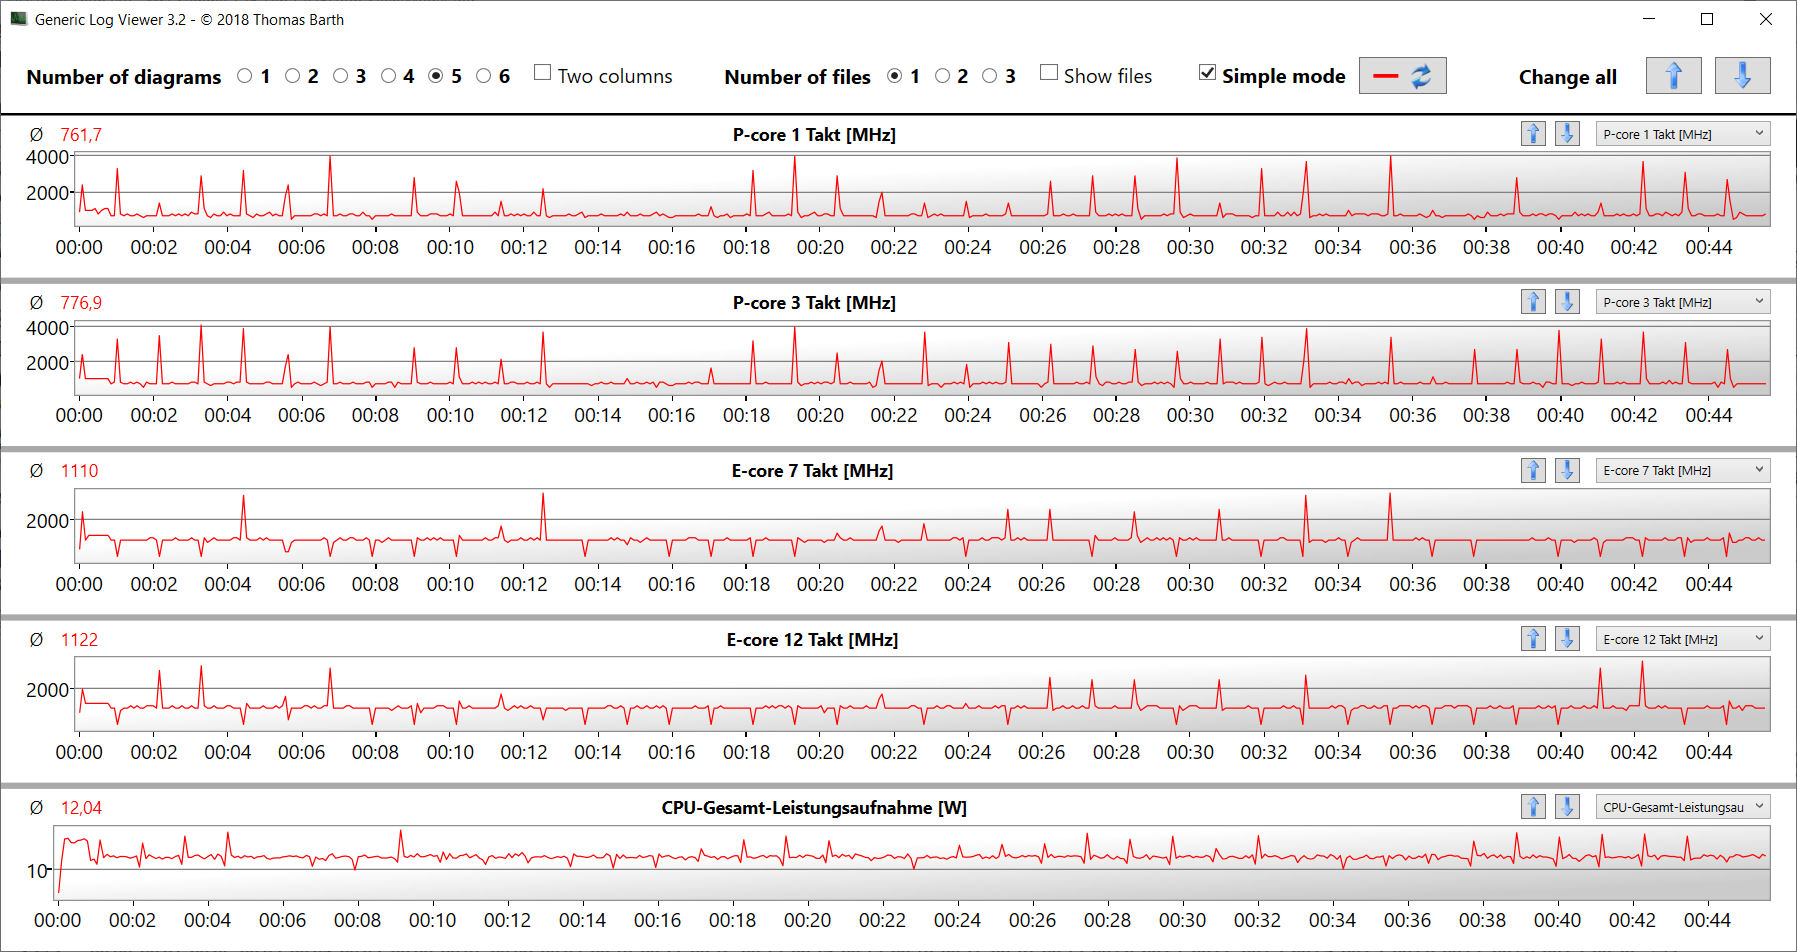
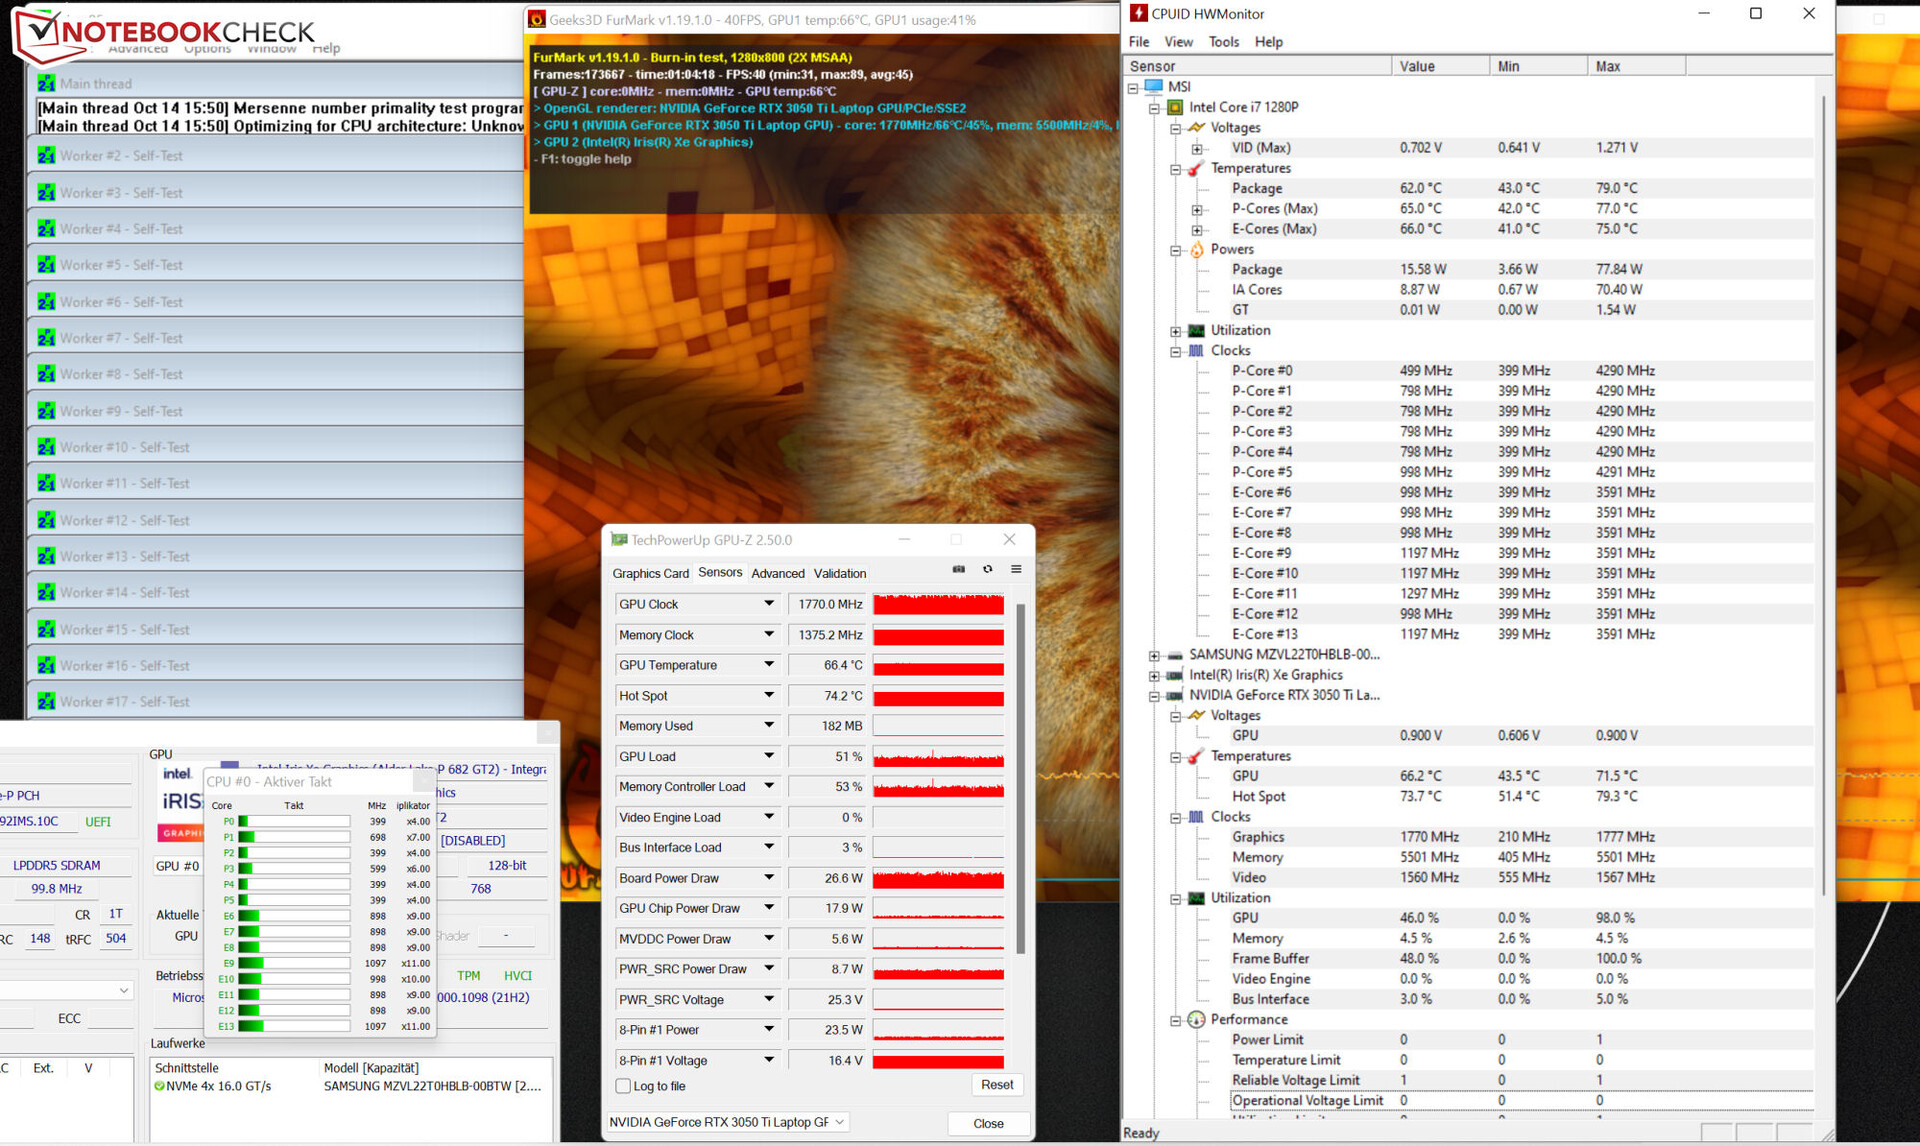
La prueba de estrés (Prime95 y Furmark funcionando constantemente) representa un escenario extremo que utilizamos para evaluar la estabilidad del sistema bajo carga completa. La CPU comienza la prueba a bajas velocidades de reloj (P: 1,6 - 2,8 GHz; E: 1,6 - 1,7 GHz), y el núcleo gráfico funciona a 1.400 - 1.800 MHz. Mientras que la velocidad de la CPU cae durante la continuación de la prueba, la velocidad de la GPU se estabiliza en un nivel alto.
(-) La temperatura máxima en la parte superior es de 49.2 °C / 121 F, frente a la media de 35.4 °C / 96 F, que oscila entre 19.6 y 60 °C para la clase Convertible.
(-) El fondo se calienta hasta un máximo de 50.2 °C / 122 F, frente a la media de 36.9 °C / 98 F
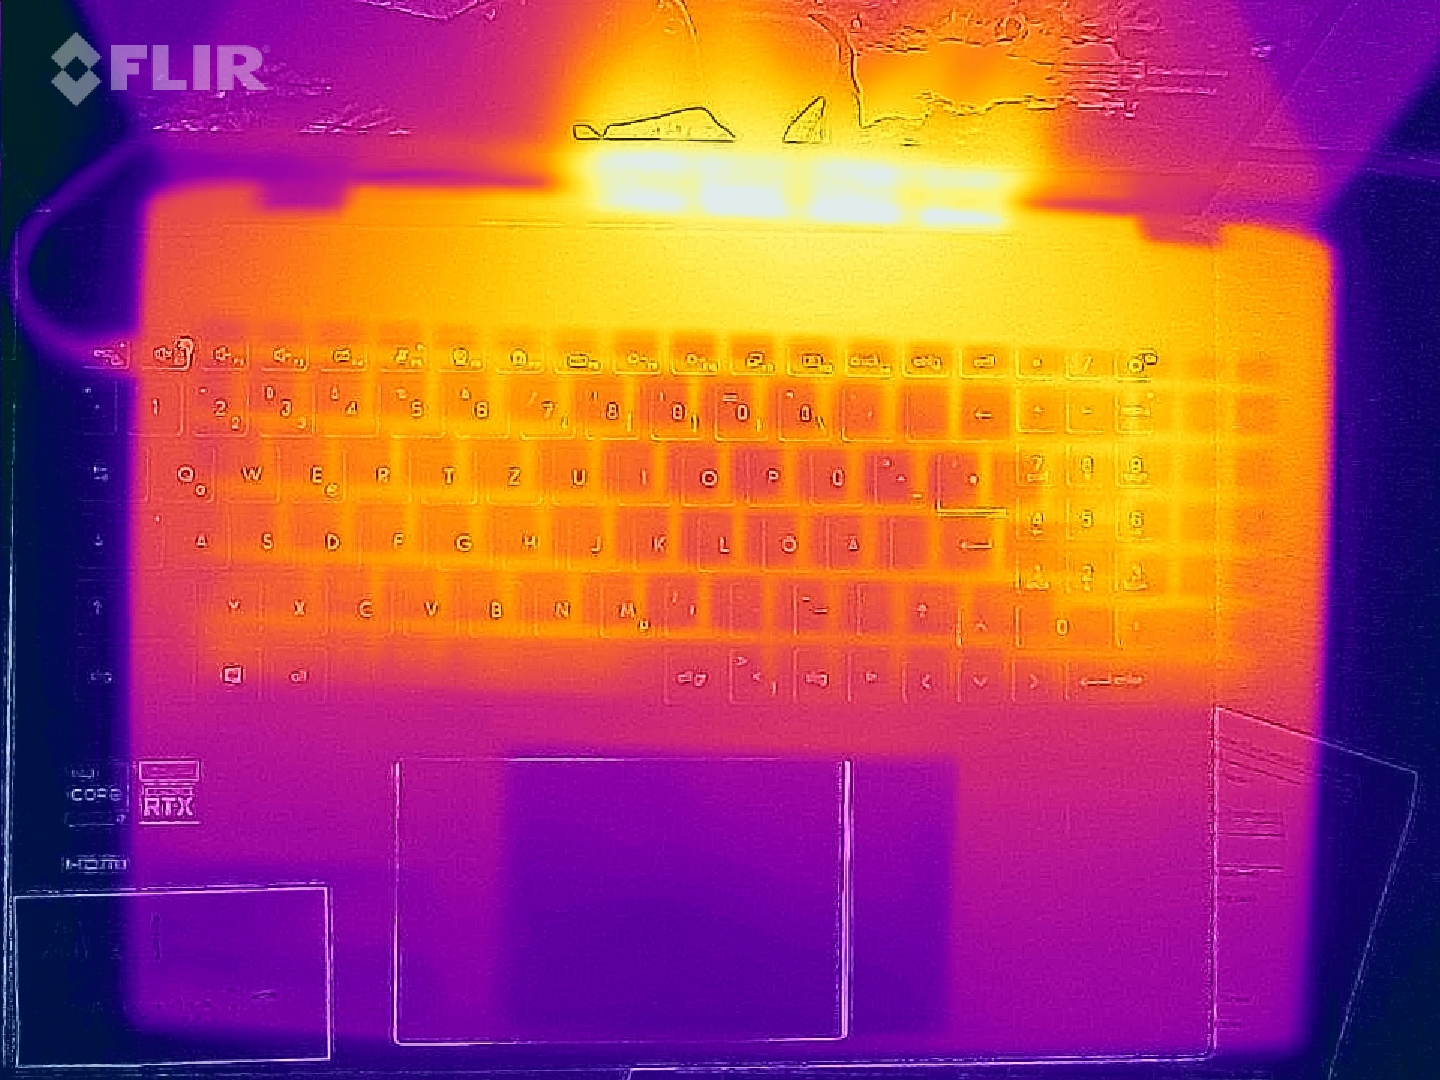
(+) En reposo, la temperatura media de la parte superior es de 27.6 °C / 82# F, frente a la media del dispositivo de 30.3 °C / 87 F.
(-) Jugando a The Witcher 3, la temperatura media de la parte superior es de 39.1 °C / 102 F, frente a la media del dispositivo de 30.3 °C / 87 F.
(+) Los reposamanos y el panel táctil alcanzan como máximo la temperatura de la piel (33.7 °C / 92.7 F) y, por tanto, no están calientes.
(-) La temperatura media de la zona del reposamanos de dispositivos similares fue de 28 °C / 82.4 F (-5.7 °C / -10.3 F).
| MSI Summit E16 Flip A12UDT-031 Intel Core i7-1280P, NVIDIA GeForce RTX 3050 Ti Laptop GPU | Asus ExpertBook B2 Flip B2502FBA-N80141X Intel Core i7-1260P, Intel Iris Xe Graphics G7 96EUs | Samsung Galaxy Book Pro 360 15 NP950QDB-KC3DE Intel Core i5-1135G7, Intel Iris Xe Graphics G7 80EUs | Dell Inspiron 16 7620 2-in-1 Intel Core i7-1260P, Intel Iris Xe Graphics G7 96EUs | |
|---|---|---|---|---|
| Heat | 5% | 14% | -1% | |
| Maximum Upper Side * (°C) | 49.2 | 36.6 26% | 42.6 13% | 42.2 14% |
| Maximum Bottom * (°C) | 50.2 | 42.2 16% | 40.8 19% | 47.4 6% |
| Idle Upper Side * (°C) | 29.4 | 31.3 -6% | 25.9 12% | 32.2 -10% |
| Idle Bottom * (°C) | 30 | 34.8 -16% | 26.1 13% | 33.6 -12% |
* ... más pequeño es mejor
Altavoces
Los altavoces estéreo producen un sonido decente que apenas incluye graves.
MSI Summit E16 Flip A12UDT-031 análisis de audio
(±) | la sonoridad del altavoz es media pero buena (79.8 dB)
Graves 100 - 315 Hz
(-) | casi sin bajos - de media 23.6% inferior a la mediana
(-) | los graves no son lineales (15.1% delta a la frecuencia anterior)
Medios 400 - 2000 Hz
(±) | medias más altas - de media 5.6% más altas que la mediana
(±) | la linealidad de los medios es media (7.4% delta respecto a la frecuencia anterior)
Altos 2 - 16 kHz
(±) | máximos más altos - de media 5.6% más altos que la mediana
(+) | los máximos son lineales (4.5% delta a la frecuencia anterior)
Total 100 - 16.000 Hz
(±) | la linealidad del sonido global es media (22.6% de diferencia con la mediana)
En comparación con la misma clase
» 68% de todos los dispositivos probados de esta clase eran mejores, 5% similares, 27% peores
» El mejor tuvo un delta de 6%, la media fue 20%, el peor fue ###max##%
En comparación con todos los dispositivos probados
» 67% de todos los dispositivos probados eran mejores, 6% similares, 28% peores
» El mejor tuvo un delta de 4%, la media fue 23%, el peor fue ###max##%
Dell Inspiron 16 7620 2-in-1 análisis de audio
(+) | los altavoces pueden reproducir a un volumen relativamente alto (#89.8 dB)
Graves 100 - 315 Hz
(-) | casi sin bajos - de media 15.3% inferior a la mediana
(±) | la linealidad de los graves es media (8.8% delta a frecuencia anterior)
Medios 400 - 2000 Hz
(+) | medios equilibrados - a sólo 3.3% de la mediana
(+) | los medios son lineales (4.8% delta a la frecuencia anterior)
Altos 2 - 16 kHz
(+) | máximos equilibrados - a sólo 3.2% de la mediana
(+) | los máximos son lineales (5% delta a la frecuencia anterior)
Total 100 - 16.000 Hz
(+) | el sonido global es lineal (11.5% de diferencia con la mediana)
En comparación con la misma clase
» 9% de todos los dispositivos probados de esta clase eran mejores, 3% similares, 88% peores
» El mejor tuvo un delta de 6%, la media fue 20%, el peor fue ###max##%
En comparación con todos los dispositivos probados
» 8% de todos los dispositivos probados eran mejores, 2% similares, 90% peores
» El mejor tuvo un delta de 4%, la media fue 23%, el peor fue ###max##%
Consumo de energía
En general, el consumo de energía se sitúa en un nivel normal para el hardware utilizado aquí. Mientras que el portátil se ejecuta a través de la prueba Witcher 3 con un consumo de energía constante, durante las pruebas de estrés el consumo cae regularmente durante un breve período de tiempo. La fuente de alimentación incluida (100 vatios) tiene un tamaño suficiente.
| Off / Standby | |
| Ocioso | |
| Carga |
|
Clave:
min: | |
Power Consumption The Witcher 3 / Stress Test
Power Consumption With External Monitor
Duración de la batería
En nuestra prueba realista de WLAN, el 16 pulgadas alcanza una duración de la batería de 7:08 horas. Esta prueba simula la carga al renderizar páginas web mediante un script.
Pro
Contra
Veredicto - Un portátil 2 en 1 para el trabajo creativo móvil
El Summit E16 Flip es un portátil 2 en 1 del segmento empresarial que se dirige principalmente a los usuarios creativos. MSI combina una pantalla táctil de 16 pulgadas en formato 16:10 con una potente GPU de gama media.
Aunque el portátil 2-en-1 de MSI no está pensado para todo el mundo, debería atraer a algunos seguidores.
ElCore i7-1280Py GeForce RTX 3050 Tison capaces de funcionar constantemente a altas velocidades de reloj. El rendimiento de la GPU casi alcanza el valor medio de la gráfica RTX 3050 Ti. Aunque el portátil no se calienta excesivamente bajo carga, puede ser bastante ruidoso. Sin embargo, en el funcionamiento diario, las cosas siguen siendo más silenciosas.
La pantalla táctil (2,560 x 1,600 pixeles) cubre el espacio de color DCI-P3. Esto va acompañado de ángulos de visión estables, una buena reproducción del color, tiempos de respuesta cortos y un buen nivel de contraste. Por desgracia, el panel tiene una superficie reflectante. Además, el brillo máximo podría haber sido mayor. La pantalla táctil se puede manejar con los dedos así como con el lápiz de entrada MSI incluido.
A pesar de su tamaño, podemos atestiguar que el dispositivo tiene cierta movilidad. Todo el paquete aporta alrededor de 1,9 kg (~4,2 lb) a la balanza. El E16 logra obtener una duración de WLAN de unas 7 horas de su batería de 82-Wh, lo que es un valor bastante bueno, considerando el equipamiento de hardware.
Nuestra base de datos no incluye un competidor directo del E16. Lo que más se acerca en esta categoría es el Dell Inspiron 16 7620 2-en-1que está disponible opcionalmente con unGeForce MX550de gráficos. Además, ese dispositivo puntúa con una duración de batería significativamente mejor y una memoria de trabajo reemplazable/ampliable.
Precio y disponibilidad
El MSI Summit E16 Flip A12UDT está disponible en Amazon por $1849por ejemplo.
MSI Summit E16 Flip A12UDT-031
- 10/19/2022 v7 (old)
Sascha Mölck
Price comparison

