Intel Core i7-1280P
El Intel Core i7-1280P es la CPU insignia de Alder Lake-P, es decir, una pieza cara de 28 W destinada a ser utilizada en portátiles ultraligeros. Esta CPU se anunció a principios de 2022 y tiene 6 núcleos de rendimiento (núcleos P, arquitectura Golden Cove) emparejados con 8 núcleos eficientes (núcleos E, arquitectura Gracemont). Los núcleos P están habilitados para Hyper-Threading, lo que supone la friolera de 20 hilos cuando se combinan con los núcleos E. Las velocidades de reloj van de 1,8 GHz a 4,8 GHz en el clúster de rendimiento y de 1,3 GHz a 3,6 GHz en el clúster de eficiencia. Se trata de la única CPU Alder Lake hexa-core de 28 W hasta febrero de 2022, superando lo que ofrecen los más asequibles i7-1270P e i7-1260P. Este Core i7 admite todo el conjunto de funciones vPro (nivel "Enterprise", que permite la gestión remota).
Arquitectura
El rendimiento de los núcleos E debería ser similar al de un núcleo Skylake (como el que se encuentra en el Core i7-6700HQ, entre otras opciones), con seis años de antigüedad en este momento. Todos los núcleos de la CPU del Core i7-1280P disfrutan de acceso a 24 MB de caché L3. El controlador de memoria integrado admite varios tipos de memoria hasta LPDDR5-5200, DDR5-4800, LPDDR4x-4267 o DDR4-3200. Al igual que los demás procesadores Alder Lake, el Core i7-1280P viene con Thread Director, que es una nueva funcionalidad diseñada para ayudar a Windows 11 a decidir qué núcleos utilizar para qué cargas de trabajo para obtener el mejor rendimiento y eficiencia posibles. La aceleración por hardware de los algoritmos de IA es compatible con GNA 3.0 y DL Boost (a través de AVX2). La compatibilidad con PCI-Express 5.0 no ha llegado a los procesadores Alder Lake para portátiles, por lo que los usuarios tendrán que conformarse con PCI-Express 4.0 por el momento.
Rendimiento
Esperamos que los 14 núcleos de la CPU superen fácilmente a cualquier pieza Tiger Lake de 35 W y cuatro núcleos (como el Core i7-11375H), además de superar a las opciones AMD Ryzen 4000 y Ryzen 5000 de 8 núcleos para portátiles que funcionan a velocidades de reloj similares a las que puede ofrecer un 1280P. La sostenibilidad del rendimiento probablemente dependa en gran medida de lo altos que sean los límites de potencia y de lo buena que sea la térmica de un determinado sistema. Dicho esto, un i7-1280P bien refrigerado tendría todo lo necesario para intercambiar golpes con el i7-12800H, una CPU de mayor potencia con la que los jugadores y artistas digitales estarán familiarizados.
Gráficos
El adaptador gráfico integrado en forma de Iris Xe de 96 UE que funciona a un máximo de 1,45 GHz no ha sufrido ningún cambio respecto a lo que incorporaban los procesadores Tiger Lake-UP3 de 11ª generación, como el i7-1165G7, lo cual no es un inconveniente, ya que esta iGPU está cargada de funciones modernas, como la capacidad de decodificación de vídeo AV1 y la compatibilidad con monitores SUHD 4320p. Si te preguntamos por su rendimiento en juegos, te diremos que esperes algo parecido a la MX450 de NVIDIA o, en otras palabras, framerates aceptables en la mayoría de los juegos cuando juegas a 1080p / configuración media, siempre que los límites de potencia sean lo suficientemente altos y la solución de refrigeración sea lo suficientemente buena. Una memoria RAM rápida es un requisito previo para un rendimiento decente, ya que la Iris Xe tiene que conformarse con ninguna memoria de vídeo dedicada.
Consumo de energía
La potencia base del i7 (también conocida como valor TDP por defecto o PL1) es de 28 W, siendo 64 W su potencia Turbo (también conocida como PL2). El Core i7-1280P está fabricado en el proceso de tercera generación de 10 nm de Intel, comercializado como Intel 7, para una eficiencia energética aceptable.
Serie Intel Alder Lake-P Nombre código Alder Lake-P Serie: Alder Lake-P Alder Lake-P Velocidad de reloj 1300 - 4800 MHz Caché de Nivel 1 1.2 MB Caché de Nivel 2 11.5 MB Caché de Nivel 3 24 MB Número de Núcleos/Subprocesos 14 / 20 Consumo de Corriente (TDP = Thermal Design Power) 28 Watt Tecnología de producción 10 nm Temperatura Máx. 100 °C Conector FCBGA1744 Recursos Thread Director GPU Intel Iris Xe Graphics G7 96EUs ( - 1450 MHz)64 Bit soporte para 64 Bit Architecture x86 Fecha de anuncio 01/04/2022 Enlace de Producto (externo) Intel Alder Lake-P i7-1280P
Benchmarks Performance Rating - CB R15 + R20 + 7-Zip + X265 + Blender + 3DM11 CPU
50.5 pt (57%)
...
AMD Ryzen 9 PRO 6950HS -2%
AMD Ryzen 9 5980HS 2%
...
Intel Core i9-12900HX 31%
Cinebench R23 - Cinebench R23 Multi Core
min: 8632 de promedio: 11685 mediana: 11666 (19%) max: 14803 Points
CPU TDP ? TDP 23 W TDP 28 W TDP 30 W TDP 35 W TDP 50 W TDP 80 W 77% 58% 80% 67% 91% 81% 100%
...
AMD Ryzen 9 PRO 6950HS -1%
...
Intel Core i9-13980HX 160%
Cinebench R23 - Cinebench R23 Single Core
min: 1609 de promedio: 1670 mediana: 1651 (73%) max: 1787 Points
CPU TDP ? TDP 23 W TDP 28 W TDP 30 W TDP 35 W TDP 50 W TDP 80 W 92% 94% 90% 95% 100% 90% 92%
...
Intel Core i3-1215U -5%
Apple M2 -5%
Intel Core i7-1265U -4%
Intel Core i5-1245U 1%
Intel Core i7-12850HX 3%
Intel Core i9-12950HX 8%
Intel Core i7-12800HX 9%
...
Intel Core i9-12900HX 15%
Cinebench R20 - Cinebench R20 CPU (Single Core)
min: 615 de promedio: 642 mediana: 629 (72%) max: 701 Points
CPU TDP ? TDP 23 W TDP 28 W TDP 30 W TDP 35 W TDP 50 W TDP 80 W 89% 91% 89% 88% 100% 96% 90%
...
Intel Core i3-1215U -6%
Intel Core i7-1250U -5%
Intel Core i7-1265U -3%
Intel Core i5-1245U 1%
Intel Core i7-12800HX 5%
Intel Core i7-12850HX 9%
...
Intel Core i9-12900HX 15%
Cinebench R20 - Cinebench R20 CPU (Multi Core)
min: 3283 de promedio: 4627 mediana: 4677.5 (20%) max: 5415 Points
CPU TDP ? TDP 23 W TDP 28 W TDP 30 W TDP 35 W TDP 50 W TDP 80 W 88% 61% 84% 81% 98% 85% 100%
...
AMD Ryzen 9 PRO 6950HS -1%
AMD Ryzen 9 5980HS 1%
...
Intel Core i7-12800HX 85%
Cinebench R15 - Cinebench R15 CPU Multi 64 Bit
min: 1905 de promedio: 2120 mediana: 2112 (22%) max: 2332 Points
CPU TDP ? TDP 23 W TDP 28 W TDP 30 W TDP 35 W TDP 50 W TDP 80 W 88% 91% 82% 85% 91% 100% 100%
...
AMD Ryzen 9 5980HS -2%
Intel Core i7-12850HX 26%
...
Intel Core i7-12800HX 60%
0 120 240 360 480 600 720 840 960 1080 1200 1320 1440 1560 1680 1800 1920 2040 2160 2280 Tooltip Dell XPS 13 Plus 9320 i7-1280P OLED: Ø1467 (1369.16-1905.49)
HP EliteBook 840 G9: Ø1567 (1319.74-1992.03)
Dell XPS 13 Plus 9320 i7 1280P: Ø1701 (1524.97-2057.08)
Lenovo Yoga Slim 9 14IAP7: Ø1774 (1704.67-2112.97)
Lenovo ThinkPad X1 Nano Gen 2 Core i7-1280P: Ø1191 (1063.89-2118.53)
MSI Prestige 15 A12UD-093: Ø1539 (1487.04-2325.04)
MSI Summit E16 Flip A12UDT-031: Ø2059 (1955.03-2339.73)
Cinebench R15 - Cinebench R15 CPU Single 64 Bit
min: 203 de promedio: 237.3 mediana: 238 (73%) max: 258 Points
CPU TDP ? TDP 23 W TDP 28 W TDP 30 W TDP 35 W TDP 50 W TDP 80 W 92% 92% 89% 100% 100% 79% 92%
...
Intel Core i7-1265U 0%
AMD Ryzen 9 PRO 6950HS 1%
Intel Core i5-1245U 2%
AMD Ryzen 9 5980HS 2%
...
Intel Core i9-12900HX 17%
Cinebench R11.5 - Cinebench R11.5 CPU Multi 64 Bit
25.2 Points (36%)
...
Intel Core i9-12900HX 65%
Cinebench R11.5 - Cinebench R11.5 CPU Single 64 Bit
3.1 Points (10%)
...
Intel Core i5-1245U -5%
Intel Core i7-1265U -3%
Intel Core i9-12900HX 9%
Cinebench R10 - Cinebench R10 Rend. Single (32bit)
8881 puntos (72%)
...
Intel Core i7-1265U -4%
Intel Core i9-12900HX 7%
Cinebench R10 - Cinebench R10 Rend. Multi (32bit)
46007 puntos (52%)
...
Intel Core i9-12900HX 40%
Cinebench R10 - Cinebench R10 Rend. Multi (64bit)
70566 Points (51%)
...
Intel Core i7-1265U -15%
Intel Core i5-1245U -12%
AMD Ryzen 9 PRO 6950HS -6%
Cinebench R10 - Cinebench R10 Rend. Single (64bit)
14362 Points (78%)
...
Intel Core i5-1230U -16%
Intel Core i3-1215U -11%
Intel Core i5-1245U -6%
Intel Core i7-1265U -3%
wPrime 2.10 - wPrime 2.0 1024m *
1168 s (14%)
...
Intel Atom x5-Z8300 -2%
Intel Core i3-2365M 0%
AMD Athlon II M320 0%
Intel Celeron 3865U 4%
...
VIA C3-M C3-M-1200 624%
wPrime 2.10 - wPrime 2.0 32m *
34 s (7%)
...
AMD Athlon II P360 -2%
Intel Celeron 2970M -1%
AMD A4-6210 0%
Intel Atom x5-E8000 2%
AMD Turion II M500 2%
AMD Athlon II P340 2%
...
wPrime 1.55 - wPrime 1.55 1024m *
1165 s (5%)
...
AMD A6-7310 -35%
Intel Core i5-7Y57 -10%
Intel Core Duo L2500 21%
Intel Pentium Dual Core T2080 34%
Intel Atom x5-Z8500 138%
Intel Mobile Pentium 4 538 148%
Intel Celeron M 430 153%
AMD Mobile Sempron 3000+ 155%
AMD Turion 64 ML-32 164%
AMD Turion 64 ML-34 165%
...
Intel Celeron M 373 2104%
wPrime 1.55 - wPrime 1.55 32m *
28 s (15%)
...
AMD A6-7310 -16%
AMD Phenom II X3 N850 -15%
AMD Phenom II X2 X640 BE -12%
AMD Turion II N530 13%
Intel Core i5-7Y57 15%
AMD Turion II P540 18%
AMD Athlon II N330 23%
AMD Athlon II P340 28%
...
Intel Pentium M 713 579%
7082 puntos (41%)
...
Intel Core i7-8559U -6%
Intel Core i3-1215U 12%
...
7-Zip 18.03 - 7-Zip 18.03 Multli Thread 4 runs
min: 45292 de promedio: 49730 mediana: 49572 (31%) max: 53710 MIPS
CPU TDP ? TDP 23 W TDP 28 W TDP 30 W TDP 35 W TDP 50 W TDP 80 W 99% 87% 92% 89% 100% 96% 84%
...
AMD Ryzen 9 PRO 6950HS -1%
...
Intel Core i7-12800HX 55%
7-Zip 18.03 - 7-Zip 18.03 Single Thread 4 runs
min: 4995 de promedio: 5488 mediana: 5540 (66%) max: 5874 MIPS
CPU TDP ? TDP 23 W TDP 28 W TDP 30 W TDP 35 W TDP 50 W TDP 80 W 93% 96% 85% 100% 97% 94% 88%
...
Apple M1 -1%
Intel Core i7-8559U 0%
AMD Ryzen 9 PRO 6950HS 1%
...
Intel Core i9-12900HX 15%
HWBOT x265 Benchmark v2.2 - HWBOT x265 4k Preset
min: 9.62 de promedio: 12.5 mediana: 12.9 (28%) max: 14.5 fps
CPU TDP 23 W TDP 28 W TDP 30 W TDP 35 W TDP 80 W 66% 95% 89% 100% 81%
...
AMD Ryzen 9 PRO 6950HS 2%
...
Intel Core i7-12800HX 99%
0 5 10 15 20 25 Tooltip Lenovo ThinkPad X1 Nano Gen 2 Core i7-1280P: Ø11.9 (1.36-27.7)
MSI Summit E16 Flip A12UDT-031: Ø12.9 (1.01-21.6)
HP EliteBook 840 G9: Ø14.8 (1.35-27.1)
Dell XPS 13 Plus 9320 i7-1280P OLED: Ø15.1 (1.32-27.2)
Lenovo Yoga Slim 9 14IAP7: Ø16 (1.26-25.5)
TrueCrypt - TrueCrypt Serpent
1.2 GB/s (0%)
...
Intel Core i9-12900HX 42%
...
Intel Core i9-12900HX 42%
TrueCrypt - TrueCrypt Twofish
2.1 GB/s (0%)
...
Intel Core i9-12900HX 52%
...
Intel Core i9-12900HX 52%
TrueCrypt - TrueCrypt AES
11.8 GB/s (0%)
...
Intel Core i3-1215U -2%
AMD Ryzen 9 PRO 6950HS -1%
Intel Core i9-12900HX 47%
...
Intel Core i9-12900HX 47%
Blender - Blender 3.3 Classroom CPU *
min: 490 de promedio: 566 mediana: 537 (7%) max: 741 Seconds
CPU TDP ? TDP 23 W TDP 28 W TDP 30 W TDP 35 W TDP 50 W TDP 80 W 104% 100% 103% 102% 104% 104% 103%
...
Apple M2 19%
Intel Core i5-1245U 26%
...
Blender - Blender 2.79 BMW27 CPU *
min: 259 de promedio: 281.7 mediana: 285 (2%) max: 309 Seconds
CPU TDP ? TDP 23 W TDP 28 W TDP 30 W TDP 35 W TDP 50 W TDP 80 W 100% 100% 100% 100% 100% 100% 100%
Intel Core i5-1038NG7 -99%
...
AMD Ryzen 9 PRO 6950HS -6%
...
R Benchmark 2.5 - R Benchmark 2.5 *
min: 0.4505 de promedio: 0.5 mediana: 0.5 (10%) max: 0.512 sec
CPU TDP ? TDP 23 W TDP 28 W TDP 30 W TDP 35 W TDP 50 W TDP 80 W 101% 101% 100% 101% 101% 101% 100%
Intel Core i9-12900HX -11%
Intel Core i9-12950HX -8%
Intel Core i7-12800HX -3%
Intel Core i7-12850HX -3%
Intel Core i7-1265U 5%
AMD Ryzen 9 5980HS 6%
...
3DMark 06 - CPU - 3DMark 06 - CPU
6579 Points (14%)
...
Intel Core i5-1230U 1%
...
Intel Core i9-12900HX 169%
Super Pi mod 1.5 XS 1M - Super Pi mod 1.5 XS 1M *
7 s (2%)
AMD Ryzen 9 PRO 6950HS 3%
Intel Core i9-12900HX 4%
Intel Core i3-1215U 4%
...
VIA C3-M C3-M-1200 6514%
Super Pi mod 1.5 XS 2M - Super Pi mod 1.5 XS 2M *
16 s (1%)
...
Intel Core i5-1230U -6%
Intel Core i3-1215U -1%
Intel Core i9-12900HX 1%
...
Super Pi Mod 1.5 XS 32M - Super Pi mod 1.5 XS 32M *
366 s (2%)
...
Intel Core i5-1230U 0%
Intel Core i3-1215U 2%
Intel Core i9-12900HX 4%
...
VIA C3-M C3-M-1200 6051%
3DMark 11 - 3DM11 Performance Physics
min: 11415 de promedio: 15372 mediana: 15372.5 (42%) max: 18478 Points
CPU TDP 23 W TDP 28 W TDP 30 W TDP 35 W TDP 50 W TDP 80 W 62% 76% 83% 100% 83% 95%
...
AMD Ryzen 9 5980HS -1%
Intel Core i5-1245U 4%
...
Intel Core i7-12800HX 46%
3DMark - 3DMark Cloud Gate Physics
min: 7264 de promedio: 12588 mediana: 12154 (31%) max: 17047 Points
CPU TDP 23 W TDP 28 W TDP 30 W TDP 35 W TDP 50 W TDP 80 W 61% 43% 78% 96% 64% 100%
...
Intel Core i5-1245U -4%
...
Intel Core i9-12950HX 81%
3DMark - 3DMark Fire Strike Standard Physics
min: 15398 de promedio: 19695 mediana: 19017.5 (35%) max: 25756 Points
CPU TDP 23 W TDP 28 W TDP 30 W TDP 35 W TDP 50 W TDP 80 W 60% 72% 76% 91% 60% 100%
...
Intel Core i5-1245U -6%
Intel Xeon W-2145 0%
AMD Ryzen 9 PRO 6950HS 4%
...
Intel Core i7-12800HX 75%
3DMark - 3DMark Time Spy CPU
min: 6205 de promedio: 8459 mediana: 7672.5 (38%) max: 12031 Points
CPU TDP 23 W TDP 28 W TDP 30 W TDP 35 W TDP 50 W TDP 80 W 52% 61% 67% 86% 56% 100%
...
AMD Ryzen 9 PRO 6950HS -16%
AMD Ryzen 9 5980HS 6%
...
Intel Core i7-12800HX 69%
Geekbench 5.4 - Geekbench 5.1 - 5.4 64 Bit Single-Core
min: 1571 de promedio: 1701 mediana: 1746 (76%) max: 1802 puntos
CPU TDP ? TDP 23 W TDP 28 W TDP 30 W TDP 35 W TDP 50 W TDP 80 W 88% 100% 100% 98% 97% 87% 91%
...
Intel Core i7-1250U -4%
Intel Core i7-1370P -3%
Intel Core i5-1245U -2%
Intel Core i7-1265U 2%
Apple M1 2%
Intel Core i7-12800HX 3%
...
Apple M2 Max 16%
Geekbench 5.4 - Geekbench 5.1 - 5.4 64 Bit Multi-Core
min: 9623 de promedio: 10839 mediana: 11191 (39%) max: 11811 puntos
CPU TDP ? TDP 23 W TDP 28 W TDP 30 W TDP 35 W TDP 50 W TDP 80 W 86% 88% 97% 96% 95% 100% 81%
...
Intel Core i7-1370P -6%
Apple M2 Pro 10-Core 11%
Intel Core i7-12850HX 13%
Intel Core i7-12800HX 31%
...
Apple M2 Max 42%
Geekbench 5.0 - Geekbench 5.0 64 Bit Single-Core
min: 1685 de promedio: 1706 mediana: 1694 (7%) max: 1738 puntos
CPU TDP 23 W TDP 28 W TDP 30 W 100% 97% 97%
...
Intel Core i5-1245U -7%
Intel Core i7-1265U -3%
Intel Core i7-12850HX 1%
Intel Core i7-12800HX 1%
Intel Core i9-12950HX 5%
Intel Core i9-12900HX 8%
Geekbench 5.0 - Geekbench 5.0 64 Bit Multi-Core
min: 9886 de promedio: 10561 mediana: 10537 (33%) max: 11260 puntos
CPU TDP 23 W TDP 28 W TDP 30 W 88% 100% 94%
...
AMD Ryzen 9 5980HS -18%
Intel Core i5-1245U -16%
Intel Core i7-12850HX 8%
Intel Core i9-12950HX 29%
Intel Core i7-12800HX 33%
Intel Core i9-12900HX 56%
Geekbench 4.1 - 4.4 - Geekbench 4.1 - 4.4 64 Bit Single-Core
7522 puntos (78%)
...
Intel Core i3-1215U -10%
Intel Core i5-1245U -6%
Intel Core i7-1265U 0%
Intel Core i9-12900HX 9%
Intel Core i9-13900HX 18%
Geekbench 4.1 - 4.4 - Geekbench 4.1 - 4.4 64 Bit Multi-Core
40196 puntos (45%)
...
Intel Xeon W-2145 -15%
Intel Core i9-12900HX 46%
Intel Core i9-13900HX 77%
Mozilla Kraken 1.1 - Kraken 1.1 Total Score *
min: 526 de promedio: 563 mediana: 538 (1%) max: 683 ms
CPU TDP ? TDP 23 W TDP 28 W TDP 30 W TDP 35 W TDP 50 W TDP 80 W 100% 100% 100% 100% 100% 100% 100%
...
Intel Core i7-12800HX -7%
Intel Core i7-12850HX -7%
Intel Core i7-1265U 0%
Intel Core i7-1260U 2%
Intel Core i5-1245U 2%
Intel Core i7-1250U 3%
...
Sunspider - Sunspider 1.0 Total Score *
95.5 ms (1%)
...
Intel Xeon W-2145 -5%
Intel Core i5-8265U -2%
Intel Core i7-4712HQ 3%
...
Octane V2 - Octane V2 Total Score
min: 83104 de promedio: 84579 mediana: 84578.5 (87%) max: 86053 Points
CPU TDP 35 W TDP 50 W 100% 97%
...
Intel Core i7-1265U -11%
Intel Core i7-1250U -4%
Intel Core i9-12950HX 11%
Intel Core i9-12900HX 13%
WebXPRT 4 - WebXPRT 4 Score
min: 232 de promedio: 247.2 mediana: 248.5 (78%) max: 257 Points
CPU TDP ? TDP 23 W TDP 28 W TDP 30 W TDP 35 W TDP 80 W 98% 100% 98% 95% 96% 90%
...
Apple M2 -9%
Intel Core i7-1250U -7%
Intel Core i7-12850HX -6%
Intel Core i7-1265U -4%
Intel Core i5-1245U -3%
Intel Core i9-12950HX 12%
Intel Core i9-12900HX 13%
...
Intel Core i9-12950HX 12%
WebXPRT 3 - WebXPRT 3 Score
min: 203 de promedio: 271.3 mediana: 286 (72%) max: 290 Points
CPU TDP ? TDP 23 W TDP 28 W TDP 30 W TDP 35 W TDP 50 W TDP 80 W 99% 100% 99% 98% 99% 70% 90%
...
Apple M1 -2%
Intel Core i7-1250U -1%
Intel Core i5-1245U 0%
Intel Core i7-1265U 1%
AMD Ryzen 9 PRO 6950HS 1%
...
CrossMark - CrossMark Overall
min: 1652 de promedio: 1704 mediana: 1690 (65%) max: 1773 Points
CPU TDP 23 W TDP 28 W TDP 30 W TDP 35 W TDP 50 W TDP 80 W 96% 99% 100% 95% 94% 93%
...
Intel Core i5-1245U -7%
Intel Core i7-12850HX -5%
Intel Core i9-12950HX 15%
Intel Core i7-12800HX 16%
...
Intel Core i9-12900HX 26%
Power Consumption - Prime95 Power Consumption - external Monitor *
min: 40.8 de promedio: 56.1 mediana: 54.3 (9%) max: 73.4 Watt
CPU TDP 23 W TDP 28 W TDP 30 W TDP 35 W TDP 50 W TDP 80 W 106% 102% 104% 104% 104% 100%
...
Intel Core i5-1245U -1%
AMD Ryzen 9 PRO 6950HS 11%
...
Intel Core i7-12800HX 216%
0 5 10 15 20 25 30 35 40 45 50 55 60 65 70 75 80 85 90 95 Tooltip Lenovo ThinkPad X1 Nano Gen 2 Core i7-1280P: Ø40.8 (36.9-65.5)
HP EliteBook 840 G9: Ø51.8 (48.3-67.3)
MSI Prestige 15 A12UD-093: Ø53.2 (50.3-63.7)
Lenovo Yoga Slim 9 14IAP7: Ø55.3 (49.5-69.4)
Dell XPS 13 Plus 9320 i7-1280P OLED: Ø62.3 (57.4-63)
MSI Summit E16 Flip A12UDT-031: Ø73.4 (67.2-95.2)
Power Consumption - Cinebench R15 Multi Power Consumption - external Monitor *
min: 45.3 de promedio: 65.3 mediana: 65.1 (14%) max: 90.7 Watt
CPU TDP 23 W TDP 28 W TDP 30 W TDP 35 W TDP 50 W TDP 80 W 112% 107% 106% 106% 109% 100%
...
Intel Core i7-7700HQ -2%
AMD Ryzen 9 PRO 6950HS -1%
Intel Core i7-8559U 14%
...
Intel Core i9-12950HX 204%
0 5 10 15 20 25 30 35 40 45 50 55 60 65 70 75 80 85 90 95 Tooltip Lenovo ThinkPad X1 Nano Gen 2 Core i7-1280P: Ø45.3 (35.8-65.3)
MSI Prestige 15 A12UD-093: Ø56.6 (51.4-63.6)
Dell XPS 13 Plus 9320 i7-1280P OLED: Ø62.8 (62.2-62.9)
HP EliteBook 840 G9: Ø67.3 (67.2-67.3)
Lenovo Yoga Slim 9 14IAP7: Ø69.1 (67.4-69.4)
MSI Summit E16 Flip A12UDT-031: Ø94.2 (86.3-96.2)
Power Consumption - Idle Power Consumption - external Monitor *
min: 3.08 de promedio: 8.5 mediana: 8.7 (8%) max: 13.6 Watt
CPU TDP 30 W TDP 35 W TDP 50 W TDP 80 W 112% 104% 107% 100%
...
Intel Core i7-1250U -15%
...
0 1 2 3 4 5 6 7 8 9 10 11 12 13 14 15 Tooltip HP EliteBook 840 G9: Ø3.08 (2.25-10.2)
MSI Prestige 15 A12UD-093: Ø7.64 (6.85-9.29)
Lenovo Yoga Slim 9 14IAP7: Ø9.8 (7.78-15)
MSI Summit E16 Flip A12UDT-031: Ø13.6 (13-15.1)
Power Consumption - Idle Power Consumption 150cd 1min *
min: 4.07 de promedio: 10.5 mediana: 10.2 (26%) max: 17.4 Watt
CPU TDP 30 W TDP 35 W TDP 50 W TDP 80 W 161% 120% 145% 100%
...
Intel Core i7-1250U -26%
AMD Ryzen 9 PRO 6950HS -14%
...
0 1 2 3 4 5 6 7 8 9 10 11 12 13 14 15 16 17 18 19 Tooltip HP EliteBook 840 G9: Ø4.07 (3.28-7.54)
MSI Prestige 15 A12UD-093: Ø7.52 (6.79-9.55)
Lenovo Yoga Slim 9 14IAP7: Ø12.9 (11.6-16.3)
MSI Summit E16 Flip A12UDT-031: Ø17.4 (16.6-19.1)
Power Consumption - Cinebench R15 Multi Power Efficiency - external Monitor
min: 25.7 de promedio: 32.6 mediana: 30.3 (35%) max: 46.8 Points per Watt
CPU TDP 23 W TDP 28 W TDP 30 W TDP 35 W TDP 80 W 100% 65% 63% 65% 55%
...
Intel Core i7-1260U -11%
AMD Ryzen 9 PRO 6950HS -9%
Intel Core i7-1250U -7%
Apple M1 15%
...
- Gama de valores de las pruebas para esta tarjeta gráfica
- Valores medios de las pruebas para esta tarjeta gráfica
* Smaller numbers mean a higher performance
v1.22
log 22. 05:07:52
#0 no ids found in url (should be separated by "_") +0s ... 0s
#1 not redirecting to Ajax server +0s ... 0s
#2 did not recreate cache, as it is less than 5 days old! Created at Fri, 20 Jan 2023 08:57:08 +0100 +0.001s ... 0.001s
#3 no comparison url found in template nbc.compare_page_2 needed +0.007s ... 0.008s
#4 no comparison url found in template nbc.compare_page_2 needed +0s ... 0.008s
#5 no comparison url found in template nbc.compare_page_2 needed +0s ... 0.009s
#6 no comparison url found in template nbc.compare_page_2 needed +0s ... 0.009s
#7 no comparison url found in template nbc.compare_page_2 needed +0s ... 0.009s
#8 no comparison url found in template nbc.compare_page_2 needed +0s ... 0.009s
#9 no comparison url found in template nbc.compare_page_2 needed +0s ... 0.009s
#10 no comparison url found in template nbc.compare_page_2 needed +0s ... 0.009s
#11 no comparison url found in template nbc.compare_page_2 needed +0s ... 0.01s
#12 no comparison url found in template nbc.compare_page_2 needed +0s ... 0.01s
#13 no comparison url found in template nbc.compare_page_2 needed +0s ... 0.01s
#14 no comparison url found in template nbc.compare_page_2 needed +0s ... 0.01s
#15 composed specs +0s ... 0.011s
#16 did output specs +0s ... 0.011s
#17 getting avg benchmarks for device 14059 +0.011s ... 0.021s
#18 got single benchmarks 14059 +0.032s ... 0.053s
#19 got avg benchmarks for devices +0s ... 0.053s
#20 min, max, avg, median took s +0.578s ... 0.631s
#21 no comparison url found in template nbc.compare_page_2 needed +0s ... 0.631s
#22 return log +0s ... 0.631s
Análisis para el Intel Core i7-1280P procesador
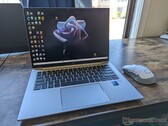
Análisis del portátil HP EliteBook 840 G9: La alternativa al Lenovo ThinkPad X1 Carbon A diferencia de la mayoría de subportátiles empresariales, el EliteBook 840/845 G9 viene con opciones Intel vPro y AMD PRO para atraer a los fans de ambos lados...
Intel Core i7-1280P | Intel Iris Xe Graphics G7 96EUs | 14.00" | 1.5 kg
Análisis del portátil MSI Prestige 15: Deslumbrante calidad de imagen 4K, sólido rendimiento 
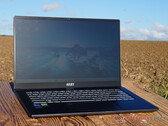
El portátil Creator de MSI combina unos valores de imagen extraordinarios con un procesador eficiente y potente, así como un chip gráfico independiente con traz...
Intel Core i7-1280P | NVIDIA GeForce RTX 3050 Ti Laptop GPU | 15.60" | 1.8 kg
Análisis del MSI Summit E16 Flip: portátil 2-en-1 con lápiz, pantalla 16:10 y RTX 3050 Ti 
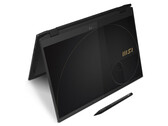
El Summit E16 Flip ofrece una pantalla táctil de 16 pulgadas en un formato 16:10 más adecuado para la oficina, Thunderbolt 4 y una GPU dedicada GeForce RTX 3050...
Intel Core i7-1280P | NVIDIA GeForce RTX 3050 Ti Laptop GPU | 16.00" | 1.9 kg
Análisis del Lenovo Yoga Slim 9i: Posiblemente el portátil Evo más rápido 
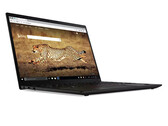
El Core i7-1280P de Intel convierte al Lenovo Yoga Slim 9i en el ultrabook presumiblemente más rápido de este momento. Gracias a la pantalla OLED 3K de 90 Hz, l...
Intel Core i7-1280P | Intel Iris Xe Graphics G7 96EUs | 14.00" | 1.4 kg
Análisis del Lenovo ThinkPad X1 Nano Gen 2: El portátil X1 más pequeño de la historia 450 nits, colores sRGB completos, relación de aspecto 16:10, WAN 5G Sub 6 y CPU Core P de 12ª generación, todo ello en un sistema que pesa menos de 1 kg. ¿Se pu...
Intel Core i7-1280P | Intel Iris Xe Graphics G7 96EUs | 13.00" | 958 g
Dell XPS 13 Plus 9320 i7-1280P OLED : Intel Iris Xe Graphics G7 96EUs, 13.40", 1.3 kg
análise » Revisión de los tres modelos Dell XPS 13 Plus 9320: ¿Core i5-1240P, i7-1260P o i7-1280P OLED?
MSI Prestige 14 Evo A12M-248RU : Intel Iris Xe Graphics G7 96EUs, 14.00", 1.3 kg
análise externo » MSI Prestige 14 Evo A12M-248RU
Lenovo Yoga 9 14IAP7-82LU007FGE : Intel Iris Xe Graphics G7 96EUs, 14.00", 1.4 kg
análise externo » Lenovo Yoga 9 14IAP7-82LU007FGE
Lenovo ThinkPad X1 Nano Gen 2 Core i7-1280P : Intel Iris Xe Graphics G7 96EUs, 13.00", 1 kg
análise externo » Lenovo ThinkPad X1 Nano Gen 2 Core i7-1280P
MSI Summit E16 Flip Evo A12MT : Intel Iris Xe Graphics G7 96EUs, 16.00", 1.9 kg
análise externo » MSI Summit E16 Flip Evo A12MT
Lenovo Yoga Slim 9 14IAP7 : Intel Iris Xe Graphics G7 96EUs, 14.00", 1.4 kg
análise externo » Lenovo Yoga Slim 9 14IAP7
MSI Summit E13 Flip Evo A12MT-023 : Intel Iris Xe Graphics G7 96EUs, 13.40", 1.4 kg
análise externo » MSI Summit E13 Flip Evo A12MT-023
MSI Prestige 14 A12SC-086CA : NVIDIA GeForce GTX 1650 Mobile, 14.00", 1.6 kg
análise externo » MSI Prestige 14 A12SC-086CA
MSI Stealth 17M A12UE : NVIDIA GeForce RTX 3060 Laptop GPU, 17.30", 2.2 kg
análise externo » MSI Stealth 17M A12UE
MSI Prestige 14 Evo A12M-089 : Intel Iris Xe Graphics G7 96EUs, 14.00", 1.3 kg
análise externo » MSI Prestige 14 Evo A12M-089
MSI Summit E16 Flip A12UDT-031 : NVIDIA GeForce RTX 3050 Ti Laptop GPU, 16.00", 1.9 kg
análise externo » MSI Summit E16 Flip A12UDT-031
MSI Prestige 15 A12UD-049ES : NVIDIA GeForce RTX 3050 Ti Laptop GPU, 15.60", 1.7 kg
análise externo » MSI Prestige 15 A12UD-049ES
Dell XPS 13 Plus 9320 i7-1280P FHD : Intel Iris Xe Graphics G7 96EUs, 13.40", 1.3 kg
análise externo » Dell XPS 13 Plus 9320 i7-1280P FHD
Dell XPS 13 Plus 9320 i7-1280P OLED : Intel Iris Xe Graphics G7 96EUs, 13.40", 1.3 kg
análise externo » Dell XPS 13 Plus 9320 i7-1280P OLED
MSI Prestige 14 A12UC, i7-1280P : NVIDIA GeForce RTX 3050 Laptop GPU, 14.00", 1.3 kg
análise externo » MSI Prestige 14 A12UC, i7-1280P
MSI Stealth 15M B12UE : NVIDIA GeForce RTX 3060 Laptop GPU, 15.60", 1.9 kg
análise externo » MSI Stealth 15M B12UE
MSI Prestige 15 A12UC : NVIDIA GeForce RTX 3050 Laptop GPU, 15.60", 1.7 kg
análise externo » MSI Prestige 15 A12UC
MSI Prestige 15 A12UD-093 : NVIDIA GeForce RTX 3050 Ti Laptop GPU, 15.60", 1.8 kg
análise externo » MSI Prestige 15 A12UD-093
MSI Summit E14 Evo A12M-050 : Intel Iris Xe Graphics G7 96EUs, 14.00", 1.6 kg
análise externo » MSI Summit E14 Evo A12M-050
Please share our article, every link counts!
.170
Otras CPUs de la serie Alder Lake-P » Intel Core i5-12600H 12x 2 GHz - 4.5 GHz
» Intel Core i5-12450H 8x 1.5 GHz - 4.4 GHz
CPUs de alrededor + Intel Core i5-13600H 12x 2.1 GHz - 4.8 GHz
+ Intel Core i5-13500H 12x 1.9 GHz - 4.7 GHz
+ AMD Ryzen 9 5980HS 8x 3.3 GHz - 4.8 GHz
+ Intel Core i7-1370P 14x 1.4 GHz - 5.2 GHz
- AMD Ryzen 7 7735HS 8x 3.2 GHz - 4.75 GHz
Klaus Hinum (Update: 2022-04- 3)