Análises de portátiles con NVIDIA GeForce RTX 3050 Ti Laptop GPU tarjeta gráfica
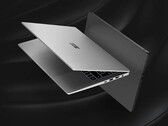
Análisis del Asus VivoBook Pro 16: Un portátil multimedia con Core i7, RTX 3050 Ti y DCI-P3
El VivoBook no viene exactamente con el hardware más nuevo (Alder Lake, Ampere), pero gana puntos por otras razones: El portátil Asus tiene una brillante pantalla de 16 pulgadas (2.560 x 1.600 píxeles) en formato 16:10 que tiene una alta frecuencia de refresco (120 Hz) y una gran cobertura del espacio de color (DCI-P3).
Intel Core i7-12700H, NVIDIA GeForce RTX 3050 Ti Laptop GPU, 16", 1.9 kgAnálisis del portátil HP Victus 15: Caro para un jugador económico
Se supone que la Victus 15 es una alternativa asequible a la serie Omen, pero su precio de venta de 1.200 dólares por una GPU básica con un rendimiento casi idéntico al de la GTX 1660 Ti de hace dos años hace que se encuentre en la cuerda floja.
Intel Core i7-12700H, NVIDIA GeForce RTX 3050 Ti Laptop GPU, 15.6", 2.3 kgAnálisis del portátil MSI Prestige 15: Deslumbrante calidad de imagen 4K, sólido rendimiento
El portátil Creator de MSI combina unos valores de imagen extraordinarios con un procesador eficiente y potente, así como un chip gráfico independiente con trazado de rayos implementado. La combinación parece especialmente adecuada para la edición/procesamiento de imágenes a un nivel superior
Intel Core i7-1280P, NVIDIA GeForce RTX 3050 Ti Laptop GPU, 15.6", 1.8 kgRevisión del portátil Schenker Vision 14 - Actualización masiva del rendimiento del Core i7-12700H
Teniendo en cuenta su bajo peso, incluso el Tiger Lake Schenker Vision 14 con la GPU GeForce RTX 3050 Ti era un portátil de 14 pulgadas muy potente que recibe un enorme impulso con la actualización del Core i7-12700H de esta generación. Además, se ha aumentado el tamaño de la batería para mejorar significativamente la autonomía.
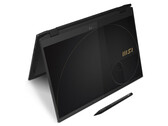
Intel Core i7-12700H, NVIDIA GeForce RTX 3050 Ti Laptop GPU, 14", 1.3 kgAnálisis del MSI Summit E16 Flip: portátil 2-en-1 con lápiz, pantalla 16:10 y RTX 3050 Ti
El Summit E16 Flip ofrece una pantalla táctil de 16 pulgadas en un formato 16:10 más adecuado para la oficina, Thunderbolt 4 y una GPU dedicada GeForce RTX 3050 Ti Laptop. La pantalla táctil puede manejarse con los dedos o con el lápiz de entrada MSI incluido.
Intel Core i7-1280P, NVIDIA GeForce RTX 3050 Ti Laptop GPU, 16", 1.9 kgLenovo IdeaPad Gaming 3 15IAH7: Intel Core i5-12500H, 15.60", 2.4 kg
análise » Análisis del Lenovo IdeaPad Gaming 3 15IAH7: Uno de los portátiles más potentes con RTX 3050 Ti
HP Pavilion Gaming 17-cd2146ng: Intel Core i5-11300H, 17.30", 2.8 kg
análise » Análisis del portátil HP Pavilion Gaming 17: Una buena pantalla a un precio económico
Dell Inspiron 16 Plus 7620: Intel Core i7-12700H, 16.00", 2.1 kg
análise » Análisis del Dell Inspiron 16 Plus 7620: El portátil multimedia que lo hace todo
Dell XPS 15 9520 RTX 3050 Ti: Intel Core i7-12700H, 15.60", 1.9 kg
análise » 2022 Análisis del portátil Dell XPS 15 9520 3.5K OLED: ¿Saltar o comprar?
HP Victus 16-e0145ng: AMD Ryzen 5 5600H, 16.10", 2.4 kg
análise » Análisis del HP Victus 16: Portátil para juegos asequible con CPU AMD y GPU Nvidia
Asus Zenbook Pro 15 OLED UM535Q: AMD Ryzen 9 5900HX, 15.60", 1.9 kg
análise » Análisis del portátil Asus Zenbook Pro 15 OLED UM535Q: Como un XPS 15 potenciado por AMD
Dell G15 5510-43NHT: Intel Core i5-10200H, 15.60", 2.5 kg
análise » Análisis del portátil Dell G15 5510: El portátil para juegos de 120 Hz más económico se enfrenta a su homólogo de AMD
Lenovo ThinkBook 15p G2 ITH 21B1000YGE: Intel Core i7-11800H, 15.60", 1.9 kg
análise » Lenovo ThinkBook 15p G2: Probando el portátil creador con RTX y 4K
Lenovo Ideapad Gaming 3 15IHU-82K1002RGE: Intel Core i5-11300H, 15.60", 2 kg
análise » Análisis del portátil Lenovo IdeaPad Gaming 3i 15 G6: Portátil de juego económico con una pantalla pobre
Microsoft Surface Laptop Studio i7 RTX 3050 Ti: Intel Core i7-11370H, 14.40", 1.8 kg
análise » Análisis del Microsoft Surface Laptop Studio: Un concepto interesante con una CPU Intel lenta
Asus ROG Flow Z13 GZ301ZE: Intel Core i9-12900H, 13.40", 1.2 kg
análise » Asus ROG Flow Z13 en revisión: Tableta para juegos con una potente CPU Alder Lake i9
Schenker Vision 14: Intel Core i7-11370H, 14.00", 1.1 kg
análise » Análisis del portátil Schenker Vision 14: Ahora también disponible con la GeForce RTX 3050 Ti
Asus Vivobook Pro 16X-M7600QE: AMD Ryzen 9 5900HX, 16.10", 1.9 kg
análise » Análisis de la unidad de preproducción del Asus Vivobook Pro 16X: Rendimiento, resistencia y poderosa pantalla OLED
Lenovo ThinkPad X1 Extreme G4-20Y5CTO1WW (3050 Ti): Intel Core i7-11800H, 16.00", 2 kg
análise » Análisis del portátil Lenovo ThinkPad X1 Extreme Gen 4: El buque insignia del rendimiento con pantalla táctil 16:10
Dell G15 5515: AMD Ryzen 7 5800H, 15.60", 2.4 kg
análise » Análisis del Dell G15 5515 Ryzen Edition: Un portátil para juegos FHD asequible
Asus Zephyrus G14 GA401QEC: AMD Ryzen 9 5900HS, 14.00", 1.7 kg
análise » Análisis del Asus Zephyrus G14 GA401Q: El portátil de 14 pulgadas para juegos Alan Walker Special Edition
Schenker XMG Focus 17: Intel Core i7-11800H, 17.30", 2.5 kg
análise » Análisis del portátil XMG Focus 17 (Clevo NP70HK): Portátil para juegos de gama media equipado con la RTX 3050 Ti
Schenker XMG Focus 15: Intel Core i7-11800H, 15.60", 1.9 kg
análise » Análisis del portátil para juegos XMG Focus 15 (Clevo NP50HK): RTX 3050 Ti al límite
Asus ROG Strix G17 G713QE-RB74: AMD Ryzen 7 5800H, 17.30", 2.5 kg
análise » Análisis del portátil Asus ROG Strix G17 G713QE: la GeForce RTX 3050 Ti arrastra a un gran sistema
Dell XPS 15 9510 11800H RTX 3050 Ti OLED: Intel Core i7-11800H, 15.60", 1.9 kg
análise » Análisis del Dell XPS 15 9510: El portátil multimedia convence con su nuevo panel OLED
Dell G15 5515: AMD Ryzen 7 5800H, 15.60", 2.4 kg
análise externo » Dell G15 5515
HP Victus 16-e1000ax: AMD Ryzen 5 6600H, 16.10", 2.4 kg
análise externo » HP Victus 16-e1000ax
HP Victus 16-e0145ng: AMD Ryzen 5 5600H, 16.10", 2.4 kg
análise externo » HP Victus 16-e0145ng
HP Victus 16-d1008ns: Intel Core i5-12500H, 16.10", 2.5 kg
análise externo » HP Victus 16-d1008ns
HP Victus 16-d1018ns: Intel Core i5-12500H, 16.10", 2.5 kg
análise externo » HP Victus 16-d1018ns
Acer Aspire 7 A715-51G-51BY: Intel Core i5-1240P, 15.60", 2.1 kg
análise externo » Acer Aspire 7 A715-51G-51BY
HP Victus 16-d1023ns: Intel Core i7-12700H, 16.10", 2.5 kg
análise externo » HP Victus 16-d1023ns
HP Omen 16-c0025ns: AMD Ryzen 7 5800H, 16.10", 2.3 kg
análise externo » HP Omen 16-c0025ns
Acer Nitro 5 AN515-58-7365: Intel Core i7-12700H, 15.60", 2.5 kg
análise externo » Acer Nitro 5 AN515-58-7365
Asus VivoBook Pro 16: Intel Core i7-12700H, 16.00", 1.9 kg
análise externo » Asus VivoBook Pro 16 K6602ZE-KV040W
MSI Katana GF66 12UD-436: Intel Core i7-12650H, 15.60", 2.3 kg
análise externo » MSI Katana GF66 12UD-436
Acer Aspire 7 A715-43G-R83Y: AMD Ryzen 7 5825U, 15.60", 2.2 kg
análise externo » Acer Aspire 7 A715-43G-R83Y
MSI Sword 17 A12UD: Intel Core i7-12700H, 17.30", 2.6 kg
análise externo » MSI Sword 17 A12UD
LG UltraPC 17, i7-1260P RTX 3050 Ti: Intel Core i7-1260P, 17.00", 2 kg
análise externo » LG UltraPC 17, i7-1260P RTX 3050 Ti
Asus ZenBook Pro 15 UM535QE, R7 5800H: AMD Ryzen 7 5800H, 15.60", 2 kg
análise externo » Asus ZenBook Pro 15 UM535QE, R7 5800H
Dell G15 5520, i5-12500H RTX 3050 Ti: Intel Core i5-12500H, 15.60", 2.7 kg
análise externo » Dell G15 5520, i5-12500H RTX 3050 Ti
Asus TUF Gaming A17 FA707RE-HX030W: AMD Ryzen 7 6800H, 17.30", 2.6 kg
análise externo » Asus TUF Gaming A17 FA707RE-HX030W
Acer Swift X SFX14-42G-R607: AMD Ryzen 7 5825U, 14.00", 1.4 kg
análise externo » Acer Swift X SFX14-42G-R607
MSI Katana GF66 12UD-064FR: Intel Core i7-12700H, 15.60", 2.3 kg
análise externo » MSI Katana GF66 12UD-064FR
Asus Vivobook Pro 14X N7401ZE: Intel Core i7-12700H, 14.50", 1.7 kg
análise externo » Asus Vivobook Pro 14X N7401ZE
Asus VivoBook Pro 16X M7600RE: AMD Ryzen 9 6900HX, 16.00", 2 kg
análise externo » Asus VivoBook Pro 16X M7600RE
HP Victus 16-d1027ns: Intel Core i7-12700H, 16.10", 2.5 kg
análise externo » HP Victus 16-d1027ns
HP Omen 16-n0000ns: AMD Ryzen 7 6800H, 16.10", 2.3 kg
análise externo » HP Omen 16-n0000ns
Dell G15 5520, i7-12700H RTX 3050 Ti: Intel Core i7-12700H, 15.60", 2.7 kg
análise externo » Dell G15 5520, i7-12700H RTX 3050 Ti
Lenovo Legion 5 15IAH7-82RC004JGE: Intel Core i5-12500H, 15.60", 2.4 kg
análise externo » Lenovo Legion 5 15IAH7-82RC004JGE
Lenovo Ideapad Gaming 3 15ARH7-82SB0073GE: AMD Ryzen 7 6800H, 15.60", 2.3 kg
análise externo » Lenovo Ideapad Gaming 3 15ARH7-82SB0073GE
HP Victus 16-e0091ns: AMD Ryzen 5 5600H, 16.10", 2.5 kg
análise externo » HP Victus 16-e0091ns
Lenovo IdeaPad Gaming 3 15IAH7-82S90075SP: Intel Core i5-12500H, 15.60", 2.3 kg
análise externo » Lenovo IdeaPad Gaming 3 15IAH7-82S90075SP
Lenovo IdeaPad Gaming 3 15IAH7, i7-12700H RTX 3050 Ti: Intel Core i7-12700H, 15.60", 2.3 kg
análise externo » Lenovo IdeaPad Gaming 3 15IAH7, i7-12700H RTX 3050 Ti
Alienware x14, i7-12700H 3050 Ti: Intel Core i7-12700H, 14.00", 1.8 kg
análise externo » Alienware x14, i7-12700H 3050 Ti
Dell Inspiron 16 Plus 7620: Intel Core i7-12700H, 16.00", 2.1 kg
análise externo » Dell Inspiron 16 Plus 7620
HP Omen 16-c0027ns: AMD Ryzen 7 5800H, 16.10", 2.3 kg
análise externo » HP Omen 16-c0027ns
HP Victus 16-e0093ns: AMD Ryzen 7 5800H, 16.10", 2.5 kg
análise externo » HP Victus 16-e0093ns
HP Victus 15-fb0012AX: AMD Ryzen 7 5800H, 15.60", 2.3 kg
análise externo » HP Victus 15-fb0012AX
HP Victus 16-e1085cl: AMD Ryzen 7 6800H, 16.10", 2.5 kg
análise externo » HP Victus 16-e1085cl
MSI Thin GF63 11UD: Intel Core i7-11800H, 15.60", 1.9 kg
análise externo » MSI Thin GF63 11UD
Acer Predator Triton 300 PT315-53-54XN: Intel Core i5-11400H, 15.60", 2.1 kg
análise externo » Acer Predator Triton 300 PT315-53-54XN
HP Victus 15-fb0028n: AMD Ryzen 7 5800H, 15.60", 2.3 kg
análise externo » HP Victus 15-fb0028n
MSI Summit E16 Flip A12UDT-031: Intel Core i7-1280P, 16.00", 1.9 kg
análise externo » MSI Summit E16 Flip A12UDT-031
MSI Prestige 15 A12UD-049ES: Intel Core i7-1280P, 15.60", 1.7 kg
análise externo » MSI Prestige 15 A12UD-049ES
Dell XPS 15 9520, i9-12900H 3050 Ti: Intel Core i9-12900H, 15.60", 1.9 kg
análise externo » Dell XPS 15 9520, i9-12900H 3050 Ti
Dell Vostro 16 7620, i7-12700H RTX 3050 Ti: Intel Core i7-12700H, 16.00", 2 kg
análise externo » Dell Vostro 16 7620, i7-12700H RTX 3050 Ti
Lenovo IdeaPad Gaming 3 15IAH7, i7-12650H RTX 3050 Ti: Intel Core i7-12650H, 15.60", 2.3 kg
análise externo » Lenovo IdeaPad Gaming 3 15IAH7, i7-12650H RTX 3050 Ti
Asus ROG Strix G17 G713IC-HX011: AMD Ryzen 7 4800H, 17.30", 2.4 kg
análise externo » Asus ROG Strix G17 G713IC-HX011
HP Omen 16-c0615nd: AMD Ryzen 7 5800H, 16.10", 2.3 kg
análise externo » HP Omen 16-c0615nd
Acer Nitro 5 AN515-57-505V: Intel Core i5-11400H, 15.60", 2.2 kg
análise externo » Acer Nitro 5 AN515-57-505V
Alienware m15 R7, i7-12700H RTX 3050 Ti: Intel Core i7-12700H, 15.60", 2.4 kg
análise externo » Alienware m15 R7, i7-12700H RTX 3050 Ti
Asus TUF Dash F15 FX517ZE-HN044W: Intel Core i5-12450H, 15.60", 2 kg
análise externo » Asus TUF Dash F15 FX517ZE-HN044W
Acer Nitro 5 AN515-58-NH.QFKEK.001: Intel Core i5-12500H, 15.60", 2.5 kg
análise externo » Acer Nitro 5 AN515-58-NH.QFKEK.001
Acer Predator Helios 300 PH315-54 NH.QC5EP.00A: Intel Core i5-11400H, 15.60", 2.2 kg
análise externo » Acer Predator Helios 300 PH315-54 NH.QC5EP.00A
Asus ROG Zephyrus G15 GA503QE: AMD Ryzen 9 5900HS, 15.60", 1.9 kg
análise externo » Asus ROG Zephyrus G15 GA503QE
Acer Predator Helios 300 PH315-54-582Q: Intel Core i5-11400H, 15.60", 2.9 kg
análise externo » Acer Predator Helios 300 PH315-54-582Q
Asus TUF Gaming F15 FX506HE-HN012: Intel Core i5-11400H, 15.60", 2.3 kg
análise externo » Asus TUF Gaming F15 FX506HE-HN012
Asus ZenBook Pro 14 Duo UX8402ZE-M3075W: Intel Core i7-12700H, 14.00", 1.8 kg
análise externo » Asus ZenBook Pro 14 Duo UX8402ZE-M3075W
MSI Summit E16 Flip A12UDT-006: Intel Core i7-1260P, 16.00", 1.9 kg
análise externo » MSI Summit E14 Flip Evo A12MT-016
HP Victus 16-e0090ns: AMD Ryzen 7 5800H, 16.10", 2.5 kg
análise externo » HP Victus 16-e0090ns
Asus TUF Dash F15 FX517ZE: Intel Core i7-12650H, 15.60", 2 kg
análise externo » Asus TUF Dash F15 FX517ZE
Asus Zenbook Pro 14 Duo UX8402ZE-M3030W: Intel Core i9-12900H, 14.50", 1.8 kg
análise externo » Asus Zenbook Pro Duo 14 UX8402ZE-M3030W
MSI Prestige 15 A12UD-093: Intel Core i7-1280P, 15.60", 1.8 kg
análise externo » MSI Prestige 15 A12UD-093
Dell XPS 15 9520 RTX 3050 Ti: Intel Core i7-12700H, 15.60", 1.9 kg
análise externo » Dell XPS 15 9520 RTX 3050 Ti
MSI Katana GF66 12UD-251: Intel Core i7-12700H, 15.60", 2.3 kg
análise externo » MSI Katana GF66 12UD-251
Lenovo Legion S7 15ACH6-82K8002YGE: AMD Ryzen 7 5800H, 15.60", 1.9 kg
análise externo » Lenovo Legion S7 15ACH6-82K8002YGE
MSI Creator M16 A12UD-283: Intel Core i7-12700H, 16.00", 2.3 kg
análise externo » MSI Creator M16 A12UD-283
MSI Katana GF76 12UD-041: Intel Core i7-12700H, 17.30", 2.6 kg
análise externo » MSI Katana GF76 12UD-041
Asus ROG Flow X13 GV301RE-LJ096W: AMD Ryzen 9 6900HS, 13.40", 1.3 kg
análise externo » Asus ROG Flow X13 GV301RE-LJ096W
Acer Nitro 5 AN515-58-77YB: Intel Core i7-12700H, 15.60", 2.5 kg
análise externo » Acer Nitro 5 AN515-58-77YB
Asus ROG Flow X13 GV301RE-LI134W: AMD Ryzen 7 6800HS, 13.40", 1.3 kg
análise externo » Asus ROG Flow X13 GV301RE-LI134W
MSI Katana GF66 11UD-1222PL: Intel Core i5-11400H, 15.60", 2.1 kg
análise externo » MSI Katana GF66 11UD-1222PL
MSI Katana GF66 11UD-480XUA: Intel Core i5-11400H, 15.60", 2.1 kg
análise externo » MSI Katana GF66 11UD-480XUA
Acer Swift X SFX14-51G-79RJ: Intel Core i7-1260P, 14.00", 1.4 kg
análise externo » Acer Swift X SFX14-51G-79RJ
HP Omen 16-c0010ca: AMD Ryzen 7 5800H, 16.10", 2.3 kg
análise externo » HP Omen 16-c0010ca
HP Omen 16-b0352TX: Intel Core i7-11800H, 16.00", 2.3 kg
análise externo » HP Omen 16-b0352TX
Lenovo ThinkPad X1 Extreme G4-20Y5001NGE: Intel Core i7-11800H, 16.00", 1.9 kg
análise externo » Lenovo ThinkPad X1 Extreme G4-20Y5001NGE
HP Envy 15-ep1074ng: Intel Core i7-11800H, 15.60", 2.2 kg
análise externo » HP Envy 15-ep1074ng
Lenovo ThinkBook 15p G2 ITH 21B1000YGE: Intel Core i7-11800H, 15.60", 1.9 kg
análise externo » Lenovo ThinkBook 15p G2 ITH 21B1000YGE
Asus Zenbook Pro 15 OLED UM535Q: AMD Ryzen 9 5900HX, 15.60", 1.9 kg
análise externo » Asus Zenbook Pro 15 OLED UM535Q
Acer Swift X SFX14-41G-R1GH: AMD Ryzen 7 5800U, 14.00", 1.5 kg
análise externo » Acer Swift X SFX14-41G-R1GH
Microsoft Surface Laptop Studio i7 RTX 3050 Ti: Intel Core i7-11370H, 14.40", 1.8 kg
análise externo » Microsoft Surface Laptop Studio i7 RTX 3050 Ti
HP Pavilion Gaming 15-dk2070ng: Intel Core i7-11370H, 15.60", 2.3 kg
análise externo » HP Pavilion Gaming 15-dk2070ng
Asus ROG Zephyrus G14 GA401QE-HZ047: AMD Ryzen 9 5900HS, 14.00", 1.6 kg
análise externo » Asus ROG Zephyrus G14 GA401QE-HZ047
Asus ROG Strix G17 G713IE-HX011: AMD Ryzen 7 4800H, 17.30", 2.7 kg
análise externo » Asus ROG Strix G17 G713IE-HX011
Samsung Galaxy Book Odyssey 15 NP762XDA-XA1US: Intel Core i7-11600H, 15.60", 1.9 kg
análise externo » Samsung Galaxy Book Odyssey 15 NP762XDA-XA1US
Asus ROG Flow Z13 GZ301ZE: Intel Core i9-12900H, 13.40", 1.2 kg
análise externo » Asus ROG Flow Z13 GZ301ZE
Lenovo Legion 5 15ITH6, i7-11600H RTX 3050 Ti: Intel Core i7-11600H, 15.60", 2.4 kg
análise externo » Lenovo Legion 5 15ITH6, i7-11600H RTX 3050 Ti
HP Victus 16-d0065ng: Intel Core i7-11800H, 16.10", 2.5 kg
análise externo » HP Victus 16-d0065ng
Asus ROG Strix G15 G513IE-HN004W: AMD Ryzen 7 4800H, 15.60", 2.3 kg
análise externo » Asus ROG Strix G15 G513IE-HN004W
MSI Sword 15 A11UD: Intel Core i7-11800H, 15.60", 2.3 kg
análise externo » MSI Sword 15 A11UD
Acer Nitro 5 AN517-54-79L1: Intel Core i7-11800H, 17.30", 2.7 kg
análise externo » Acer Nitro 5 AN517-54-79L1
Asus VivoBook Pro 15 M3500-L1179T: AMD Ryzen 9 5900HX, 15.60", 1.7 kg
análise externo » Asus VivoBook Pro 15 M3500-L1179T
Asus TUF Gaming F15 FX506HCB-HN243T: Intel Core i5-11400H, 15.60", 2.3 kg
análise externo » Asus TUF Gaming F15 FX506HCB-HN243T
Dell G15 5511-RNGVW: Intel Core i7-11800H, 15.60", 2.8 kg
análise externo » Dell G15 5511-RNGVW
Dell G15 5515-2CMCX: AMD Ryzen 7 5800H, 15.60", 2.8 kg
análise externo » Dell G15 5515-2CMCX
Tuxedo InfinityBook Pro 14 Gen6, 11370H 3K: Intel Core i7-11370H, 14.00", 1 kg
análise externo » Tuxedo InfinityBook Pro 14 Gen6, 11370H 2K
Asus Vivobook Pro 16X-M7600QE: AMD Ryzen 9 5900HX, 16.10", 1.9 kg
análise externo » Asus Vivobook Pro 16X-M7600QE
HP Victus 16-d0367ng: Intel Core i5-11400H, 16.10", 2.5 kg
análise externo » HP Victus 16-d0367ng
Dell G15 5515, 5600H RTX 3050 Ti: AMD Ryzen 5 5600H, 15.60", 2.6 kg
análise externo » Dell G15 5515, 5600H RTX 3050 Ti
Lenovo Legion S7 15ACH6-82K8CTO1WW: AMD Ryzen 5 5600H, 15.60", 1.9 kg
análise externo » Lenovo Legion S7 15ACH6-82K8CTO1WW
Acer Swift X SFX16-51G-76HE: Intel Core i7-11390H, 16.00", 1.8 kg
análise externo » Acer Swift X SFX16-51G-76HE
Acer ConceptD 3 Ezel CC315-73G-74TT: Intel Core i7-11800H, 15.60", 2.2 kg
análise externo » Acer ConceptD 3 Ezel CC315-73G-74TT
Asus Vivobook Pro 14X M7400, 5800H 3050 Ti: AMD Ryzen 7 5800H, 14.00", 1.5 kg
análise externo » Asus Vivobook Pro 14X M7400, 5800H 3050 Ti
Lenovo Legion 5 15ITH6, i7-11800H 3050 Ti: Intel Core i7-11800H, 15.60", 2.4 kg
análise externo » Lenovo Legion 5 15ITH6, i7-11800H 3050 Ti
Dell XPS 15 9510, 11900H RTX 3050 Ti OLED: Intel Core i9-11900H, 15.60", 2 kg
análise externo » Dell XPS 15 9510, 11900H RTX 3050 Ti OLED
Acer Nitro 5 AN517-54-77KG: Intel Core i7-11800H, 17.30", 2.7 kg
análise externo » Acer Nitro 5 AN517-54-77KG
HP Victus 16-e0076ng: AMD Ryzen 7 5800H, 16.10", 2.5 kg
análise externo » HP Victus 16-e0076ng
Asus ROG Zephyrus G14 GA401QE-HZ055T: AMD Ryzen 7 5800HS, 14.00", 1.7 kg
análise externo » Asus ROG Zephyrus G14 GA401QE-HZ055T
Microsoft Surface Laptop Studio, i7-11370H RTX 3050 Ti: Intel Core i7-11370H, 14.40", 1.8 kg
análise externo » Microsoft Surface Laptop Studio, i7-11370H RTX 3050 Ti
Gigabyte G5 MD-51US123SH: Intel Core i5-11400H, 15.60", 2.2 kg
análise externo » Gigabyte G5 MD-51US123SH
MSI GF75 Thin 10UD: Intel Core i7-10750H, 17.30", 2.2 kg
análise externo » MSI GF75 Thin 10UD
MSI Katana GF66 11UD-836XFR: Intel Core i5-11400H, 15.60", 2.1 kg
análise externo » MSI Katana GF66 11UD-836XFR
Asus Vivobook Pro 14X M7400, 5900HX 3050 Ti: AMD Ryzen 9 5900HX, 14.00", 1.5 kg
análise externo » Asus Vivobook Pro 14X M7400, 5900HX 3050 Ti
Acer Nitro 5 AN515-57-796N: Intel Core i7-11800H, 15.60", 2.3 kg
análise externo » Acer Nitro 5 AN515-57-796N
Asus Vivobook Pro 16X M7600, 5900HX 3050 Ti: AMD Ryzen 9 5900HX, 16.00", 2 kg
análise externo » Asus Vivobook Pro 16X M7600, 5900HX 3050 Ti
Acer Swift X SFX14-41G-R1S6: AMD Ryzen 7 5800U, 14.00", 1.5 kg
análise externo » Acer Swift X SFX14-41G-R1S6
MSI Katana GF66 11UD-092: Intel Core i7-11800H, 15.60", 2.1 kg
análise externo » MSI Katana GF66 11UD-092
MSI Pulse GL66 11UDK: Intel Core i7-11800H, 15.60", 2.3 kg
análise externo » MSI Pulse GL66 11UDK
MSI Pulse GL76 11UDK: Intel Core i7-11800H, 17.30", 2.3 kg
análise externo » MSI Pulse GL76 11UDK
Dell XPS 15 9510, 11800H RTX 3050 Ti FHD: Intel Core i7-11800H, 15.60", 2 kg
análise externo » Dell XPS 15 9510, 11800H RTX 3050 Ti FHD
Dell XPS 15 9510 11800H RTX 3050 Ti OLED: Intel Core i7-11800H, 15.60", 1.9 kg
análise externo » Dell XPS 15 9510 11800H RTX 3050 Ti OLED
Asus Zephyrus G14 GA401QEC: AMD Ryzen 9 5900HS, 14.00", 1.7 kg
análise externo » Asus Zephyrus G14 GA401Q - Alan Walker Special Edition
Lenovo Legion 5 15ACH6H-82JW0012US: AMD Ryzen 7 5800H, 15.60", 2.4 kg
análise externo » Lenovo Legion 5 15ACH6H-82JW0012US
Asus TUF Dash F15 TUF516PE-AB73: Intel Core i7-11370H, 15.60", 2 kg
análise externo » Asus TUF Dash F15 TUF516PE-AB73
Asus ROG Flow X13 GV301QE-K6149T: AMD Ryzen 9 5900HS, 13.40", 1.3 kg
análise externo » Asus ROG Flow X13 GV301QE-K6149T
Asus ROG Strix G17 G713QE-RB74: AMD Ryzen 7 5800H, 17.30", 2.5 kg
análise externo » Asus ROG Strix G17 G713QE-RB74
MSI Katana GF76 11UD-050: Intel Core i7-11800H, 17.30", 2.3 kg
análise externo » MSI Katana GF76 11UD-050
Asus TUF Gaming F15 TUF506HE-DS74: Intel Core i7-11800H, 15.60", 2.3 kg
análise externo » Asus TUF Gaming F15 TUF506HE-DS74
Asus TUF Dash F15 FX516PE-HN006T: Intel Core i7-11370H, 15.60", 2 kg
análise externo » Asus TUF Dash F15 FX516P-EHN006T
Dell G15 5510, i5-10200H RTX 3050 Ti: Intel Core i5-10200H, 15.60", 2.7 kg
análise externo » Dell G15 5510, i5-10200H RTX 3050 Ti
Acer Swift X SFX14-41G-R4VH: AMD Ryzen 7 5800U, 14.00", 1.4 kg
análise externo » Acer Swift X SFX14-41G-R4VH
Schenker Vision 14: Intel Core i7-11370H, 14.00", 1.1 kg
» El Schenker Vision 14 con la GeForce RTX 3050 Ti no tiene realmente ningún competidor
Dell XPS 15 9510 11800H RTX 3050 Ti OLED: Intel Core i7-11800H, 15.60", 1.9 kg
» ¿Cuándo tendremos por fin el Dell XPS 15 con CPUs AMD Ryzen?
» El nuevo Dell XPS 15 9510 OLED tiene problemas con el rendimiento de la GPU