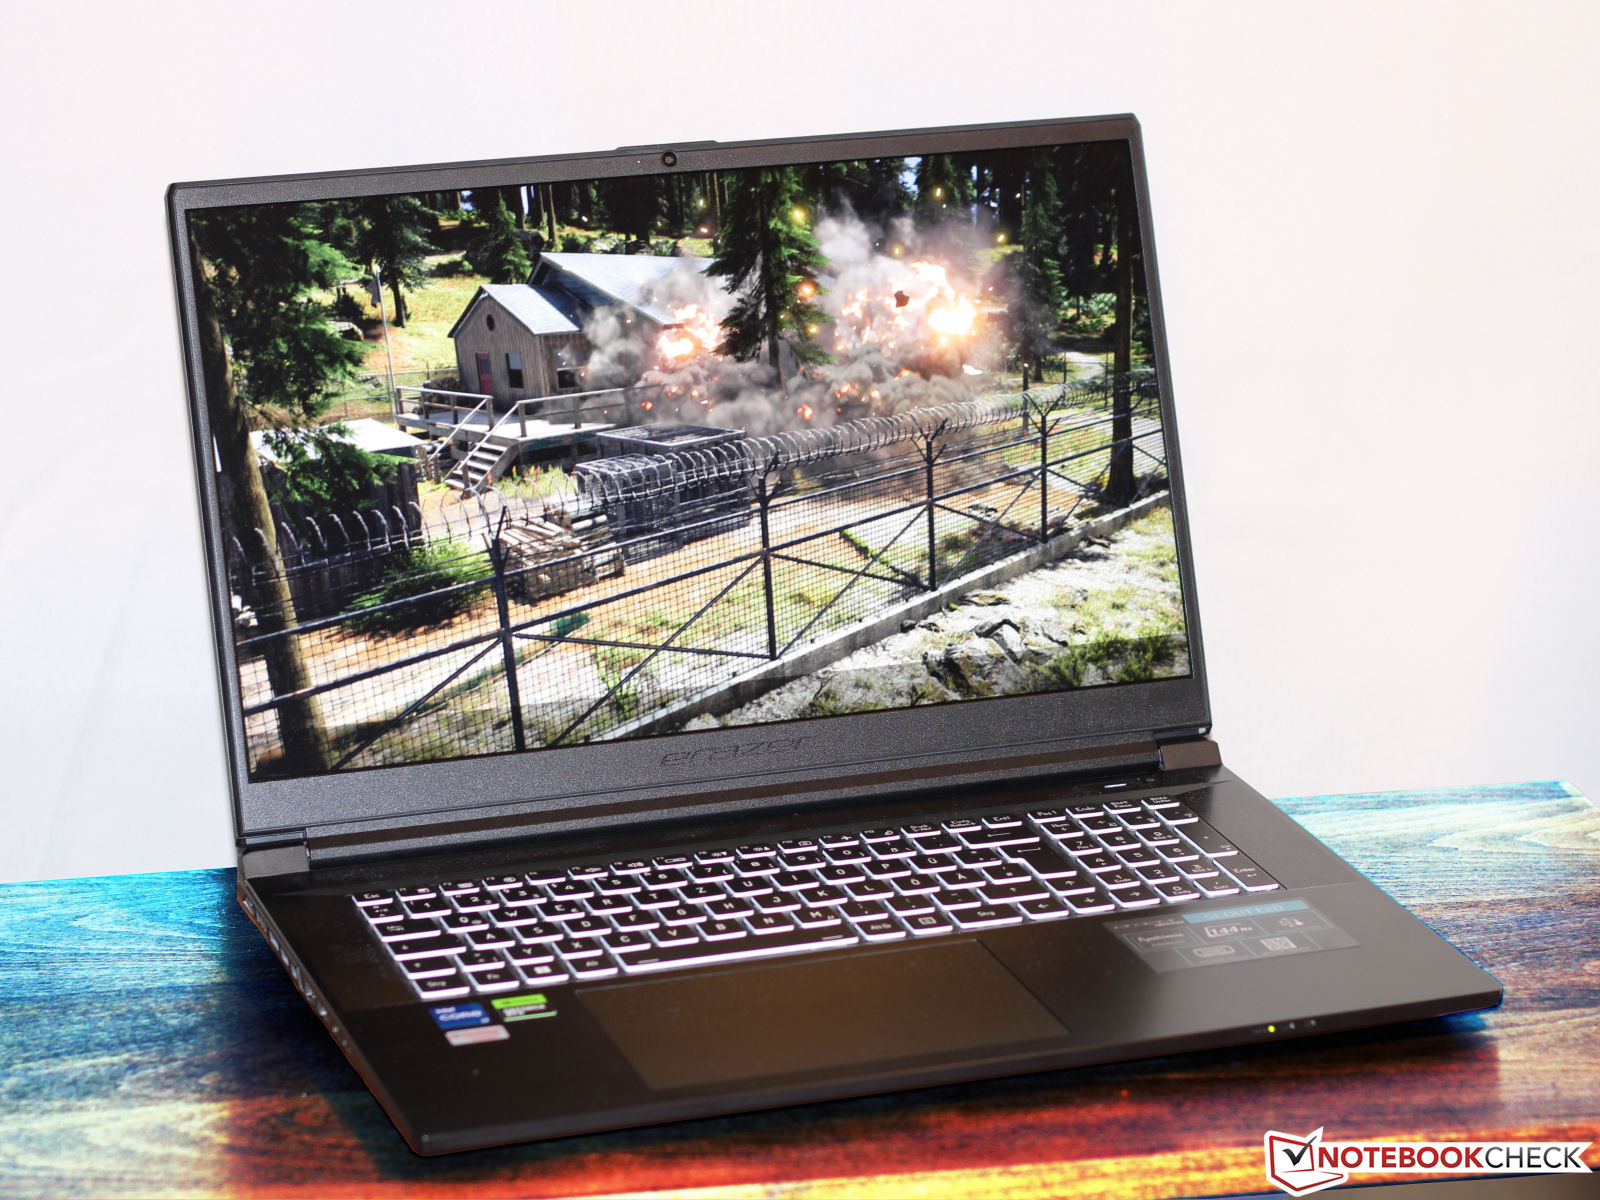
Análisis del Medion Erazer Scout E20: Portátil de juegos FHD asequible con RTX 4050
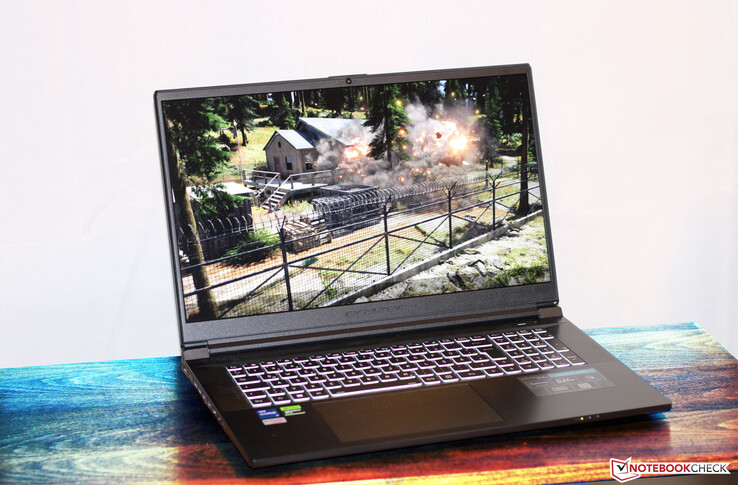
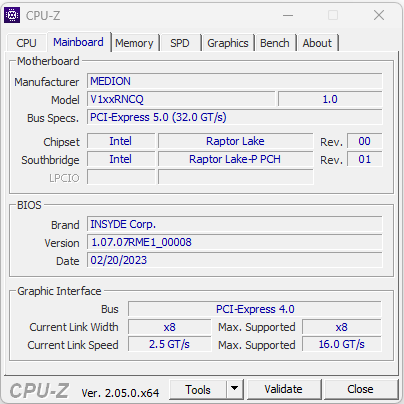
Aunque el Erazer Scout E20 se considera principalmente un portátil para juegos del segmento básico, también podría utilizarse en otras áreas que exigen un alto rendimiento, como el renderizado o el procesamiento de vídeo. Medion combina un procesador Raptor Lake con un procesador GeForce RTX 4050gPU para portátiles, pidiendo unos 1.500 euros (~1.658 dólares) por todo el paquete. El ordenador se basa en un barebone de Clevo (V170RNCQ). Sus competidores son dispositivos como el Gigabyte G7 KEelMSI Katana 17 B13VFKelAsus TUF Gaming A16 FA617elLenovo Legion 5 15IAH7H 82RBy elAcer Nitro 5 AN515-46-R1A1.
Posibles contendientes en la comparación
Valoración | Fecha | Modelo | Peso | Altura | Tamaño | Resolución | Precio |
|---|---|---|---|---|---|---|---|
| 83 % v7 (old) | 05/2023 | Medion Erazer Scout E20 i7-13700H, GeForce RTX 4050 Laptop GPU | 2.8 kg | 29 mm | 17.30" | 1920x1080 | |
| 83.3 % v7 (old) | 01/2023 | Gigabyte G7 KE i5-12500H, GeForce RTX 3060 Laptop GPU | 2.6 kg | 25 mm | 17.30" | 1920x1080 | |
| 82.1 % v7 (old) | 02/2023 | MSI Katana 17 B13VFK i7-13620H, GeForce RTX 4060 Laptop GPU | 2.8 kg | 25.2 mm | 17.30" | 1920x1080 | |
| 86.2 % v7 (old) | 02/2023 | Asus TUF Gaming A16 FA617 R7 7735HS, Radeon RX 7600S | 2.2 kg | 27 mm | 16.00" | 1920x1200 | |
| 87.5 % v7 (old) | 11/2022 | Lenovo Legion 5 15IAH7H 82RB i7-12700H, GeForce RTX 3060 Laptop GPU | 2.4 kg | 19.99 mm | 15.60" | 1920x1080 | |
| 83.9 % v7 (old) | 11/2022 | Acer Nitro 5 AN515-46-R1A1 R7 6800H, GeForce RTX 3070 Ti Laptop GPU | 2.5 kg | 26.8 mm | 15.60" | 1920x1080 |
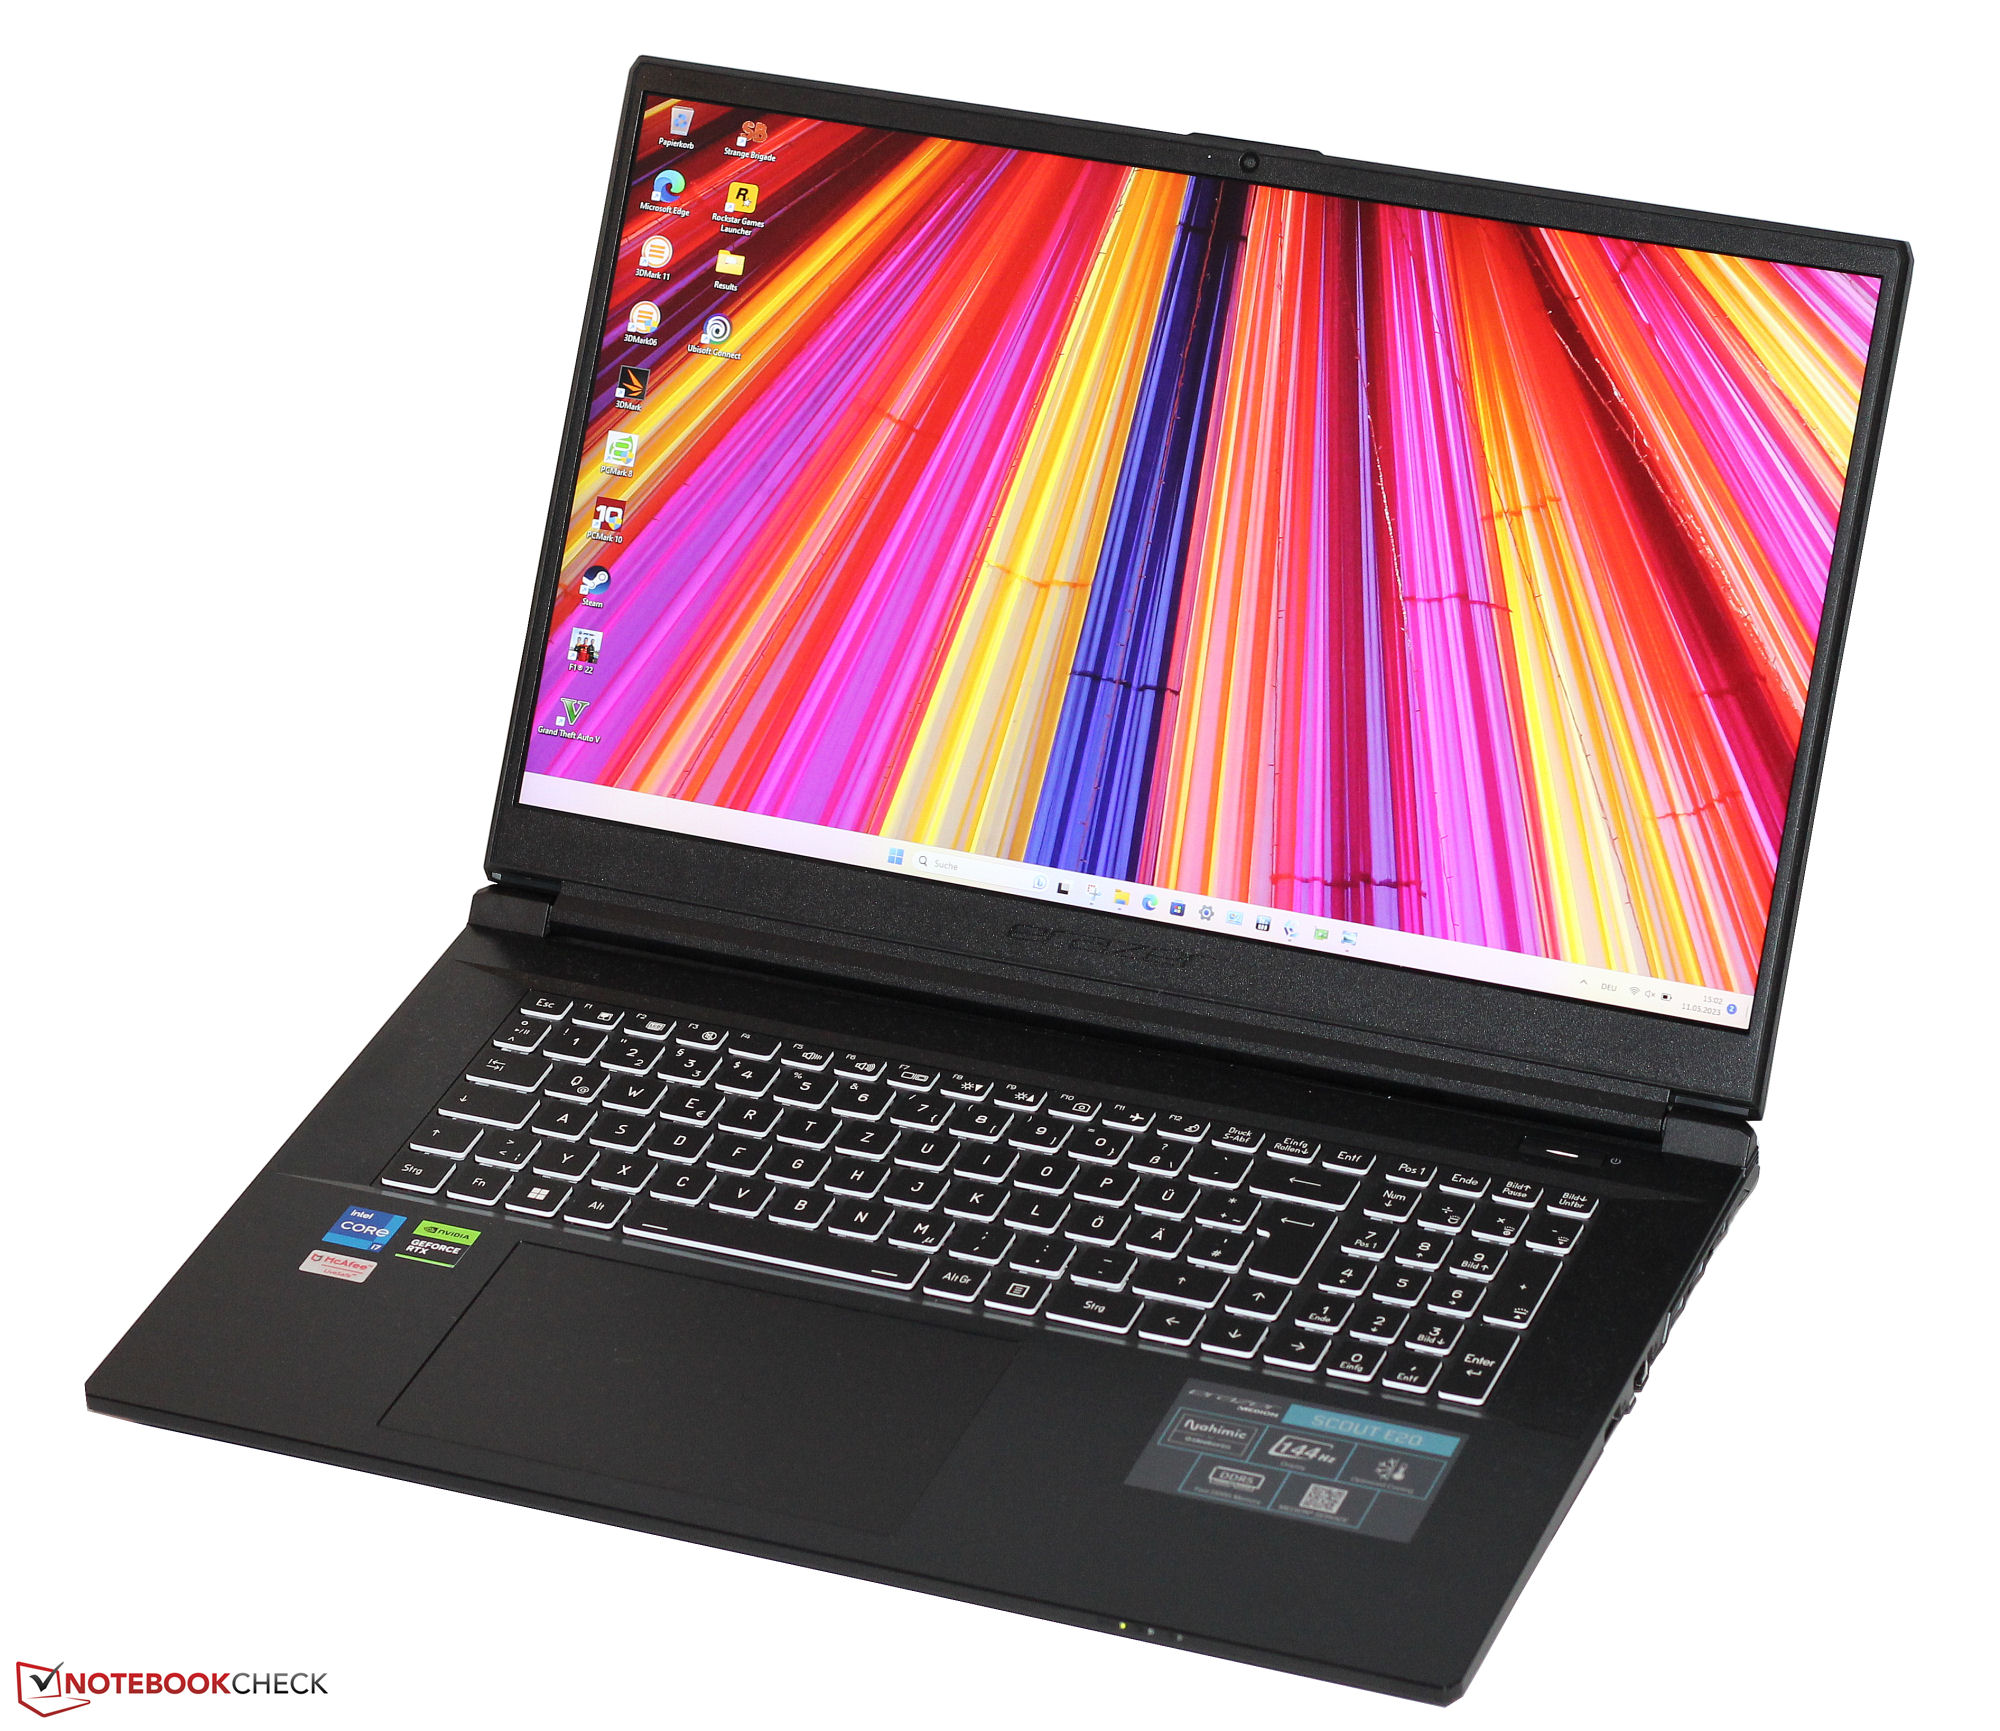
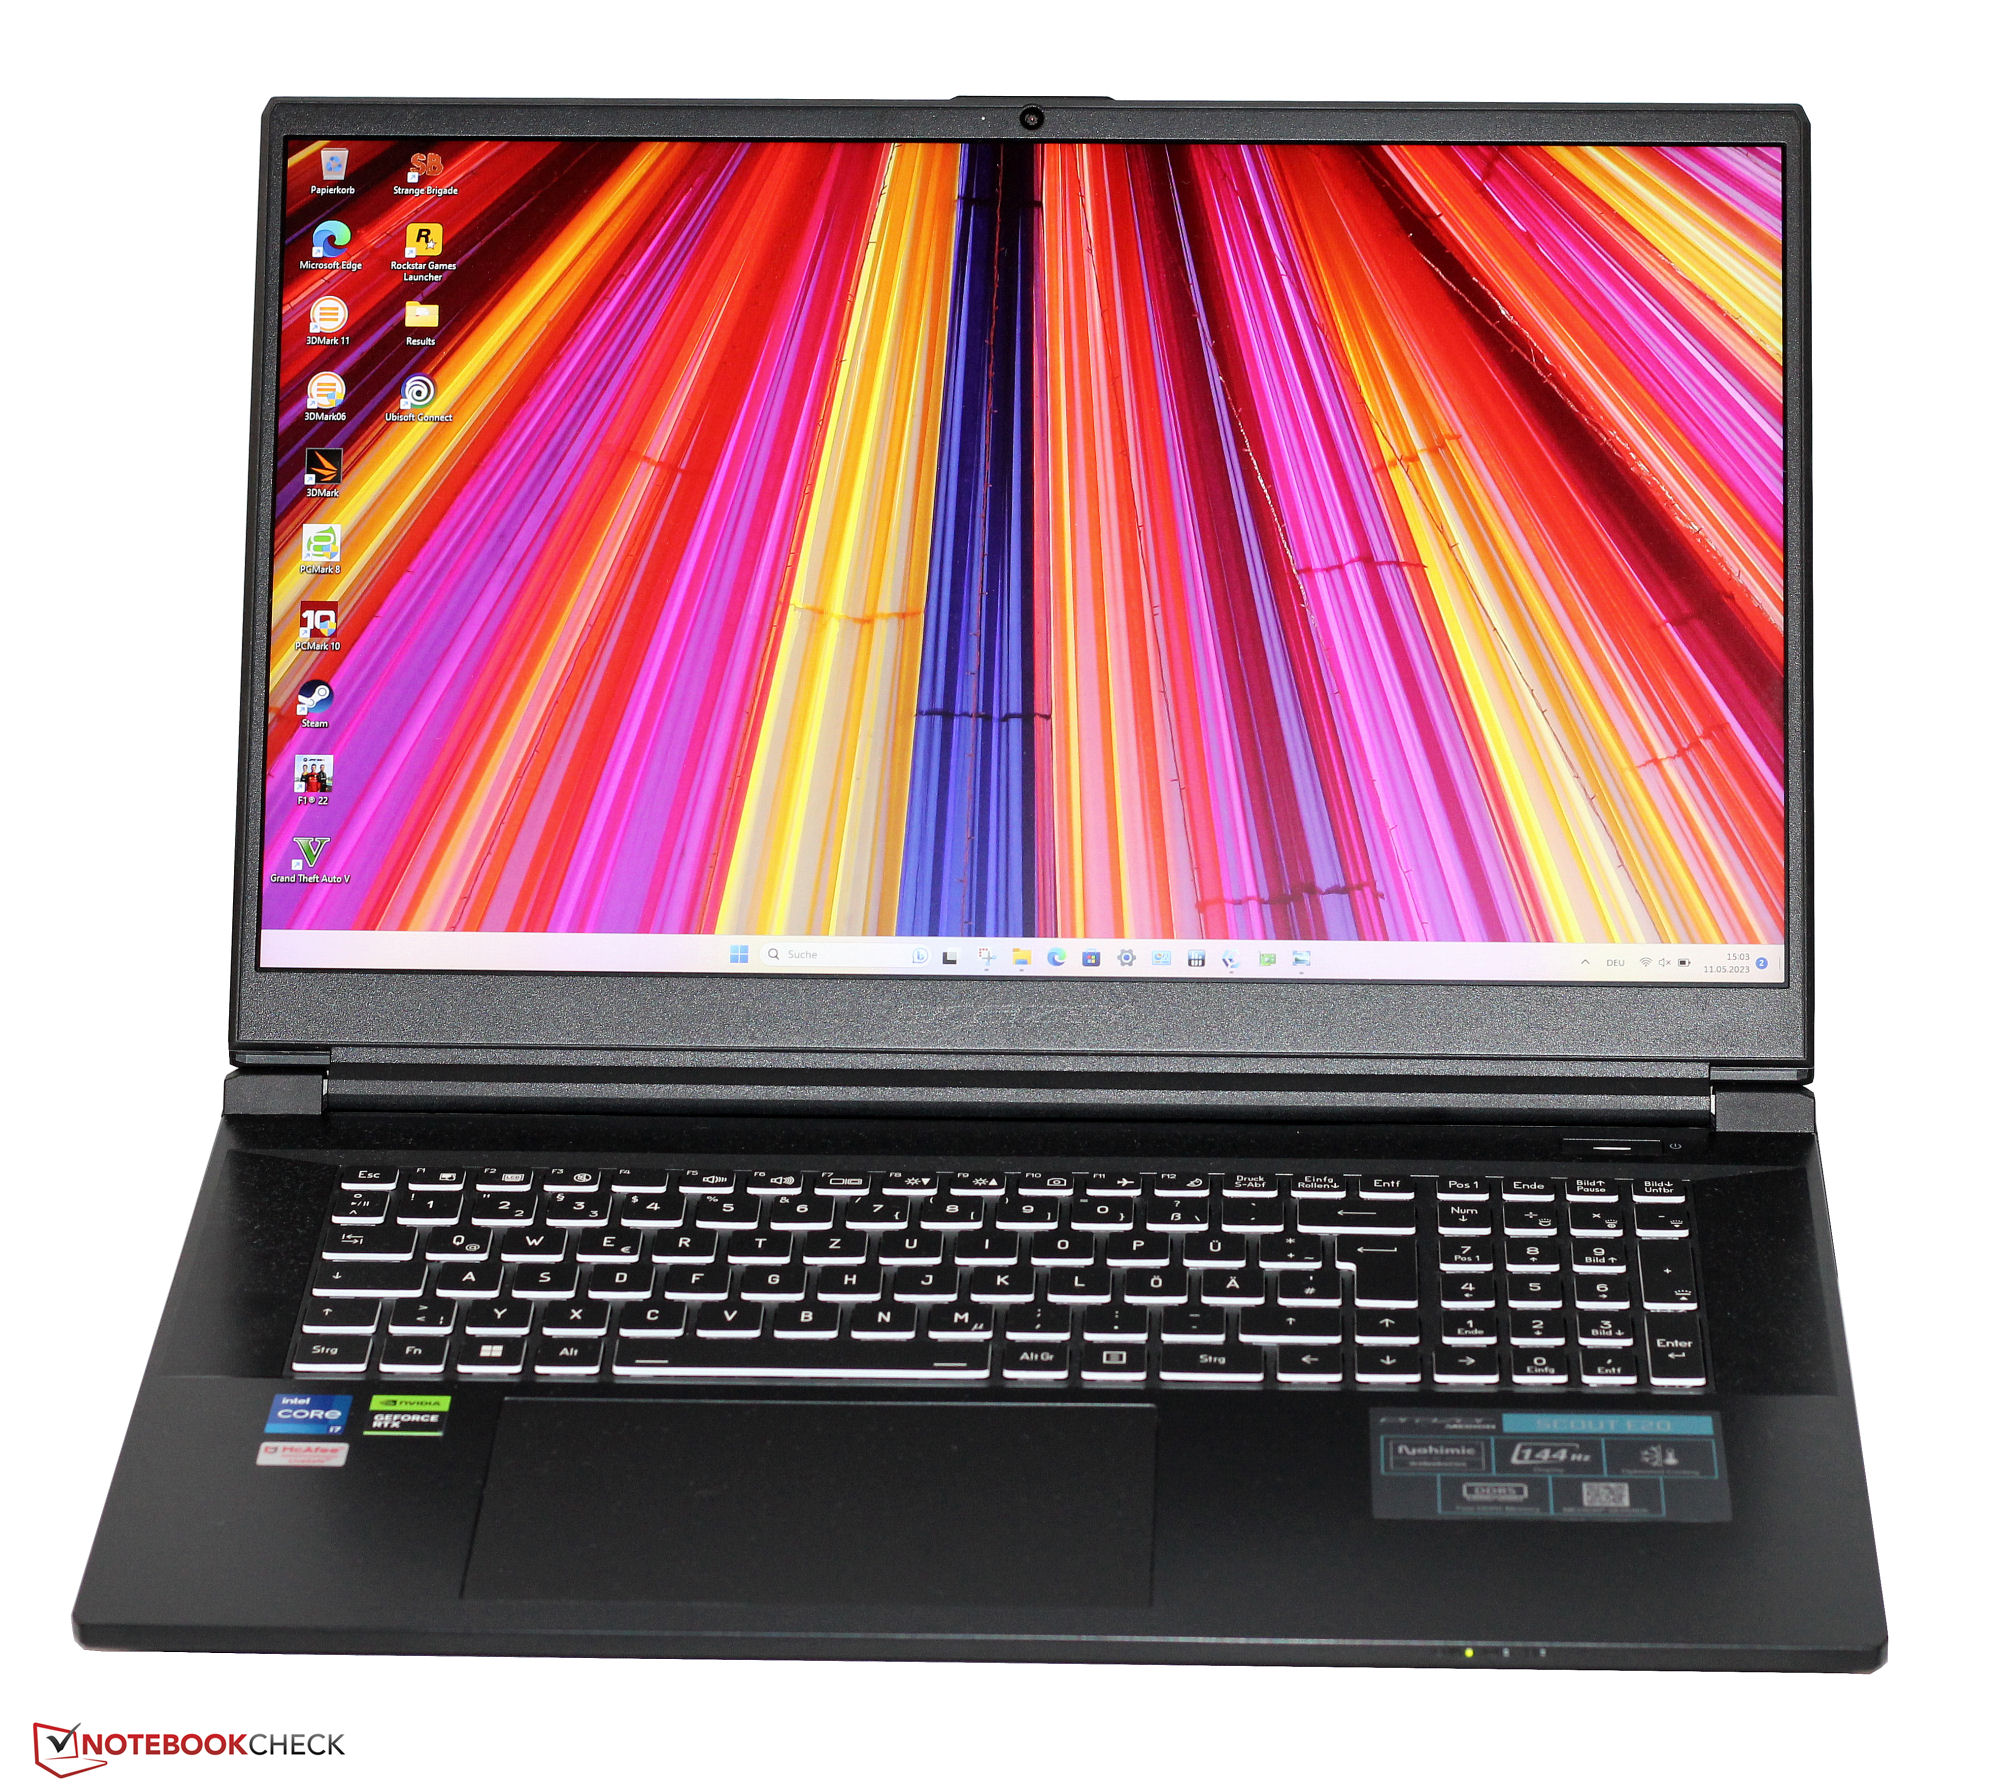
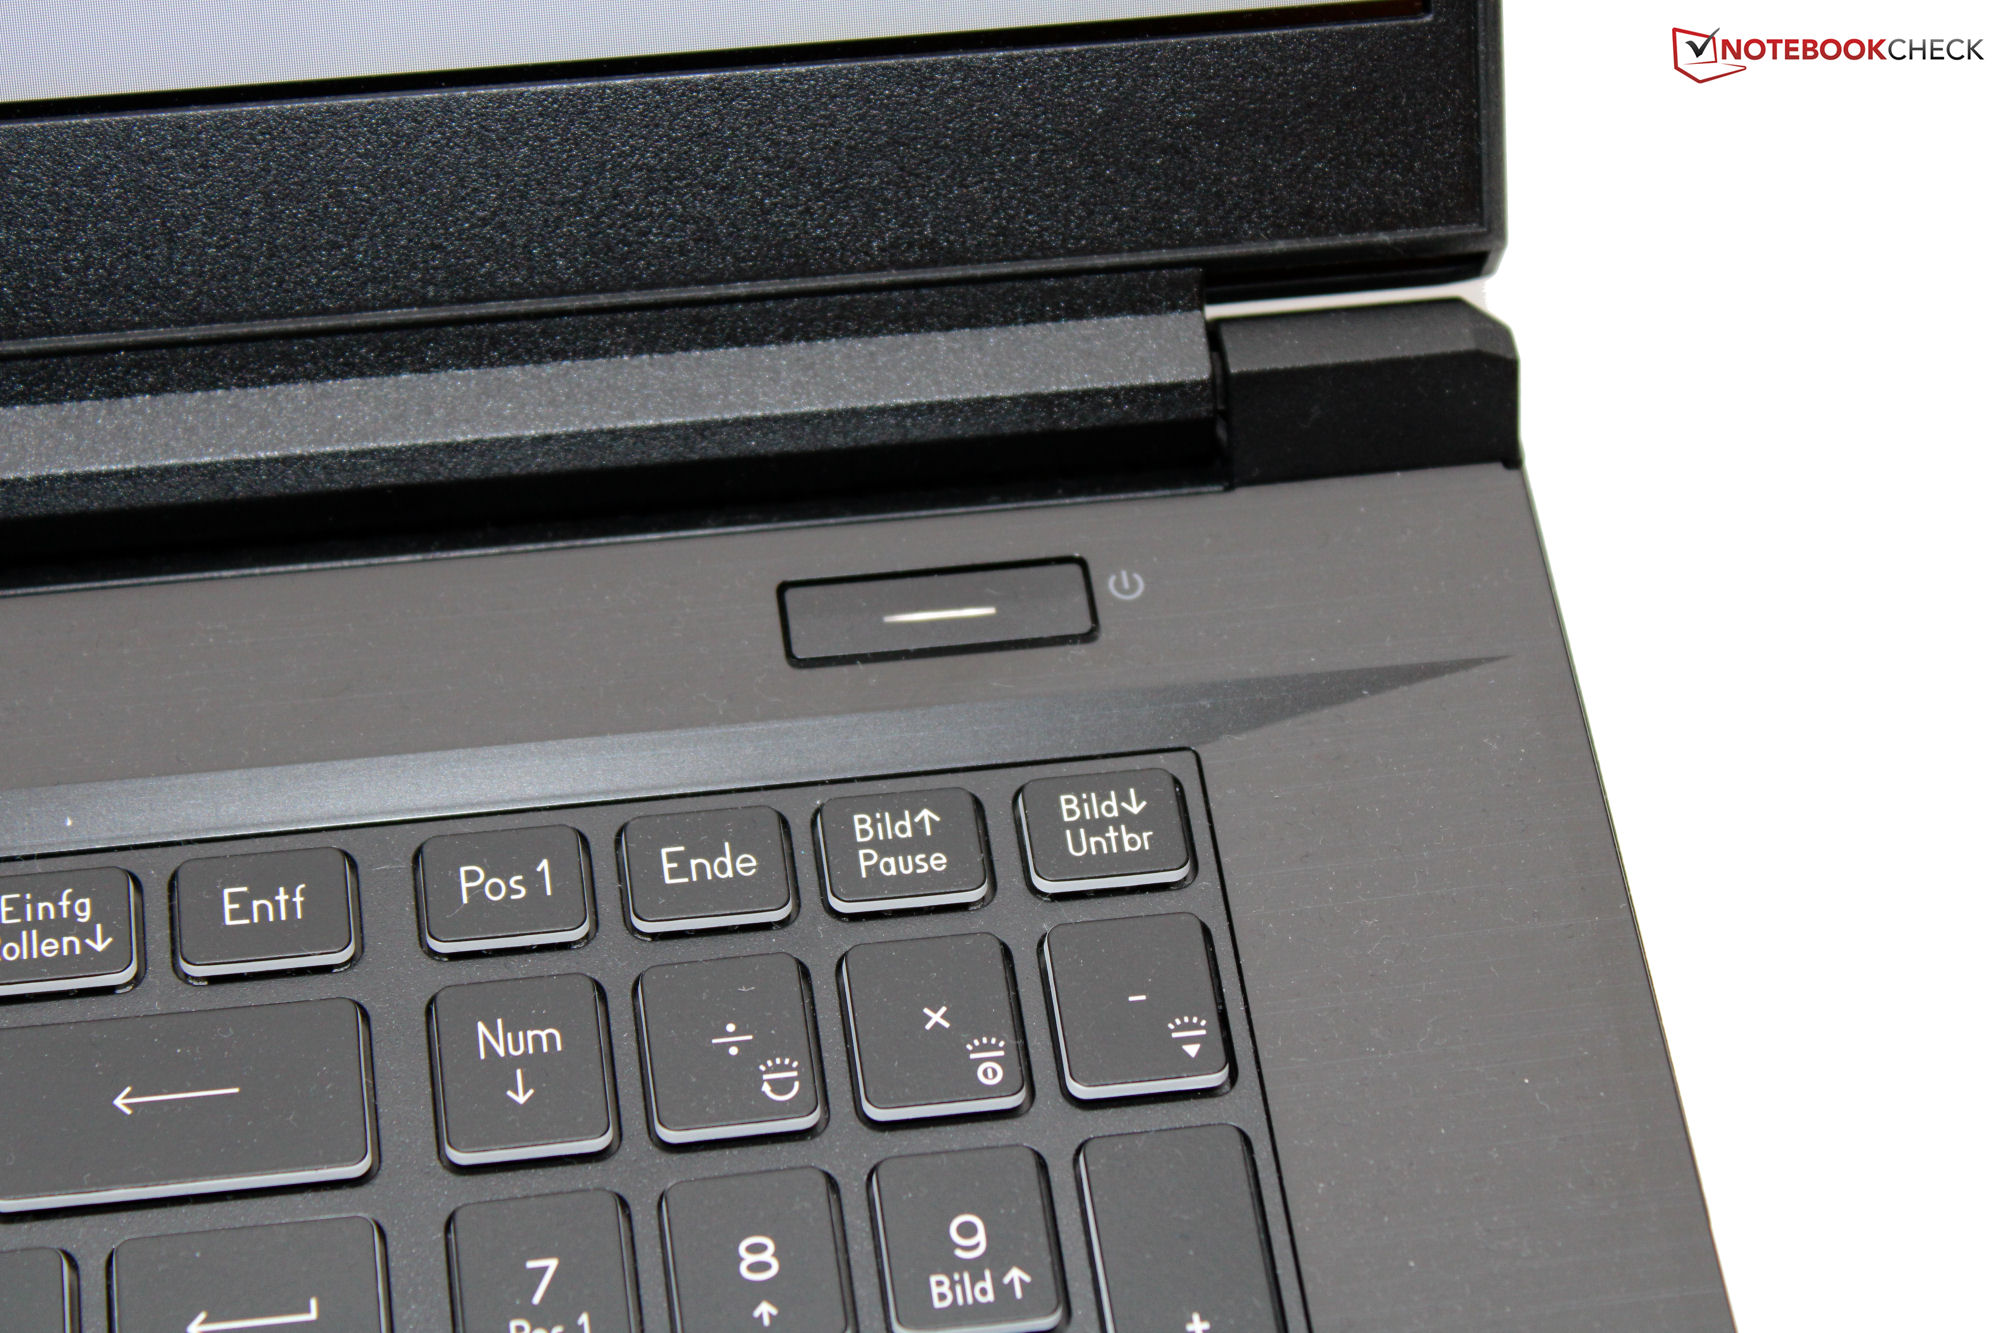
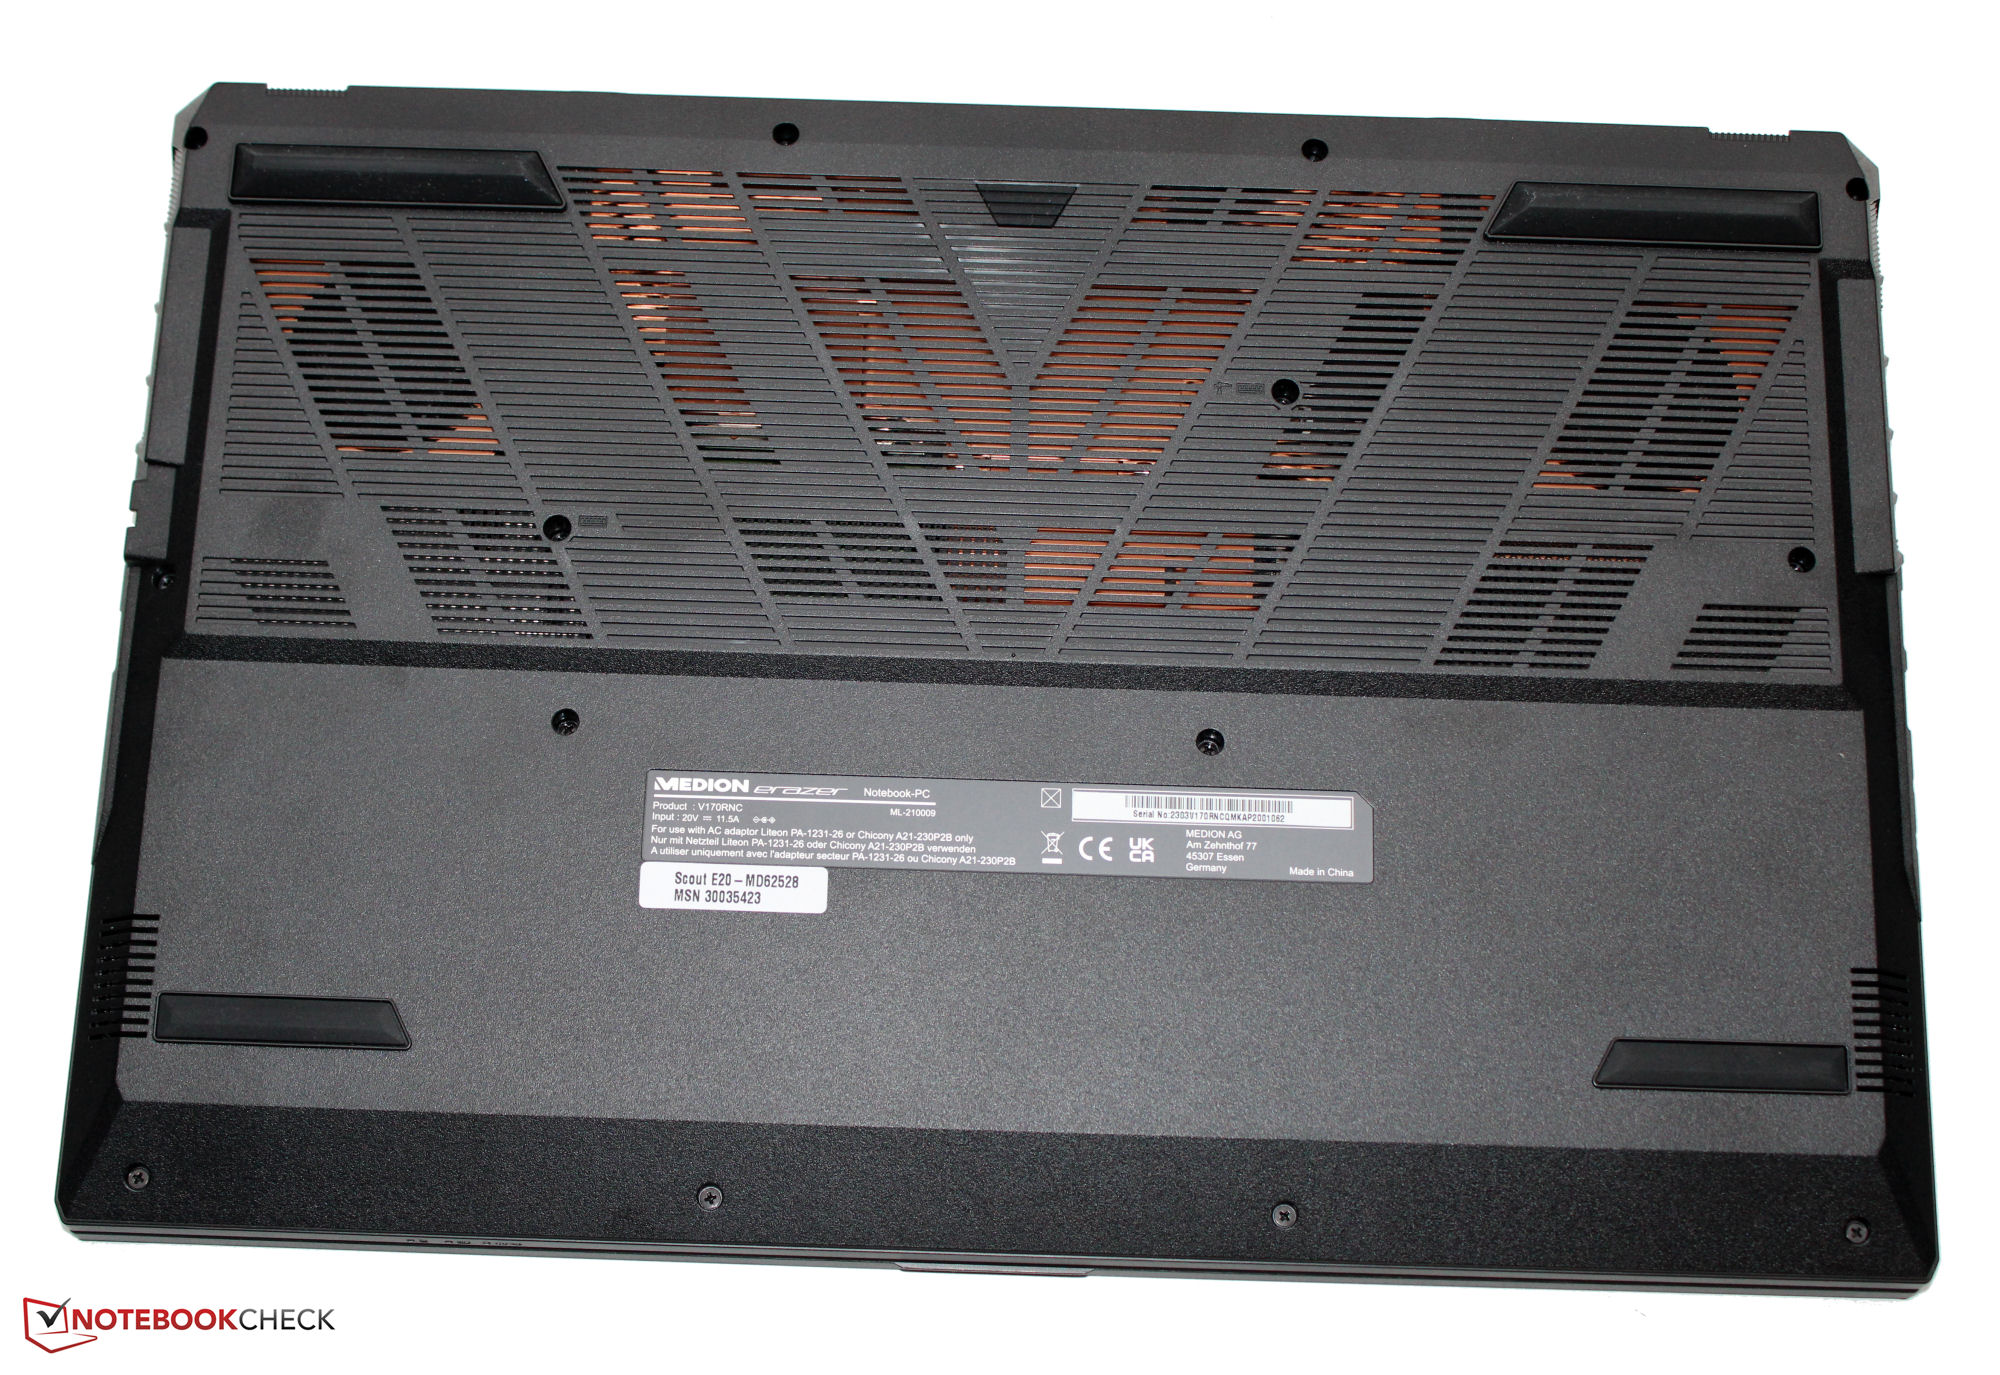
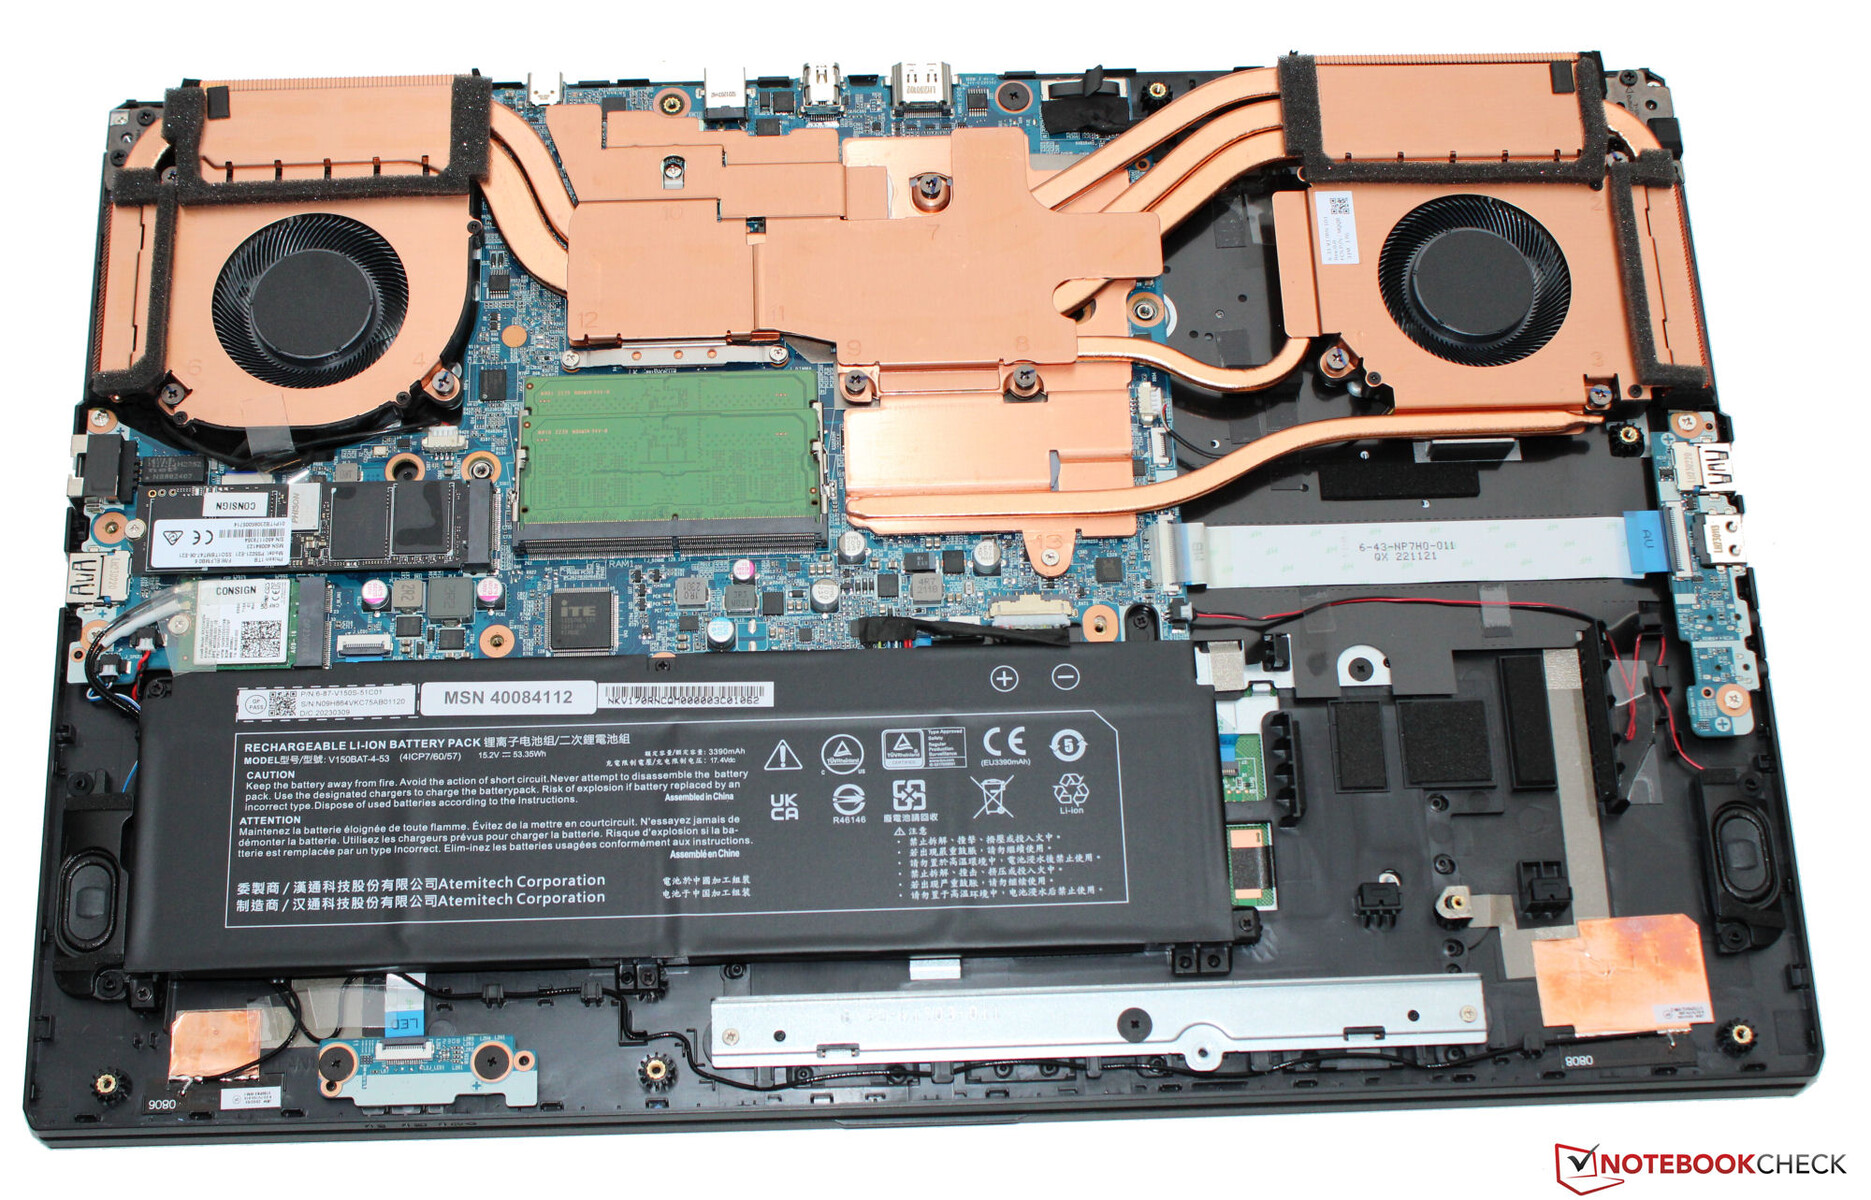
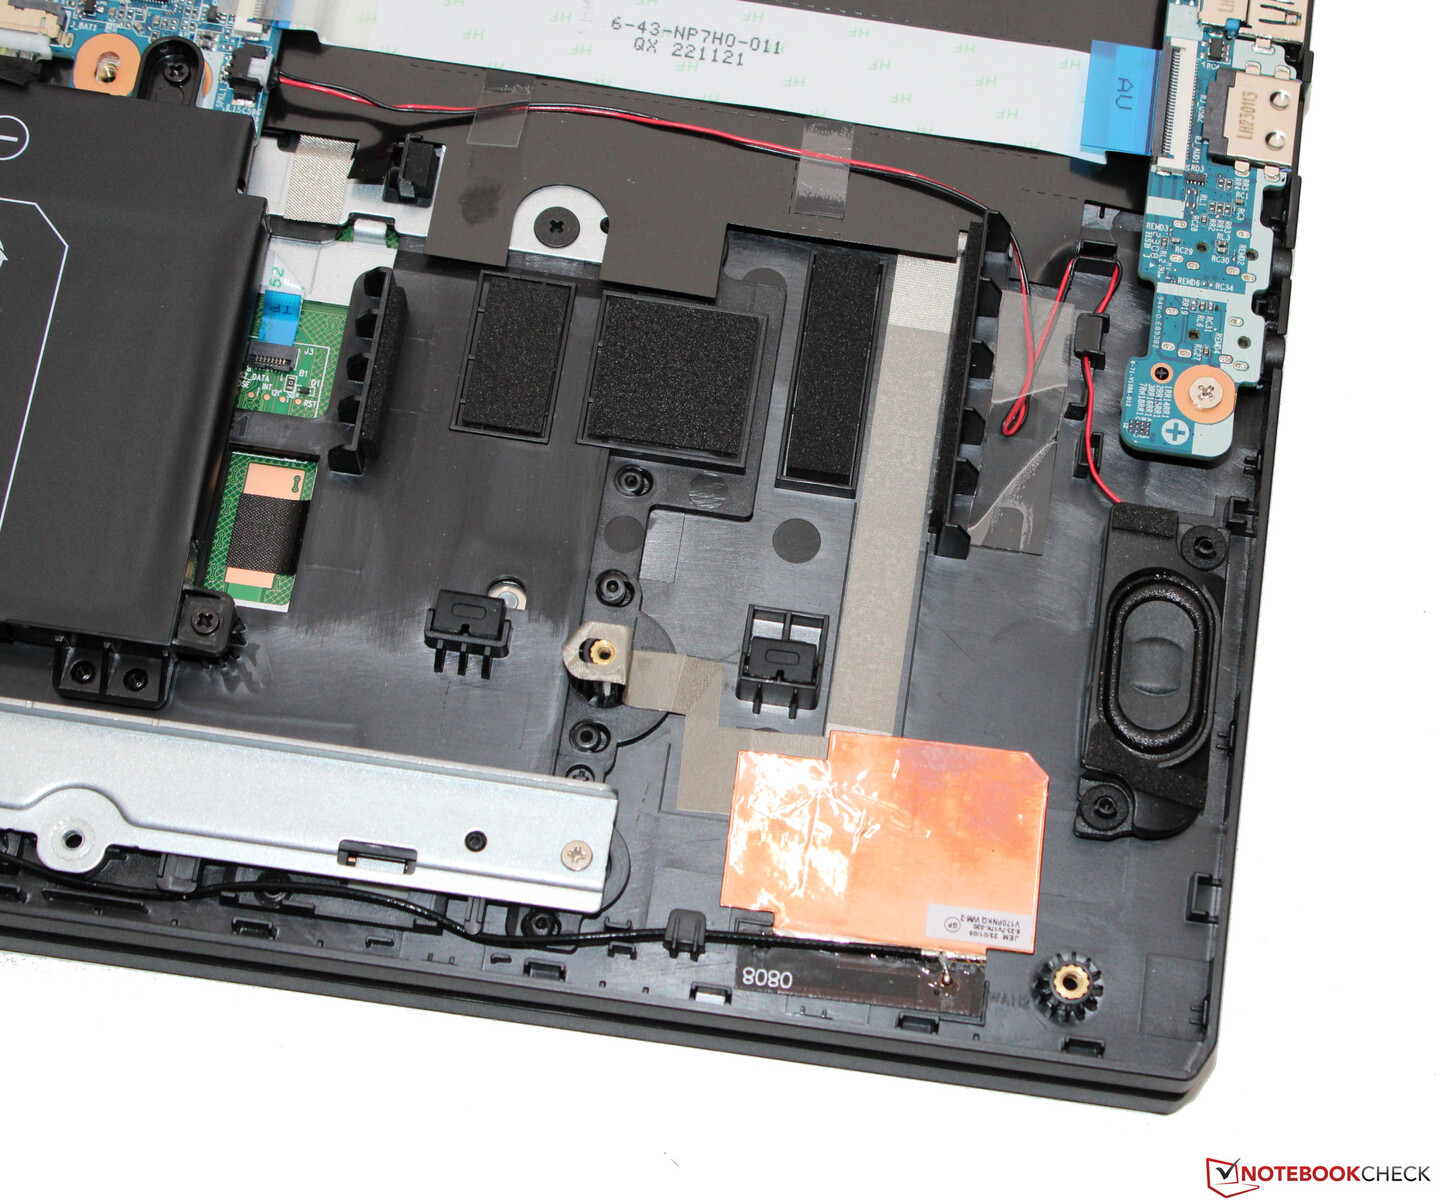
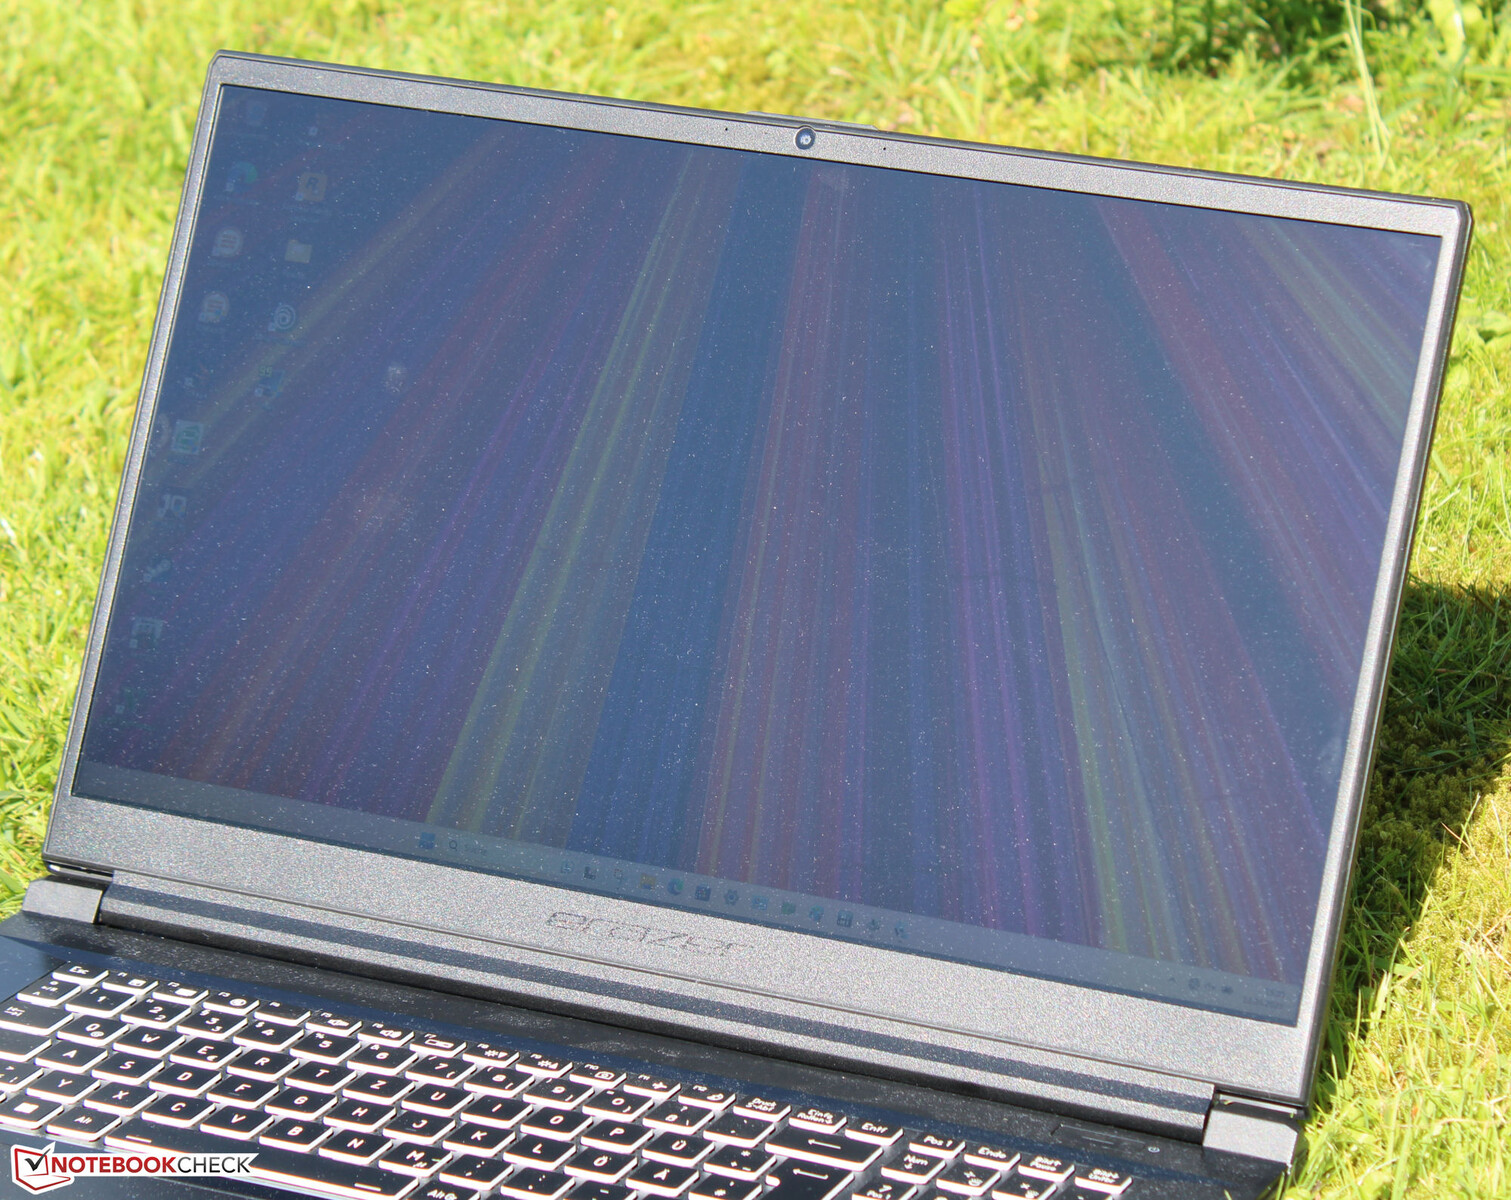
Carcasa - El portátil Medion utiliza una carcasa de plástico
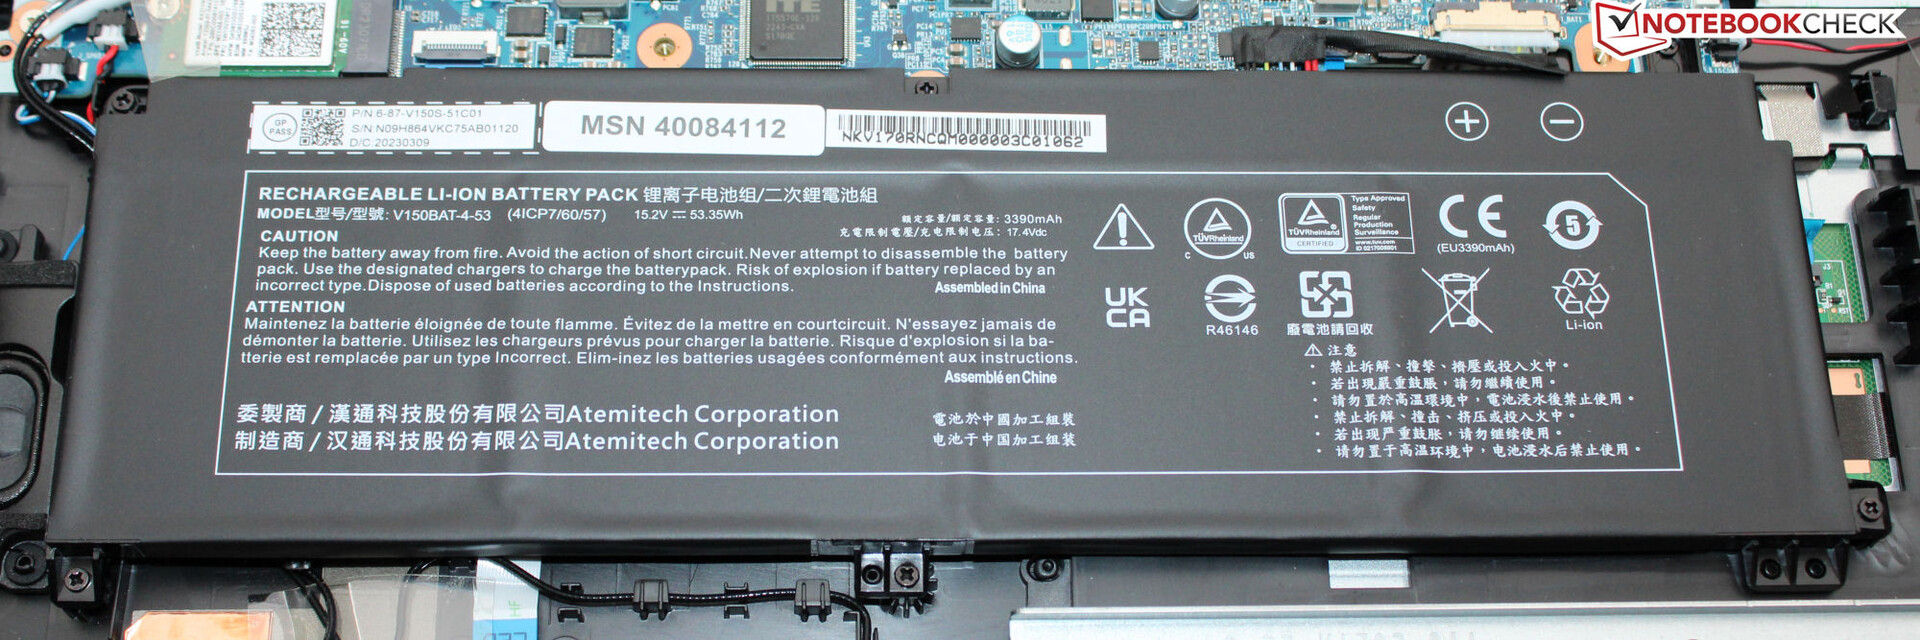
El E20 no puede ofrecer materiales de carcasa que den una apariencia de alta calidad, pero toda la carcasa es de plástico negro. Medion utiliza superficies lisas y mates. El diseño sin pretensiones del portátil también permitiría usarlo en entornos de negocios. Aparte de la iluminación del teclado, el portátil no incluye ninguna ornamentación colorida en forma de bandas LED. La batería (que está atornillada y no pegada) y el resto del equipo son accesibles tras retirar la parte inferior de la carcasa.
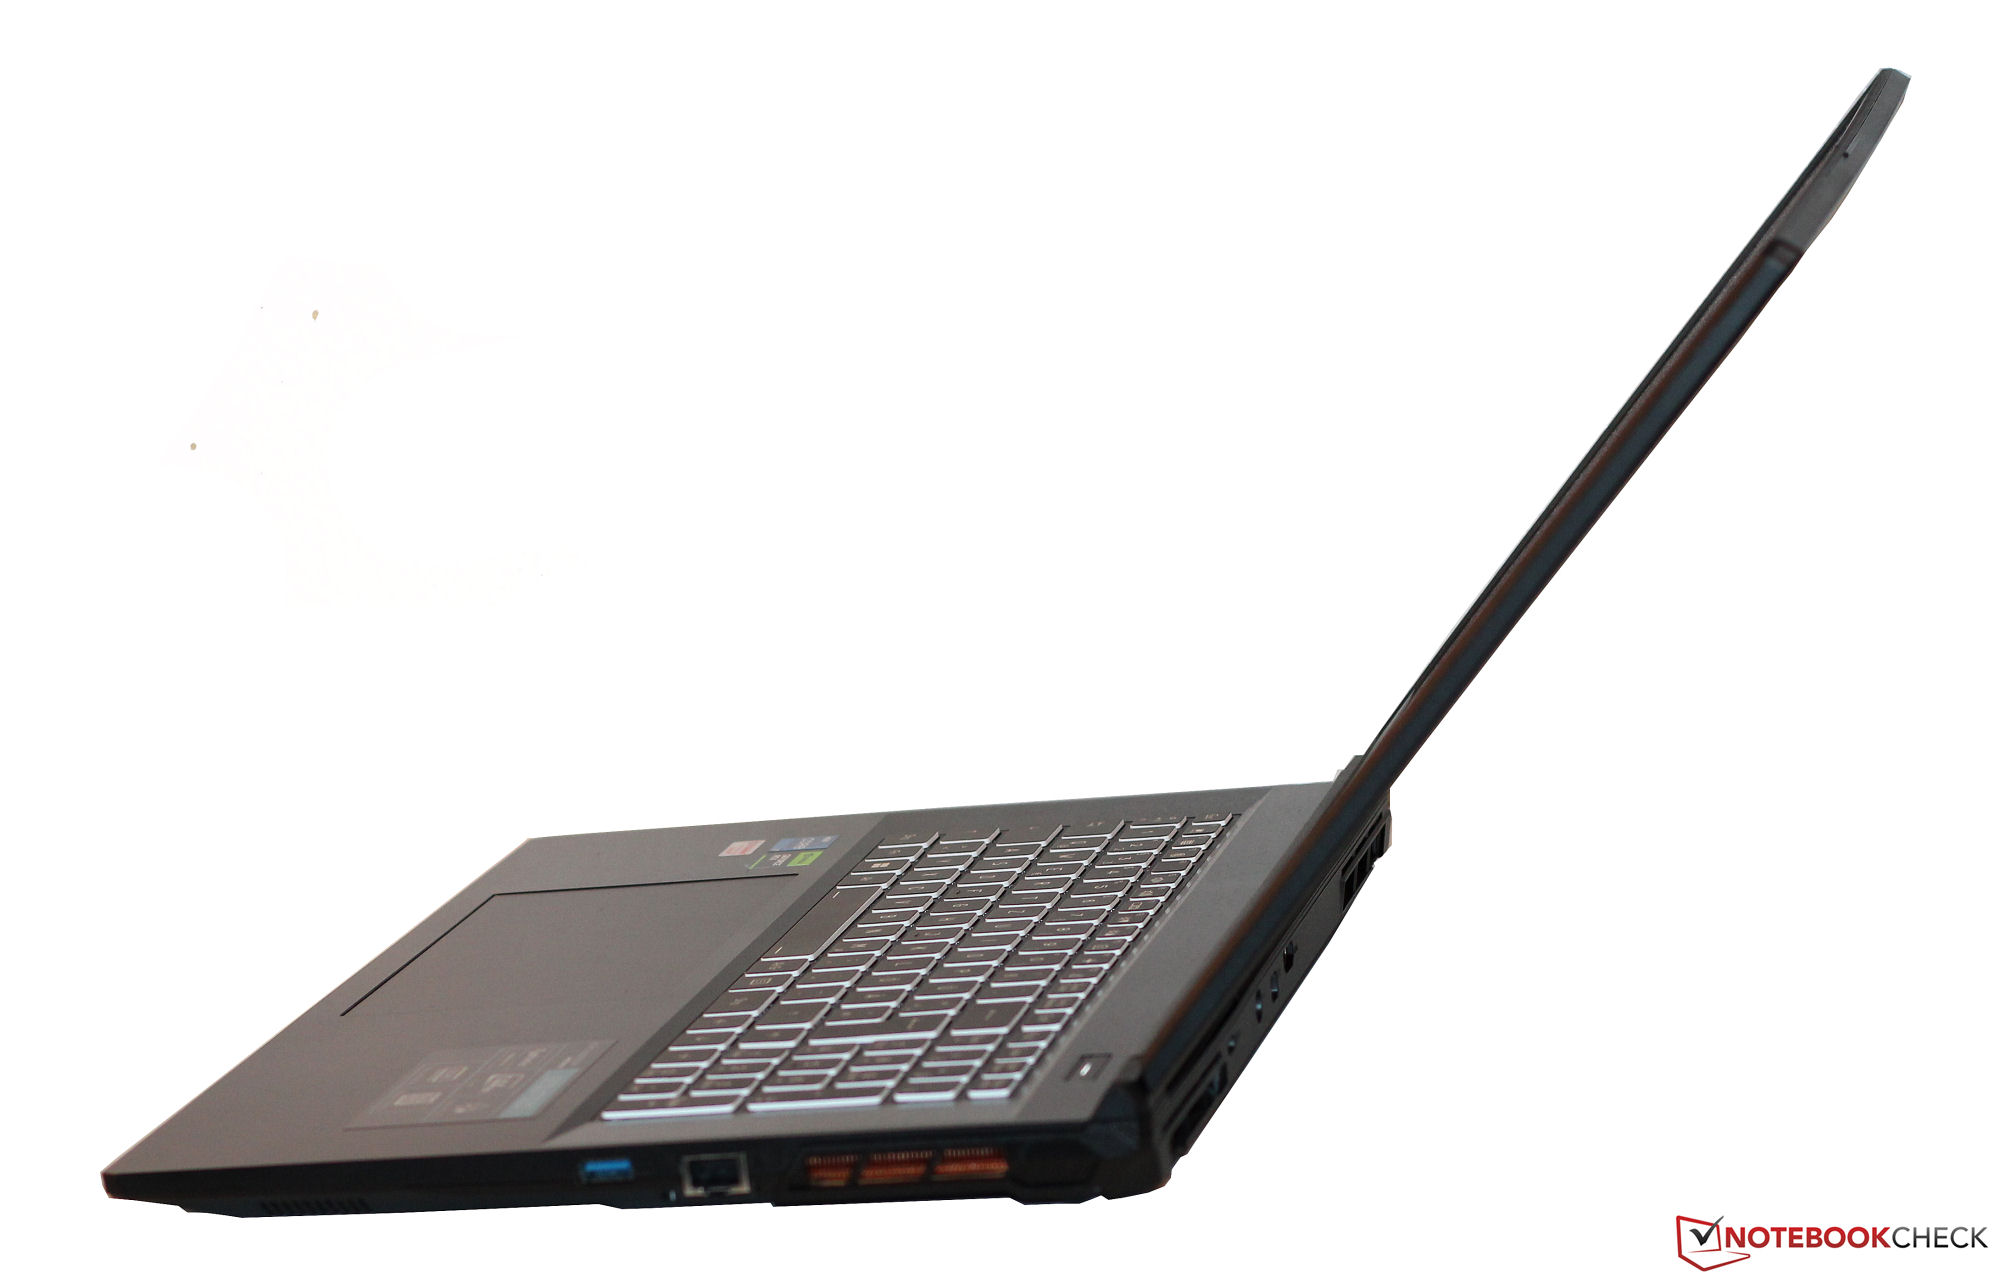
El Scout no muestra ningún defecto de fabricación. Los huecos son uniformes y no hay salientes de material. La unidad base sólo se puede deformar ligeramente, pero la tapa de forma más significativa, aunque sigue estando dentro de los límites. Las bisagras mantienen la tapa firmemente en su posición, con un ángulo máximo de apertura de unos 135 grados. La tapa puede abrirse con una sola mano.
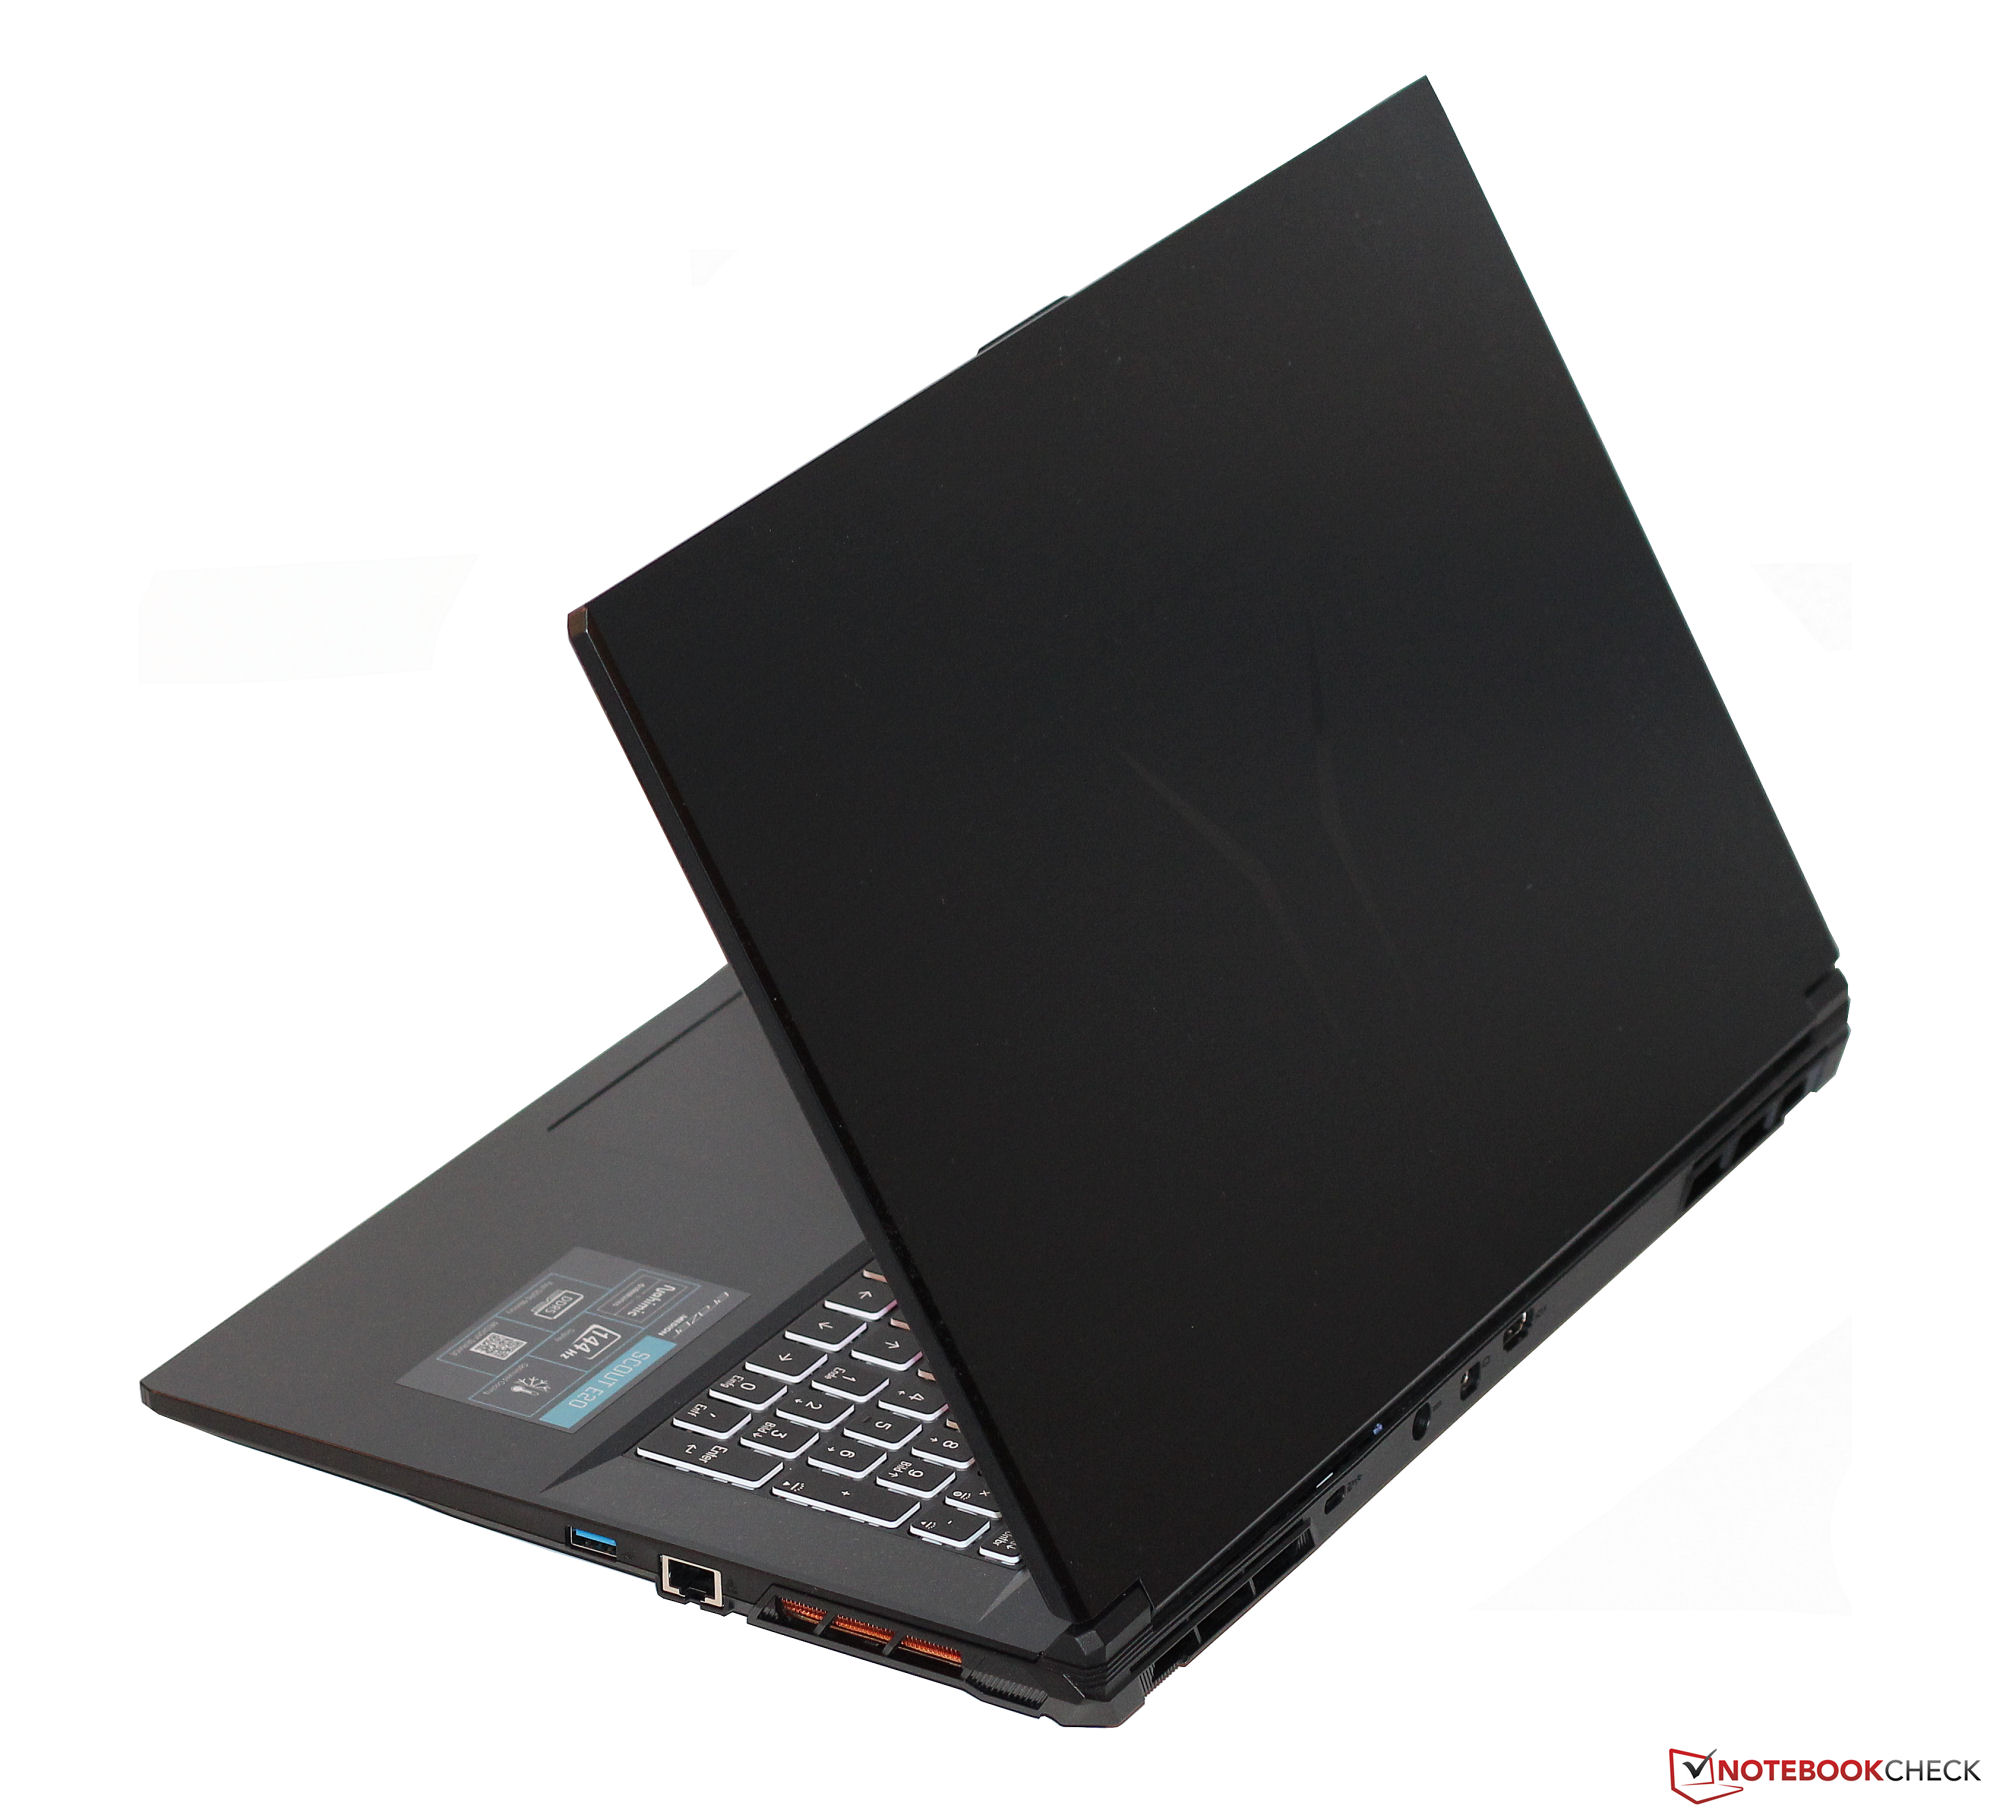
En cuanto a su tamaño, el E20 se sitúa al nivel de los portátiles comparables de 17,3 pulgadas, y lo mismo ocurre en cierta medida con su peso. En nuestro campo de comparación, representa el dispositivo más pesado -junto con el Katana 17- con 2,8 kg. ElG7 KEpesa 200 gramos menos que ambos competidores.
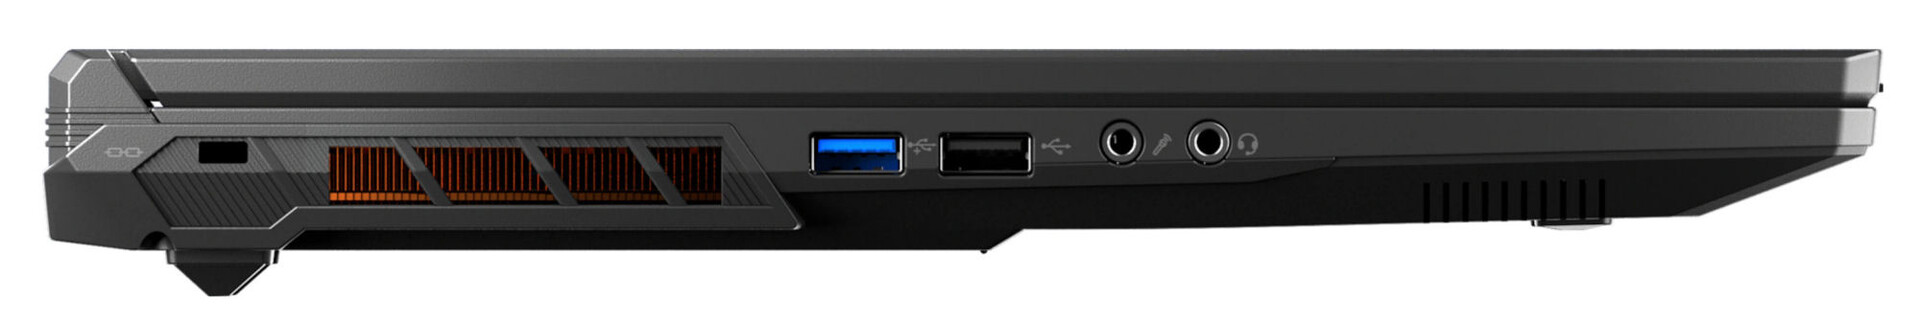
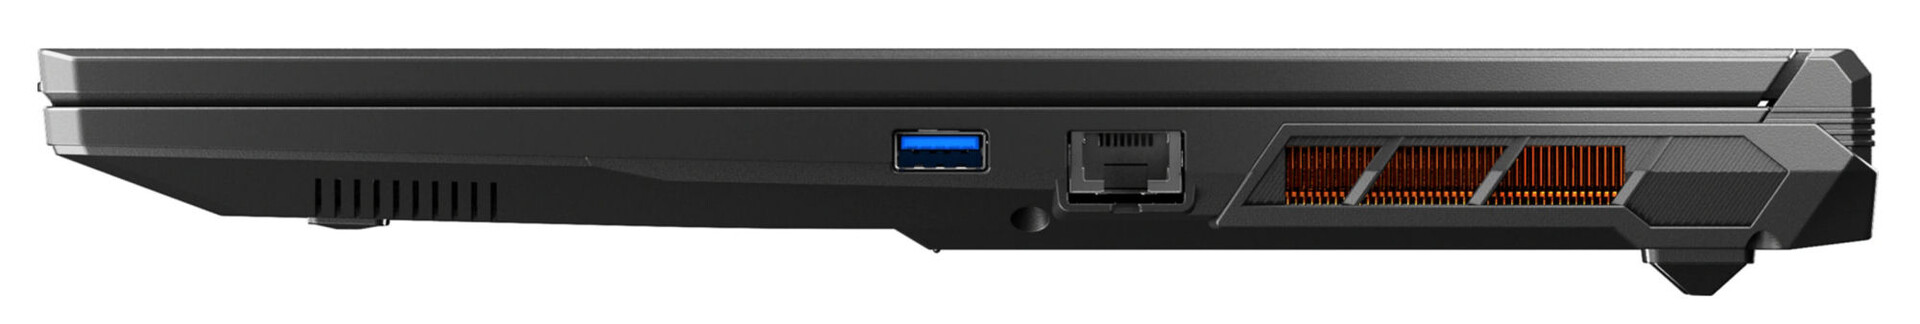
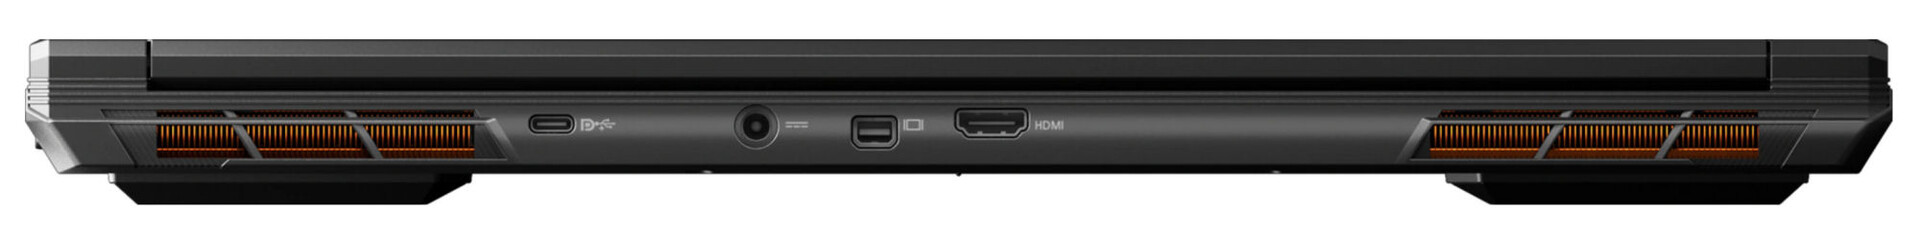
Equipamiento - Sin Thunderbolt para el Erazer
El Erazer ofrece tres puertos USB-A (1x USB 2.0, 1x USB 3.2 Gen 1, 1x USB 3.2 Gen 2) y un único puerto USB-C (USB 3.2 Gen 2). Aunque este último puede emitir una señal DisplayPort, no incluye soporte para Power Delivery. El Scout E20 incluye un total de tres puertos de salida de vídeo (HDMI 2.1, 2x DP). El equipo de conexión se completa con dos puertos de audio y un puerto Gigabit Ethernet. No hay lector de tarjetas de almacenamiento.
Los puertos de vídeo y la conexión de alimentación están en la parte trasera del dispositivo, por lo que los cables correspondientes pasarían por detrás y no estorbarían.
Comunicación
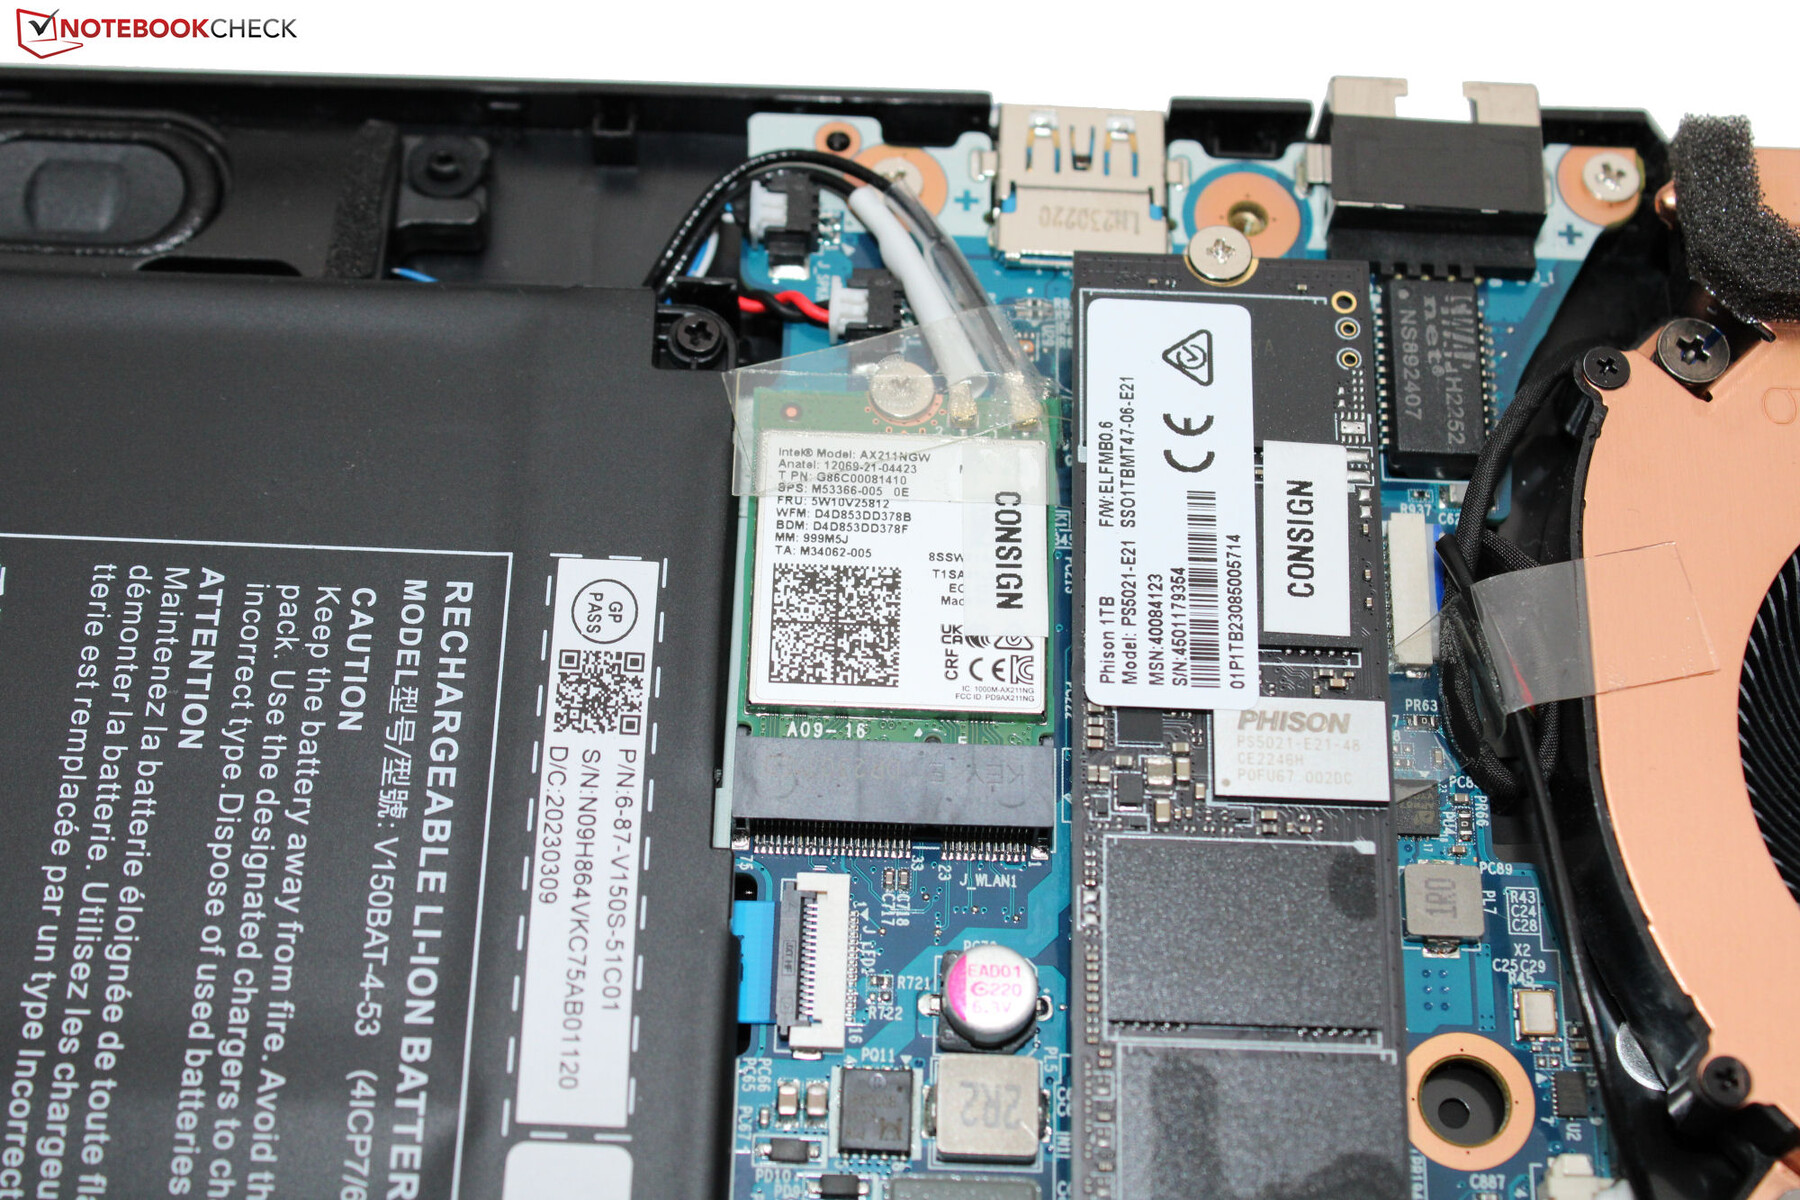
En condiciones óptimas (sin otros dispositivos WLAN cerca y poca distancia entre el portátil y el PC servidor), se alcanzan excelentes velocidades de datos WiFi. El portátil Medion utiliza un chip Intel AX211 WiFi-6E, y de las conexiones por cable también se encarga un chip Intel (I219-V; 1 Gbit/s).
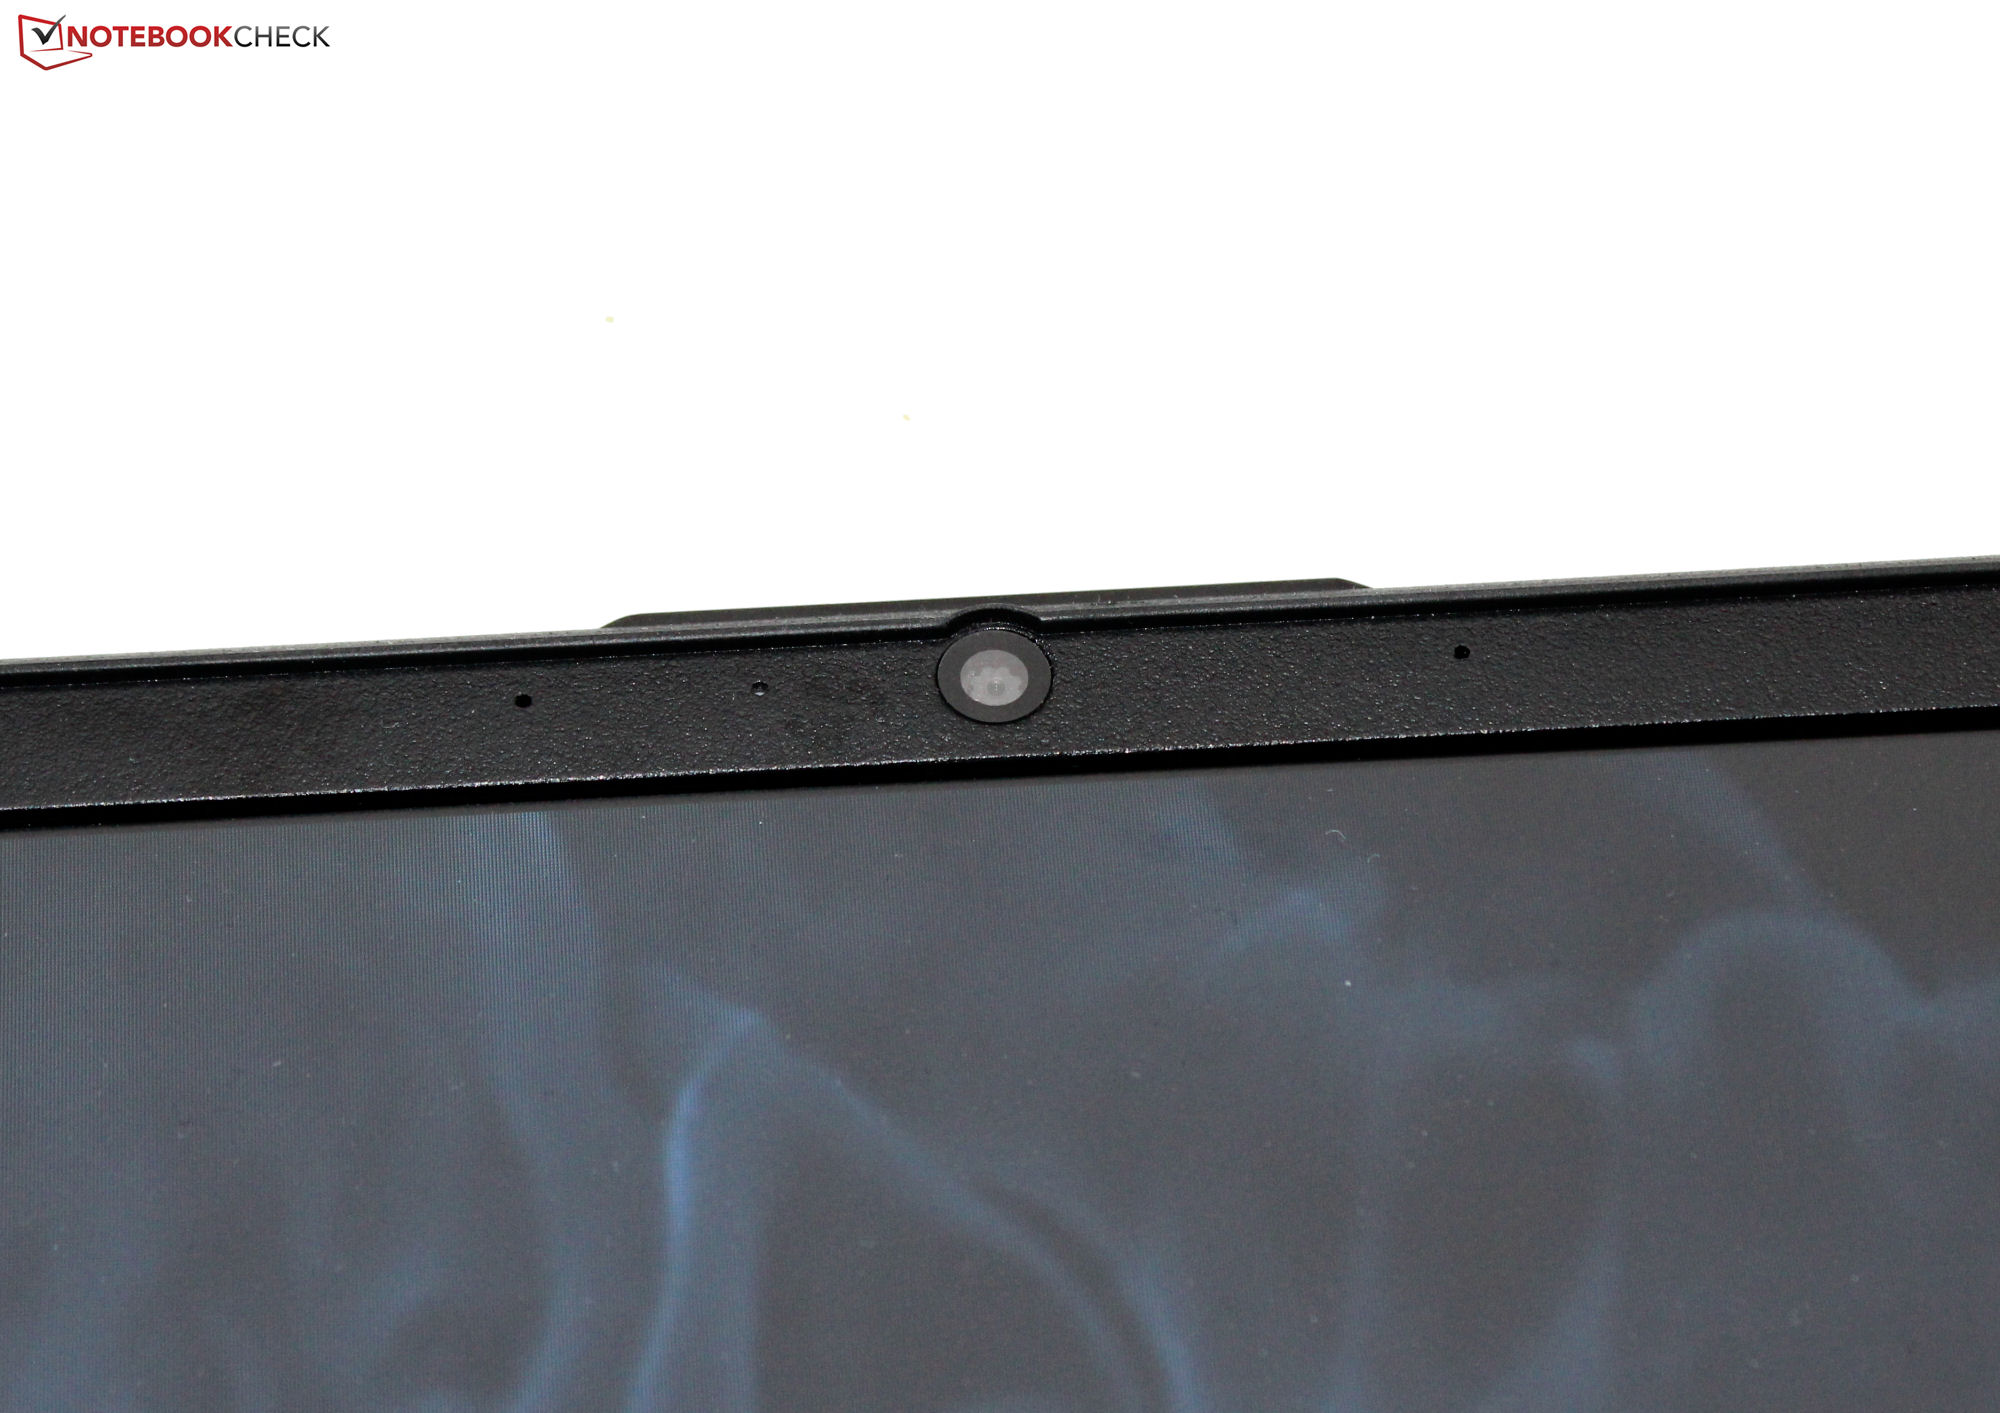
Cámara web
La webcam de 0.9-MP tiene una resolución máxima de 1,280 x 720 pixels y no ofrece obturador mecánico. La calidad que es capaz de ofrecer es estándar, pero al menos los resultados sólo muestran una desviación de color relativamente baja.


Accesorios
El portátil no incluye ningún accesorio adicional aparte de la documentación habitual, como las instrucciones de inicio rápido y la información sobre la garantía.
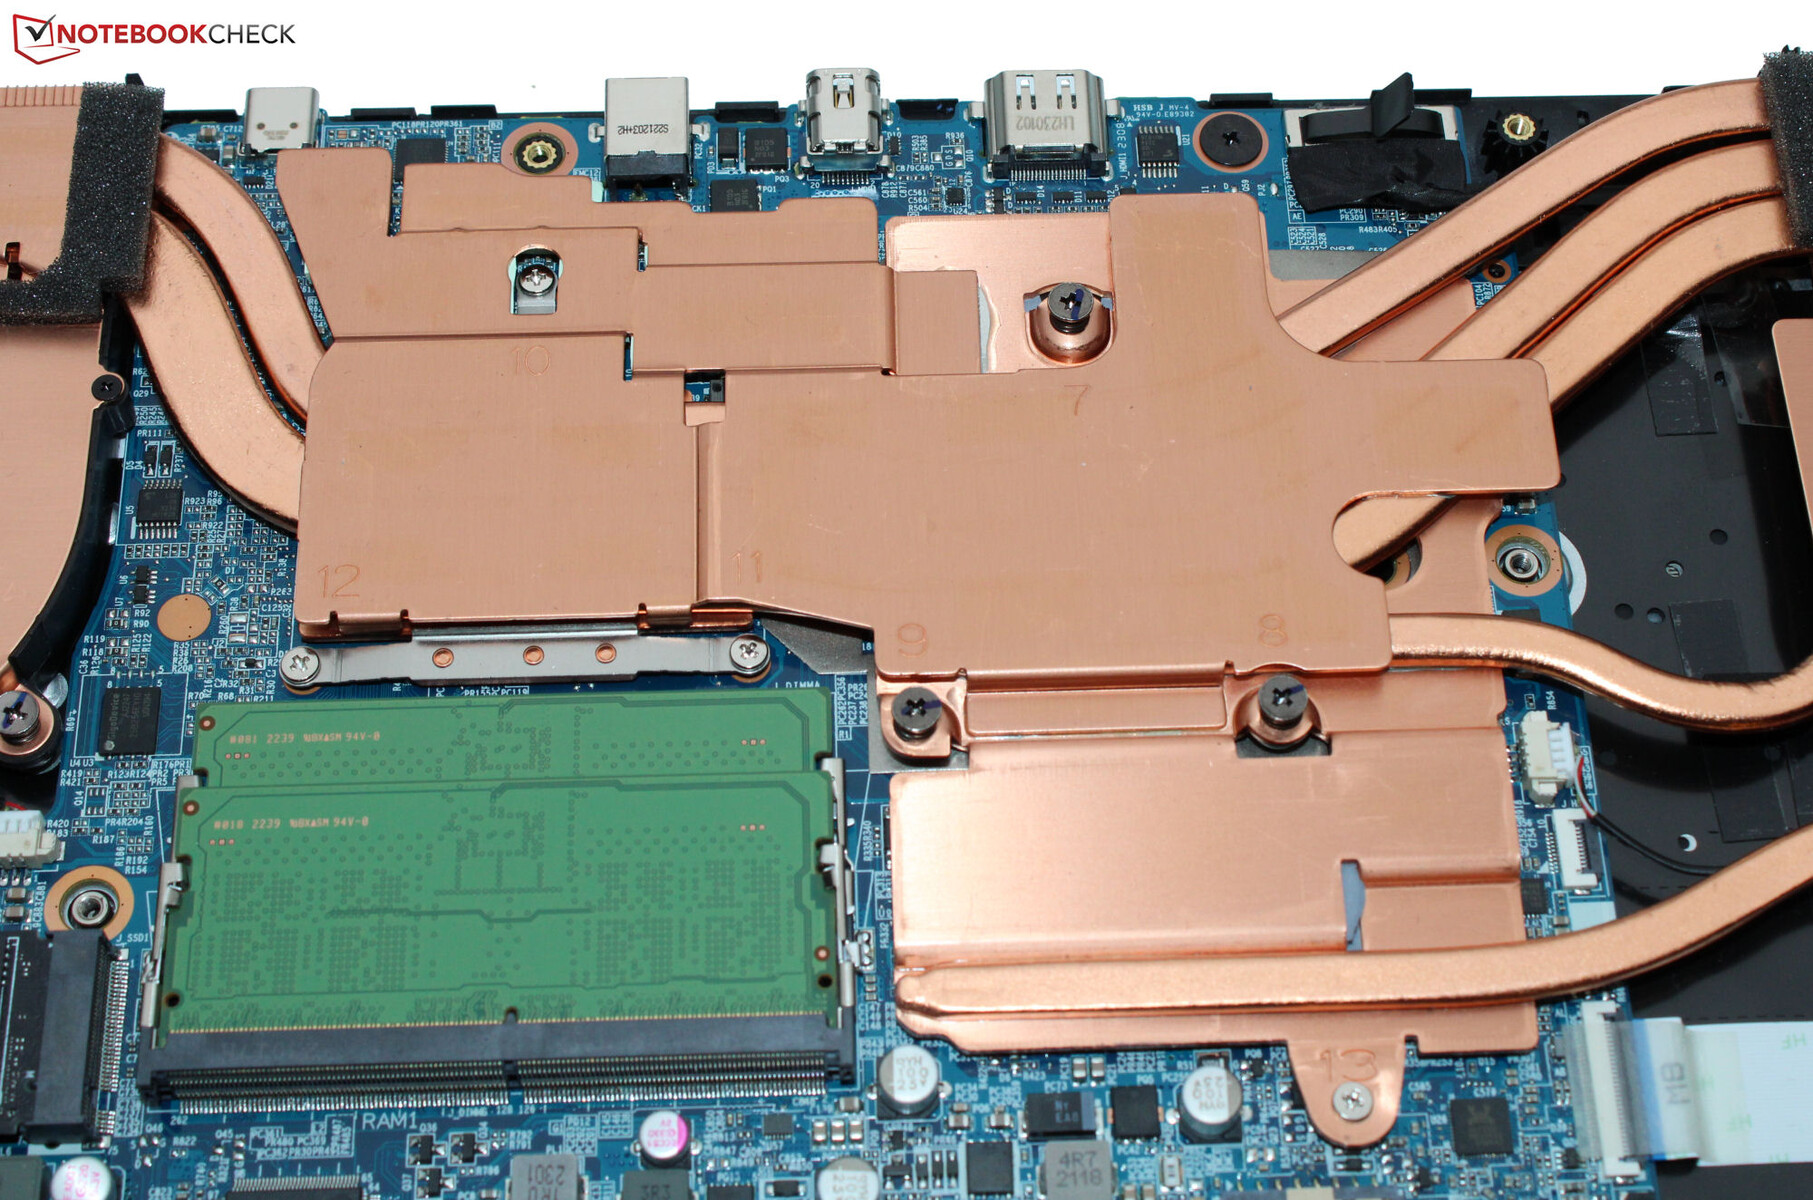
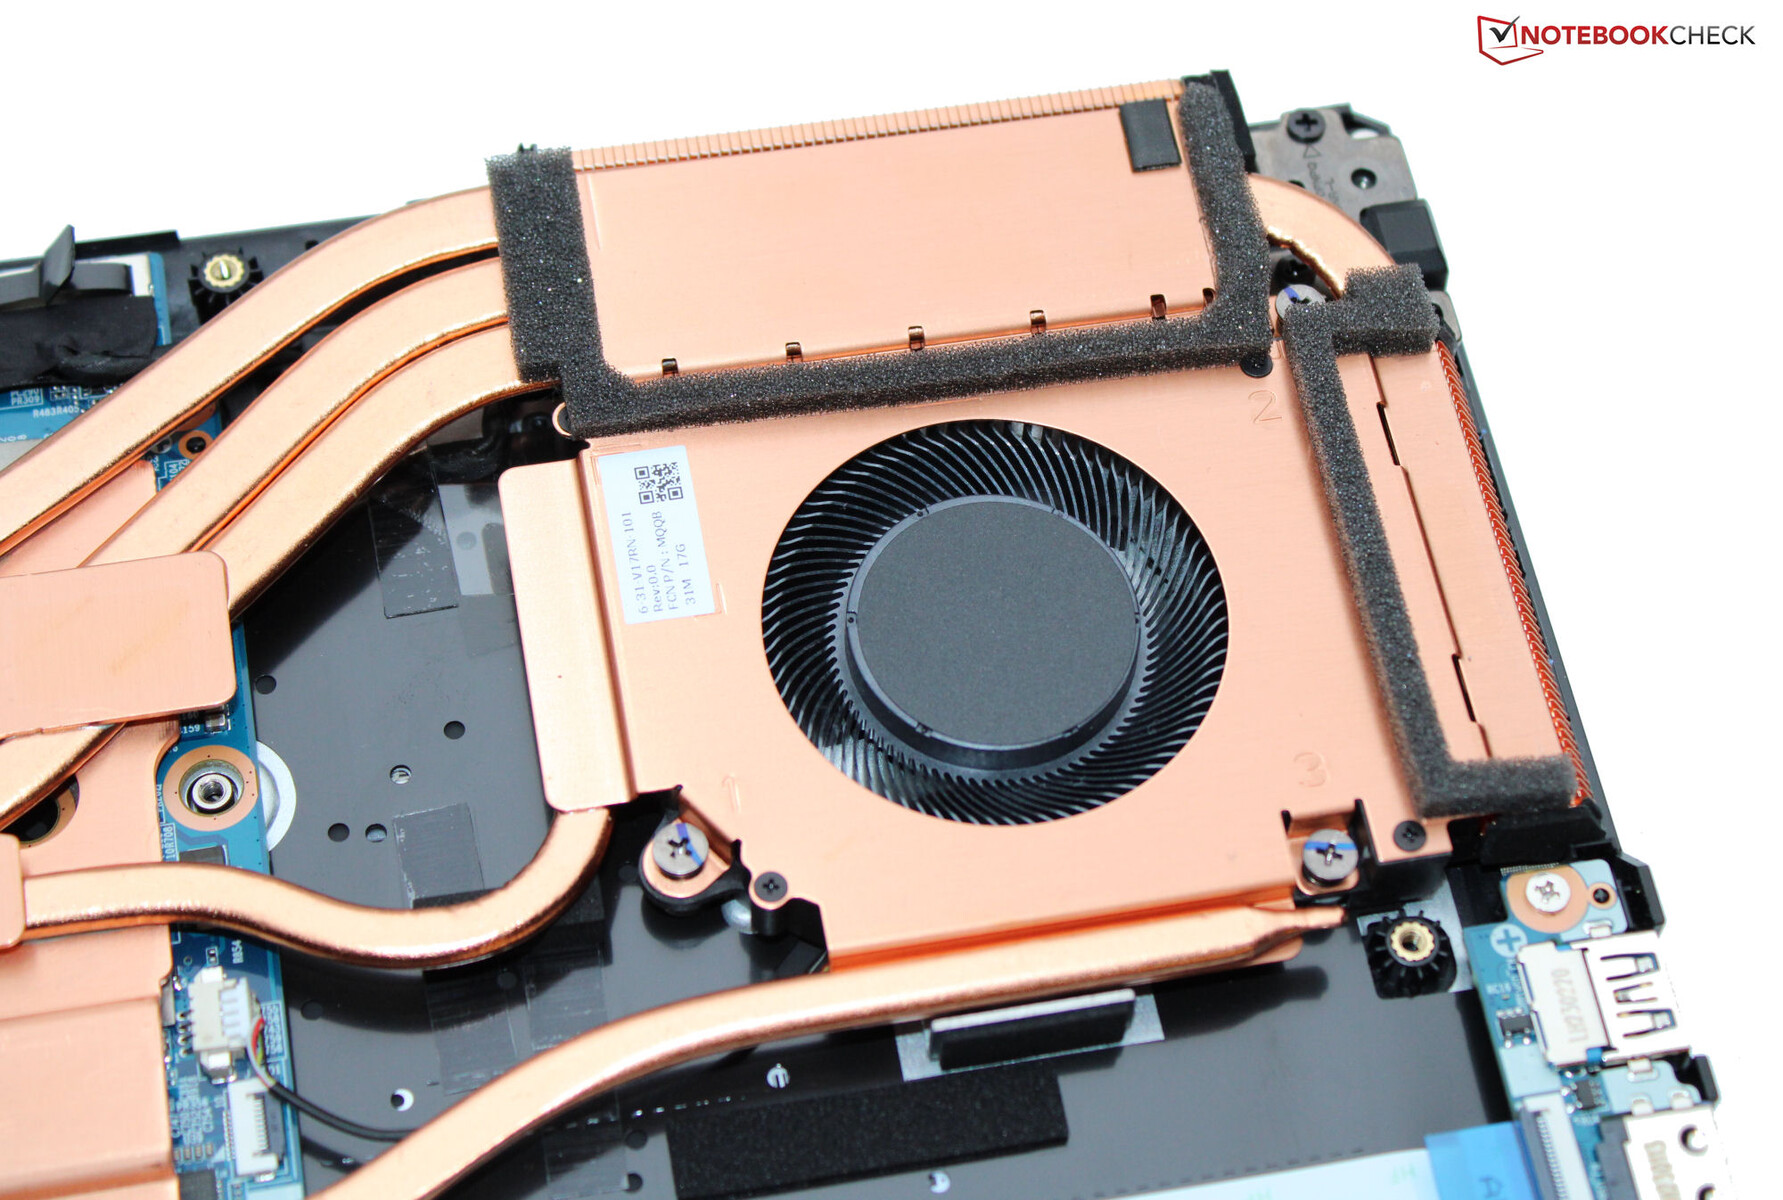
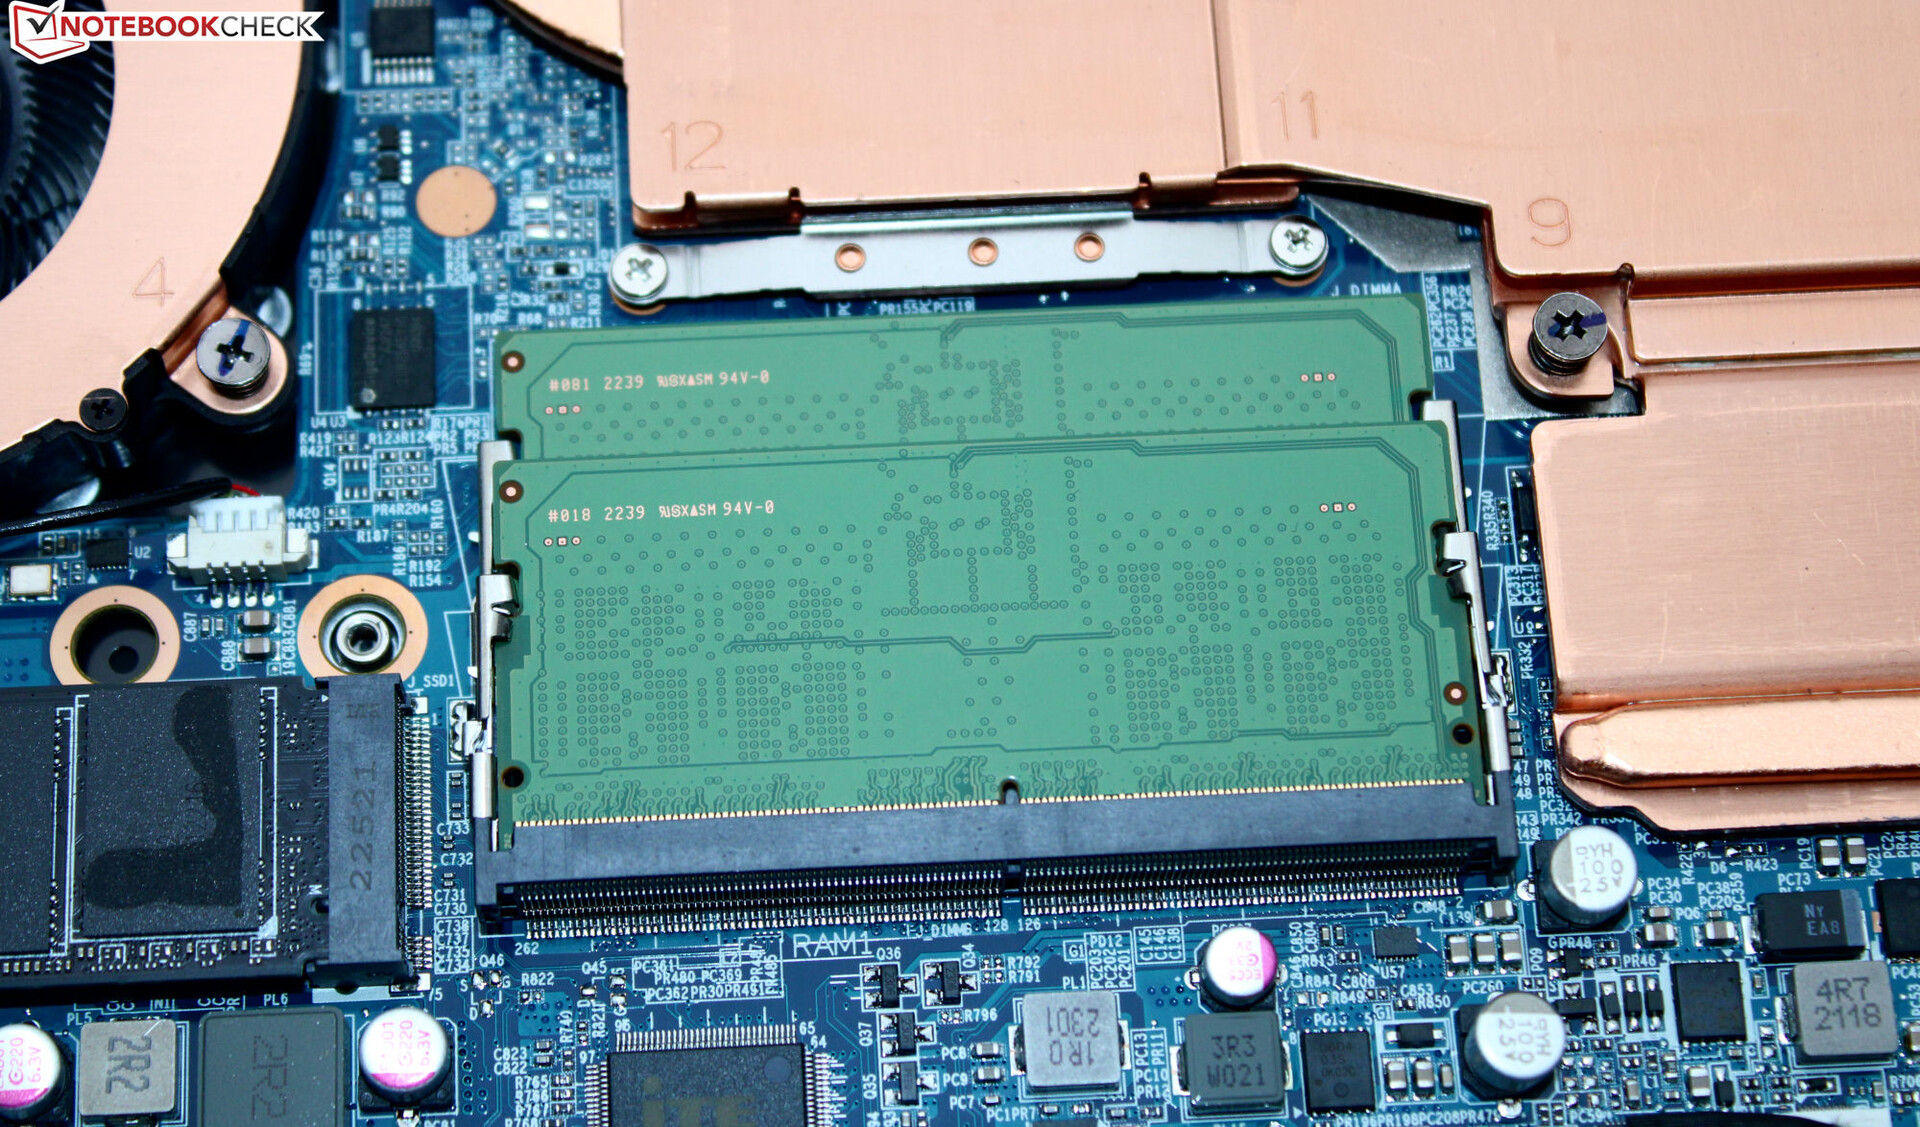
Mantenimiento
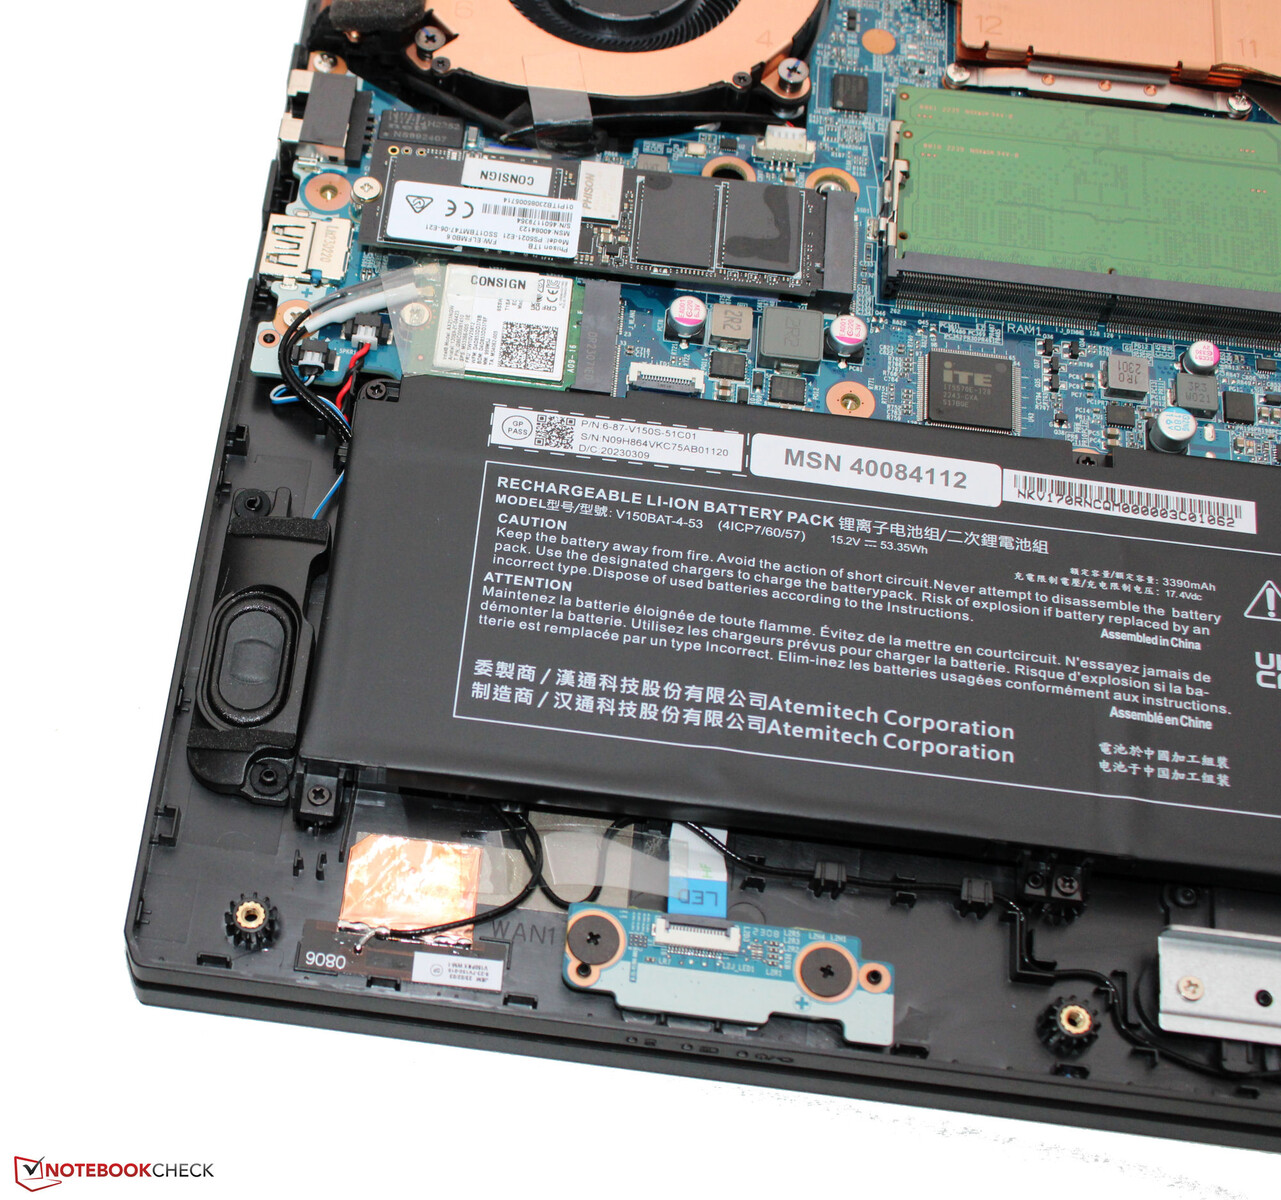
Tras retirar numerosos tornillos de la parte inferior de la carcasa, puedes retirar la placa inferior con la ayuda de una herramienta de palanca como una espátula plana. Entonces tendrás acceso a los bancos de memoria de trabajo (ambos están ocupados), el SSD PCIe 4 M.2-2280, el módulo WLAN, los ventiladores y la batería.
Garantía
Medion ofrece una garantía de dos años para el Erazer. Aunque existen extensiones de garantía, hay que adquirirlas junto con el portátil en la tienda en línea de Medion. No es posible adquirirlas posteriormente.
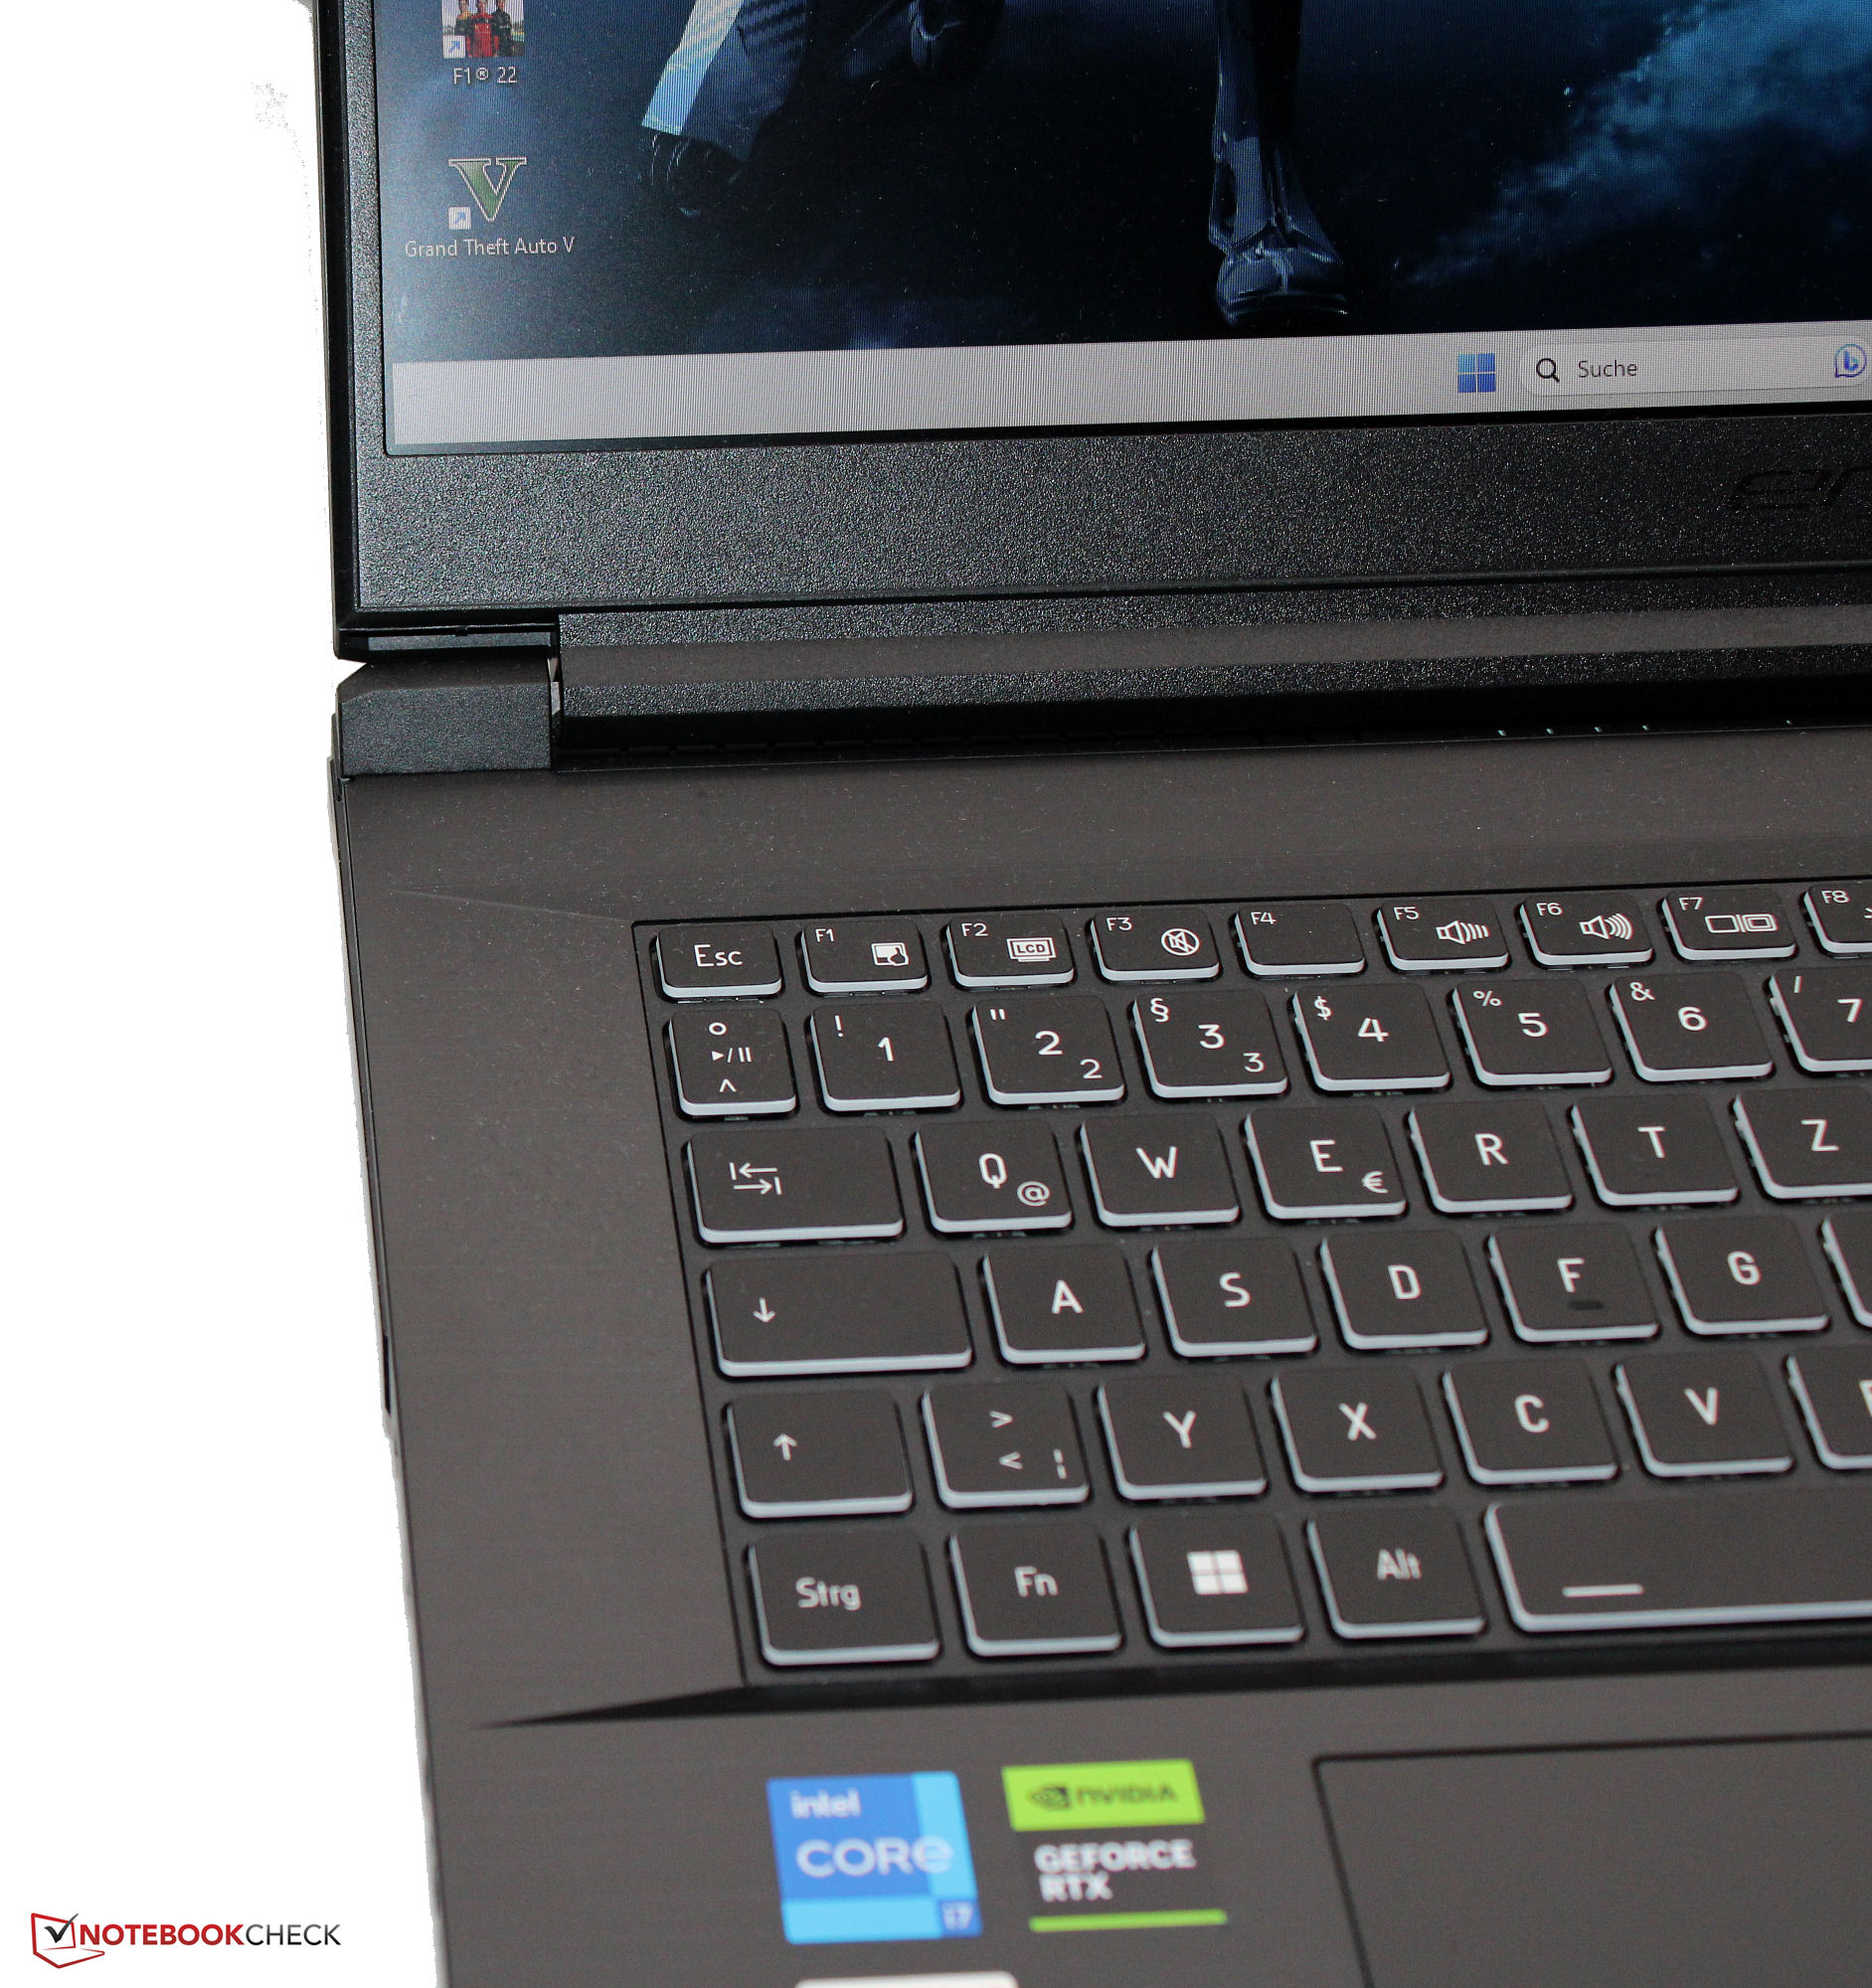
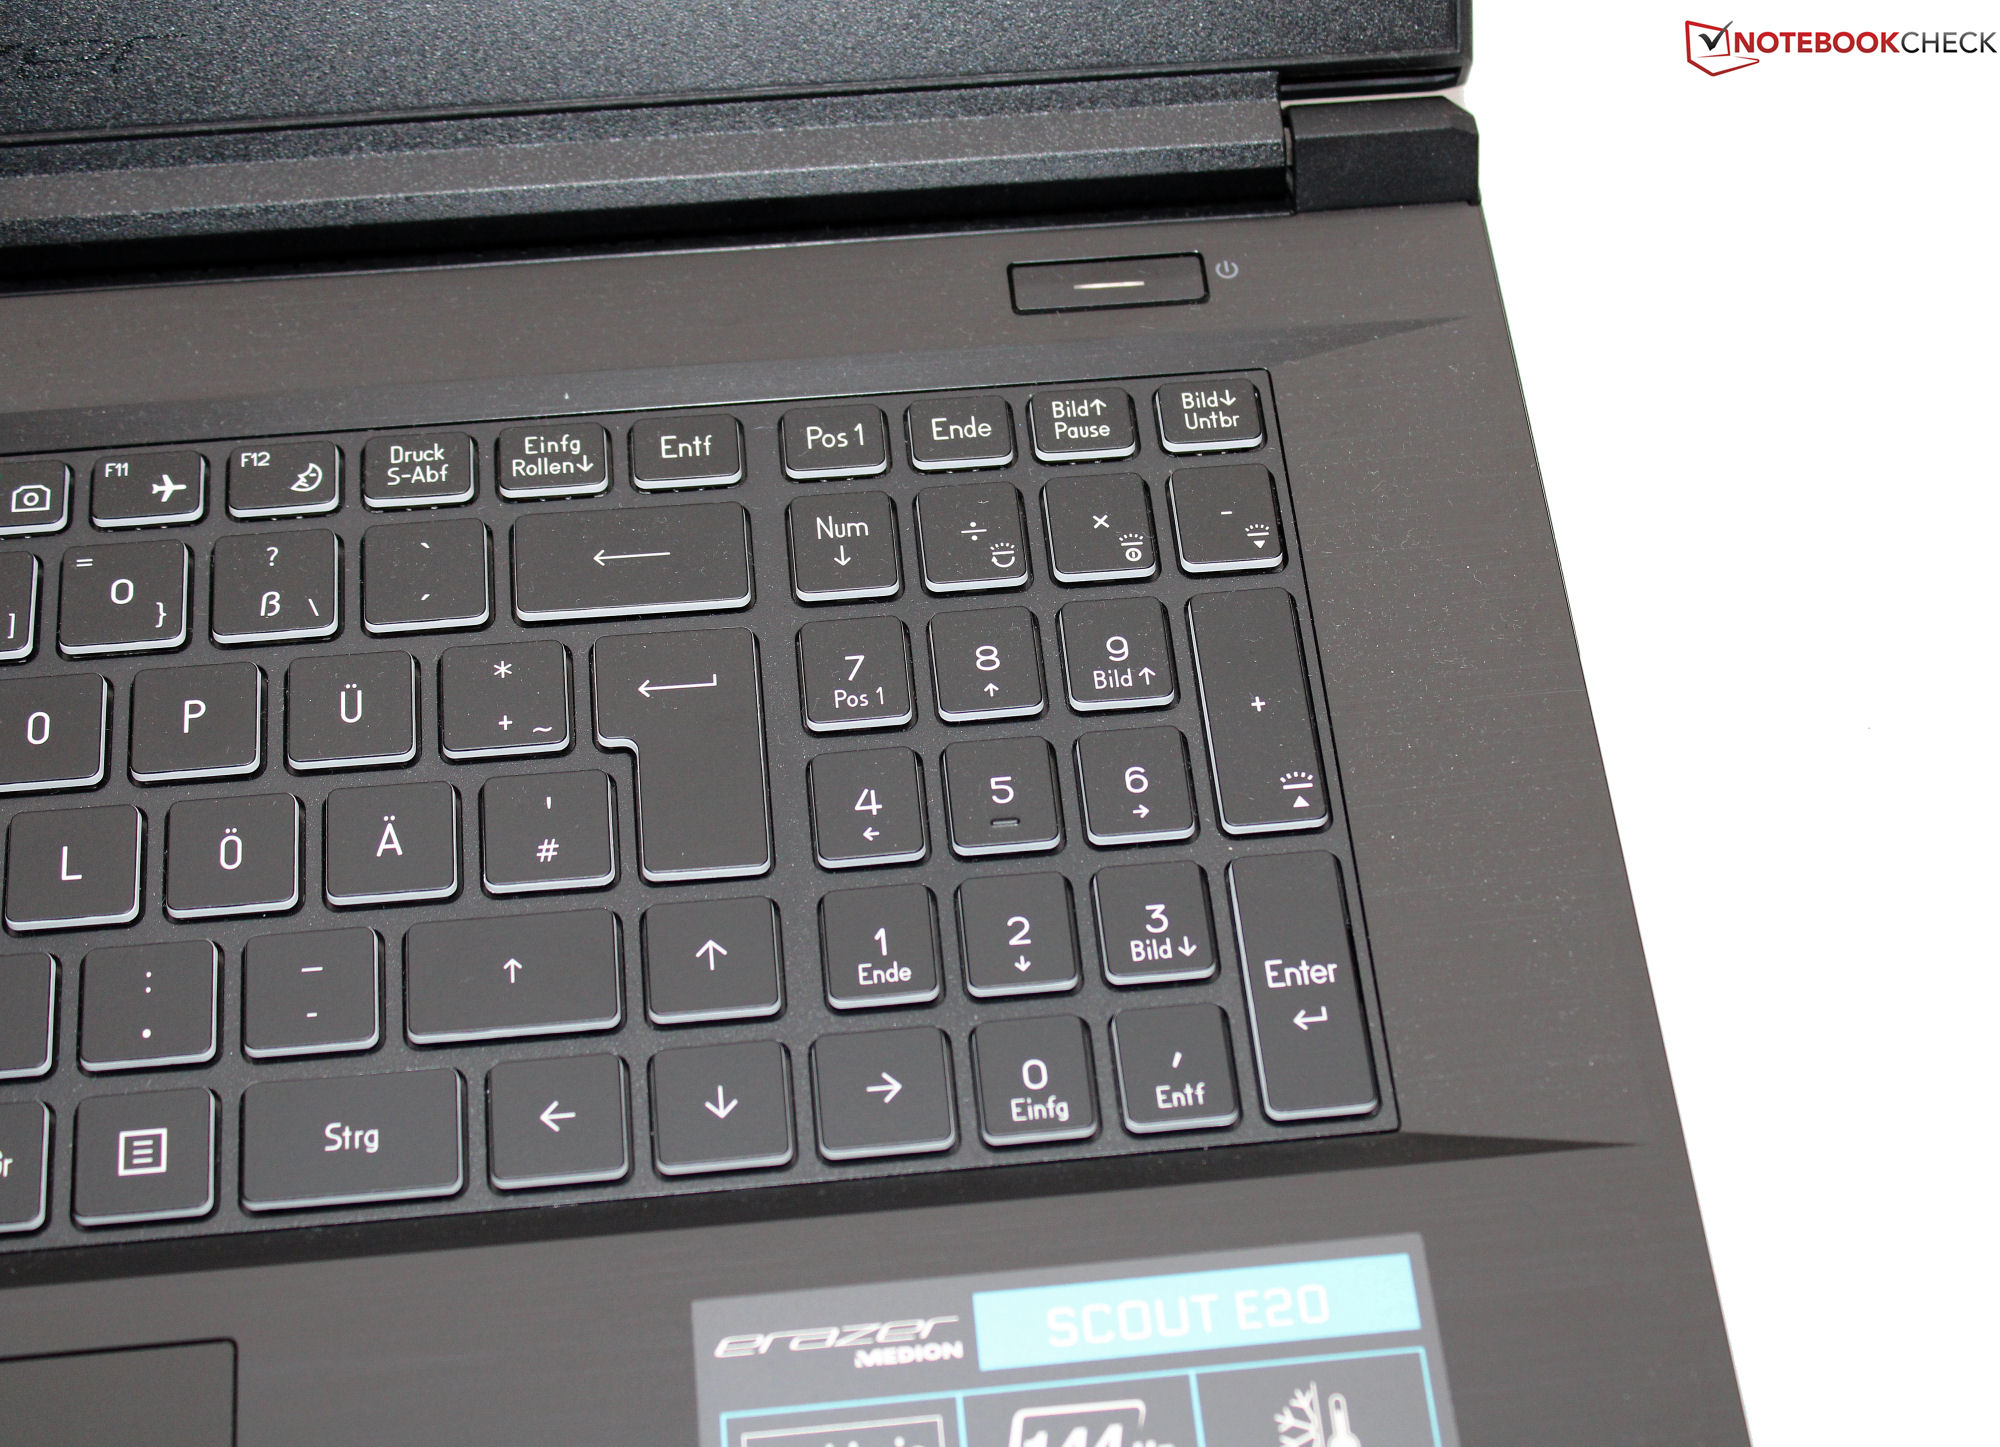
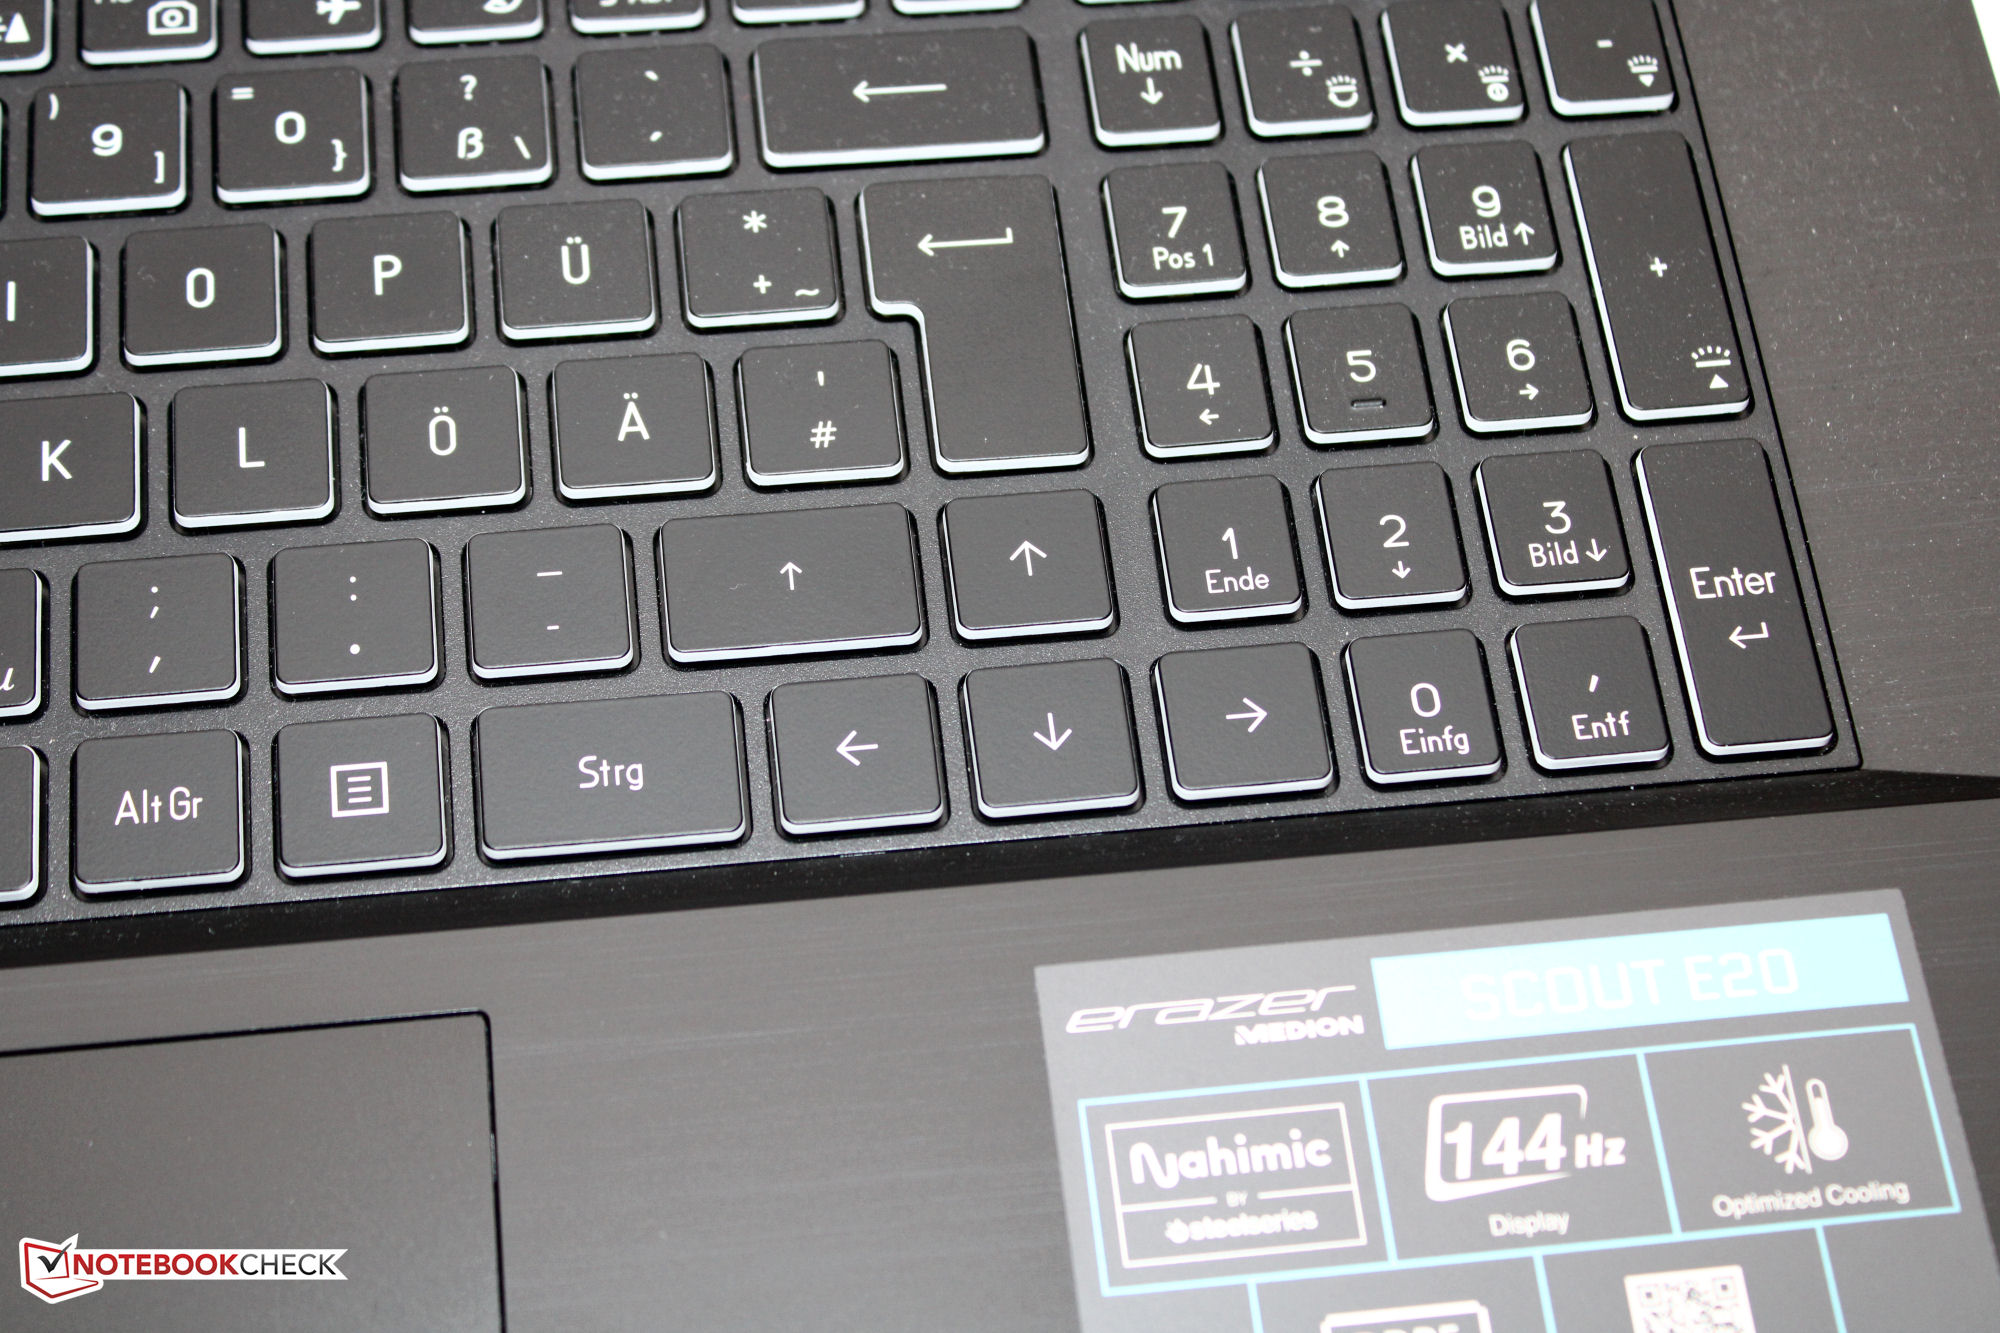
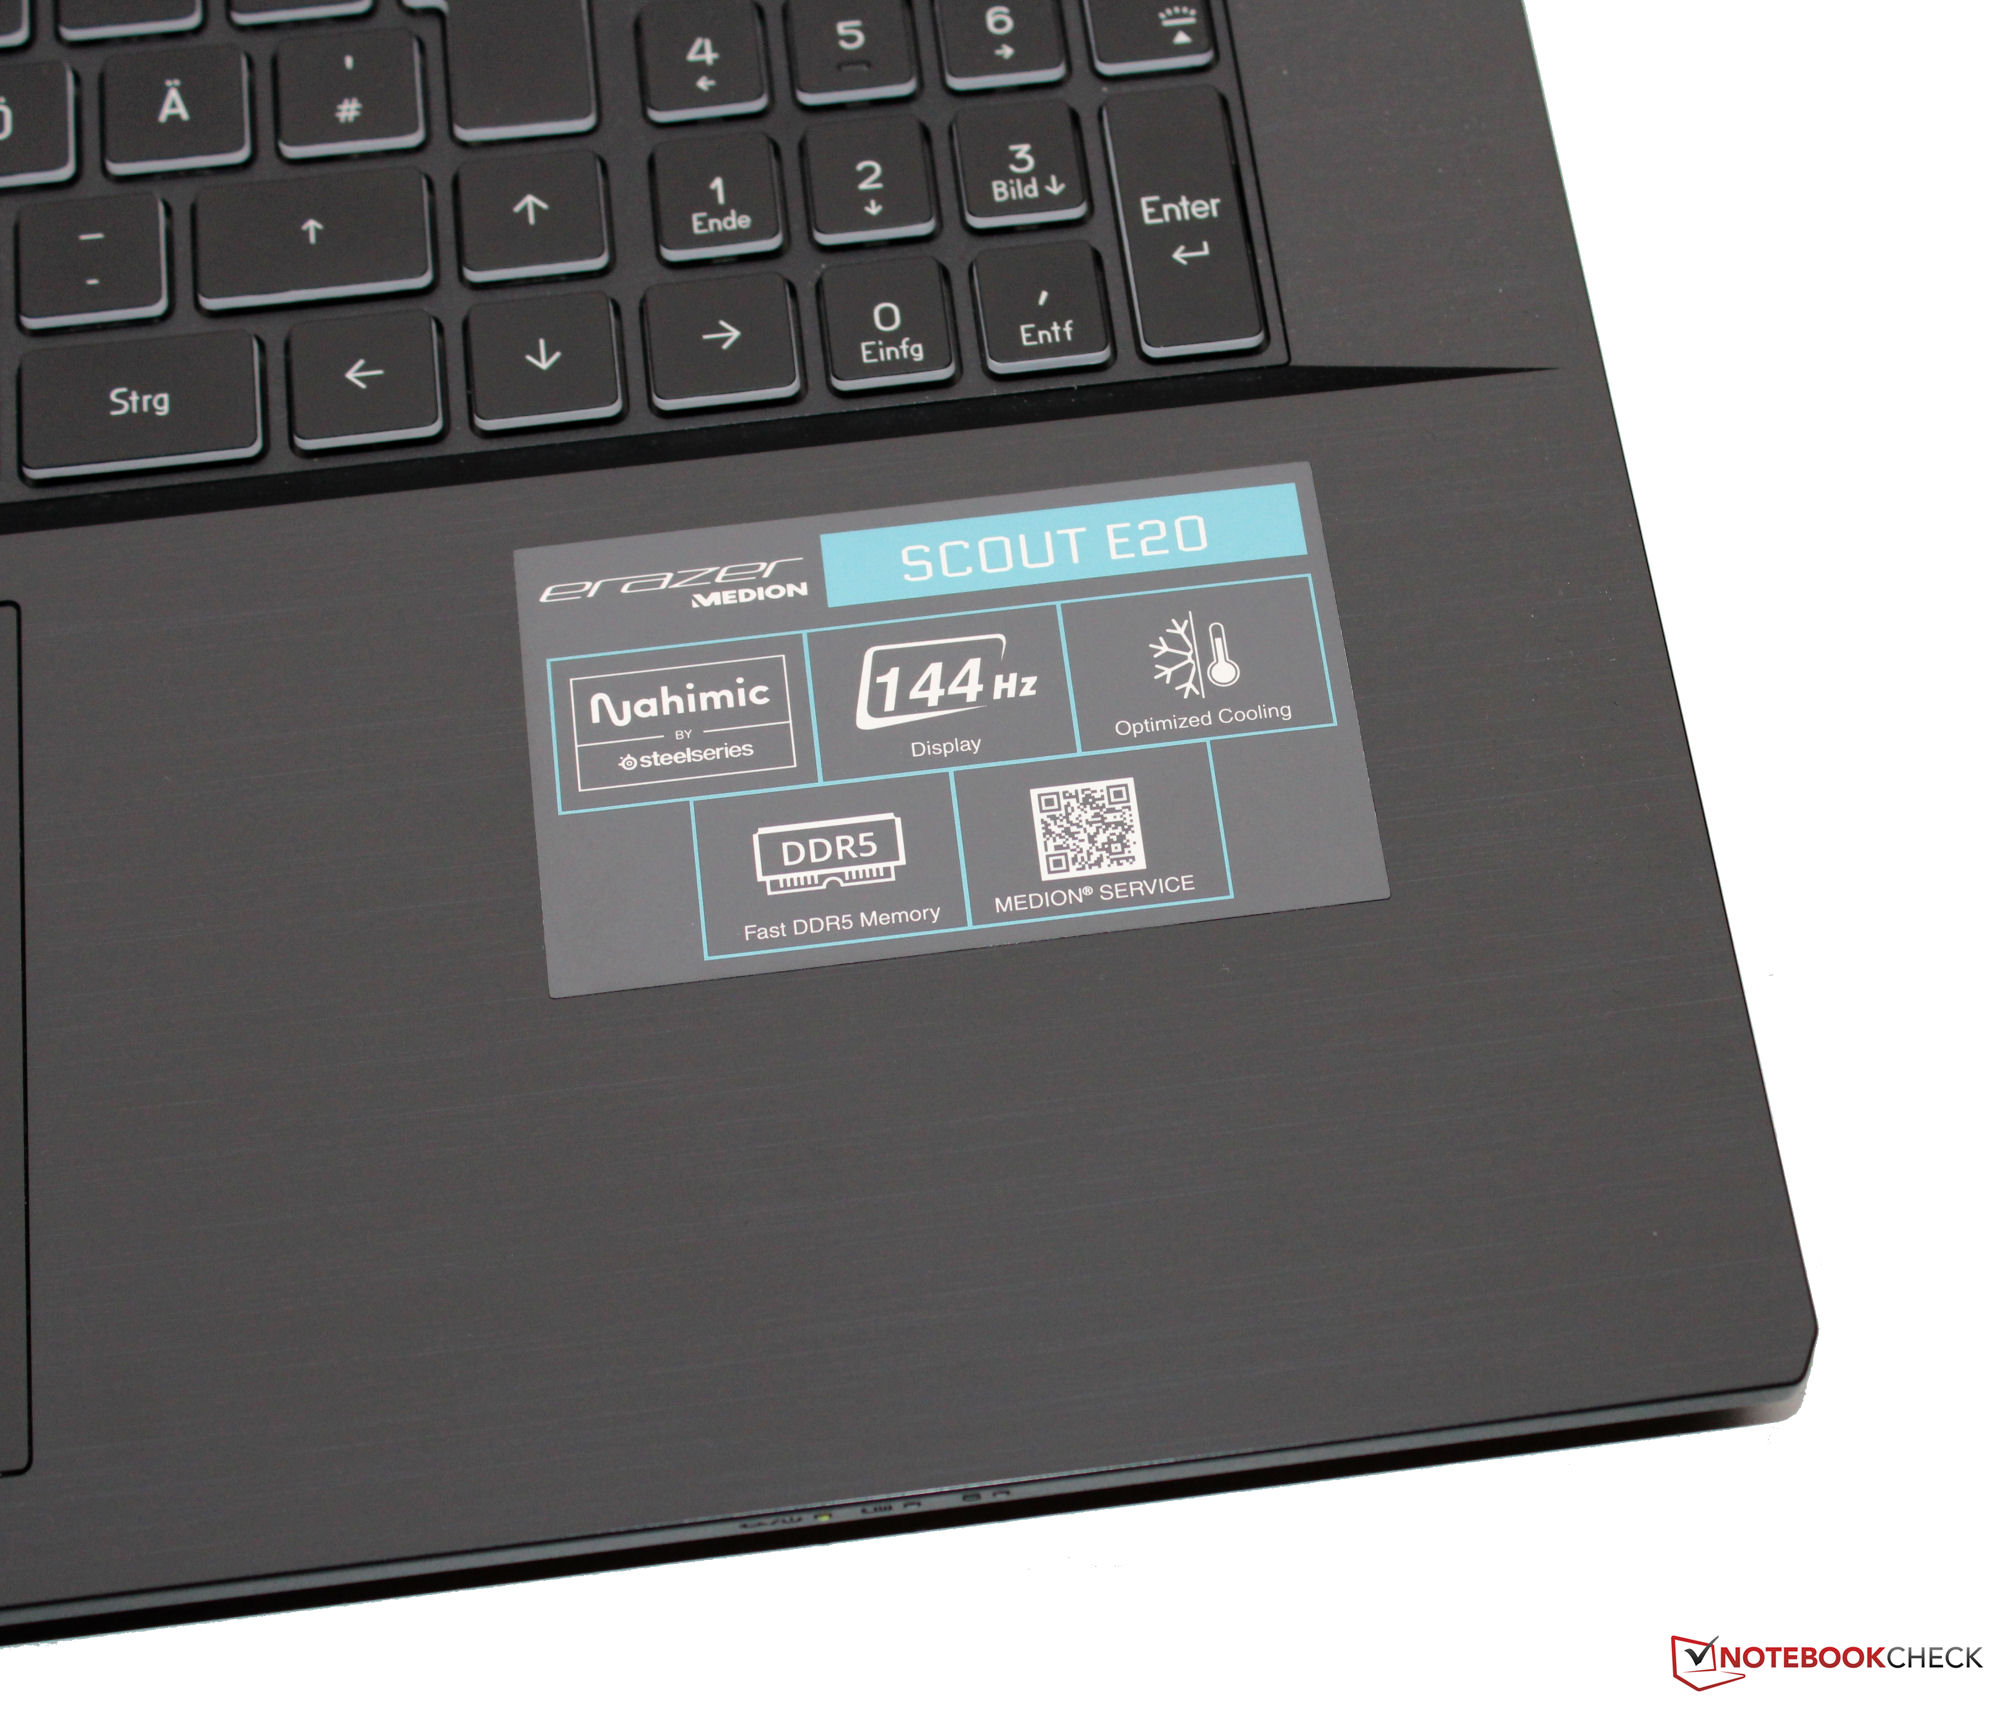
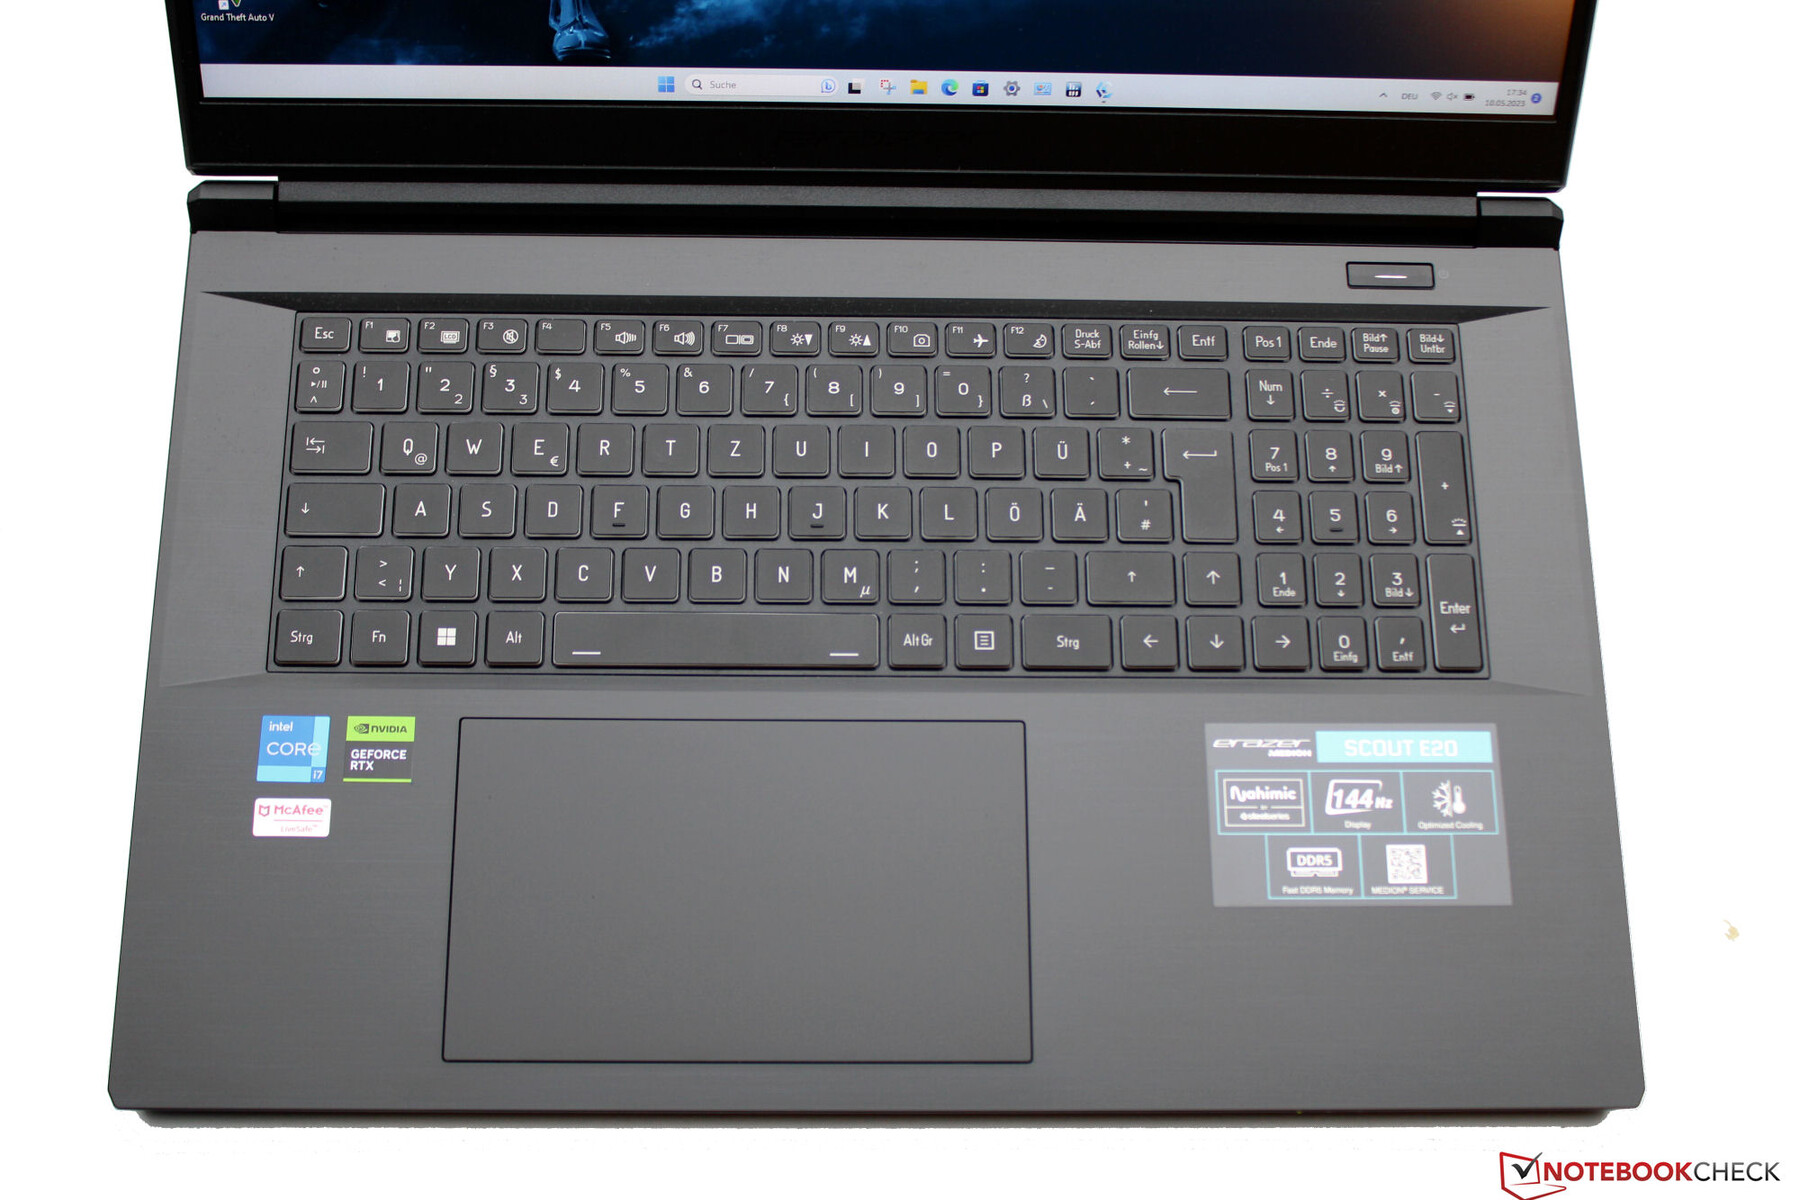
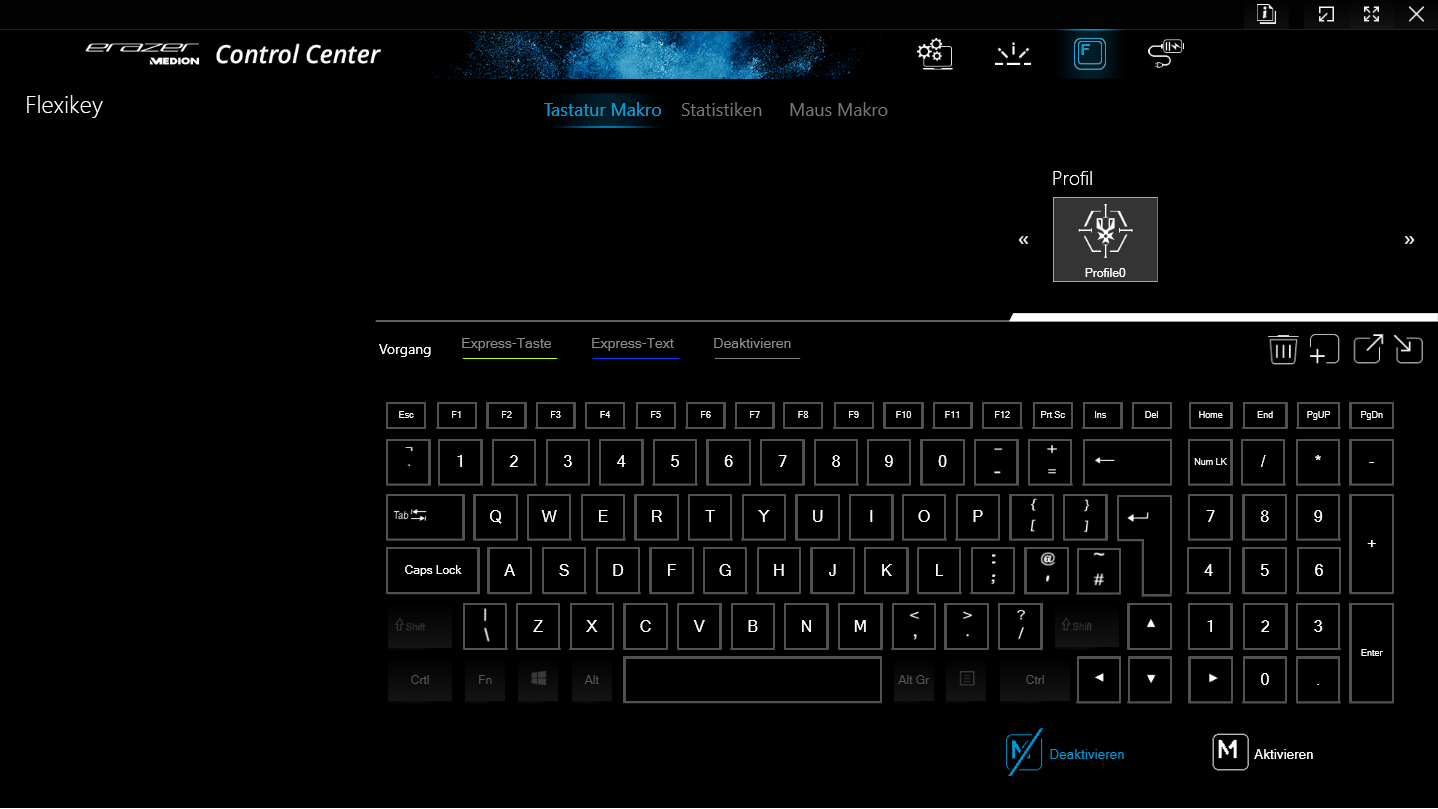
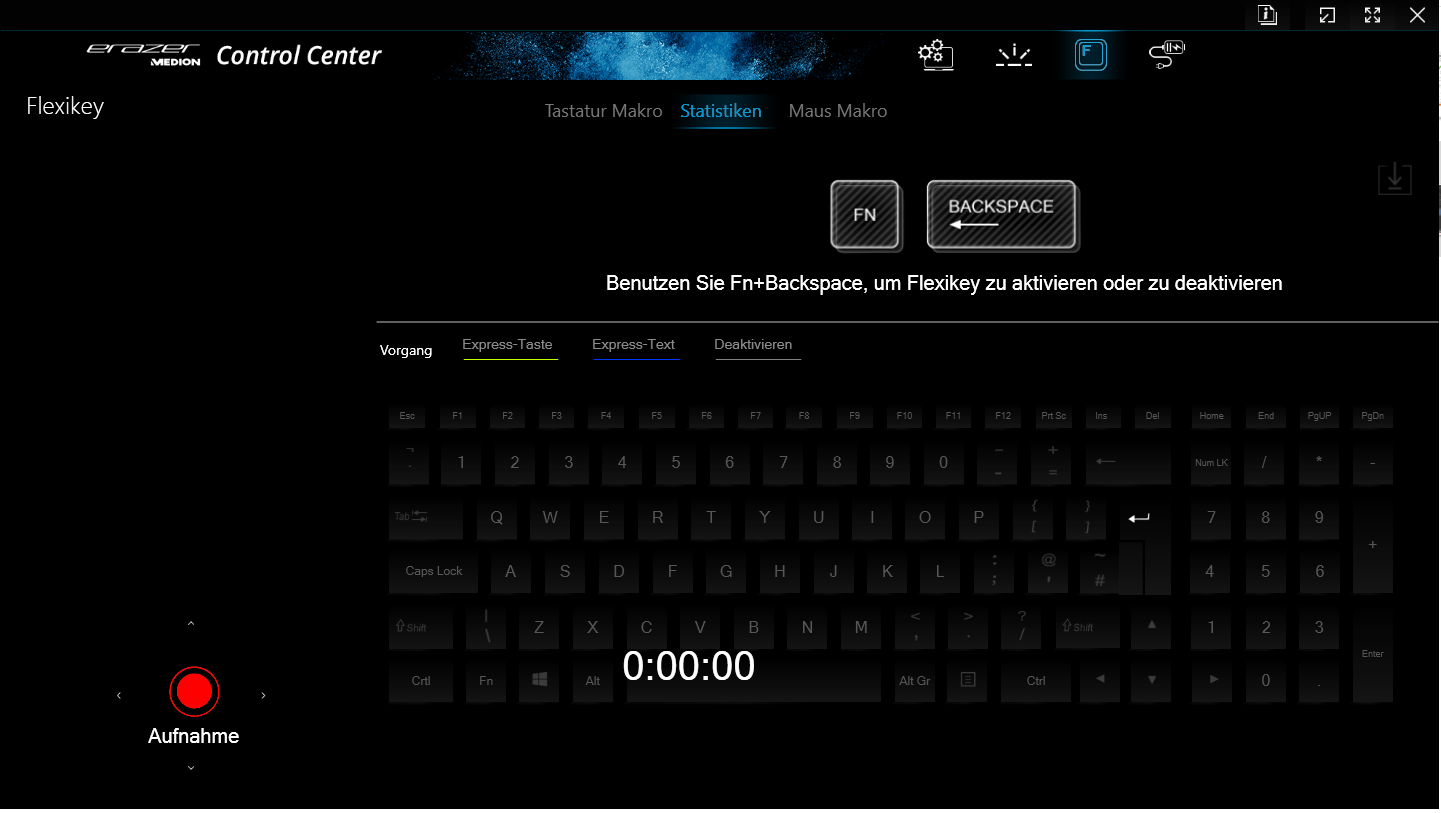
Dispositivos de entrada - Teclado E20 con iluminación RGB
Teclado
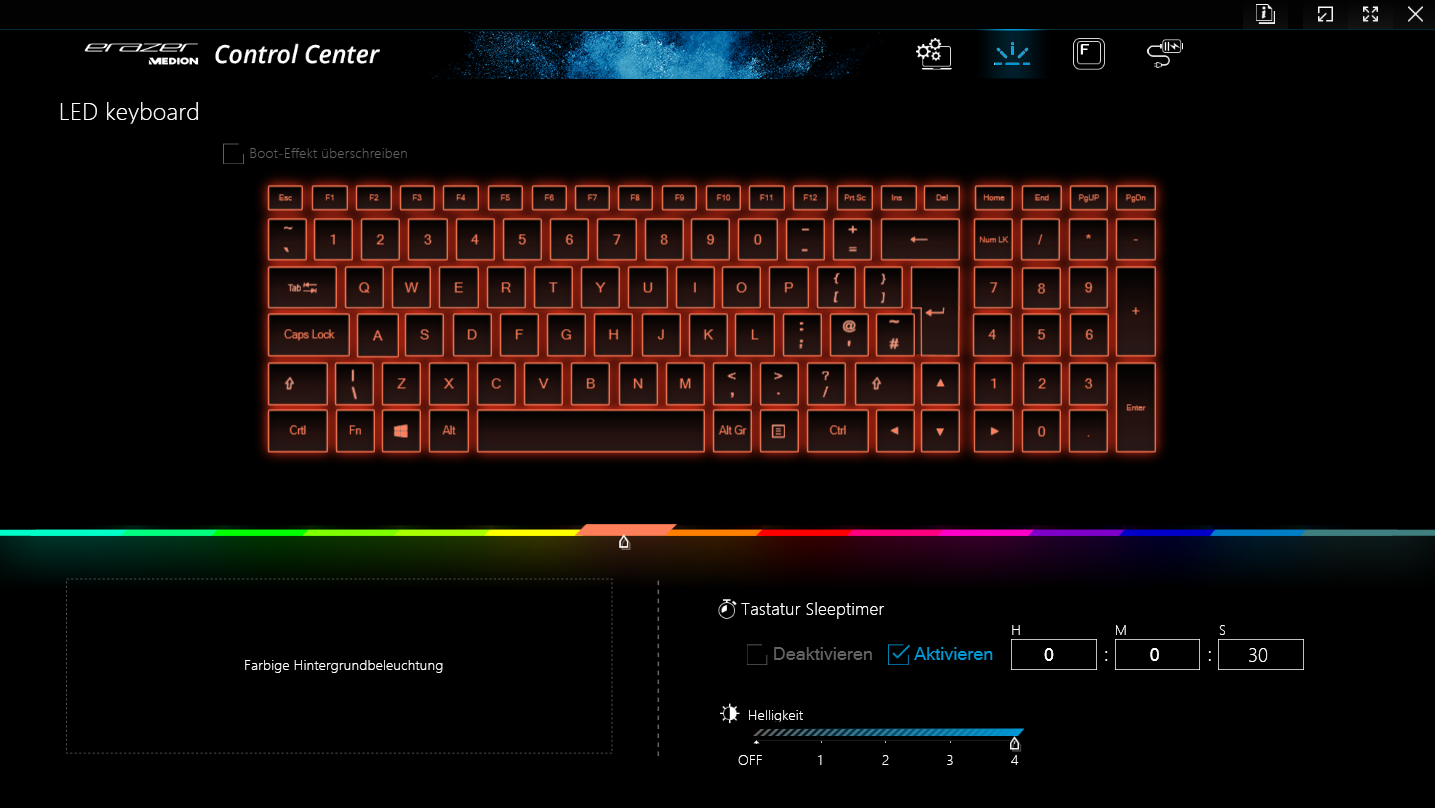
Las teclas lisas y planas del teclado chiclet (que incluye un bloque numérico) ofrecen un recorrido corto y un punto de presión claro. La resistencia de las teclas es buena. Al escribir, el teclado cede lo mínimo, lo que no supone un obstáculo. La iluminación del teclado tiene cuatro niveles de brillo. En general, Medion ha conseguido un teclado adecuado para las tareas cotidianas.
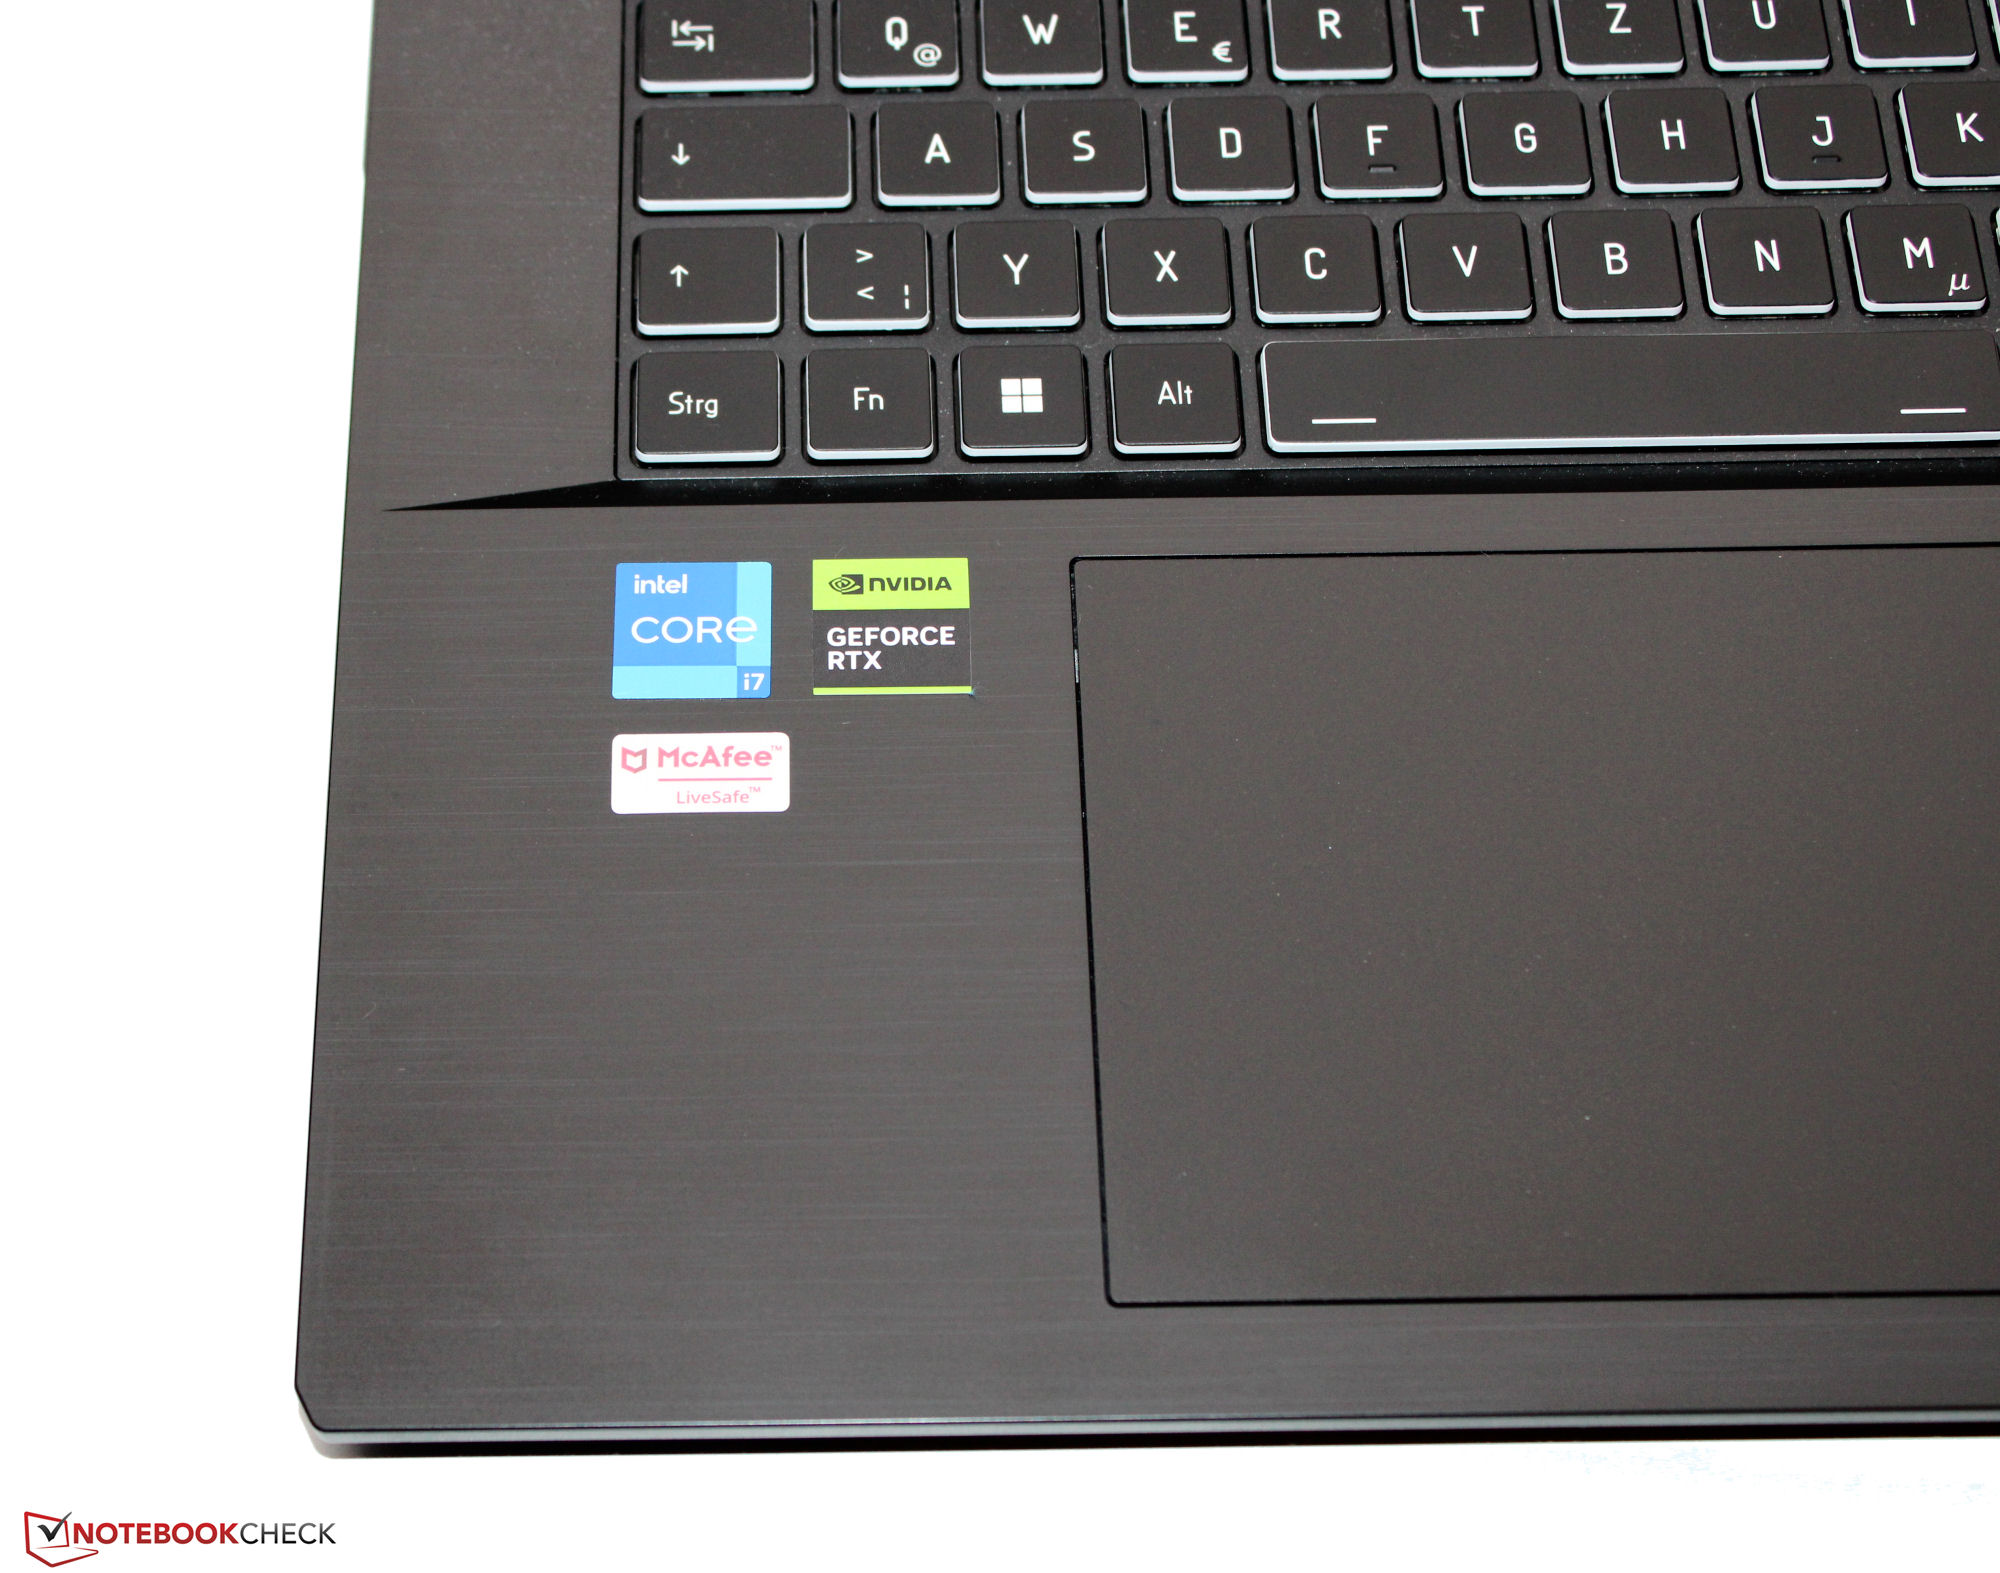
Panel táctil
Un ClickPad de 15,1 x 9,2 cm (~6 x 3,6 pulg.), cuya superficie lisa facilita el deslizamiento de los dedos, sirve como sustituto del ratón. También responde a las entradas en las esquinas y ofrece un recorrido corto y un punto de presión claro.
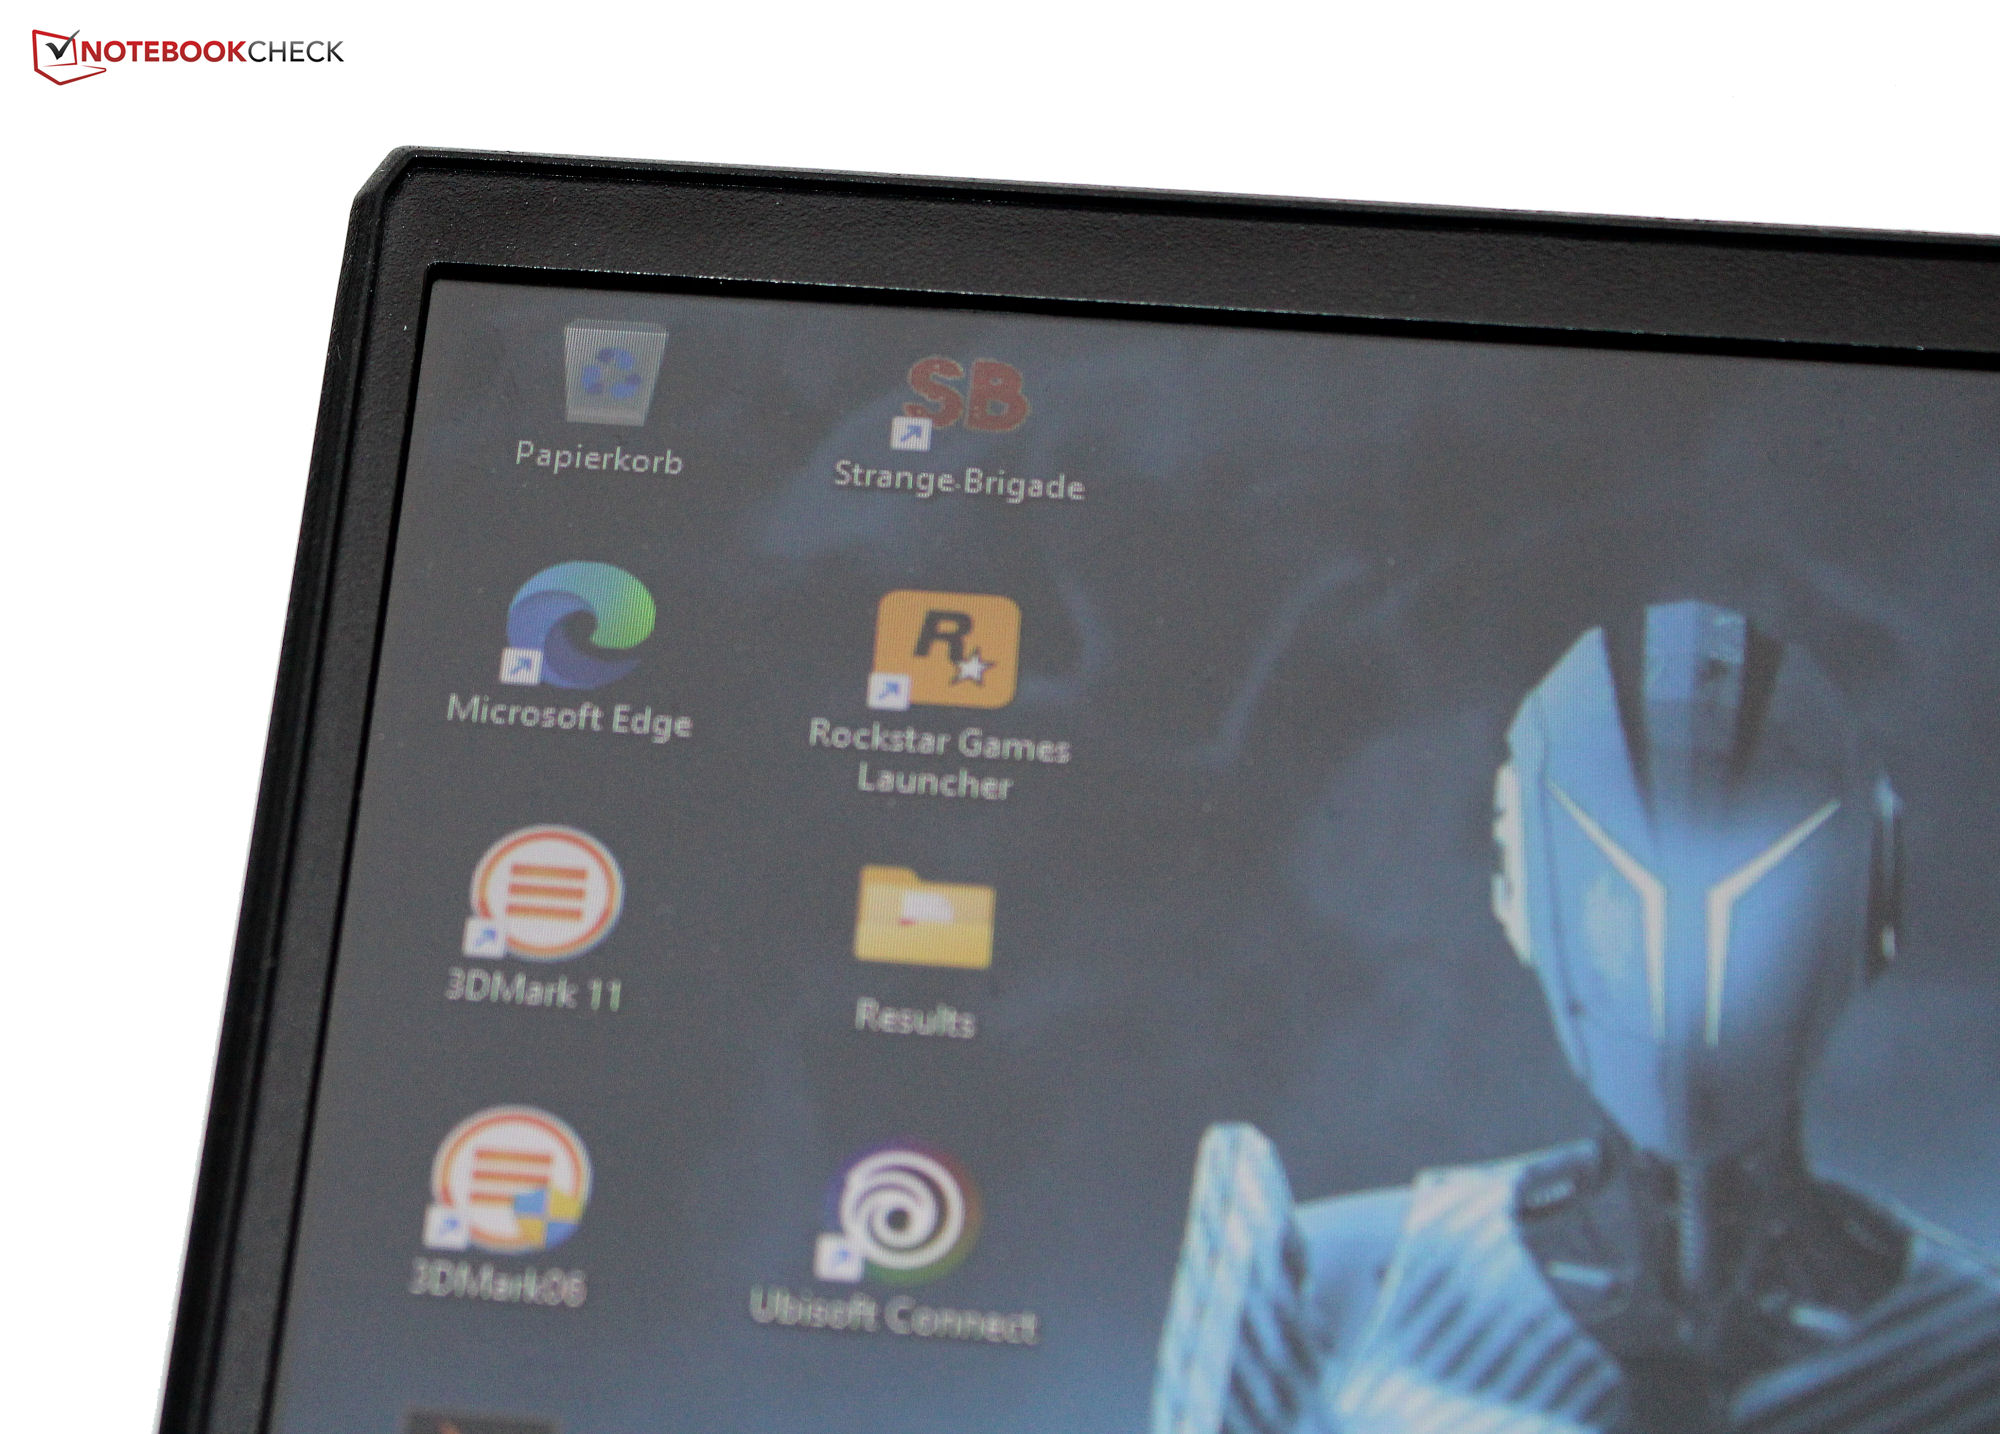
Pantalla: panel FHD con cobertura sRGB
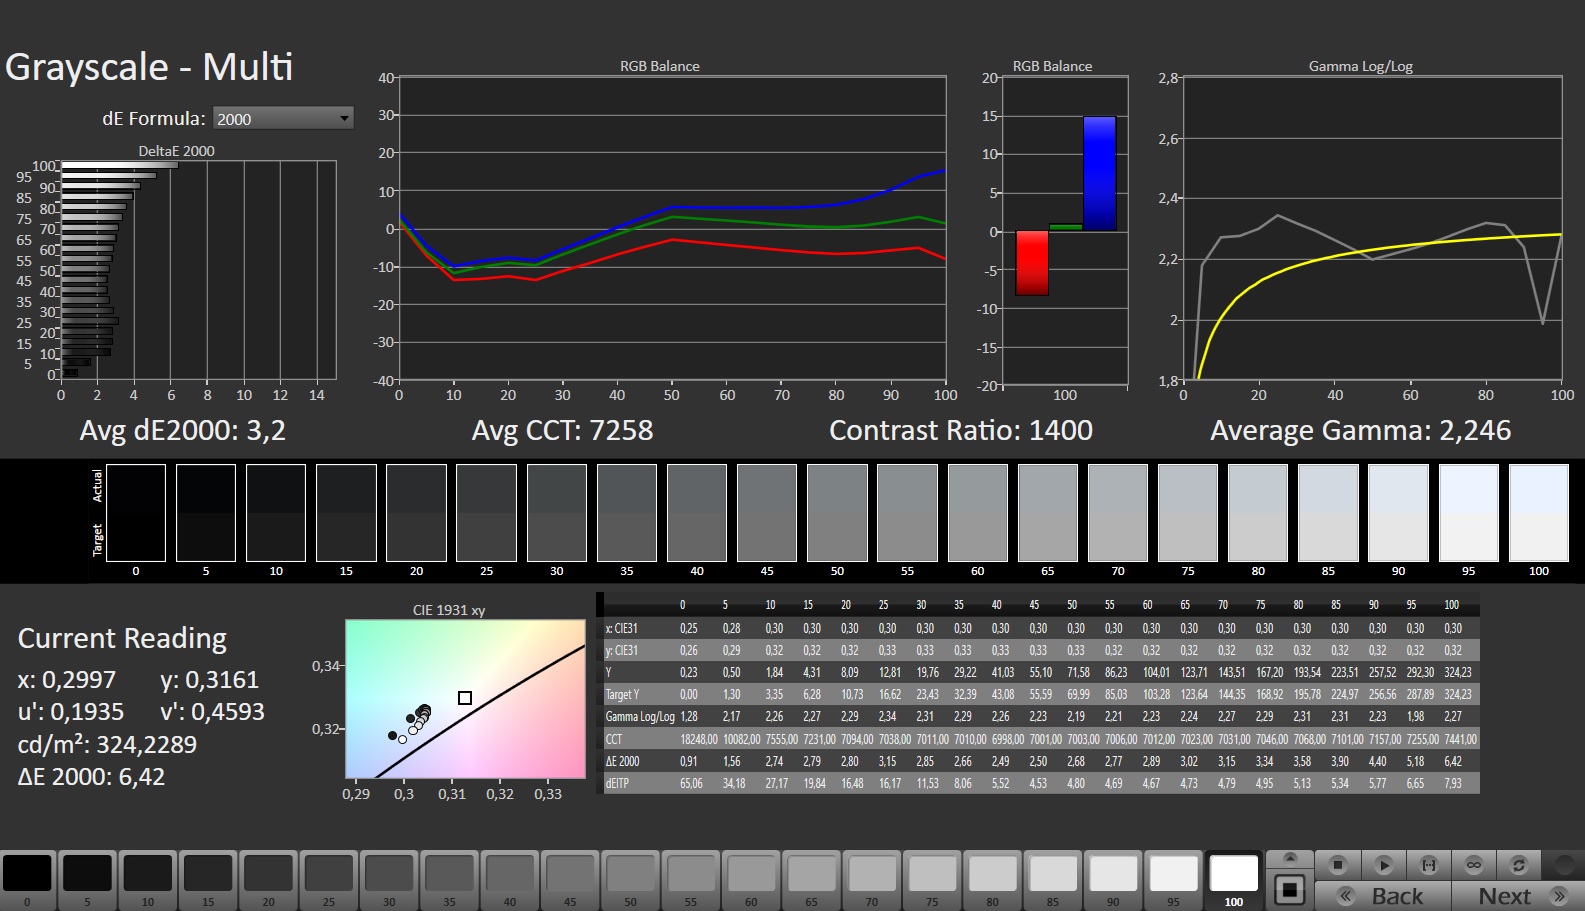
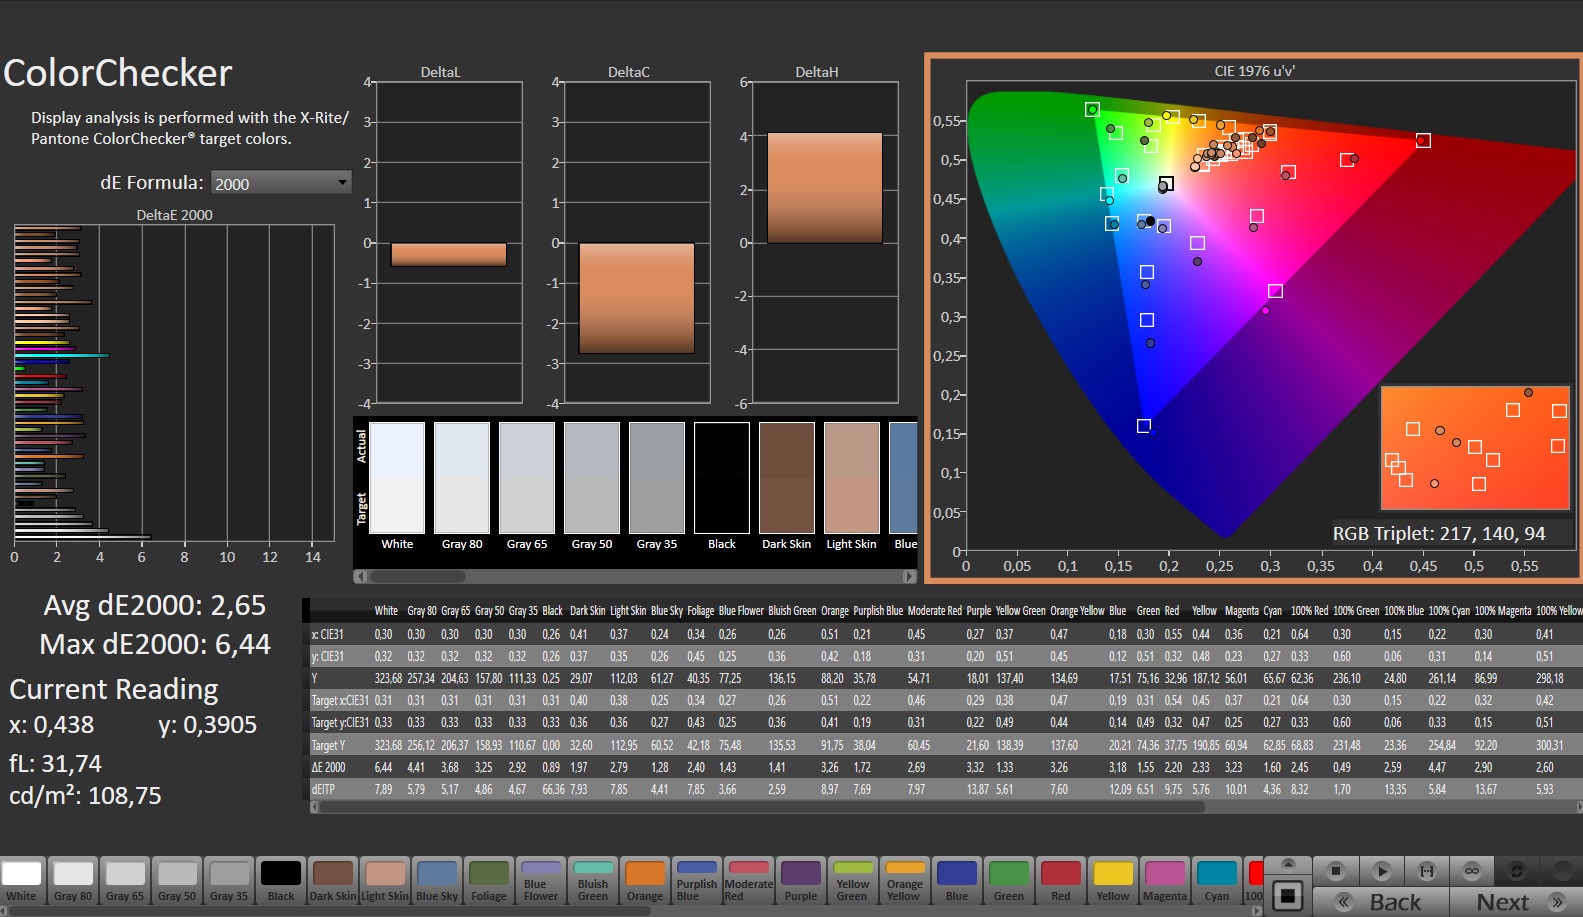
Medion ha equipado el E20 con un panel de 144 Hz muy sensible en formato 16:9 que no muestra parpadeo PWM en ningún nivel de brillo. El brillo y el contraste de la pantalla mate de 17,3 pulgadas (1.920 x 1.080 píxeles) cumplen sus requisitos de >300 cd/m² y 1.000:1 respectivamente.
| |||||||||||||||||||||||||
iluminación: 91 %
Brillo con batería: 312 cd/m²
Contraste: 1248:1 (Negro: 0.25 cd/m²)
ΔE ColorChecker Calman: 2.65 | ∀{0.5-29.43 Ø4.71}
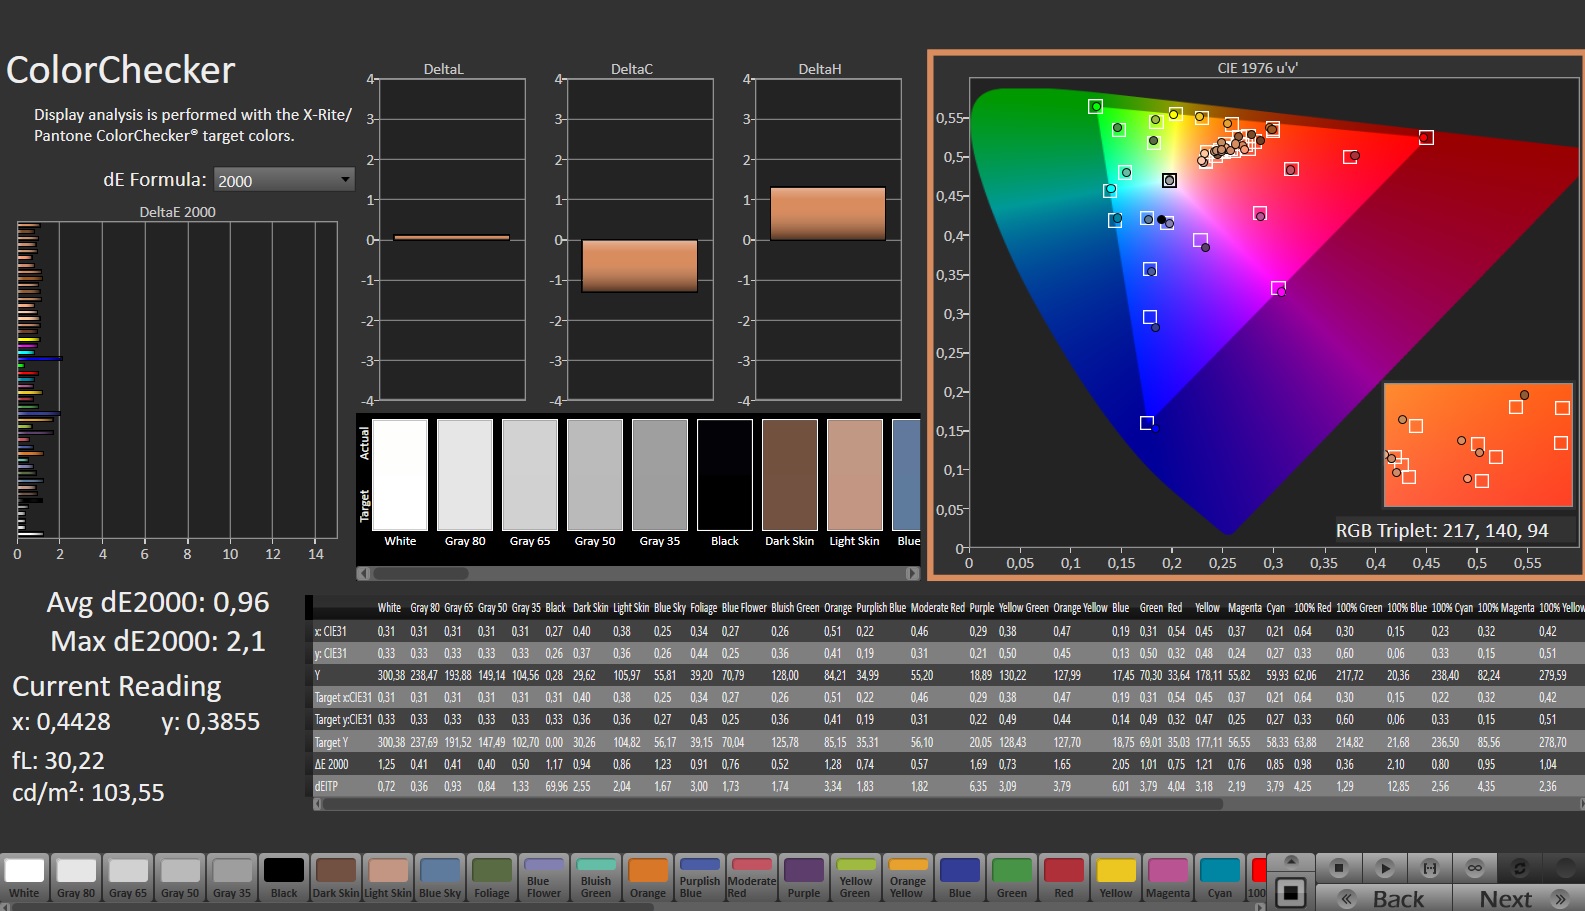
calibrated: 0.96
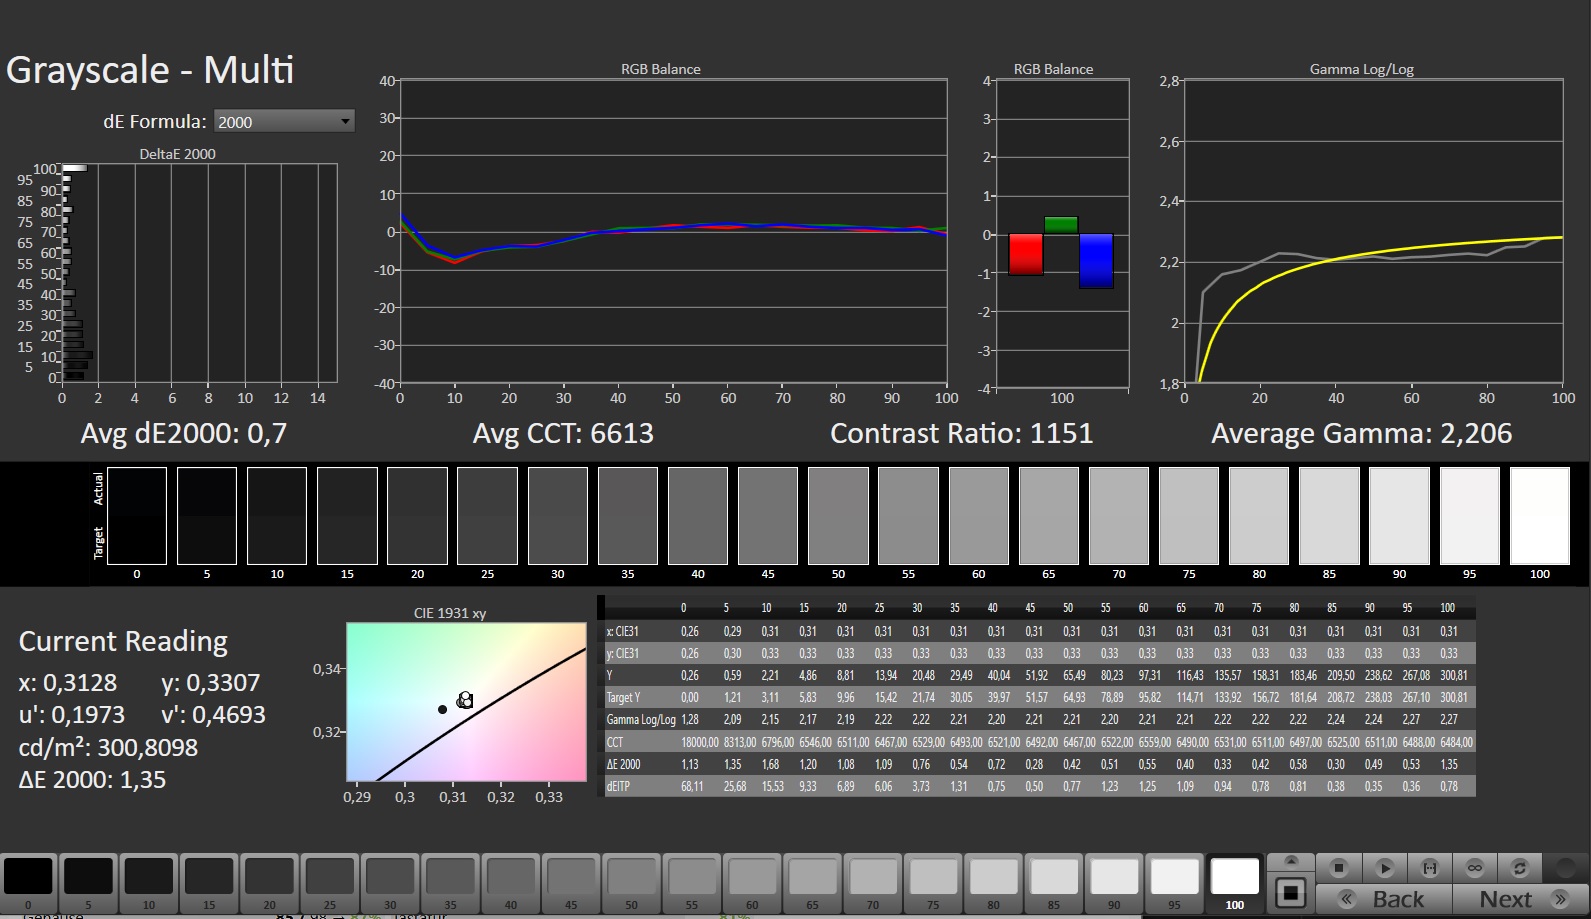
ΔE Greyscale Calman: 3.2 | ∀{0.09-98 Ø4.96}
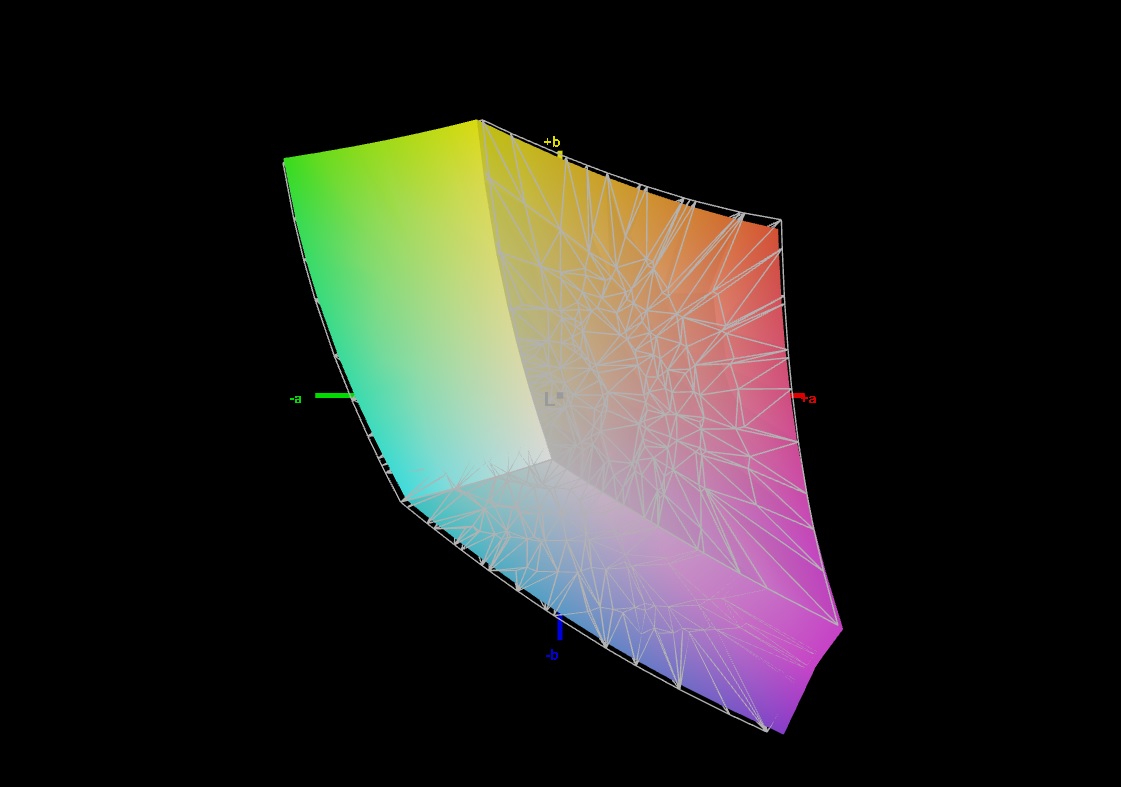
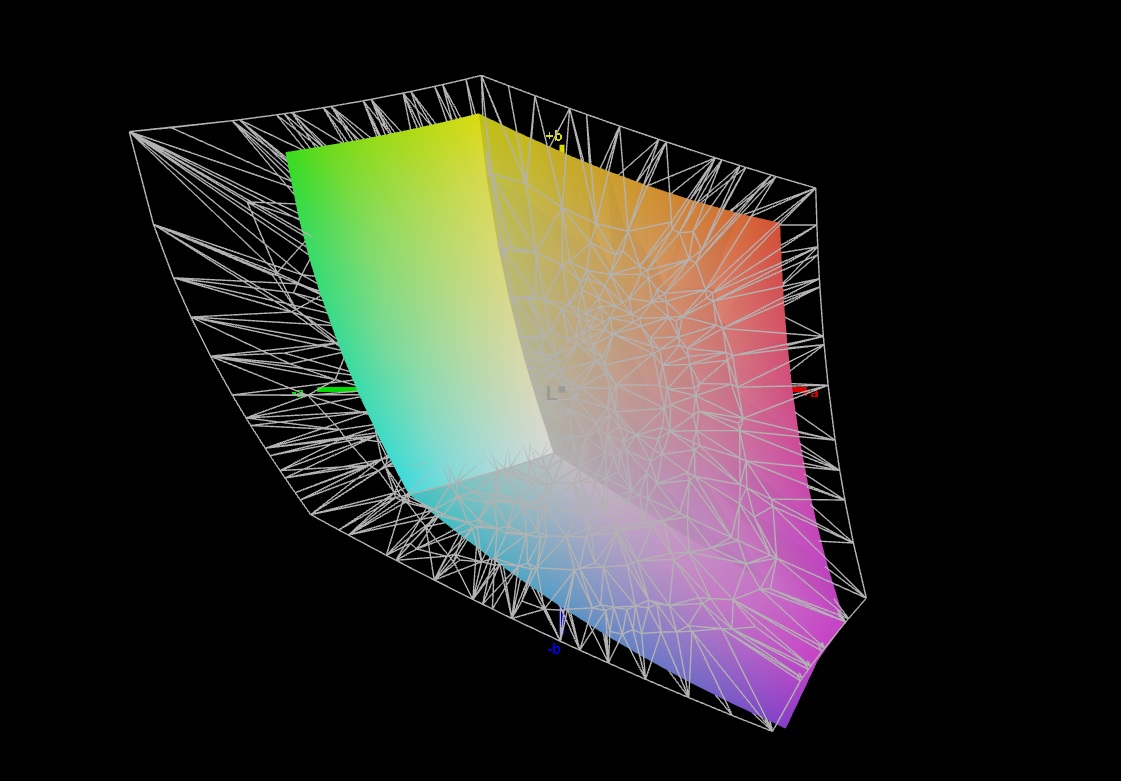
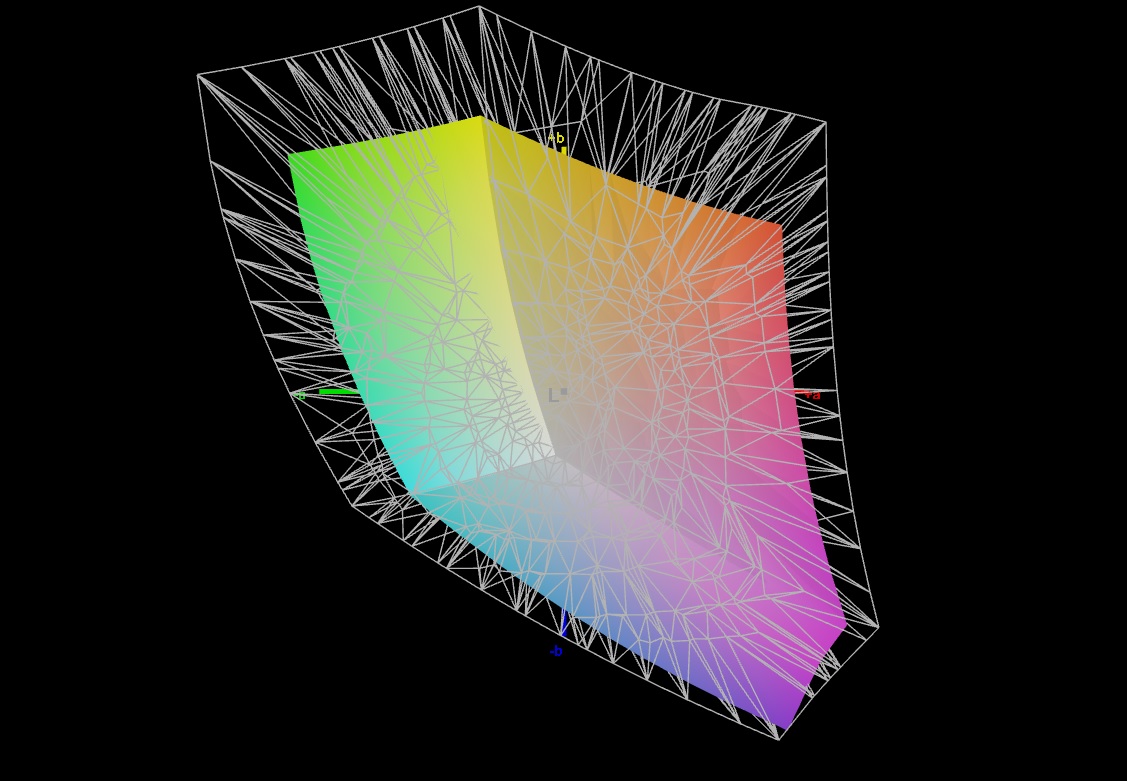
66.5% AdobeRGB 1998 (Argyll 3D)
96.7% sRGB (Argyll 3D)
65.1% Display P3 (Argyll 3D)
Gamma: 2.246
CCT: 7258 K
| Medion Erazer Scout E20 LG Philips LGD0611, IPS, 1920x1080, 17.3" | Gigabyte G7 KE AU Optronics B173HAN05.1, IPS, 1920x1080, 17.3" | MSI Katana 17 B13VFK B173HAN04.9, IPS LED, 1920x1080, 17.3" | Asus TUF Gaming A16 FA617 NE160WUM-NX2 (BOE0B33), IPS-Level, 1920x1200, 16" | Lenovo Legion 5 15IAH7H 82RB CSOT MNF601CA1-3, IPS, 1920x1080, 15.6" | Acer Nitro 5 AN515-46-R1A1 AU Optronics B156HAN12.H, IPS, 1920x1080, 15.6" | |
|---|---|---|---|---|---|---|
| Display | 6% | -37% | 5% | 5% | 4% | |
| Display P3 Coverage (%) | 65.1 | 70.4 8% | 40.8 -37% | 69.4 7% | 69.1 6% | 68.8 6% |
| sRGB Coverage (%) | 96.7 | 99.8 3% | 61 -37% | 97.8 1% | 99.5 3% | 98.1 1% |
| AdobeRGB 1998 Coverage (%) | 66.5 | 71.7 8% | 42.2 -37% | 70.9 7% | 70 5% | 69.7 5% |
| Response Times | 43% | -137% | -6% | -8% | 18% | |
| Response Time Grey 50% / Grey 80% * (ms) | 14.8 ? | 5 ? 66% | 33 ? -123% | 17 ? -15% | 14.8 ? -0% | 13 ? 12% |
| Response Time Black / White * (ms) | 10.4 ? | 8.3 ? 20% | 26 ? -150% | 10.1 ? 3% | 12 ? -15% | 8 ? 23% |
| PWM Frequency (Hz) | ||||||
| Screen | 16% | -69% | 15% | -21% | -8% | |
| Brightness middle (cd/m²) | 312 | 307 -2% | 267 -14% | 308 -1% | 363.5 17% | 327 5% |
| Brightness (cd/m²) | 303 | 301 -1% | 256 -16% | 293 -3% | 350 16% | 320 6% |
| Brightness Distribution (%) | 91 | 93 2% | 93 2% | 90 -1% | 89 -2% | 93 2% |
| Black Level * (cd/m²) | 0.25 | 0.2 20% | 0.21 16% | 0.23 8% | 0.39 -56% | 0.24 4% |
| Contrast (:1) | 1248 | 1535 23% | 1271 2% | 1339 7% | 932 -25% | 1363 9% |
| Colorchecker dE 2000 * | 2.65 | 1.32 50% | 4.7 -77% | 1.47 45% | 3.68 -39% | 3.26 -23% |
| Colorchecker dE 2000 max. * | 6.44 | 4.6 29% | 20.4 -217% | 2.98 54% | 8.92 -39% | 8.73 -36% |
| Colorchecker dE 2000 calibrated * | 0.96 | 1.03 -7% | 4.5 -369% | 1.02 -6% | 0.53 45% | 0.87 9% |
| Greyscale dE 2000 * | 3.2 | 2.1 34% | 1.5 53% | 2.2 31% | 6.5 -103% | 4.87 -52% |
| Gamma | 2.246 98% | 2.247 98% | 2.12 104% | 2.228 99% | 2.2 100% | 2.3 96% |
| CCT | 7258 90% | 6815 95% | 6552 99% | 6228 104% | 5995 108% | 7070 92% |
| Media total (Programa/Opciones) | 22% /
18% | -81% /
-72% | 5% /
10% | -8% /
-13% | 5% /
-2% |
* ... más pequeño es mejor
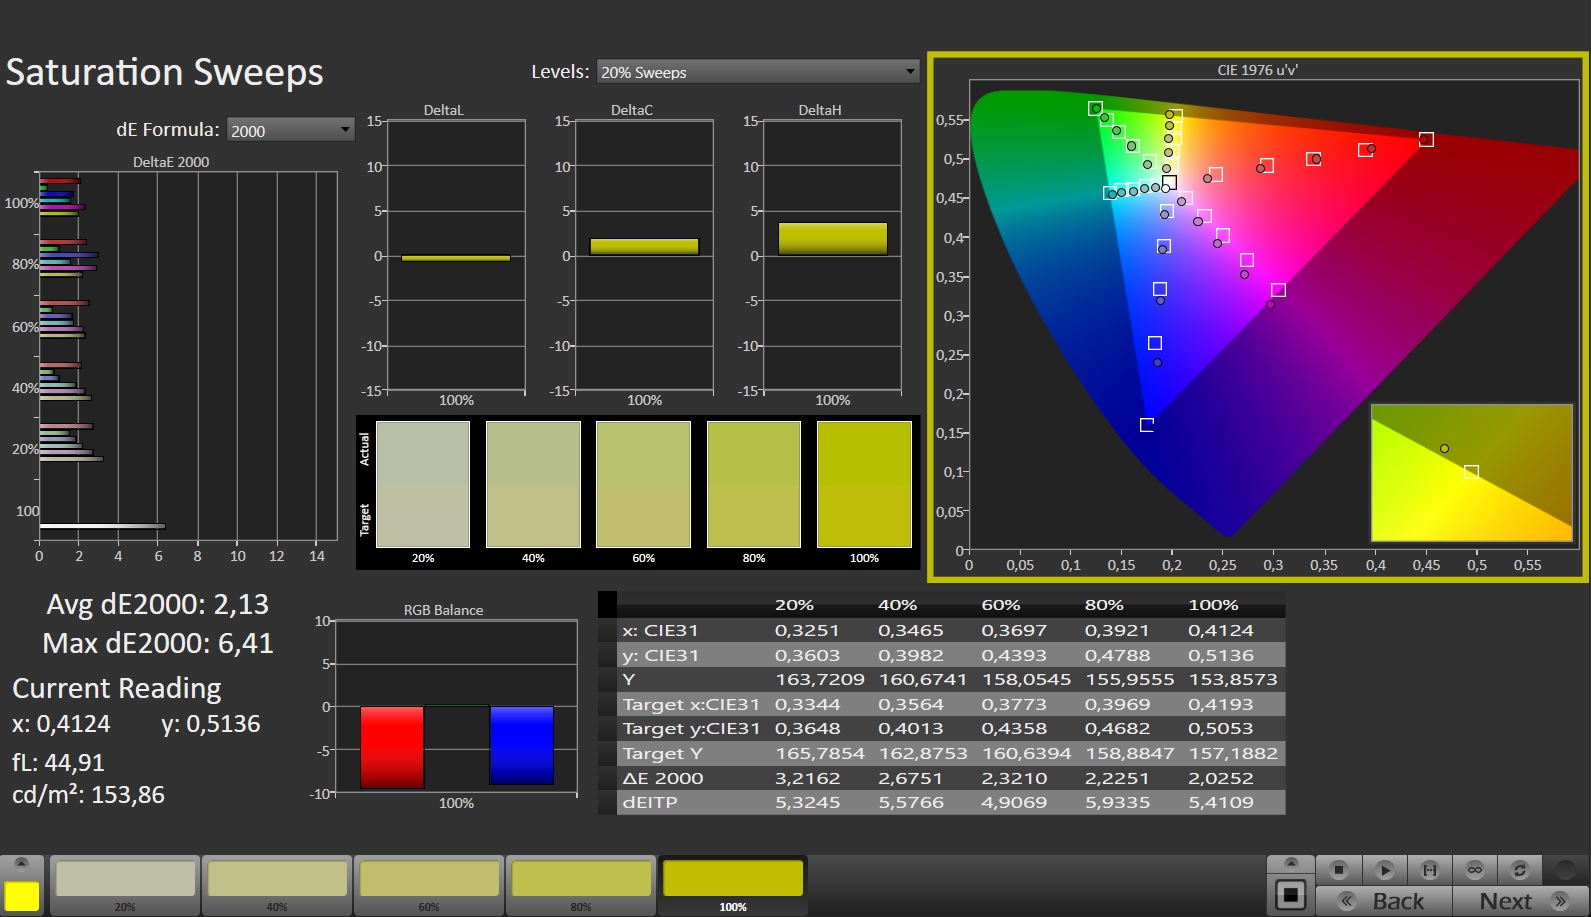
La pantalla muestra una buena reproducción del color ya en el estado de entrega, y con una desviación de aproximadamente 2,65, se cumple el objetivo de DeltaE < 3. Una calibración adicional reduce la desviación a 0,96 y garantiza una escala de grises más equilibrada.
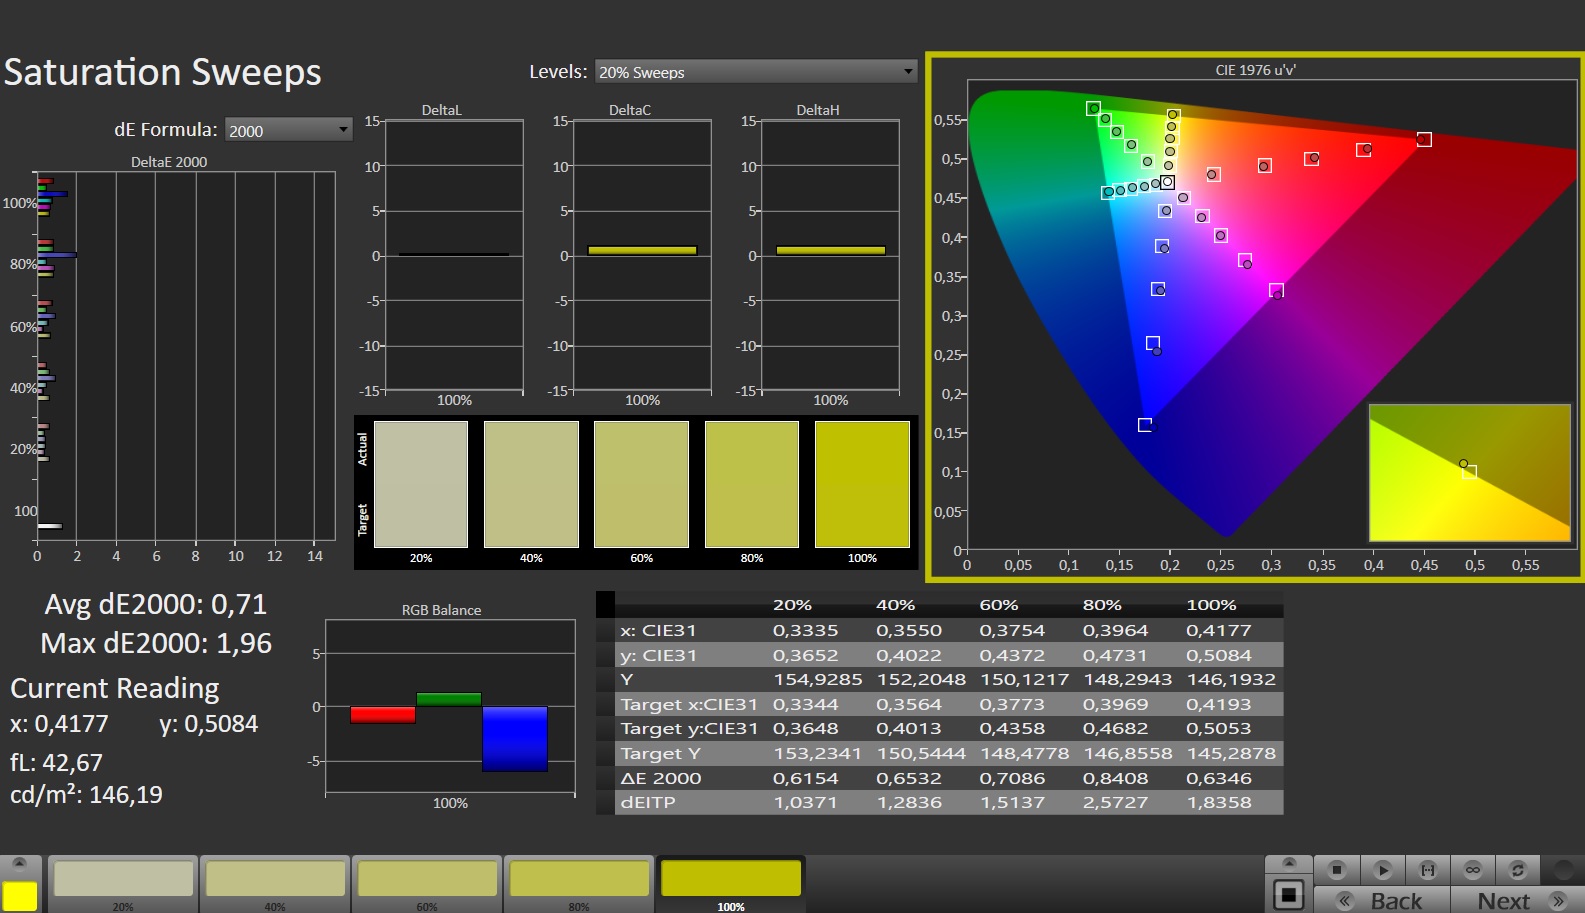
El panel es capaz de cubrir completamente el espacio de color sRGB, pero no los espacios de color AdobeRGB y DCI-P3. Las pantallas de la mayoría de los competidores muestran cualidades similares.
Tiempos de respuesta del display
| ↔ Tiempo de respuesta de Negro a Blanco | ||
|---|---|---|
| 10.4 ms ... subida ↗ y bajada ↘ combinada | ↗ 5.4 ms subida | 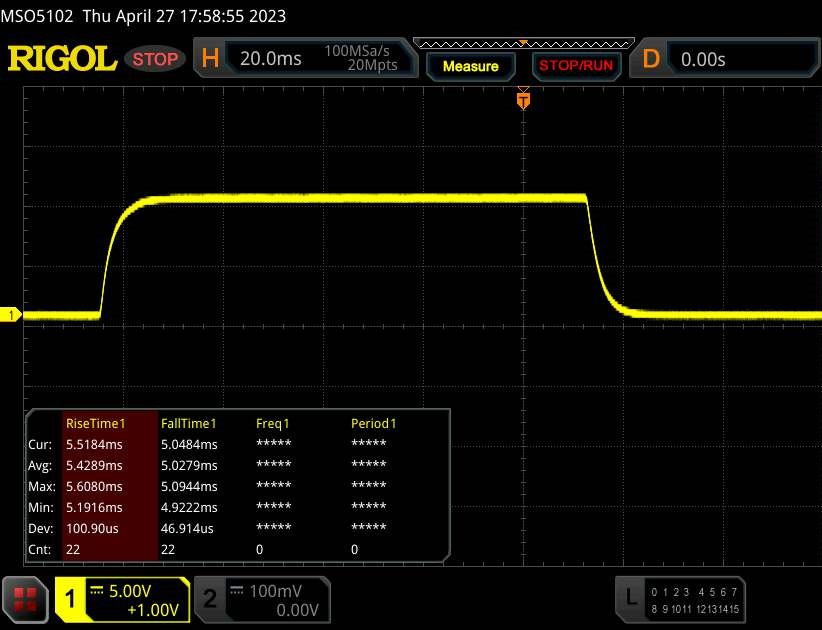 |
| ↘ 5 ms bajada | ||
| La pantalla mostró buenos tiempos de respuesta en nuestros tests pero podría ser demasiado lenta para los jugones competitivos. En comparación, todos los dispositivos de prueba van de ##min### (mínimo) a 240 (máximo) ms. » 28 % de todos los dispositivos son mejores. Esto quiere decir que el tiempo de respuesta medido es mejor que la media (19.8 ms) de todos los dispositivos testados. | ||
| ↔ Tiempo de respuesta 50% Gris a 80% Gris | ||
| 14.8 ms ... subida ↗ y bajada ↘ combinada | ↗ 7.2 ms subida | 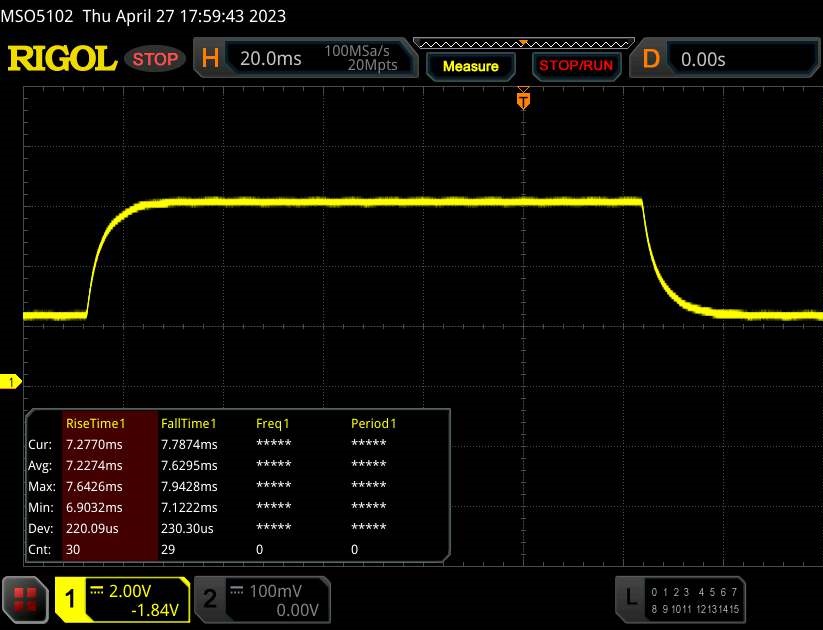 |
| ↘ 7.6 ms bajada | ||
| La pantalla mostró buenos tiempos de respuesta en nuestros tests pero podría ser demasiado lenta para los jugones competitivos. En comparación, todos los dispositivos de prueba van de ##min### (mínimo) a 636 (máximo) ms. » 29 % de todos los dispositivos son mejores. Esto quiere decir que el tiempo de respuesta medido es mejor que la media (31 ms) de todos los dispositivos testados. | ||
Parpadeo de Pantalla / PWM (Pulse-Width Modulation)
| Parpadeo de Pantalla / PWM no detectado | 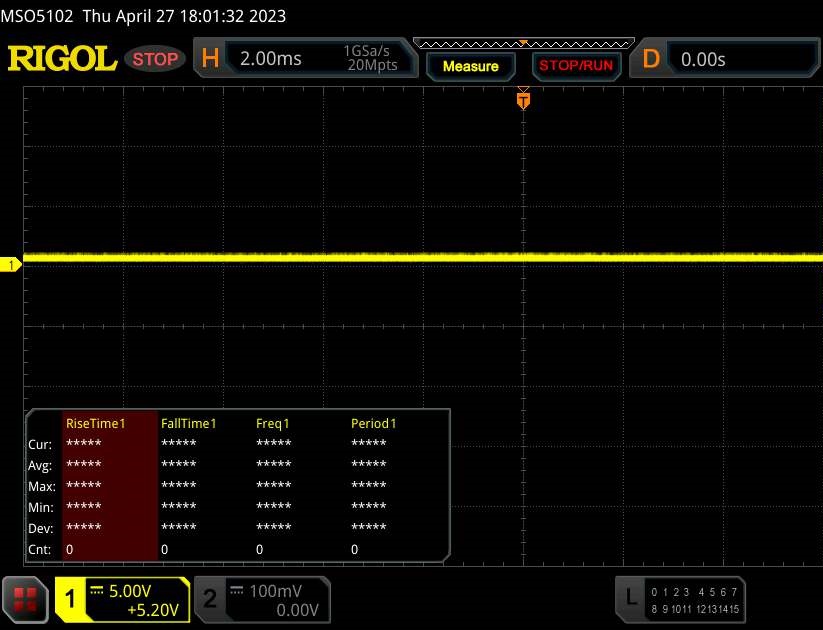 | ||
Comparación: 52 % de todos los dispositivos testados no usaron PWM para atenuar el display. Si se usó, medimos una media de 7754 (mínimo: 5 - máxmo: 343500) Hz. | |||
El panel IPS tiene ángulos de visión estables y se puede leer desde cualquier posición. En exteriores, puedes leer el contenido de la pantalla cuando la luz solar no es demasiado intensa.

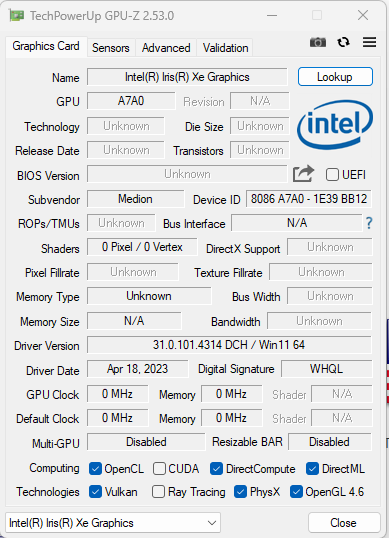
Rendimiento - El explorador utiliza Raptor Lake y Ada Lovelace
El Erazer Scout E20 es un portátil para juegos del segmento básico. El rendimiento informático necesario lo ofrecen los chips Raptor Lake y Ada Lovelace. Nuestra unidad de pruebas está disponible por unos 1,500 Euros. En el momento de esta prueba, no pudimos encontrar otras configuraciones de equipo.
Condiciones de la prueba
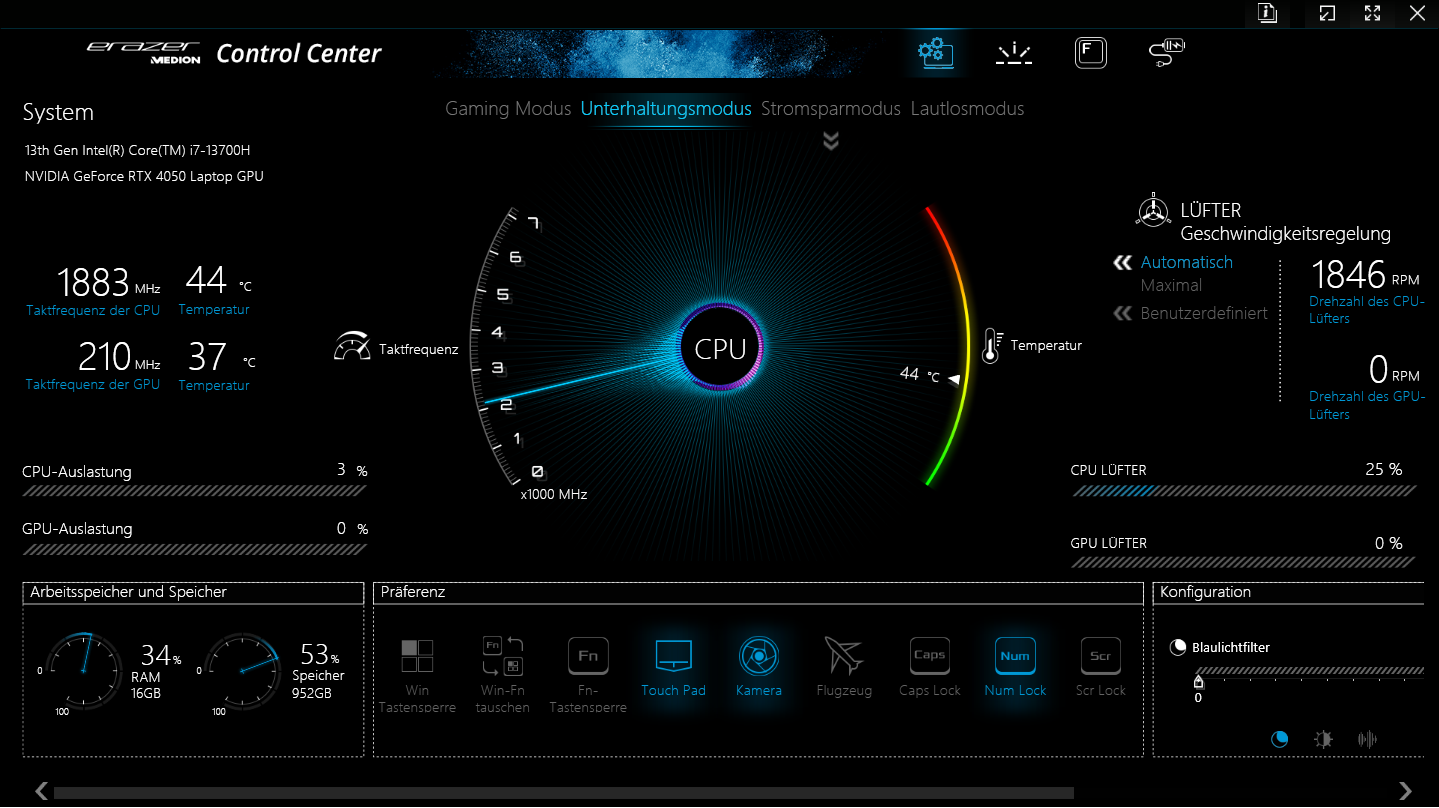
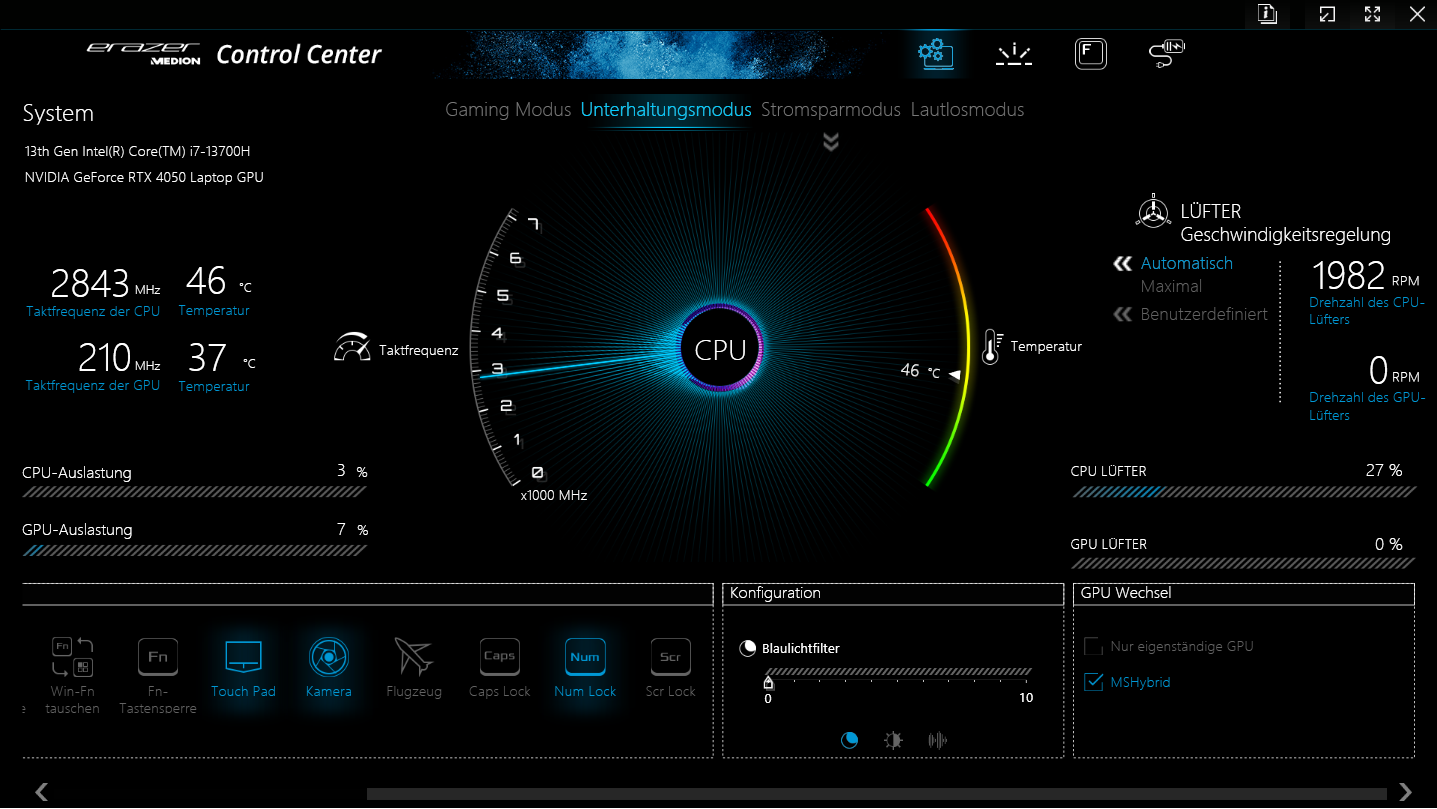
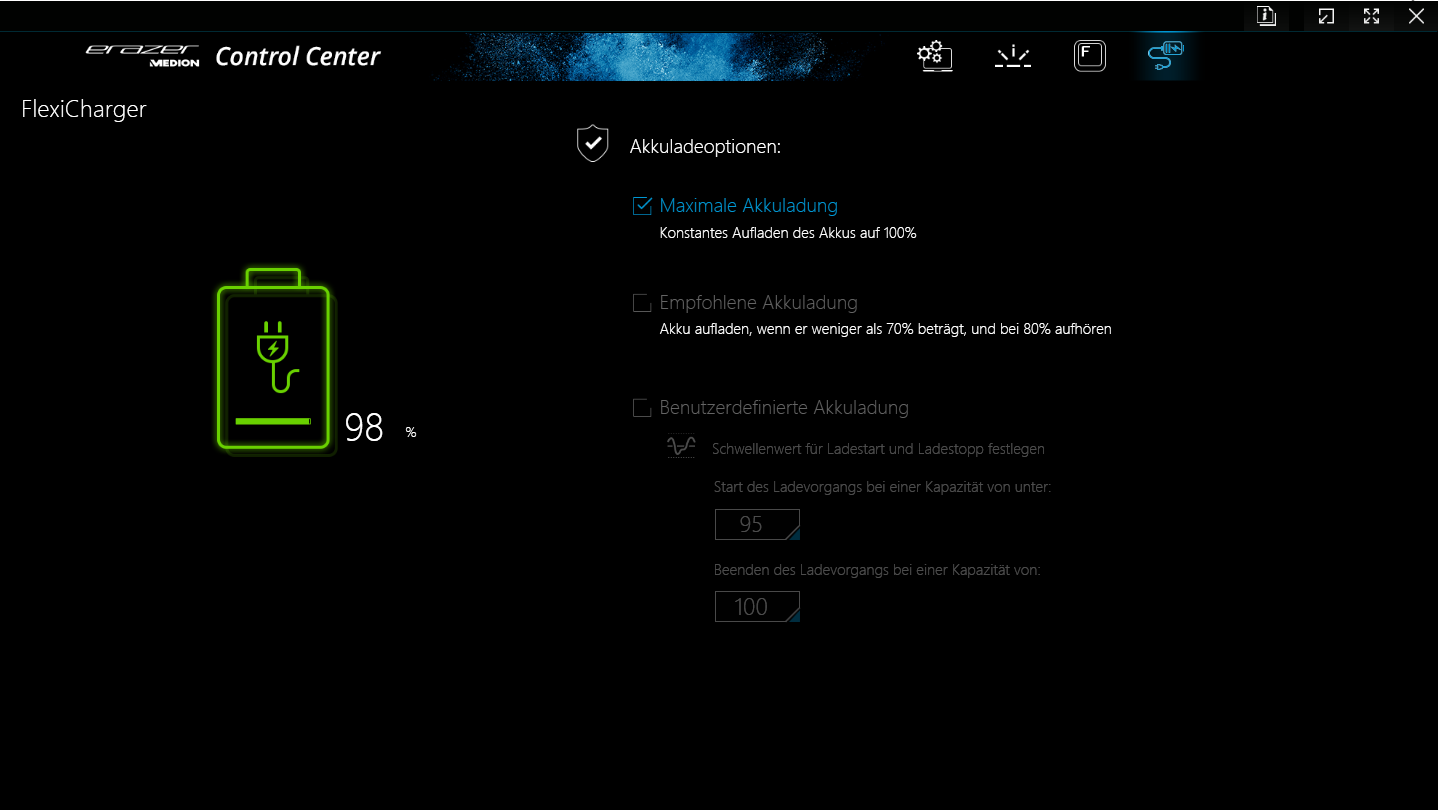
El E20 incluye cuatro modos de rendimiento específicos del fabricante (ver tabla). Puedes cambiar entre ellos usando el software Control Center, que es el centro de control del portátil. Usamos el "Modo Entretenimiento" para los benchmarks y el "Modo Ahorro de Energía" para las pruebas de batería, con Optimus activo. El modo de ahorro de energía también representa un caso especial entre los modos, ya que desactiva el núcleo gráfico GeForce.
| Modo Juego | Modo Entretenimiento | Modo Ahorro de Energía | Modo Silencio | |
|---|---|---|---|---|
| Límite de potencia 1(HWInfo) | 110 vatios | 50 vatios | 20 vatios | 15 vatios |
| Límite de potencia 2 (HWInfo) | 115 vatios | 115 vatios | 30 vatios | 30 vatios |
| Ruido (El Witcher 3 ) | 57 dB(A) | 50 dB(A) | - | 34 dB(A) |
| Rendimiento (The Witcher 3 ) | ~83 fps | ~80 fps | - | 30-50 fps |
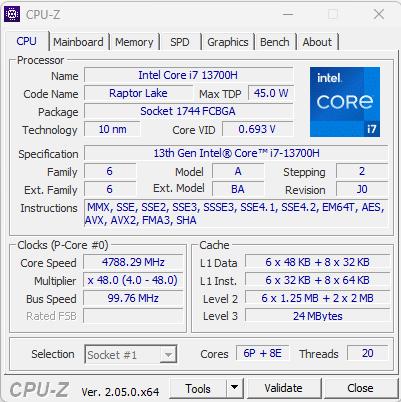
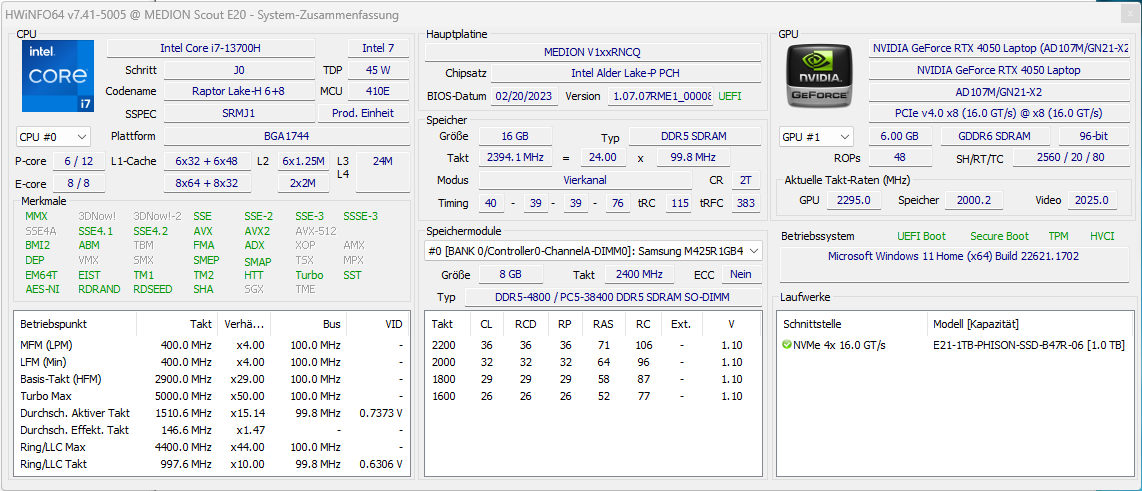
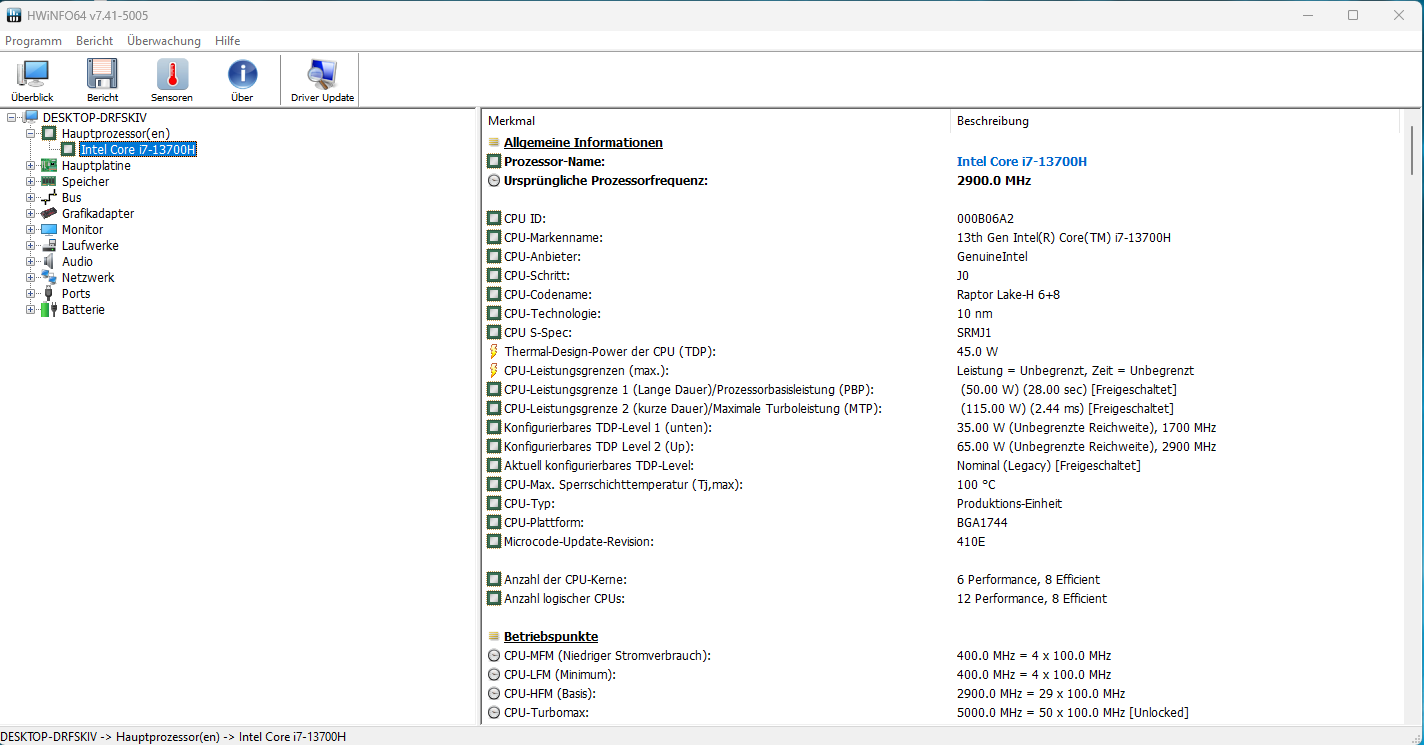
Procesador
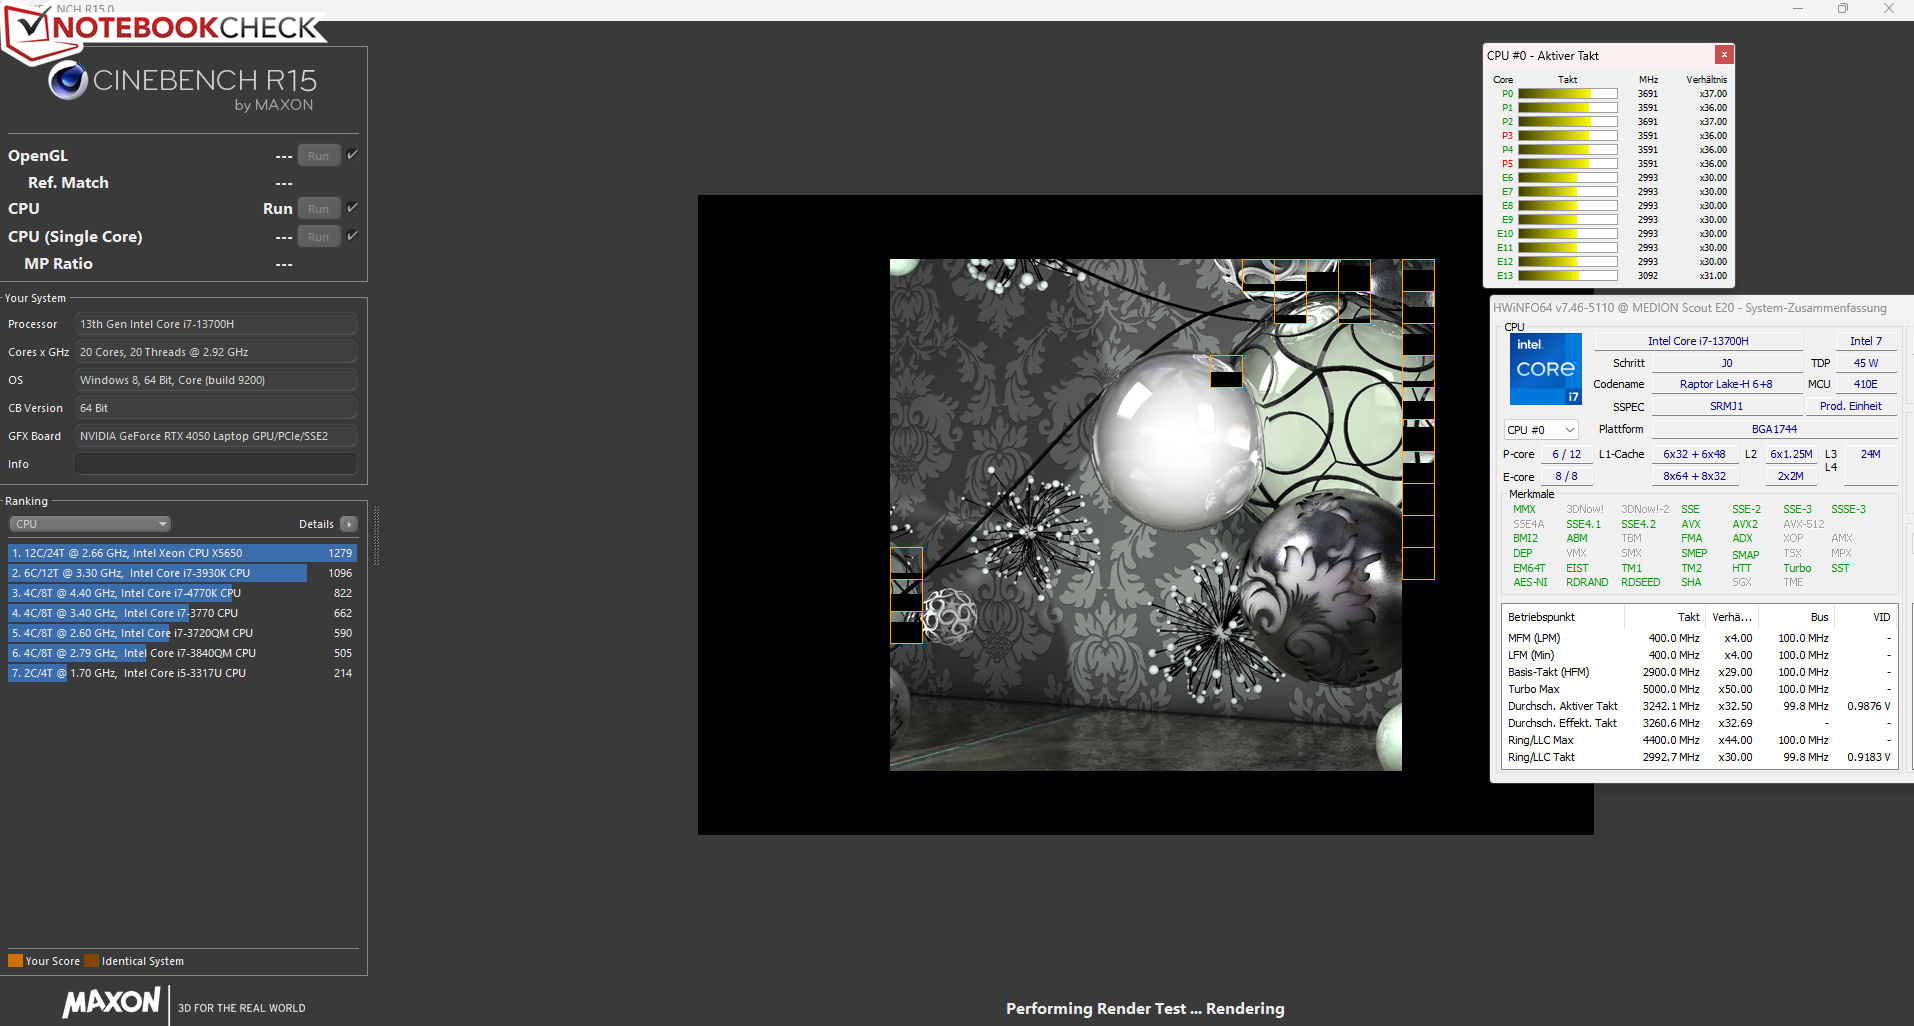
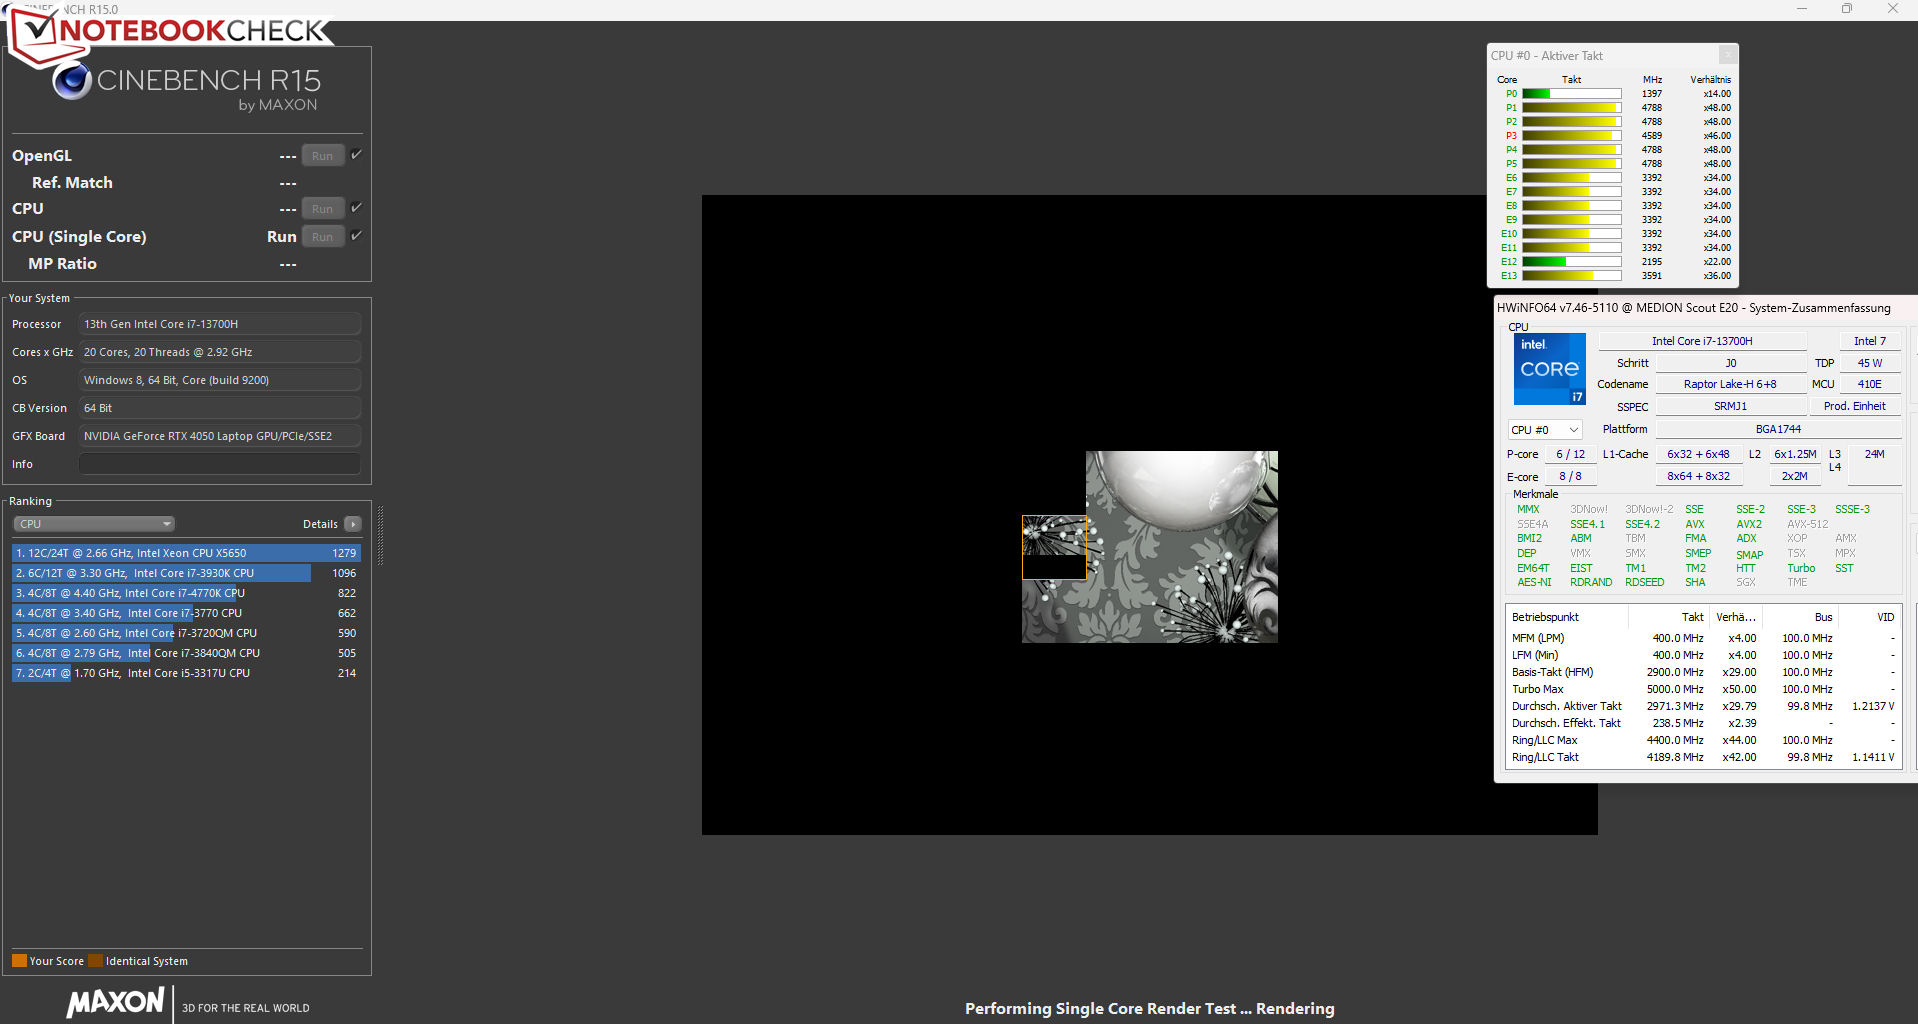
El Raptor LakeCore i7-13700Hconsta de ocho núcleos Efficiency (sin hyperthreading, de 1,8 a 3,7 GHz) y seis núcleos Performance (hyperthreading, de 2,4 a 5 GHz), lo que da un total de 20 núcleos lógicos de CPU.
Los benchmarks ofrecen resultados por encima (modo Juego, modo Entretenimiento) y por debajo (otros modos) de la media actual de la CPU hasta ahora. El rendimiento más relevante de un solo hilo (170 puntos) se reduce menos en funcionamiento en batería que el rendimiento multihilo (1.335 puntos).
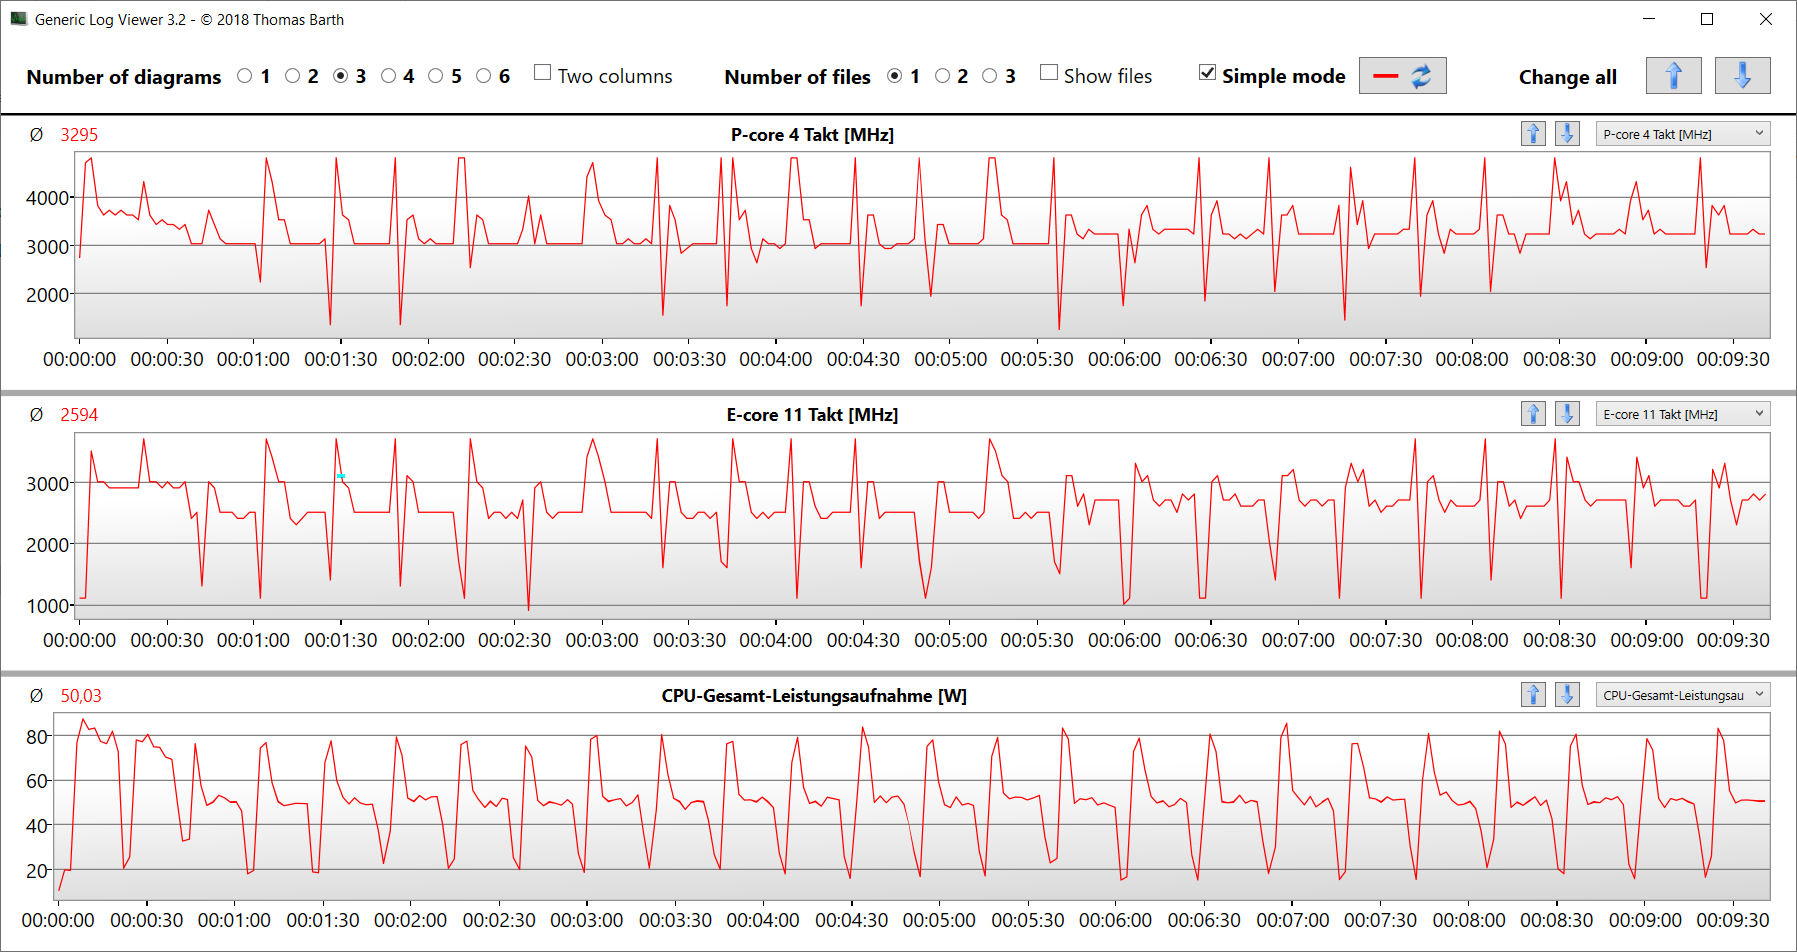
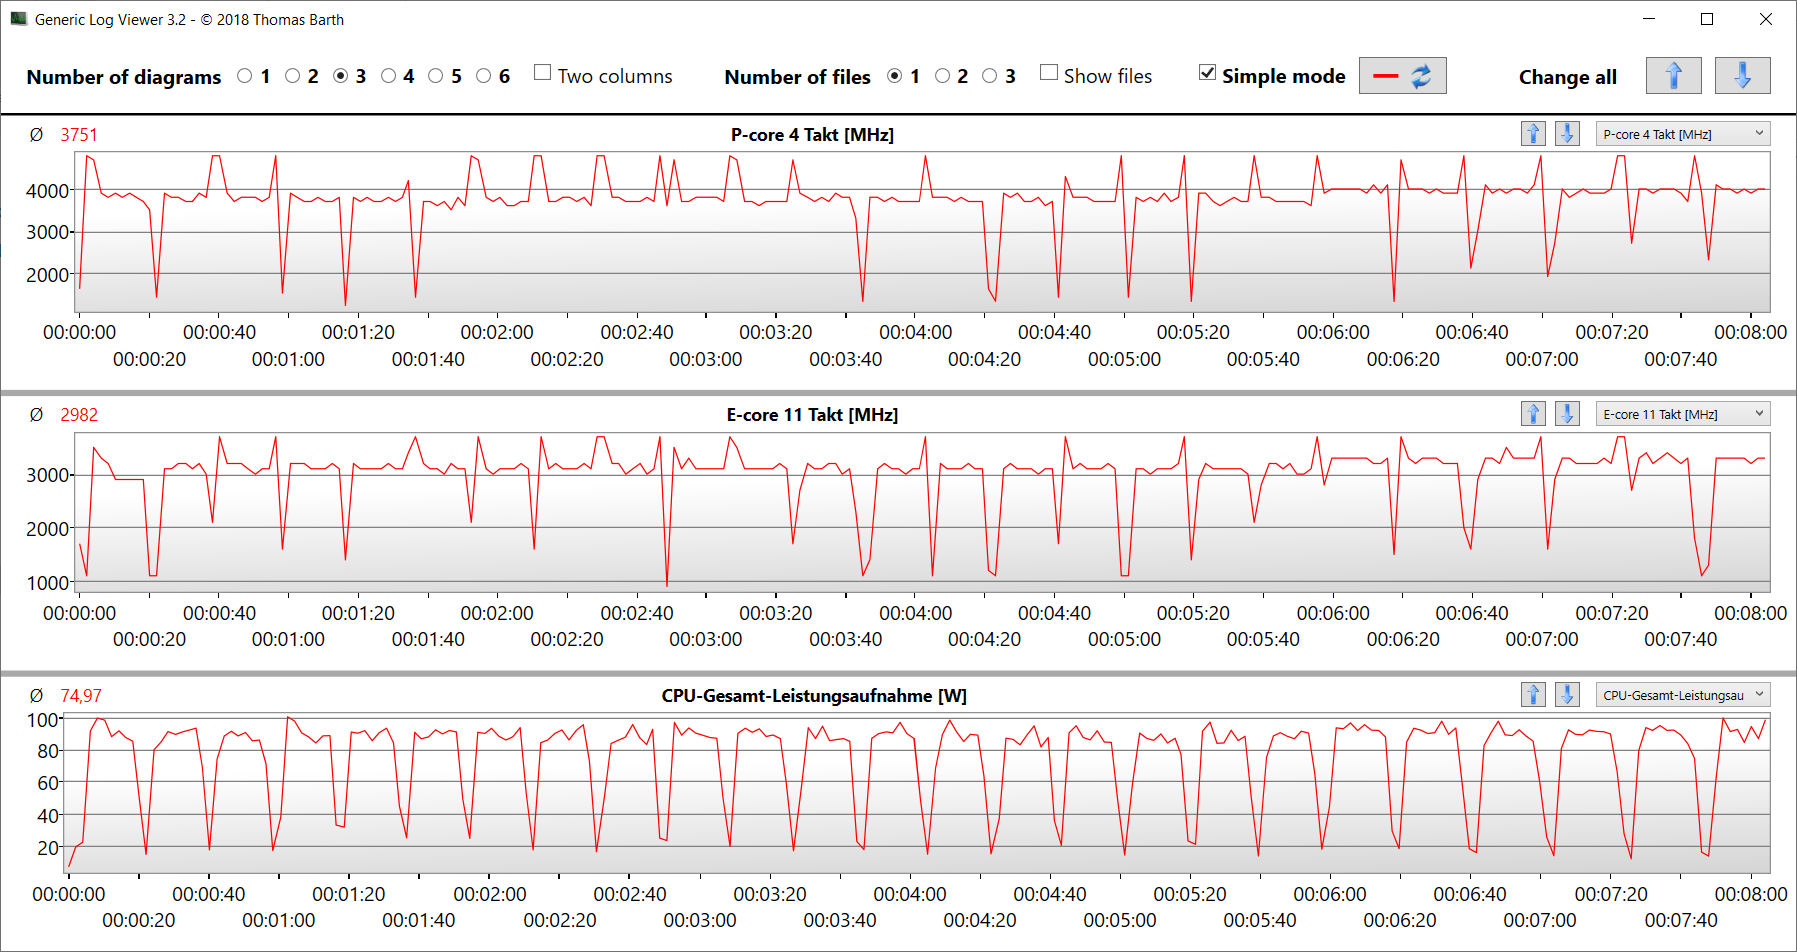
La prueba de bucle CB15 muestra que una carga multihilo constante hace que la velocidad Turbo caiga de la primera a la tercera ejecución. Después de eso, se puede mantener un nivel constante - al menos durante un tiempo. El modo Gaming asegura una velocidad de reloj constante más alta.
Cinebench R15 Multi Constant Load Test
| CPU Performance rating - Percent | |
| Media de la clase Gaming | |
| Lenovo Legion 5 15IAH7H 82RB | |
| Medion Erazer Scout E20 | |
| Medion Erazer Scout E20 | |
| Medio Intel Core i7-13700H | |
| MSI Katana 17 B13VFK | |
| Gigabyte G7 KE | |
| Asus TUF Gaming A16 FA617 | |
| Acer Nitro 5 AN515-46-R1A1 | |
| Medion Erazer Scout E20 | |
| Cinebench R23 | |
| Multi Core | |
| Media de la clase Gaming (10488 - 42661, n=107, últimos 2 años) | |
| Lenovo Legion 5 15IAH7H 82RB | |
| Medion Erazer Scout E20 (Gaming Modus) | |
| Medion Erazer Scout E20 | |
| MSI Katana 17 B13VFK | |
| Medio Intel Core i7-13700H (5890 - 20034, n=29) | |
| Gigabyte G7 KE | |
| Asus TUF Gaming A16 FA617 | |
| Acer Nitro 5 AN515-46-R1A1 | |
| Medion Erazer Scout E20 (Lautlosmodus) | |
| Single Core | |
| Media de la clase Gaming (1166 - 2415, n=107, últimos 2 años) | |
| Medion Erazer Scout E20 (Gaming Modus) | |
| Medion Erazer Scout E20 | |
| Lenovo Legion 5 15IAH7H 82RB | |
| MSI Katana 17 B13VFK | |
| Medio Intel Core i7-13700H (1323 - 1914, n=29) | |
| Gigabyte G7 KE | |
| Asus TUF Gaming A16 FA617 | |
| Acer Nitro 5 AN515-46-R1A1 | |
| Medion Erazer Scout E20 (Lautlosmodus) | |
| Cinebench R20 | |
| CPU (Multi Core) | |
| Media de la clase Gaming (4029 - 16433, n=106, últimos 2 años) | |
| Lenovo Legion 5 15IAH7H 82RB | |
| Medion Erazer Scout E20 (Gaming Modus) | |
| Medion Erazer Scout E20 | |
| MSI Katana 17 B13VFK | |
| Medio Intel Core i7-13700H (2322 - 7674, n=29) | |
| Asus TUF Gaming A16 FA617 | |
| Gigabyte G7 KE | |
| Acer Nitro 5 AN515-46-R1A1 | |
| Medion Erazer Scout E20 (Lautlosmodus) | |
| CPU (Single Core) | |
| Media de la clase Gaming (442 - 913, n=106, últimos 2 años) | |
| Medion Erazer Scout E20 | |
| Medion Erazer Scout E20 (Gaming Modus) | |
| Lenovo Legion 5 15IAH7H 82RB | |
| Medio Intel Core i7-13700H (508 - 741, n=29) | |
| MSI Katana 17 B13VFK | |
| Gigabyte G7 KE | |
| Asus TUF Gaming A16 FA617 | |
| Acer Nitro 5 AN515-46-R1A1 | |
| Medion Erazer Scout E20 (Lautlosmodus) | |
| Cinebench R15 | |
| CPU Multi 64Bit | |
| Media de la clase Gaming (1578 - 6330, n=105, últimos 2 años) | |
| Lenovo Legion 5 15IAH7H 82RB | |
| Medion Erazer Scout E20 (Gaming Modus) | |
| Medion Erazer Scout E20 | |
| Medio Intel Core i7-13700H (905 - 2982, n=29) | |
| MSI Katana 17 B13VFK | |
| Asus TUF Gaming A16 FA617 | |
| Acer Nitro 5 AN515-46-R1A1 | |
| Gigabyte G7 KE | |
| Medion Erazer Scout E20 (Lautlosmodus) | |
| CPU Single 64Bit | |
| Media de la clase Gaming (188.8 - 350, n=106, últimos 2 años) | |
| Medion Erazer Scout E20 | |
| Medion Erazer Scout E20 (Gaming Modus) | |
| Lenovo Legion 5 15IAH7H 82RB | |
| Medio Intel Core i7-13700H (213 - 278, n=29) | |
| MSI Katana 17 B13VFK | |
| Gigabyte G7 KE | |
| Acer Nitro 5 AN515-46-R1A1 | |
| Asus TUF Gaming A16 FA617 | |
| Medion Erazer Scout E20 (Lautlosmodus) | |
| Blender - v2.79 BMW27 CPU | |
| Medion Erazer Scout E20 (Lautlosmodus) | |
| Acer Nitro 5 AN515-46-R1A1 | |
| Medio Intel Core i7-13700H (169 - 555, n=29) | |
| Gigabyte G7 KE | |
| Asus TUF Gaming A16 FA617 | |
| MSI Katana 17 B13VFK | |
| Medion Erazer Scout E20 | |
| Medion Erazer Scout E20 (Gaming Modus) | |
| Lenovo Legion 5 15IAH7H 82RB | |
| Media de la clase Gaming (79 - 330, n=104, últimos 2 años) | |
| 7-Zip 18.03 | |
| 7z b 4 | |
| Media de la clase Gaming (33491 - 148086, n=105, últimos 2 años) | |
| Lenovo Legion 5 15IAH7H 82RB | |
| Medion Erazer Scout E20 (Gaming Modus) | |
| Medion Erazer Scout E20 | |
| MSI Katana 17 B13VFK | |
| Acer Nitro 5 AN515-46-R1A1 | |
| Asus TUF Gaming A16 FA617 | |
| Medio Intel Core i7-13700H (27322 - 76344, n=29) | |
| Gigabyte G7 KE | |
| Medion Erazer Scout E20 (Lautlosmodus) | |
| 7z b 4 -mmt1 | |
| Media de la clase Gaming (4199 - 7436, n=105, últimos 2 años) | |
| Medion Erazer Scout E20 | |
| Medion Erazer Scout E20 (Gaming Modus) | |
| Medio Intel Core i7-13700H (4825 - 6238, n=29) | |
| Lenovo Legion 5 15IAH7H 82RB | |
| Asus TUF Gaming A16 FA617 | |
| MSI Katana 17 B13VFK | |
| Acer Nitro 5 AN515-46-R1A1 | |
| Gigabyte G7 KE | |
| Medion Erazer Scout E20 (Lautlosmodus) | |
| Geekbench 5.5 | |
| Multi-Core | |
| Media de la clase Gaming (6460 - 28263, n=105, últimos 2 años) | |
| Lenovo Legion 5 15IAH7H 82RB | |
| Medion Erazer Scout E20 (Gaming Modus) | |
| Medion Erazer Scout E20 | |
| Medio Intel Core i7-13700H (6165 - 14215, n=29) | |
| MSI Katana 17 B13VFK | |
| Gigabyte G7 KE | |
| Asus TUF Gaming A16 FA617 | |
| Acer Nitro 5 AN515-46-R1A1 | |
| Medion Erazer Scout E20 (Lautlosmodus) | |
| Single-Core | |
| Media de la clase Gaming (986 - 2474, n=105, últimos 2 años) | |
| Medion Erazer Scout E20 (Gaming Modus) | |
| Medion Erazer Scout E20 | |
| Medio Intel Core i7-13700H (1362 - 1919, n=29) | |
| MSI Katana 17 B13VFK | |
| Lenovo Legion 5 15IAH7H 82RB | |
| Gigabyte G7 KE | |
| Medion Erazer Scout E20 (Lautlosmodus) | |
| Asus TUF Gaming A16 FA617 | |
| Acer Nitro 5 AN515-46-R1A1 | |
| HWBOT x265 Benchmark v2.2 - 4k Preset | |
| Media de la clase Gaming (11.5 - 44.4, n=105, últimos 2 años) | |
| Lenovo Legion 5 15IAH7H 82RB | |
| Medion Erazer Scout E20 (Gaming Modus) | |
| Asus TUF Gaming A16 FA617 | |
| MSI Katana 17 B13VFK | |
| Medion Erazer Scout E20 | |
| Acer Nitro 5 AN515-46-R1A1 | |
| Gigabyte G7 KE | |
| Medio Intel Core i7-13700H (6.72 - 21.2, n=29) | |
| Medion Erazer Scout E20 (Lautlosmodus) | |
| LibreOffice - 20 Documents To PDF | |
| Asus TUF Gaming A16 FA617 | |
| MSI Katana 17 B13VFK | |
| Acer Nitro 5 AN515-46-R1A1 | |
| Media de la clase Gaming (33.2 - 88.8, n=105, últimos 2 años) | |
| Medio Intel Core i7-13700H (31.3 - 62.4, n=29) | |
| Medion Erazer Scout E20 (Lautlosmodus) | |
| Gigabyte G7 KE | |
| Medion Erazer Scout E20 | |
| Medion Erazer Scout E20 (Gaming Modus) | |
| Lenovo Legion 5 15IAH7H 82RB | |
| R Benchmark 2.5 - Overall mean | |
| Medion Erazer Scout E20 (Lautlosmodus) | |
| Asus TUF Gaming A16 FA617 | |
| Acer Nitro 5 AN515-46-R1A1 | |
| Gigabyte G7 KE | |
| Medio Intel Core i7-13700H (0.4308 - 0.607, n=29) | |
| Lenovo Legion 5 15IAH7H 82RB | |
| Medion Erazer Scout E20 (Gaming Modus) | |
| Medion Erazer Scout E20 | |
| MSI Katana 17 B13VFK | |
| Media de la clase Gaming (0.3439 - 0.759, n=106, últimos 2 años) | |
* ... más pequeño es mejor
AIDA64: FP32 Ray-Trace | FPU Julia | CPU SHA3 | CPU Queen | FPU SinJulia | FPU Mandel | CPU AES | CPU ZLib | FP64 Ray-Trace | CPU PhotoWorxx
| Performance rating | |
| Media de la clase Gaming | |
| Lenovo Legion 5 15IAH7H 82RB | |
| Acer Nitro 5 AN515-46-R1A1 | |
| Asus TUF Gaming A16 FA617 | |
| Medion Erazer Scout E20 | |
| Medion Erazer Scout E20 | |
| Medio Intel Core i7-13700H | |
| Gigabyte G7 KE | |
| MSI Katana 17 B13VFK | |
| Medion Erazer Scout E20 | |
| AIDA64 / FP32 Ray-Trace | |
| Media de la clase Gaming (10227 - 85542, n=105, últimos 2 años) | |
| Lenovo Legion 5 15IAH7H 82RB (v6.75.6100) | |
| Asus TUF Gaming A16 FA617 (v6.85.6300) | |
| Medion Erazer Scout E20 (v6.75.6100, Gaming Modus) | |
| Acer Nitro 5 AN515-46-R1A1 (v6.75.6100) | |
| Medion Erazer Scout E20 (v6.75.6100) | |
| Medio Intel Core i7-13700H (4986 - 18908, n=29) | |
| MSI Katana 17 B13VFK (v6.85.6300) | |
| Gigabyte G7 KE (v6.75.6100) | |
| Medion Erazer Scout E20 (v6.75.6100, Lautlosmodus) | |
| AIDA64 / FPU Julia | |
| Media de la clase Gaming (51376 - 238426, n=105, últimos 2 años) | |
| Asus TUF Gaming A16 FA617 (v6.85.6300) | |
| Acer Nitro 5 AN515-46-R1A1 (v6.75.6100) | |
| Lenovo Legion 5 15IAH7H 82RB (v6.75.6100) | |
| Medion Erazer Scout E20 (v6.75.6100, Gaming Modus) | |
| Medion Erazer Scout E20 | |
| Medio Intel Core i7-13700H (25360 - 92359, n=29) | |
| MSI Katana 17 B13VFK (v6.85.6300) | |
| Gigabyte G7 KE (v6.75.6100) | |
| Medion Erazer Scout E20 (v6.75.6100, Lautlosmodus) | |
| AIDA64 / CPU SHA3 | |
| Media de la clase Gaming (2180 - 10115, n=105, últimos 2 años) | |
| Lenovo Legion 5 15IAH7H 82RB (v6.75.6100) | |
| Medion Erazer Scout E20 (v6.75.6100, Gaming Modus) | |
| Asus TUF Gaming A16 FA617 (v6.85.6300) | |
| Acer Nitro 5 AN515-46-R1A1 (v6.75.6100) | |
| Gigabyte G7 KE (v6.75.6100) | |
| Medion Erazer Scout E20 (v6.75.6100) | |
| Medio Intel Core i7-13700H (1339 - 4224, n=29) | |
| MSI Katana 17 B13VFK (v6.85.6300) | |
| Medion Erazer Scout E20 (v6.75.6100, Lautlosmodus) | |
| AIDA64 / CPU Queen | |
| Media de la clase Gaming (49785 - 173351, n=90, últimos 2 años) | |
| Medion Erazer Scout E20 (v6.75.6100) | |
| Acer Nitro 5 AN515-46-R1A1 (v6.75.6100) | |
| Medion Erazer Scout E20 (v6.75.6100, Gaming Modus) | |
| Asus TUF Gaming A16 FA617 (v6.85.6300) | |
| Lenovo Legion 5 15IAH7H 82RB (v6.75.6100) | |
| Medio Intel Core i7-13700H (59324 - 107159, n=29) | |
| Gigabyte G7 KE (v6.75.6100) | |
| MSI Katana 17 B13VFK | |
| Medion Erazer Scout E20 (v6.75.6100, Lautlosmodus) | |
| AIDA64 / FPU SinJulia | |
| Media de la clase Gaming (4424 - 33636, n=105, últimos 2 años) | |
| Acer Nitro 5 AN515-46-R1A1 (v6.75.6100) | |
| Asus TUF Gaming A16 FA617 (v6.85.6300) | |
| Medion Erazer Scout E20 (v6.75.6100, Gaming Modus) | |
| Lenovo Legion 5 15IAH7H 82RB (v6.75.6100) | |
| Medion Erazer Scout E20 (v6.75.6100) | |
| Medio Intel Core i7-13700H (4800 - 11050, n=29) | |
| MSI Katana 17 B13VFK | |
| Gigabyte G7 KE (v6.75.6100) | |
| Medion Erazer Scout E20 (v6.75.6100, Lautlosmodus) | |
| AIDA64 / FPU Mandel | |
| Media de la clase Gaming (25115 - 128721, n=105, últimos 2 años) | |
| Acer Nitro 5 AN515-46-R1A1 (v6.75.6100) | |
| Asus TUF Gaming A16 FA617 (v6.85.6300) | |
| Lenovo Legion 5 15IAH7H 82RB (v6.75.6100) | |
| Medion Erazer Scout E20 (v6.75.6100, Gaming Modus) | |
| Medion Erazer Scout E20 (v6.75.6100) | |
| Medio Intel Core i7-13700H (12321 - 45118, n=29) | |
| MSI Katana 17 B13VFK (v6.85.6300) | |
| Gigabyte G7 KE (v6.75.6100) | |
| Medion Erazer Scout E20 (v6.75.6100, Lautlosmodus) | |
| AIDA64 / CPU AES | |
| Lenovo Legion 5 15IAH7H 82RB (v6.75.6100) | |
| Acer Nitro 5 AN515-46-R1A1 | |
| Gigabyte G7 KE (v6.75.6100) | |
| Media de la clase Gaming (39258 - 247074, n=105, últimos 2 años) | |
| Medion Erazer Scout E20 (v6.75.6100, Gaming Modus) | |
| Medio Intel Core i7-13700H (28769 - 151254, n=29) | |
| Medion Erazer Scout E20 (v6.75.6100) | |
| Asus TUF Gaming A16 FA617 (v6.85.6300) | |
| MSI Katana 17 B13VFK (v6.85.6300) | |
| Medion Erazer Scout E20 (v6.75.6100, Lautlosmodus) | |
| AIDA64 / CPU ZLib | |
| Media de la clase Gaming (574 - 2531, n=105, últimos 2 años) | |
| Lenovo Legion 5 15IAH7H 82RB (v6.75.6100) | |
| Medion Erazer Scout E20 (v6.75.6100, Gaming Modus) | |
| Medion Erazer Scout E20 (v6.75.6100) | |
| Medio Intel Core i7-13700H (389 - 1215, n=29) | |
| Gigabyte G7 KE (v6.75.6100) | |
| Asus TUF Gaming A16 FA617 (v6.85.6300) | |
| Acer Nitro 5 AN515-46-R1A1 (v6.75.6100) | |
| MSI Katana 17 B13VFK (v6.85.6300) | |
| Medion Erazer Scout E20 (v6.75.6100, Lautlosmodus) | |
| AIDA64 / FP64 Ray-Trace | |
| Media de la clase Gaming (5509 - 45446, n=105, últimos 2 años) | |
| Lenovo Legion 5 15IAH7H 82RB (v6.75.6100) | |
| Asus TUF Gaming A16 FA617 (v6.85.6300) | |
| Medion Erazer Scout E20 (v6.75.6100, Gaming Modus) | |
| Acer Nitro 5 AN515-46-R1A1 (v6.75.6100) | |
| Medion Erazer Scout E20 (v6.75.6100) | |
| Medio Intel Core i7-13700H (2540 - 10135, n=29) | |
| MSI Katana 17 B13VFK (v6.85.6300) | |
| Gigabyte G7 KE (v6.75.6100) | |
| Medion Erazer Scout E20 (v6.75.6100, Lautlosmodus) | |
| AIDA64 / CPU PhotoWorxx | |
| Media de la clase Gaming (12271 - 89891, n=105, últimos 2 años) | |
| Medio Intel Core i7-13700H (12872 - 52727, n=29) | |
| Medion Erazer Scout E20 (v6.75.6100, Gaming Modus) | |
| Medion Erazer Scout E20 (v6.75.6100) | |
| Lenovo Legion 5 15IAH7H 82RB (v6.75.6100) | |
| MSI Katana 17 B13VFK (v6.85.6300) | |
| Medion Erazer Scout E20 (v6.75.6100, Lautlosmodus) | |
| Gigabyte G7 KE (v6.75.6100) | |
| Acer Nitro 5 AN515-46-R1A1 | |
| Asus TUF Gaming A16 FA617 (v6.85.6300) | |
Rendimiento del sistema
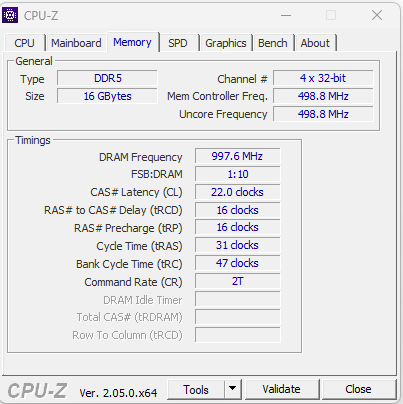
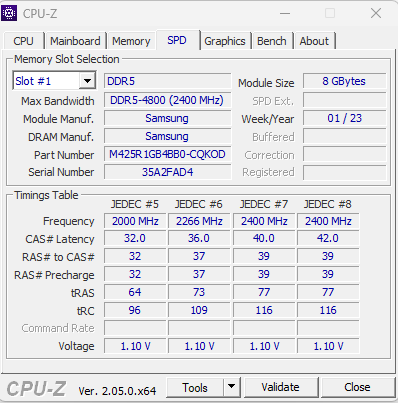
La fluidez del sistema ofrece rendimiento suficiente para tareas exigentes como el renderizado y los juegos, lo que también confirman los buenos resultados de PCMark. Las tasas de transferencia de la memoria de trabajo se sitúan en niveles normales para el almacenamiento DDR5-4800.
CrossMark: Overall | Productivity | Creativity | Responsiveness
| PCMark 10 / Score | |
| Media de la clase Gaming (5828 - 12414, n=93, últimos 2 años) | |
| Lenovo Legion 5 15IAH7H 82RB | |
| Medion Erazer Scout E20 | |
| Asus TUF Gaming A16 FA617 | |
| Medio Intel Core i7-13700H, NVIDIA GeForce RTX 4050 Laptop GPU (6822 - 7556, n=7) | |
| MSI Katana 17 B13VFK | |
| Acer Nitro 5 AN515-46-R1A1 | |
| Gigabyte G7 KE | |
| PCMark 10 / Essentials | |
| Lenovo Legion 5 15IAH7H 82RB | |
| Medion Erazer Scout E20 | |
| Medio Intel Core i7-13700H, NVIDIA GeForce RTX 4050 Laptop GPU (10283 - 11549, n=7) | |
| MSI Katana 17 B13VFK | |
| Media de la clase Gaming (8810 - 11935, n=97, últimos 2 años) | |
| Asus TUF Gaming A16 FA617 | |
| Acer Nitro 5 AN515-46-R1A1 | |
| Gigabyte G7 KE | |
| PCMark 10 / Productivity | |
| Media de la clase Gaming (6845 - 25323, n=95, últimos 2 años) | |
| Lenovo Legion 5 15IAH7H 82RB | |
| Medion Erazer Scout E20 | |
| Asus TUF Gaming A16 FA617 | |
| MSI Katana 17 B13VFK | |
| Medio Intel Core i7-13700H, NVIDIA GeForce RTX 4050 Laptop GPU (8368 - 9836, n=7) | |
| Gigabyte G7 KE | |
| Acer Nitro 5 AN515-46-R1A1 | |
| PCMark 10 / Digital Content Creation | |
| Media de la clase Gaming (7602 - 19954, n=95, últimos 2 años) | |
| Lenovo Legion 5 15IAH7H 82RB | |
| Asus TUF Gaming A16 FA617 | |
| Medion Erazer Scout E20 | |
| Medio Intel Core i7-13700H, NVIDIA GeForce RTX 4050 Laptop GPU (9527 - 10643, n=7) | |
| MSI Katana 17 B13VFK | |
| Acer Nitro 5 AN515-46-R1A1 | |
| Gigabyte G7 KE | |
| CrossMark / Overall | |
| Lenovo Legion 5 15IAH7H 82RB | |
| Media de la clase Gaming (1366 - 2409, n=94, últimos 2 años) | |
| Medion Erazer Scout E20 | |
| MSI Katana 17 B13VFK | |
| Gigabyte G7 KE | |
| Medio Intel Core i7-13700H, NVIDIA GeForce RTX 4050 Laptop GPU (1205 - 1937, n=9) | |
| Acer Nitro 5 AN515-46-R1A1 | |
| CrossMark / Productivity | |
| Lenovo Legion 5 15IAH7H 82RB | |
| Medion Erazer Scout E20 | |
| Media de la clase Gaming (1386 - 2254, n=94, últimos 2 años) | |
| Gigabyte G7 KE | |
| MSI Katana 17 B13VFK | |
| Medio Intel Core i7-13700H, NVIDIA GeForce RTX 4050 Laptop GPU (1158 - 1877, n=9) | |
| Acer Nitro 5 AN515-46-R1A1 | |
| CrossMark / Creativity | |
| Media de la clase Gaming (1343 - 2786, n=94, últimos 2 años) | |
| Medion Erazer Scout E20 | |
| Lenovo Legion 5 15IAH7H 82RB | |
| MSI Katana 17 B13VFK | |
| Medio Intel Core i7-13700H, NVIDIA GeForce RTX 4050 Laptop GPU (1293 - 2044, n=9) | |
| Gigabyte G7 KE | |
| Acer Nitro 5 AN515-46-R1A1 | |
| CrossMark / Responsiveness | |
| Lenovo Legion 5 15IAH7H 82RB | |
| Gigabyte G7 KE | |
| Medion Erazer Scout E20 | |
| MSI Katana 17 B13VFK | |
| Media de la clase Gaming (1226 - 2334, n=94, últimos 2 años) | |
| Medio Intel Core i7-13700H, NVIDIA GeForce RTX 4050 Laptop GPU (1097 - 1929, n=9) | |
| Acer Nitro 5 AN515-46-R1A1 | |
| PCMark 8 Home Score Accelerated v2 | 5486 puntos | |
| PCMark 8 Work Score Accelerated v2 | 6205 puntos | |
| PCMark 10 Score | 7556 puntos | |
ayuda | ||
| AIDA64 / Memory Copy | |
| Media de la clase Gaming (21750 - 129946, n=105, últimos 2 años) | |
| Medio Intel Core i7-13700H (24334 - 78081, n=29) | |
| Medion Erazer Scout E20 | |
| MSI Katana 17 B13VFK | |
| Lenovo Legion 5 15IAH7H 82RB | |
| Acer Nitro 5 AN515-46-R1A1 | |
| Asus TUF Gaming A16 FA617 | |
| Gigabyte G7 KE | |
| AIDA64 / Memory Read | |
| Media de la clase Gaming (22956 - 118858, n=105, últimos 2 años) | |
| Medion Erazer Scout E20 | |
| Medio Intel Core i7-13700H (23681 - 79656, n=29) | |
| MSI Katana 17 B13VFK | |
| Lenovo Legion 5 15IAH7H 82RB | |
| Acer Nitro 5 AN515-46-R1A1 | |
| Asus TUF Gaming A16 FA617 | |
| Gigabyte G7 KE | |
| AIDA64 / Memory Write | |
| Media de la clase Gaming (22297 - 135096, n=105, últimos 2 años) | |
| Medio Intel Core i7-13700H (22986 - 99898, n=29) | |
| Medion Erazer Scout E20 | |
| Lenovo Legion 5 15IAH7H 82RB | |
| Acer Nitro 5 AN515-46-R1A1 | |
| Asus TUF Gaming A16 FA617 | |
| MSI Katana 17 B13VFK | |
| Gigabyte G7 KE | |
| AIDA64 / Memory Latency | |
| Media de la clase Gaming (75.3 - 259, n=105, últimos 2 años) | |
| MSI Katana 17 B13VFK | |
| Medion Erazer Scout E20 | |
| Lenovo Legion 5 15IAH7H 82RB | |
| Medio Intel Core i7-13700H (82.4 - 136.8, n=29) | |
| Gigabyte G7 KE | |
| Acer Nitro 5 AN515-46-R1A1 | |
| Asus TUF Gaming A16 FA617 | |
* ... más pequeño es mejor
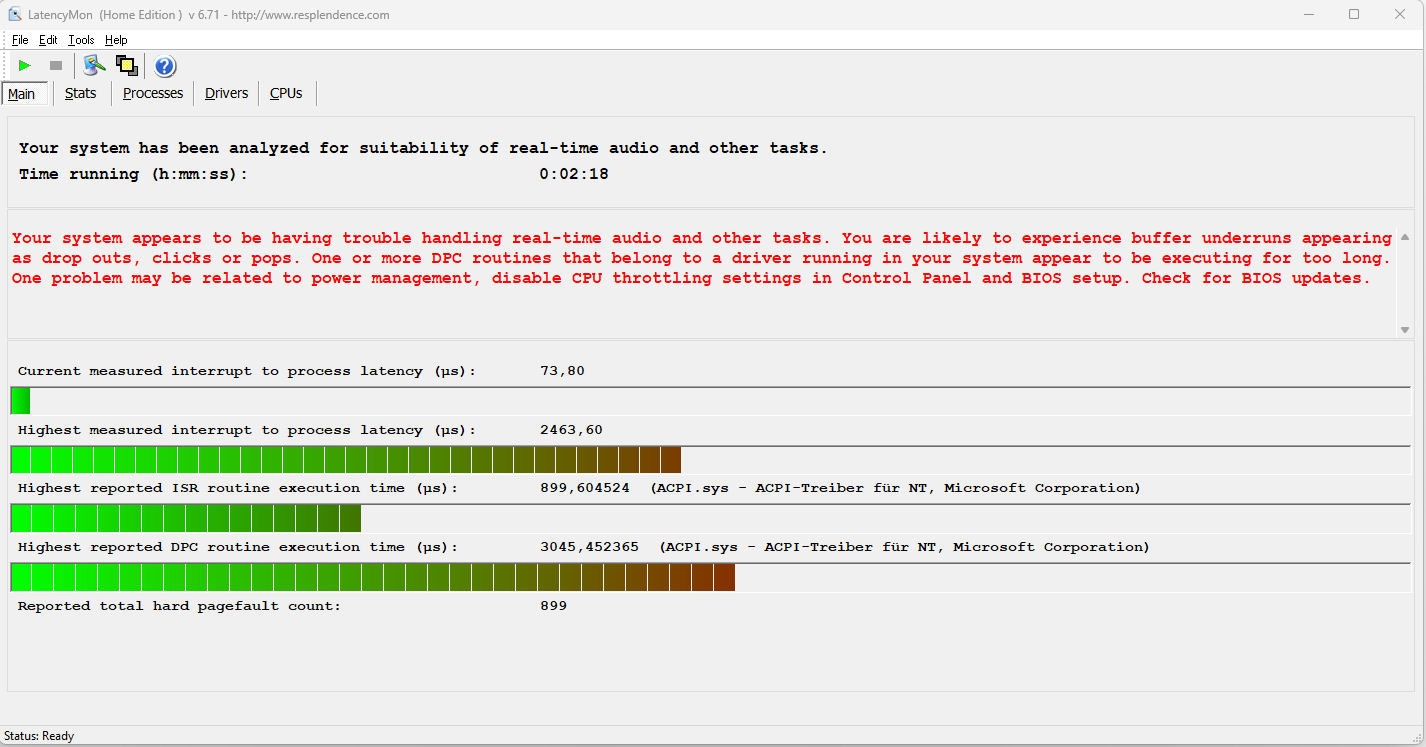
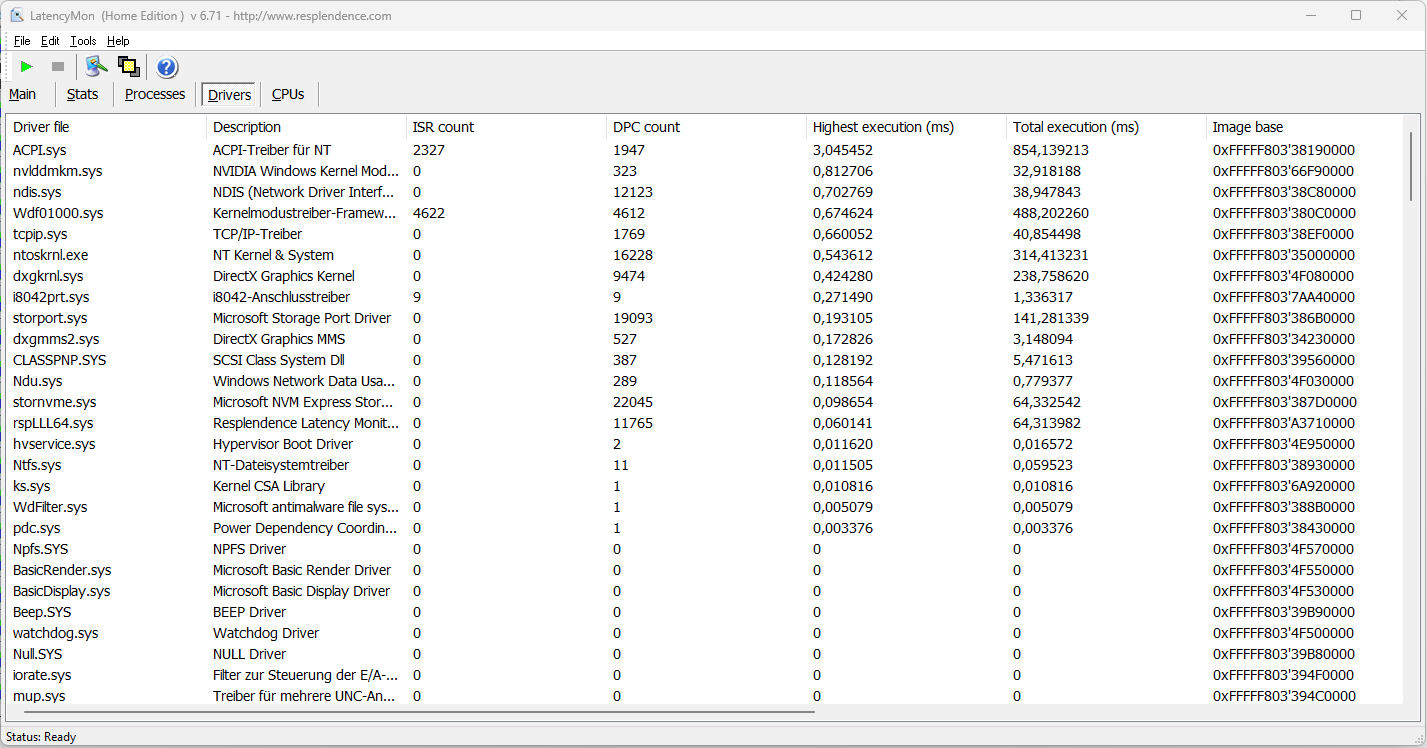
Latencias del CPD
La prueba estandarizada Latency Monitor (con navegación web, reproducción de vídeo 4k y carga alta de Prime95) revela algunas latencias llamativas. El sistema no parece adecuado para el procesamiento de vídeo y audio en tiempo real. Futuras actualizaciones de software podrían traer algunas mejoras o incluso empeorar las cosas.
| DPC Latencies / LatencyMon - interrupt to process latency (max), Web, Youtube, Prime95 | |
| Acer Nitro 5 AN515-46-R1A1 | |
| Medion Erazer Scout E20 | |
| MSI Katana 17 B13VFK | |
| Gigabyte G7 KE | |
| Lenovo Legion 5 15IAH7H 82RB | |
| Asus TUF Gaming A16 FA617 | |
* ... más pequeño es mejor
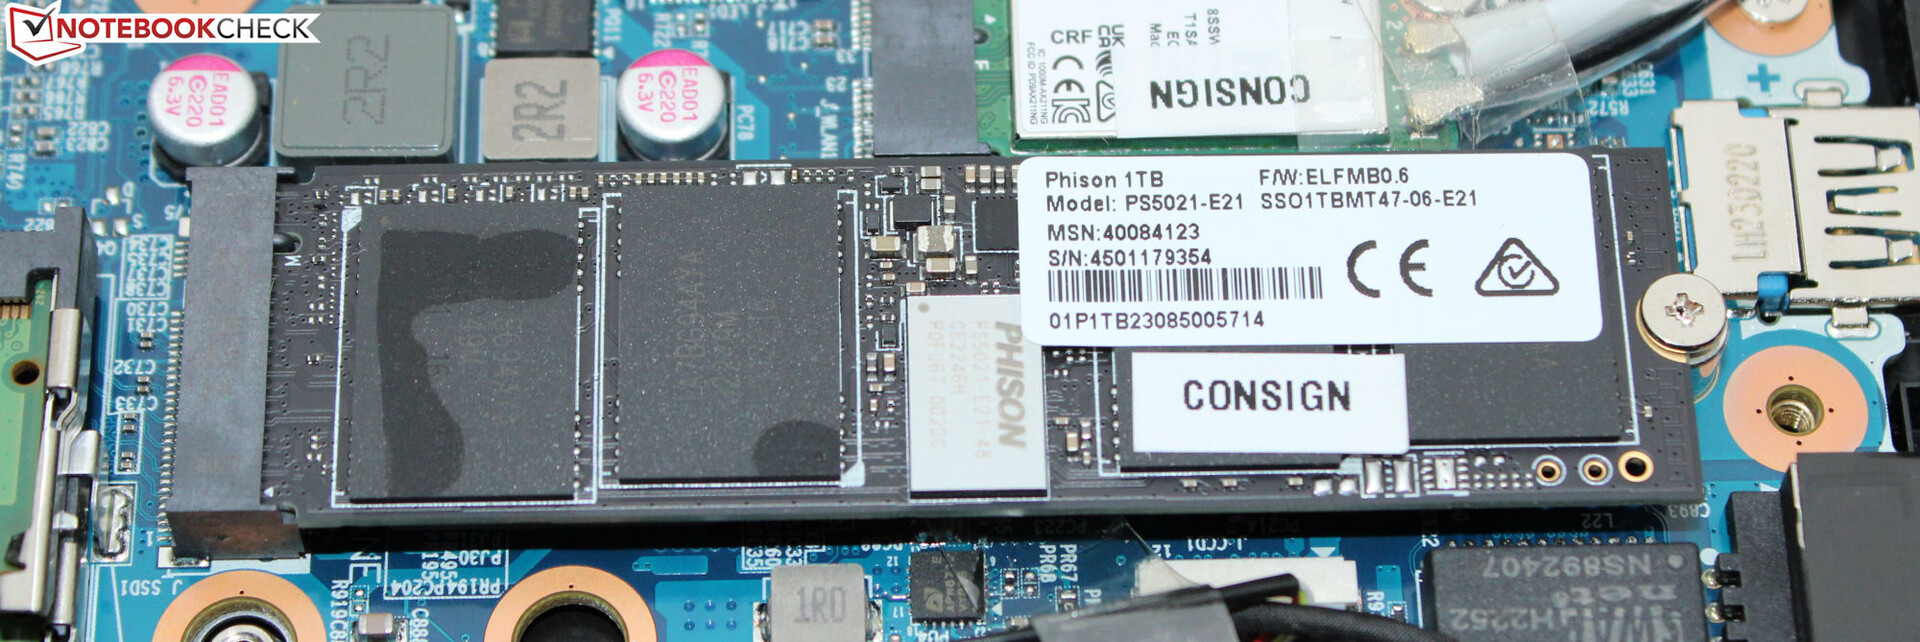
Solución de almacenamiento
Un SSD PCIe 4 de 1 TB en formato M.2-2280 de Phison sirve como unidad del sistema. Aunque ofrece muy buenas tasas de transferencia, no es uno de los mejores modelos entre los SSDs. No hay caídas de rendimiento debidas al estrangulamiento térmico.
Según la web de Medion, se puede ampliar el almacenamiento del portátil usando un medio de almacenamiento de 2,5 pulgadas, pero nuestra unidad de pruebas no incluye ni las ranuras SATA necesarias ni el marco de inserción.

* ... más pequeño es mejor
Disk Throttling: DiskSpd Read Loop, Queue Depth 8
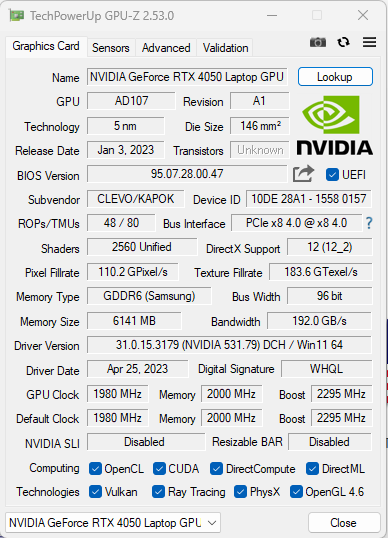
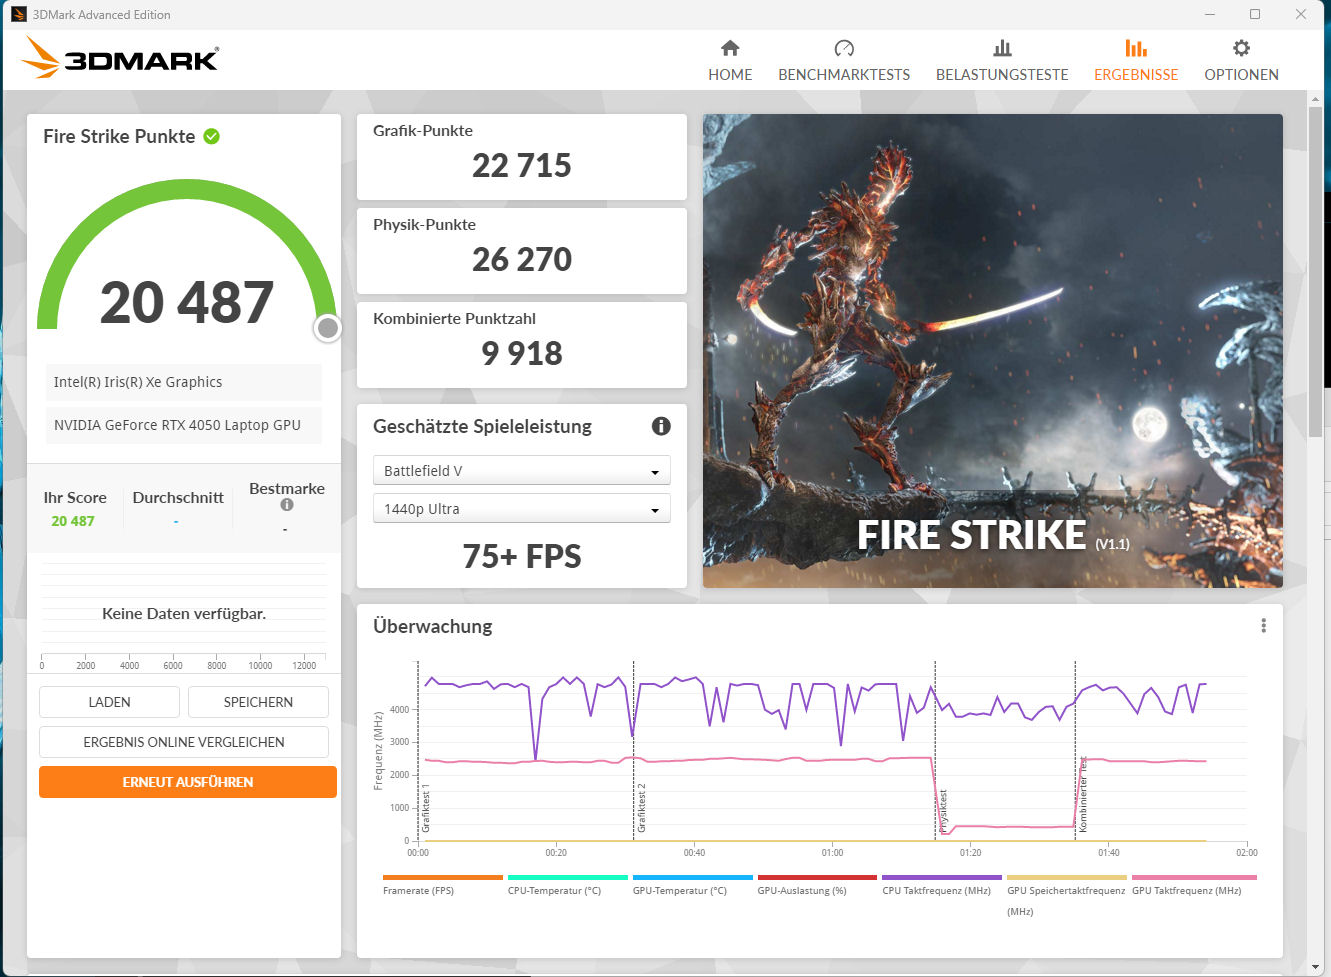
Tarjeta gráfica
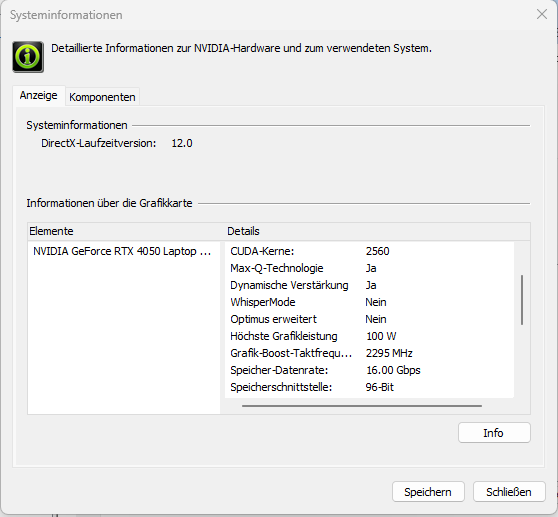
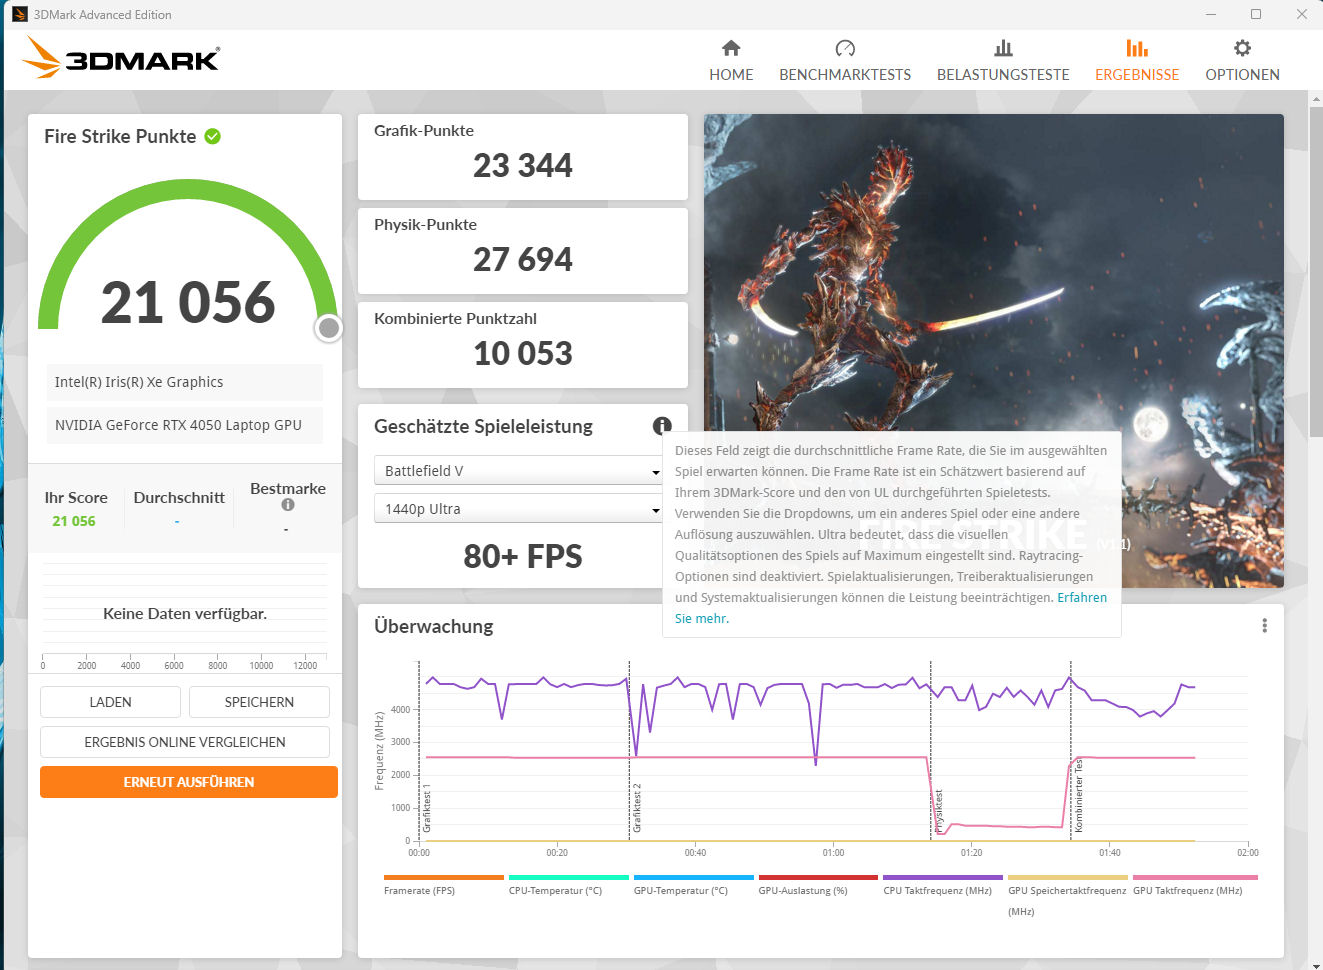
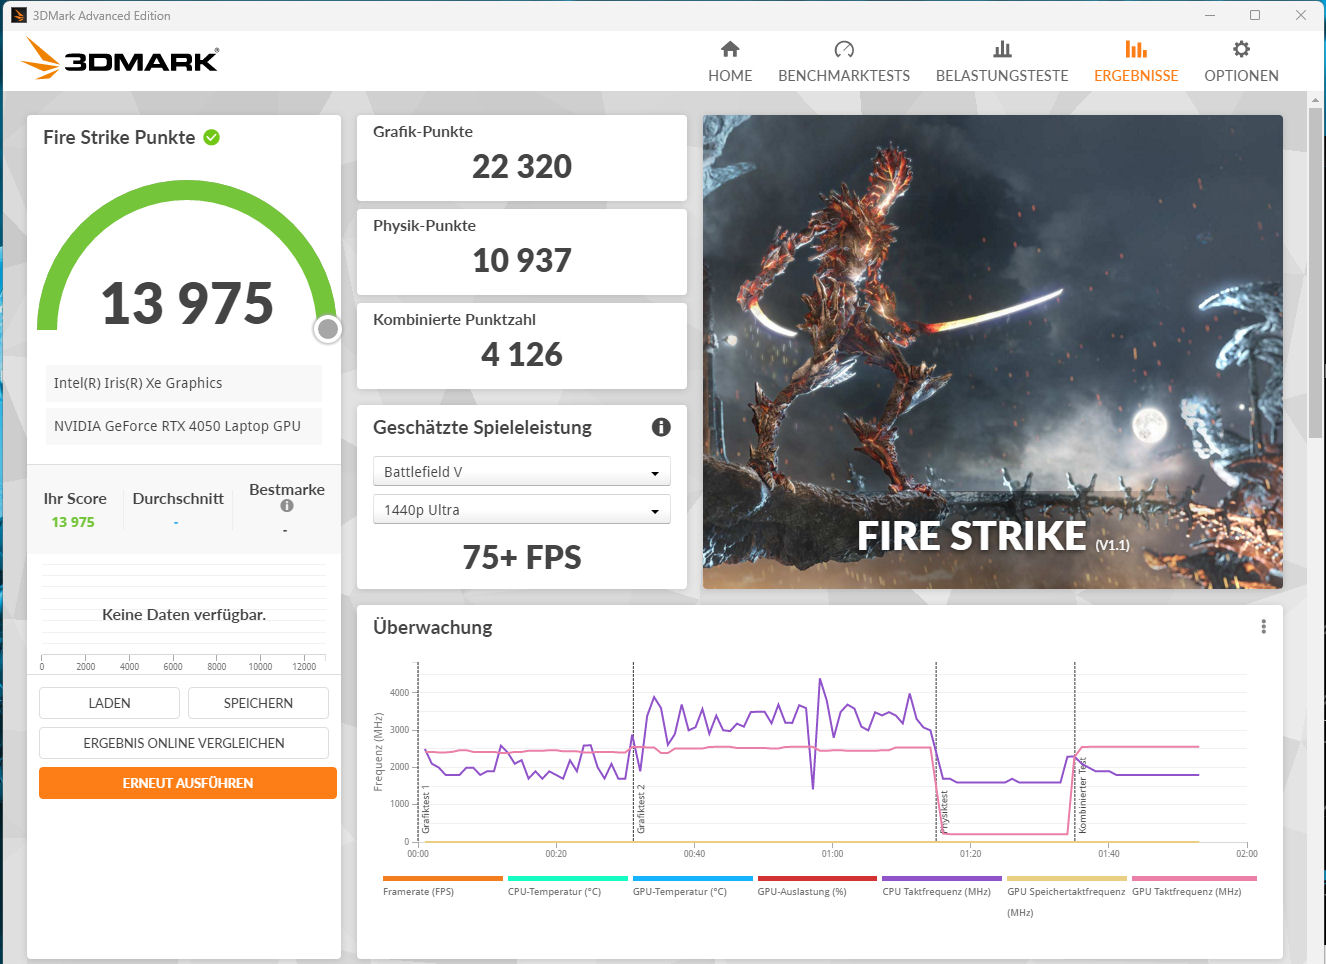
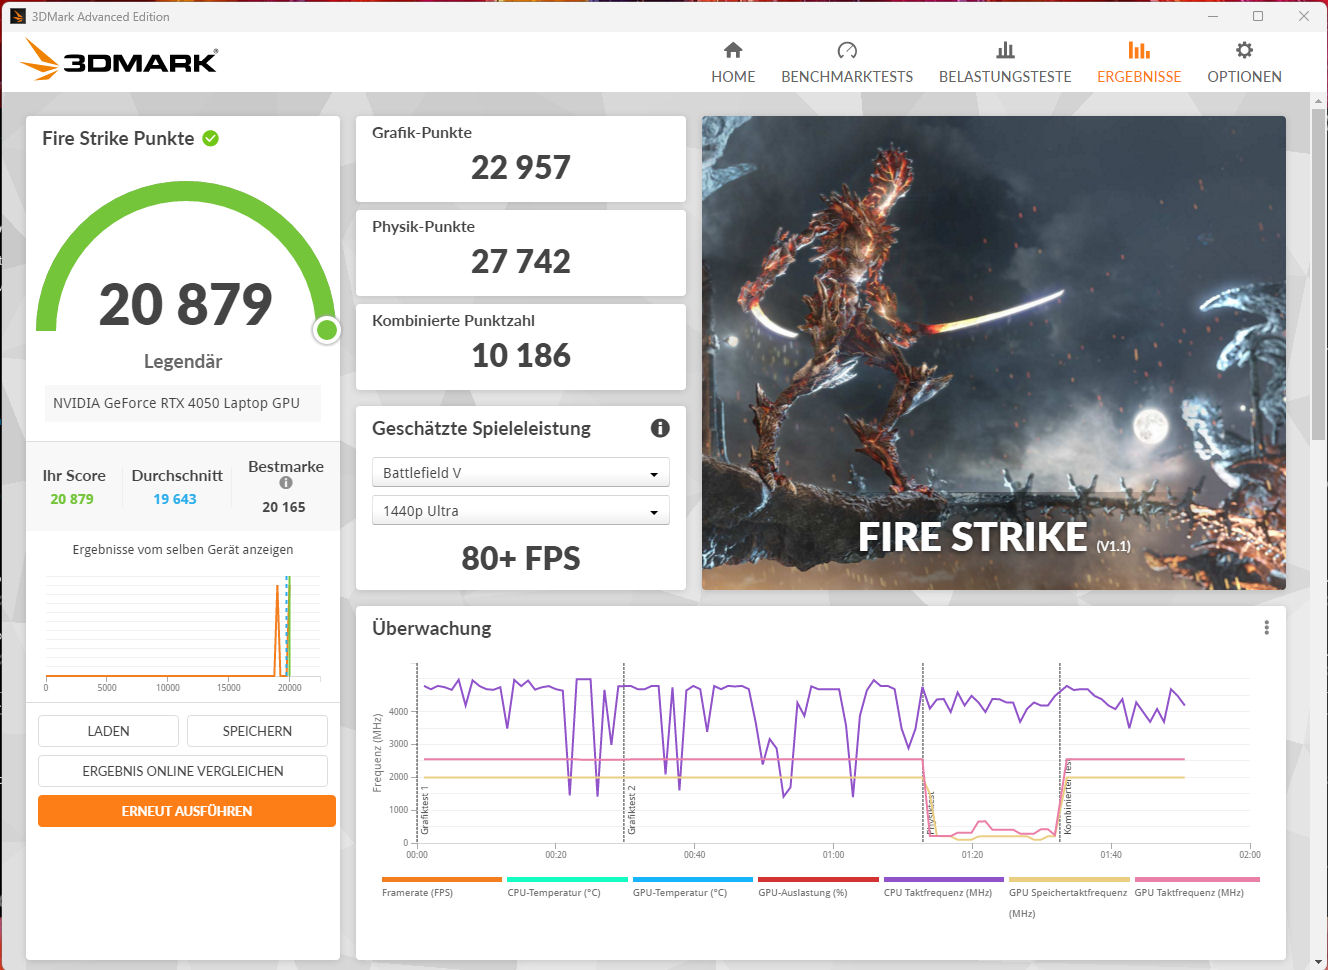
LaGeForce RTX 4050para portátiles ofrece 2.560 shaders, un bus de 96 bits y 6.144 MB de rápido almacenamiento GDDR6. Medion le permite un TGP máximo de 100 vatios. Según nuestra prueba The Witcher 3, el TGP máximo no se usa del todo.
Los resultados del benchmark se sitúan por encima de la media para la RTX 4050. Los modos Entretenimiento y Juego producen casi el mismo rendimiento gráfico. La salida directa de imagen a través de la GPU GeForce no aporta un aumento de rendimiento. El cambio entre los modos Optimus y dGPU se hace en la BIOS o a través del Centro de Control. El modo Optimus avanzado no es compatible.
| 3DMark Performance rating - Percent | |
| Media de la clase Gaming | |
| MSI Katana 17 B13VFK | |
| Acer Nitro 5 AN515-46-R1A1 | |
| Asus TUF Gaming A16 FA617 | |
| Medion Erazer Scout E20 | |
| Medion Erazer Scout E20 | |
| Lenovo Legion 5 15IAH7H 82RB -1! | |
| Medio NVIDIA GeForce RTX 4050 Laptop GPU | |
| Medion Erazer Scout E20 | |
| Gigabyte G7 KE | |
| 3DMark 11 - 1280x720 Performance GPU | |
| Media de la clase Gaming (21841 - 80022, n=104, últimos 2 años) | |
| Acer Nitro 5 AN515-46-R1A1 | |
| MSI Katana 17 B13VFK | |
| Asus TUF Gaming A16 FA617 | |
| Medion Erazer Scout E20 (Gaming Performance) | |
| Lenovo Legion 5 15IAH7H 82RB | |
| Medion Erazer Scout E20 | |
| Medion Erazer Scout E20 (Lautlosmodus) | |
| Gigabyte G7 KE | |
| Medio NVIDIA GeForce RTX 4050 Laptop GPU (13339 - 32642, n=41) | |
| 3DMark 06 Standard Score | 51372 puntos | |
| 3DMark 11 Performance | 27315 puntos | |
| 3DMark Cloud Gate Standard Score | 52998 puntos | |
| 3DMark Fire Strike Score | 20487 puntos | |
| 3DMark Time Spy Score | 8594 puntos | |
ayuda | ||
| Blender | |
| v3.3 Classroom OPTIX/RTX | |
| Gigabyte G7 KE (3.3.2) | |
| Lenovo Legion 5 15IAH7H 82RB (3.3.0) | |
| Medion Erazer Scout E20 (3.3.3) | |
| Medion Erazer Scout E20 (3.3.3, Lautlosmodus) | |
| Medio NVIDIA GeForce RTX 4050 Laptop GPU (25 - 37, n=40) | |
| Medion Erazer Scout E20 (3.3.3, Gaming Modus) | |
| Acer Nitro 5 AN515-46-R1A1 (3.3.0) | |
| MSI Katana 17 B13VFK (3.3.3) | |
| Media de la clase Gaming (9 - 32, n=106, últimos 2 años) | |
| v3.3 Classroom CUDA | |
| Medio NVIDIA GeForce RTX 4050 Laptop GPU (47 - 68, n=39) | |
| Gigabyte G7 KE (3.3.2) | |
| Medion Erazer Scout E20 (3.3.3) | |
| Medion Erazer Scout E20 (3.3.3, Lautlosmodus) | |
| Lenovo Legion 5 15IAH7H 82RB (3.3.0) | |
| Medion Erazer Scout E20 (3.3.3, Gaming Modus) | |
| MSI Katana 17 B13VFK (3.3.3) | |
| Acer Nitro 5 AN515-46-R1A1 (3.3.0) | |
| Media de la clase Gaming (15 - 228, n=106, últimos 2 años) | |
| Geekbench 5.5 - OpenCL Score | |
| Media de la clase Gaming (80702 - 277970, n=101, últimos 2 años) | |
| Acer Nitro 5 AN515-46-R1A1 | |
| Gigabyte G7 KE | |
| Lenovo Legion 5 15IAH7H 82RB | |
| MSI Katana 17 B13VFK | |
| Medion Erazer Scout E20 (Gaming Modus) | |
| Medion Erazer Scout E20 (Lautlosmodus) | |
| Medion Erazer Scout E20 | |
| Medio NVIDIA GeForce RTX 4050 Laptop GPU (63538 - 90075, n=38) | |
| Asus TUF Gaming A16 FA617 | |
| Geekbench 6.0 - GPU OpenCL 6.0 | |
| Media de la clase Gaming (155885 - 241981, n=3, últimos 2 años) | |
| Medion Erazer Scout E20 | |
| Medio NVIDIA GeForce RTX 4050 Laptop GPU (66574 - 84452, n=13) | |
| V-Ray 5 Benchmark | |
| GPU RTX | |
| Media de la clase Gaming (1146 - 4363, n=33, últimos 2 años) | |
| Acer Nitro 5 AN515-46-R1A1 (5.0.1) | |
| Medion Erazer Scout E20 (5.0.1, Gaming Modus) | |
| Medion Erazer Scout E20 (5.0.1) | |
| Medio NVIDIA GeForce RTX 4050 Laptop GPU (618 - 1588, n=24) | |
| Medion Erazer Scout E20 (5.0.1, Lautlosmodus) | |
| Gigabyte G7 KE (5.0.1) | |
| GPU CUDA | |
| Media de la clase Gaming (887 - 3288, n=33, últimos 2 años) | |
| Acer Nitro 5 AN515-46-R1A1 (5.0.1) | |
| Medion Erazer Scout E20 (5.0.1, Gaming Modus) | |
| Medion Erazer Scout E20 (5.0.1, Lautlosmodus) | |
| Medion Erazer Scout E20 (5.0.1) | |
| Medio NVIDIA GeForce RTX 4050 Laptop GPU (735 - 1202, n=24) | |
| Gigabyte G7 KE (5.0.1) | |
| CPU | |
| Media de la clase Gaming (5864 - 30302, n=32, últimos 2 años) | |
| Lenovo Legion 5 15IAH7H 82RB (5.0.1) | |
| Medion Erazer Scout E20 (5.0.1, Gaming Modus) | |
| Medio NVIDIA GeForce RTX 4050 Laptop GPU (3562 - 14401, n=24) | |
| Medion Erazer Scout E20 (5.0.1) | |
| Acer Nitro 5 AN515-46-R1A1 (5.0.1) | |
| Gigabyte G7 KE (5.0.1) | |
| Medion Erazer Scout E20 (5.0.1, Lautlosmodus) | |
| V-Ray Benchmark Next 4.10 | |
| GPU | |
| Media de la clase Gaming (427 - 1627, n=99, últimos 2 años) | |
| MSI Katana 17 B13VFK (v4.10.07 ) | |
| Acer Nitro 5 AN515-46-R1A1 (v4.10.07 ) | |
| Medion Erazer Scout E20 (v4.10.07, Gaming Modus) | |
| Medion Erazer Scout E20 (v4.10.07, Lautlosmodus) | |
| Medion Erazer Scout E20 (v4.10.07 ) | |
| Medio NVIDIA GeForce RTX 4050 Laptop GPU (333 - 565, n=35) | |
| Gigabyte G7 KE (v4.10.07 ) | |
| Asus TUF Gaming A16 FA617 (v4.10.07 ) | |
| CPU | |
| Media de la clase Gaming (10048 - 45327, n=97, últimos 2 años) | |
| Medion Erazer Scout E20 (v4.10.07, Gaming Modus) | |
| MSI Katana 17 B13VFK (v4.10.07 ) | |
| Medion Erazer Scout E20 (v4.10.07 ) | |
| Medio NVIDIA GeForce RTX 4050 Laptop GPU (5413 - 24181, n=35) | |
| Asus TUF Gaming A16 FA617 (v4.10.07 ) | |
| Gigabyte G7 KE (v4.10.07 ) | |
| Acer Nitro 5 AN515-46-R1A1 (v4.10.07 ) | |
| Medion Erazer Scout E20 (v4.10.07, Lautlosmodus) | |
* ... más pequeño es mejor
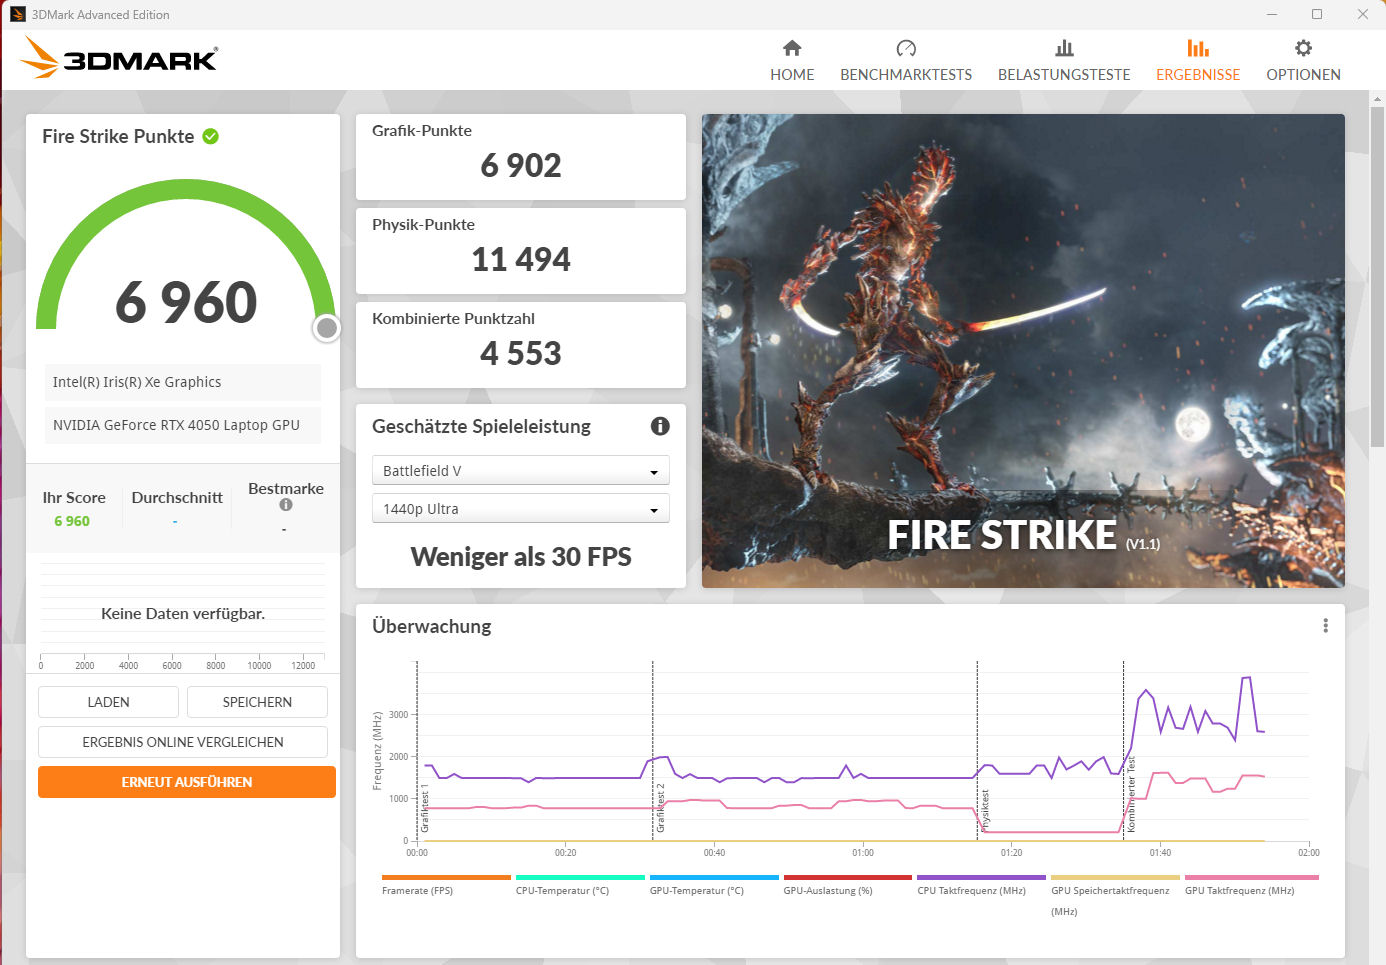
Rendimiento en juegos
El Scout está configurado para juegos FHD con ajustes de altos a máximos. El "Modo Silencioso" permite jugar con poco ruido de funcionamiento, pero deberías bajar la resolución y los ajustes en consecuencia. El portátil alcanza frame rates por encima (modo Juego, modo Entretenimiento) y por debajo (modo Silencioso) de la media que determinamos hasta ahora para la RTX 4050. Dependiendo del juego, la salida de imagen directa a través de la GPU GeForce puede llevar a un aumento mínimo de los frame rates.
| Performance rating - Percent | |
| Media de la clase Gaming | |
| MSI Katana 17 B13VFK | |
| Lenovo Legion 5 15IAH7H 82RB | |
| Medion Erazer Scout E20 | |
| Medion Erazer Scout E20 | |
| Acer Nitro 5 AN515-46-R1A1 | |
| Gigabyte G7 KE | |
| Medio NVIDIA GeForce RTX 4050 Laptop GPU | |
| Asus TUF Gaming A16 FA617 | |
| Medion Erazer Scout E20 | |
| The Witcher 3 - 1920x1080 Ultra Graphics & Postprocessing (HBAO+) | |
| Media de la clase Gaming (104.7 - 240, n=7, últimos 2 años) | |
| Acer Nitro 5 AN515-46-R1A1 | |
| MSI Katana 17 B13VFK | |
| Asus TUF Gaming A16 FA617 | |
| Lenovo Legion 5 15IAH7H 82RB | |
| Medion Erazer Scout E20 (Gaming Modus) | |
| Medion Erazer Scout E20 | |
| Gigabyte G7 KE | |
| Medion Erazer Scout E20 (Lautlosmodus) | |
| Medio NVIDIA GeForce RTX 4050 Laptop GPU (18.5 - 94.7, n=40) | |
| GTA V - 1920x1080 Highest AA:4xMSAA + FX AF:16x | |
| Media de la clase Gaming (48.3 - 186.9, n=94, últimos 2 años) | |
| MSI Katana 17 B13VFK | |
| Lenovo Legion 5 15IAH7H 82RB | |
| Gigabyte G7 KE | |
| Medion Erazer Scout E20 (Gaming Modus) | |
| Medion Erazer Scout E20 | |
| Acer Nitro 5 AN515-46-R1A1 | |
| Asus TUF Gaming A16 FA617 | |
| Medio NVIDIA GeForce RTX 4050 Laptop GPU (14.9 - 101.7, n=35) | |
| Medion Erazer Scout E20 (Lautlosmodus) | |
| Final Fantasy XV Benchmark - 1920x1080 High Quality | |
| Media de la clase Gaming (41 - 215, n=95, últimos 2 años) | |
| Acer Nitro 5 AN515-46-R1A1 (1.3) | |
| Lenovo Legion 5 15IAH7H 82RB (1.3) | |
| MSI Katana 17 B13VFK (1.3) | |
| Gigabyte G7 KE (1.3) | |
| Medion Erazer Scout E20 (1.3) | |
| Medion Erazer Scout E20 (1.3, Gaming Modus) | |
| Asus TUF Gaming A16 FA617 (1.3) | |
| Medio NVIDIA GeForce RTX 4050 Laptop GPU (15.5 - 122.3, n=39) | |
| Medion Erazer Scout E20 (1.3, Lautlosmodus) | |
| Strange Brigade - 1920x1080 ultra AA:ultra AF:16 | |
| Media de la clase Gaming (76.3 - 458, n=87, últimos 2 años) | |
| MSI Katana 17 B13VFK (1.47.22.14 D3D12) | |
| Acer Nitro 5 AN515-46-R1A1 (1.47.22.14 D3D12) | |
| Lenovo Legion 5 15IAH7H 82RB (1.47.22.14 D3D12) | |
| Asus TUF Gaming A16 FA617 (1.47.22.14 D3D12) | |
| Medion Erazer Scout E20 (1.47.22.14 D3D12, Gaming Modus) | |
| Gigabyte G7 KE (1.47.22.14 D3D12) | |
| Medion Erazer Scout E20 (1.47.22.14 D3D12) | |
| Medion Erazer Scout E20 (1.47.22.14 D3D12, Lautlosmodus) | |
| Medio NVIDIA GeForce RTX 4050 Laptop GPU (21.2 - 156.6, n=38) | |
| Dota 2 Reborn - 1920x1080 ultra (3/3) best looking | |
| MSI Katana 17 B13VFK | |
| Lenovo Legion 5 15IAH7H 82RB | |
| Media de la clase Gaming (84.8 - 248, n=107, últimos 2 años) | |
| Medion Erazer Scout E20 (Gaming Modus) | |
| Medion Erazer Scout E20 | |
| Gigabyte G7 KE | |
| Medio NVIDIA GeForce RTX 4050 Laptop GPU (73.5 - 175.6, n=39) | |
| Asus TUF Gaming A16 FA617 | |
| Acer Nitro 5 AN515-46-R1A1 | |
| Medion Erazer Scout E20 (Lautlosmodus) | |
| X-Plane 11.11 - 1920x1080 high (fps_test=3) | |
| MSI Katana 17 B13VFK | |
| Medion Erazer Scout E20 (Gaming Modus) | |
| Lenovo Legion 5 15IAH7H 82RB | |
| Medion Erazer Scout E20 | |
| Media de la clase Gaming (55.5 - 143.5, n=109, últimos 2 años) | |
| Medio NVIDIA GeForce RTX 4050 Laptop GPU (55.5 - 117, n=40) | |
| Gigabyte G7 KE | |
| Acer Nitro 5 AN515-46-R1A1 | |
| Medion Erazer Scout E20 (Lautlosmodus) | |
| Asus TUF Gaming A16 FA617 | |
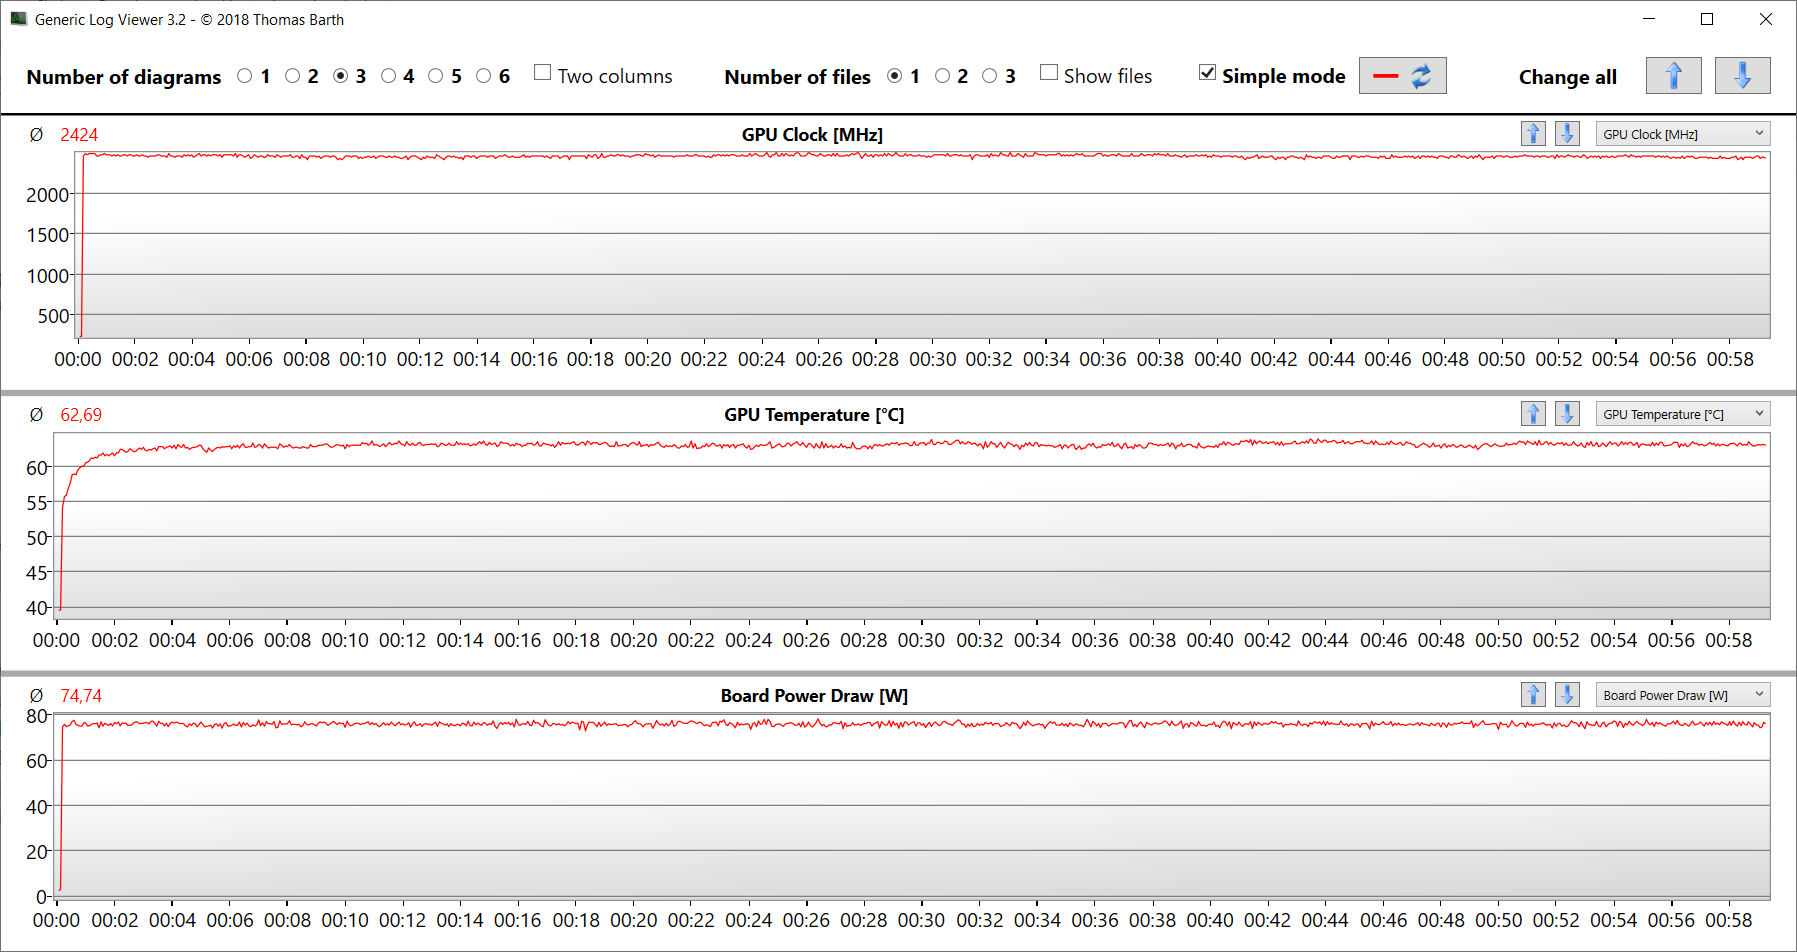
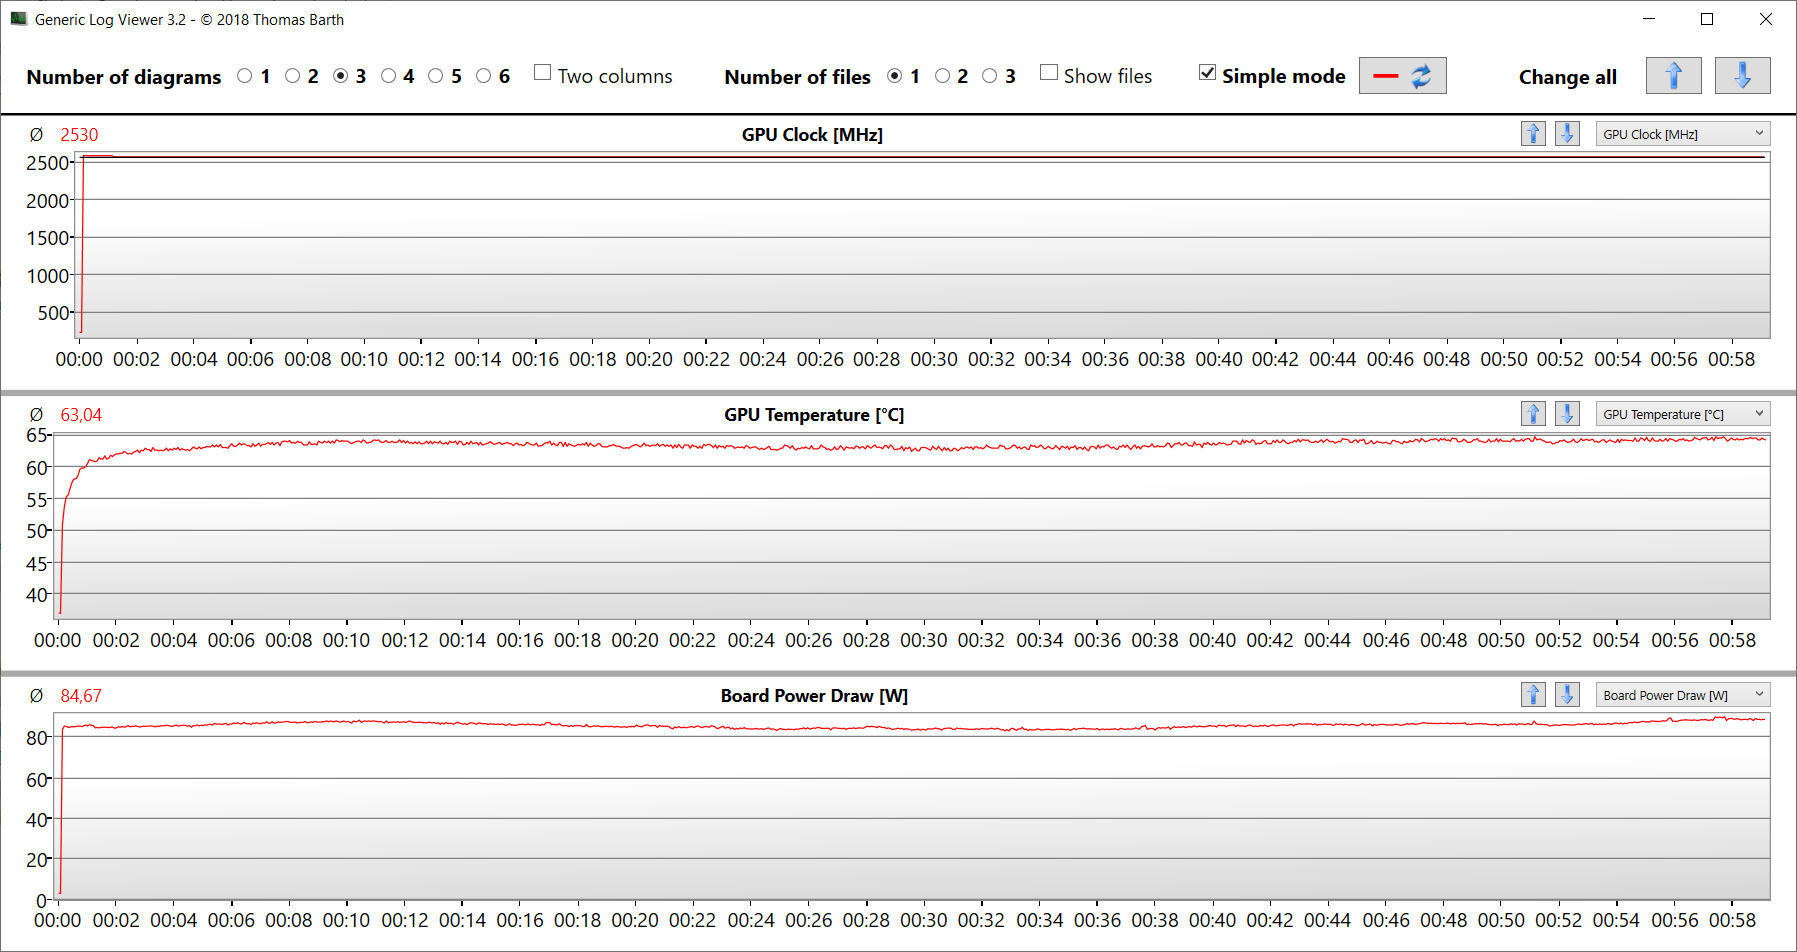
Para evaluar si las frecuencias de cuadro se mantienen en gran medida constantes durante un periodo de tiempo más largo, ejecutamos el juego "The Witcher 3" durante unos 60 minutos en resolución Full-HD y con los ajustes de máxima calidad. El personaje del juego no se mueve durante ese tiempo. Sólo cuando se activa el "modo silencioso" se produce una disminución de las frecuencias de cuadro.
The Witcher 3 FPS Chart
| bajo | medio | alto | ultra | |
|---|---|---|---|---|
| GTA V (2015) | 184.8 | 180.1 | 172.4 | 94.2 |
| The Witcher 3 (2015) | 382.6 | 265.3 | 150.9 | 83.4 |
| Dota 2 Reborn (2015) | 177.6 | 160.3 | 150.3 | 142.5 |
| Final Fantasy XV Benchmark (2018) | 187.5 | 116.9 | 82.6 | |
| X-Plane 11.11 (2018) | 153.9 | 132.7 | 104.4 | |
| Far Cry 5 (2018) | 172 | 136 | 126 | 119 |
| Strange Brigade (2018) | 447 | 206 | 166.5 | 144 |
| Gears Tactics (2020) | 341.6 | 204.1 | 133.9 | 96.7 |
| Death Stranding (2020) | 174.8 | 140.5 | 132 | 128.8 |
| Assassin´s Creed Valhalla (2020) | 184 | 117 | 92 | 70 |
| Immortals Fenyx Rising (2020) | 171 | 112 | 101 | 93 |
| Mass Effect Legendary Edition (2021) | 150.1 | 135.1 | ||
| Far Cry 6 (2021) | 153.2 | 125.3 | 107.3 | 76.7 |
| Back 4 Blood (2021) | 332 | 221 | 166.1 | 155.3 |
| Guardians of the Galaxy (2021) | 144 | 120 | 119 | 113 |
| Riders Republic (2021) | 164 | 131 | 107 | 96 |
| Halo Infinite (2021) | 122.8 | 104.6 | 85.9 | |
| Rainbow Six Extraction (2022) | 208 | 166 | 159 | 125 |
| GRID Legends (2022) | 206.2 | 171.4 | 140.9 | 109.8 |
| Elex 2 (2022) | 116.3 | 115.7 | 103.4 | 81.4 |
| F1 22 (2022) | 215 | 197.2 | 152.3 | 52.5 |
| Uncharted Legacy of Thieves Collection (2022) | 75.1 | 71.1 | 67.2 | 62.6 |
| Dead Island 2 (2023) | 196 | 171.7 | 133.1 | 120.6 |
| Star Wars Jedi Survivor (2023) | 99.2 | 86.3 | 62.9 | 49.4 |
| Anno 117: Pax Romana (2025) | 83.6 | 64 | 47.8 | 26.2 |
| Forza Horizon 6 (2026) | 147 | 96 | 50 | 18 |
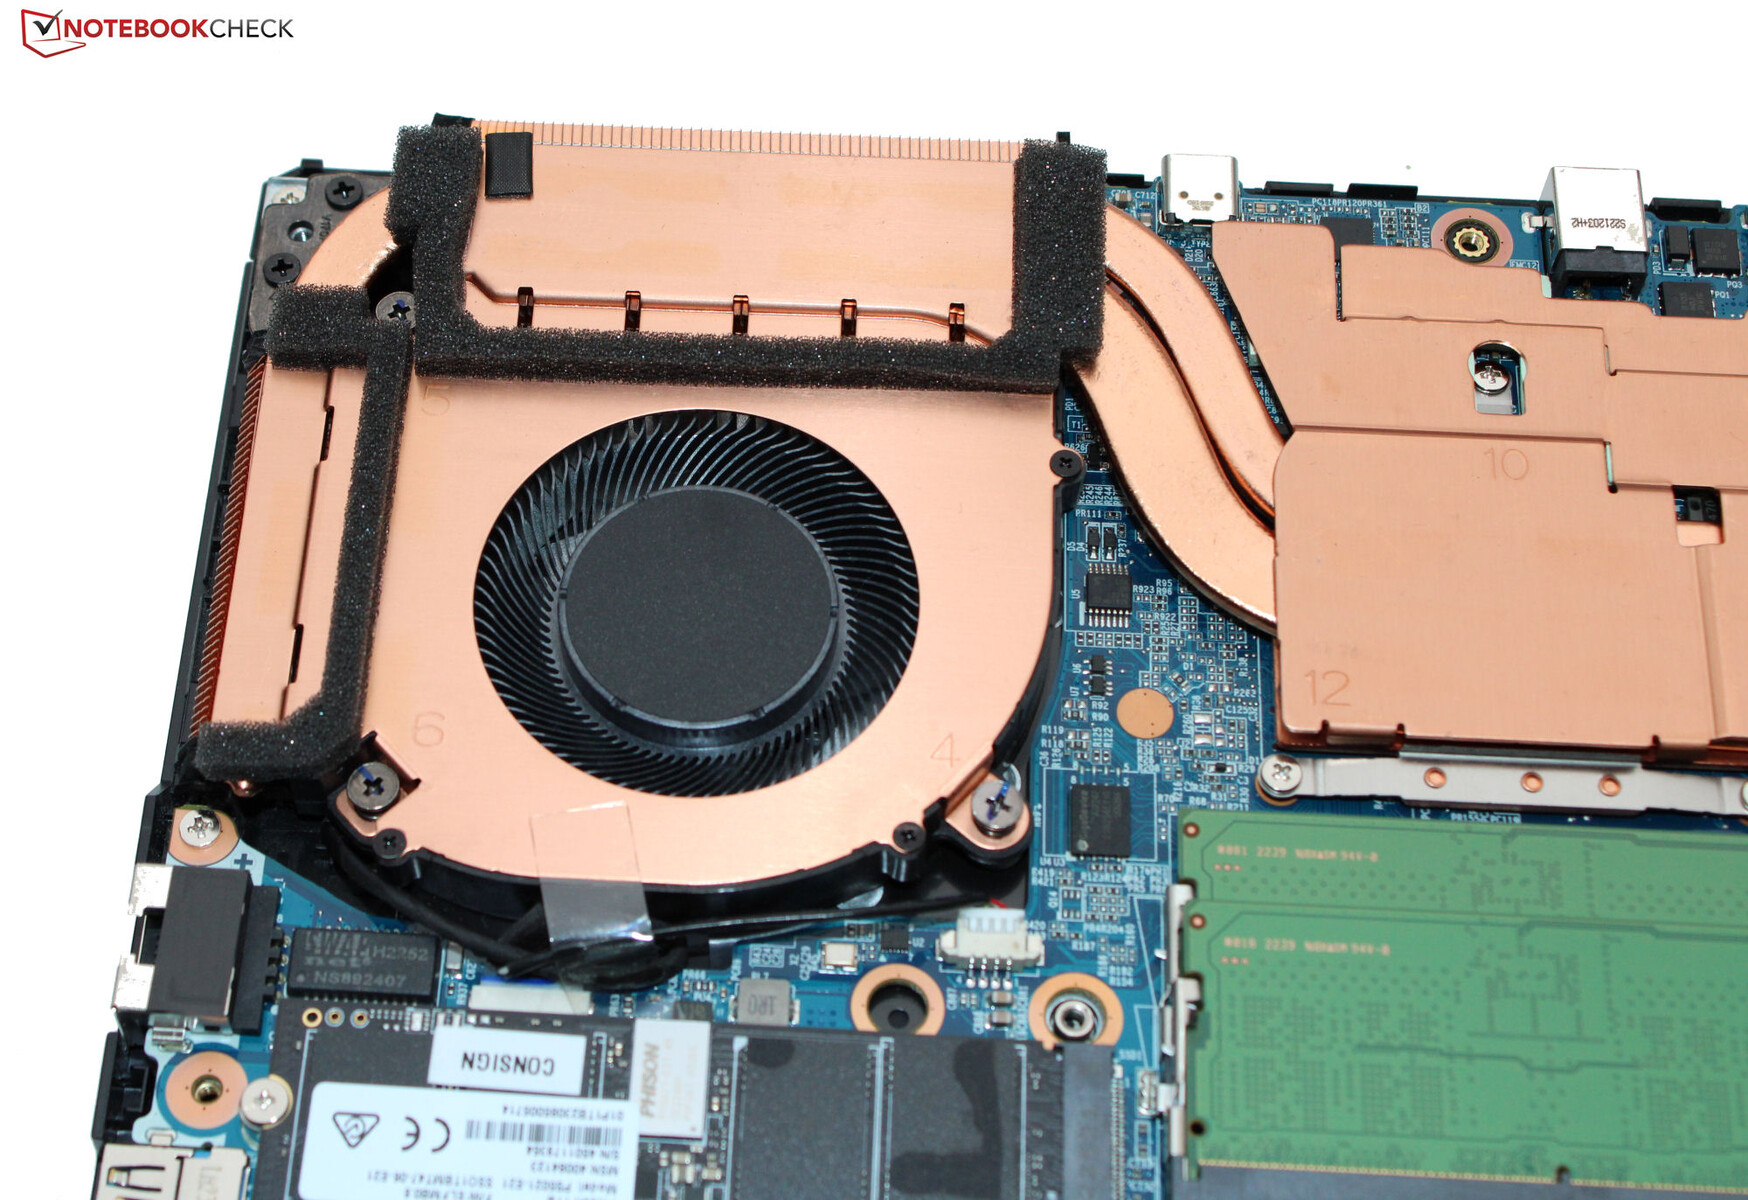
Emisiones - El Erazer Scout apenas se calienta
Niveles de ruido
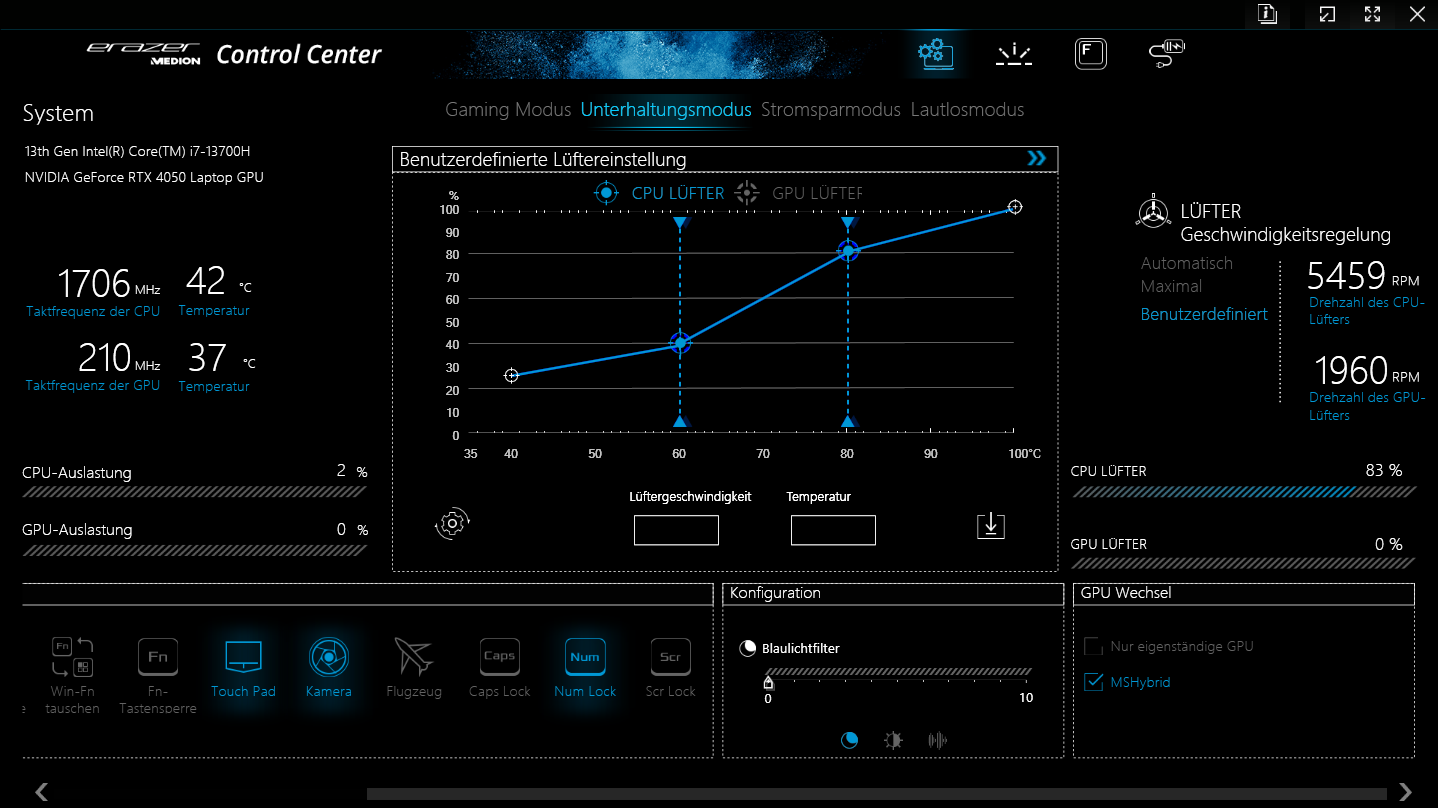
Los perfiles de rendimiento tienen una gran influencia en el desarrollo del ruido del portátil. Mientras se juega, el "modo Juego" producirá un nivel de ruido de unos 57 dB(A), y cuando se selecciona el "modo Entretenimiento", el nivel es notablemente inferior, de 50 dB(A). En cualquier caso, los valores son demasiado altos. La CPU y la GPU deberían refrigerarse lo suficiente incluso con ventiladores más lentos, y Medion aún tiene trabajo por hacer para actualizar el control de ventiladores.
Los otros dos modos son considerablemente más fáciles de usar, ya que hacen que el E20 funcione más silenciosamente. Aunque el "modo silencioso" no cumple lo que promete su nombre, permite jugar con un bajo nivel de ruido. Por ejemplo, el portátil pasa nuestra prueba The Witcher 3 a unos 34 dB(A).
Durante la inactividad o el funcionamiento diario (Office, Internet), el portátil funciona a menudo en silencio, y a veces incluso en silencio. Por otro lado, los ventiladores de vez en cuando también se aceleran innecesariamente (que es un fenómeno típico con Clevo barebones).
Ruido
| Ocioso |
| 26 / 27 / 32 dB(A) |
| Carga |
| 57 / 57 dB(A) |
 | ||
30 dB silencioso 40 dB(A) audible 50 dB(A) ruidosamente alto |
||
min: | ||
| Medion Erazer Scout E20 i7-13700H, GeForce RTX 4050 Laptop GPU | Gigabyte G7 KE i5-12500H, GeForce RTX 3060 Laptop GPU | MSI Katana 17 B13VFK i7-13620H, GeForce RTX 4060 Laptop GPU | Asus TUF Gaming A16 FA617 R7 7735HS, Radeon RX 7600S | Lenovo Legion 5 15IAH7H 82RB i7-12700H, GeForce RTX 3060 Laptop GPU | Acer Nitro 5 AN515-46-R1A1 R7 6800H, GeForce RTX 3070 Ti Laptop GPU | |
|---|---|---|---|---|---|---|
| Noise | -10% | -1% | 10% | 14% | -3% | |
| apagado / medio ambiente * (dB) | 25 | 27 -8% | 24.5 2% | 24 4% | 23.3 7% | 25 -0% |
| Idle Minimum * (dB) | 26 | 27 -4% | 24.5 6% | 24 8% | 23.5 10% | 25 4% |
| Idle Average * (dB) | 27 | 35 -30% | 24.5 9% | 25 7% | 23.5 13% | 28.6 -6% |
| Idle Maximum * (dB) | 32 | 38 -19% | 40 -25% | 28 12% | 26.8 16% | 44.3 -38% |
| Load Average * (dB) | 57 | 52 9% | 48.3 15% | 42 26% | 29.3 49% | 47.6 16% |
| Witcher 3 ultra * (dB) | 50 | 56 -12% | 56 -12% | 50 -0% | 51.4 -3% | |
| Load Maximum * (dB) | 57 | 59 -4% | 59.1 -4% | 50 12% | 53 7% | 53.6 6% |
* ... más pequeño es mejor
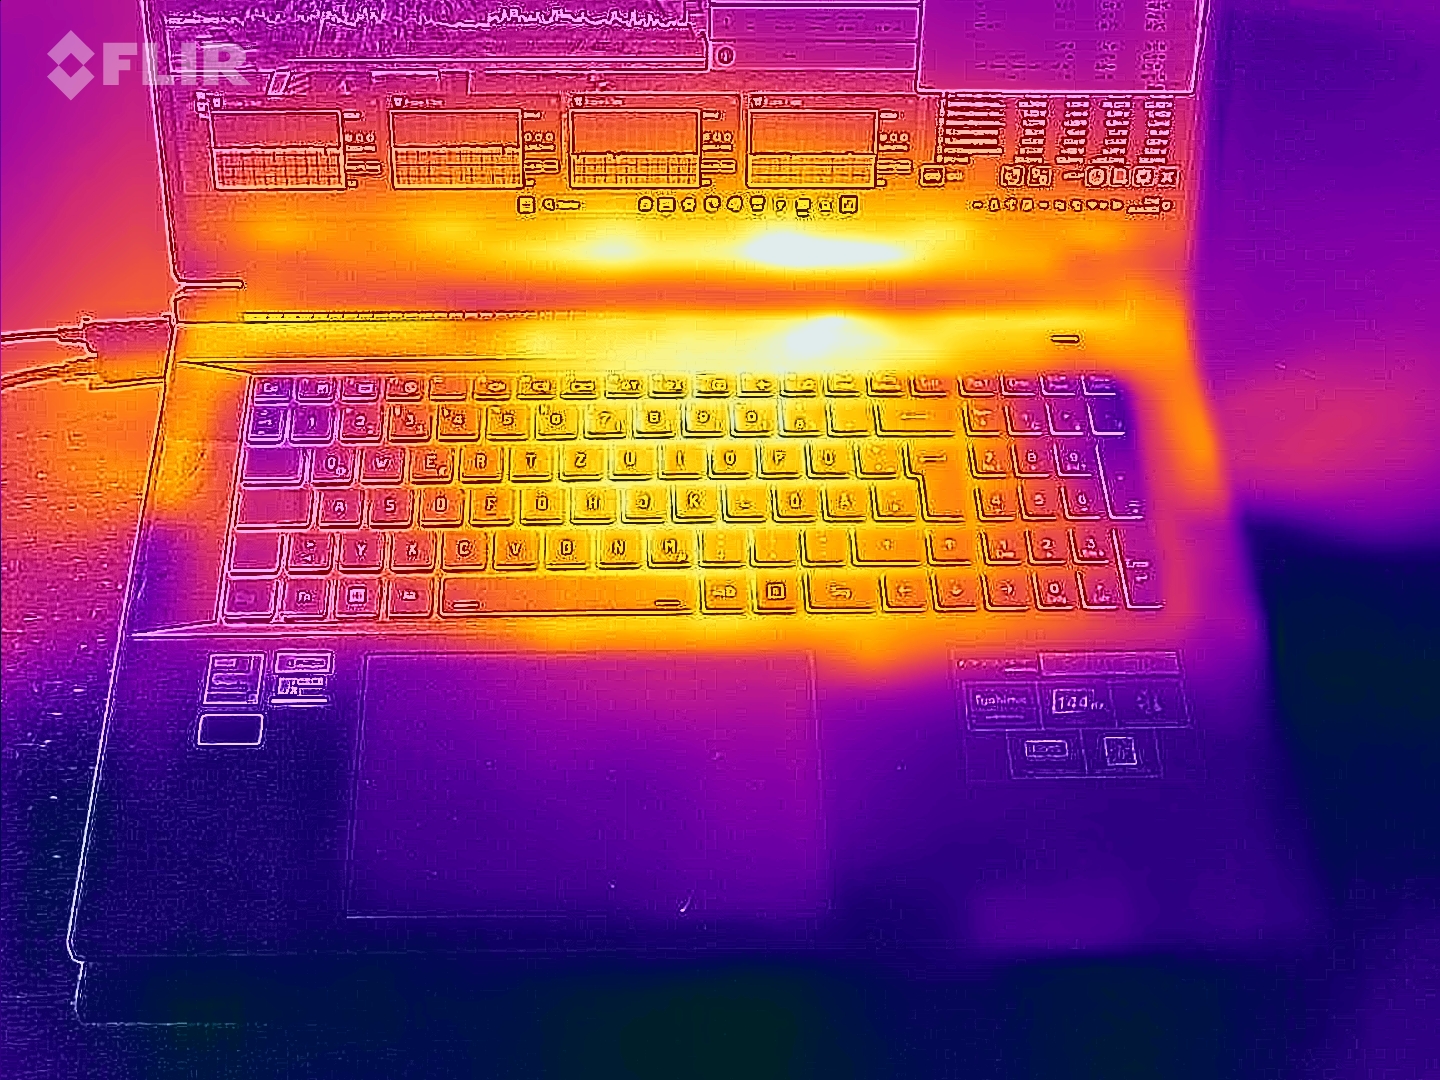
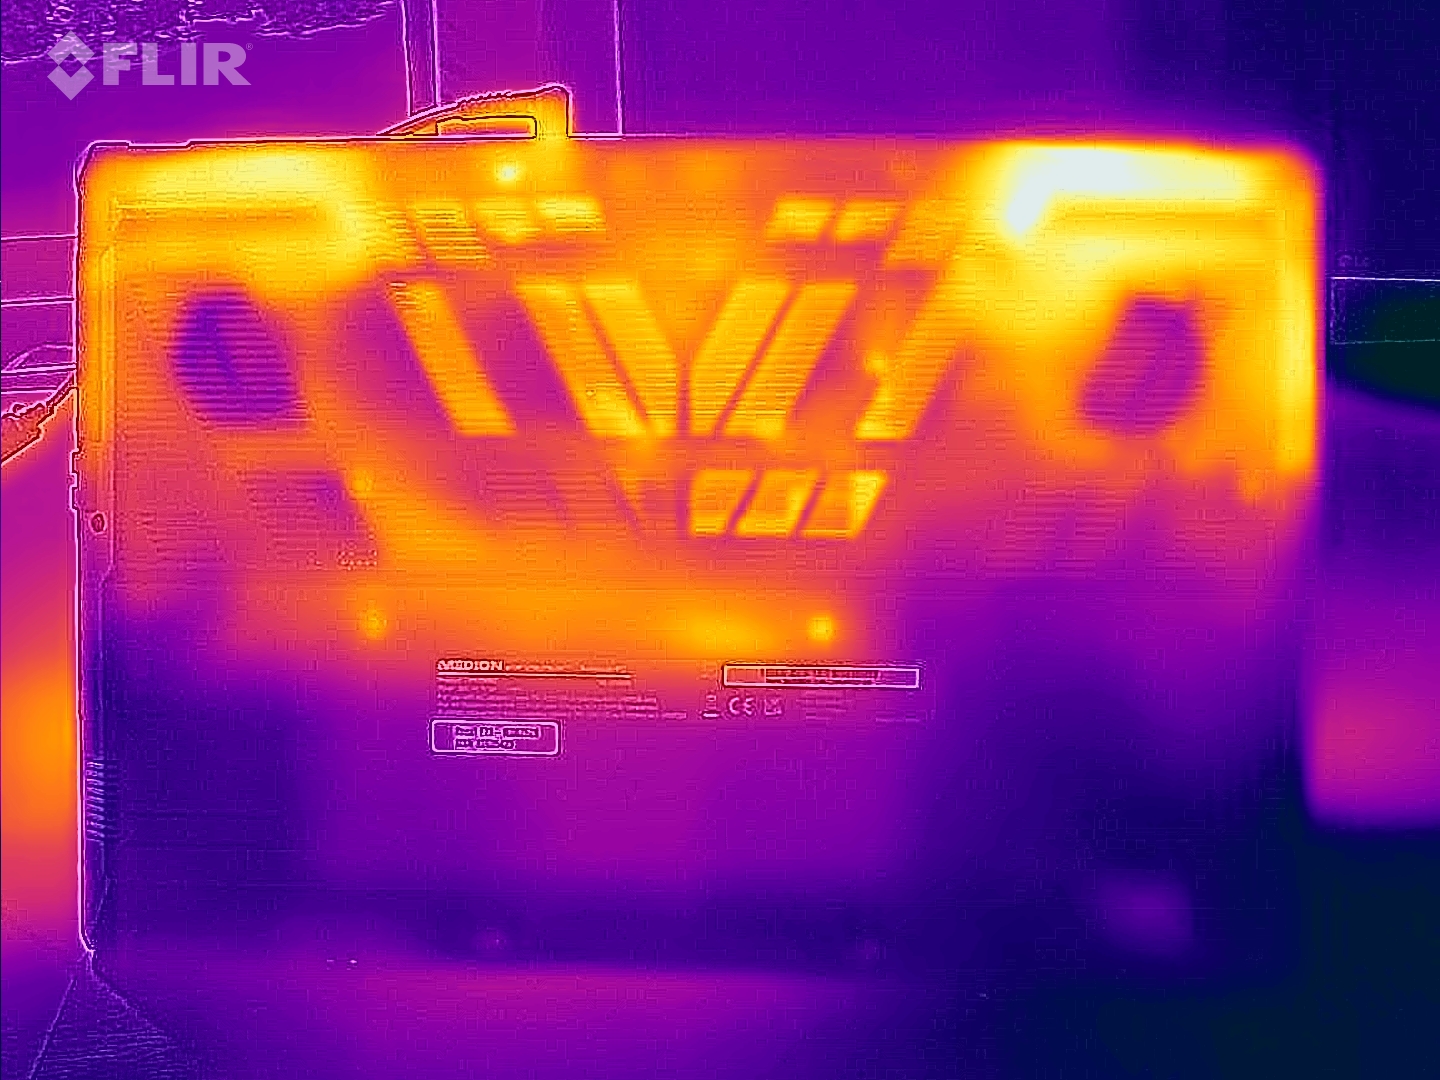
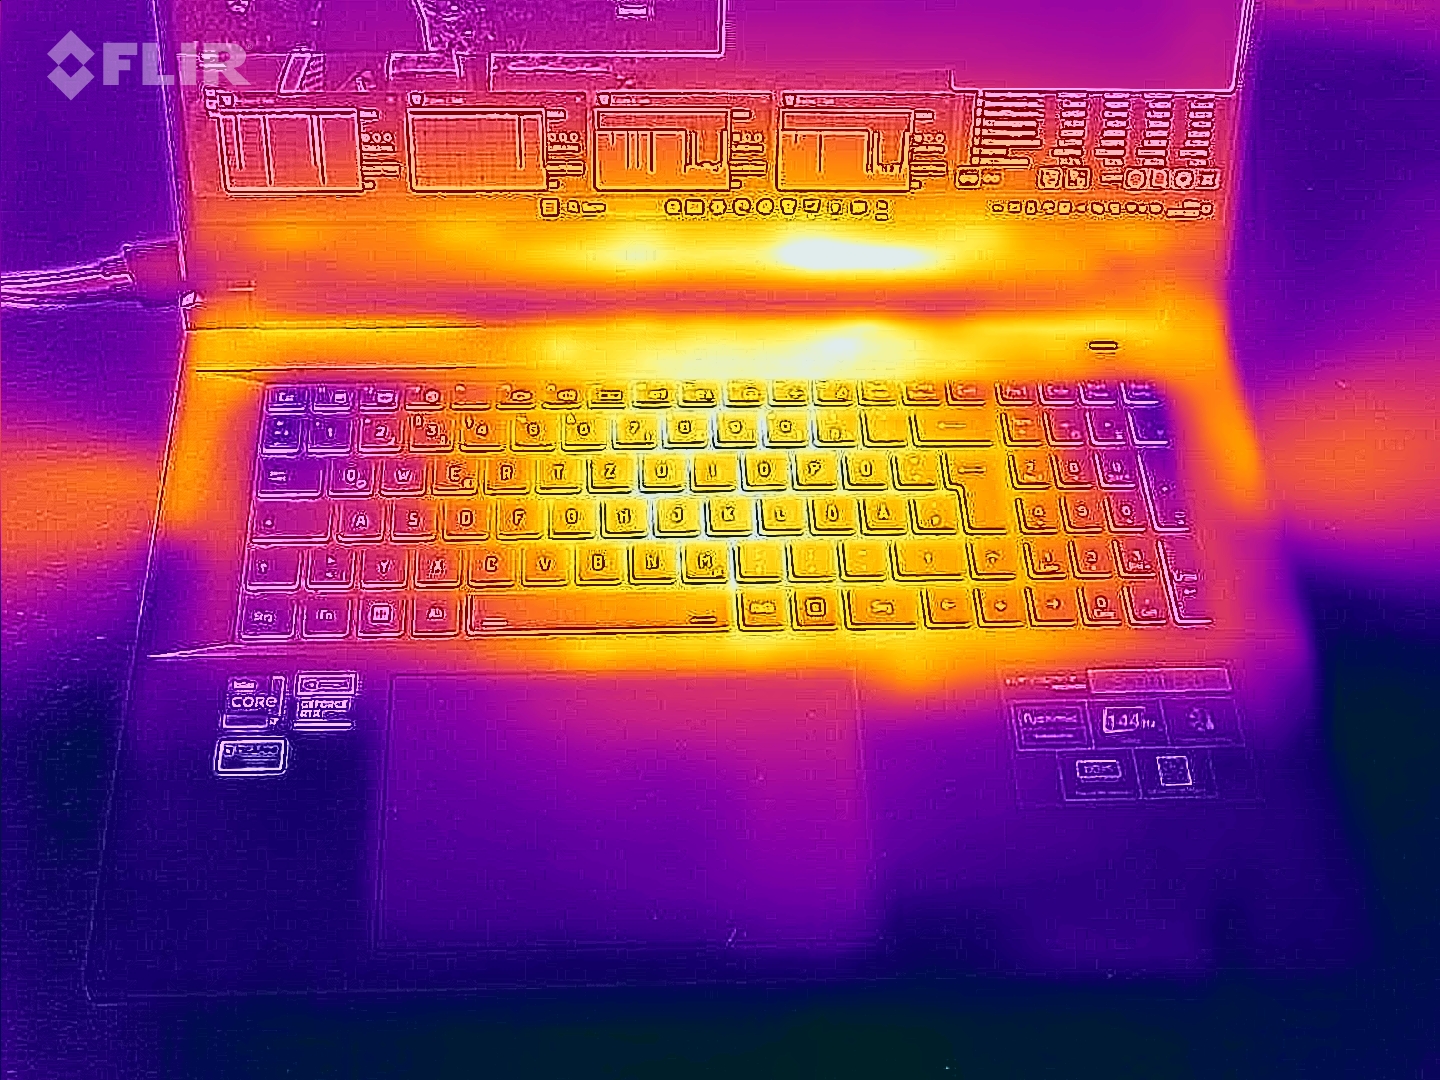
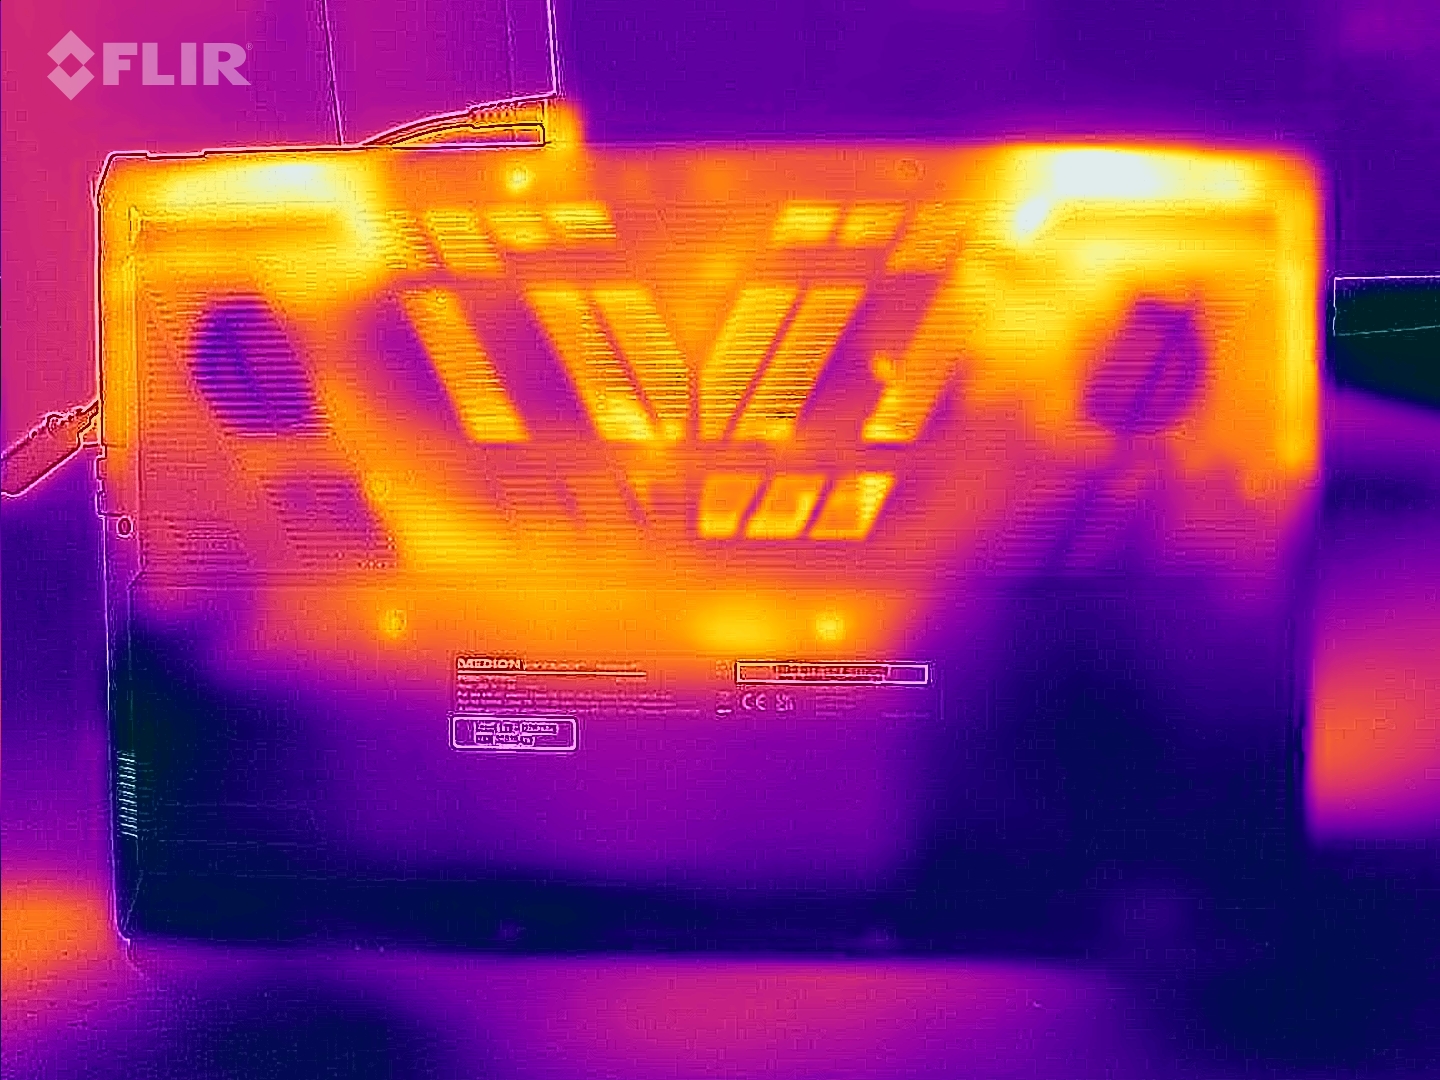
Temperaturas
El portátil se calienta moderadamente como mucho. La temperatura más alta se alcanza durante la prueba de estrés, con 41 °C en un único punto de medición. En el funcionamiento diario, las temperaturas se mantienen dentro del rango verde.
(±) La temperatura máxima en la parte superior es de 41 °C / 106 F, frente a la media de 40.4 °C / 105 F, que oscila entre 21.2 y 68.8 °C para la clase Gaming.
(+) El fondo se calienta hasta un máximo de 39 °C / 102 F, frente a la media de 43.2 °C / 110 F
(+) En reposo, la temperatura media de la parte superior es de 26.8 °C / 80# F, frente a la media del dispositivo de 33.9 °C / 93 F.
(±) Jugando a The Witcher 3, la temperatura media de la parte superior es de 34.1 °C / 93 F, frente a la media del dispositivo de 33.9 °C / 93 F.
(+) El reposamanos y el panel táctil están a una temperatura inferior a la de la piel, con un máximo de 26 °C / 78.8 F y, por tanto, son fríos al tacto.
(+) La temperatura media de la zona del reposamanos de dispositivos similares fue de 28.8 °C / 83.8 F (+2.8 °C / 5 F).
| Medion Erazer Scout E20 Intel Core i7-13700H, NVIDIA GeForce RTX 4050 Laptop GPU | Gigabyte G7 KE Intel Core i5-12500H, NVIDIA GeForce RTX 3060 Laptop GPU | MSI Katana 17 B13VFK Intel Core i7-13620H, NVIDIA GeForce RTX 4060 Laptop GPU | Asus TUF Gaming A16 FA617 AMD Ryzen 7 7735HS, AMD Radeon RX 7600S | Lenovo Legion 5 15IAH7H 82RB Intel Core i7-12700H, NVIDIA GeForce RTX 3060 Laptop GPU | Acer Nitro 5 AN515-46-R1A1 AMD Ryzen 7 6800H, NVIDIA GeForce RTX 3070 Ti Laptop GPU | |
|---|---|---|---|---|---|---|
| Heat | -16% | -10% | -30% | -1% | -13% | |
| Maximum Upper Side * (°C) | 41 | 52 -27% | 41.6 -1% | 54 -32% | 37.8 8% | 48.1 -17% |
| Maximum Bottom * (°C) | 39 | 54 -38% | 43.1 -11% | 47 -21% | 51 -31% | 49.7 -27% |
| Idle Upper Side * (°C) | 31 | 28 10% | 32 -3% | 40 -29% | 25.8 17% | 30 3% |
| Idle Bottom * (°C) | 29 | 32 -10% | 35.8 -23% | 40 -38% | 28.8 1% | 31.7 -9% |
* ... más pequeño es mejor
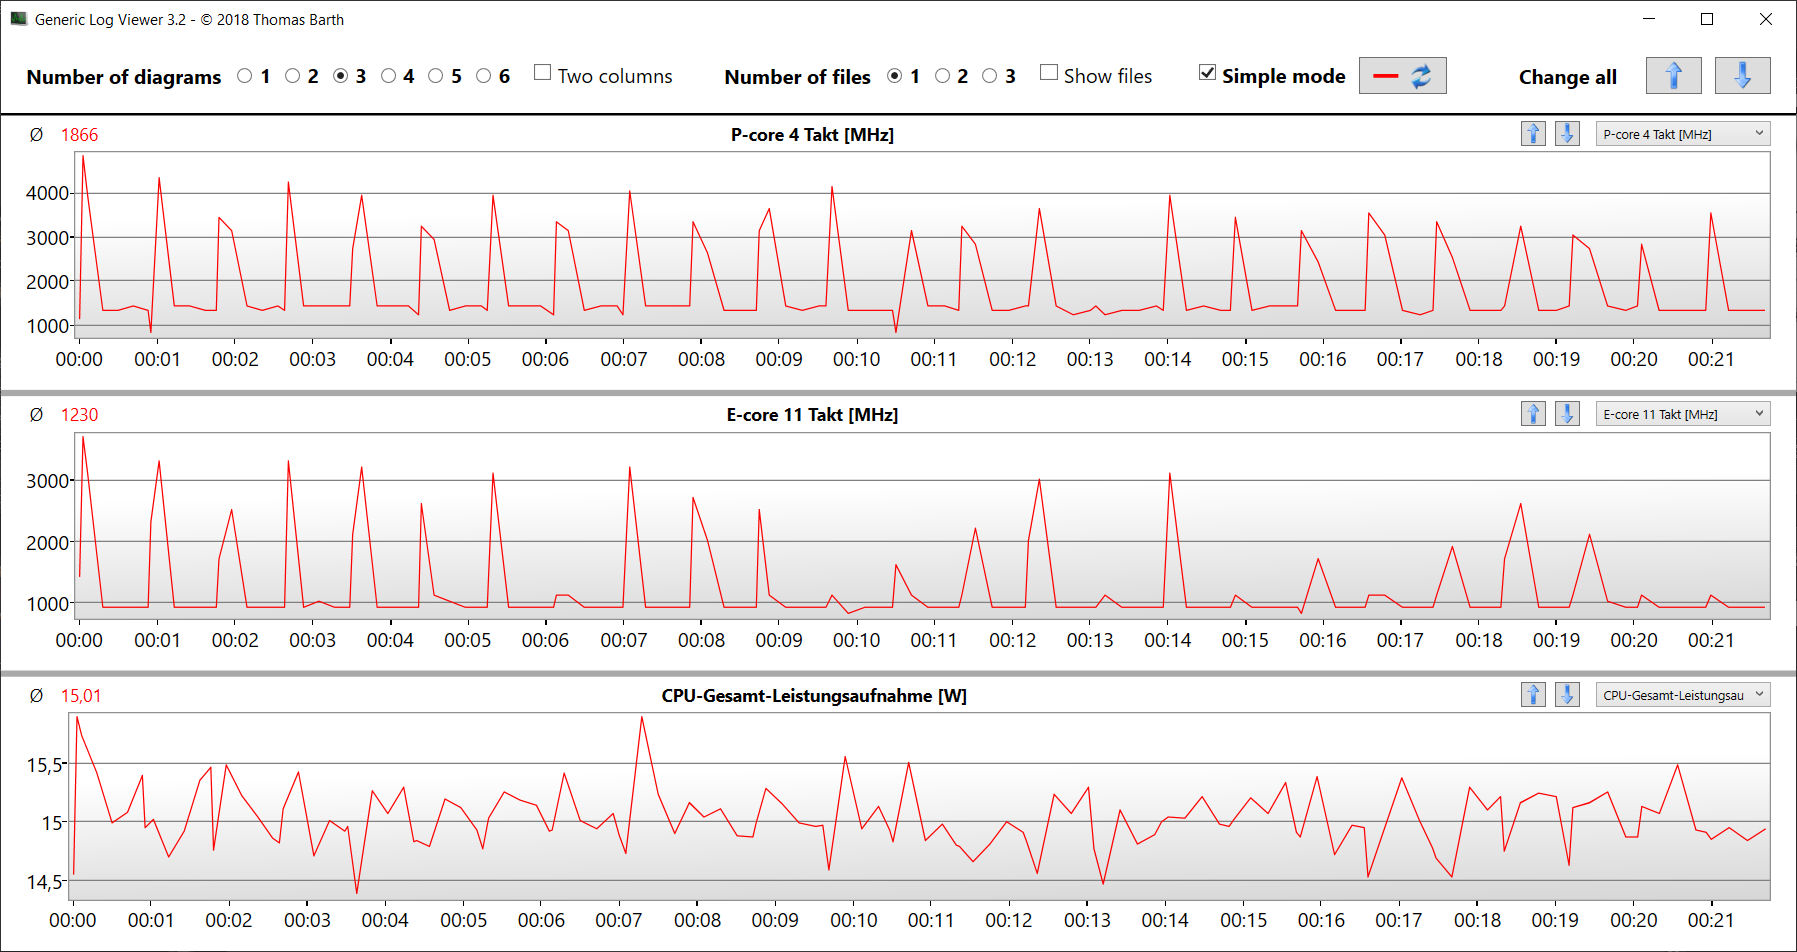
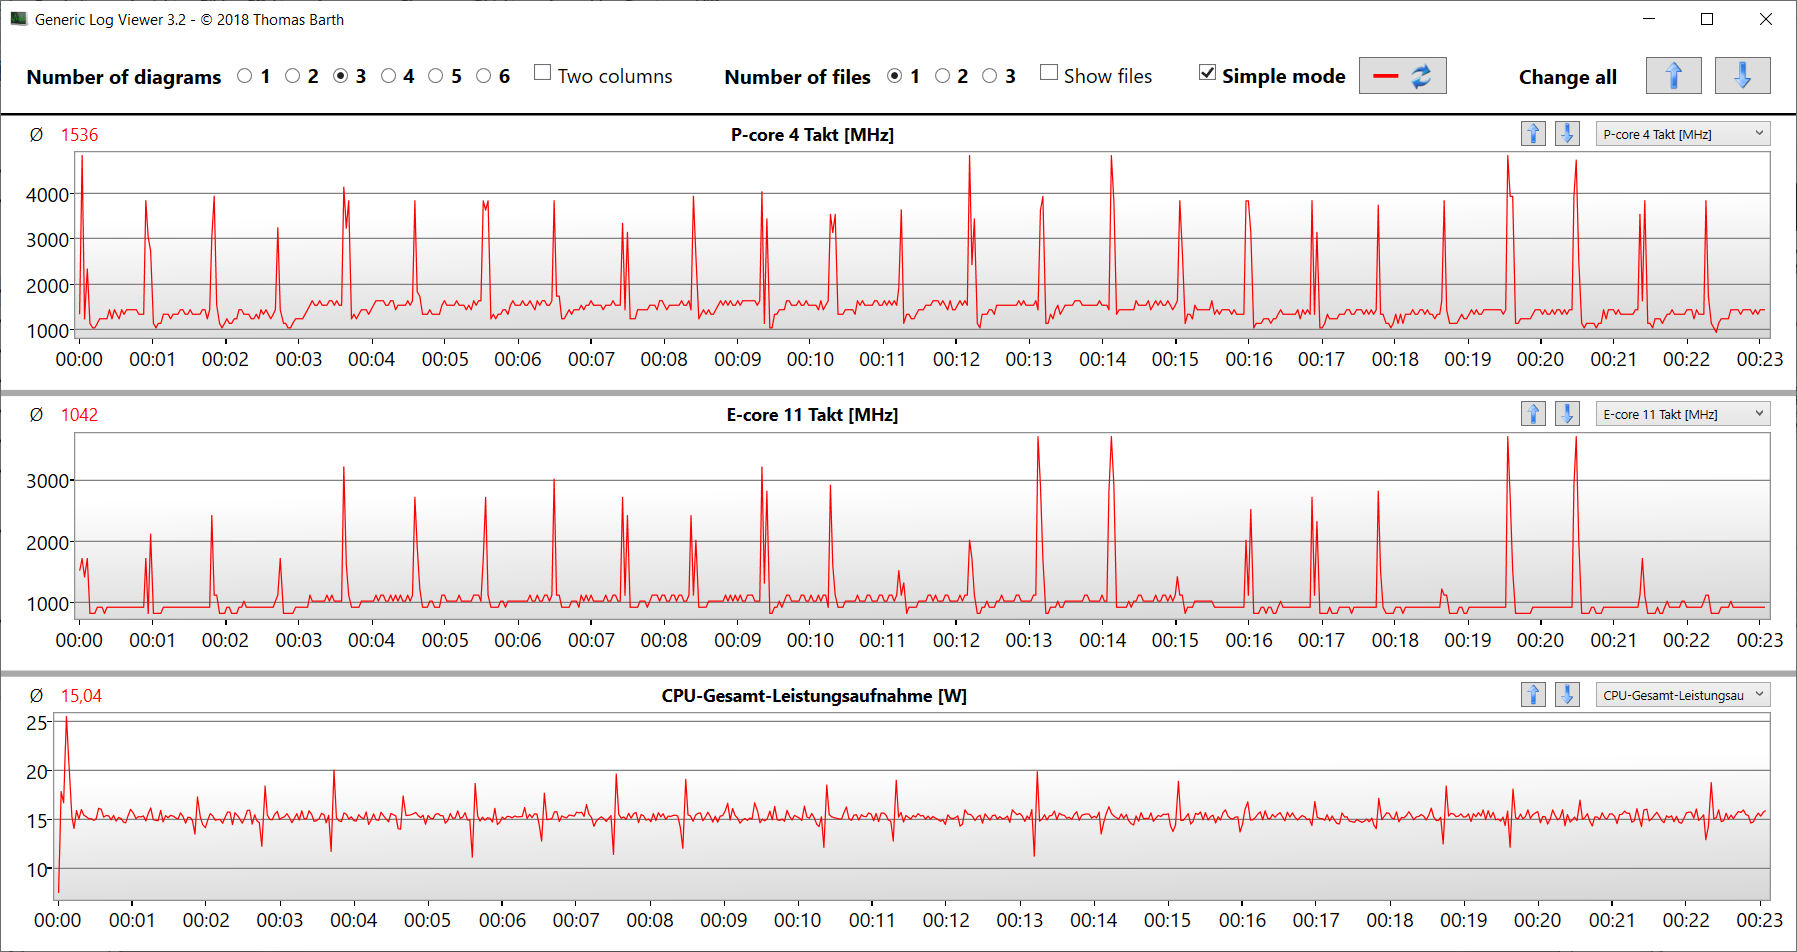
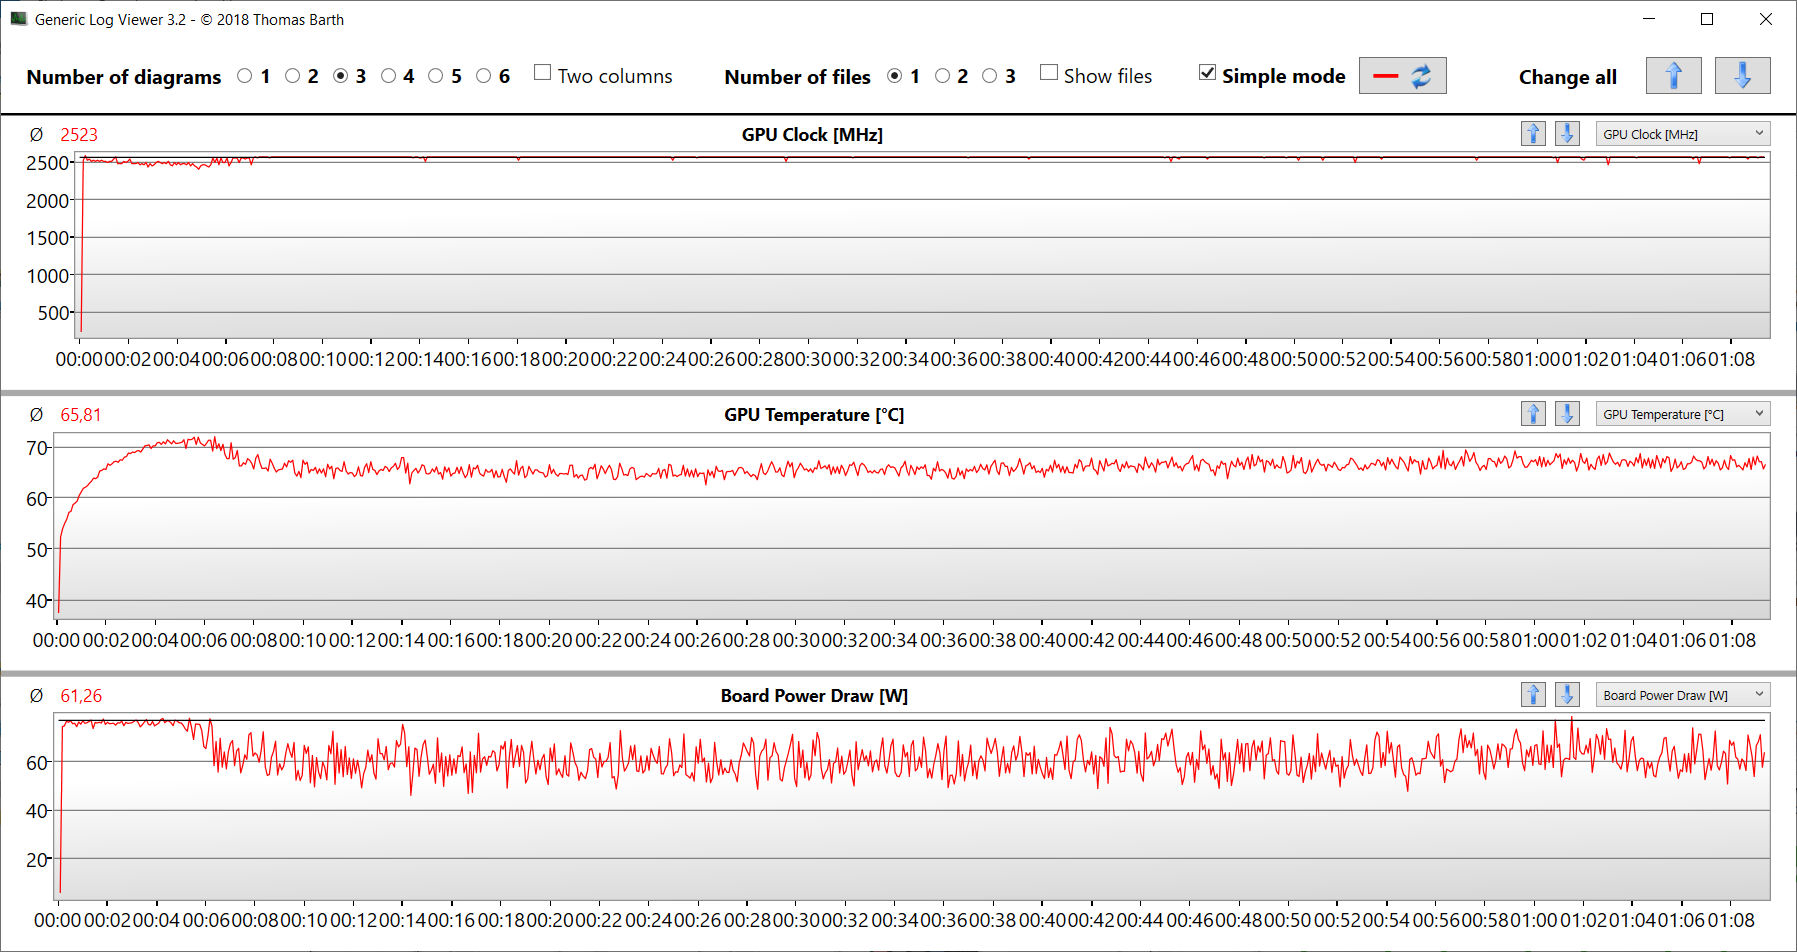
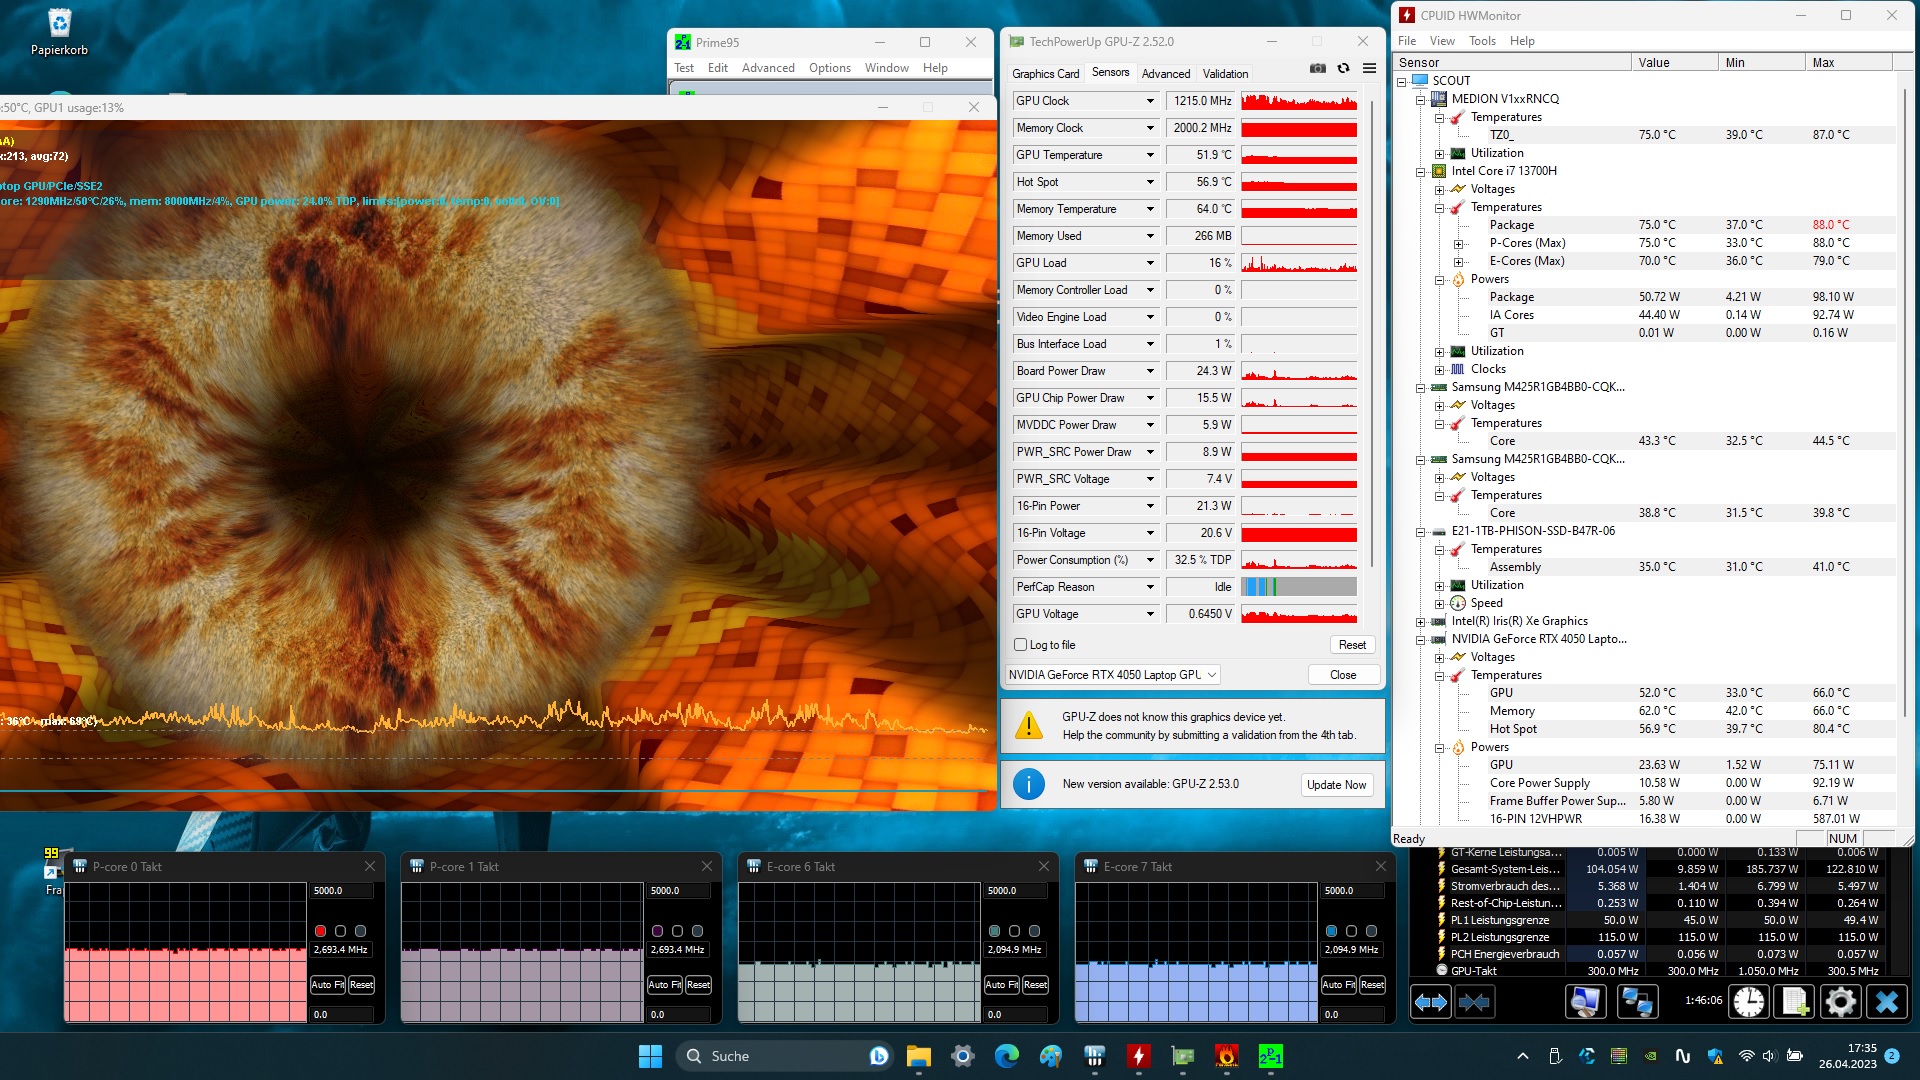
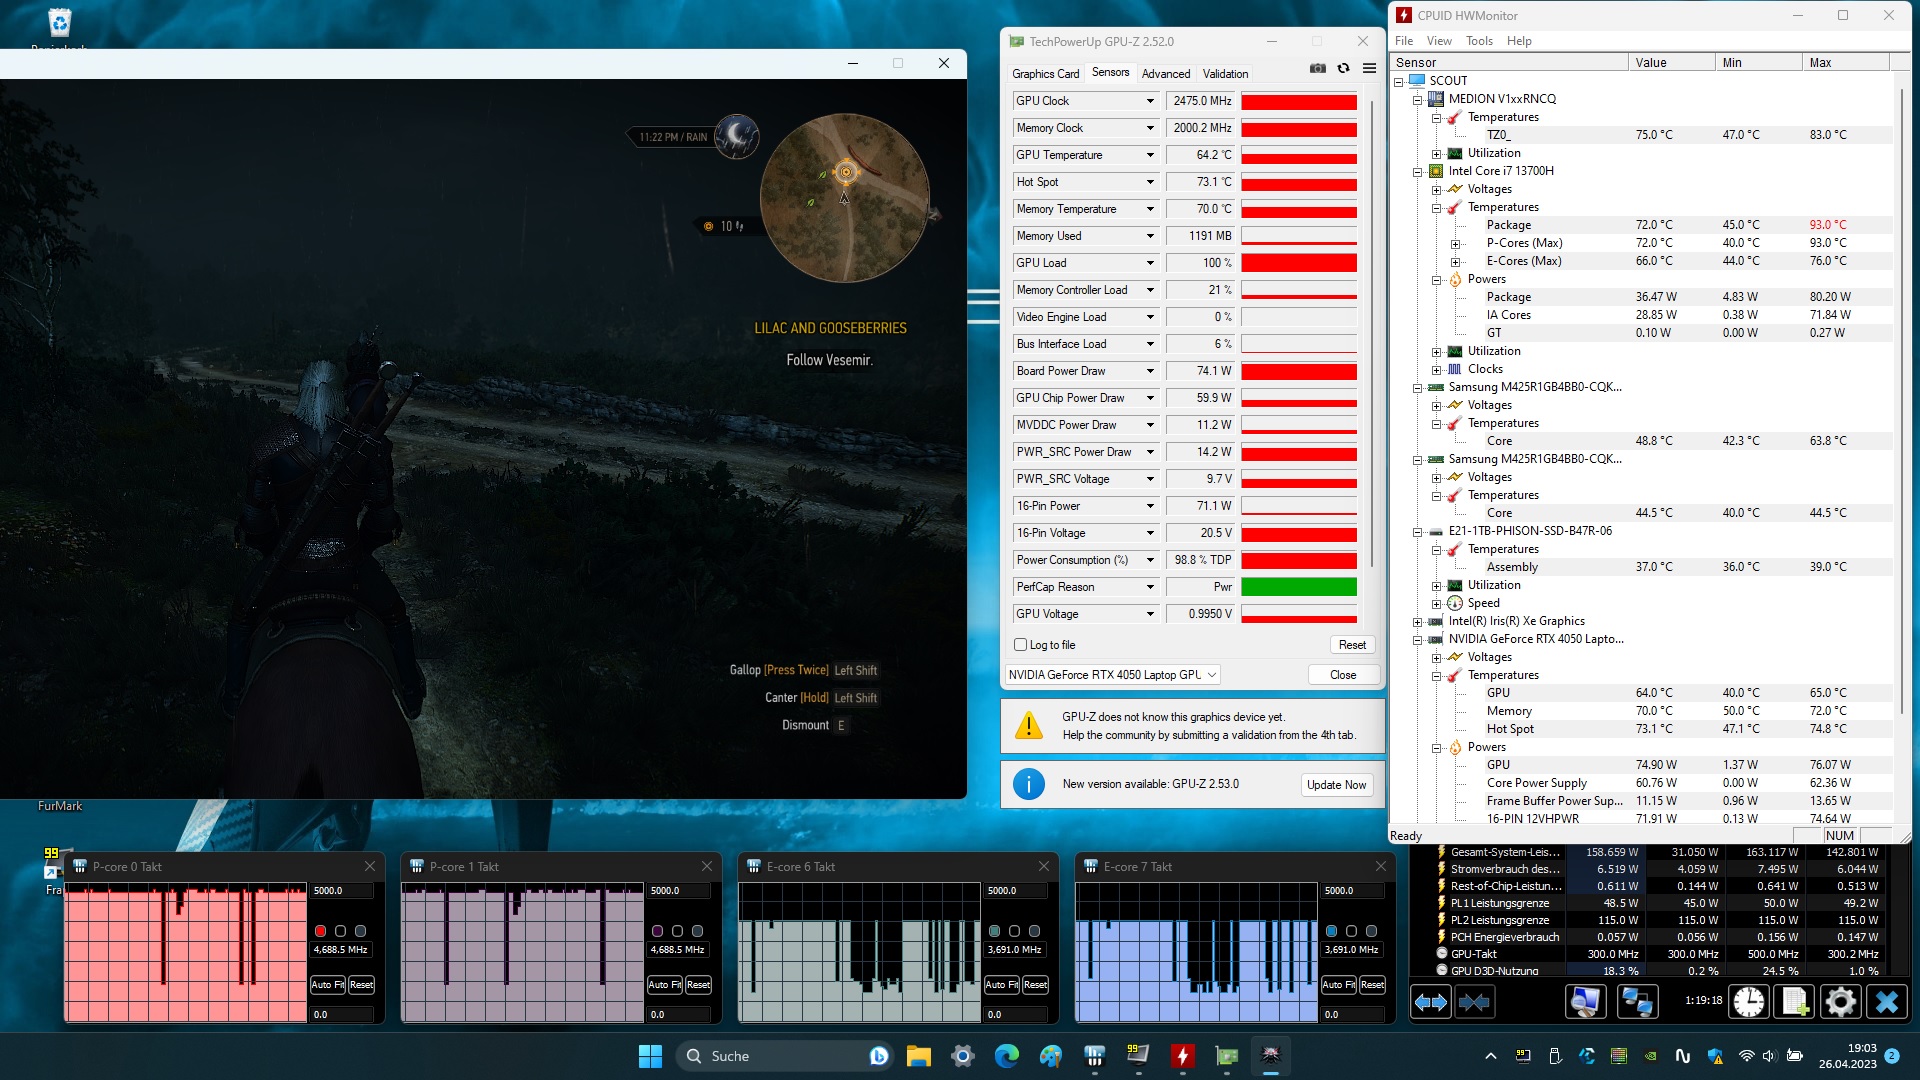
Prueba de resistencia
La prueba de estrés (con Prime95 y Furmark ejecutándose constantemente) representa un escenario extremo que utilizamos para evaluar la estabilidad del sistema a plena carga. La CPU comienza la prueba con velocidades de reloj medias-altas (P: 3,4 a 3,7 GHz, E: 2,8 a 2,9 GHz), y la GPU funciona a 2,3 GHz. A medida que avanza la prueba, las velocidades de reloj de la CPU y la GPU disminuyen.
Altavoces
Los altavoces estéreo producen un sonido escaso que, además, apenas ofrece graves. Para una mejor experiencia de escucha, recomendamos usar auriculares o altavoces externos.
Medion Erazer Scout E20 análisis de audio
(+) | los altavoces pueden reproducir a un volumen relativamente alto (#84 dB)
Graves 100 - 315 Hz
(-) | casi sin bajos - de media 33.1% inferior a la mediana
(±) | la linealidad de los graves es media (9.9% delta a frecuencia anterior)
Medios 400 - 2000 Hz
(±) | medias más altas - de media 6.6% más altas que la mediana
(±) | la linealidad de los medios es media (8.2% delta respecto a la frecuencia anterior)
Altos 2 - 16 kHz
(+) | máximos equilibrados - a sólo 2.1% de la mediana
(±) | la linealidad de los máximos es media (7.5% delta a frecuencia anterior)
Total 100 - 16.000 Hz
(±) | la linealidad del sonido global es media (22.2% de diferencia con la mediana)
En comparación con la misma clase
» 79% de todos los dispositivos probados de esta clase eran mejores, 6% similares, 14% peores
» El mejor tuvo un delta de 6%, la media fue 18%, el peor fue ###max##%
En comparación con todos los dispositivos probados
» 65% de todos los dispositivos probados eran mejores, 6% similares, 29% peores
» El mejor tuvo un delta de 4%, la media fue 23%, el peor fue ###max##%
MSI Katana 17 B13VFK análisis de audio
(±) | la sonoridad del altavoz es media pero buena (78.5 dB)
Graves 100 - 315 Hz
(-) | casi sin bajos - de media 17.7% inferior a la mediana
(±) | la linealidad de los graves es media (11.7% delta a frecuencia anterior)
Medios 400 - 2000 Hz
(±) | medias más altas - de media 6.8% más altas que la mediana
(+) | los medios son lineales (6.7% delta a la frecuencia anterior)
Altos 2 - 16 kHz
(+) | máximos equilibrados - a sólo 3.2% de la mediana
(±) | la linealidad de los máximos es media (7.2% delta a frecuencia anterior)
Total 100 - 16.000 Hz
(±) | la linealidad del sonido global es media (19.4% de diferencia con la mediana)
En comparación con la misma clase
» 67% de todos los dispositivos probados de esta clase eran mejores, 7% similares, 26% peores
» El mejor tuvo un delta de 6%, la media fue 18%, el peor fue ###max##%
En comparación con todos los dispositivos probados
» 48% de todos los dispositivos probados eran mejores, 7% similares, 45% peores
» El mejor tuvo un delta de 4%, la media fue 23%, el peor fue ###max##%
Gestión de la energía - El portátil Medion sólo ofrece una escasa duración de la batería
Consumo de energía
El consumo de energía del portátil Medion no muestra ningún comportamiento llamativo, y los valores oscilan en niveles normales para el hardware utilizado. El portátil pasa nuestro test Witcher 3 y el test de estrés con un consumo de energía constante. La fuente de alimentación de 230 vatios proporciona una cantidad suficiente de energía en todo momento.
| Off / Standby | |
| Ocioso | |
| Carga |
|
Clave:
min: | |
| Medion Erazer Scout E20 i7-13700H, GeForce RTX 4050 Laptop GPU | Gigabyte G7 KE i5-12500H, GeForce RTX 3060 Laptop GPU | MSI Katana 17 B13VFK i7-13620H, GeForce RTX 4060 Laptop GPU | Asus TUF Gaming A16 FA617 R7 7735HS, Radeon RX 7600S | Lenovo Legion 5 15IAH7H 82RB i7-12700H, GeForce RTX 3060 Laptop GPU | Acer Nitro 5 AN515-46-R1A1 R7 6800H, GeForce RTX 3070 Ti Laptop GPU | Medio NVIDIA GeForce RTX 4050 Laptop GPU | Media de la clase Gaming | |
|---|---|---|---|---|---|---|---|---|
| Power Consumption | -51% | -25% | -5% | -104% | -25% | -23% | -58% | |
| Idle Minimum * (Watt) | 5 | 15 -200% | 12.2 -144% | 8 -60% | 19.8 -296% | 7 -40% | 9.95 ? -99% | 13 ? -160% |
| Idle Average * (Watt) | 11 | 17 -55% | 14.9 -35% | 11 -0% | 26.2 -138% | 8.9 19% | 15.8 ? -44% | 19 ? -73% |
| Idle Maximum * (Watt) | 22 | 24 -9% | 15.8 28% | 16 27% | 48.2 -119% | 14.4 35% | 20.1 ? 9% | 24.6 ? -12% |
| Load Average * (Watt) | 96 | 111 -16% | 85.22 11% | 97 -1% | 102.9 -7% | 202 -110% | 88 ? 8% | 110.7 ? -15% |
| Witcher 3 ultra * (Watt) | 145.2 | 174.1 -20% | 151.1 -4% | 161.5 -11% | 186.7 -29% | 203 -40% | ||
| Load Maximum * (Watt) | 201 | 208 -3% | 212.8 -6% | 168 16% | 268 -33% | 230 -14% | 176.3 ? 12% | 259 ? -29% |
* ... más pequeño es mejor
Power Consumption The Witcher 3 / Stress Test
Power Consumption With External Monitor
Duración de la batería
En nuestra prueba WLAN de llamada a sitios web mediante script y la prueba de vídeo reproduciendo el corto Big Buck Bunny (codificación H.264, FHD) en bucle, el portátil de 17,3 pulgadas logra tiempos de ejecución de 4:44 h y 4:37 h respectivamente. Durante ambas pruebas, las funciones de ahorro de energía del portátil están desactivadas y el brillo de la pantalla se ajusta a unos 150 cd/m². Además, los módulos de comunicación también se apagan mientras se ejecuta la prueba de vídeo.
| Medion Erazer Scout E20 i7-13700H, GeForce RTX 4050 Laptop GPU, 53.35 Wh | Gigabyte G7 KE i5-12500H, GeForce RTX 3060 Laptop GPU, 54 Wh | MSI Katana 17 B13VFK i7-13620H, GeForce RTX 4060 Laptop GPU, 53.5 Wh | Asus TUF Gaming A16 FA617 R7 7735HS, Radeon RX 7600S, 90 Wh | Lenovo Legion 5 15IAH7H 82RB i7-12700H, GeForce RTX 3060 Laptop GPU, 80 Wh | Acer Nitro 5 AN515-46-R1A1 R7 6800H, GeForce RTX 3070 Ti Laptop GPU, 57.5 Wh | Media de la clase Gaming | |
|---|---|---|---|---|---|---|---|
| Duración de Batería | -12% | -36% | 119% | 0% | 23% | 39% | |
| Reader / Idle (h) | 6.7 | 7.1 6% | 20.2 201% | 8.1 21% | 10.5 57% | 8.27 ? 23% | |
| H.264 (h) | 4.6 | 2.2 -52% | 5.7 24% | 8.32 ? 81% | |||
| WiFi v1.3 (h) | 4.7 | 5.3 13% | 2.9 -38% | 12.1 157% | 5 6% | 5.8 23% | 7.11 ? 51% |
| Load (h) | 1.5 | 1.3 -13% | 1 -33% | 1.5 0% | 1.1 -27% | 1.3 -13% | 1.502 ? 0% |
Pro
Contra
Veredicto - Un portátil para juegos muy completo del segmento básico
Aunque el Erazer Scout E20 se centra en los juegos FHD, el portátil también destaca en otras áreas como el renderizado y el procesamiento de vídeo. ElCore i7-13700Hy GeForce RTX 4050son capaces de funcionar a altas velocidades de reloj, y un SSD de 1 TB garantiza tiempos de carga cortos y proporciona el espacio de almacenamiento necesario.
Con el Erazer Scout E20, Medion ofrece un portátil gaming consistente del segmento básico. El control del ventilador aún podría ajustarse un poco.
Aunque el portátil se calienta moderadamente bajo carga, puede producir mucho ruido. Afortunadamente, hay un "modo silencioso" que permite jugar con un bajo nivel de ruido, pero no en silencio.
Una duración de batería realista de apenas 4,5 a 5 horas no inspira ningún entusiasmo, y la capacidad relativamente baja de la batería de 53,35 Wh se hace notar aquí. Dado que la batería no se puede cargar con un cargador USB-C, siempre tendrías que traer la fuente de alimentación. La pantalla mate de 17.3 pulgadas (FHD, IPS, 144 Hz, sRGB) dejó una buena impresión en general.
Una alternativa al E20 podría ser elAsus TUF Gaming A16 Advantage Edition. Mientras que el rendimiento se sitúa a un nivel similar, puede puntuar con una duración de batería significativamente mayor y una pantalla en formato 16:10. Una alternativa económica sería elGigabyte G7 KEque tiene un rendimiento gráfico comparable pero un precio de compra unos 450 euros inferior. Sin embargo, no incluye sistema operativo Windows.
Precio y disponibilidad
En Alemania, el Medion Erazer Scout E20 está disponible en la tienda online Medionpor casi 1.500 euros (~1.658 dólares). Está basado en el Clevo V170RNCQ, disponible en Clevo por 1.399 euros (~$1,547). Clevo también ofrece distintas opciones de configuración.
Medion Erazer Scout E20
- 05/16/2023 v7 (old)
Sascha Mölck
Transparencia
La selección de los dispositivos que se van a reseñar corre a cargo de nuestro equipo editorial. La muestra de prueba fue proporcionada al autor en calidad de préstamo por el fabricante o el minorista a los efectos de esta reseña. El prestamista no tuvo ninguna influencia en esta reseña, ni el fabricante recibió una copia de la misma antes de su publicación. No había ninguna obligación de publicar esta reseña. Como empresa de medios independiente, Notebookcheck no está sujeta a la autoridad de fabricantes, minoristas o editores.
Así es como prueba Notebookcheck
Cada año, Notebookcheck revisa de forma independiente cientos de portátiles y smartphones utilizando procedimientos estandarizados para asegurar que todos los resultados son comparables. Hemos desarrollado continuamente nuestros métodos de prueba durante unos 20 años y hemos establecido los estándares de la industria en el proceso. En nuestros laboratorios de pruebas, técnicos y editores experimentados utilizan equipos de medición de alta calidad. Estas pruebas implican un proceso de validación en varias fases. Nuestro complejo sistema de clasificación se basa en cientos de mediciones y puntos de referencia bien fundamentados, lo que mantiene la objetividad.Price comparison

