El portátil Core i7-12700H más rápido que puedes comprar: Lenovo Legion 5 15IAH7H análisis
El 2022 Legion 5 15 es una actualización importante sobre el 2021 Legion 5 15. Utiliza la misma GPU, aunque con un objetivo de TGP más elevado (140 W frente a 130 W), y actualiza la CPU a la última serie Alder Lake-H de 12ª generación. El chasis externo también se ha actualizado para darle un aspecto más nuevo y elegante.
Nuestra configuración de análisis es una configuración de gama media con el Core i7-12700H, la GPU GeForce RTX 3060 y la pantalla IPS de 1080p165 por unos 1600 dólares al por menor. Hay otras versiones disponibles con la CPU Core i5-12500H de menor potencia, pantalla de 144 Hz, o la más rápida GeForce RTX 3070 Ti.
Entre los competidores del Legion 5 15 se encuentran otros portátiles de juego de gama media de 15,6 pulgadas como el Razer Blade 15 Base Edition, Asus TUF Gaming F15, MSI Bravo 15, o Acer Aspire Nitro 5. El Legion 5 15 no debe confundirse con el Legion 5 Pro que es un diseño más grande de 16 pulgadas.
Todas las opciones de especificaciones se pueden encontrar en el PDF oficial de Lenovo aquí.
Más opiniones de Lenovo:
Posibles contendientes en la comparación
Valoración | Fecha | Modelo | Peso | Altura | Tamaño | Resolución | Precio |
|---|---|---|---|---|---|---|---|
| 87.5 % v7 (old) | 11/2022 | Lenovo Legion 5 15IAH7H 82RB i7-12700H, GeForce RTX 3060 Laptop GPU | 2.4 kg | 19.99 mm | 15.60" | 1920x1080 | |
| 83.4 % v7 (old) | 09/2021 | Lenovo Legion 5 15ACH-82JU00C6GE-FL R7 5800H, GeForce RTX 3060 Laptop GPU | 2.5 kg | 26 mm | 15.60" | 1920x1080 | |
| 78.2 % v7 (old) | 04/2022 | MSI Bravo 15 B5DD-010US R5 5600H, Radeon RX 5500M | 2.3 kg | 24.95 mm | 15.60" | 1920x1080 | |
| 87.2 % v7 (old) | 03/2022 | Asus TUF Gaming F15 FX507ZM i7-12700H, GeForce RTX 3060 Laptop GPU | 2.1 kg | 24.95 mm | 15.60" | 1920x1080 | |
| 80.5 % v7 (old) | 05/2021 | Acer Aspire Nitro 5 AN515-55-57GF i5-10300H, GeForce RTX 3060 Laptop GPU | 2.3 kg | 23.9 mm | 15.60" | 1920x1080 | |
| 85.5 % v7 (old) | 03/2021 | Razer Blade 15 Base Edition 2021, i7-10750H RTX 3060 i7-10750H, GeForce RTX 3060 Laptop GPU | 2.1 kg | 19.9 mm | 15.60" | 1920x1080 |
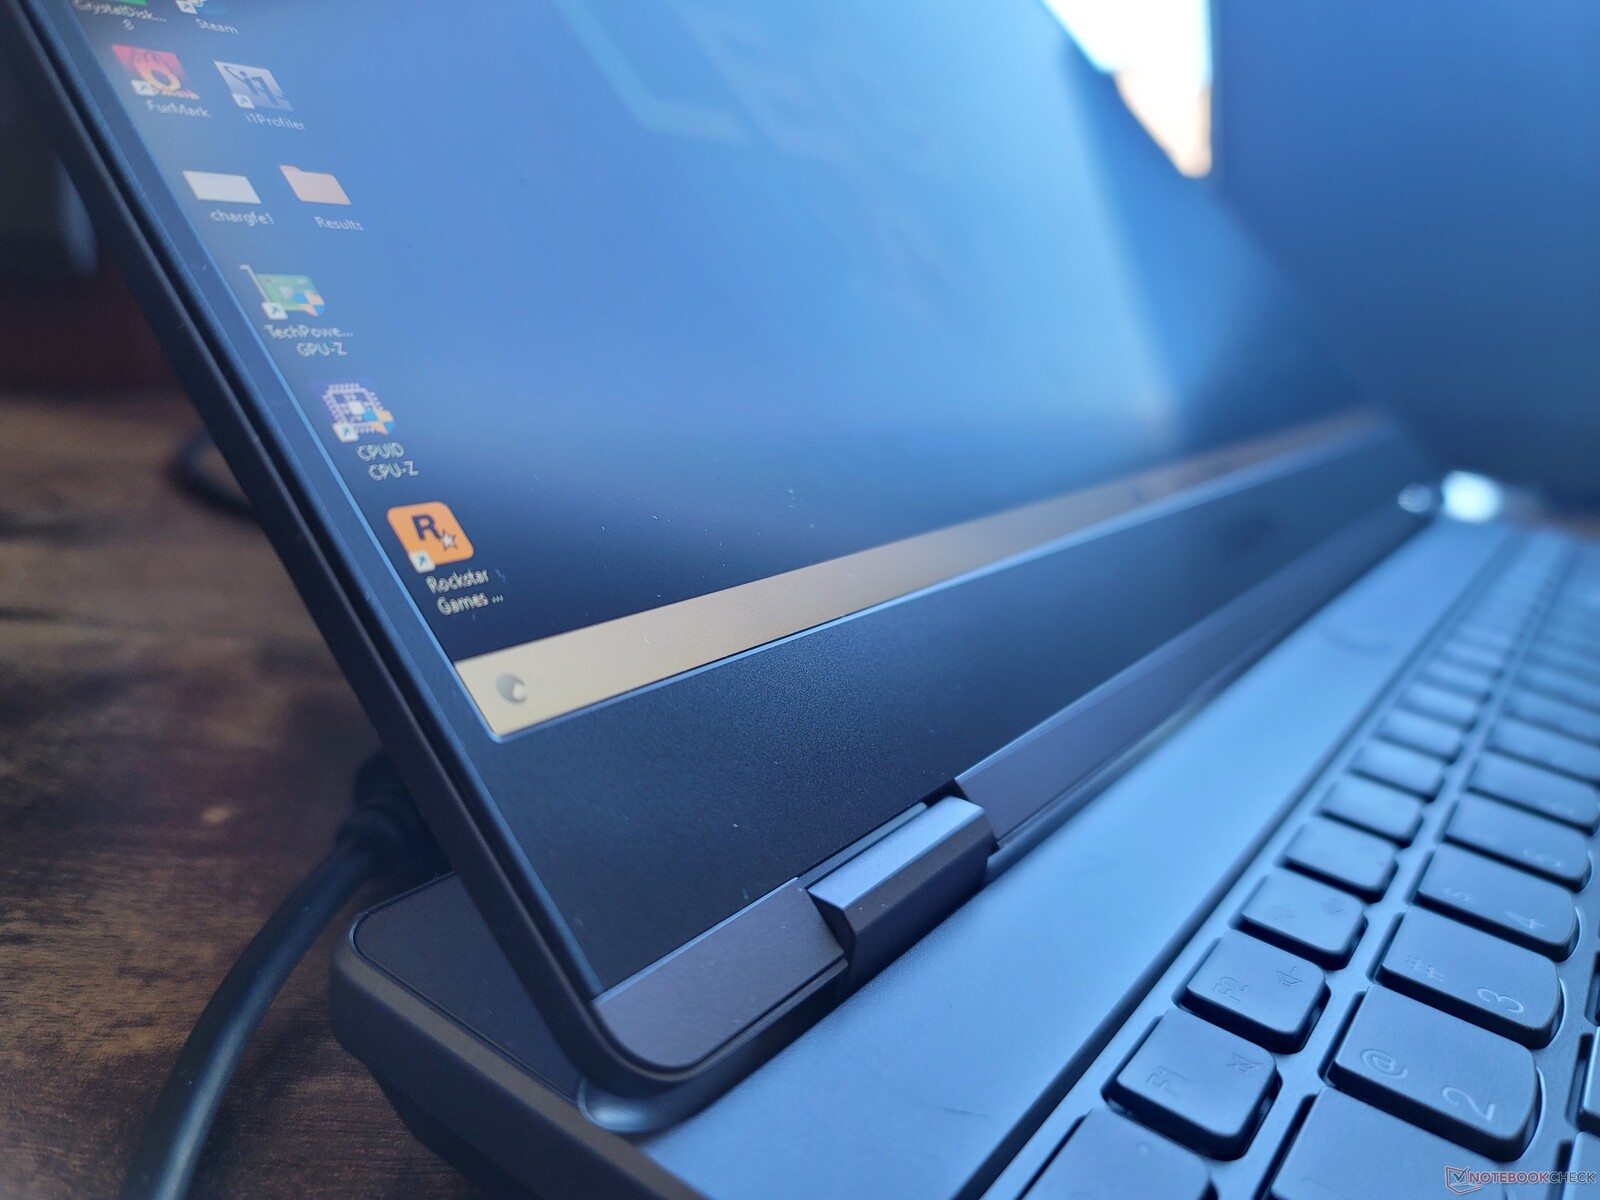
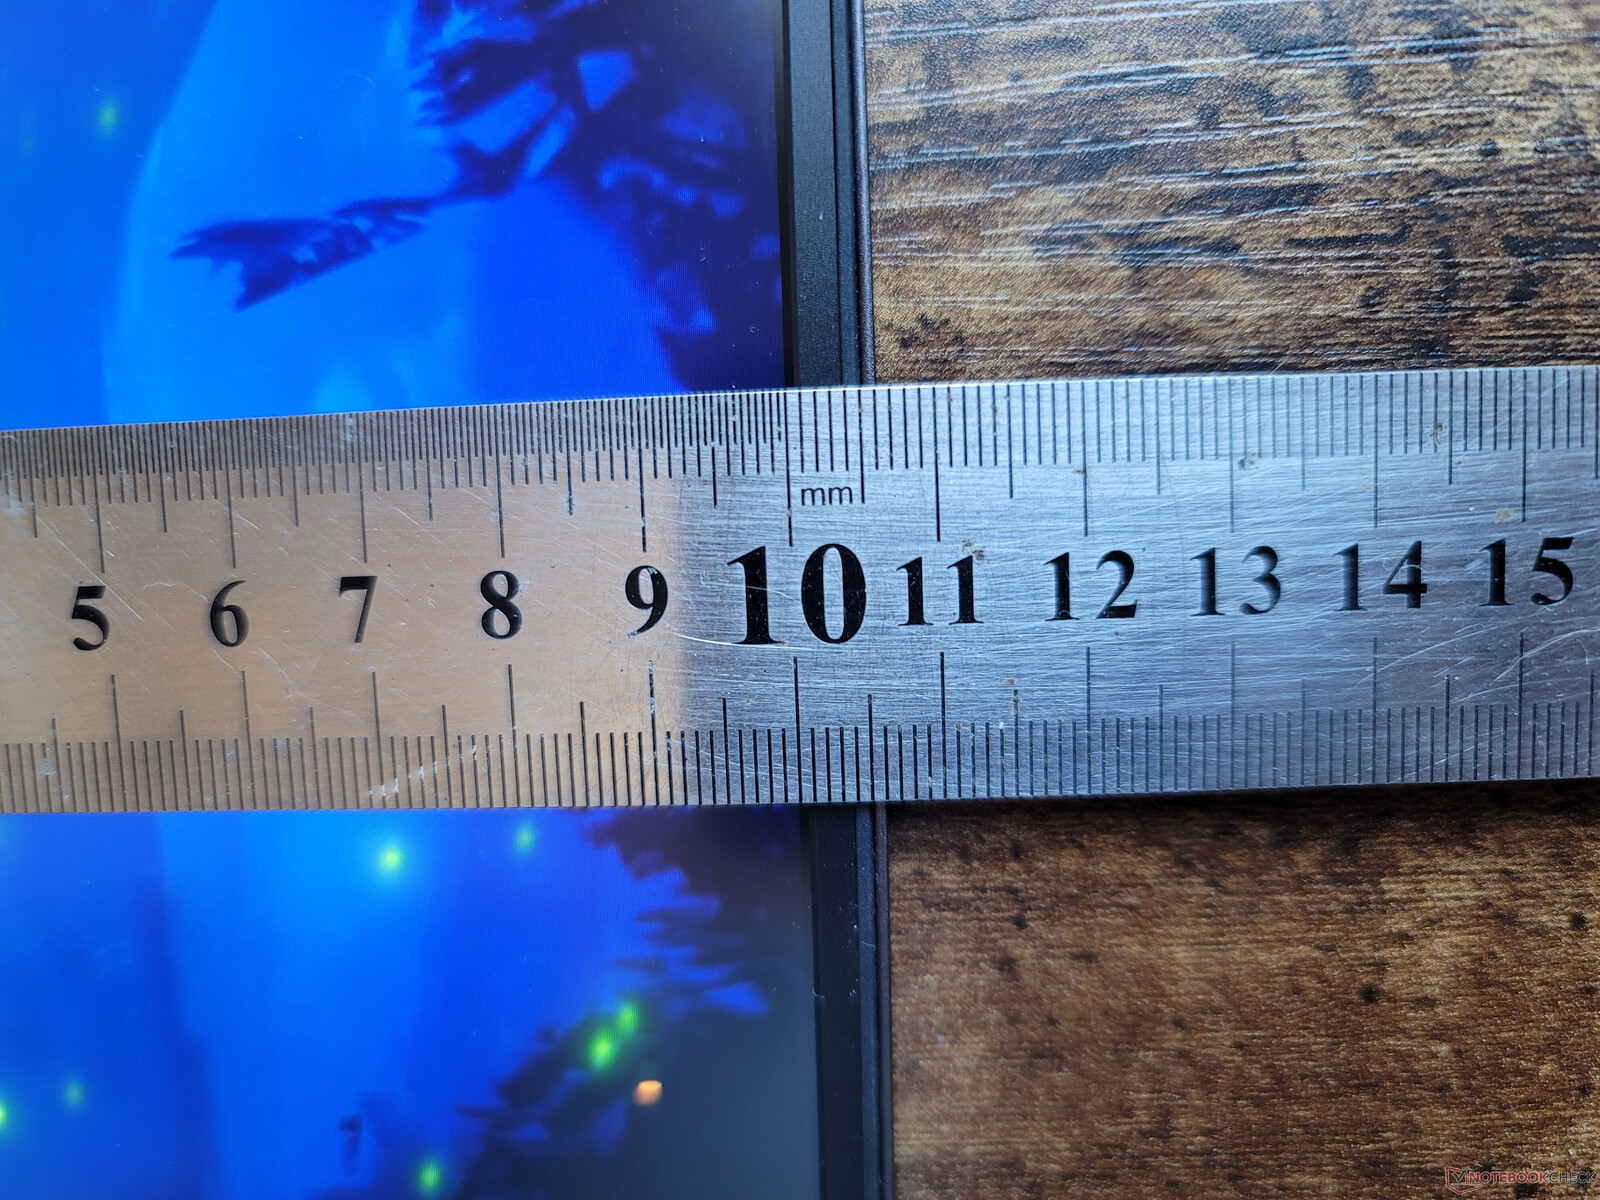
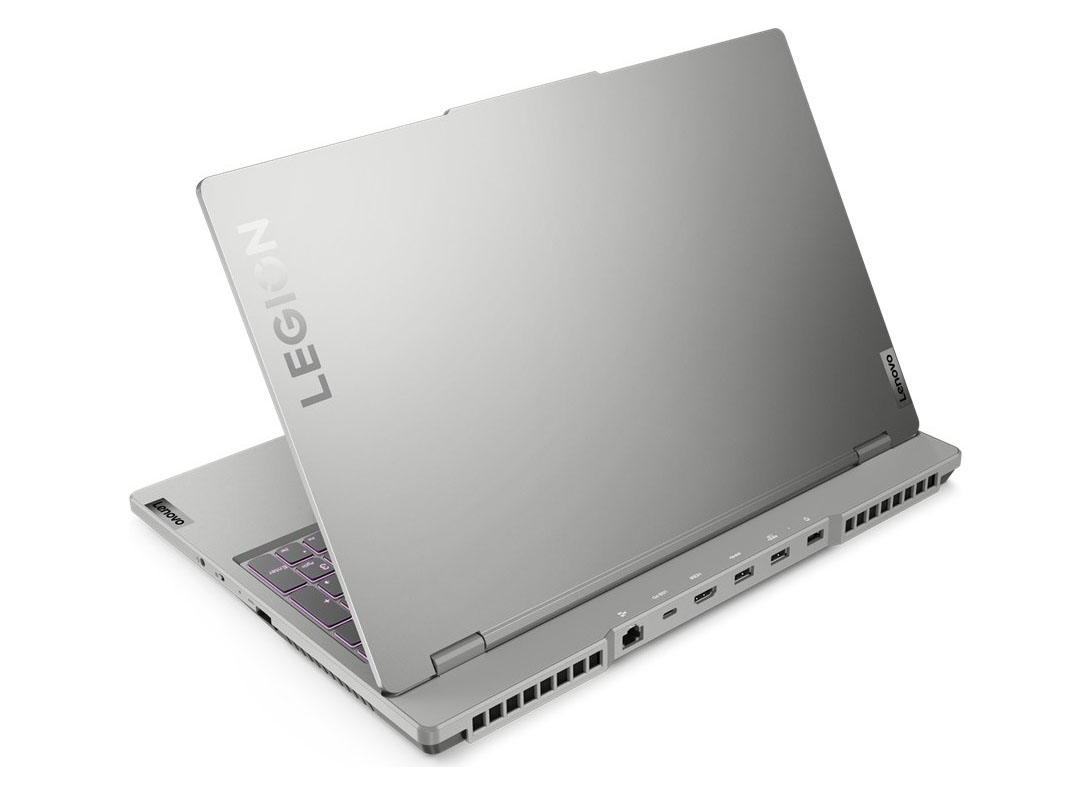
Caso - Legion con una pizca de ThinkBook
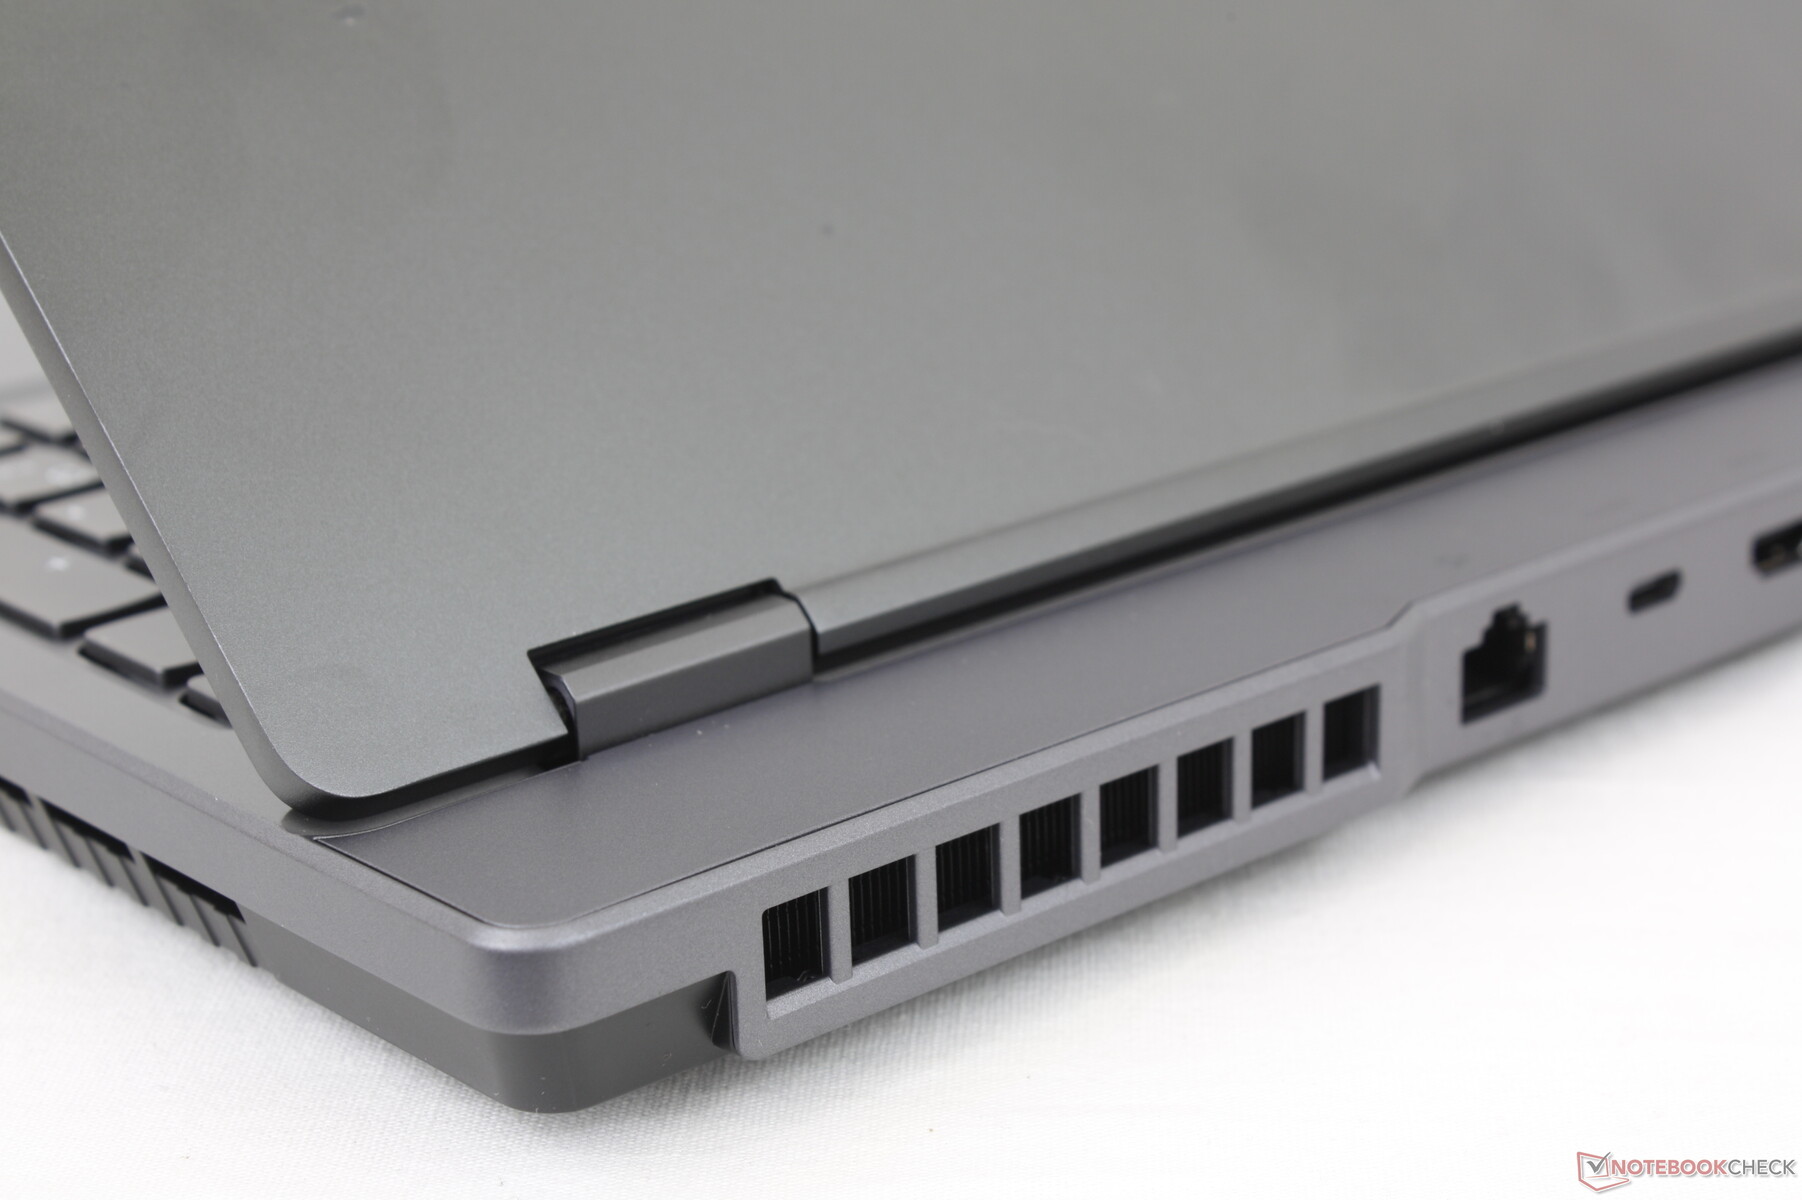
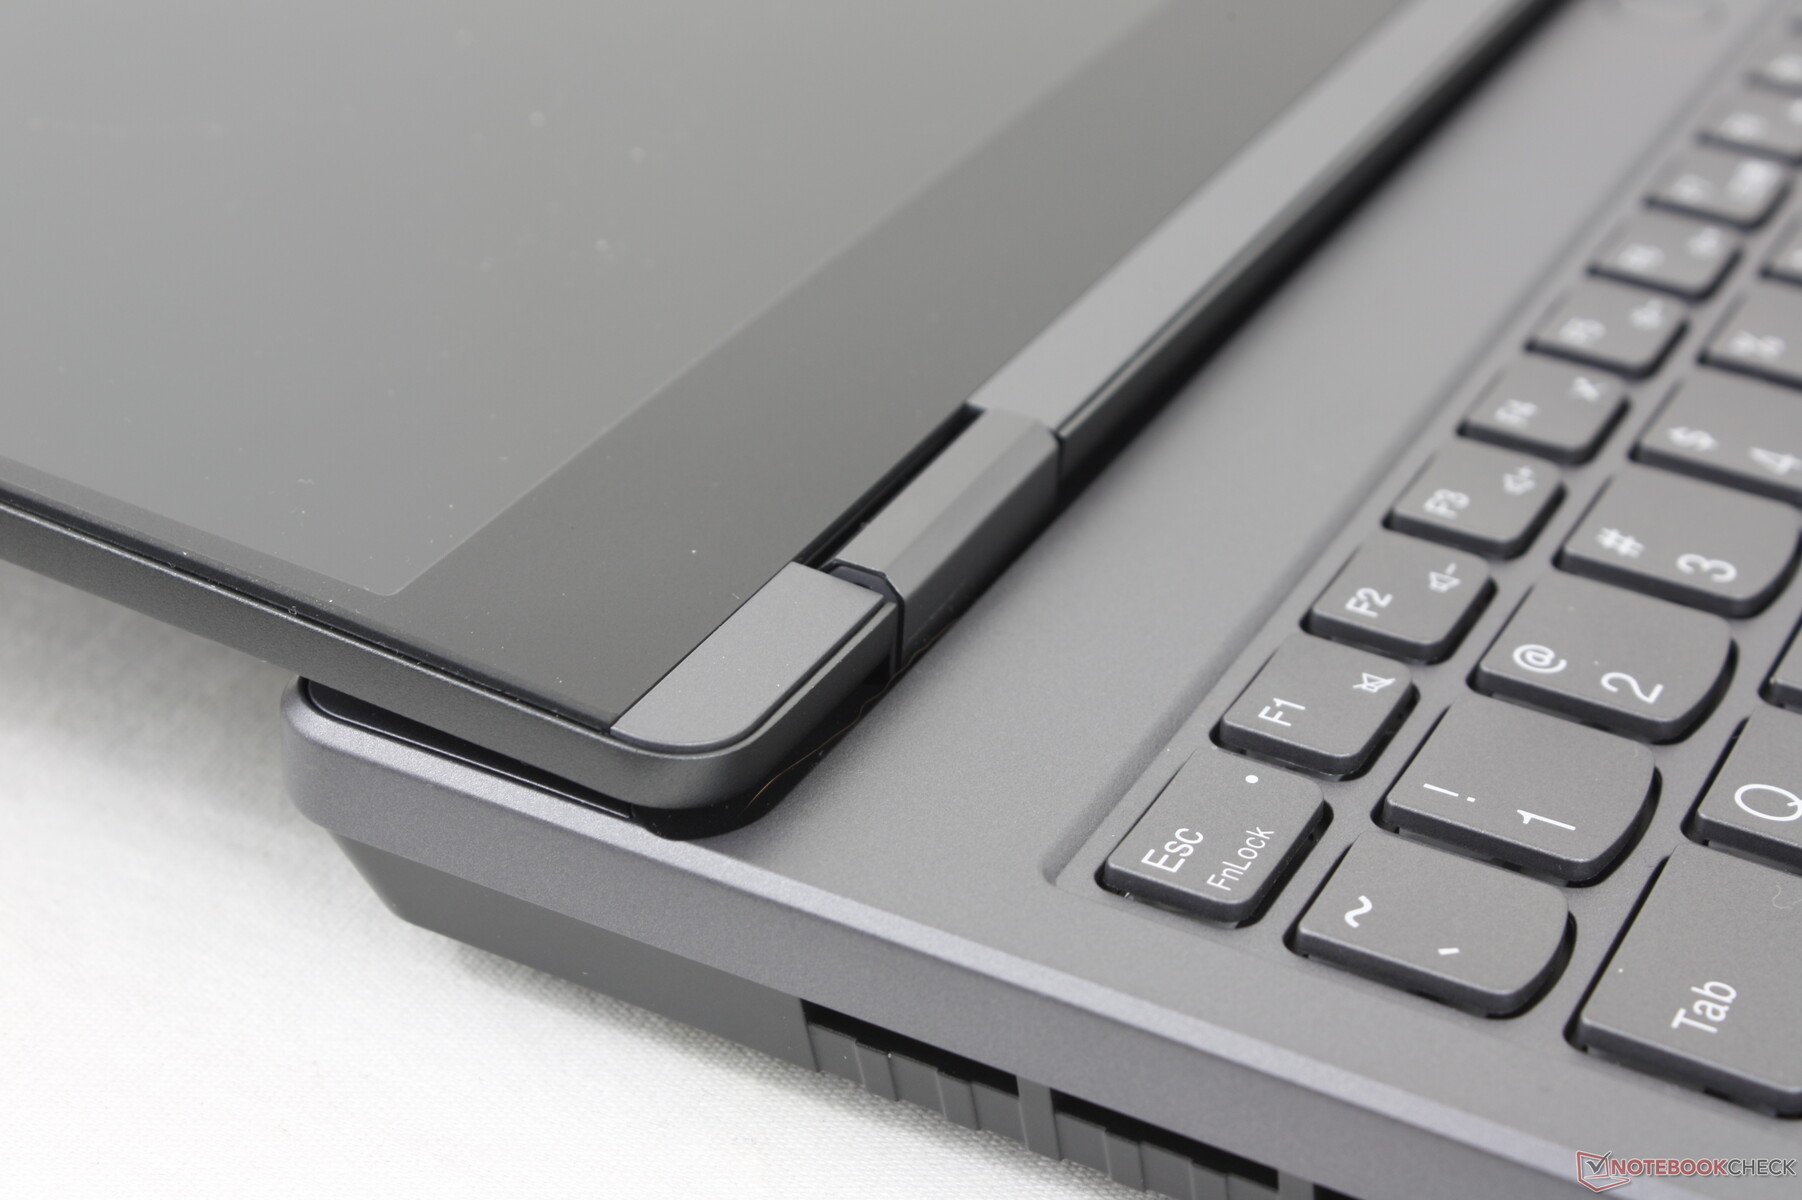
El chasis mantiene la estética general del modelo del año pasado, pero con esquinas redondeadas en todos los lados y rejillas de ventilación rediseñadas. El aspecto más limpio se asemeja más a la Serie ThinkBook lo que probablemente no sea una coincidencia. Si se compara con la serie TUF/ROG de Asus o con la serie MSI, el nuevo Legion 5 15 tiene un aspecto mucho menos gamer y más cercano al semiprofesional.
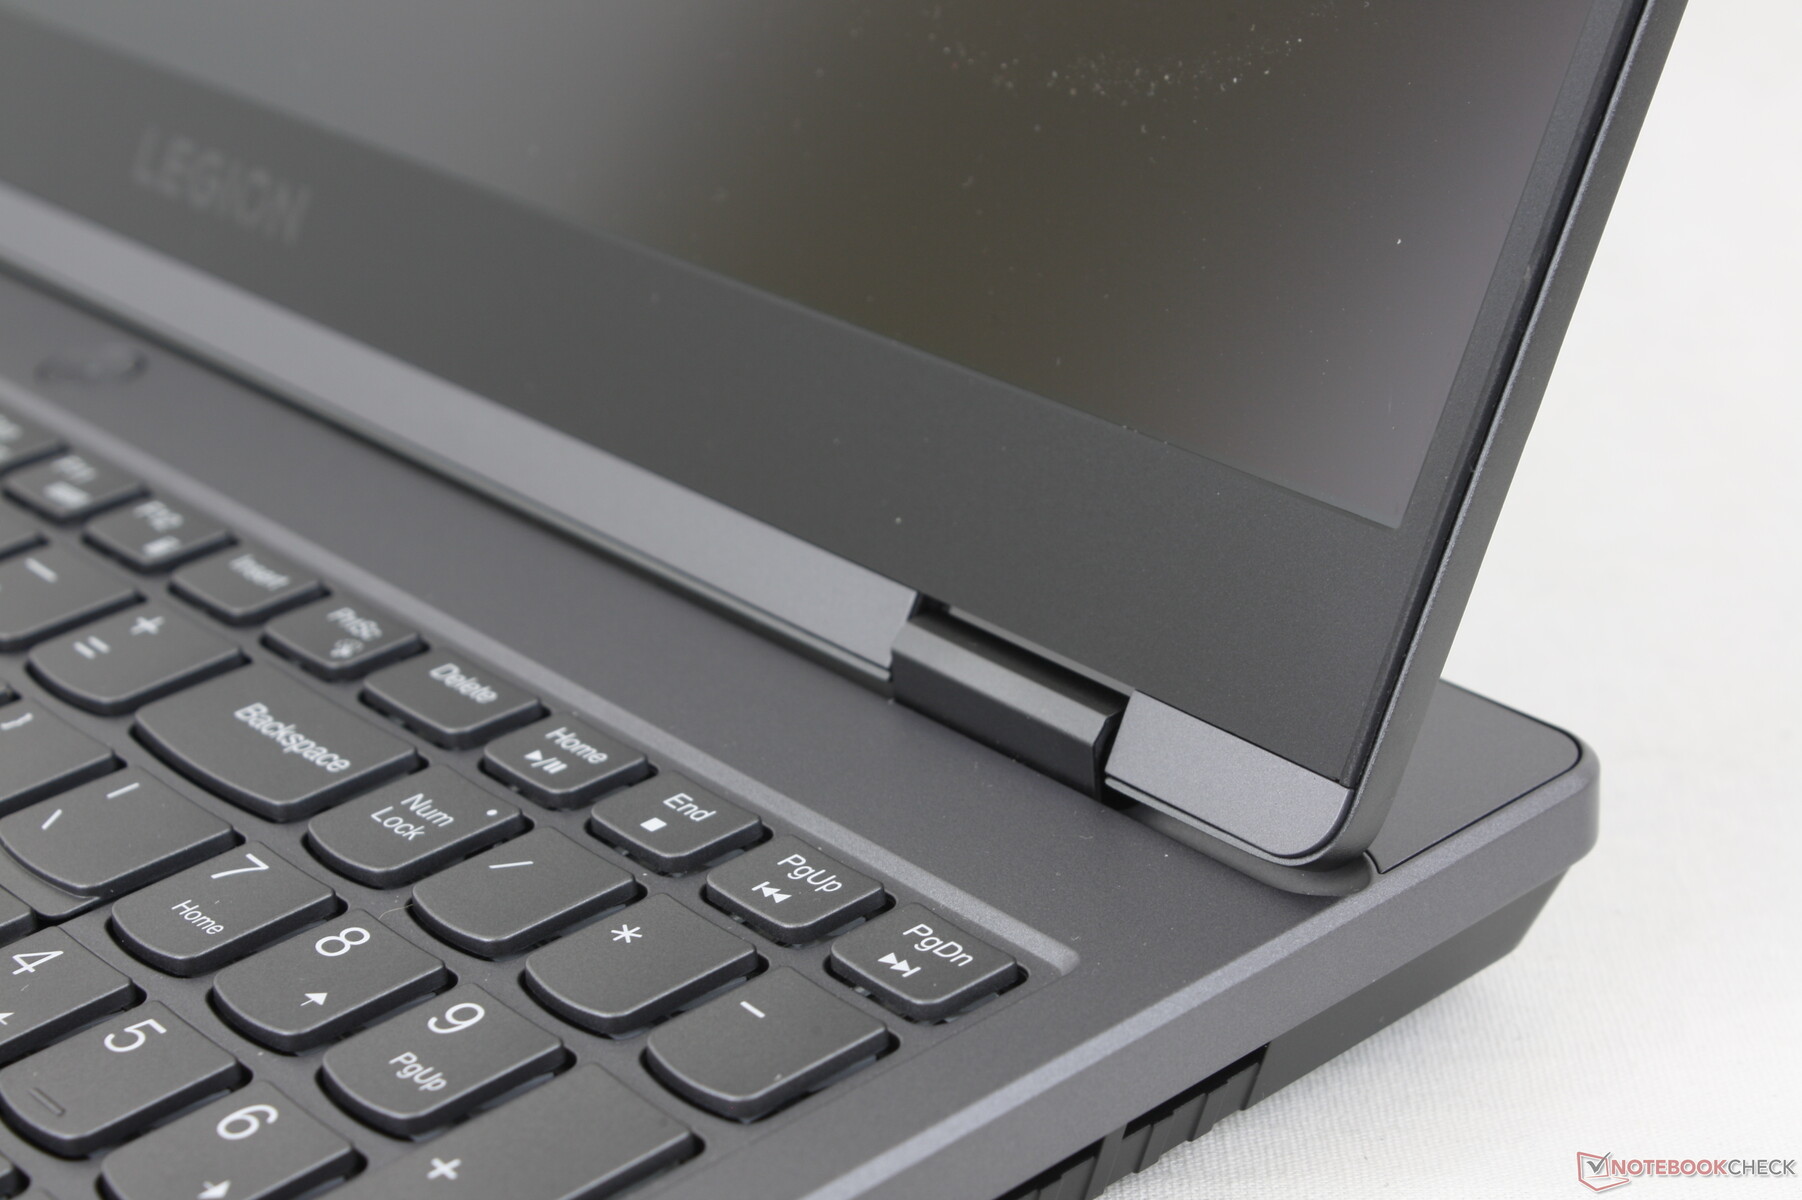
La rigidez del chasis es fuerte pero no está a la altura del Razer Blade razer Blade. Al intentar girar la base, por ejemplo, el Lenovo muestra un poco más de deformación y crujido y lo mismo puede decirse de su pantalla. Las bisagras son satisfactorias pero no tan fuertes como las bisagras sobredimensionadas de la serie TUF de Asus.
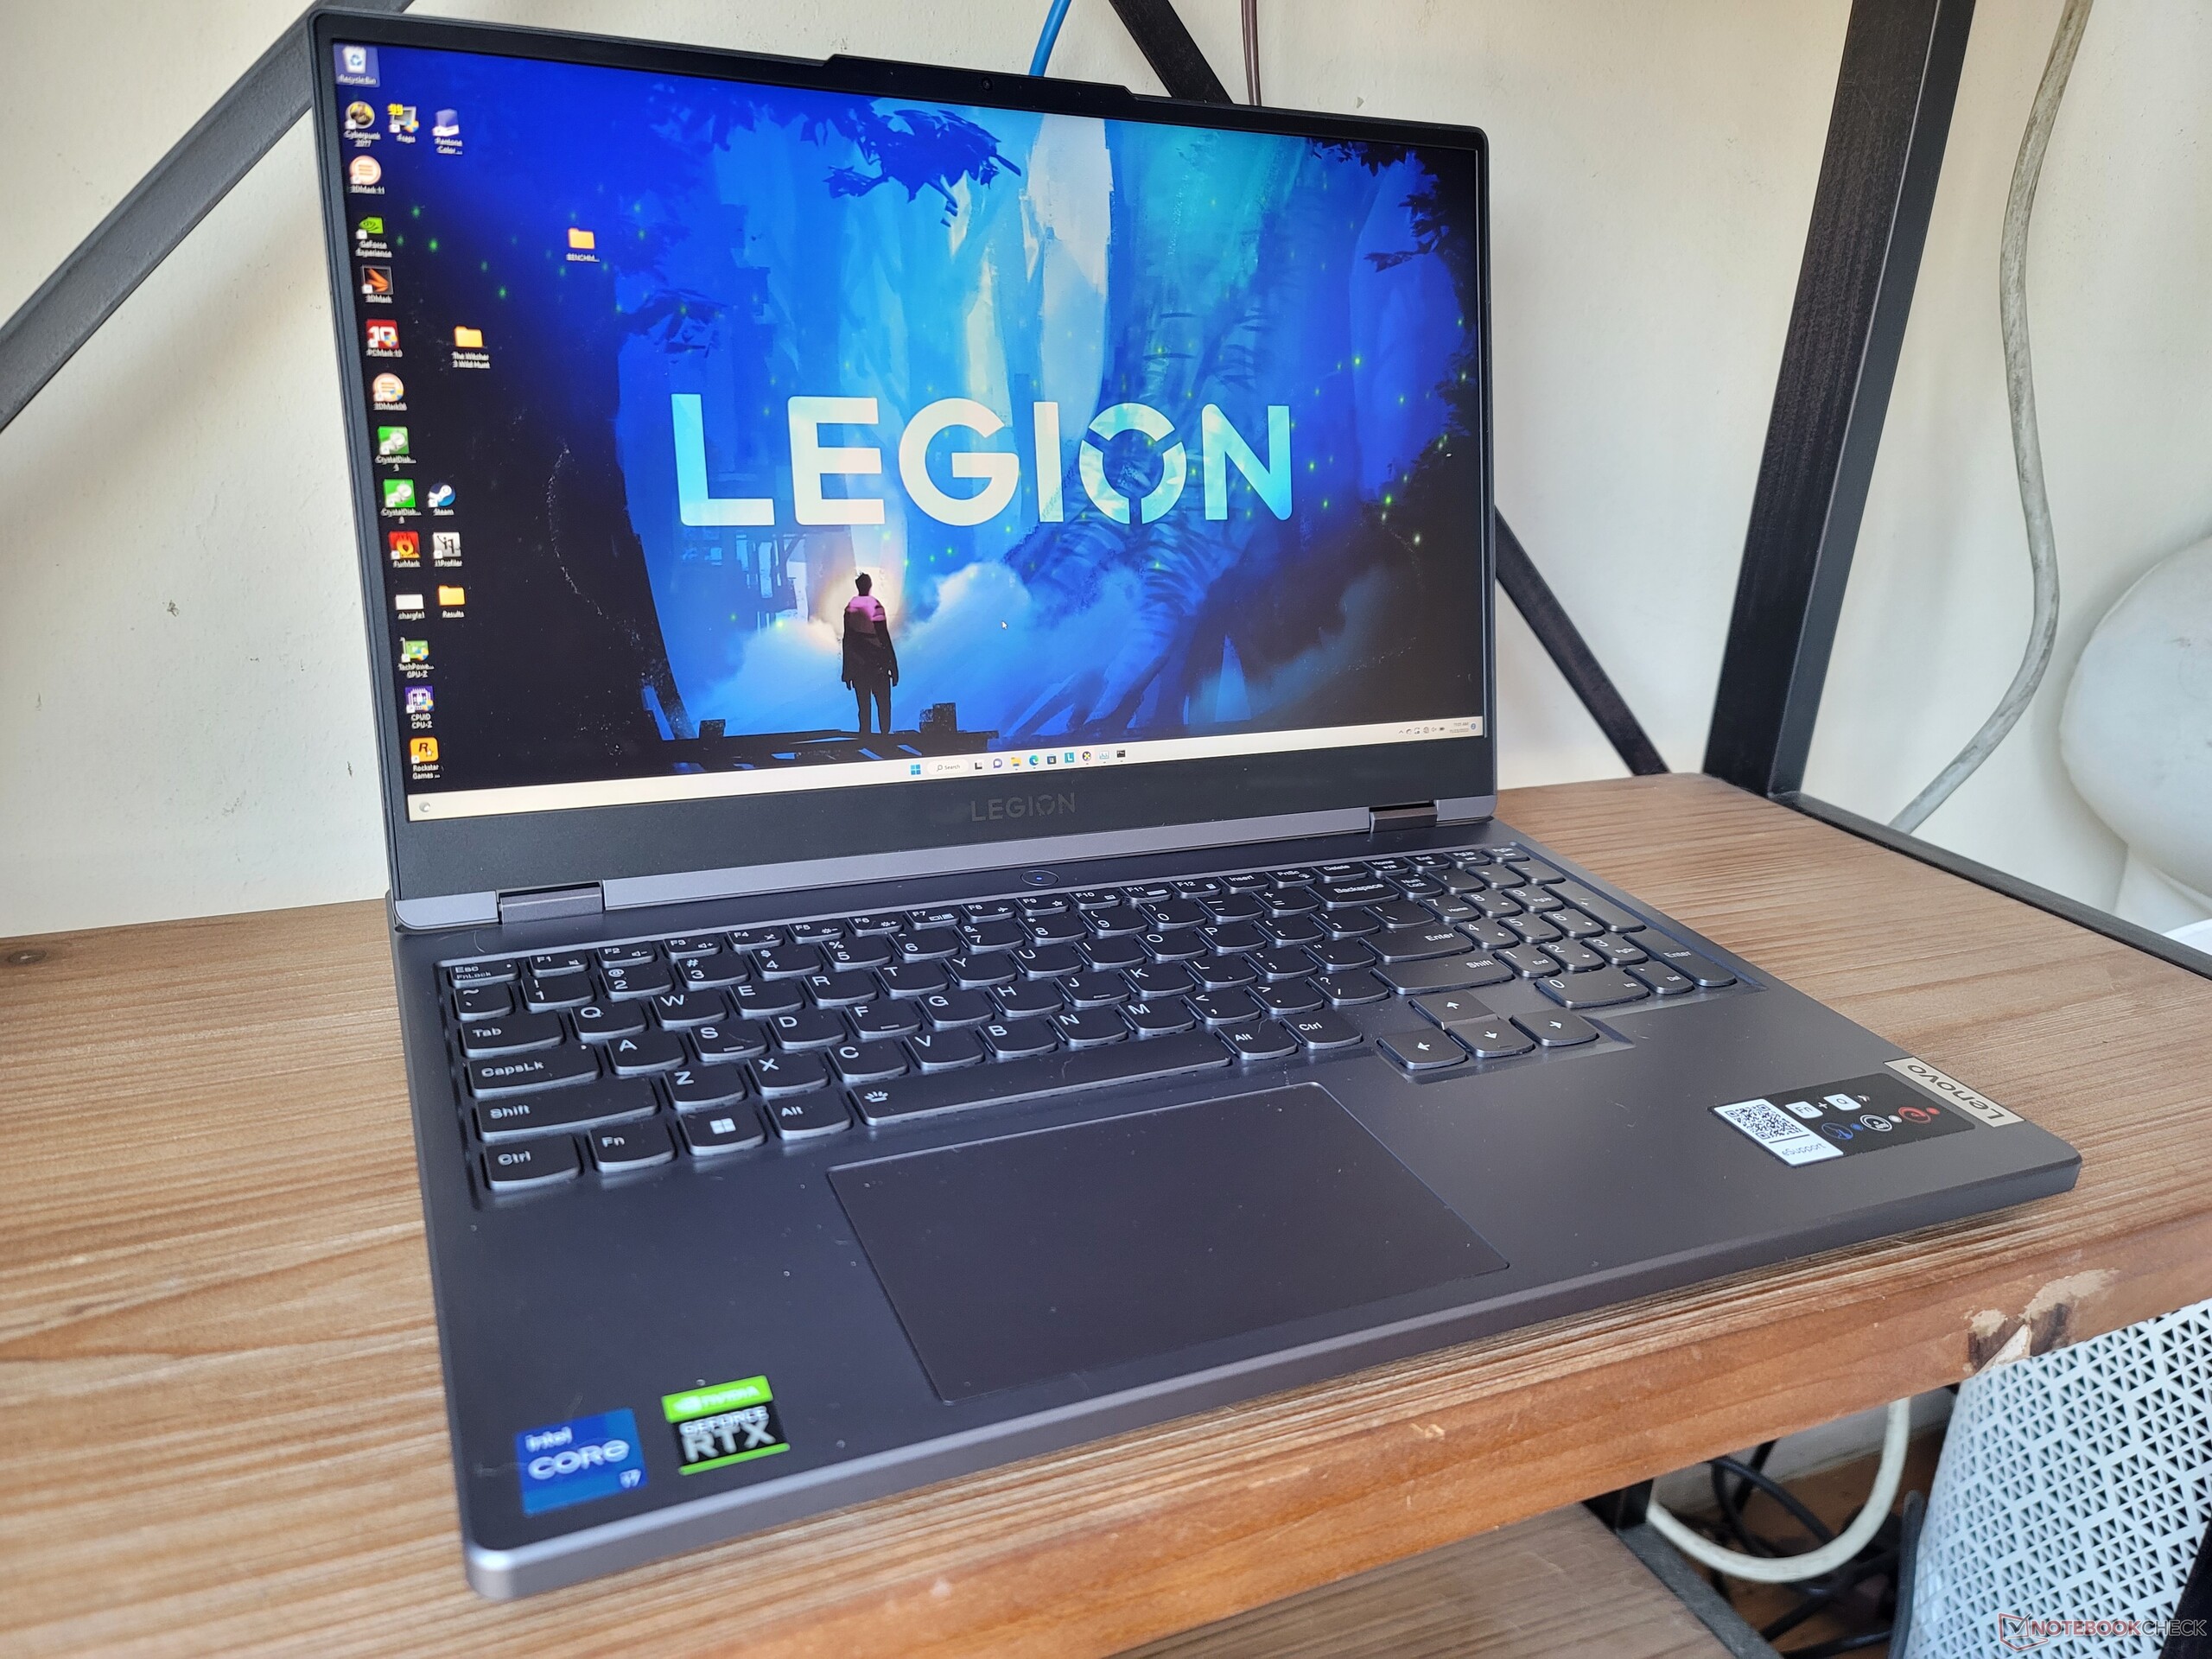
El modelo es más ancho y, por tanto, más pesado que muchos otros portátiles para juegos de 15,6 pulgadas debido a la gran parte trasera que sobresale del diseño de Legion. Aunque esto ayuda a la refrigeración y el rendimiento, el inconveniente es un portátil más tosco que no es tan adecuado para viajar como muchas alternativas como el Razer Blade 15 Base Edition.
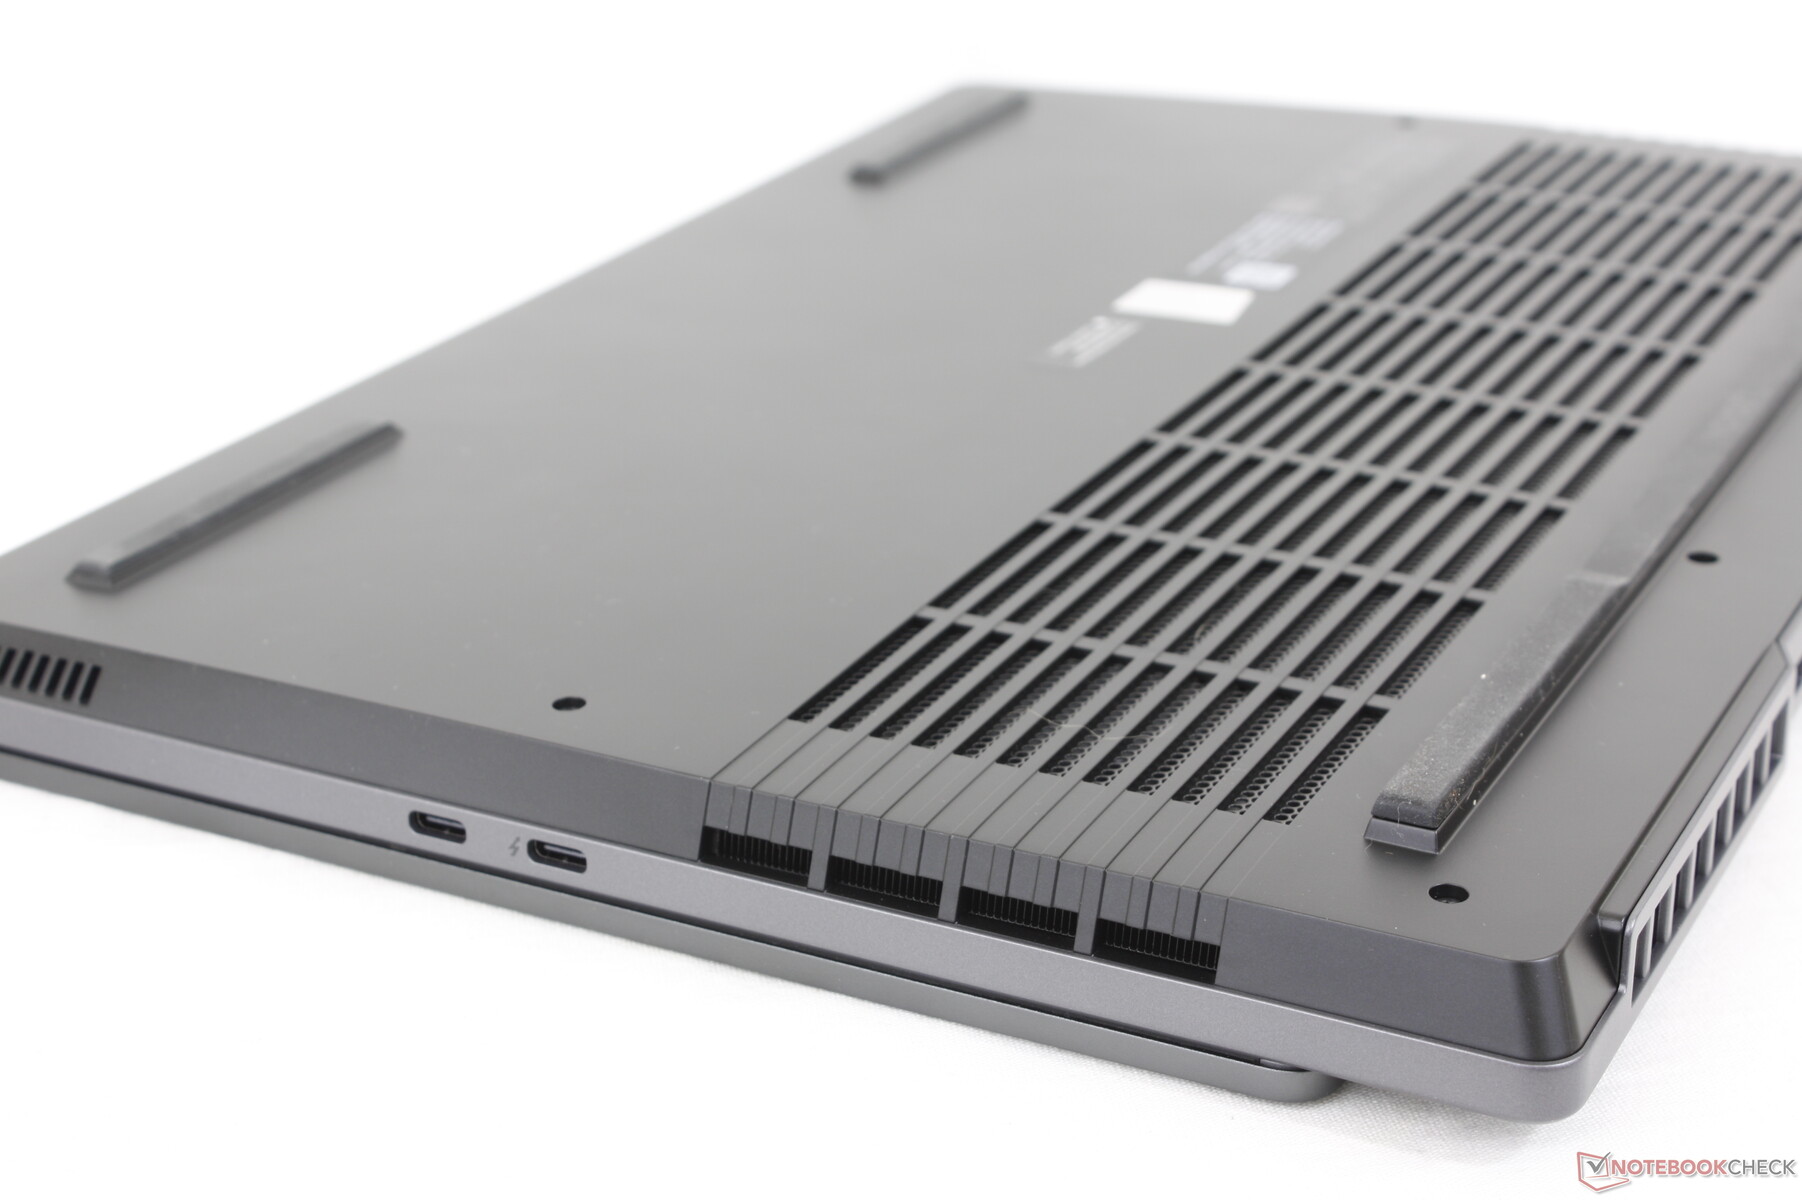
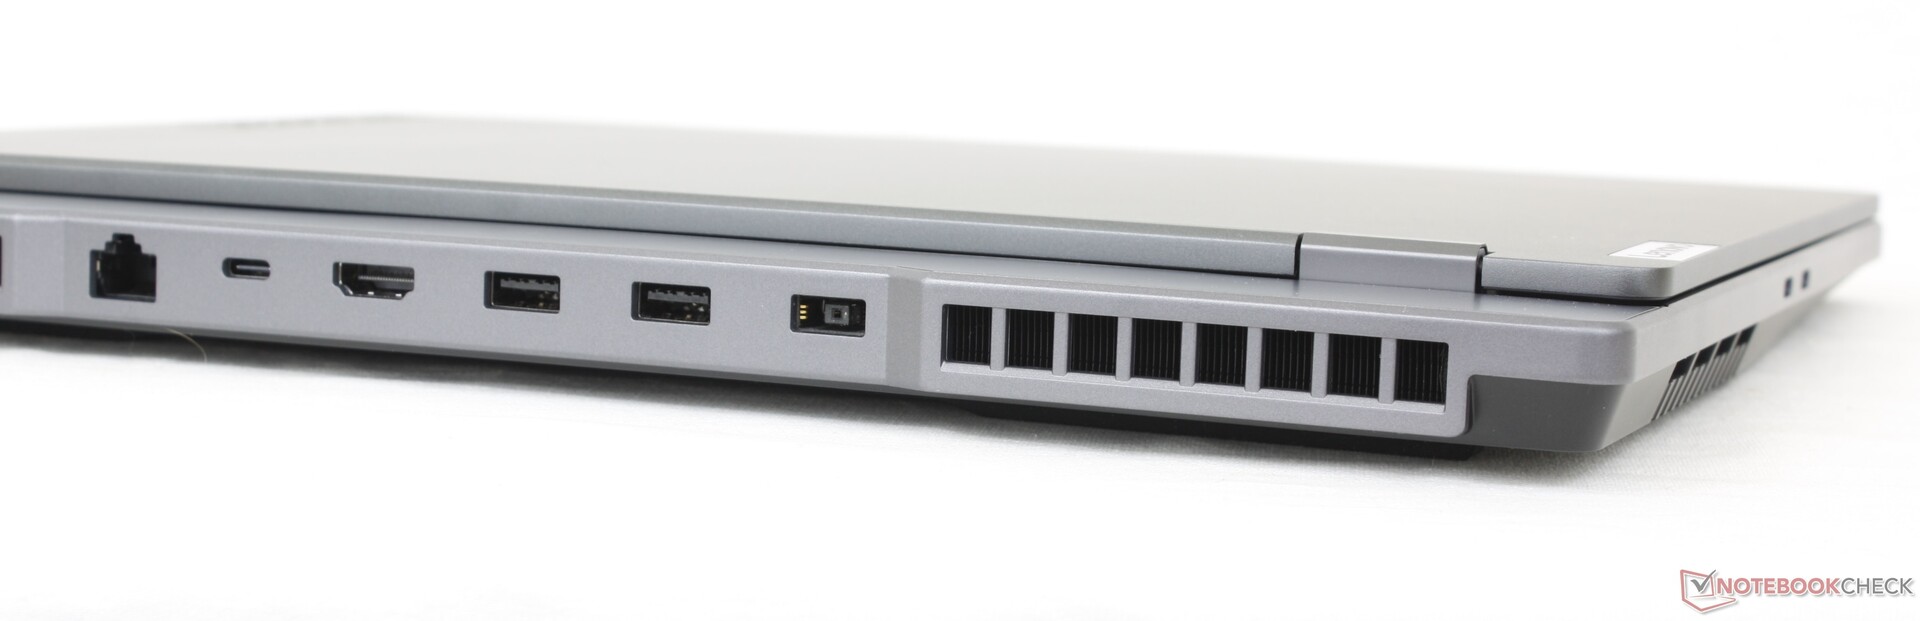
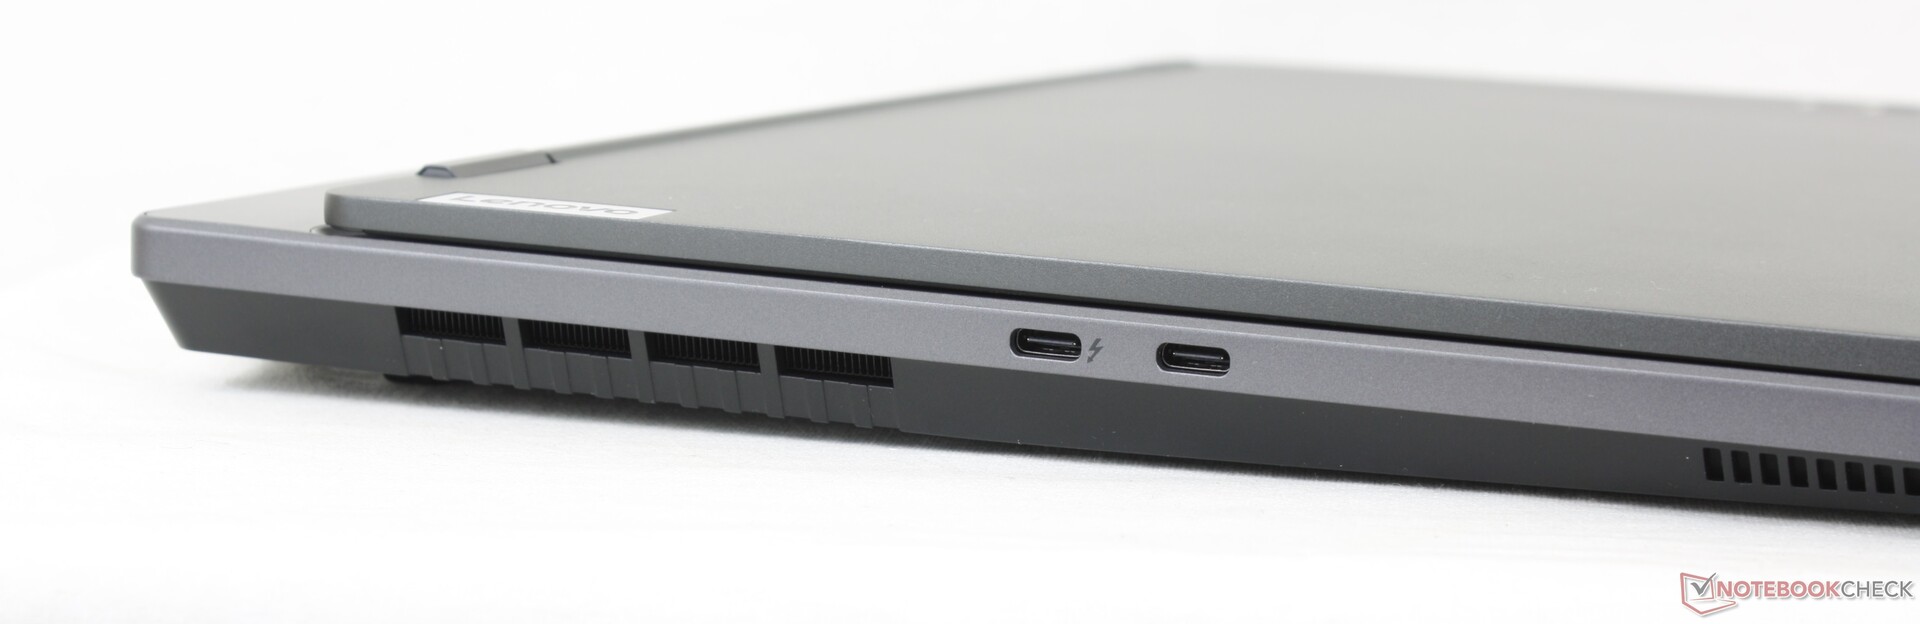
Conectividad - Soporte de Thunderbolt 4
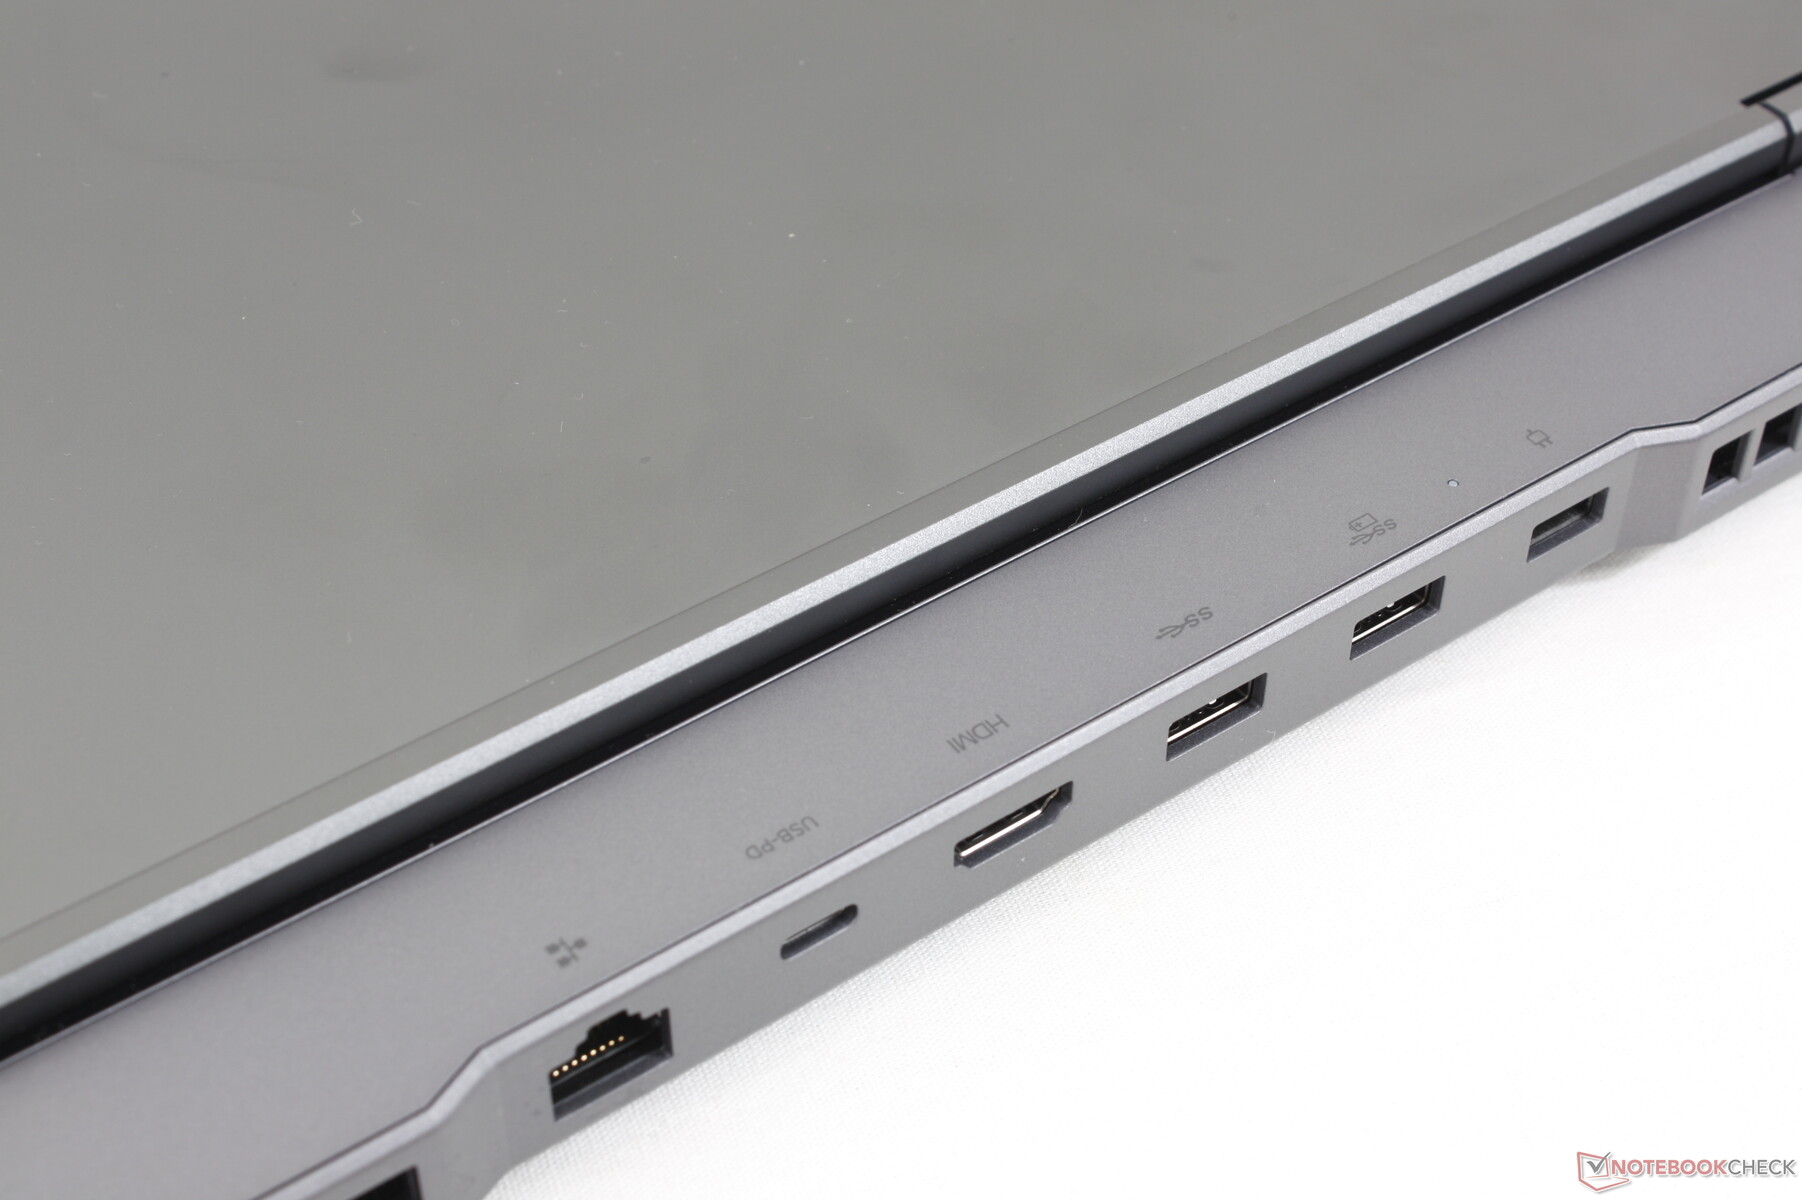
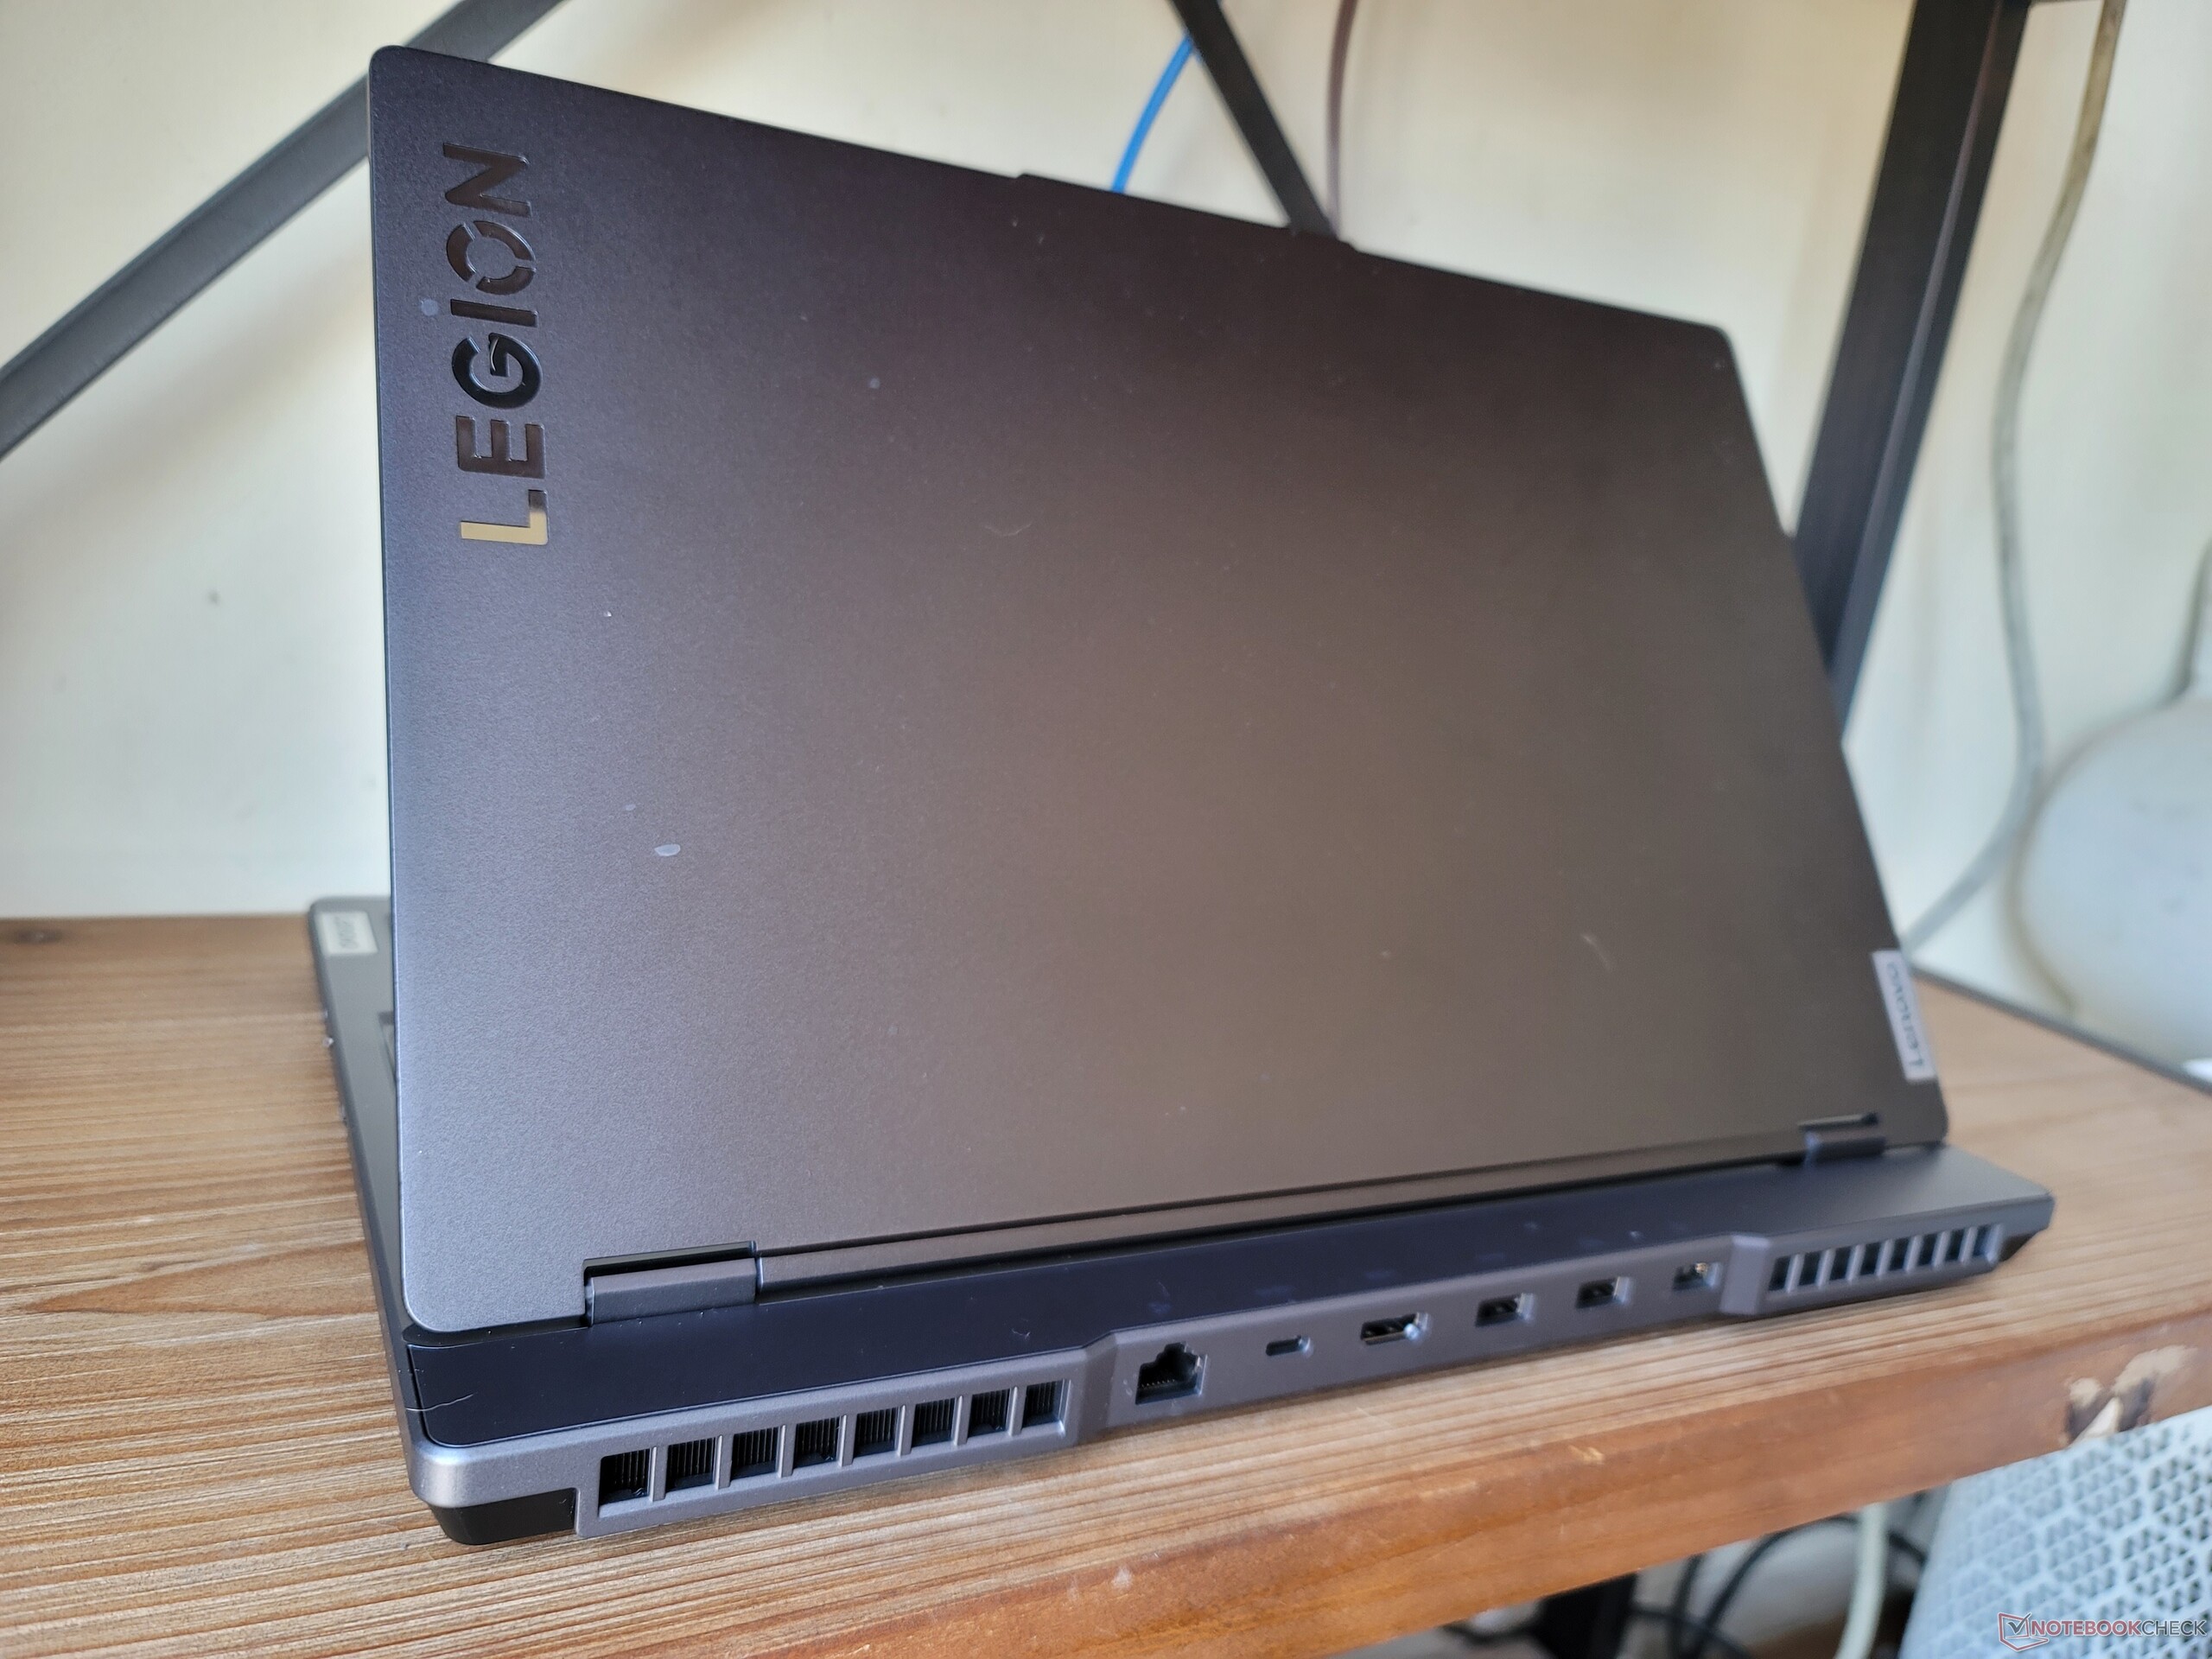
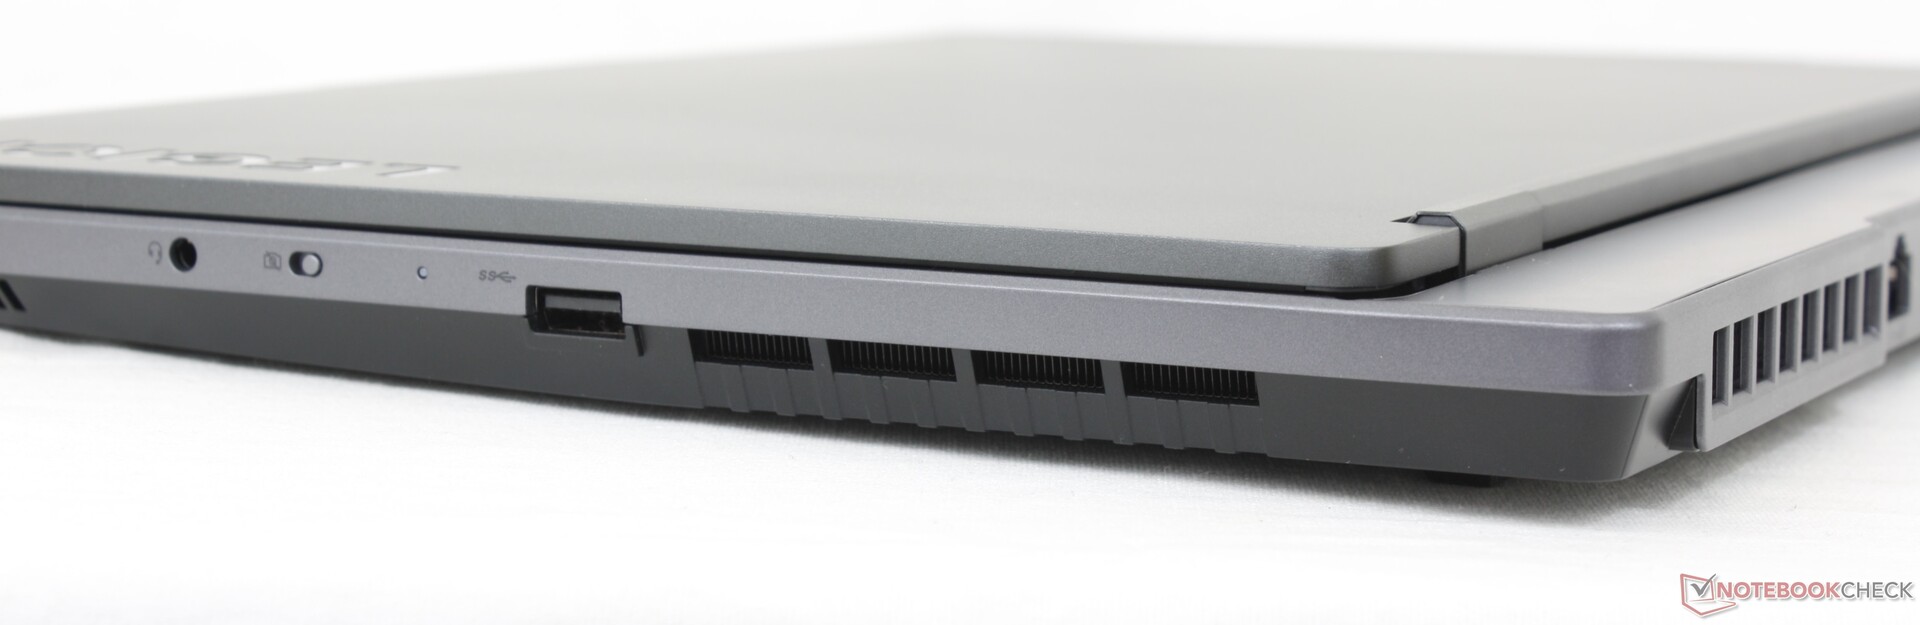
En comparación con el modelo 2021 basado en AMD, nuestro modelo Intel cambia un puerto USB-A por un puerto USB-C. Las opciones de puerto son por lo demás idénticas entre los dos modelos, aunque con una posición distinta. La mayoría de los puertos están en la parte trasera, a diferencia de la mayoría de portátiles de juego, para bien o para mal.
Thunderbolt 4 sólo es compatible con el puerto USB-C etiquetado en el borde izquierdo.
Comunicación
El Intel AX211 viene de serie en la mayoría de los modelos para la compatibilidad con Wi-Fi 6E y Bluetooth 5.2. No experimentamos ningún problema al emparejarlo con nuestra red de 6 GHz.
| Networking | |
| iperf3 transmit AX12 | |
| Razer Blade 15 Base Edition 2021, i7-10750H RTX 3060 | |
| Acer Aspire Nitro 5 AN515-55-57GF | |
| MSI Bravo 15 B5DD-010US | |
| Asus TUF Gaming F15 FX507ZM | |
| Lenovo Legion 5 15ACH-82JU00C6GE-FL | |
| iperf3 receive AX12 | |
| Razer Blade 15 Base Edition 2021, i7-10750H RTX 3060 | |
| Asus TUF Gaming F15 FX507ZM | |
| MSI Bravo 15 B5DD-010US | |
| Lenovo Legion 5 15ACH-82JU00C6GE-FL | |
| Acer Aspire Nitro 5 AN515-55-57GF | |
| iperf3 receive AXE11000 6GHz | |
| Lenovo Legion 5 15IAH7H 82RB | |
| iperf3 receive AXE11000 | |
| Lenovo Legion 5 15IAH7H 82RB | |
| iperf3 transmit AXE11000 | |
| Lenovo Legion 5 15IAH7H 82RB | |
| iperf3 transmit AXE11000 6GHz | |
| Lenovo Legion 5 15IAH7H 82RB | |
Webcam - Calidad baja de 1 MP
La calidad de la cámara es turbia desde la webcam de 720p. Tampoco es compatible con Windows Hello.


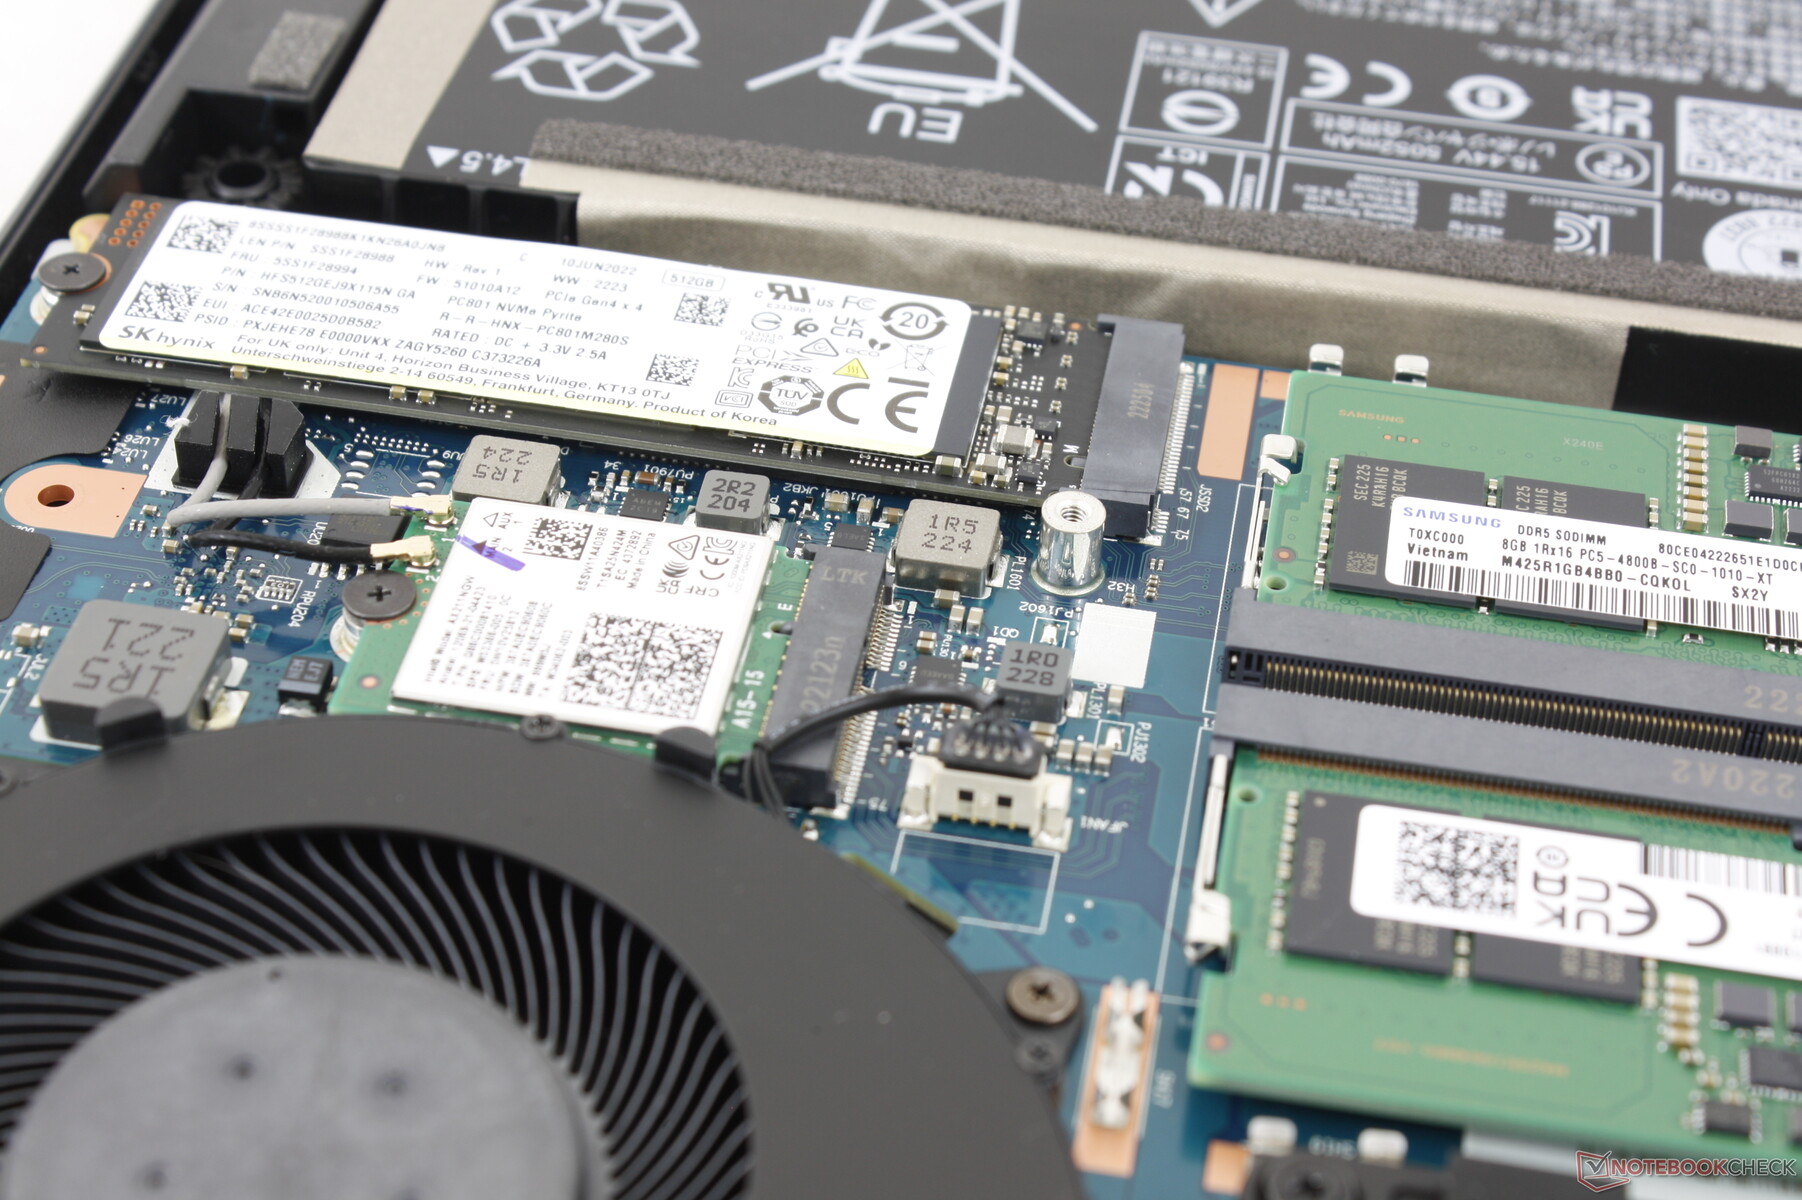
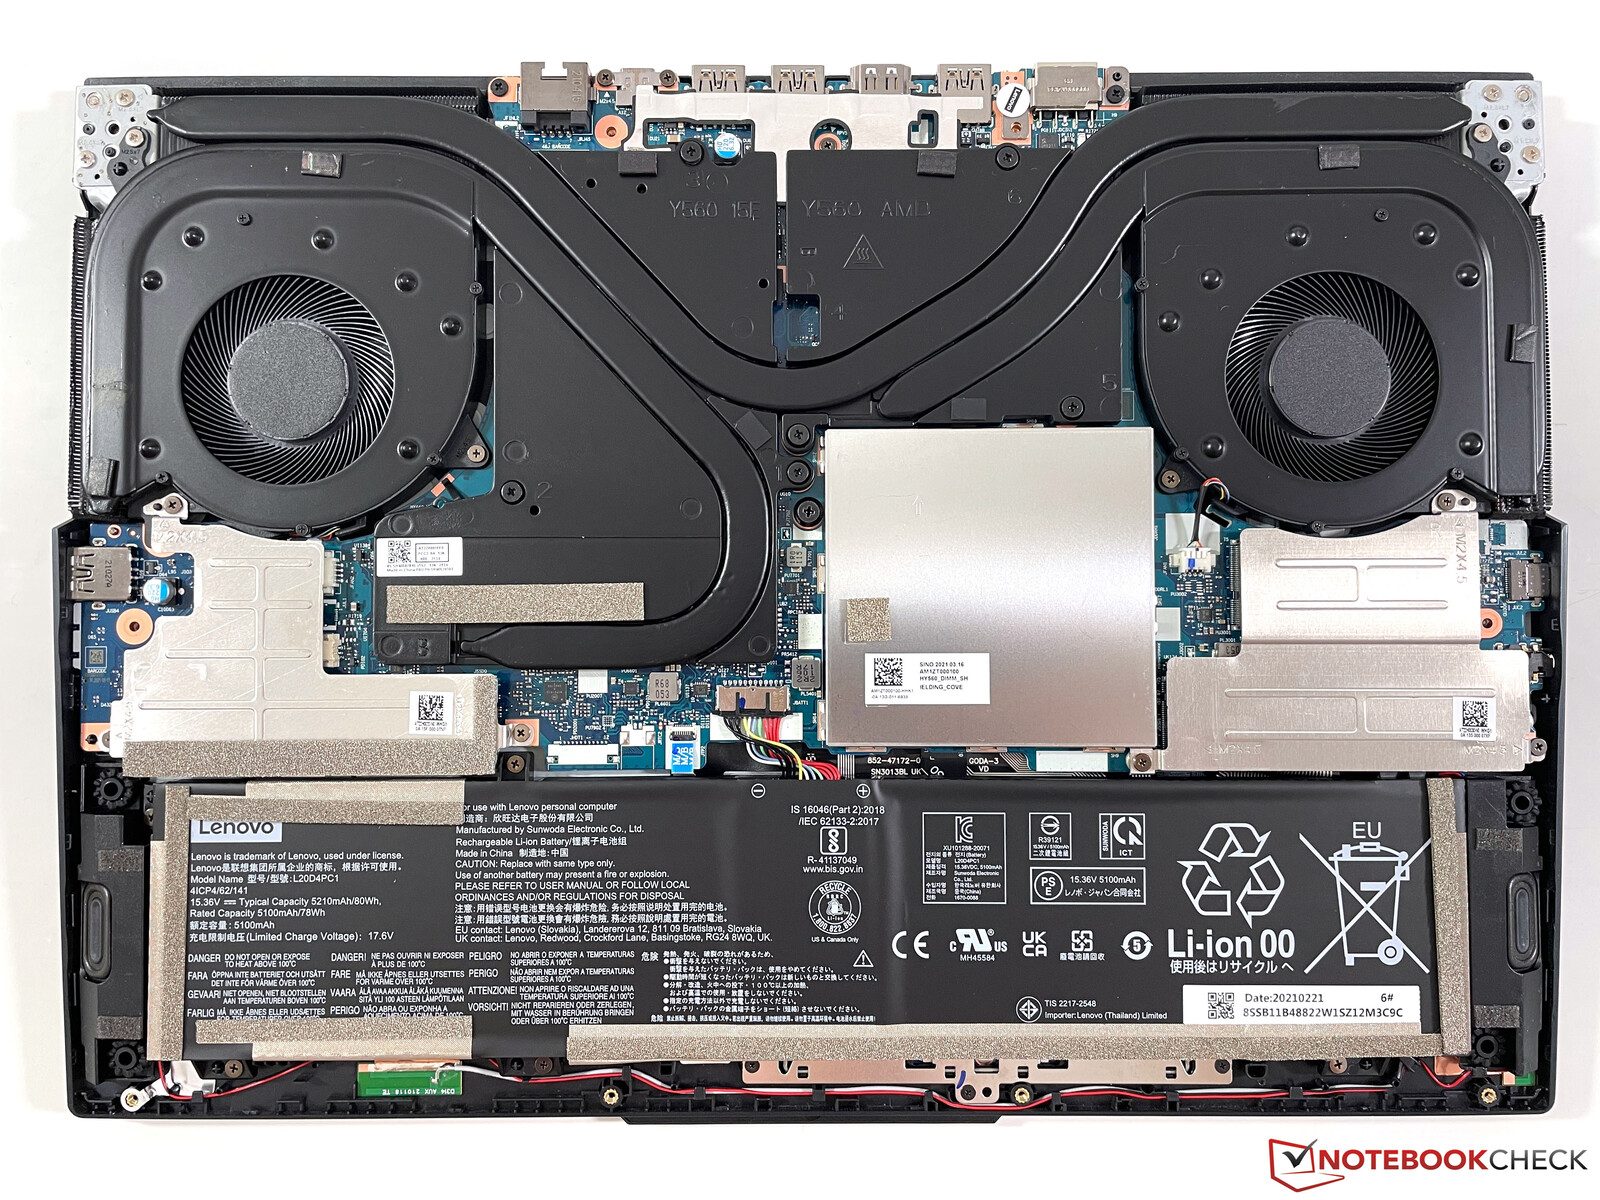
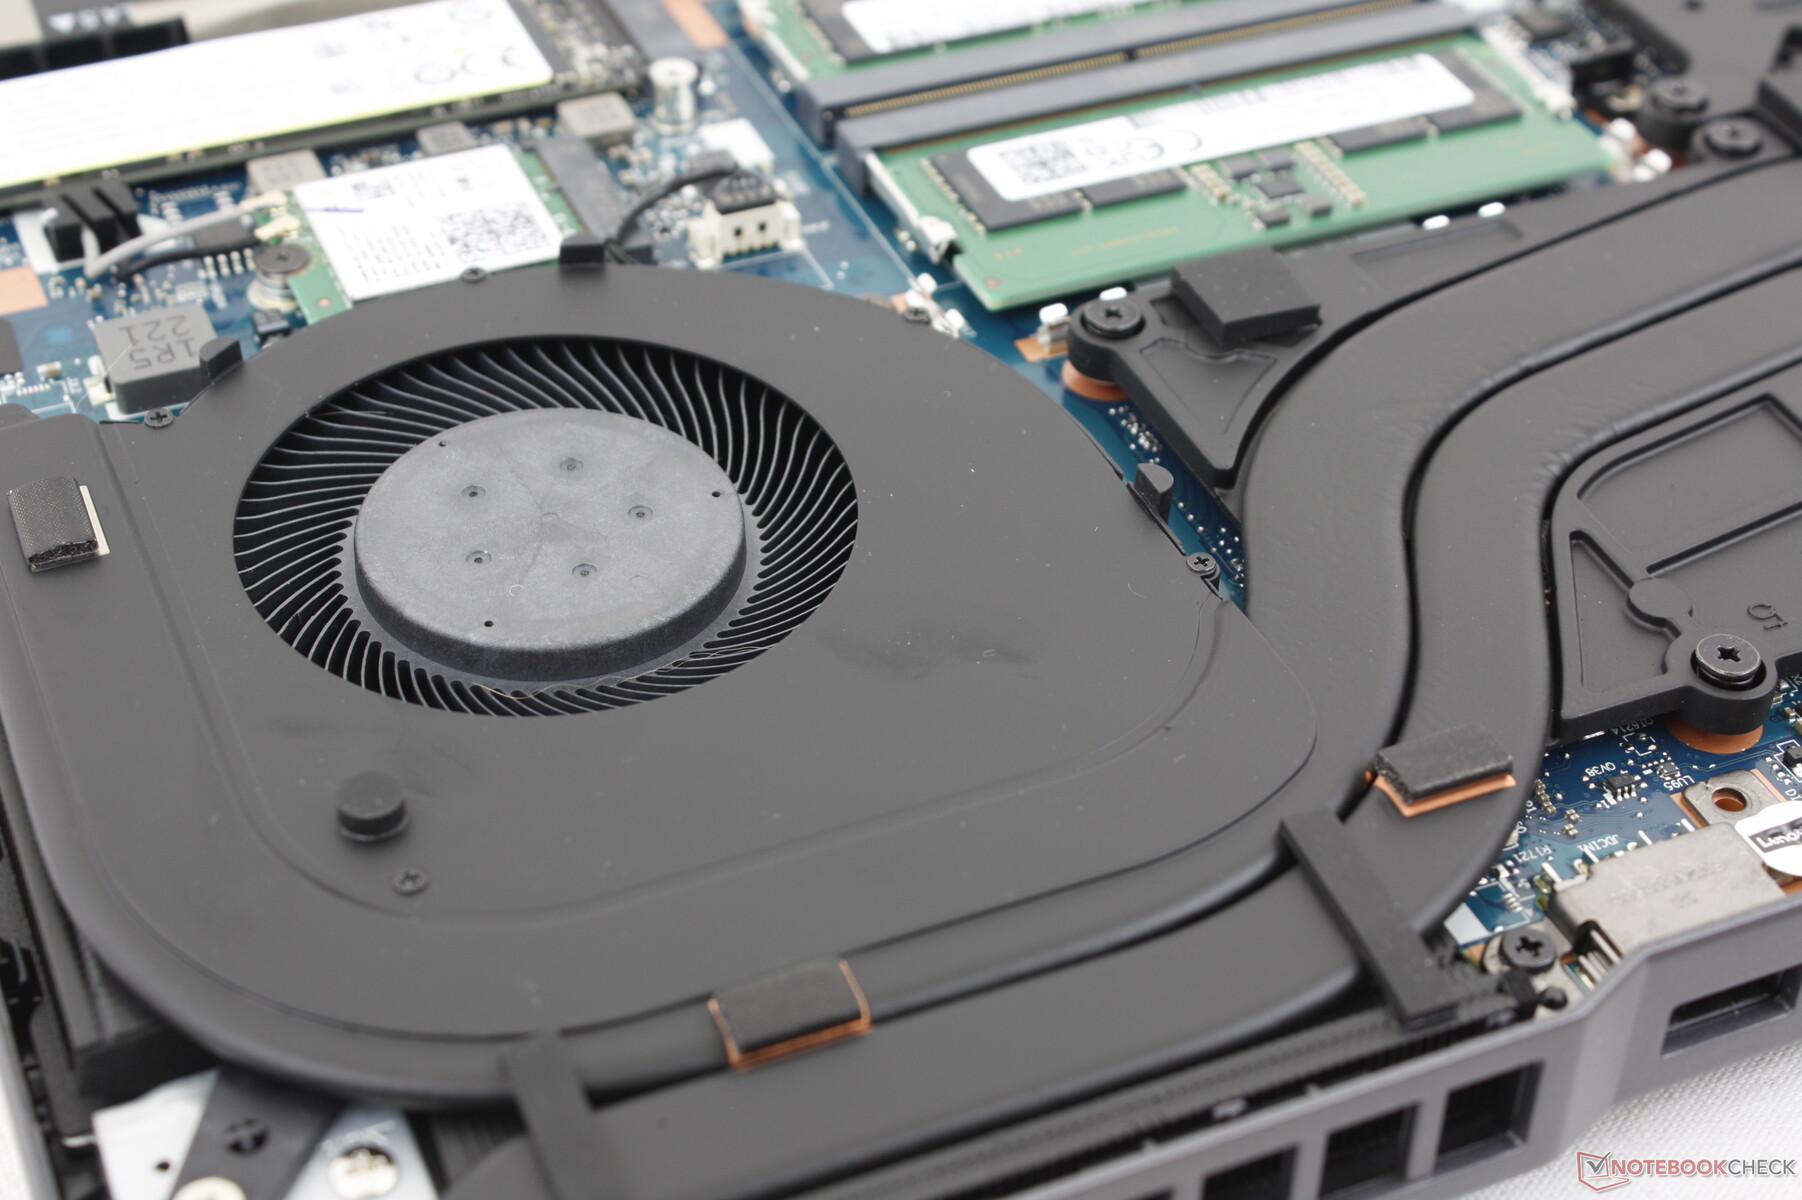
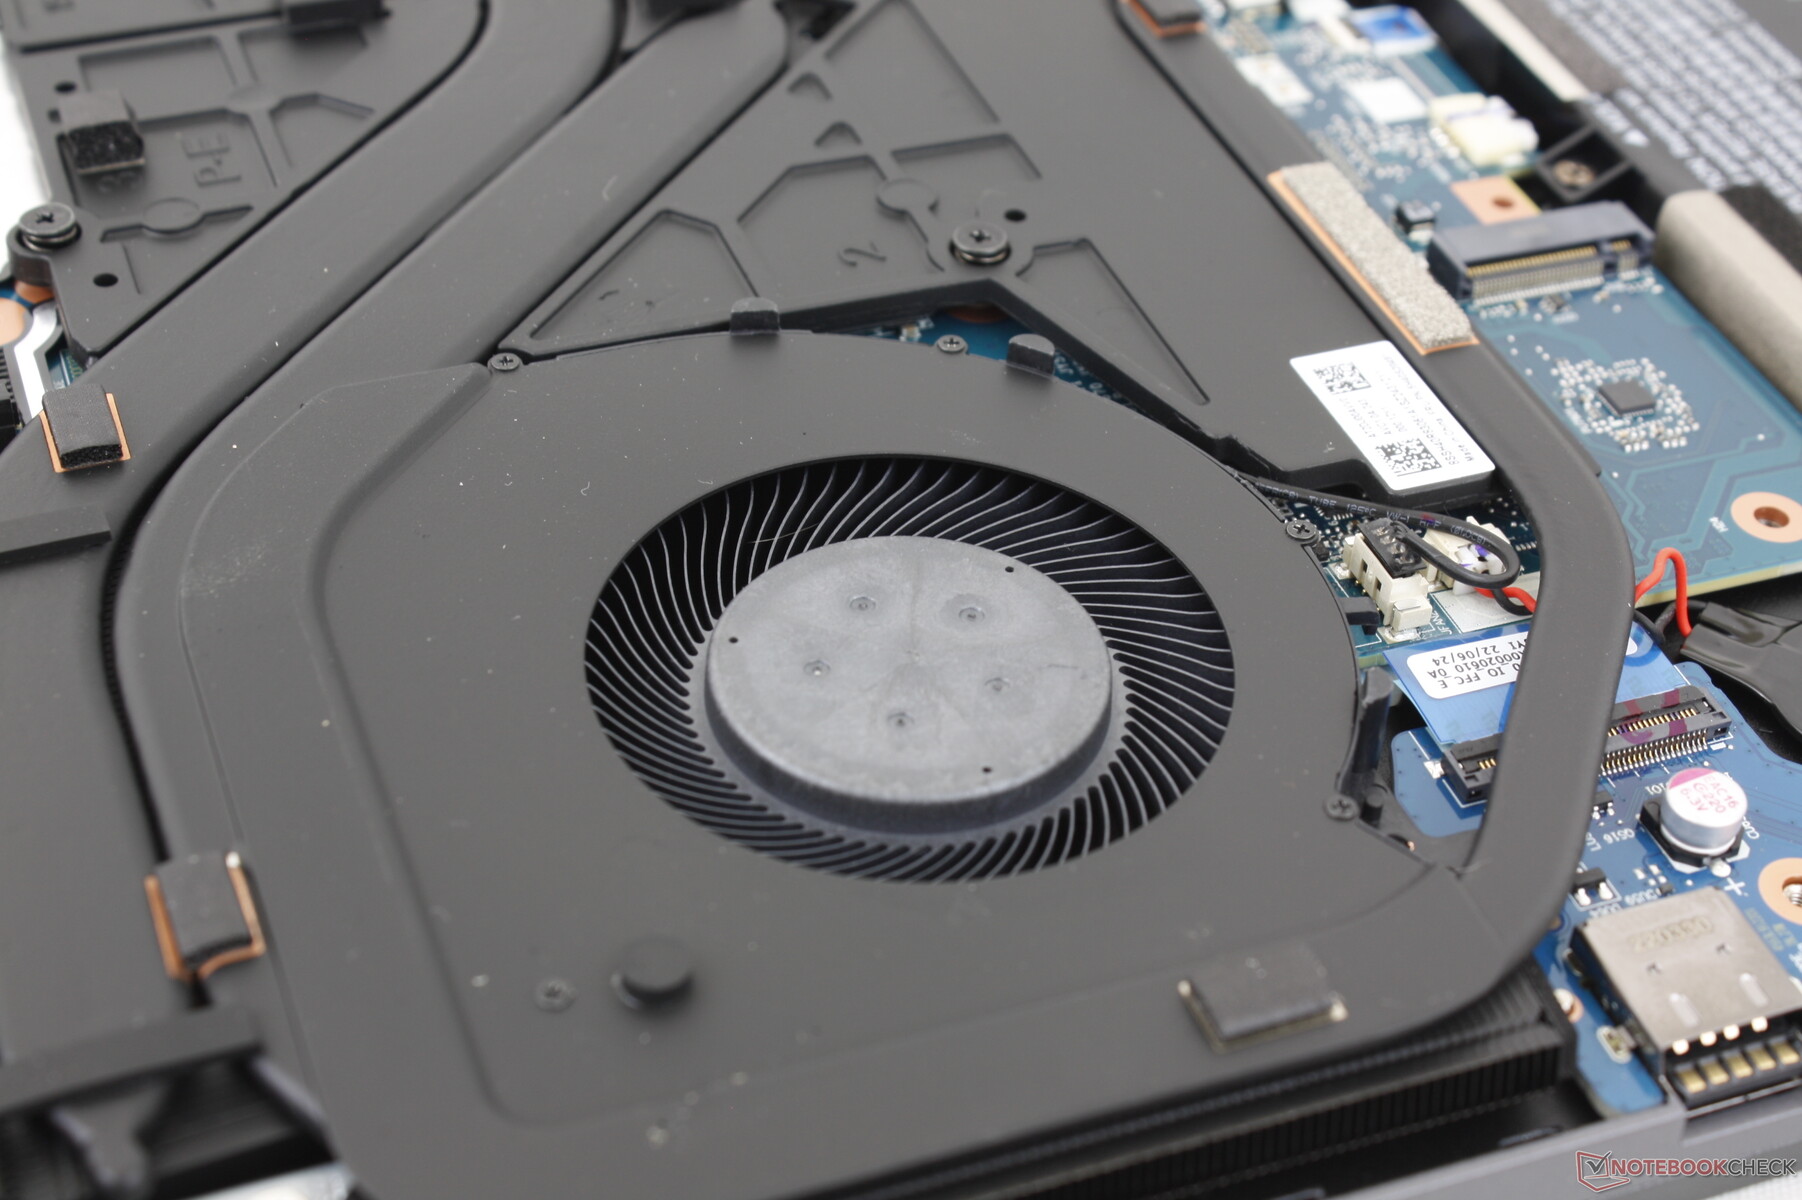
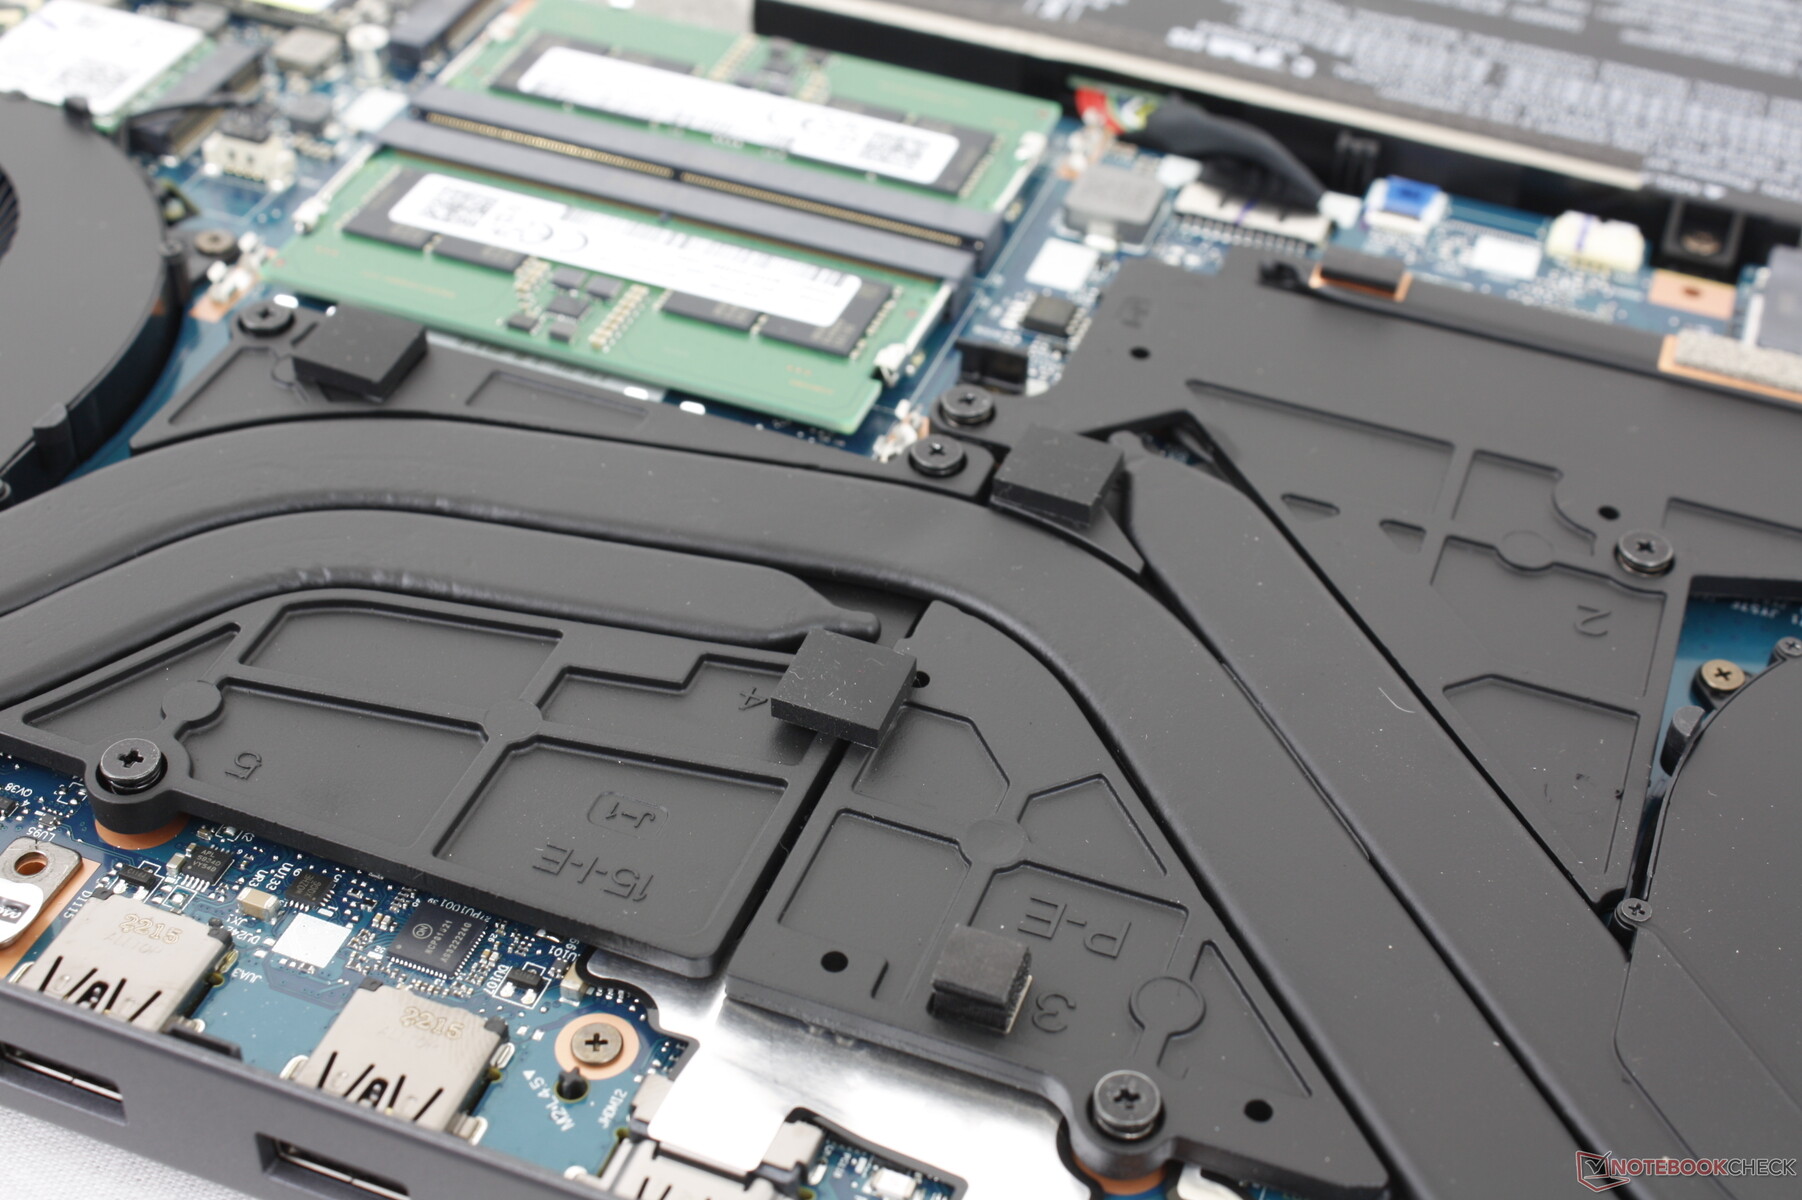
Mantenimiento
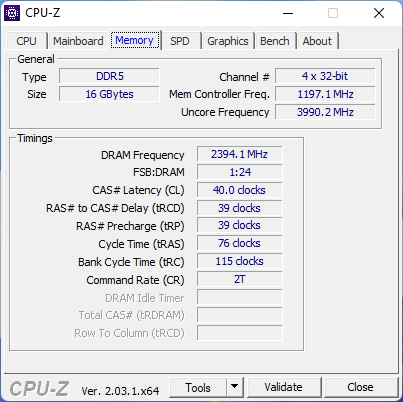
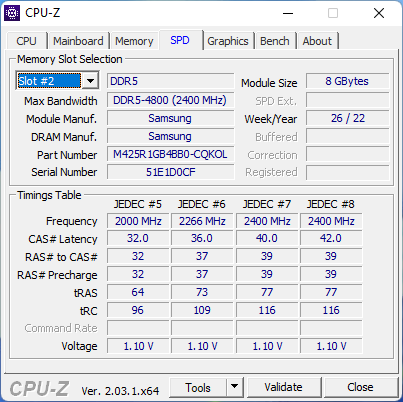
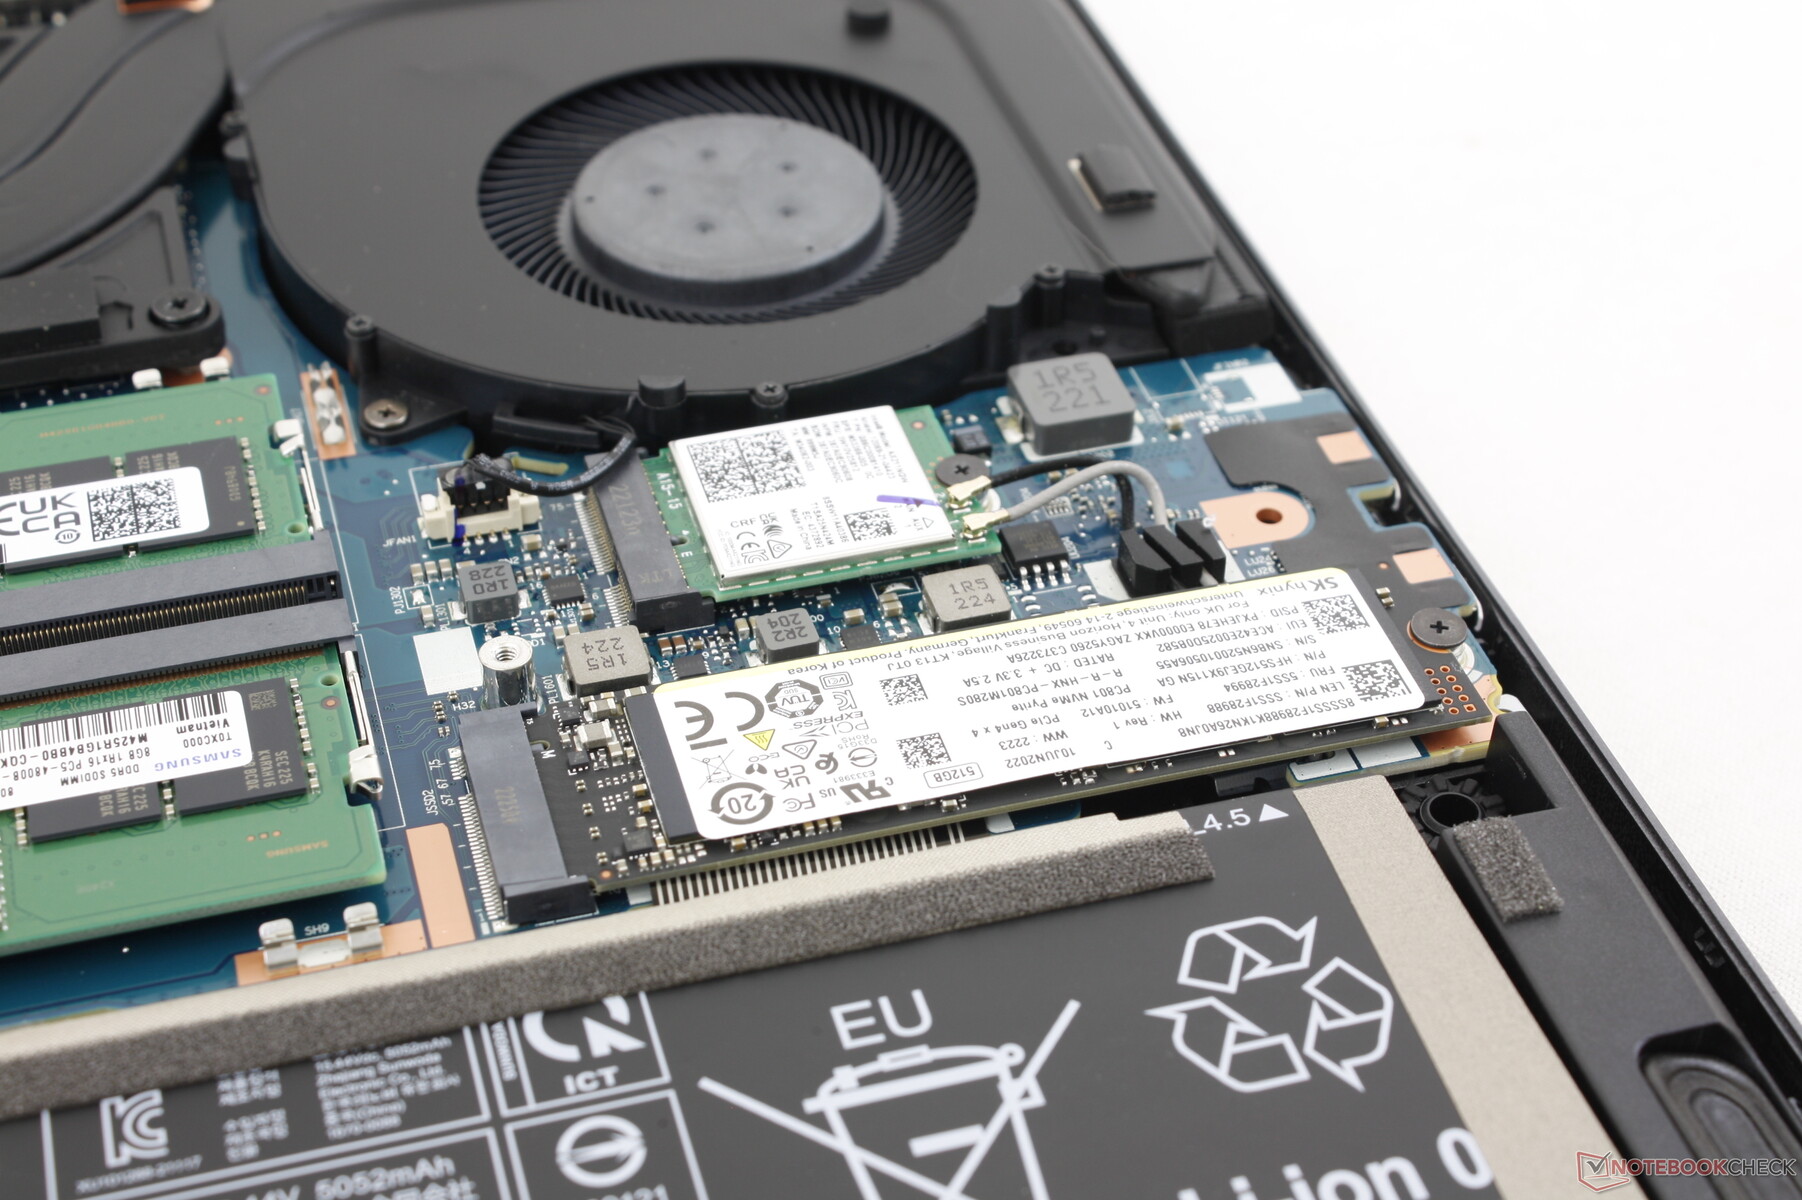
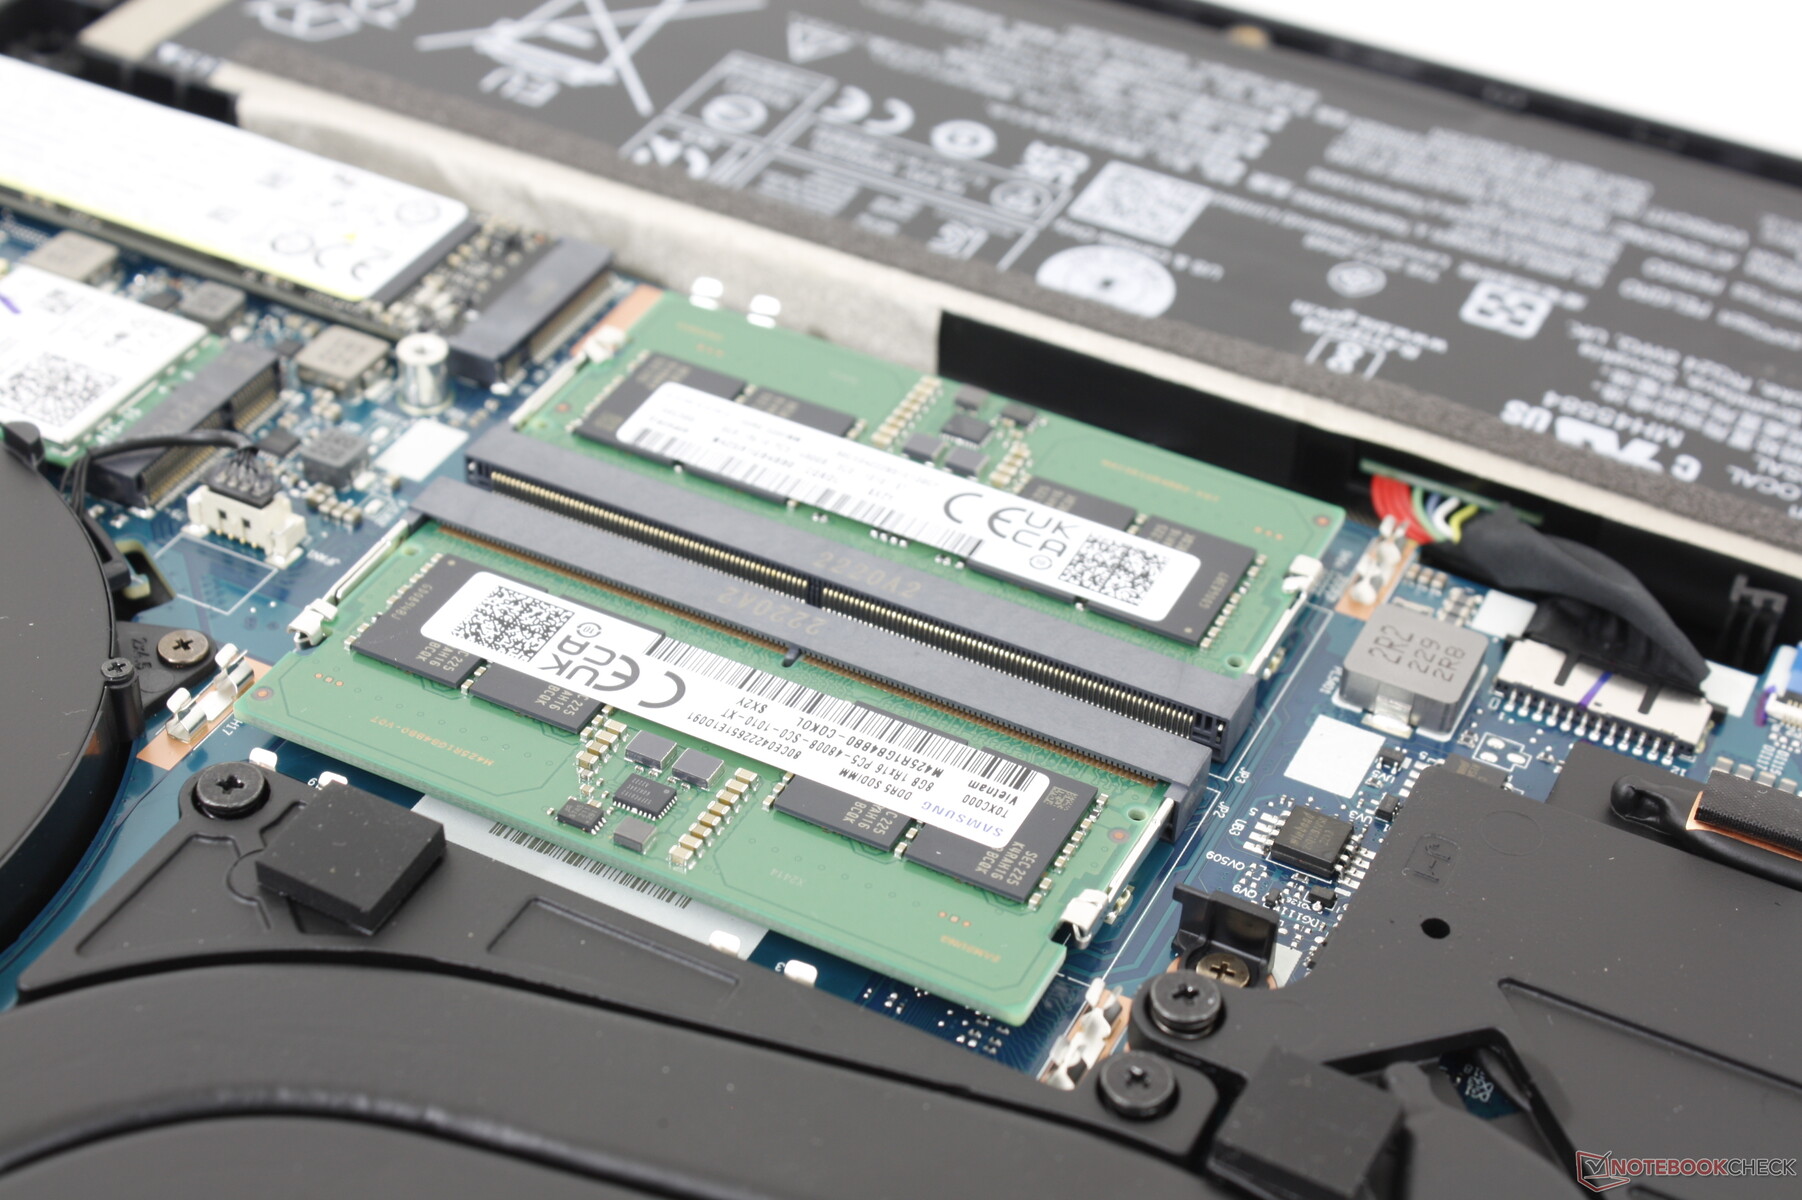
El panel inferior sólo requiere un destornillador Philips para retirarlo. Los usuarios pueden añadir/extraer hasta dos módulos DDR5 SODIMM, dos SSD M.2 PCIe4 x4 2280 y un módulo M.2 WLAN.
Accesorios y garantía
No hay extras en la caja más allá del adaptador de CA y la documentación. Se aplica la garantía estándar de un año limitada del fabricante.
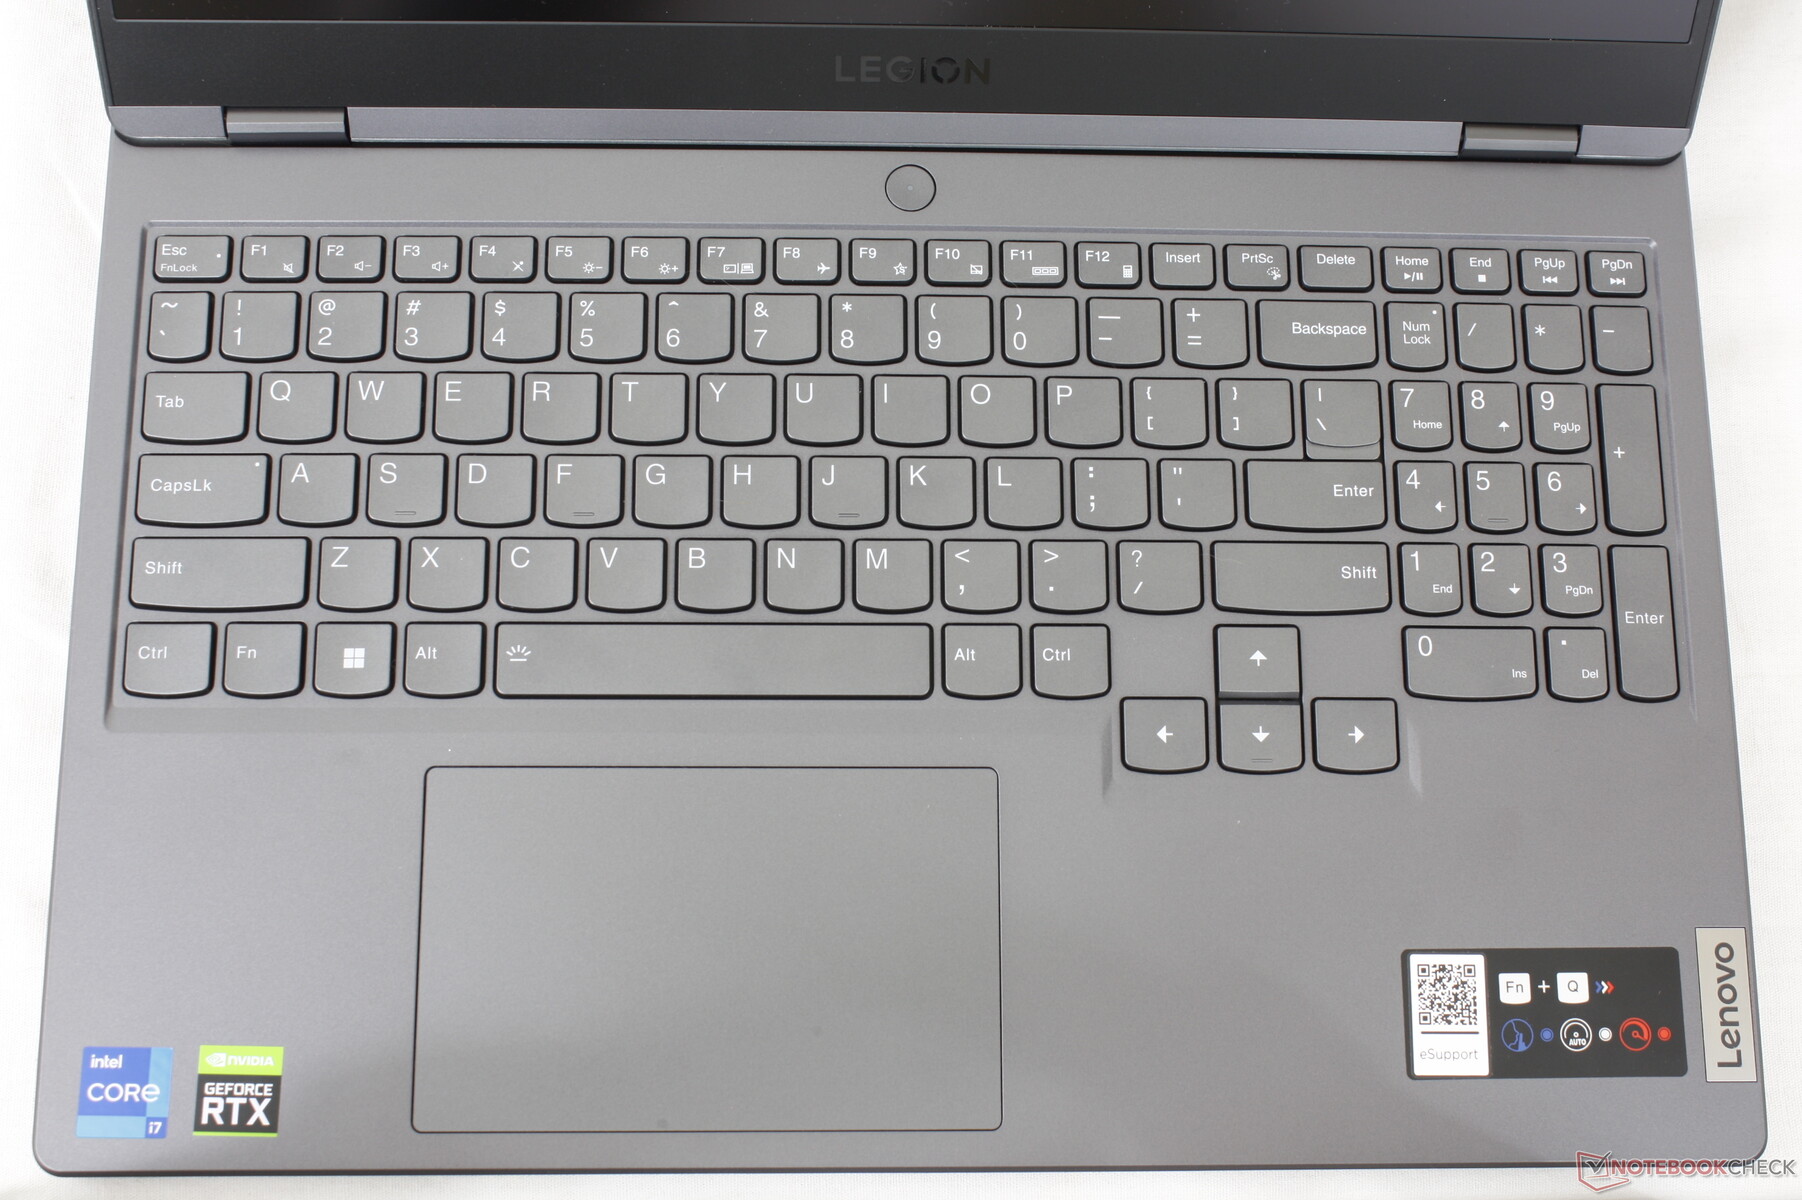
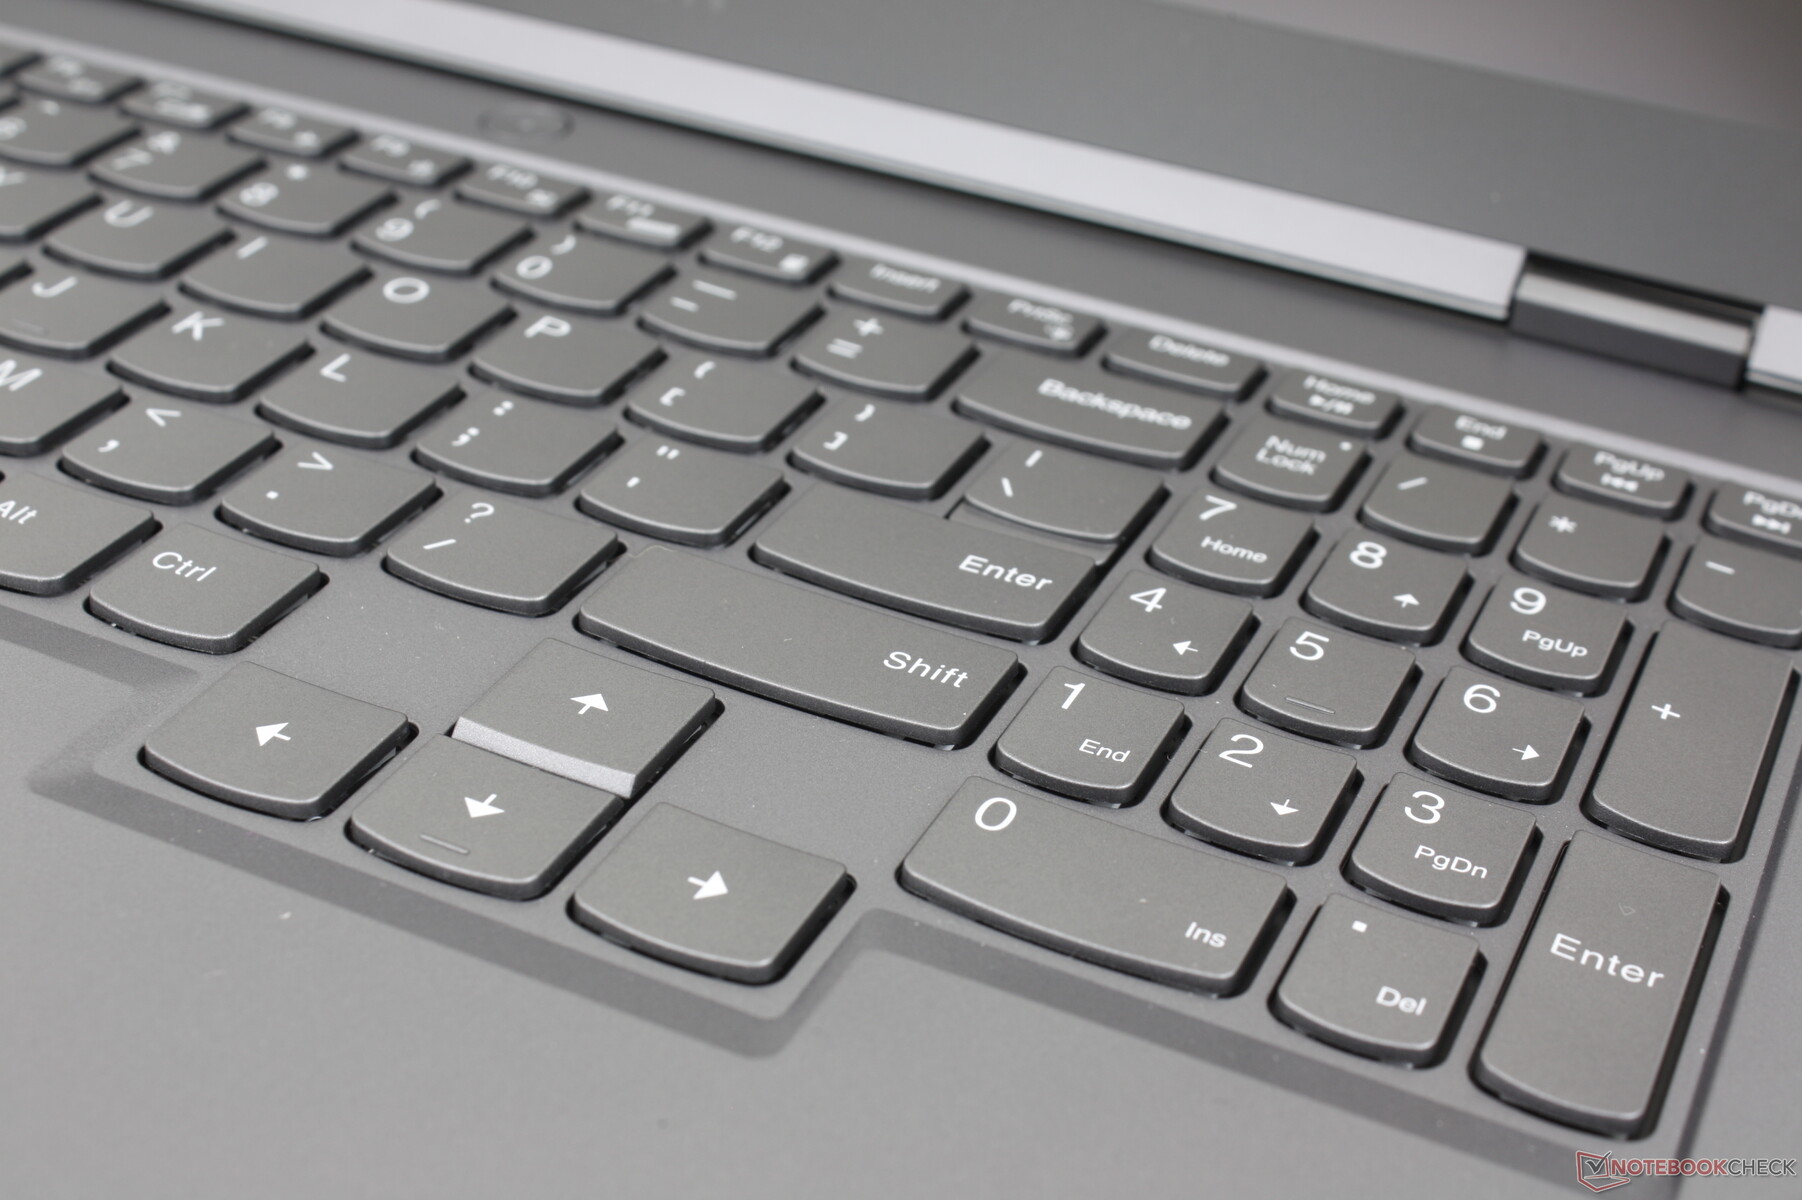
Dispositivos de entrada - Gran teclado, Clickpad esponjoso
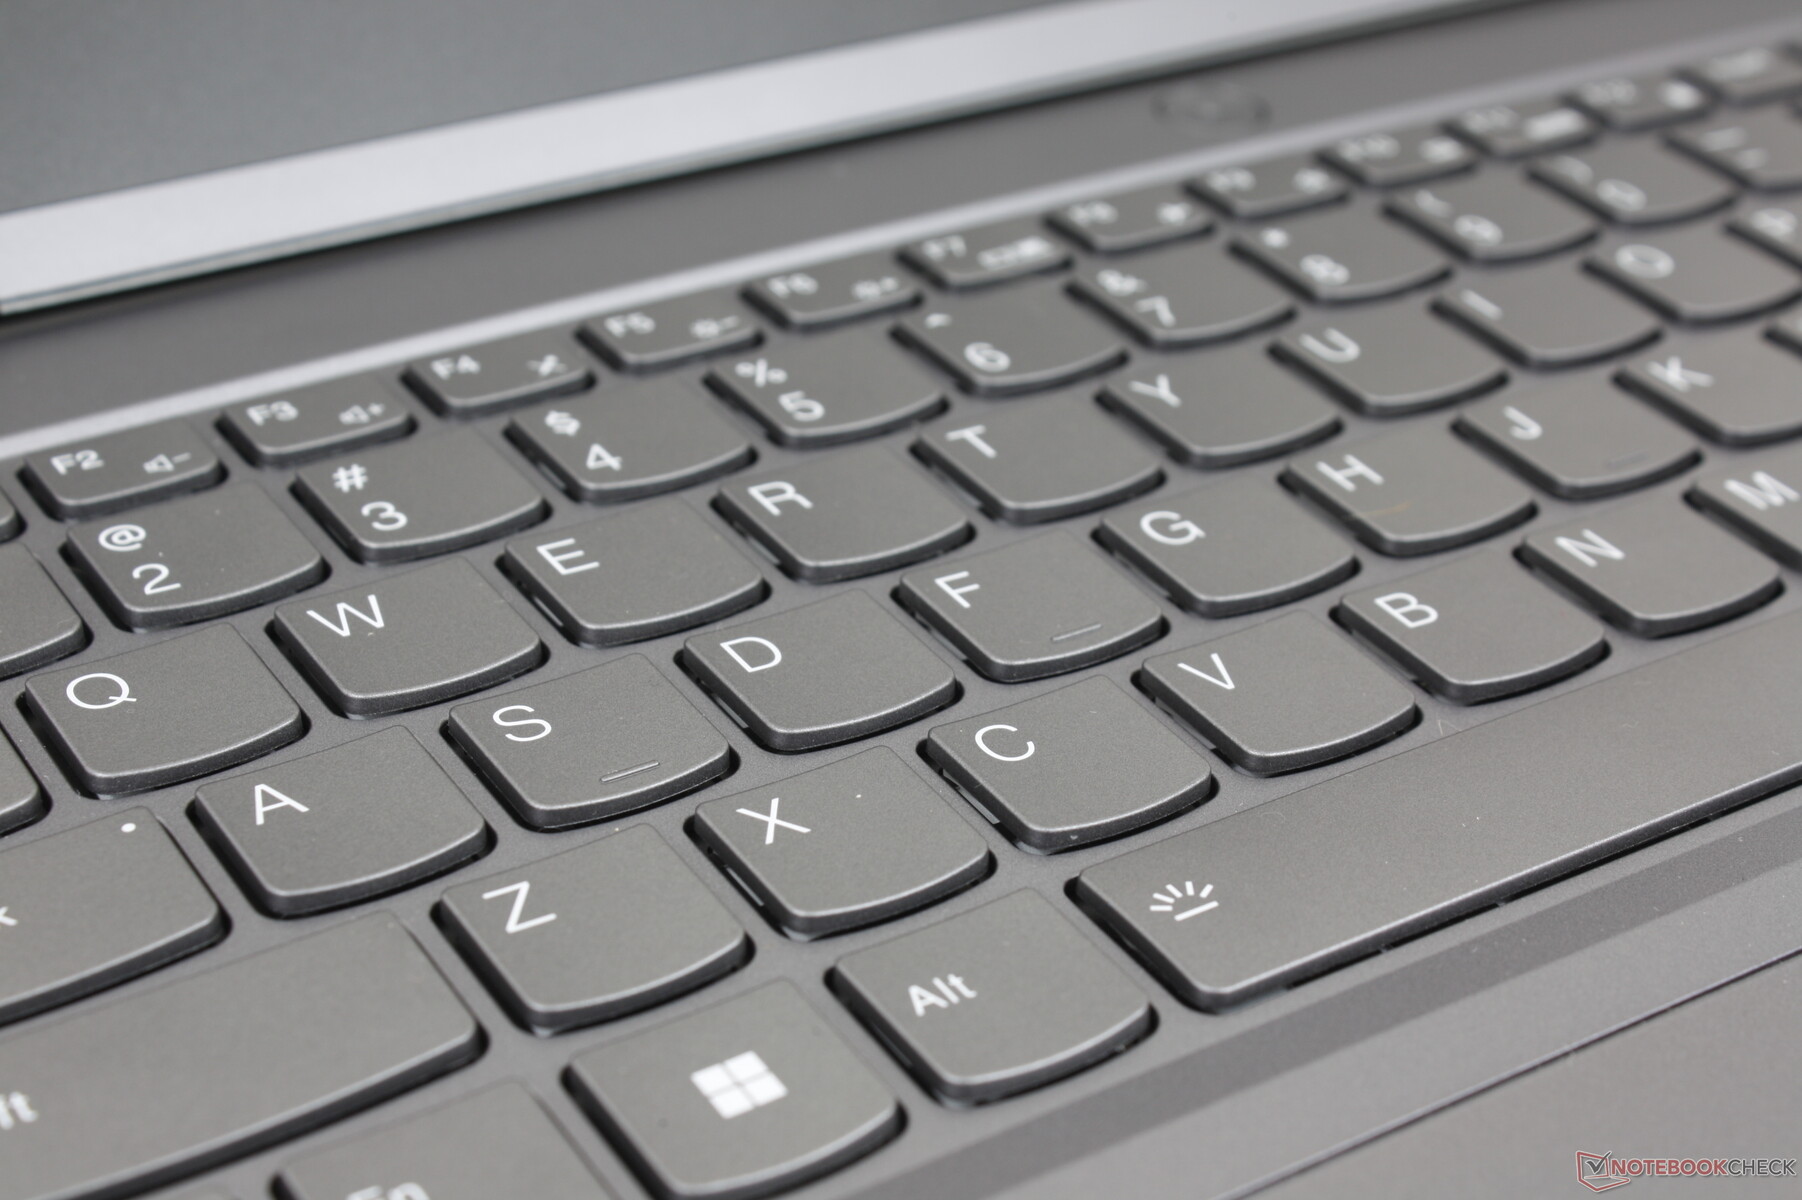
Teclado
El Legion 5 15 utiliza las tradicionales teclas de membrana en lugar de las mecánicas que se encuentran en algunos modelos de gama alta como el Serie Alienware m15. No obstante, la respuesta y el recorrido de las teclas son más nítidos y profundos en el Legion en comparación con las teclas de los Ultrabooks normales. Si escribes mucho, el teclado te resultará más cómodo para las tareas de oficina que el de un IdeaPad o un Dell Inspiron más baratos
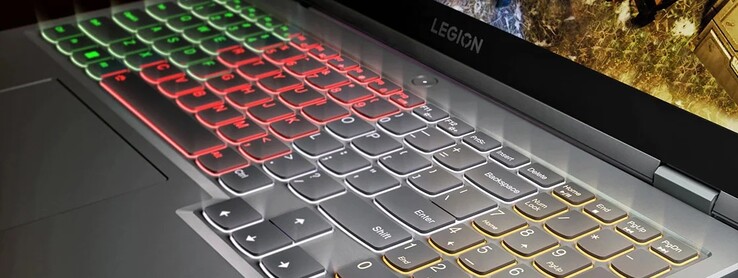
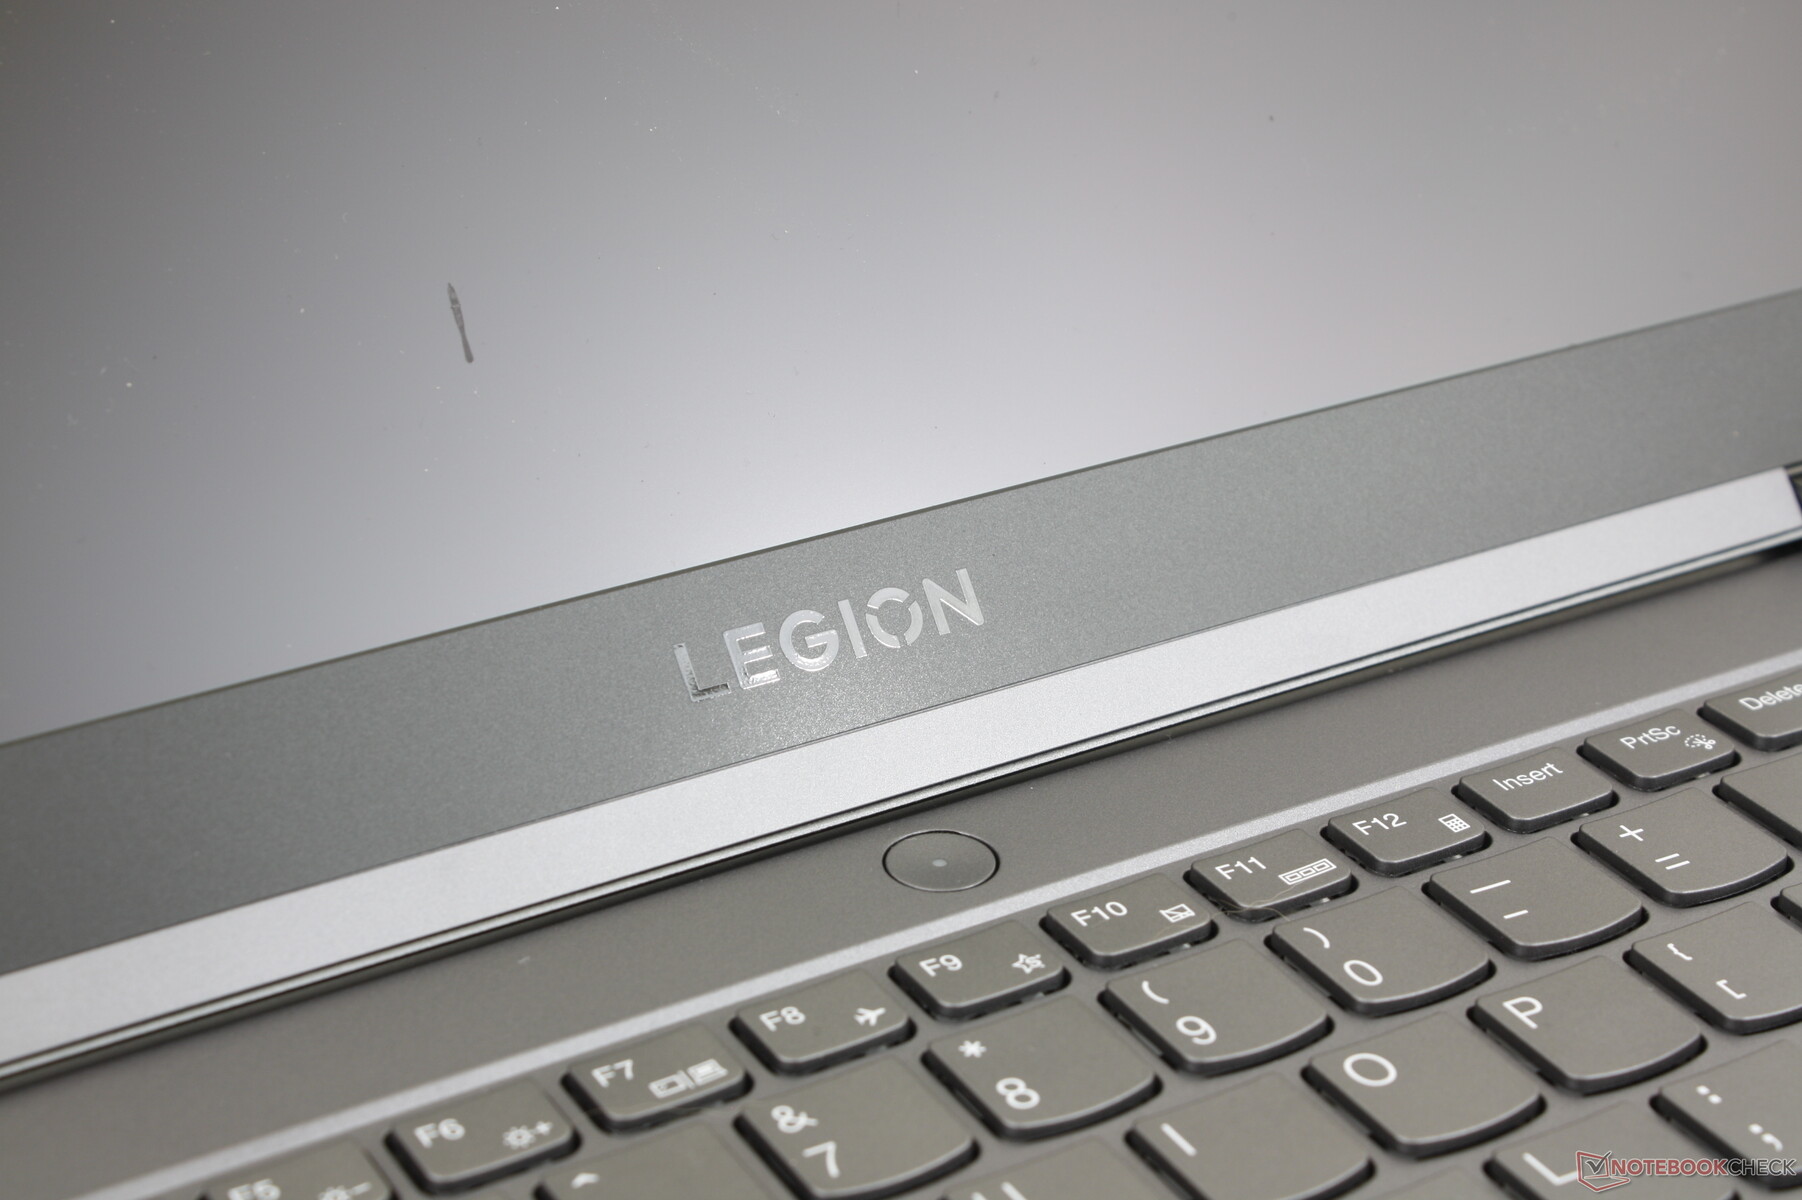
Todas las configuraciones incluyen una retroiluminación del teclado, pero algunas sólo tienen una zona blanca mientras que otras tienen cuatro zonas RGB. No hay opción de RGB por tecla, lo que probablemente ahorra costes. Todas las teclas y símbolos se iluminan.
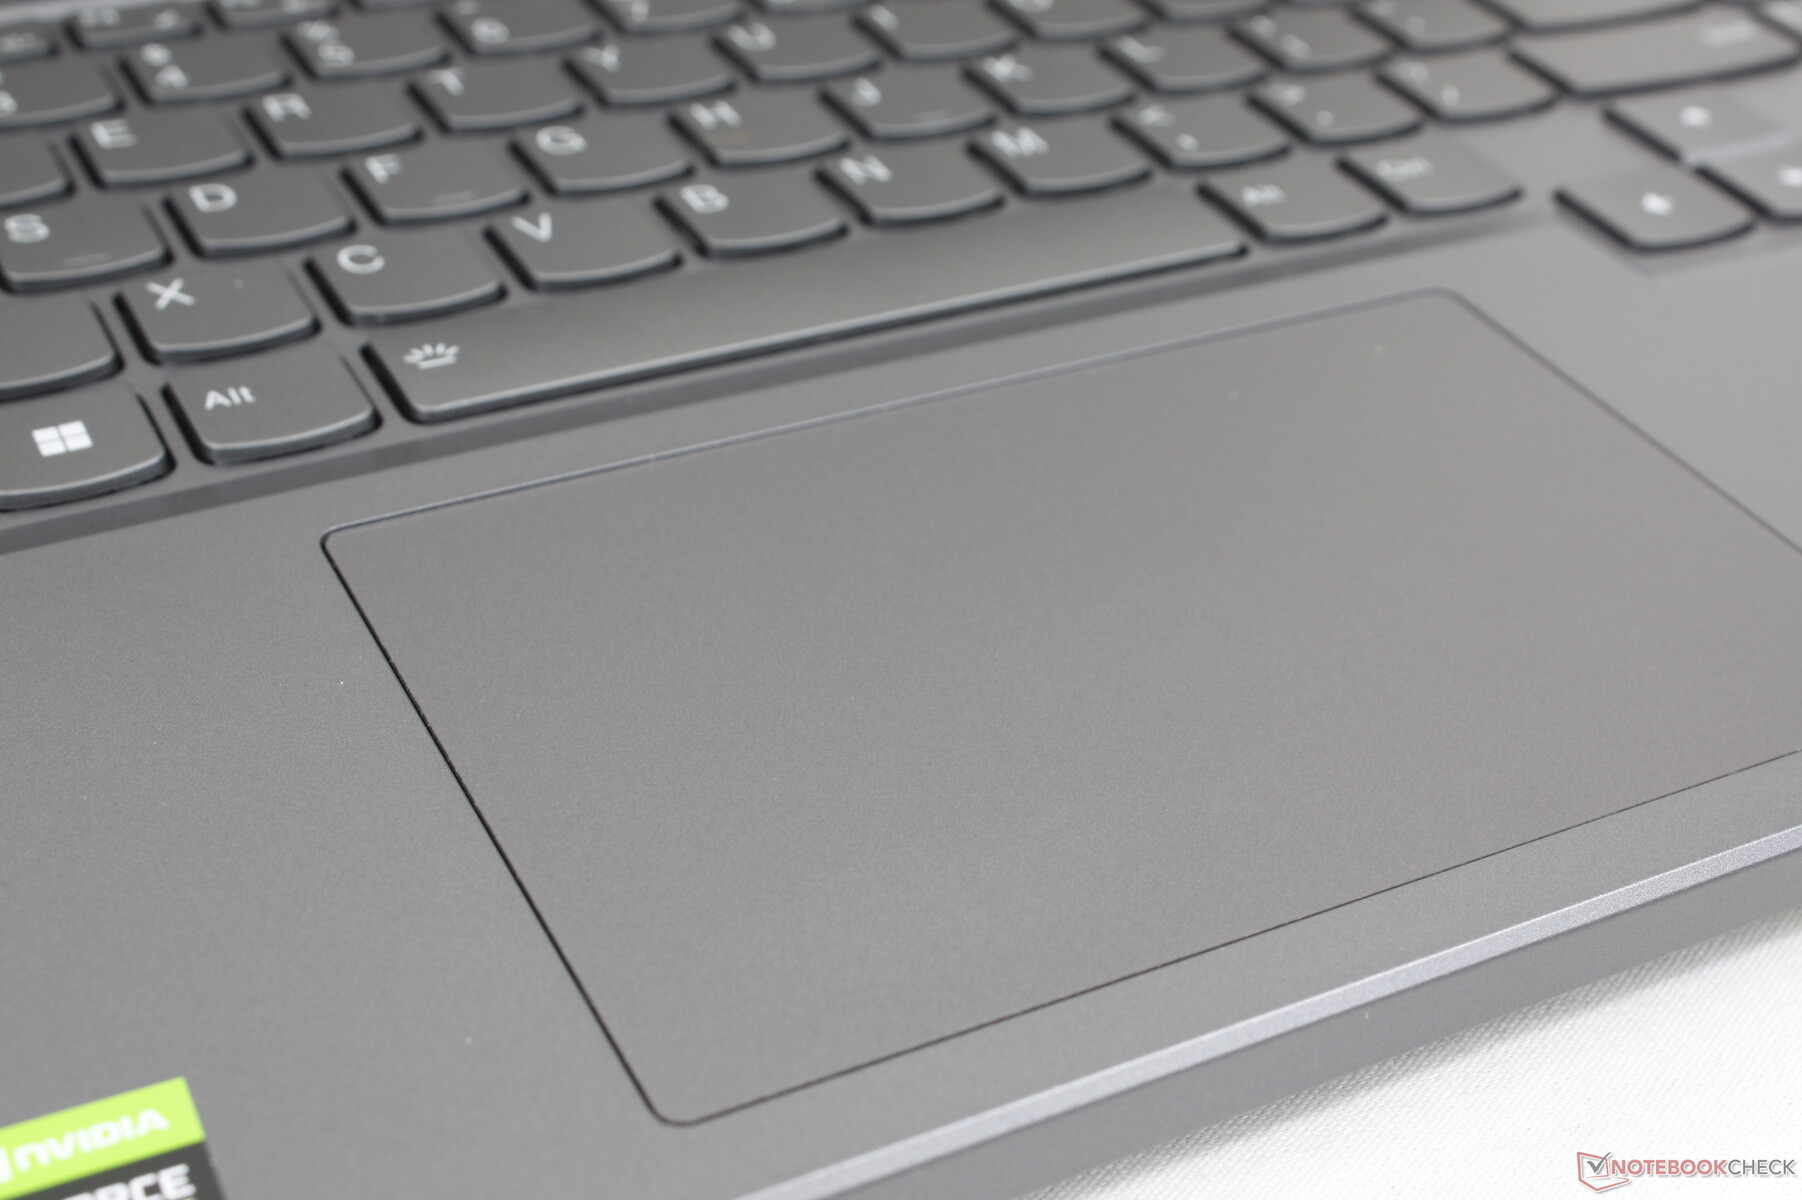
Teclado táctil
El clickpad es idéntico en tamaño al clickpad del más caro Legion 7 16 con 12 x 7,5 cm. La respuesta también es idéntica, por lo que los usuarios pueden esperar un clic algo esponjoso y poco satisfactorio al pulsarlo. La superficie del clickpad es lisa, al igual que la de los reposamanos circundantes, pero recomendamos utilizar un ratón externo para que sea más fácil hacer clic y arrastrar.
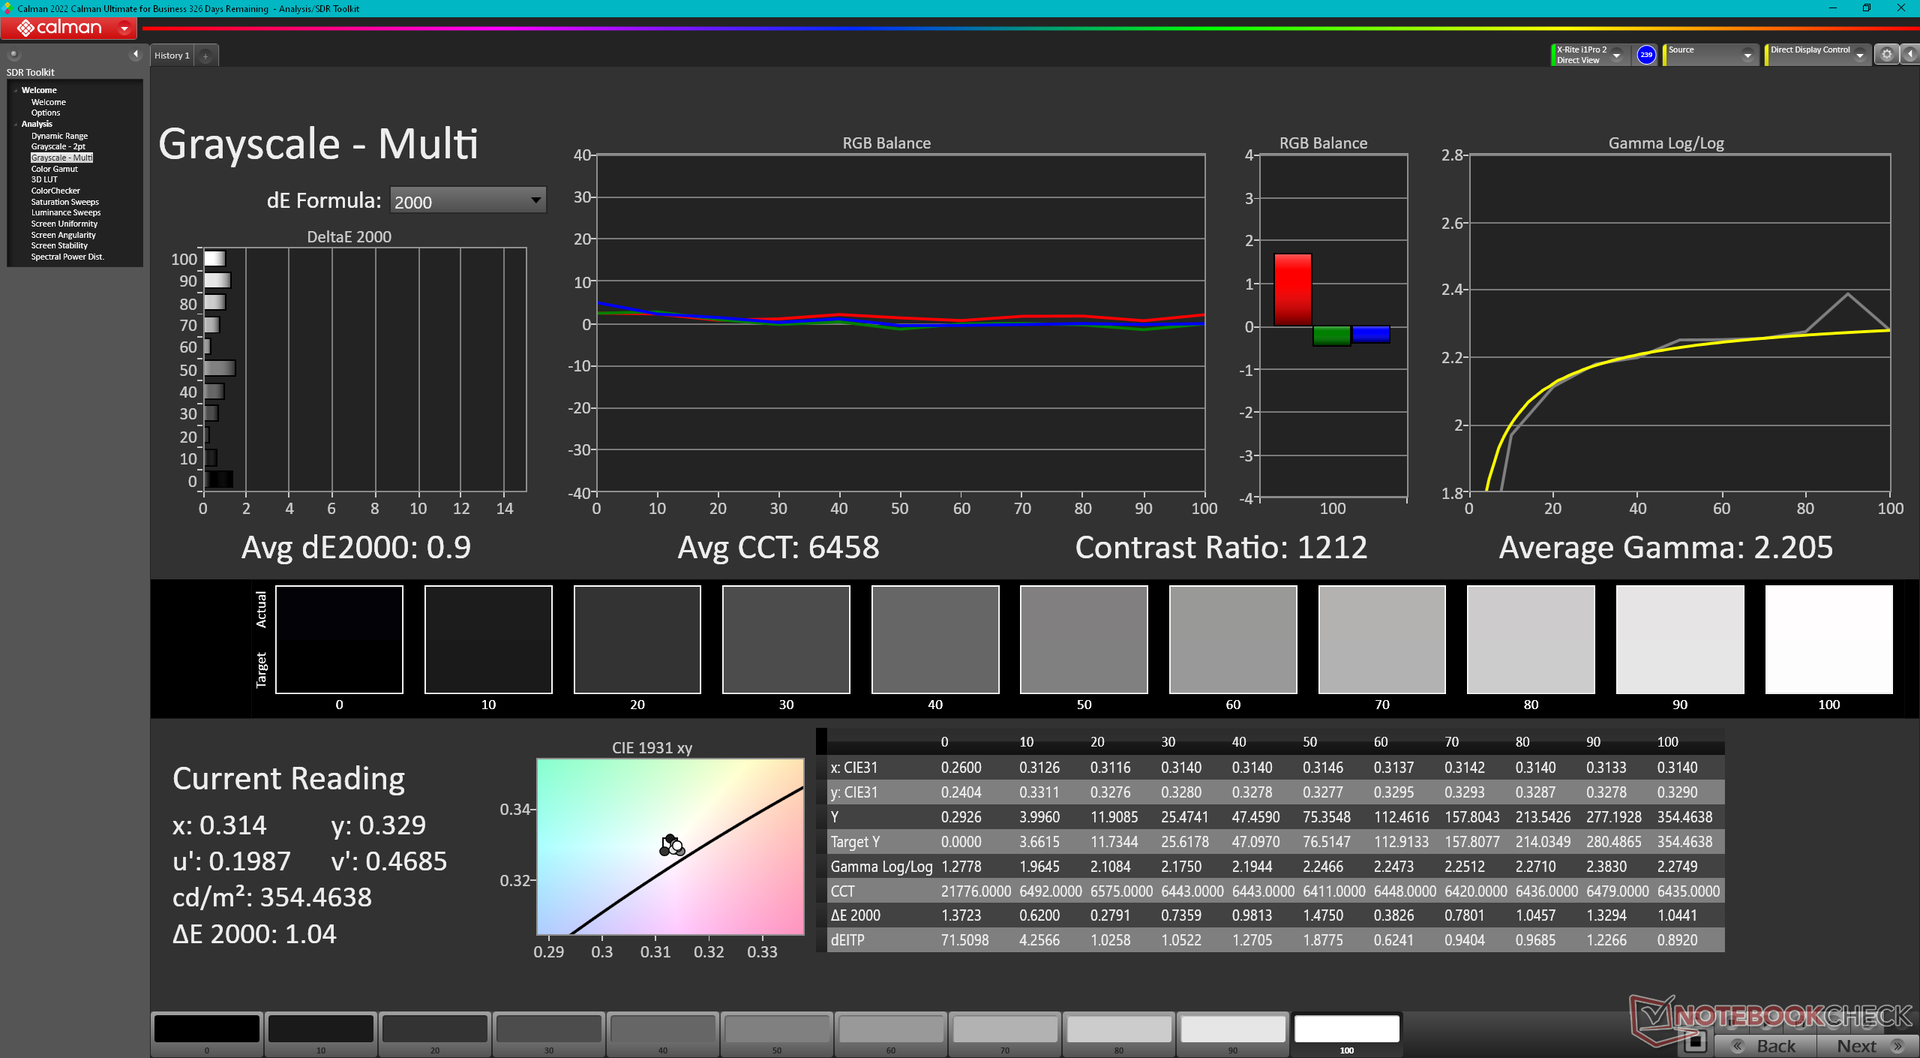
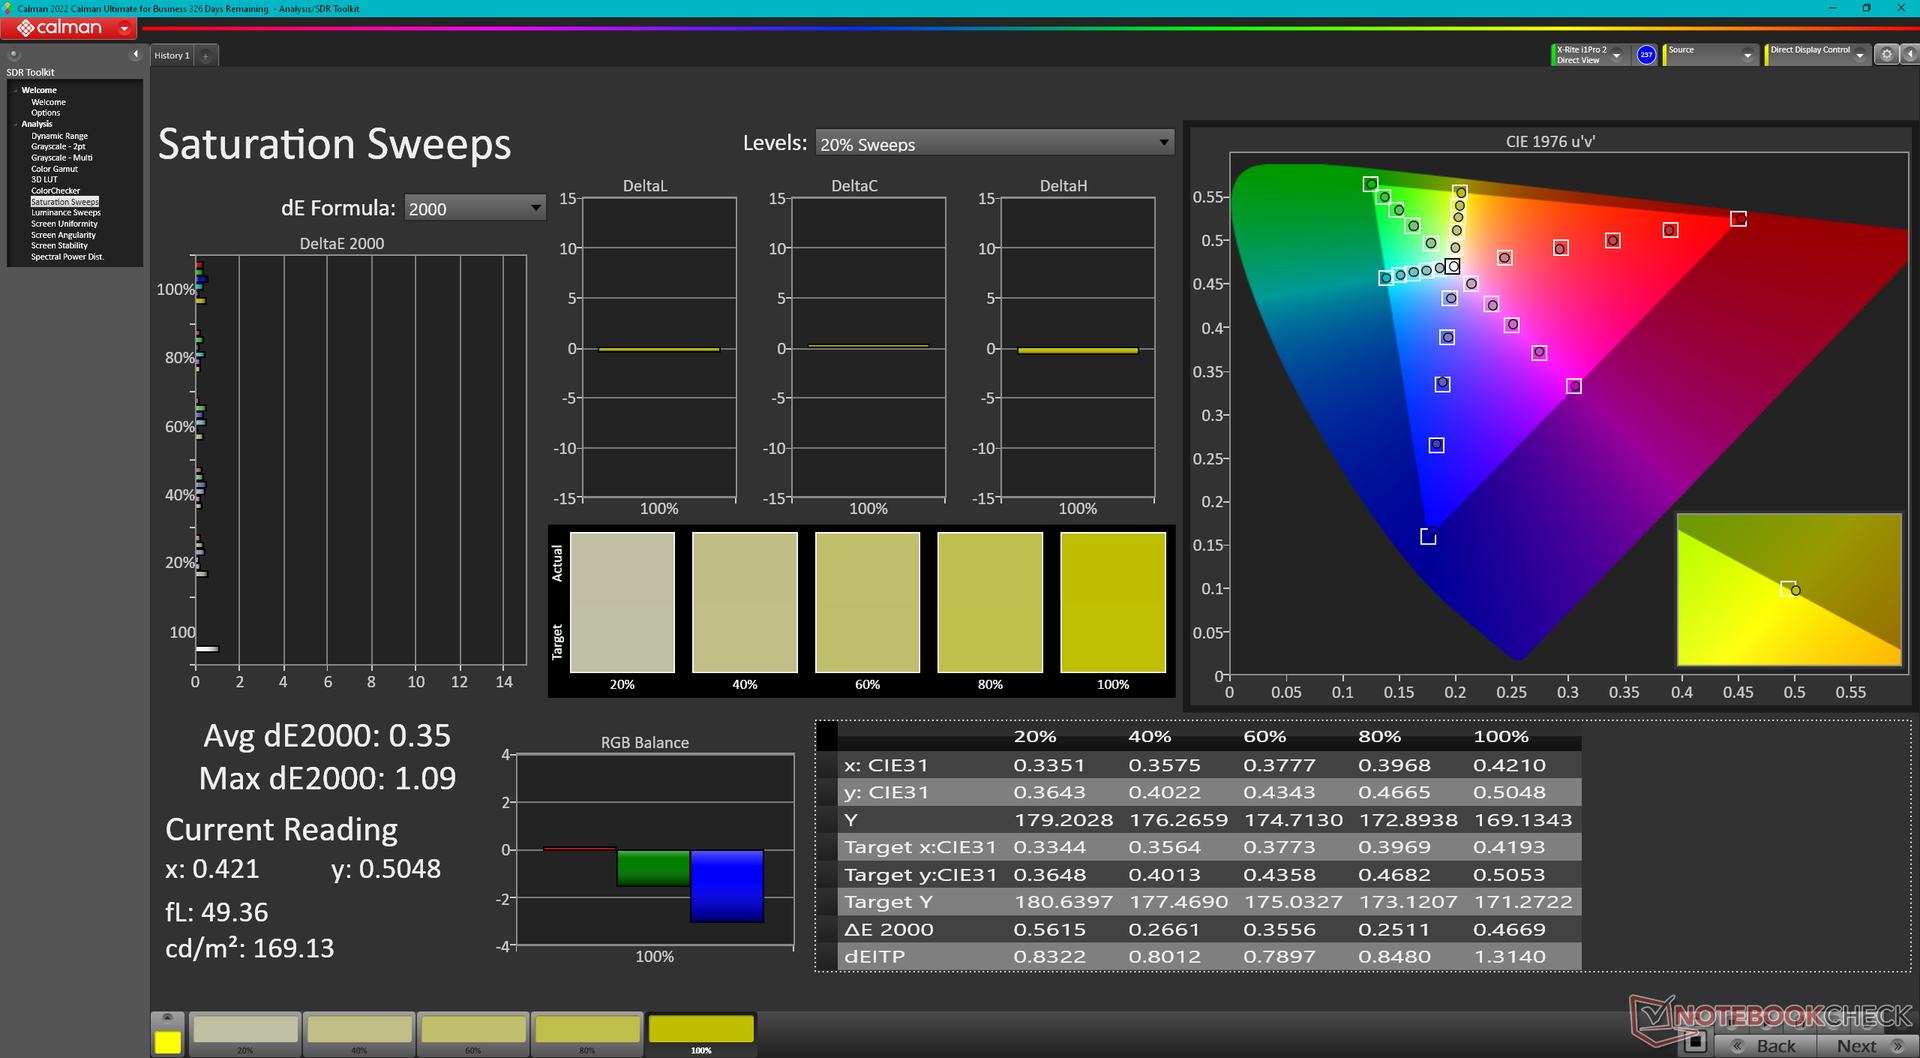
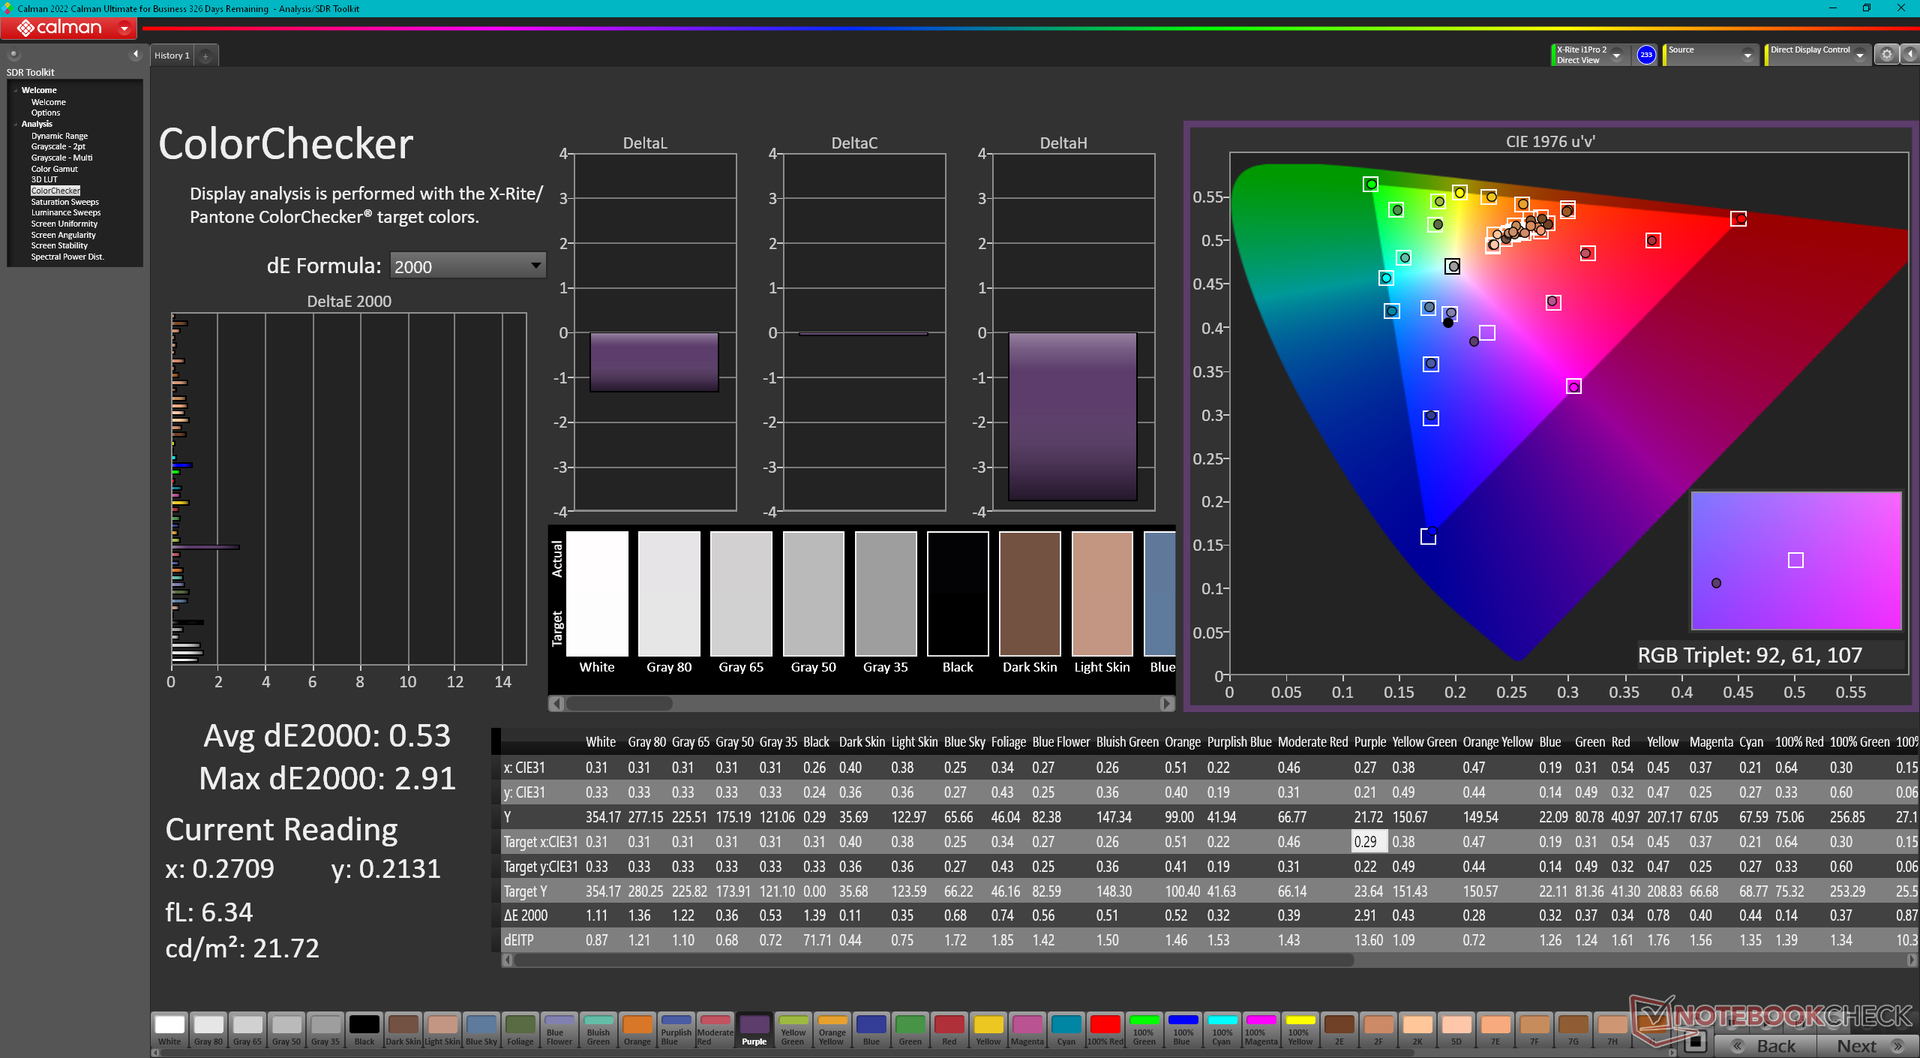
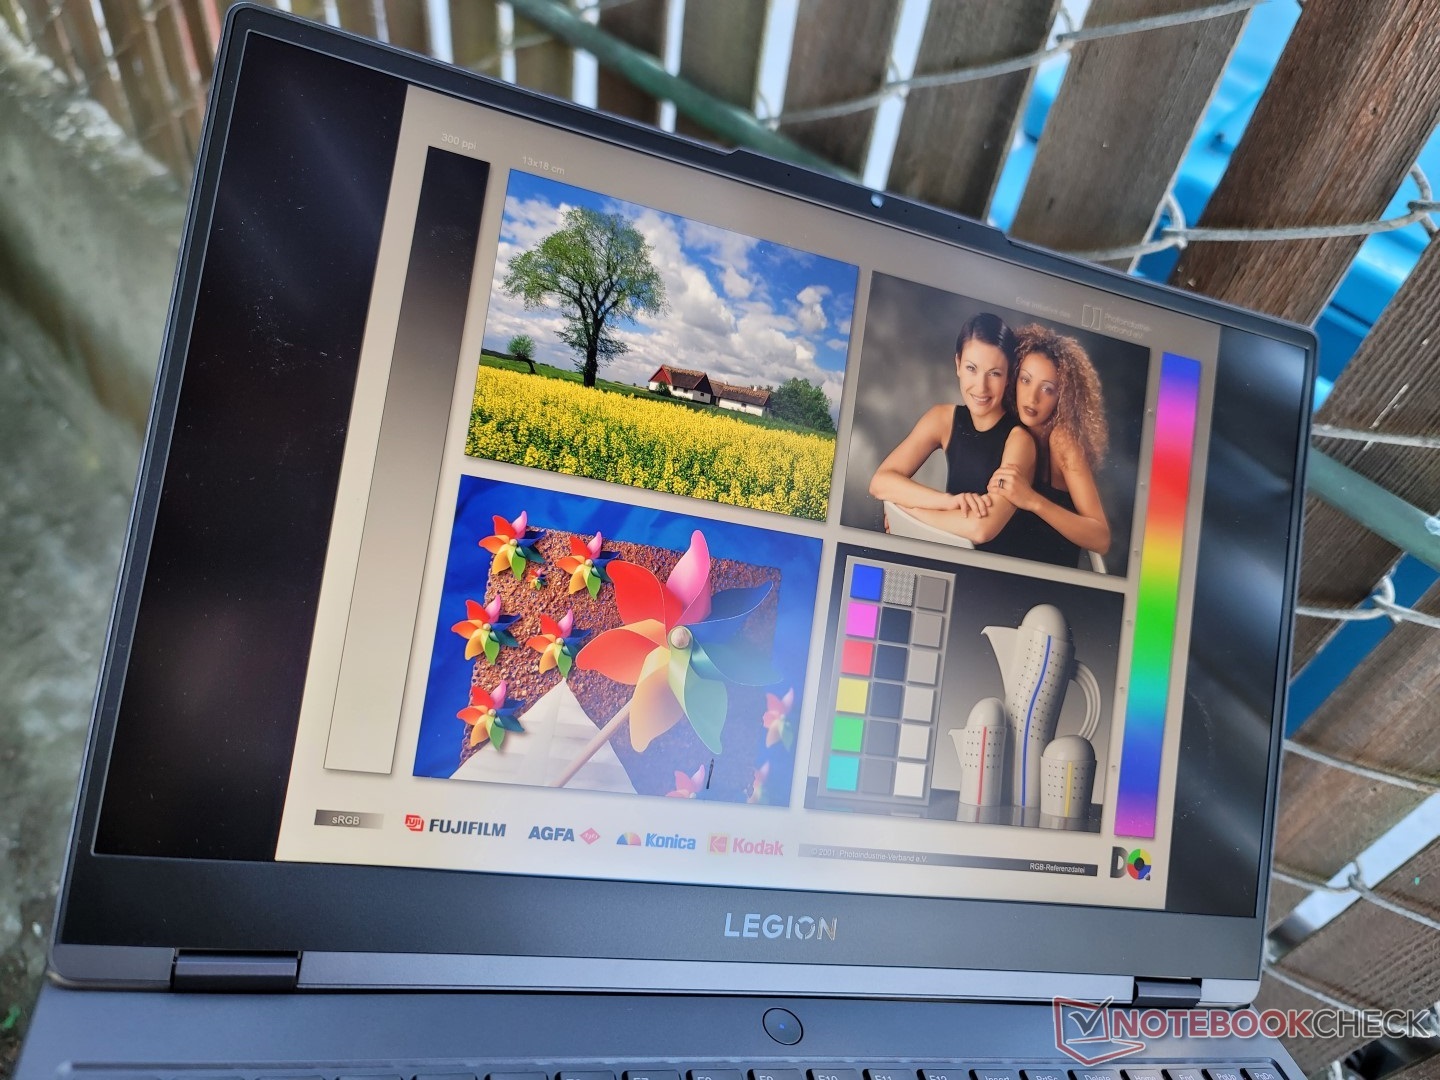
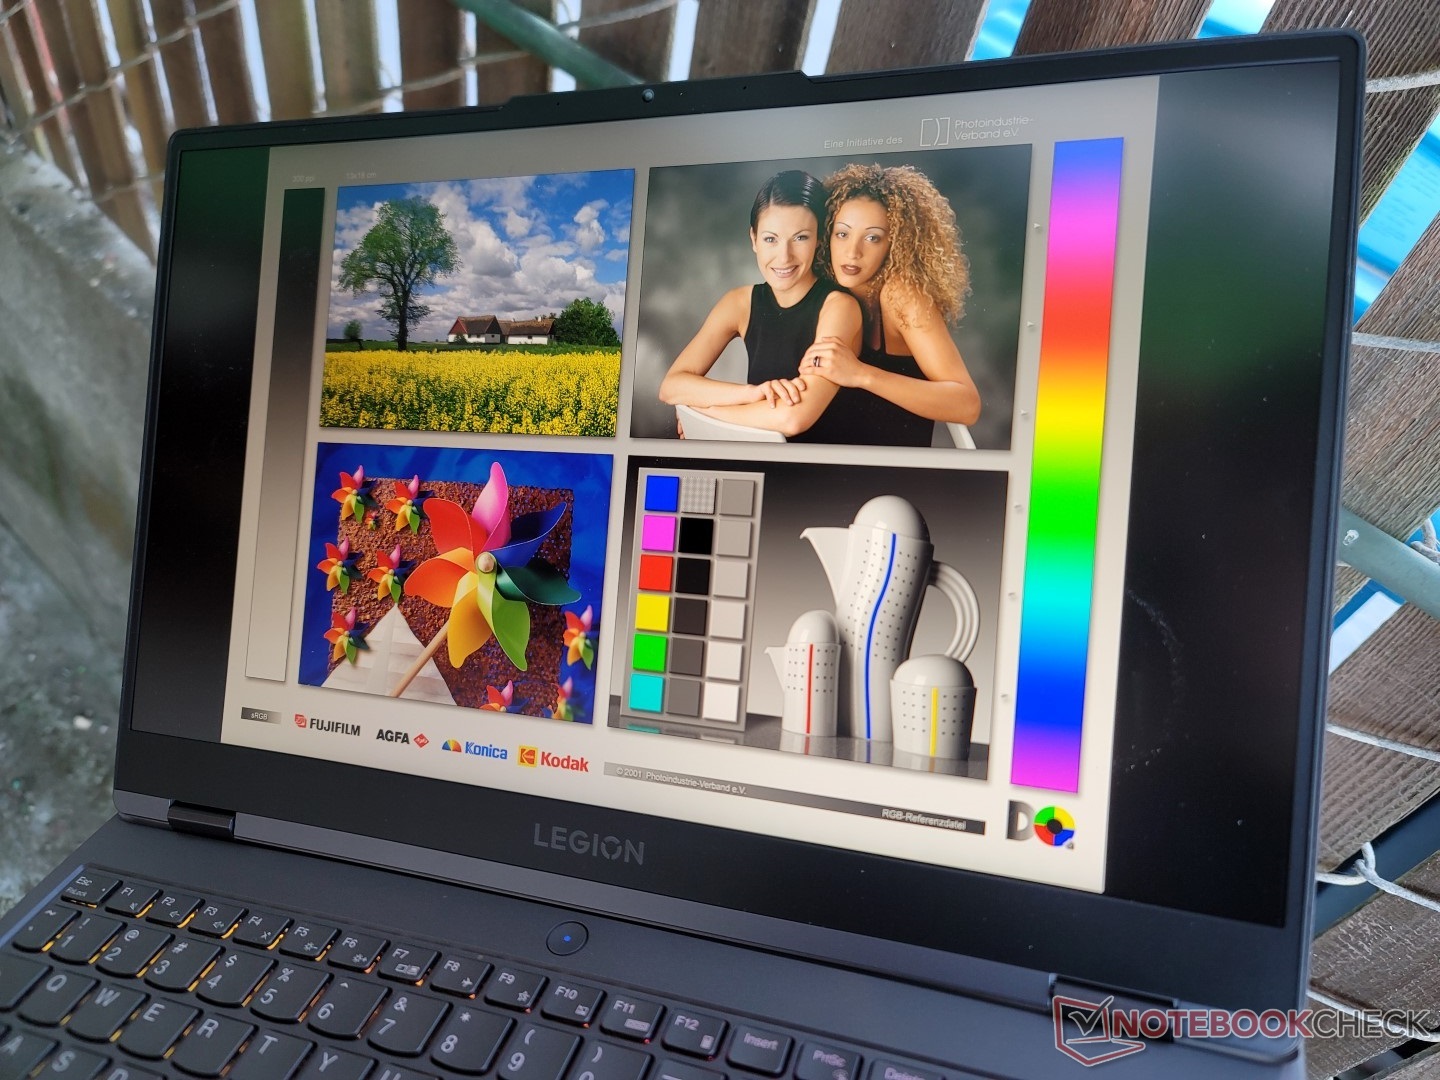
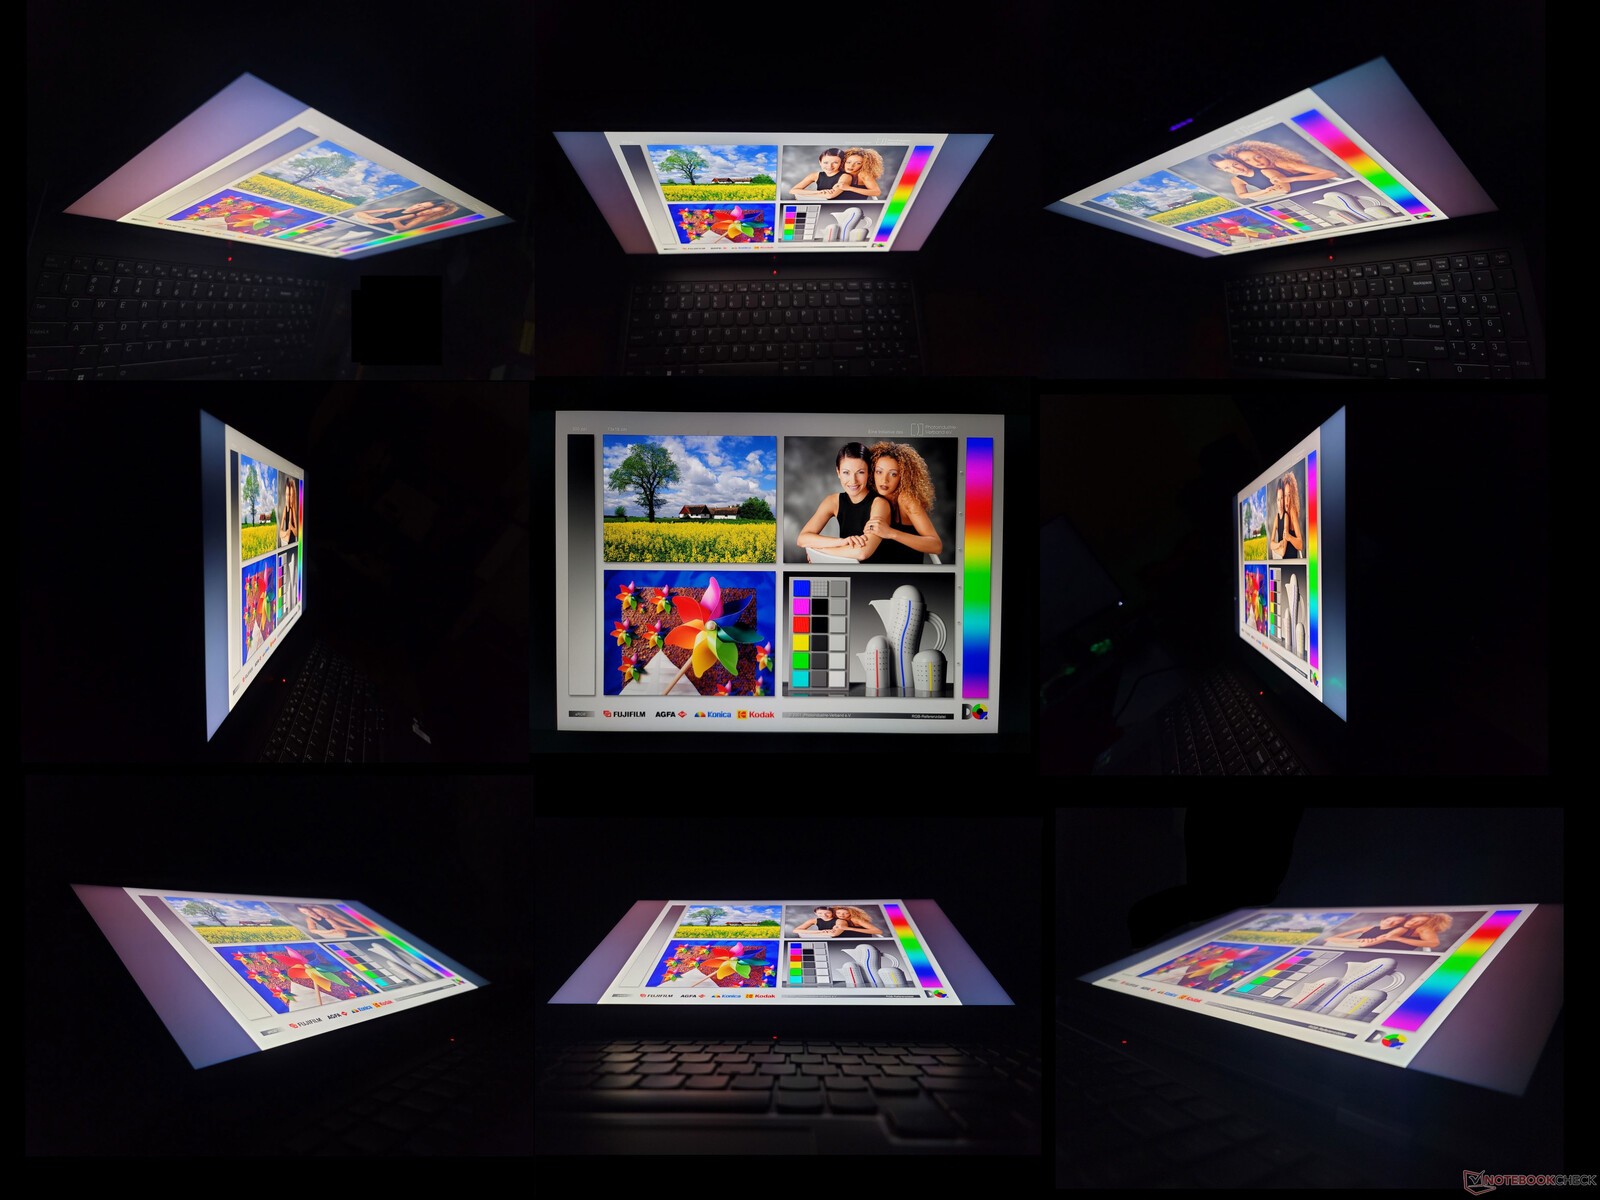
Pantalla - 165 Hz, G-Sync, 100% sRGB, IPS
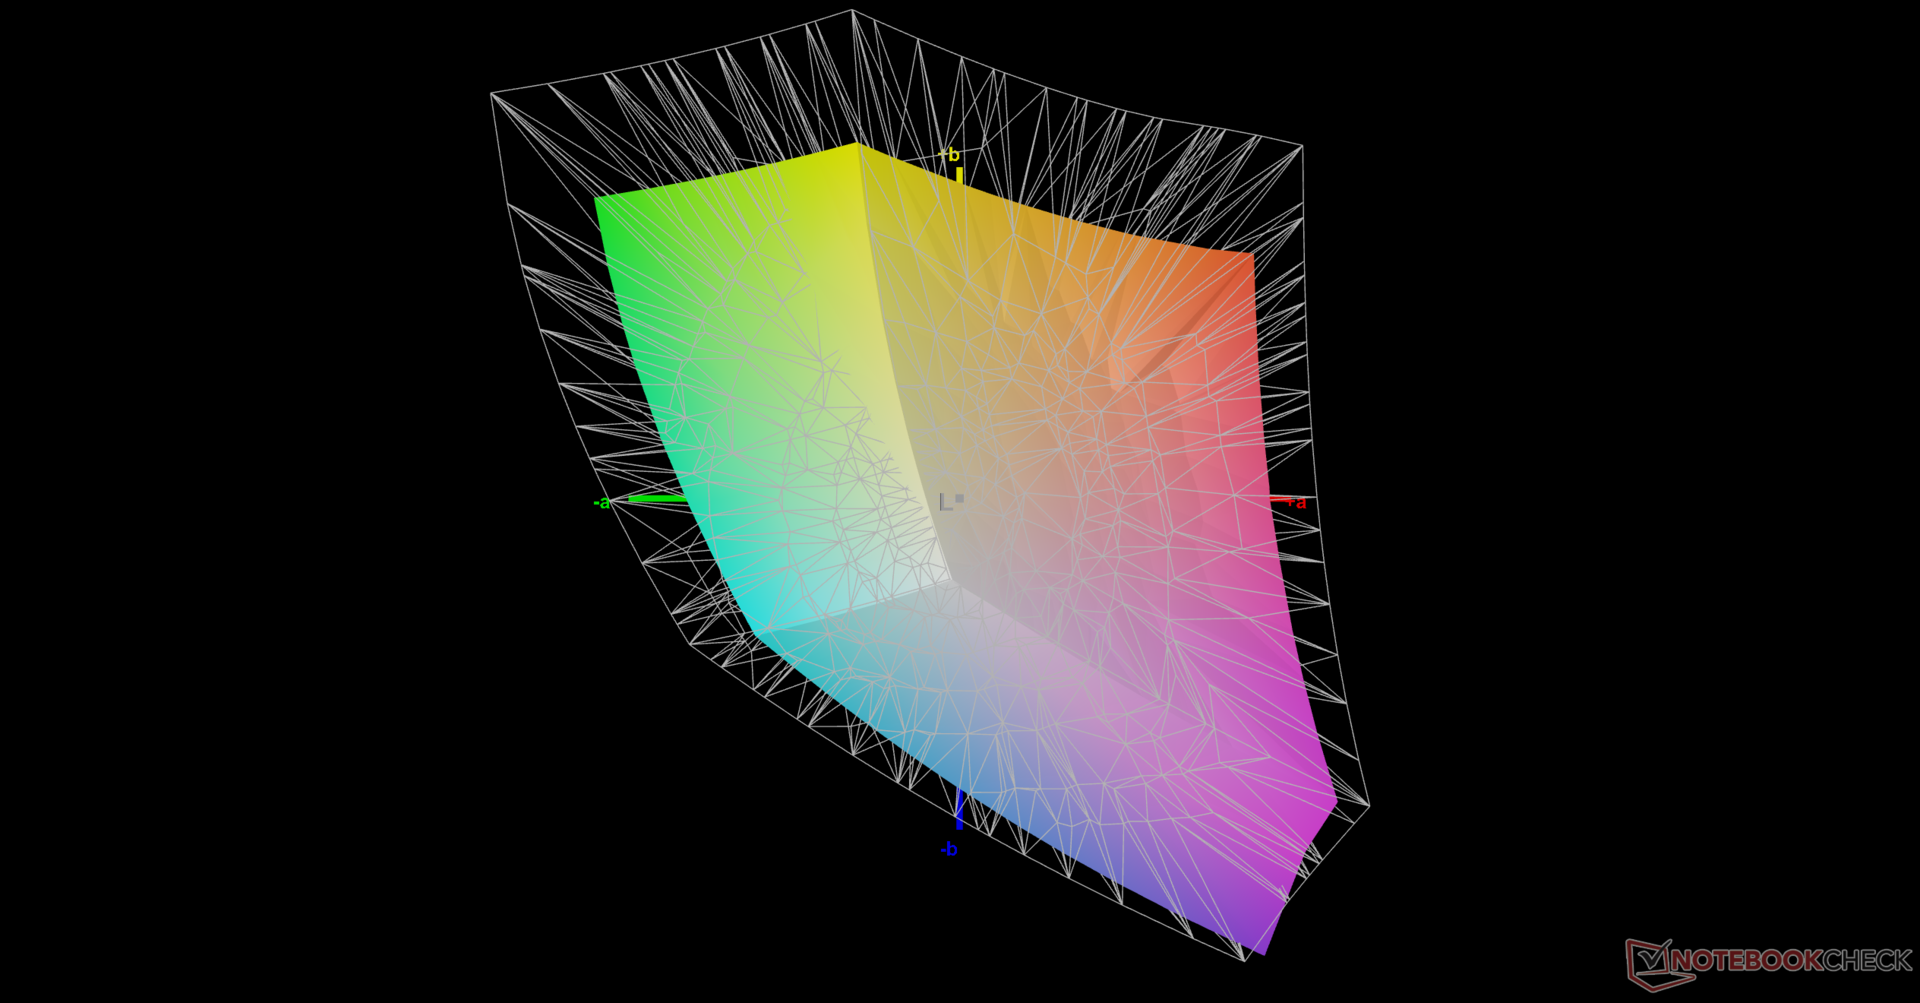
Lenovo ha cambiado los proveedores de paneles IPS de AUO a CSOT en comparación con el modelo del año pasado. No obstante, la mayoría de los atributos siguen siendo casi los mismos para una experiencia visual similar. Los usuarios siguen teniendo G-Sync, 100% de cobertura sRGB, 165 Hz de tasa de refresco nativa, rápidos tiempos de respuesta, brillante retroiluminación de 350 nits, y un decente ratio de contraste de ~1000:1. Algunos modelos pueden incluir un panel 1080p 144 Hz más barato que recomendamos evitar debido a su espacio de color más estrecho.


| |||||||||||||||||||||||||
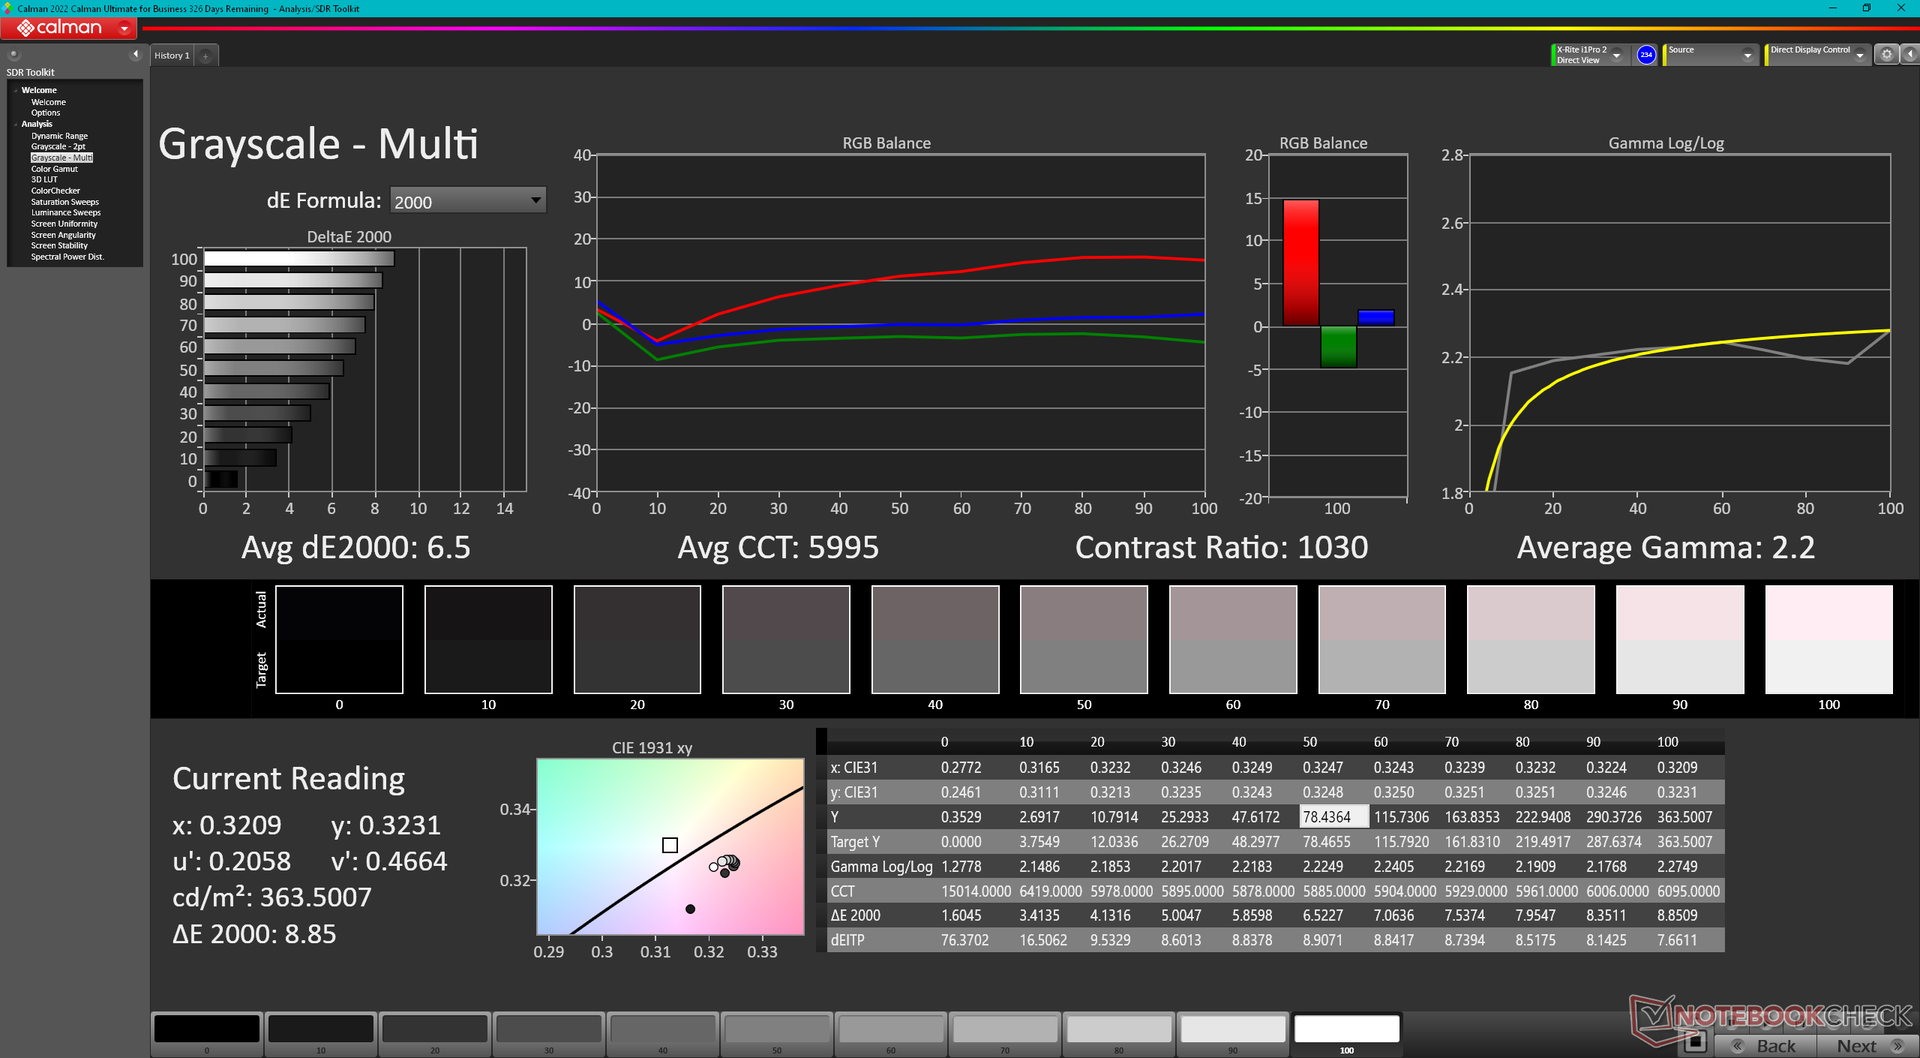
iluminación: 89 %
Brillo con batería: 363.5 cd/m²
Contraste: 932:1 (Negro: 0.39 cd/m²)
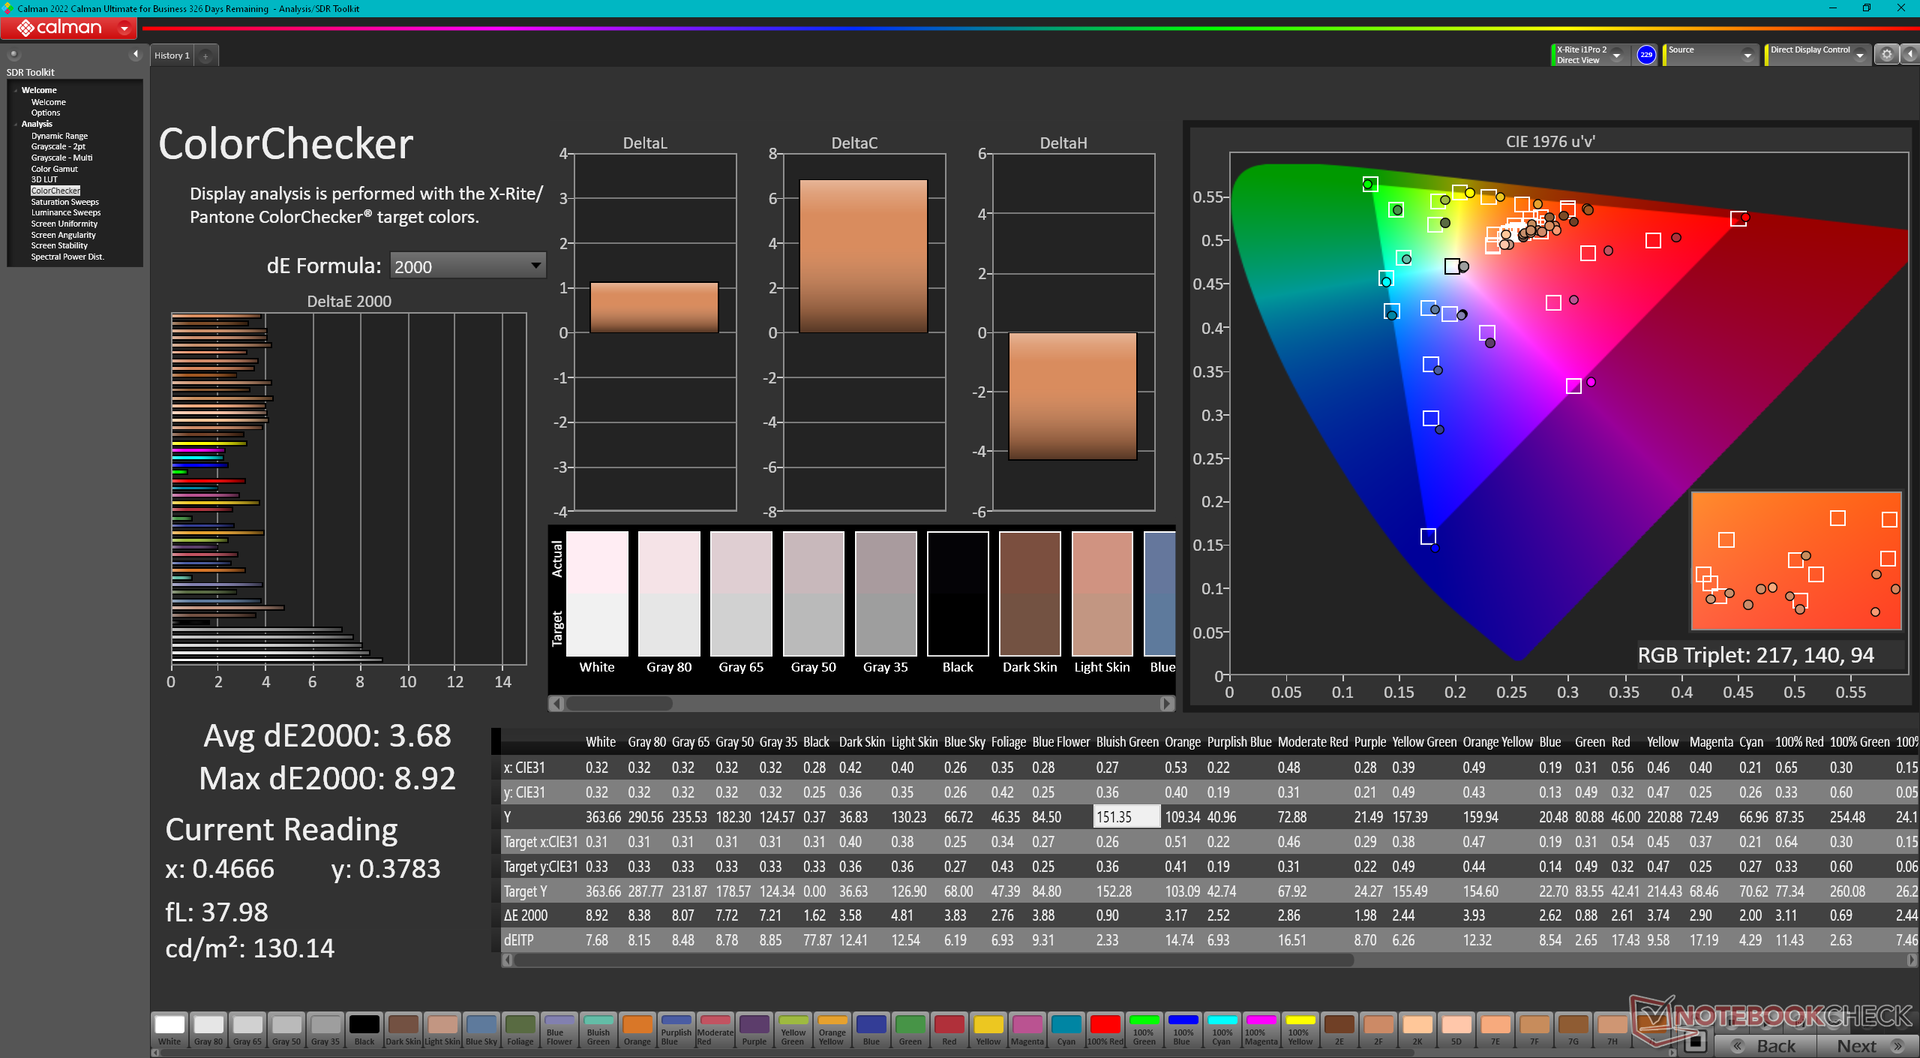
ΔE ColorChecker Calman: 3.68 | ∀{0.5-29.43 Ø4.73}
calibrated: 0.53
ΔE Greyscale Calman: 6.5 | ∀{0.09-98 Ø4.97}
70% AdobeRGB 1998 (Argyll 3D)
99.5% sRGB (Argyll 3D)
69.1% Display P3 (Argyll 3D)
Gamma: 2.2
CCT: 5995 K
| Lenovo Legion 5 15IAH7H 82RB CSOT MNF601CA1-3, IPS, 1920x1080, 15.6" | Lenovo Legion 5 15ACH-82JU00C6GE-FL B156HAN12.H, , 1920x1080, 15.6" | MSI Bravo 15 B5DD-010US Chi Mei N156HRA-EA1, IPS, 1920x1080, 15.6" | Asus TUF Gaming F15 FX507ZM TL156VDXP0101, IPS, 1920x1080, 15.6" | Acer Aspire Nitro 5 AN515-55-57GF Chi Mei CMN N156HRA-EA1, IPS, 1920x1080, 15.6" | Razer Blade 15 Base Edition 2021, i7-10750H RTX 3060 BOE NV156FHM-N4K, IPS, 1920x1080, 15.6" | |
|---|---|---|---|---|---|---|
| Display | -4% | -38% | -3% | -37% | -7% | |
| Display P3 Coverage (%) | 69.1 | 65.4 -5% | 42.1 -39% | 66.4 -4% | 42.54 -38% | 64.3 -7% |
| sRGB Coverage (%) | 99.5 | 96.3 -3% | 62.8 -37% | 97 -3% | 63.5 -36% | 91.8 -8% |
| AdobeRGB 1998 Coverage (%) | 70 | 67.5 -4% | 43.6 -38% | 68.5 -2% | 44.02 -37% | 65.5 -6% |
| Response Times | 16% | -82% | 28% | -111% | 29% | |
| Response Time Grey 50% / Grey 80% * (ms) | 14.8 ? | 13.6 ? 8% | 25.6 ? -73% | 5.6 ? 62% | 33.8 ? -128% | 8.8 ? 41% |
| Response Time Black / White * (ms) | 12 ? | 9.2 ? 23% | 22.8 ? -90% | 12.8 ? -7% | 23.2 ? -93% | 10 ? 17% |
| PWM Frequency (Hz) | 1000 ? | |||||
| Screen | -15% | -87% | 23% | -53% | -40% | |
| Brightness middle (cd/m²) | 363.5 | 350 -4% | 265.1 -27% | 353.7 -3% | 288 -21% | 317.2 -13% |
| Brightness (cd/m²) | 350 | 350 0% | 245 -30% | 340 -3% | 262 -25% | 306 -13% |
| Brightness Distribution (%) | 89 | 96 8% | 87 -2% | 89 0% | 88 -1% | 89 0% |
| Black Level * (cd/m²) | 0.39 | 0.3 23% | 0.35 10% | 0.34 13% | 0.21 46% | 0.31 21% |
| Contrast (:1) | 932 | 1167 25% | 757 -19% | 1040 12% | 1371 47% | 1023 10% |
| Colorchecker dE 2000 * | 3.68 | 3.9 -6% | 4.68 -27% | 1.74 53% | 3.61 2% | 4.37 -19% |
| Colorchecker dE 2000 max. * | 8.92 | 8.2 8% | 19.96 -124% | 3.63 59% | 18.07 -103% | 6.62 26% |
| Colorchecker dE 2000 calibrated * | 0.53 | 1.6 -202% | 3.7 -598% | 0.5 6% | 3.12 -489% | 2.67 -404% |
| Greyscale dE 2000 * | 6.5 | 5.5 15% | 4.5 31% | 2.1 68% | 2.4 63% | 4.5 31% |
| Gamma | 2.2 100% | 2.15 102% | 2.22 99% | 2.3 96% | 2.216 99% | 2.4 92% |
| CCT | 5995 108% | 7414 88% | 6632 98% | 6257 104% | 6675 97% | 7418 88% |
| Color Space (Percent of AdobeRGB 1998) (%) | 44 | 59.2 | ||||
| Color Space (Percent of sRGB) (%) | 62 | 91.4 | ||||
| Media total (Programa/Opciones) | -1% /
-8% | -69% /
-76% | 16% /
18% | -67% /
-58% | -6% /
-23% |
* ... más pequeño es mejor
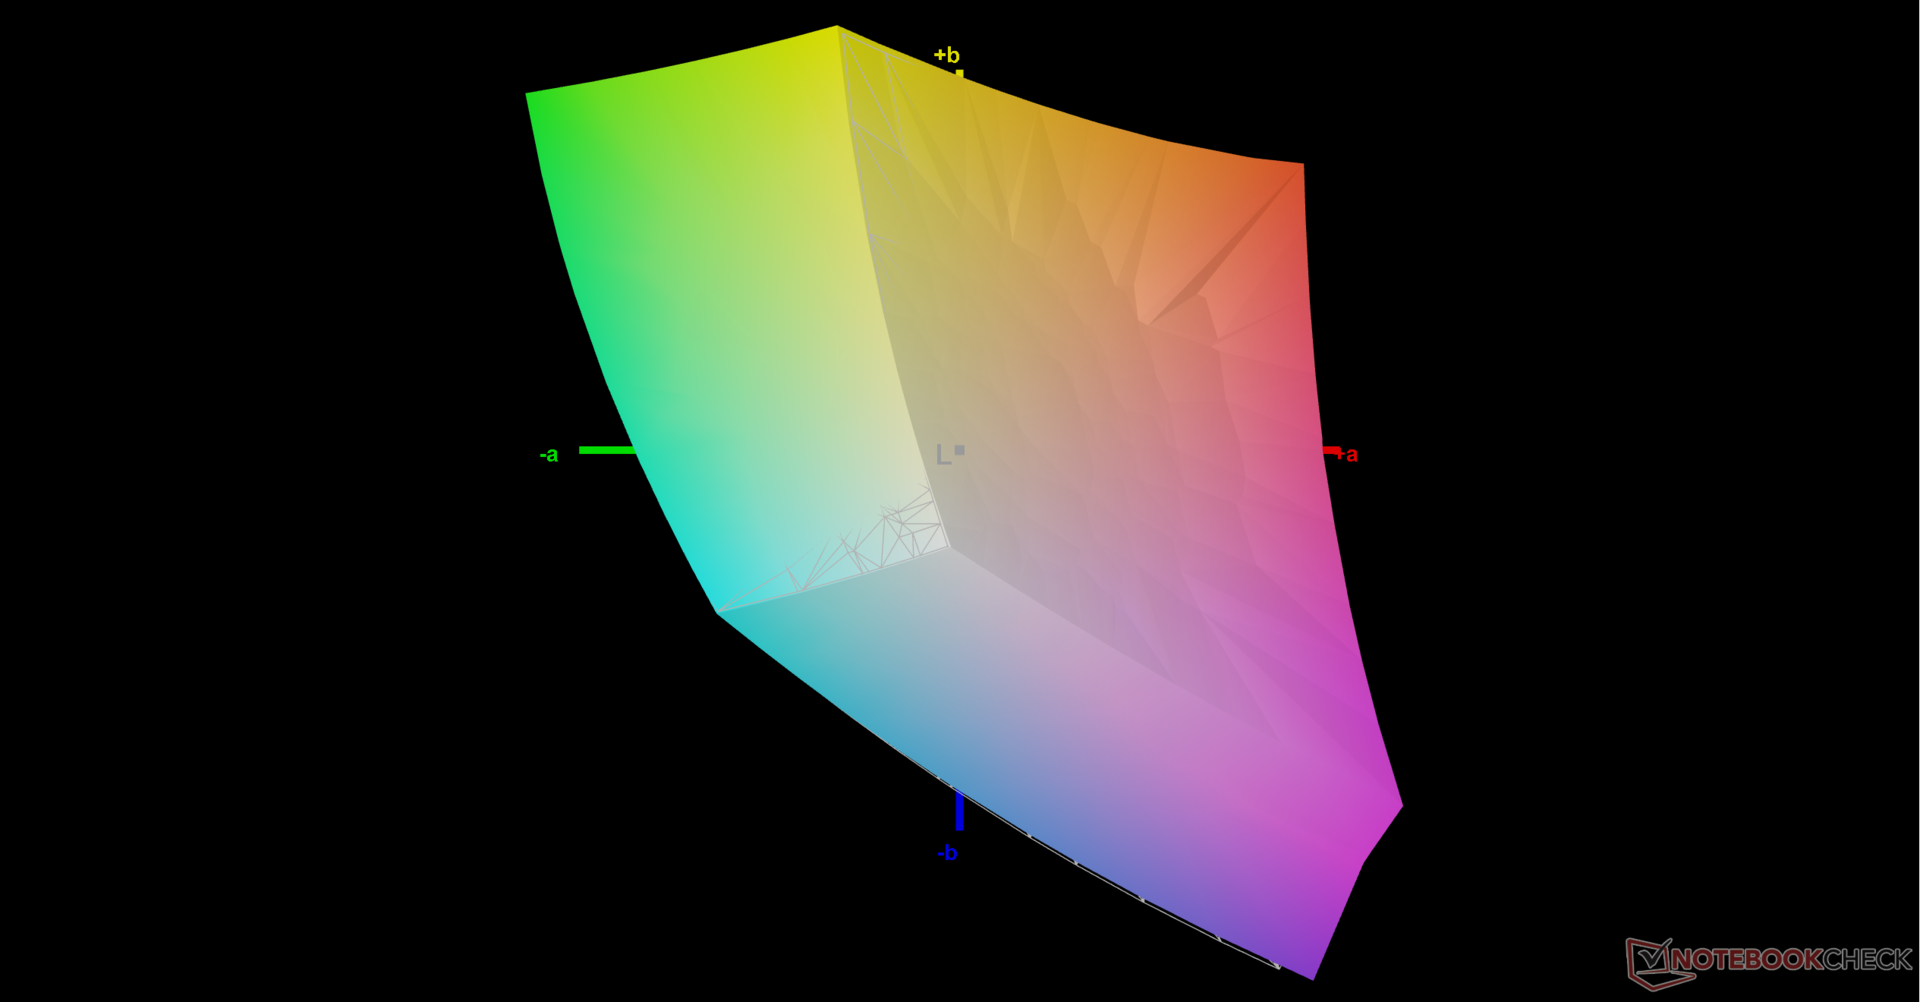
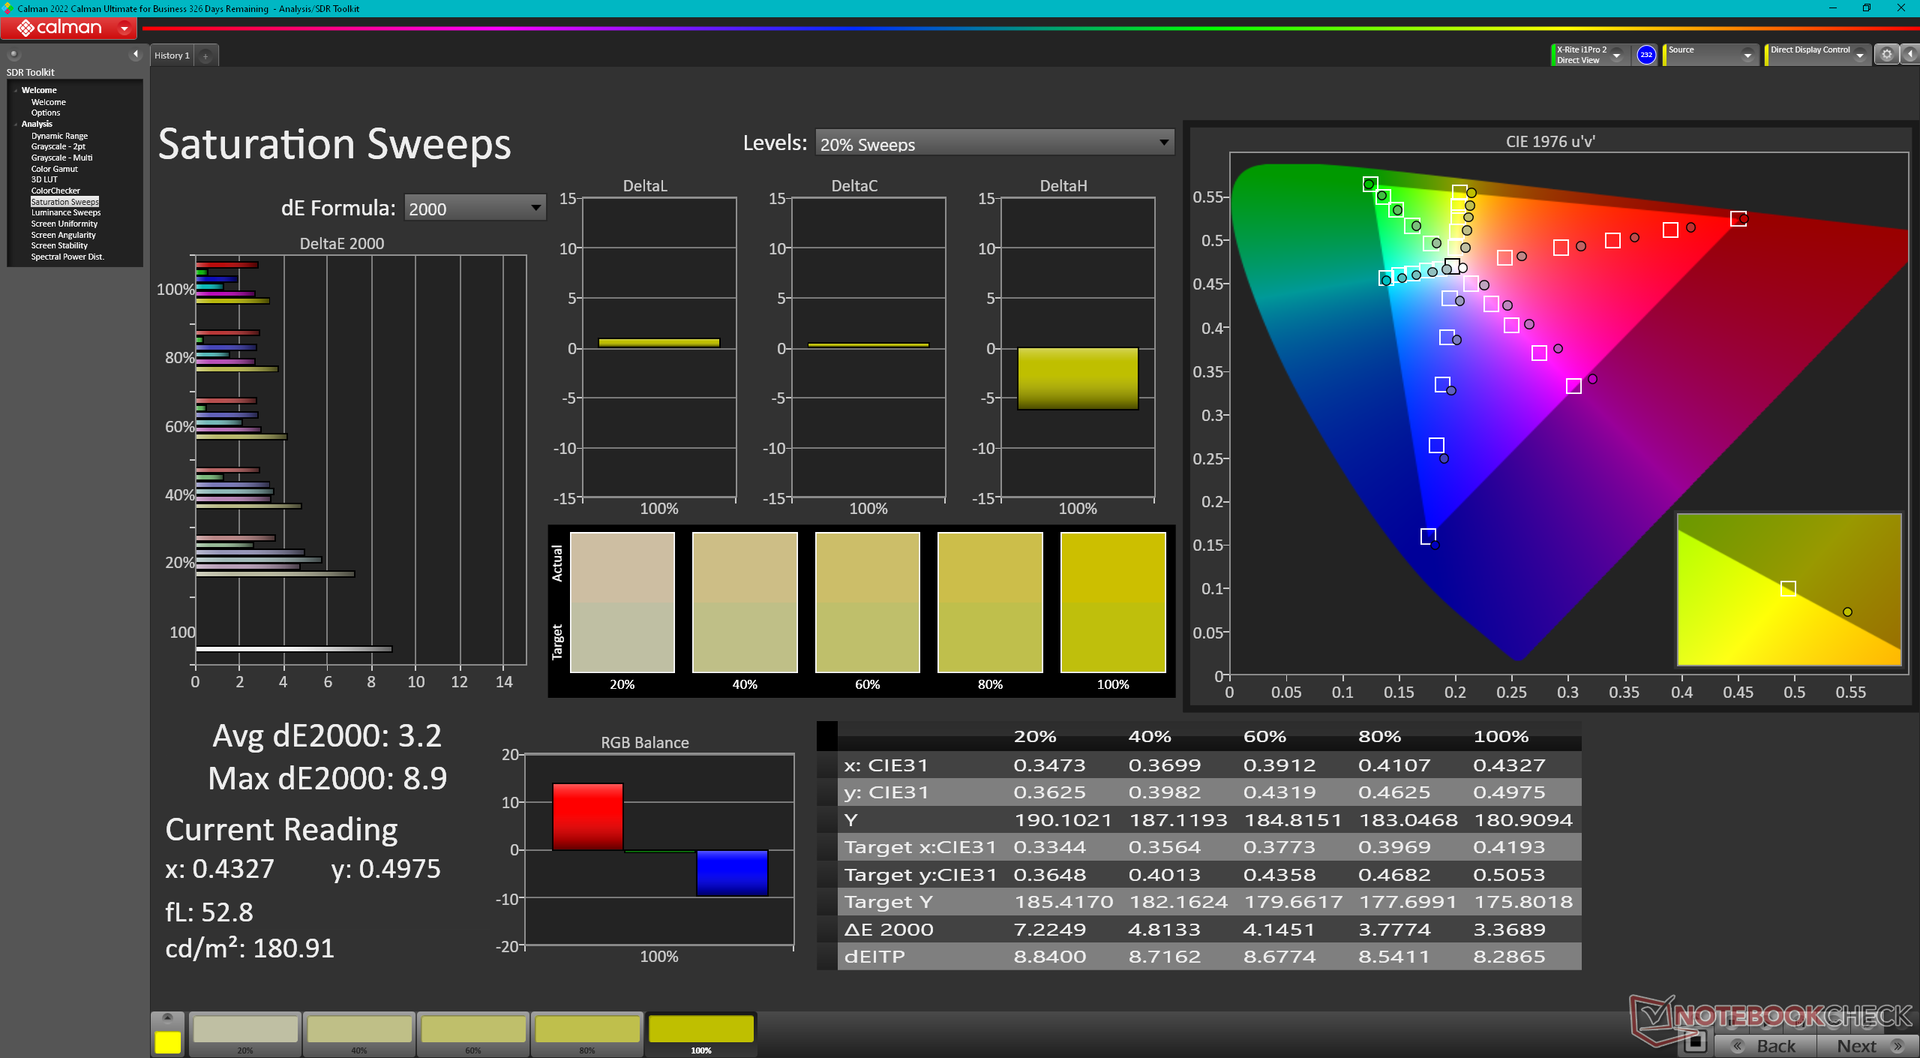
La pantalla no viene precalibrada, como demuestran los resultados de nuestro colorímetro X-Rite, donde los valores medios de la escala de grises y deltaE del color llegan a ser de 6,5 y 3,68, respectivamente. Una calibración adecuada puede reducir dichos promedios a sólo 0,9 y 0,53, respectivamente, ya que el panel cubre todo el sRGB. Recomendamos aplicar nuestro perfil ICM calibrado más arriba para aprovechar mejor los amplios colores sRGB del panel.
Tiempos de respuesta del display
| ↔ Tiempo de respuesta de Negro a Blanco | ||
|---|---|---|
| 12 ms ... subida ↗ y bajada ↘ combinada | ↗ 6.8 ms subida | 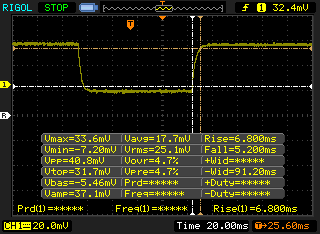 |
| ↘ 5.2 ms bajada | ||
| La pantalla mostró buenos tiempos de respuesta en nuestros tests pero podría ser demasiado lenta para los jugones competitivos. En comparación, todos los dispositivos de prueba van de ##min### (mínimo) a 240 (máximo) ms. » 31 % de todos los dispositivos son mejores. Esto quiere decir que el tiempo de respuesta medido es mejor que la media (19.9 ms) de todos los dispositivos testados. | ||
| ↔ Tiempo de respuesta 50% Gris a 80% Gris | ||
| 14.8 ms ... subida ↗ y bajada ↘ combinada | ↗ 8 ms subida | 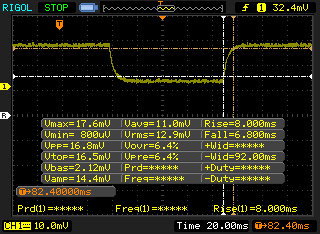 |
| ↘ 6.8 ms bajada | ||
| La pantalla mostró buenos tiempos de respuesta en nuestros tests pero podría ser demasiado lenta para los jugones competitivos. En comparación, todos los dispositivos de prueba van de ##min### (mínimo) a 636 (máximo) ms. » 29 % de todos los dispositivos son mejores. Esto quiere decir que el tiempo de respuesta medido es mejor que la media (31.1 ms) de todos los dispositivos testados. | ||
Parpadeo de Pantalla / PWM (Pulse-Width Modulation)
| Parpadeo de Pantalla / PWM no detectado | 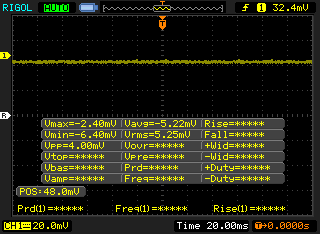 | ||
Comparación: 52 % de todos los dispositivos testados no usaron PWM para atenuar el display. Si se usó, medimos una media de 7798 (mínimo: 5 - máxmo: 343500) Hz. | |||
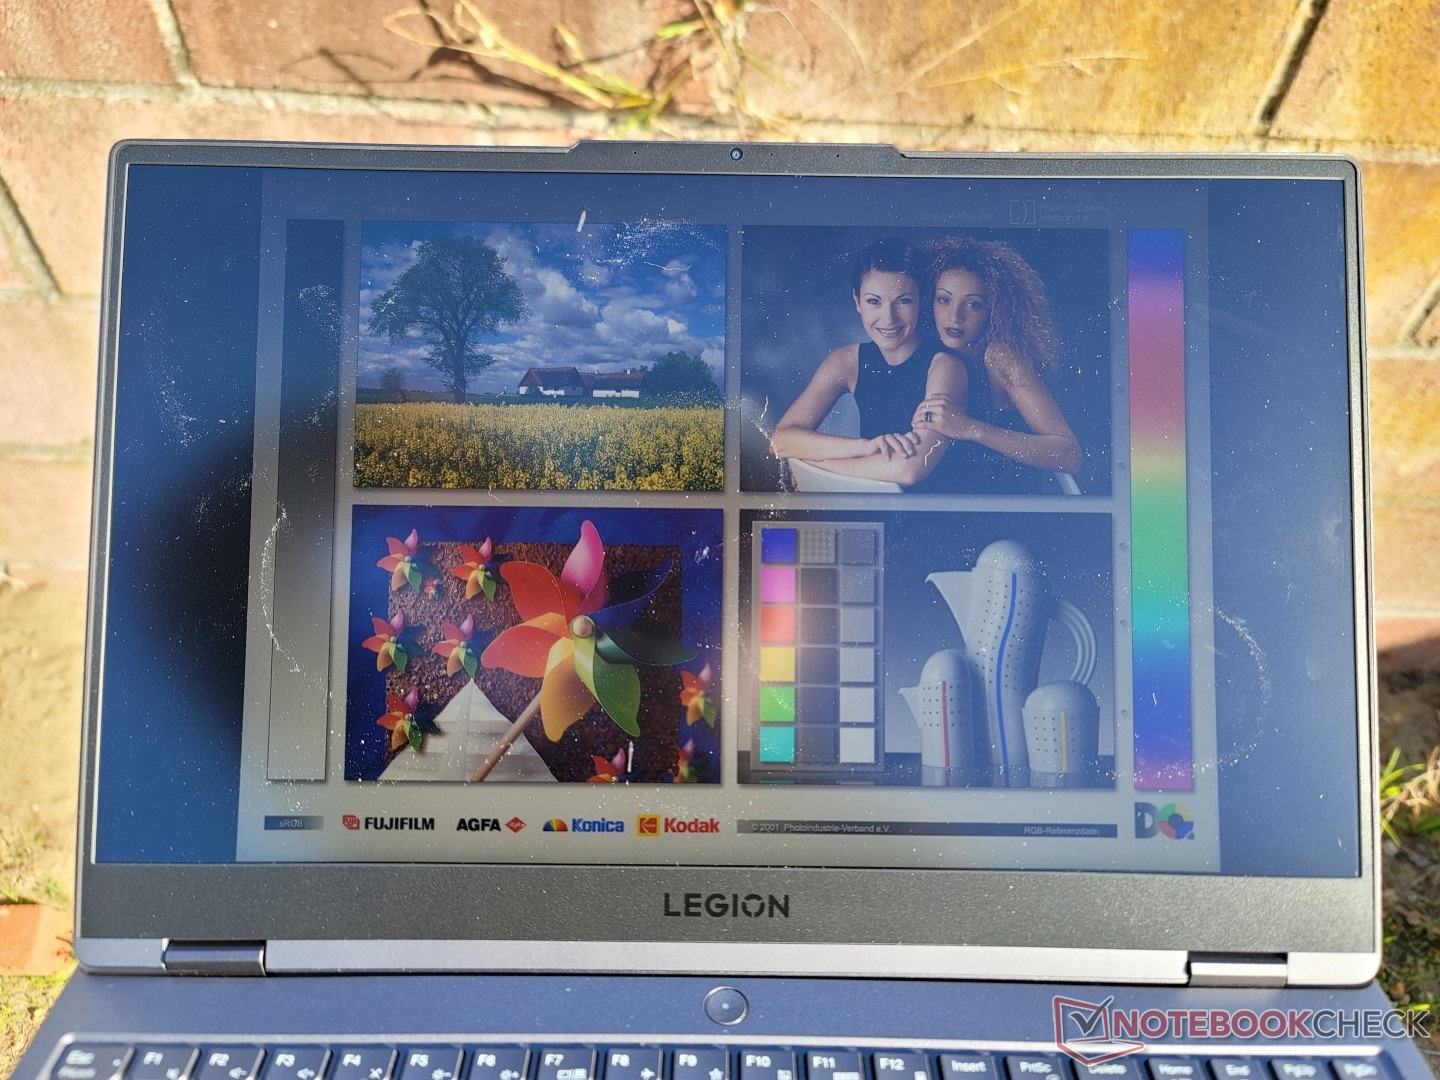
Con 350 nits, la pantalla es ligeramente más brillante que la media de los portátiles de juego, donde 300 nits es lo habitual. La pantalla es cómoda para ver en exteriores a la sombra y el revestimiento mate ayuda a reducir los reflejos, pero todo se vuelve borroso en condiciones de mayor luminosidad.
Rendimiento - Soporte MUX
Condiciones de la prueba
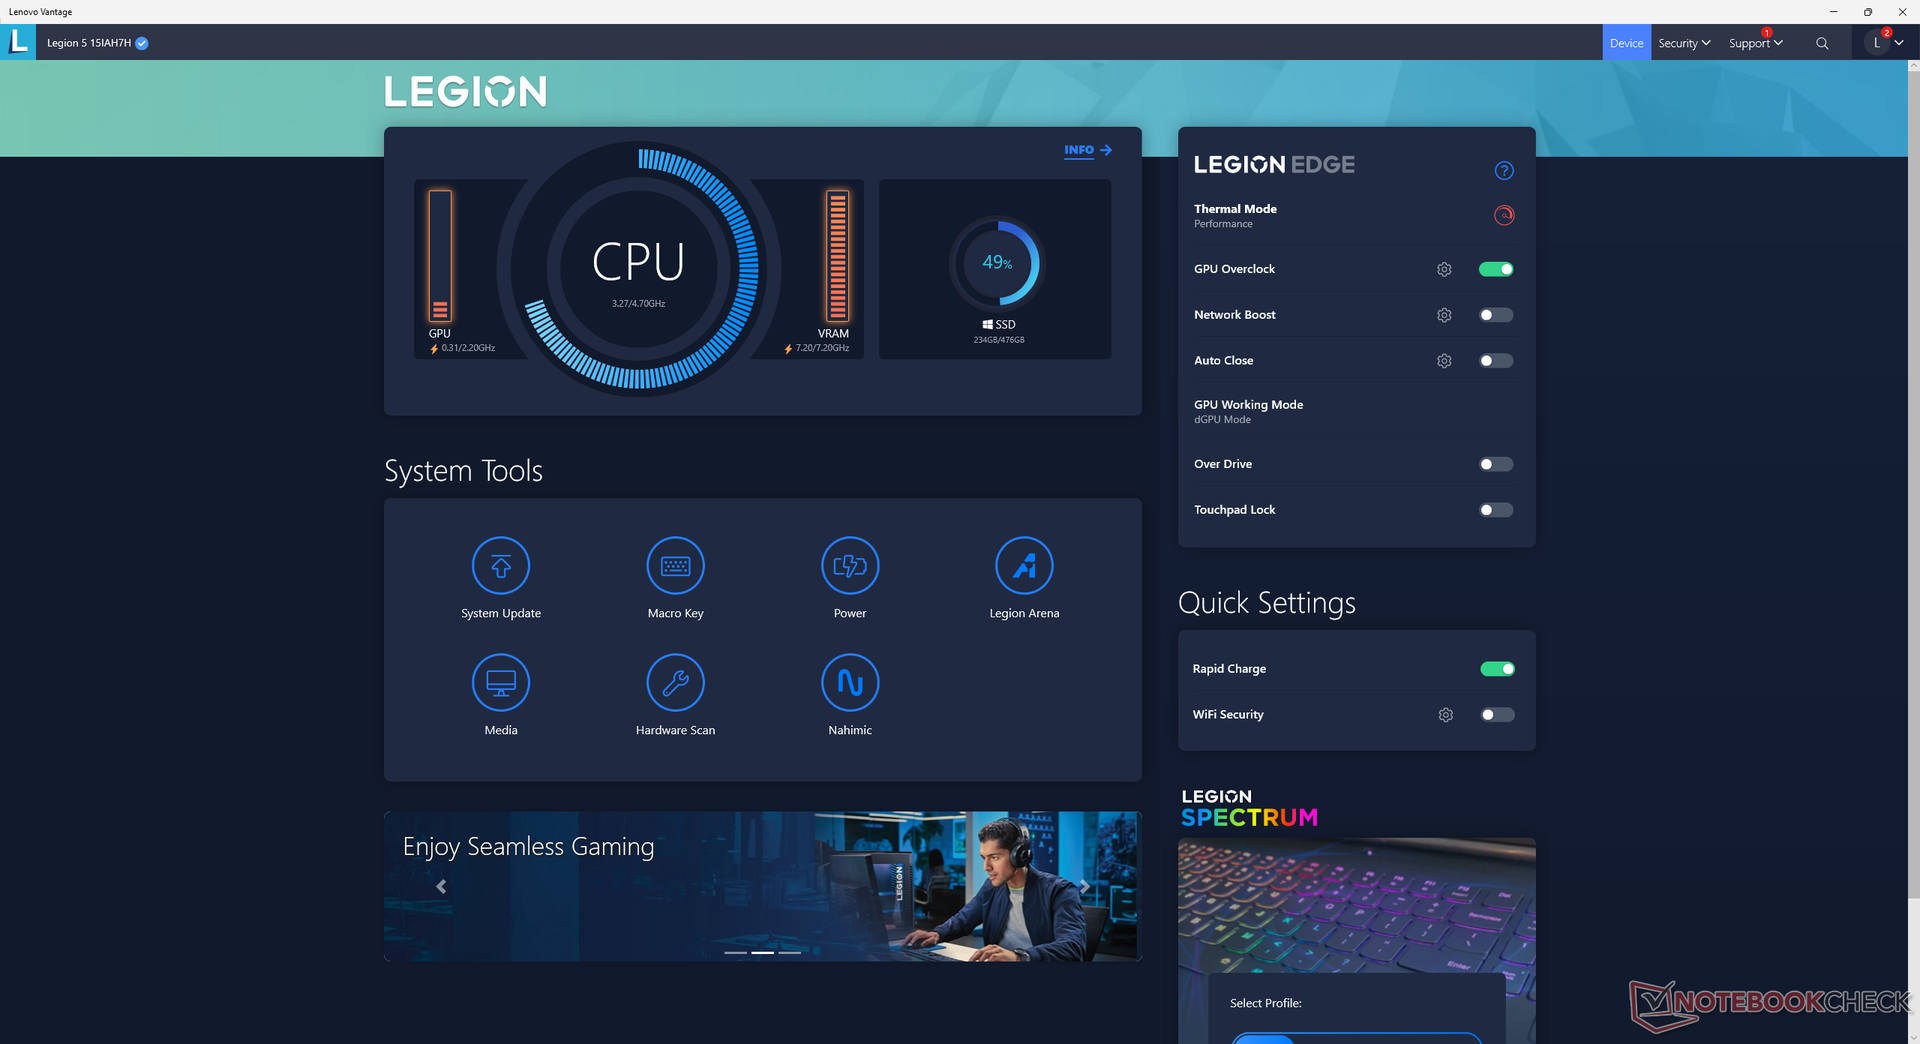
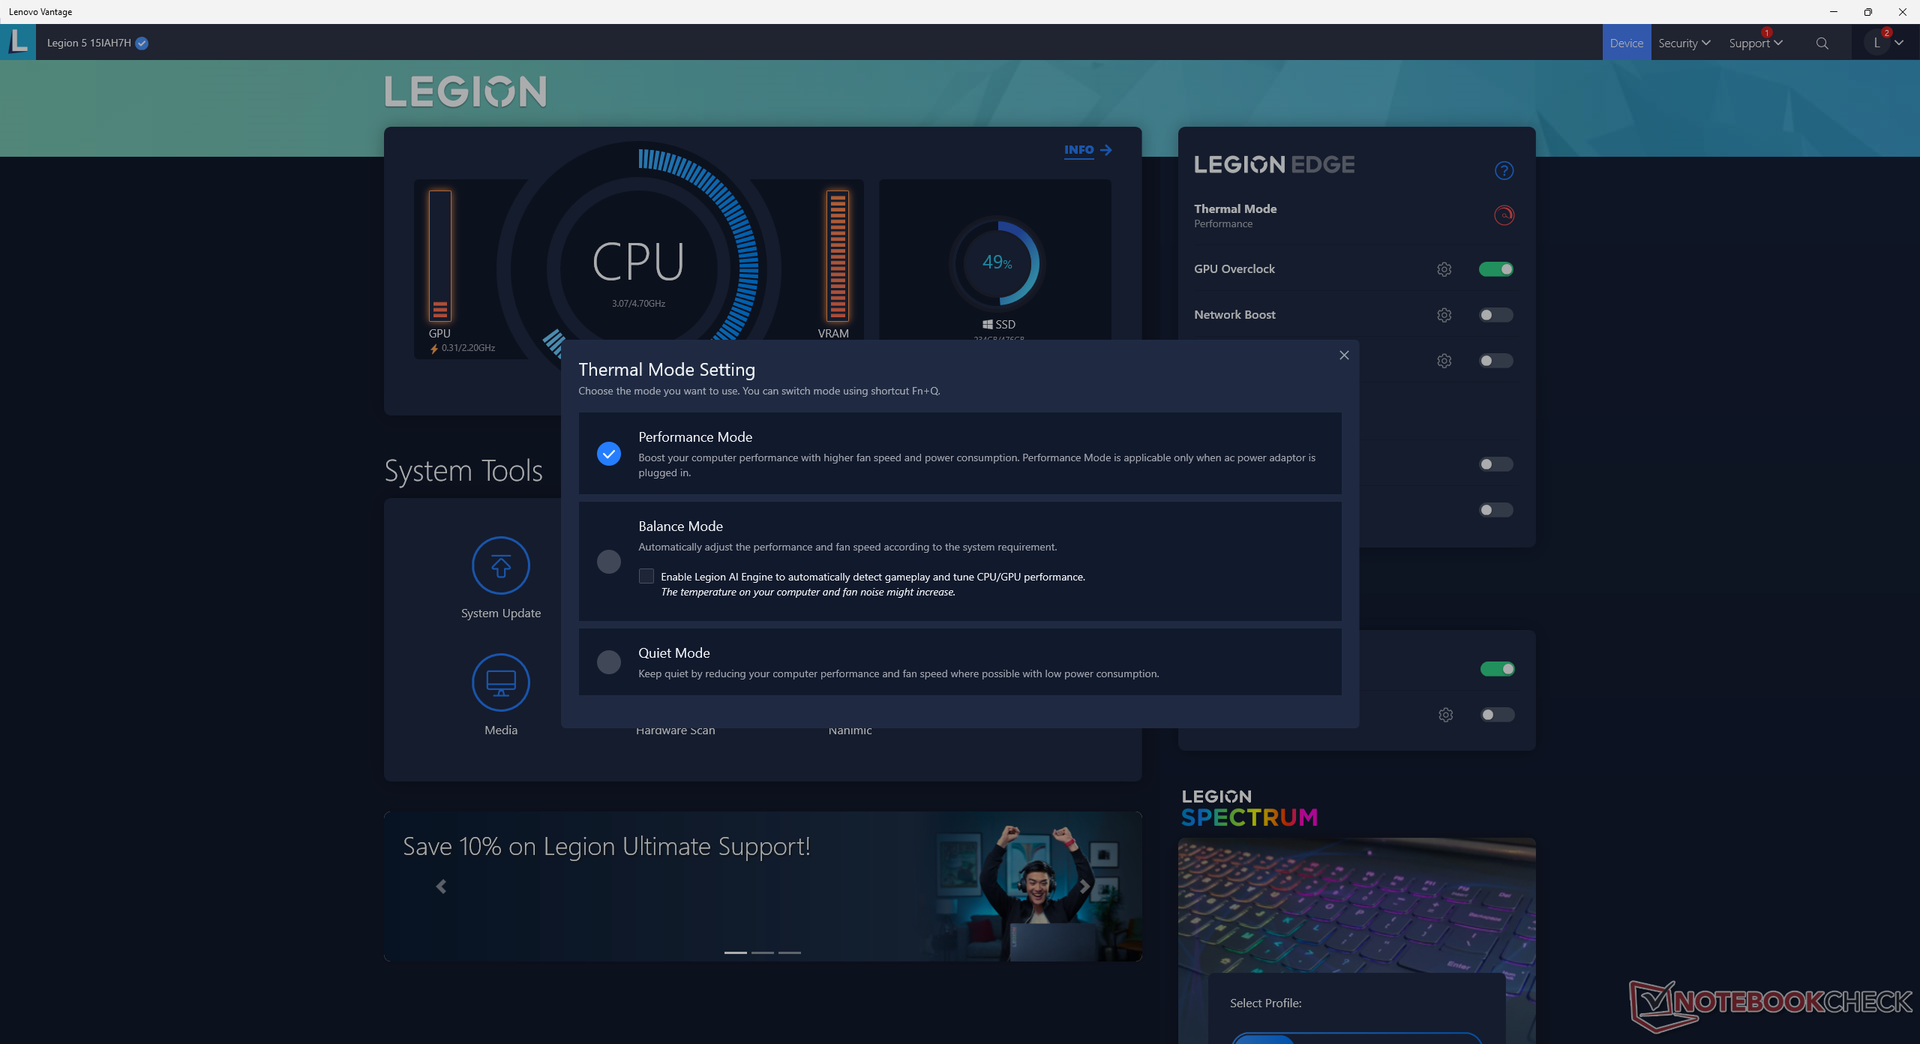
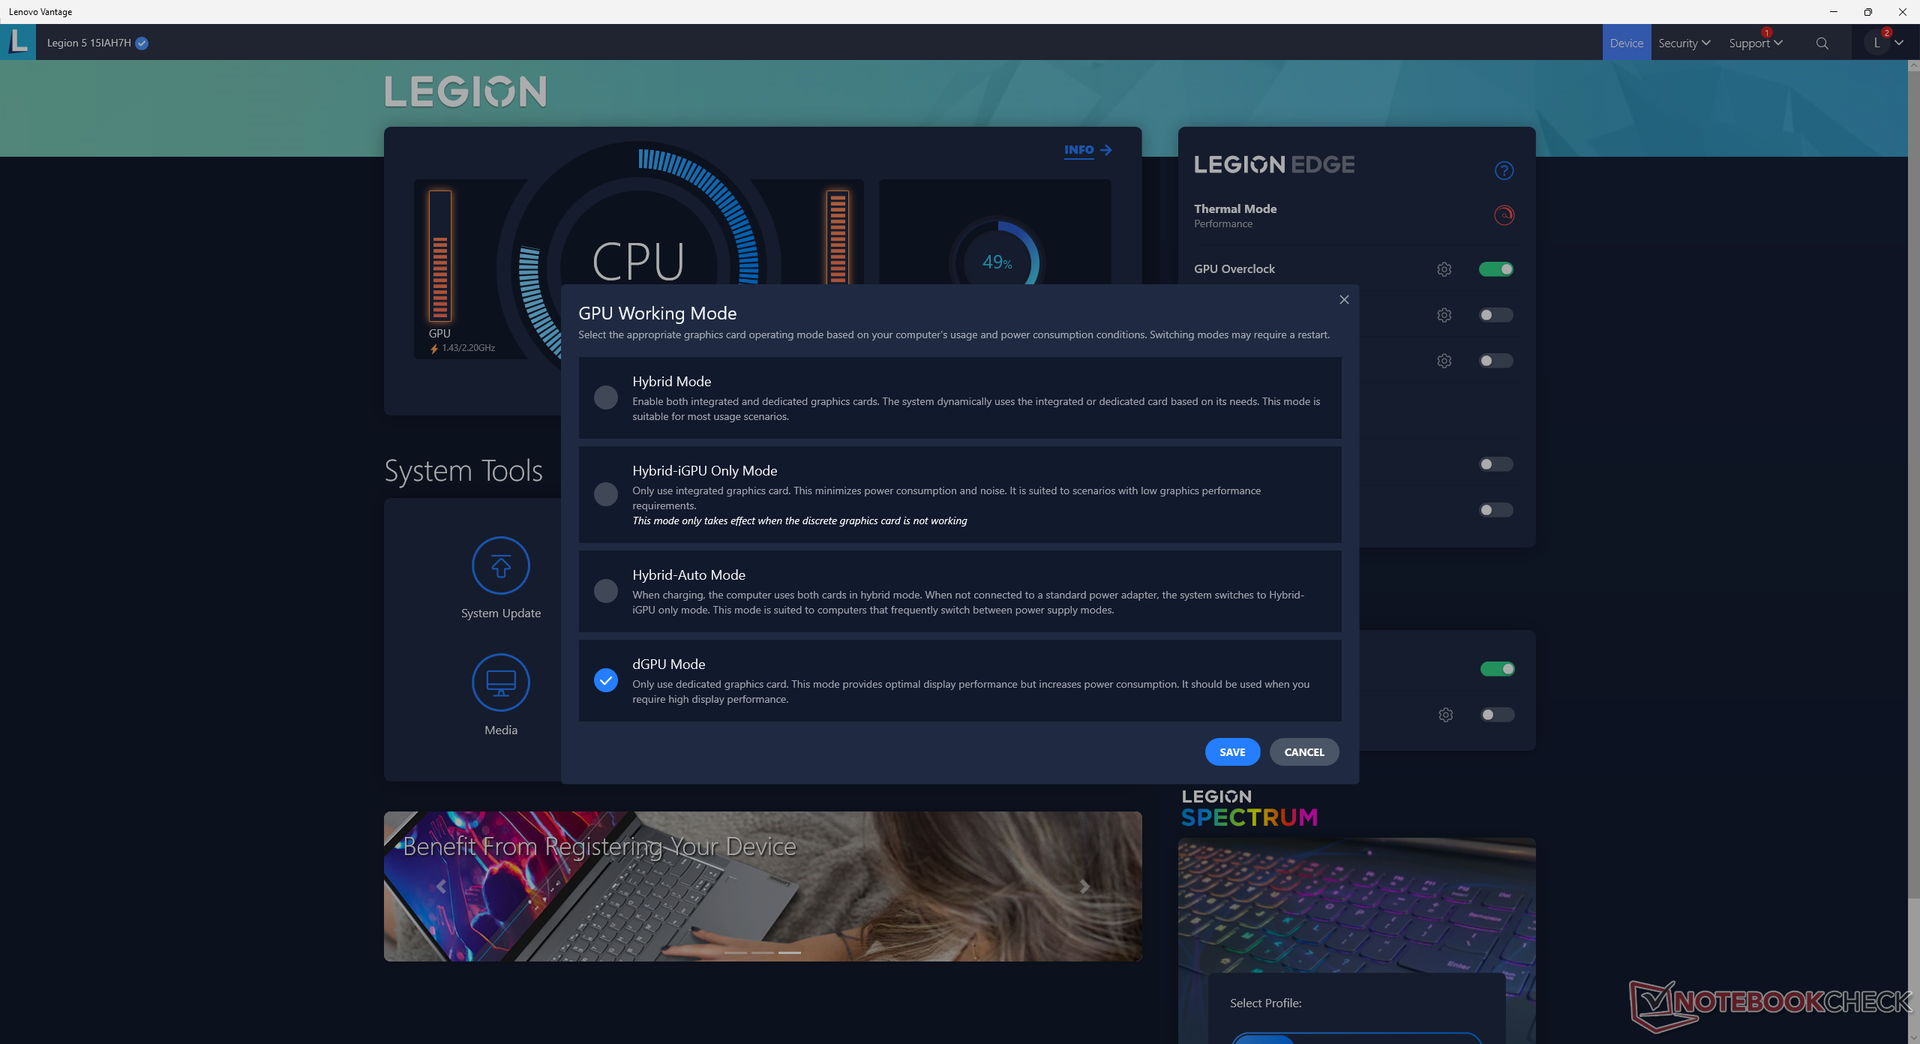
Hemos configurado nuestro sistema en modo Rendimiento y la GPU en modo discreto a través de Lenovo Vantage antes de ejecutar cualquier prueba de rendimiento a continuación. Se recomienda encarecidamente que los usuarios se familiaricen con el software Vantage preinstalado, ya que es el centro de las actualizaciones del sistema, los modos de gráficos MUX o híbridos, el comportamiento de la carga y mucho más, como se muestra en las capturas de pantalla siguientes.
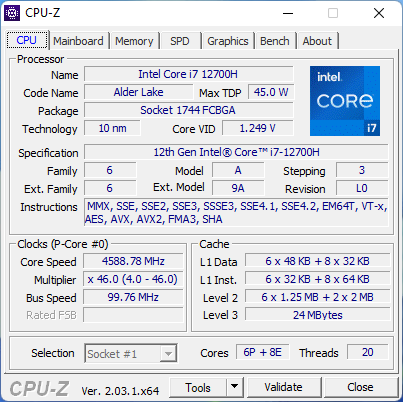
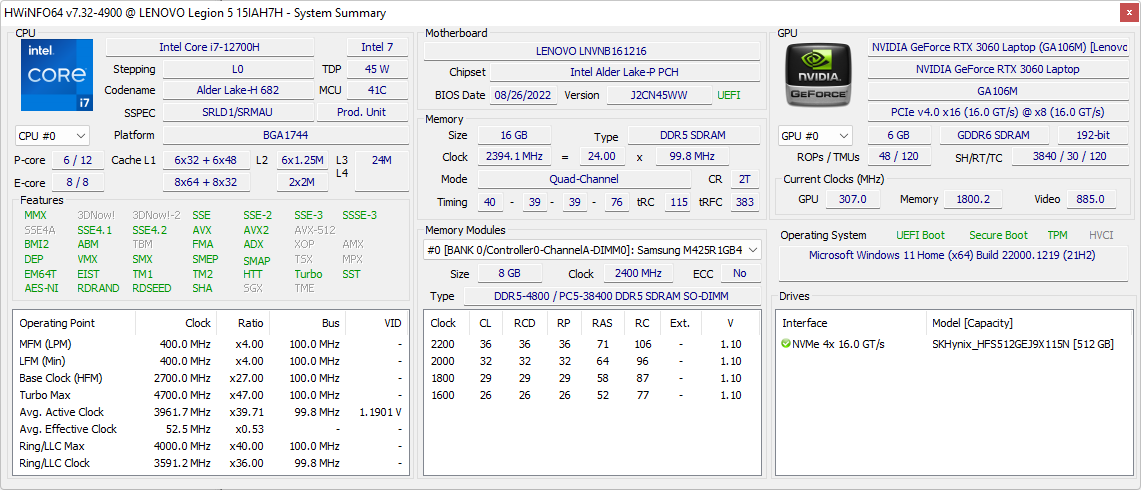
Procesador
El rendimiento de la CPU es más rápido de lo esperado, con resultados que son entre un 15 y un 25 por ciento más rápidos que la media de los portátiles de nuestra base de datos equipados con el mismo Core i7-12700H que el mismo procesador Core i7-12700H. De hecho, el Legion 5 15 es uno de los modelos más rápidos que se pueden conseguir con el Core i7-12700H. El rendimiento bruto supera al del Core i7-12800H en el más caro 2022 Razer Blade 15 por un margen considerable
Si se cambia a un Core i5-12500H implica una caída del 5 y el 25 por ciento en el rendimiento de un solo hilo y de varios hilos, respectivamente.
Cinebench R15 Multi Loop
Cinebench R23: Multi Core | Single Core
Cinebench R15: CPU Multi 64Bit | CPU Single 64Bit
Blender: v2.79 BMW27 CPU
7-Zip 18.03: 7z b 4 | 7z b 4 -mmt1
Geekbench 5.5: Multi-Core | Single-Core
HWBOT x265 Benchmark v2.2: 4k Preset
LibreOffice : 20 Documents To PDF
R Benchmark 2.5: Overall mean
* ... más pequeño es mejor
AIDA64: FP32 Ray-Trace | FPU Julia | CPU SHA3 | CPU Queen | FPU SinJulia | FPU Mandel | CPU AES | CPU ZLib | FP64 Ray-Trace | CPU PhotoWorxx
| Performance rating | |
| Lenovo Legion 5 15IAH7H 82RB | |
| Lenovo Legion 5 15ACH-82JU00C6GE-FL | |
| Medio Intel Core i7-12700H | |
| Asus TUF Gaming F15 FX507ZM | |
| MSI Bravo 15 B5DD-010US | |
| Acer Aspire Nitro 5 AN515-55-57GF | |
| AIDA64 / FP32 Ray-Trace | |
| Lenovo Legion 5 15IAH7H 82RB | |
| Lenovo Legion 5 15ACH-82JU00C6GE-FL | |
| Medio Intel Core i7-12700H (2585 - 17957, n=64) | |
| MSI Bravo 15 B5DD-010US | |
| Asus TUF Gaming F15 FX507ZM | |
| Acer Aspire Nitro 5 AN515-55-57GF | |
| AIDA64 / FPU Julia | |
| Lenovo Legion 5 15ACH-82JU00C6GE-FL | |
| Lenovo Legion 5 15IAH7H 82RB | |
| MSI Bravo 15 B5DD-010US | |
| Medio Intel Core i7-12700H (12439 - 90760, n=64) | |
| Asus TUF Gaming F15 FX507ZM | |
| Acer Aspire Nitro 5 AN515-55-57GF | |
| AIDA64 / CPU SHA3 | |
| Lenovo Legion 5 15IAH7H 82RB | |
| Asus TUF Gaming F15 FX507ZM | |
| Lenovo Legion 5 15ACH-82JU00C6GE-FL | |
| Medio Intel Core i7-12700H (833 - 4242, n=64) | |
| MSI Bravo 15 B5DD-010US | |
| Acer Aspire Nitro 5 AN515-55-57GF | |
| AIDA64 / CPU Queen | |
| Lenovo Legion 5 15IAH7H 82RB | |
| Asus TUF Gaming F15 FX507ZM | |
| Medio Intel Core i7-12700H (57923 - 103202, n=63) | |
| Lenovo Legion 5 15ACH-82JU00C6GE-FL | |
| MSI Bravo 15 B5DD-010US | |
| Acer Aspire Nitro 5 AN515-55-57GF | |
| AIDA64 / FPU SinJulia | |
| Lenovo Legion 5 15ACH-82JU00C6GE-FL | |
| Lenovo Legion 5 15IAH7H 82RB | |
| Asus TUF Gaming F15 FX507ZM | |
| MSI Bravo 15 B5DD-010US | |
| Medio Intel Core i7-12700H (3249 - 9939, n=64) | |
| Acer Aspire Nitro 5 AN515-55-57GF | |
| AIDA64 / FPU Mandel | |
| Lenovo Legion 5 15ACH-82JU00C6GE-FL | |
| Lenovo Legion 5 15IAH7H 82RB | |
| MSI Bravo 15 B5DD-010US | |
| Medio Intel Core i7-12700H (7135 - 44760, n=64) | |
| Asus TUF Gaming F15 FX507ZM | |
| Acer Aspire Nitro 5 AN515-55-57GF | |
| AIDA64 / CPU AES | |
| Lenovo Legion 5 15IAH7H 82RB | |
| Lenovo Legion 5 15ACH-82JU00C6GE-FL | |
| MSI Bravo 15 B5DD-010US | |
| Medio Intel Core i7-12700H (31839 - 144360, n=64) | |
| Asus TUF Gaming F15 FX507ZM | |
| Acer Aspire Nitro 5 AN515-55-57GF | |
| AIDA64 / CPU ZLib | |
| Asus TUF Gaming F15 FX507ZM | |
| Lenovo Legion 5 15IAH7H 82RB | |
| Medio Intel Core i7-12700H (305 - 1171, n=64) | |
| Lenovo Legion 5 15ACH-82JU00C6GE-FL | |
| MSI Bravo 15 B5DD-010US | |
| Acer Aspire Nitro 5 AN515-55-57GF | |
| AIDA64 / FP64 Ray-Trace | |
| Lenovo Legion 5 15IAH7H 82RB | |
| Lenovo Legion 5 15ACH-82JU00C6GE-FL | |
| Medio Intel Core i7-12700H (1437 - 9692, n=64) | |
| MSI Bravo 15 B5DD-010US | |
| Asus TUF Gaming F15 FX507ZM | |
| Acer Aspire Nitro 5 AN515-55-57GF | |
| AIDA64 / CPU PhotoWorxx | |
| Lenovo Legion 5 15IAH7H 82RB | |
| Asus TUF Gaming F15 FX507ZM | |
| Medio Intel Core i7-12700H (12863 - 52207, n=64) | |
| Acer Aspire Nitro 5 AN515-55-57GF | |
| MSI Bravo 15 B5DD-010US | |
| Lenovo Legion 5 15ACH-82JU00C6GE-FL | |
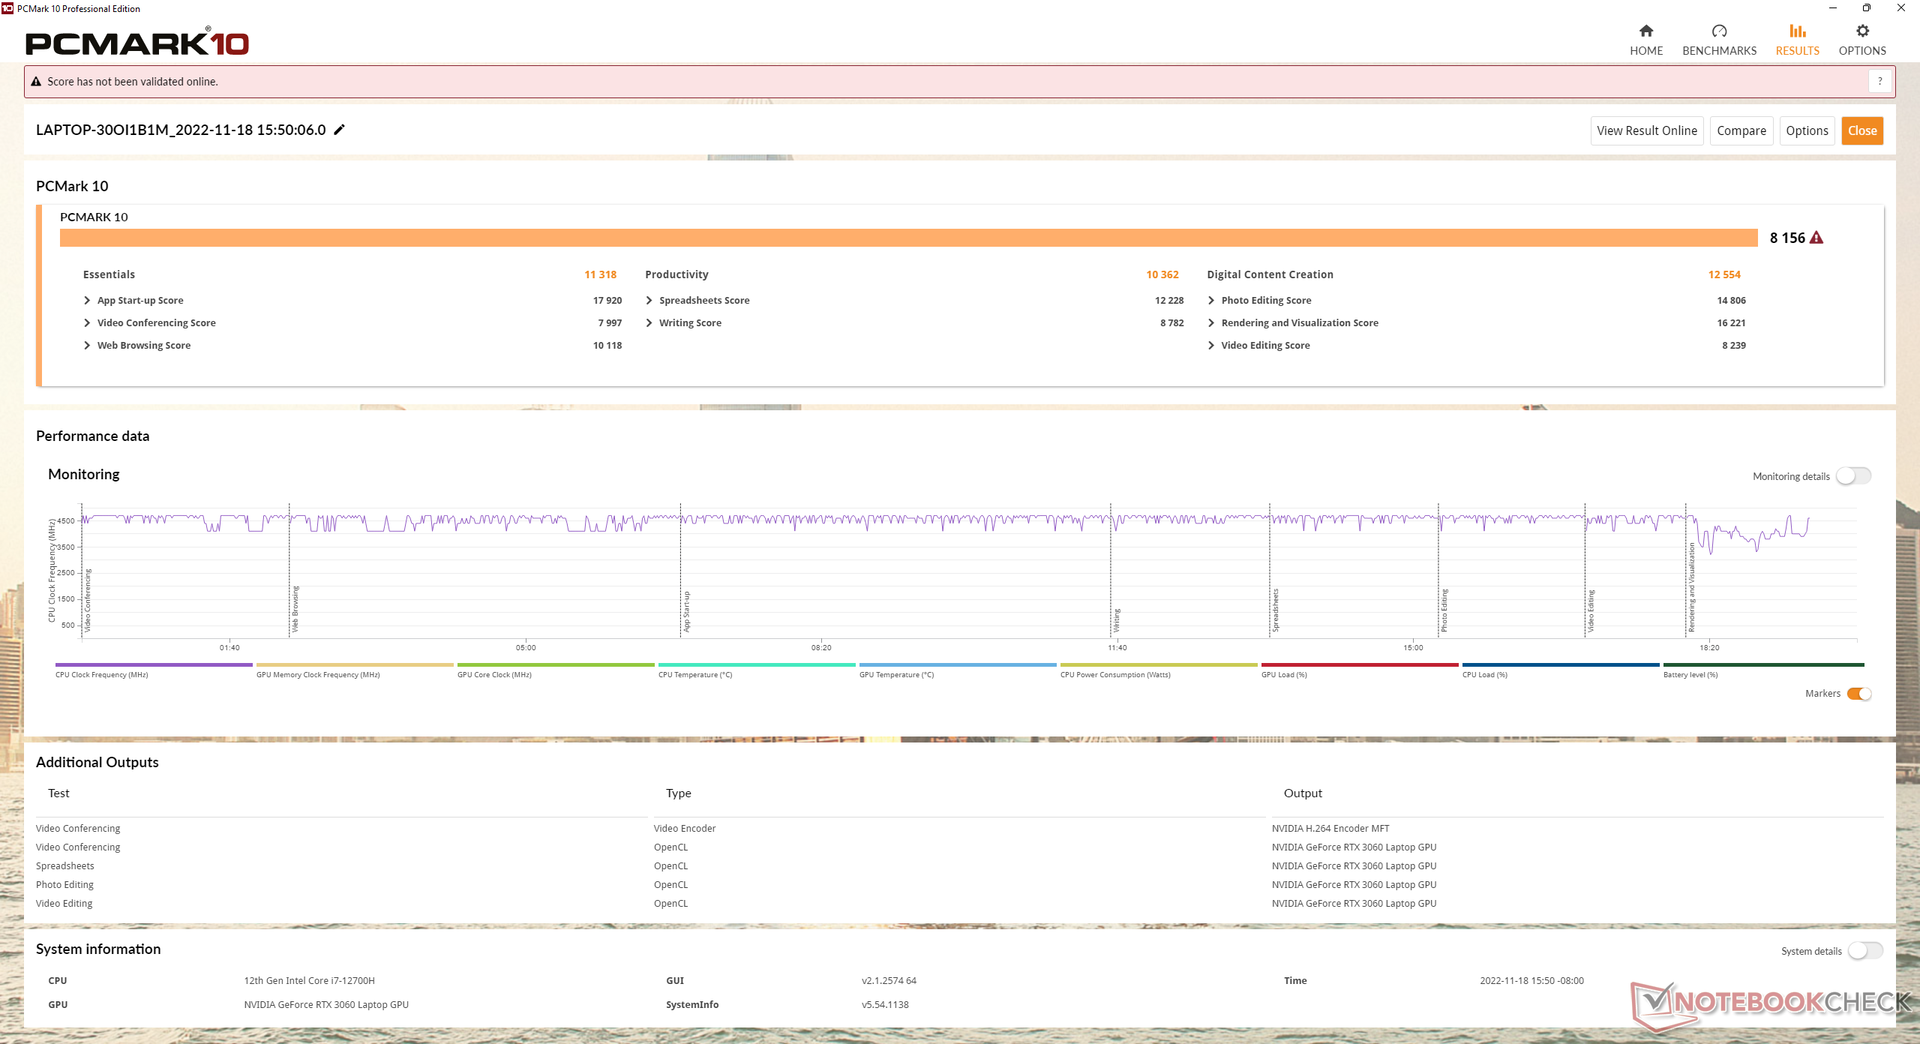
Rendimiento del sistema
Los resultados de PCMark son consistentemente más altos que en el modelo del año pasado para ser uno de los más altos de cualquier portátil con la misma CPU Core i7-12700H y GPU RTX 3060. Esto se alinea con los resultados de rendimiento de CPU y GPU más rápidos que la media de nuestra unidad de pruebas.
CrossMark: Overall | Productivity | Creativity | Responsiveness
| PCMark 10 / Score | |
| Lenovo Legion 5 15IAH7H 82RB | |
| Asus TUF Gaming F15 FX507ZM | |
| Medio Intel Core i7-12700H, NVIDIA GeForce RTX 3060 Laptop GPU (5986 - 8156, n=12) | |
| Lenovo Legion 5 15ACH-82JU00C6GE-FL | |
| Razer Blade 15 Base Edition 2021, i7-10750H RTX 3060 | |
| MSI Bravo 15 B5DD-010US | |
| Acer Aspire Nitro 5 AN515-55-57GF | |
| PCMark 10 / Essentials | |
| Lenovo Legion 5 15IAH7H 82RB | |
| Medio Intel Core i7-12700H, NVIDIA GeForce RTX 3060 Laptop GPU (9289 - 12144, n=12) | |
| Asus TUF Gaming F15 FX507ZM | |
| Lenovo Legion 5 15ACH-82JU00C6GE-FL | |
| Razer Blade 15 Base Edition 2021, i7-10750H RTX 3060 | |
| MSI Bravo 15 B5DD-010US | |
| Acer Aspire Nitro 5 AN515-55-57GF | |
| PCMark 10 / Productivity | |
| Lenovo Legion 5 15IAH7H 82RB | |
| Lenovo Legion 5 15ACH-82JU00C6GE-FL | |
| Medio Intel Core i7-12700H, NVIDIA GeForce RTX 3060 Laptop GPU (6161 - 10362, n=12) | |
| Asus TUF Gaming F15 FX507ZM | |
| MSI Bravo 15 B5DD-010US | |
| Razer Blade 15 Base Edition 2021, i7-10750H RTX 3060 | |
| Acer Aspire Nitro 5 AN515-55-57GF | |
| PCMark 10 / Digital Content Creation | |
| Lenovo Legion 5 15IAH7H 82RB | |
| Asus TUF Gaming F15 FX507ZM | |
| Medio Intel Core i7-12700H, NVIDIA GeForce RTX 3060 Laptop GPU (8950 - 12554, n=12) | |
| Razer Blade 15 Base Edition 2021, i7-10750H RTX 3060 | |
| Lenovo Legion 5 15ACH-82JU00C6GE-FL | |
| MSI Bravo 15 B5DD-010US | |
| Acer Aspire Nitro 5 AN515-55-57GF | |
| CrossMark / Overall | |
| Lenovo Legion 5 15IAH7H 82RB | |
| Medio Intel Core i7-12700H, NVIDIA GeForce RTX 3060 Laptop GPU (1649 - 2017, n=11) | |
| CrossMark / Productivity | |
| Lenovo Legion 5 15IAH7H 82RB | |
| Medio Intel Core i7-12700H, NVIDIA GeForce RTX 3060 Laptop GPU (1536 - 1958, n=11) | |
| CrossMark / Creativity | |
| Lenovo Legion 5 15IAH7H 82RB | |
| Medio Intel Core i7-12700H, NVIDIA GeForce RTX 3060 Laptop GPU (1816 - 2084, n=11) | |
| CrossMark / Responsiveness | |
| Lenovo Legion 5 15IAH7H 82RB | |
| Medio Intel Core i7-12700H, NVIDIA GeForce RTX 3060 Laptop GPU (1210 - 2207, n=11) | |
| PCMark 10 Score | 8156 puntos | |
ayuda | ||
| AIDA64 / Memory Copy | |
| Medio Intel Core i7-12700H (25615 - 80511, n=64) | |
| Asus TUF Gaming F15 FX507ZM | |
| Lenovo Legion 5 15IAH7H 82RB | |
| MSI Bravo 15 B5DD-010US | |
| Lenovo Legion 5 15ACH-82JU00C6GE-FL | |
| Acer Aspire Nitro 5 AN515-55-57GF | |
| AIDA64 / Memory Read | |
| Lenovo Legion 5 15IAH7H 82RB | |
| Asus TUF Gaming F15 FX507ZM | |
| Medio Intel Core i7-12700H (25586 - 79442, n=64) | |
| MSI Bravo 15 B5DD-010US | |
| Lenovo Legion 5 15ACH-82JU00C6GE-FL | |
| Acer Aspire Nitro 5 AN515-55-57GF | |
| AIDA64 / Memory Write | |
| Lenovo Legion 5 15IAH7H 82RB | |
| Asus TUF Gaming F15 FX507ZM | |
| Medio Intel Core i7-12700H (23679 - 88660, n=64) | |
| Acer Aspire Nitro 5 AN515-55-57GF | |
| MSI Bravo 15 B5DD-010US | |
| Lenovo Legion 5 15ACH-82JU00C6GE-FL | |
| AIDA64 / Memory Latency | |
| Lenovo Legion 5 15IAH7H 82RB | |
| Lenovo Legion 5 15ACH-82JU00C6GE-FL | |
| Medio Intel Core i7-12700H (76.2 - 133.9, n=62) | |
| MSI Bravo 15 B5DD-010US | |
| Acer Aspire Nitro 5 AN515-55-57GF | |
| Asus TUF Gaming F15 FX507ZM | |
* ... más pequeño es mejor
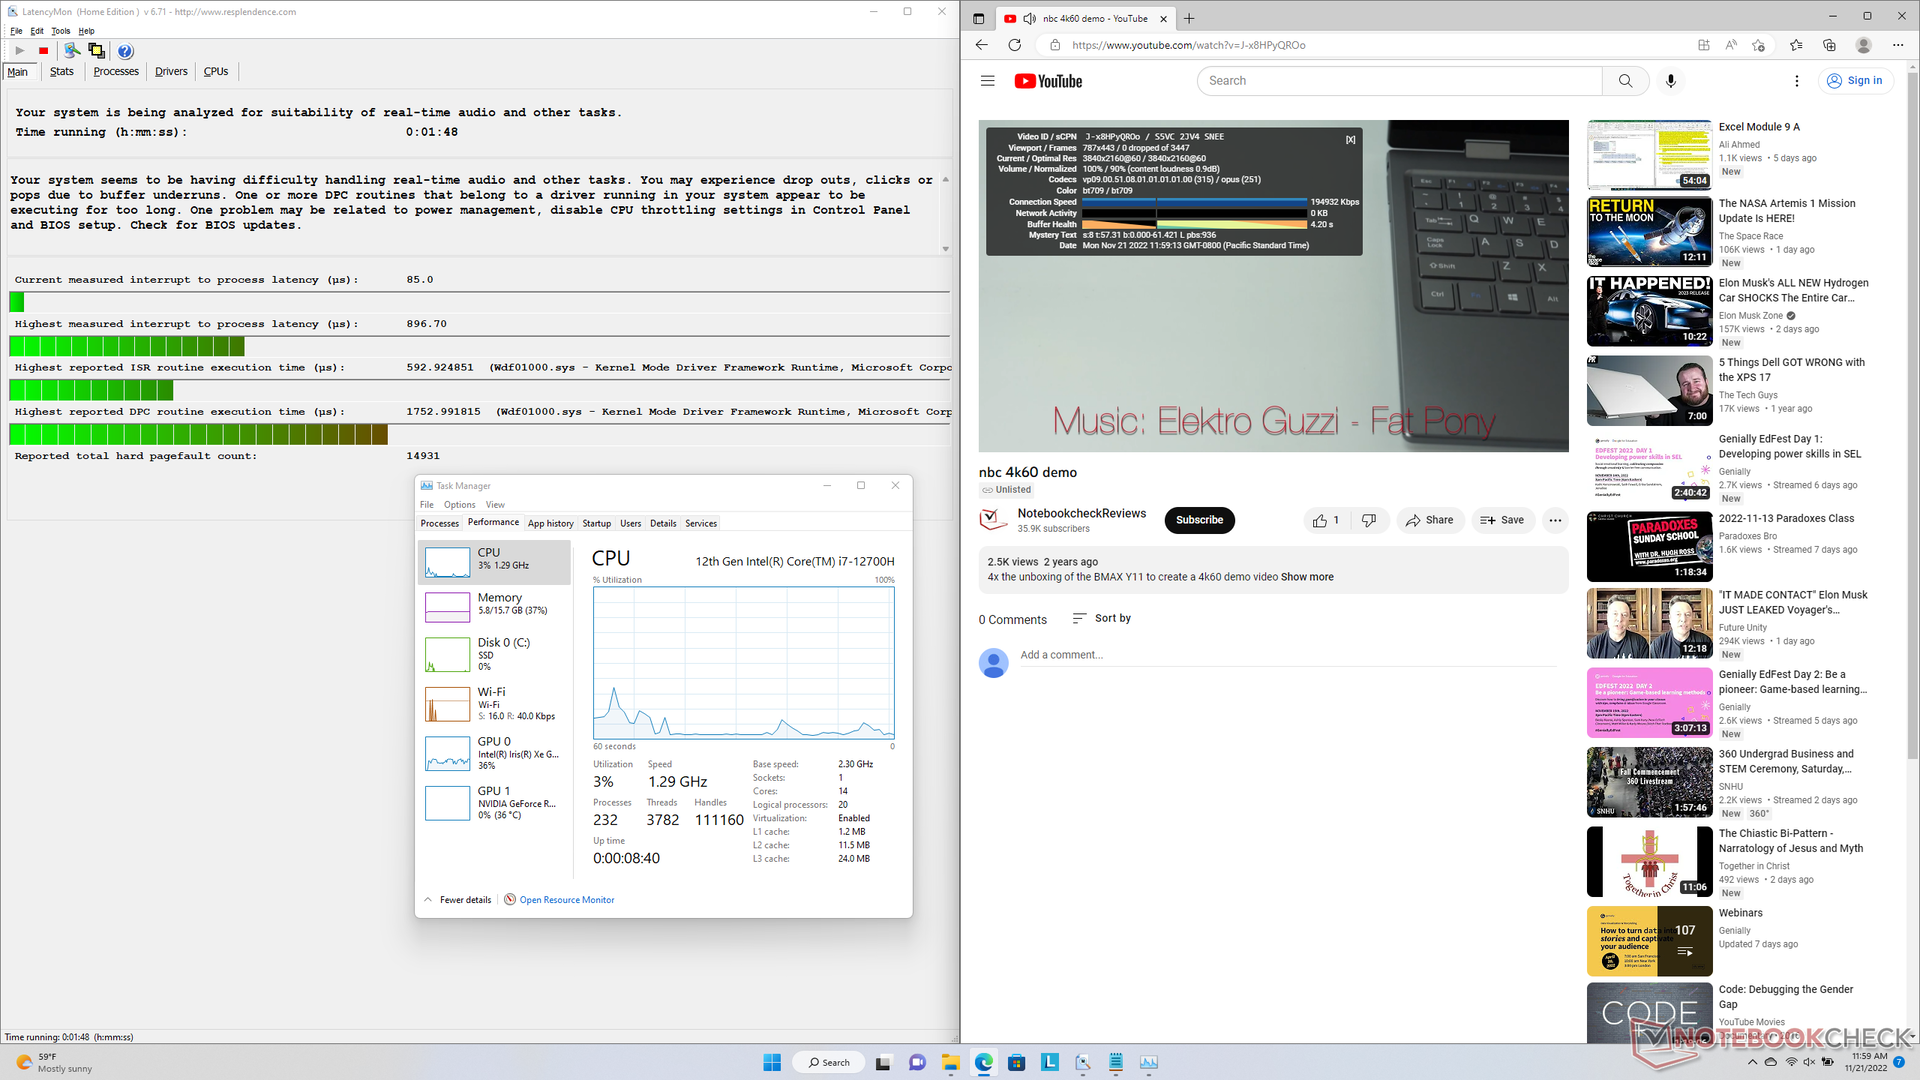
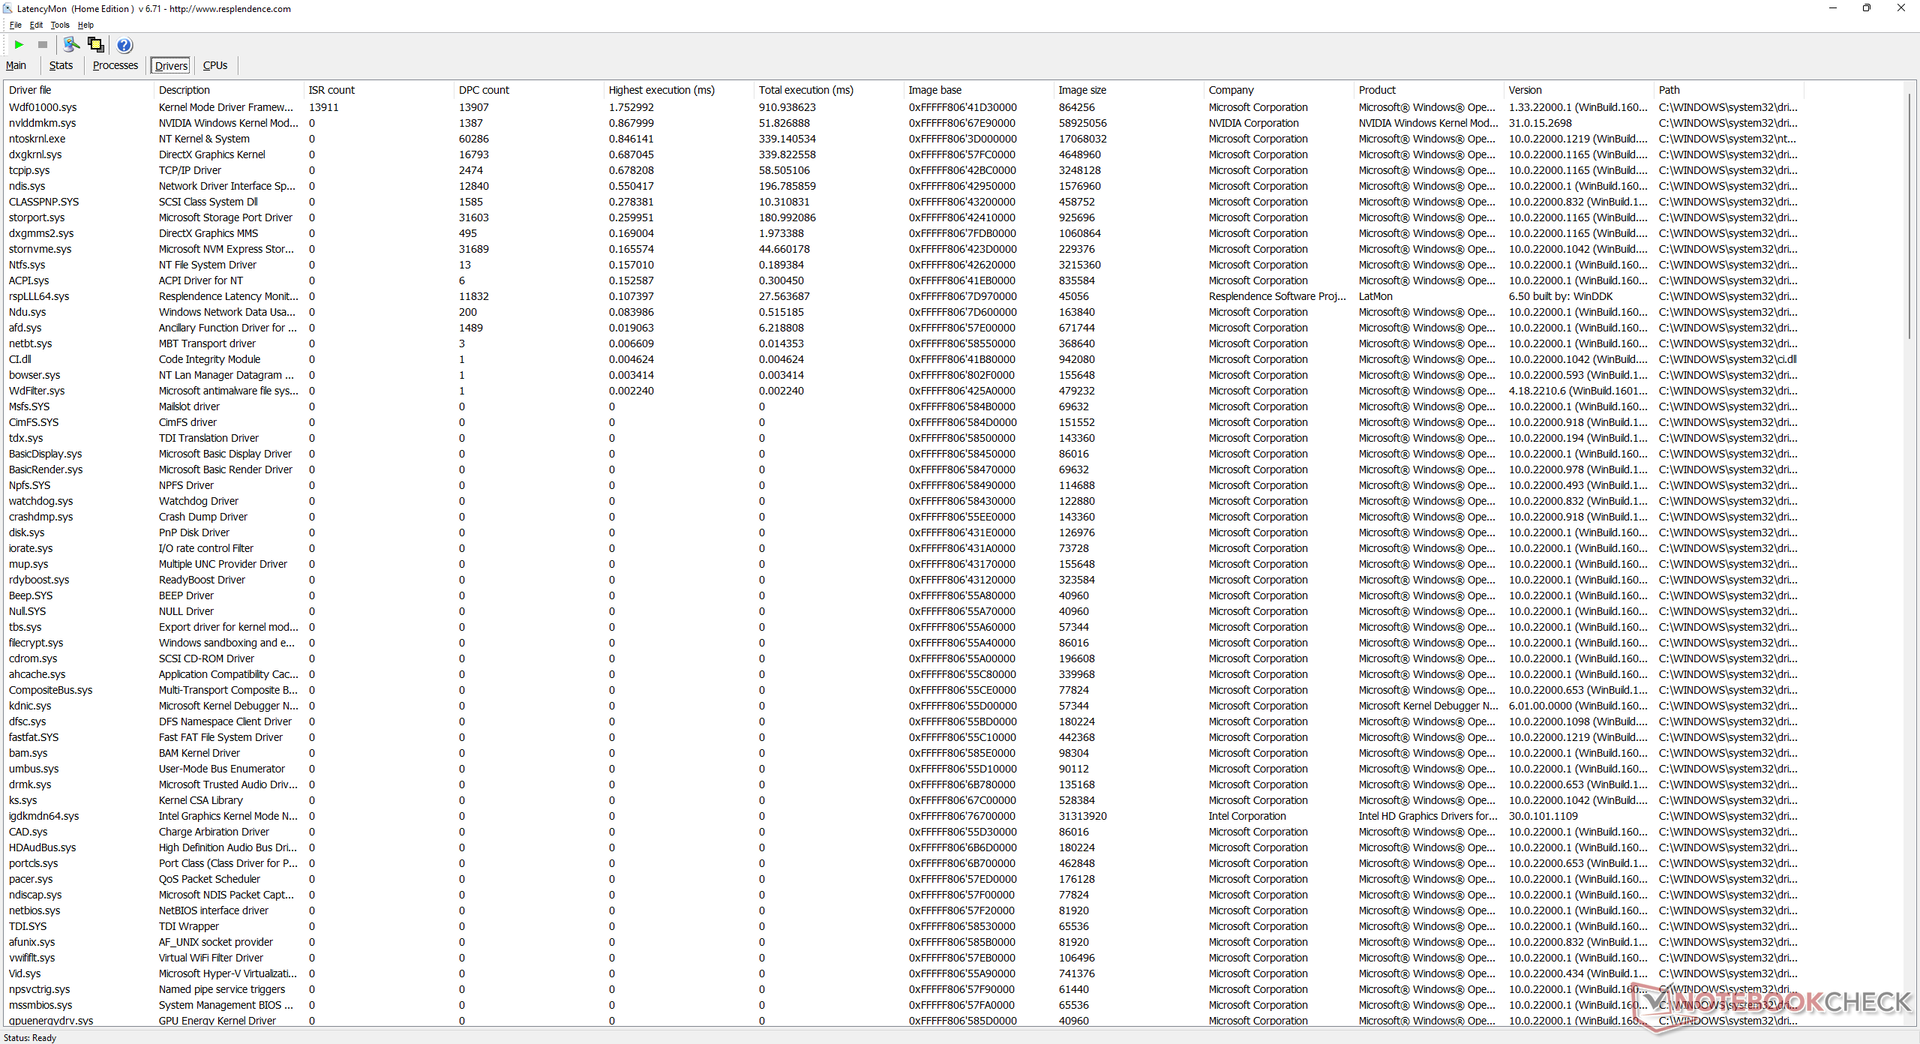
Latencia del CPD
LatencyMon revela problemas menores de CPD al abrir varias pestañas del navegador en nuestra página web. por lo demás, la reproducción de vídeo 4K a 60 FPS es perfecta, sin pérdida de fotogramas.
| DPC Latencies / LatencyMon - interrupt to process latency (max), Web, Youtube, Prime95 | |
| MSI Bravo 15 B5DD-010US | |
| Lenovo Legion 5 15IAH7H 82RB | |
| Asus TUF Gaming F15 FX507ZM | |
| Lenovo Legion 5 15ACH-82JU00C6GE-FL | |
| Razer Blade 15 Base Edition 2021, i7-10750H RTX 3060 | |
| Acer Aspire Nitro 5 AN515-55-57GF | |
* ... más pequeño es mejor
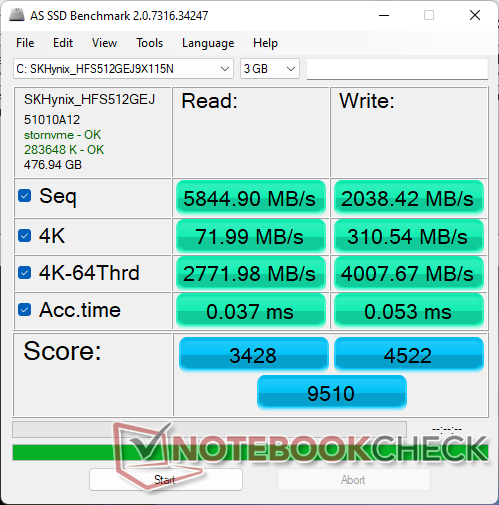
Dispositivos de almacenamiento - Soporte 2x PCIe4 x4
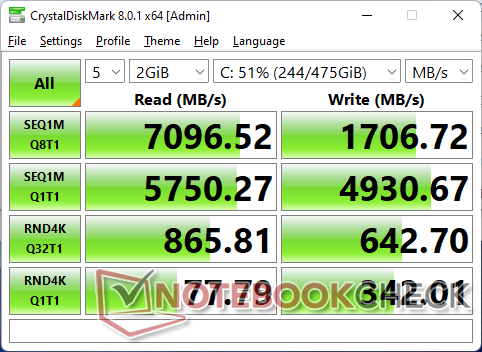
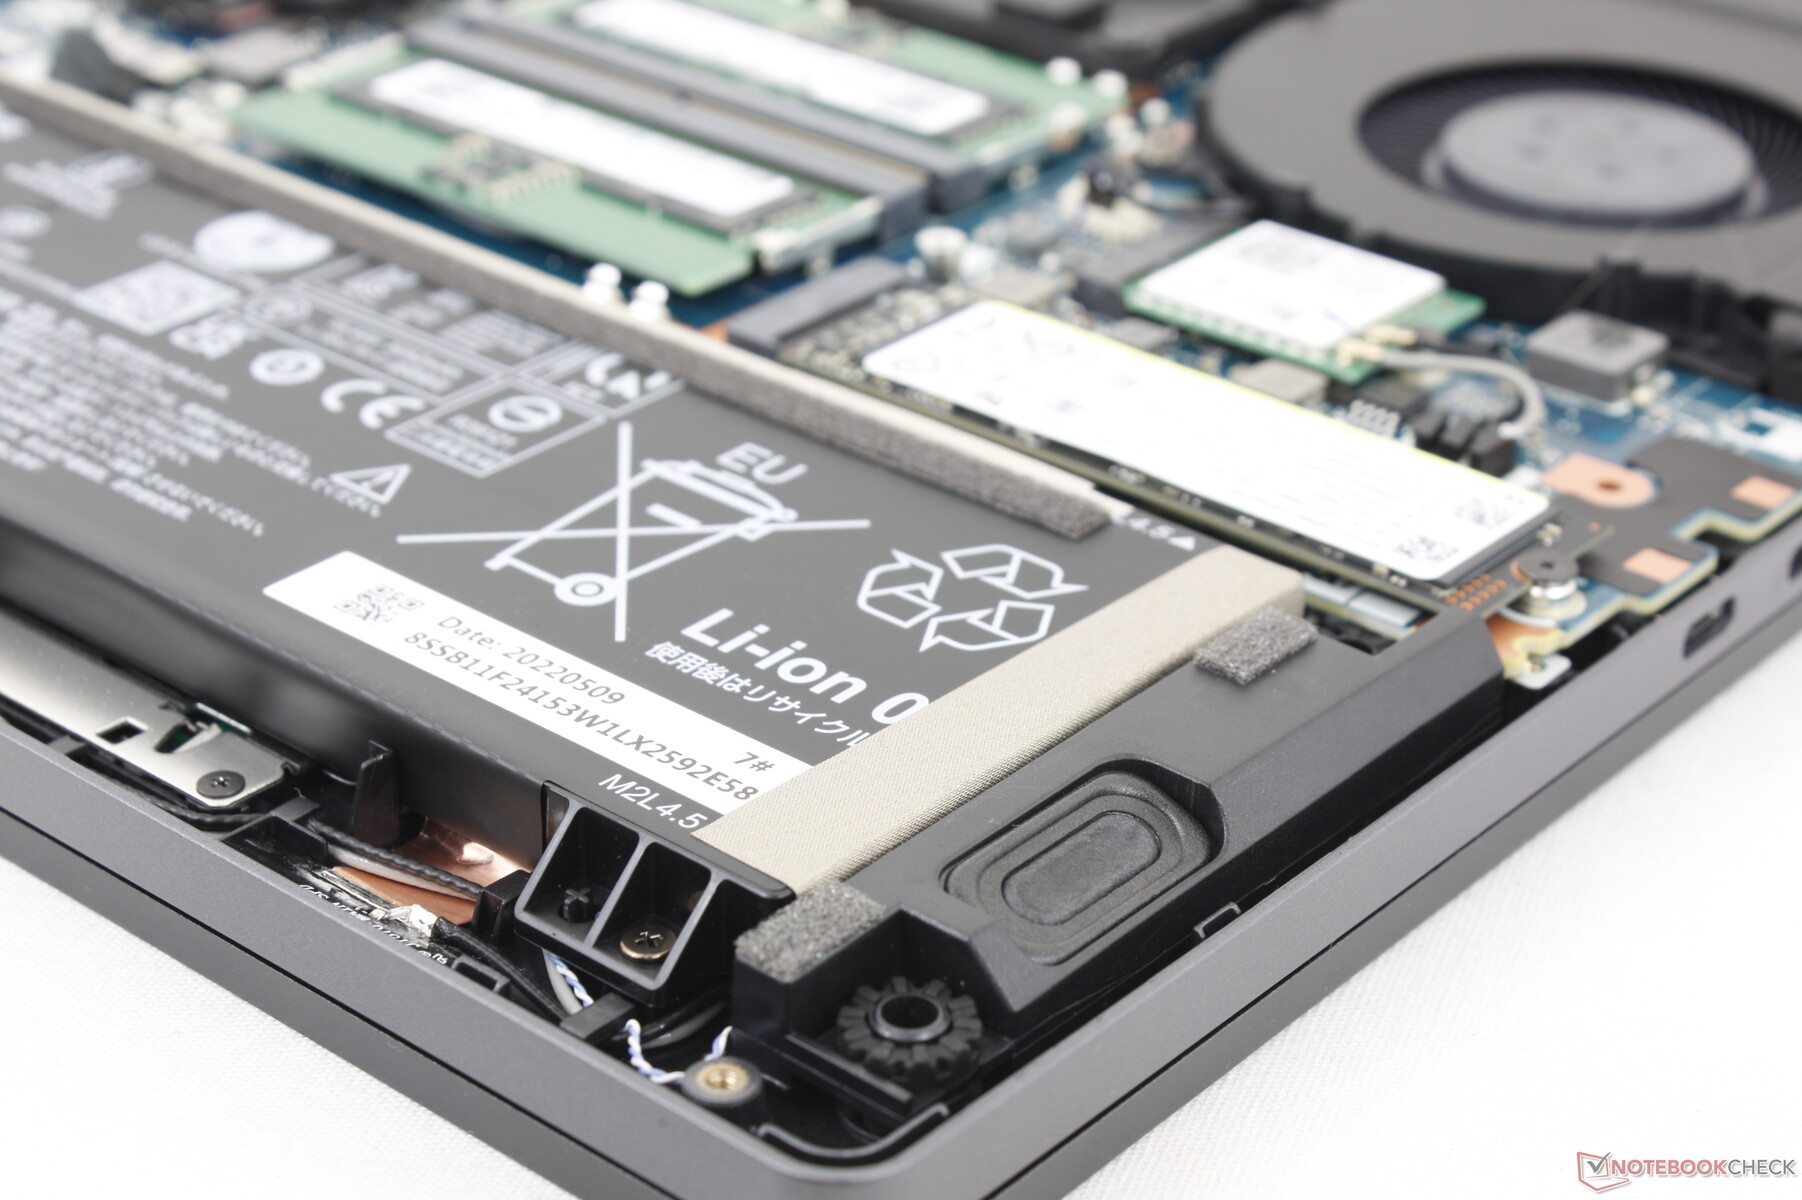
Los usuarios pueden instalar hasta dos SSD M.2 2280. Cada ranura incluye su propia almohadilla térmica y disipador de calor para ayudar a la refrigeración. La unidad de 512 GB SK Hynix en nuestra unidad fue capaz de mantener su velocidad máxima de lectura de 7000 MB/s sin ningún problema de estrangulamiento
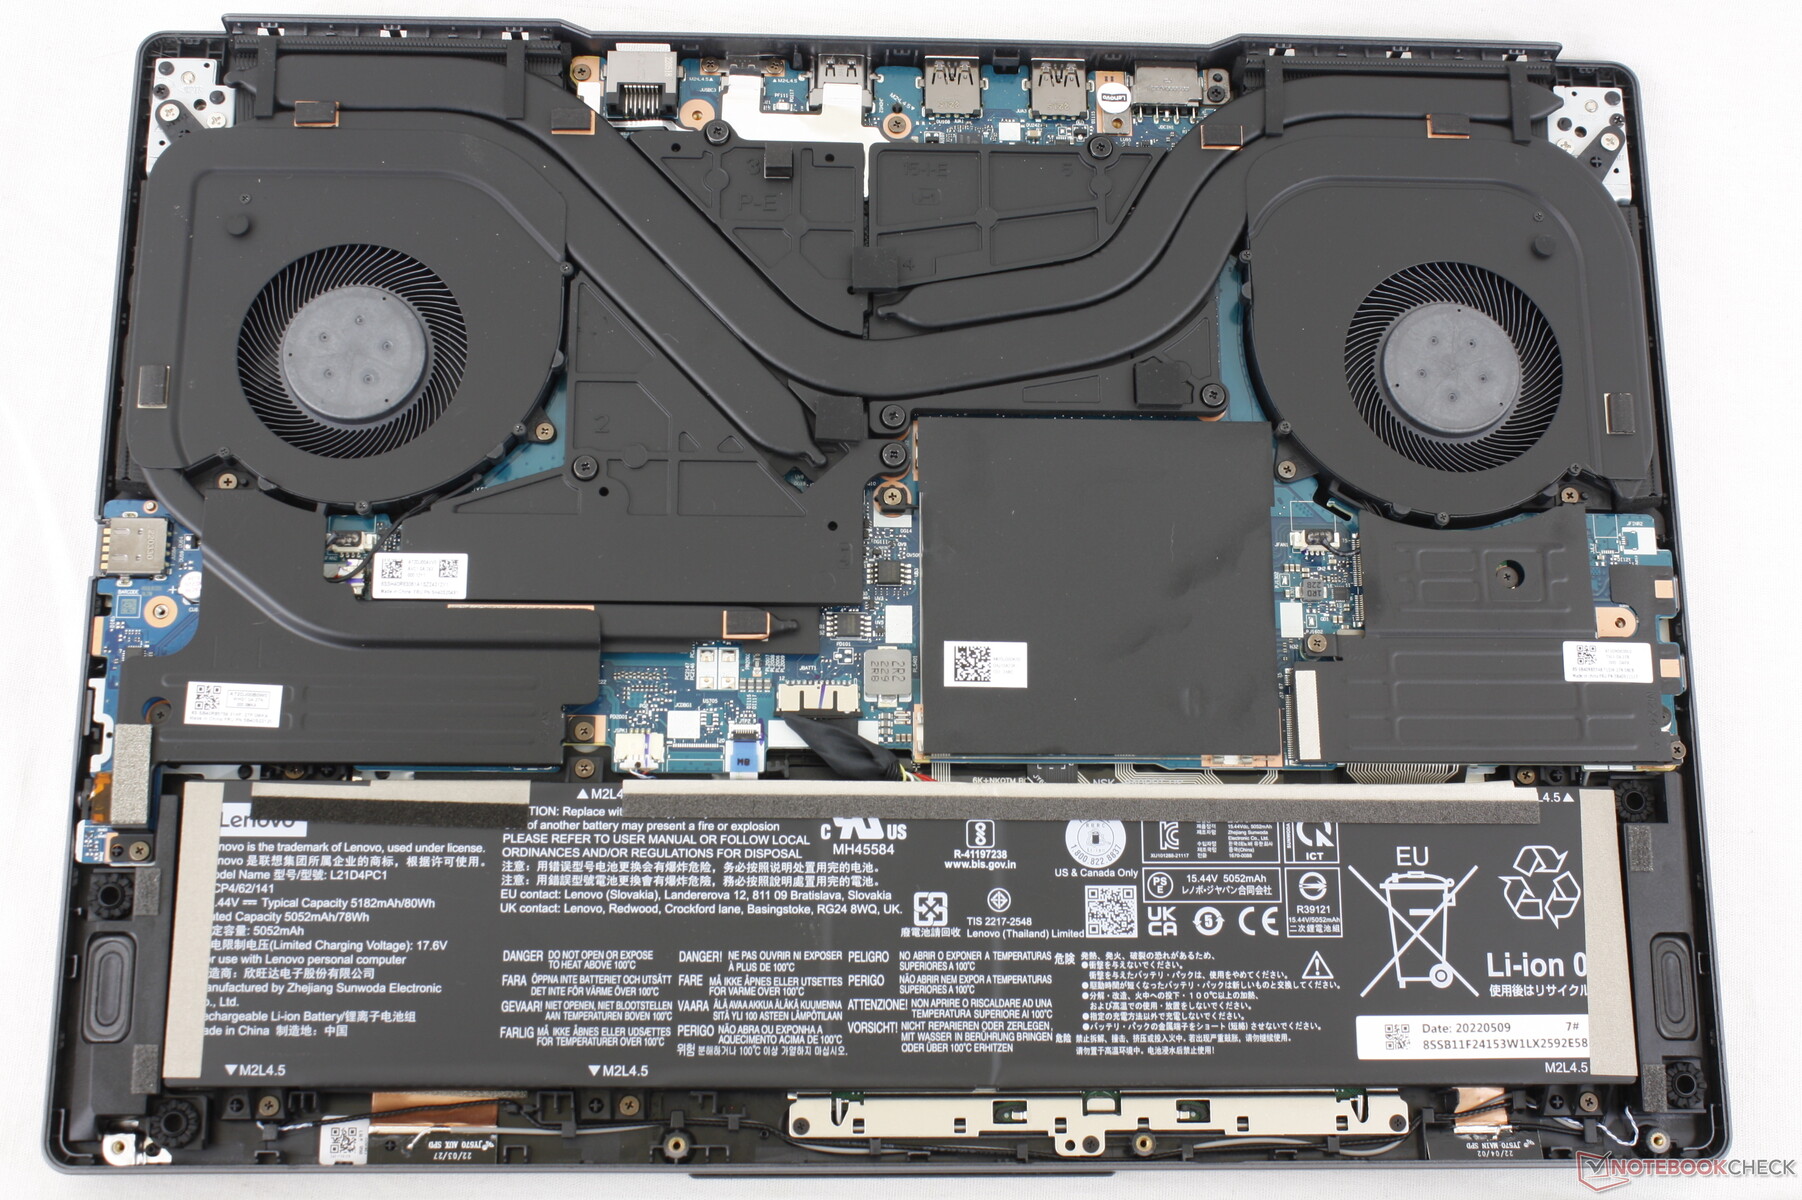
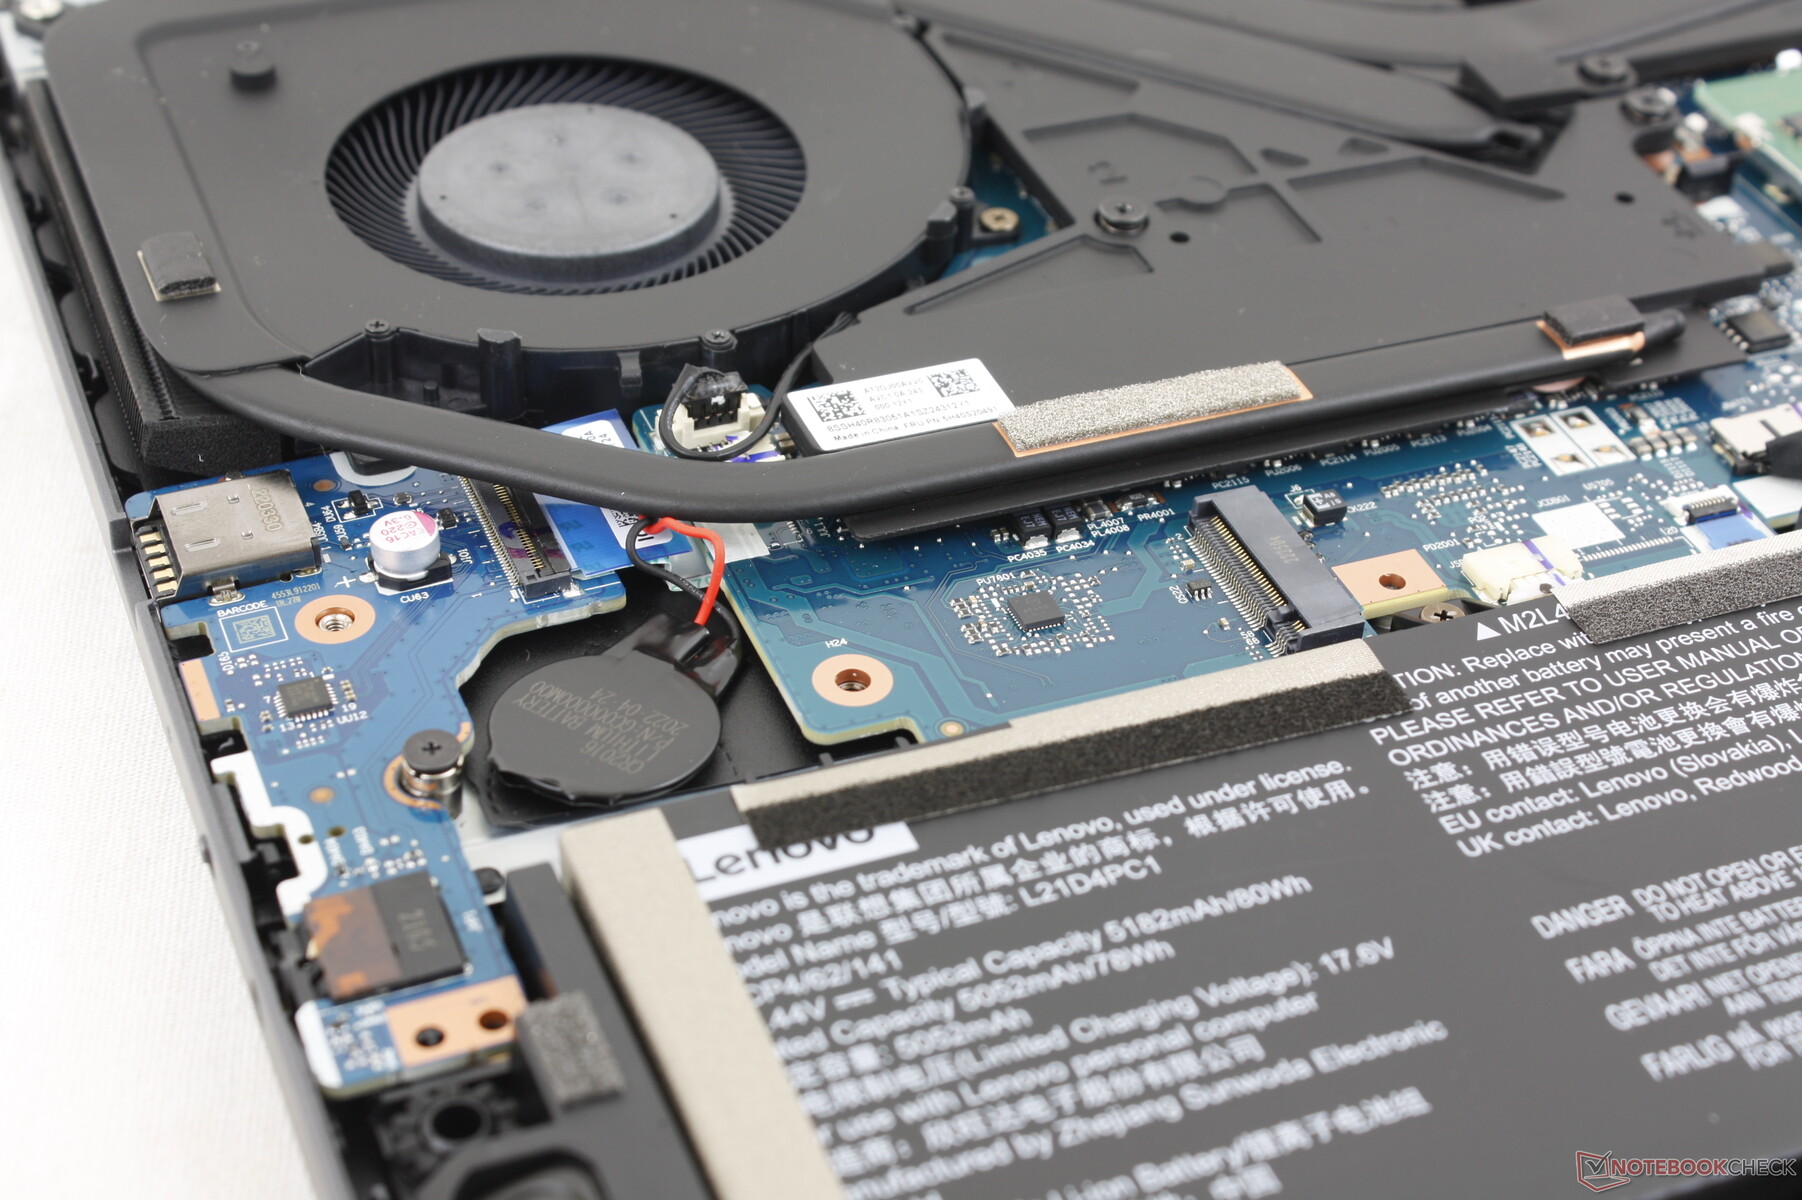
Si se instala una segunda unidad, hay que asegurarse de que no sea de doble cara, ya que de lo contrario podría no caber en su ranura. Nuestra imagen de abajo muestra que la batería de la BIOS está ocupando el espacio de una posible unidad SSD M.2 2280.

* ... más pequeño es mejor
Disk Throttling: DiskSpd Read Loop, Queue Depth 8
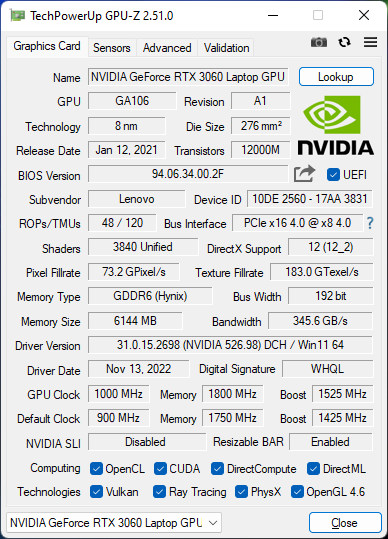
Rendimiento de la GPU - TGP de 140 W
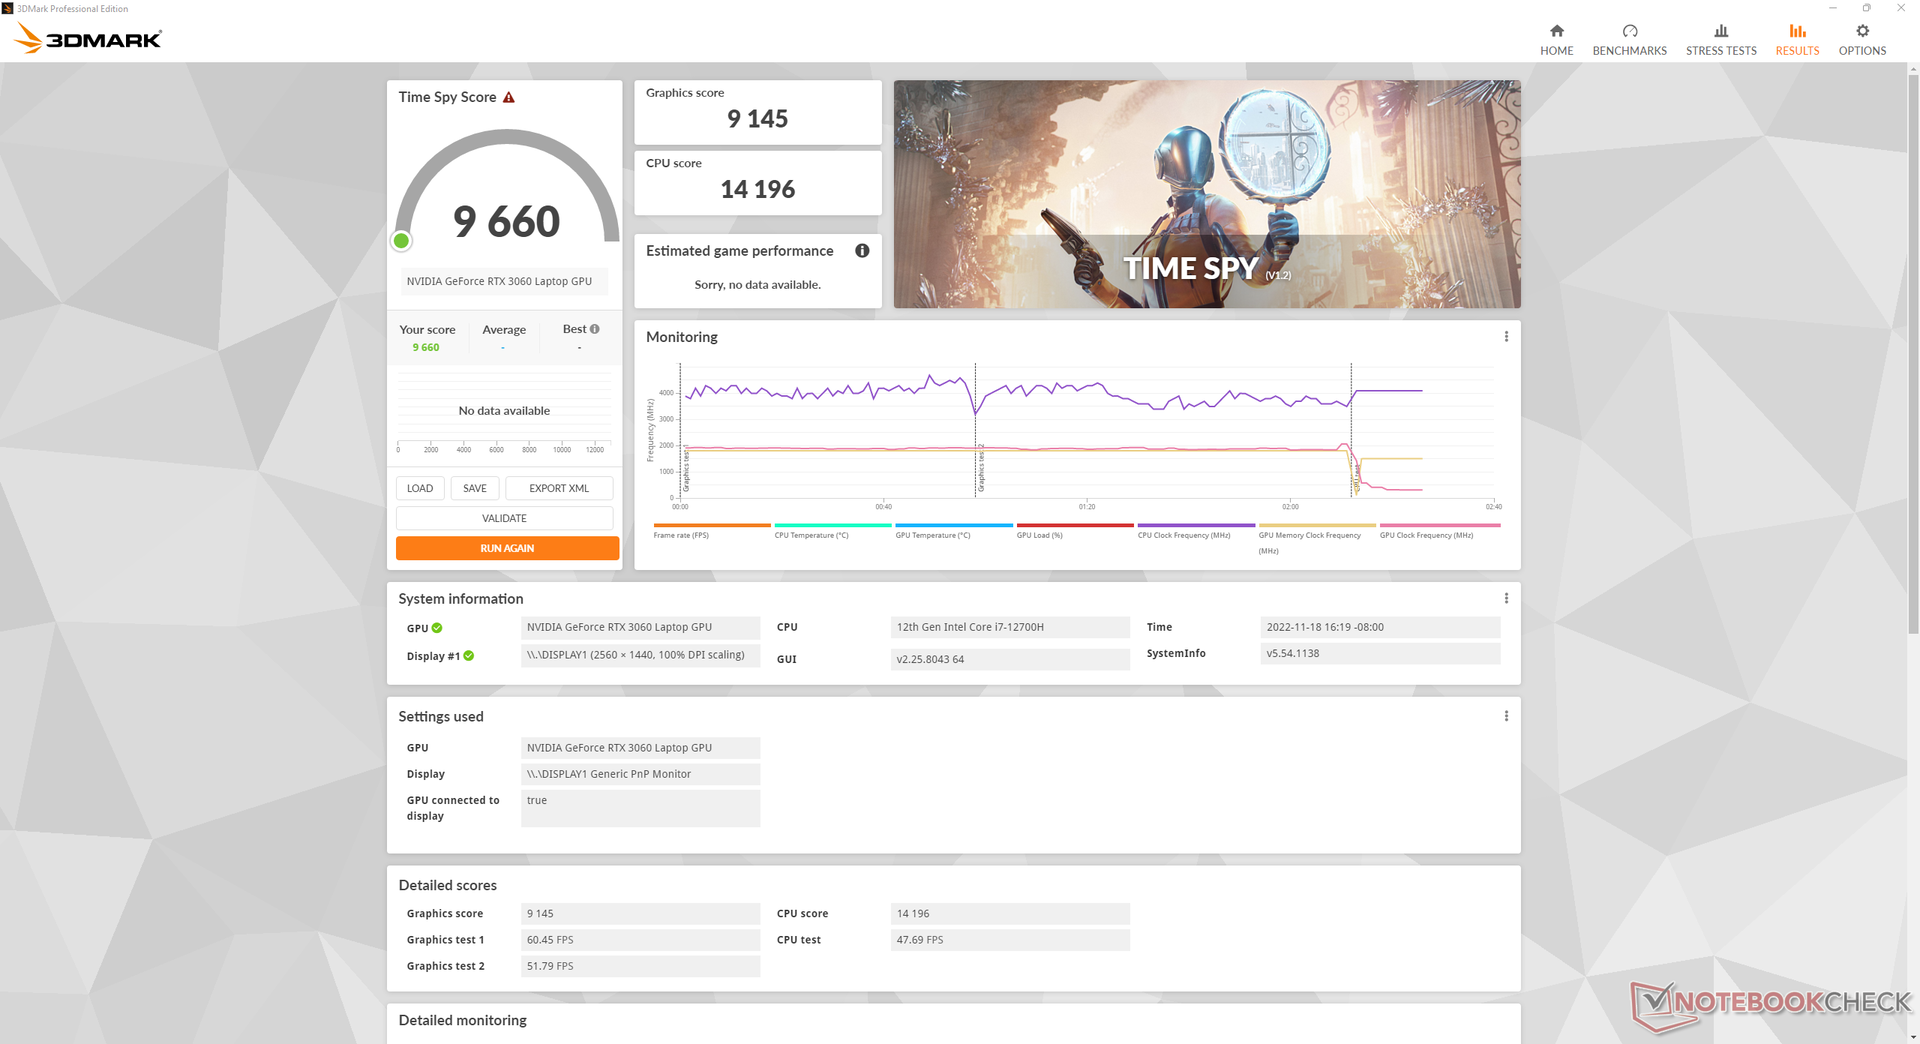
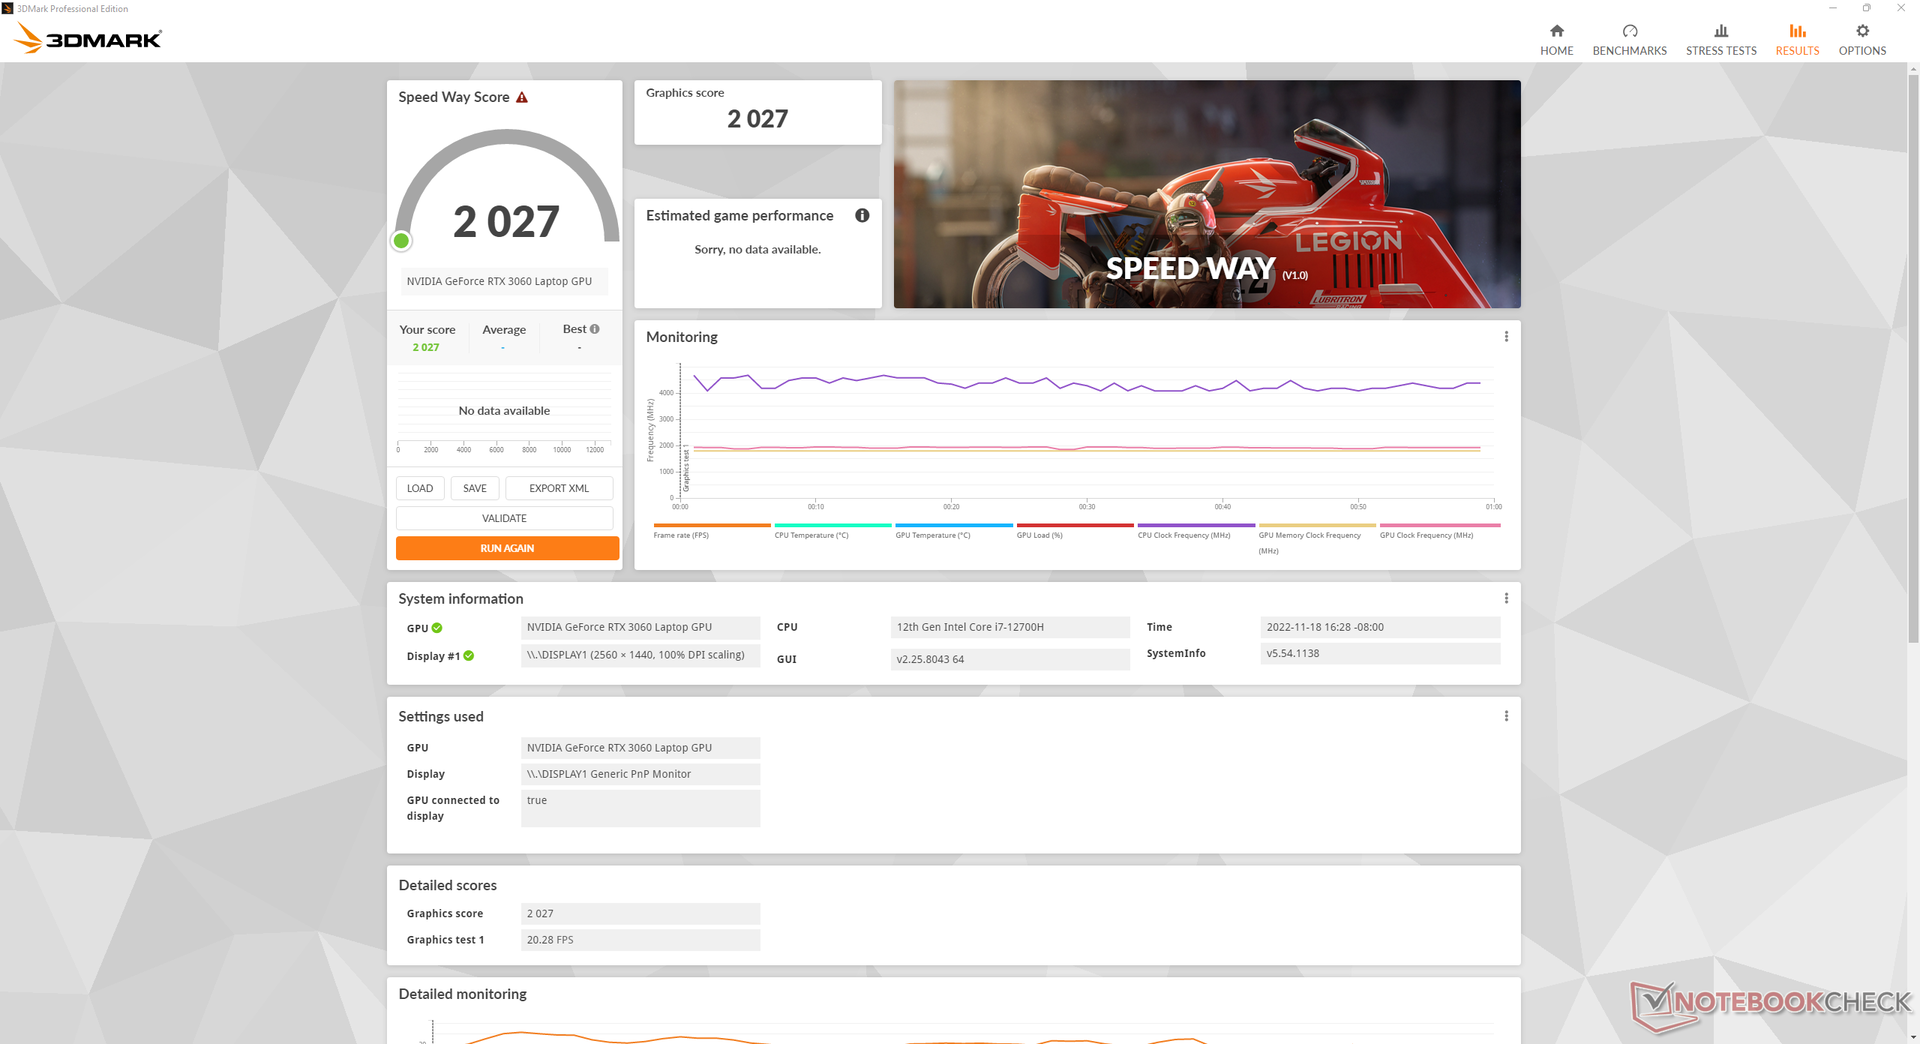
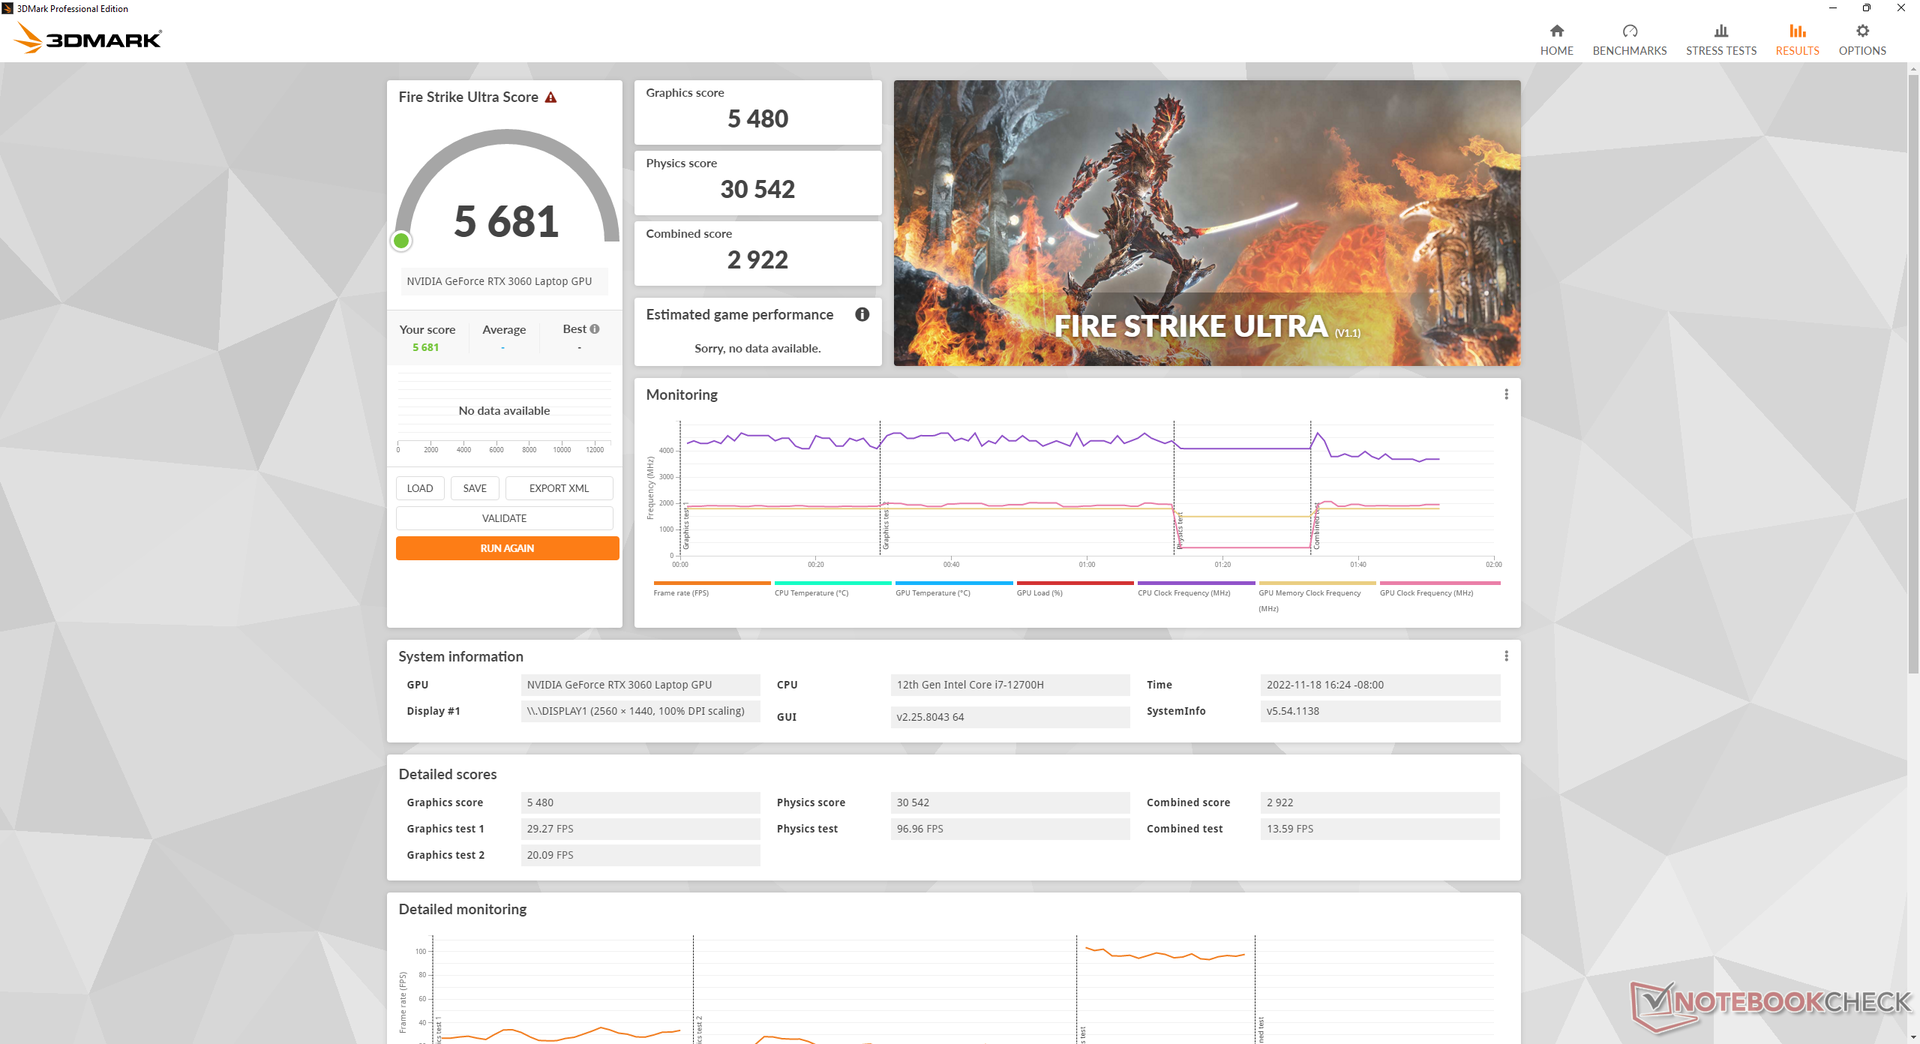
El rendimiento gráfico es excelente, con resultados en 3DMark que son entre un 10 y un 15 por ciento más rápidos que la media de los portátiles de nuestra base de datos equipados con la misma GeForce RTX 3060 GPU. El rendimiento superior a la media puede atribuirse en parte al objetivo TGP de 140 W, que es superior al de la mayoría de portátiles de juego.
El sistema debe estar configurado en modo Rendimiento para aprovechar al máximo la GPU. Si se ejecuta en modo equilibrado, por ejemplo, el rendimiento gráfico caerá alrededor de un 10 por ciento, como muestran nuestros resultados de Fire Strike a continuación.
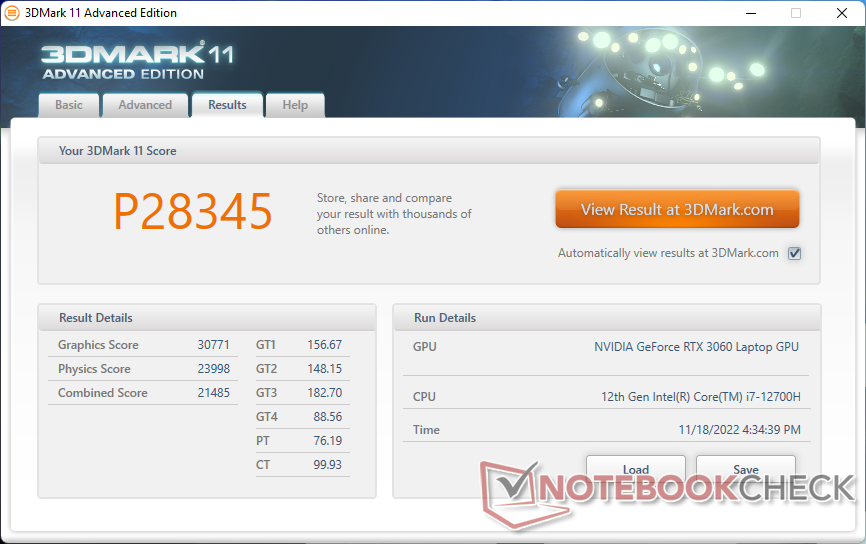

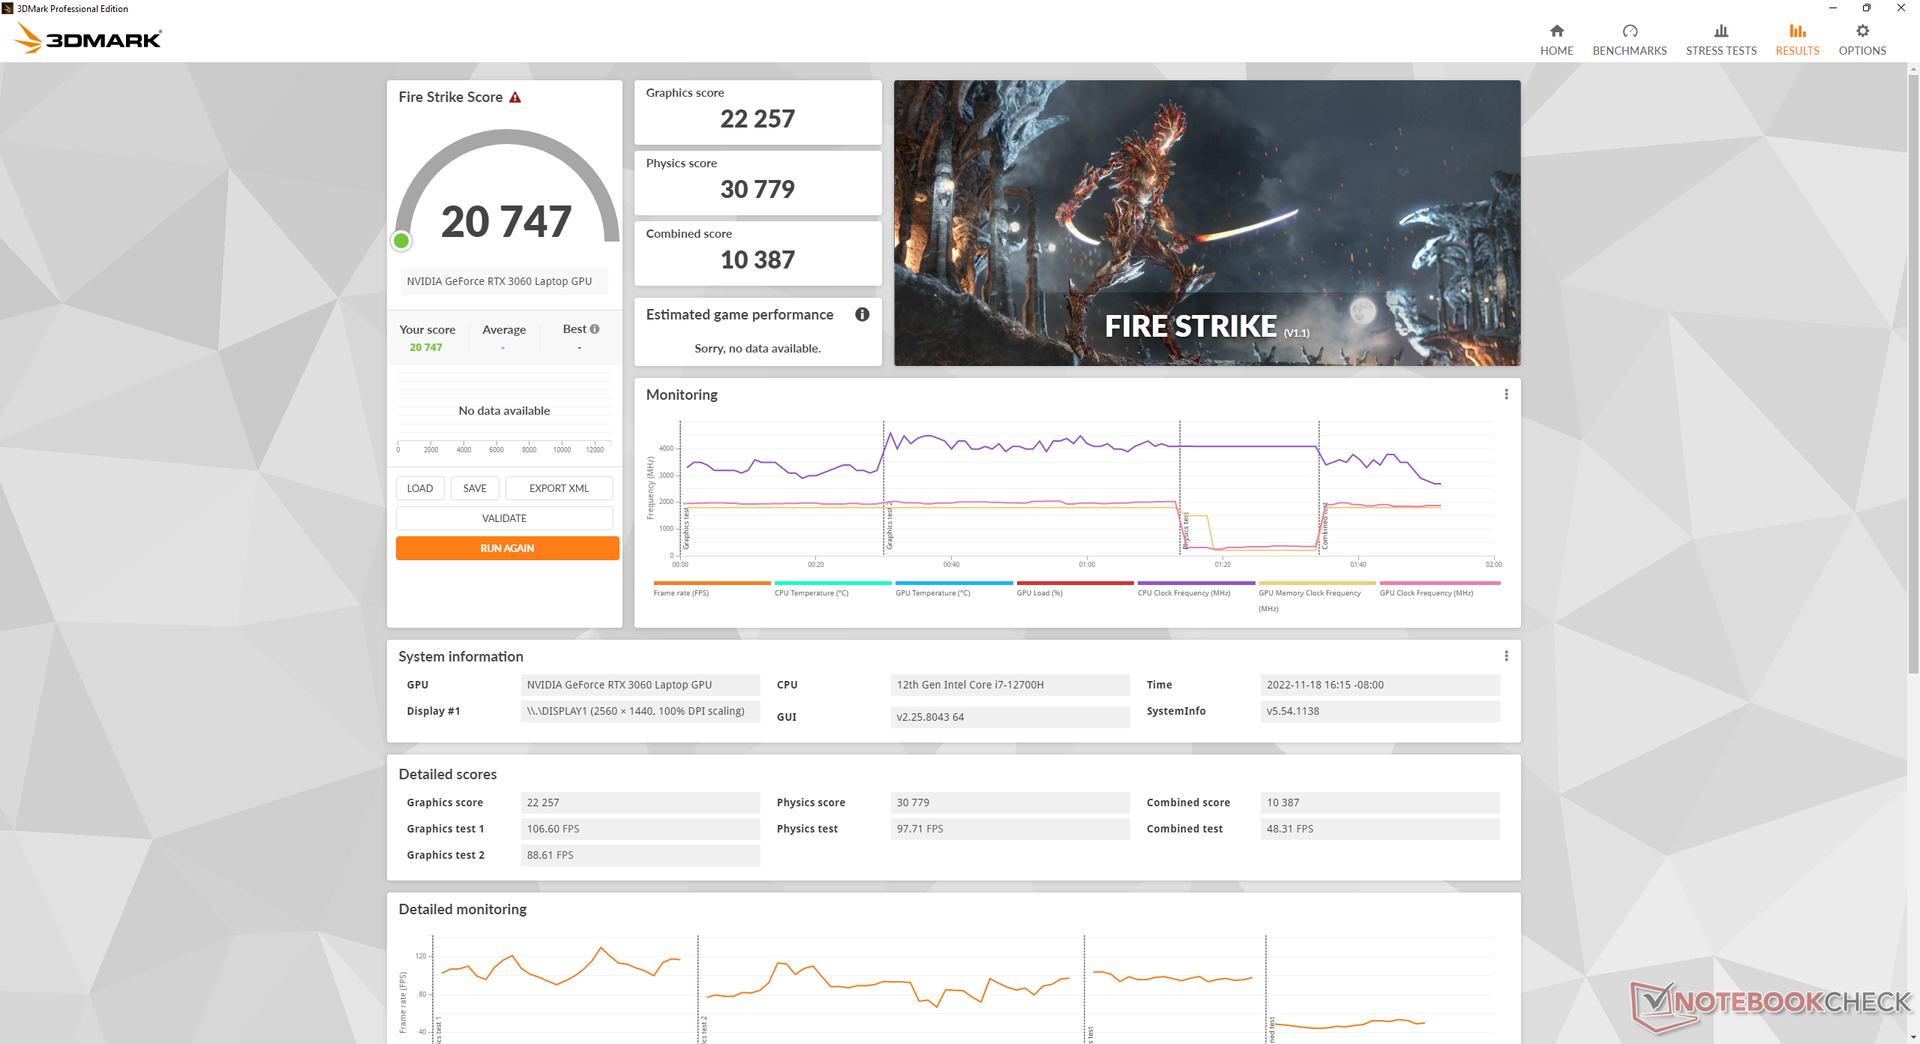
| 3DMark 11 Performance | 28345 puntos | |
| 3DMark Fire Strike Score | 20747 puntos | |
| 3DMark Time Spy Score | 9660 puntos | |
ayuda | ||
| Blender | |
| v3.3 Classroom OPTIX/RTX | |
| Medio NVIDIA GeForce RTX 3060 Laptop GPU (30 - 56, n=15) | |
| Lenovo Legion 5 15IAH7H 82RB | |
| v3.3 Classroom CUDA | |
| Medio NVIDIA GeForce RTX 3060 Laptop GPU (51 - 89, n=15) | |
| Lenovo Legion 5 15IAH7H 82RB | |
| v3.3 Classroom CPU | |
| Medio NVIDIA GeForce RTX 3060 Laptop GPU (291 - 508, n=15) | |
| Lenovo Legion 5 15IAH7H 82RB | |
* ... más pequeño es mejor
| Performance rating - Percent | |
| Media de la clase Gaming | |
| Lenovo Legion 5 15IAH7H 82RB | |
| The Witcher 3 - 1920x1080 Ultra Graphics & Postprocessing (HBAO+) | |
| Media de la clase Gaming (95 - 240, n=8, últimos 2 años) | |
| Lenovo Legion 5 15IAH7H 82RB | |
| GTA V - 1920x1080 Highest AA:4xMSAA + FX AF:16x | |
| Media de la clase Gaming (48.3 - 186.9, n=103, últimos 2 años) | |
| Lenovo Legion 5 15IAH7H 82RB | |
| Final Fantasy XV Benchmark - 1920x1080 High Quality | |
| Media de la clase Gaming (41 - 215, n=104, últimos 2 años) | |
| Lenovo Legion 5 15IAH7H 82RB | |
| Strange Brigade - 1920x1080 ultra AA:ultra AF:16 | |
| Media de la clase Gaming (76.3 - 456, n=94, últimos 2 años) | |
| Lenovo Legion 5 15IAH7H 82RB | |
| Dota 2 Reborn - 1920x1080 ultra (3/3) best looking | |
| Lenovo Legion 5 15IAH7H 82RB | |
| Media de la clase Gaming (84.8 - 248, n=113, últimos 2 años) | |
| X-Plane 11.11 - 1920x1080 high (fps_test=3) | |
| Lenovo Legion 5 15IAH7H 82RB | |
| Media de la clase Gaming (52.1 - 143.5, n=116, últimos 2 años) | |
Witcher 3 FPS Chart
| bajo | medio | alto | ultra | QHD | |
|---|---|---|---|---|---|
| GTA V (2015) | 186.8 | 183.4 | 179.4 | 109.8 | 83.6 |
| The Witcher 3 (2015) | 448.6 | 295.6 | 181.1 | 89.2 | |
| Dota 2 Reborn (2015) | 180.1 | 168.2 | 161.9 | 154.8 | |
| Final Fantasy XV Benchmark (2018) | 214 | 133.5 | 100.9 | 73.7 | |
| X-Plane 11.11 (2018) | 157.1 | 138.3 | 109.3 | ||
| Strange Brigade (2018) | 471 | 242 | 192.1 | 166.3 | 118.4 |
| Cyberpunk 2077 1.6 (2022) | 135.7 | 113.4 | 87.7 | 73.7 | 45.8 |
Emisiones
Ruido del sistema
Los ventiladores internos permanecen más silenciosos durante más tiempo antes de tener que aumentar la potencia en comparación con los ventiladores del modelo 2021. Cuando se ejecuta la primera escena de prueba de 3DMark 06, por ejemplo, el ruido de los ventiladores alcanza un máximo de sólo 29,3 dB(A) en comparación con los 54 dB(A) del modelo anterior. Esto significa que puedes ejecutar cargas bajas o medias como la navegación web o el streaming de vídeo durante más tiempo antes de que los ventiladores sean audibles.
Si se utiliza Witcher 3 en modo equilibrado, el nivel de ruido de los ventiladores oscila entre 43 y 48 dB(A), frente a los 51,4 dB(A) del modo de rendimiento. Por lo tanto, los usuarios deben soportar ventiladores más ruidosos si desean aprovechar al máximo la GPU. El ruido general de los ventiladores es más alto que en el Razer Blade 15 Base Edition pero más silencioso que en elAsus TUF Gaming F15 ambos con la misma GPU GeForce RTX 3060.
Ruido
| Ocioso |
| 23.5 / 23.5 / 26.8 dB(A) |
| Carga |
| 29.3 / 53 dB(A) |
 | ||
30 dB silencioso 40 dB(A) audible 50 dB(A) ruidosamente alto |
||
min: | ||
| Lenovo Legion 5 15IAH7H 82RB GeForce RTX 3060 Laptop GPU, i7-12700H | Lenovo Legion 5 15ACH-82JU00C6GE-FL GeForce RTX 3060 Laptop GPU, R7 5800H, Micron 2300 512GB MTFDHBA512TDV | MSI Bravo 15 B5DD-010US Radeon RX 5500M, R5 5600H, Kingston OM8PCP3512F-AB | Asus TUF Gaming F15 FX507ZM GeForce RTX 3060 Laptop GPU, i7-12700H, SK Hynix HFM001TD3JX013N | Acer Aspire Nitro 5 AN515-55-57GF GeForce RTX 3060 Laptop GPU, i5-10300H, WDC PC SN530 SDBPNPZ-512G | Razer Blade 15 Base Edition 2021, i7-10750H RTX 3060 GeForce RTX 3060 Laptop GPU, i7-10750H, Samsung SSD PM981a MZVLB512HBJQ | |
|---|---|---|---|---|---|---|
| Noise | -21% | -12% | -5% | -15% | -6% | |
| apagado / medio ambiente * (dB) | 23.3 | 24.2 -4% | 24.5 -5% | 23.2 -0% | 25 -7% | 25.3 -9% |
| Idle Minimum * (dB) | 23.5 | 29 -23% | 24.5 -4% | 23.6 -0% | 25 -6% | 25.4 -8% |
| Idle Average * (dB) | 23.5 | 29 -23% | 32.8 -40% | 23.6 -0% | 30 -28% | 25.4 -8% |
| Idle Maximum * (dB) | 26.8 | 29 -8% | 32.8 -22% | 25.4 5% | 33 -23% | 25.4 5% |
| Load Average * (dB) | 29.3 | 53.5 -83% | 34.5 -18% | 38 -30% | 46 -57% | 42.5 -45% |
| Witcher 3 ultra * (dB) | 51.4 | 53.5 -4% | 42.5 17% | 54.1 -5% | 47 9% | 42 18% |
| Load Maximum * (dB) | 53 | 53.5 -1% | 58.5 -10% | 57.2 -8% | 50 6% | 52.2 2% |
* ... más pequeño es mejor
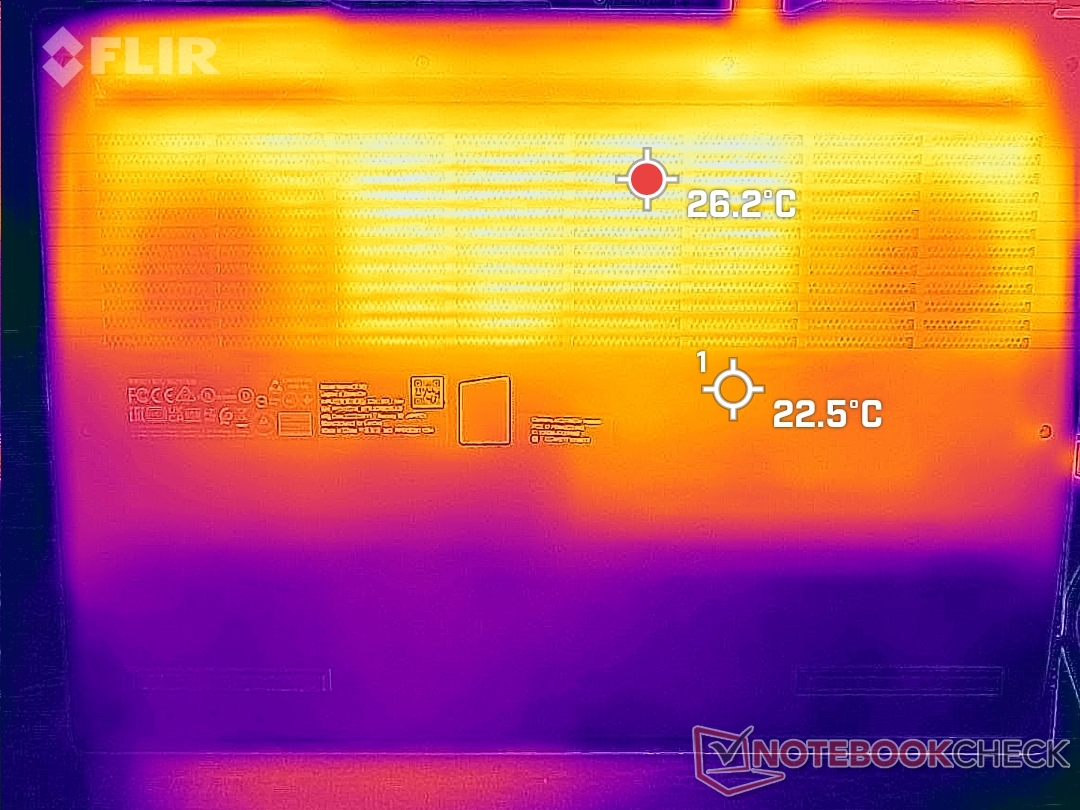
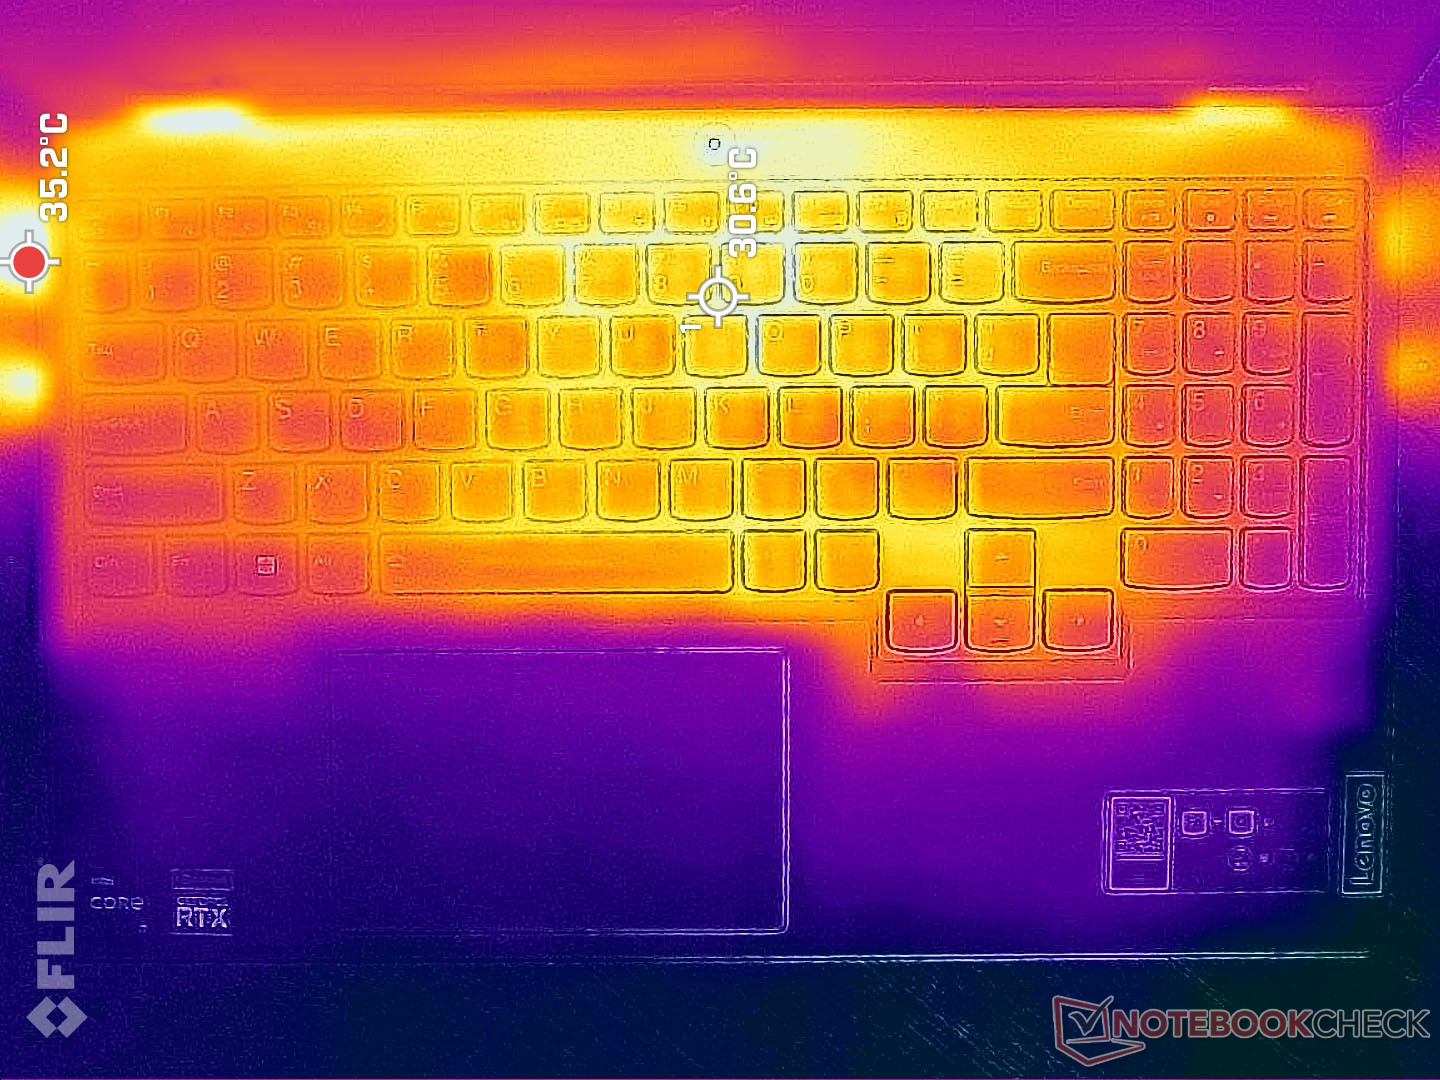
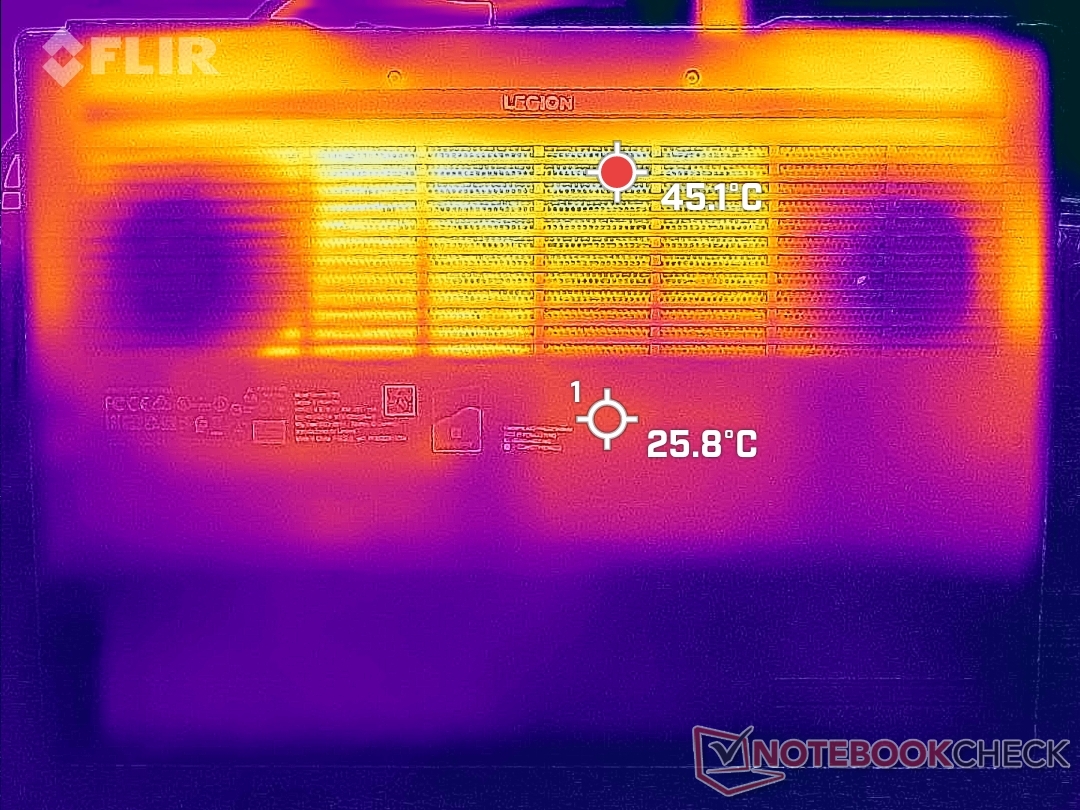
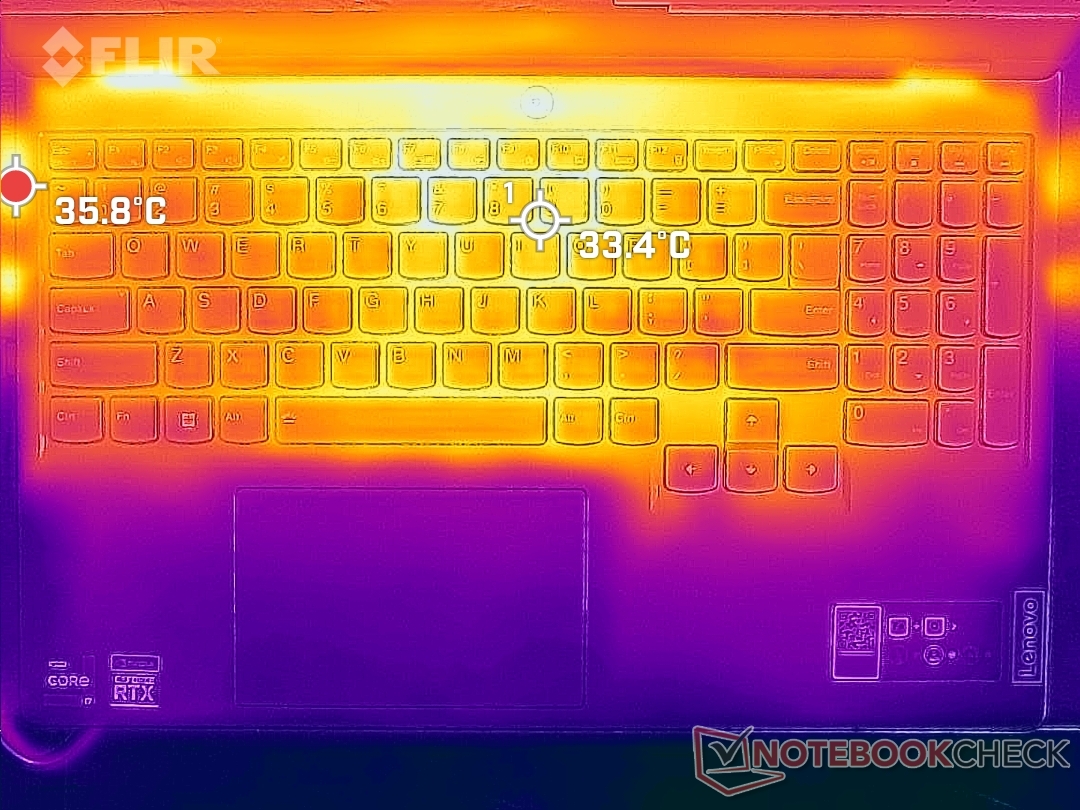
Temperatura
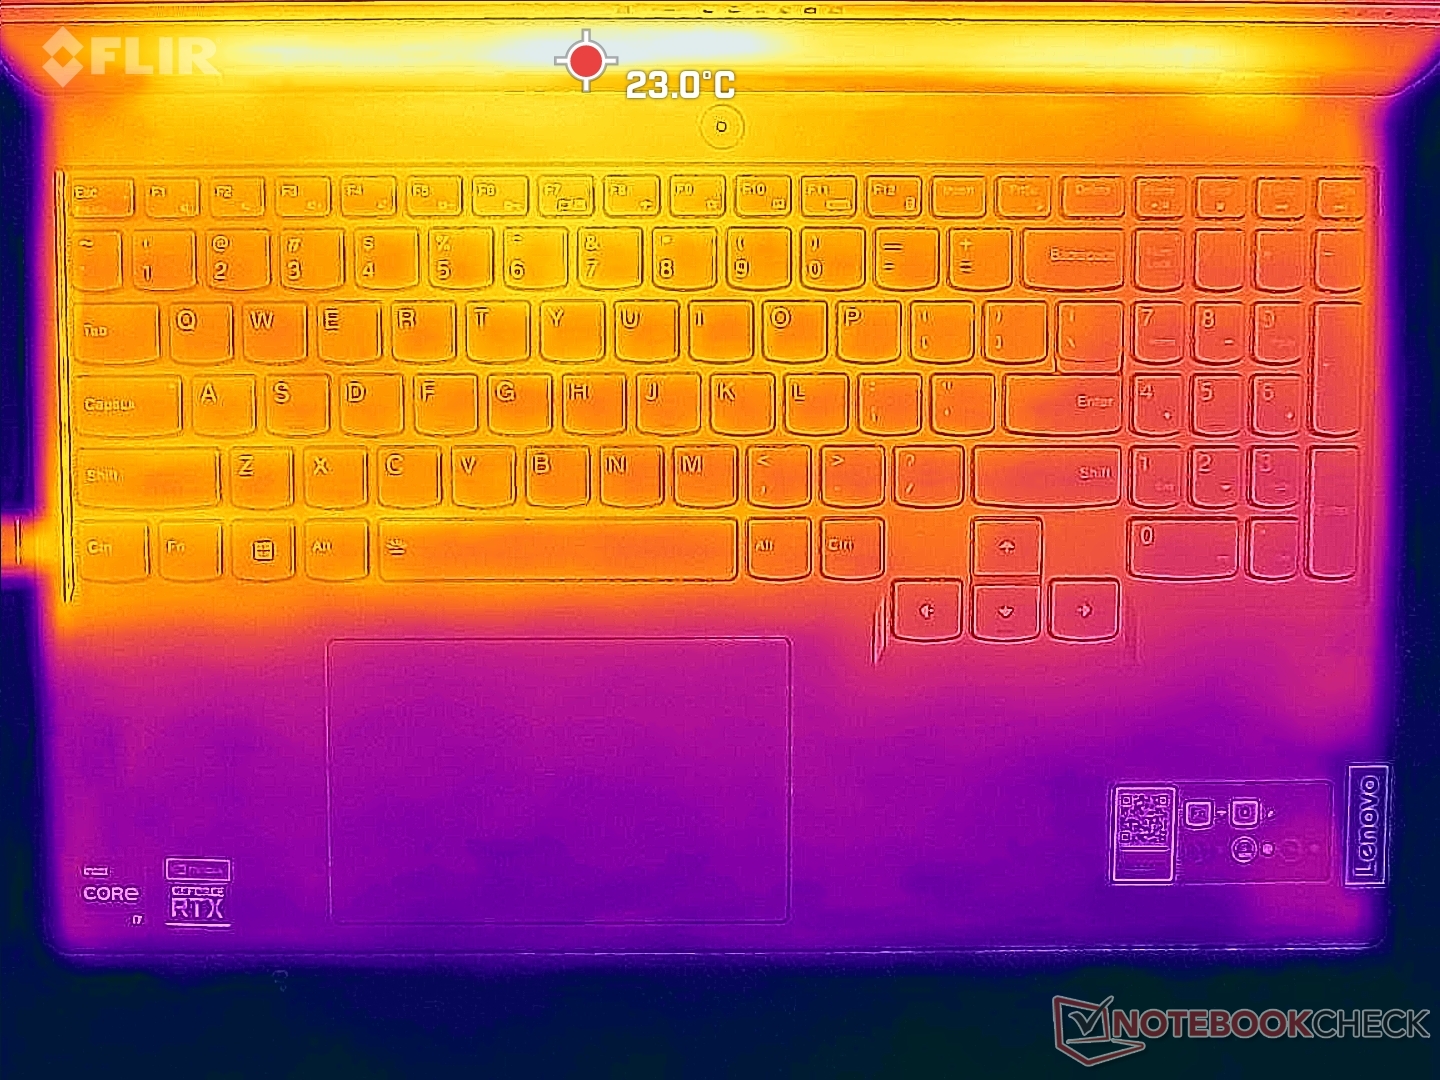
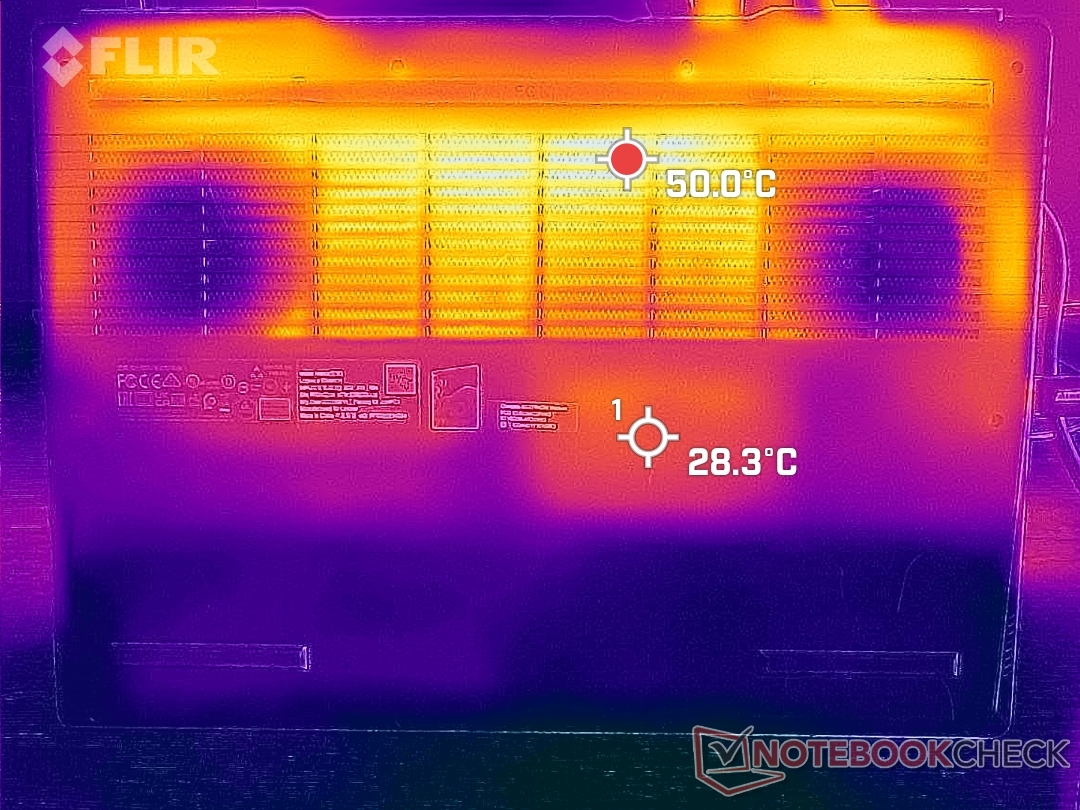
Las temperaturas de la superficie son mucho más cálidas en la parte inferior, donde los puntos calientes pueden alcanzar más de 50 C, en comparación con sólo 36 C en la parte superior cuando se ejecutan cargas exigentes. No obstante, es una mejora respecto al modelo del año pasado, en el que las temperaturas pueden superar los 40 C en la mayor parte del teclado cuando se juega.
Los puntos calientes están en el borde trasero del chasis, donde el contacto con la piel es poco probable. Hay rejillas de ventilación en casi la mitad de la superficie del chasis, por lo que los usuarios deben tener cuidado de no bloquear ningún flujo de aire.
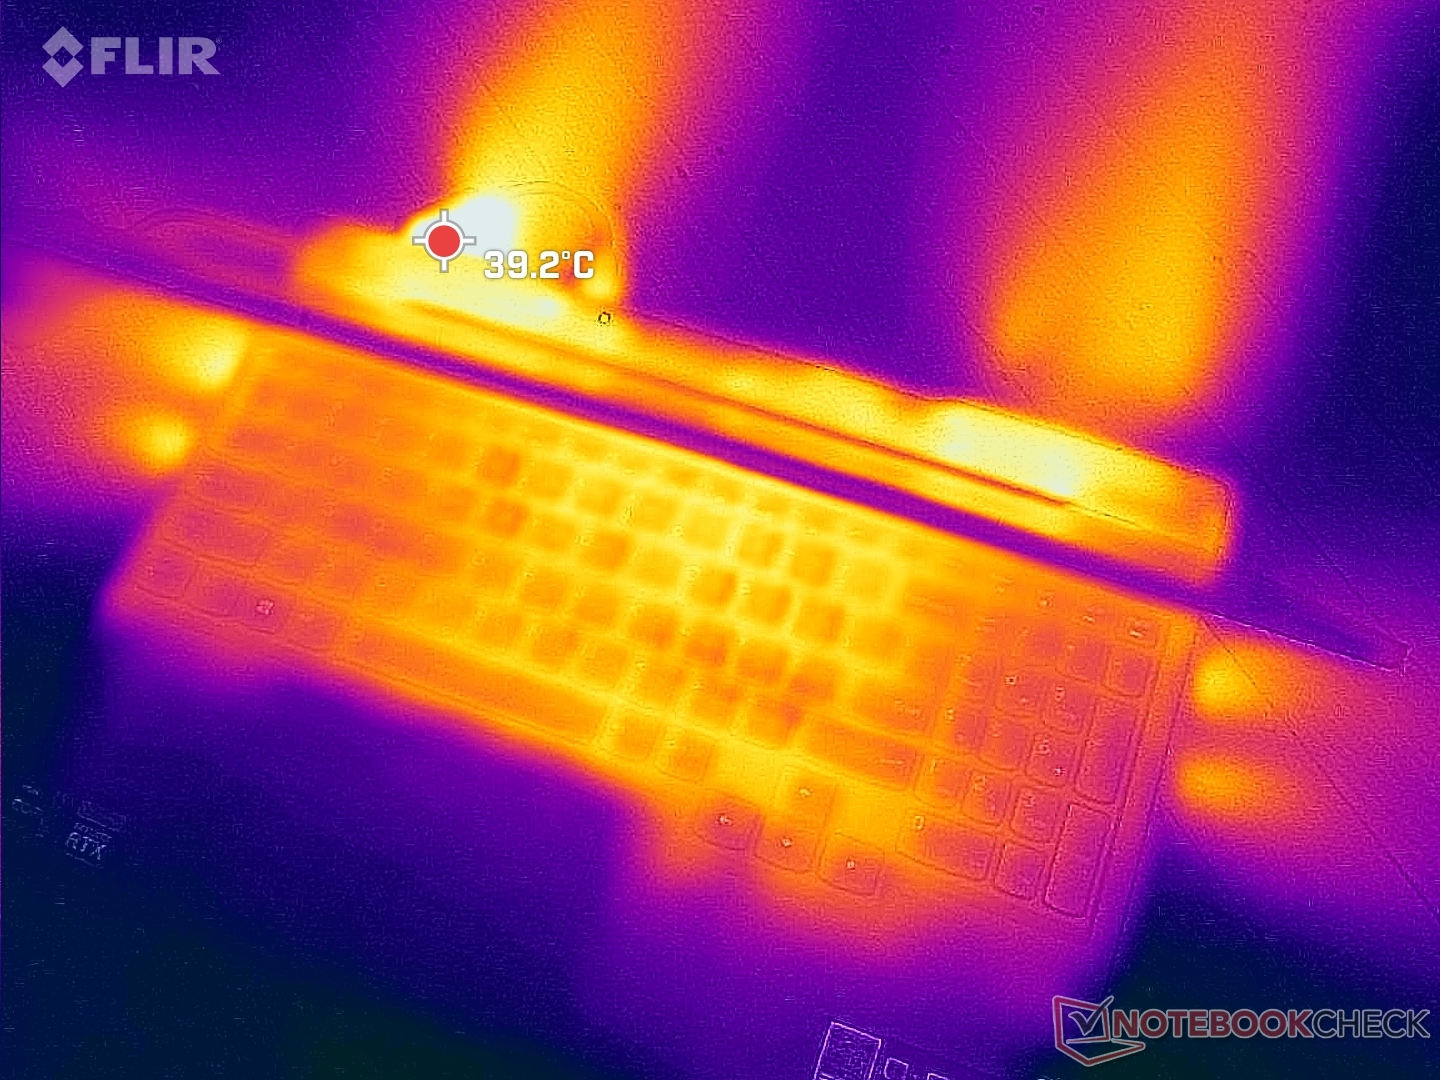
(+) La temperatura máxima en la parte superior es de 37.8 °C / 100 F, frente a la media de 40.4 °C / 105 F, que oscila entre 21.2 y 68.8 °C para la clase Gaming.
(-) El fondo se calienta hasta un máximo de 51 °C / 124 F, frente a la media de 43.2 °C / 110 F
(+) En reposo, la temperatura media de la parte superior es de 23.8 °C / 75# F, frente a la media del dispositivo de 33.9 °C / 93 F.
(+) Jugando a The Witcher 3, la temperatura media de la parte superior es de 27.3 °C / 81 F, frente a la media del dispositivo de 33.9 °C / 93 F.
(+) El reposamanos y el panel táctil están a una temperatura inferior a la de la piel, con un máximo de 23.8 °C / 74.8 F y, por tanto, son fríos al tacto.
(+) La temperatura media de la zona del reposamanos de dispositivos similares fue de 28.8 °C / 83.8 F (+5 °C / 9 F).
| Lenovo Legion 5 15IAH7H 82RB Intel Core i7-12700H, NVIDIA GeForce RTX 3060 Laptop GPU | Lenovo Legion 5 15ACH-82JU00C6GE-FL AMD Ryzen 7 5800H, NVIDIA GeForce RTX 3060 Laptop GPU | MSI Bravo 15 B5DD-010US AMD Ryzen 5 5600H, AMD Radeon RX 5500M | Asus TUF Gaming F15 FX507ZM Intel Core i7-12700H, NVIDIA GeForce RTX 3060 Laptop GPU | Acer Aspire Nitro 5 AN515-55-57GF Intel Core i5-10300H, NVIDIA GeForce RTX 3060 Laptop GPU | Razer Blade 15 Base Edition 2021, i7-10750H RTX 3060 Intel Core i7-10750H, NVIDIA GeForce RTX 3060 Laptop GPU | |
|---|---|---|---|---|---|---|
| Heat | 0% | -20% | -25% | -6% | -19% | |
| Maximum Upper Side * (°C) | 37.8 | 42.6 -13% | 52.2 -38% | 44.4 -17% | 49 -30% | 45.2 -20% |
| Maximum Bottom * (°C) | 51 | 52.2 -2% | 48.6 5% | 48.8 4% | 51 -0% | 48 6% |
| Idle Upper Side * (°C) | 25.8 | 24.9 3% | 38 -47% | 37.8 -47% | 26 -1% | 34.4 -33% |
| Idle Bottom * (°C) | 28.8 | 25.3 12% | 28.4 1% | 39.6 -38% | 27 6% | 37.2 -29% |
* ... más pequeño es mejor
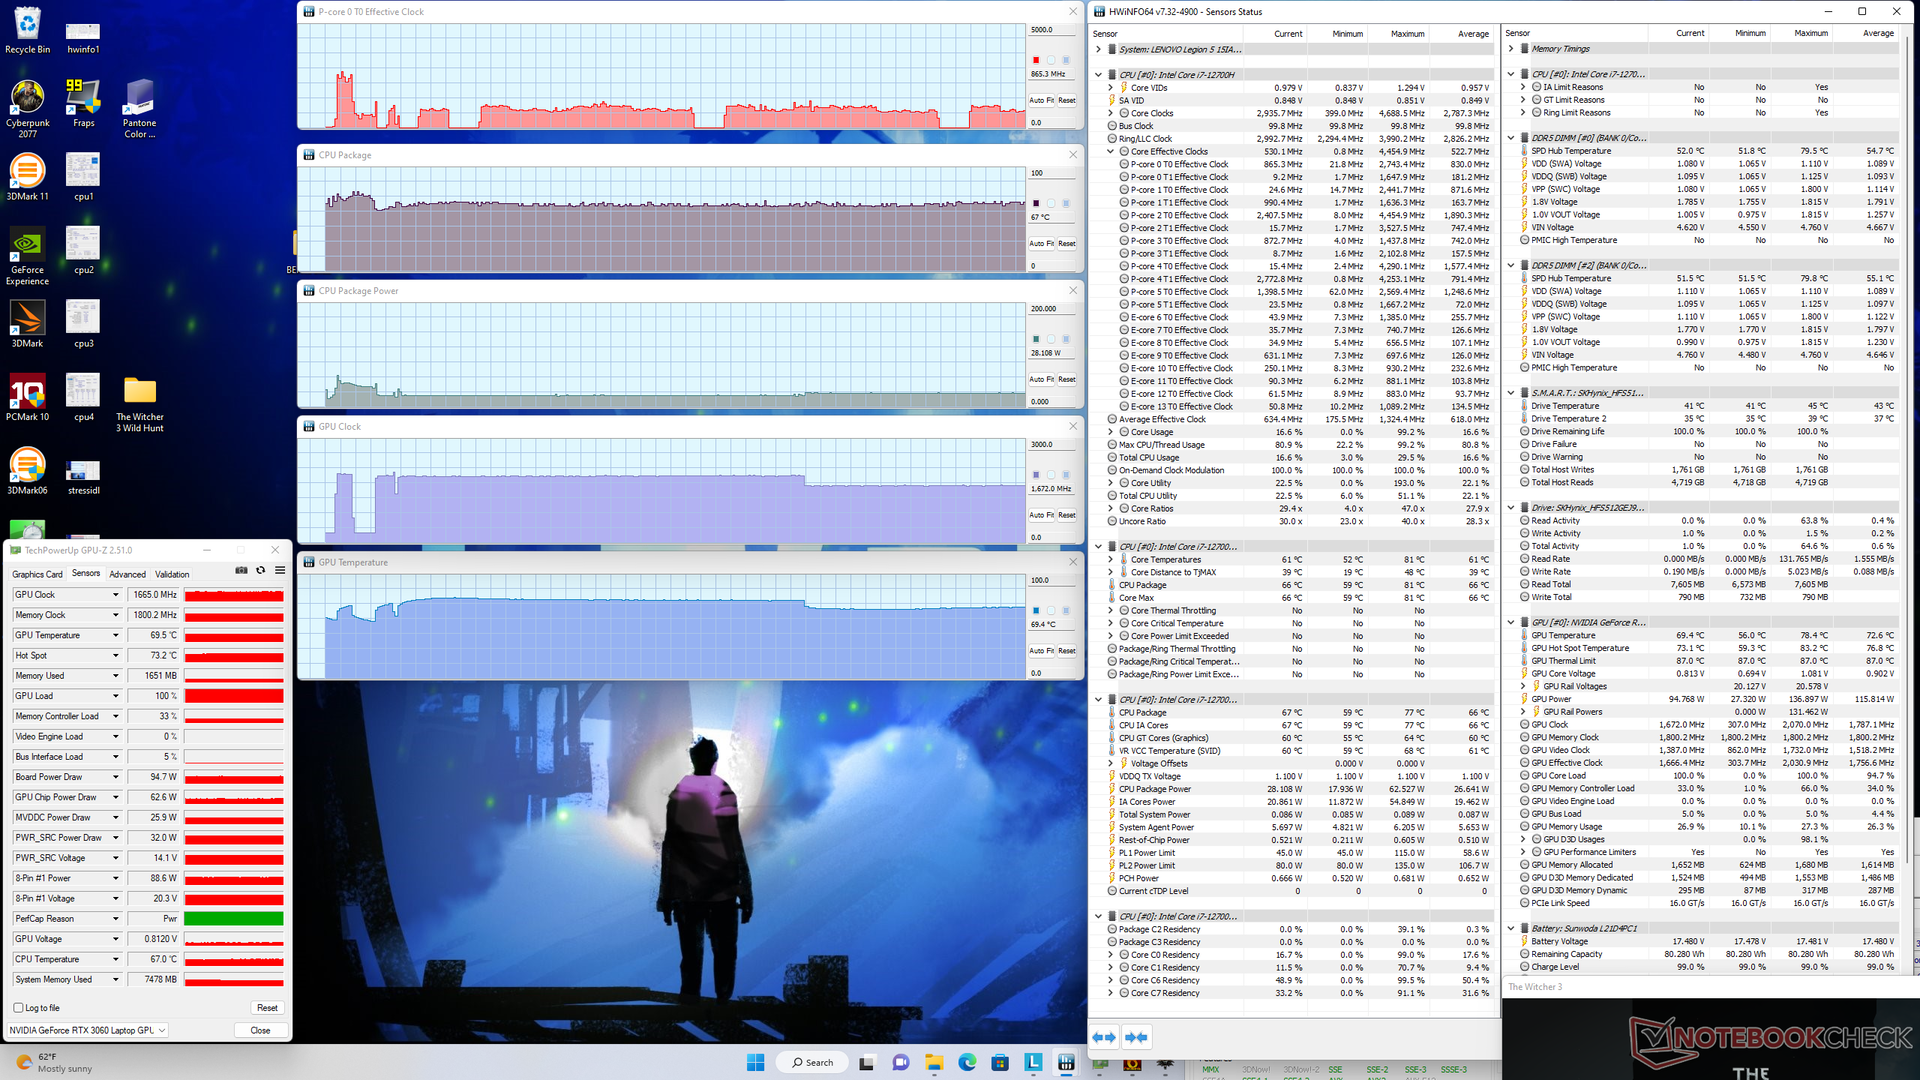
Prueba de esfuerzo
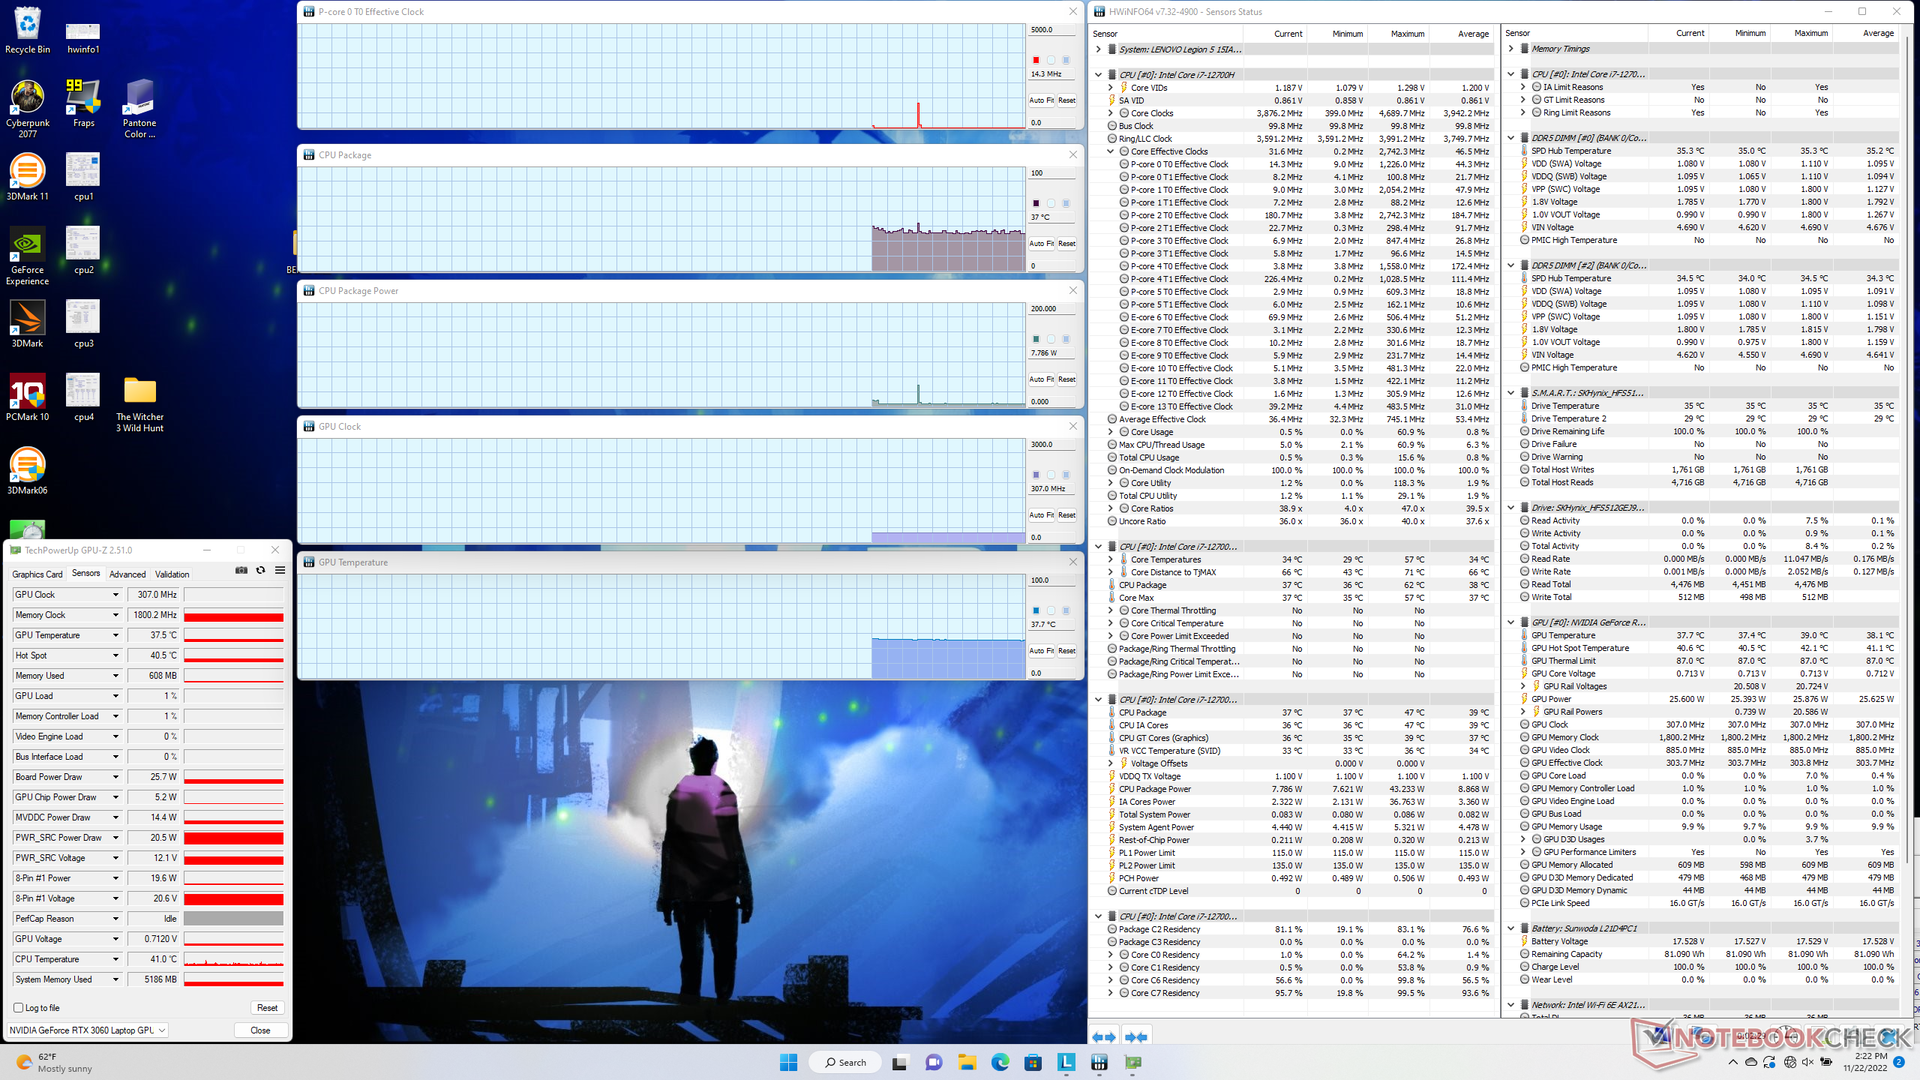
Cuando se ejecuta Prime95 para estresar la CPU, las velocidades de reloj y el consumo de energía de la placa se disparan a 4,1 GHz y 110 W, respectivamente, y duran aproximadamente un minuto. A continuación, la CPU se estabilizó en 3,6 GHz, 101 W y 97 C. La temperatura del núcleo, muy caliente, sugiere que el procesador está forzando los límites de la solución de refrigeración más que en otros portátiles de juego para exprimir el rendimiento adicional. El HP Envy 16 con la misma CPU Core i7-12700H, por ejemplo, se estabilizaría a sólo 2,1 GHz y 66 C en condiciones de prueba similares en comparación.
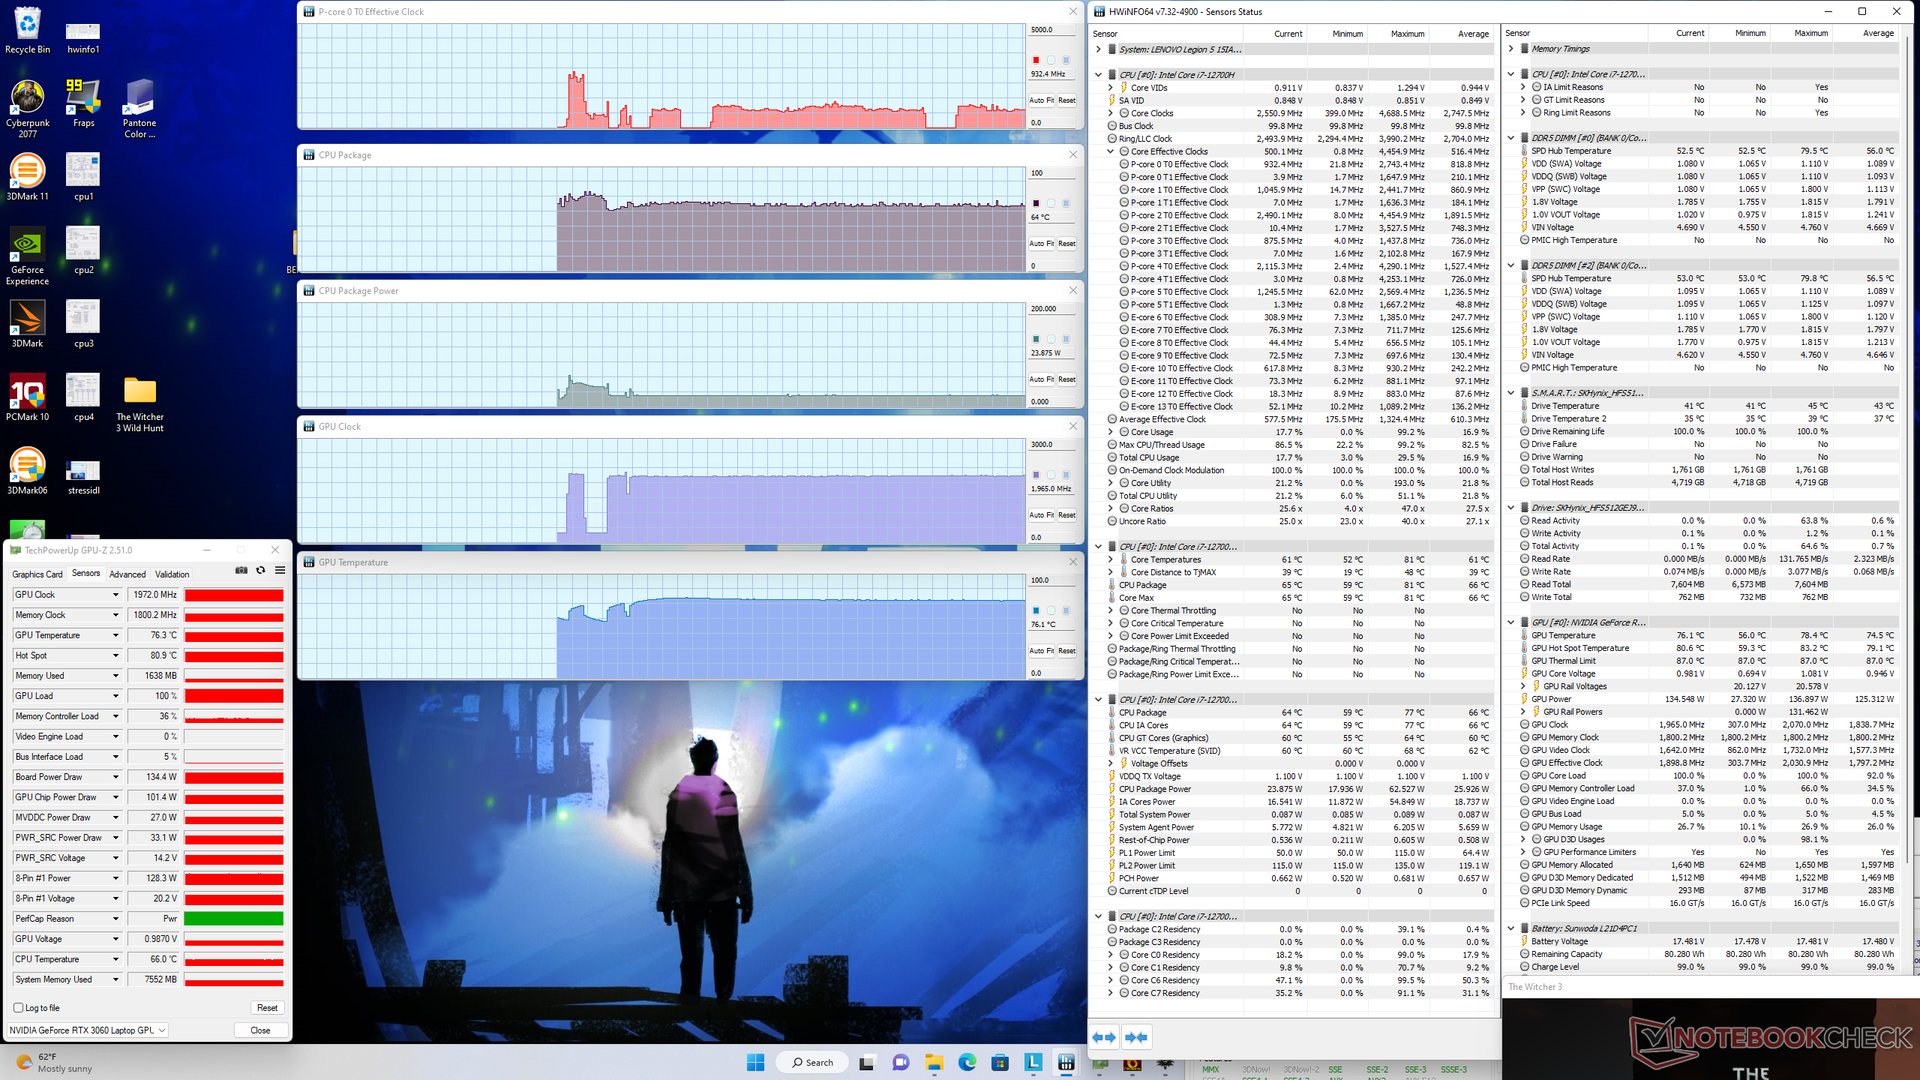
Ejecutando Witcher 3 en el modo Rendimiento para representar las cargas típicas de los juegos haría que la GPU Nvidia se estabilizara a 1972 MHz, 134 W de consumo de energía de la placa y 76 C. Si estuviera en el modo Equilibrado, la GPU se estabilizaría en cambio a 1665 MHz, 95 W y 70 C para un déficit de rendimiento del 10 por ciento como se detalla en nuestra sección de Rendimiento de la GPU más arriba. Por tanto, los usuarios deben activar el modo Rendimiento a través del software Vantage si quieren explotar la GPU al máximo.
El funcionamiento con baterías limita el rendimiento. Una prueba de Fire Strike con baterías arrojaría unas puntuaciones de Física y Gráficos de 23698 y 12906 puntos, respectivamente, en comparación con los 30779 y 22257 puntos con la red eléctrica.
| Reloj dela CPU (GHz) | Reloj de la GPU (MHz) | Temperatura media dela CPU (°C) | Temperatura media de la GPU (°C) | |
| Sistema en reposo | -- | -- | 37 | 38 |
| Prime95 Stress | 3.6 - 3.8 | -- | 97 | 57 |
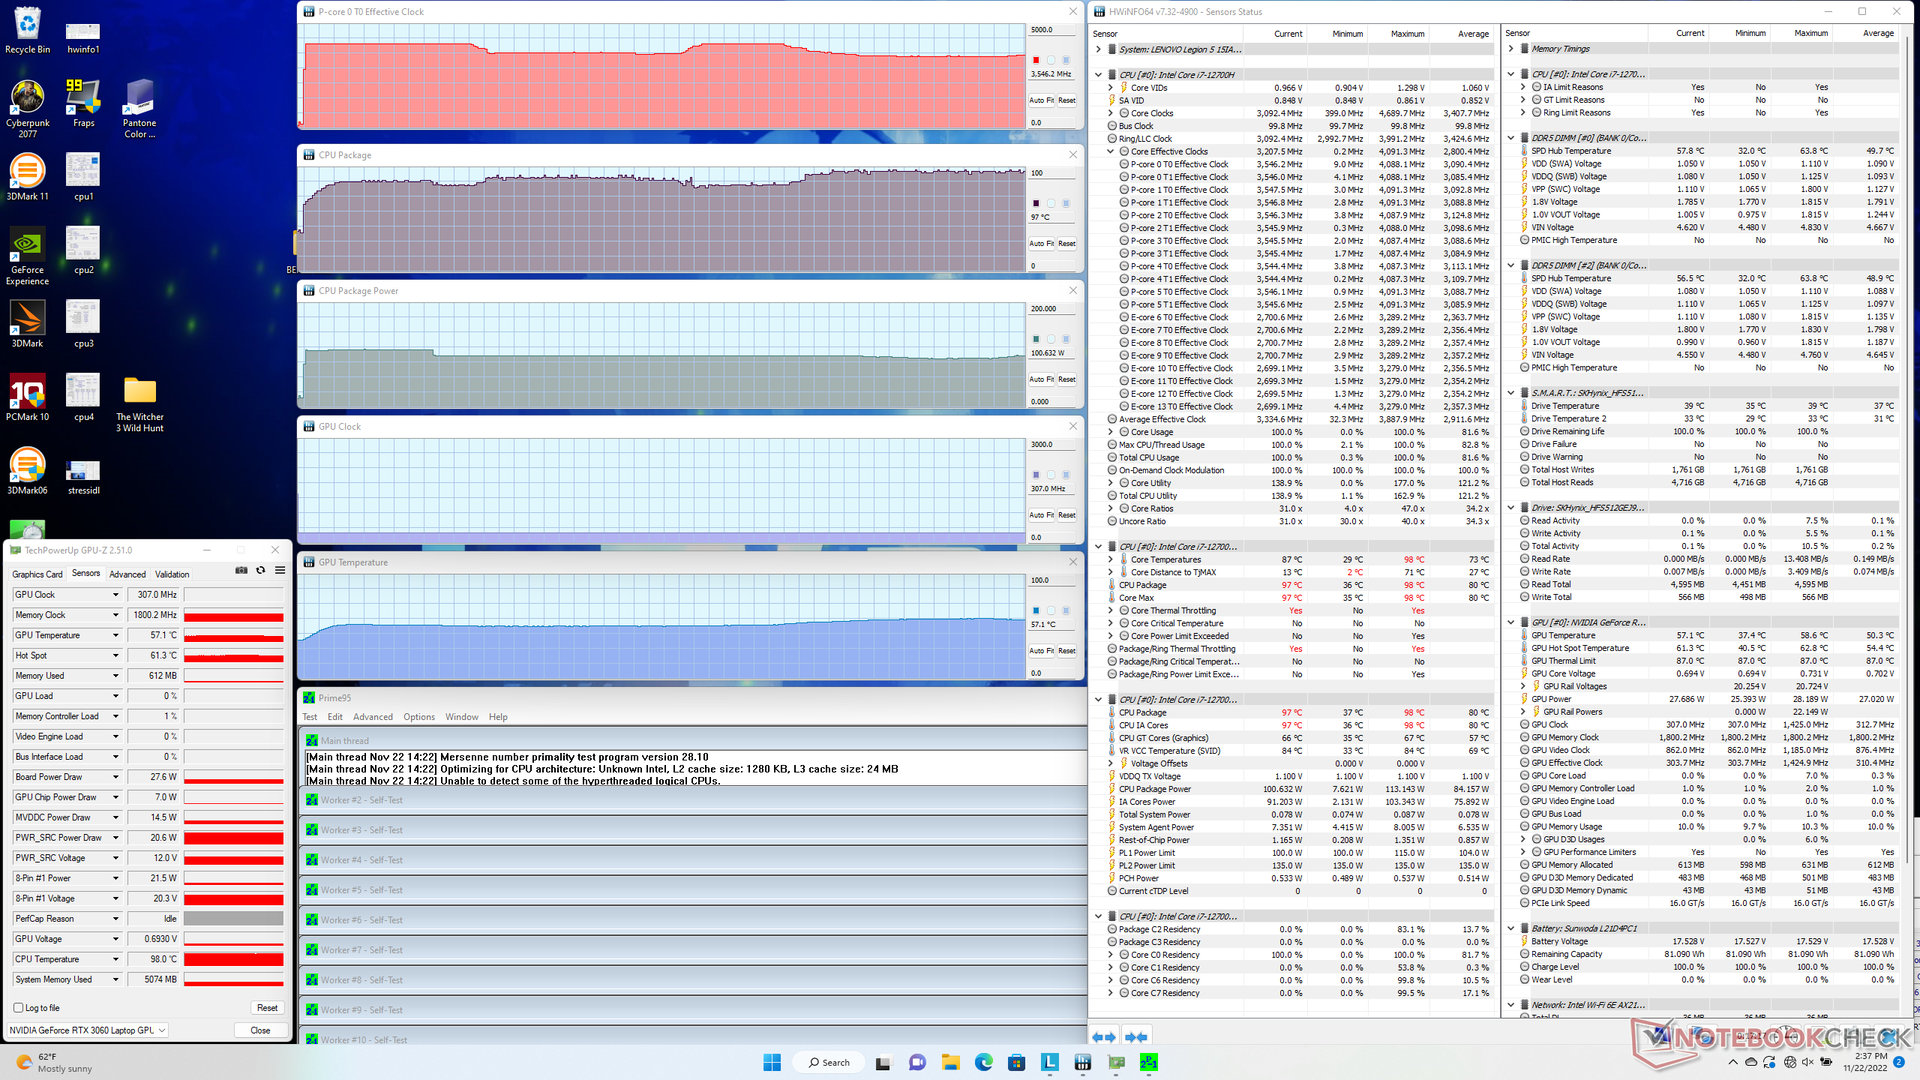
| Prime95+ FurMark Stress | 2.5 | 1597 - 2010 | 77 | 75 |
| Witcher 3 Estrés (modoequilibrado) | ~0,9 | 1665 | 67 | 70 |
| Witcher 3 Estrés (modorendimiento) | ~0,9 | 1972 | 64 | 76 |
Altavoces
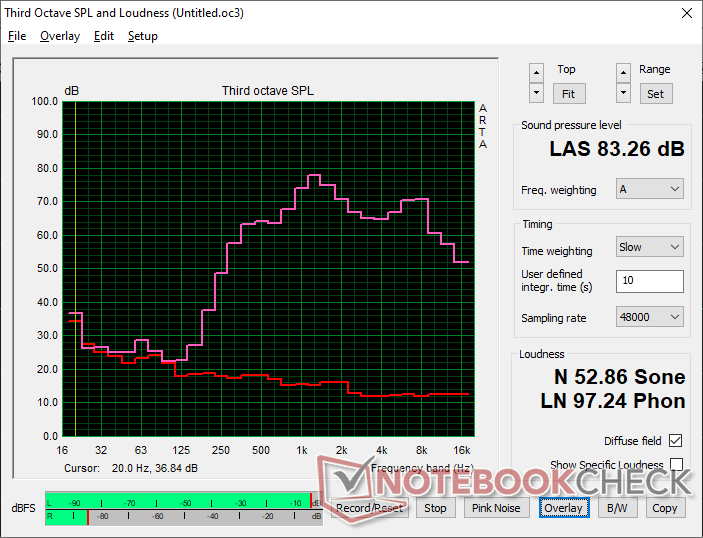
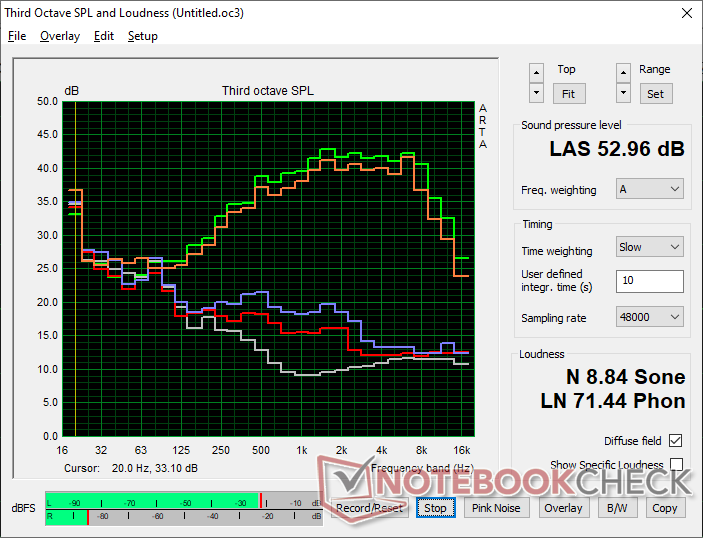
Lenovo Legion 5 15IAH7H 82RB análisis de audio
(+) | los altavoces pueden reproducir a un volumen relativamente alto (#83.3 dB)
Graves 100 - 315 Hz
(-) | casi sin bajos - de media 28.2% inferior a la mediana
(±) | la linealidad de los graves es media (12.9% delta a frecuencia anterior)
Medios 400 - 2000 Hz
(±) | medias más altas - de media 5.7% más altas que la mediana
(±) | la linealidad de los medios es media (7.4% delta respecto a la frecuencia anterior)
Altos 2 - 16 kHz
(+) | máximos equilibrados - a sólo 3.3% de la mediana
(+) | los máximos son lineales (6.4% delta a la frecuencia anterior)
Total 100 - 16.000 Hz
(±) | la linealidad del sonido global es media (23.6% de diferencia con la mediana)
En comparación con la misma clase
» 86% de todos los dispositivos probados de esta clase eran mejores, 4% similares, 10% peores
» El mejor tuvo un delta de 6%, la media fue 18%, el peor fue ###max##%
En comparación con todos los dispositivos probados
» 71% de todos los dispositivos probados eran mejores, 6% similares, 23% peores
» El mejor tuvo un delta de 4%, la media fue 24%, el peor fue ###max##%
Apple MacBook Pro 16 2021 M1 Pro análisis de audio
(+) | los altavoces pueden reproducir a un volumen relativamente alto (#84.7 dB)
Graves 100 - 315 Hz
(+) | buen bajo - sólo 3.8% lejos de la mediana
(+) | el bajo es lineal (5.2% delta a la frecuencia anterior)
Medios 400 - 2000 Hz
(+) | medios equilibrados - a sólo 1.3% de la mediana
(+) | los medios son lineales (2.1% delta a la frecuencia anterior)
Altos 2 - 16 kHz
(+) | máximos equilibrados - a sólo 1.9% de la mediana
(+) | los máximos son lineales (2.7% delta a la frecuencia anterior)
Total 100 - 16.000 Hz
(+) | el sonido global es lineal (4.6% de diferencia con la mediana)
En comparación con la misma clase
» 0% de todos los dispositivos probados de esta clase eran mejores, 0% similares, 100% peores
» El mejor tuvo un delta de 5%, la media fue 17%, el peor fue ###max##%
En comparación con todos los dispositivos probados
» 0% de todos los dispositivos probados eran mejores, 0% similares, 100% peores
» El mejor tuvo un delta de 4%, la media fue 24%, el peor fue ###max##%
Gestión de la energía - Exigencia bajo altas cargas de la CPU
Consumo de energía
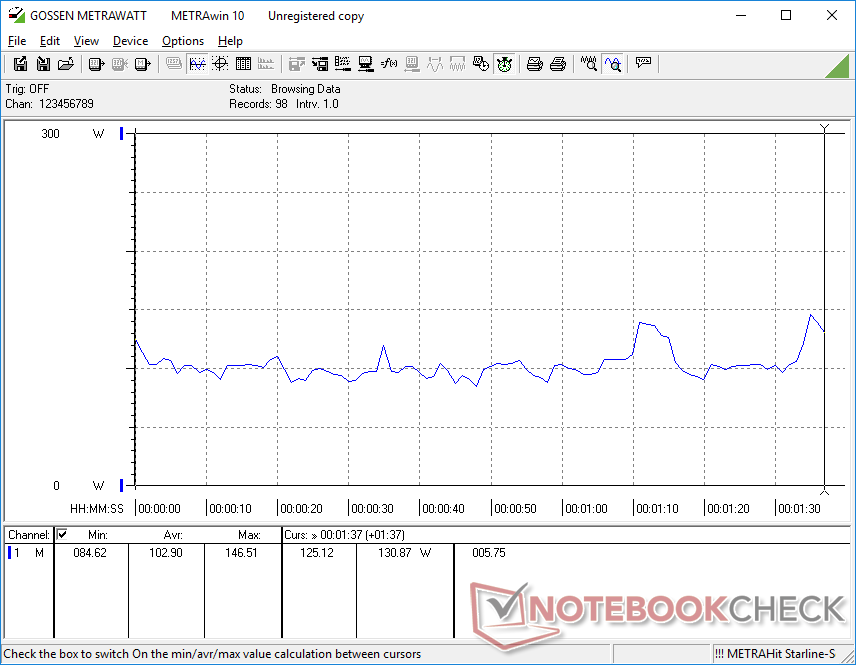
El sistema es inusualmente exigente cuando está en reposo en el escritorio. El consumo de energía oscila entre los 20 W en el ajuste de brillo y perfil de energía más bajos con gráficos híbridos y los 49 W en el ajuste de brillo y perfil de energía más altos con la dGPU activa. En cambio, el modelo 2021 oscilaría entre 7 W y 16 W.
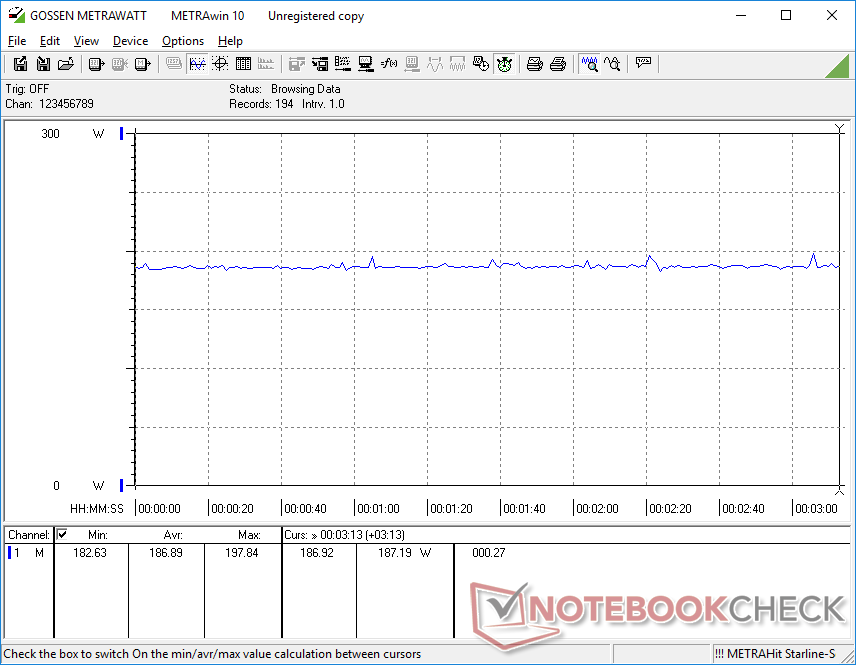
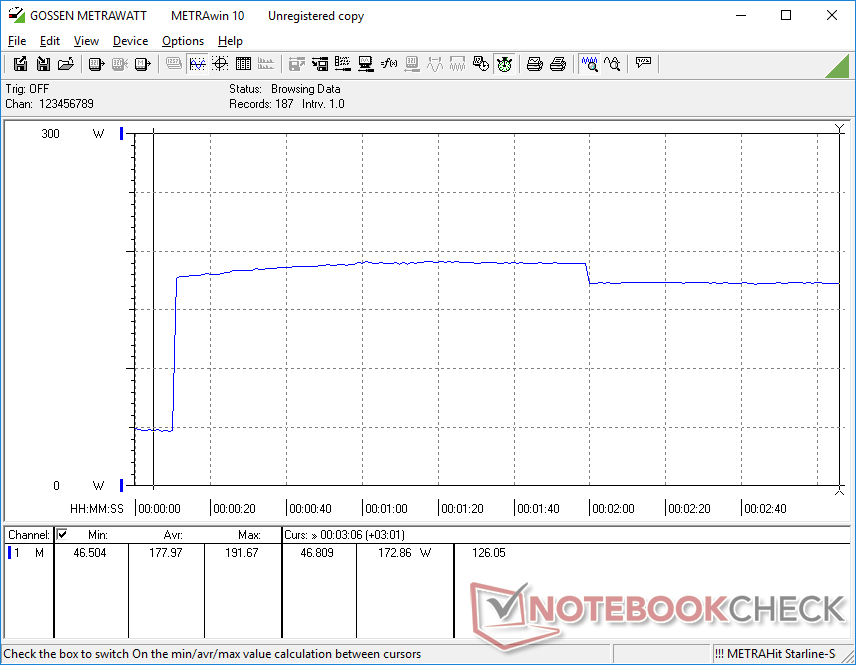
La ejecución de Witcher 3 exige unos 187 W frente a los 175 W del modelo del año pasado, lo que se corresponde con el objetivo de 10 W más de TGP de nuestro modelo de 2022.
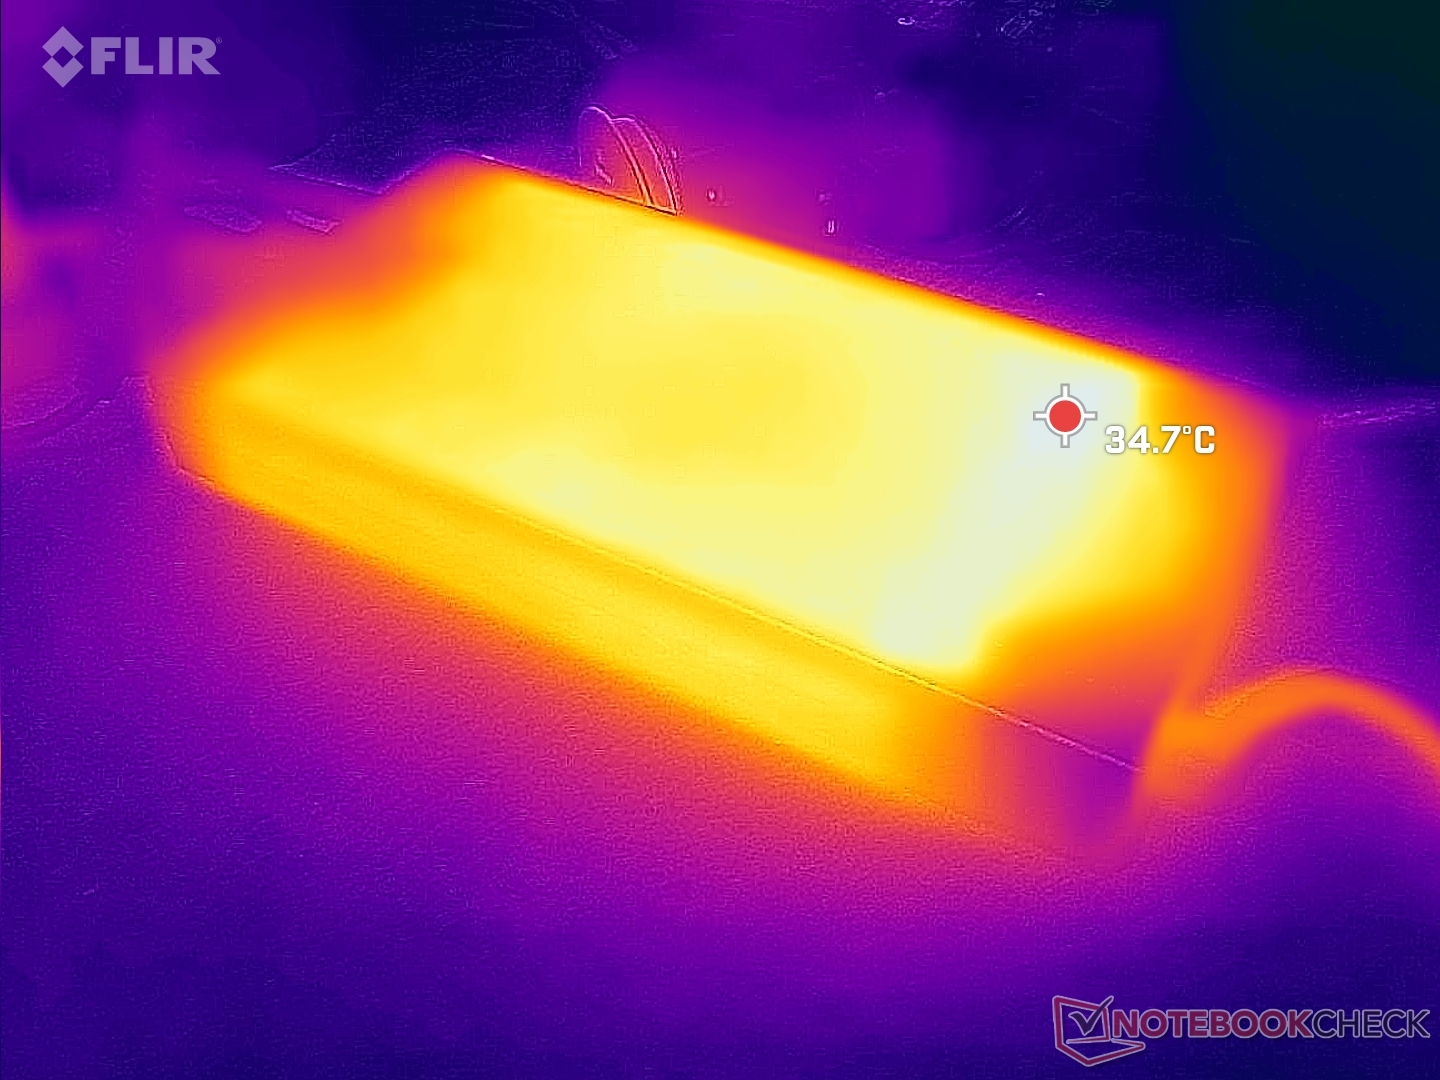
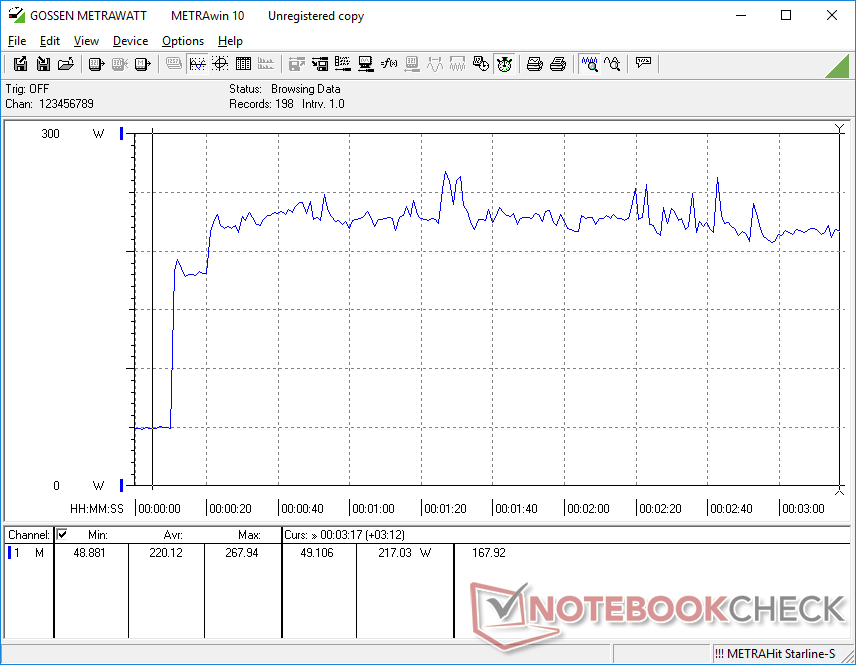
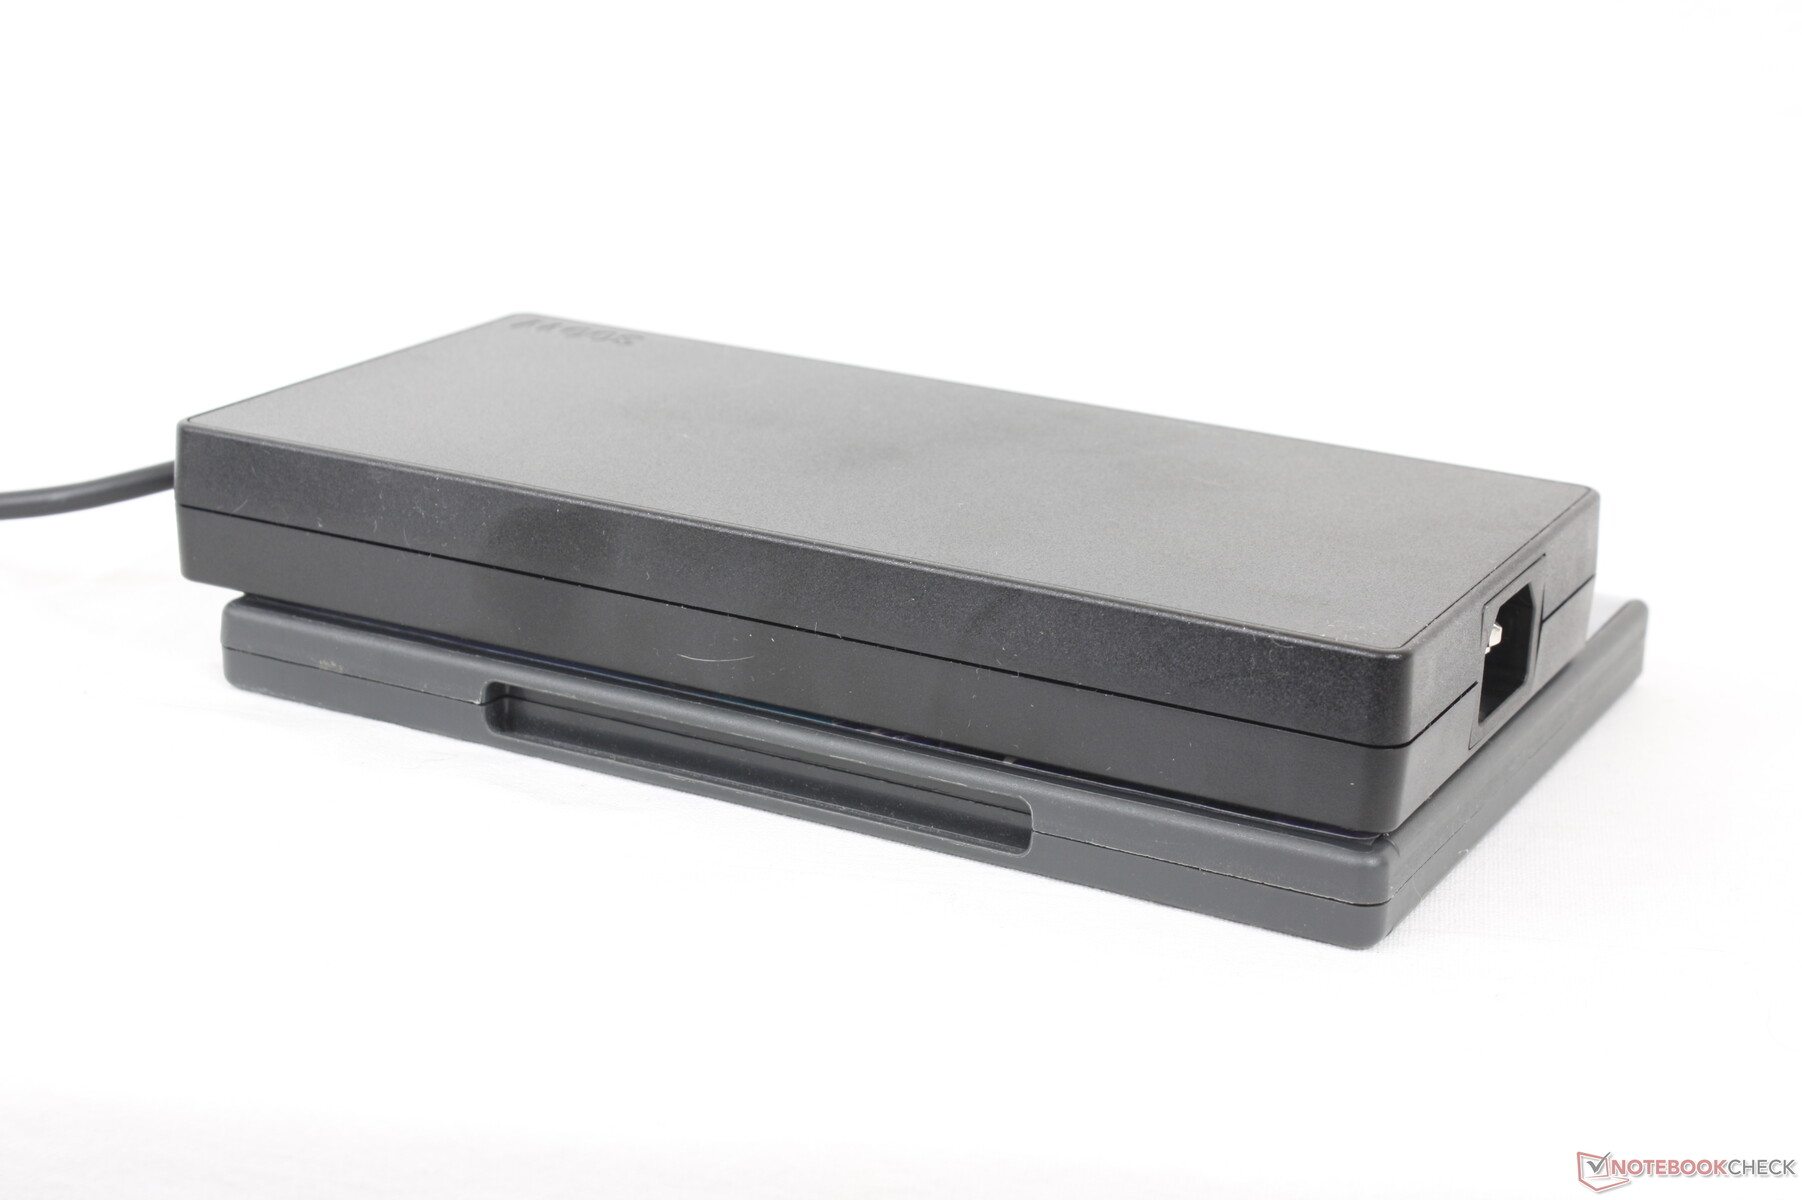
Registramos un consumo máximo de 268 W con el gran adaptador de CA de 300 W (~19,8 x 9,8 x 2,5 cm) cuando tanto la CPU como la GPU están al 100% de utilización. Este máximo es superior al de la mayoría de portátiles para juegos que funcionan con plataformas AMD o Intel de 10ª/11ª generación, ya que la serie Core de 12ª generación es mucho más exigente.
| Off / Standby | |
| Ocioso | |
| Carga |
|
Clave:
min: | |
| Lenovo Legion 5 15IAH7H 82RB i7-12700H, GeForce RTX 3060 Laptop GPU, , IPS, 1920x1080, 15.6" | Lenovo Legion 5 15ACH-82JU00C6GE-FL R7 5800H, GeForce RTX 3060 Laptop GPU, Micron 2300 512GB MTFDHBA512TDV, , 1920x1080, 15.6" | MSI Bravo 15 B5DD-010US R5 5600H, Radeon RX 5500M, Kingston OM8PCP3512F-AB, IPS, 1920x1080, 15.6" | Asus TUF Gaming F15 FX507ZM i7-12700H, GeForce RTX 3060 Laptop GPU, SK Hynix HFM001TD3JX013N, IPS, 1920x1080, 15.6" | Acer Aspire Nitro 5 AN515-55-57GF i5-10300H, GeForce RTX 3060 Laptop GPU, WDC PC SN530 SDBPNPZ-512G, IPS, 1920x1080, 15.6" | Razer Blade 15 Base Edition 2021, i7-10750H RTX 3060 i7-10750H, GeForce RTX 3060 Laptop GPU, Samsung SSD PM981a MZVLB512HBJQ, IPS, 1920x1080, 15.6" | |
|---|---|---|---|---|---|---|
| Power Consumption | 34% | 53% | 31% | 49% | 29% | |
| Idle Minimum * (Watt) | 19.8 | 7.3 63% | 6.6 67% | 6.3 68% | 5 75% | 11.7 41% |
| Idle Average * (Watt) | 26.2 | 10.5 60% | 9.8 63% | 9.8 63% | 9 66% | 16 39% |
| Idle Maximum * (Watt) | 48.2 | 15.7 67% | 10.8 78% | 26.5 45% | 13 73% | 29.3 39% |
| Load Average * (Watt) | 102.9 | 108 -5% | 70.5 31% | 103.8 -1% | 84 18% | 95.6 7% |
| Witcher 3 ultra * (Watt) | 186.7 | 175 6% | 103.2 45% | 189 -1% | 125 33% | 141.3 24% |
| Load Maximum * (Watt) | 268 | 228 15% | 175 35% | 241.9 10% | 190 29% | 197 26% |
* ... más pequeño es mejor
Power Consumption Witcher 3 / Stresstest
Power Consumption external Monitor
Duración de la batería
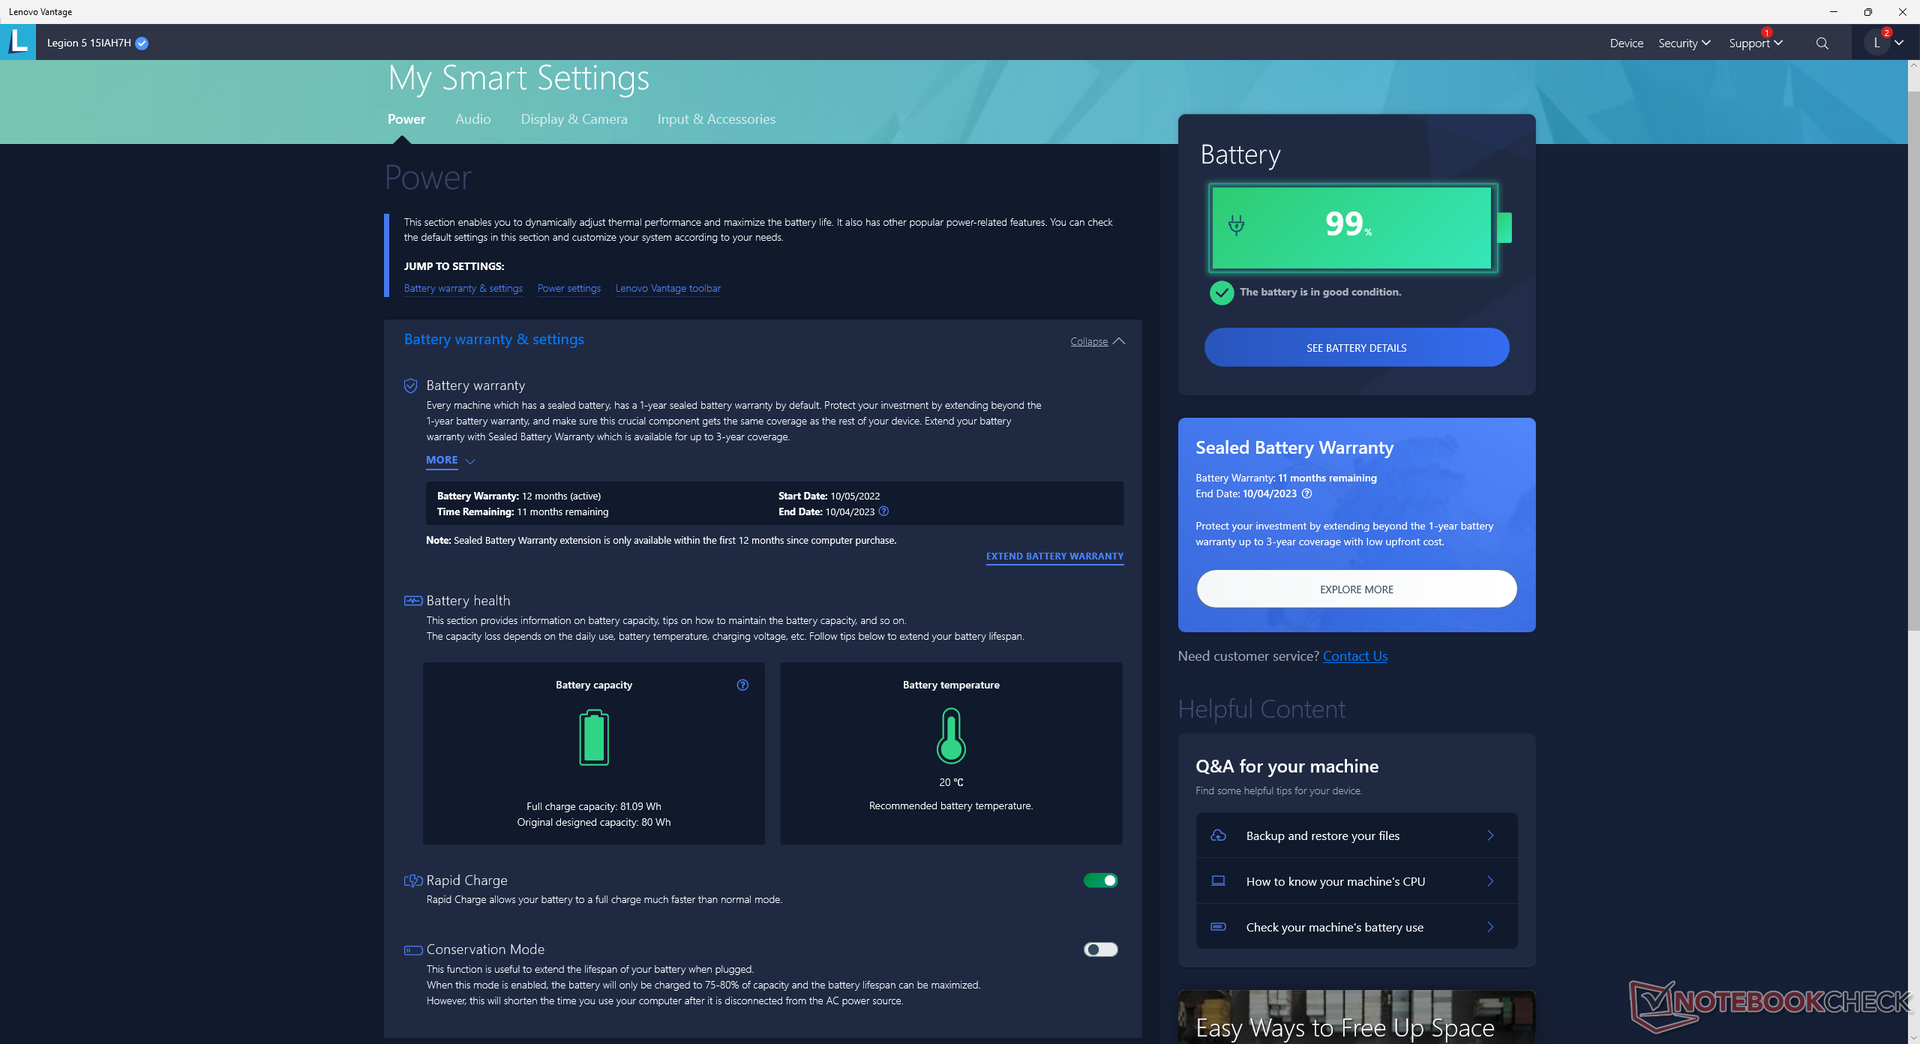
La duración de la WLAN es más o menos la misma que en el modelo del año pasado, ya que la capacidad de la batería sigue siendo de 80 Wh. La carga desde el vacío hasta la capacidad total sólo lleva 35 minutos cuando se activa la carga rápida, comparado con las 1,5 a 2 horas de la mayoría de los otros portátiles.
La carga por USB-C sólo es compatible con el puerto USB-C trasero. Sin embargo, la carga sólo puede ser compatible con el cargador USB-C opcional de Lenovo y no con la mayoría de cargadores de terceros. Probamos tres cargadores USB-C distintos (30 W, 100 W y 130 W), pero sólo funcionó el de 130 W de Lenovo.
Algunas versiones vienen con una batería más pequeña de 60 Wh en vez de la de 80 Wh.
| Lenovo Legion 5 15IAH7H 82RB i7-12700H, GeForce RTX 3060 Laptop GPU, 80 Wh | Lenovo Legion 5 15ACH-82JU00C6GE-FL R7 5800H, GeForce RTX 3060 Laptop GPU, 80 Wh | MSI Bravo 15 B5DD-010US R5 5600H, Radeon RX 5500M, 53 Wh | Asus TUF Gaming F15 FX507ZM i7-12700H, GeForce RTX 3060 Laptop GPU, 90 Wh | Acer Aspire Nitro 5 AN515-55-57GF i5-10300H, GeForce RTX 3060 Laptop GPU, 57.5 Wh | Razer Blade 15 Base Edition 2021, i7-10750H RTX 3060 i7-10750H, GeForce RTX 3060 Laptop GPU, 65 Wh | |
|---|---|---|---|---|---|---|
| Duración de Batería | 30% | 10% | 30% | 25% | 9% | |
| Reader / Idle (h) | 8.1 | 9.2 14% | 15.8 95% | 7.8 -4% | ||
| WiFi v1.3 (h) | 5 | 4.8 -4% | 6.3 26% | 4.8 -4% | 5.7 14% | 4.8 -4% |
| Load (h) | 1.1 | 1.8 64% | 1 -9% | 1.1 0% | 1.5 36% | 1.5 36% |
| H.264 (h) | 4.3 | 6.2 |
Pro
Contra
Veredicto - Gran tamaño, gran rendimiento
El aspecto más sorprendente del 2022 Legion 5 15 es su rendimiento superior a la media. Aunque ya hemos probado muchos portátiles para juegos con el Core i7-12700H CPU y GeForce RTX 3060 GPU, este modelo de Lenovo funciona a velocidades de reloj notablemente más altas para un mayor rendimiento que muchos competidores equipados con el mismo hardware. Si te preocupa comprar accidentalmente un portátil con hardware infrautilizado, el Legion 5 15 disipará esas preocupaciones.
El 2022 Lenovo Legion 5 15 destaca por maximizar el rendimiento en un chasis casi semiprofesional con mínimas luces RGB. Sin embargo, es bastante grande y pesado, y algunos aspectos auxiliares podrían mejorar.
El rendimiento extra se consigue a costa de un chasis más pesado y grande. La gran parte trasera que sobresale es difícil de ignorar y competidores como el Asus TUF Gaming F15 FX507ZM o el Razer Blade 15 Base Model son cada uno notablemente más ligero. Si viajas mucho, puede que el mayor rendimiento no merezca la pena por el mayor peso. El voluminoso adaptador de CA de 300 W tampoco hace que el Lenovo sea muy fácil de viajar.
Para futuros modelos, nos gustaría ver mejoras en el esponjoso clickpad, la calidad pixelada de la webcam, el pobre soporte de carga USB-C de terceros y las pequeñas bisagras. Esto último en particular ayudaría a justificar el chasis más pesado en comparación con la competencia.
Precio y disponibilidad
Lenovo ya está comercializando su serie Legion 5 15 a partir de $1100 a $1900 USD dependiendo de la configuración. Nuestra configuración de prueba específica se envía actualmente por $1350.
Lenovo Legion 5 15IAH7H 82RB
- 11/25/2022 v7 (old)
Allen Ngo
Price comparison

