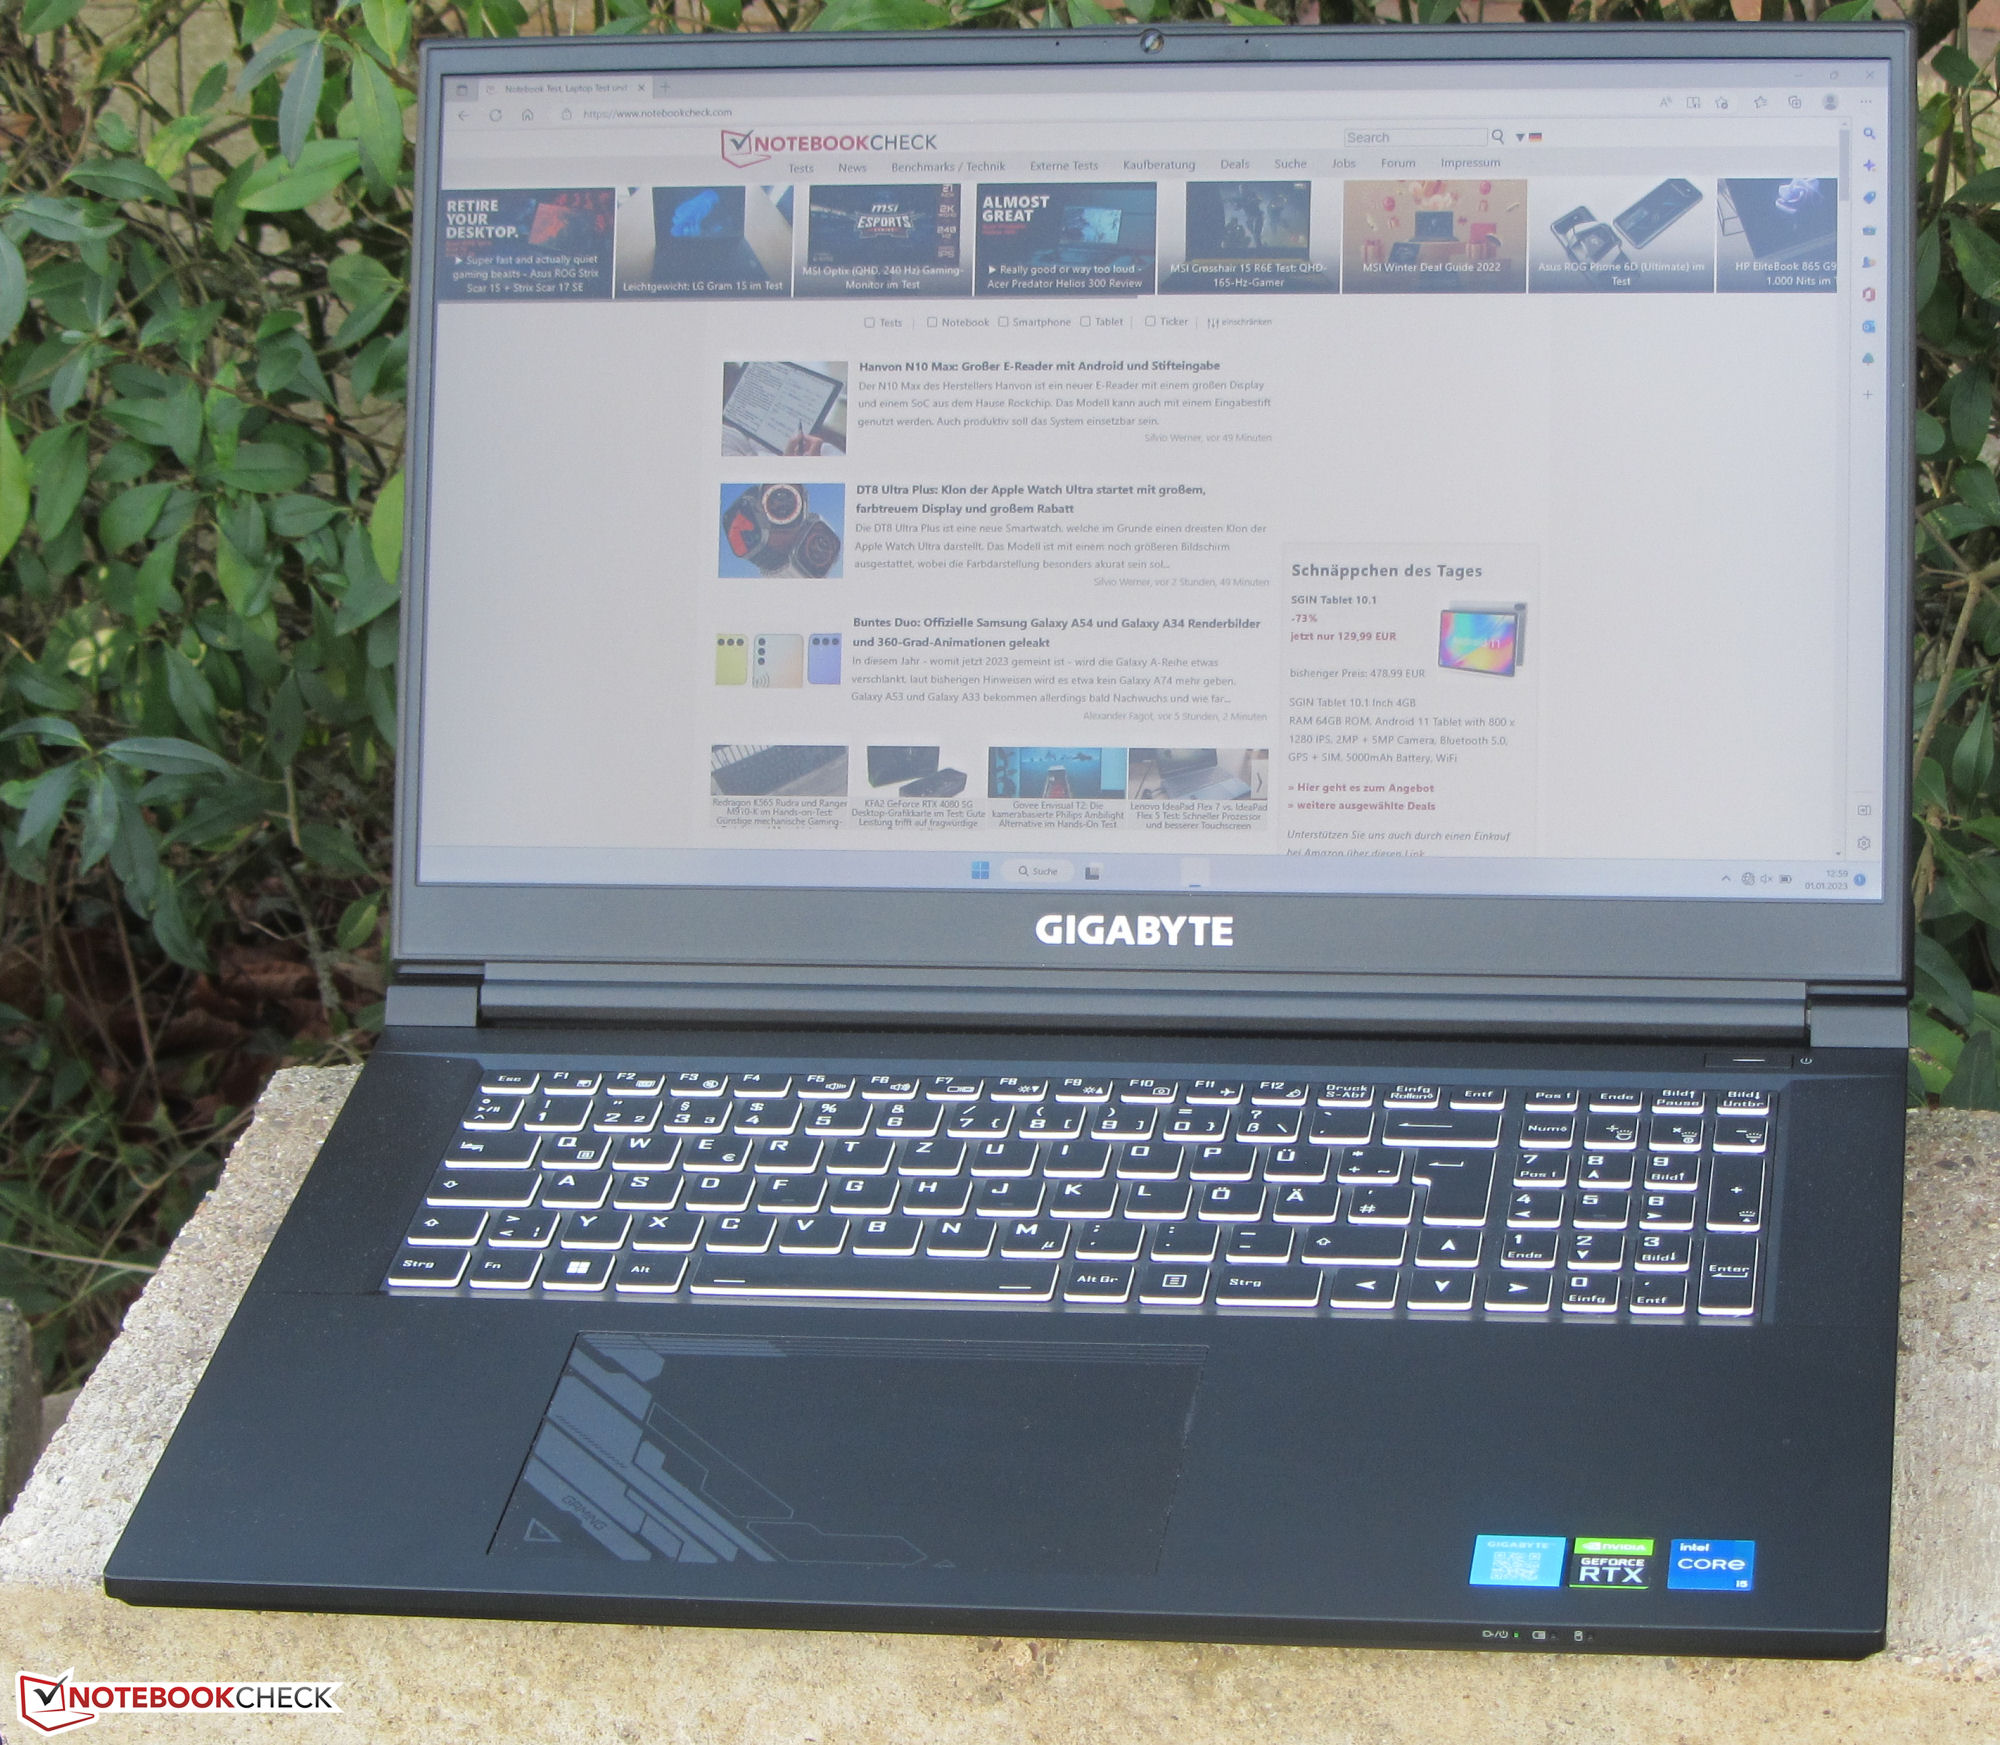
Análisis del Gigabyte G7 KE: Portátil de juegos asequible con una potente RTX 3060
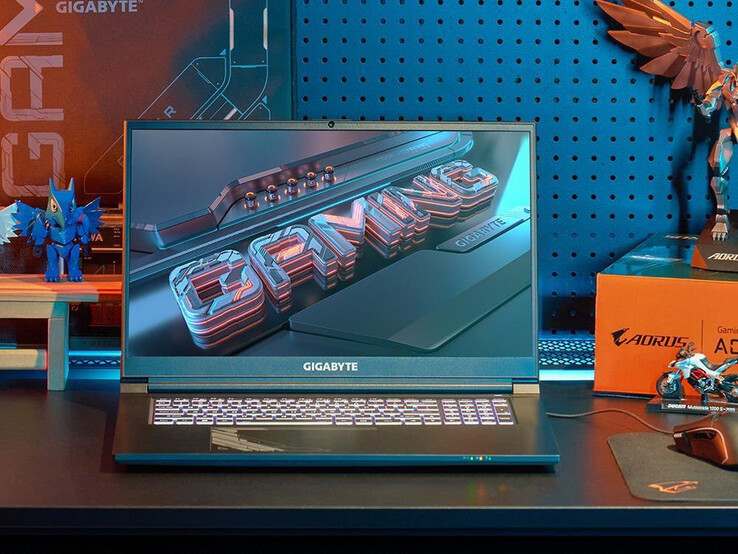
El G7 KE es un portátil gaming de 17,3 pulgadas de la gama baja de precios. Gigabyte combina una CPU Core i5 Alder Lake con un procesador RTX 3060 Por unos 1200 Euros. Modelos más baratos con una GeForce RTX 3050 (G7 GE) o GeForce RTX 3050 Ti (G7 ME). Entre los competidores se encuentran dispositivos como el HP Pavilion Gaming 17, Acer Nitro 5 AN517-55, Lenovo IdeaPad Gaming 3 15IAH7 o el Asus TUF Gaming F17 FX707Z.
Posibles contendientes en la comparación
Valoración | Fecha | Modelo | Peso | Altura | Tamaño | Resolución | Precio |
|---|---|---|---|---|---|---|---|
| 83.3 % v7 (old) | 01/2023 | Gigabyte G7 KE i5-12500H, GeForce RTX 3060 Laptop GPU | 2.6 kg | 25 mm | 17.30" | 1920x1080 | |
| 82.7 % v7 (old) | 09/2022 | HP Pavilion Gaming 17-cd2146ng i5-11300H, GeForce RTX 3050 Ti Laptop GPU | 2.8 kg | 25 mm | 17.30" | 1920x1080 | |
| 83.9 % v7 (old) | 08/2022 | Acer Nitro 5 AN517-55-738R i7-12700H, GeForce RTX 3060 Laptop GPU | 3.1 kg | 28.6 mm | 17.30" | 1920x1080 | |
| 84.1 % v7 (old) | 04/2022 | Asus TUF Gaming F17 FX707Z-HX011W i7-12700H, GeForce RTX 3060 Laptop GPU | 2.5 kg | 25 mm | 17.30" | 1920x1080 | |
| 82.8 % v7 (old) | 10/2022 | Lenovo IdeaPad Gaming 3 15IAH7 i5-12500H, GeForce RTX 3050 Ti Laptop GPU | 2.4 kg | 26 mm | 15.60" | 1920x1080 |
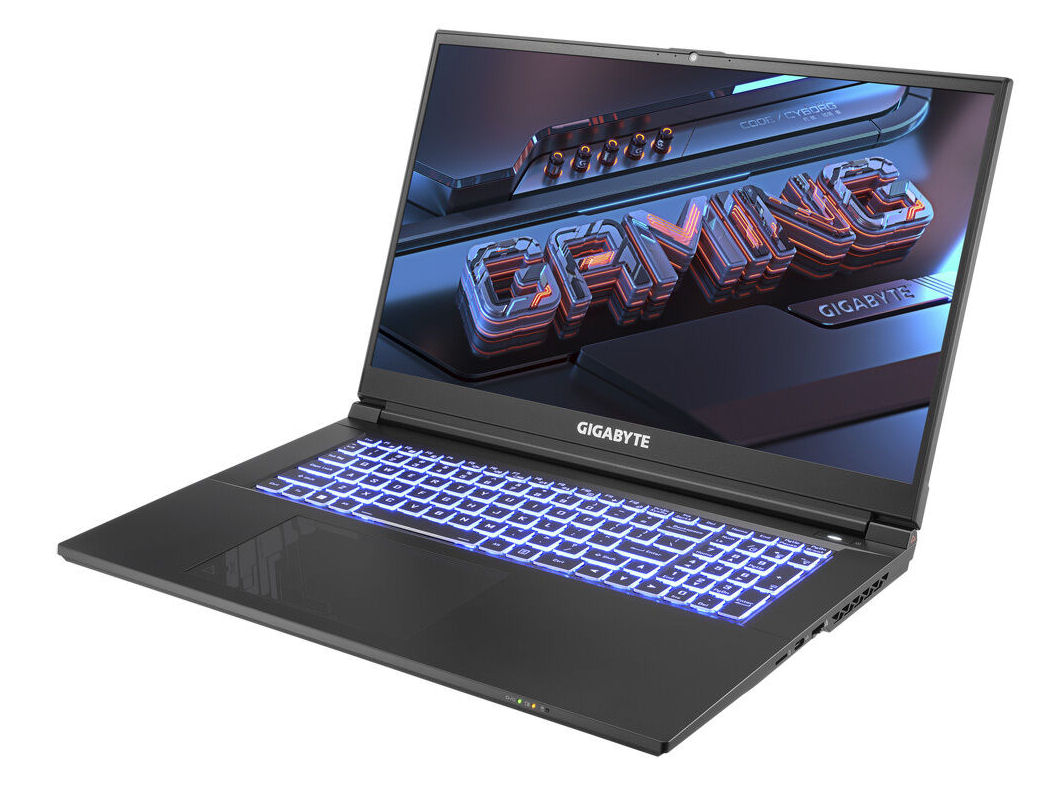
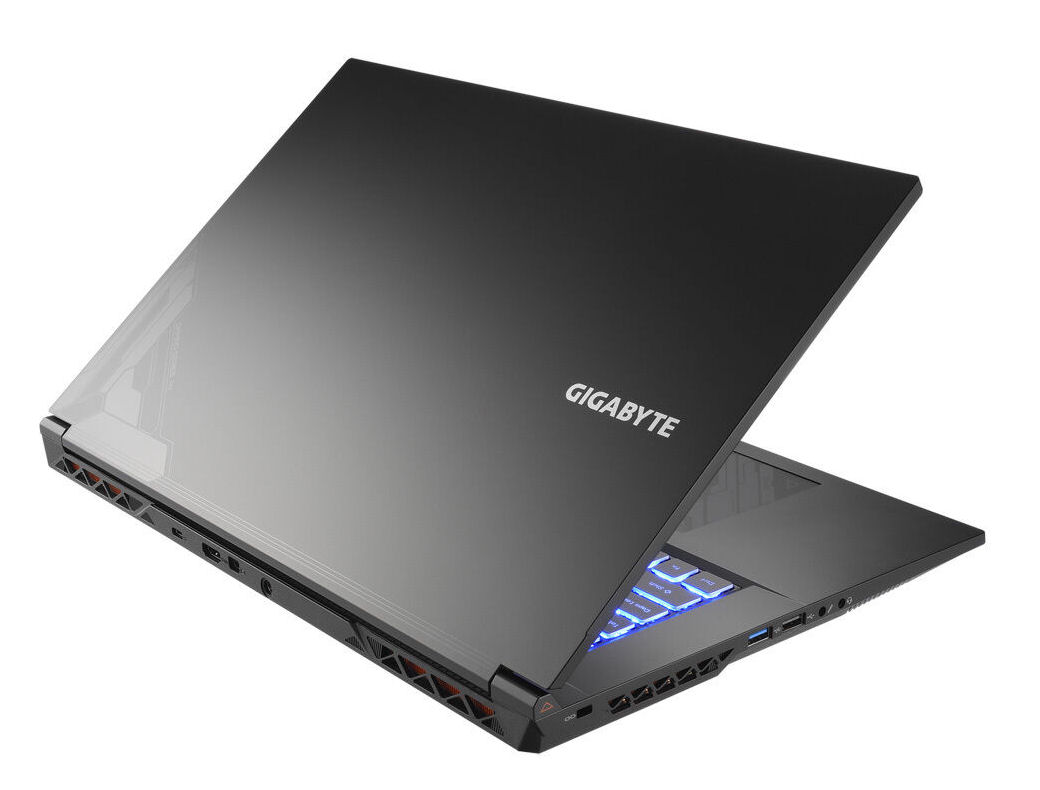
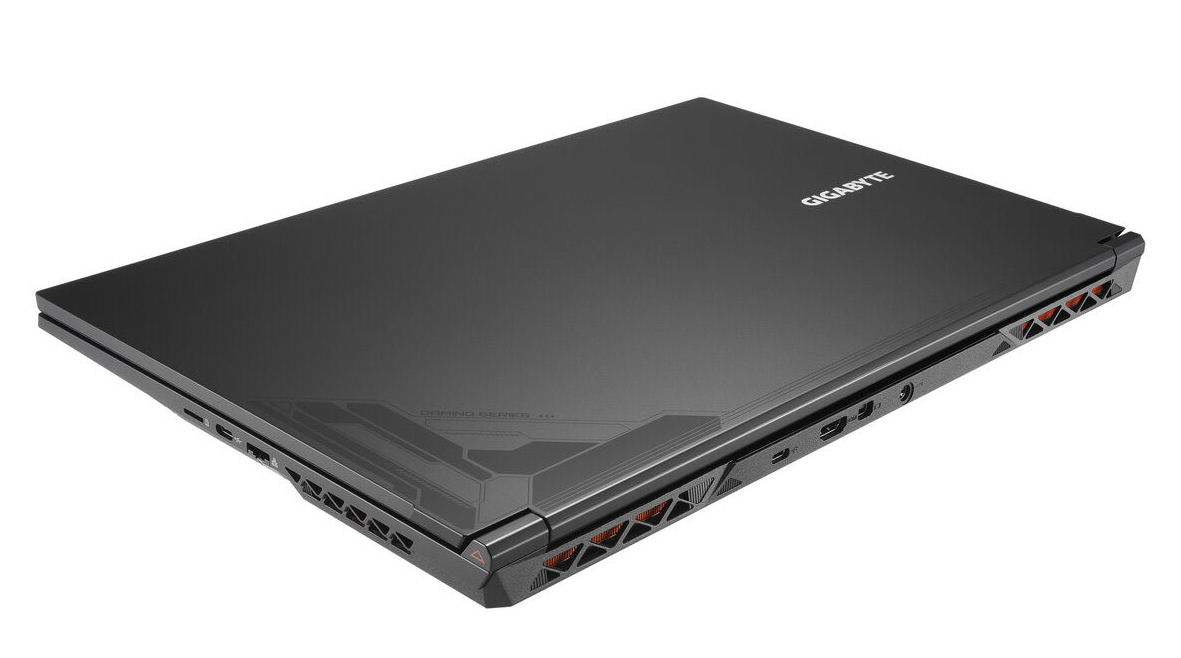
Maletín - G7 con chasis de plástico
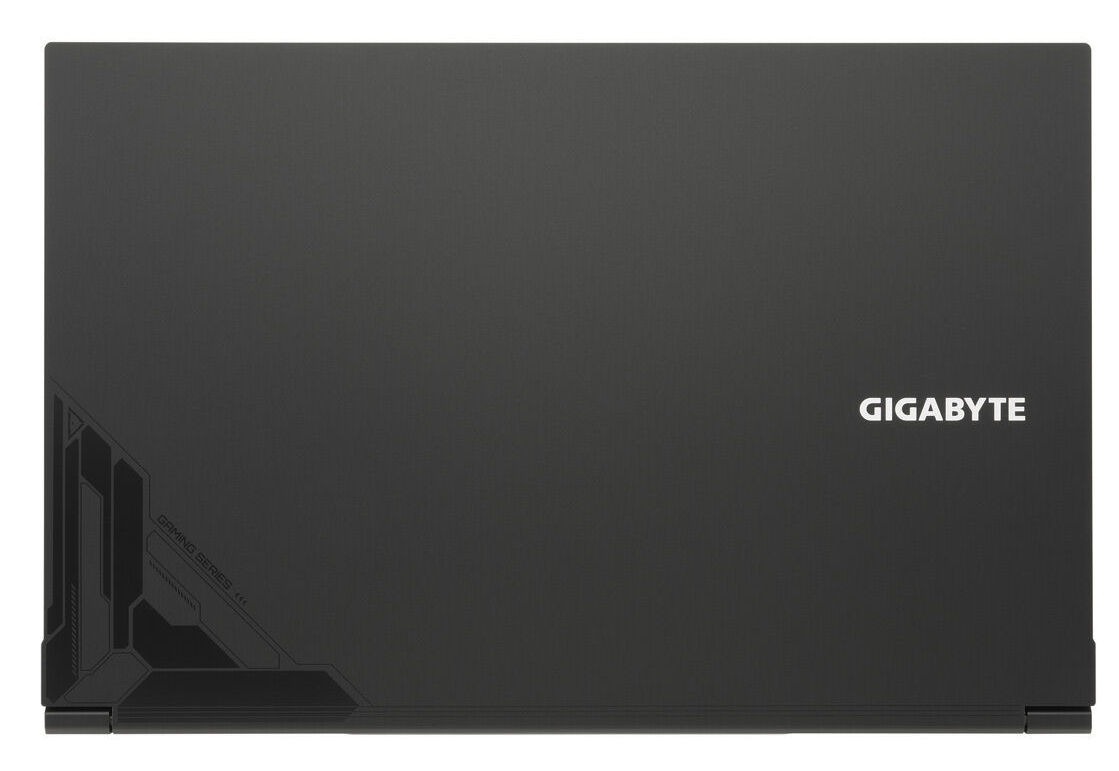
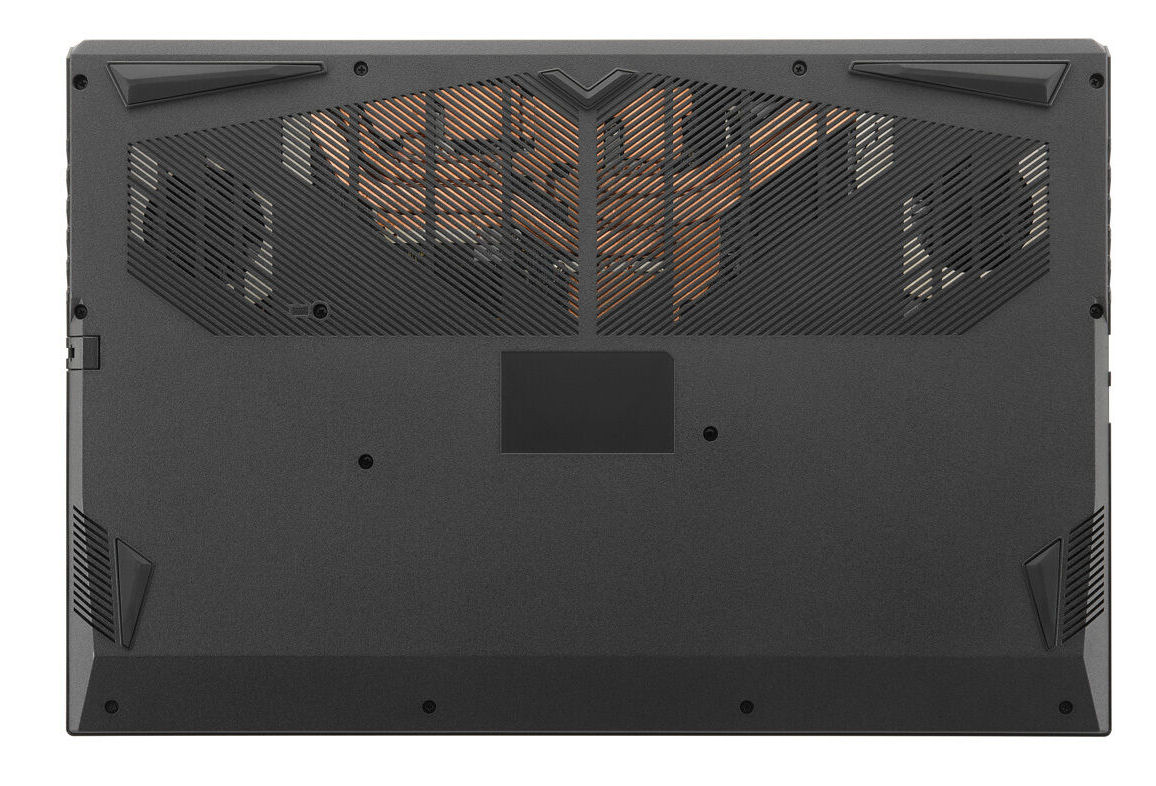
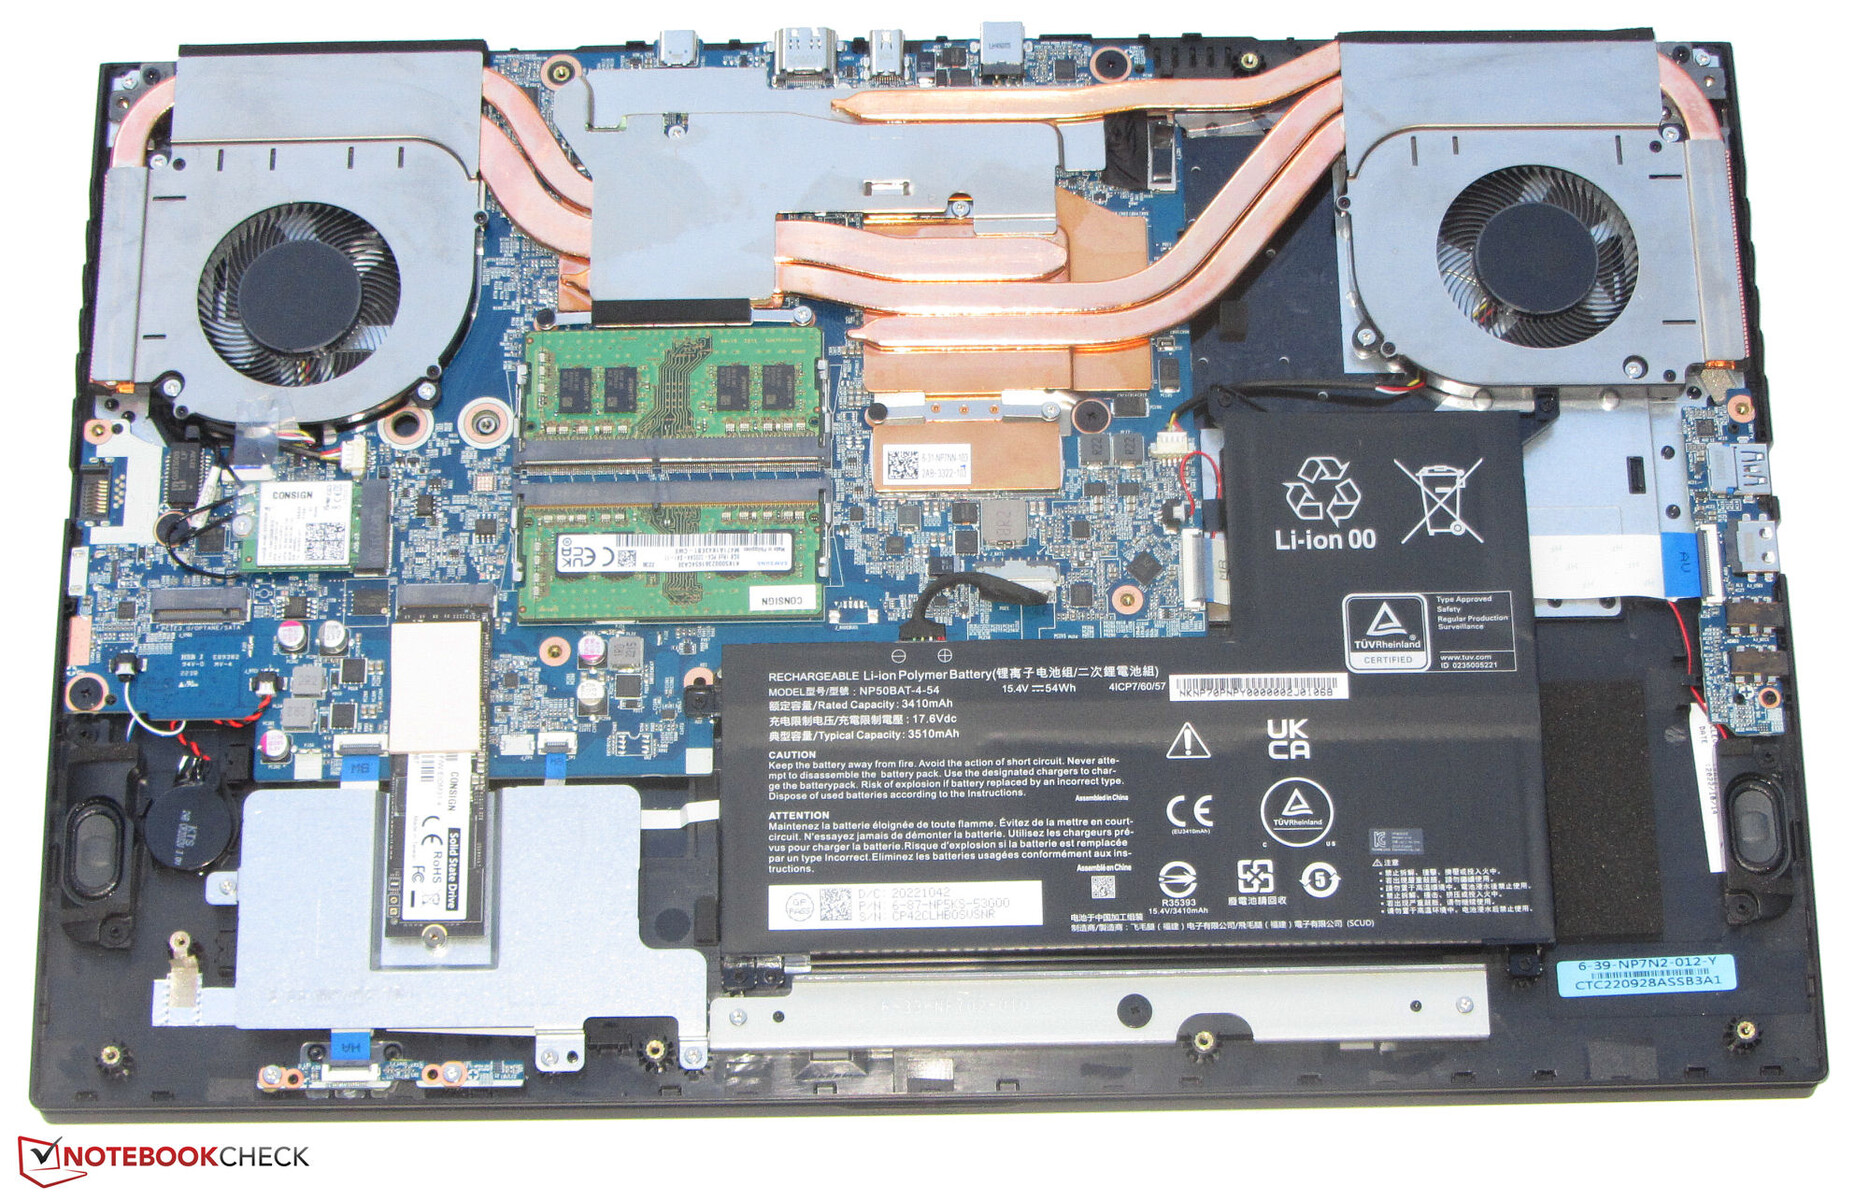
Gigabyte no usa materiales premium para el chasis del G7. En vez de eso, el fabricante apuesta por plástico negro con superficies lisas y mates. Hay unos pocos acentos sutiles, visuales, negros y grises impresos en la trasera de la tapa y el clickpad. Por lo demás, el diseño del chasis es muy sencillo y podría describirse como "funcional". Se puede acceder a la batería (atornillada, no pegada) y a los demás componentes internos tras retirar la placa inferior.
La calidad de construcción del chasis no merece ninguna crítica. Las holguras son ajustadas y no hay exceso de material que sobresalga. Aunque la unidad base se puede torcer por las esquinas, esto no debería ser un problema durante el uso diario. Sin embargo, la rigidez de la tapa deja algo que desear. Aunque las bisagras mantienen la pantalla firmemente en su lugar, permiten cierto tambaleo. La pantalla se puede abrir hasta un ángulo máximo de unos 140 grados. Es posible abrir la tapa con una sola mano.

El G7 es uno de los dispositivos de 17,3 pulgadas más compactos y ligeros de nuestra comparativa. Sólo el Asus TUF Gaming F17 logra superarlo por un pequeño margen.
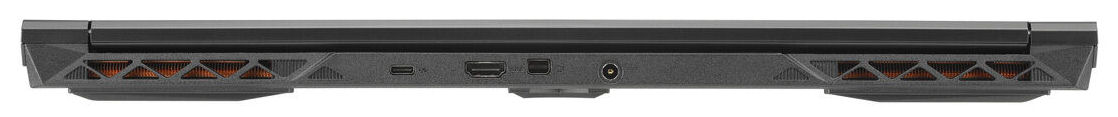
Conectividad - Portátil Gigabyte con Thunderbolt 4
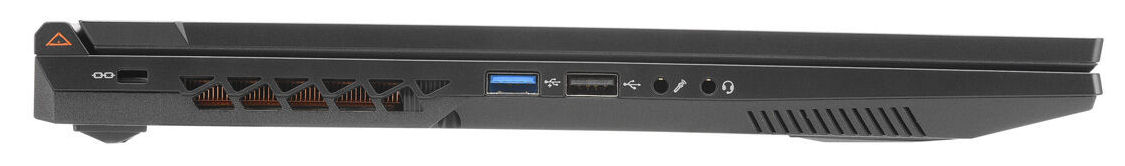
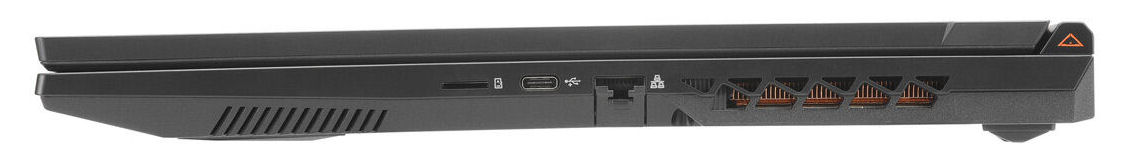
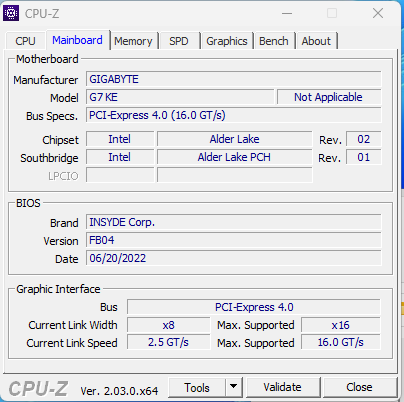
El G7 viene con dos puertos USB-A (1x USB 2.0, 1x USB 3.2 gen. 1) y dos puertos USB-C (1x USB 3.2 gen. 2, 1x Thunderbolt 4). Las interfaces tipo-C no soportan Power Delivery y sólo el puerto TB4 soporta DisplayPort por USB-C. Combinado con el puerto HDMI (2.1) y el Mini DisplayPort dedicado (1.4), suman un total de tres salidas de vídeo.
Los puertos del G7 están distribuidos por tres lados del portátil. Las dos salidas de vídeo dedicadas se encuentran en la parte trasera del dispositivo. Así, los cables conectados discurren por la parte trasera y no estorban. No ocurre lo mismo con los cables Ethernet: El puerto se encuentra en el borde derecho del modelo.
Lector de tarjetas SD
El rendimiento del lector de tarjetas microSD (tarjeta de referencia: AV Pro SD microSD 128 GB V60) es medio, con lecturas secuenciales a unos 89 MB/s.
| SD Card Reader | |
| average JPG Copy Test (av. of 3 runs) | |
| Media de la clase Gaming (20.9 - 210, n=54, últimos 2 años) | |
| HP Pavilion Gaming 17-cd2146ng (AV PRO microSD 128 GB V60) | |
| maximum AS SSD Seq Read Test (1GB) | |
| Media de la clase Gaming (25.5 - 261, n=51, últimos 2 años) | |
| Gigabyte G7 KE (AV PRO microSD 128 GB V60) | |
Comunicación
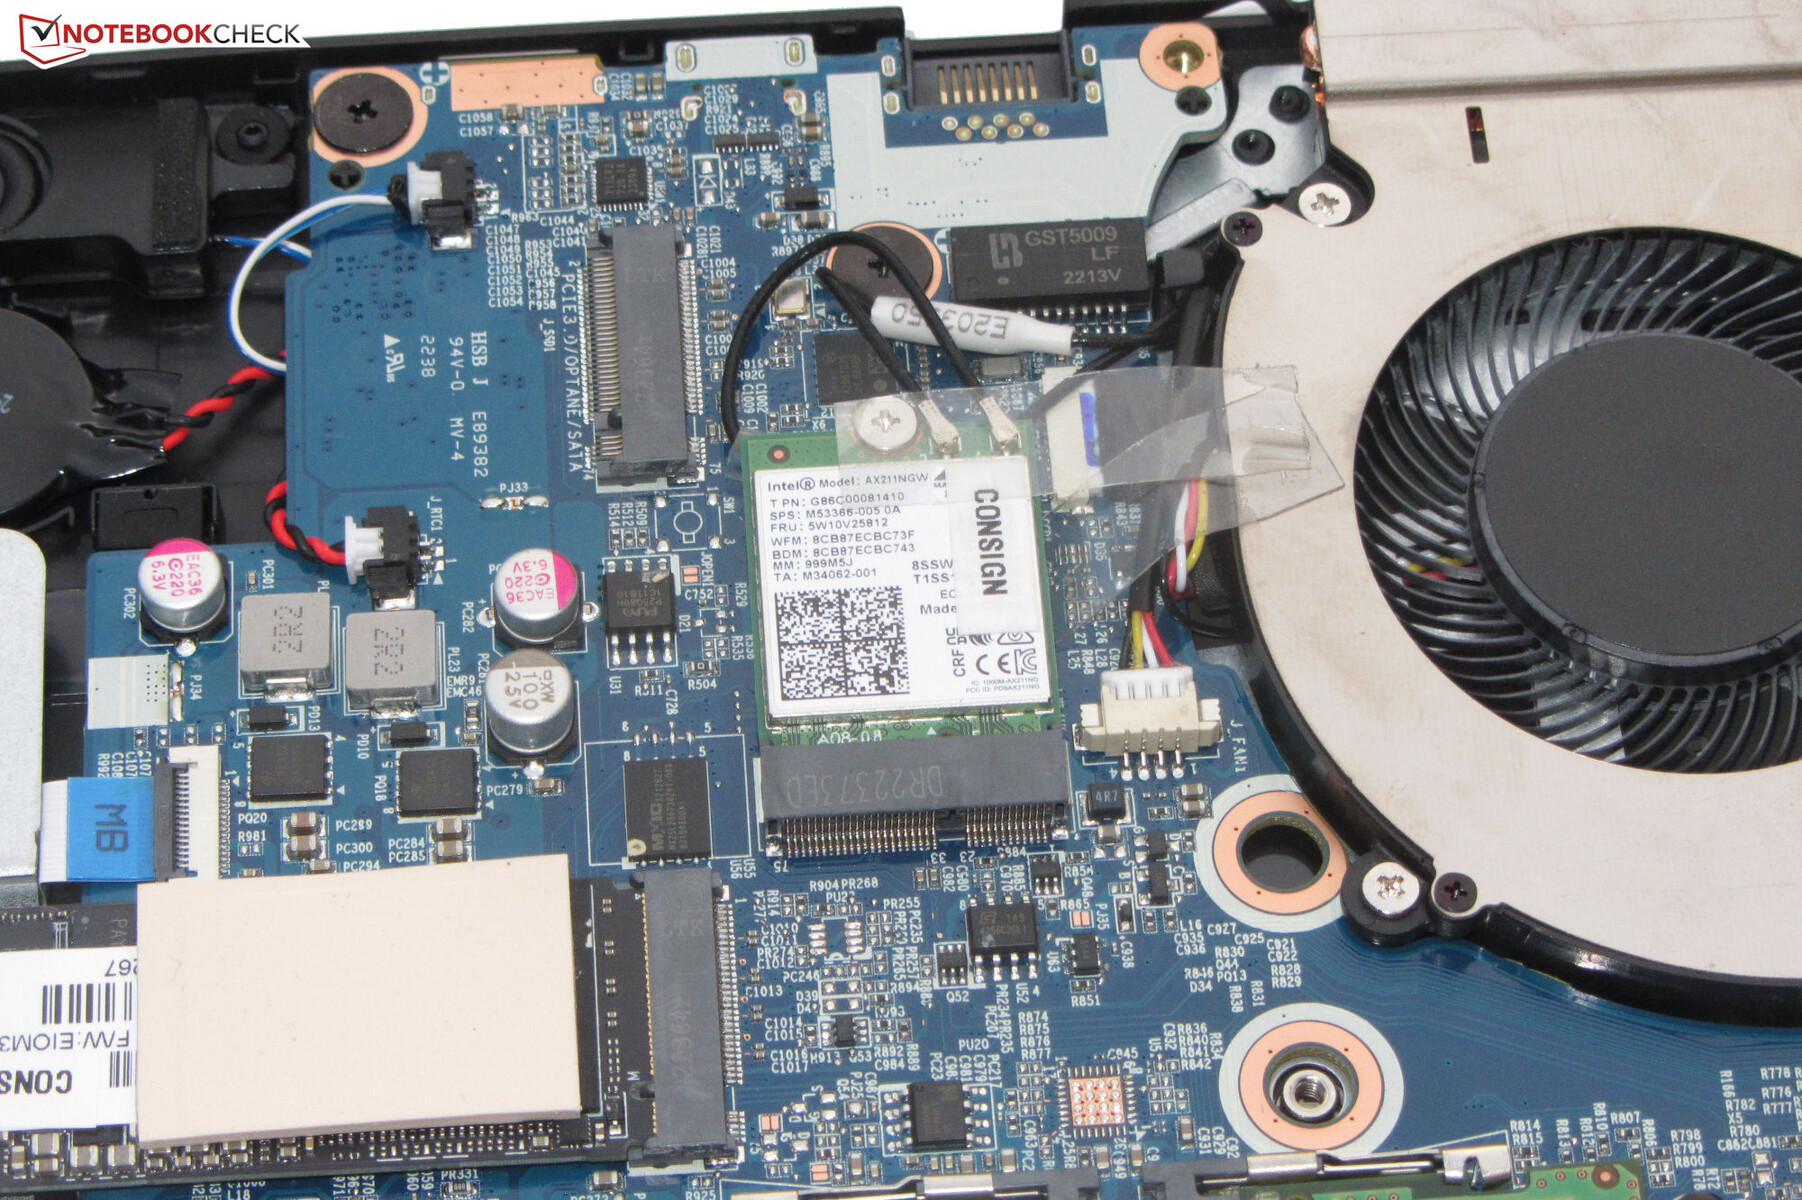
En condiciones ideales (sin otros dispositivos Wi-Fi cerca, corta distancia entre el portátil y el servidor), las velocidades de transferencia Wi-Fi son excelentes y agotan más o menos las capacidades del módulo Wi-Fi (Intel AX211; Wi-Fi 6E, 802.11ax). Mientras tanto, una interfaz Gigabit Ethernet (I-219V) de Intel se encarga de la conexión en red por cable.
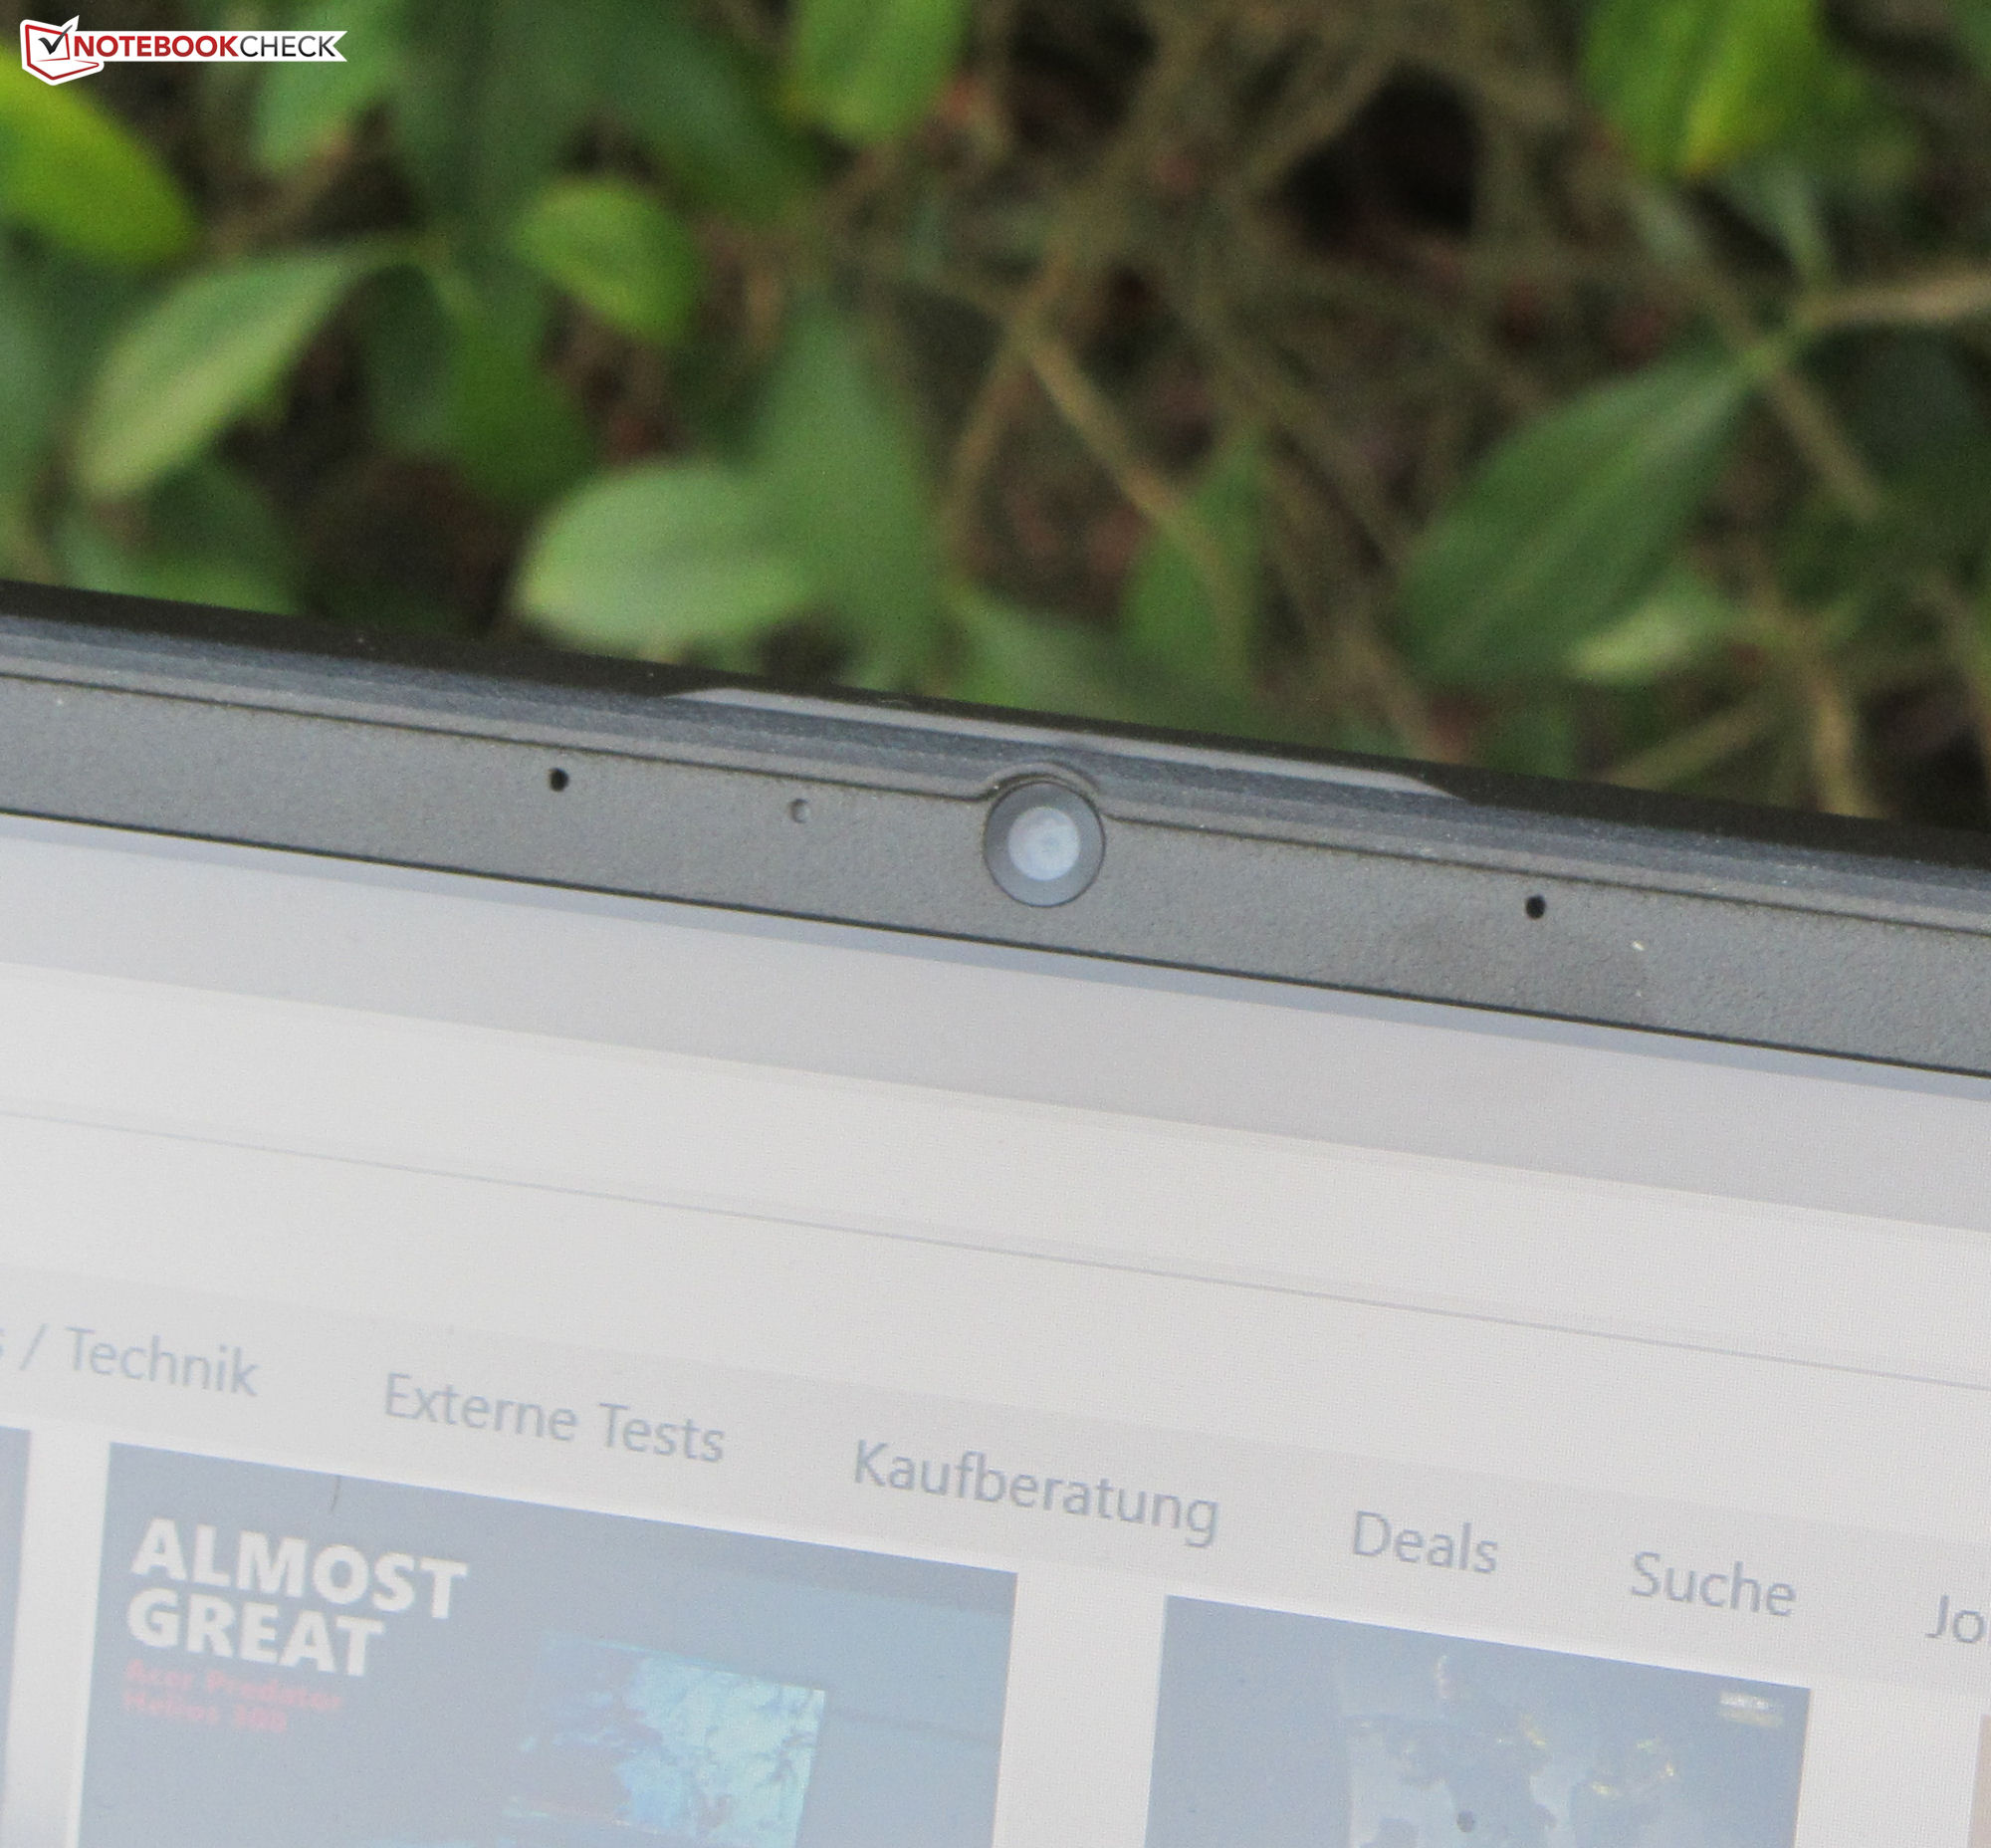
Cámara web
La webcam (0,9 MP) captura imágenes con una resolución máxima de 1280 x 720 píxeles. La cámara produce resultados decentes con una desviación general del color relativamente baja. La cámara no está equipada con un obturador mecánico para webcam.


Accesorios
Además de la documentación habitual (guía de inicio rápido e información sobre la garantía), el portátil también incluye un tornillo para la instalación y una almohadilla térmica para refrigerar la SSD secundaria.
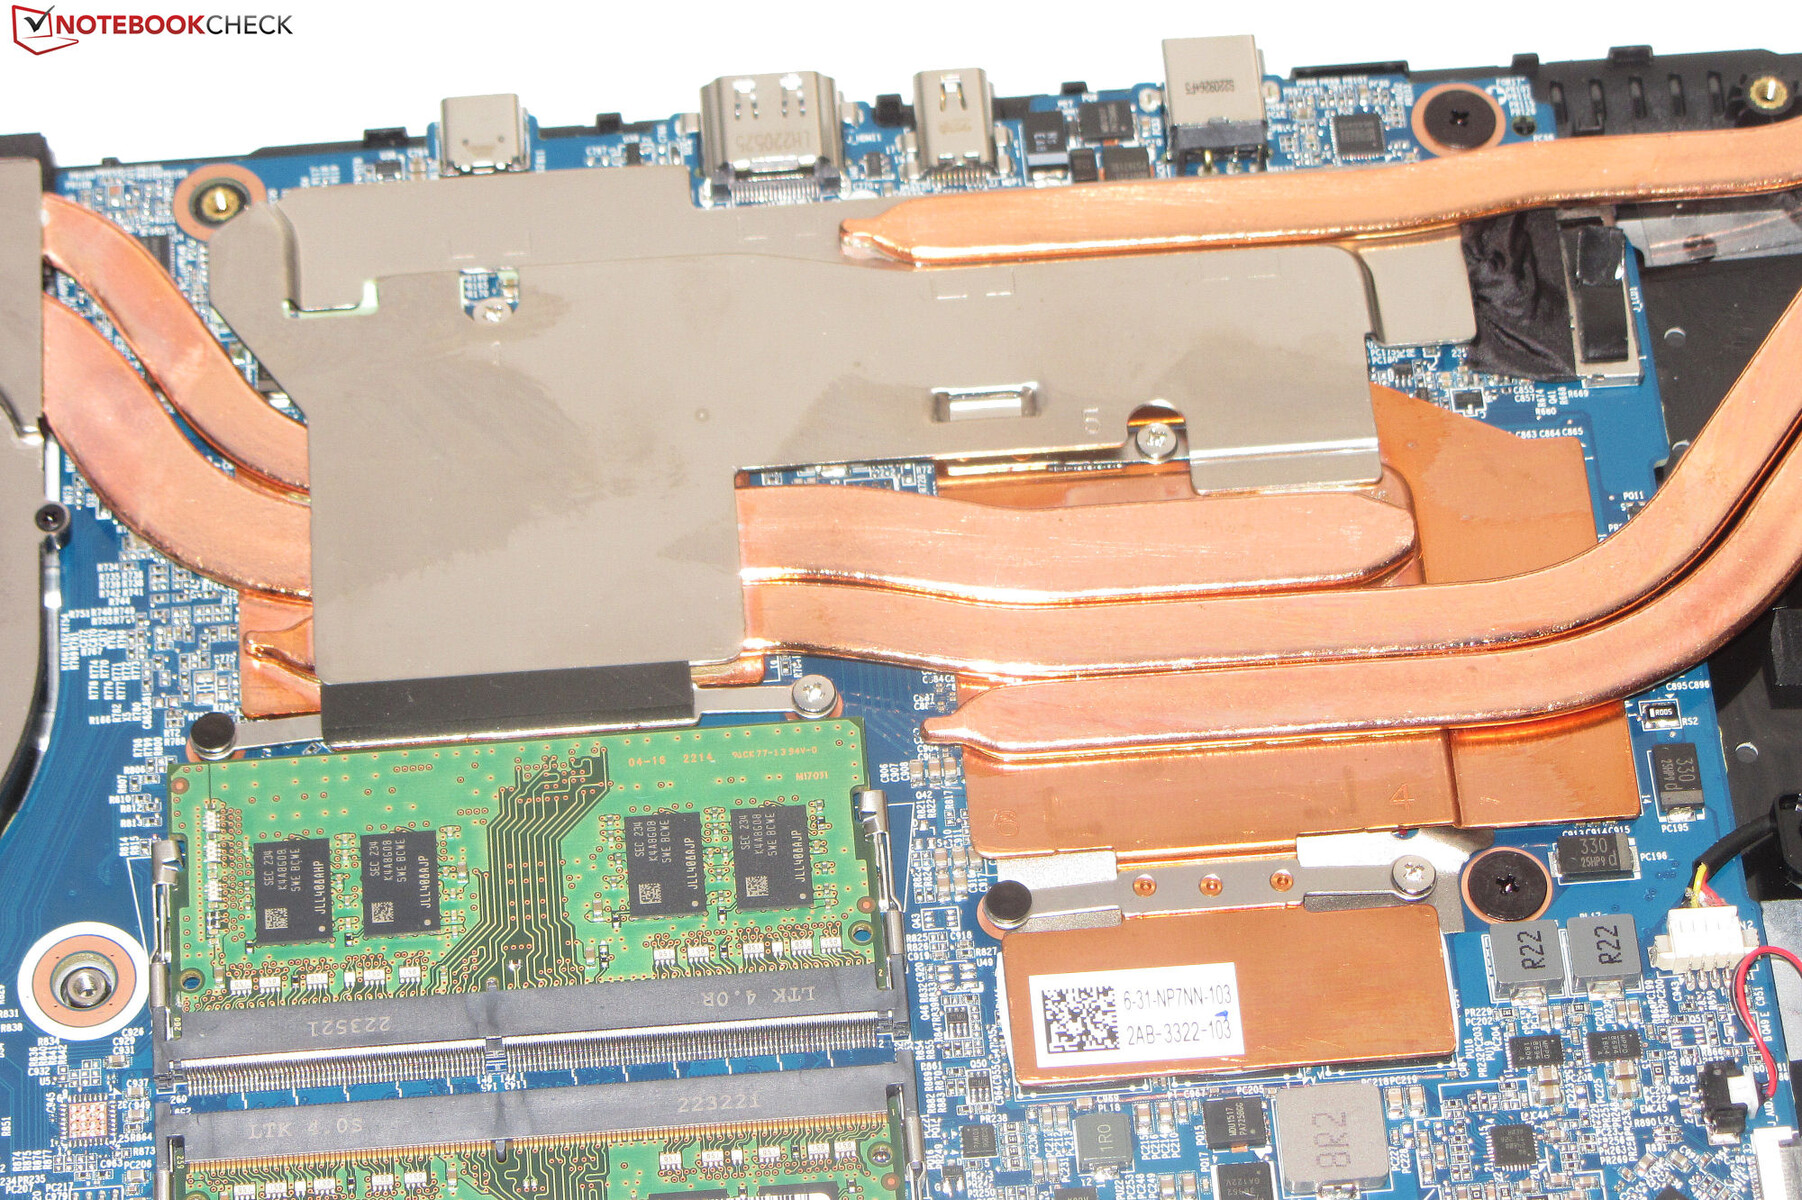
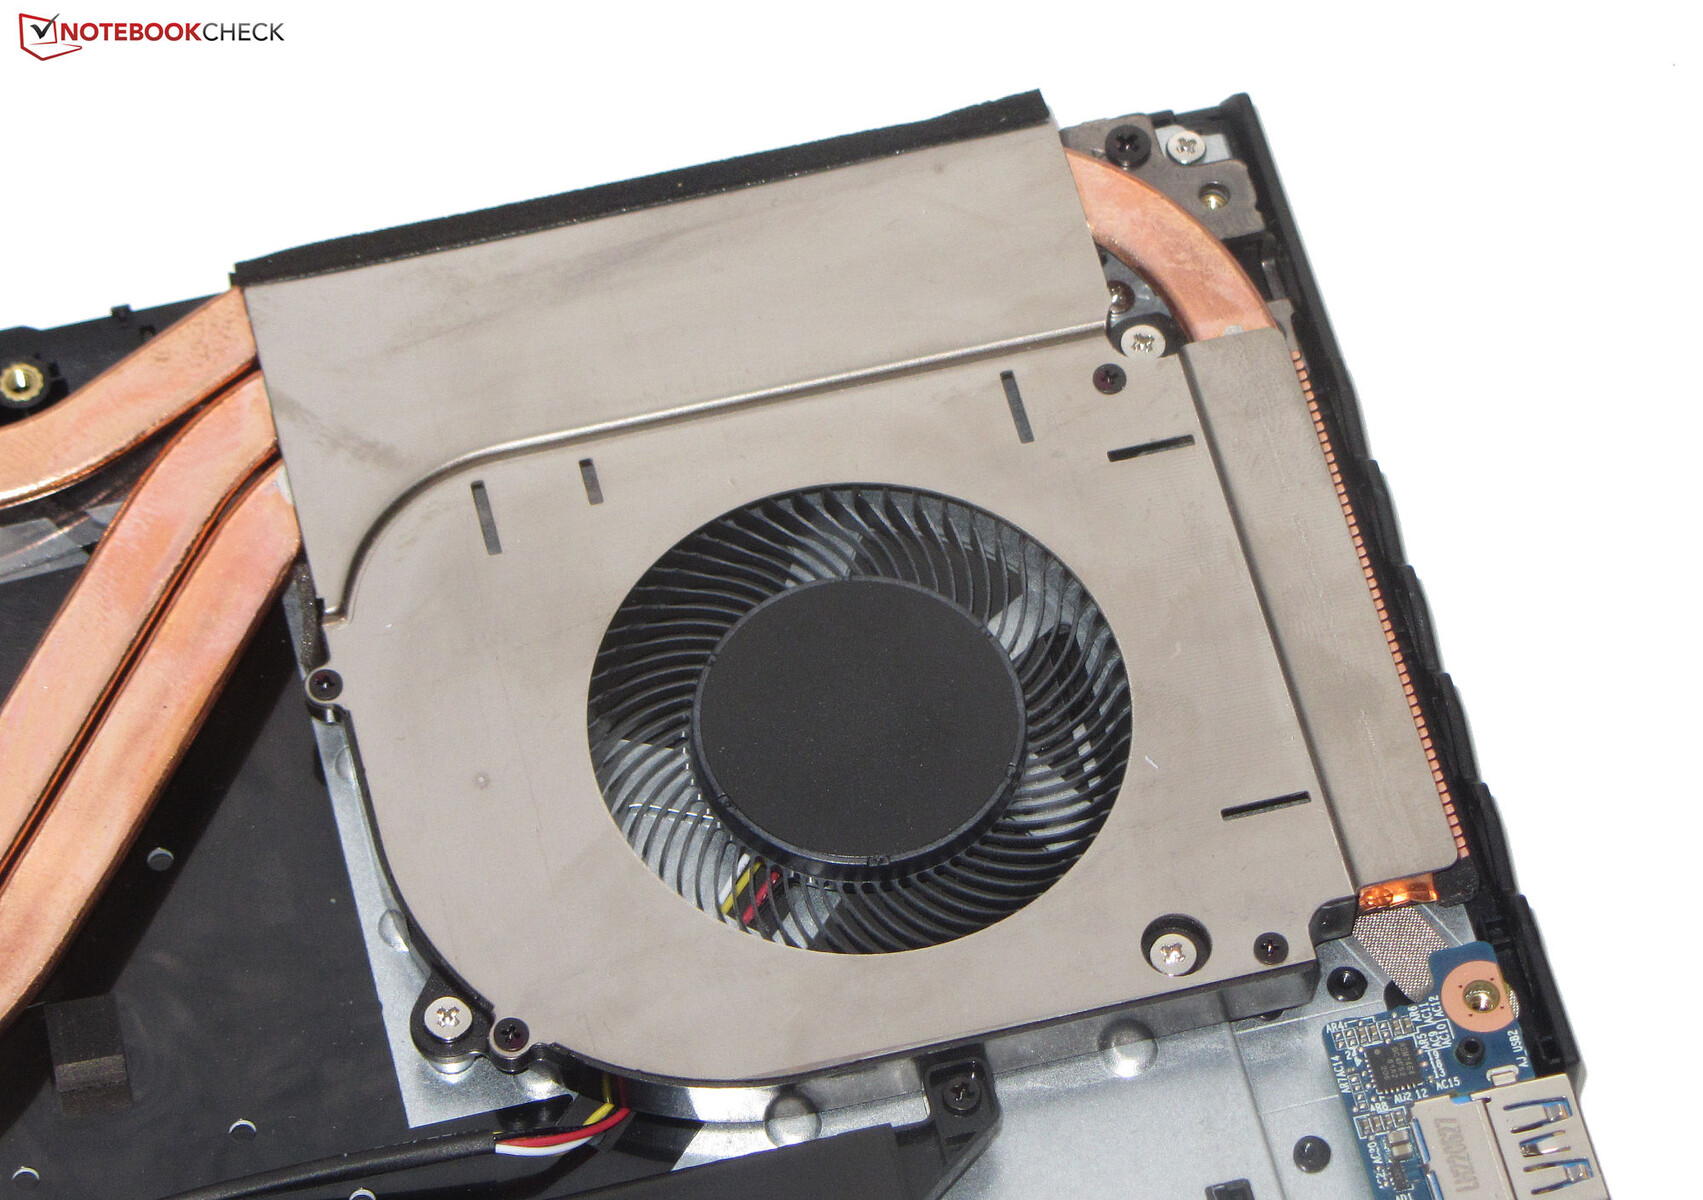
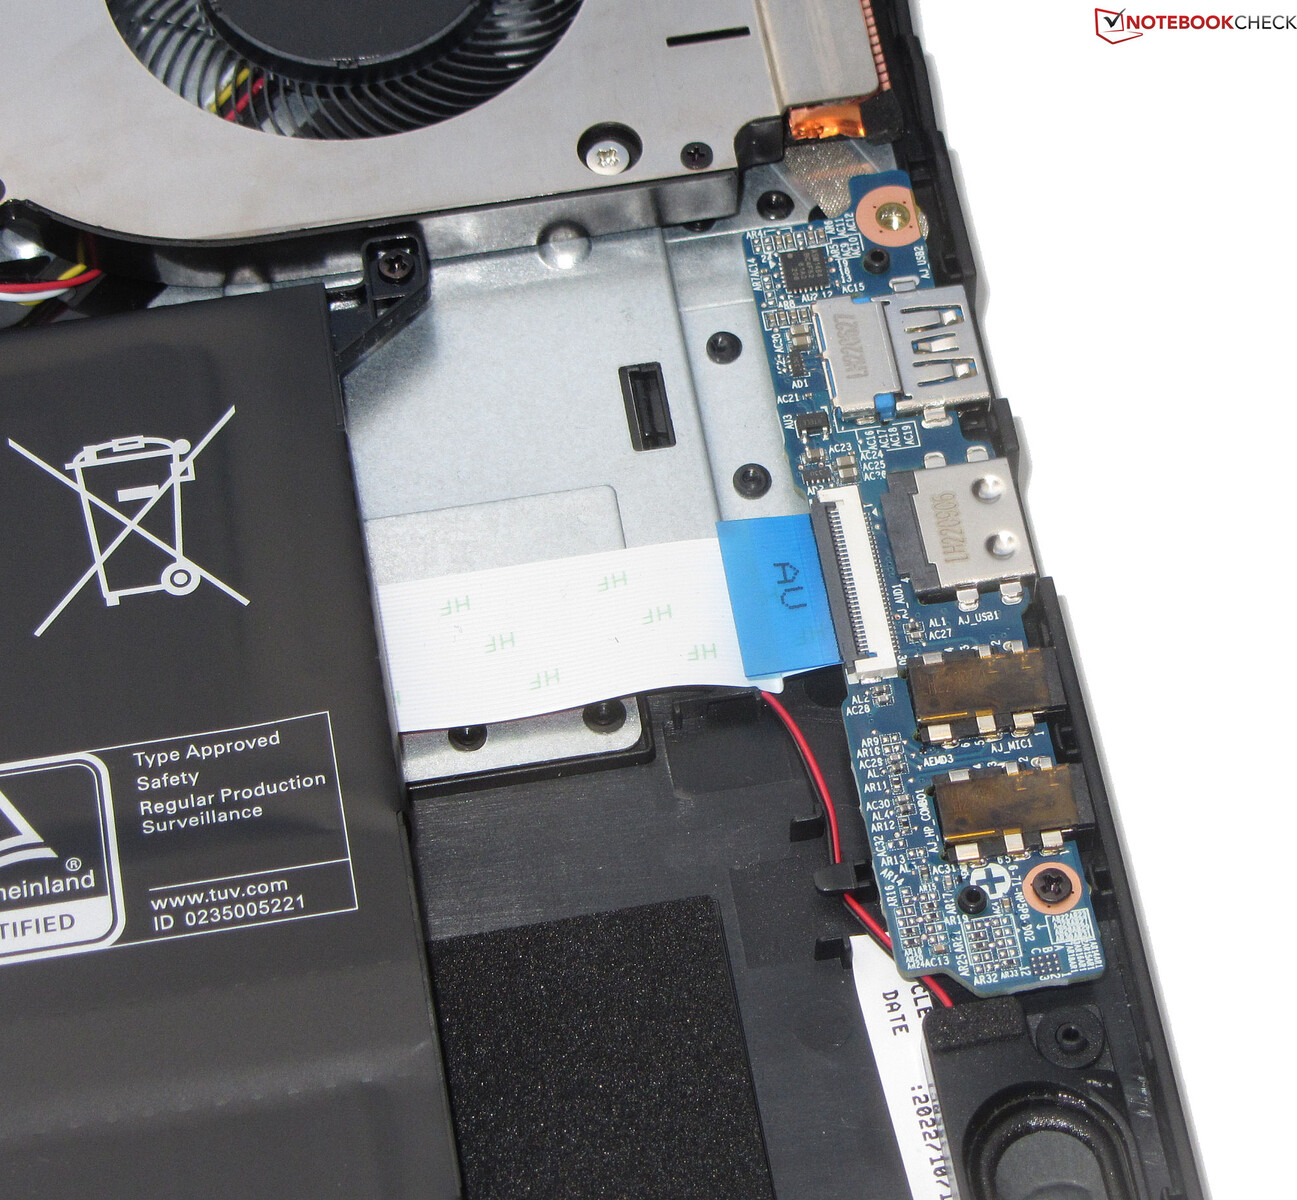
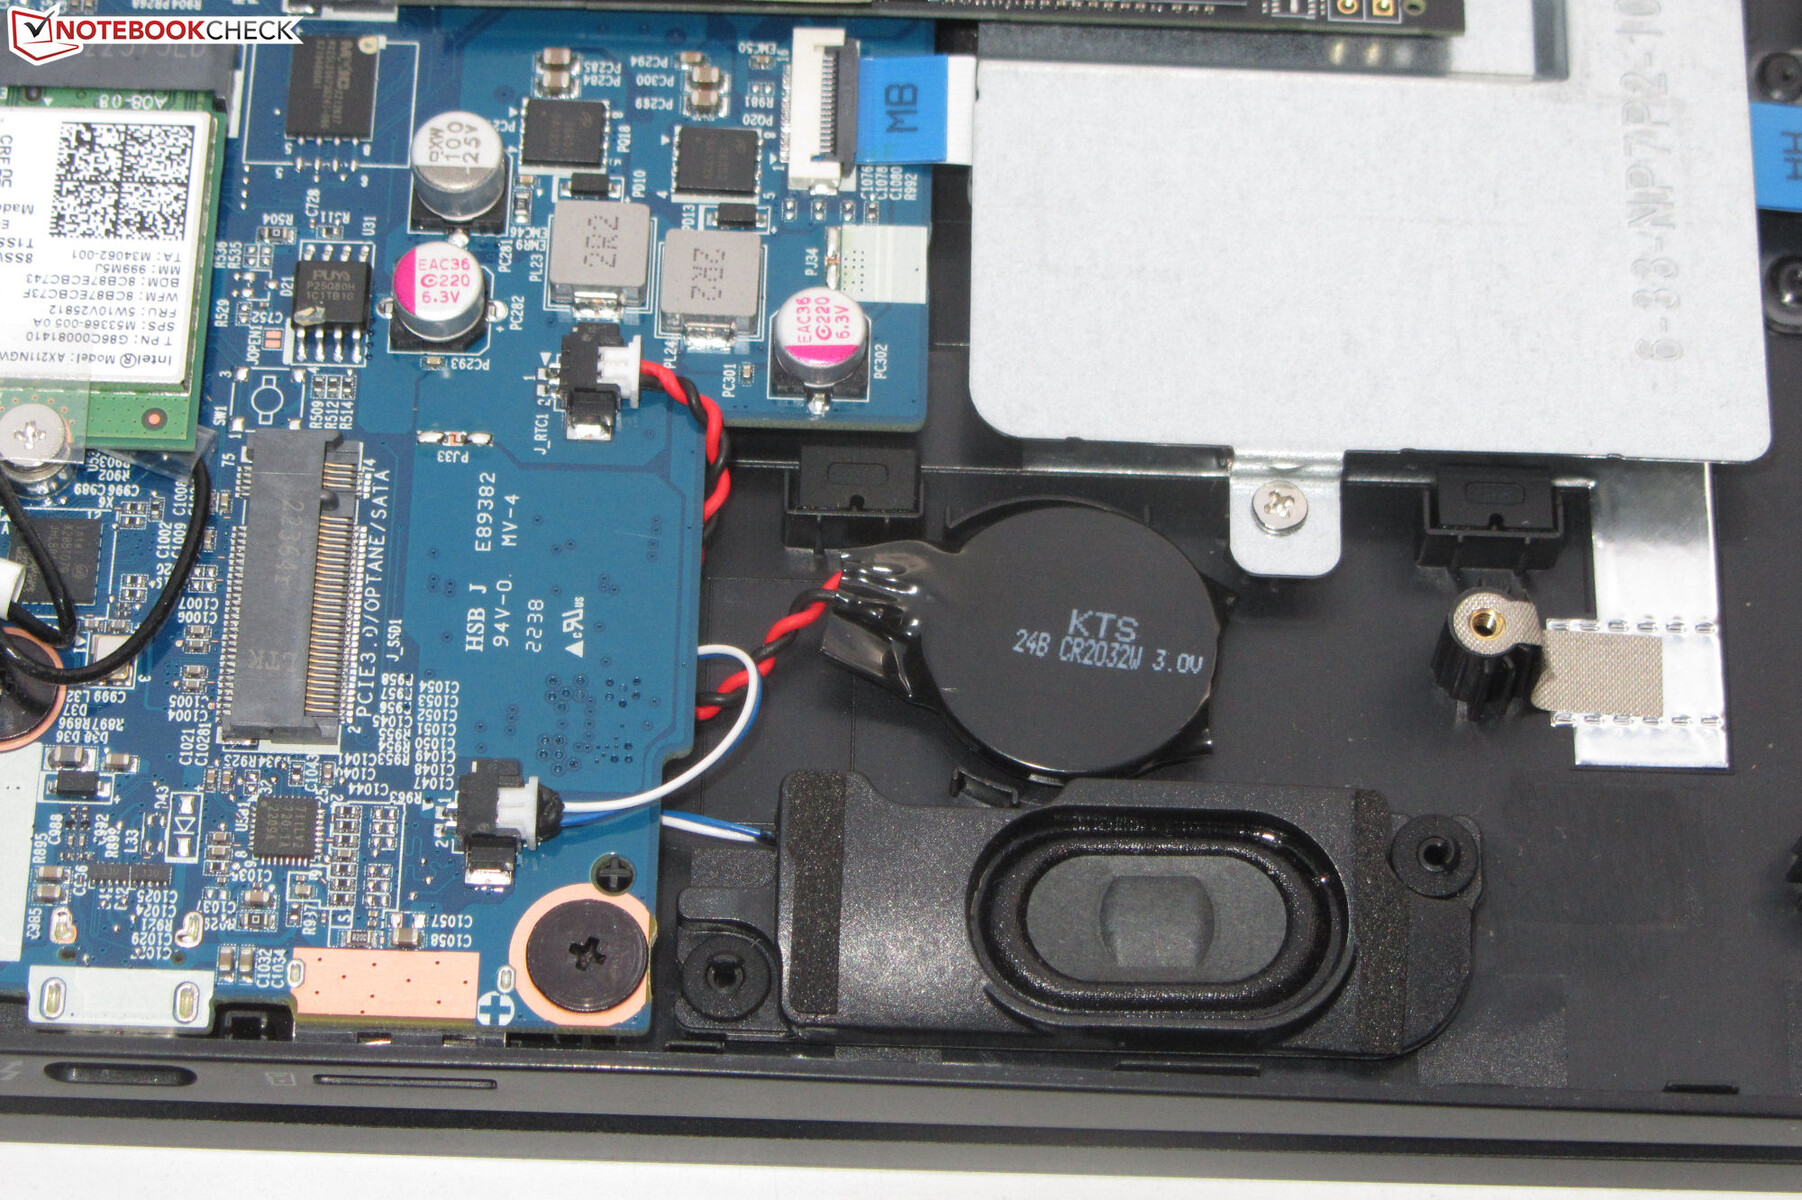
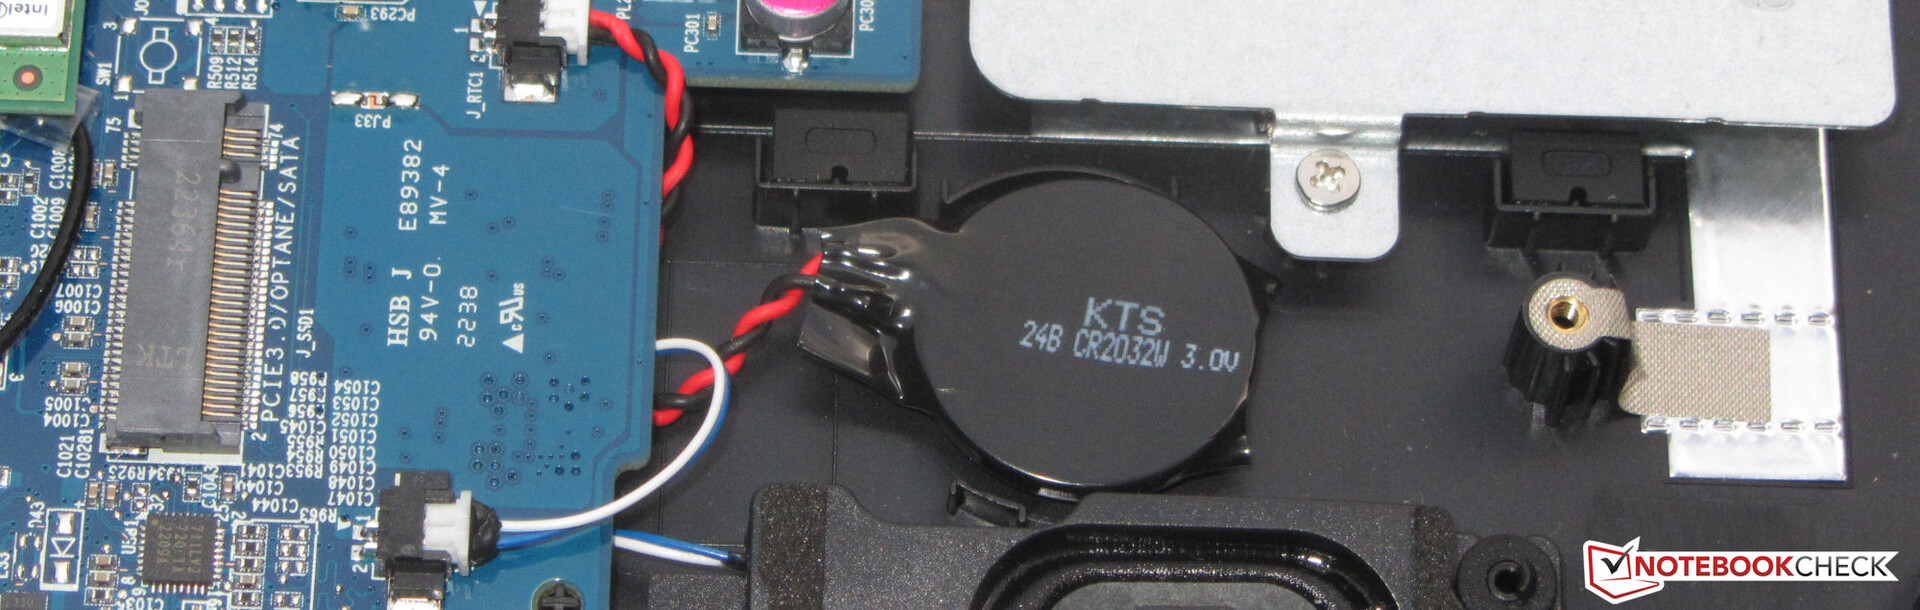
Mantenimiento
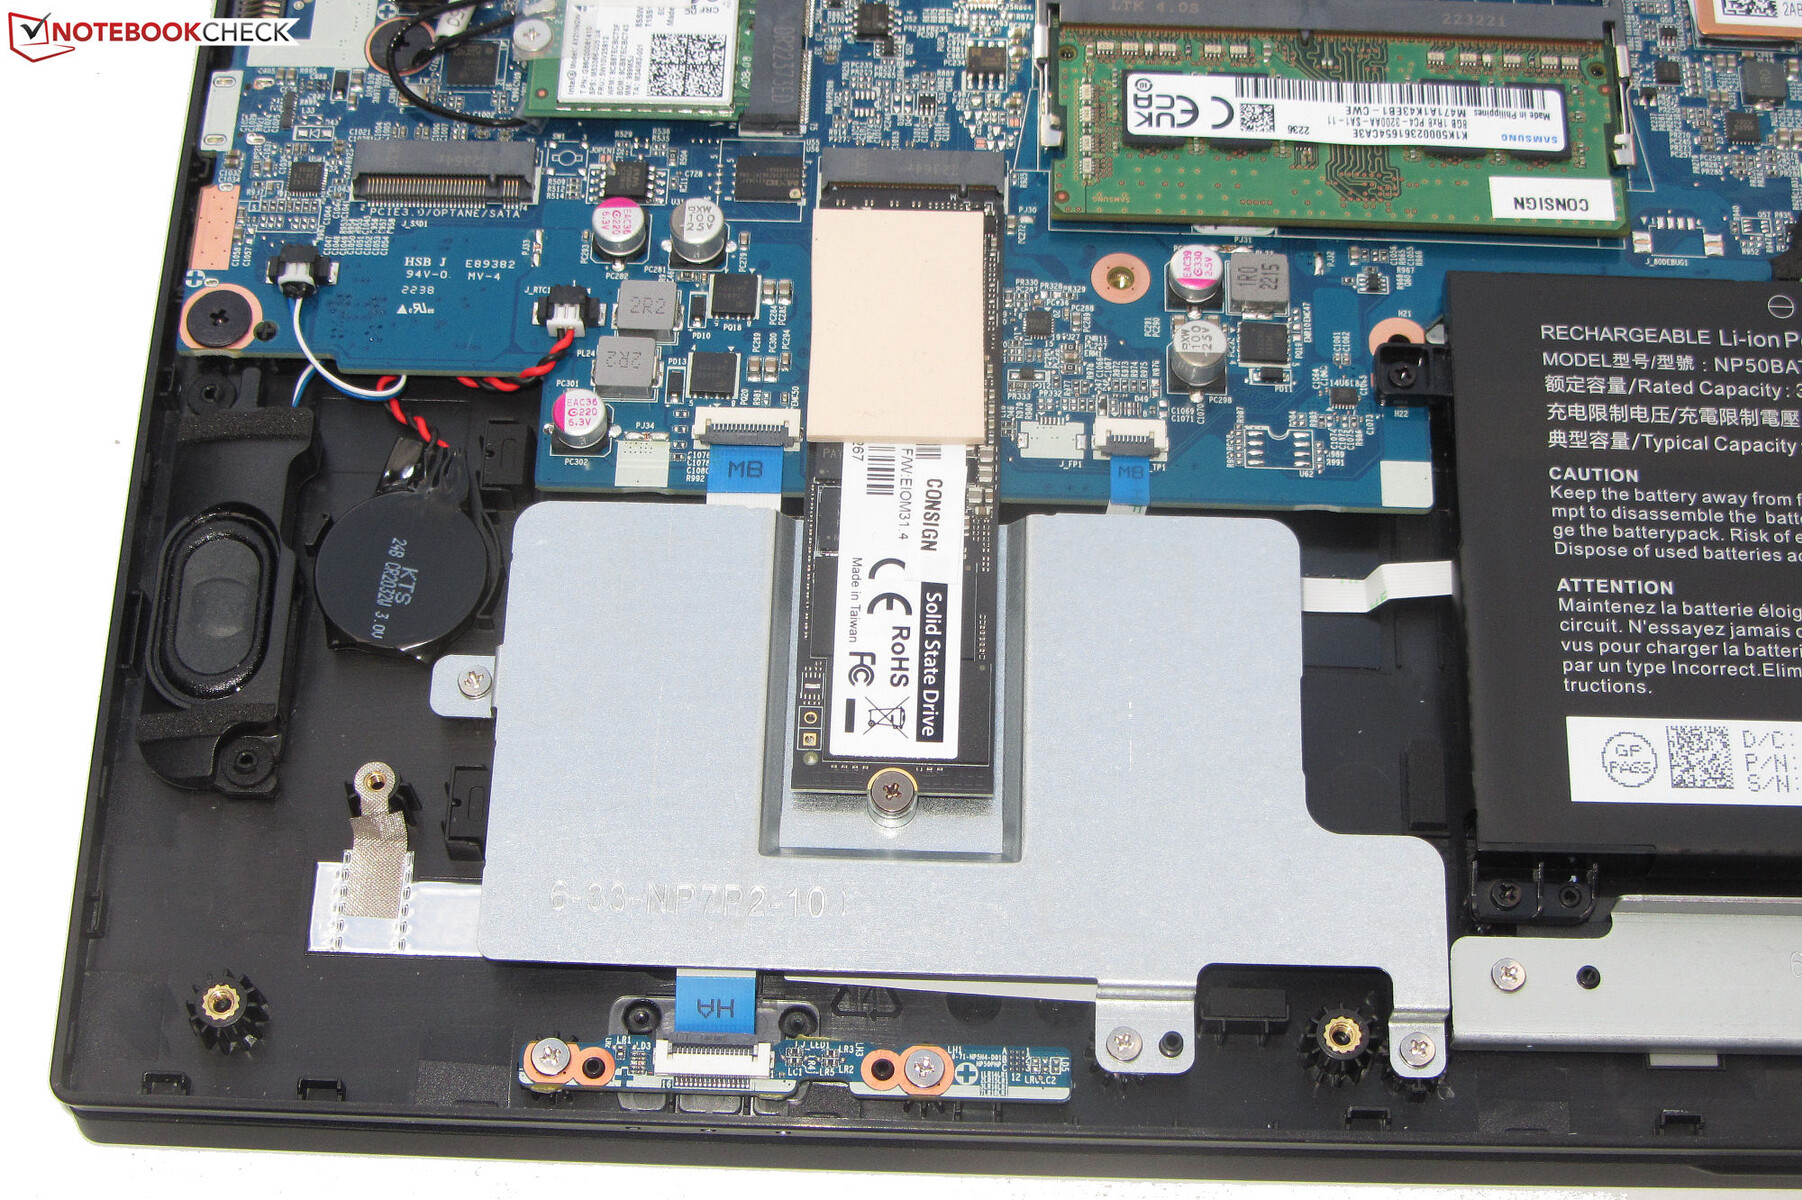
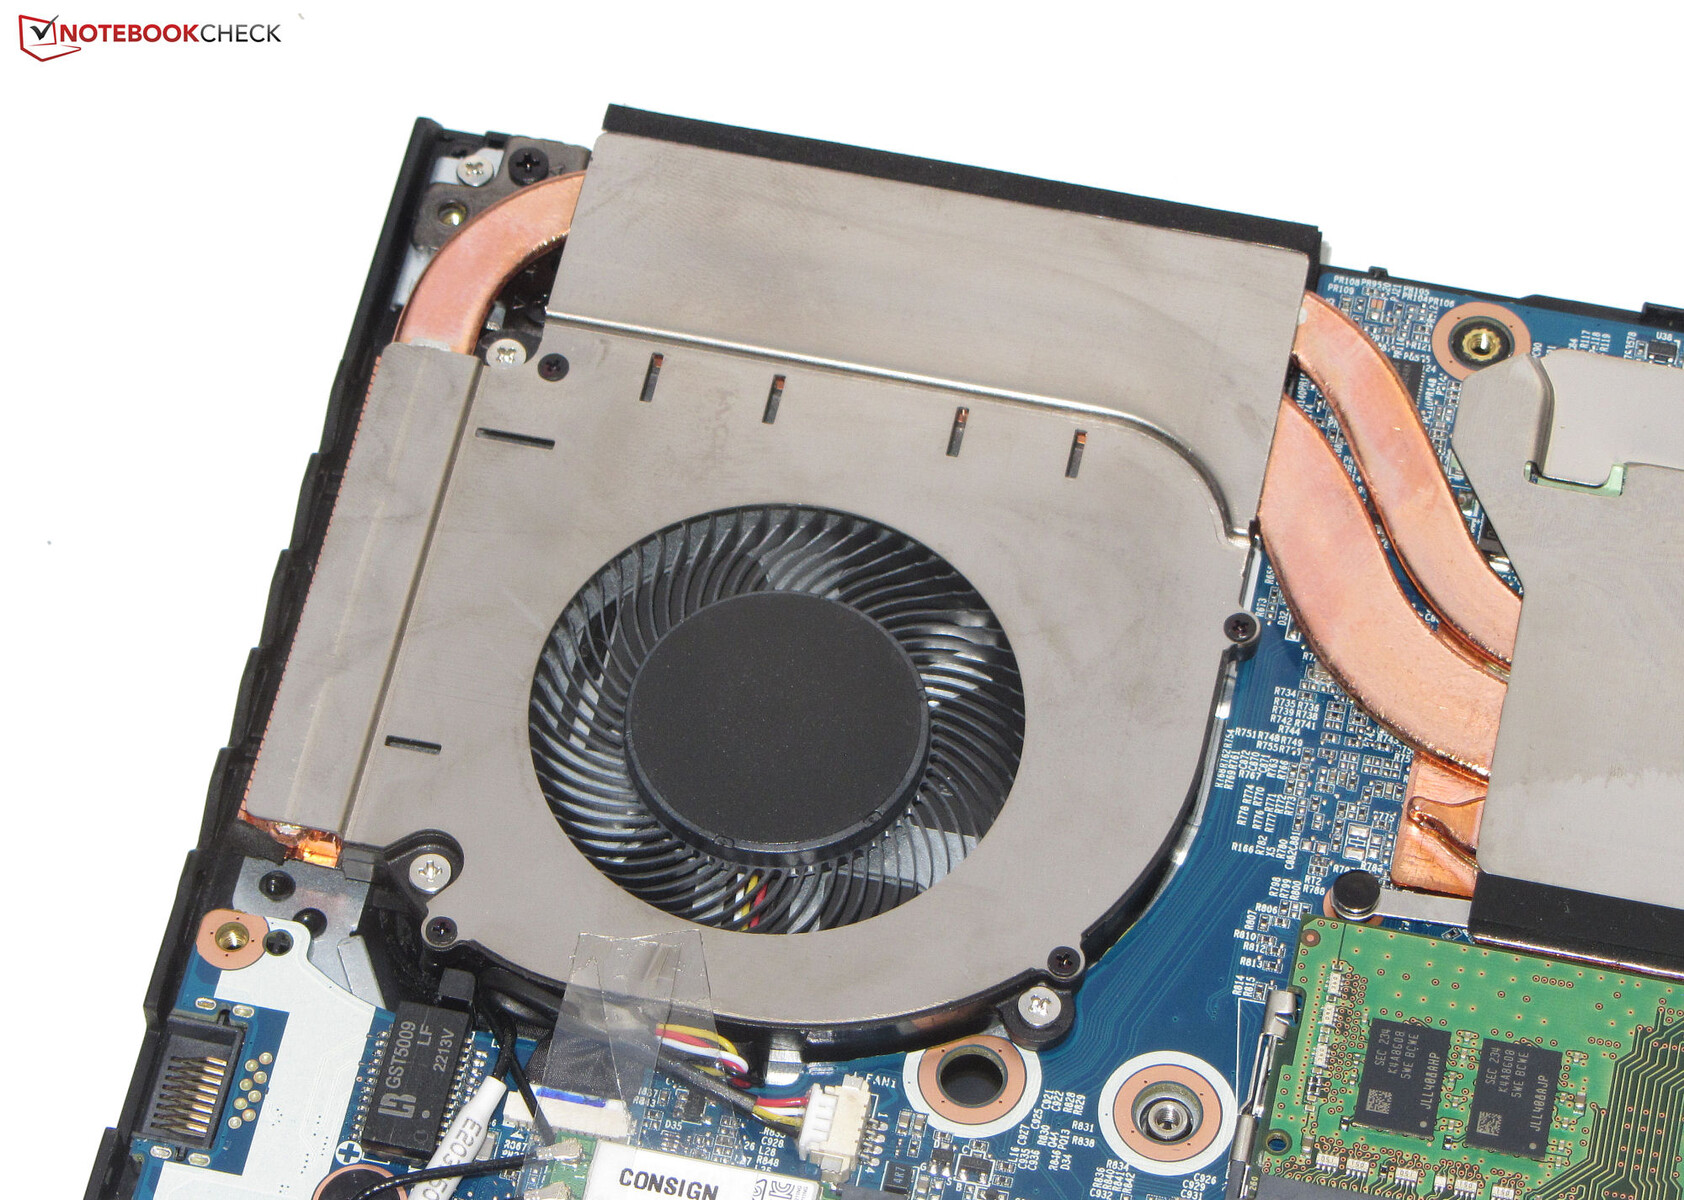
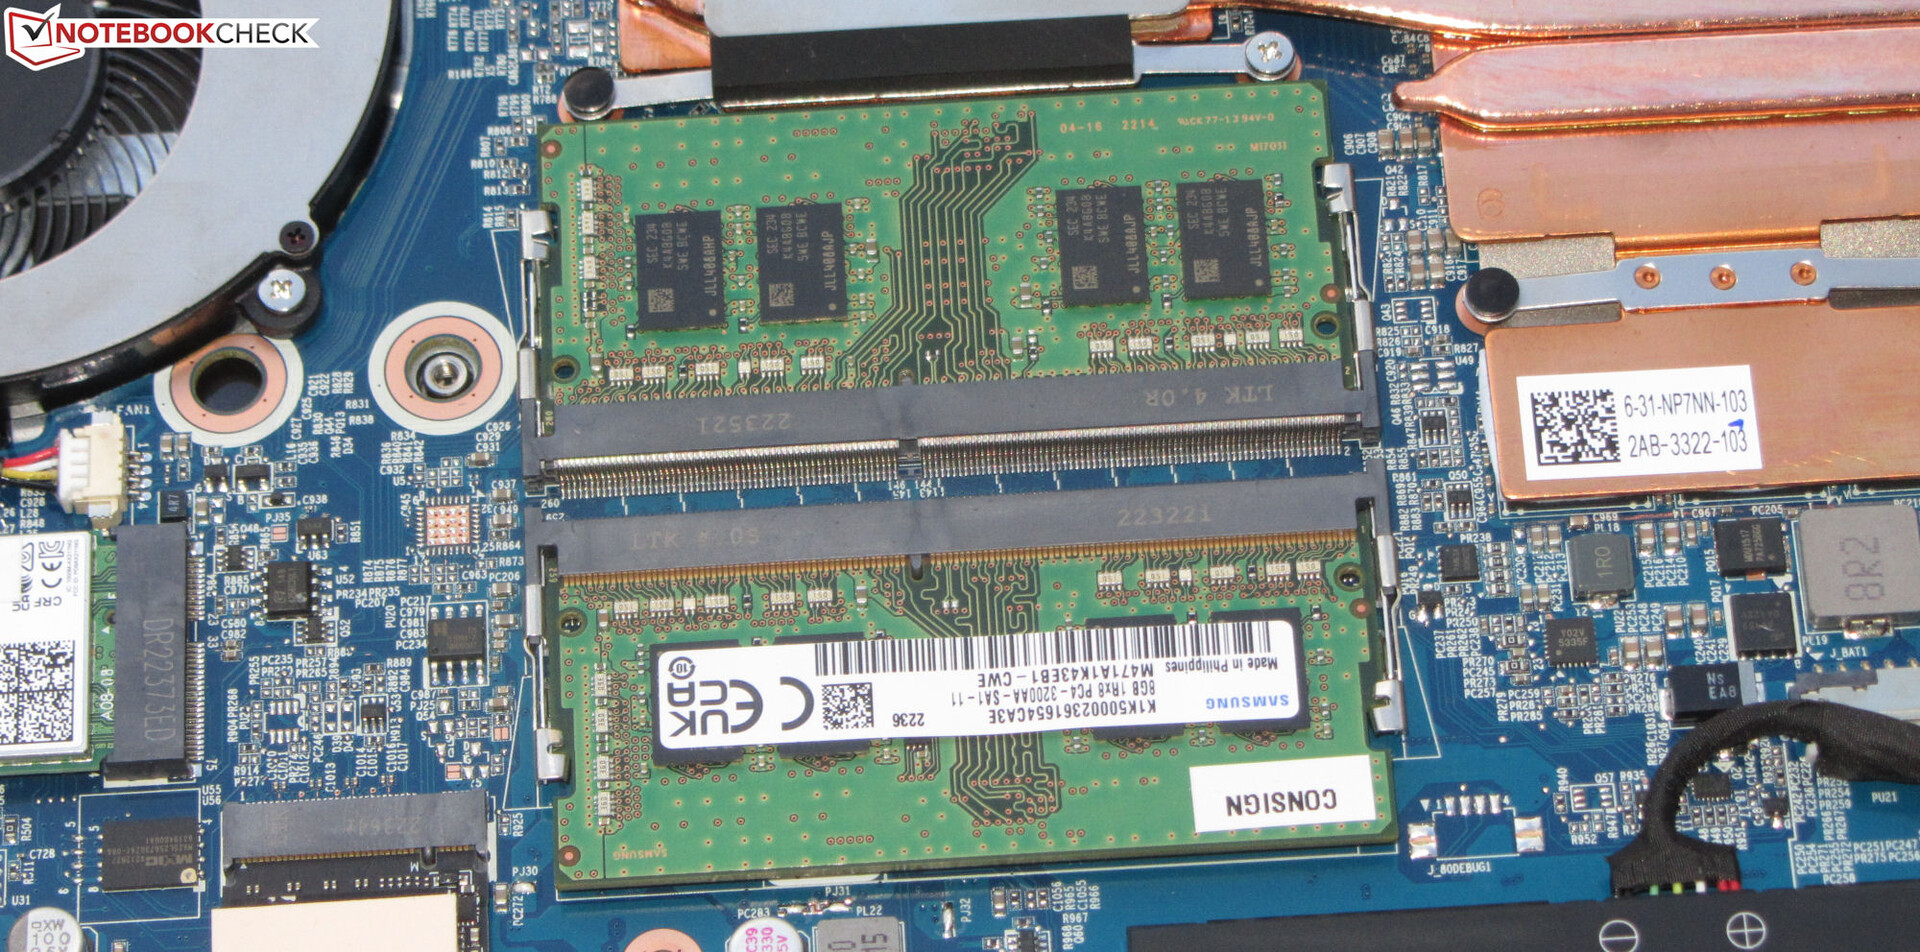
Tras sacar todos los tornillos de la parte inferior del dispositivo, se puede sacar la placa inferior con la ayuda de un borde afilado - sin embargo, está sujeta muy firmemente en ciertas áreas. En el interior, los usuarios pueden acceder al SSD (PCIe 4), la ranura secundaria M.2 (PCIe 3), el módulo Wi-Fi, las ranuras RAM (ambas en uso), la batería BIOS, los ventiladores, y la batería principal.
Garantía
El modelo Gigabyte de 17,3 pulgadas viene con una garantía limitada estándar de un año. Actualmente no hay extensiones de garantía disponibles.
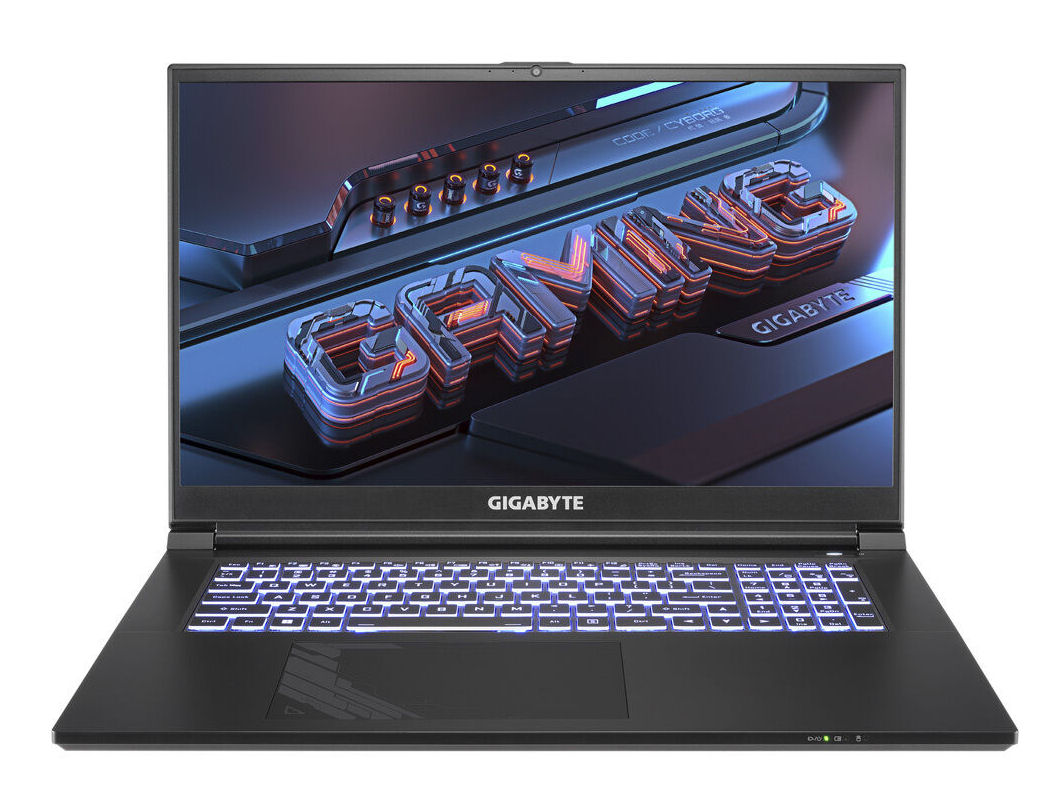
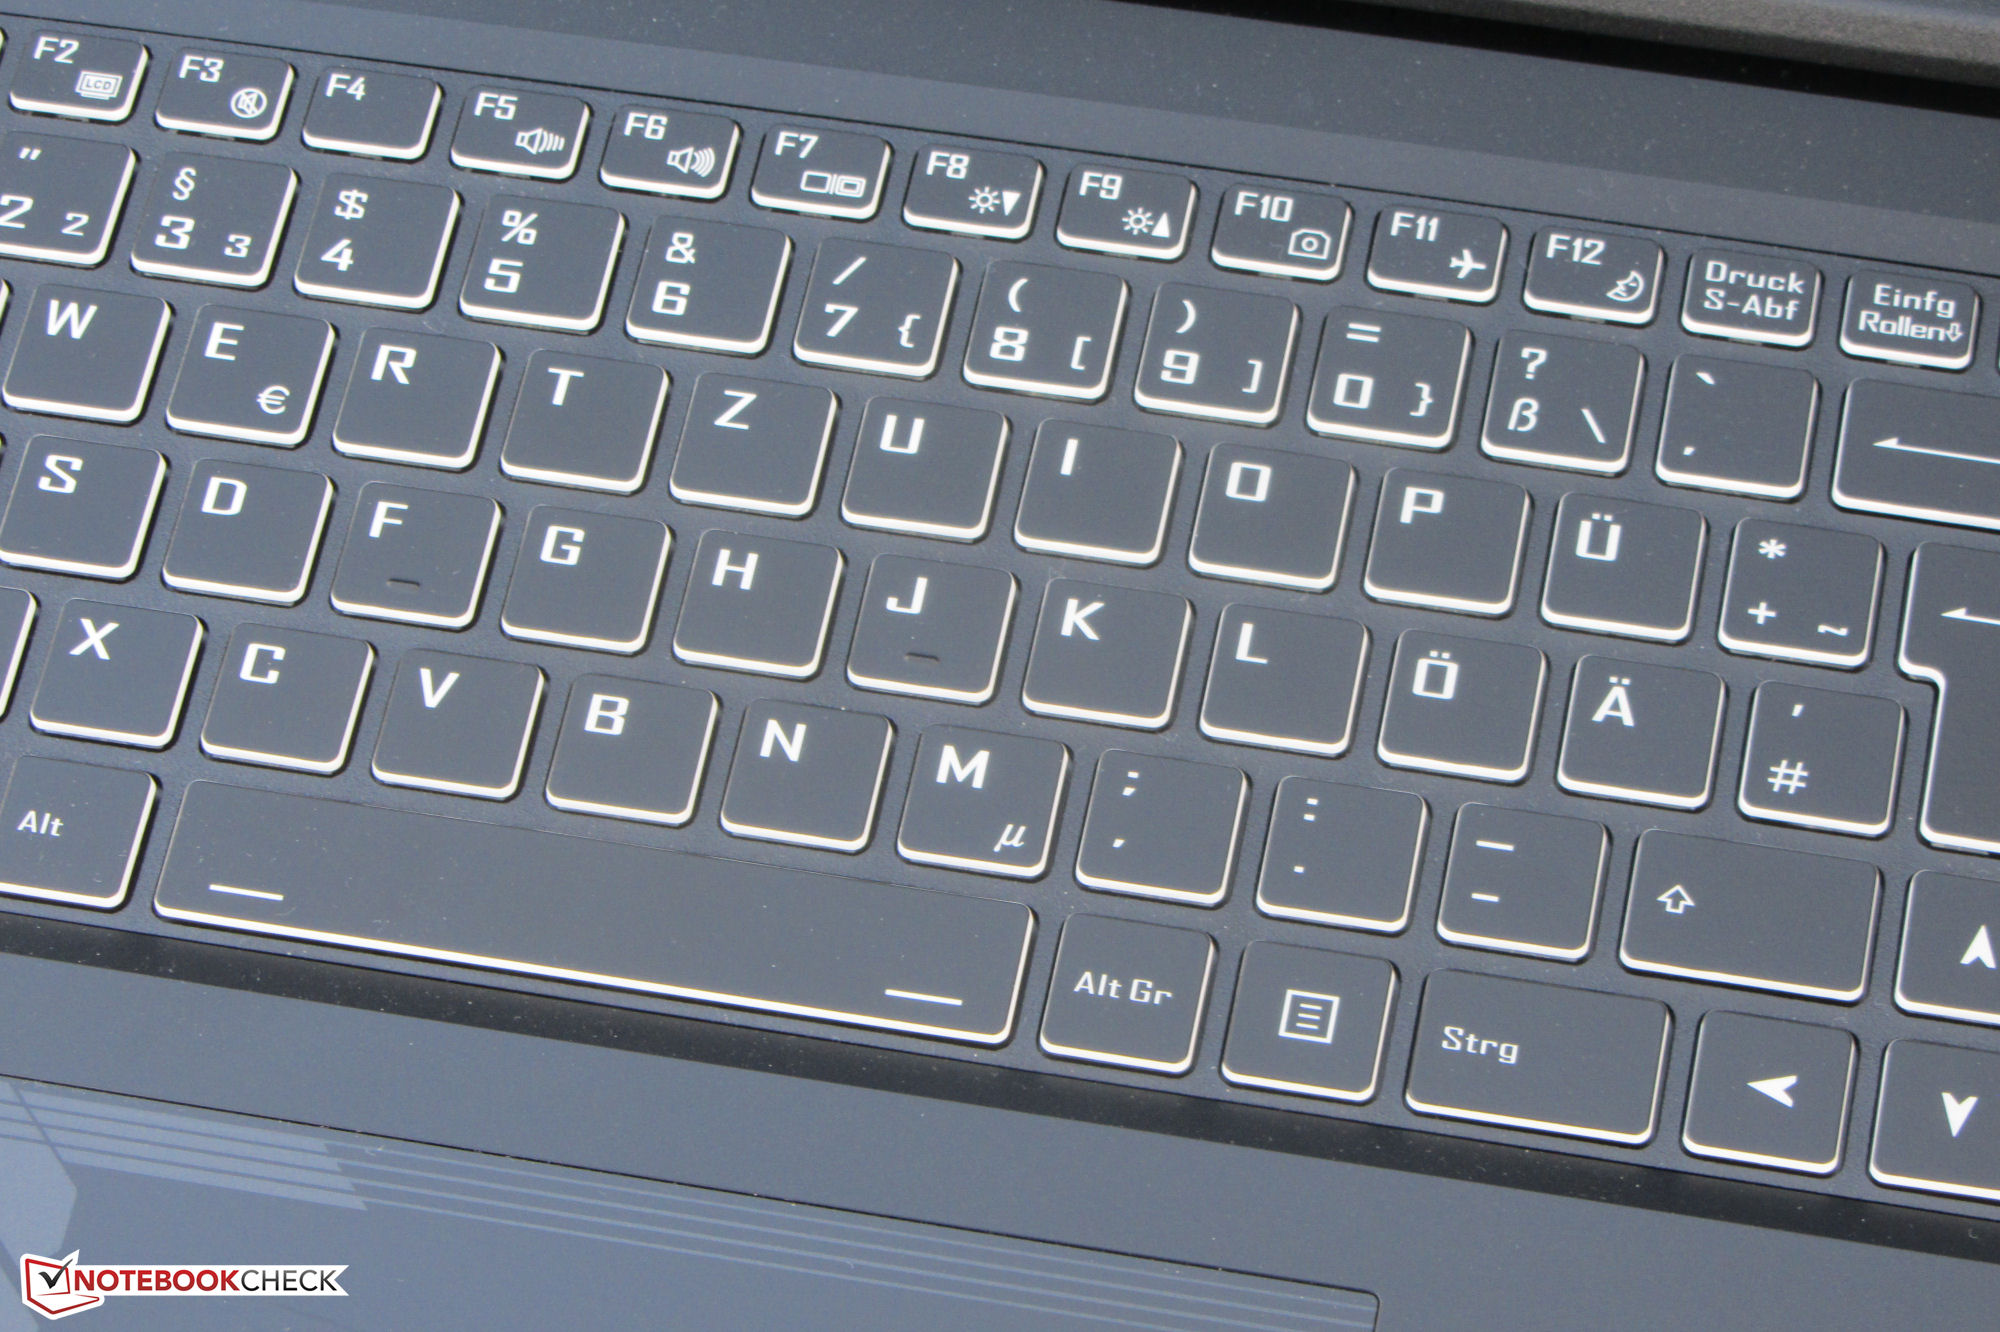
Dispositivos de entrada - Teclado con retroiluminación RGB
Teclado
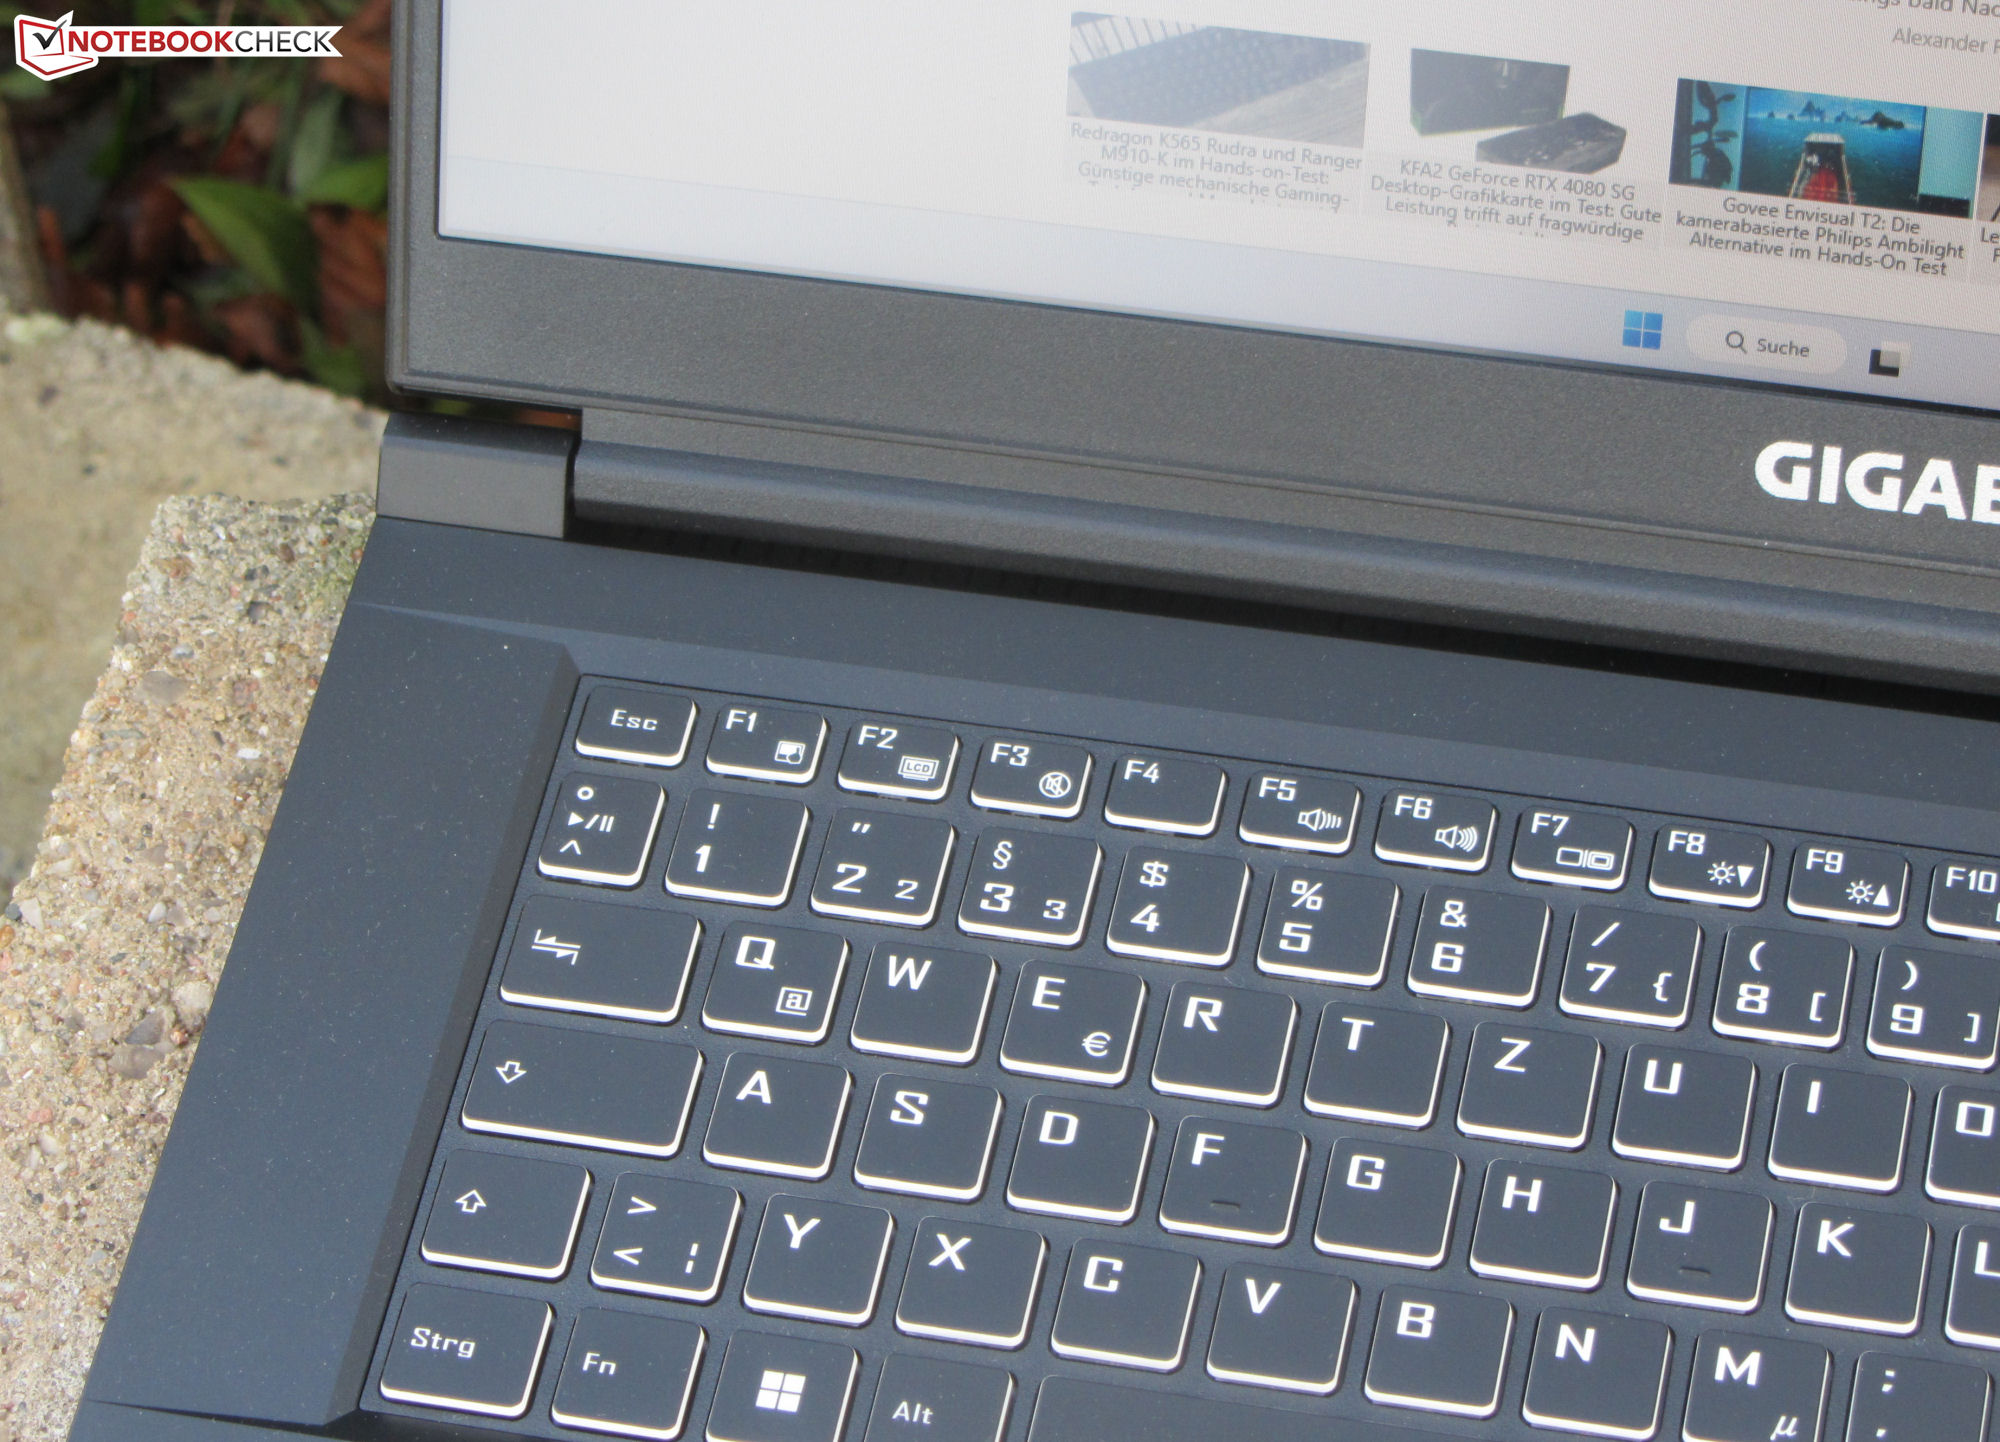
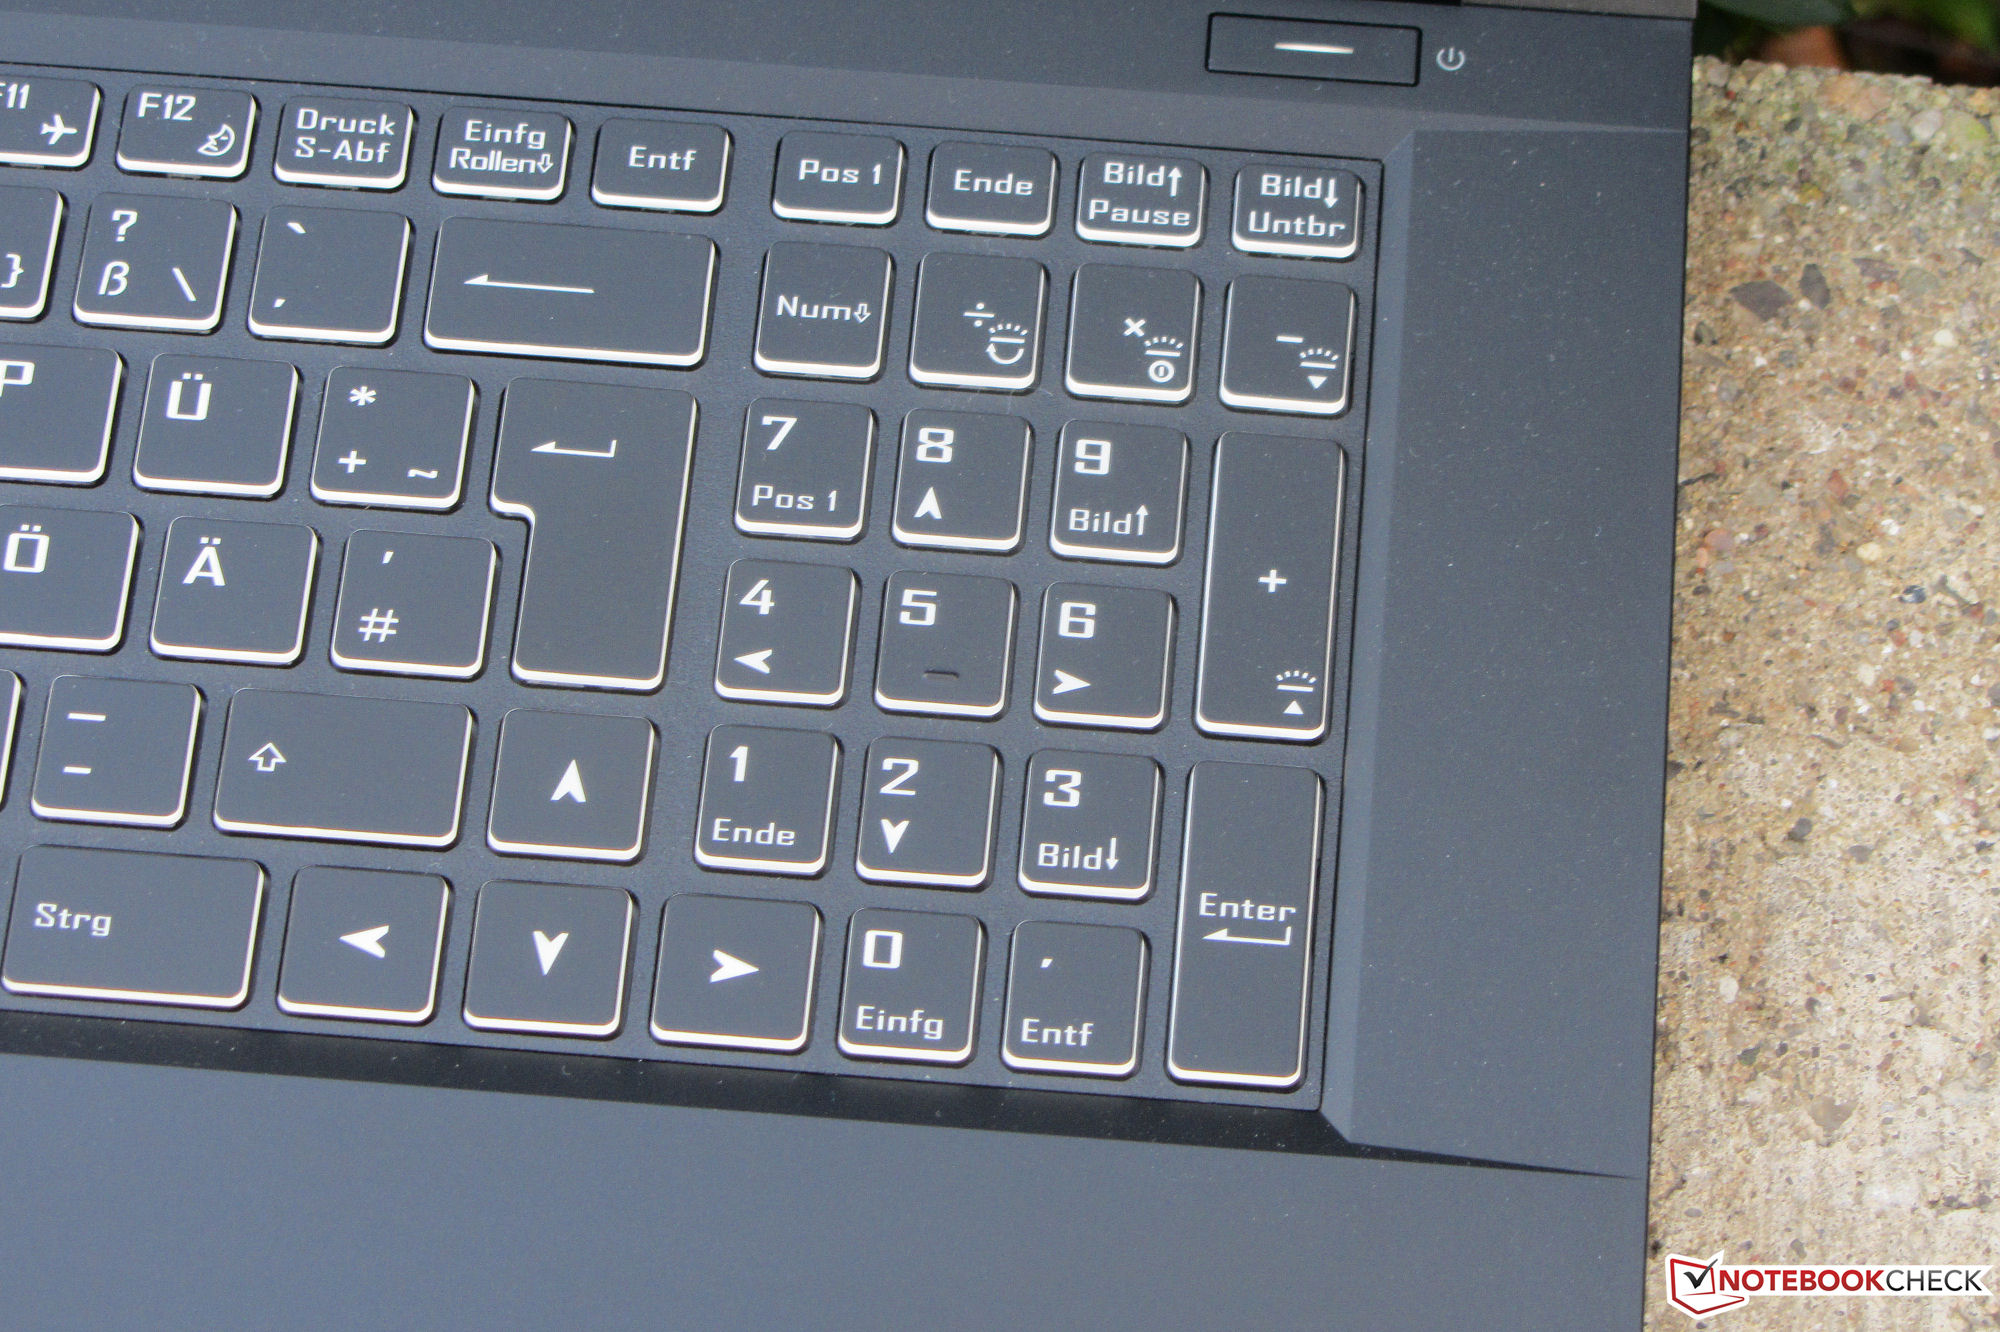
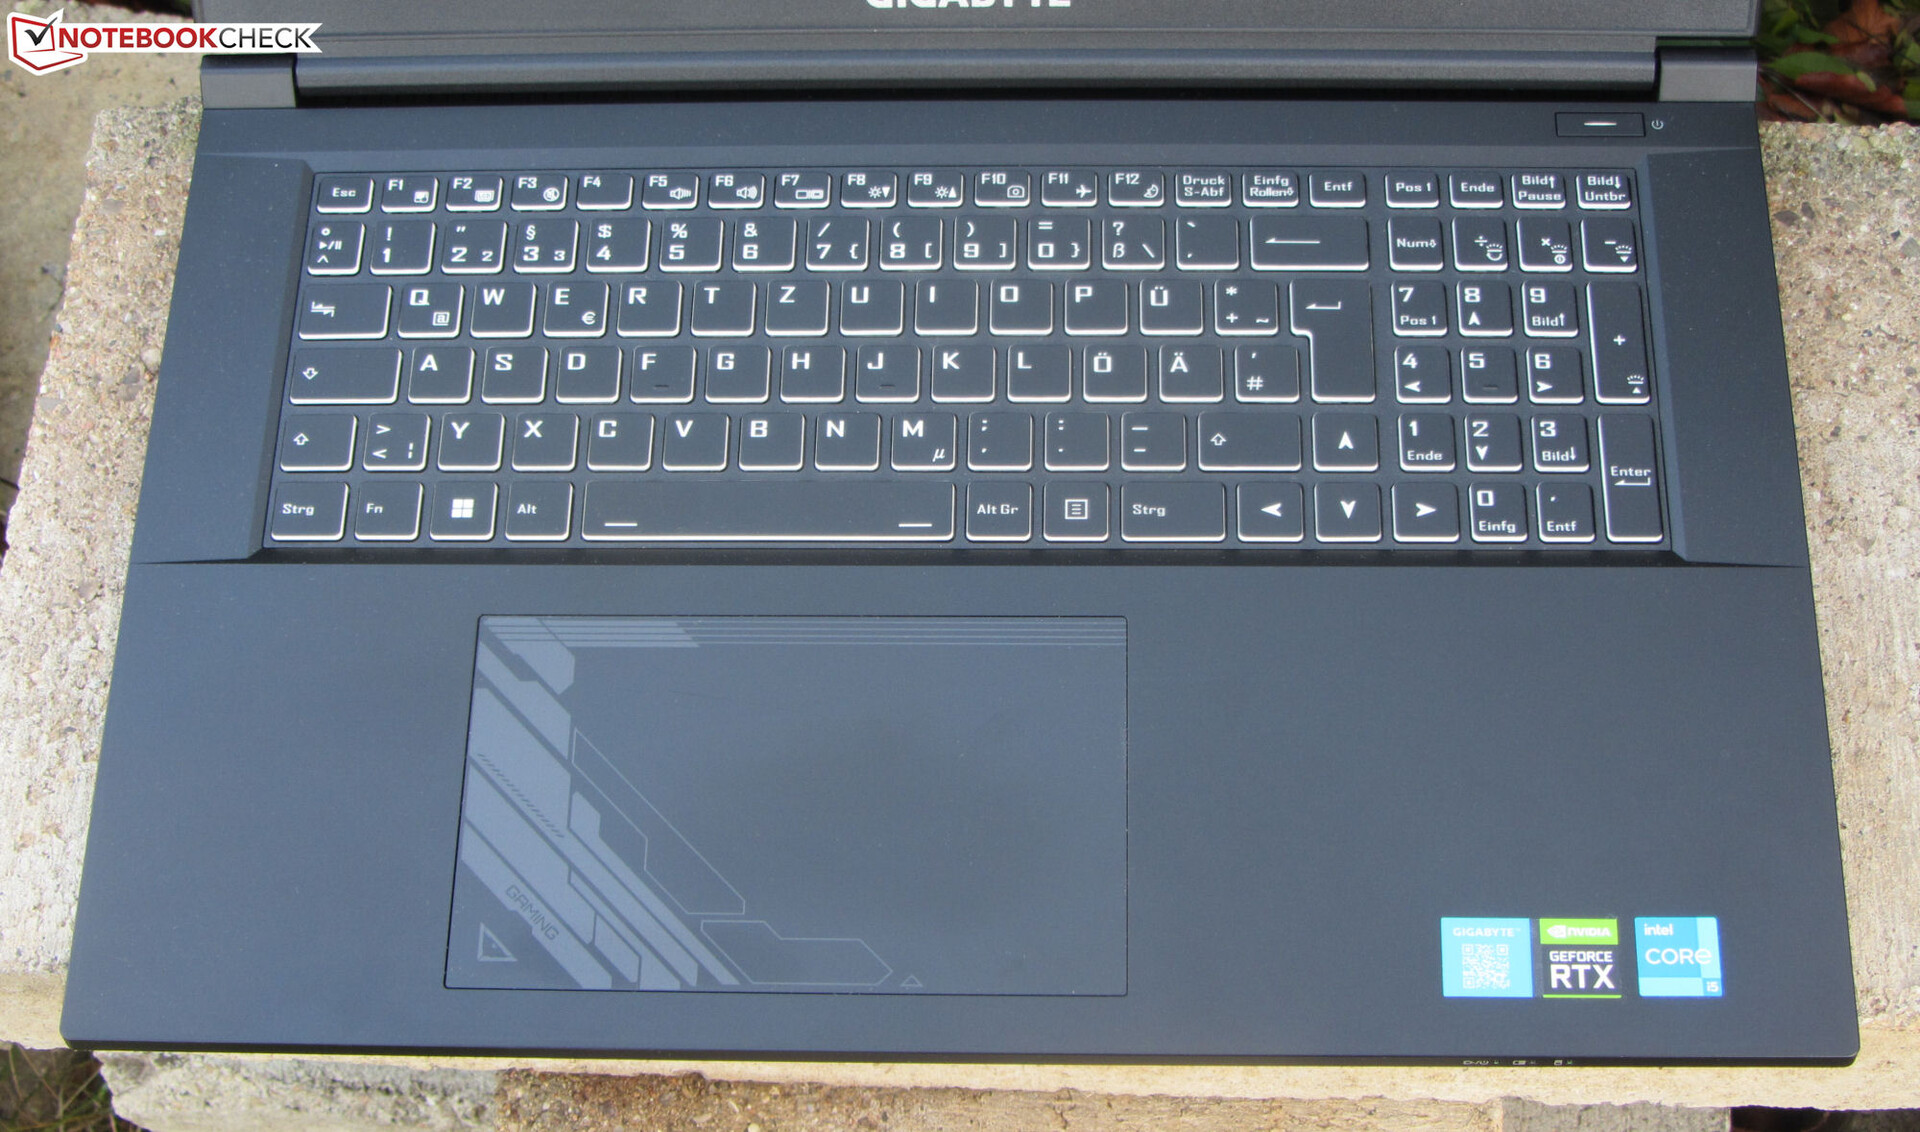
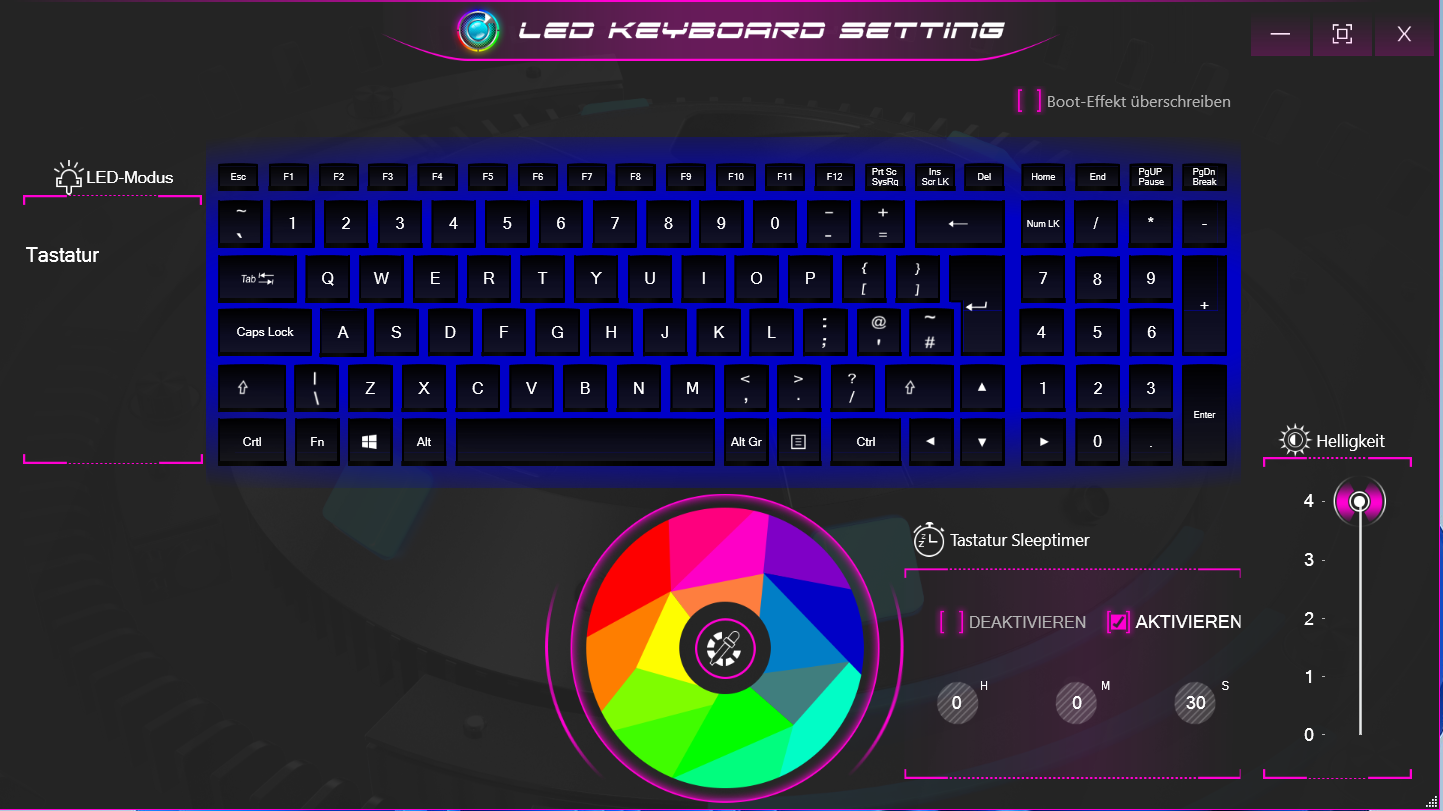
Las teclas planas y suaves del teclado chiclet retroiluminado ofrecen un recorrido moderado y un punto de accionamiento definido. La respuesta de las teclas podría haber sido más firme. El área del teclado cede ligeramente al escribir, aunque esto no debería ser un problema en la práctica. Bien: El teclado utiliza teclas de flecha de tamaño normal. La retroiluminación RGB (cuatro niveles) puede controlarse con tres teclas de función. En general, Gigabyte ofrece un buen teclado para el uso diario.
Panel táctil
Gracias al gran clickpad multitáctil (~ 15,2 x 9,1 cm), técnicamente no se necesita un ratón externo, ya que la superficie lisa ofrece buenas propiedades de deslizamiento. Es sensible hasta en las esquinas. El touchpad tiene un recorrido corto y un punto de accionamiento bien definido.
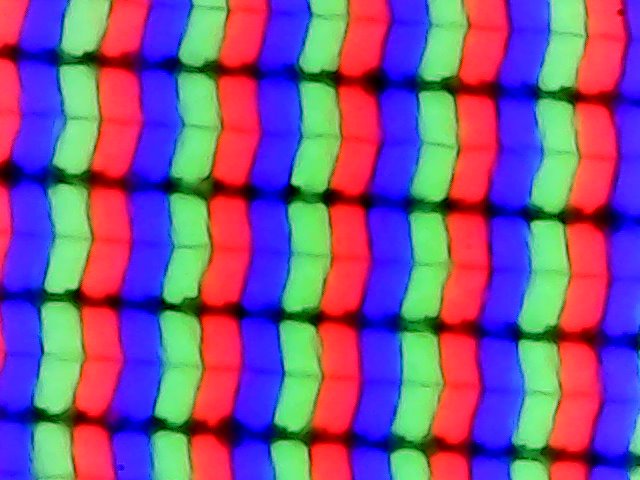
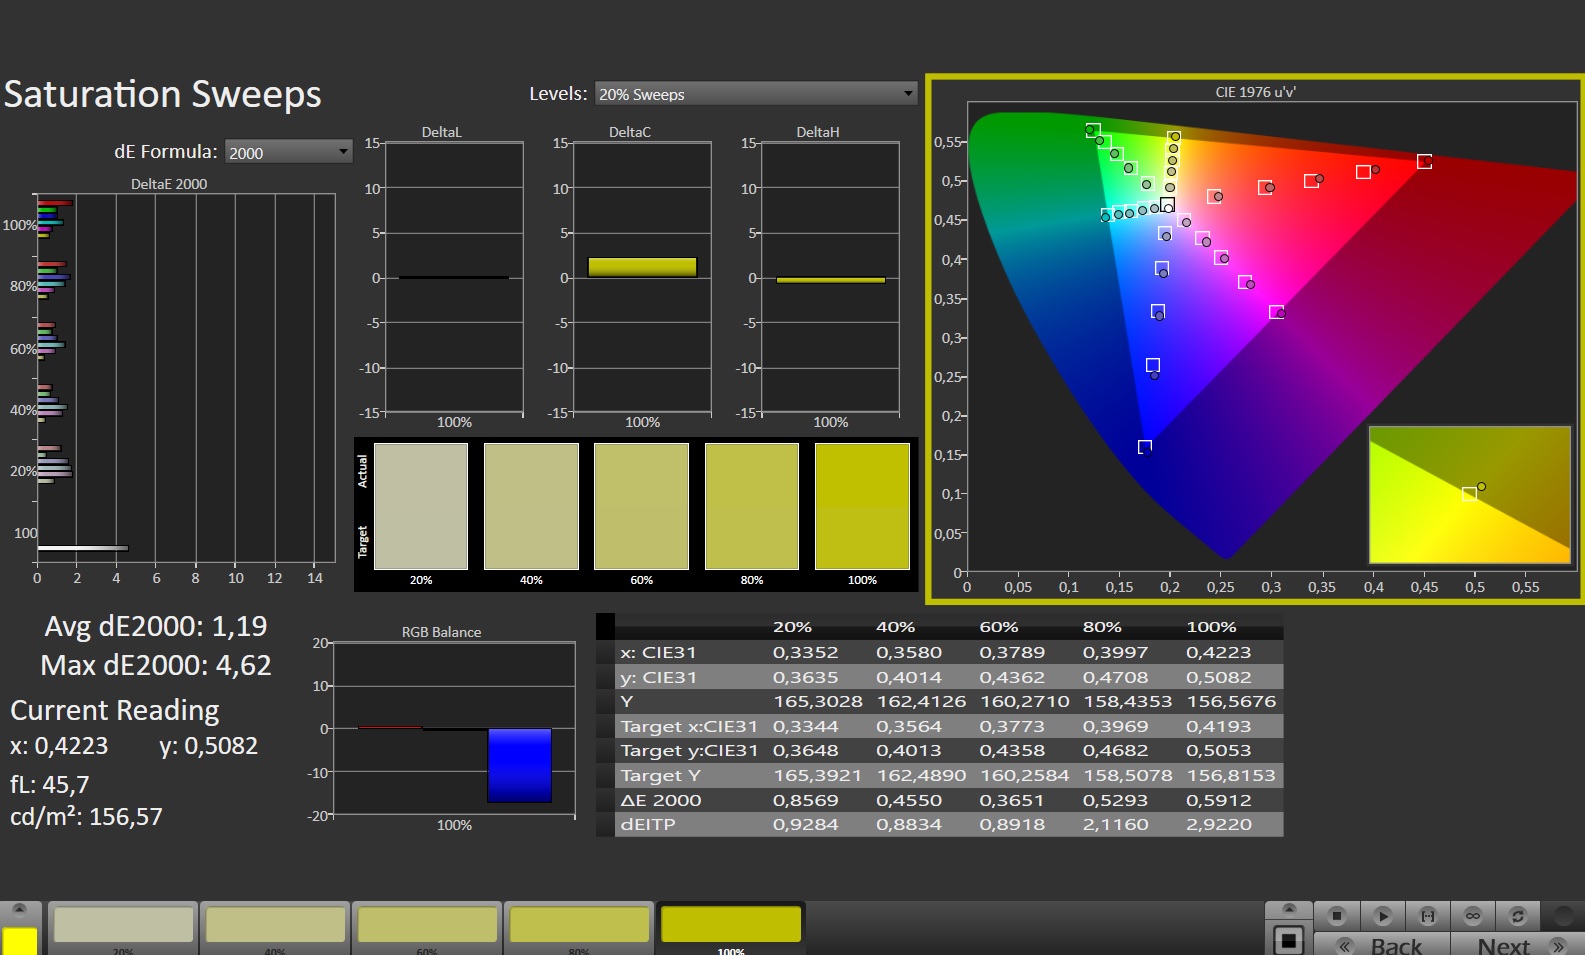
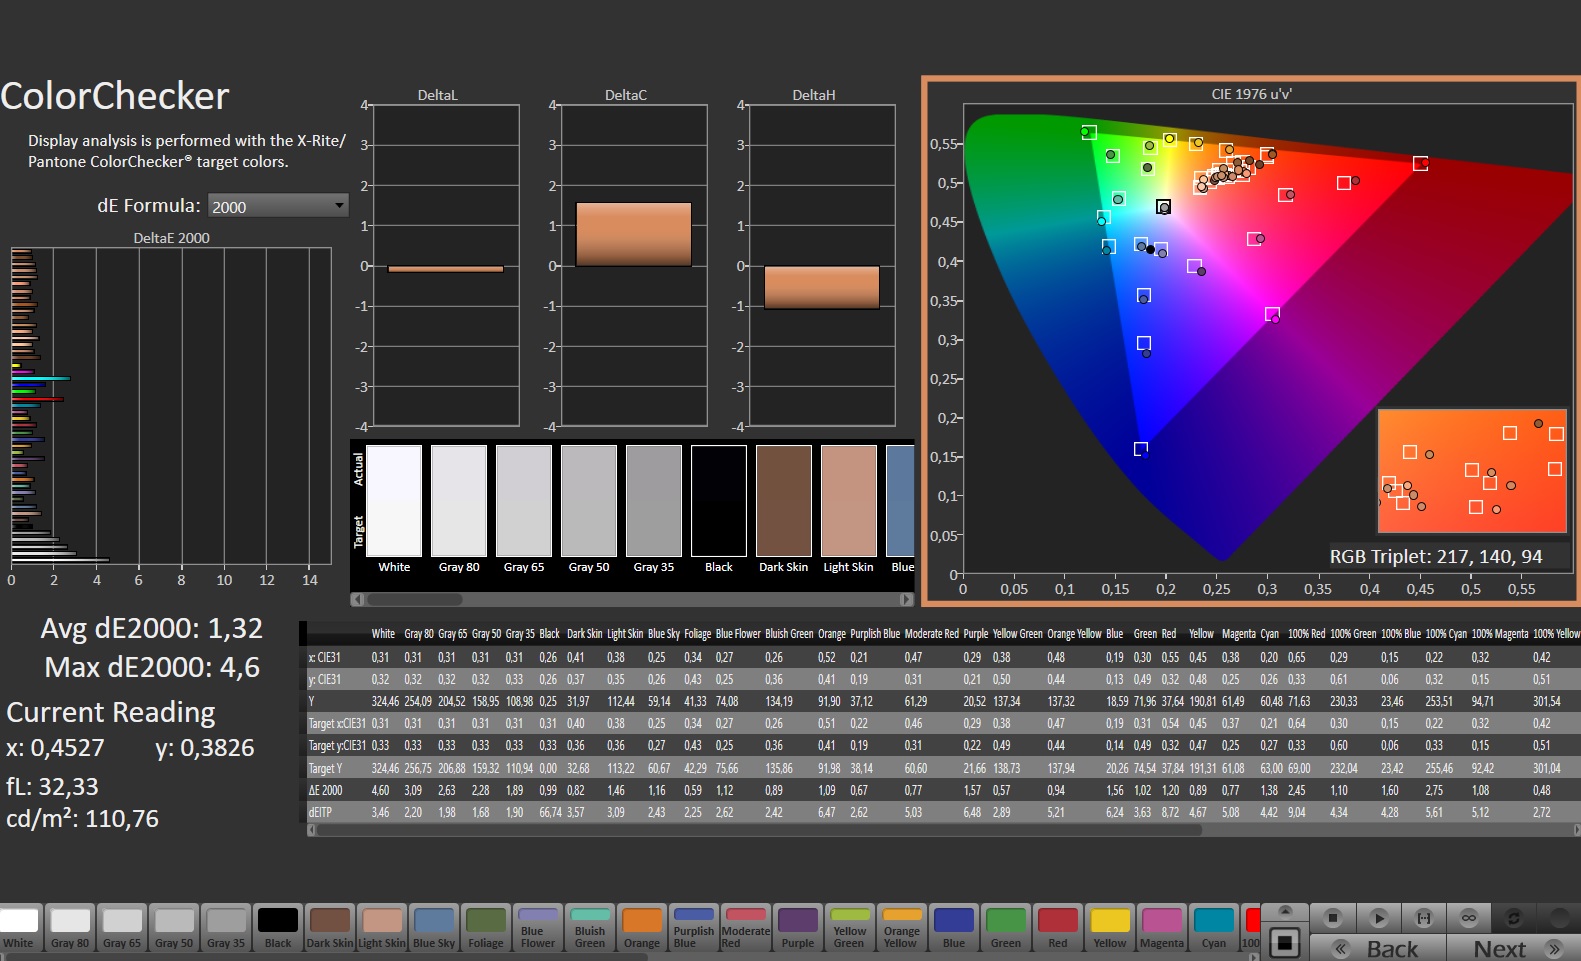
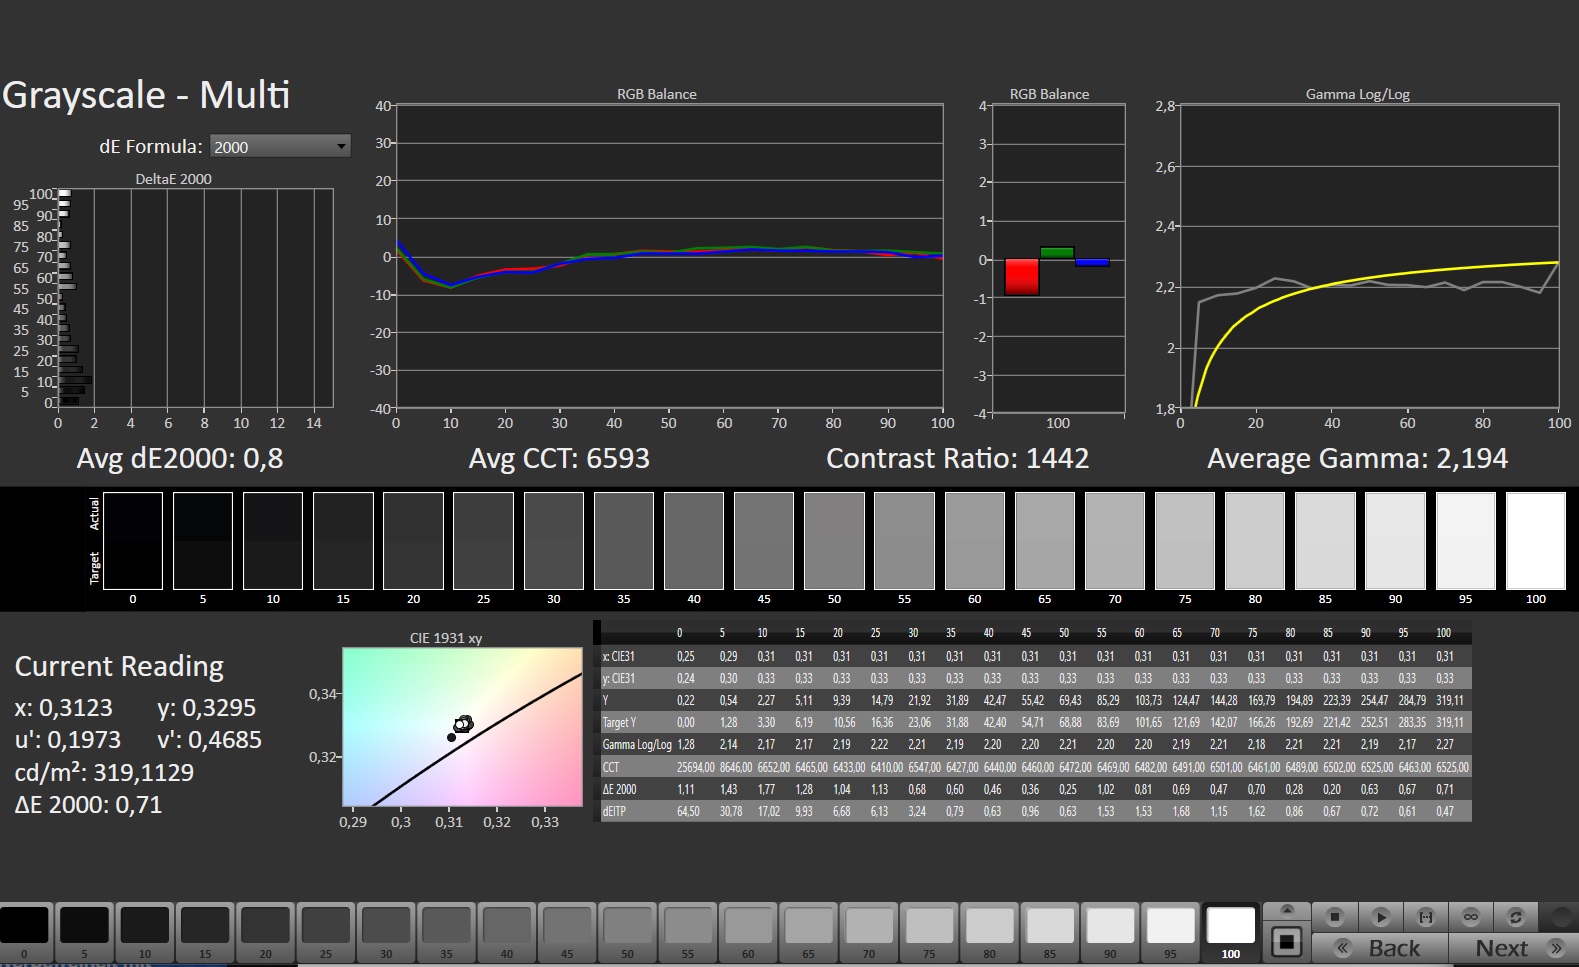
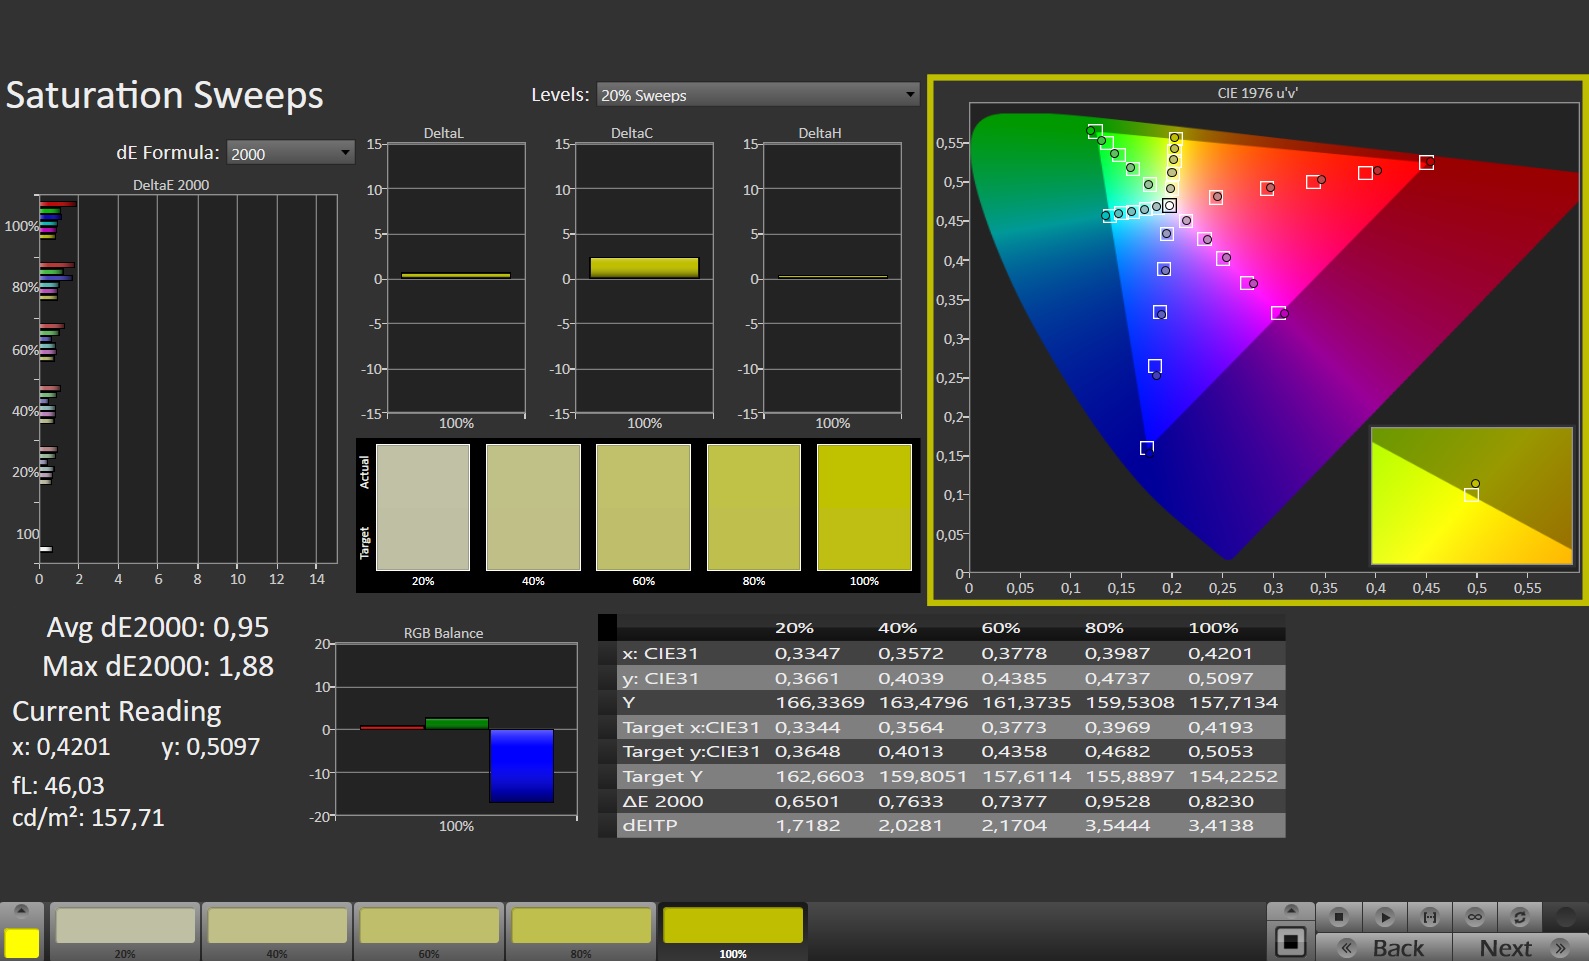
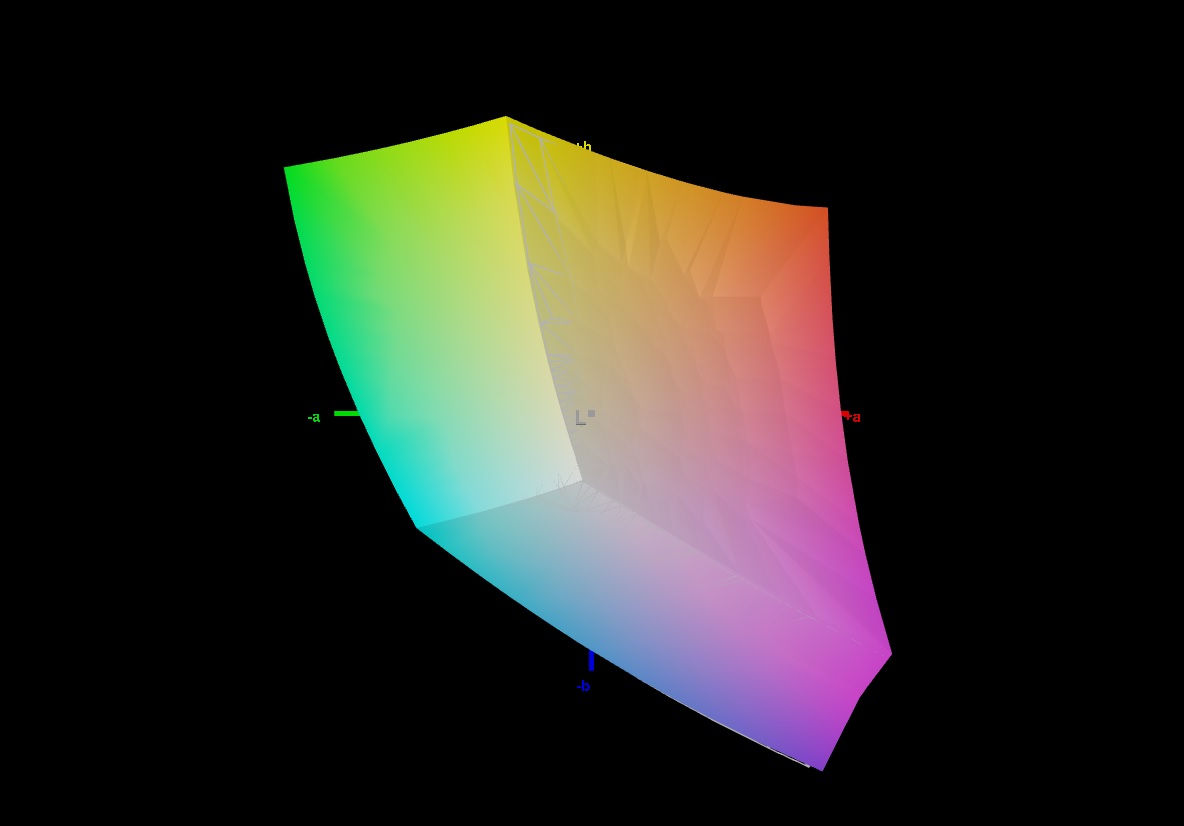
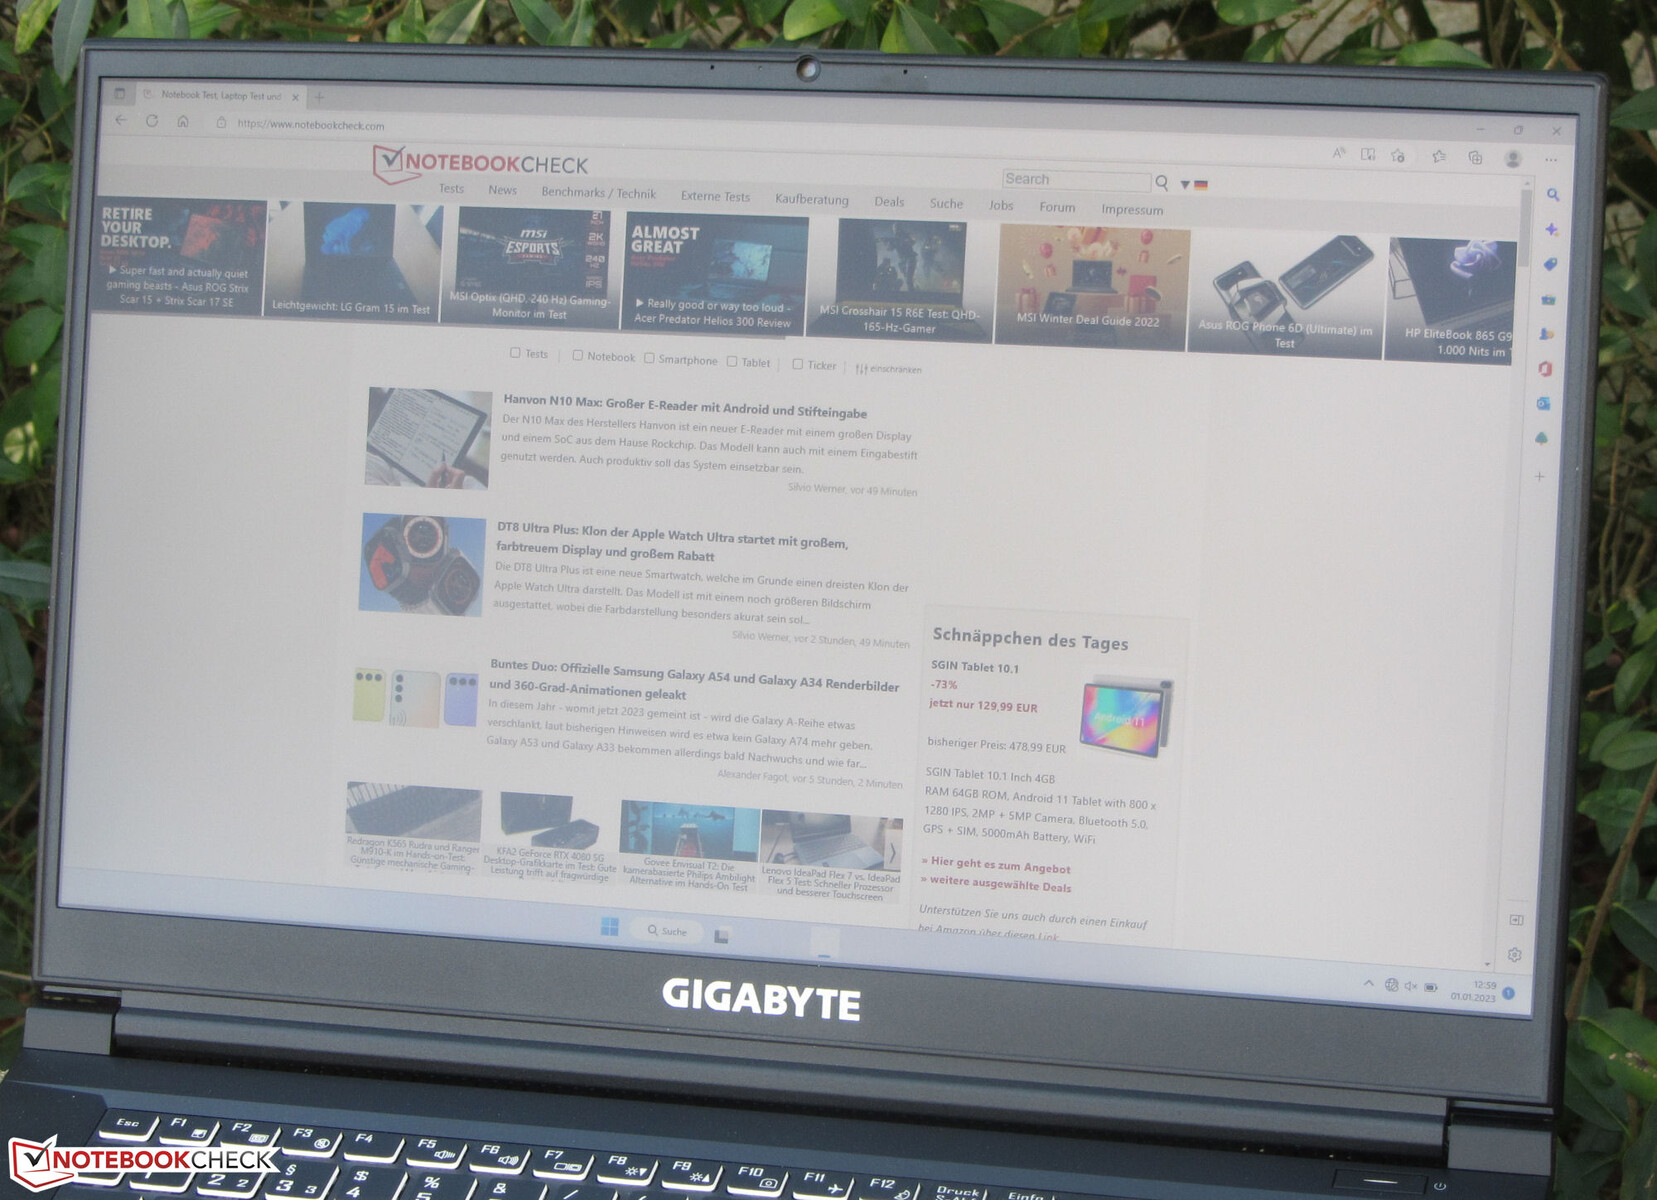
Pantalla - 300-Hz IPS
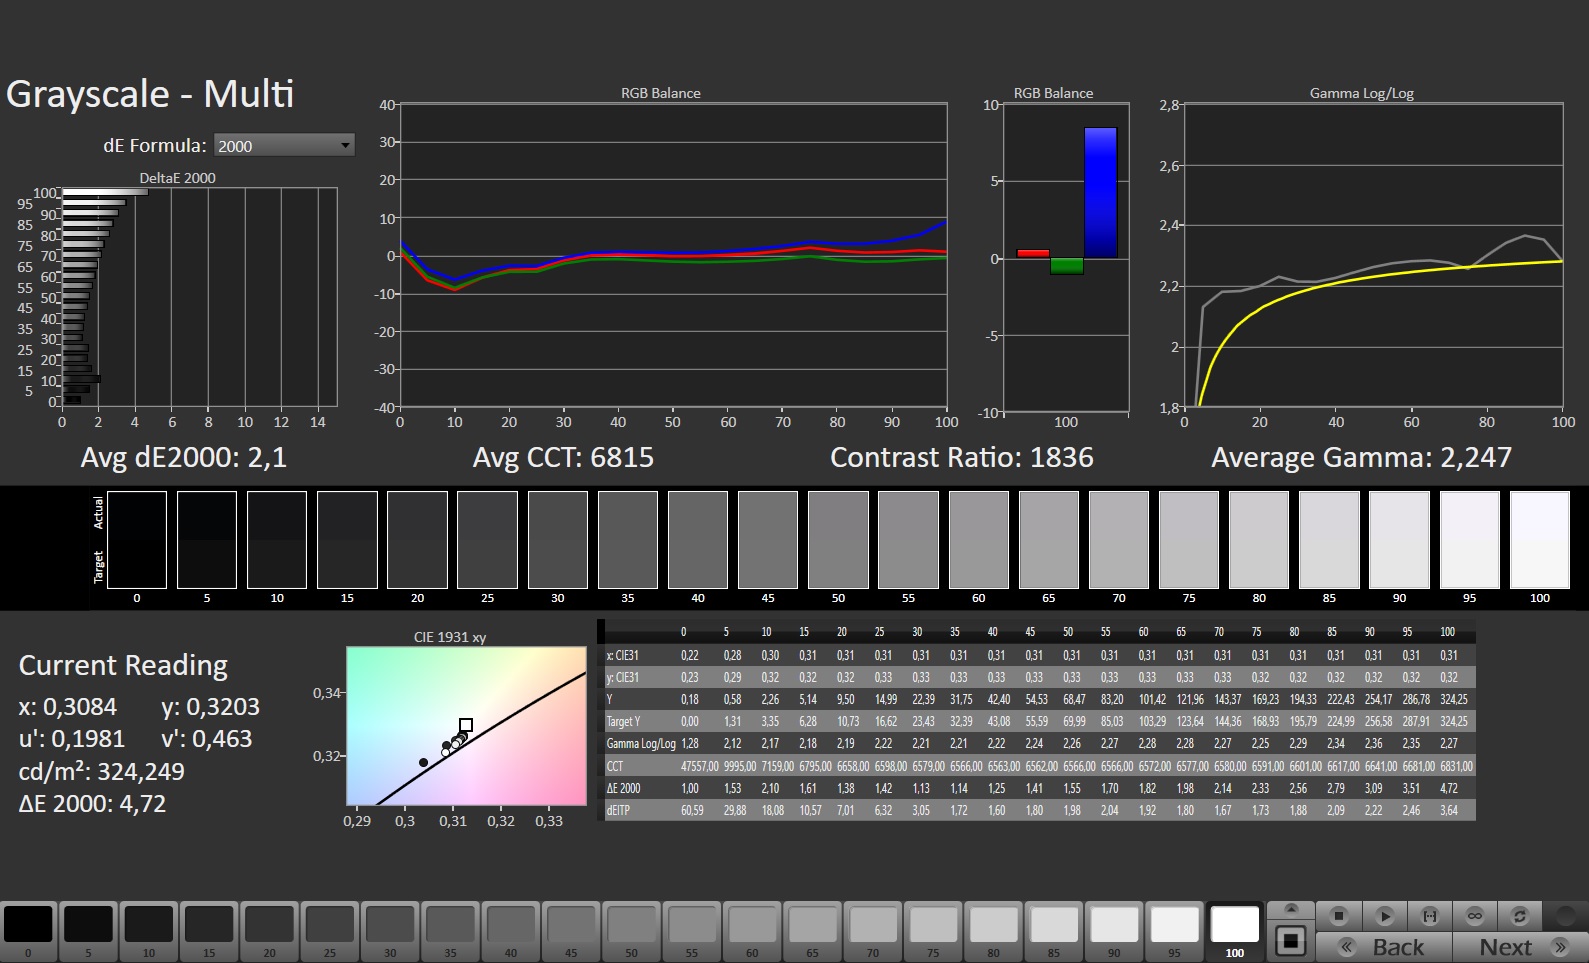
Gigabyte equipa al G7 con una pantalla mate de 17,3 pulgadas (1920 x 1080 píxeles). El brillo (300 nits) y el contraste (1535:1) del panel reactivo de 300 Hz cumplen y superan nuestras expectativas (>300 nits y 1000:1). Además, la pantalla no sufre parpadeos PWM en ningún nivel de brillo.
| |||||||||||||||||||||||||
iluminación: 93 %
Brillo con batería: 307 cd/m²
Contraste: 1535:1 (Negro: 0.2 cd/m²)
ΔE ColorChecker Calman: 1.32 | ∀{0.5-29.43 Ø4.71}
calibrated: 1.03
ΔE Greyscale Calman: 2.1 | ∀{0.09-98 Ø4.96}
71.7% AdobeRGB 1998 (Argyll 3D)
99.8% sRGB (Argyll 3D)
70.4% Display P3 (Argyll 3D)
Gamma: 2.247
CCT: 6815 K
| Gigabyte G7 KE AU Optronics B173HAN05.1, IPS, 1920x1080, 17.3" | HP Pavilion Gaming 17-cd2146ng LGD0611, IPS, 1920x1080, 17.3" | Acer Nitro 5 AN517-55-738R B173HAN04.0, IPS, 1920x1080, 17.3" | Asus TUF Gaming F17 FX707Z-HX011W AU Optronics B173HAN04.9 (AUO4B9D), IPS, 1920x1080, 17.3" | Lenovo IdeaPad Gaming 3 15IAH7 Lenovo LEN156FHD, IPS, 1920x1080, 15.6" | |
|---|---|---|---|---|---|
| Display | -6% | -15% | -42% | -2% | |
| Display P3 Coverage (%) | 70.4 | 64.8 -8% | 58.9 -16% | 40.2 -43% | 69.1 -2% |
| sRGB Coverage (%) | 99.8 | 96.8 -3% | 86.4 -13% | 59.7 -40% | 99.2 -1% |
| AdobeRGB 1998 Coverage (%) | 71.7 | 66.5 -7% | 60.5 -16% | 41.5 -42% | 69.9 -3% |
| Response Times | -80% | -8% | -471% | -81% | |
| Response Time Grey 50% / Grey 80% * (ms) | 5 ? | 12.7 ? -154% | 6 ? -20% | 39.2 ? -684% | 13 ? -160% |
| Response Time Black / White * (ms) | 8.3 ? | 8.7 ? -5% | 8 ? 4% | 29.6 ? -257% | 8.4 ? -1% |
| PWM Frequency (Hz) | |||||
| Screen | -44% | -59% | -97% | -46% | |
| Brightness middle (cd/m²) | 307 | 328 7% | 286 -7% | 287 -7% | 338 10% |
| Brightness (cd/m²) | 301 | 317 5% | 278 -8% | 268 -11% | 329 9% |
| Brightness Distribution (%) | 93 | 94 1% | 89 -4% | 89 -4% | 92 -1% |
| Black Level * (cd/m²) | 0.2 | 0.23 -15% | 0.32 -60% | 0.17 15% | 0.27 -35% |
| Contrast (:1) | 1535 | 1426 -7% | 894 -42% | 1688 10% | 1252 -18% |
| Colorchecker dE 2000 * | 1.32 | 3.83 -190% | 3.05 -131% | 5.1 -286% | 2.88 -118% |
| Colorchecker dE 2000 max. * | 4.6 | 8.51 -85% | 5.83 -27% | 8.72 -90% | 9.35 -103% |
| Colorchecker dE 2000 calibrated * | 1.03 | 0.83 19% | 3.13 -204% | 5.1 -395% | 1.22 -18% |
| Greyscale dE 2000 * | 2.1 | 4.9 -133% | 3.17 -51% | 4.24 -102% | 5 -138% |
| Gamma | 2.247 98% | 2.177 101% | 2.29 96% | 2.44 90% | 2.162 102% |
| CCT | 6815 95% | 7881 82% | 6916 94% | 6008 108% | 7497 87% |
| Media total (Programa/Opciones) | -43% /
-41% | -27% /
-43% | -203% /
-138% | -43% /
-41% |
* ... más pequeño es mejor
La precisión del color de la pantalla es muy buena de fábrica: Con una desviación de 1,32, se sitúa cómodamente dentro del rango ideal (deltaE < 3). Tras calibrar la pantalla nosotros mismos, la desviación desciende a 1,03 para una representación aún más precisa de la escala de grises. La pantalla es capaz de reproducir todo el espacio de color sRGB (100 %), mientras que los espacios de color AdobeRGB (72 %) y DCI-P3 (70 %) no pueden mostrarse en su totalidad. Estos resultados son similares a los de la mayoría de los competidores.

Tiempos de respuesta del display
| ↔ Tiempo de respuesta de Negro a Blanco | ||
|---|---|---|
| 8.3 ms ... subida ↗ y bajada ↘ combinada | ↗ 4.2 ms subida | 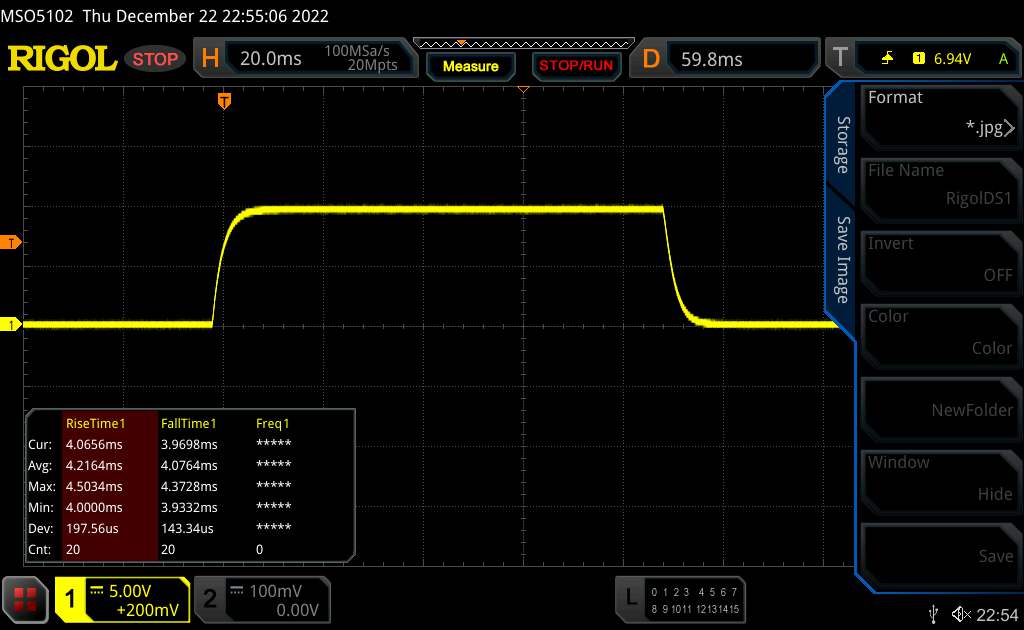 |
| ↘ 4.1 ms bajada | ||
| La pantalla mostró tiempos de respuesta rápidos en nuestros tests y debería ser adecuada para juegos. En comparación, todos los dispositivos de prueba van de ##min### (mínimo) a 240 (máximo) ms. » 24 % de todos los dispositivos son mejores. Esto quiere decir que el tiempo de respuesta medido es mejor que la media (19.8 ms) de todos los dispositivos testados. | ||
| ↔ Tiempo de respuesta 50% Gris a 80% Gris | ||
| 5 ms ... subida ↗ y bajada ↘ combinada | ↗ 2.1 ms subida | 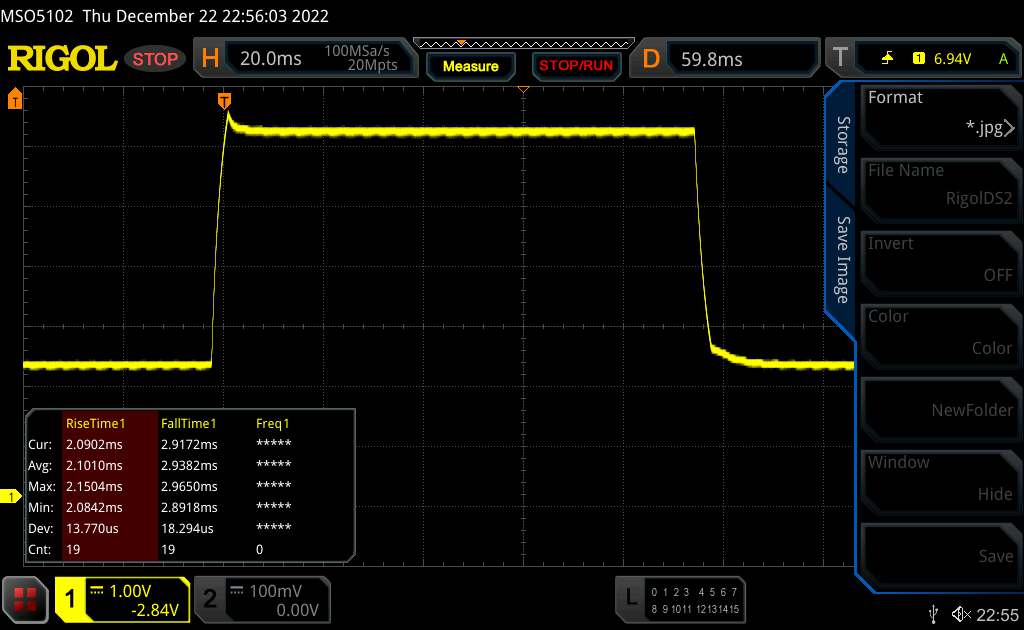 |
| ↘ 2.9 ms bajada | ||
| La pantalla mostró tiempos de respuesta muy rápidos en nuestros tests y debería ser adecuada para juegos frenéticos. En comparación, todos los dispositivos de prueba van de ##min### (mínimo) a 636 (máximo) ms. » 17 % de todos los dispositivos son mejores. Esto quiere decir que el tiempo de respuesta medido es mejor que la media (30.9 ms) de todos los dispositivos testados. | ||
Parpadeo de Pantalla / PWM (Pulse-Width Modulation)
| Parpadeo de Pantalla / PWM no detectado | 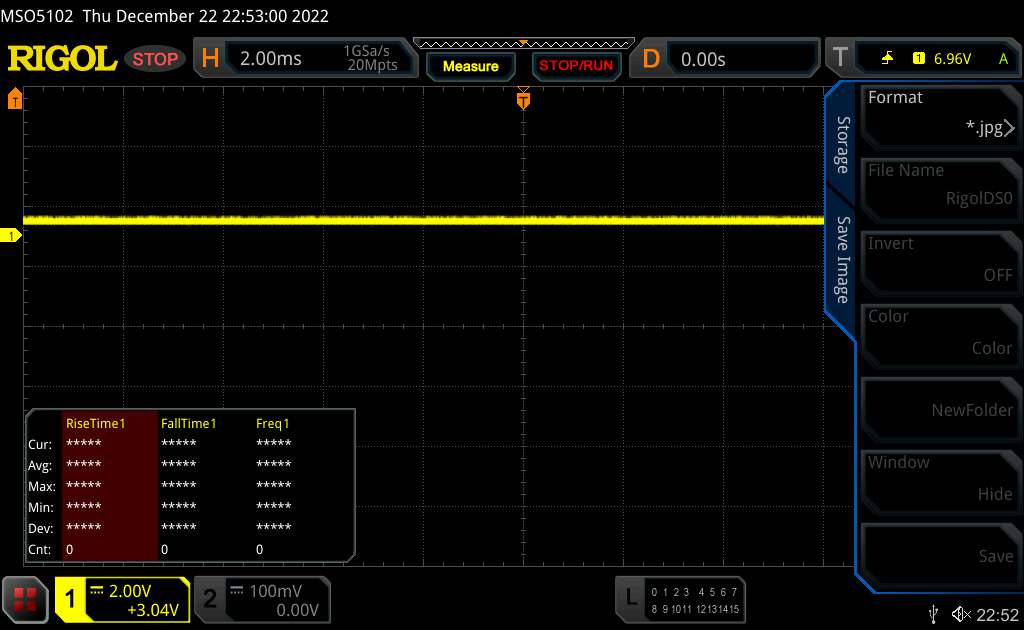 | ||
Comparación: 52 % de todos los dispositivos testados no usaron PWM para atenuar el display. Si se usó, medimos una media de 7744 (mínimo: 5 - máxmo: 343500) Hz. | |||
El panel IPS tiene buenos ángulos de visión y se puede leer desde cualquier ángulo. La legibilidad en exteriores también es buena, siempre que el sol no brille demasiado.

Rendimiento - Gigabyte confía en Alder Lake y Ampere
Gigabyte ofrece con el G7 KE un portátil de juego de alta calidad, que se adapta a los juegos FHD (configuración alta a máxima), pero que también ofrece un buen rendimiento en campos como la reproducción de vídeo y el renderizado.
Condiciones de ensayo
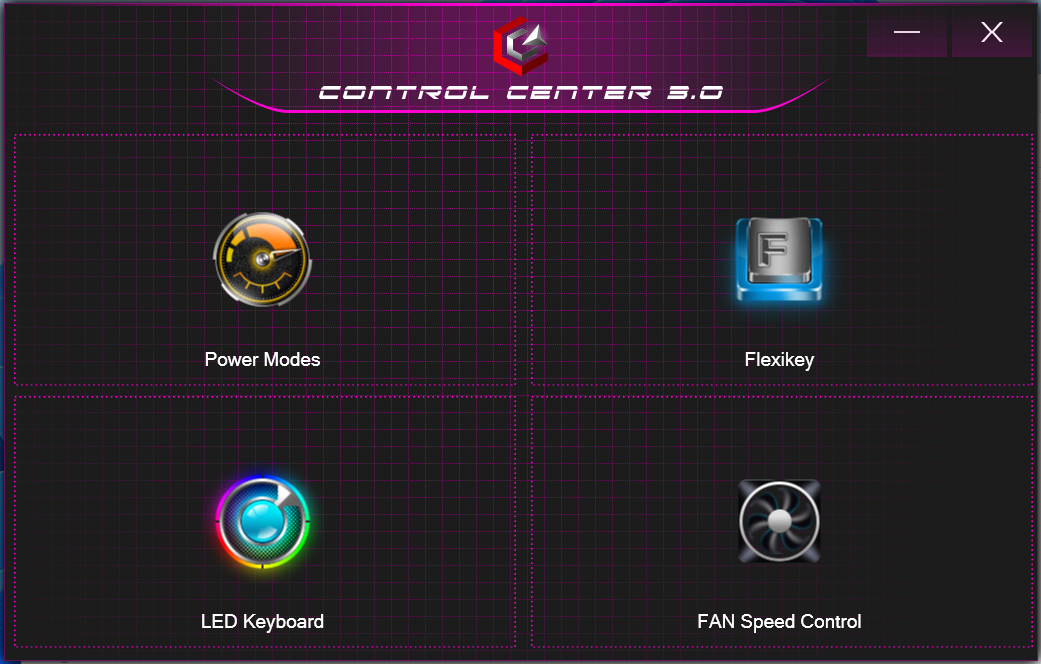
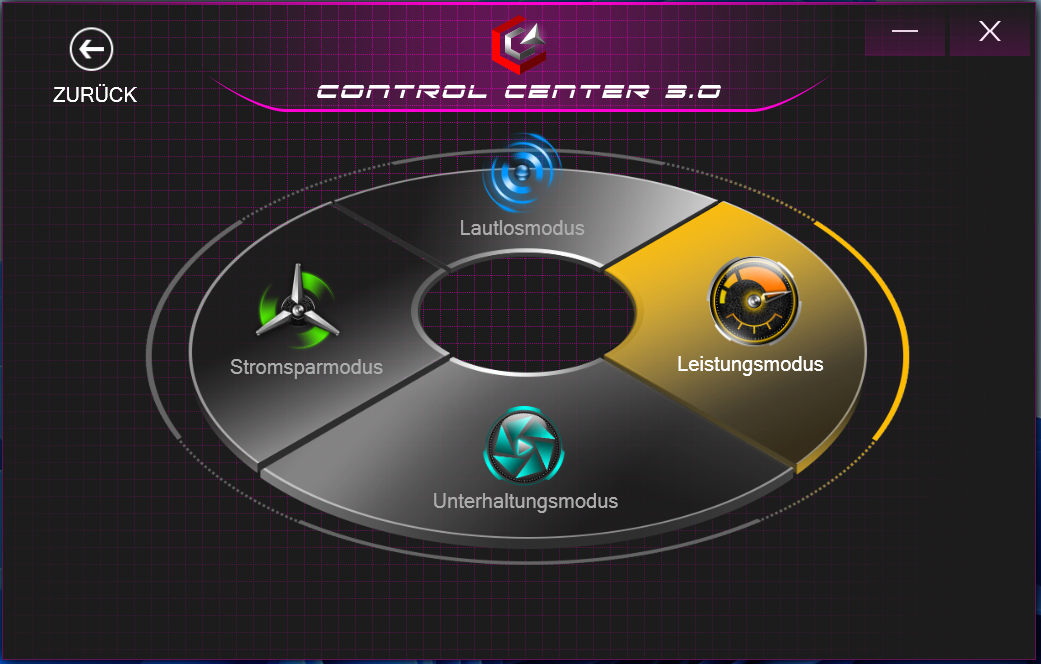
El Centro de Control preinstalado permite a los usuarios controlar varios parámetros, como elegir un perfil de energía (ver tabla). Utilizamos los perfiles "Rendimiento" (pruebas de rendimiento) y "Ahorro de energía" (pruebas de batería).
| Perfil de potencia | Modo de entretenimiento | Modo de ahorro de energía | Modo silencioso | |
|---|---|---|---|---|
| Límite de potencia 1 | 80 vatios | 45 vatios | 15 vatios | 15 vatios |
| Límite de potencia 2 | 135 vatios | 115 vatios | 30 vatios | 30 vatios |
Procesador
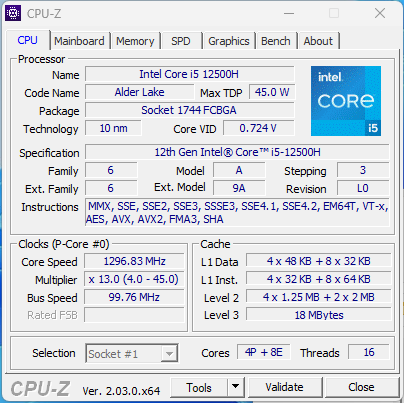
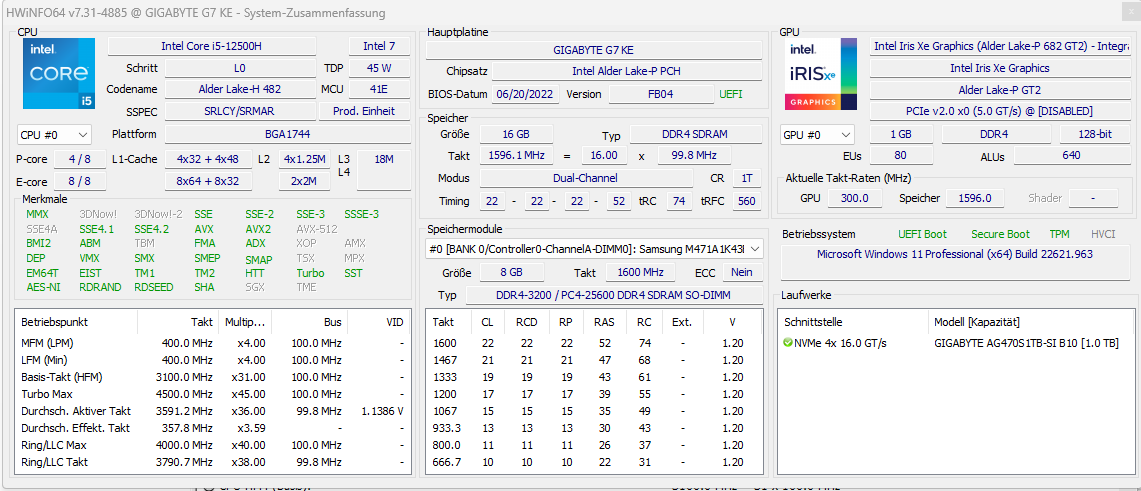
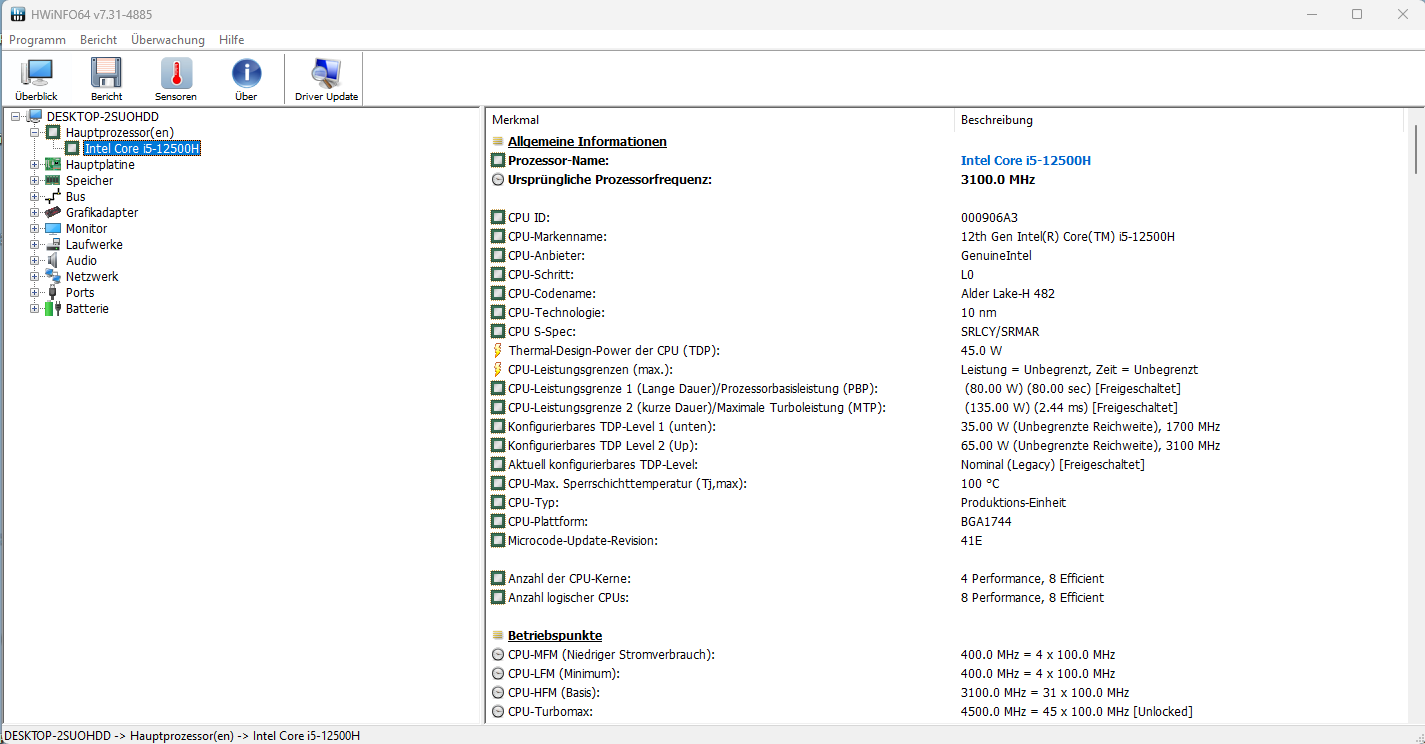
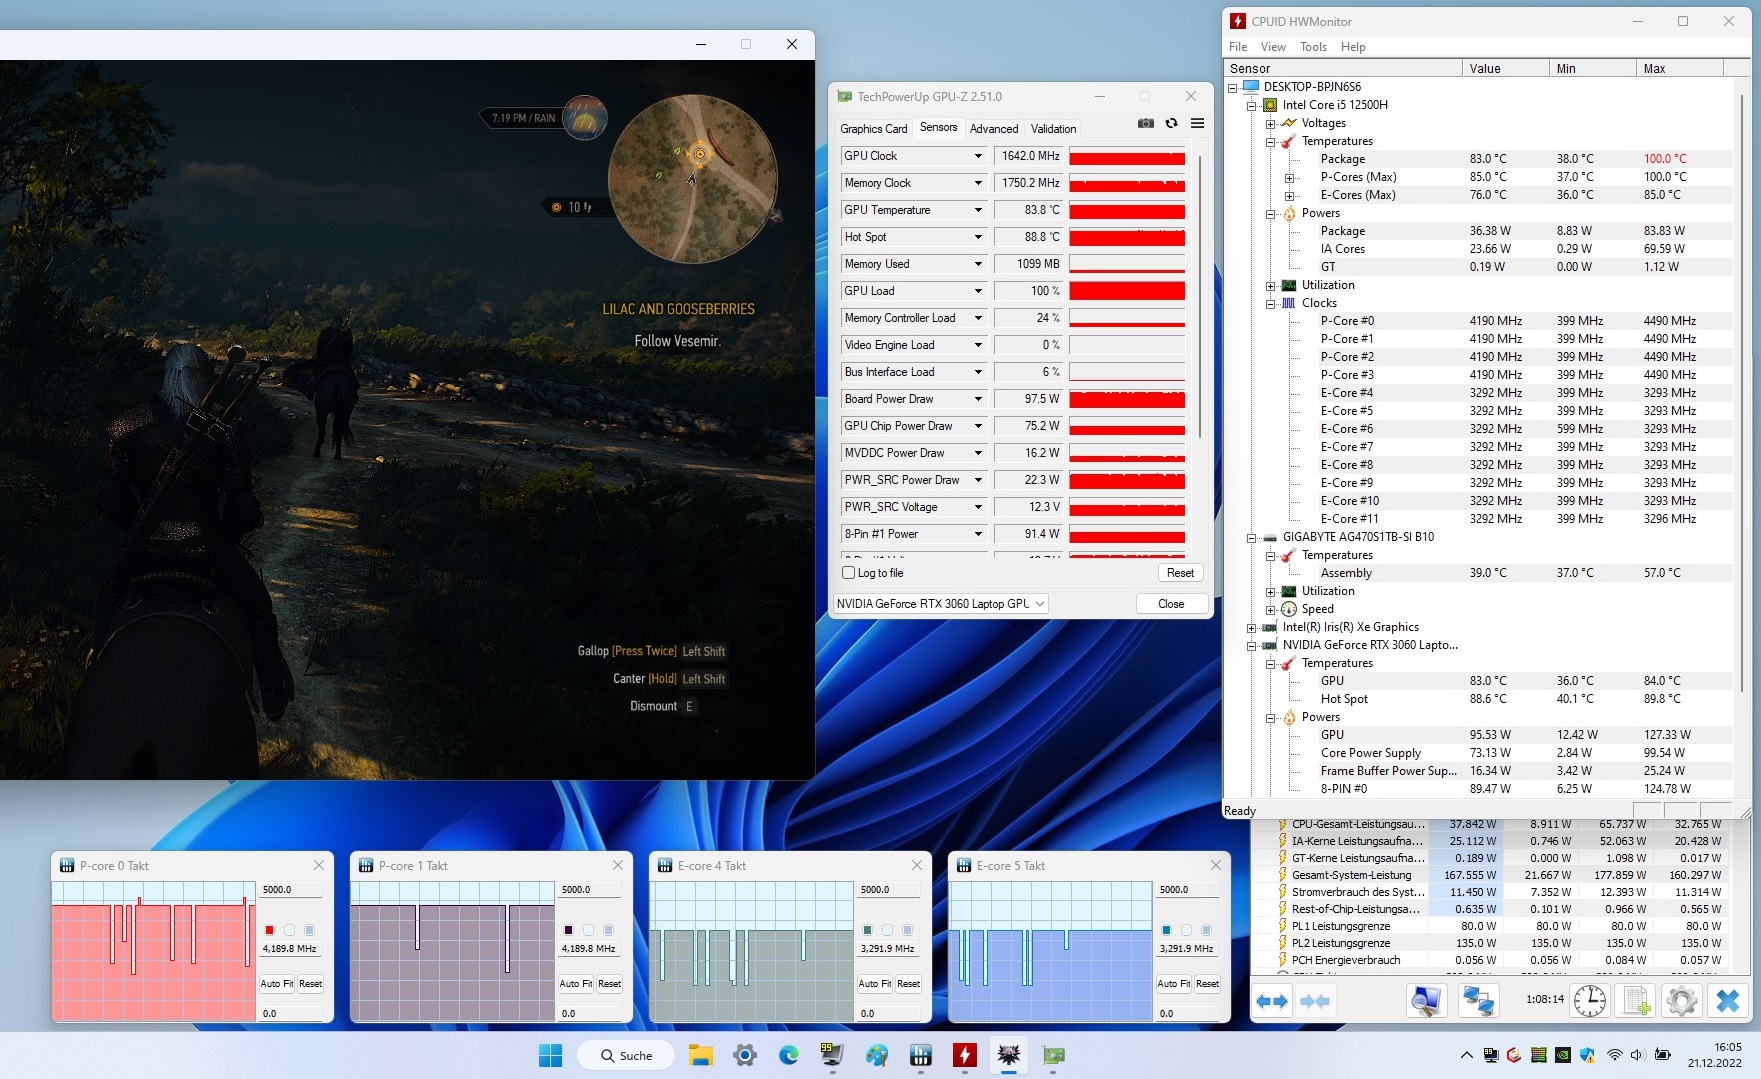
El Core i5-12500H (Alder Lake) consta de cuatro núcleos de rendimiento (Hyper-Threading, de 2,5 a 4,5 GHz) y ocho núcleos de eficiencia (sin Hyper-Threading, de 1,8 a 3,3 GHz). Por tanto, hay un total de 16 núcleos lógicos de CPU.
Las velocidades medias de reloj durante las pruebas multinúcleo (núcleos P: de 3,9 a 4,2 GHz, núcleos E: de 1,5 a 3,1 GHz) y mononúcleo (núcleos P: de 4,2 a 4,5 GHz, núcleos E: de 1,5 a 3,3 GHz) son altas. Las velocidades de reloj se reducen en modo batería. Con nuestro bucle CB15, pudimos confirmar el uso continuo del Turbo de la CPU. Los resultados del Core i5 en los benchmarks están ligeramente por encima de la media en general.
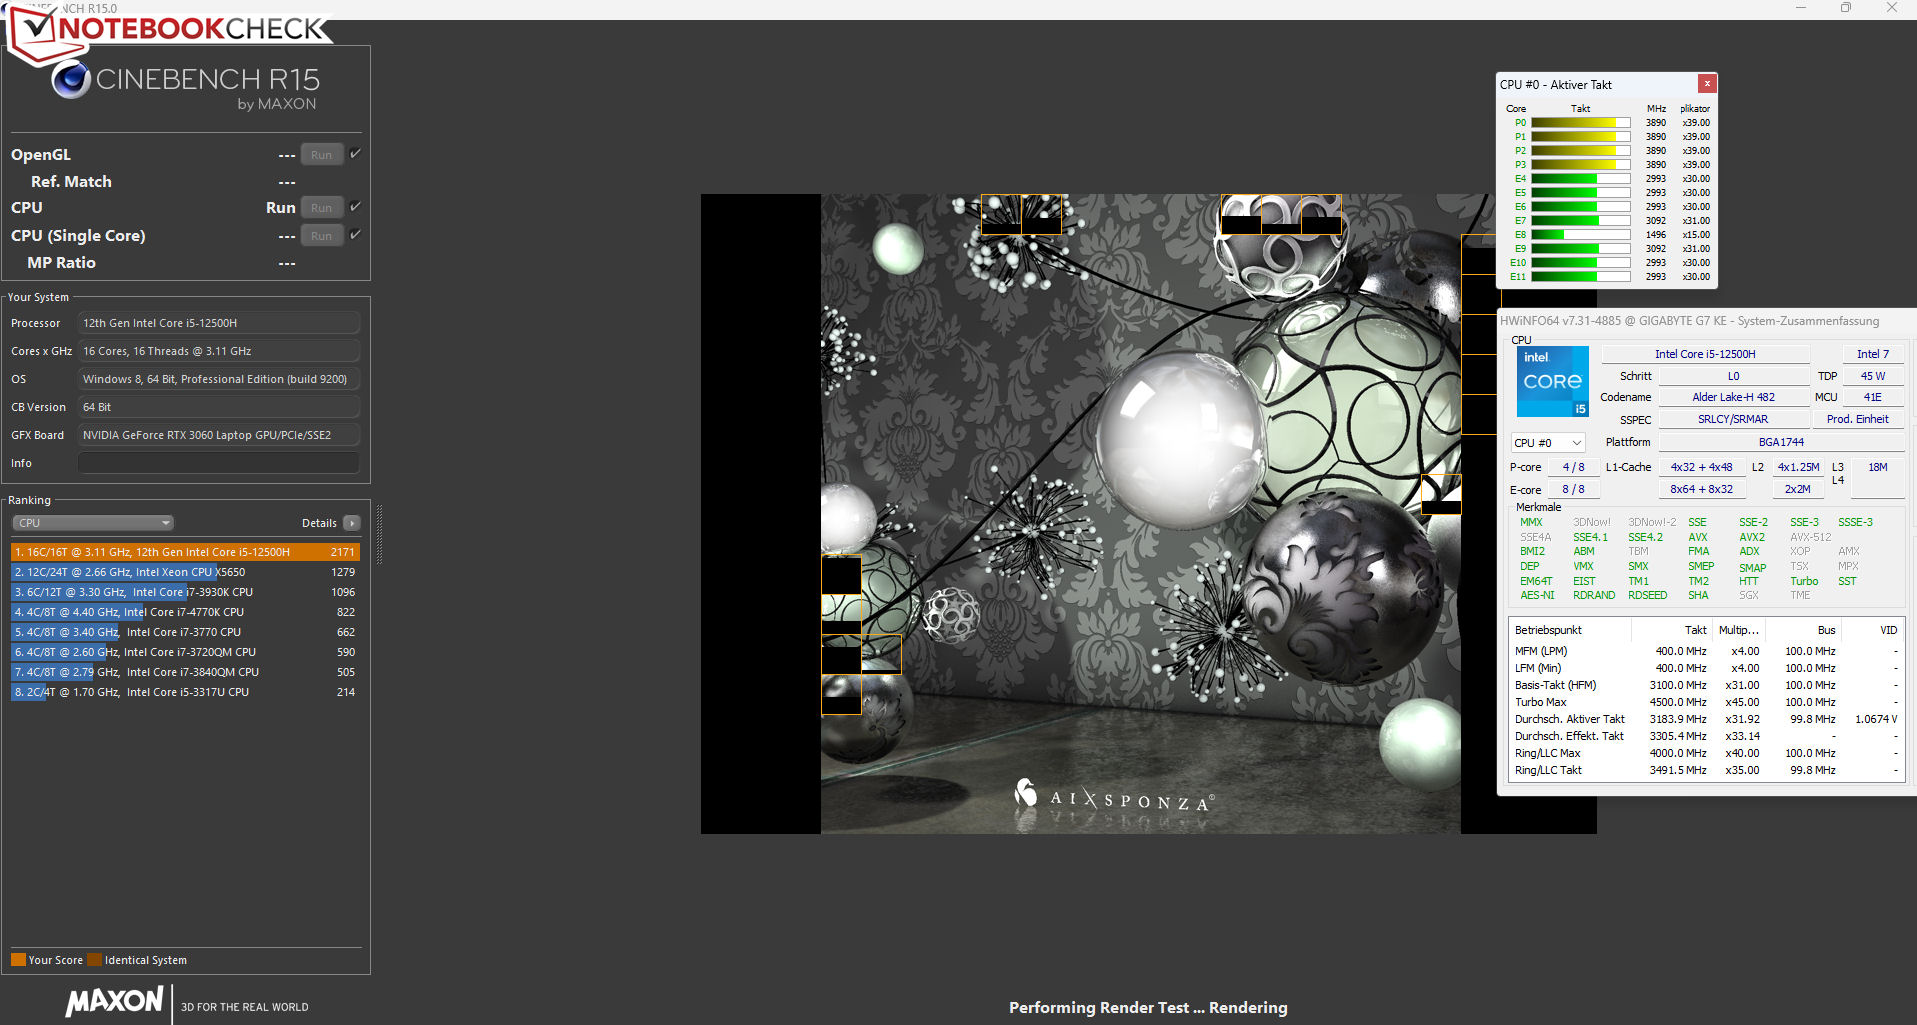
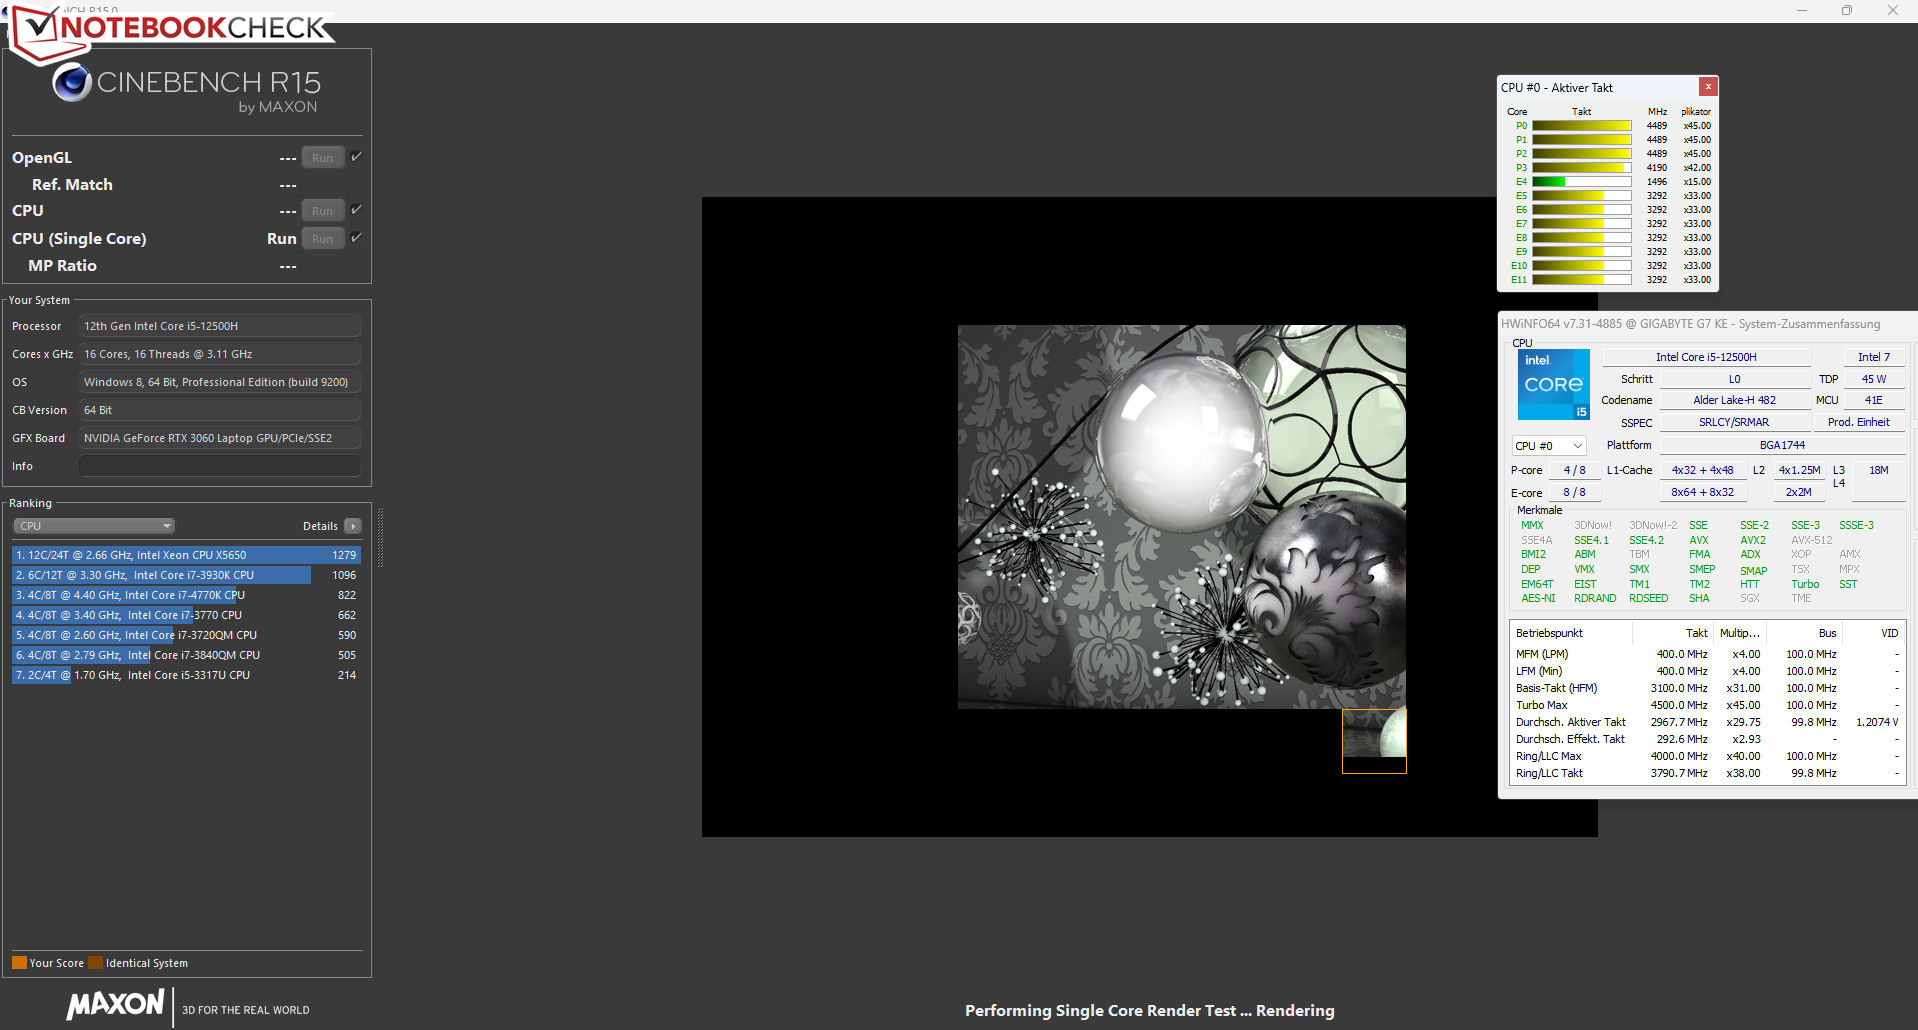
Cinebench R15 Multi Loop
* ... más pequeño es mejor
AIDA64: FP32 Ray-Trace | FPU Julia | CPU SHA3 | CPU Queen | FPU SinJulia | FPU Mandel | CPU AES | CPU ZLib | FP64 Ray-Trace | CPU PhotoWorxx
| Performance rating | |
| Media de la clase Gaming | |
| Gigabyte G7 KE | |
| Lenovo IdeaPad Gaming 3 15IAH7 | |
| Medio Intel Core i5-12500H | |
| Acer Nitro 5 AN517-55-738R | |
| Asus TUF Gaming F17 FX707Z-HX011W | |
| HP Pavilion Gaming 17-cd2146ng | |
| AIDA64 / FP32 Ray-Trace | |
| Media de la clase Gaming (10227 - 85542, n=102, últimos 2 años) | |
| Lenovo IdeaPad Gaming 3 15IAH7 | |
| Gigabyte G7 KE | |
| Medio Intel Core i5-12500H (6851 - 13947, n=9) | |
| Acer Nitro 5 AN517-55-738R | |
| HP Pavilion Gaming 17-cd2146ng | |
| Asus TUF Gaming F17 FX707Z-HX011W | |
| AIDA64 / FPU Julia | |
| Media de la clase Gaming (51376 - 372155, n=102, últimos 2 años) | |
| Lenovo IdeaPad Gaming 3 15IAH7 | |
| Gigabyte G7 KE | |
| Medio Intel Core i5-12500H (29874 - 68178, n=9) | |
| Acer Nitro 5 AN517-55-738R | |
| Asus TUF Gaming F17 FX707Z-HX011W | |
| HP Pavilion Gaming 17-cd2146ng | |
| AIDA64 / CPU SHA3 | |
| Media de la clase Gaming (2180 - 10115, n=102, últimos 2 años) | |
| Lenovo IdeaPad Gaming 3 15IAH7 | |
| Gigabyte G7 KE | |
| Medio Intel Core i5-12500H (2287 - 3337, n=9) | |
| Acer Nitro 5 AN517-55-738R | |
| Asus TUF Gaming F17 FX707Z-HX011W | |
| HP Pavilion Gaming 17-cd2146ng | |
| AIDA64 / CPU Queen | |
| Media de la clase Gaming (49785 - 173351, n=86, últimos 2 años) | |
| Asus TUF Gaming F17 FX707Z-HX011W | |
| Acer Nitro 5 AN517-55-738R | |
| Lenovo IdeaPad Gaming 3 15IAH7 | |
| Gigabyte G7 KE | |
| Medio Intel Core i5-12500H (77935 - 80703, n=9) | |
| HP Pavilion Gaming 17-cd2146ng | |
| AIDA64 / FPU SinJulia | |
| Media de la clase Gaming (4424 - 33636, n=102, últimos 2 años) | |
| Acer Nitro 5 AN517-55-738R | |
| Asus TUF Gaming F17 FX707Z-HX011W | |
| Gigabyte G7 KE | |
| Lenovo IdeaPad Gaming 3 15IAH7 | |
| Medio Intel Core i5-12500H (6590 - 7431, n=9) | |
| HP Pavilion Gaming 17-cd2146ng | |
| AIDA64 / FPU Mandel | |
| Media de la clase Gaming (25115 - 196829, n=102, últimos 2 años) | |
| Lenovo IdeaPad Gaming 3 15IAH7 | |
| Gigabyte G7 KE | |
| Medio Intel Core i5-12500H (18252 - 34041, n=9) | |
| Acer Nitro 5 AN517-55-738R | |
| Asus TUF Gaming F17 FX707Z-HX011W | |
| HP Pavilion Gaming 17-cd2146ng | |
| AIDA64 / CPU AES | |
| Lenovo IdeaPad Gaming 3 15IAH7 | |
| Gigabyte G7 KE | |
| Media de la clase Gaming (39258 - 247074, n=102, últimos 2 años) | |
| Medio Intel Core i5-12500H (50298 - 111567, n=9) | |
| Acer Nitro 5 AN517-55-738R | |
| Asus TUF Gaming F17 FX707Z-HX011W | |
| HP Pavilion Gaming 17-cd2146ng | |
| AIDA64 / CPU ZLib | |
| Media de la clase Gaming (574 - 2531, n=102, últimos 2 años) | |
| Gigabyte G7 KE | |
| Acer Nitro 5 AN517-55-738R | |
| Lenovo IdeaPad Gaming 3 15IAH7 | |
| Medio Intel Core i5-12500H (746 - 924, n=9) | |
| Asus TUF Gaming F17 FX707Z-HX011W | |
| HP Pavilion Gaming 17-cd2146ng | |
| AIDA64 / FP64 Ray-Trace | |
| Media de la clase Gaming (5509 - 45446, n=102, últimos 2 años) | |
| Lenovo IdeaPad Gaming 3 15IAH7 | |
| Gigabyte G7 KE | |
| Medio Intel Core i5-12500H (3848 - 7405, n=9) | |
| Acer Nitro 5 AN517-55-738R | |
| Asus TUF Gaming F17 FX707Z-HX011W | |
| HP Pavilion Gaming 17-cd2146ng | |
| AIDA64 / CPU PhotoWorxx | |
| Media de la clase Gaming (12271 - 89891, n=102, últimos 2 años) | |
| Asus TUF Gaming F17 FX707Z-HX011W | |
| Medio Intel Core i5-12500H (13686 - 43813, n=9) | |
| Gigabyte G7 KE | |
| HP Pavilion Gaming 17-cd2146ng | |
| Acer Nitro 5 AN517-55-738R | |
| Lenovo IdeaPad Gaming 3 15IAH7 | |
Rendimiento del sistema
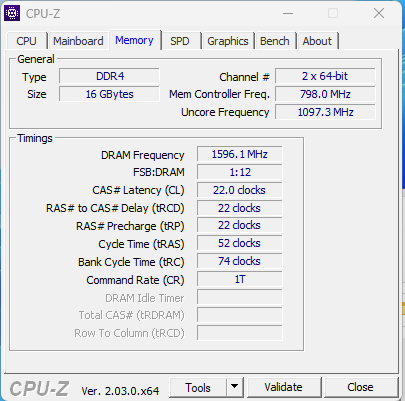
El sistema es fluido y sensible, y ofrece rendimiento suficiente para renderizado, edición de vídeo y juegos. Los resultados de las pruebas PCMark son buenos. Para la memoria DDR4-3200, las tasas de transferencia de la memoria del sistema cumplen nuestras expectativas.
CrossMark: Overall | Productivity | Creativity | Responsiveness
| PCMark 10 / Score | |
| Media de la clase Gaming (5828 - 12414, n=93, últimos 2 años) | |
| Lenovo IdeaPad Gaming 3 15IAH7 | |
| Medio Intel Core i5-12500H, NVIDIA GeForce RTX 3060 Laptop GPU (6126 - 7201, n=2) | |
| Acer Nitro 5 AN517-55-738R | |
| Gigabyte G7 KE | |
| Asus TUF Gaming F17 FX707Z-HX011W | |
| HP Pavilion Gaming 17-cd2146ng | |
| PCMark 10 / Essentials | |
| Medio Intel Core i5-12500H, NVIDIA GeForce RTX 3060 Laptop GPU (10301 - 11150, n=2) | |
| Media de la clase Gaming (8810 - 11935, n=97, últimos 2 años) | |
| Gigabyte G7 KE | |
| Lenovo IdeaPad Gaming 3 15IAH7 | |
| Acer Nitro 5 AN517-55-738R | |
| Asus TUF Gaming F17 FX707Z-HX011W | |
| HP Pavilion Gaming 17-cd2146ng | |
| PCMark 10 / Productivity | |
| Media de la clase Gaming (6845 - 25323, n=95, últimos 2 años) | |
| Lenovo IdeaPad Gaming 3 15IAH7 | |
| Medio Intel Core i5-12500H, NVIDIA GeForce RTX 3060 Laptop GPU (9038 - 9475, n=2) | |
| Acer Nitro 5 AN517-55-738R | |
| Gigabyte G7 KE | |
| HP Pavilion Gaming 17-cd2146ng | |
| Asus TUF Gaming F17 FX707Z-HX011W | |
| PCMark 10 / Digital Content Creation | |
| Media de la clase Gaming (7602 - 19954, n=95, últimos 2 años) | |
| Asus TUF Gaming F17 FX707Z-HX011W | |
| Acer Nitro 5 AN517-55-738R | |
| Lenovo IdeaPad Gaming 3 15IAH7 | |
| Medio Intel Core i5-12500H, NVIDIA GeForce RTX 3060 Laptop GPU (6703 - 9593, n=2) | |
| Gigabyte G7 KE | |
| HP Pavilion Gaming 17-cd2146ng | |
| CrossMark / Overall | |
| Media de la clase Gaming (1366 - 2409, n=94, últimos 2 años) | |
| Gigabyte G7 KE | |
| Acer Nitro 5 AN517-55-738R | |
| Medio Intel Core i5-12500H, NVIDIA GeForce RTX 3060 Laptop GPU (1752 - 1824, n=2) | |
| Asus TUF Gaming F17 FX707Z-HX011W | |
| CrossMark / Productivity | |
| Media de la clase Gaming (1386 - 2254, n=94, últimos 2 años) | |
| Gigabyte G7 KE | |
| Acer Nitro 5 AN517-55-738R | |
| Medio Intel Core i5-12500H, NVIDIA GeForce RTX 3060 Laptop GPU (1720 - 1804, n=2) | |
| Asus TUF Gaming F17 FX707Z-HX011W | |
| CrossMark / Creativity | |
| Media de la clase Gaming (1343 - 2786, n=94, últimos 2 años) | |
| Asus TUF Gaming F17 FX707Z-HX011W | |
| Acer Nitro 5 AN517-55-738R | |
| Gigabyte G7 KE | |
| Medio Intel Core i5-12500H, NVIDIA GeForce RTX 3060 Laptop GPU (1778 - 1800, n=2) | |
| CrossMark / Responsiveness | |
| Gigabyte G7 KE | |
| Medio Intel Core i5-12500H, NVIDIA GeForce RTX 3060 Laptop GPU (1771 - 1966, n=2) | |
| Acer Nitro 5 AN517-55-738R | |
| Media de la clase Gaming (1226 - 2334, n=94, últimos 2 años) | |
| Asus TUF Gaming F17 FX707Z-HX011W | |
| PCMark 8 Home Score Accelerated v2 | 4560 puntos | |
| PCMark 8 Work Score Accelerated v2 | 6853 puntos | |
| PCMark 10 Score | 6126 puntos | |
ayuda | ||
| AIDA64 / Memory Copy | |
| Media de la clase Gaming (21750 - 129946, n=102, últimos 2 años) | |
| Asus TUF Gaming F17 FX707Z-HX011W | |
| Medio Intel Core i5-12500H (23850 - 66598, n=9) | |
| Gigabyte G7 KE | |
| Acer Nitro 5 AN517-55-738R | |
| HP Pavilion Gaming 17-cd2146ng | |
| Lenovo IdeaPad Gaming 3 15IAH7 | |
| AIDA64 / Memory Read | |
| Media de la clase Gaming (22956 - 118858, n=102, últimos 2 años) | |
| Asus TUF Gaming F17 FX707Z-HX011W | |
| Medio Intel Core i5-12500H (24879 - 68013, n=9) | |
| Gigabyte G7 KE | |
| Acer Nitro 5 AN517-55-738R | |
| HP Pavilion Gaming 17-cd2146ng | |
| Lenovo IdeaPad Gaming 3 15IAH7 | |
| AIDA64 / Memory Write | |
| Media de la clase Gaming (22297 - 135096, n=102, últimos 2 años) | |
| Asus TUF Gaming F17 FX707Z-HX011W | |
| Acer Nitro 5 AN517-55-738R | |
| Medio Intel Core i5-12500H (23543 - 58797, n=9) | |
| Gigabyte G7 KE | |
| HP Pavilion Gaming 17-cd2146ng | |
| Lenovo IdeaPad Gaming 3 15IAH7 | |
| AIDA64 / Memory Latency | |
| Media de la clase Gaming (75.3 - 165.4, n=102, últimos 2 años) | |
| Medio Intel Core i5-12500H (83.8 - 114.7, n=9) | |
| Lenovo IdeaPad Gaming 3 15IAH7 | |
| Gigabyte G7 KE | |
| HP Pavilion Gaming 17-cd2146ng | |
| Asus TUF Gaming F17 FX707Z-HX011W | |
| Acer Nitro 5 AN517-55-738R | |
* ... más pequeño es mejor
Latencia del CPD
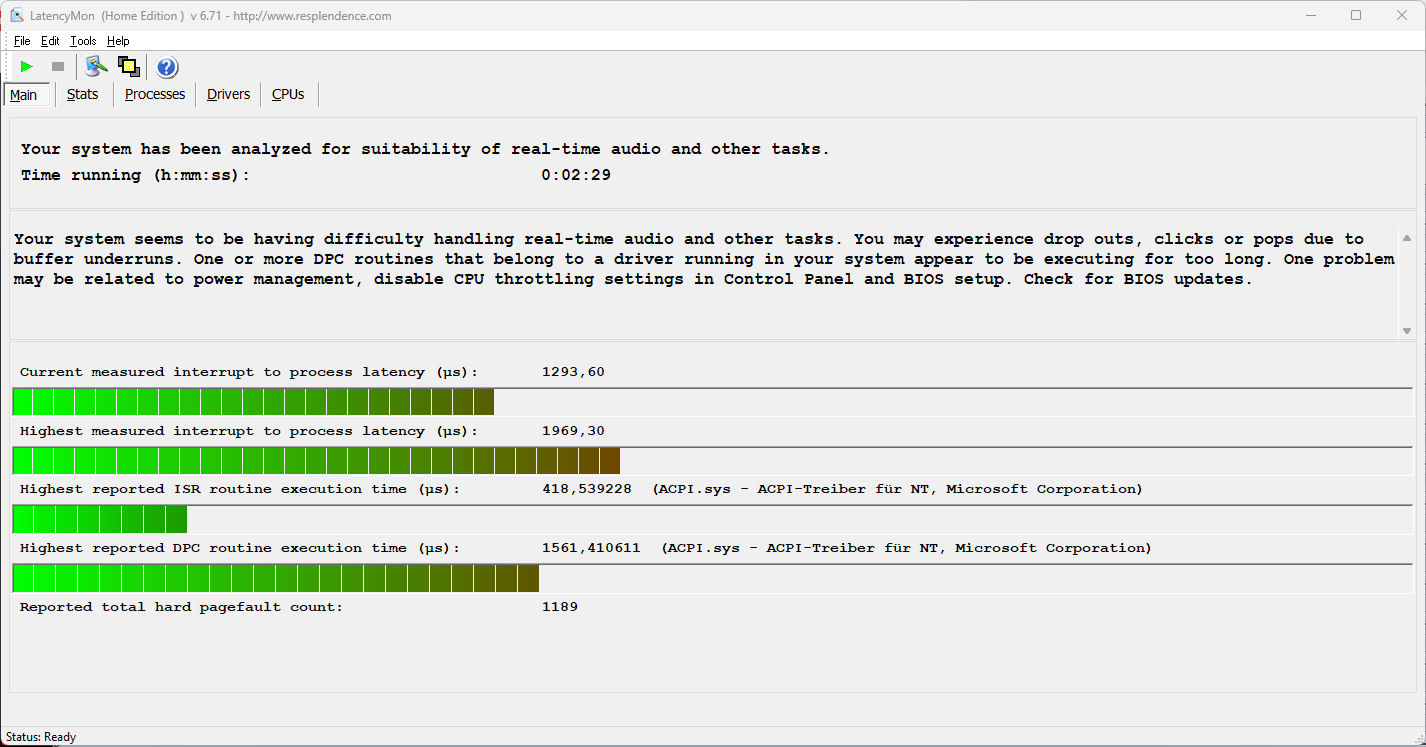
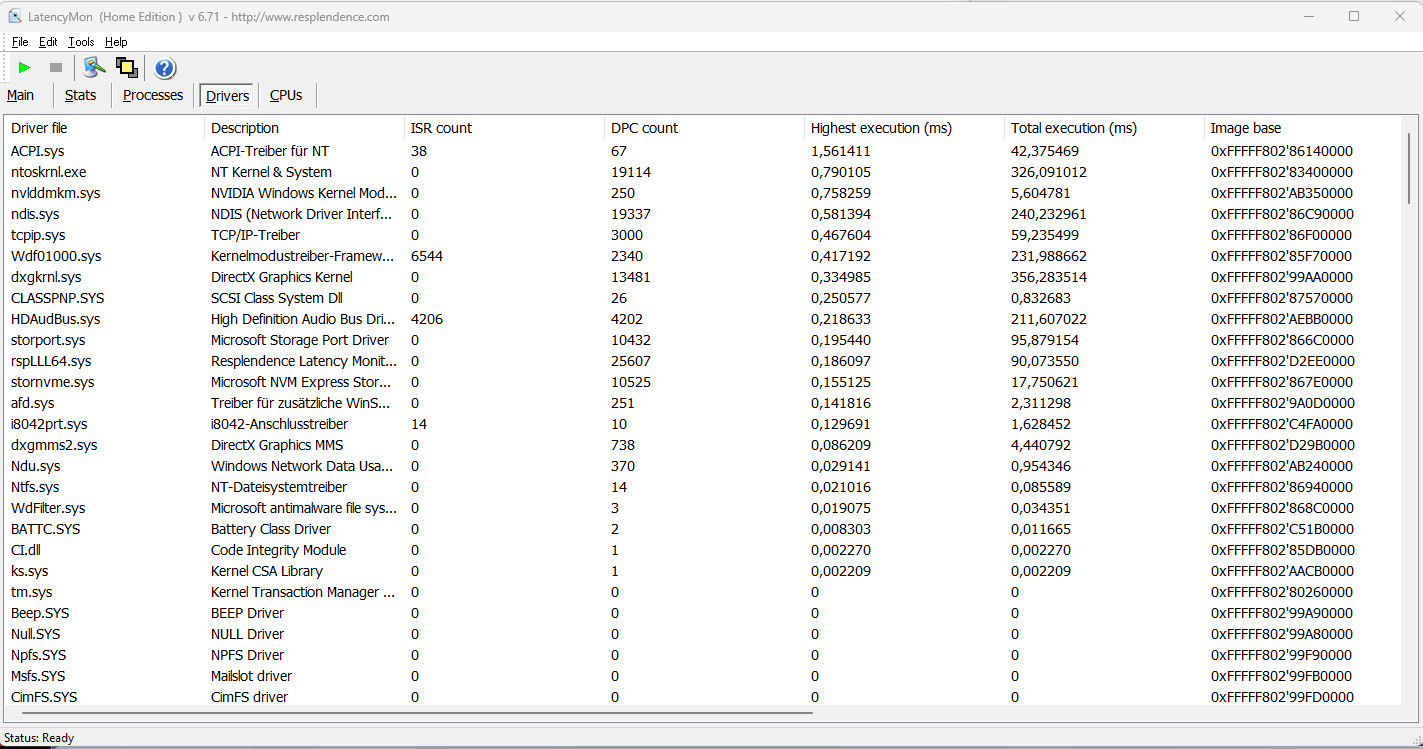
Nuestra prueba estandarizada Latency Monitor (navegación web, reproducción de vídeo 4K, Prime95 de alta carga) revela latencias DPC problemáticas. Con la configuración de hardware y software en el momento de la prueba, el sistema parece inadecuado para la edición de audio y vídeo en tiempo real. Futuras actualizaciones de software pueden mejorar o empeorar el problema.
| DPC Latencies / LatencyMon - interrupt to process latency (max), Web, Youtube, Prime95 | |
| Asus TUF Gaming F17 FX707Z-HX011W | |
| Gigabyte G7 KE | |
| Lenovo IdeaPad Gaming 3 15IAH7 | |
| HP Pavilion Gaming 17-cd2146ng | |
| Acer Nitro 5 AN517-55-738R | |
* ... más pequeño es mejor
Solución de almacenamiento
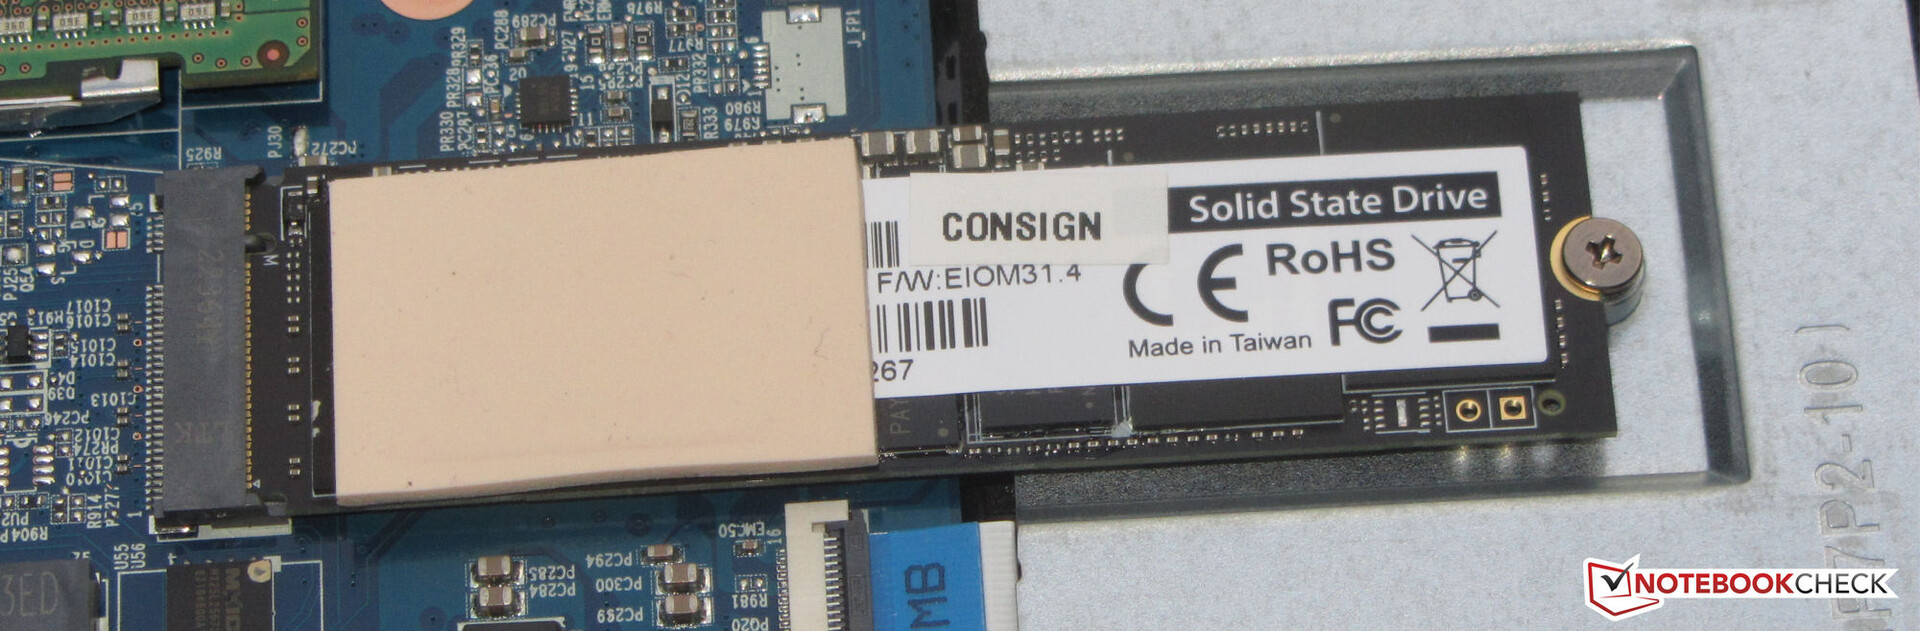
Gigabyte equipa el portátil con su propio SSD PCIe-4 (1 TB, M.2-2280), que logra excelentes tasas de transferencia. Por desgracia, la unidad sufre de ralentización térmica a pesar de la lámina metálica de refrigeración en el interior de la placa inferior. Hay espacio para un total de dos SSD M.2-2280 (1x PCIe 4.0, 1x PCIe 3.0).

* ... más pequeño es mejor
Disk Throttling: DiskSpd Read Loop, Queue Depth 8
Rendimiento de la GPU
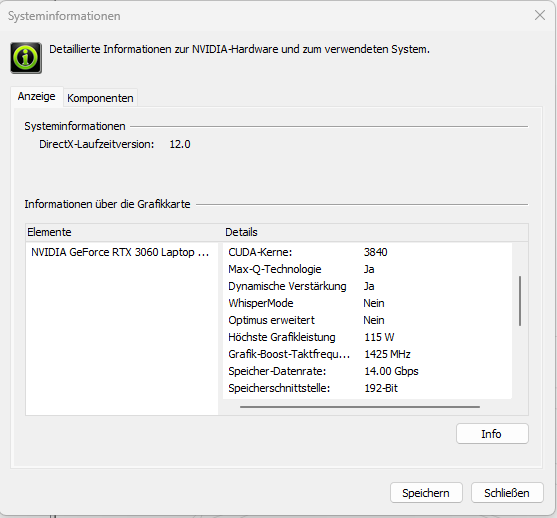
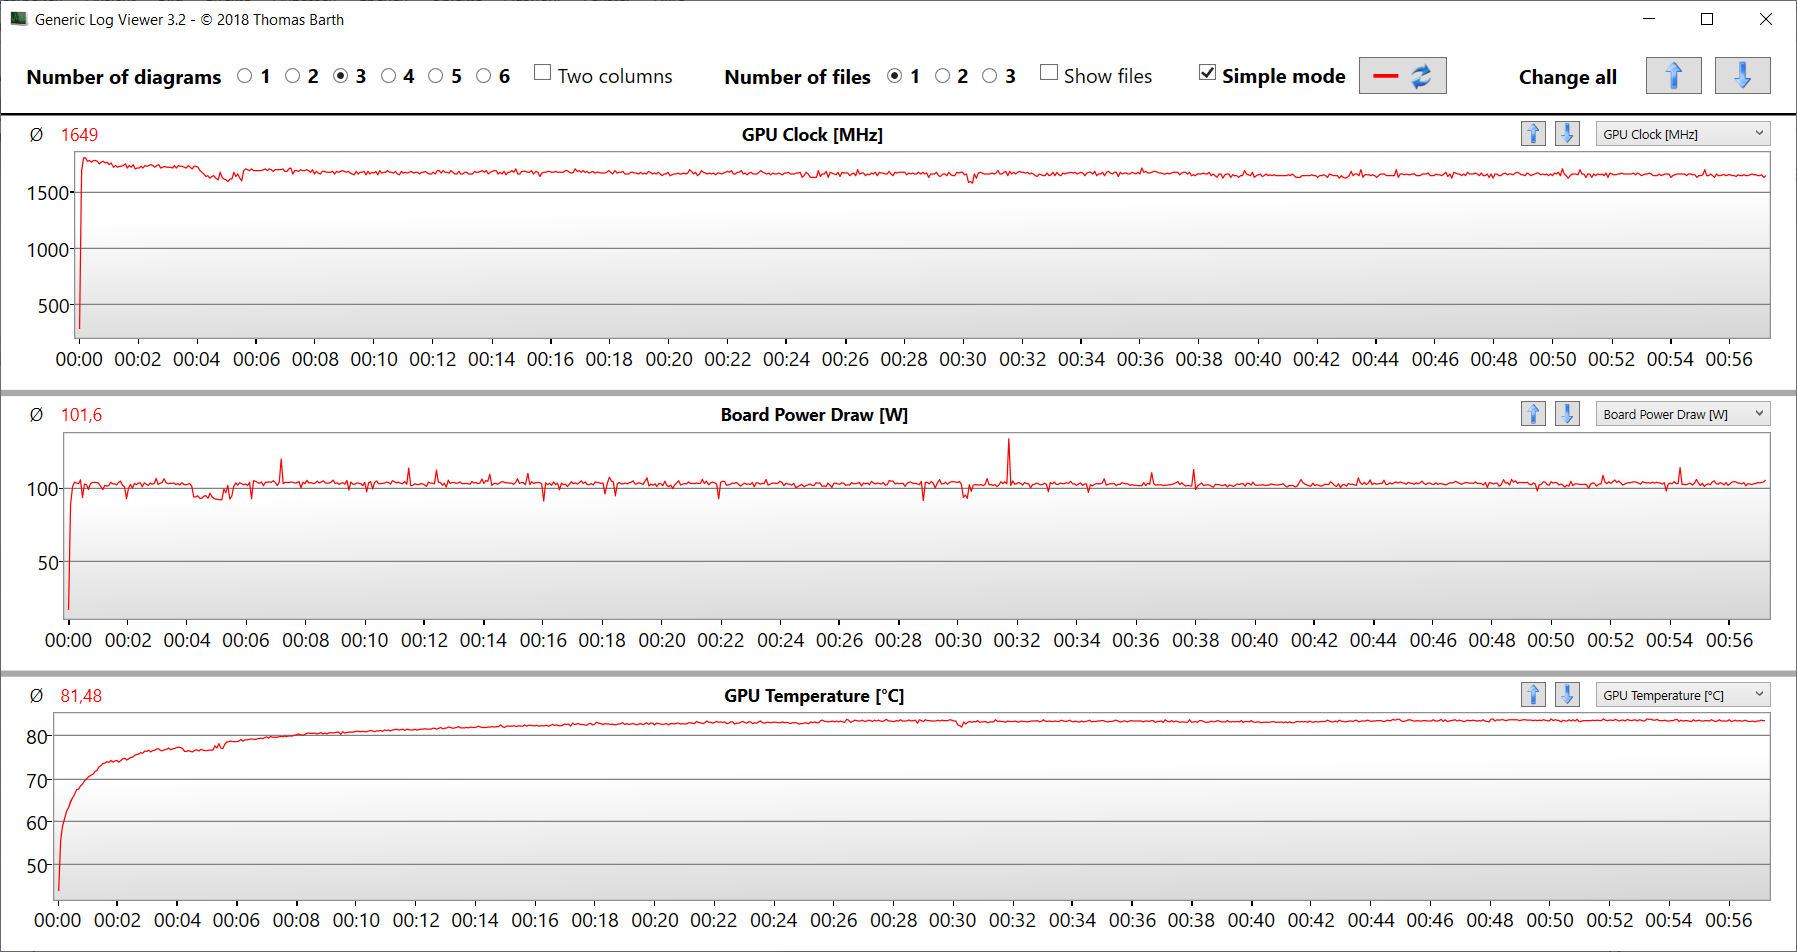
En la práctica, el rendimiento de una GPU RTX-3000 depende de unos cuantos factores: La solución de refrigeración, la configuración de la memoria y el TGP máximo, que establece el fabricante del portátil dentro del rango especificado por Nvidia. En este caso, Gigabyte fijó el TGP máximo del portátil dedicado GeForce RTX 3060 dedicada A 115 vatios. Sin embargo Witcher 3 prueba, sin embargo, este valor TGP no se alcanza del todo.
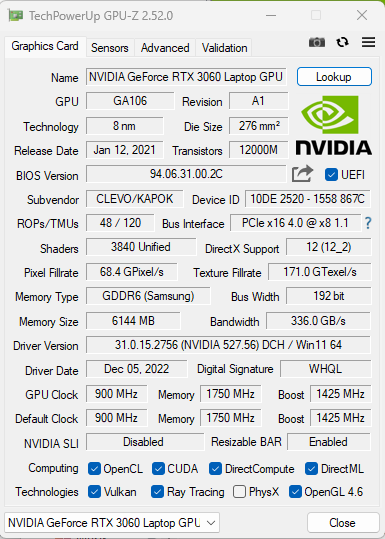
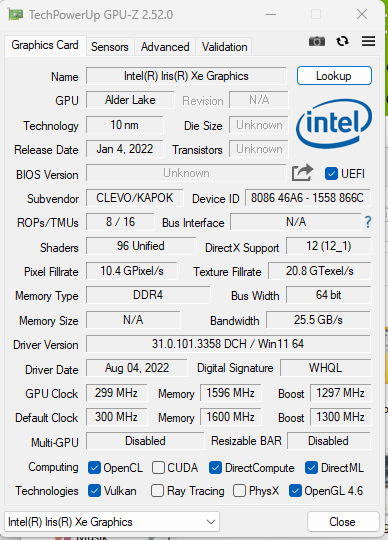
Los resultados 3DMark superan la media de nuestros modelos RTX 3060 analizados anteriormente. La GPU tiene acceso a la rápida memoria de vídeo GDDR6 (6144 MB). ElIris Xe Graphics G7 80EU integrada del procesador está activa y el portátil usa la tecnología de conmutación gráfica Nvidia Optimus. Aunque hay disponible un modo dGPU, no resultó en un rendimiento mejorado.

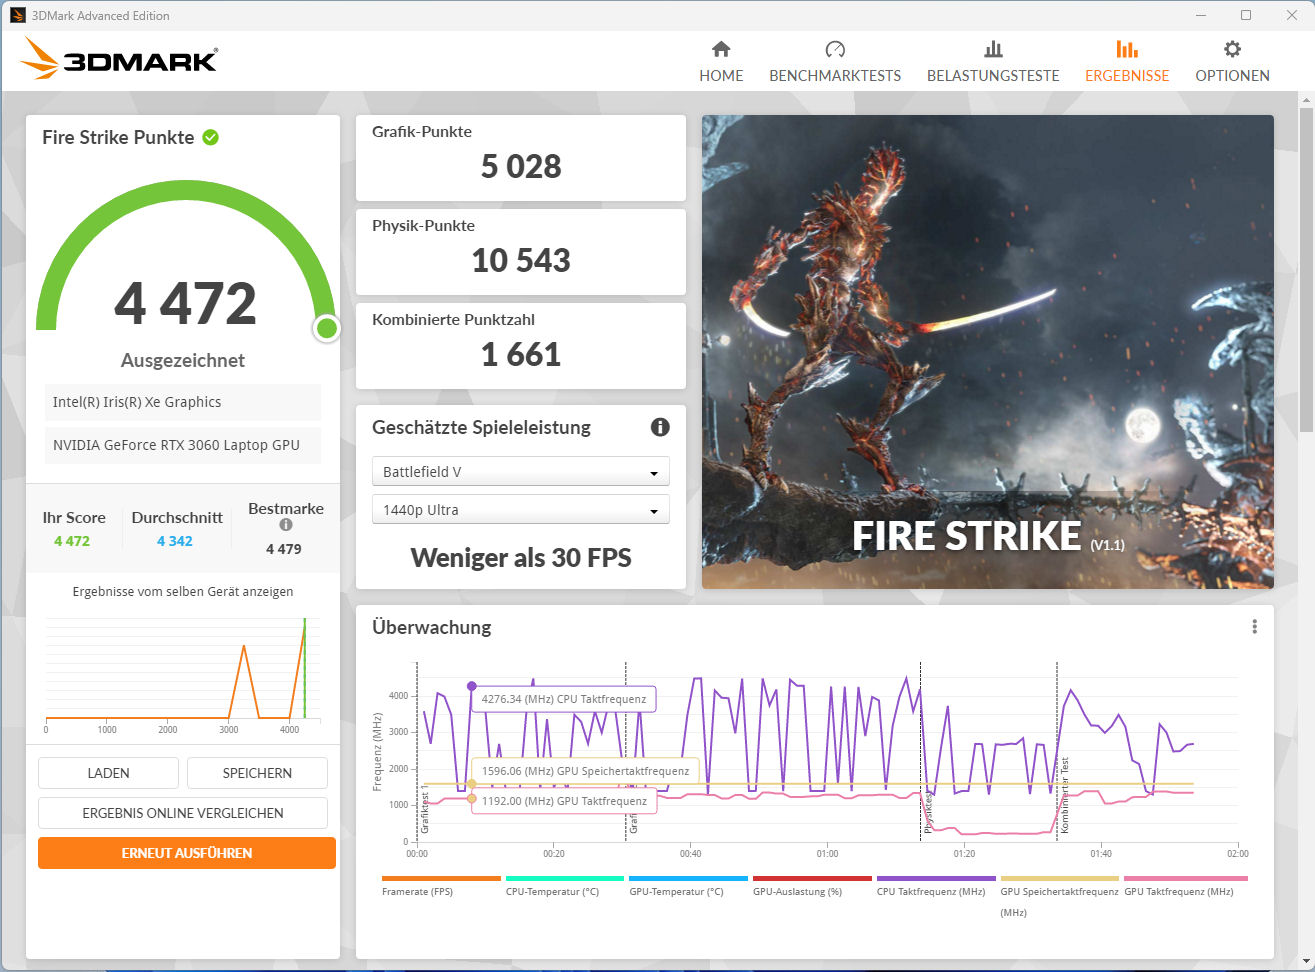
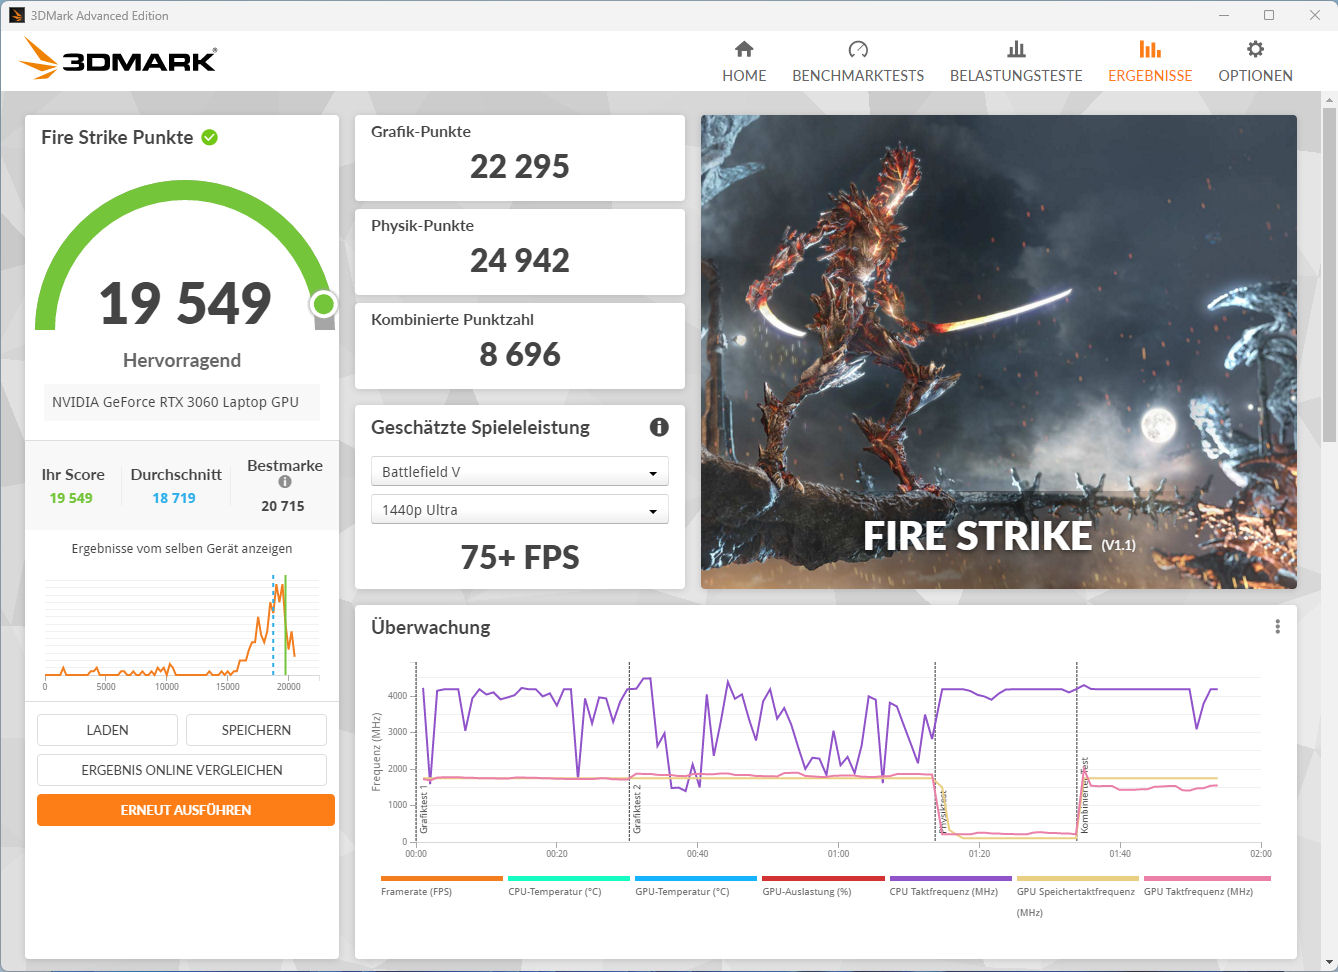
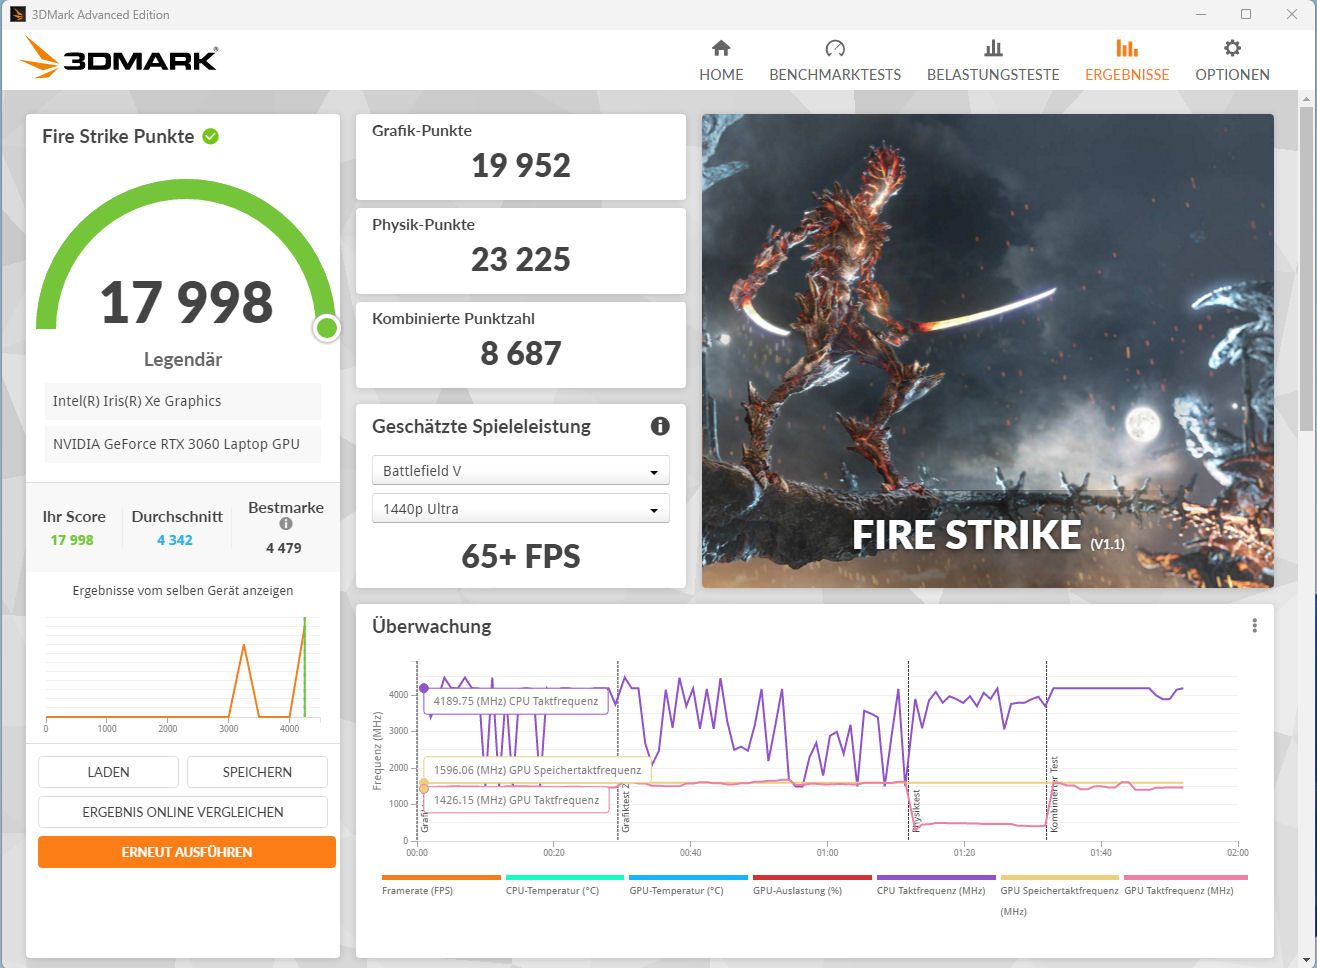
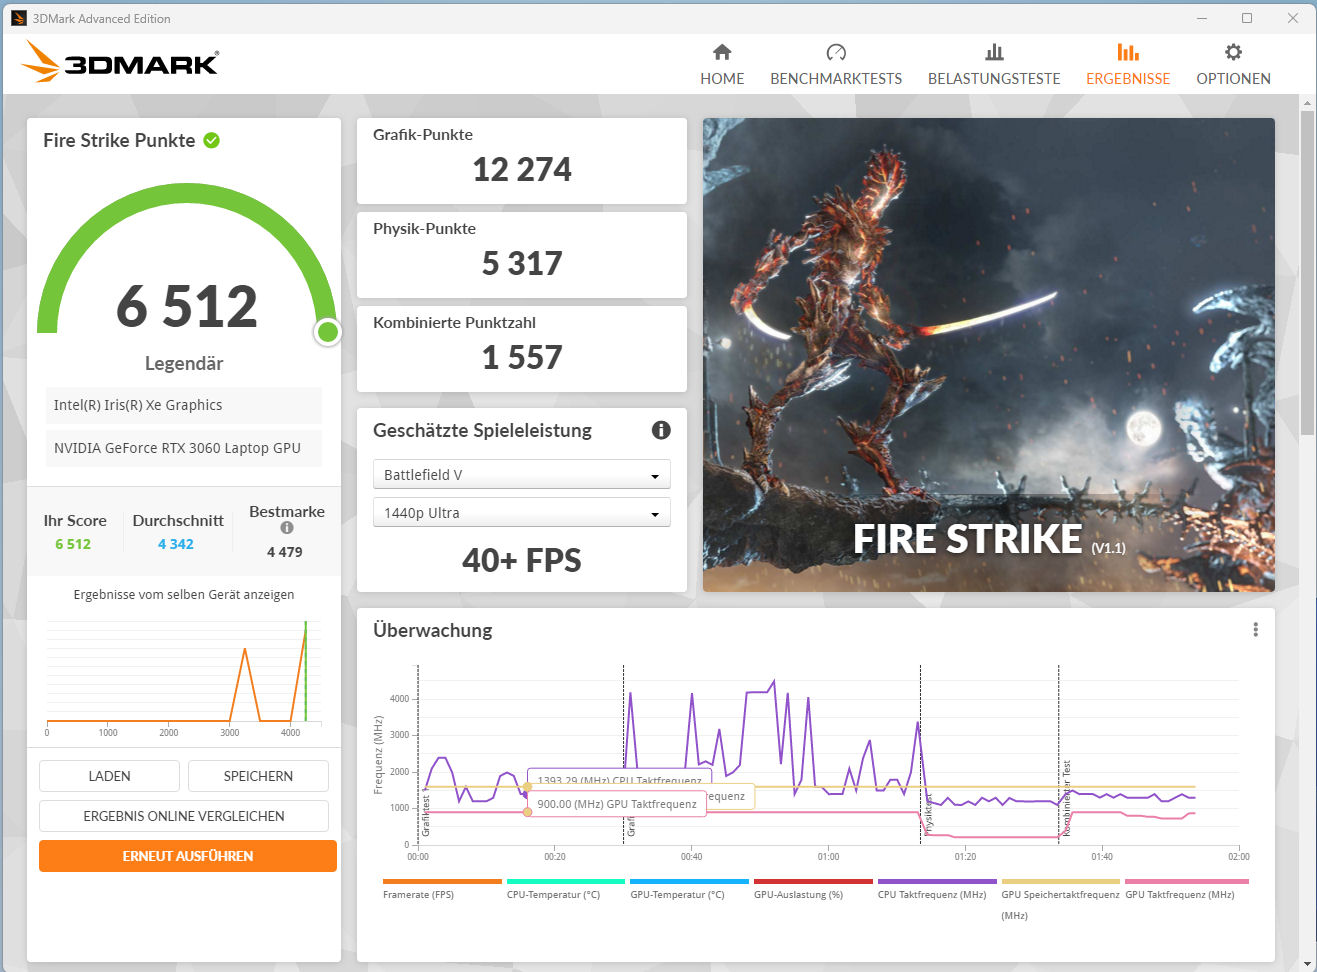
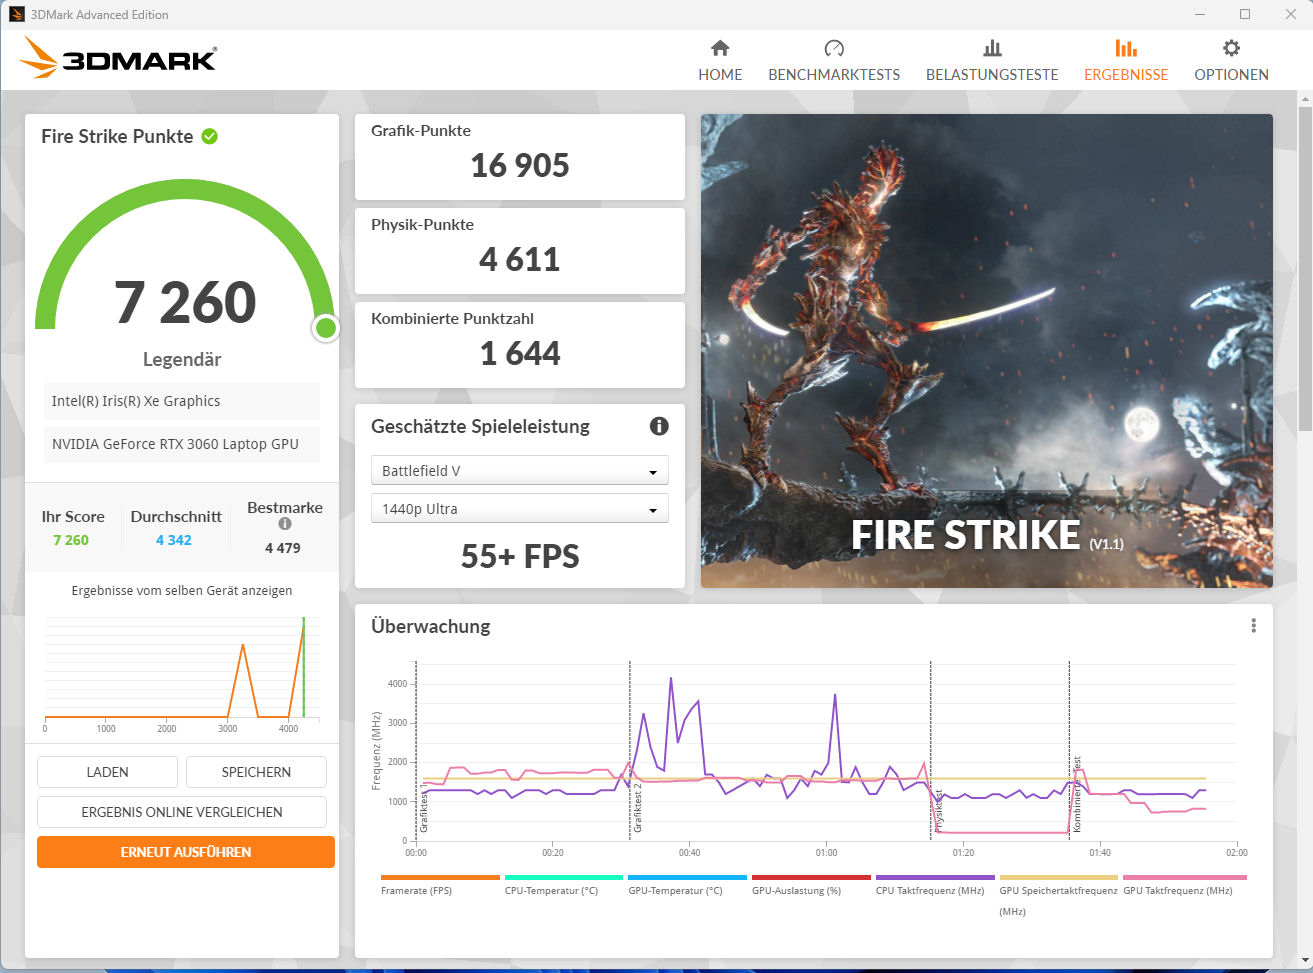
| 3DMark 06 Standard Score | 47733 puntos | |
| 3DMark 11 Performance | 26102 puntos | |
| 3DMark Cloud Gate Standard Score | 37608 puntos | |
| 3DMark Fire Strike Score | 20063 puntos | |
| 3DMark Time Spy Score | 8799 puntos | |
ayuda | ||
| GPUScore: Sacred Path | |
| 2560x1440 Official VRS | |
| Media de la clase Gaming (13.8 - 330, n=139, últimos 2 años) | |
| Medio NVIDIA GeForce RTX 3060 Laptop GPU (111.2 - 113.7, n=2) | |
| Gigabyte G7 KE | |
| 2560x1440 Official | |
| Media de la clase Gaming (11 - 331, n=233, últimos 2 años) | |
| Medio NVIDIA GeForce RTX 3060 Laptop GPU (2.34 - 110.1, n=3) | |
| Gigabyte G7 KE | |
| Geekbench 5.5 - Vulkan Score 5.5 | |
| Media de la clase Gaming (18857 - 246759, n=72, últimos 2 años) | |
| Medio NVIDIA GeForce RTX 3060 Laptop GPU (46619 - 81150, n=25) | |
| Gigabyte G7 KE | |
| Acer Nitro 5 AN517-55-738R | |
* ... más pequeño es mejor
Rendimiento en juegos
Los componentes instalados permiten jugar en FHD con ajustes de altos a máximos. También es posible usar un monitor externo con mayor resolución, aunque para ello haya que reducir los ajustes. Los frame rates superan la media de una RTX 3060 de nuestra base de datos.
| The Witcher 3 - 1920x1080 Ultra Graphics & Postprocessing (HBAO+) | |
| Media de la clase Gaming (104.7 - 240, n=7, últimos 2 años) | |
| Asus TUF Gaming F17 FX707Z-HX011W | |
| Acer Nitro 5 AN517-55-738R | |
| Gigabyte G7 KE | |
| Medio NVIDIA GeForce RTX 3060 Laptop GPU (58.2 - 91.5, n=48) | |
| Lenovo IdeaPad Gaming 3 15IAH7 | |
| HP Pavilion Gaming 17-cd2146ng | |
Para determinar si las frecuencias de cuadro se mantienen constantes durante un periodo prolongado, ejecutamos The Witcher 3 durante unos 60 minutos a resolución Full HD y ajustes de máxima calidad. El personaje no se mueve durante toda la duración. No observamos ninguna disminución del rendimiento.
Witcher 3 FPS Graph
| bajo | medio | alto | ultra | |
|---|---|---|---|---|
| GTA V (2015) | 182.8 | 179.5 | 172.1 | 103 |
| The Witcher 3 (2015) | 339 | 233 | 137.1 | 82.4 |
| Dota 2 Reborn (2015) | 170.5 | 153 | 145.9 | 137.3 |
| Final Fantasy XV Benchmark (2018) | 180.4 | 112.4 | 84.7 | |
| X-Plane 11.11 (2018) | 120.5 | 106 | 86.8 | |
| Far Cry 5 (2018) | 168 | 131 | 122 | 115 |
| Strange Brigade (2018) | 369 | 211 | 168 | 146.4 |
| Flight Simulator 2020 (2020) | 135.7 | 85.1 | 62.8 | 45.9 |
| Guardians of the Galaxy (2021) | 120 | 114 | 114 | 110 |
| Cyberpunk 2077 1.6 (2022) | 96.7 | 75.5 | 66 | 60.7 |
| F1 22 (2022) | 190.5 | 186.3 | 149.6 | 54.4 |
| The Quarry (2022) | 126.9 | 97.2 | 80 | 64.1 |
| A Plague Tale Requiem (2022) | 87.5 | 73 | 62.8 | 52.8 |
| Uncharted Legacy of Thieves Collection (2022) | 72.2 | 69.8 | 65.6 | 62.3 |
| Call of Duty Modern Warfare 2 2022 (2022) | 111 | 99 | 77 | 72 |
| Spider-Man Miles Morales (2022) | 103.3 | 94.2 | 86.4 | 77.5 |
| The Callisto Protocol (2022) | 105.5 | 83.9 | 55.6 | 55.3 |
| Need for Speed Unbound (2022) | 114.9 | 106.7 | 88.6 | 76.6 |
| High On Life (2023) | 177.1 | 134.2 | 99.3 | 79.4 |
| The Witcher 3 v4 (2023) | 170.1 | 132.2 | 108.4 | 87.5 |
| Dead Space Remake (2023) | 69.2 | 66.5 | 59 | 54 |
Emisiones - El sistema Gigabyte puede ser muy ruidoso
Emisiones sonoras
Incluso durante el uso diario (oficina, web), los dos ventiladores se hacen notar con frecuencia - son posibles niveles de ruido de hasta 38 dB(A). Rara vez están en reposo. Bajo carga, el portátil puede alcanzar niveles de ruido muy altos de hasta 59 dB(A) (test de estrés) y 56 dB(A) (Witcher 3) - esto hace que nuestro modelo de pruebas sea sustancialmente más ruidoso que la mayoría de los competidores en estos escenarios. Las emisiones de ruido pueden reducirse usando uno de los tres perfiles de rendimiento "Entretenimiento", "Ahorro de Energía", "Silencioso" - a costa de algo de rendimiento.
Ruido
| Ocioso |
| 27 / 35 / 38 dB(A) |
| Carga |
| 52 / 59 dB(A) |
 | ||
30 dB silencioso 40 dB(A) audible 50 dB(A) ruidosamente alto |
||
min: | ||
| Gigabyte G7 KE i5-12500H, GeForce RTX 3060 Laptop GPU | HP Pavilion Gaming 17-cd2146ng i5-11300H, GeForce RTX 3050 Ti Laptop GPU | Acer Nitro 5 AN517-55-738R i7-12700H, GeForce RTX 3060 Laptop GPU | Asus TUF Gaming F17 FX707Z-HX011W i7-12700H, GeForce RTX 3060 Laptop GPU | Lenovo IdeaPad Gaming 3 15IAH7 i5-12500H, GeForce RTX 3050 Ti Laptop GPU | |
|---|---|---|---|---|---|
| Noise | 17% | 9% | 21% | 11% | |
| apagado / medio ambiente * (dB) | 27 | 25 7% | 25.5 6% | 24 11% | 25 7% |
| Idle Minimum * (dB) | 27 | 27 -0% | 25.5 6% | 24 11% | 29 -7% |
| Idle Average * (dB) | 35 | 28 20% | 25.5 27% | 24 31% | 30 14% |
| Idle Maximum * (dB) | 38 | 30 21% | 27 29% | 24 37% | 32 16% |
| Load Average * (dB) | 52 | 39 25% | 52.6 -1% | 42.6 18% | 42 19% |
| Witcher 3 ultra * (dB) | 56 | 44 21% | 46.84 16% | 46 18% | |
| Load Maximum * (dB) | 59 | 46 22% | 68.2 -16% | 46.84 21% | 54 8% |
* ... más pequeño es mejor
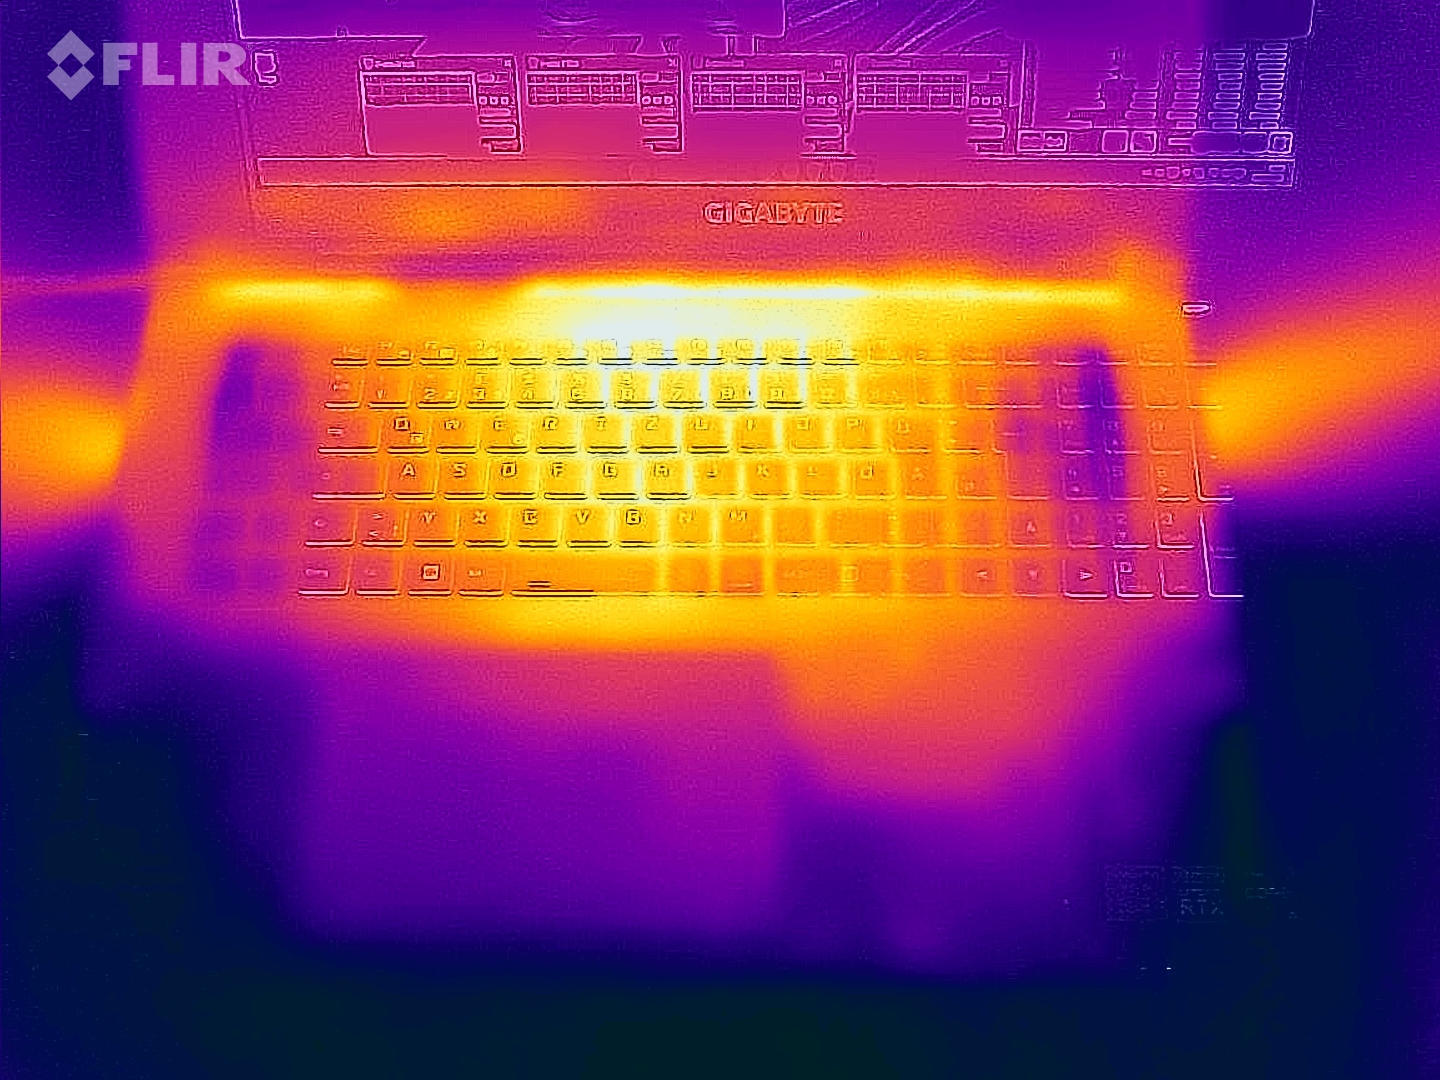
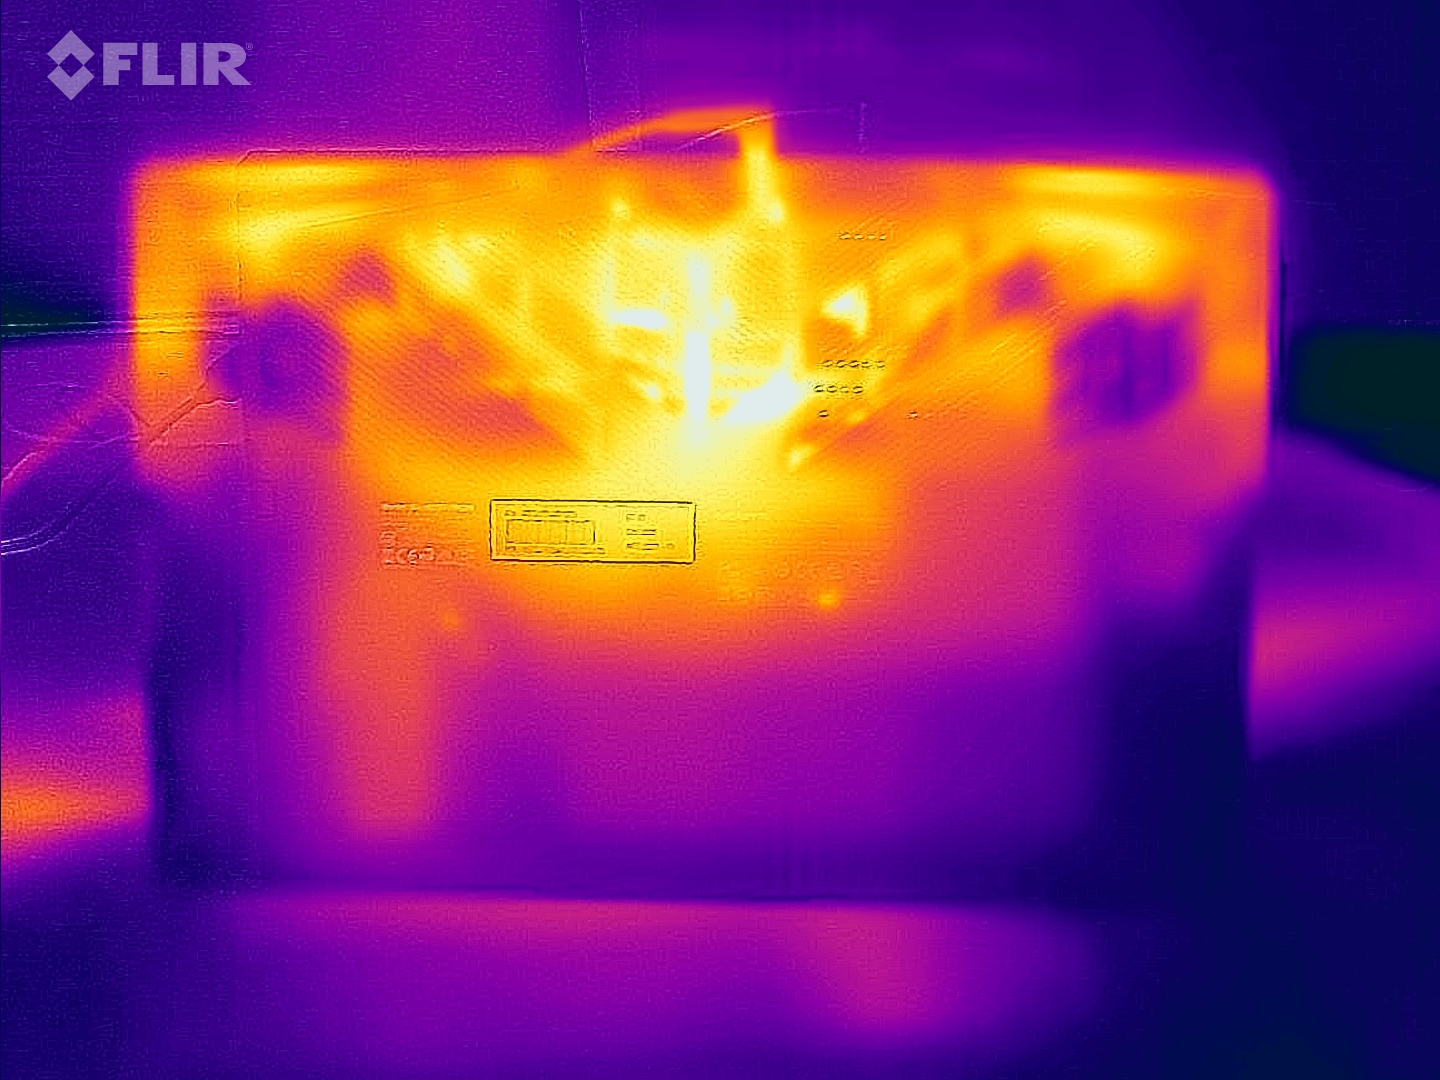
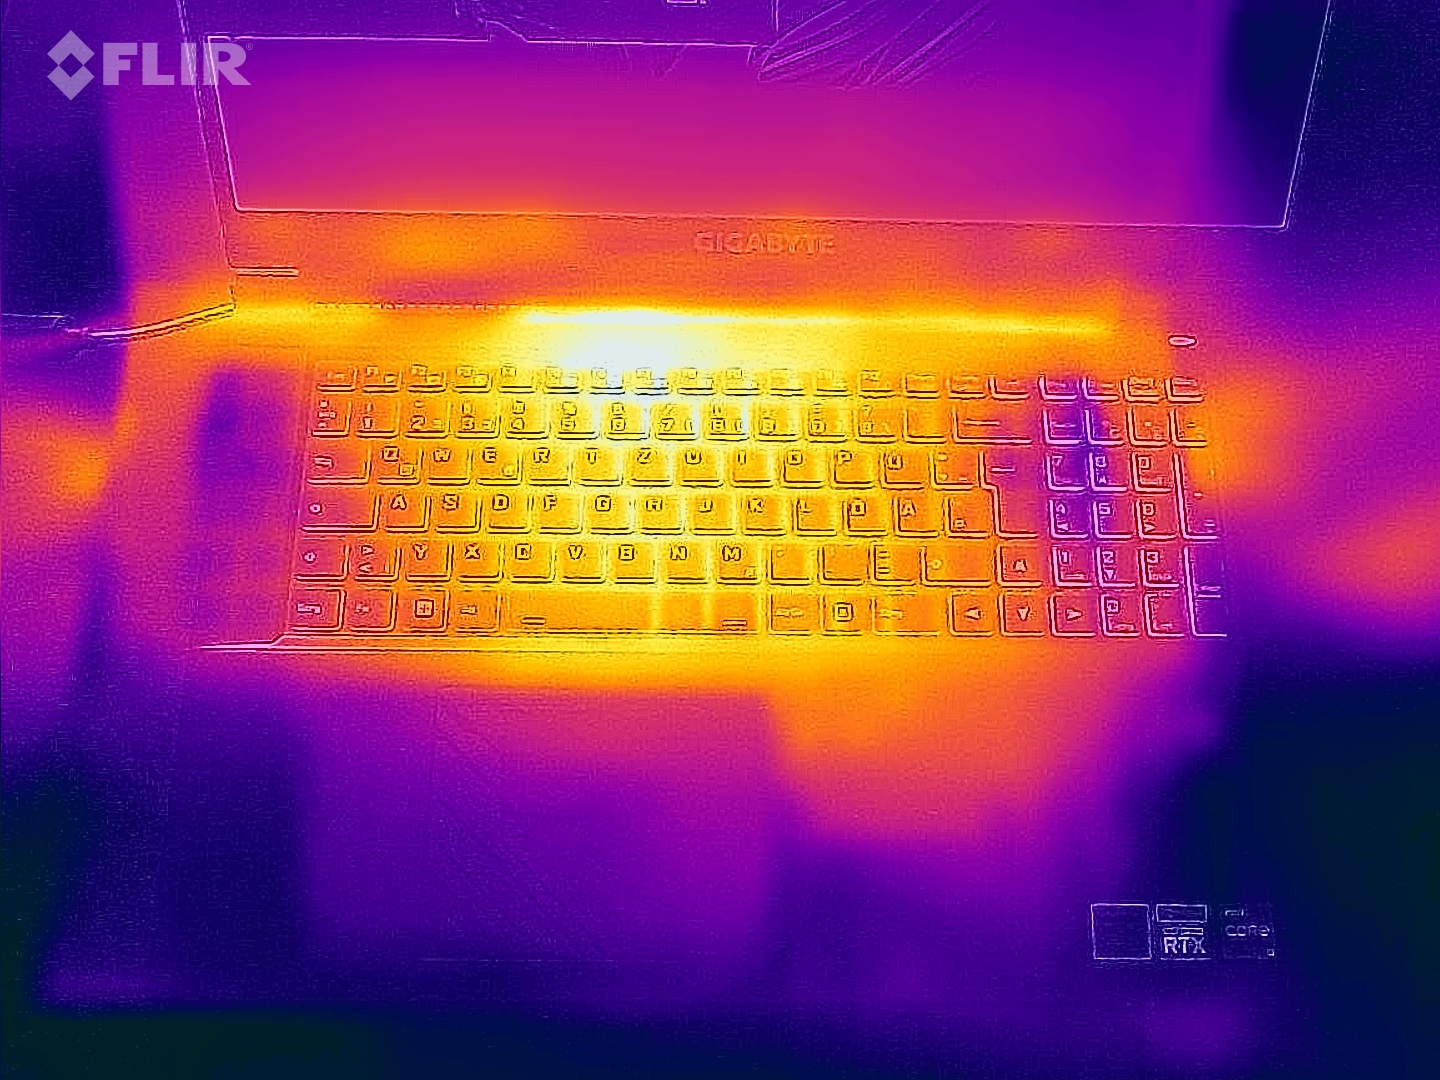
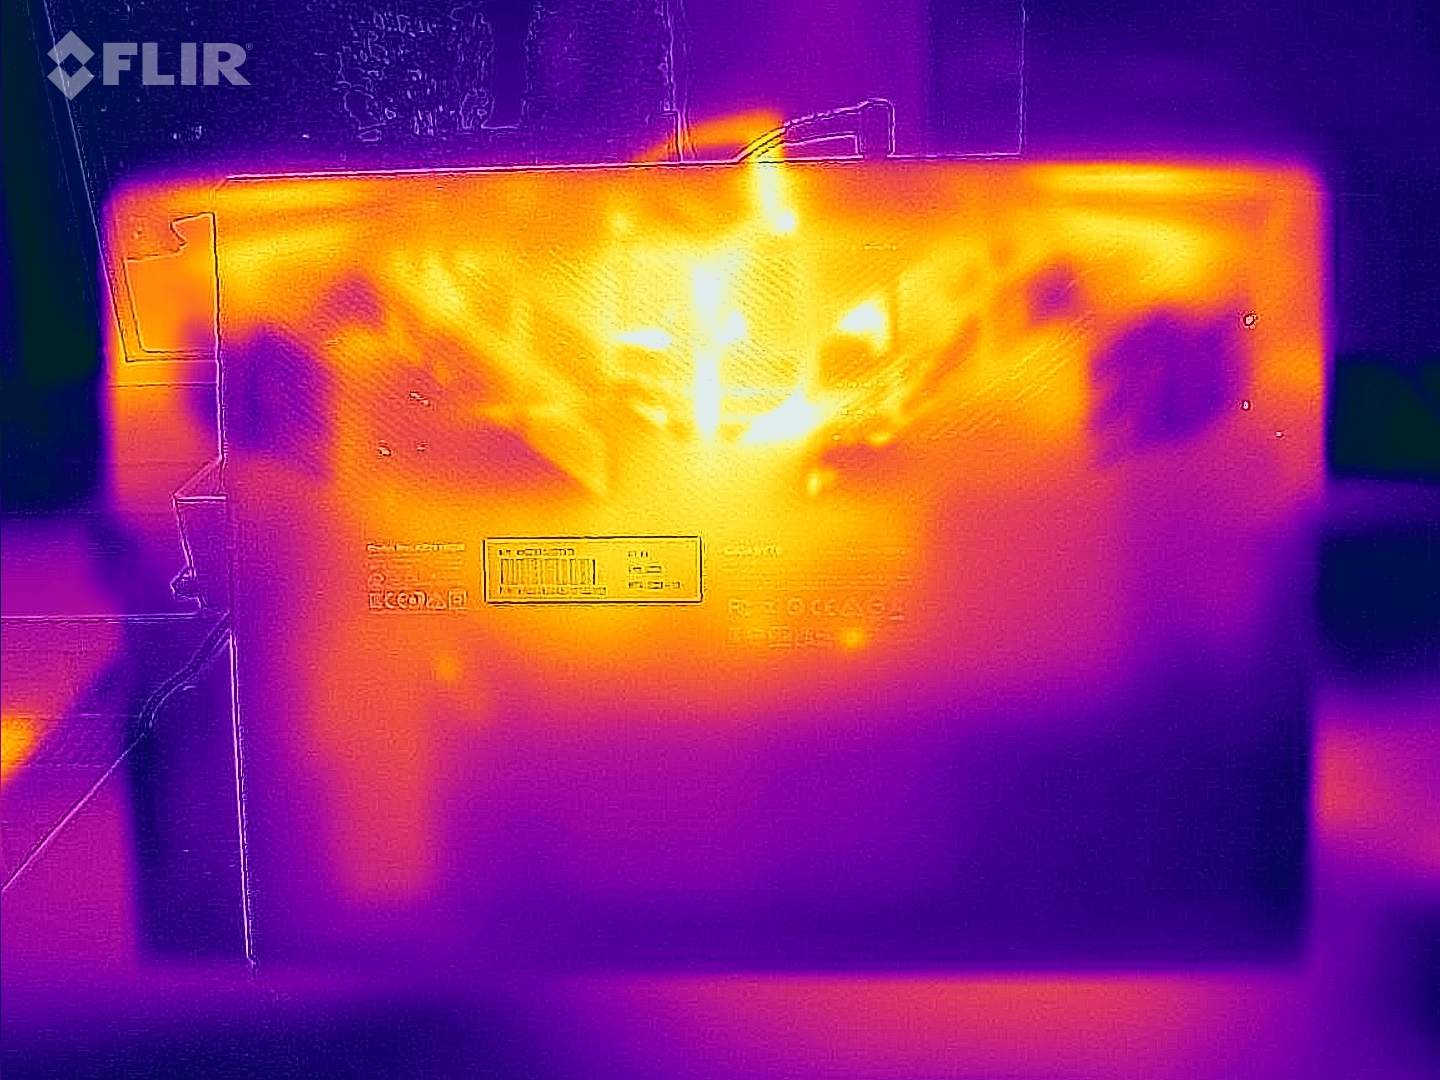
Temperaturas
Durante el uso cotidiano (oficina, web), las temperaturas superficiales se mantienen razonables. Aunque el desarrollo de calor bajo carga (prueba de estrés, Witcher 3) es significativo, no alcanza niveles críticos. La CPU alcanza temperaturas cercanas a su límite de 100 °C.
(-) La temperatura máxima en la parte superior es de 52 °C / 126 F, frente a la media de 40.4 °C / 105 F, que oscila entre 21.2 y 68.8 °C para la clase Gaming.
(-) El fondo se calienta hasta un máximo de 54 °C / 129 F, frente a la media de 43.2 °C / 110 F
(+) En reposo, la temperatura media de la parte superior es de 26.6 °C / 80# F, frente a la media del dispositivo de 33.9 °C / 93 F.
(-) Jugando a The Witcher 3, la temperatura media de la parte superior es de 40.6 °C / 105 F, frente a la media del dispositivo de 33.9 °C / 93 F.
(+) Los reposamanos y el panel táctil alcanzan como máximo la temperatura de la piel (34 °C / 93.2 F) y, por tanto, no están calientes.
(-) La temperatura media de la zona del reposamanos de dispositivos similares fue de 28.8 °C / 83.8 F (-5.2 °C / -9.4 F).
| Gigabyte G7 KE Intel Core i5-12500H, NVIDIA GeForce RTX 3060 Laptop GPU | HP Pavilion Gaming 17-cd2146ng Intel Core i5-11300H, NVIDIA GeForce RTX 3050 Ti Laptop GPU | Acer Nitro 5 AN517-55-738R Intel Core i7-12700H, NVIDIA GeForce RTX 3060 Laptop GPU | Asus TUF Gaming F17 FX707Z-HX011W Intel Core i7-12700H, NVIDIA GeForce RTX 3060 Laptop GPU | Lenovo IdeaPad Gaming 3 15IAH7 Intel Core i5-12500H, NVIDIA GeForce RTX 3050 Ti Laptop GPU | |
|---|---|---|---|---|---|
| Heat | 12% | -6% | 1% | 13% | |
| Maximum Upper Side * (°C) | 52 | 44 15% | 48.3 7% | 52 -0% | 47 10% |
| Maximum Bottom * (°C) | 54 | 48 11% | 52 4% | 47 13% | 52 4% |
| Idle Upper Side * (°C) | 28 | 27 4% | 34.5 -23% | 31 -11% | 25 11% |
| Idle Bottom * (°C) | 32 | 27 16% | 35.8 -12% | 31 3% | 24 25% |
* ... más pequeño es mejor
Prueba de resistencia
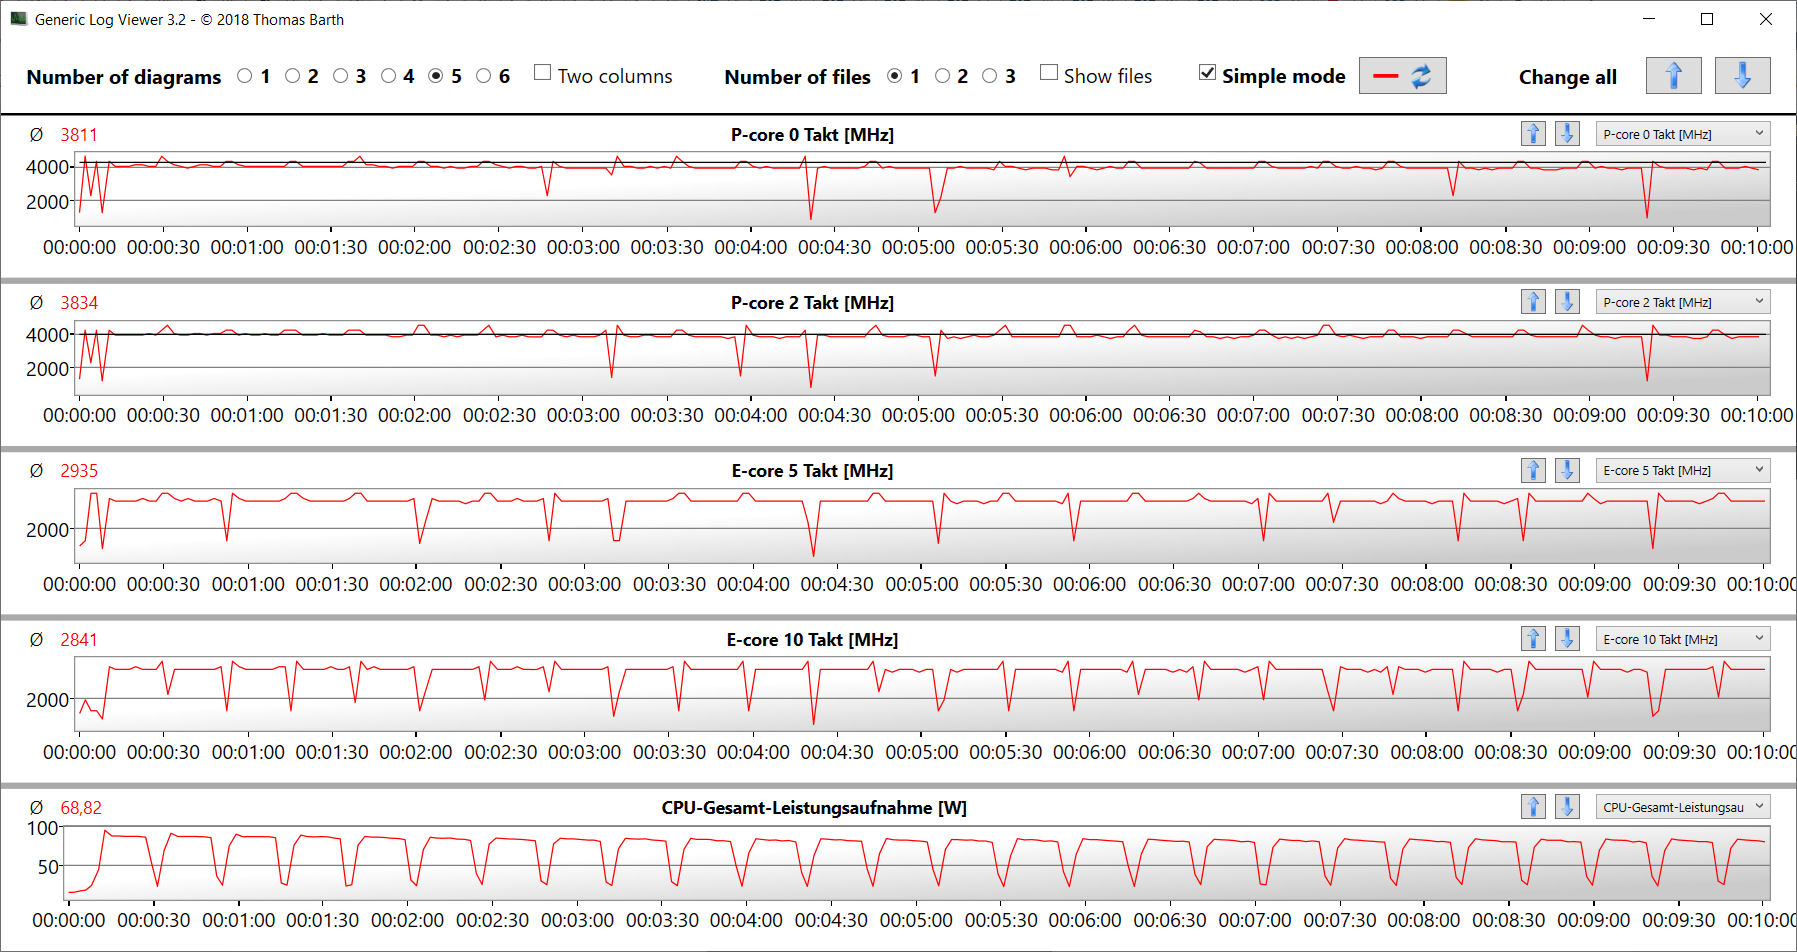
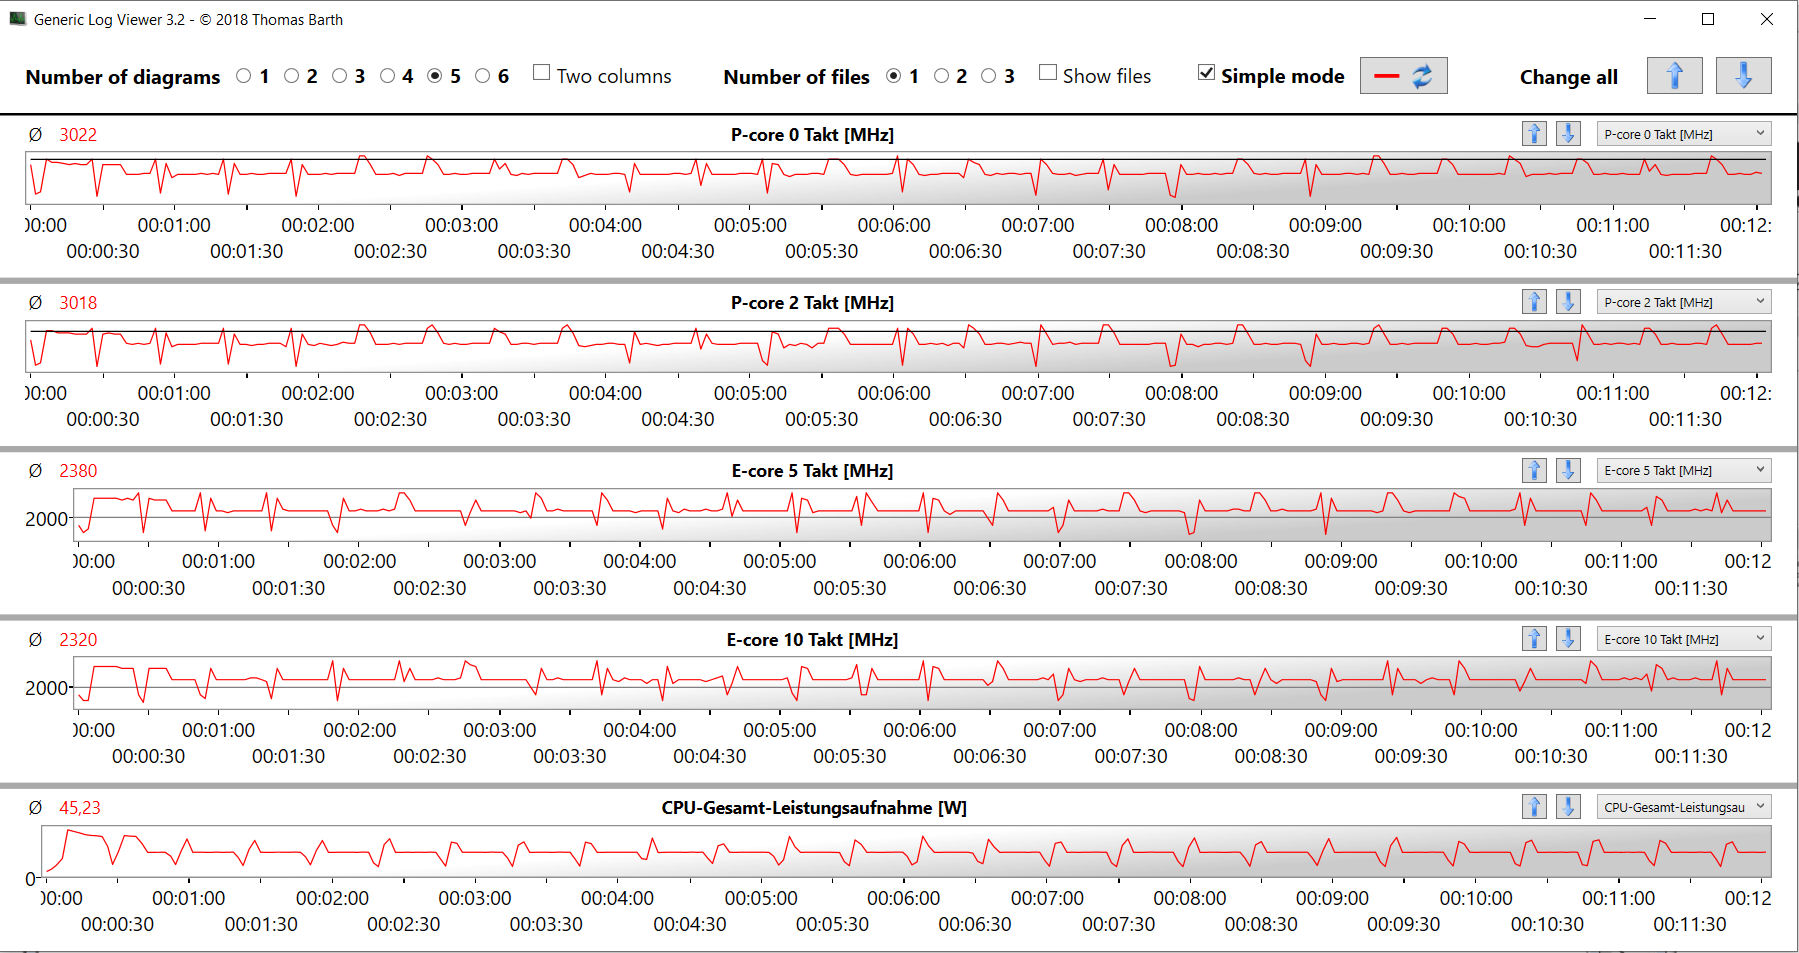
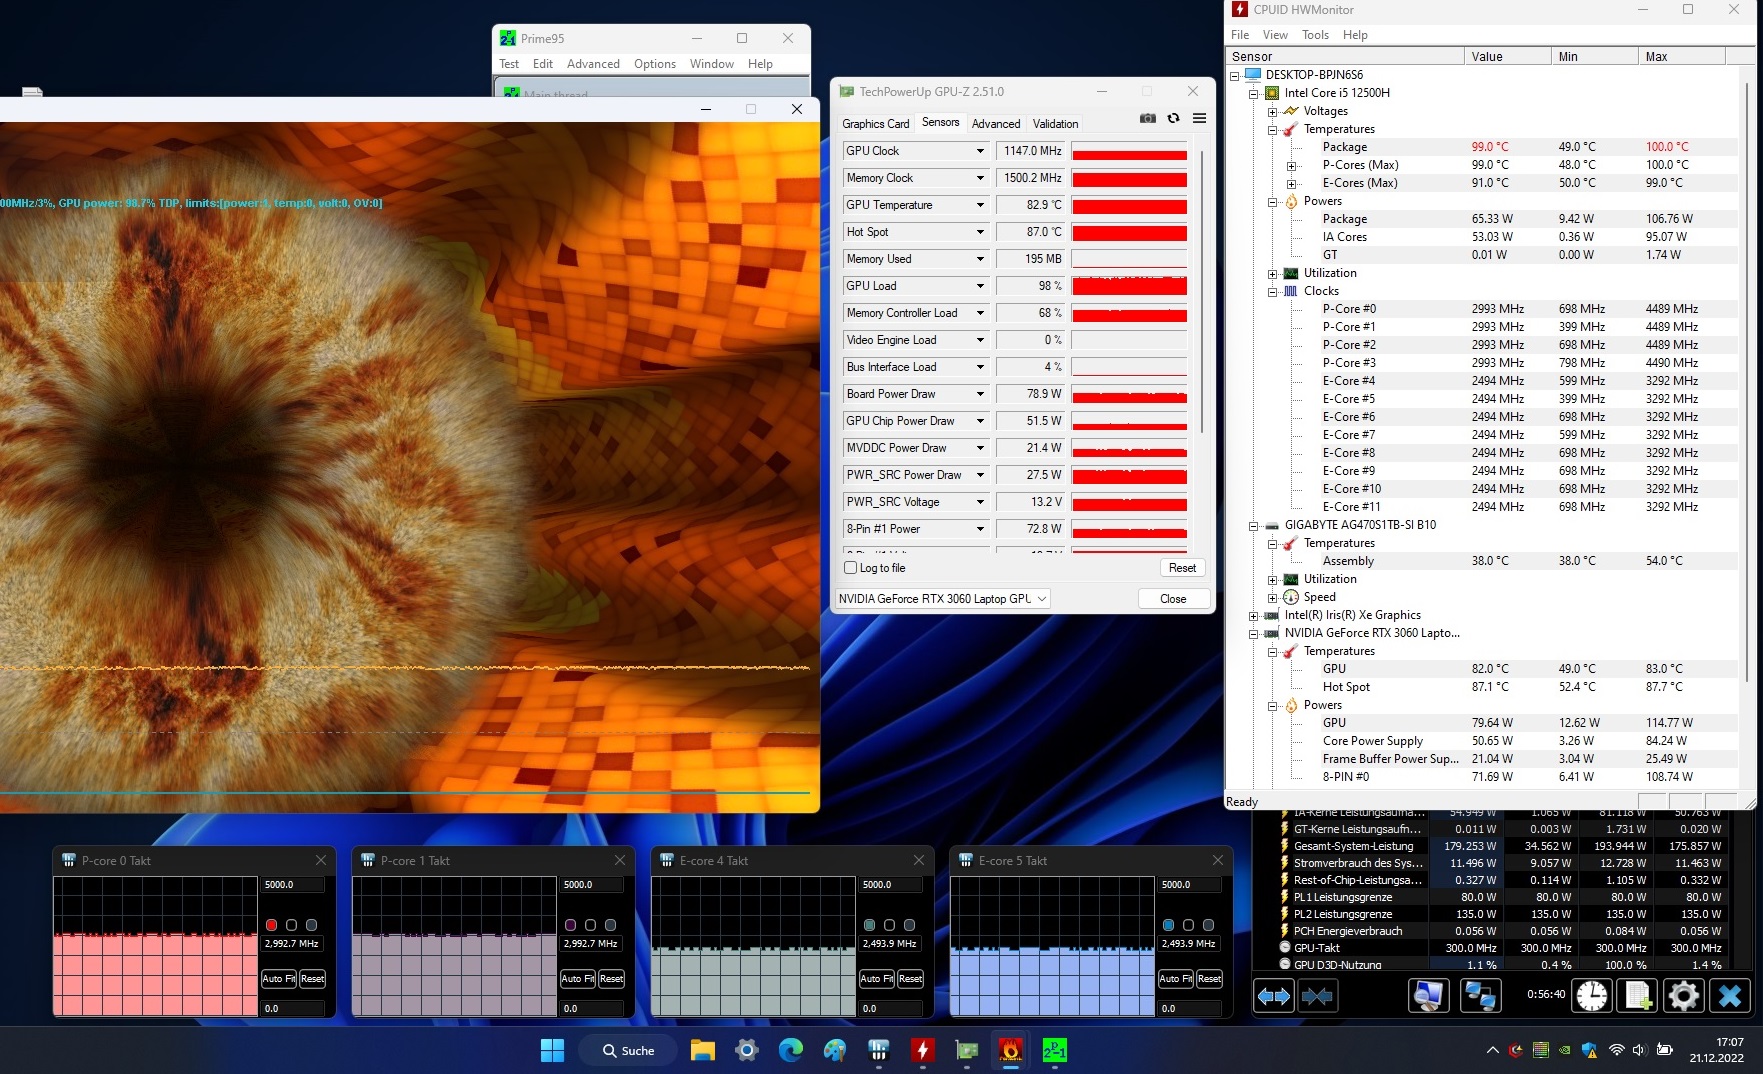
Nuestra prueba de estrés (estrés continuo de Prime95 y FurMark) representa un escenario extremo y sirve como prueba de estabilidad para cuando el sistema está al 100 % de carga. La velocidad de reloj de la CPU cae de 4,1 GHz (núcleos P) y 3,1 GHz (núcleos E) a alrededor del reloj base (P: 3 GHz, E: 2,5 GHz) en el transcurso de 15 minutos y luego se mantiene en ese nivel. La velocidad de reloj de la GPU fluctúa inicialmente entre 1200 MHz y 1500 MHz, antes de estabilizarse finalmente en 1150 MHz.
Altavoces
El sonido producido por los altavoces estéreo es fino y carece de graves. Recomendamos auriculares o altavoces externos para un mejor audio.
Gigabyte G7 KE análisis de audio
(±) | la sonoridad del altavoz es media pero buena (79 dB)
Graves 100 - 315 Hz
(-) | casi sin bajos - de media 23.4% inferior a la mediana
(±) | la linealidad de los graves es media (10.8% delta a frecuencia anterior)
Medios 400 - 2000 Hz
(±) | medias más altas - de media 11.1% más altas que la mediana
(±) | la linealidad de los medios es media (10.6% delta respecto a la frecuencia anterior)
Altos 2 - 16 kHz
(±) | máximos más altos - de media 6.5% más altos que la mediana
(±) | la linealidad de los máximos es media (7.7% delta a frecuencia anterior)
Total 100 - 16.000 Hz
(-) | el sonido global no es lineal (32% de diferencia con la mediana)
En comparación con la misma clase
» 97% de todos los dispositivos probados de esta clase eran mejores, 1% similares, 2% peores
» El mejor tuvo un delta de 6%, la media fue 18%, el peor fue ###max##%
En comparación con todos los dispositivos probados
» 91% de todos los dispositivos probados eran mejores, 2% similares, 7% peores
» El mejor tuvo un delta de 4%, la media fue 23%, el peor fue ###max##%
HP Pavilion Gaming 17-cd2146ng análisis de audio
(±) | la sonoridad del altavoz es media pero buena (80 dB)
Graves 100 - 315 Hz
(-) | casi sin bajos - de media 19.5% inferior a la mediana
(±) | la linealidad de los graves es media (11.5% delta a frecuencia anterior)
Medios 400 - 2000 Hz
(+) | medios equilibrados - a sólo 3.2% de la mediana
(+) | los medios son lineales (3.8% delta a la frecuencia anterior)
Altos 2 - 16 kHz
(±) | máximos más altos - de media 8.6% más altos que la mediana
(±) | la linealidad de los máximos es media (8% delta a frecuencia anterior)
Total 100 - 16.000 Hz
(±) | la linealidad del sonido global es media (20.5% de diferencia con la mediana)
En comparación con la misma clase
» 73% de todos los dispositivos probados de esta clase eran mejores, 5% similares, 22% peores
» El mejor tuvo un delta de 6%, la media fue 18%, el peor fue ###max##%
En comparación con todos los dispositivos probados
» 54% de todos los dispositivos probados eran mejores, 8% similares, 38% peores
» El mejor tuvo un delta de 4%, la media fue 23%, el peor fue ###max##%
Gestión de la energía - Portátil G7 con tiempos de funcionamiento aceptables
Consumo de energía
En inactivo, observamos un consumo de energía ligeramente superior en el portátil Gigabyte. Un vistazo a la competencia muestra dónde está el rango normal para un portátil Optimus. Durante la prueba de estrés y el Witcher 3 test, el consumo de energía coincide con nuestras expectativas para los componentes instalados. El adaptador de corriente incluido está bien dimensionado y es capaz de gestionar picos de consumo cortos, que superan su potencia nominal (180 vatios).
| Off / Standby | |
| Ocioso | |
| Carga |
|
Clave:
min: | |
| Gigabyte G7 KE i5-12500H, GeForce RTX 3060 Laptop GPU | HP Pavilion Gaming 17-cd2146ng i5-11300H, GeForce RTX 3050 Ti Laptop GPU | Acer Nitro 5 AN517-55-738R i7-12700H, GeForce RTX 3060 Laptop GPU | Asus TUF Gaming F17 FX707Z-HX011W i7-12700H, GeForce RTX 3060 Laptop GPU | Lenovo IdeaPad Gaming 3 15IAH7 i5-12500H, GeForce RTX 3050 Ti Laptop GPU | Media de la clase Gaming | |
|---|---|---|---|---|---|---|
| Power Consumption | 35% | 3% | 25% | 28% | -5% | |
| Idle Minimum * (Watt) | 15 | 3 80% | 9.7 35% | 6.6 56% | 8 47% | 13.1 ? 13% |
| Idle Average * (Watt) | 17 | 8 53% | 14.6 14% | 8.3 51% | 10 41% | 19 ? -12% |
| Idle Maximum * (Watt) | 24 | 28 -17% | 16.7 30% | 11.8 51% | 16 33% | 24.6 ? -3% |
| Load Average * (Watt) | 111 | 88 21% | 166 -50% | 119 -7% | 99 11% | 111.3 ? -0% |
| Witcher 3 ultra * (Watt) | 174.1 | 98.2 44% | 169 3% | 144.6 17% | ||
| Load Maximum * (Watt) | 208 | 152 27% | 235 -13% | 222 -7% | 168 19% | 260 ? -25% |
* ... más pequeño es mejor
Consumption Witcher 3 / Stress Test
Consumption external Monitor
Duración de la batería
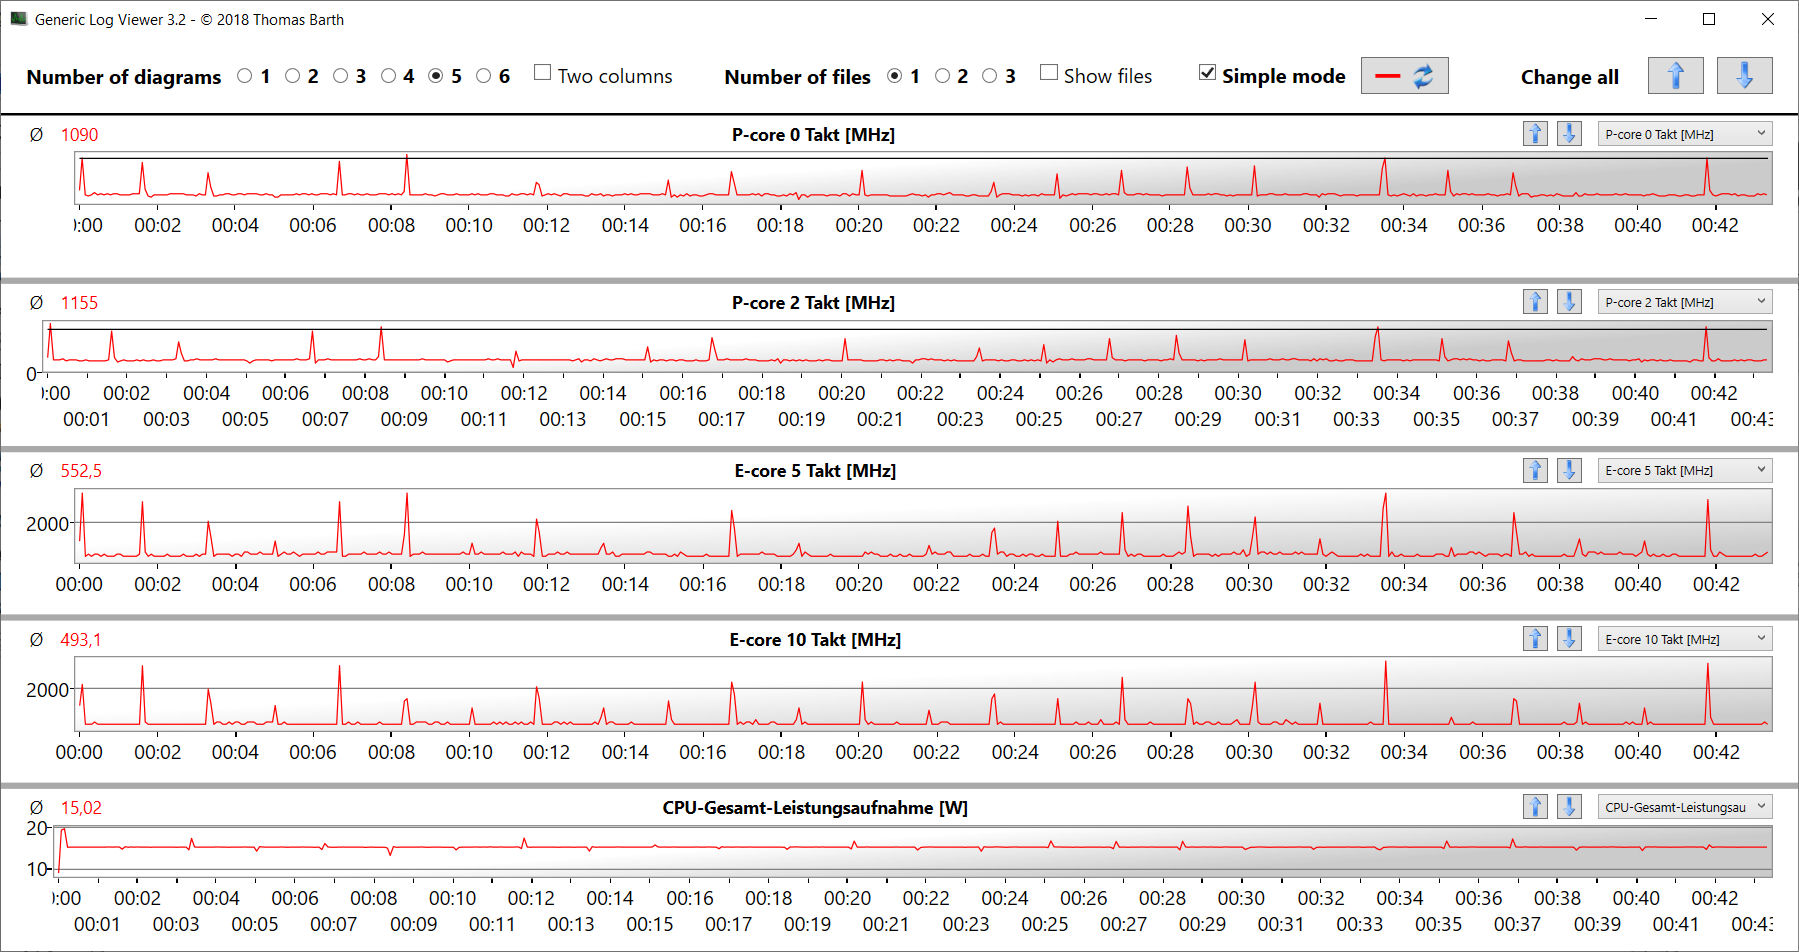
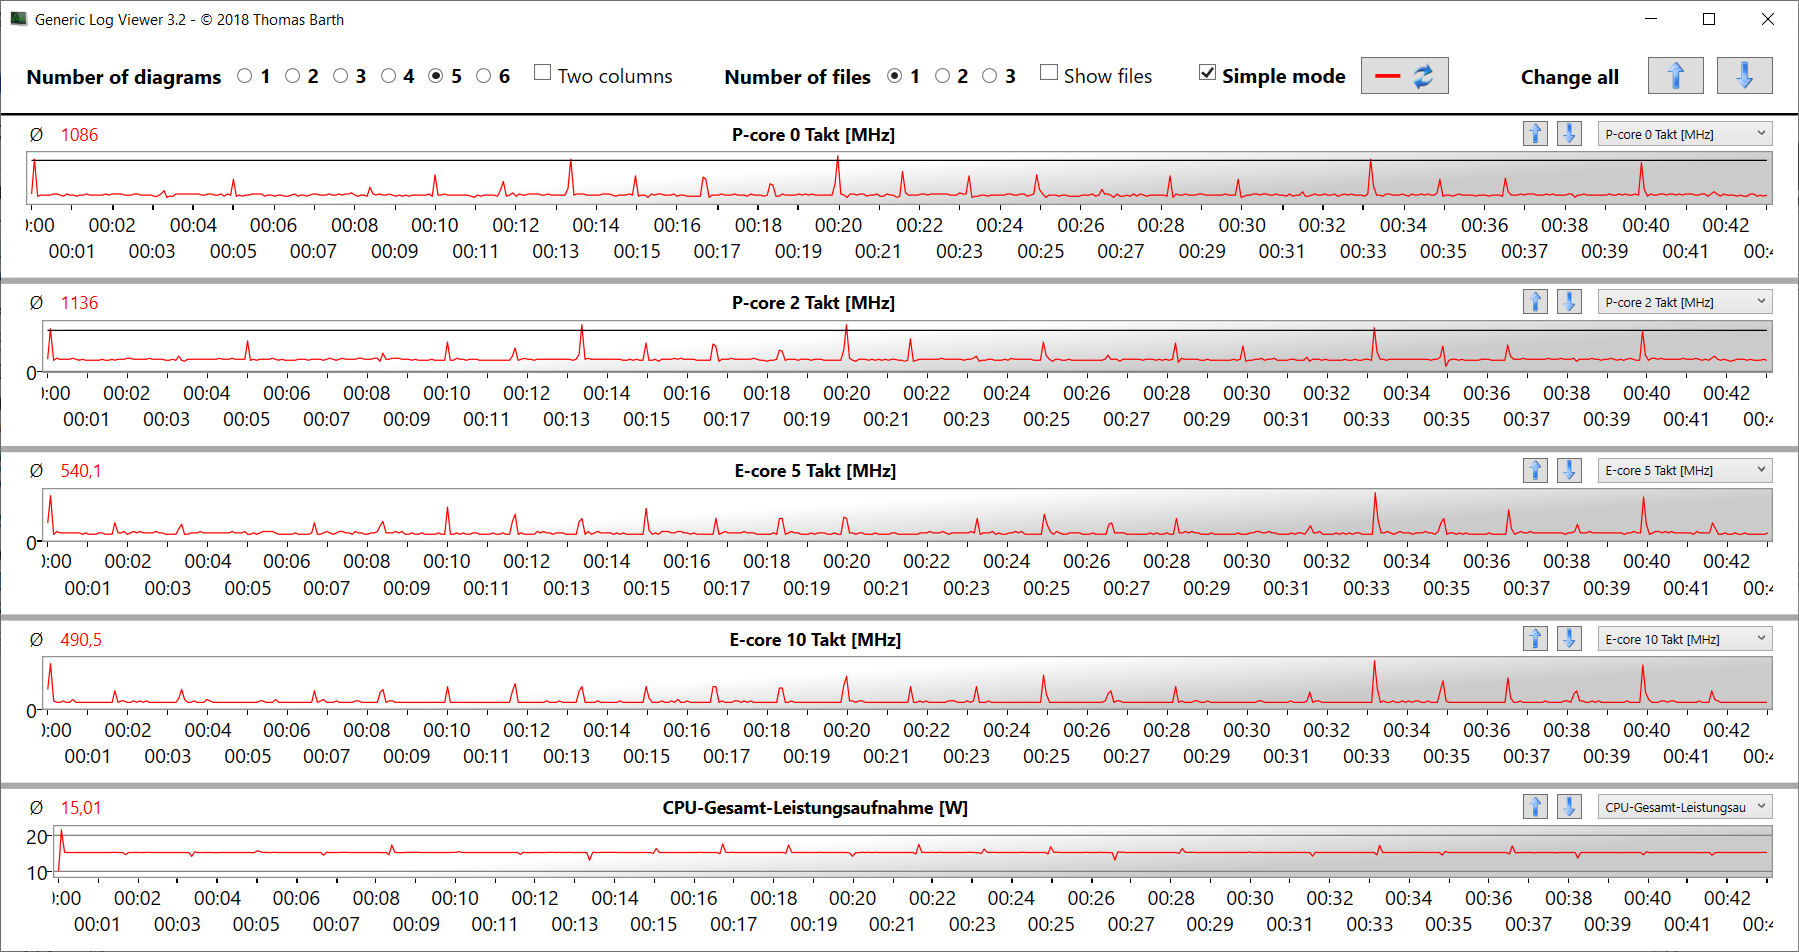
El portátil de 17,3 pulgadas alcanza una duración de 5:17 h y 2:12 h en nuestras pruebas Wi-Fi (navegación web a través de un script) y de vídeo (reproducción del códec H.264, cortometraje FHD Big Buck Bunny en bucle), respectivamente. Desactivamos las funciones de ahorro de energía del portátil y ajustamos el brillo de la pantalla a unos 150 nits antes de ejecutar las pruebas. Además, desactivamos los módulos inalámbricos para la prueba de vídeo.
La duración del vídeo es muy decepcionante. Normalmente, esperaríamos al menos la paridad con el tiempo de ejecución Wi-Fi. Evidentemente, el sistema consume más energía durante la reproducción. Para descartar un problema de software, probamos varias versiones diferentes del controlador para la iGPU de Intel, que se utilizó para la reproducción. Del mismo modo, el sistema operativo tampoco parece ser el culpable: Observamos un tiempo de ejecución corto tanto con Windows 10 como con Windows 11. Esto sugiere un problema interno que sólo Gigabyte podría solucionar.
| Gigabyte G7 KE i5-12500H, GeForce RTX 3060 Laptop GPU, 54 Wh | HP Pavilion Gaming 17-cd2146ng i5-11300H, GeForce RTX 3050 Ti Laptop GPU, 52.5 Wh | Acer Nitro 5 AN517-55-738R i7-12700H, GeForce RTX 3060 Laptop GPU, 90.61 Wh | Asus TUF Gaming F17 FX707Z-HX011W i7-12700H, GeForce RTX 3060 Laptop GPU, 90 Wh | Lenovo IdeaPad Gaming 3 15IAH7 i5-12500H, GeForce RTX 3050 Ti Laptop GPU, 60 Wh | Media de la clase Gaming | |
|---|---|---|---|---|---|---|
| Duración de Batería | -6% | 69% | 130% | 11% | 84% | |
| Reader / Idle (h) | 7.1 | 11.7 65% | 7.84 ? 10% | |||
| H.264 (h) | 2.2 | 5.3 141% | 7.7 250% | 8.27 ? 276% | ||
| WiFi v1.3 (h) | 5.3 | 5 -6% | 6.5 23% | 8.7 64% | 5.9 11% | 7.08 ? 34% |
| Load (h) | 1.3 | 1.9 46% | 2.3 77% | 1.496 ? 15% |
Pro
Contra
Veredicto - Portátil de juegos asequible
Con el G7 KE, Gigabyte ha creado un portátil para juegos FHD relativamente asequible, que también rinde bien en lo que se refiere a la edición y renderización de vídeo - esto es posible gracias al Core i5-12500H Y el portátil GeForce RTX 3060 portátil GPU. Mientras tanto, el rapidísimo SSD PCIe-4 (1 TB) garantiza tiempos de carga cortos.
El Gigabyte G7 KE es un portátil gaming sólido. Los inconvenientes que encontramos son bastante menores.
Aunque el desarrollo de calor del sistema bajo carga no es excesivo, los niveles de ruido resultantes son relativamente altos - muchos competidores lo hacen mejor en este aspecto. En general, nos gustó la calidad de la pantalla mate de 17,3 pulgadas (FHD, IPS, 300 Hz, sRGB).
El G7 alcanza duraciones bastante aceptables a pesar de su batería de baja capacidad (54 Wh). Por desgracia, la batería no se puede recargar con un cargador universal USB-C - ninguno de los puertos USB-C (1x Thunderbolt 4, 1x USB 3.2 gen. 2) ofrece soporte Power Delivery.
La falta de un SO Windows incluido no es una razón insignificante para el precio relativamente barato. Si no tienes una licencia Windows válida y no quieres comprar una, también deberías poder instalar una distribución Linux. Sin embargo, el proceso de instalación y configuración del sistema operativo alternativo puede resultar muy complicado para algunos usuarios.
El sitio Asus TUF Gaming F17 puede ser una alternativa al G7 KE. Aunque está equipado con la misma GPU, su rendimiento 3D es ligeramente mejor y la duración de la batería también es mayor. Dicho esto, el sistema tiene un sobreprecio de unos 200-300 dólares.
Precio y disponibilidad
Aunque el Gigabyte G7 KE tal como está configurado aún no está disponible en los principales distribuidores de EE.UU., esperamos que pronto lleguen modelos por unos 1.200 dólares.
Gigabyte G7 KE
- 01/21/2023 v7 (old)
Sascha Mölck
Price comparison

