Análisis del portátil Asus Zenbook Pro 14 OLED: El rival del MacBook Pro con pantalla OLED de 120 Hz
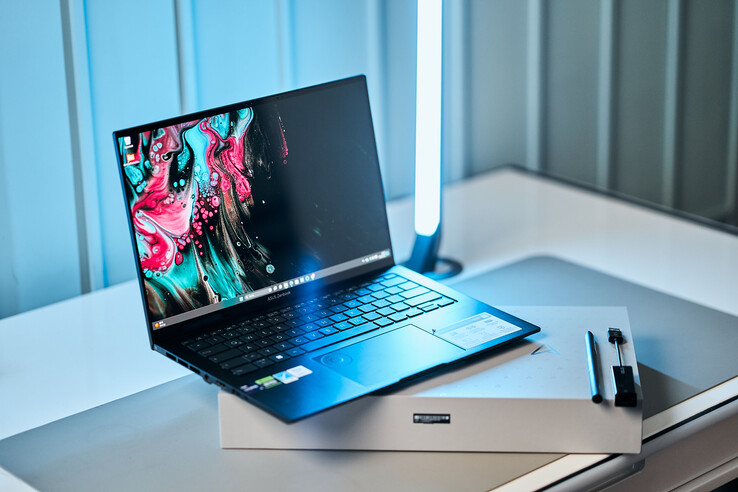
Con su nuevo Zenbook Pro 14, Asus ofrece un potente portátil multimedia para creadores de contenido, poniéndolo así en competencia directa con el Apple MacBook Pro 14. Además de los actuales procesadores Raptor Lake de Intel, Asus instala las nuevas GPUs RTX de Nvidia, por lo que nuestro dispositivo de pruebas cuenta incluso con la GPUGeForce RTX 4070 portátil Portátil RTX 4070. Una característica especial es la pantalla, que es una pantalla táctil OLED de 2.8K con 120 Hz.
Sin embargo, todo este hardware tiene un precio: nuestro dispositivo de pruebas con unCore i9 13900Huna RTX 4070, 32 GB de RAM y un SSD de 2 TB cuesta la friolera de 3.500 euros (~3.750 dólares), por lo que su precio compite directamente con el del MacBook Pro 14 (M2 Max). Los dispositivos de 14 pulgadas con estos valores de rendimiento son raros, por lo que también listamos algunos modelos de 15 pulgadas como dispositivos de comparación.
Posibles contendientes en la comparación
Valoración | Fecha | Modelo | Peso | Altura | Tamaño | Resolución | Precio |
|---|---|---|---|---|---|---|---|
| 89.3 % v7 (old) | 06/2023 | Asus Zenbook Pro 14 OLED UX6404VI i9-13900H, GeForce RTX 4070 Laptop GPU | 1.7 kg | 17.9 mm | 14.50" | 2880x1800 | |
| 87 % v7 (old) | 06/2023 | Asus ZenBook Pro 14 Duo UX8402VV-P1021W i9-13900H, GeForce RTX 4060 Laptop GPU | 1.8 kg | 21 mm | 14.50" | 2880x1800 | |
| 93.9 % v7 (old) | 03/2023 | Apple MacBook Pro 14 2023 M2 Pro M2 Pro, M2 Pro 19-Core GPU | 1.6 kg | 15.5 mm | 14.20" | 3024x1964 | |
| 90 % v7 (old) | 05/2023 | Asus ROG Zephyrus G14 GA402XY R9 7940HS, GeForce RTX 4090 Laptop GPU | 1.7 kg | 20.5 mm | 14.00" | 2560x1600 | |
| 90.3 % v7 (old) | 04/2023 | Dell XPS 15 9530 RTX 4070 i7-13700H, GeForce RTX 4070 Laptop GPU | 1.9 kg | 18 mm | 15.60" | 3456x2160 | |
| 89.9 % v7 (old) | 03/2023 | Razer Blade 15 OLED (Early 2022) i9-12900H, GeForce RTX 3070 Ti Laptop GPU | 2 kg | 16.99 mm | 15.60" | 2560x1440 |
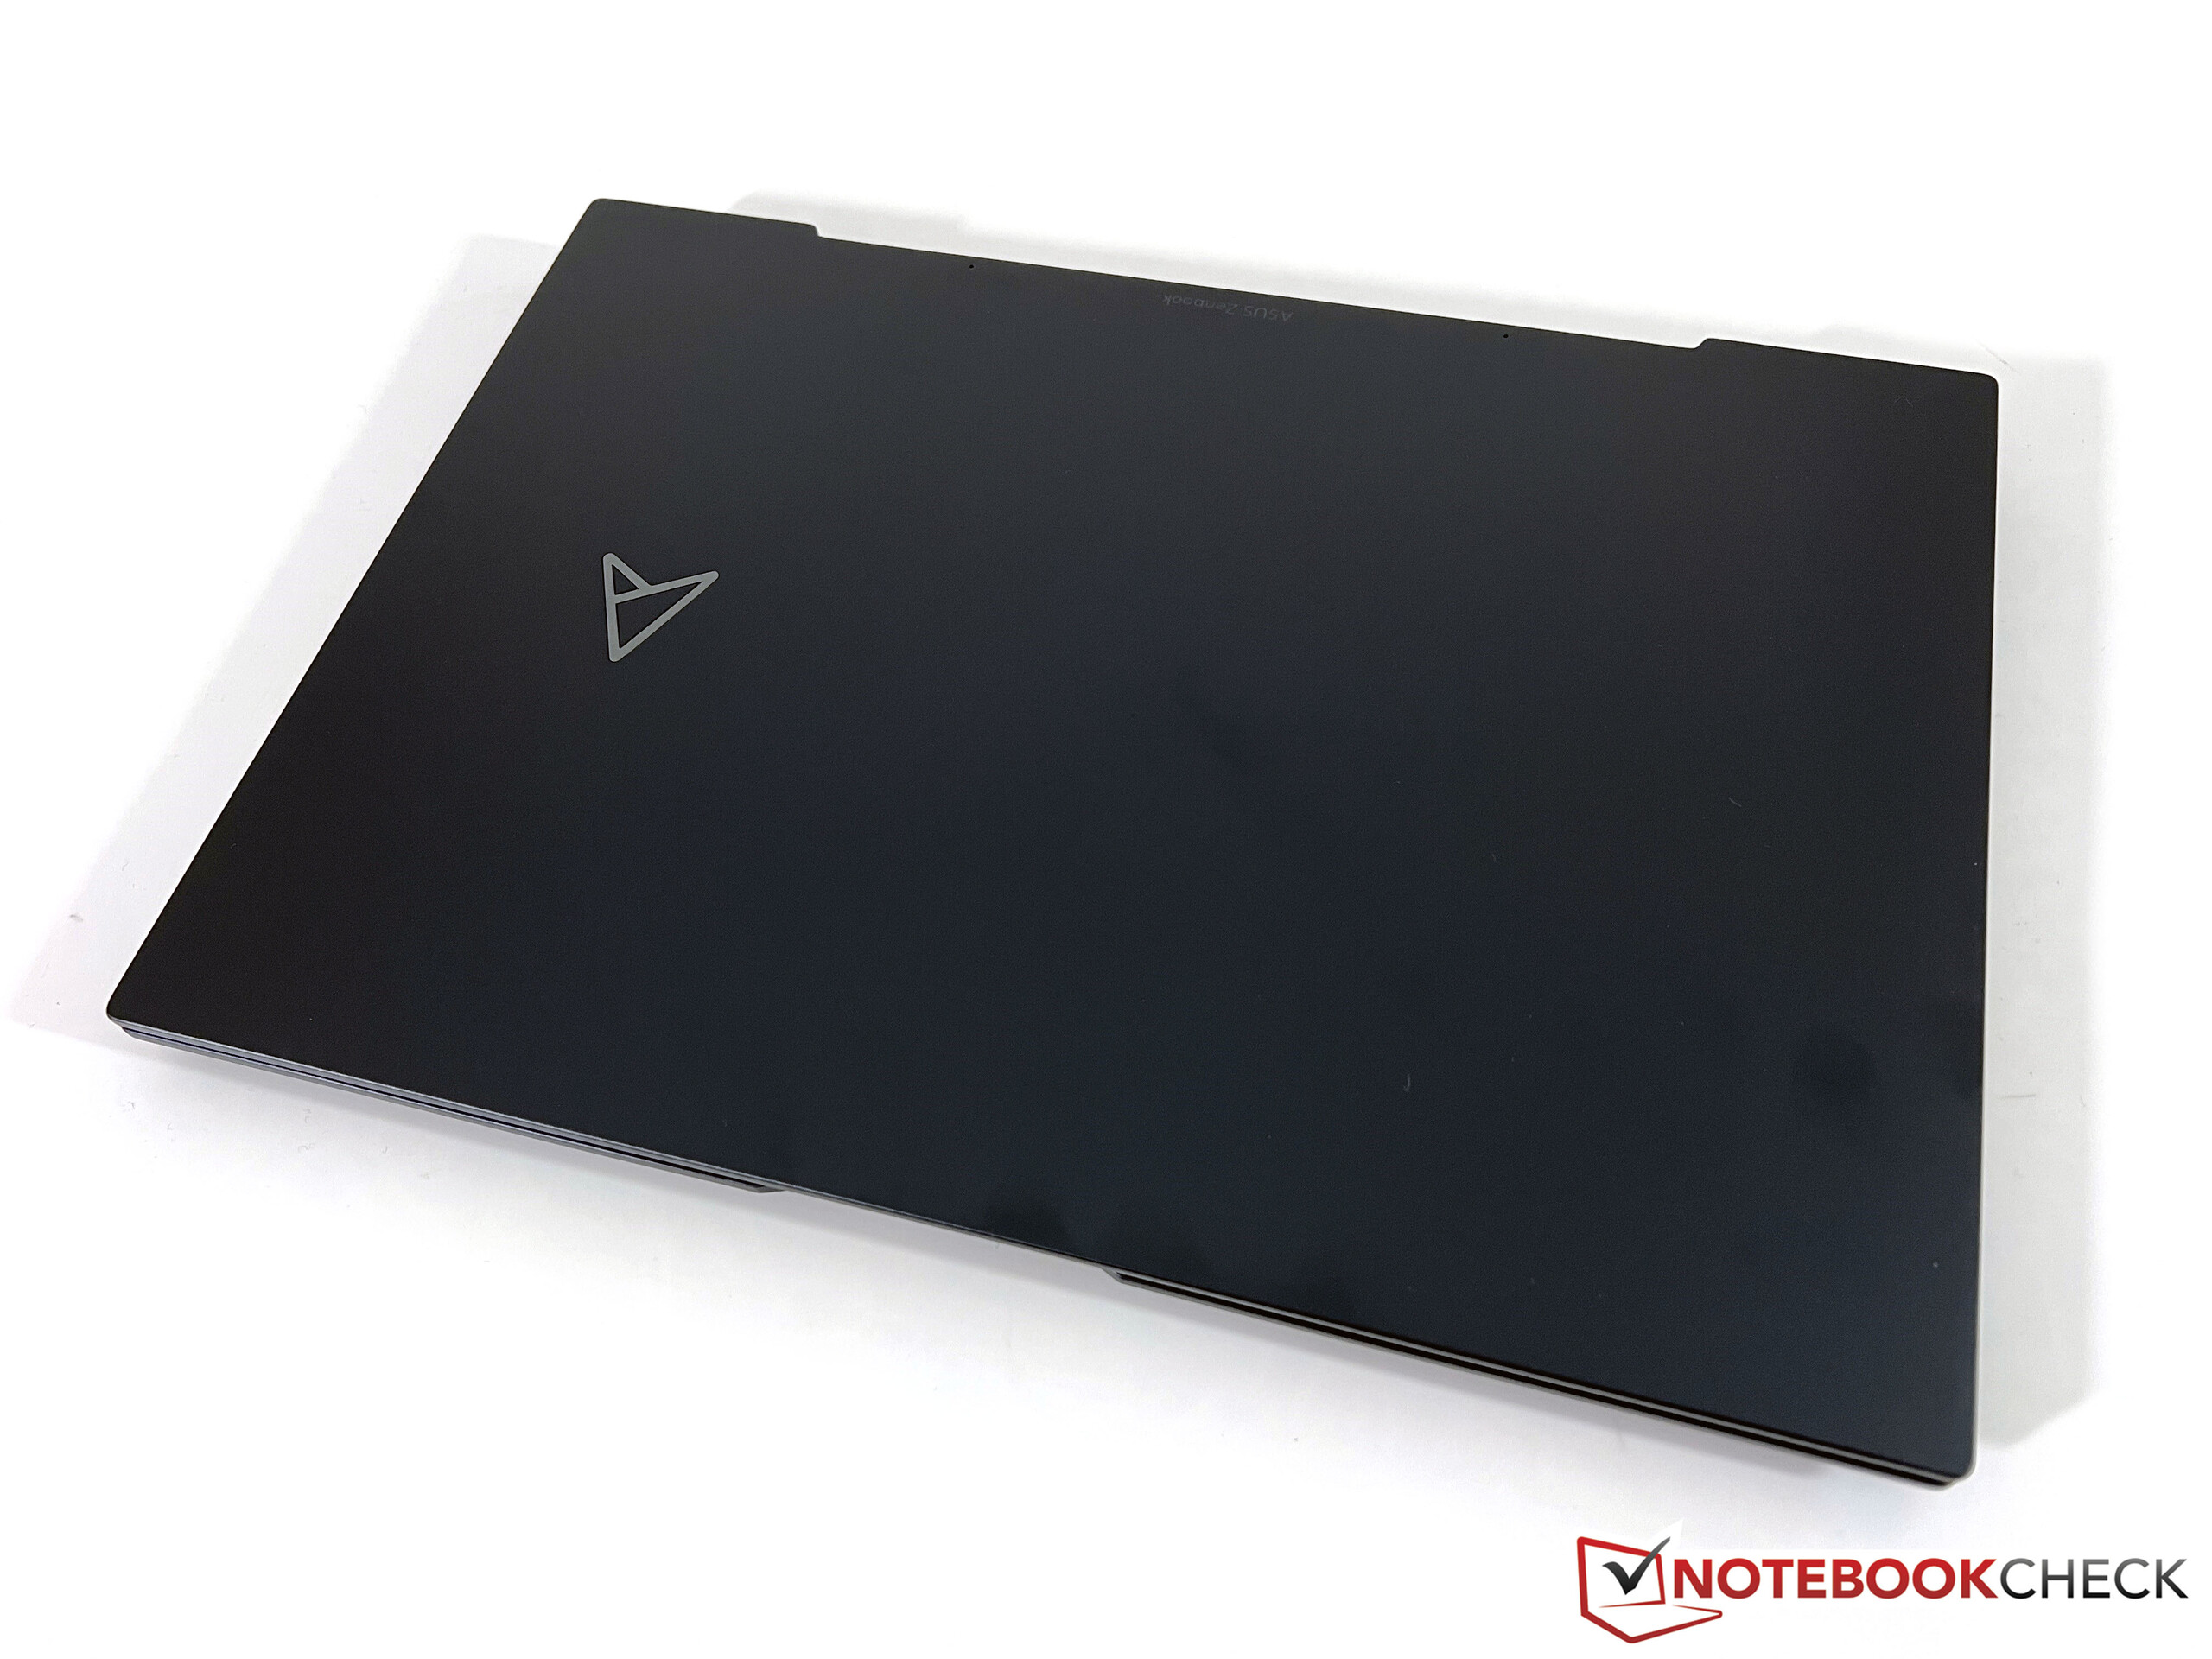
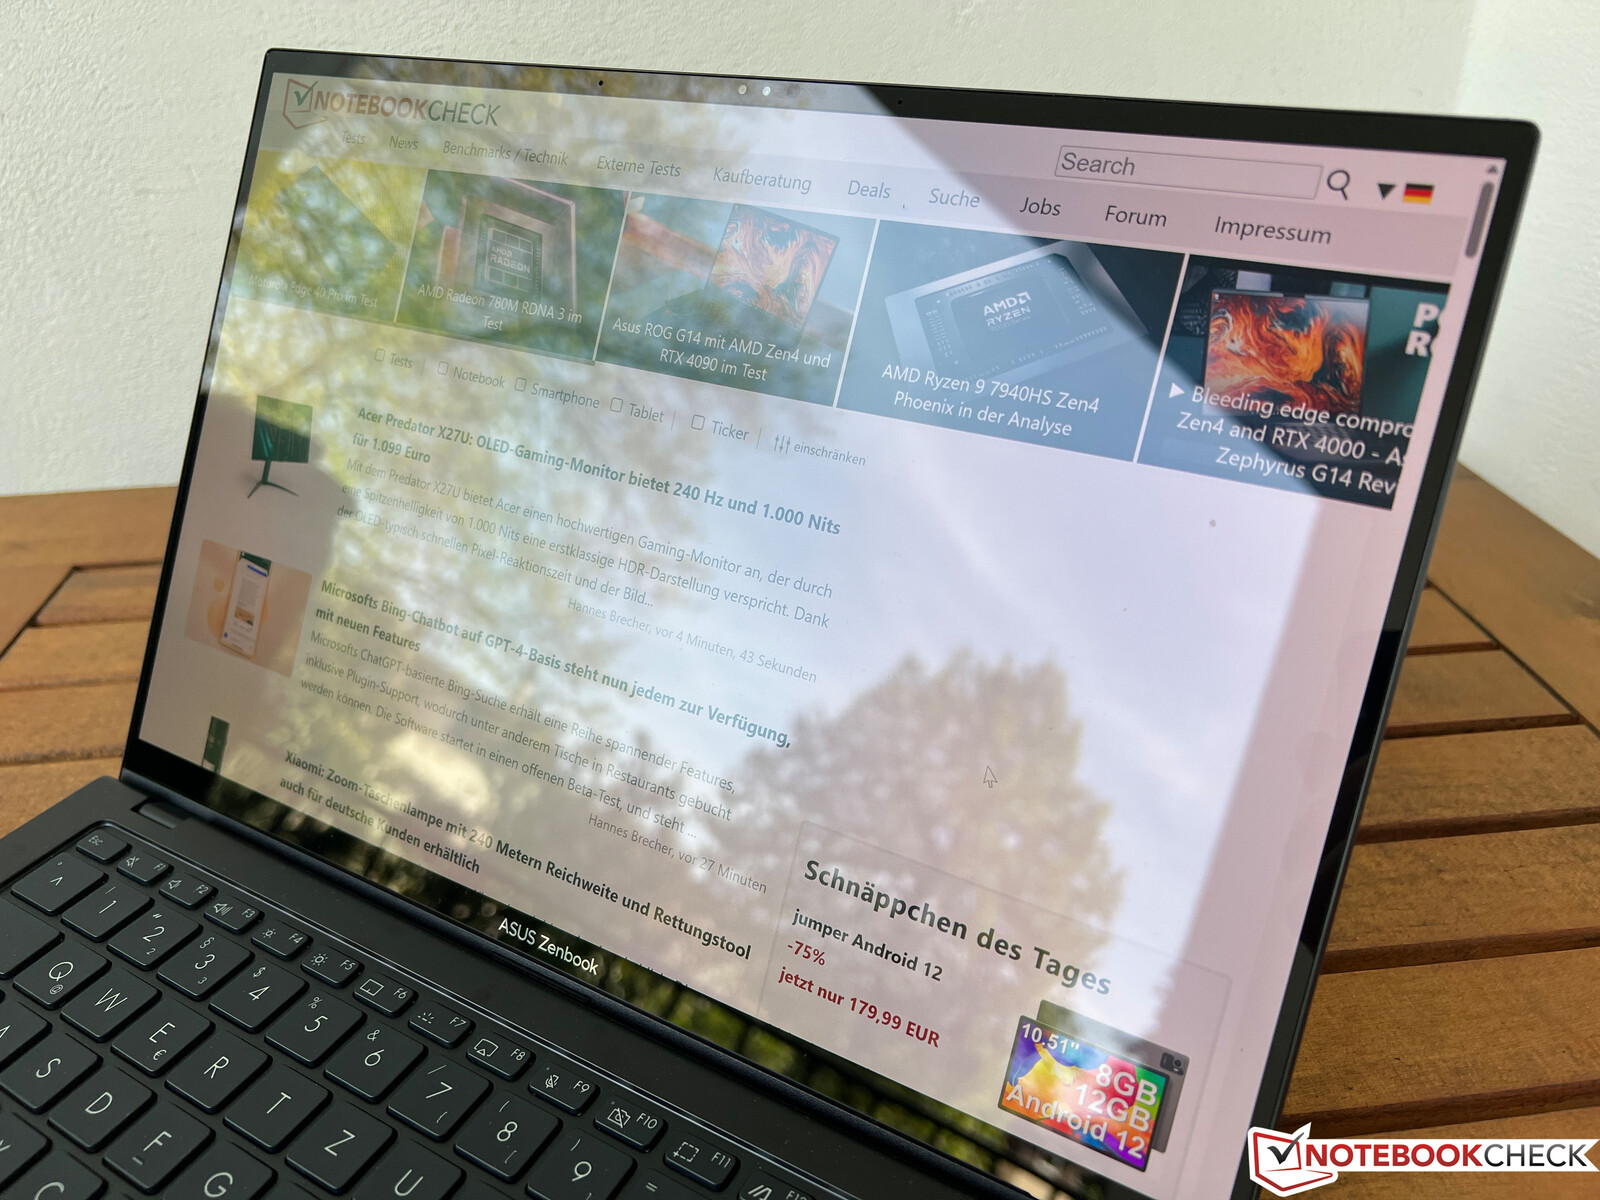
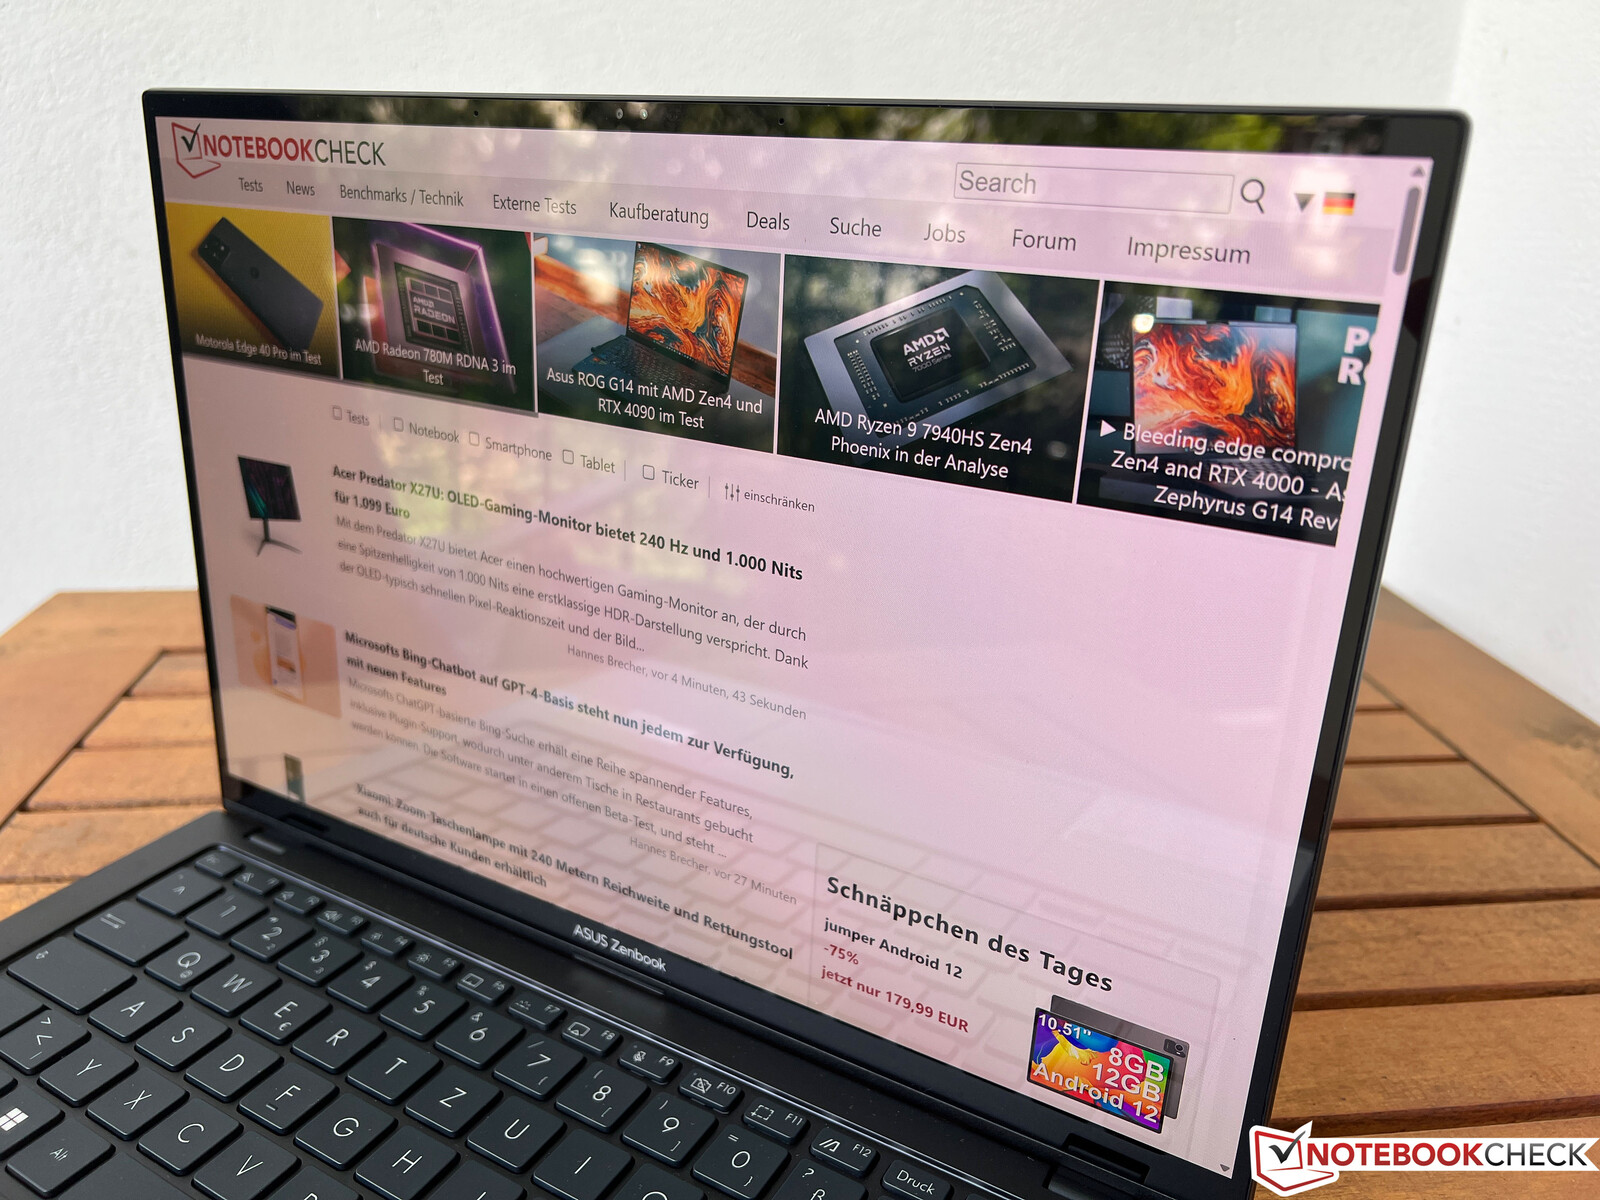
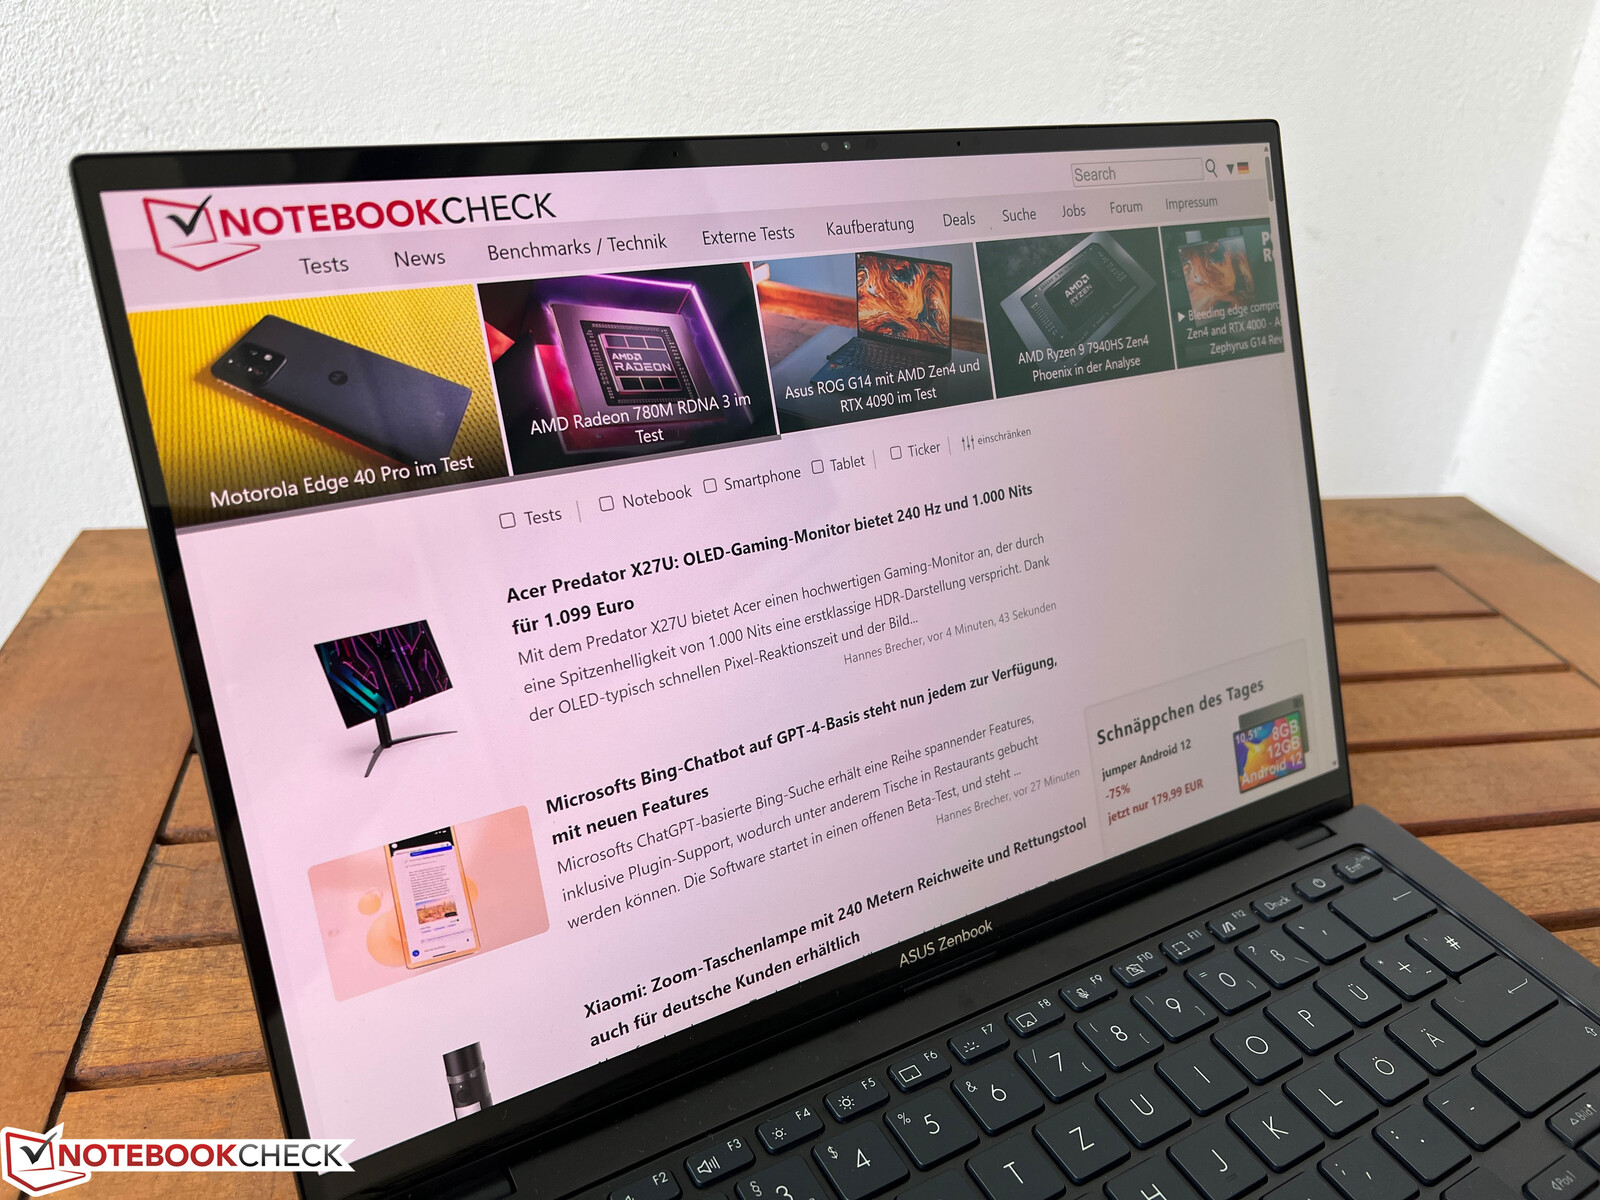
Carcasa - Zenbook con chasis metálico resistente
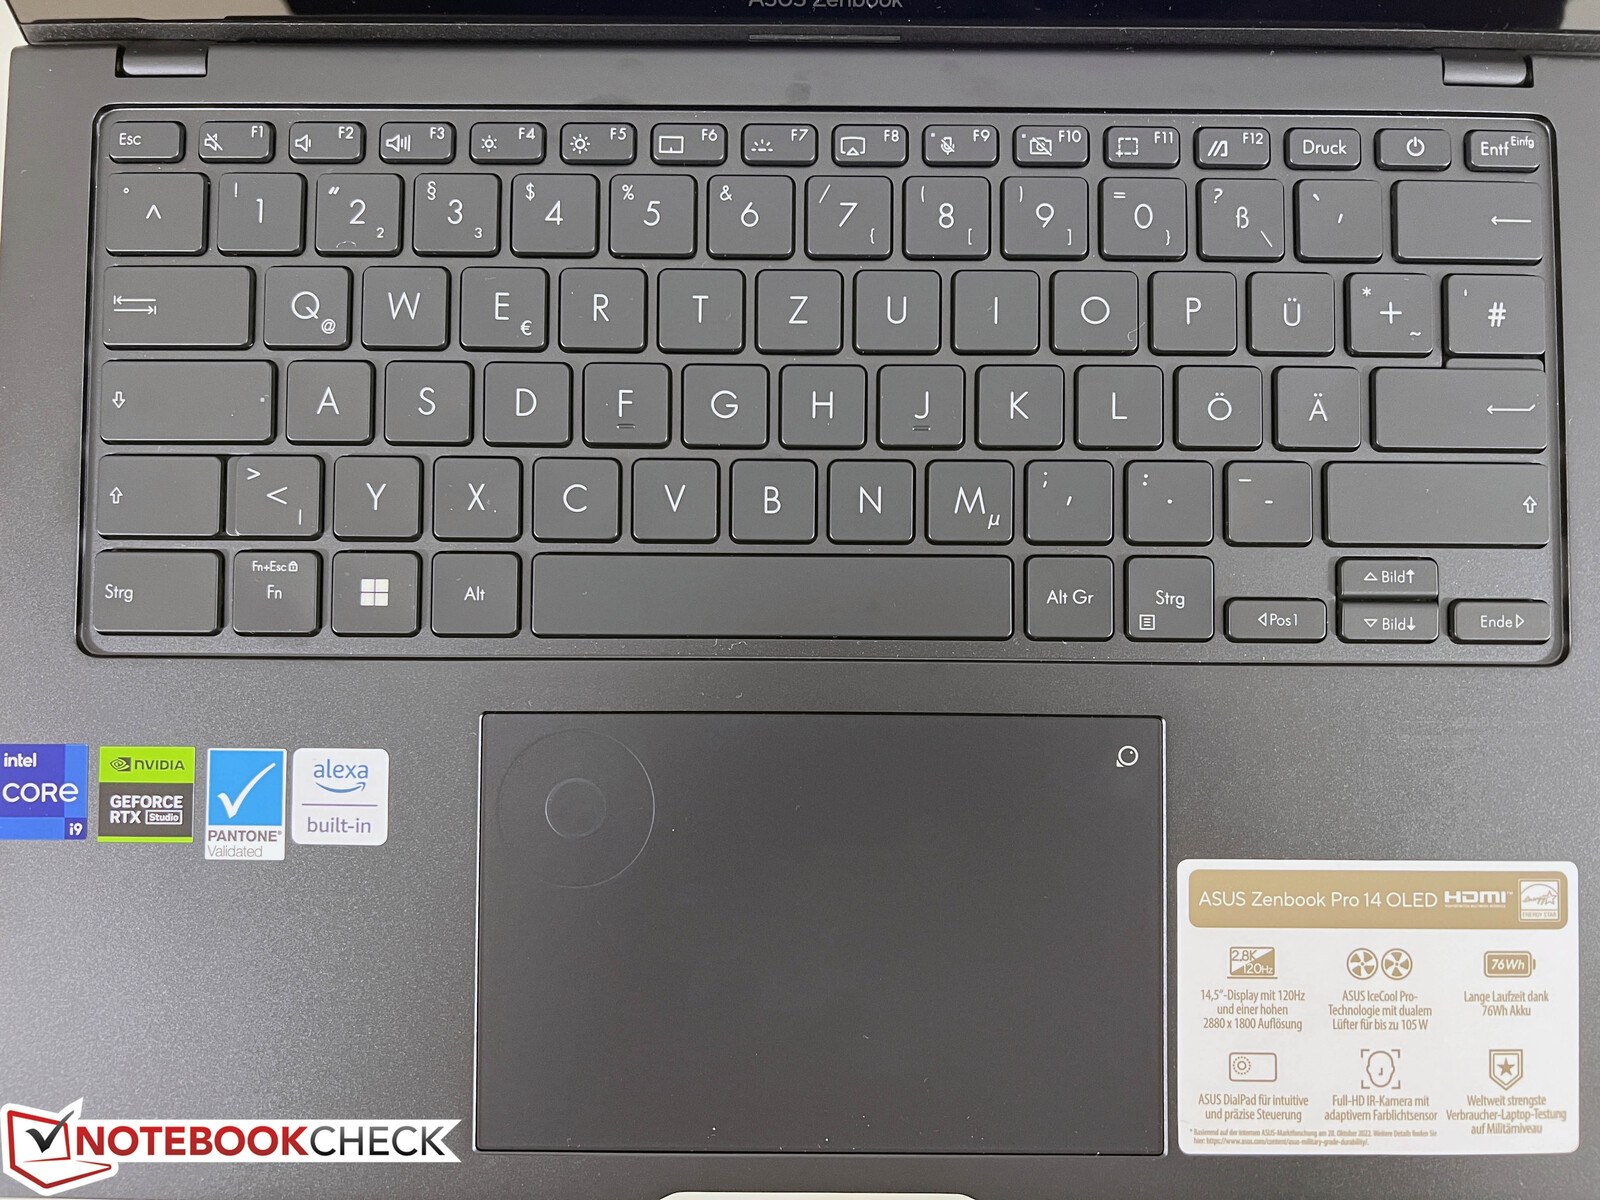
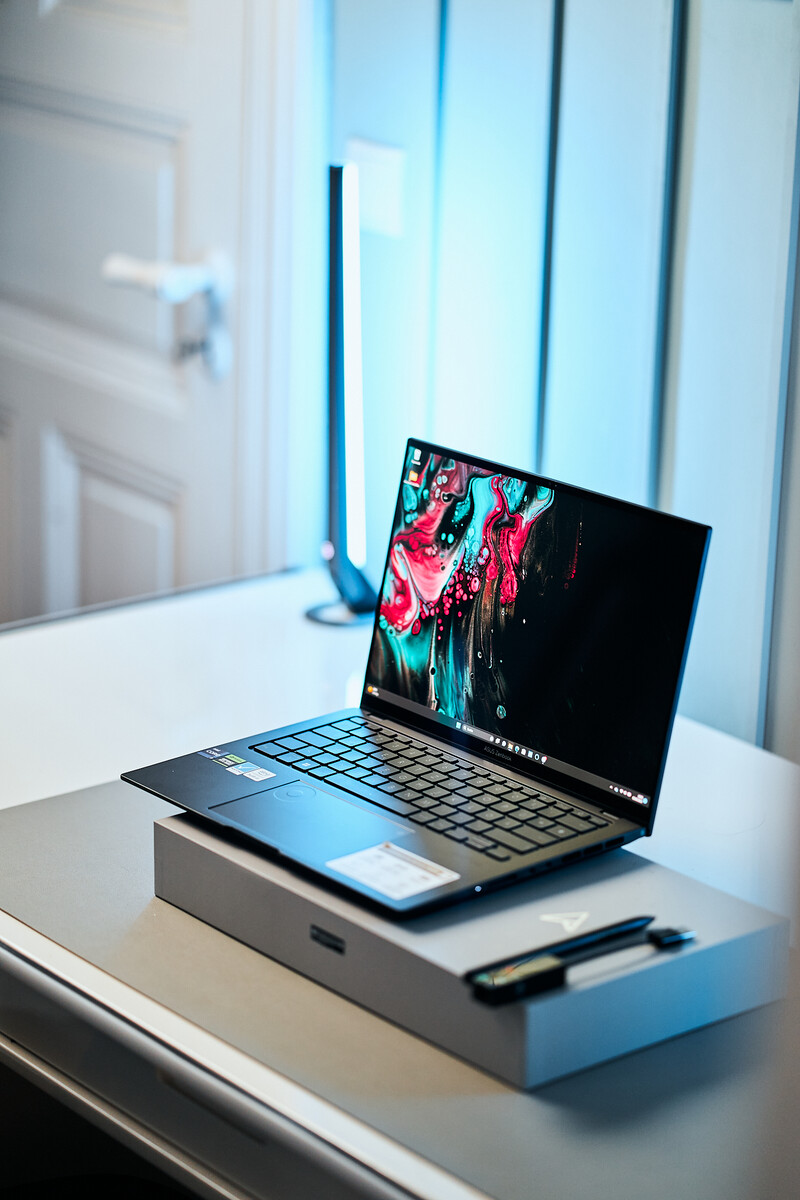
Visualmente, el nuevo Zenbook Pro 14 parece bastante comedido y sólo hay un pequeño logo ProArt en la tapa del display. Asus no añade ningún otro elemento visual por lo demás. Las superficies son lisas, lo que rápidamente resulta en manchas de huellas y la limpieza regular de las mismas. El portátil parece muy elegante en el oscuro color Tech Black, pero las pegatinas del fabricante en el reposamanos son enormemente molestas. La pegatina grande con las características del portátil en el lado derecho puede quitarse fácilmente, pero las cuatro pegatinas más pequeñas del lado izquierdo no. ¿Quién quiere una pegatina de Amazon Alexa en su dispositivo cuando has pagado 3.500 euros por él?
Asus usa un chasis de metal y tanto la unidad base como la tapa de la pantalla son extremadamente estables y resistentes a la torsión. La unidad base también parece bastante delgada, lo que es posible gracias a los laterales cónicos. Esto contrasta con elApple MacBook Pro 14por ejemplo, en el que la unidad base parece muy voluminosa, aunque en realidad es más delgada que el Zenbook. Definitivamente no es un portátil extremadamente delgado, pero esto no es un punto de crítica en vista de los potentes componentes.
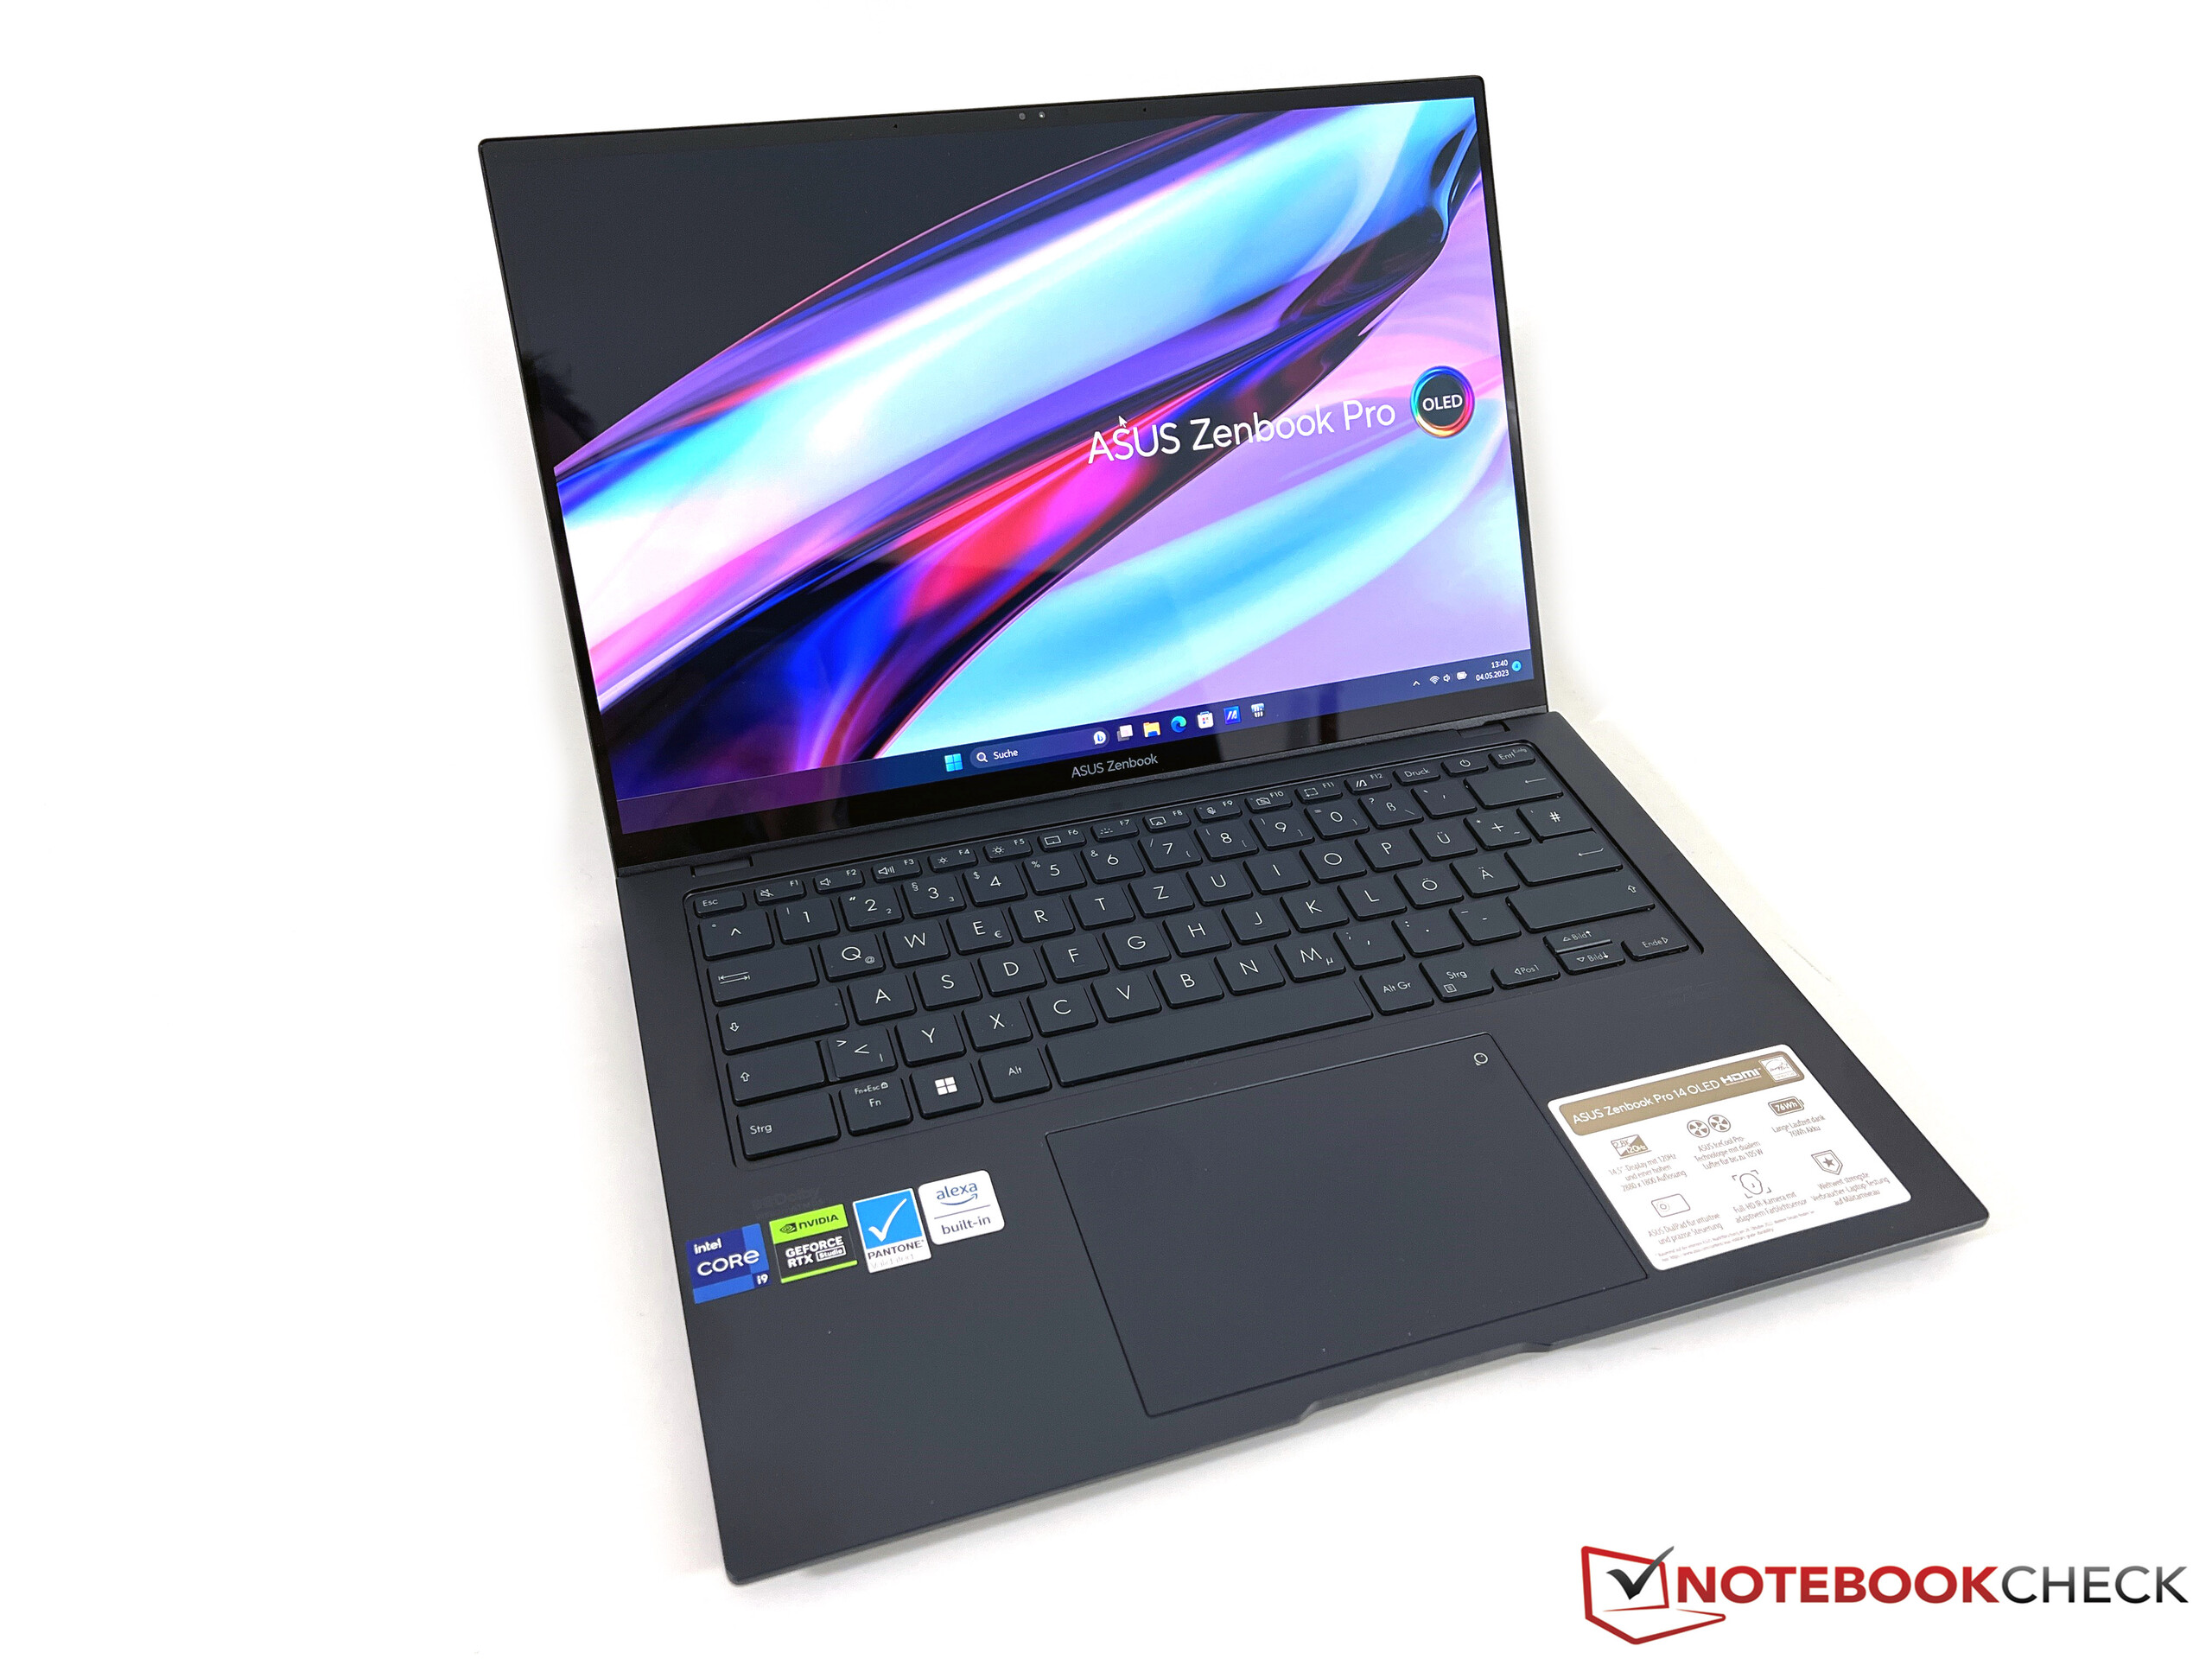
Las dos bisagras del display están bien ajustadas, pero no pueden evitar completamente cierto tambaleo al cambiar el ángulo de apertura. El ángulo máximo de apertura es de ~135 grados. Los bordes de la pantalla del panel 16:10 son muy estrechos, especialmente en los laterales, y el ratio general pantalla-cuerpo es de un buen 85%.
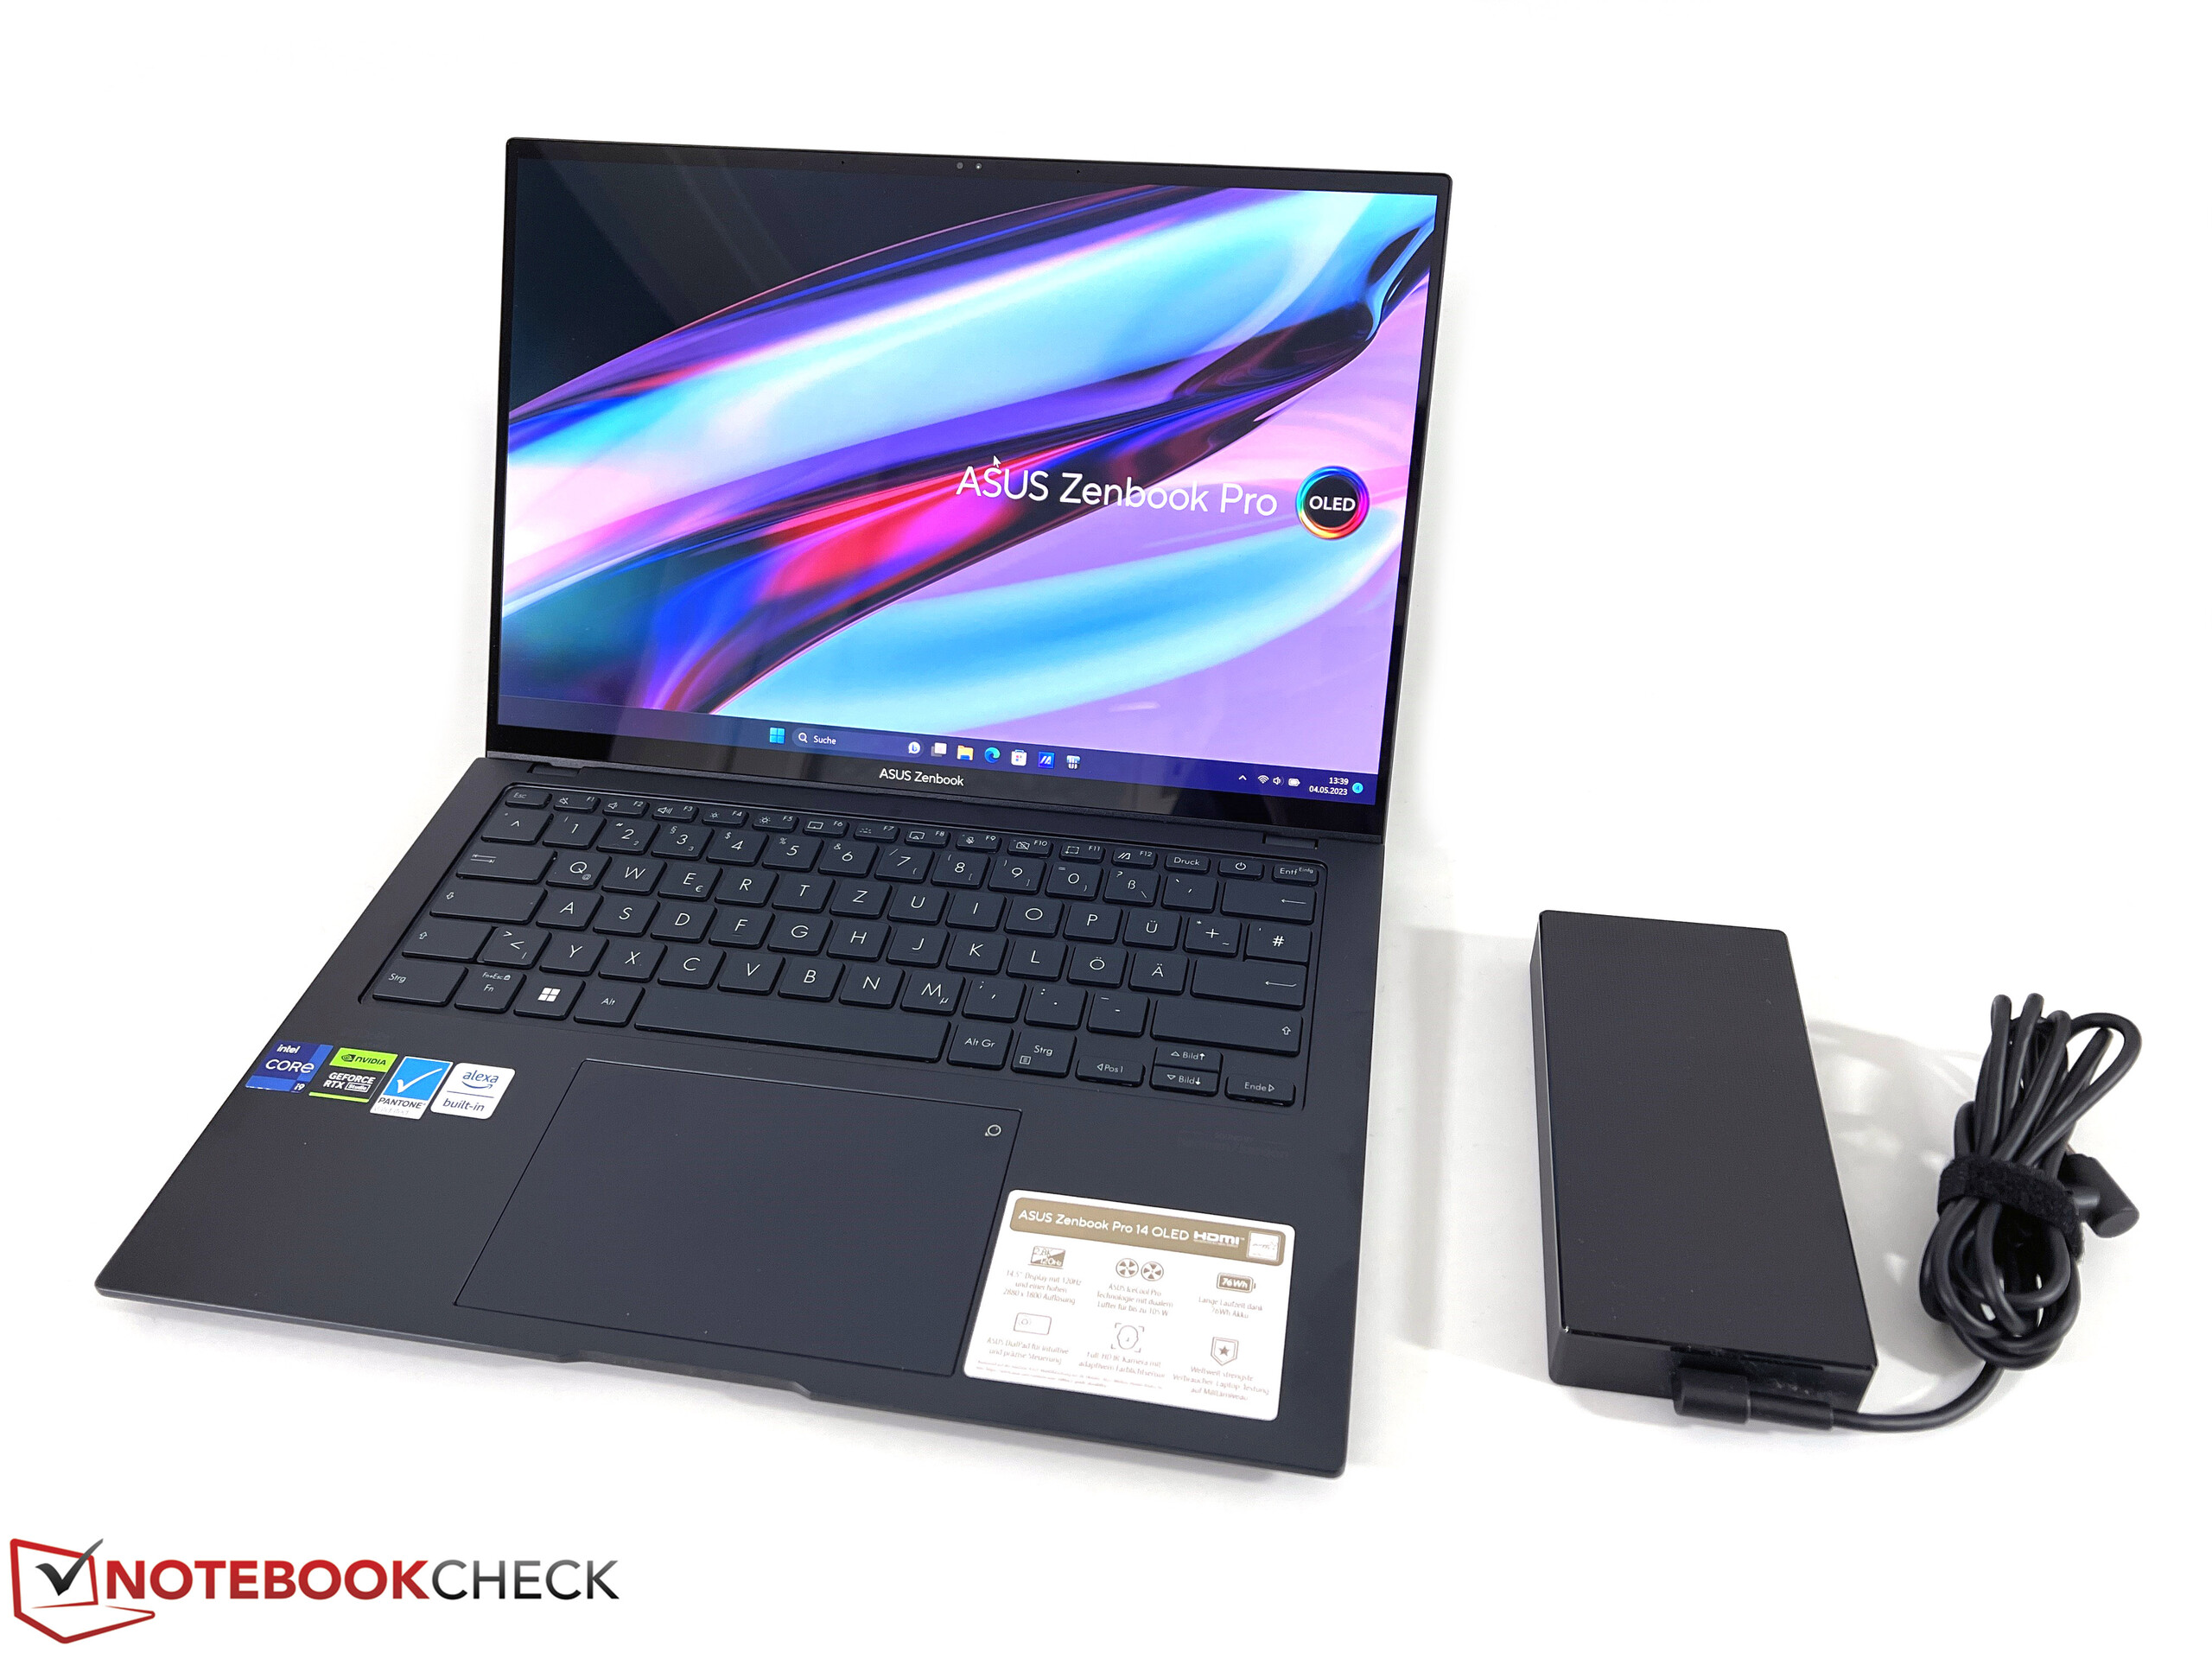
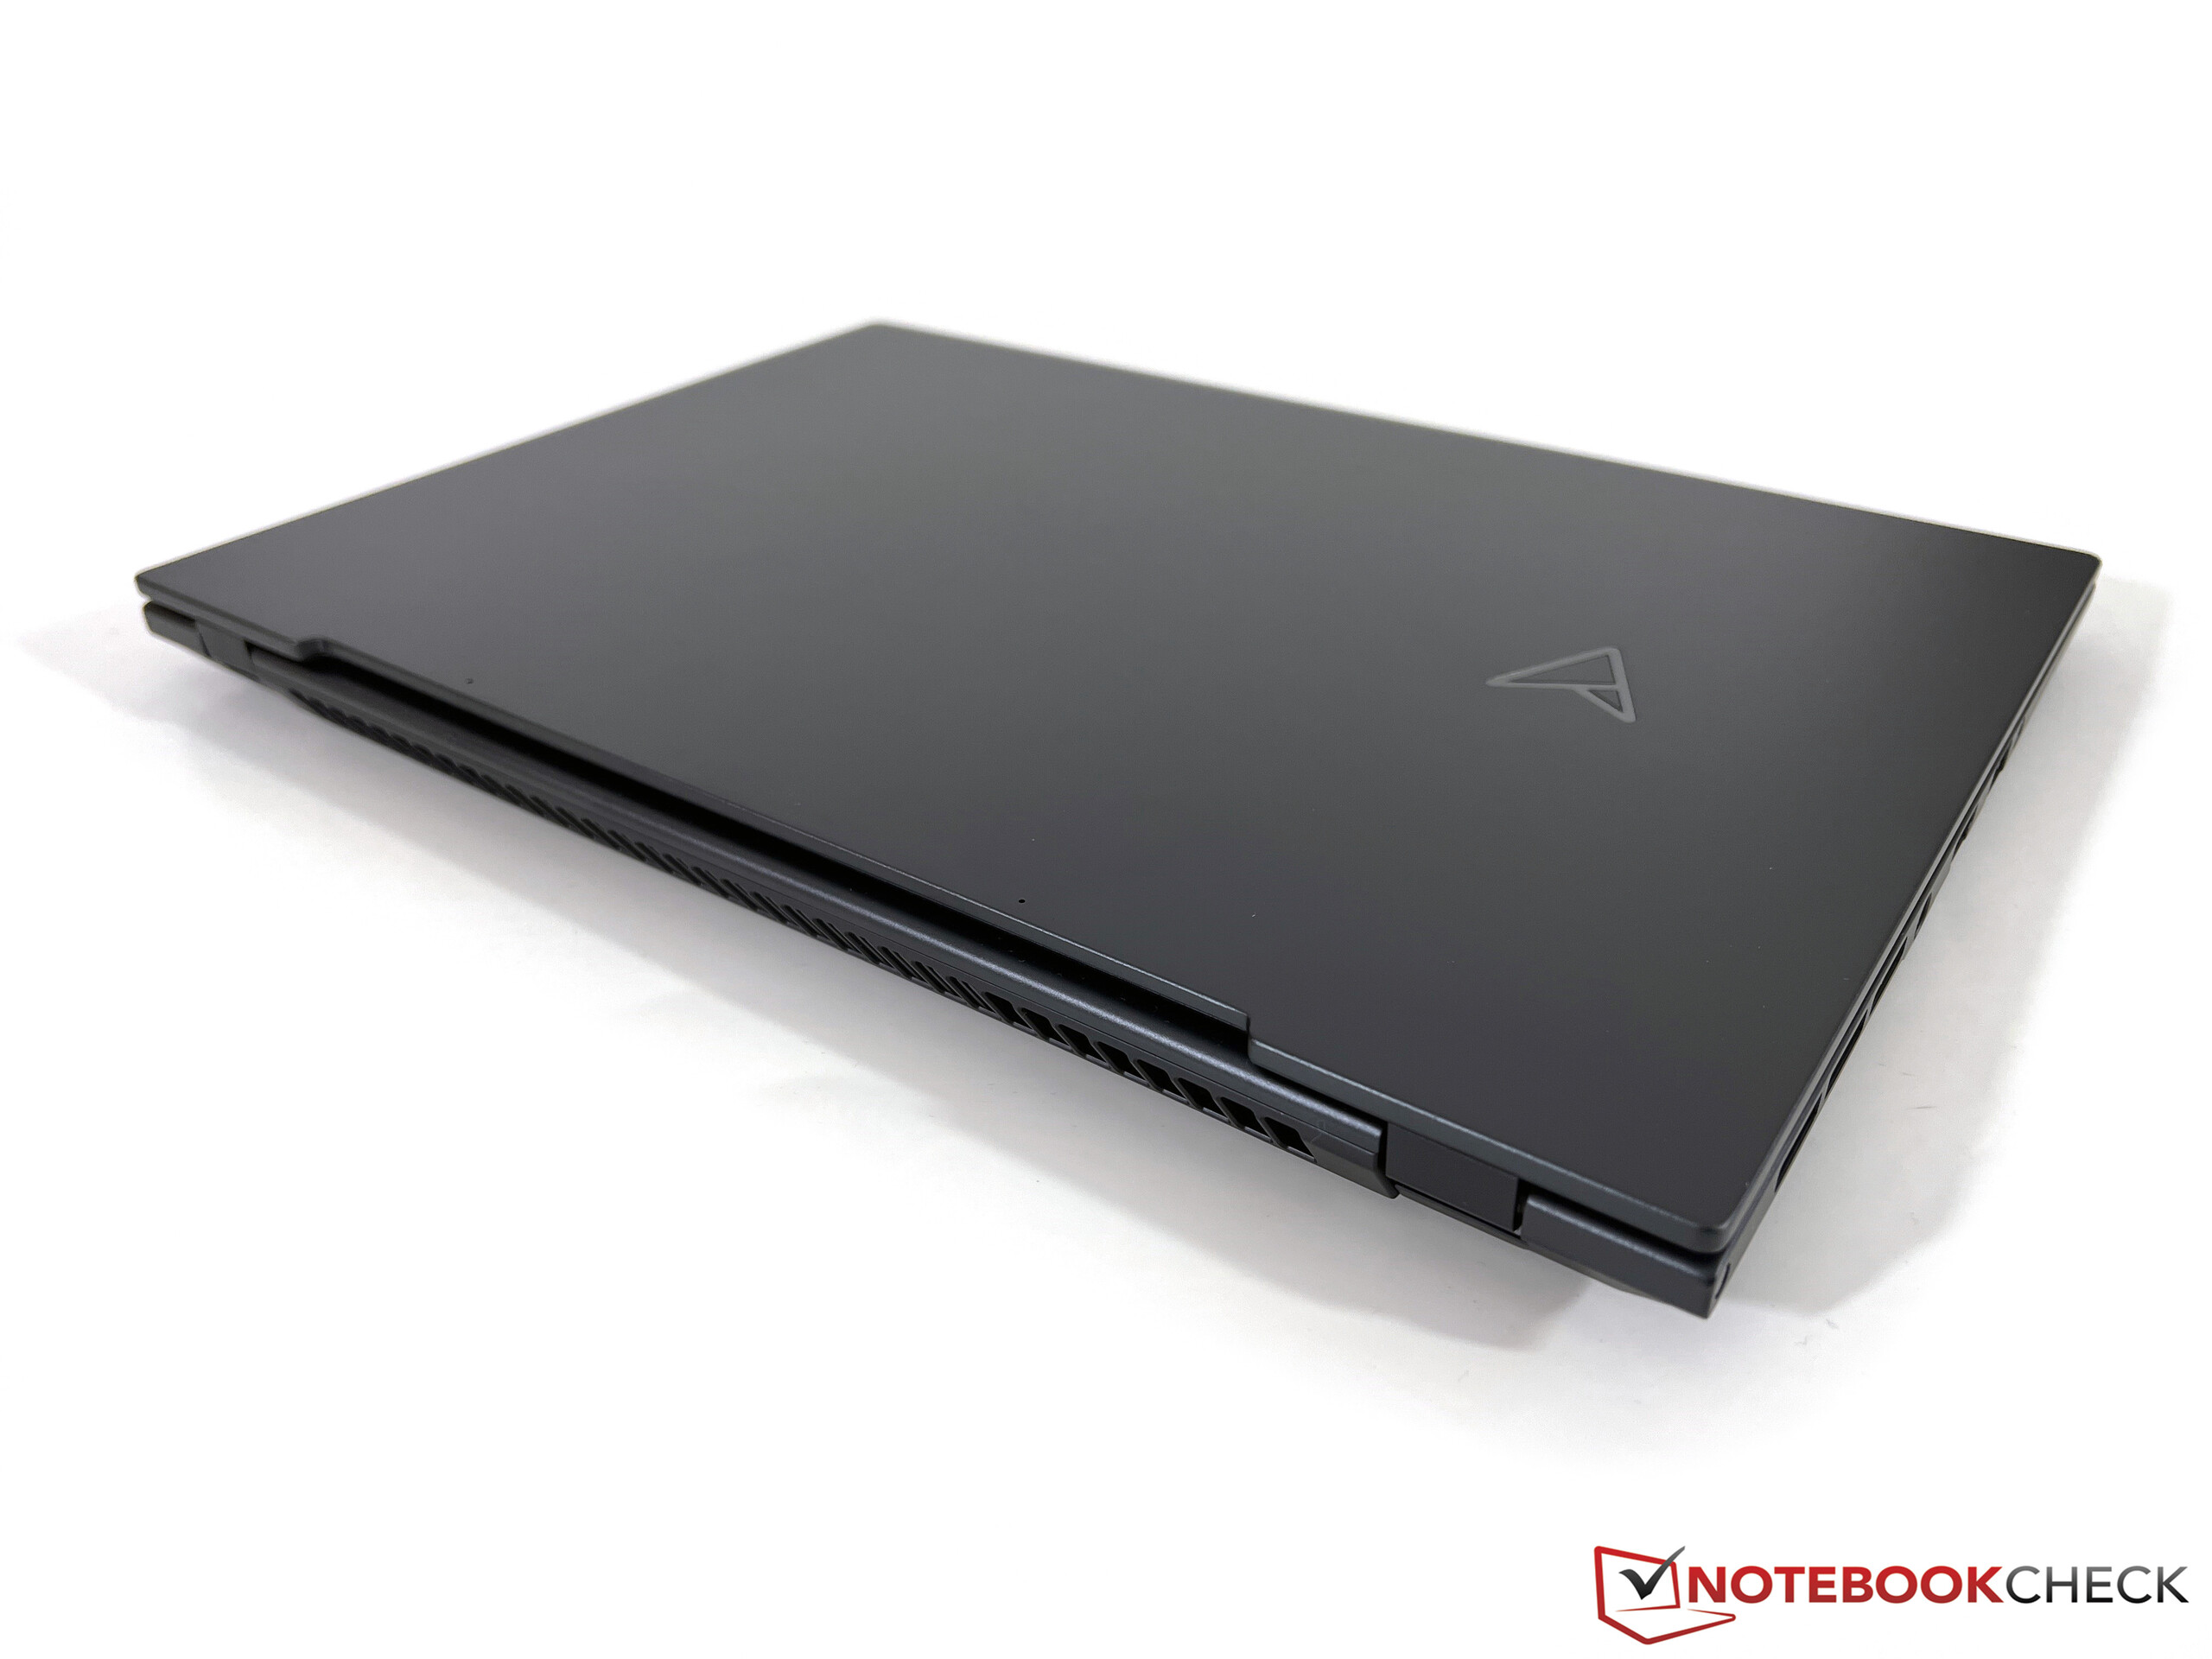
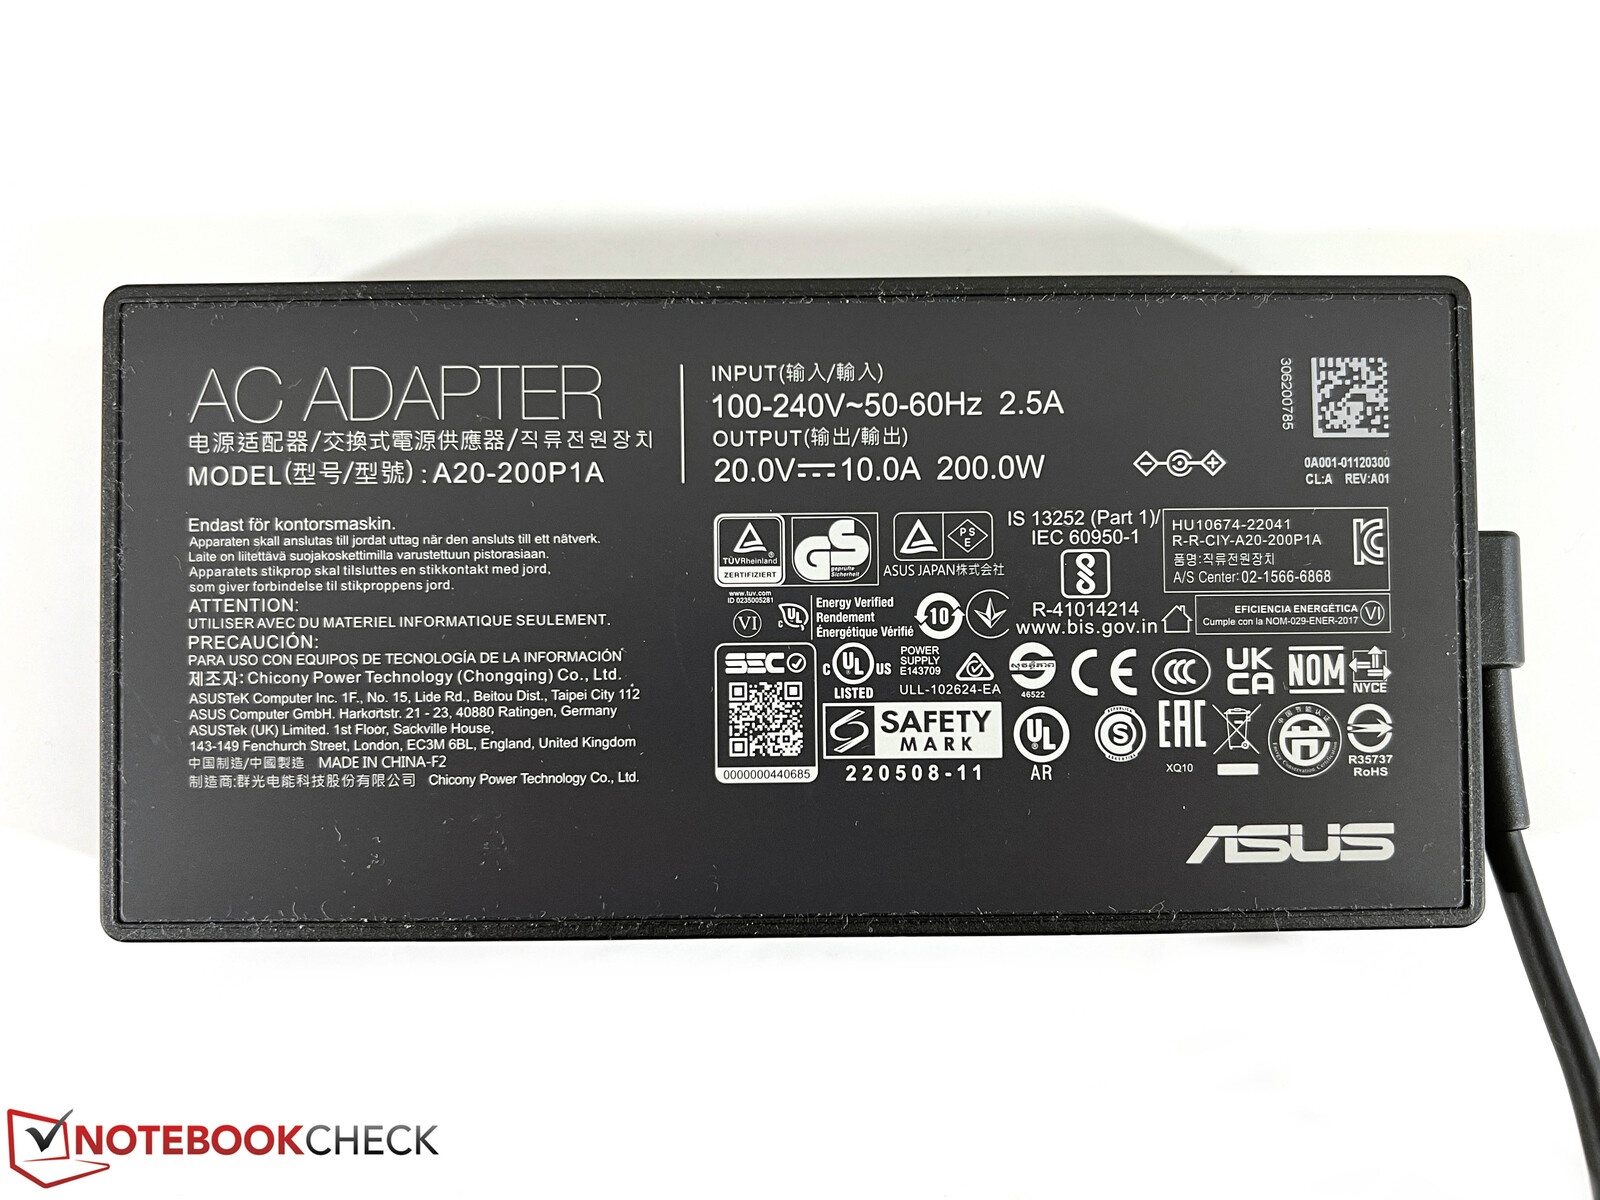
En una comparación directa, el MacBook Pro 14 en particular es algo más compacto en todas las áreas, pero no hay grandes diferencias de peso. Debido al hardware de alto rendimiento, algunos dispositivos de 15 pulgadas de nuestro campo de comparación requieren naturalmente un poco más de espacio en el escritorio. La fuente de alimentación de 200 vatios incluida añade 556 gramos adicionales a la balanza.
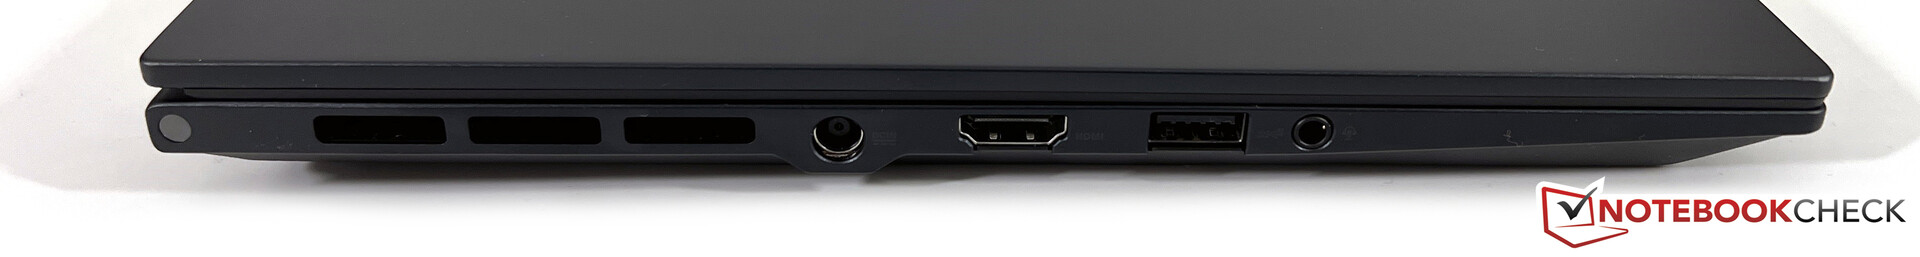
Equipamiento - Asus instala todos los puertos importantes
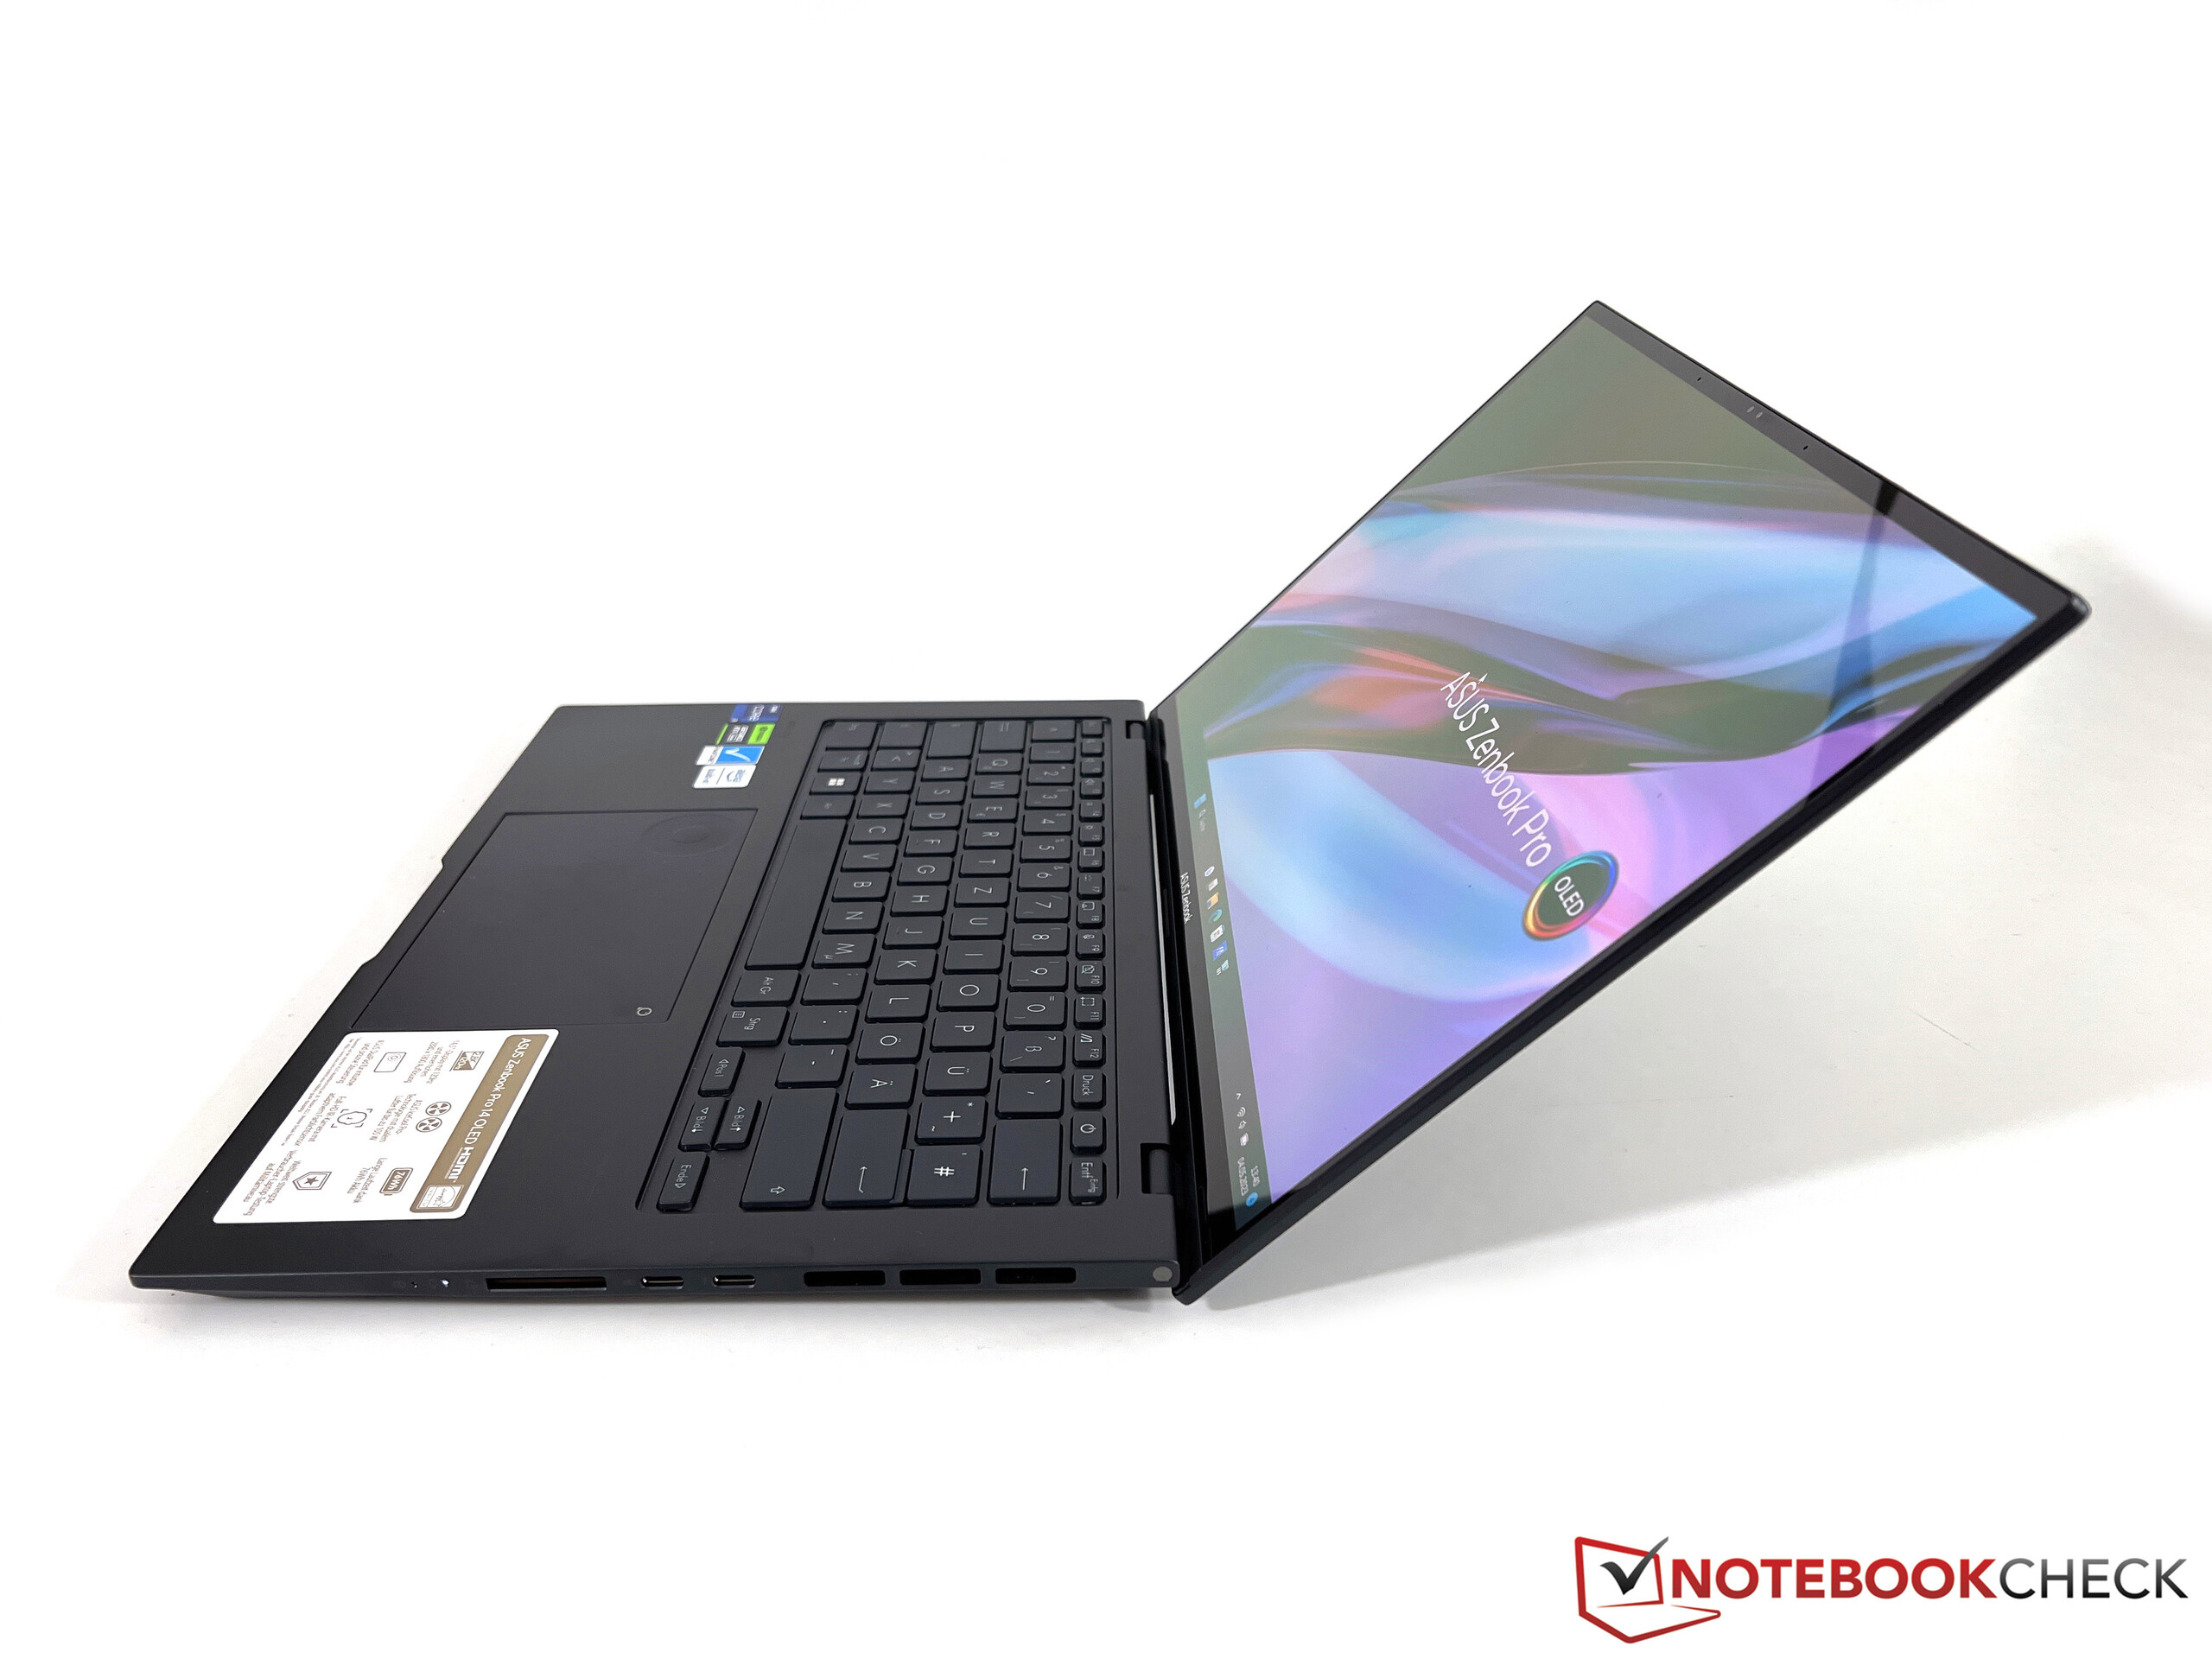
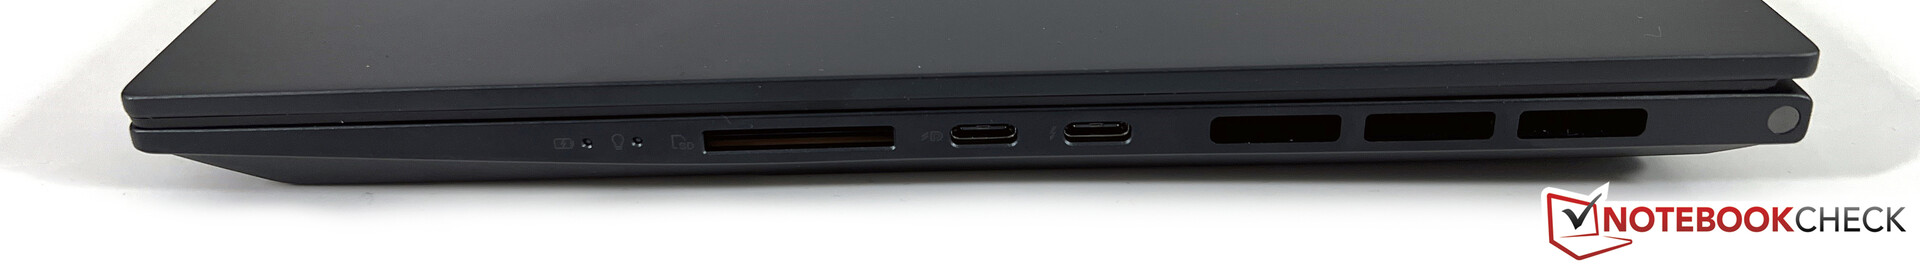
Dado que la zona trasera de la unidad base está ocupada por la refrigeración, las conexiones se distribuyen por el centro de ambos lados. Usar todos los puertos a la vez puede resultar en un puesto de trabajo que parezca muy estrecho. No obstante, Asus ofrece todos los puertos importantes, incluyendo USB-A, USB-C y HDMI. El puerto USB-C trasero también soporta Thunderbolt y también debería usarse si quieres trabajar en un monitor externo, ya que es la única forma de usar la iGPU en el monitor externo. El otro puerto USB-C y la salida HDMI siempre usan la GPU dedicada, lo que consume energía innecesaria, especialmente en tareas sencillas.
Lector de tarjetas SD
El Zenbook ofrece un lector de tarjetas SD en toda regla que también alcanza tasas de transferencia muy altas. Junto con nuestra tarjeta de referencia (Angelbird AV Pro V60), registramos tasas de transferencia máximas de más de 250 MB/s y algo más de 100 MB/s al copiar archivos de imagen.
| SD Card Reader | |
| average JPG Copy Test (av. of 3 runs) | |
| Apple MacBook Pro 14 2023 M2 Pro (AV Pro V60) | |
| Dell XPS 15 9530 RTX 4070 (Toshiba Exceria Pro SDXC 64 GB UHS-II) | |
| Asus ROG Zephyrus G14 GA402XY (Angelibrid AV Pro V60) | |
| Media de la clase Multimedia (23 - 531, n=37, últimos 2 años) | |
| Asus Zenbook Pro 14 OLED UX6404VI (Angelbird AV Pro V60) | |
| Razer Blade 15 OLED (Early 2022) (AV Pro SD microSD 128 GB V60) | |
| Asus ZenBook Pro 14 Duo UX8402VV-P1021W (AV Pro SD microSD 128 GB V60) | |
| maximum AS SSD Seq Read Test (1GB) | |
| Asus ROG Zephyrus G14 GA402XY (Angelibrid AV Pro V60) | |
| Asus Zenbook Pro 14 OLED UX6404VI (Angelbird AV Pro V60) | |
| Apple MacBook Pro 14 2023 M2 Pro (AV Pro V60) | |
| Media de la clase Multimedia (37.3 - 1455, n=36, últimos 2 años) | |
| Dell XPS 15 9530 RTX 4070 (Toshiba Exceria Pro SDXC 64 GB UHS-II) | |
| Razer Blade 15 OLED (Early 2022) (AV Pro SD microSD 128 GB V60) | |
| Asus ZenBook Pro 14 Duo UX8402VV-P1021W (AV Pro SD microSD 128 GB V60) | |
Comunicación
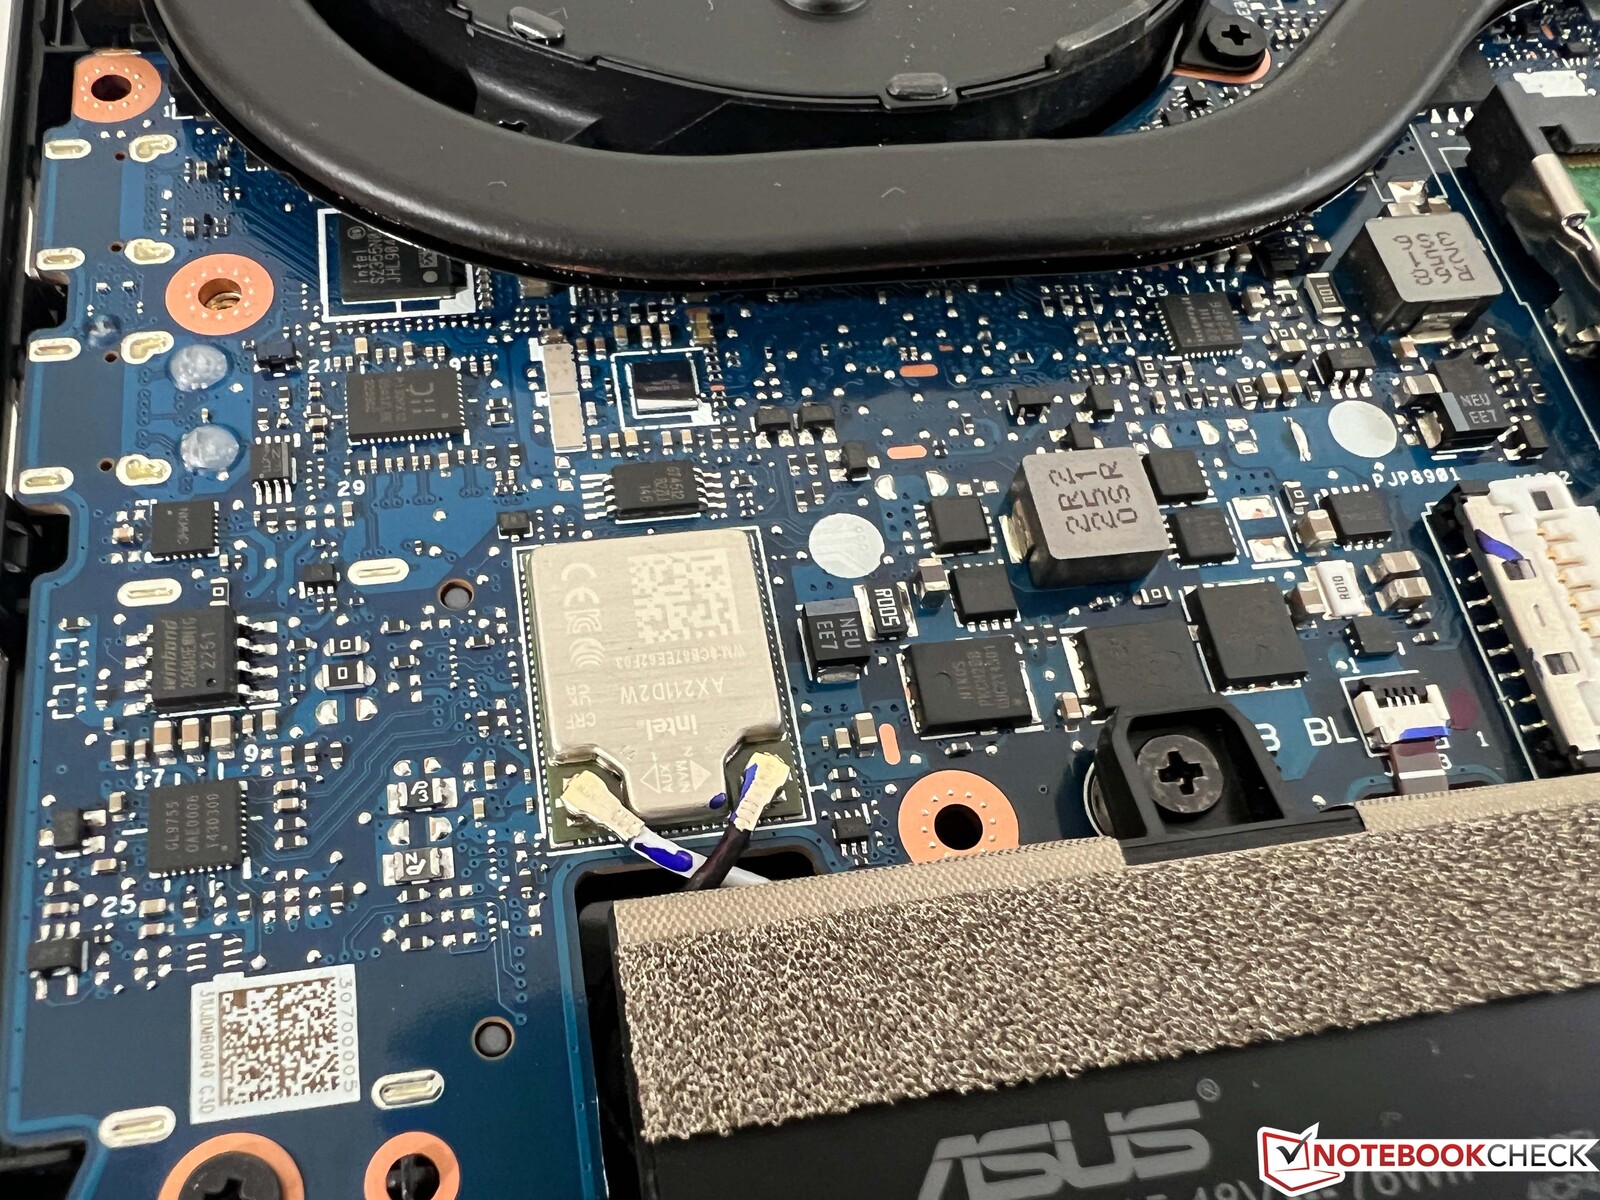
Las conexiones de red inalámbricas corren a cargo del módulo AX211 de Intel, que soporta Bluetooth 5.2 además del actual estándar Wi-Fi 6E. No pudimos conectarnos a la red de 6 GHz correspondiente de nuestro router de referencia Asus, pero el rendimiento en la red de 5 GHz fue muy bueno y no tuvimos problemas con la WLAN. También se incluye un adaptador Ethernet USB para redes cableadas.
| Networking | |
| Asus Zenbook Pro 14 OLED UX6404VI | |
| iperf3 transmit AXE11000 | |
| iperf3 receive AXE11000 | |
| Asus ZenBook Pro 14 Duo UX8402VV-P1021W | |
| iperf3 transmit AXE11000 | |
| iperf3 receive AXE11000 | |
| iperf3 transmit AXE11000 6GHz | |
| iperf3 receive AXE11000 6GHz | |
| Apple MacBook Pro 14 2023 M2 Pro | |
| iperf3 transmit AXE11000 6GHz | |
| iperf3 receive AXE11000 6GHz | |
| Asus ROG Zephyrus G14 GA402XY | |
| iperf3 transmit AXE11000 | |
| iperf3 receive AXE11000 | |
| Dell XPS 15 9530 RTX 4070 | |
| iperf3 transmit AXE11000 | |
| iperf3 receive AXE11000 | |
| Razer Blade 15 OLED (Early 2022) | |
| iperf3 transmit AXE11000 | |
| iperf3 receive AXE11000 | |
| iperf3 transmit AXE11000 6GHz | |
| iperf3 receive AXE11000 6GHz | |
Cámara web
Asus instala un sensor 1080p en el bisel superior de la pantalla para la webcam. La calidad de imagen es algo mejor que la de los viejos modelos 720p, pero no esperes milagros. También se instala un módulo IR que permite el reconocimiento facial a través de Windows Hello.


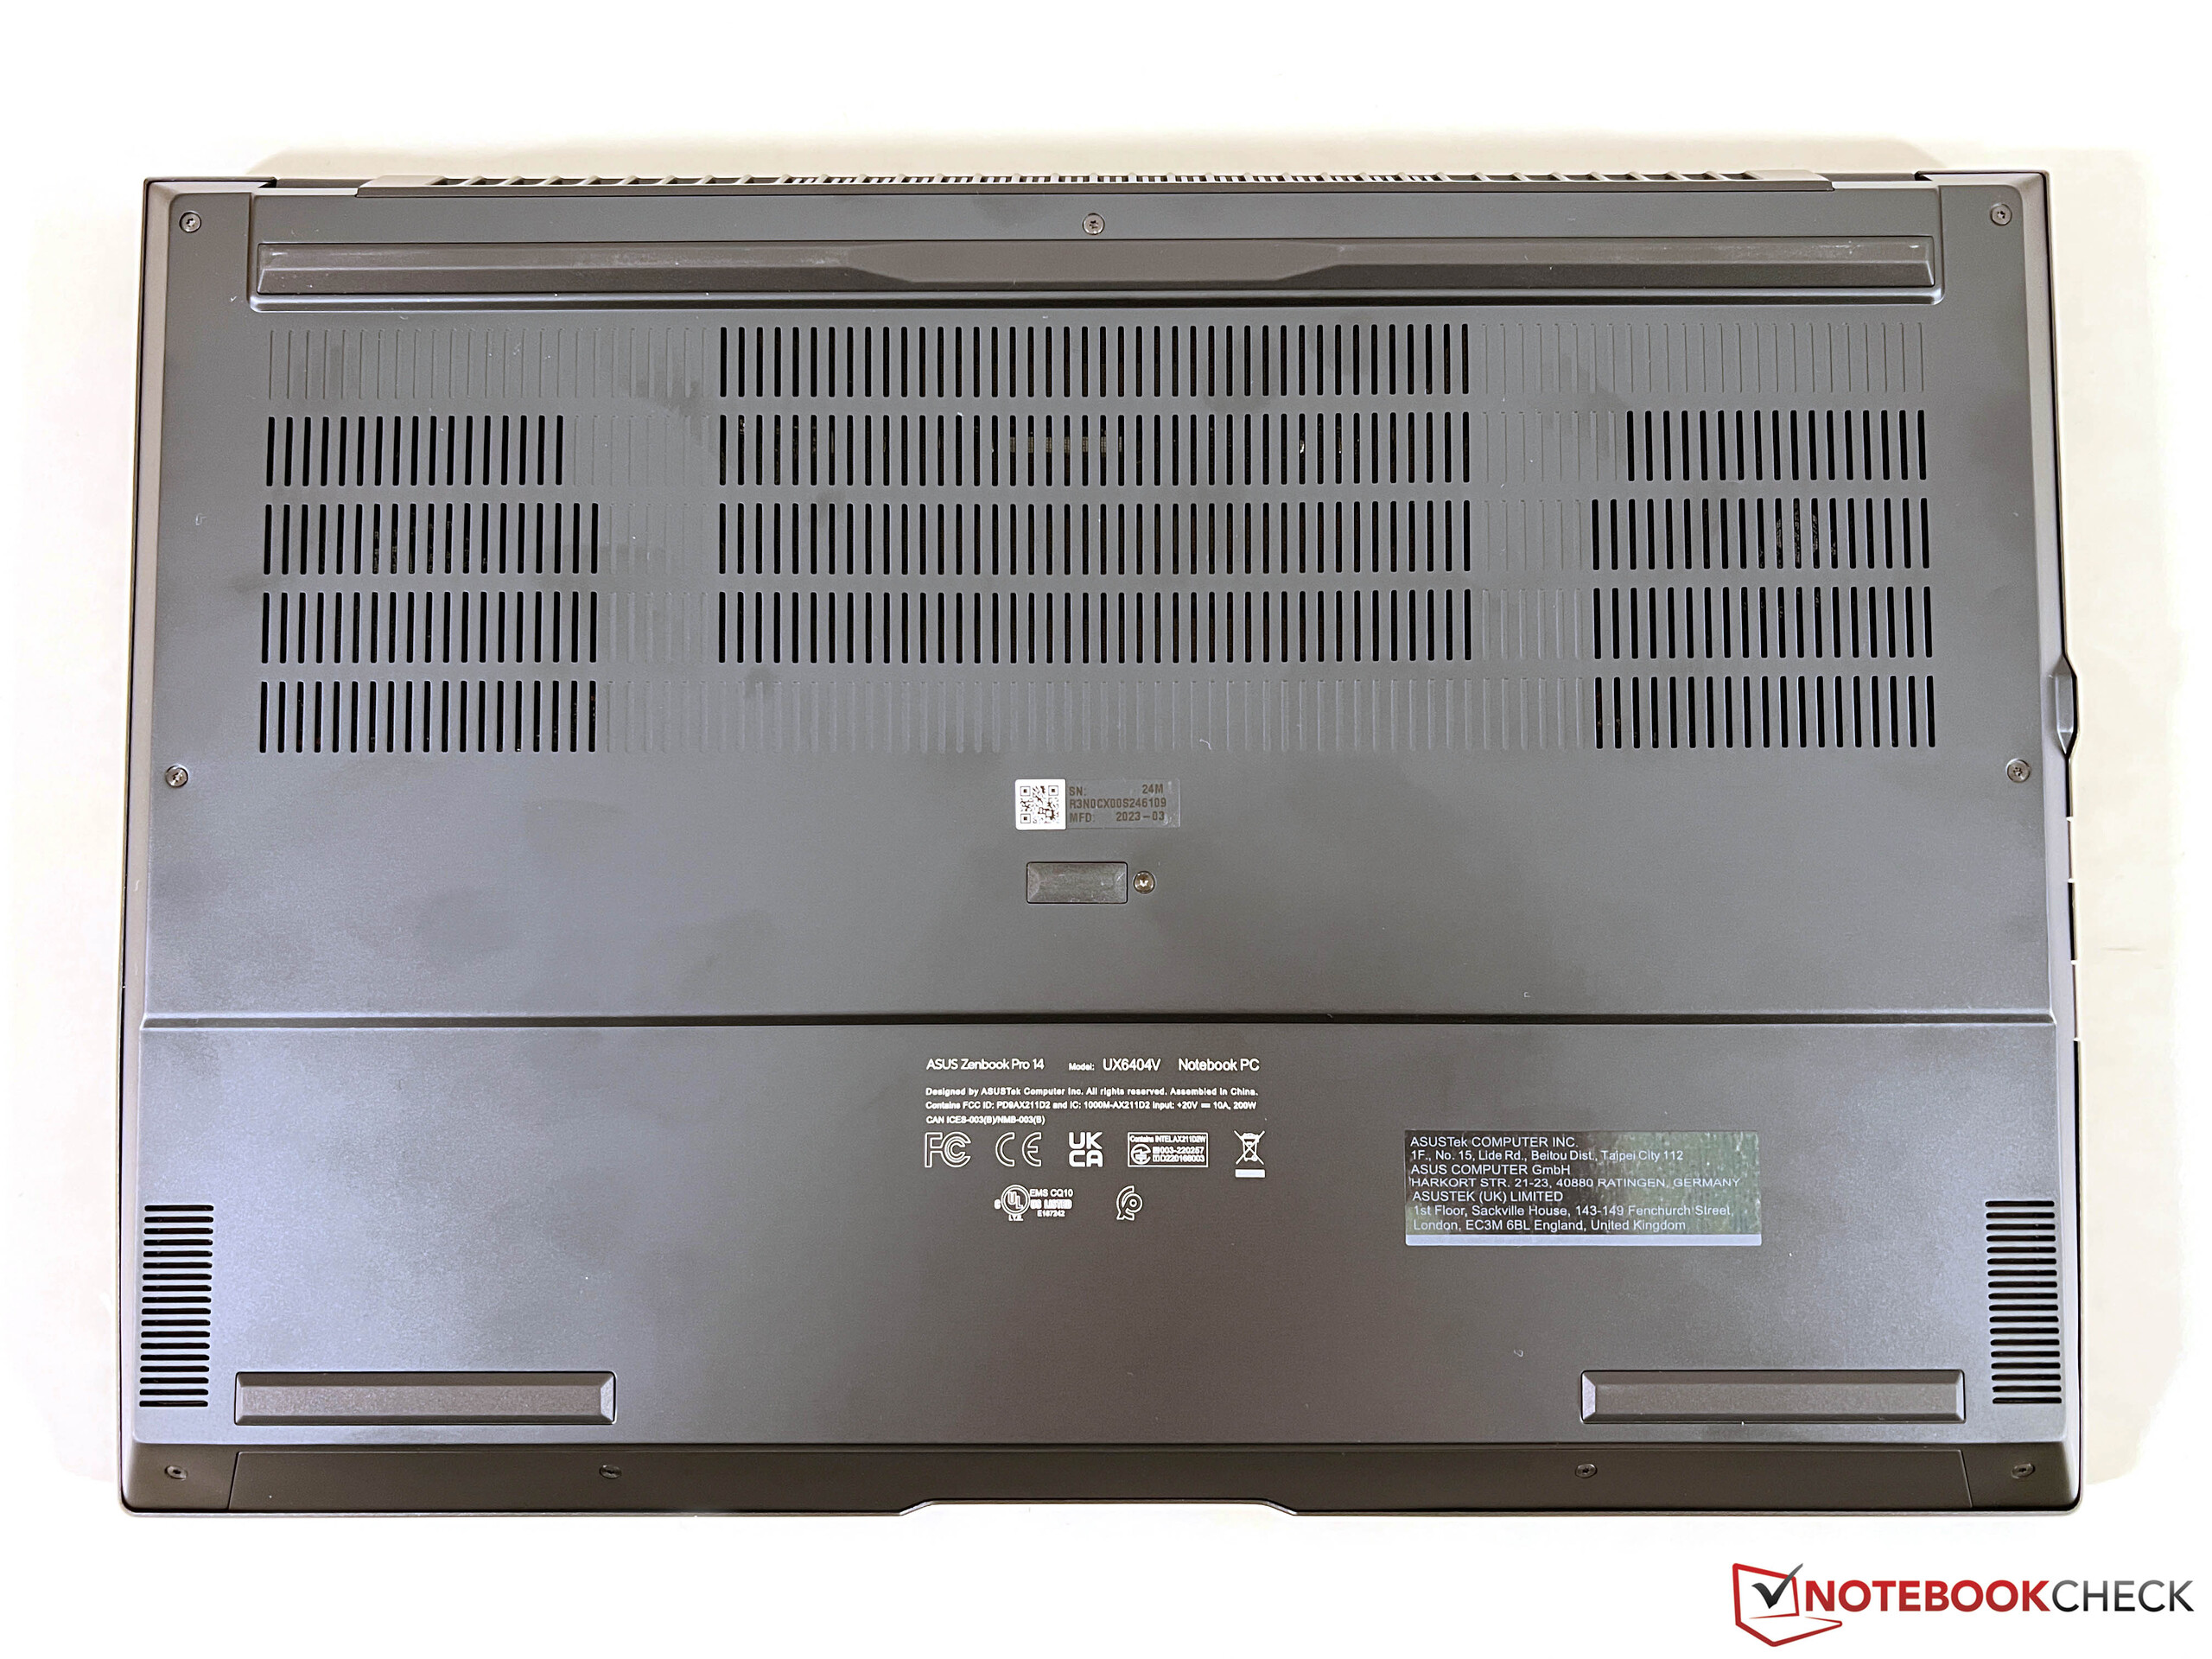
Mantenimiento
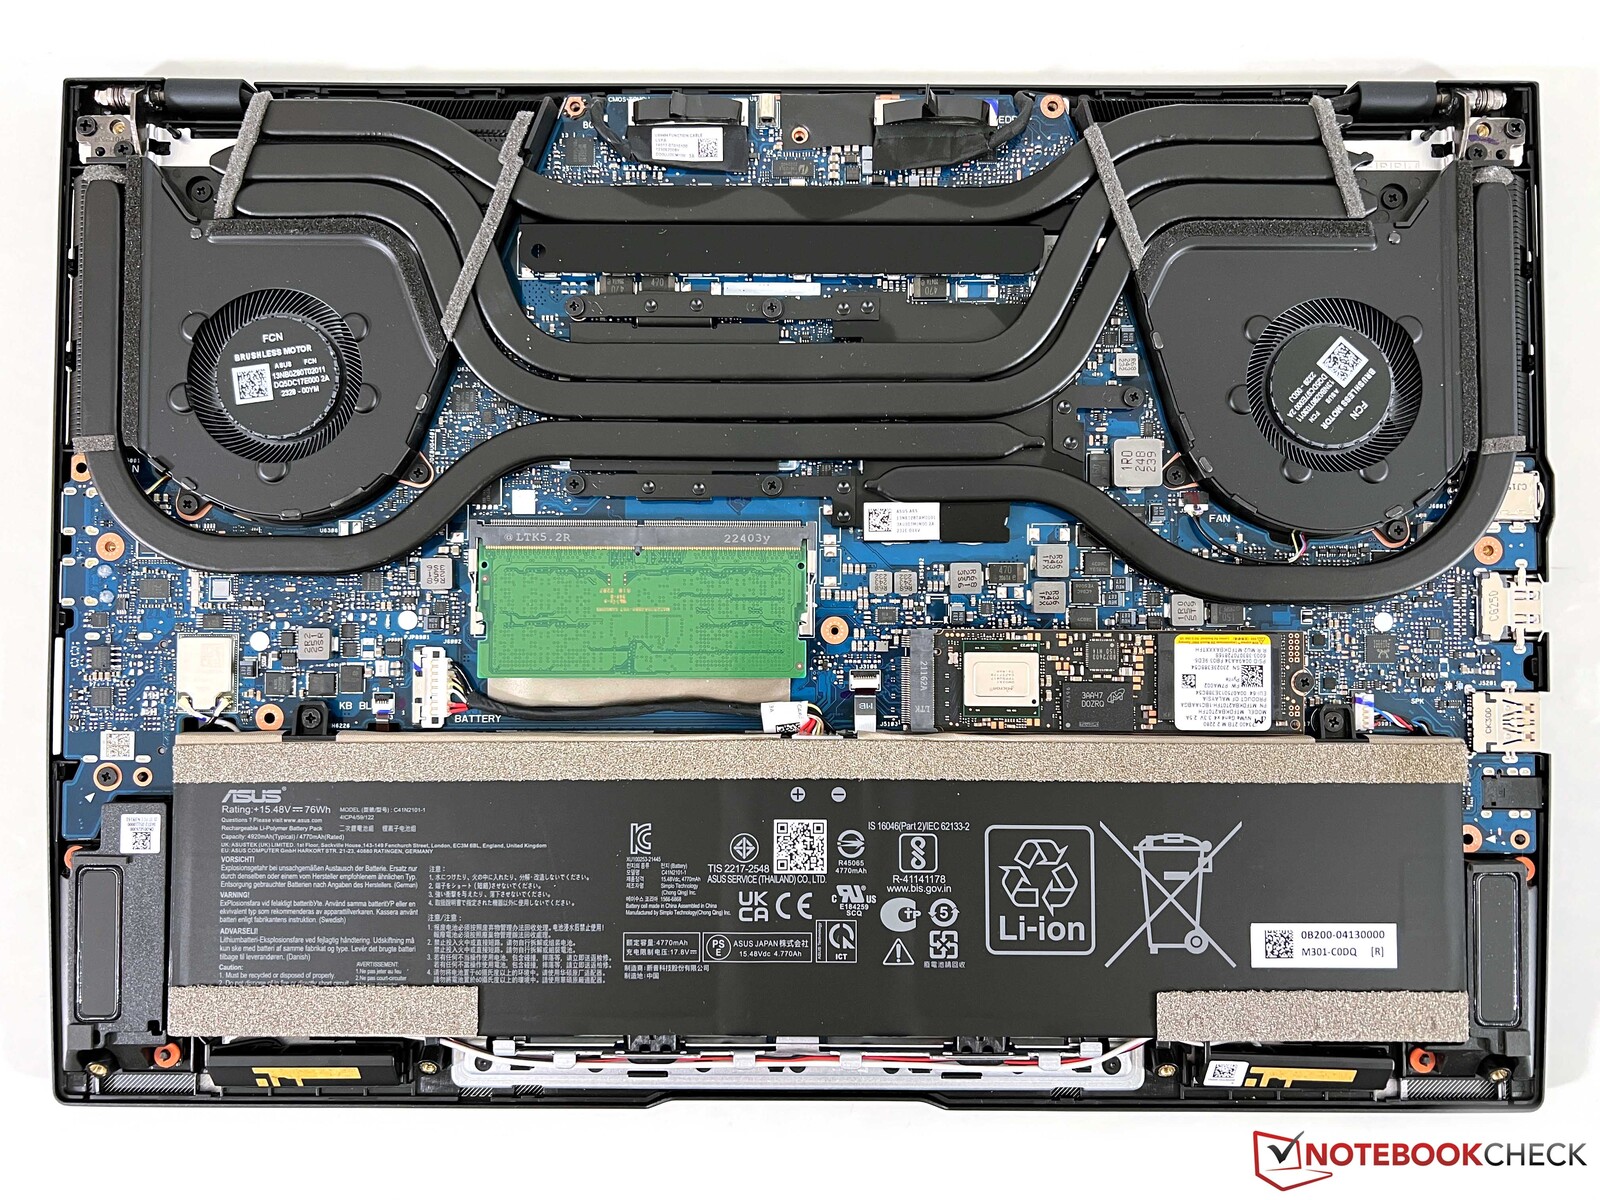
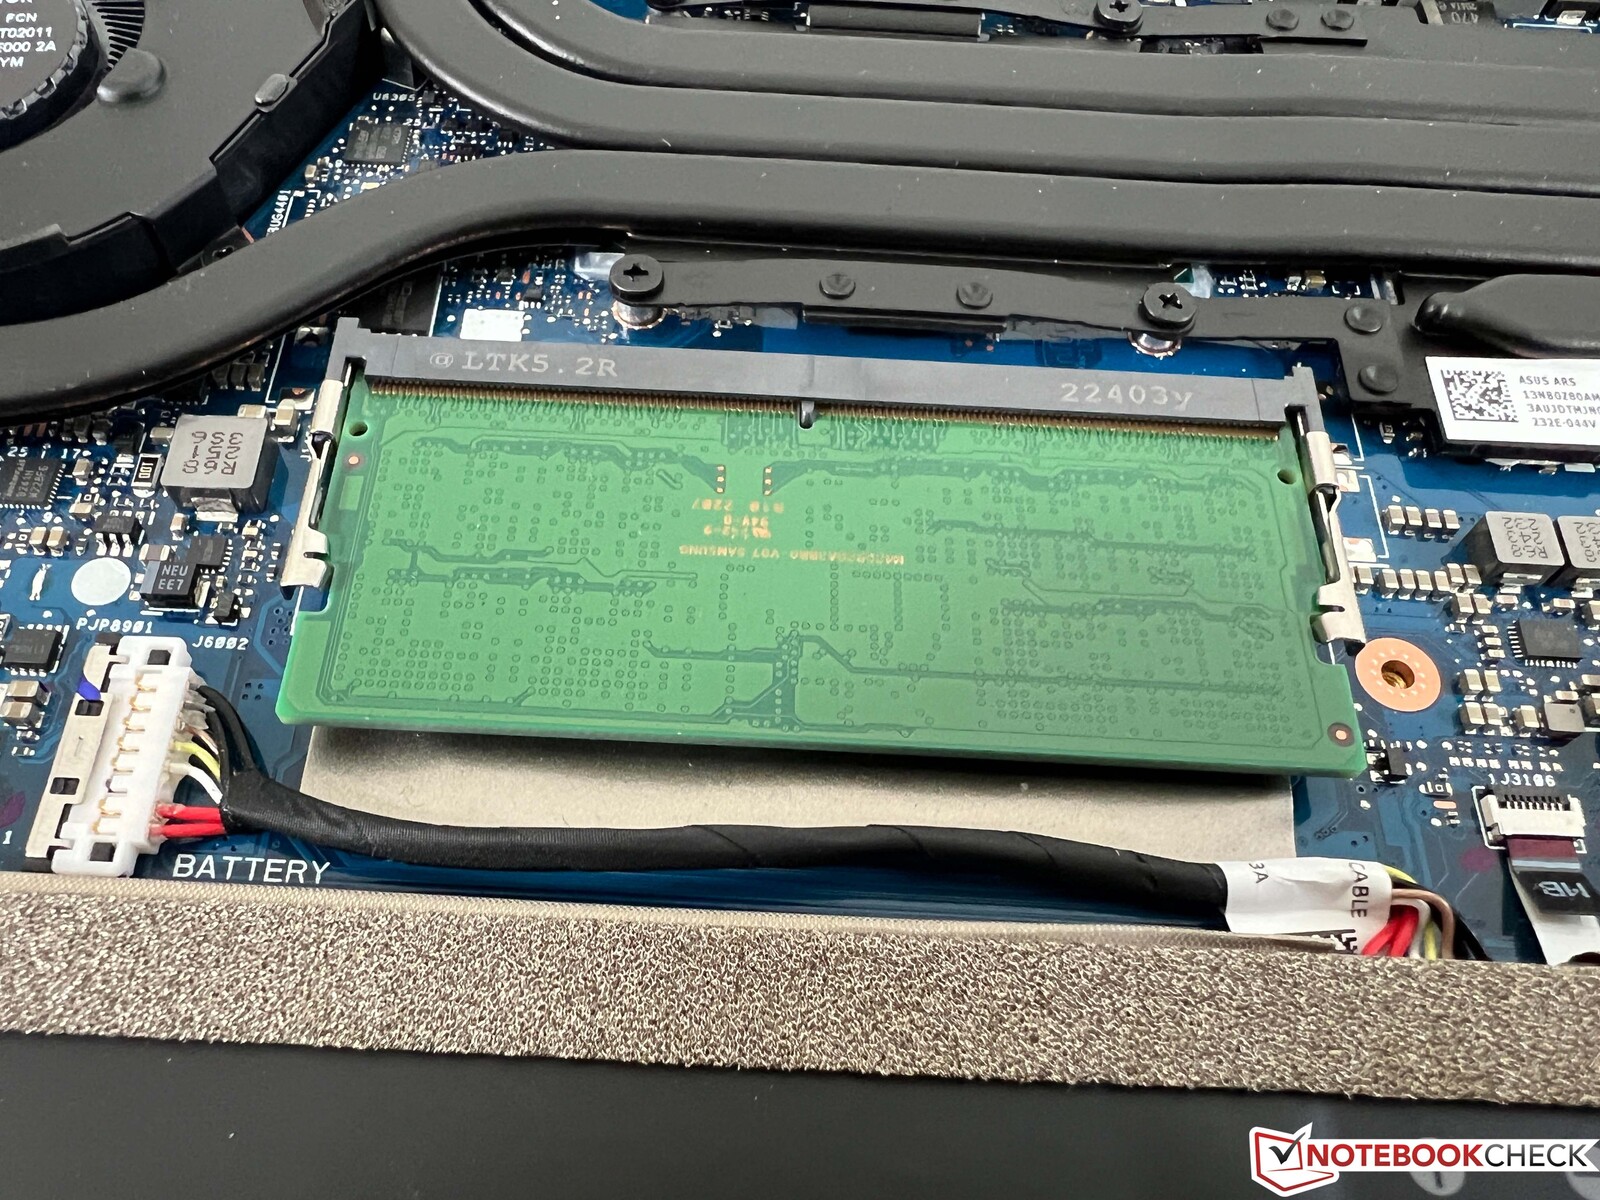
La tapa inferior de la carcasa se fija con un total de nueve tornillos Torx (T5) y se puede quitar fácilmente. Entonces tienes acceso a los dos ventiladores, la batería y la única ranura SODIMM para un módulo RAM. Sin embargo, el módulo WLAN y un módulo RAM están soldados.
Dispositivos de entrada - Touchpad con DialPad
Teclado
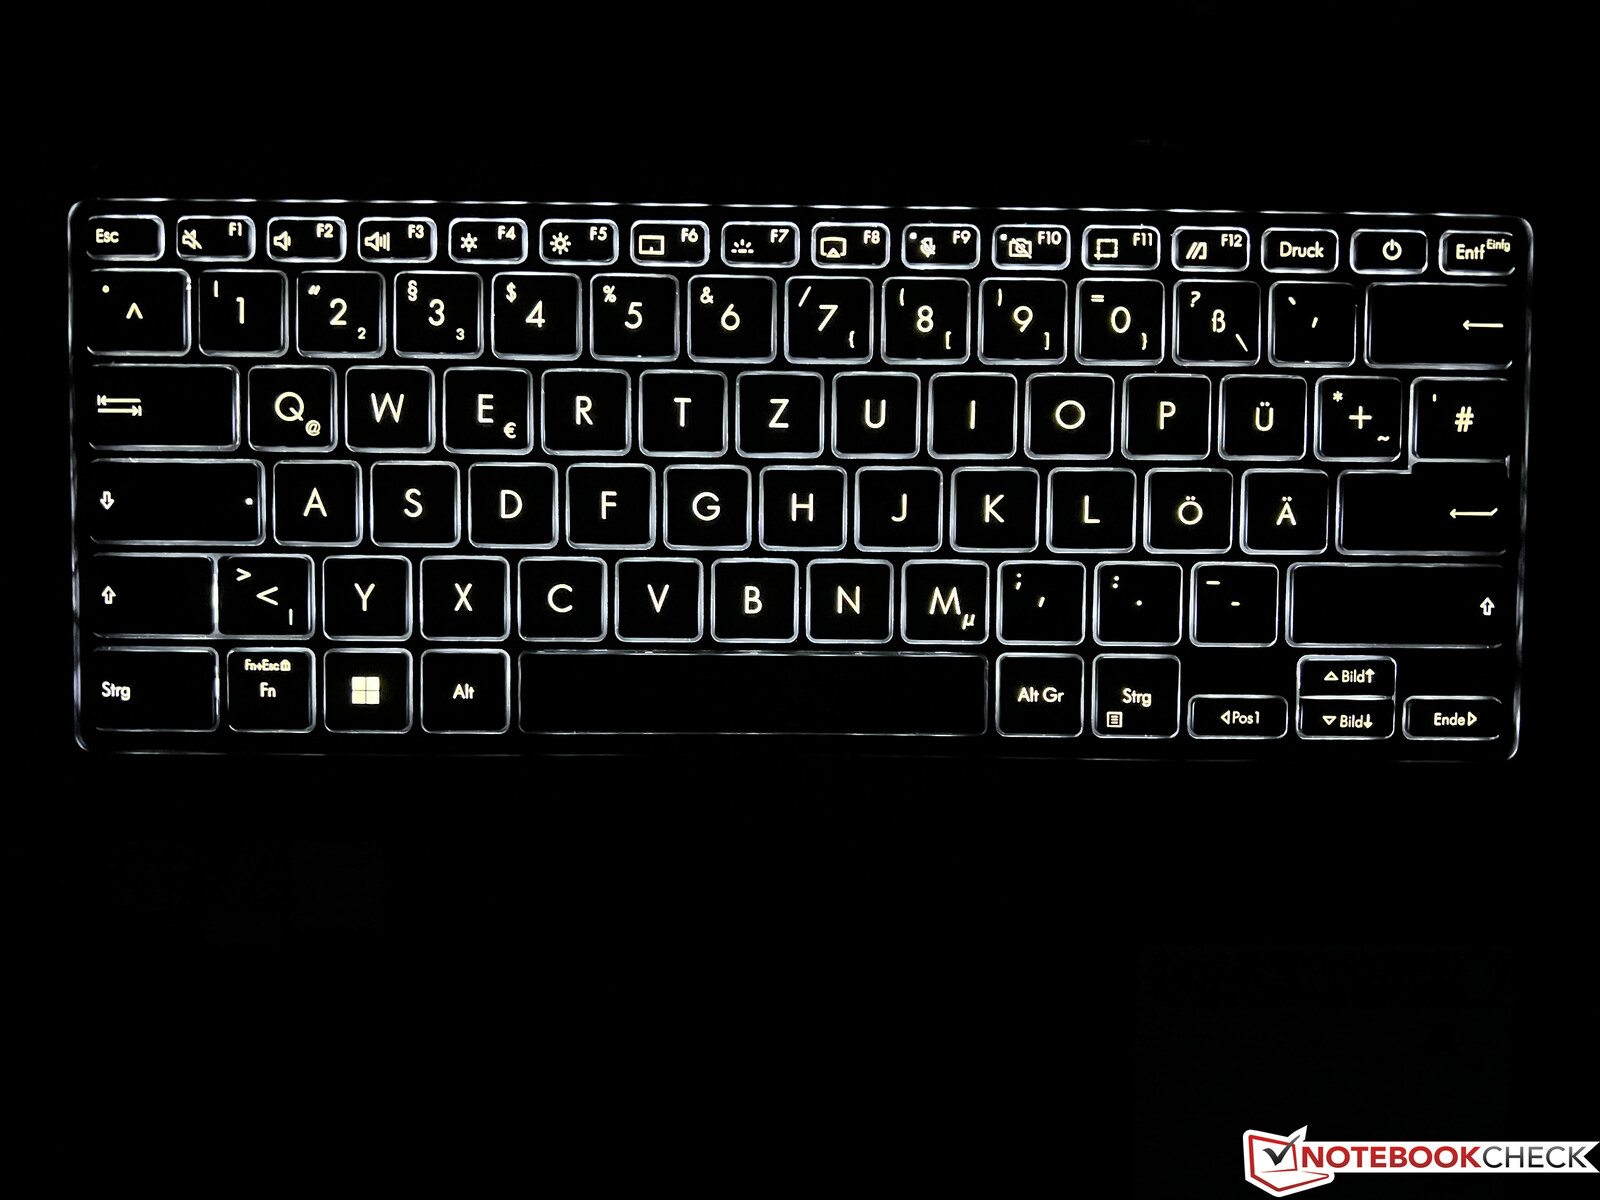
El teclado tiene un recorrido de tecla de 1,4 mm y ofrece una entrada media en general. Teniendo en cuenta el grosor de la carcasa y también el precio, se podría haber hecho más aquí, especialmente dado que las teclas tienden a traquetear un poco en general. Por ejemplo, nos gustó más el teclado del ROG Zephyrus G14 (1,7 mm de recorrido). En cuanto a la disposición, también hay que acostumbrarse a la tecla Intro de una sola fila, así como a las pequeñas teclas de flecha. Por último, hay una retroiluminación blanca de tres niveles que se puede activar mediante un sensor.
Touchpad y lápiz óptico
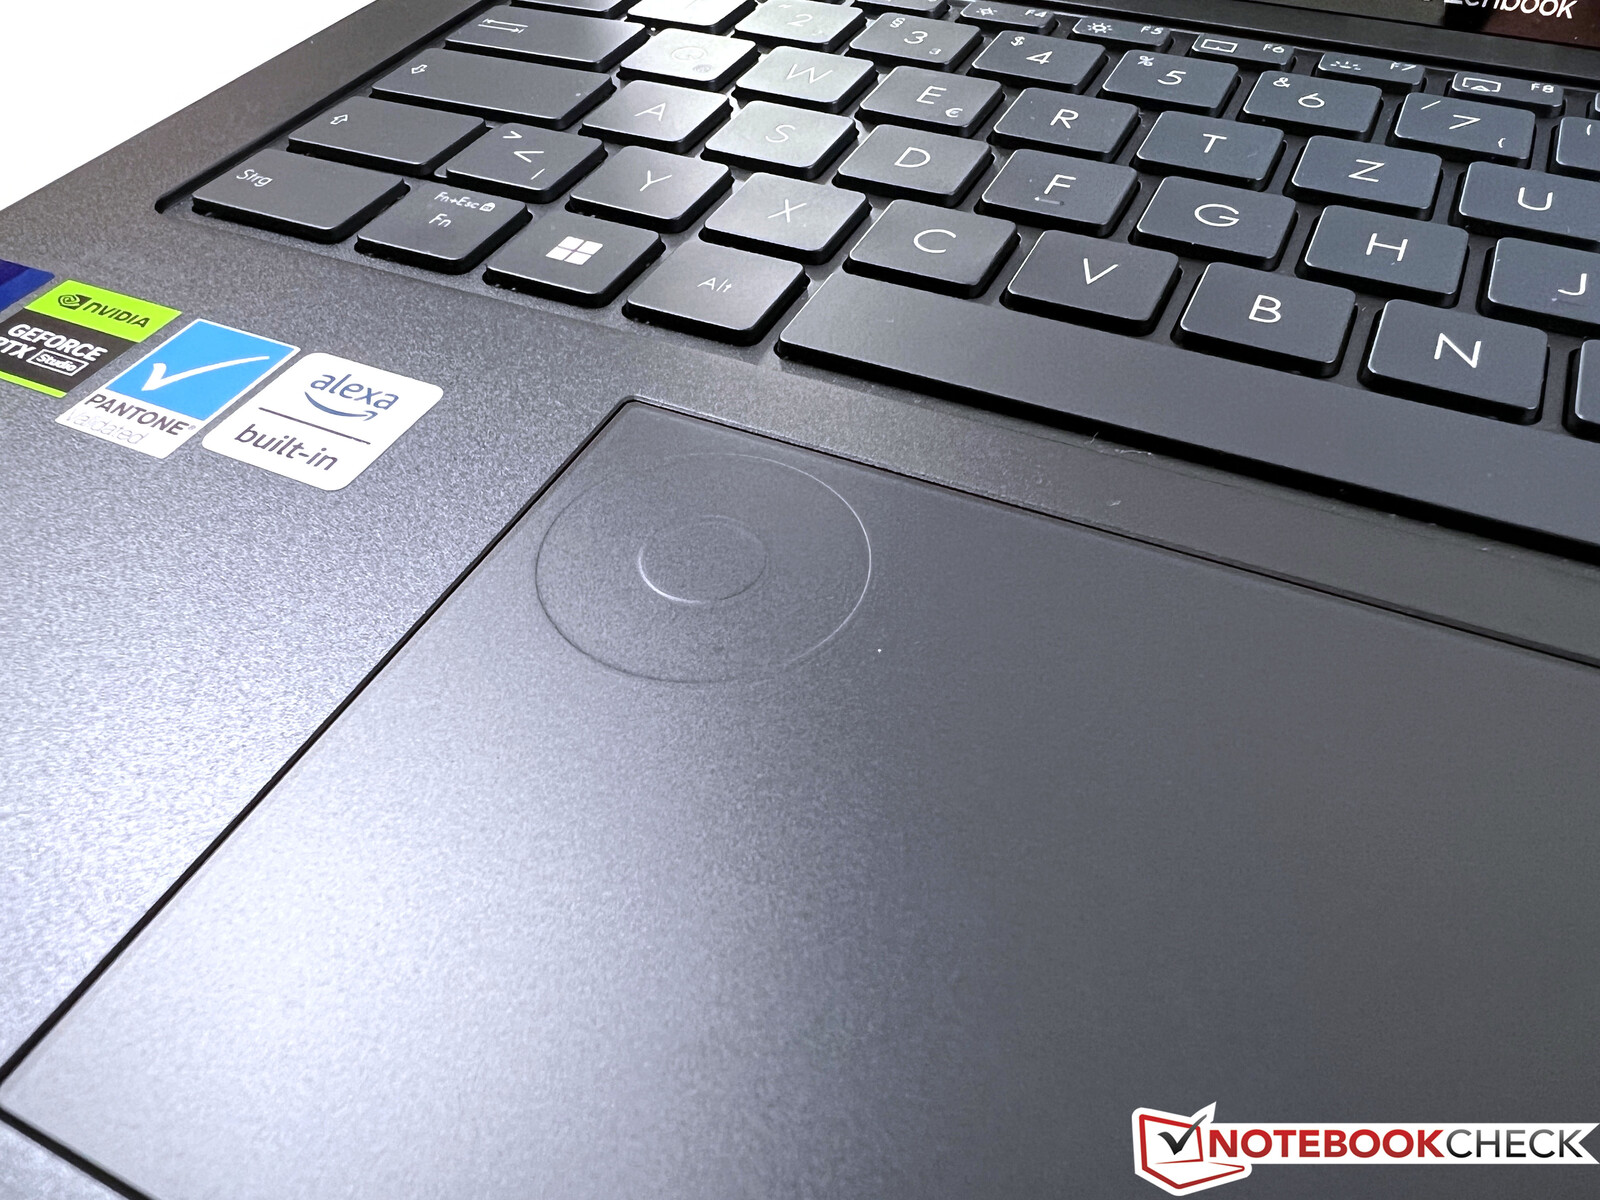
Asus ha ideado una característica especial para el touchpad, el llamado DialPad, que se instala en la esquina superior izquierda. Este anillo da al usuario opciones adicionales y la integración con las apps de Adobe funciona muy bien. En el uso diario, por ejemplo, el brillo y el volumen se pueden ajustar aquí. Todo esto funciona bien, pero las teclas especiales dedicadas y los accesos directos de las apps creativas suelen funcionar más rápido
Además, se nota el anillo elevado durante el manejo sencillo del pad, que funciona bien en general, pero hace un clic un poco fuerte. Por supuesto, la pantalla táctil capacitiva también se puede utilizar opcionalmente, y también se incluye un lápiz óptico activo, que también causó una buena impresión, especialmente al editar imágenes.
Pantalla - Pantalla táctil OLED de 120 Hz
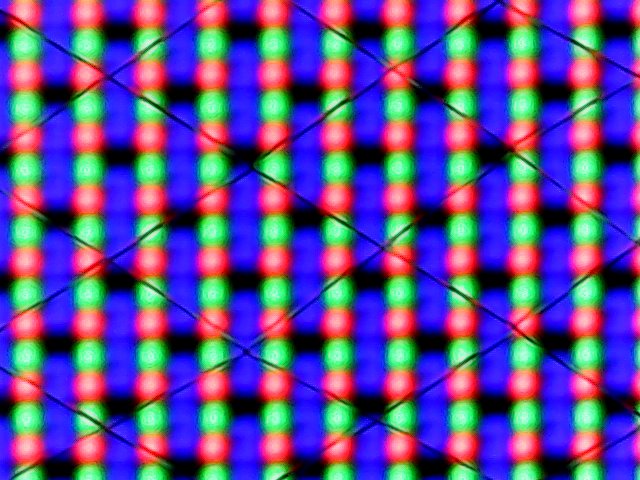
Asus equipa al Zenbook Pro 14 con una pantalla táctil OLED de alta resolución. La resolución del panel de 14.5 pulgadas (16:10) es de 2880x1800 y la impresión subjetiva de imagen fundamentalmente muy buena, pero la calidad de imagen es ligeramente granulada debido a la pantalla táctil. La actividad de la pantalla es muy fluida gracias a la alta frecuencia
En los datos técnicos, el fabricante especifica un brillo de 400 cd/m² o un máximo de 550 cd/m² para contenidos HDR. Sin embargo, el panel no llega a eso en nuestras mediciones, ya que determinamos una media de casi 360 cd/m² para contenido SDR normal (es decir, cosas cotidianas). La relación de contraste es extremadamente alta, lo que se debe al bajo nivel de negro. En términos de contenido HDR, registramos un máximo de 584 cd/m² con una pequeña sección de imagen brillante y alrededor de 460 cd/m² con una imagen casi completamente blanca.
Los ajustes HDR de Windows merecen una crítica, ya que para que el contenido HDR se muestre realmente, primero hay que activar HDR en los ajustes. Sin embargo, todos los perfiles de color se descartan por completo y los diversos perfiles de color del software MyAsus ya no están disponibles. Apple la implementación de HDR del MacBook Pro 14 en el panel mini-LED es claramente superior aquí y también se alcanzan valores de brillo muy superiores.
| |||||||||||||||||||||||||
iluminación: 99 %
Brillo con batería: 356 cd/m²
Contraste: ∞:1 (Negro: 0 cd/m²)
ΔE ColorChecker Calman: 0.8 | ∀{0.5-29.43 Ø4.71}
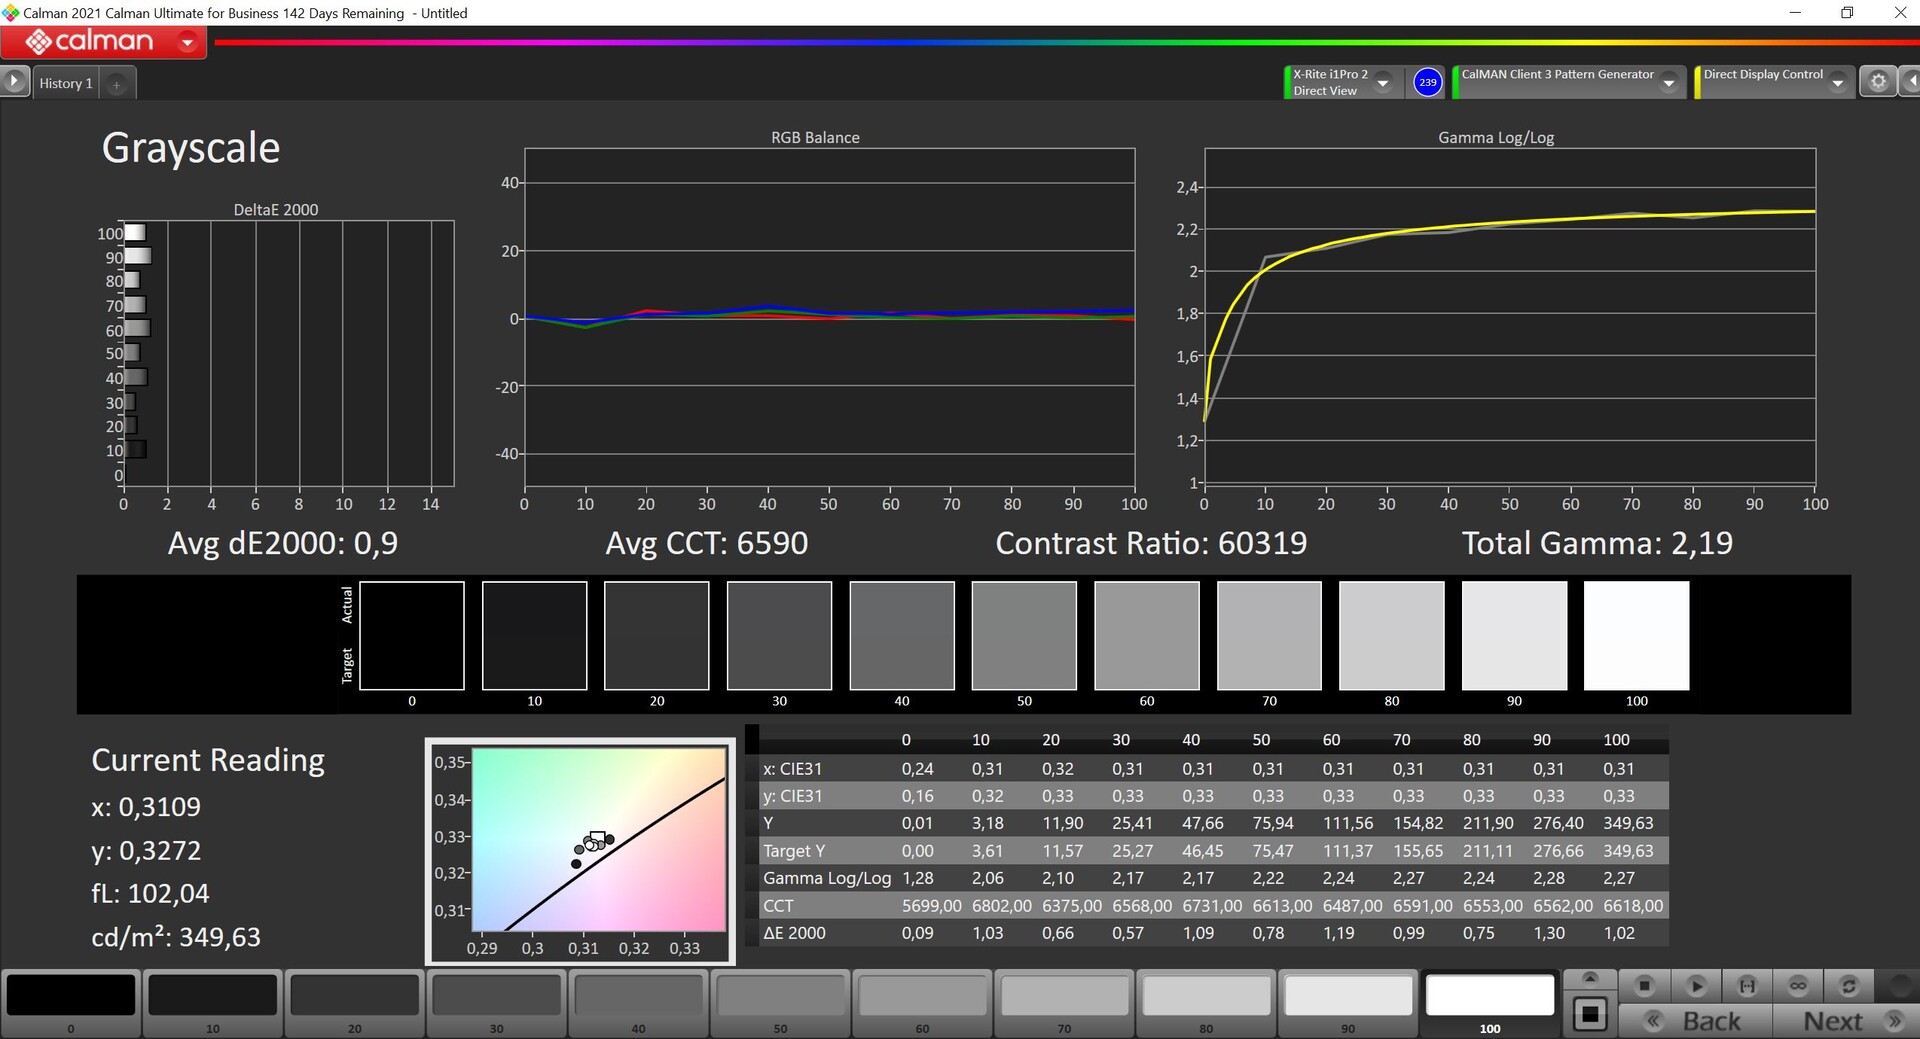
ΔE Greyscale Calman: 0.9 | ∀{0.09-98 Ø4.96}
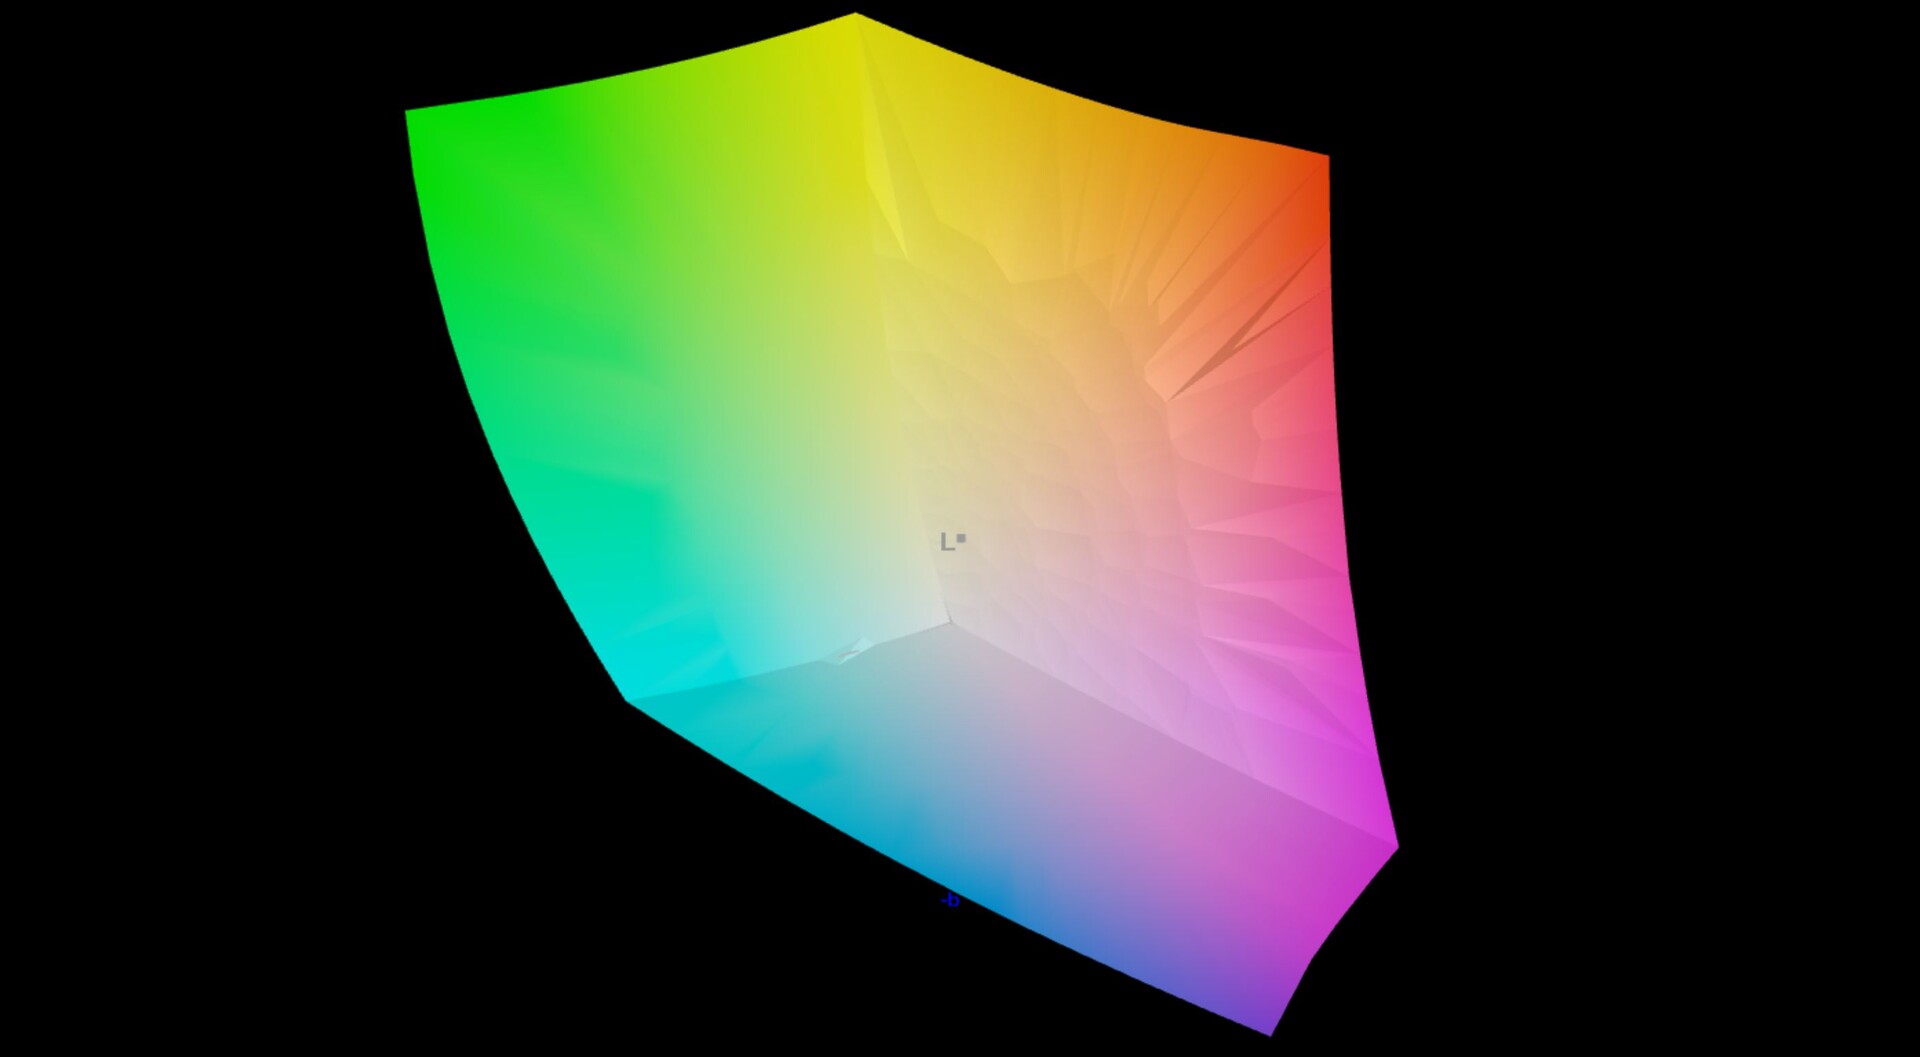
97.5% AdobeRGB 1998 (Argyll 3D)
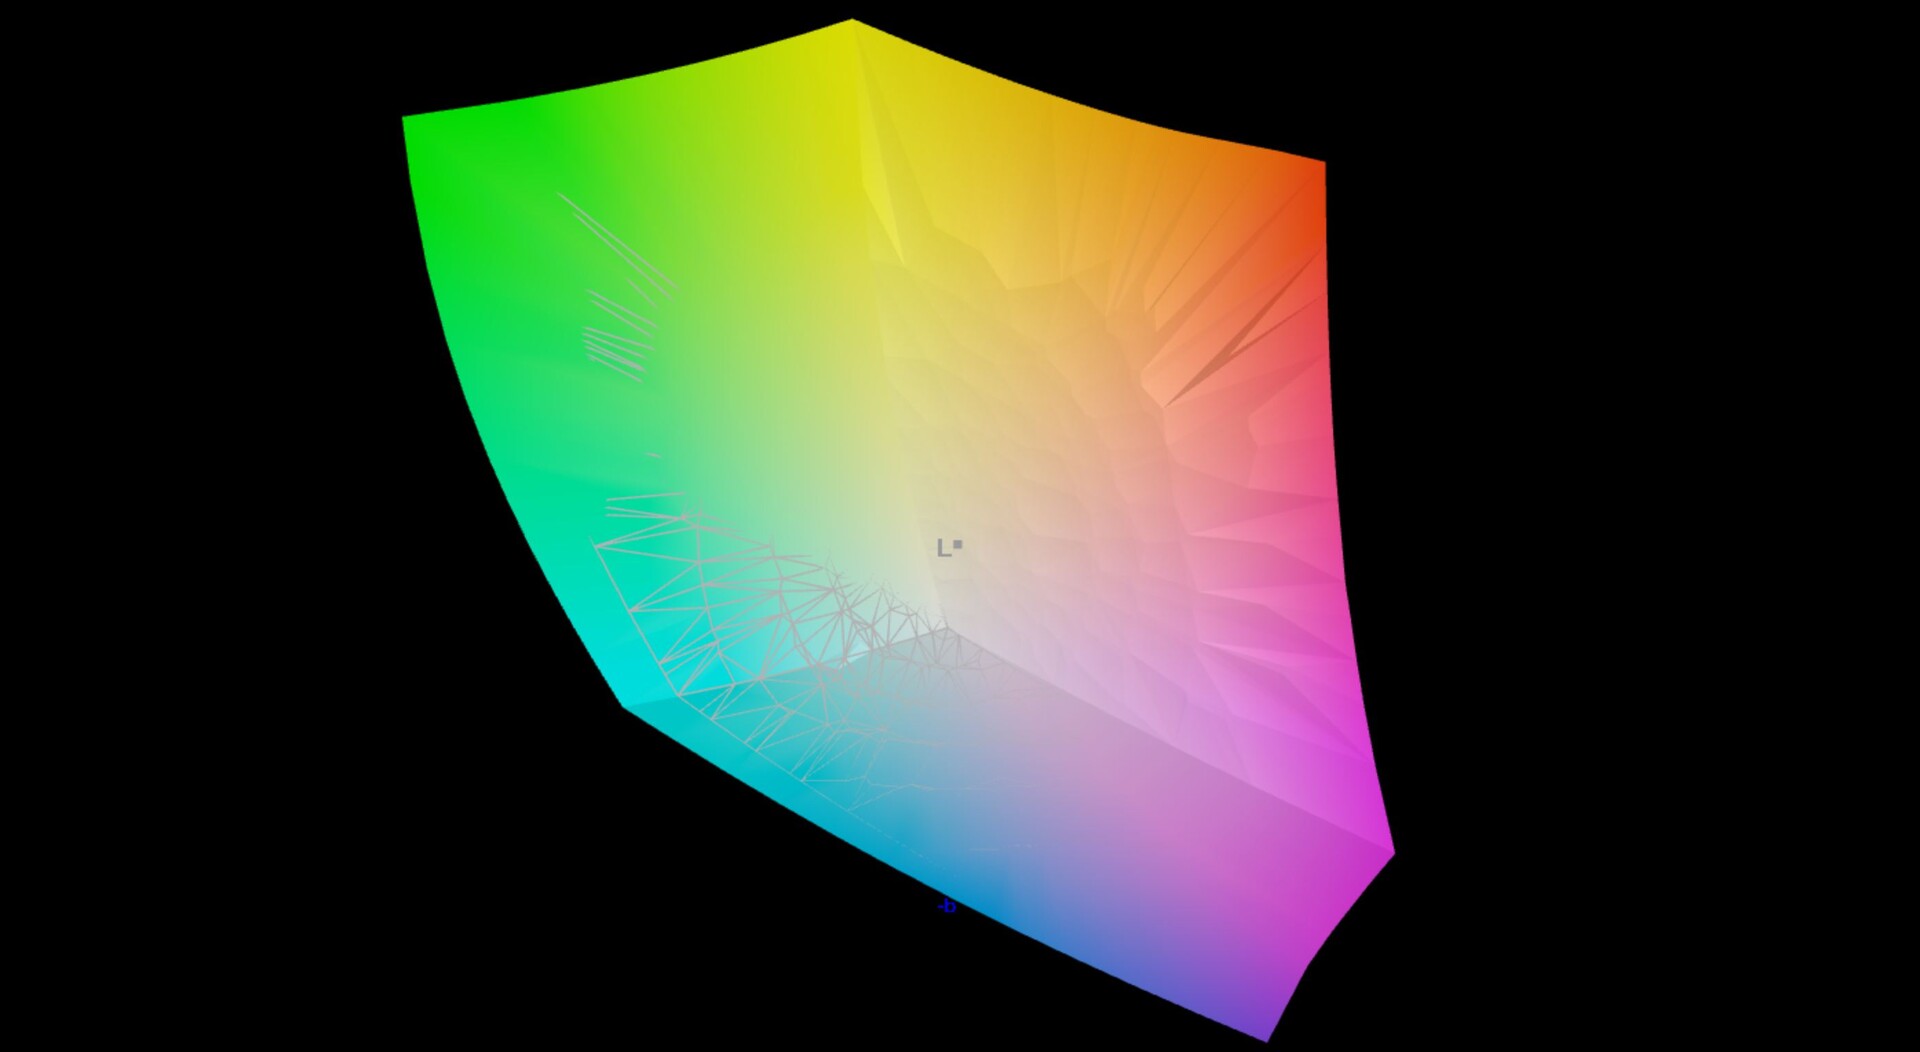
100% sRGB (Argyll 3D)
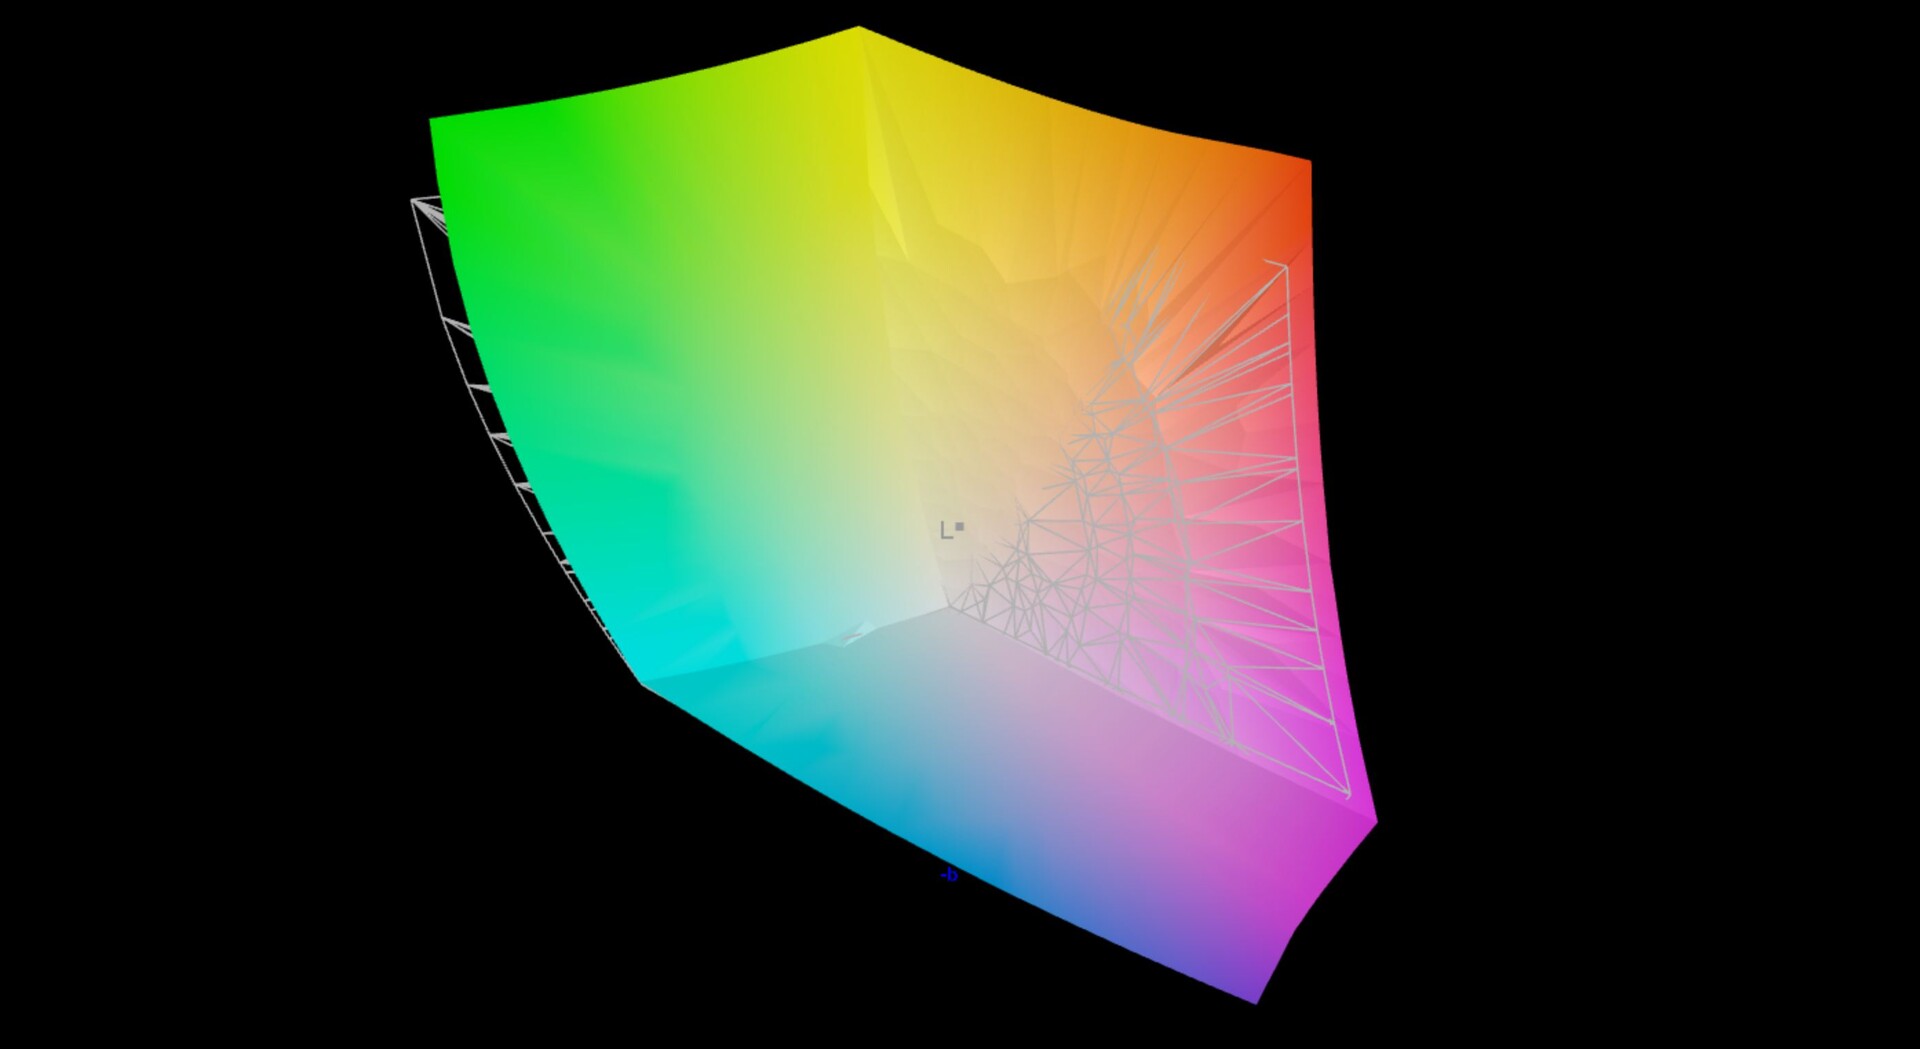
99.6% Display P3 (Argyll 3D)
Gamma: 2.19
CCT: 6590 K
| Asus Zenbook Pro 14 OLED UX6404VI SDC4190, OLED, 2880x1800, 14.5" | Asus ZenBook Pro 14 Duo UX8402VV-P1021W ATNA45AF04-0 , OLED, 2880x1800, 14.5" | Apple MacBook Pro 14 2023 M2 Pro Mini-LED, 3024x1964, 14.2" | Asus ROG Zephyrus G14 GA402XY B140QAN06.S, Mini-LED, 2560x1600, 14" | Dell XPS 15 9530 RTX 4070 Samsung 156XG01, OLED, 3456x2160, 15.6" | Razer Blade 15 OLED (Early 2022) Samsung ATNA562P02-0, OLED, 2560x1440, 15.6" | |
|---|---|---|---|---|---|---|
| Display | -1% | 0% | -1% | 0% | -2% | |
| Display P3 Coverage (%) | 99.6 | 99.91 0% | 99.2 0% | 99.6 0% | 99.8 0% | 97.6 -2% |
| sRGB Coverage (%) | 100 | 100 0% | 100 0% | 100 0% | 99.4 -1% | |
| AdobeRGB 1998 Coverage (%) | 97.5 | 95.35 -2% | 93.4 -4% | 98.4 1% | 94 -4% | |
| Response Times | -161% | -3994% | -1734% | -134% | -161% | |
| Response Time Grey 50% / Grey 80% * (ms) | 0.67 ? | 2 ? -199% | 35.2 ? -5154% | 17.2 ? -2467% | 1.68 ? -151% | 2 ? -199% |
| Response Time Black / White * (ms) | 0.9 ? | 2 ? -122% | 26.4 ? -2833% | 9.9 ? -1000% | 1.94 ? -116% | 2 ? -122% |
| PWM Frequency (Hz) | 240 | 240 | 14880 ? | 5430 | 239 | 500 ? |
| Screen | -43% | -22% | -17% | -178% | -49% | |
| Brightness middle (cd/m²) | 356 | 340 -4% | 500 40% | 535 50% | 389.5 9% | 383 8% |
| Brightness (cd/m²) | 358 | 340 -5% | 489 37% | 563 57% | 392 9% | 384 7% |
| Brightness Distribution (%) | 99 | 99 0% | 94 -5% | 91 -8% | 98 -1% | 99 0% |
| Black Level * (cd/m²) | 0.002 | 0.02 | 0.03 | |||
| Colorchecker dE 2000 * | 0.8 | 1.76 -120% | 1.2 -50% | 1 -25% | 4.95 -519% | 1.89 -136% |
| Colorchecker dE 2000 max. * | 1.6 | 3.2 -100% | 2.6 -63% | 2.8 -75% | 8.65 -441% | 3.76 -135% |
| Greyscale dE 2000 * | 0.9 | 1.16 -29% | 1.7 -89% | 1.8 -100% | 2 -122% | 1.26 -40% |
| Gamma | 2.19 100% | 2.43 91% | 2.24 98% | 2.24 98% | 2.27 97% | 2.41 91% |
| CCT | 6590 99% | 6418 101% | 6791 96% | 6337 103% | 6265 104% | 6386 102% |
| Contrast (:1) | 170000 | 25000 | 12767 | |||
| Colorchecker dE 2000 calibrated * | 1.62 | 1.53 | 2.67 | |||
| Media total (Programa/Opciones) | -68% /
-53% | -1339% /
-902% | -584% /
-325% | -104% /
-121% | -71% /
-57% |
* ... más pequeño es mejor

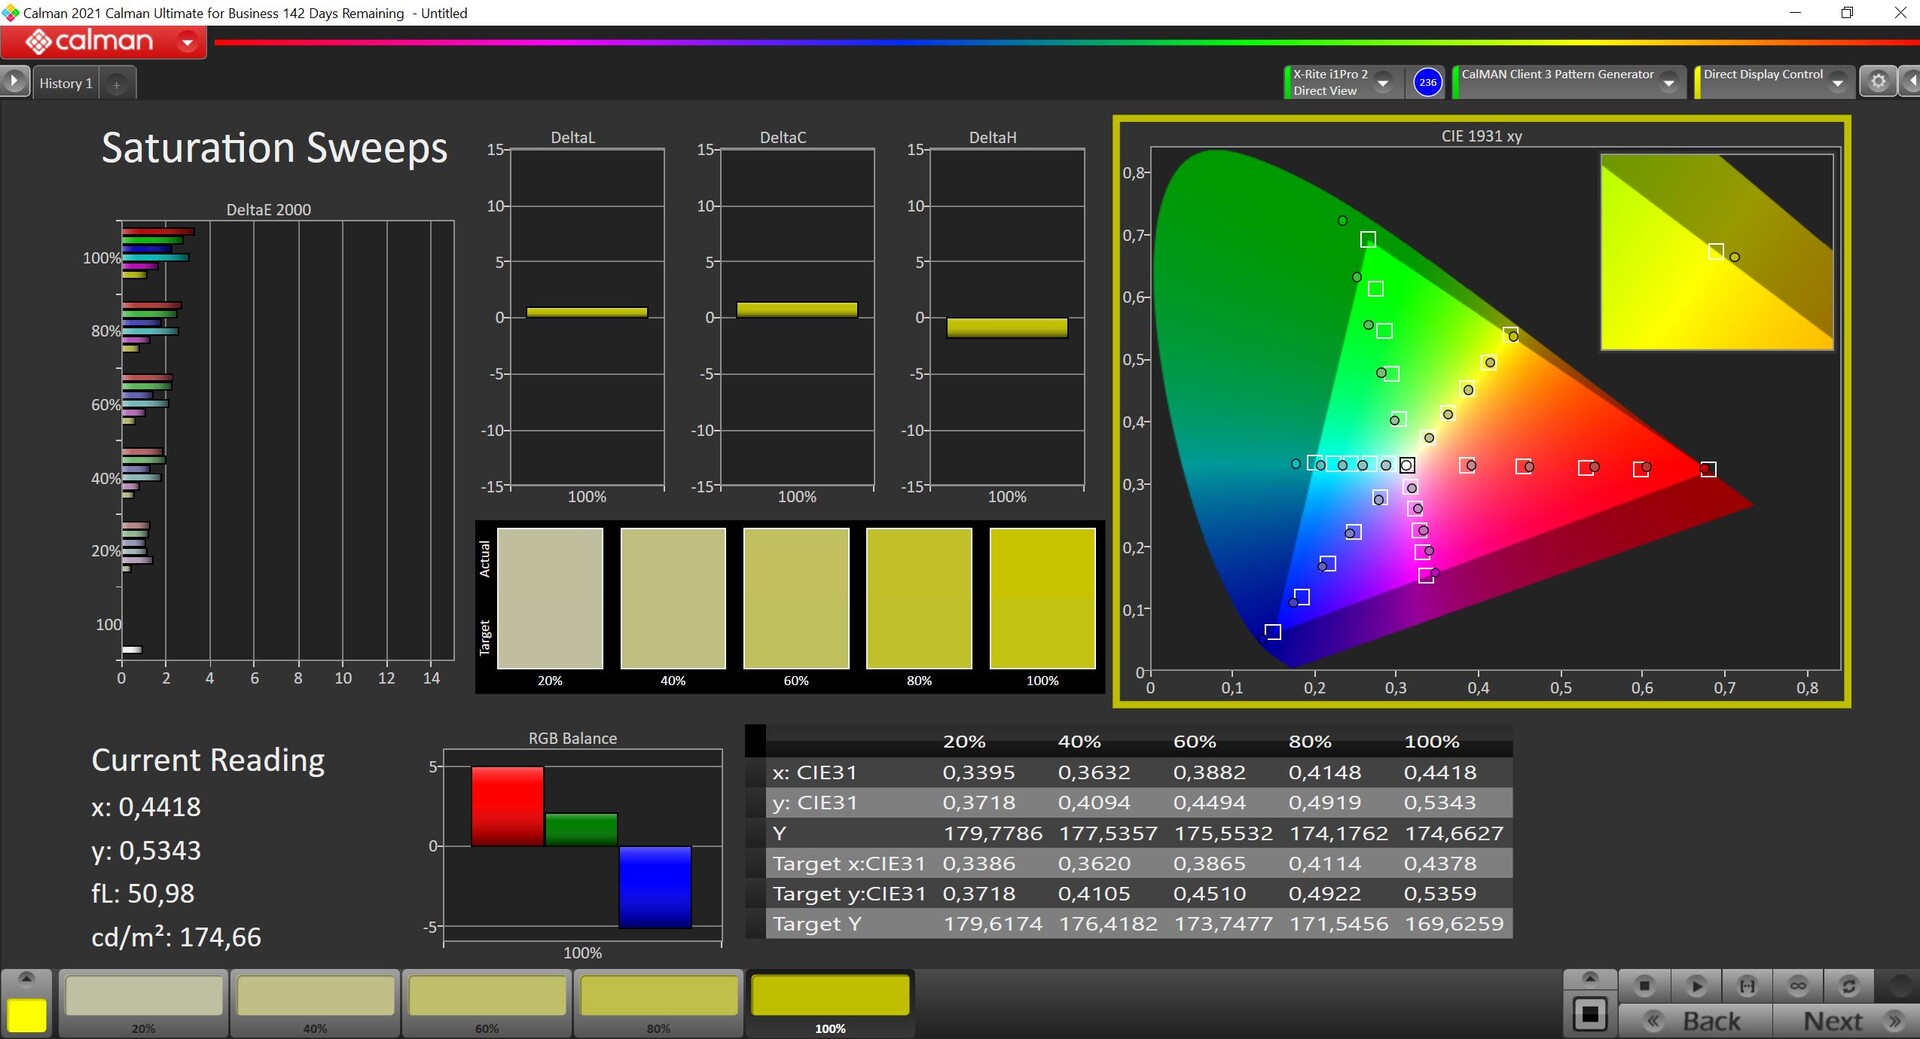
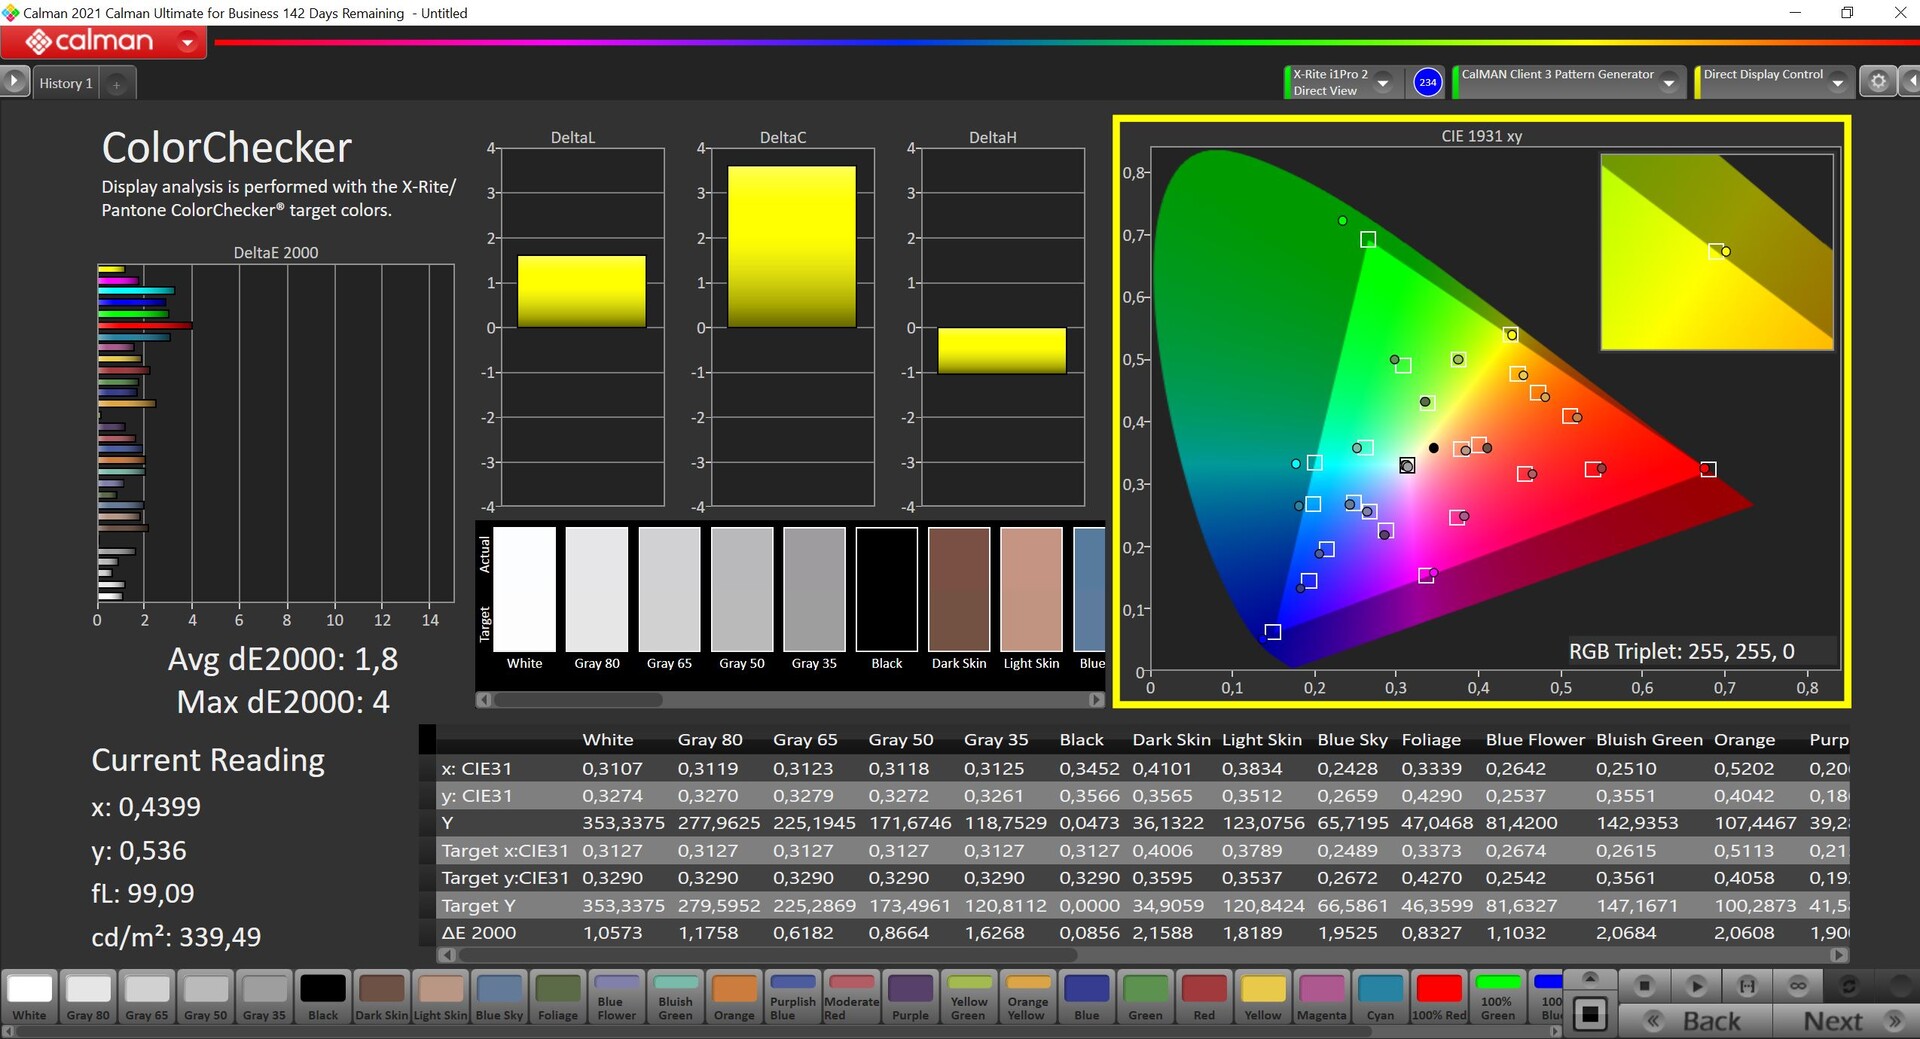
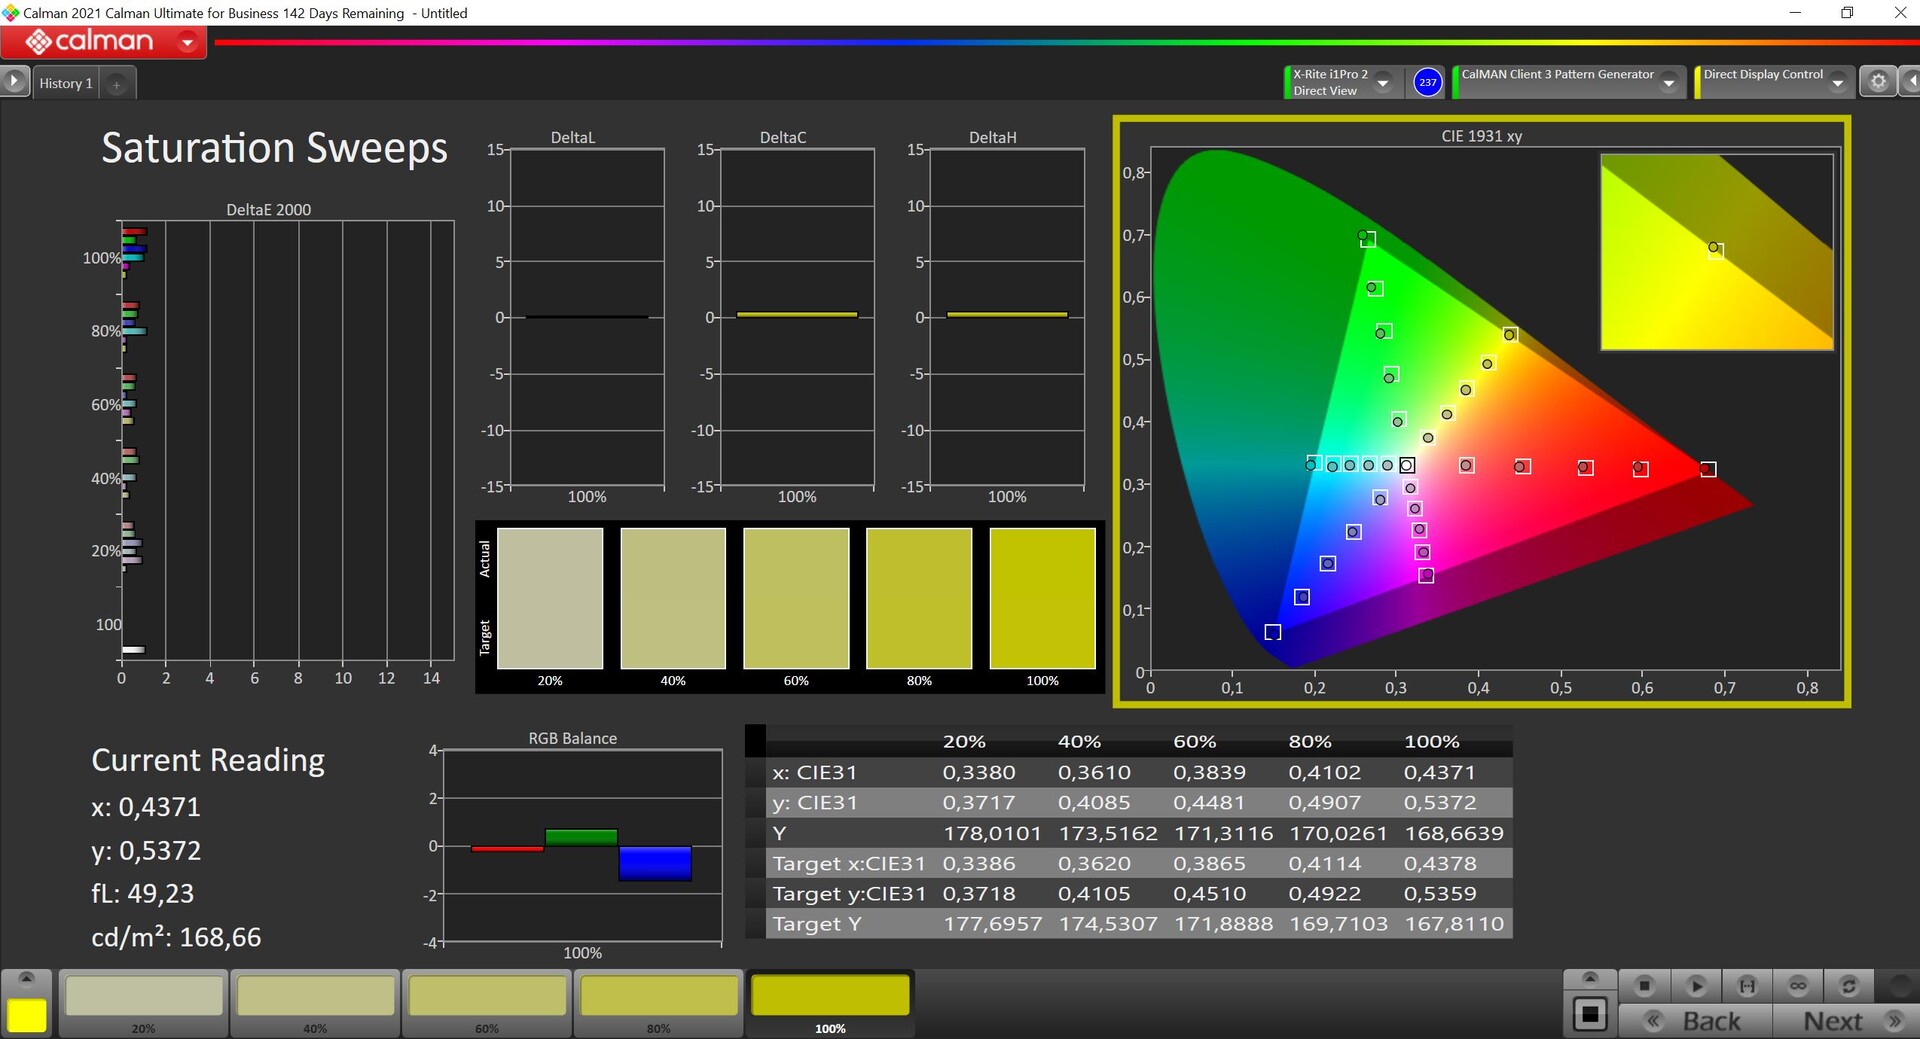
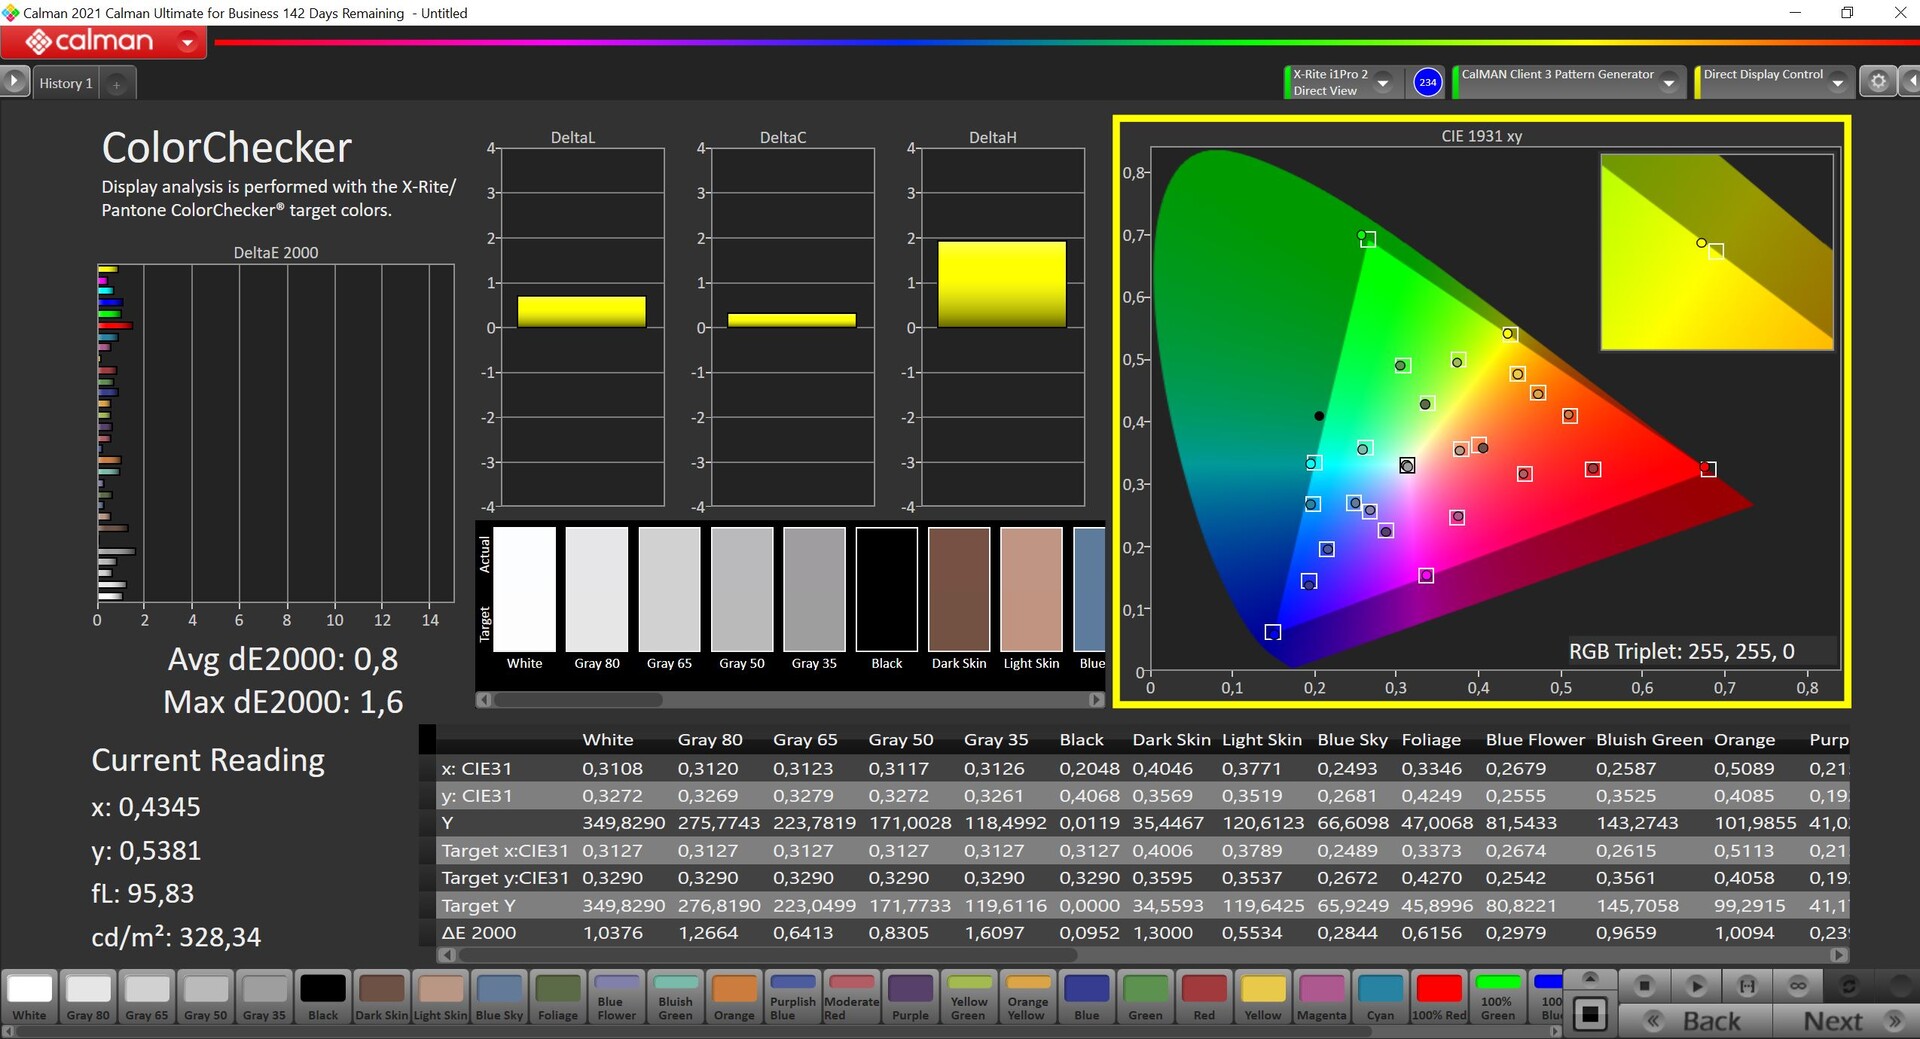
Medimos el panel OLED con el software profesional CalMAN (es decir, X-Rite i1 Pro 2) utilizando el perfil Native por defecto, así como Display P3. Los colores aparecen un poco sobresaturados en el perfil Nativo, lo que se traduce en una calidad de imagen aún más viva, pero algunos colores sobrepasan el importante límite de 3. El perfil Display P3, en cambio, proporciona colores extremadamente precisos y permite la edición directa de imagen/vídeo. No pudimos mejorar aún más la pantalla con nuestro propio calibrado, por lo que no se ofrece aquí el perfil correspondiente para descargar. También hay disponible un perfil sRGB. El espacio de color P3 está completamente cubierto.
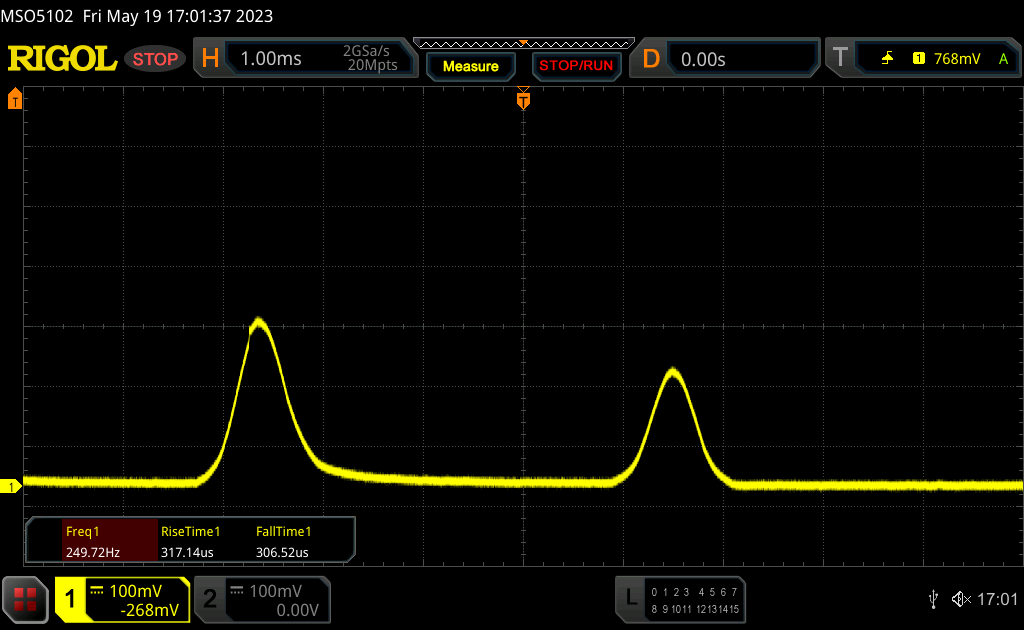
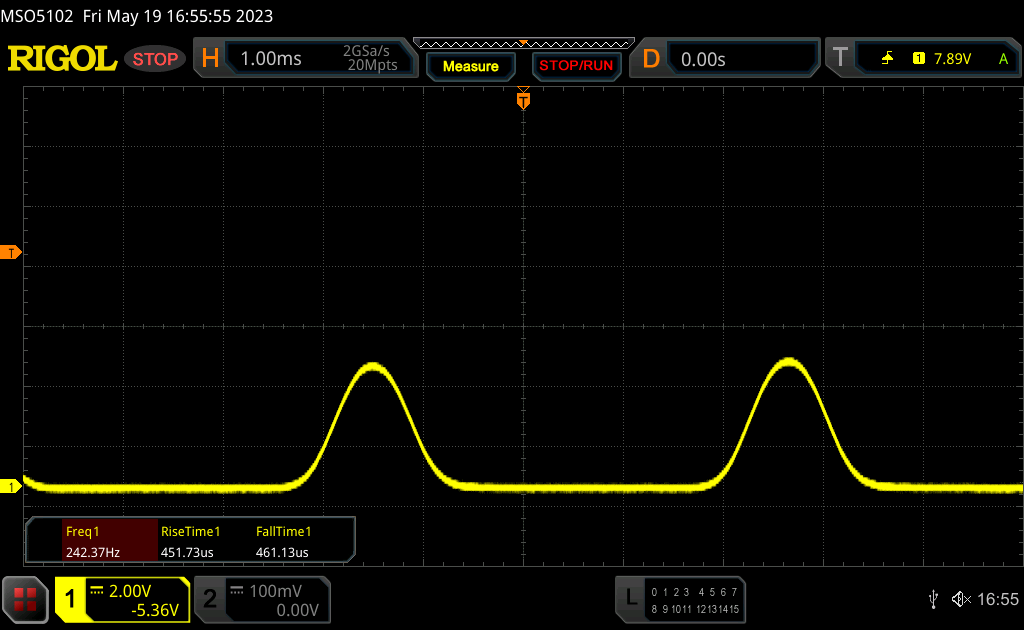
Tiempos de respuesta del display
| ↔ Tiempo de respuesta de Negro a Blanco | ||
|---|---|---|
| 0.9 ms ... subida ↗ y bajada ↘ combinada | ↗ 0.4 ms subida | 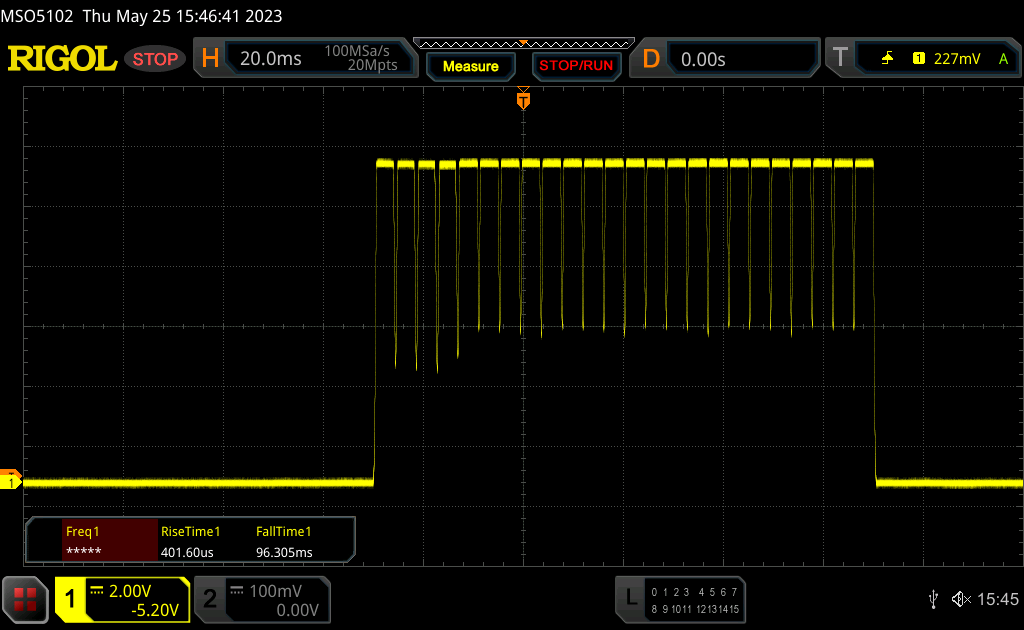 |
| ↘ 0.5 ms bajada | ||
| La pantalla mostró tiempos de respuesta muy rápidos en nuestros tests y debería ser adecuada para juegos frenéticos. En comparación, todos los dispositivos de prueba van de ##min### (mínimo) a 240 (máximo) ms. » 3 % de todos los dispositivos son mejores. Esto quiere decir que el tiempo de respuesta medido es mejor que la media (19.8 ms) de todos los dispositivos testados. | ||
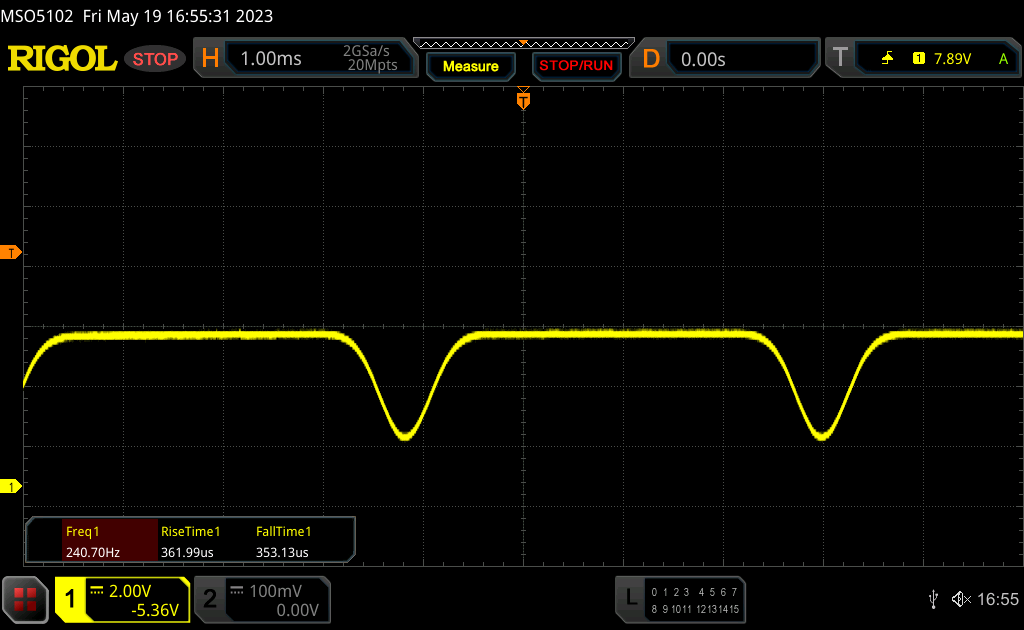
| ↔ Tiempo de respuesta 50% Gris a 80% Gris | ||
| 0.67 ms ... subida ↗ y bajada ↘ combinada | ↗ 0.33 ms subida | 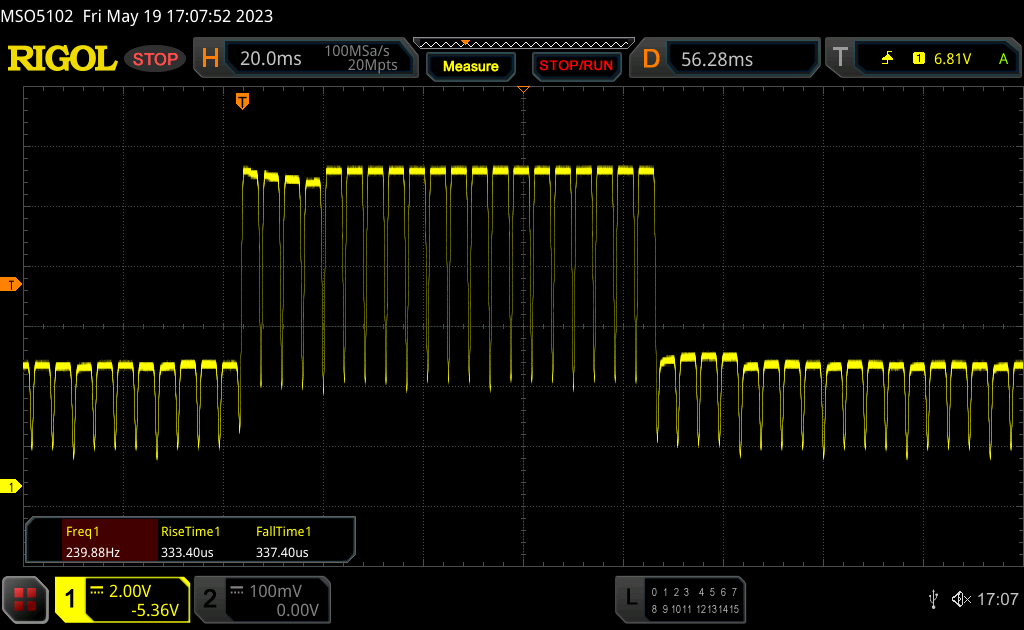 |
| ↘ 0.34 ms bajada | ||
| La pantalla mostró tiempos de respuesta muy rápidos en nuestros tests y debería ser adecuada para juegos frenéticos. En comparación, todos los dispositivos de prueba van de ##min### (mínimo) a 636 (máximo) ms. » 2 % de todos los dispositivos son mejores. Esto quiere decir que el tiempo de respuesta medido es mejor que la media (31 ms) de todos los dispositivos testados. | ||
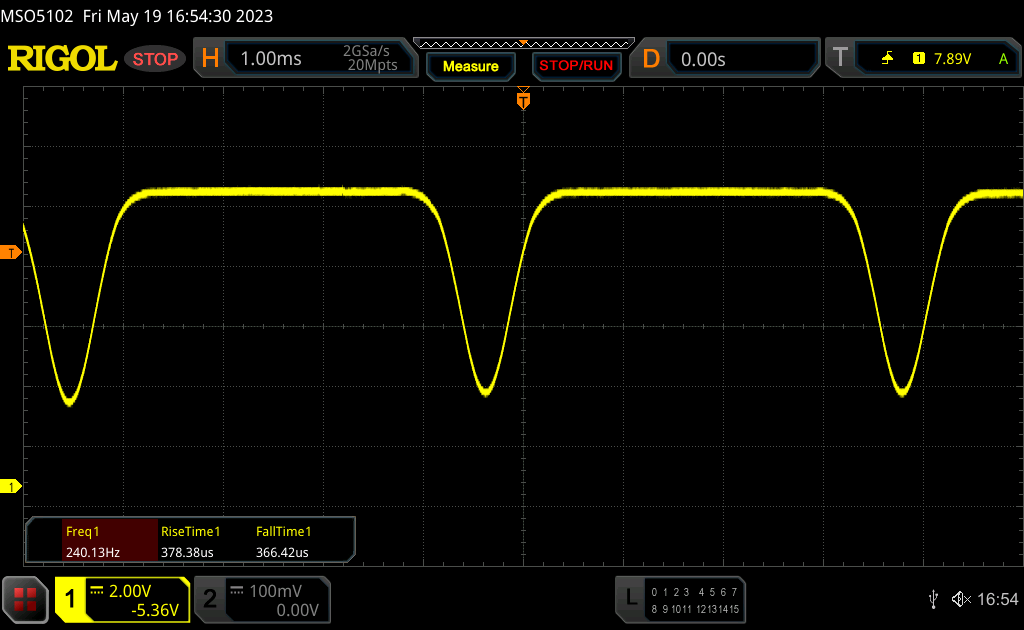
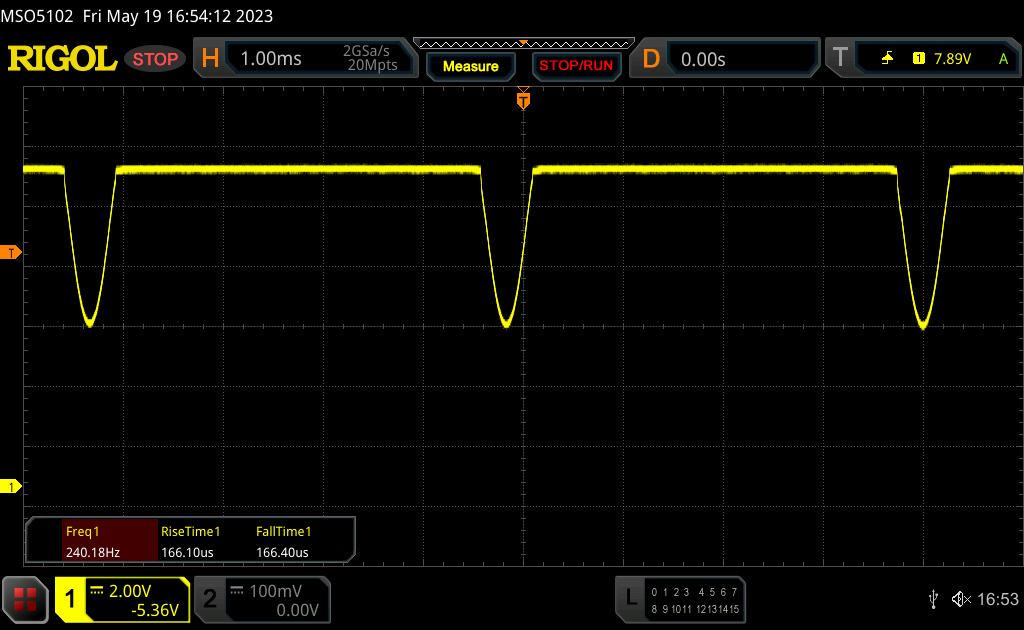
Parpadeo de Pantalla / PWM (Pulse-Width Modulation)
| Parpadeo de Pantalla / PWM detectado | 240 Hz | 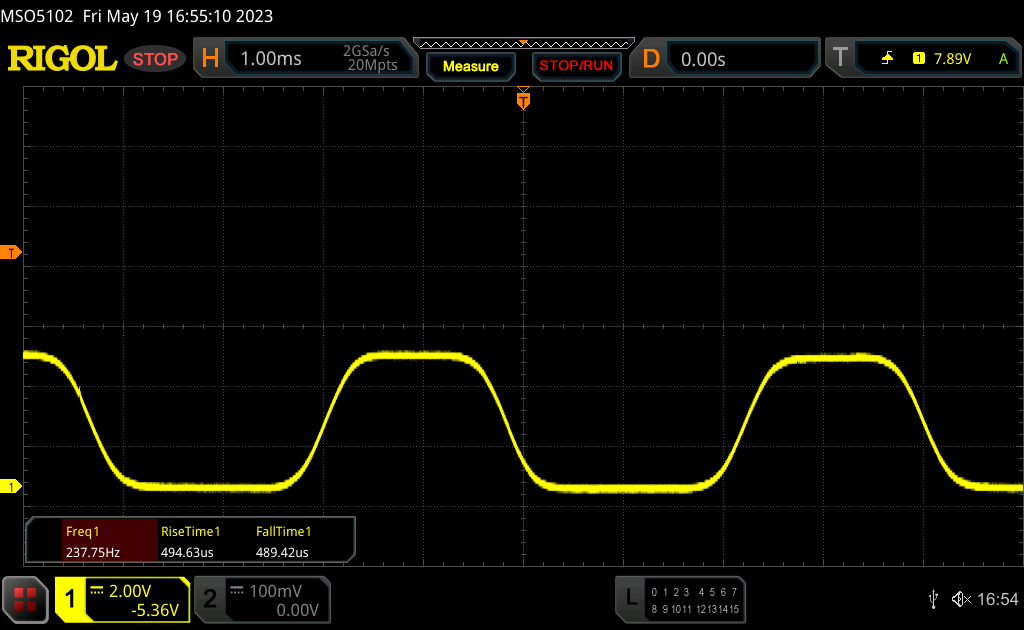 | |
La retroiluminación del display parpadea a 240 Hz (seguramente usa PWM - Pulse-Width Modulation) . La frecuencia de 240 Hz es relativamente baja, por lo que la gente sensible debería ver parpadeos y padecer fatiga visual por la pantalla (usado al brillo indicado a continuación). Comparación: 52 % de todos los dispositivos testados no usaron PWM para atenuar el display. Si se usó, medimos una media de 7754 (mínimo: 5 - máxmo: 343500) Hz. | |||
Los tiempos de respuesta del panel OLED son muy rápidos, pero detectamos parpadeos PWM en todos los niveles de brillo. La atenuación DC se usa hasta un nivel de brillo del 50%, y el PWM clásico con una frecuencia de 240 Hz se usa por debajo. La propia Asus aconseja no bajar de este brillo y usar en su lugar la función de atenuación OLED sin parpadeos del software MyAsus. Hablamos de esto en detalle en el análisis delZenbook S 13 OLEDy la funcionalidad es idéntica aquí.
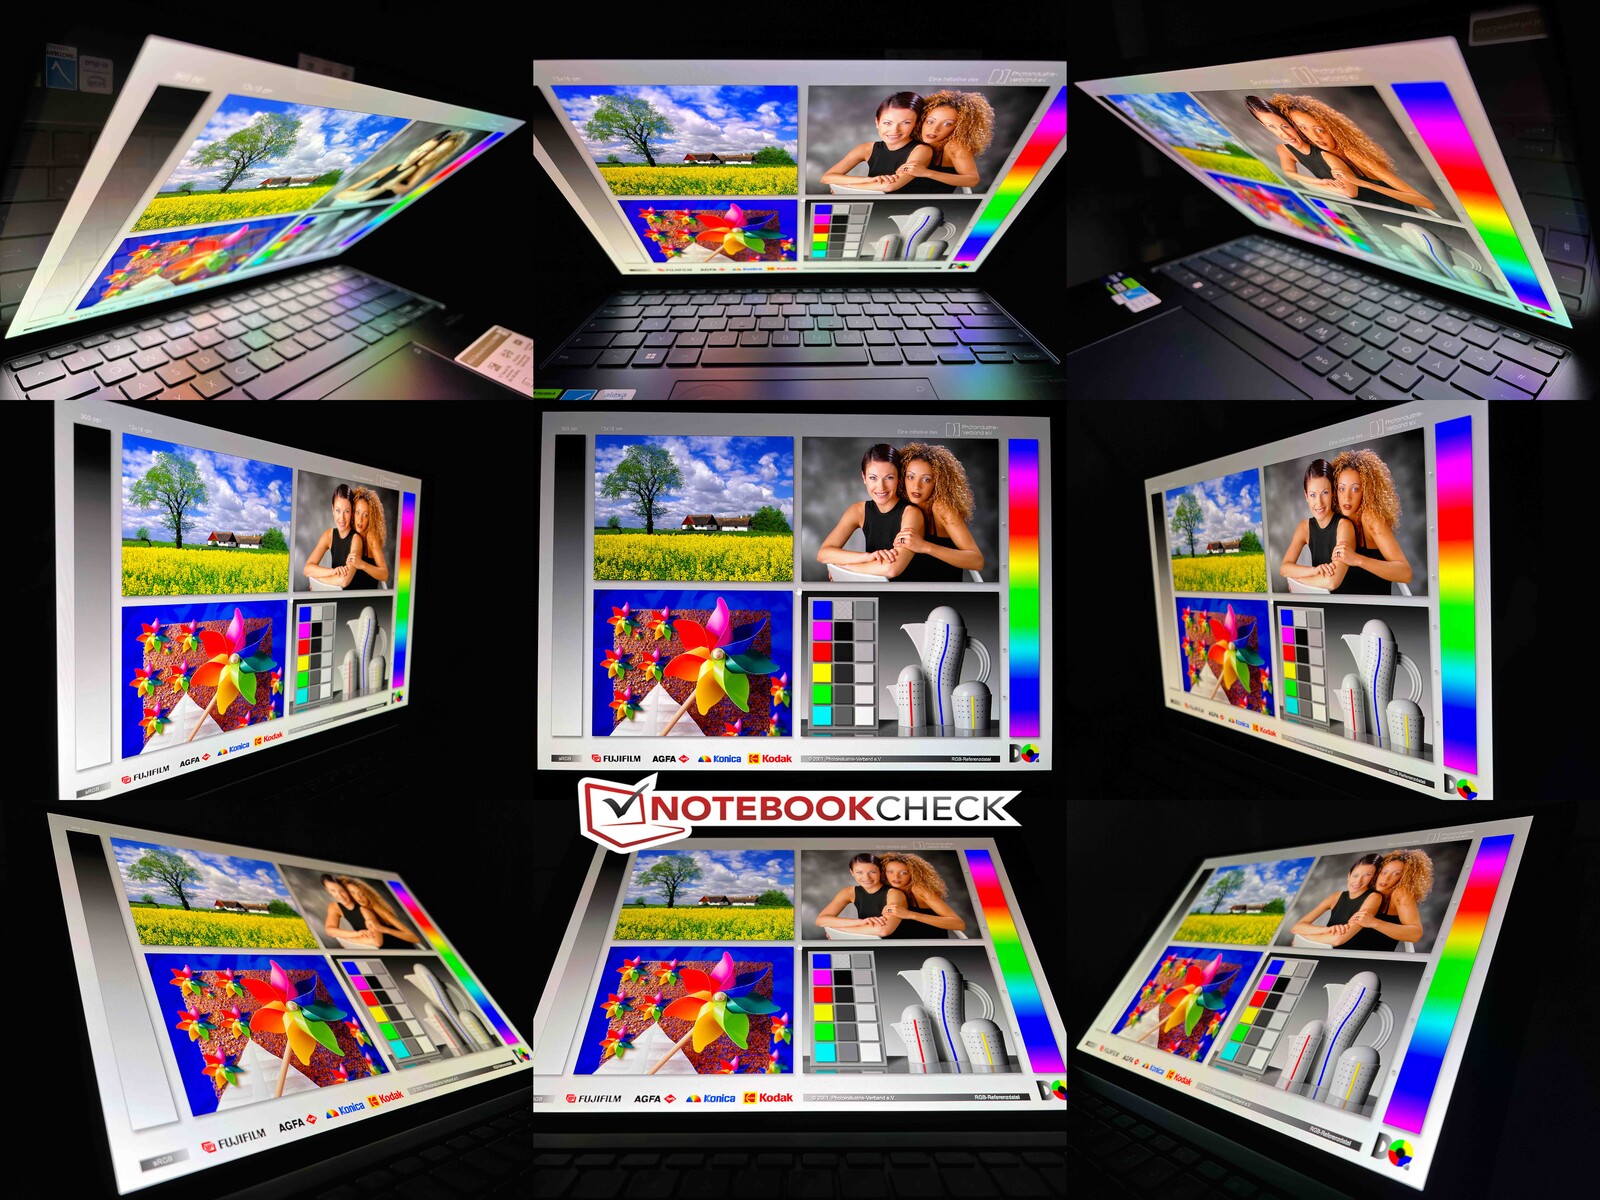
En exteriores, la pantalla táctil altamente reflectante es problemática porque siempre hay que lidiar con los reflejos, incluso en días nublados. La estabilidad del ángulo de visión es muy buena en general. Sólo desde ciertos ángulos (amplios) se nota un tinte azul, típico de los paneles OLED.
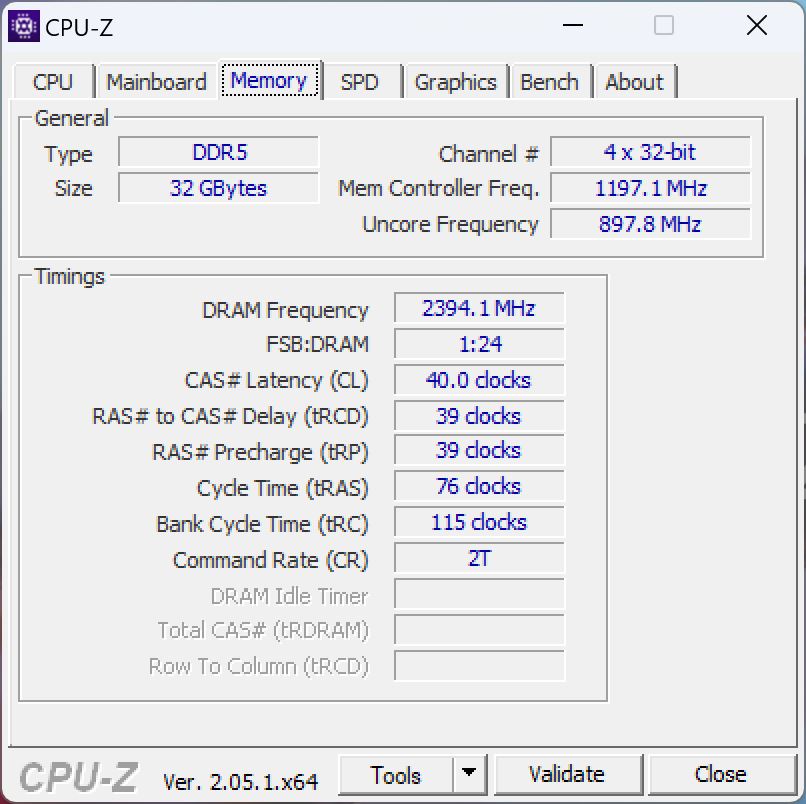
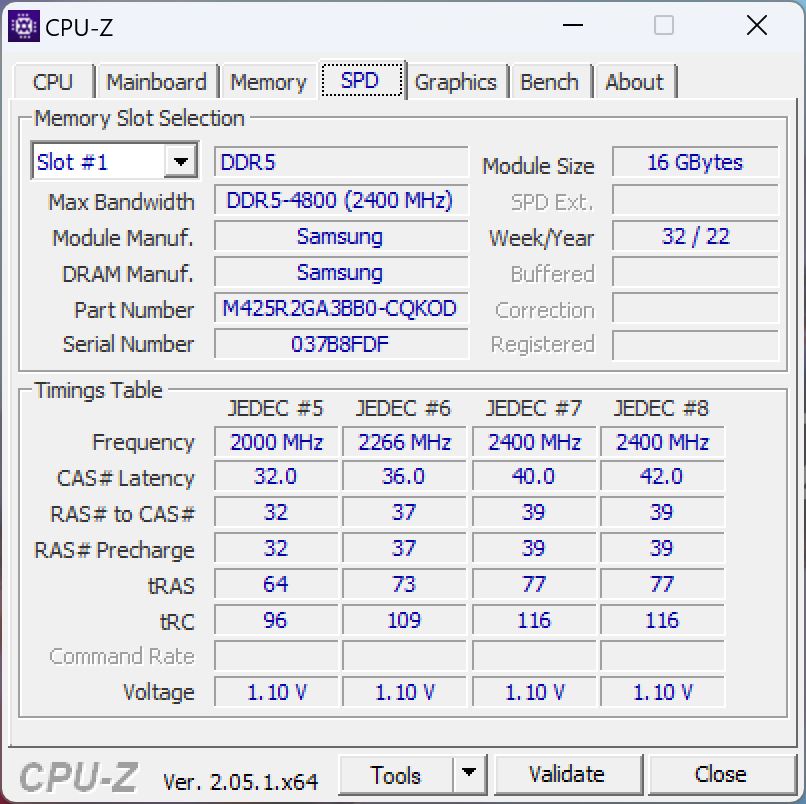
Rendimiento - Core i9 y GPU RTX 4070 para portátiles
El Zenbook Pro 14 sólo está disponible con el Intel Core i9-13900H y 16 GB de RAM soldada. Hay disponible una ranura SODIMM equipada con 16 o 32 GB de RAM, dependiendo del modelo. En cuanto a la tarjeta gráfica, se puede elegir entre laGeForce RTX 4060 portátil y la RTX 4070, de las cuales esta última está instalada en nuestro dispositivo de prueba.
Condiciones de ensayo
Hay tres modos de rendimiento diferentes en el software MyAsus: Susurro, Estándar y Rendimiento. La siguiente tabla muestra los valores TDP/TGP de los modos. Usamos el modo Rendimiento para las siguientes pruebas y mediciones, ya que el rendimiento gráfico de la GPU GeForce en particular es significativamente inferior. En el día a día, sin embargo, puedes usar fácilmente uno de los otros dos modos sin problemas. El Zenbook también tiene un interruptor MUX que puede usarse para desactivar completamente la GPU integrada. Sin embargo, el cambio requiere reiniciar el sistema.
| Modo | CPU | GPU | Prueba de estrés | CB R23 Multi | Time Spy Gráficos |
|---|---|---|---|---|---|
| Whisper | 45 vatios | 35 vatios | CPU: 25 vatios GPU: 35 vatios |
13.453 puntos | 7.252 puntos |
| Estándar | 120 -> 80 vatios | 45 vatios | CPU: 25 vatios GPU: 35 vatios |
18.576 puntos | 8.218 puntos |
| Rendimiento | 120 -> 90 vatios | 90 vatios | CPU: 30 vatios GPU: 75 vatios |
19.014 puntos | 11.398 puntos |
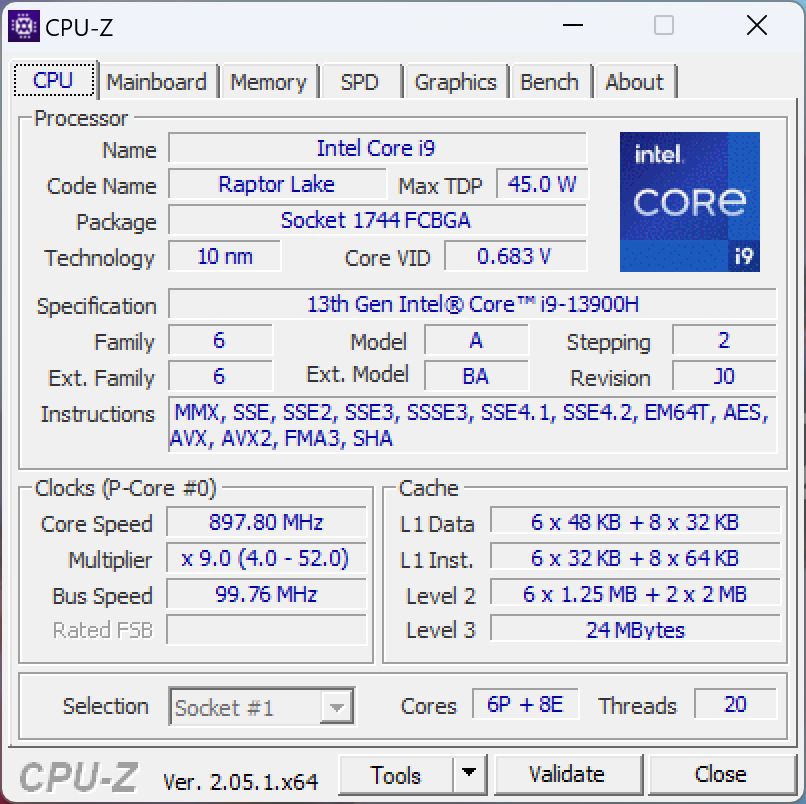
Procesador - Intel Core i9 13900H
El Intel Core i9-13900H es un procesador móvil de gama alta con 6 núcleos de rendimiento y 8 núcleos de eficiencia, por lo que se pueden procesar un total de 20 hilos en un momento dado. Aparte de la velocidad de reloj ligeramente superior, sin embargo, no hay diferencias con el Core i9-12900H. El rendimiento en el Zenbook Pro 14 es muy bueno gracias a los altos límites de potencia, aunque también hay que decir aquí que el chip Intel es sólo marginalmente más rápido que el nuevo AMD Ryzen 9 7940HScon 80 vatios, a pesar del consumo de energía significativamente mayor. En nuestro multiloop CB R15, el i9-13900H baja a 90 vatios tras unas pocas ejecuciones, donde también es más lento que el 7940HS.
Cinebench R15 Multi Sustained Load
Por otro lado, el rendimiento de un solo núcleo de los núcleos de rendimiento sigue siendo muy bueno: vemos una ventaja de alrededor del 15% sobre el actualAMD Ryzen 9 7940HS el principal rival Apple MacBook Pro 14 está claramente en desventaja en términos de rendimiento bruto de CPU, pero el consumo de energía de 34 vatios también es significativamente inferior. El MacBook también tiene la ventaja de que el rendimiento se mantiene constante en modo batería. La CPU del Zenbook, sin embargo, cae a unos míseros 30 vatios sin la fuente de alimentación, lo que resulta en una pérdida de rendimiento de alrededor del 45% en las pruebas multi-core. Más pruebas de CPU en nuestra sección de tecnología.
Cinebench R23: Multi Core | Single Core
Cinebench R20: CPU (Multi Core) | CPU (Single Core)
Cinebench R15: CPU Multi 64Bit | CPU Single 64Bit
Blender: v2.79 BMW27 CPU
7-Zip 18.03: 7z b 4 | 7z b 4 -mmt1
Geekbench 5.5: Multi-Core | Single-Core
HWBOT x265 Benchmark v2.2: 4k Preset
LibreOffice : 20 Documents To PDF
R Benchmark 2.5: Overall mean
| CPU Performance rating | |
| Asus Zenbook Pro 14 OLED UX6404VI | |
| Asus ROG Zephyrus G14 GA402XY | |
| Apple MacBook Pro 14 2023 M2 Pro -6! | |
| Asus ZenBook Pro 14 Duo UX8402VV-P1021W | |
| Medio Intel Core i9-13900H | |
| Dell XPS 15 9530 RTX 4070 | |
| Media de la clase Multimedia | |
| Razer Blade 15 OLED (Early 2022) | |
| Cinebench R23 / Multi Core | |
| Asus Zenbook Pro 14 OLED UX6404VI | |
| Asus ROG Zephyrus G14 GA402XY | |
| Asus ZenBook Pro 14 Duo UX8402VV-P1021W | |
| Medio Intel Core i9-13900H (11997 - 20385, n=28) | |
| Media de la clase Multimedia (4861 - 33362, n=74, últimos 2 años) | |
| Razer Blade 15 OLED (Early 2022) | |
| Dell XPS 15 9530 RTX 4070 | |
| Apple MacBook Pro 14 2023 M2 Pro | |
| Cinebench R23 / Single Core | |
| Asus Zenbook Pro 14 OLED UX6404VI | |
| Asus ZenBook Pro 14 Duo UX8402VV-P1021W | |
| Media de la clase Multimedia (1128 - 2459, n=66, últimos 2 años) | |
| Medio Intel Core i9-13900H (1297 - 2054, n=26) | |
| Dell XPS 15 9530 RTX 4070 | |
| Asus ROG Zephyrus G14 GA402XY | |
| Razer Blade 15 OLED (Early 2022) | |
| Apple MacBook Pro 14 2023 M2 Pro | |
| Cinebench R20 / CPU (Multi Core) | |
| Asus Zenbook Pro 14 OLED UX6404VI | |
| Asus ROG Zephyrus G14 GA402XY | |
| Asus ZenBook Pro 14 Duo UX8402VV-P1021W | |
| Medio Intel Core i9-13900H (4935 - 7716, n=25) | |
| Media de la clase Multimedia (1887 - 12912, n=57, últimos 2 años) | |
| Razer Blade 15 OLED (Early 2022) | |
| Dell XPS 15 9530 RTX 4070 | |
| Apple MacBook Pro 14 2023 M2 Pro | |
| Cinebench R20 / CPU (Single Core) | |
| Asus Zenbook Pro 14 OLED UX6404VI | |
| Asus ZenBook Pro 14 Duo UX8402VV-P1021W | |
| Media de la clase Multimedia (425 - 853, n=57, últimos 2 años) | |
| Medio Intel Core i9-13900H (428 - 792, n=25) | |
| Asus ROG Zephyrus G14 GA402XY | |
| Dell XPS 15 9530 RTX 4070 | |
| Razer Blade 15 OLED (Early 2022) | |
| Apple MacBook Pro 14 2023 M2 Pro | |
| Cinebench R15 / CPU Multi 64Bit | |
| Asus Zenbook Pro 14 OLED UX6404VI | |
| Asus ROG Zephyrus G14 GA402XY | |
| Asus ZenBook Pro 14 Duo UX8402VV-P1021W | |
| Medio Intel Core i9-13900H (2061 - 3100, n=26) | |
| Dell XPS 15 9530 RTX 4070 | |
| Media de la clase Multimedia (856 - 5224, n=61, últimos 2 años) | |
| Razer Blade 15 OLED (Early 2022) | |
| Apple MacBook Pro 14 2023 M2 Pro | |
| Cinebench R15 / CPU Single 64Bit | |
| Asus Zenbook Pro 14 OLED UX6404VI | |
| Asus ZenBook Pro 14 Duo UX8402VV-P1021W | |
| Asus ROG Zephyrus G14 GA402XY | |
| Media de la clase Multimedia (184.8 - 326, n=59, últimos 2 años) | |
| Dell XPS 15 9530 RTX 4070 | |
| Medio Intel Core i9-13900H (211 - 297, n=26) | |
| Razer Blade 15 OLED (Early 2022) | |
| Apple MacBook Pro 14 2023 M2 Pro | |
| Blender / v2.79 BMW27 CPU | |
| Media de la clase Multimedia (100 - 557, n=58, últimos 2 años) | |
| Razer Blade 15 OLED (Early 2022) | |
| Dell XPS 15 9530 RTX 4070 | |
| Medio Intel Core i9-13900H (166 - 268, n=24) | |
| Asus ZenBook Pro 14 Duo UX8402VV-P1021W | |
| Asus ROG Zephyrus G14 GA402XY | |
| Asus Zenbook Pro 14 OLED UX6404VI | |
| 7-Zip 18.03 / 7z b 4 | |
| Asus Zenbook Pro 14 OLED UX6404VI | |
| Asus ROG Zephyrus G14 GA402XY | |
| Asus ZenBook Pro 14 Duo UX8402VV-P1021W | |
| Medio Intel Core i9-13900H (45045 - 79032, n=25) | |
| Razer Blade 15 OLED (Early 2022) | |
| Dell XPS 15 9530 RTX 4070 | |
| Media de la clase Multimedia (26062 - 130368, n=55, últimos 2 años) | |
| 7-Zip 18.03 / 7z b 4 -mmt1 | |
| Asus ROG Zephyrus G14 GA402XY | |
| Asus Zenbook Pro 14 OLED UX6404VI | |
| Asus ZenBook Pro 14 Duo UX8402VV-P1021W | |
| Dell XPS 15 9530 RTX 4070 | |
| Medio Intel Core i9-13900H (3665 - 6600, n=25) | |
| Media de la clase Multimedia (3666 - 7545, n=56, últimos 2 años) | |
| Razer Blade 15 OLED (Early 2022) | |
| Geekbench 5.5 / Multi-Core | |
| Apple MacBook Pro 14 2023 M2 Pro | |
| Asus Zenbook Pro 14 OLED UX6404VI | |
| Dell XPS 15 9530 RTX 4070 | |
| Media de la clase Multimedia (4652 - 20422, n=56, últimos 2 años) | |
| Asus ZenBook Pro 14 Duo UX8402VV-P1021W | |
| Medio Intel Core i9-13900H (9094 - 15410, n=26) | |
| Razer Blade 15 OLED (Early 2022) | |
| Asus ROG Zephyrus G14 GA402XY | |
| Geekbench 5.5 / Single-Core | |
| Asus ROG Zephyrus G14 GA402XY | |
| Asus Zenbook Pro 14 OLED UX6404VI | |
| Media de la clase Multimedia (805 - 2974, n=56, últimos 2 años) | |
| Apple MacBook Pro 14 2023 M2 Pro | |
| Asus ZenBook Pro 14 Duo UX8402VV-P1021W | |
| Dell XPS 15 9530 RTX 4070 | |
| Medio Intel Core i9-13900H (1140 - 2043, n=26) | |
| Razer Blade 15 OLED (Early 2022) | |
| HWBOT x265 Benchmark v2.2 / 4k Preset | |
| Asus ROG Zephyrus G14 GA402XY | |
| Asus Zenbook Pro 14 OLED UX6404VI | |
| Media de la clase Multimedia (5.26 - 36.1, n=56, últimos 2 años) | |
| Medio Intel Core i9-13900H (14.1 - 22.3, n=25) | |
| Asus ZenBook Pro 14 Duo UX8402VV-P1021W | |
| Dell XPS 15 9530 RTX 4070 | |
| Razer Blade 15 OLED (Early 2022) | |
| LibreOffice / 20 Documents To PDF | |
| Razer Blade 15 OLED (Early 2022) | |
| Media de la clase Multimedia (23.9 - 146.7, n=57, últimos 2 años) | |
| Medio Intel Core i9-13900H (34.4 - 82.8, n=25) | |
| Asus Zenbook Pro 14 OLED UX6404VI | |
| Dell XPS 15 9530 RTX 4070 | |
| Asus ZenBook Pro 14 Duo UX8402VV-P1021W | |
| Asus ROG Zephyrus G14 GA402XY | |
| R Benchmark 2.5 / Overall mean | |
| Razer Blade 15 OLED (Early 2022) | |
| Media de la clase Multimedia (0.3604 - 0.947, n=56, últimos 2 años) | |
| Medio Intel Core i9-13900H (0.4052 - 0.723, n=25) | |
| Asus ZenBook Pro 14 Duo UX8402VV-P1021W | |
| Dell XPS 15 9530 RTX 4070 | |
| Asus ROG Zephyrus G14 GA402XY | |
| Asus Zenbook Pro 14 OLED UX6404VI | |
* ... más pequeño es mejor
AIDA64: FP32 Ray-Trace | FPU Julia | CPU SHA3 | CPU Queen | FPU SinJulia | FPU Mandel | CPU AES | CPU ZLib | FP64 Ray-Trace | CPU PhotoWorxx
| Performance rating | |
| Asus Zenbook Pro 14 OLED UX6404VI | |
| Media de la clase Multimedia | |
| Medio Intel Core i9-13900H | |
| Razer Blade 15 OLED (Early 2022) | |
| Asus ZenBook Pro 14 Duo UX8402VV-P1021W | |
| Dell XPS 15 9530 RTX 4070 | |
| AIDA64 / FP32 Ray-Trace | |
| Media de la clase Multimedia (2214 - 50388, n=53, últimos 2 años) | |
| Asus Zenbook Pro 14 OLED UX6404VI | |
| Medio Intel Core i9-13900H (6788 - 19557, n=25) | |
| Asus ZenBook Pro 14 Duo UX8402VV-P1021W | |
| Dell XPS 15 9530 RTX 4070 | |
| Razer Blade 15 OLED (Early 2022) | |
| AIDA64 / FPU Julia | |
| Asus Zenbook Pro 14 OLED UX6404VI | |
| Media de la clase Multimedia (12867 - 201874, n=54, últimos 2 años) | |
| Medio Intel Core i9-13900H (22551 - 95579, n=25) | |
| Razer Blade 15 OLED (Early 2022) | |
| Asus ZenBook Pro 14 Duo UX8402VV-P1021W | |
| Dell XPS 15 9530 RTX 4070 | |
| AIDA64 / CPU SHA3 | |
| Asus Zenbook Pro 14 OLED UX6404VI | |
| Media de la clase Multimedia (626 - 8623, n=54, últimos 2 años) | |
| Medio Intel Core i9-13900H (2491 - 4270, n=25) | |
| Razer Blade 15 OLED (Early 2022) | |
| Asus ZenBook Pro 14 Duo UX8402VV-P1021W | |
| Dell XPS 15 9530 RTX 4070 | |
| AIDA64 / CPU Queen | |
| Asus Zenbook Pro 14 OLED UX6404VI | |
| Asus ZenBook Pro 14 Duo UX8402VV-P1021W | |
| Razer Blade 15 OLED (Early 2022) | |
| Medio Intel Core i9-13900H (65121 - 120936, n=25) | |
| Dell XPS 15 9530 RTX 4070 | |
| Media de la clase Multimedia (13483 - 181505, n=41, últimos 2 años) | |
| AIDA64 / FPU SinJulia | |
| Asus Zenbook Pro 14 OLED UX6404VI | |
| Razer Blade 15 OLED (Early 2022) | |
| Medio Intel Core i9-13900H (6108 - 11631, n=25) | |
| Asus ZenBook Pro 14 Duo UX8402VV-P1021W | |
| Media de la clase Multimedia (886 - 28794, n=54, últimos 2 años) | |
| Dell XPS 15 9530 RTX 4070 | |
| AIDA64 / FPU Mandel | |
| Media de la clase Multimedia (6395 - 105740, n=53, últimos 2 años) | |
| Asus Zenbook Pro 14 OLED UX6404VI | |
| Medio Intel Core i9-13900H (11283 - 48474, n=25) | |
| Asus ZenBook Pro 14 Duo UX8402VV-P1021W | |
| Razer Blade 15 OLED (Early 2022) | |
| Dell XPS 15 9530 RTX 4070 | |
| AIDA64 / CPU AES | |
| Razer Blade 15 OLED (Early 2022) | |
| Medio Intel Core i9-13900H (3691 - 149377, n=25) | |
| Asus Zenbook Pro 14 OLED UX6404VI | |
| Media de la clase Multimedia (8171 - 126790, n=54, últimos 2 años) | |
| Asus ZenBook Pro 14 Duo UX8402VV-P1021W | |
| Dell XPS 15 9530 RTX 4070 | |
| AIDA64 / CPU ZLib | |
| Asus Zenbook Pro 14 OLED UX6404VI | |
| Razer Blade 15 OLED (Early 2022) | |
| Medio Intel Core i9-13900H (789 - 1254, n=25) | |
| Media de la clase Multimedia (143.8 - 2022, n=54, últimos 2 años) | |
| Dell XPS 15 9530 RTX 4070 | |
| Asus ZenBook Pro 14 Duo UX8402VV-P1021W | |
| AIDA64 / FP64 Ray-Trace | |
| Media de la clase Multimedia (1014 - 26875, n=54, últimos 2 años) | |
| Asus Zenbook Pro 14 OLED UX6404VI | |
| Medio Intel Core i9-13900H (3655 - 10716, n=25) | |
| Asus ZenBook Pro 14 Duo UX8402VV-P1021W | |
| Dell XPS 15 9530 RTX 4070 | |
| Razer Blade 15 OLED (Early 2022) | |
| AIDA64 / CPU PhotoWorxx | |
| Media de la clase Multimedia (8187 - 88154, n=54, últimos 2 años) | |
| Dell XPS 15 9530 RTX 4070 | |
| Asus Zenbook Pro 14 OLED UX6404VI | |
| Asus ZenBook Pro 14 Duo UX8402VV-P1021W | |
| Medio Intel Core i9-13900H (10871 - 50488, n=25) | |
| Razer Blade 15 OLED (Early 2022) | |
| Razer Blade 15 OLED (Early 2022) | |
Rendimiento del sistema
El rendimiento del sistema es excelente, lo que confirman tanto los buenos resultados de las pruebas como nuestra impresión subjetiva del rendimiento. No experimentamos problemas con el Zenbook Pro durante las pruebas.
CrossMark: Overall | Productivity | Creativity | Responsiveness
| PCMark 10 / Score | |
| Asus ROG Zephyrus G14 GA402XY | |
| Media de la clase Multimedia (4325 - 10386, n=52, últimos 2 años) | |
| Medio Intel Core i9-13900H, NVIDIA GeForce RTX 4070 Laptop GPU (5855 - 8538, n=8) | |
| Asus ZenBook Pro 14 Duo UX8402VV-P1021W | |
| Asus Zenbook Pro 14 OLED UX6404VI | |
| Razer Blade 15 OLED (Early 2022) | |
| Dell XPS 15 9530 RTX 4070 | |
| PCMark 10 / Essentials | |
| Dell XPS 15 9530 RTX 4070 | |
| Asus ZenBook Pro 14 Duo UX8402VV-P1021W | |
| Asus Zenbook Pro 14 OLED UX6404VI | |
| Medio Intel Core i9-13900H, NVIDIA GeForce RTX 4070 Laptop GPU (8835 - 11940, n=8) | |
| Asus ROG Zephyrus G14 GA402XY | |
| Media de la clase Multimedia (8025 - 11664, n=51, últimos 2 años) | |
| Razer Blade 15 OLED (Early 2022) | |
| PCMark 10 / Productivity | |
| Media de la clase Multimedia (7323 - 18233, n=51, últimos 2 años) | |
| Asus ROG Zephyrus G14 GA402XY | |
| Razer Blade 15 OLED (Early 2022) | |
| Asus ZenBook Pro 14 Duo UX8402VV-P1021W | |
| Medio Intel Core i9-13900H, NVIDIA GeForce RTX 4070 Laptop GPU (7967 - 10991, n=8) | |
| Asus Zenbook Pro 14 OLED UX6404VI | |
| Dell XPS 15 9530 RTX 4070 | |
| PCMark 10 / Digital Content Creation | |
| Asus ROG Zephyrus G14 GA402XY | |
| Medio Intel Core i9-13900H, NVIDIA GeForce RTX 4070 Laptop GPU (7738 - 13575, n=8) | |
| Asus Zenbook Pro 14 OLED UX6404VI | |
| Dell XPS 15 9530 RTX 4070 | |
| Asus ZenBook Pro 14 Duo UX8402VV-P1021W | |
| Media de la clase Multimedia (3651 - 16240, n=51, últimos 2 años) | |
| Razer Blade 15 OLED (Early 2022) | |
| CrossMark / Overall | |
| Asus Zenbook Pro 14 OLED UX6404VI | |
| Dell XPS 15 9530 RTX 4070 | |
| Media de la clase Multimedia (866 - 2728, n=60, últimos 2 años) | |
| Asus ZenBook Pro 14 Duo UX8402VV-P1021W | |
| Asus ROG Zephyrus G14 GA402XY | |
| Medio Intel Core i9-13900H, NVIDIA GeForce RTX 4070 Laptop GPU (1104 - 1974, n=7) | |
| Apple MacBook Pro 14 2023 M2 Pro | |
| Razer Blade 15 OLED (Early 2022) | |
| CrossMark / Productivity | |
| Asus Zenbook Pro 14 OLED UX6404VI | |
| Asus ZenBook Pro 14 Duo UX8402VV-P1021W | |
| Media de la clase Multimedia (931 - 2489, n=60, últimos 2 años) | |
| Asus ROG Zephyrus G14 GA402XY | |
| Dell XPS 15 9530 RTX 4070 | |
| Medio Intel Core i9-13900H, NVIDIA GeForce RTX 4070 Laptop GPU (1058 - 1914, n=7) | |
| Razer Blade 15 OLED (Early 2022) | |
| Apple MacBook Pro 14 2023 M2 Pro | |
| CrossMark / Creativity | |
| Apple MacBook Pro 14 2023 M2 Pro | |
| Asus Zenbook Pro 14 OLED UX6404VI | |
| Media de la clase Multimedia (907 - 3465, n=60, últimos 2 años) | |
| Dell XPS 15 9530 RTX 4070 | |
| Asus ZenBook Pro 14 Duo UX8402VV-P1021W | |
| Asus ROG Zephyrus G14 GA402XY | |
| Medio Intel Core i9-13900H, NVIDIA GeForce RTX 4070 Laptop GPU (1178 - 2254, n=7) | |
| Razer Blade 15 OLED (Early 2022) | |
| CrossMark / Responsiveness | |
| Medio Intel Core i9-13900H, NVIDIA GeForce RTX 4070 Laptop GPU (1037 - 1952, n=7) | |
| Dell XPS 15 9530 RTX 4070 | |
| Asus Zenbook Pro 14 OLED UX6404VI | |
| Razer Blade 15 OLED (Early 2022) | |
| Asus ZenBook Pro 14 Duo UX8402VV-P1021W | |
| Media de la clase Multimedia (605 - 2024, n=60, últimos 2 años) | |
| Asus ROG Zephyrus G14 GA402XY | |
| Apple MacBook Pro 14 2023 M2 Pro | |
| PCMark 10 Score | 7534 puntos | |
ayuda | ||
| AIDA64 / Memory Copy | |
| Media de la clase Multimedia (11299 - 132135, n=54, últimos 2 años) | |
| Dell XPS 15 9530 RTX 4070 | |
| Asus Zenbook Pro 14 OLED UX6404VI | |
| Medio Intel Core i9-13900H (37448 - 74486, n=25) | |
| Asus ZenBook Pro 14 Duo UX8402VV-P1021W | |
| Razer Blade 15 OLED (Early 2022) | |
| AIDA64 / Memory Read | |
| Media de la clase Multimedia (11624 - 174586, n=54, últimos 2 años) | |
| Dell XPS 15 9530 RTX 4070 | |
| Asus Zenbook Pro 14 OLED UX6404VI | |
| Medio Intel Core i9-13900H (41599 - 75433, n=25) | |
| Razer Blade 15 OLED (Early 2022) | |
| Asus ZenBook Pro 14 Duo UX8402VV-P1021W | |
| AIDA64 / Memory Write | |
| Media de la clase Multimedia (11755 - 134998, n=54, últimos 2 años) | |
| Asus ZenBook Pro 14 Duo UX8402VV-P1021W | |
| Dell XPS 15 9530 RTX 4070 | |
| Medio Intel Core i9-13900H (36152 - 88505, n=25) | |
| Asus Zenbook Pro 14 OLED UX6404VI | |
| Razer Blade 15 OLED (Early 2022) | |
| AIDA64 / Memory Latency | |
| Media de la clase Multimedia (7 - 535, n=53, últimos 2 años) | |
| Razer Blade 15 OLED (Early 2022) | |
| Asus ZenBook Pro 14 Duo UX8402VV-P1021W | |
| Medio Intel Core i9-13900H (75.8 - 102.3, n=25) | |
| Dell XPS 15 9530 RTX 4070 | |
| Asus Zenbook Pro 14 OLED UX6404VI | |
* ... más pequeño es mejor
Latencia del CPD
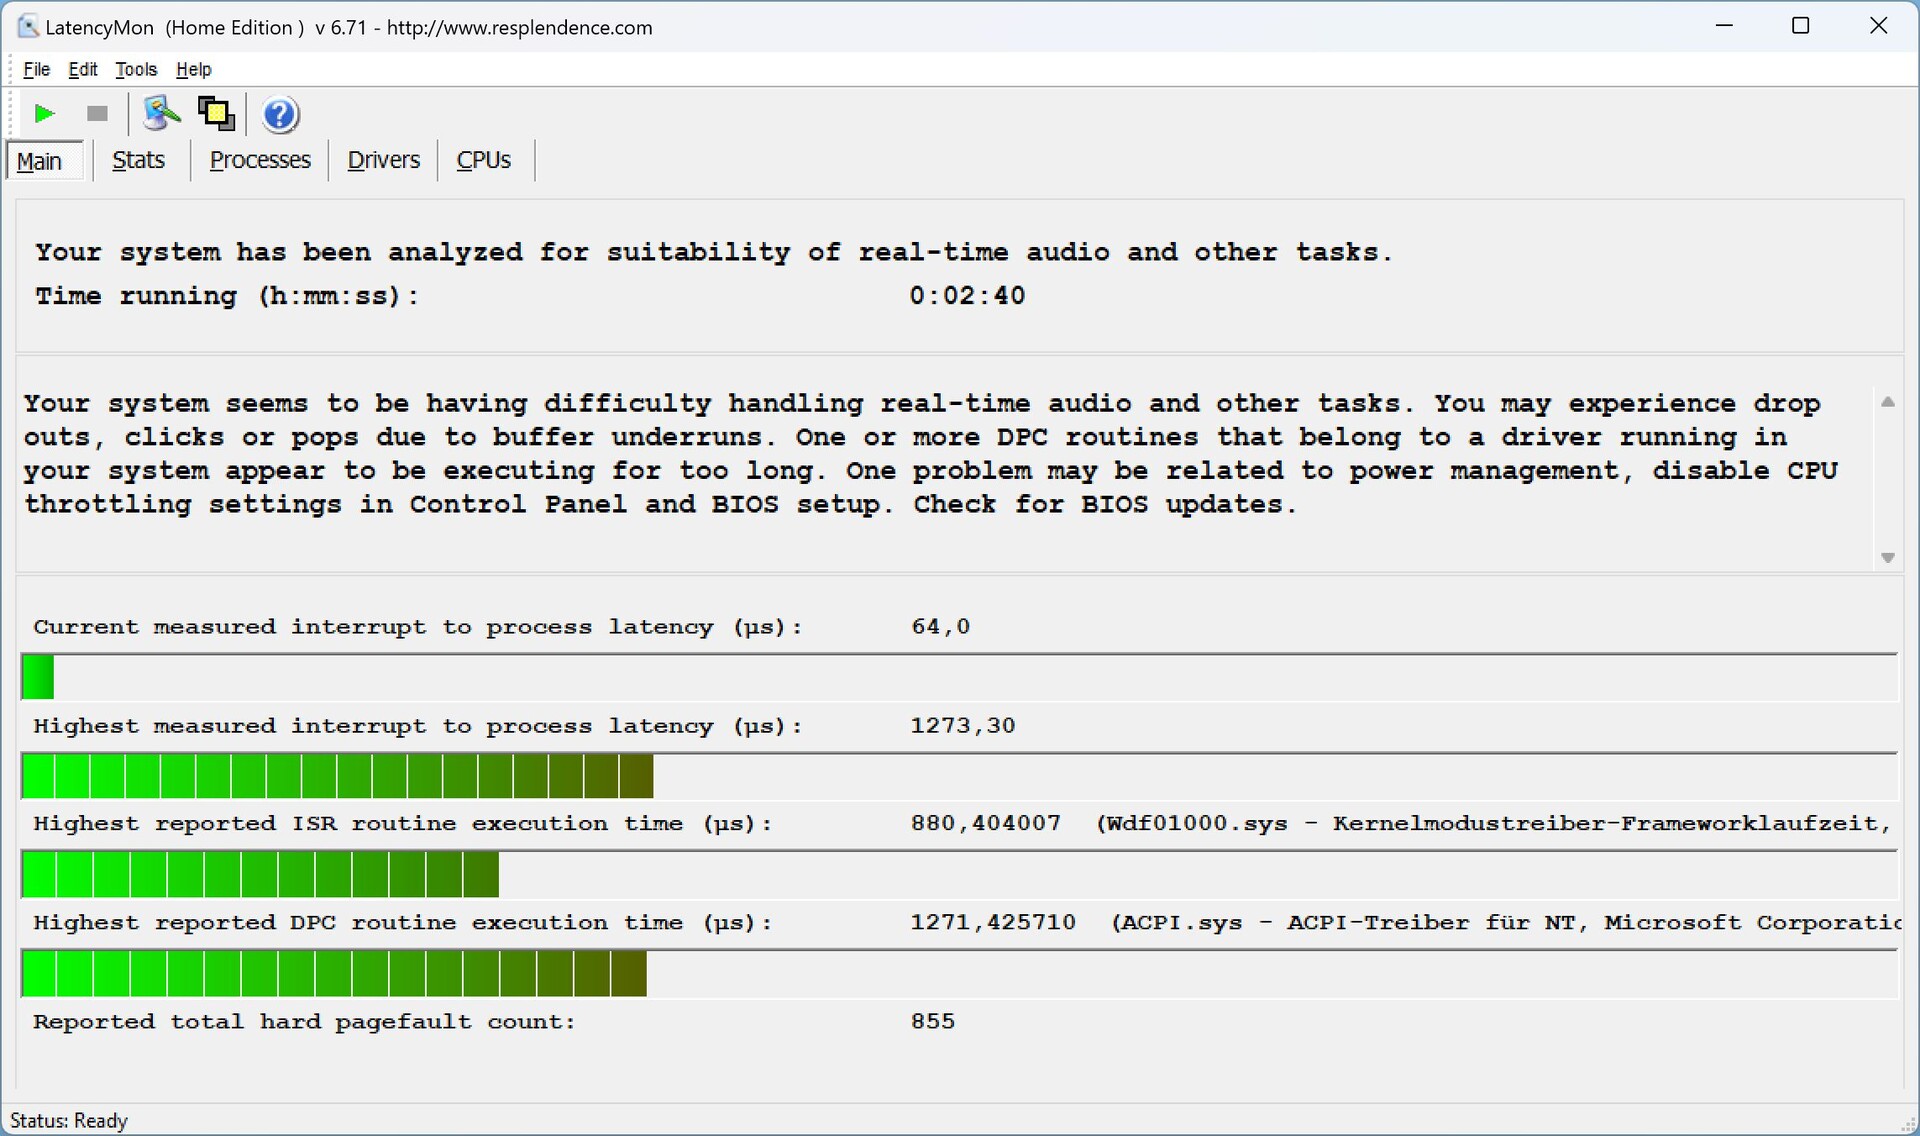
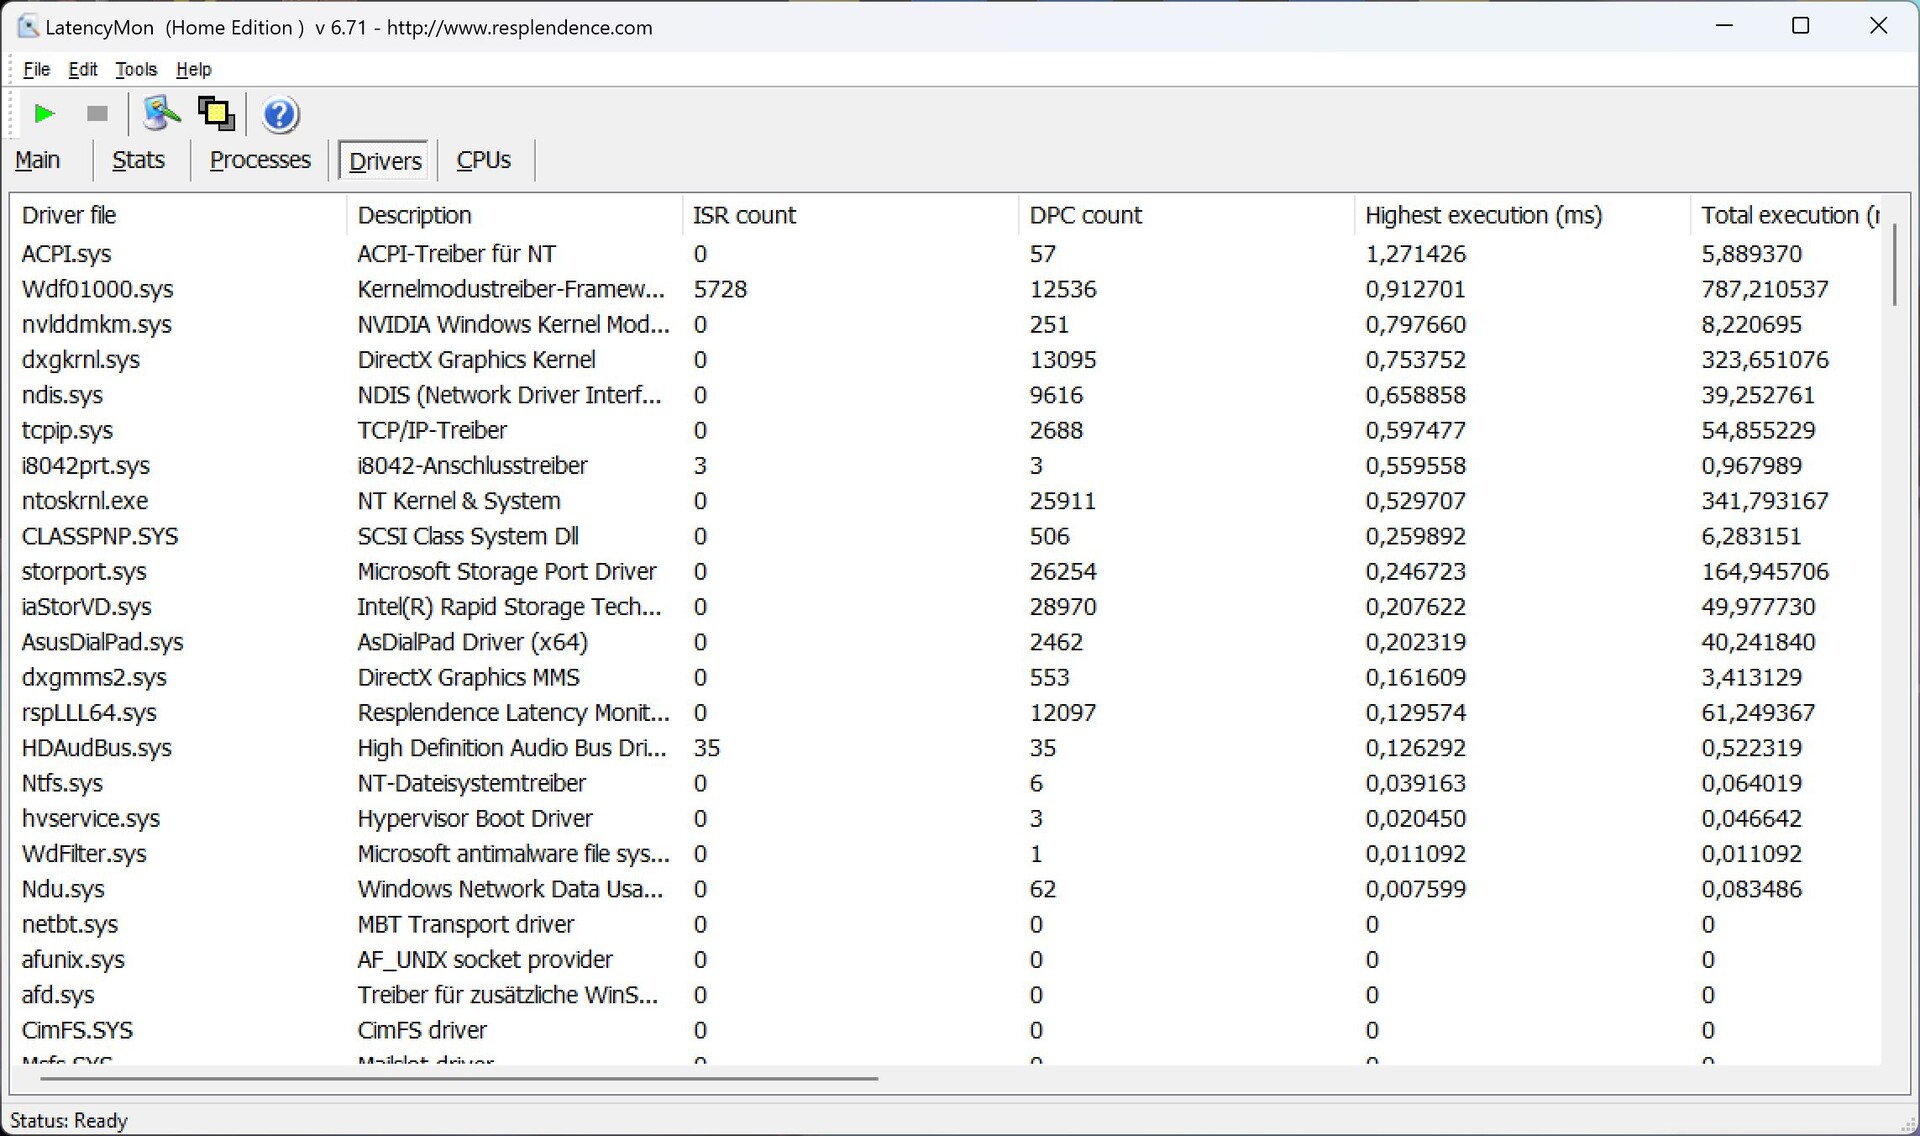
En nuestra prueba de latencia estandarizada (navegación web, reproducción de YouTube 4K, carga de la CPU), el dispositivo de prueba muestra ligeras limitaciones al usar aplicaciones de audio en tiempo real con la versión actual de la BIOS.
| DPC Latencies / LatencyMon - interrupt to process latency (max), Web, Youtube, Prime95 | |
| Asus Zenbook Pro 14 OLED UX6404VI | |
| Dell XPS 15 9530 RTX 4070 | |
| Asus ZenBook Pro 14 Duo UX8402VV-P1021W | |
| Razer Blade 15 OLED (Early 2022) | |
| Asus ROG Zephyrus G14 GA402XY | |
* ... más pequeño es mejor
Dispositivos de almacenamiento
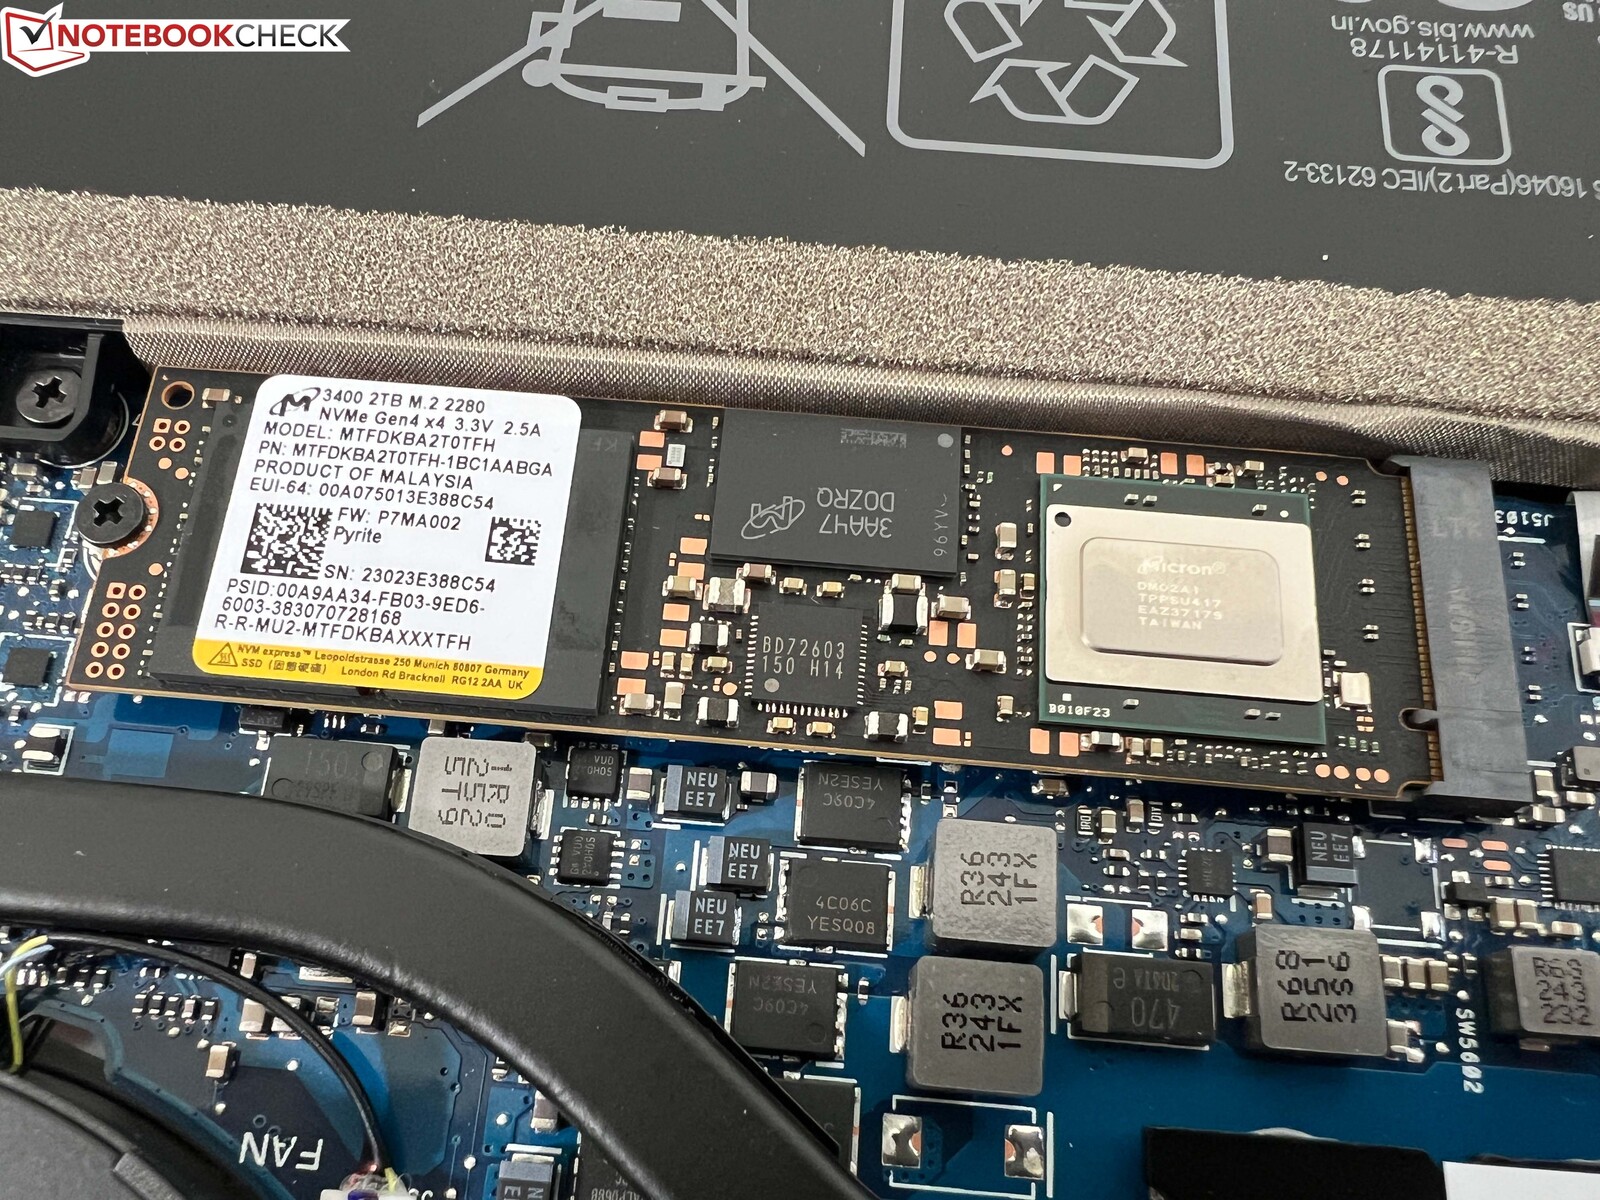
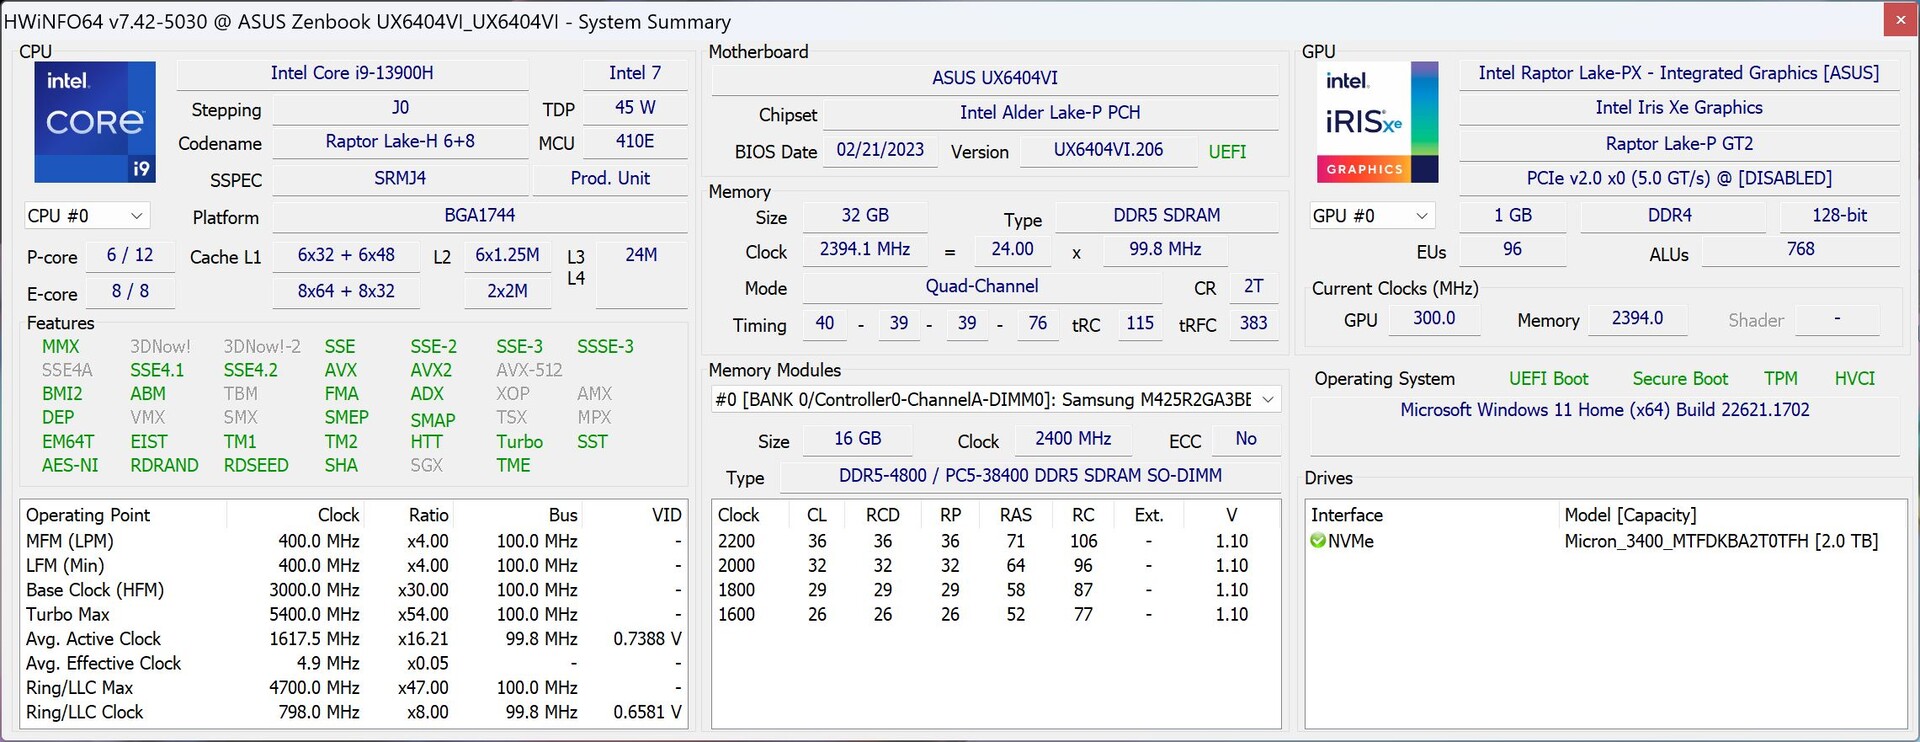
Nuestro dispositivo de pruebas está equipado con el SSD Micron 3400 NVMe, que ofrece una capacidad de almacenamiento de 2 TB (de los cuales 1,79 TB están disponibles tras el primer arranque). Es un veloz SSD PCIe 4.0, aunque los dispositivos de Samsung y SK Hynix logran tasas de transferencia ligeramente superiores. Pero esto no juega un papel importante en el uso diario; es mucho más importante que el rendimiento se mantenga estable bajo carga sostenida. Más pruebas comparativas de SSD aquí.

* ... más pequeño es mejor
Sustained Read Performance: DiskSpd Read Loop, Queue Depth 8
Tarjeta gráfica
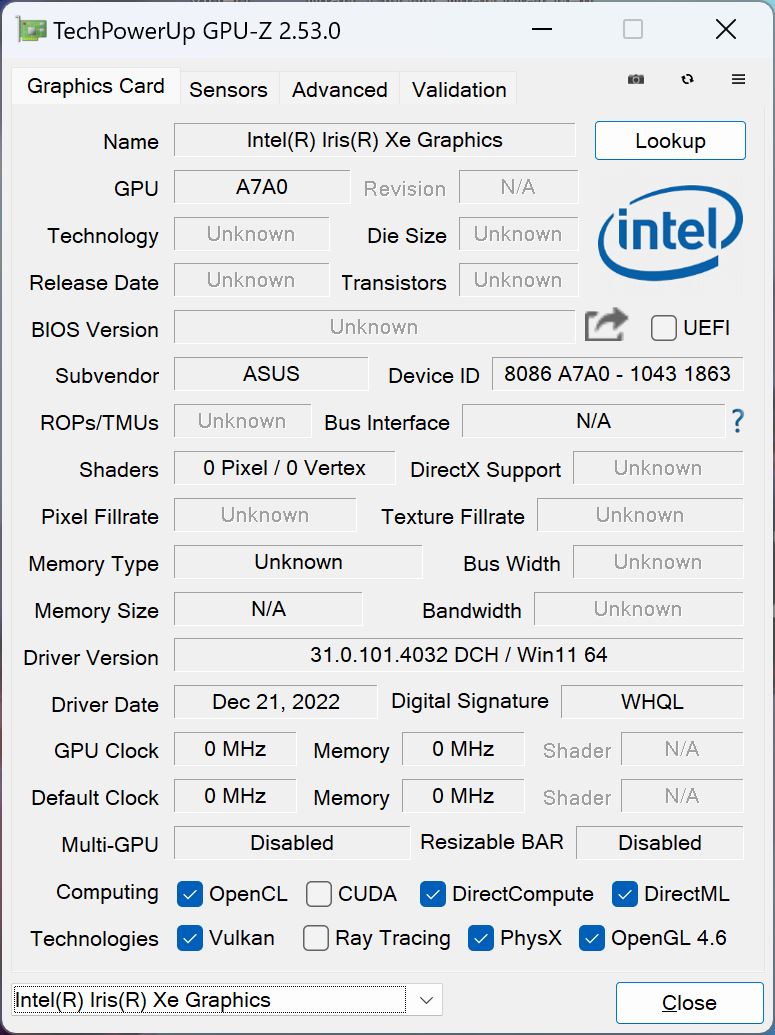
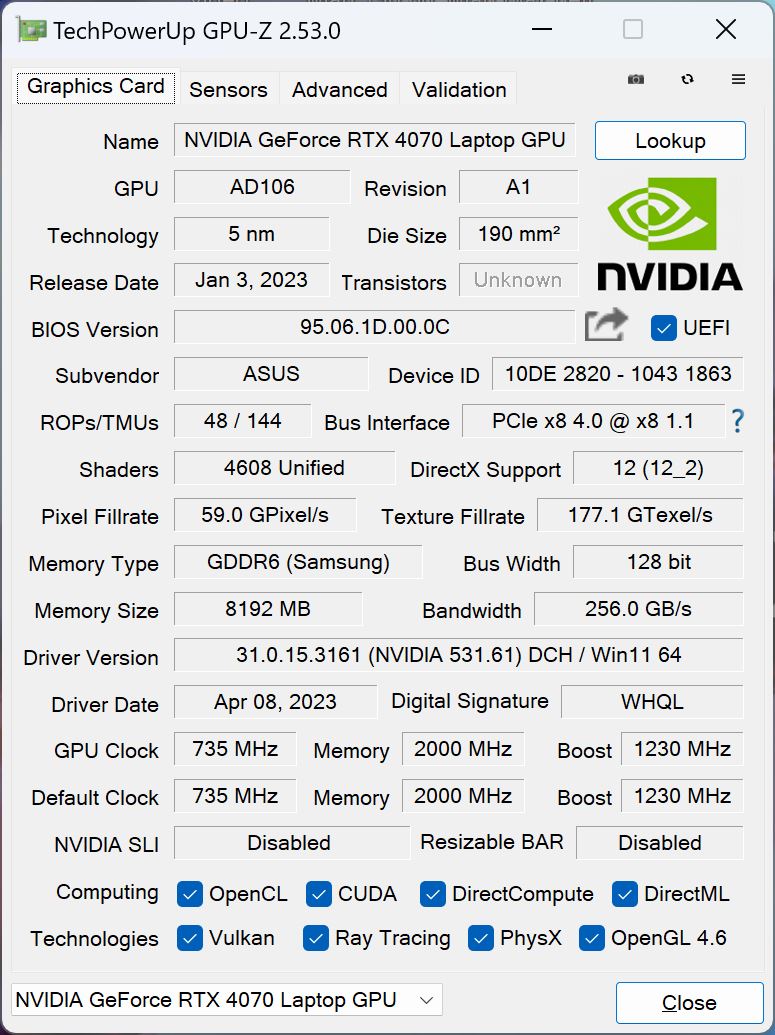
El nuevoGeForce RTX 4070 para portátiles CPU con 8 GB de VRAM se usa como tarjeta gráfica dedicada. Según el driver, tenemos instalada la variante de 120 vatios, pero sólo pudimos sacar un máximo de 95 vatios de la GPU (120 vatios brevemente en la prueba de estrés). Dado que la GPU sólo consume un máximo de ~105-110 vatios durante los juegos, esto importa poco y el rendimiento general es muy bueno, especialmente a la vista del compacto chasis de 14 pulgadas. El modo híbrido está activo por defecto, pero la GPU integrada también puede desactivarse por completo si es necesario (lo que requiere un reinicio).
En las pruebas sintéticas, por ejemplo, el Zenbook Pro 14 también es bastante más rápido (60-80%) que la variante de 50 vatios del portátil RTX 4070 del nuevoDell XPS 15y, en general, también es notablemente más rápida que la antigua RTX 3070 Ti del Razer Blade 15.
El rendimiento de la GPU también permanece completamente estable bajo carga sostenida, ya que pasa fácilmente el test de estrés Time Spy al 99.5%. Con batería, empero, el rendimiento GPU está limitado a 60 vatios, lo que reduce el rendimiento en un 23%. Más pruebas de rendimiento de la GPUaquí.
| 3DMark 11 Performance | 34341 puntos | |
| 3DMark Fire Strike Score | 25794 puntos | |
| 3DMark Time Spy Score | 11666 puntos | |
ayuda | ||
| Blender / v3.3 Classroom OPTIX/RTX | |
| Media de la clase Multimedia (12 - 105, n=22, últimos 2 años) | |
| Dell XPS 15 9530 RTX 4070 | |
| Asus ZenBook Pro 14 Duo UX8402VV-P1021W | |
| Razer Blade 15 OLED (Early 2022) | |
| Asus Zenbook Pro 14 OLED UX6404VI | |
| Medio NVIDIA GeForce RTX 4070 Laptop GPU (18 - 30, n=68) | |
| Asus ROG Zephyrus G14 GA402XY | |
| Blender / v3.3 Classroom CUDA | |
| Media de la clase Multimedia (20 - 186, n=22, últimos 2 años) | |
| Asus ZenBook Pro 14 Duo UX8402VV-P1021W | |
| Dell XPS 15 9530 RTX 4070 | |
| Razer Blade 15 OLED (Early 2022) | |
| Asus Zenbook Pro 14 OLED UX6404VI | |
| Medio NVIDIA GeForce RTX 4070 Laptop GPU (32 - 50, n=67) | |
| Asus ROG Zephyrus G14 GA402XY | |
| Blender / v3.3 Classroom METAL | |
| Apple MacBook Pro 14 2023 M2 Pro | |
| Media de la clase Multimedia (17.8 - 68, n=5, últimos 2 años) | |
* ... más pequeño es mejor
Rendimiento en juegos
Aunque Asus anuncia el Zenbook Pro 14 como un portátil para creadores, también es genial para jugar. El rendimiento del Portátil RTX 4070es completamente adecuado para un juego fluido en resolución QHD, incluso en los últimos títulos de juegos. El rendimiento de juego también permanece completamente estable durante sesiones largas. Más pruebas de GPU en nuestra sección de tecnología.
| The Witcher 3 - 1920x1080 Ultra Graphics & Postprocessing (HBAO+) | |
| Asus ROG Zephyrus G14 GA402XY | |
| Asus ZenBook Pro 14 Duo UX8402VV-P1021W | |
| Asus Zenbook Pro 14 OLED UX6404VI | |
| Razer Blade 15 OLED (Early 2022) | |
| Dell XPS 15 9530 RTX 4070 | |
| Media de la clase Multimedia (11 - 121, n=7, últimos 2 años) | |
| Final Fantasy XV Benchmark - 1920x1080 High Quality | |
| Asus ROG Zephyrus G14 GA402XY | |
| Asus Zenbook Pro 14 OLED UX6404VI | |
| Razer Blade 15 OLED (Early 2022) | |
| Asus ZenBook Pro 14 Duo UX8402VV-P1021W | |
| Dell XPS 15 9530 RTX 4070 | |
| Media de la clase Multimedia (7.61 - 144.4, n=57, últimos 2 años) | |
Witcher 3 FPS Chart
| bajo | medio | alto | ultra | QHD | |
|---|---|---|---|---|---|
| GTA V (2015) | 184.5 | 179.4 | 117.7 | 86.8 | |
| The Witcher 3 (2015) | 223 | 105.3 | |||
| Dota 2 Reborn (2015) | 199.2 | 182.3 | 171.5 | 162.2 | |
| Final Fantasy XV Benchmark (2018) | 121.8 | 108.3 | 79.5 | ||
| X-Plane 11.11 (2018) | 162.3 | 143.3 | 113.4 | ||
| Far Cry 5 (2018) | 119 | 118 | 116 | 95 | |
| Strange Brigade (2018) | 249 | 215 | 194 | 132 | |
| F1 2021 (2021) | 182.6 | 162.5 | 118.4 | 88.6 | |
| Cyberpunk 2077 1.6 (2022) | 130 | 104 | 89 | 82 | 61 |
| F1 22 (2022) | 242 | 182 | 71.8 | 47.1 |
Emisiones - Buenos altavoces
Ruido
Para las tareas diarias (o siempre que no necesites rendimiento GPU), deberías usar el modo Susurro o Estándar si es posible, ya que el Zenbook Pro 14 suele permanecer silencioso. También deberías probar el modo Estándar para jugar, ya que el rendimiento seguirá siendo suficiente en muchos casos y el dispositivo es mucho más agradable con algo menos de 41 dB(A) comparado con algo menos de 49 dB(A) en modo Rendimiento . No se detectaron otros ruidos electrónicos, como el zumbido de la bobina.
Ruido
| Ocioso |
| 23.3 / 23.3 / 23.3 dB(A) |
| Carga |
| 39.3 / 48.8 dB(A) |
 | ||
30 dB silencioso 40 dB(A) audible 50 dB(A) ruidosamente alto |
||
min: | ||
| Asus Zenbook Pro 14 OLED UX6404VI GeForce RTX 4070 Laptop GPU, i9-13900H, Micron 3400 2TB MTFDKBA2T0TFH | Asus ZenBook Pro 14 Duo UX8402VV-P1021W GeForce RTX 4060 Laptop GPU, i9-13900H, Samsung PM9A1 MZVL22T0HBLB | Apple MacBook Pro 14 2023 M2 Pro M2 Pro 19-Core GPU, M2 Pro, Apple SSD AP2048Z | Asus ROG Zephyrus G14 GA402XY GeForce RTX 4090 Laptop GPU, R9 7940HS, Samsung PM9A1 MZVL21T0HCLR | Dell XPS 15 9530 RTX 4070 GeForce RTX 4070 Laptop GPU, i7-13700H, SK hynix PC801 HFS001TEJ9X101N | Razer Blade 15 OLED (Early 2022) GeForce RTX 3070 Ti Laptop GPU, i9-12900H, Samsung PM9A1 MZVL21T0HCLR | |
|---|---|---|---|---|---|---|
| Noise | -23% | 6% | -12% | 8% | -10% | |
| apagado / medio ambiente * (dB) | 23.3 | 25.2 -8% | 23.9 -3% | 23.3 -0% | 23.1 1% | 26 -12% |
| Idle Minimum * (dB) | 23.3 | 25.2 -8% | 23.9 -3% | 23.6 -1% | 23.1 1% | 28 -20% |
| Idle Average * (dB) | 23.3 | 25.2 -8% | 23.9 -3% | 23.6 -1% | 23.1 1% | 28 -20% |
| Idle Maximum * (dB) | 23.3 | 32.5 -39% | 23.9 -3% | 33 -42% | 24.2 -4% | 28 -20% |
| Load Average * (dB) | 39.3 | 59.7 -52% | 26 34% | 49.5 -26% | 27.1 31% | 38.5 2% |
| Witcher 3 ultra * (dB) | 48.8 | 52.2 -7% | 40.1 18% | |||
| Load Maximum * (dB) | 48.8 | 60.9 -25% | 43.2 11% | 52.2 -7% | 44.6 9% | 43.9 10% |
* ... más pequeño es mejor
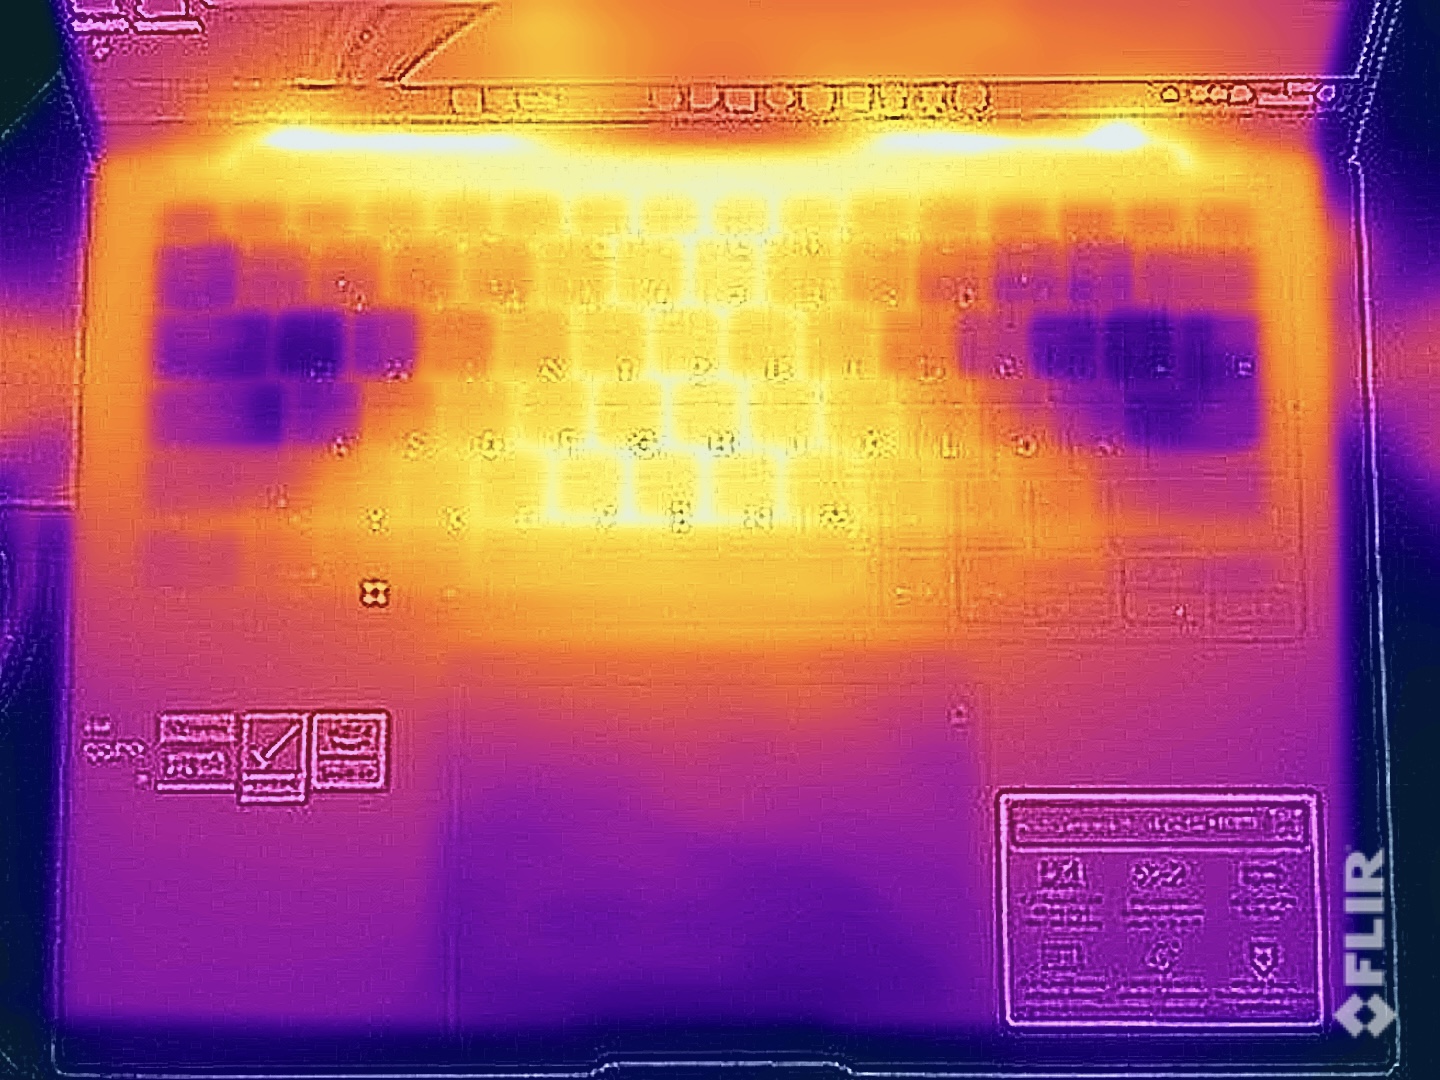
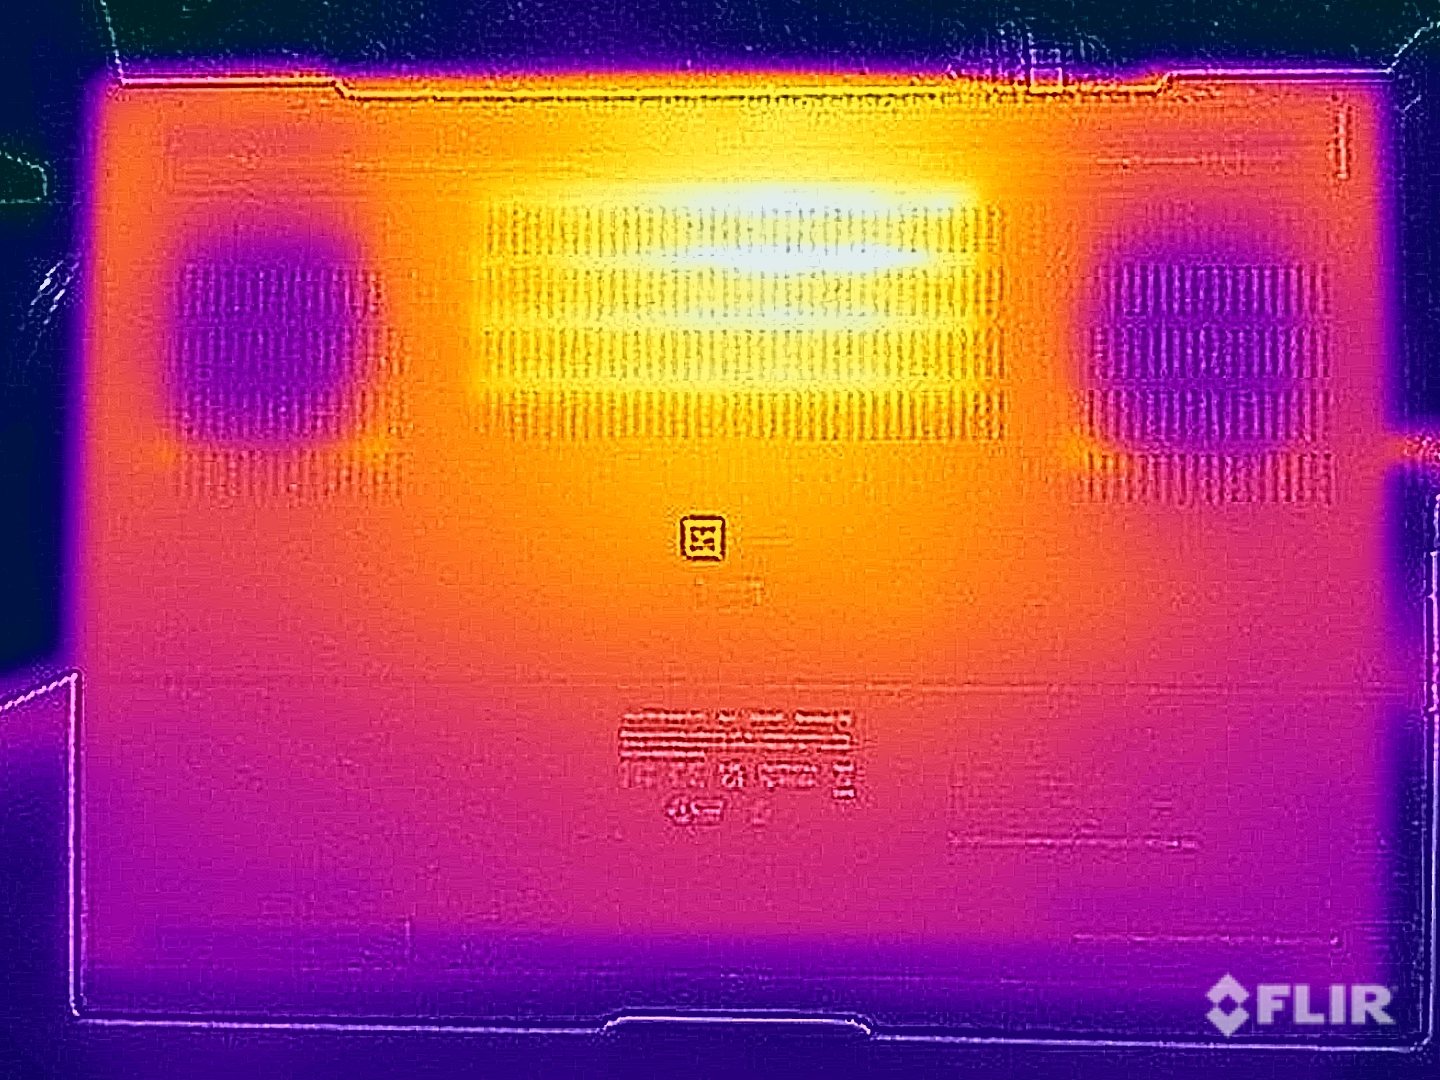
Temperatura
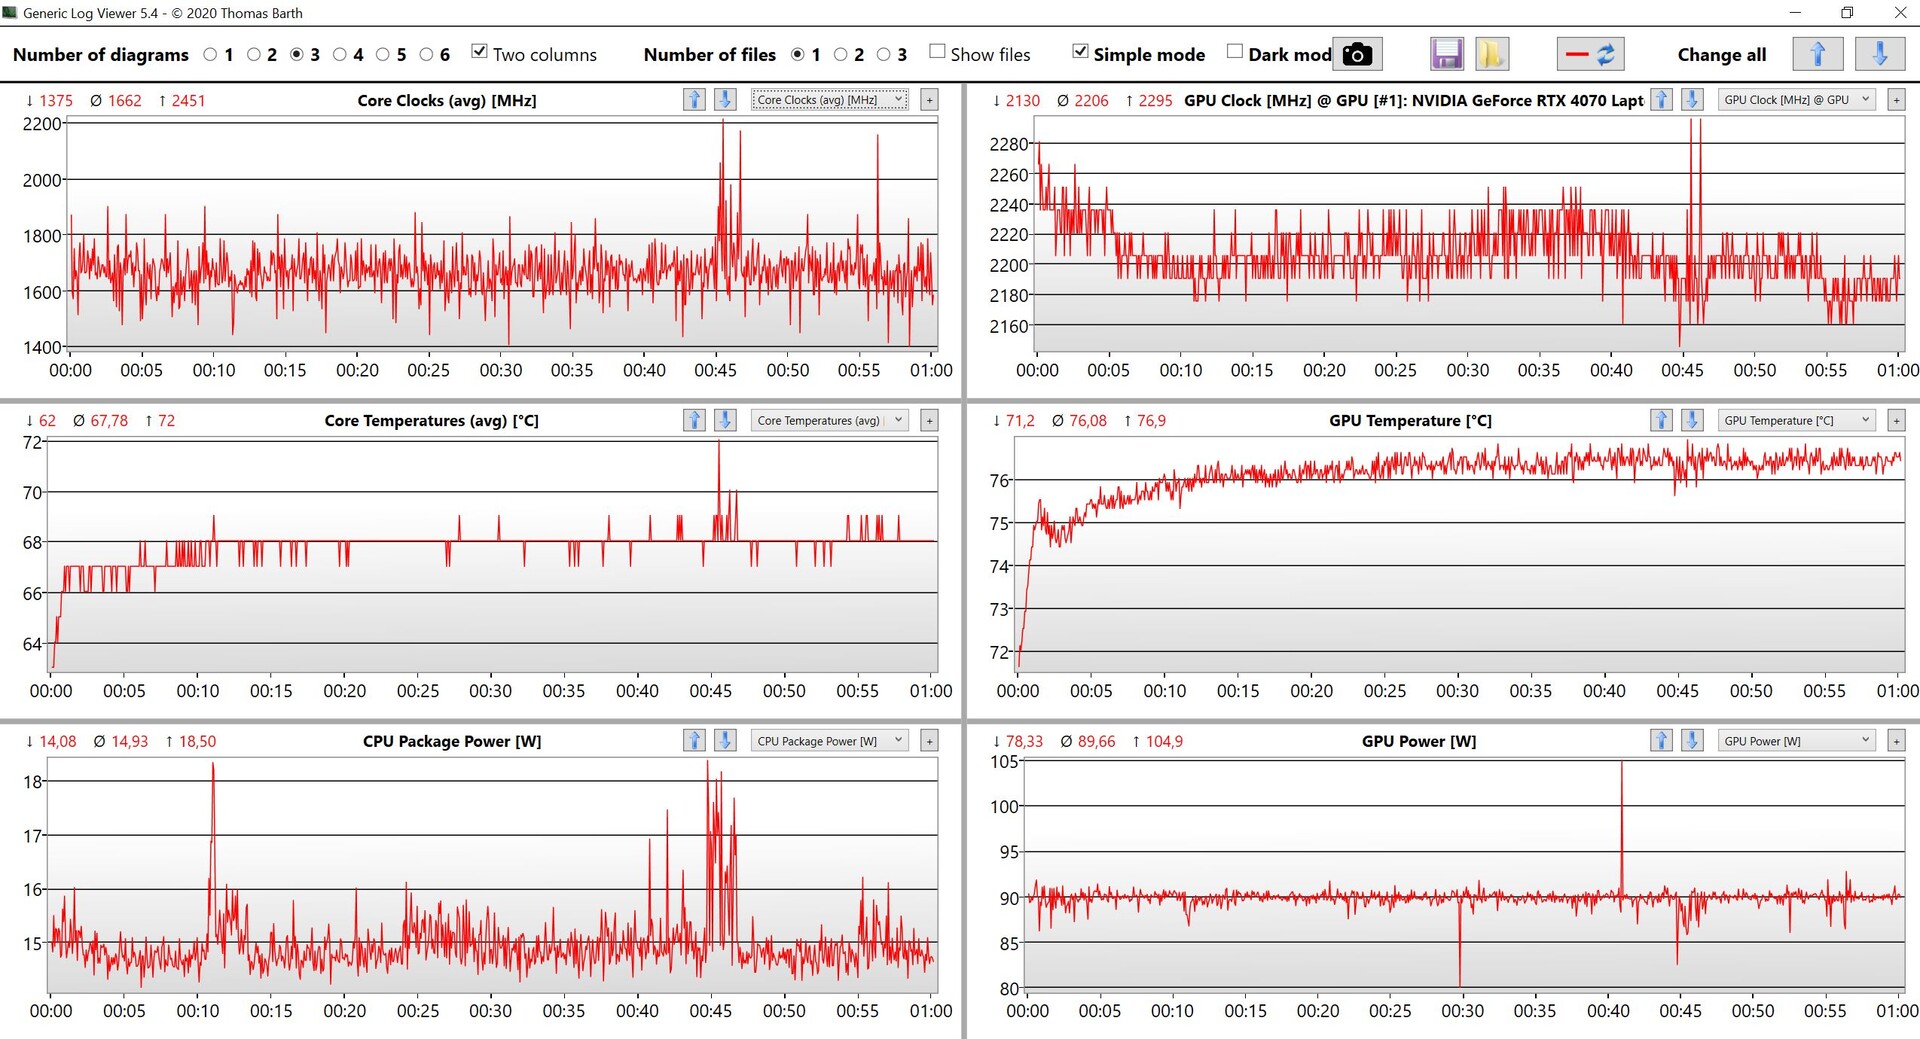
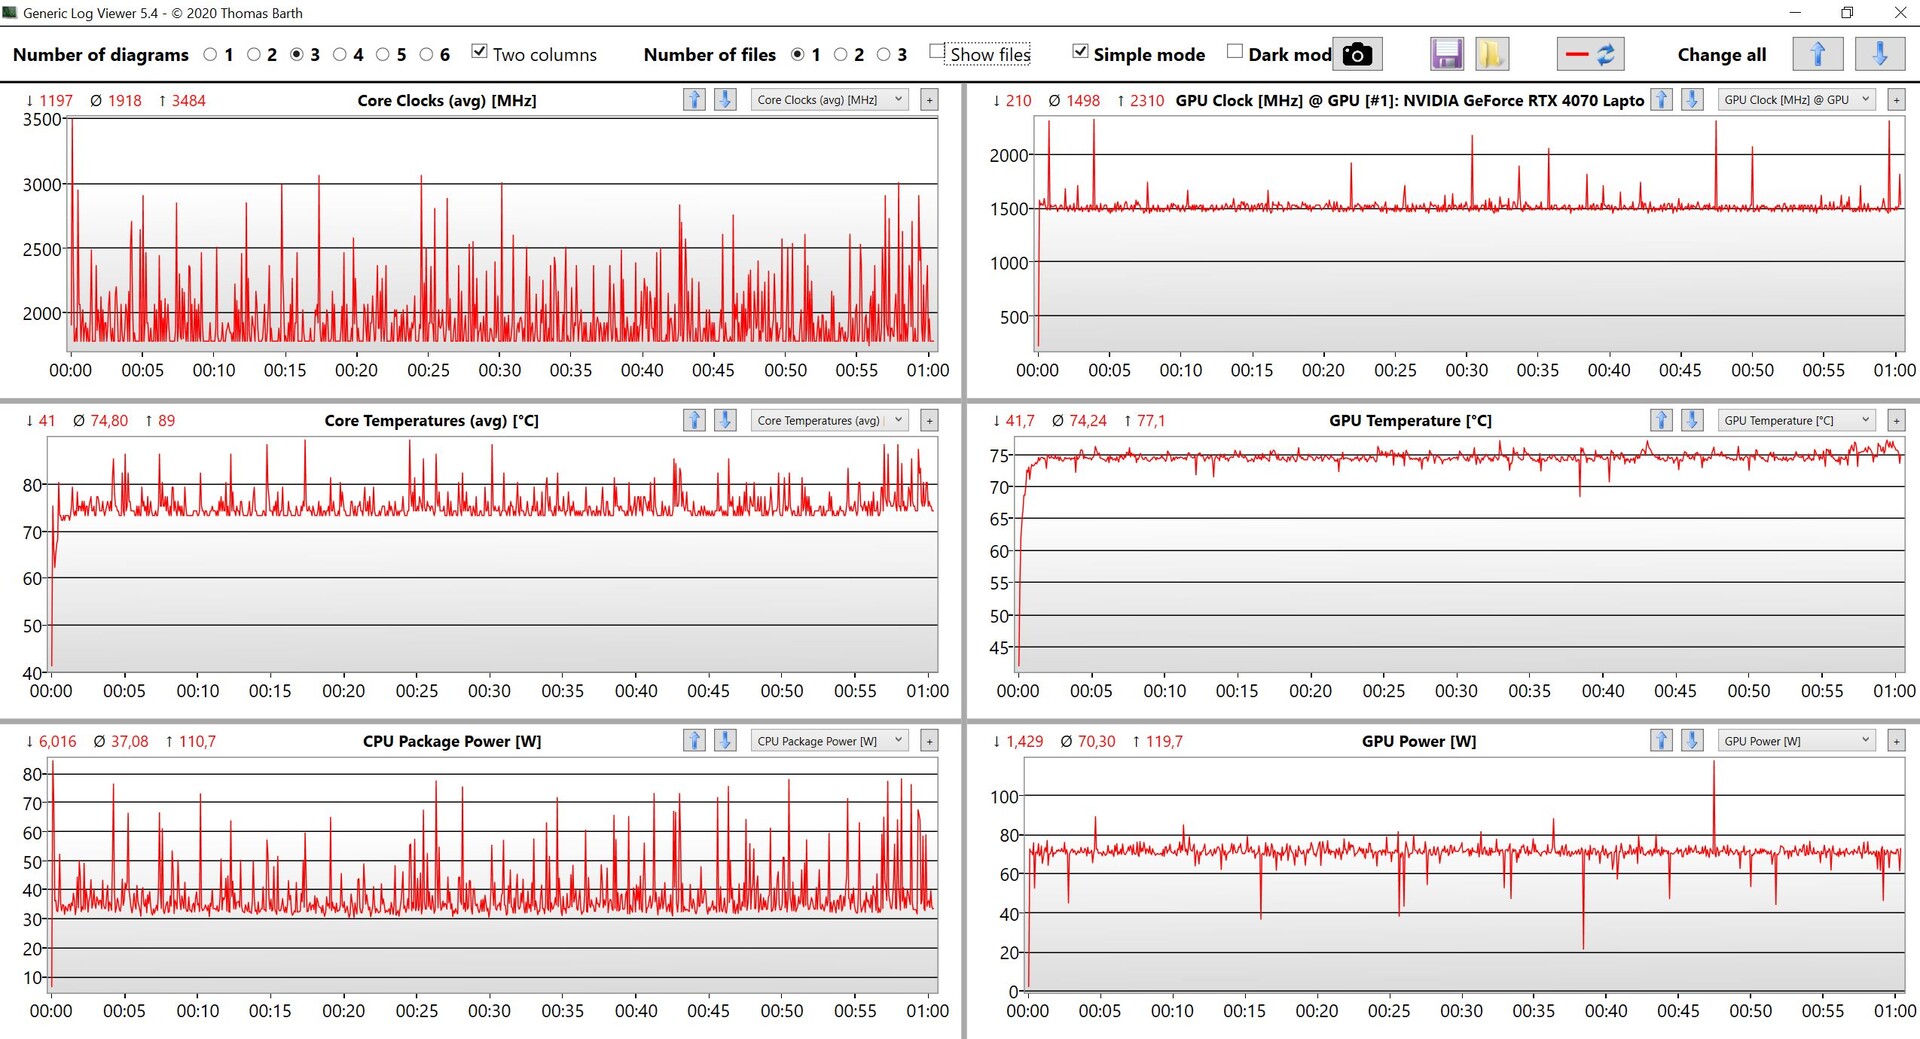
Los ventiladores suelen desactivarse en inactivo o durante tareas ligeras, pero la carcasa se calienta un poco a unos 30 °C en algunos sitios. No obstante, Asus tiene las temperaturas bajo carga bien controladas porque el área del teclado permanece inofensiva con un máximo de 42 °C en el test de estrés y durante los juegos. En la parte inferior, hay un punto caliente que alcanza un máximo de 51 °C en la zona central trasera, por lo que deberías evitar el contacto directo con la piel aquí
La tarjeta gráfica se estabiliza en torno a los 75 vatios en el test de estrés y se mantiene en este valor. El procesador es un poco más errático y suele rondar los 35 vatios con constantes picos cortos al alza.
(±) La temperatura máxima en la parte superior es de 40.6 °C / 105 F, frente a la media de 36.8 °C / 98 F, que oscila entre 21 y 71 °C para la clase Multimedia.
(-) El fondo se calienta hasta un máximo de 49.5 °C / 121 F, frente a la media de 39.1 °C / 102 F
(+) En reposo, la temperatura media de la parte superior es de 27.1 °C / 81# F, frente a la media del dispositivo de 31.3 °C / 88 F.
(±) Jugando a The Witcher 3, la temperatura media de la parte superior es de 36.3 °C / 97 F, frente a la media del dispositivo de 31.3 °C / 88 F.
(+) El reposamanos y el panel táctil están a una temperatura inferior a la de la piel, con un máximo de 30.5 °C / 86.9 F y, por tanto, son fríos al tacto.
(±) La temperatura media de la zona del reposamanos de dispositivos similares fue de 28.7 °C / 83.7 F (-1.8 °C / -3.2 F).
| Asus Zenbook Pro 14 OLED UX6404VI Intel Core i9-13900H, NVIDIA GeForce RTX 4070 Laptop GPU | Asus ZenBook Pro 14 Duo UX8402VV-P1021W Intel Core i9-13900H, NVIDIA GeForce RTX 4060 Laptop GPU | Apple MacBook Pro 14 2023 M2 Pro Apple M2 Pro, Apple M2 Pro 19-Core GPU | Asus ROG Zephyrus G14 GA402XY AMD Ryzen 9 7940HS, NVIDIA GeForce RTX 4090 Laptop GPU | Dell XPS 15 9530 RTX 4070 Intel Core i7-13700H, NVIDIA GeForce RTX 4070 Laptop GPU | Razer Blade 15 OLED (Early 2022) Intel Core i9-12900H, NVIDIA GeForce RTX 3070 Ti Laptop GPU | |
|---|---|---|---|---|---|---|
| Heat | -1% | 14% | 2% | -7% | -13% | |
| Maximum Upper Side * (°C) | 40.6 | 37.1 9% | 46.9 -16% | 47 -16% | 45.6 -12% | 49.5 -22% |
| Maximum Bottom * (°C) | 49.5 | 49.4 -0% | 41.7 16% | 46.5 6% | 42 15% | 47.5 4% |
| Idle Upper Side * (°C) | 28.2 | 30 -6% | 21.4 24% | 25.9 8% | 34.4 -22% | 33.4 -18% |
| Idle Bottom * (°C) | 30.6 | 32.4 -6% | 21.4 30% | 28 8% | 33.2 -8% | 35 -14% |
* ... más pequeño es mejor
Altavoces
Los altavoces ofrecen una buena calidad de sonido en general. Sólo los graves podrían ser un poco más potentes. Aunque son adecuados para vídeos ocasionales y algo de música, es preferible usar auriculares para jugar debido a los ventiladores.
Asus Zenbook Pro 14 OLED UX6404VI análisis de audio
(±) | la sonoridad del altavoz es media pero buena (78.9 dB)
Graves 100 - 315 Hz
(±) | lubina reducida - en promedio 10.7% inferior a la mediana
(±) | la linealidad de los graves es media (9.4% delta a frecuencia anterior)
Medios 400 - 2000 Hz
(+) | medios equilibrados - a sólo 1.2% de la mediana
(+) | los medios son lineales (4.1% delta a la frecuencia anterior)
Altos 2 - 16 kHz
(+) | máximos equilibrados - a sólo 4.3% de la mediana
(+) | los máximos son lineales (4.8% delta a la frecuencia anterior)
Total 100 - 16.000 Hz
(+) | el sonido global es lineal (11.4% de diferencia con la mediana)
En comparación con la misma clase
» 18% de todos los dispositivos probados de esta clase eran mejores, 4% similares, 78% peores
» El mejor tuvo un delta de 5%, la media fue 17%, el peor fue ###max##%
En comparación con todos los dispositivos probados
» 7% de todos los dispositivos probados eran mejores, 2% similares, 90% peores
» El mejor tuvo un delta de 4%, la media fue 23%, el peor fue ###max##%
Apple MacBook Pro 14 2023 M2 Pro análisis de audio
(+) | los altavoces pueden reproducir a un volumen relativamente alto (#84.3 dB)
Graves 100 - 315 Hz
(+) | buen bajo - sólo 3.8% lejos de la mediana
(+) | el bajo es lineal (6.9% delta a la frecuencia anterior)
Medios 400 - 2000 Hz
(+) | medios equilibrados - a sólo 2.1% de la mediana
(+) | los medios son lineales (2.2% delta a la frecuencia anterior)
Altos 2 - 16 kHz
(+) | máximos equilibrados - a sólo 2.7% de la mediana
(+) | los máximos son lineales (4.8% delta a la frecuencia anterior)
Total 100 - 16.000 Hz
(+) | el sonido global es lineal (6% de diferencia con la mediana)
En comparación con la misma clase
» 3% de todos los dispositivos probados de esta clase eran mejores, 0% similares, 97% peores
» El mejor tuvo un delta de 5%, la media fue 17%, el peor fue ###max##%
En comparación con todos los dispositivos probados
» 0% de todos los dispositivos probados eran mejores, 0% similares, 100% peores
» El mejor tuvo un delta de 4%, la media fue 23%, el peor fue ###max##%
Gestión de la energía: el OLED de 120 Hz consume mucha energía
Consumo de energía
El consumo de energía de las pantallas OLED depende en gran medida del contenido mostrado. Medimos un máximo de algo menos de 12 vatios en reposo con el fondo estándar oscuro, pero puede aumentar aún más en presencia de imágenes brillantes. En cuanto se ven contenidos HDR, el consumo aumenta hasta los 28 vatios. Registramos hasta 208 vatios durante un breve periodo de tiempo en el test de estrés, pero esto se niveló rápidamente a ~140 vatios (también se aplica a los juegos). En general, la fuente de alimentación de 200w es suficiente.
| Off / Standby | |
| Ocioso | |
| Carga |
|
Clave:
min: | |
| Asus Zenbook Pro 14 OLED UX6404VI i9-13900H, GeForce RTX 4070 Laptop GPU, Micron 3400 2TB MTFDKBA2T0TFH, OLED, 2880x1800, 14.5" | Asus ZenBook Pro 14 Duo UX8402VV-P1021W i9-13900H, GeForce RTX 4060 Laptop GPU, Samsung PM9A1 MZVL22T0HBLB, OLED, 2880x1800, 14.5" | Apple MacBook Pro 14 2023 M2 Pro M2 Pro, M2 Pro 19-Core GPU, Apple SSD AP2048Z, Mini-LED, 3024x1964, 14.2" | Asus ROG Zephyrus G14 GA402XY R9 7940HS, GeForce RTX 4090 Laptop GPU, Samsung PM9A1 MZVL21T0HCLR, Mini-LED, 2560x1600, 14" | Dell XPS 15 9530 RTX 4070 i7-13700H, GeForce RTX 4070 Laptop GPU, SK hynix PC801 HFS001TEJ9X101N, OLED, 3456x2160, 15.6" | Razer Blade 15 OLED (Early 2022) i9-12900H, GeForce RTX 3070 Ti Laptop GPU, Samsung PM9A1 MZVL21T0HCLR, OLED, 2560x1440, 15.6" | Medio NVIDIA GeForce RTX 4070 Laptop GPU | Media de la clase Multimedia | |
|---|---|---|---|---|---|---|---|---|
| Power Consumption | 2% | 35% | -17% | -44% | -134% | -53% | 20% | |
| Idle Minimum * (Watt) | 7.5 | 8.5 -13% | 2.4 68% | 9.4 -25% | 20 -167% | 31.6 -321% | 13.2 ? -76% | 5.66 ? 25% |
| Idle Average * (Watt) | 11.1 | 8.8 21% | 11.3 -2% | 14.2 -28% | 20.7 -86% | 33.3 -200% | 18.2 ? -64% | 10.2 ? 8% |
| Idle Maximum * (Watt) | 11.6 | 16.5 -42% | 11.5 1% | 14.5 -25% | 22.4 -93% | 38.6 -233% | 24.6 ? -112% | 12.5 ? -8% |
| Load Average * (Watt) | 91.9 | 102 -11% | 59.6 35% | 79 14% | 77.1 16% | 149 -62% | 97 ? -6% | 65.2 ? 29% |
| Witcher 3 ultra * (Watt) | 132.2 | 101.2 23% | 55.9 58% | 172 -30% | 95.4 28% | 149.6 -13% | ||
| Load Maximum * (Watt) | 208 | 140 33% | 100 52% | 220.8 -6% | 133.4 36% | 160 23% | 221 ? -6% | 113.5 ? 45% |
* ... más pequeño es mejor
Power consumption Witcher 3 / Stress test
Power consumption with an external monitor
Duración de la batería
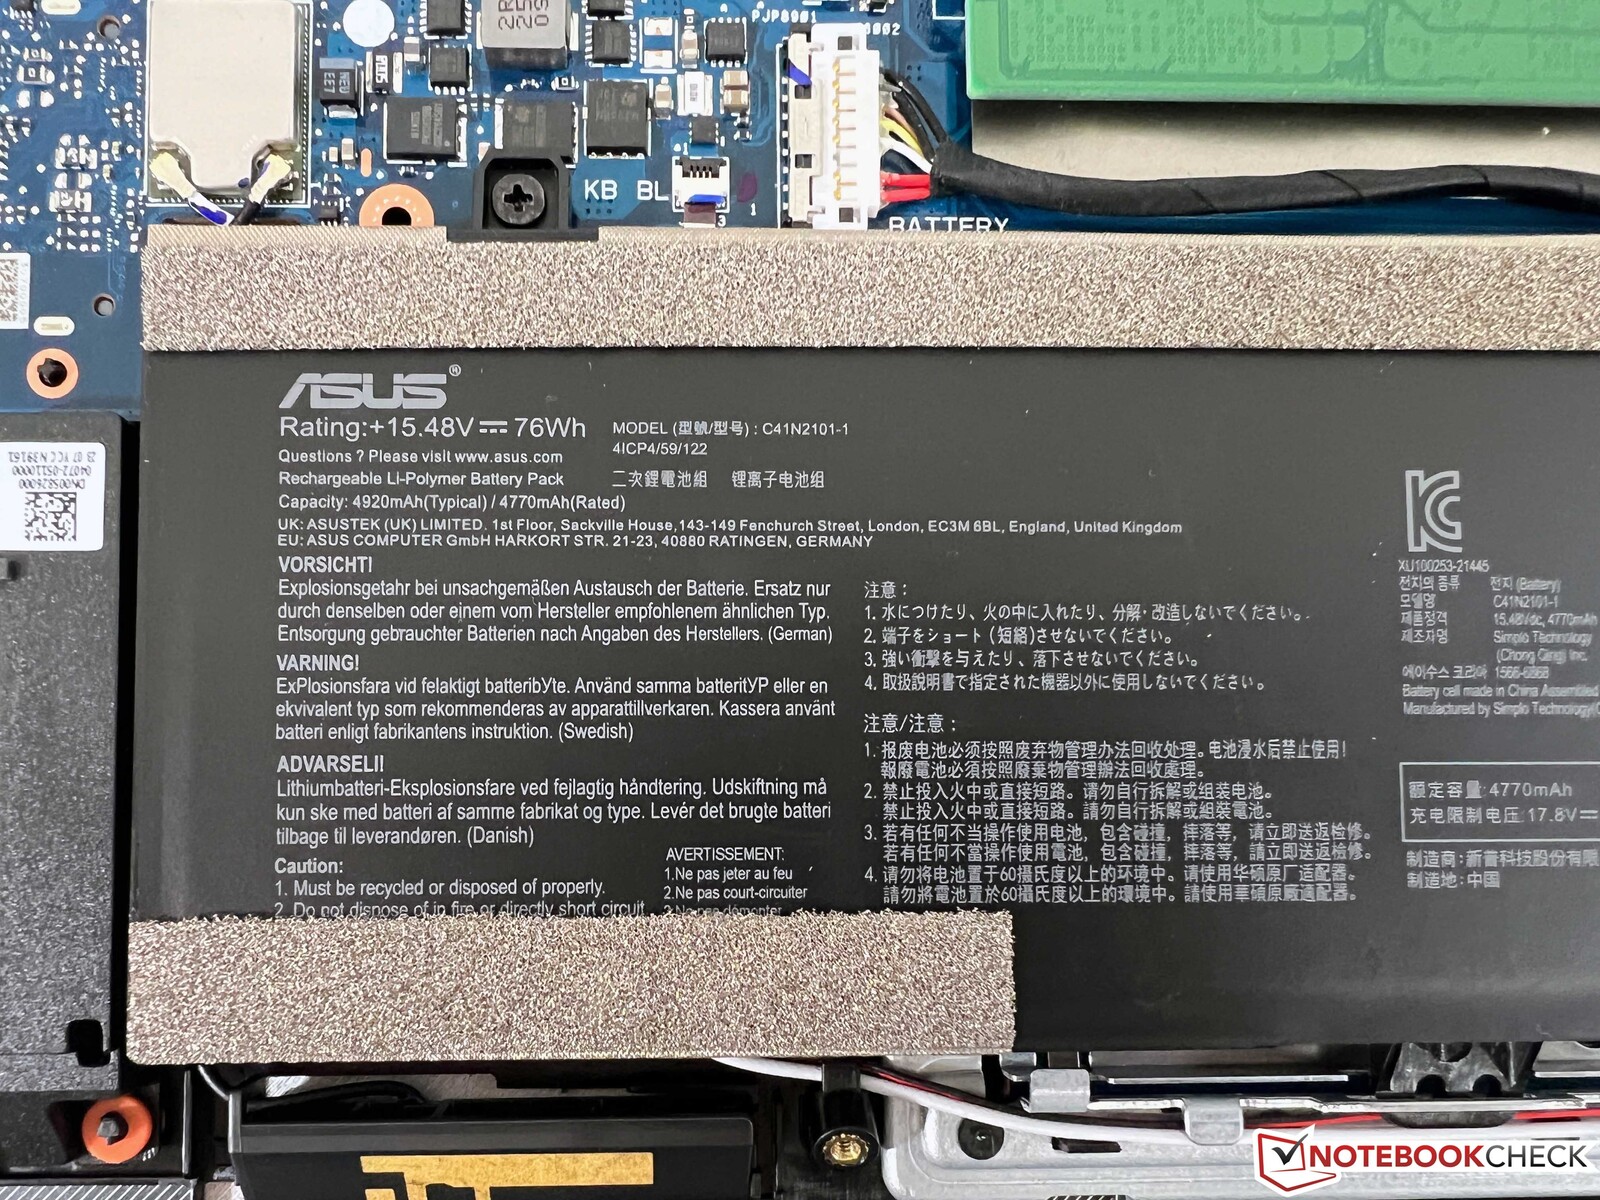
La batería de 76 Wh sólo ofrece duraciones medias porque la pantalla OLED necesita mucha energía. Realizamos las pruebas a 60 Hz (para 120 Hz puedes restar media hora). La reproducción de vídeo a 150 cd/m² (correspondiente al 73% del brillo SDR máximo del dispositivo de pruebas) duró unas decentes 8,5 horas, pero sólo 7,5 horas en el test WLAN o algo menos de 6 horas a brillo máximo. Un vídeo HDR de YouTube a brillo máximo agota la batería en 3,5 horas. El MacBook Pro 14 dura bastante más en todos los aspectos.
Una carga completa tarda unos 105 minutos cuando el dispositivo está encendido; el 50% de la capacidad está disponible tras menos de media hora.
| Asus Zenbook Pro 14 OLED UX6404VI i9-13900H, GeForce RTX 4070 Laptop GPU, 76 Wh | Apple MacBook Pro 14 2023 M2 Pro M2 Pro, M2 Pro 19-Core GPU, 70 Wh | Asus ROG Zephyrus G14 GA402XY R9 7940HS, GeForce RTX 4090 Laptop GPU, 76 Wh | Dell XPS 15 9530 RTX 4070 i7-13700H, GeForce RTX 4070 Laptop GPU, 86 Wh | Razer Blade 15 OLED (Early 2022) i9-12900H, GeForce RTX 3070 Ti Laptop GPU, 80 Wh | Media de la clase Multimedia | |
|---|---|---|---|---|---|---|
| Duración de Batería | 59% | -5% | 28% | 13% | 76% | |
| H.264 (h) | 8.5 | 15.3 80% | 7.2 -15% | 5.9 -31% | 17.1 ? 101% | |
| WiFi v1.3 (h) | 7.6 | 13.5 78% | 7.5 -1% | 8 5% | 4.6 -39% | 12.2 ? 61% |
| Load (h) | 1 | 1.2 20% | 1 0% | 1.5 50% | 2.1 110% | 1.664 ? 66% |
Pro
Contra
Veredicto - El Zenbook Pro 14 ofrece mucho rendimiento, pero tiene que hacer algunas concesiones
El nuevo Zenbook Pro 14 de Asus es un potente dispositivo de 14 pulgadas dirigido a usuarios creativos, por lo que compite directamente con el Apple MacBook Pro 14. De ahí que el fabricante instale los últimos componentes de Intel y Nvidia: tanto el Core i9-13900H como el GeForce Portátil RTX 4070 ofrecen mucho rendimiento para un dispositivo tan compacto. El Zenbook también ofrece bastante más rendimiento que portátiles multimedia más grandes como el nuevo XPS 15 de Dell de Dell.
Como display se usa una pantalla OLED con 120 Hz. La calidad de imagen subjetiva es muy buena en general, pero las áreas brillantes aparecen ligeramente granuladas debido a la pantalla táctil. Además, se usa PMW a partir de un brillo del 50% e inferior. Como en otros portátiles OLED de Asus, hay una característica software que permite atenuar el OLED sin PWM, pero los usuarios tienen que activarla por software cada vez. Los distintos perfiles de color son muy buenos; el Display P3 en particular es extremadamente preciso y no requiere calibración posterior. Sin embargo, los perfiles de color no están disponibles en modo HDR, y la función HDR simplemente funciona mucho mejor en el Apple MacBook Pro y su panel mini-LED también logra valores de brillo significativamente superiores.
La atención se centra en el rendimiento: Gracias al Intel Core i9-13900H y a la GPU Nvidia GeForce RTX 4070 Laptop, el nuevo Zenbook Pro es un portátil de 14 pulgadas muy rápido. Sin embargo, la pantalla OLED lucha con una calidad de imagen mínimamente granulada y también hay que hacer concesiones en términos de duración de la batería.
El dispositivo es notablemente más voluminoso que muchos otros portátiles de 14 pulgadas, pero los componentes se refrigeran bastante bien y hay suficientes puertos. El fabricante también disimula muy bien el grosor de la carcasa gracias a la unidad base cónica. Sin embargo, para obtener todo el rendimiento de la GeForce RTX 4070, los usuarios tienen que activar el modo Rendimiento , en el que los ventiladores se vuelven notablemente más ruidosos.
El teclado tampoco pasa de la media, lo que resulta un poco decepcionante teniendo en cuenta el elevado precio de compra. El DialPad adicional en la parte superior izquierda del touchpad también es más bien un truco. La implementación de las apps de Adobe funciona muy bien, pero al final, los atajos y las combinaciones de teclas funcionan más rápido. Por defecto, el brillo de la pantalla y el volumen también se pueden ajustar usando el DialPad, pero esto también funciona mucho más rápido con las teclas especiales dedicadas. Otro inconveniente es la duración de la batería (especialmente con 120 Hz activados), por no mencionar el precio, que en nuestro caso asciende a la friolera de 3.500 euros.
Un gran competidor es, por supuesto, el Apple MacBook Pro 14que tiene desventajas en términos de rendimiento bruto de CPU y GPU, pero es el mejor portátil en general. Además, el MacBook no es una opción ideal si también quieres usar el portátil para juegos actuales. Otro competidor interesante viene de la propia Asus: Aunque el ROG Zephyrus G14 es principalmente una máquina de juegos, también puede usarse igual de bien para fines creativos (también disponible con la GPU RTX 4070 para portátiles). El panel mate mini-LED o IPS (dependiendo de la configuración) incluso confiere algunas ventajas sobre la pantalla OLED.
Precio y disponibilidad
La disponibilidad mundial del Asus Zenbook Pro 14 OLED parece limitada. El portátil tiene un precio de 1.799,99 $ en la tienda de Asus, pero actualmente está agotado.
Los precios y la disponibilidad son a fecha de 12.06.2023 y están sujetos a cambios.
Asus Zenbook Pro 14 OLED UX6404VI
- 06/09/2023 v7 (old)
Andreas Osthoff
Transparencia
La selección de los dispositivos que se van a reseñar corre a cargo de nuestro equipo editorial. La muestra de prueba fue proporcionada al autor en calidad de préstamo por el fabricante o el minorista a los efectos de esta reseña. El prestamista no tuvo ninguna influencia en esta reseña, ni el fabricante recibió una copia de la misma antes de su publicación. No había ninguna obligación de publicar esta reseña. Como empresa de medios independiente, Notebookcheck no está sujeta a la autoridad de fabricantes, minoristas o editores.
Así es como prueba Notebookcheck
Cada año, Notebookcheck revisa de forma independiente cientos de portátiles y smartphones utilizando procedimientos estandarizados para asegurar que todos los resultados son comparables. Hemos desarrollado continuamente nuestros métodos de prueba durante unos 20 años y hemos establecido los estándares de la industria en el proceso. En nuestros laboratorios de pruebas, técnicos y editores experimentados utilizan equipos de medición de alta calidad. Estas pruebas implican un proceso de validación en varias fases. Nuestro complejo sistema de clasificación se basa en cientos de mediciones y puntos de referencia bien fundamentados, lo que mantiene la objetividad.Price comparison

