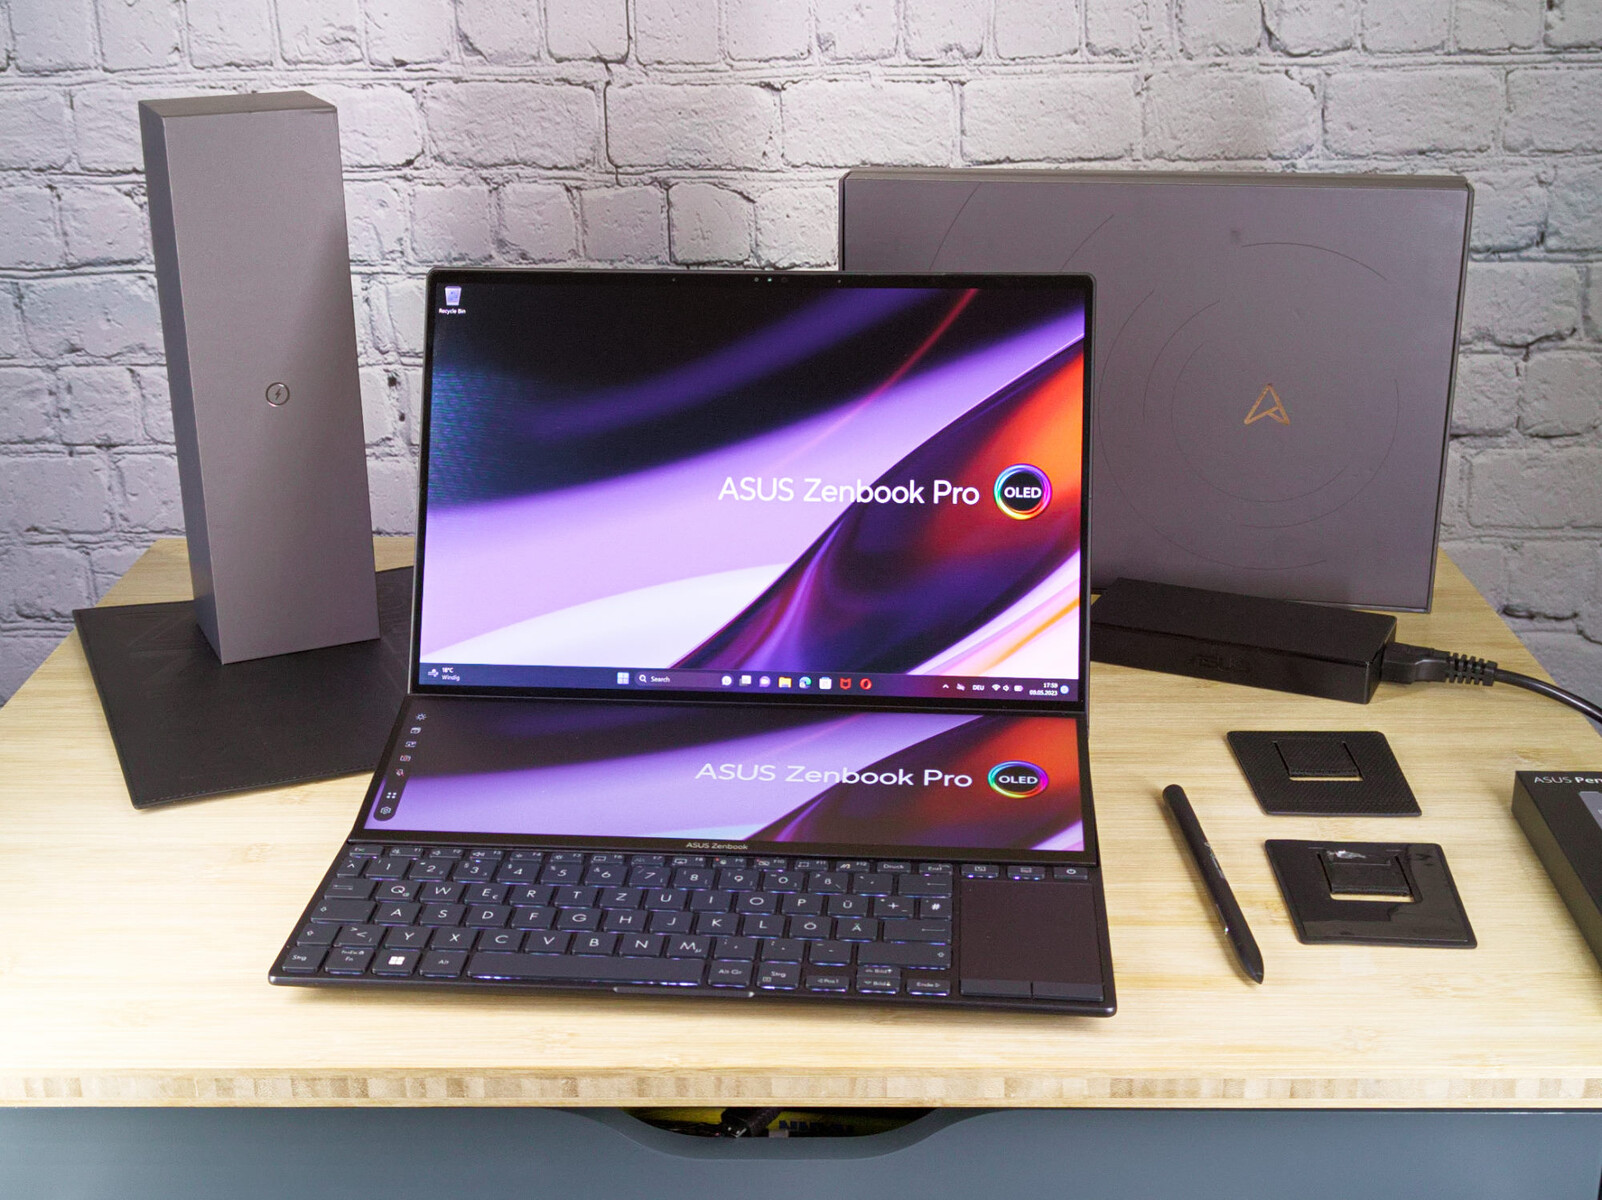
Análisis del portátil Asus ZenBook Pro 14 Duo con segunda pantalla para creativos: Mayor productividad
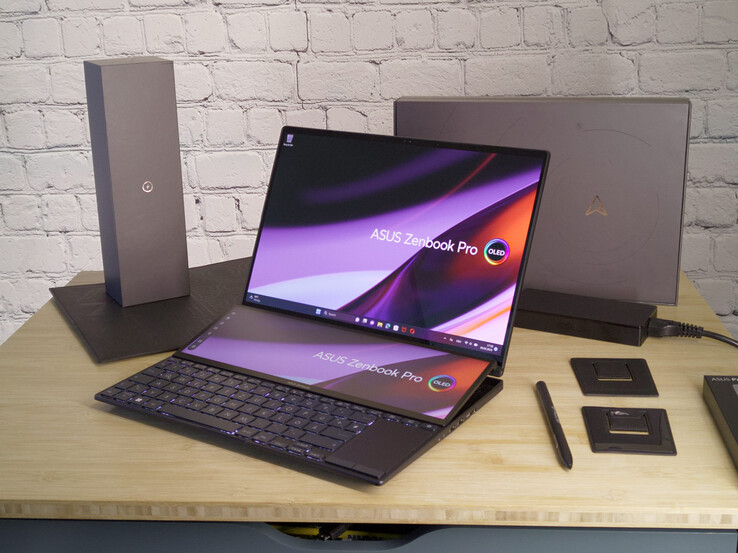
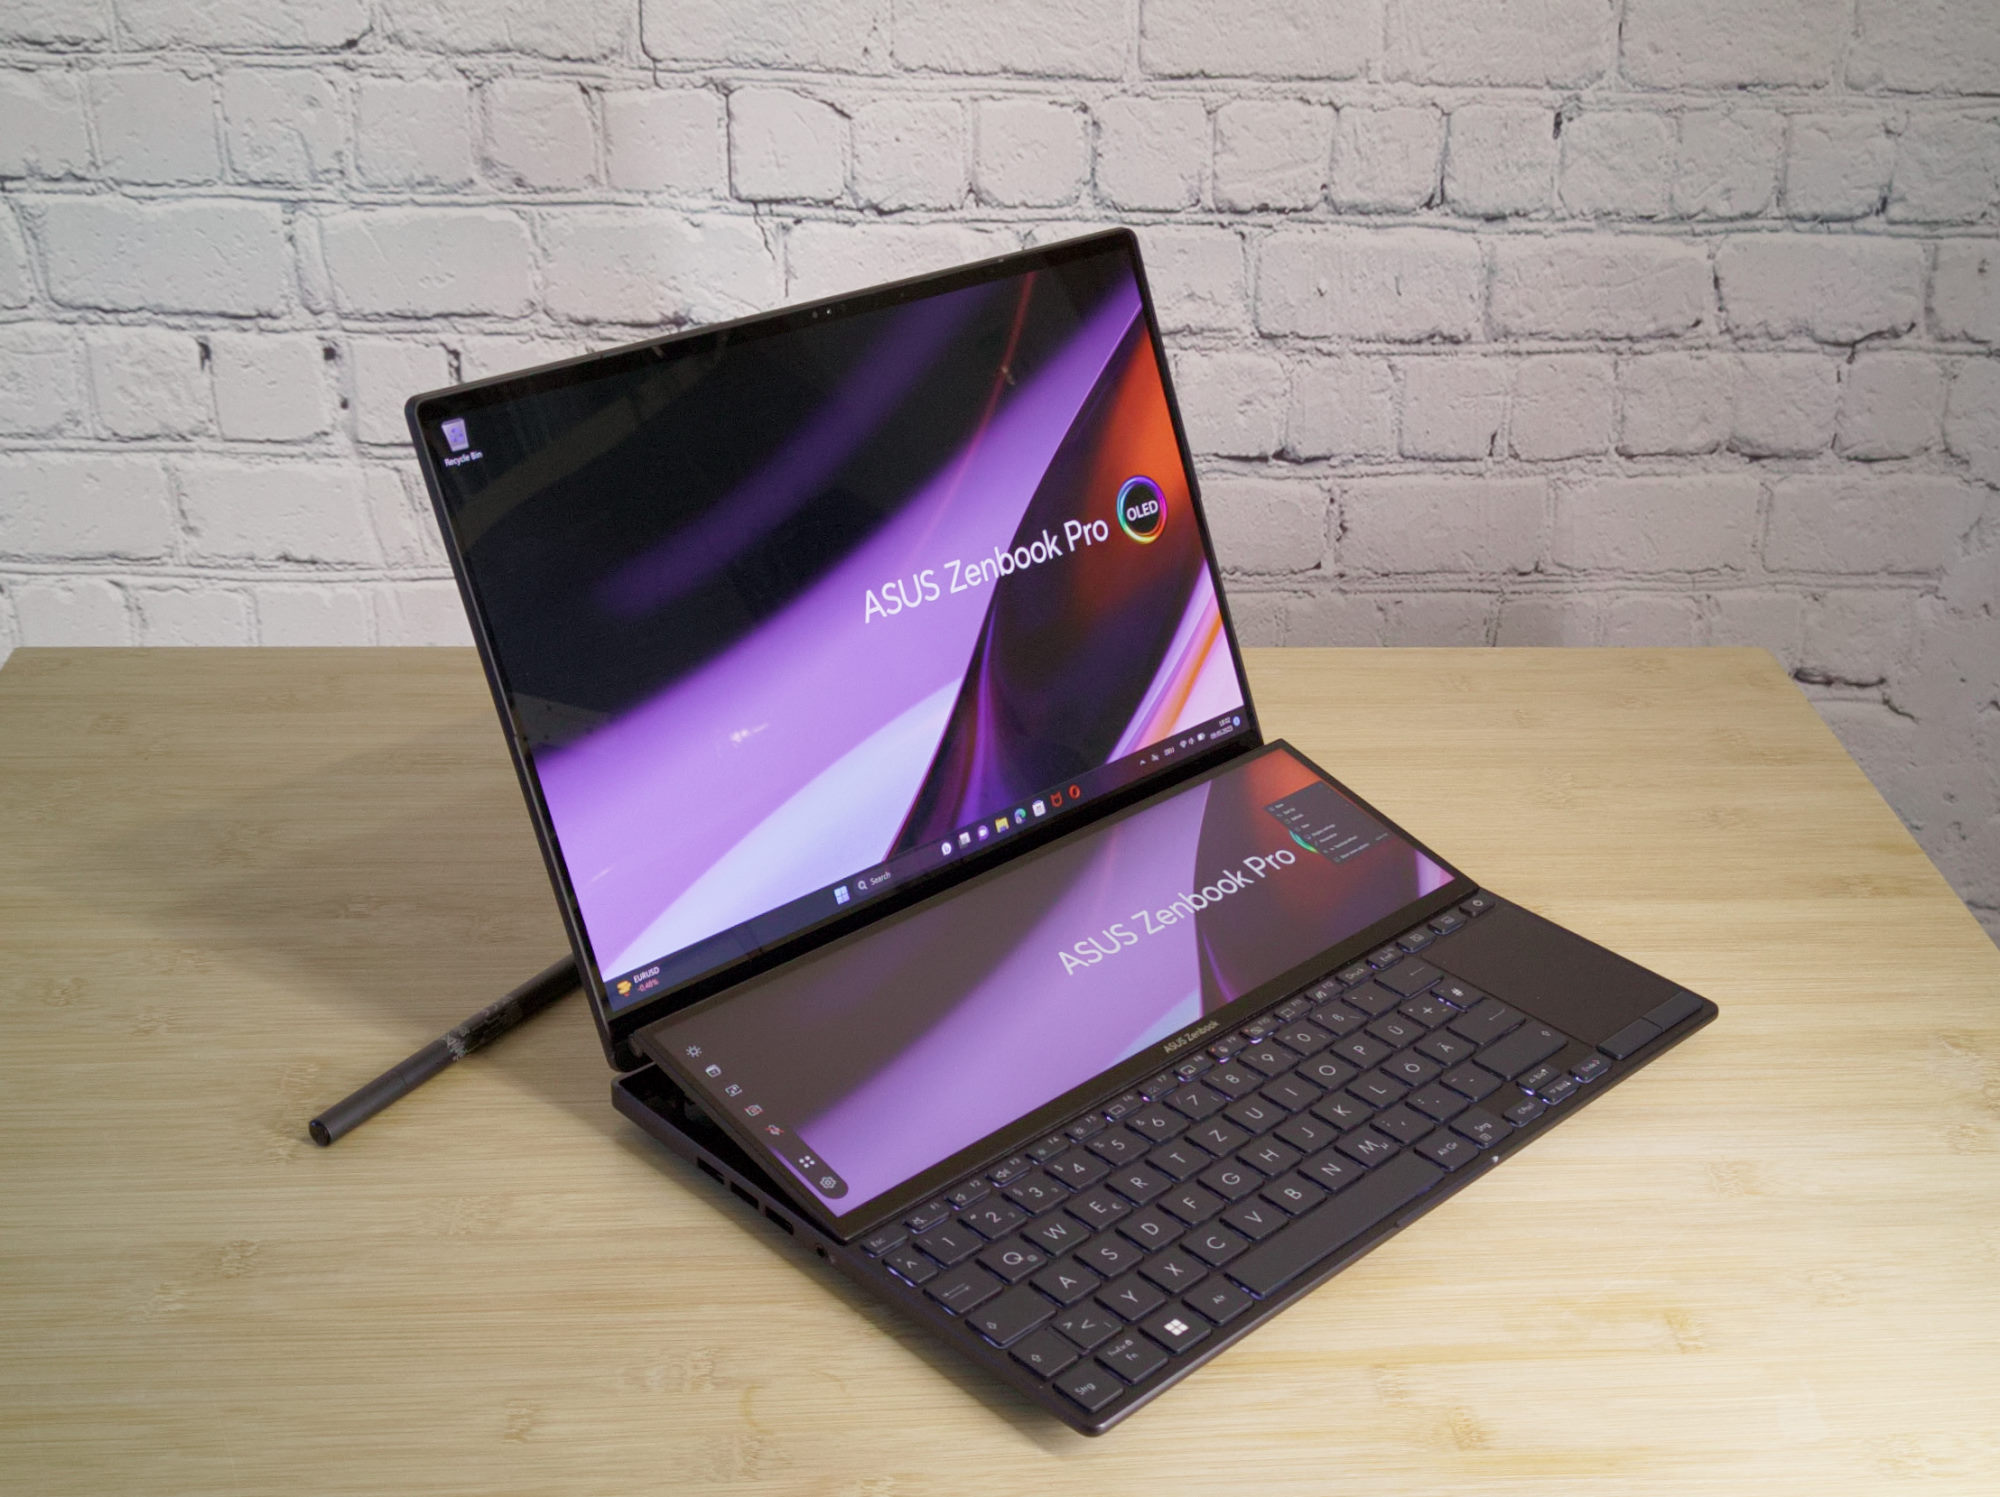
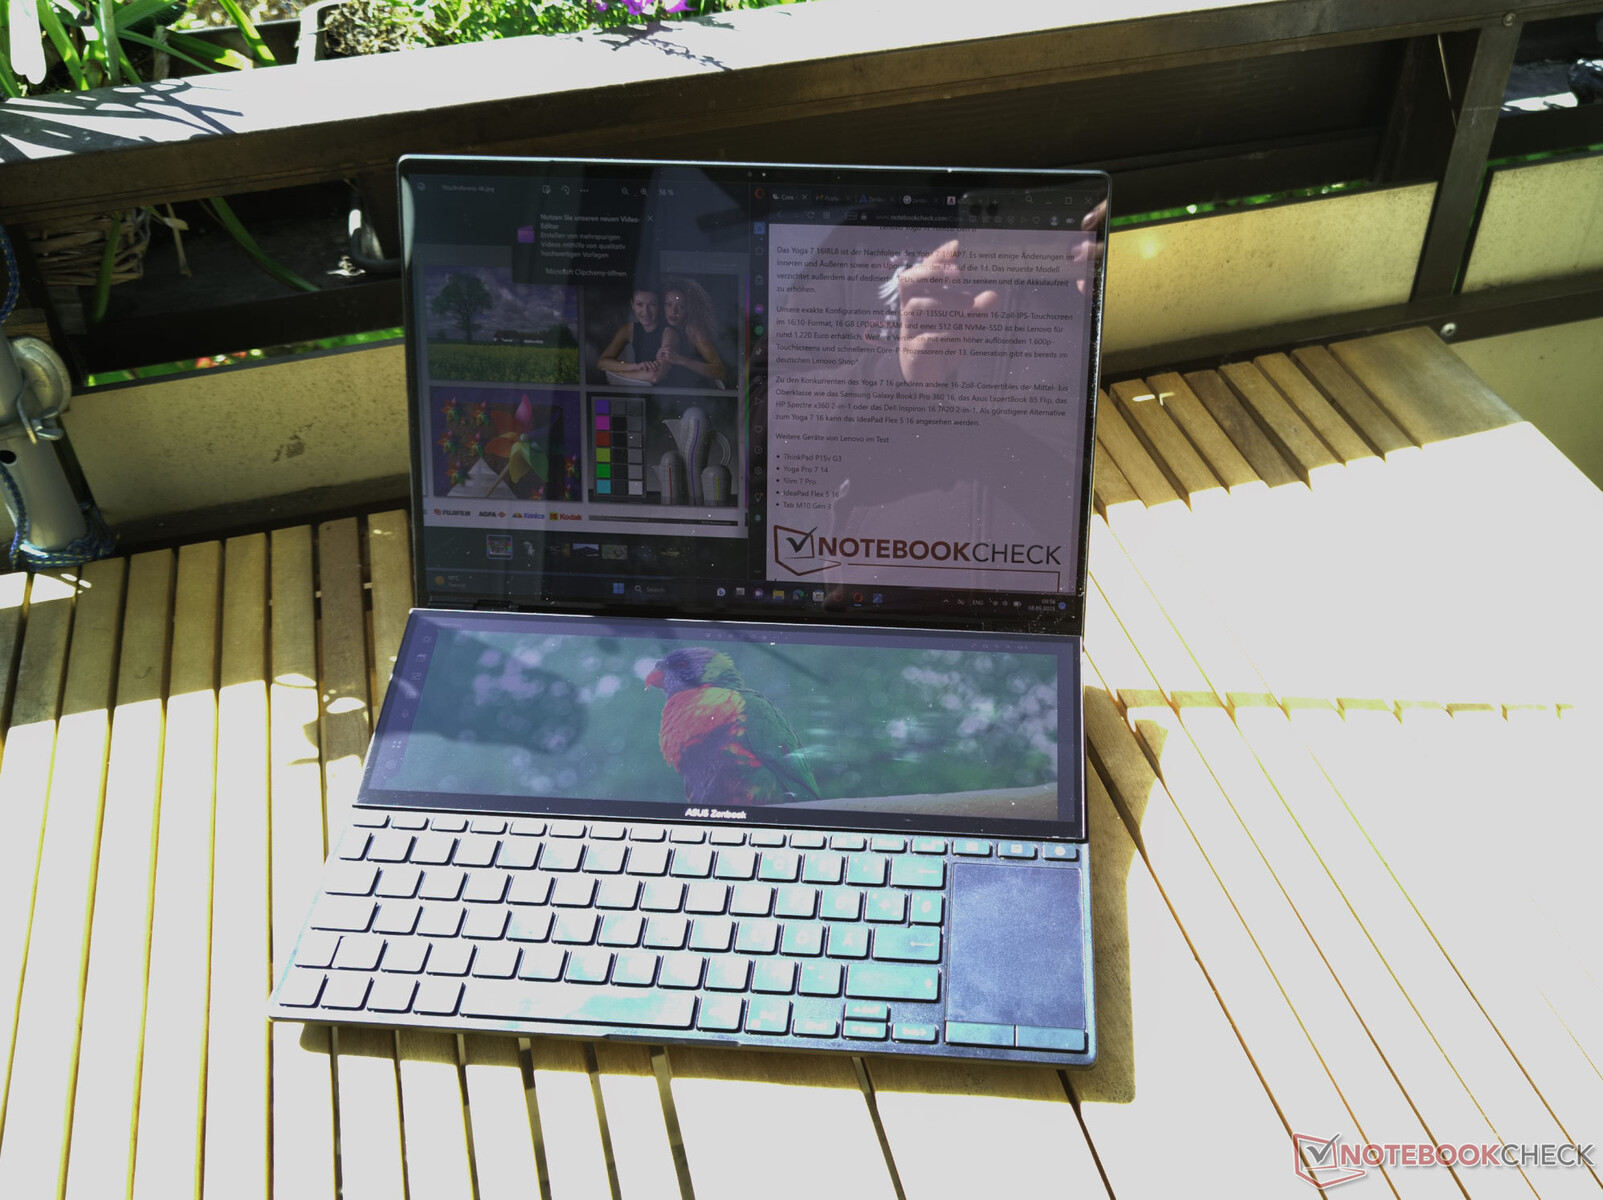
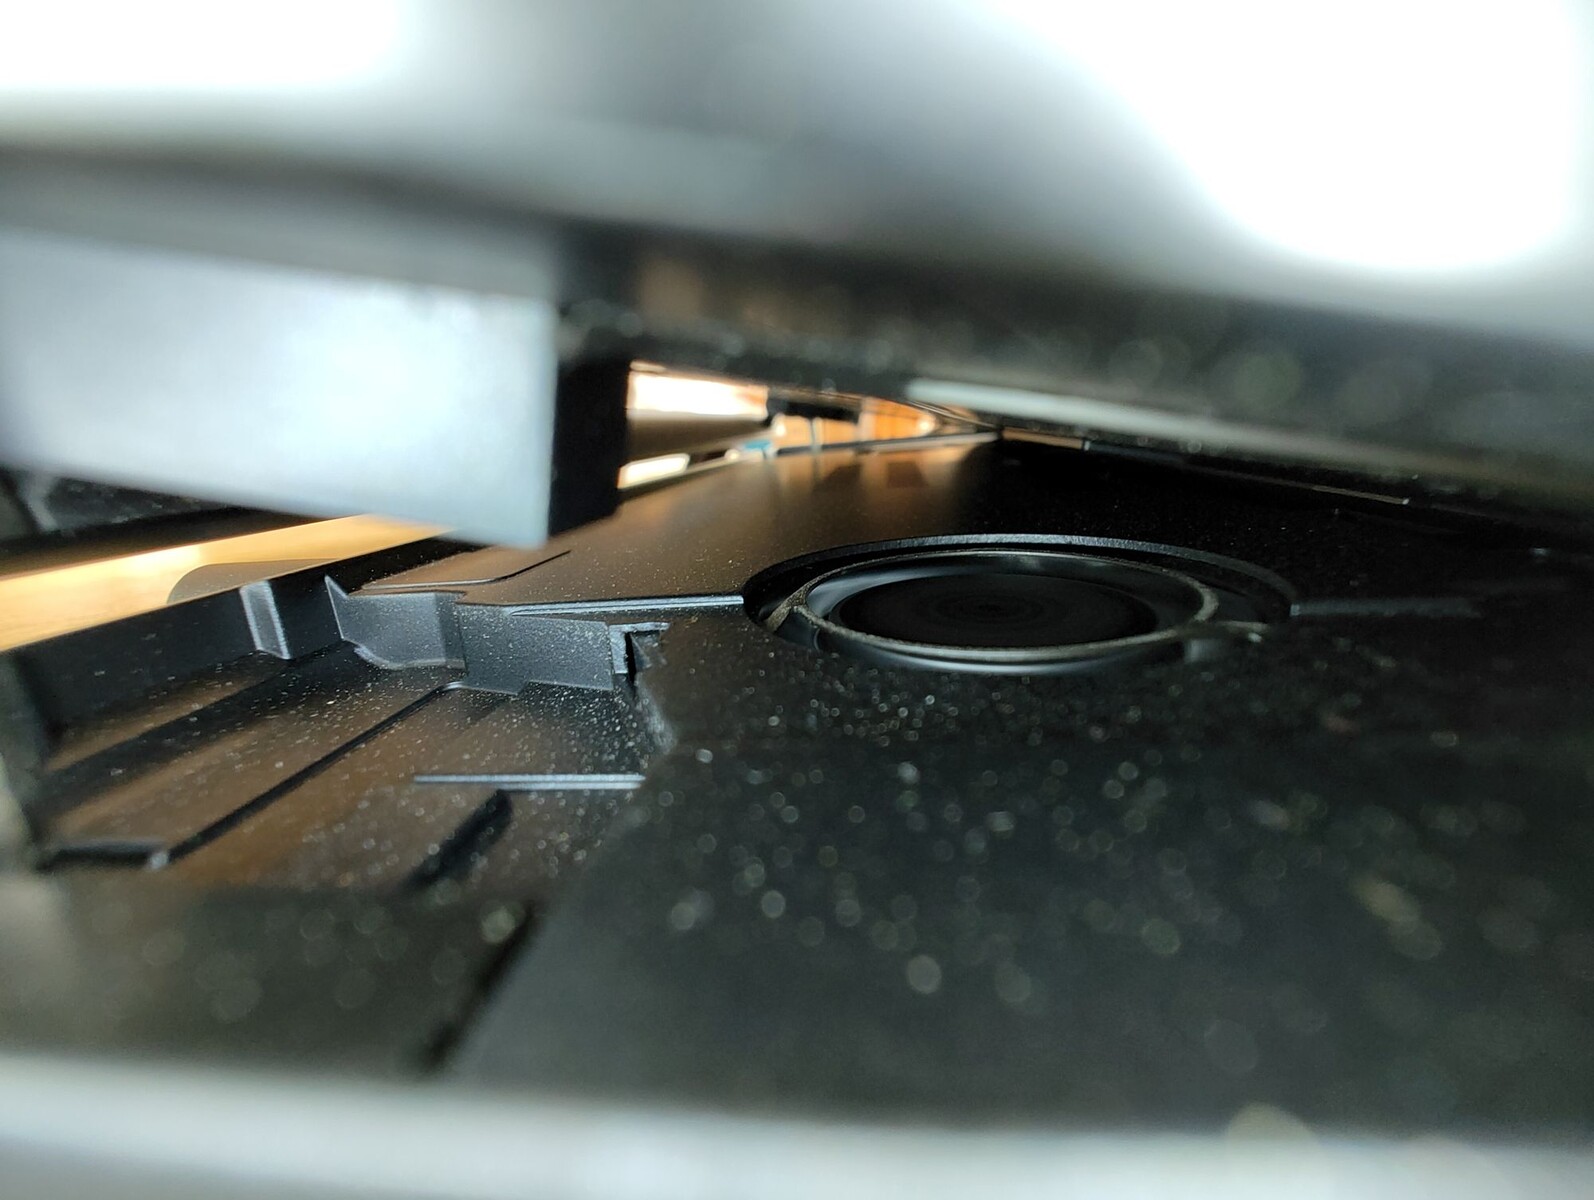
¡Con la segunda se ve mejor! Así es como nuestro vídeo de YouTube sobre el Asus ROG Zephyrus Duo 16 . Pero el portátil para juegos no es el único dispositivo de Asus con una segunda pantalla. En lugar de un procesador AMD y RTX 4090el Asus Zenbook Pro 14 Duo utiliza un procesador Nvidia GeForce RTX 4060 y Intel Core i9-13900H. Ya hemos probado un Zenbook Pro 14 Duocon pantalla de 14,5 pulgadas el año pasado, pero entonces no tenía dGPU. Similar al teclado del Zenbook Pro 16Xque se puede plegar, la segunda pantalla plegable da acceso a los ventiladores del portátil a una corriente de aire más potente, lo que posiblemente lleve a una refrigeración más eficiente y, finalmente, a un mayor rendimiento del portátil.
Con la Nvida GeForce RTX 4060, el portátil se vuelve significativamente más productivo. La segunda pantalla invita a mover simplemente las barras de herramientas de muchos programas creativos a la parte inferior, dando así más área de visualización para las tareas esenciales.
Aunque el pequeño portátil puede ser único con su concepto de control operativo, hay muchos competidores en el área de los portátiles pequeños con potentes opciones de CPU y GPU. Por ejemplo, aunque el Gigabyte Aero 14 OLED y el Schenker Vision 14 son ligeramente más pequeños que el Zenbook en todos los aspectos, también son portátiles clásicos sin las ventajas y desventajas de una segunda pantalla. Si quieres un portátil de Asus, el Vivobook S 14X también podría ser interesante.
Posibles contendientes en la comparación
Valoración | Fecha | Modelo | Peso | Altura | Tamaño | Resolución | Precio |
|---|---|---|---|---|---|---|---|
| 87 % v7 (old) | 06/2023 | Asus ZenBook Pro 14 Duo UX8402VV-P1021W i9-13900H, GeForce RTX 4060 Laptop GPU | 1.8 kg | 21 mm | 14.50" | 2880x1800 | |
| 86 % v7 (old) | 11/2022 | Acer Predator Triton 300 SE i9-12900H, GeForce RTX 3060 Laptop GPU | 1.7 kg | 19.8 mm | 14.00" | 2880x1800 | |
| 90.2 % v7 (old) | 05/2023 | Lenovo Yoga Pro 7 14IRH G8 i7-13700H, GeForce RTX 4050 Laptop GPU | 1.5 kg | 15.6 mm | 14.50" | 3072x1920 | |
| 89.4 % v7 (old) | 05/2023 | Gigabyte Aero 14 OLED BMF i7-13700H, GeForce RTX 4050 Laptop GPU | 1.4 kg | 17 mm | 14.00" | 2880x1800 | |
| 88 % v7 (old) | 04/2023 | Asus Zephyrus Duo 16 GX650PY-NM006W R9 7945HX, GeForce RTX 4090 Laptop GPU | 2.7 kg | 29.7 mm | 16.00" | 2560x1600 | |
| 88.8 % v7 (old) | 10/2022 | Schenker Vision 14 2022 RTX 3050 Ti i7-12700H, GeForce RTX 3050 Ti Laptop GPU | 1.3 kg | 16.6 mm | 14.00" | 2880x1800 | |
| 84.4 % v7 (old) | 06/2022 | Asus Zenbook Pro 14 Duo OLED UX8402ZA i7-12700H, Iris Xe G7 96EUs | 1.7 kg | 19.6 mm | 14.50" | 2880x1800 | |
| 84.1 % v7 (old) | 07/2022 | Asus VivoBook S 14X S5402Z i7-12700H, Iris Xe G7 96EUs | 1.6 kg | 17.9 mm | 14.50" | 2880x1800 |
Caso - Refrigeración AAS debajo de la segunda pantalla
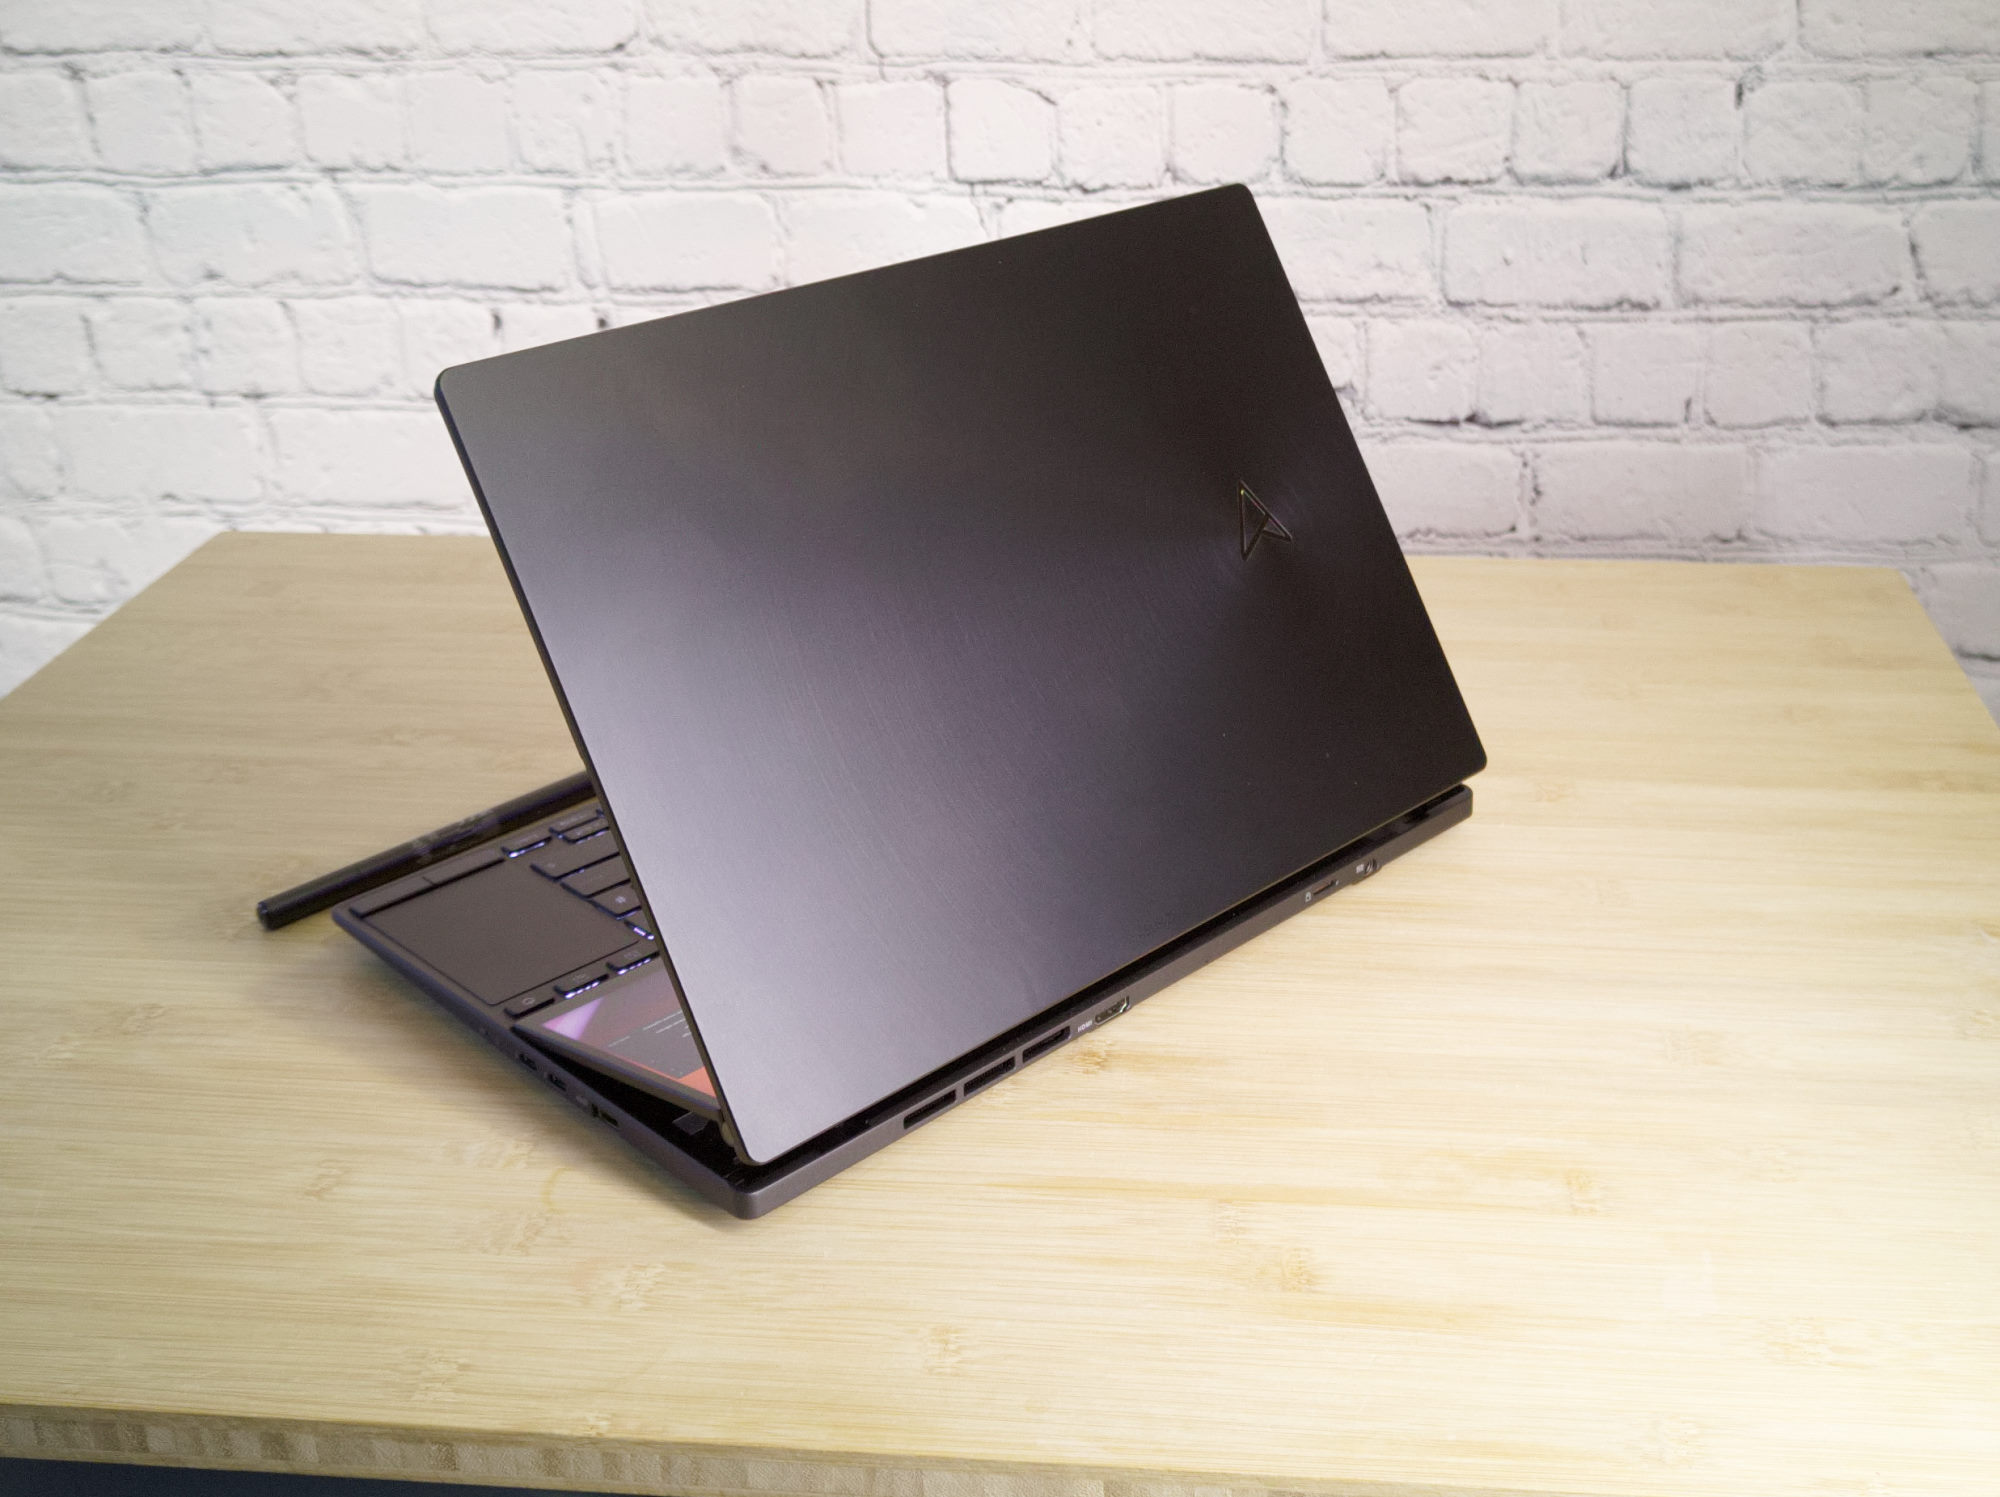
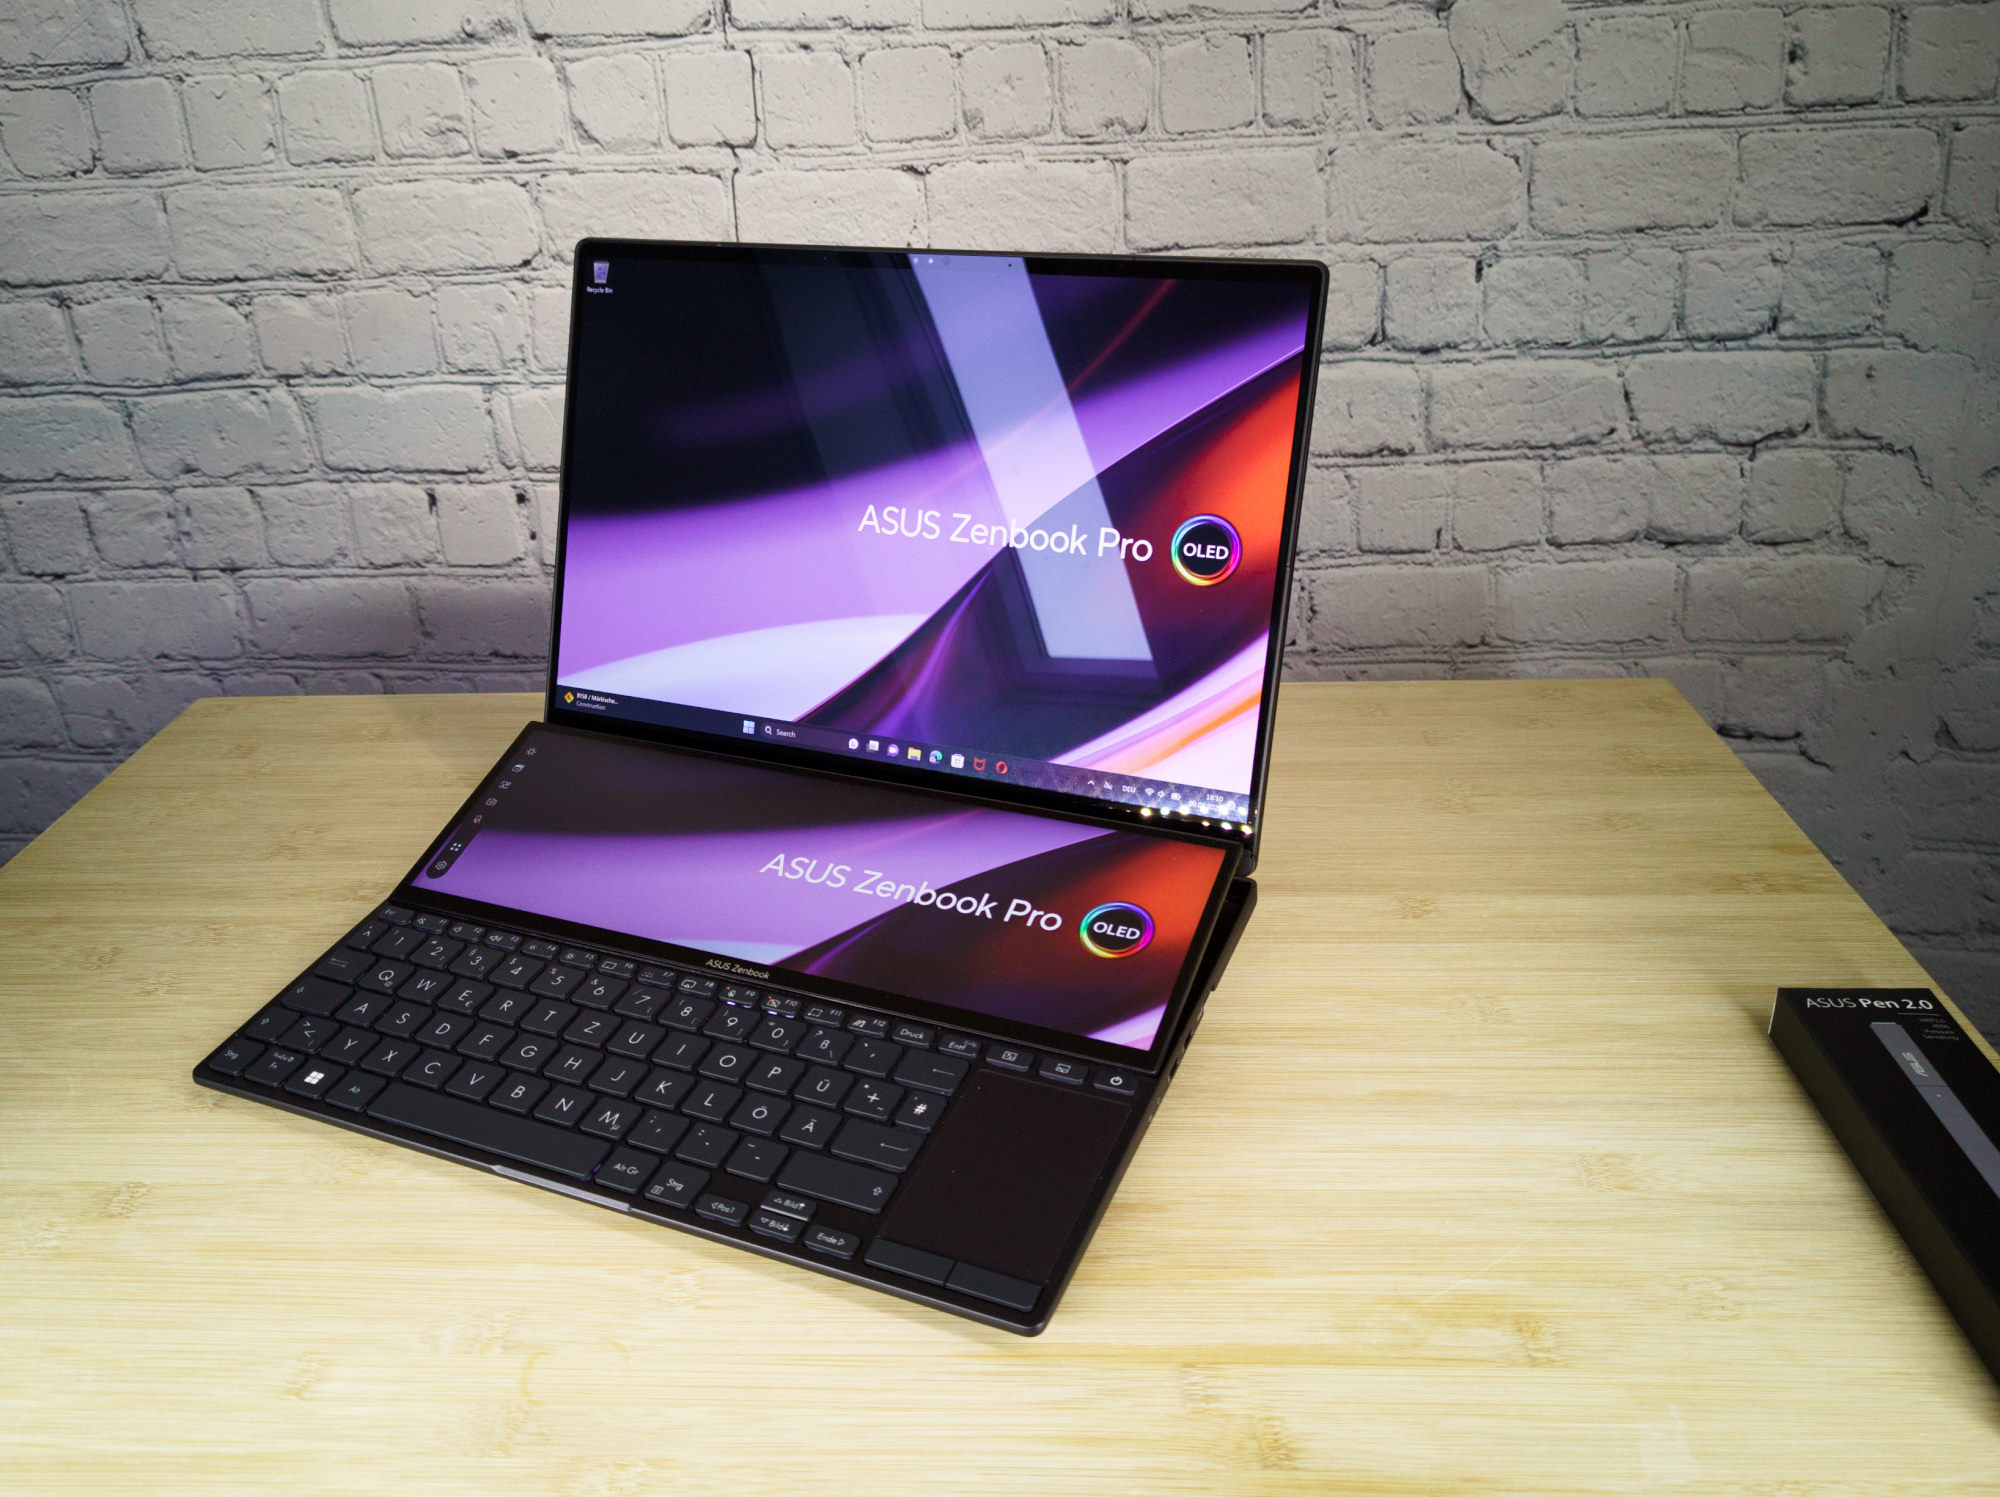
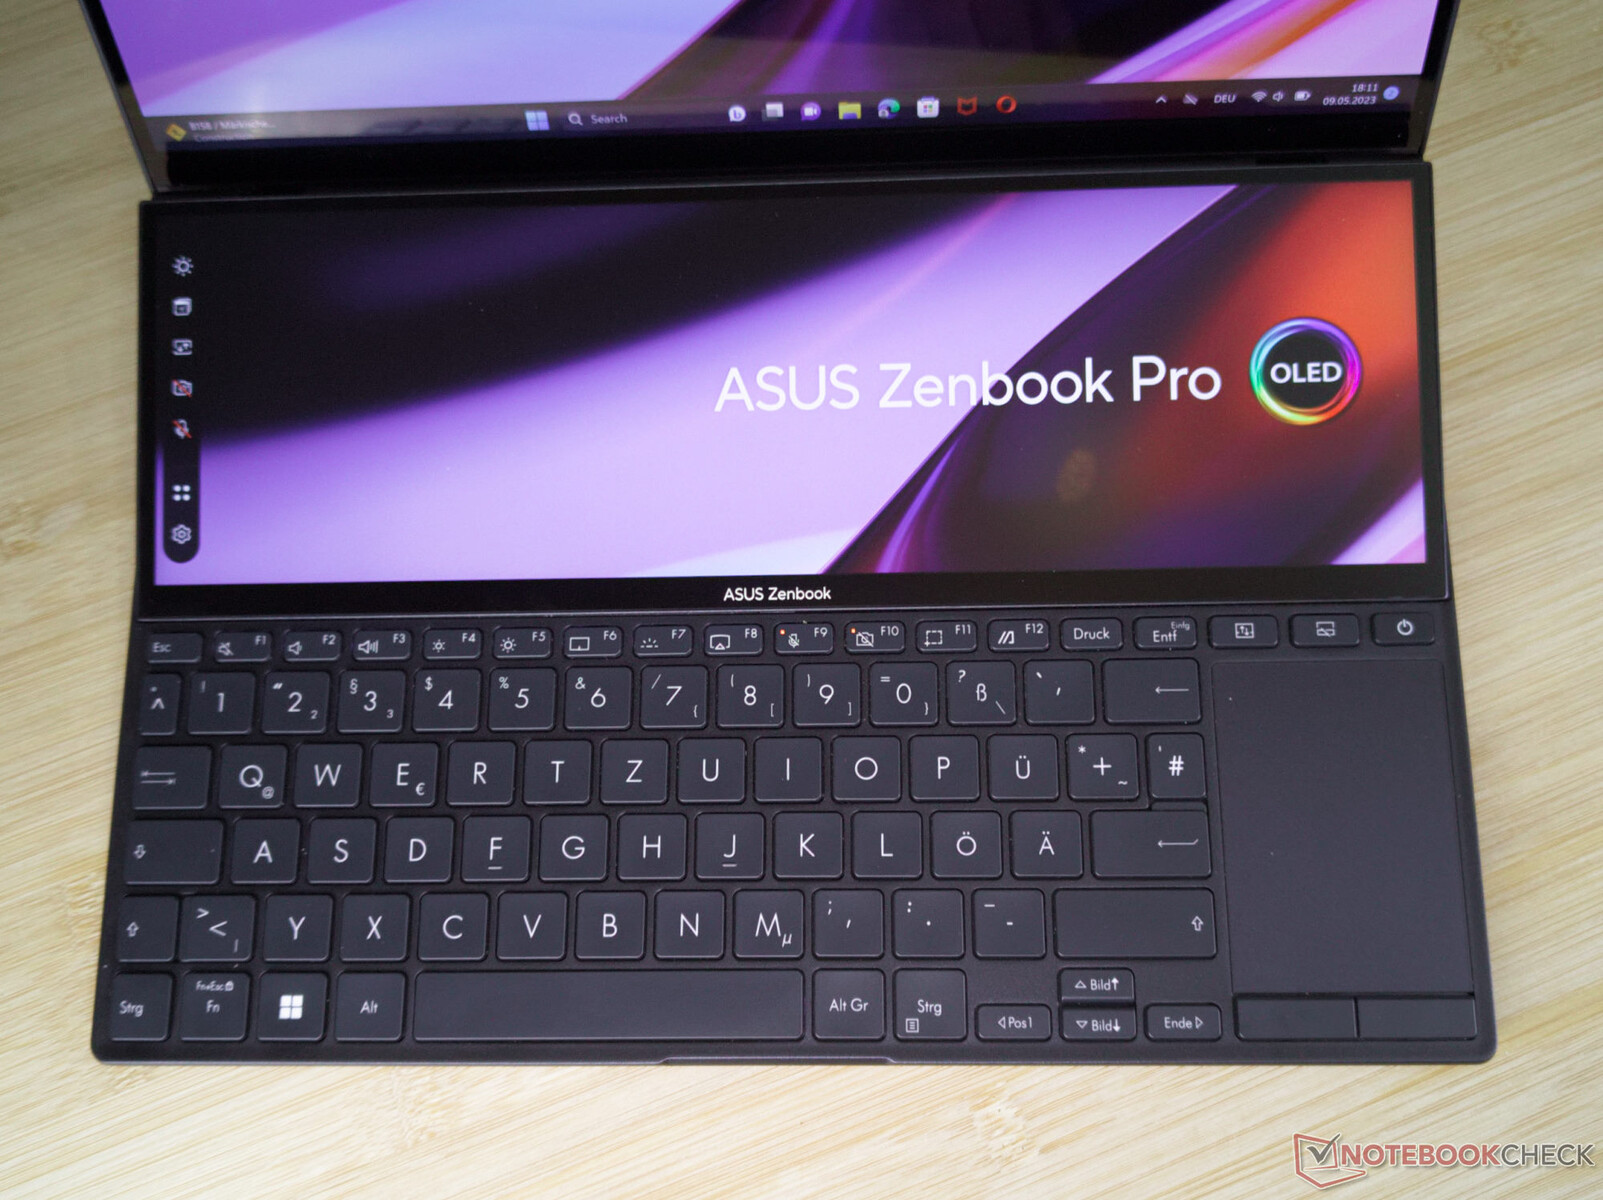
Mientras el Zenbook está cerrado, tiene un aspecto muy poco llamativo, y no se aprecia el inusual concepto de diseño del portátil con su pantalla de 14,5 pulgadas. Con sus componentes de aluminio para la tapa del display y la cubierta de la base, parece de gran calidad y quizá algo pesado, si coges el pequeño dispositivo. Solo cuando abres el Zenbook Pro Duo puedes ver los cambios en el diseño para hacer sitio a la segunda pantalla. El teclado y el touchpad comparten el espacio de la mitad inferior de la base. Los reposamuñecas se han eliminado por completo. Encima del teclado está la gran segunda pantalla, que ahora se llama "Screenpad+" y también ofrece varios elementos de control además de su función como segunda pantalla. Desde nuestro anterior análisis del Zenbook Pro Duo 14 en 2022asus no hizo ningún cambio visible en el exterior del portátil.
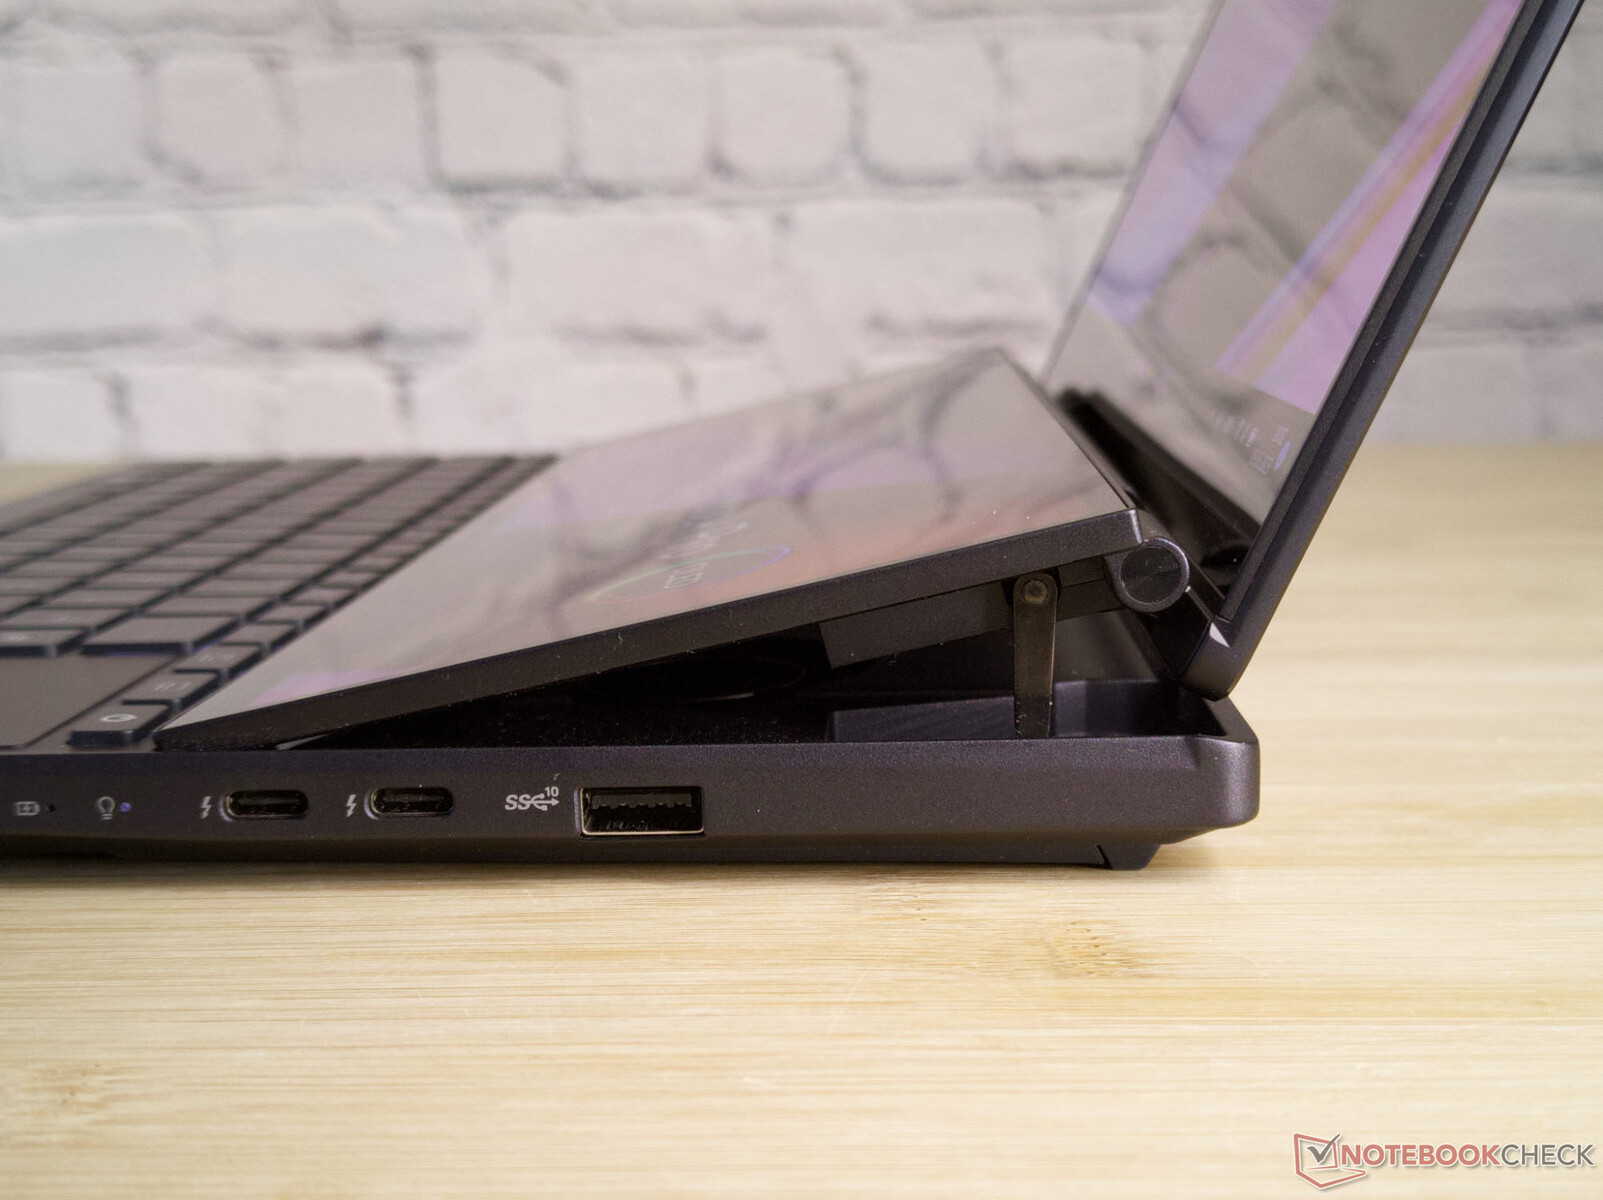
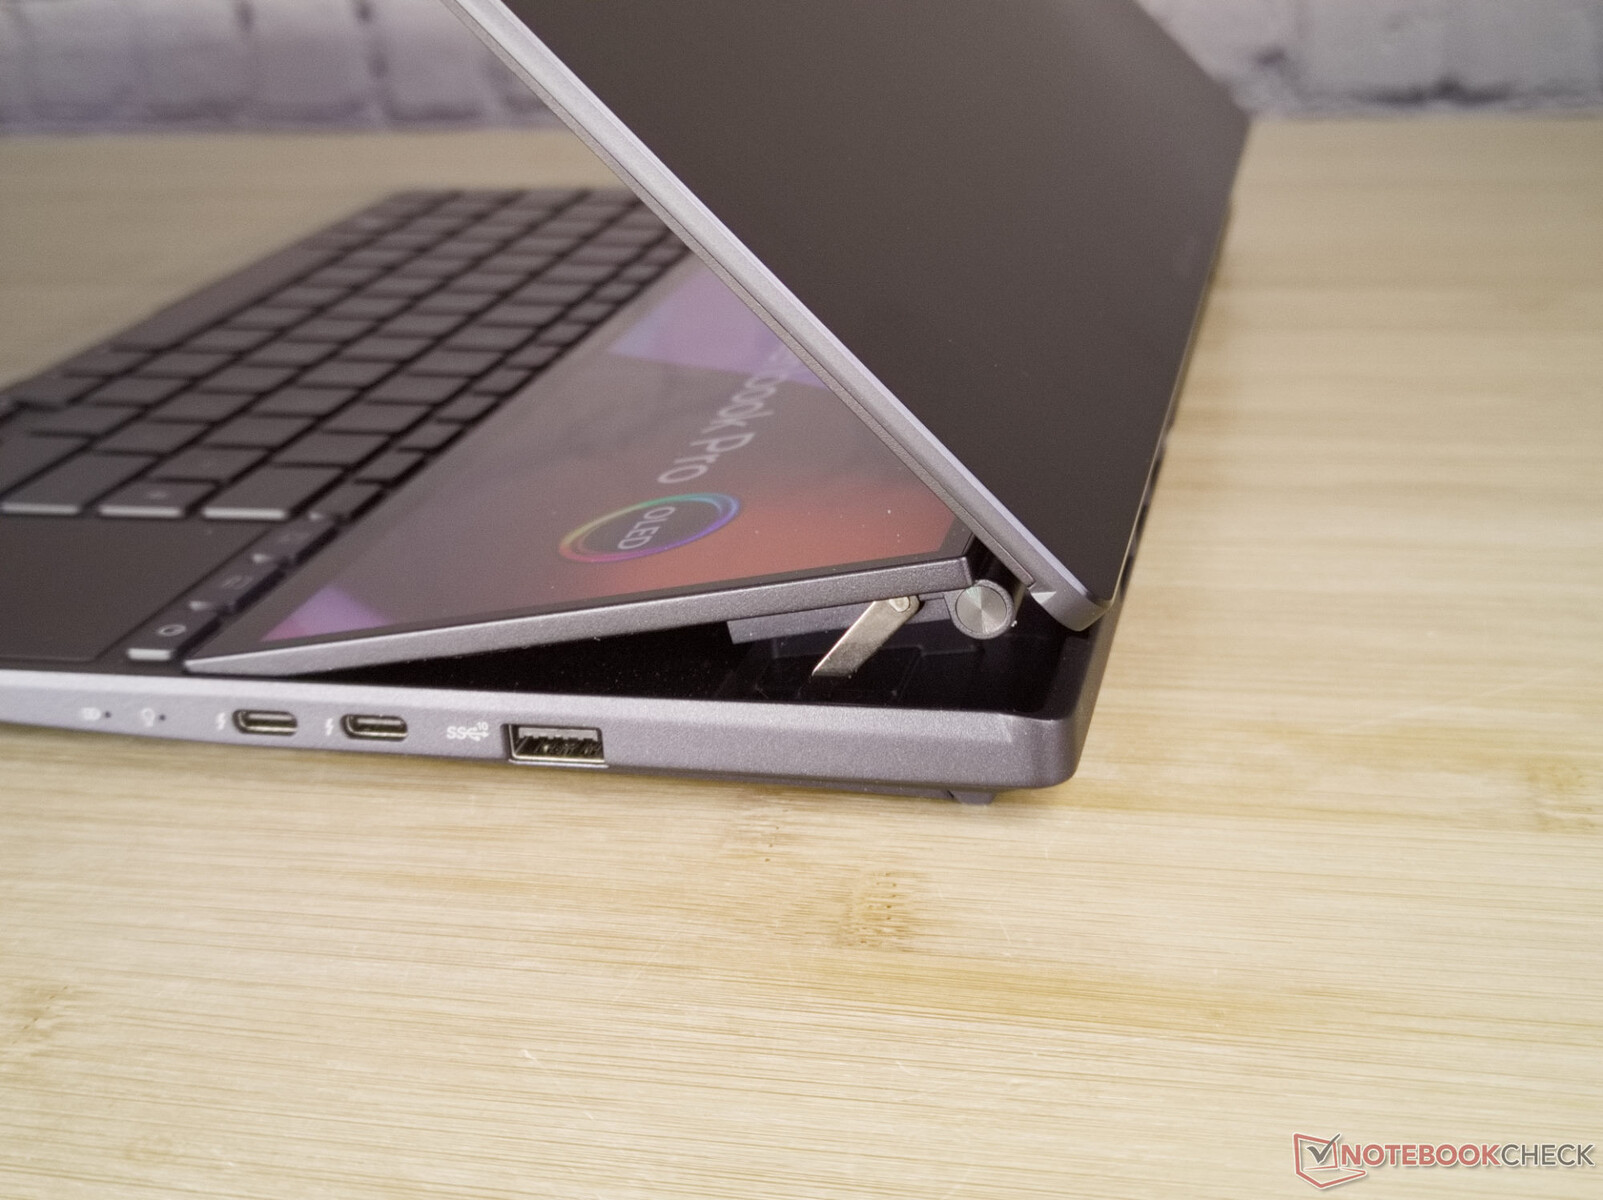
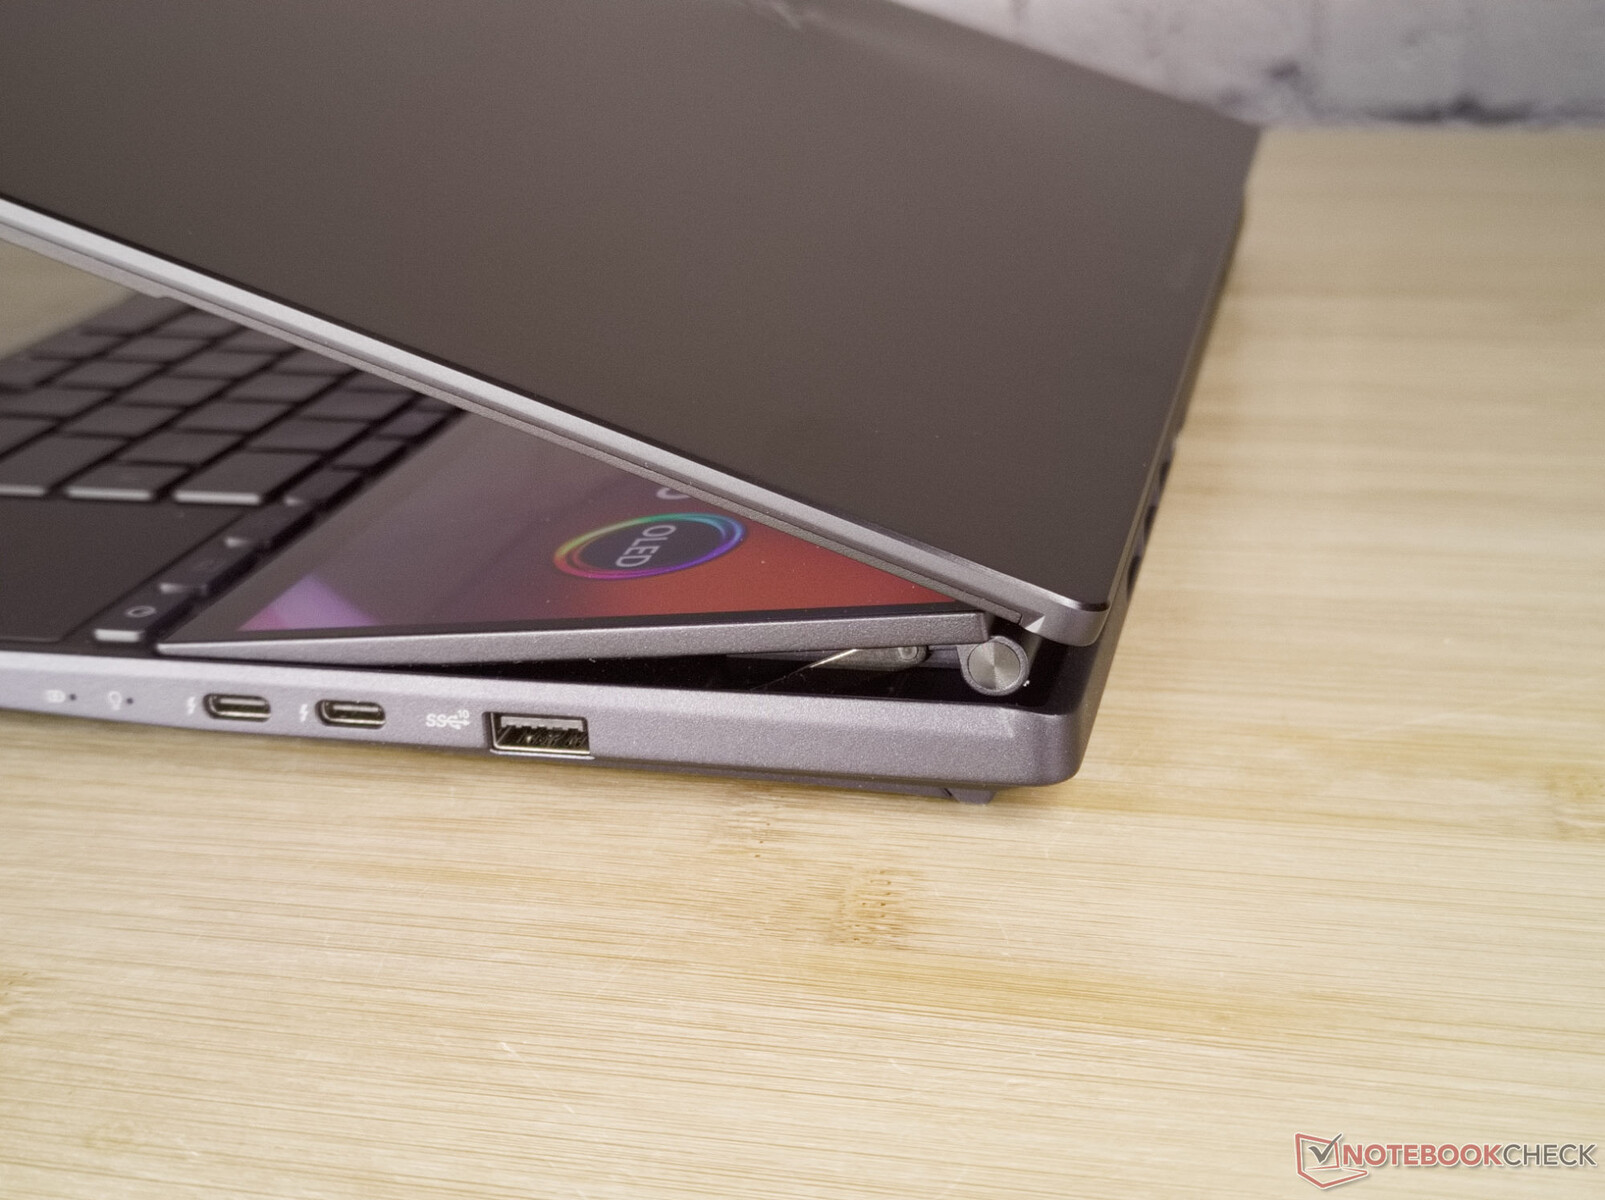
El mecanismo de bisagra del display principal sigue siendo ligeramente tambaleante, mientras que el Sceenpad+ se mantiene bien fijo en su ángulo de apertura de 15º. Aunque el gran display puede combarse ligeramente, la rigidez de la base sigue dando al Zenbook Pro Duo 14 una sensación de gran calidad y robustez.
Sentado sobre el escritorio, el portátil requiere un espacio ligeramente más profundo que un dispositivo de tamaño comparable sin la segunda pantalla. Con la falta de reposamanos, las palmas tienen que colocarse delante del dispositivo. Esto también convierte el uso del portátil sobre el regazo en un acto de equilibrio. El centro de gravedad del portátil está relativamente lejos en la parte trasera, y el lugar donde normalmente estabilizarías el portátil con las manos está ahora ocupado por el touchpad y el teclado. La única solución práctica que queda es utilizar un teclado en pantalla en la segunda pantalla y desactivar los dispositivos físicos de entrada.


Con un peso de 1,8 kg y un grosor de 21 mm, el Zenbook Pro Duo es bastante grande y pesado entre los portátiles de 14 a 15 pulgadas. La segunda pantalla con su complicada mecánica de bisagra seguramente añade unos cuantos gramos y milímetros. Pero Asus también ha añadido un enorme sistema de refrigeración con gruesos tubos de calor y ventiladores relativamente grandes, que también aumentan el peso, por lo que no sorprende que el resto de dispositivos de 14 pulgadas de la competencia sean más delgados y ligeros. Además, el espacio realmente necesario para usar el portátil aumenta debido a la falta de reposamanos.
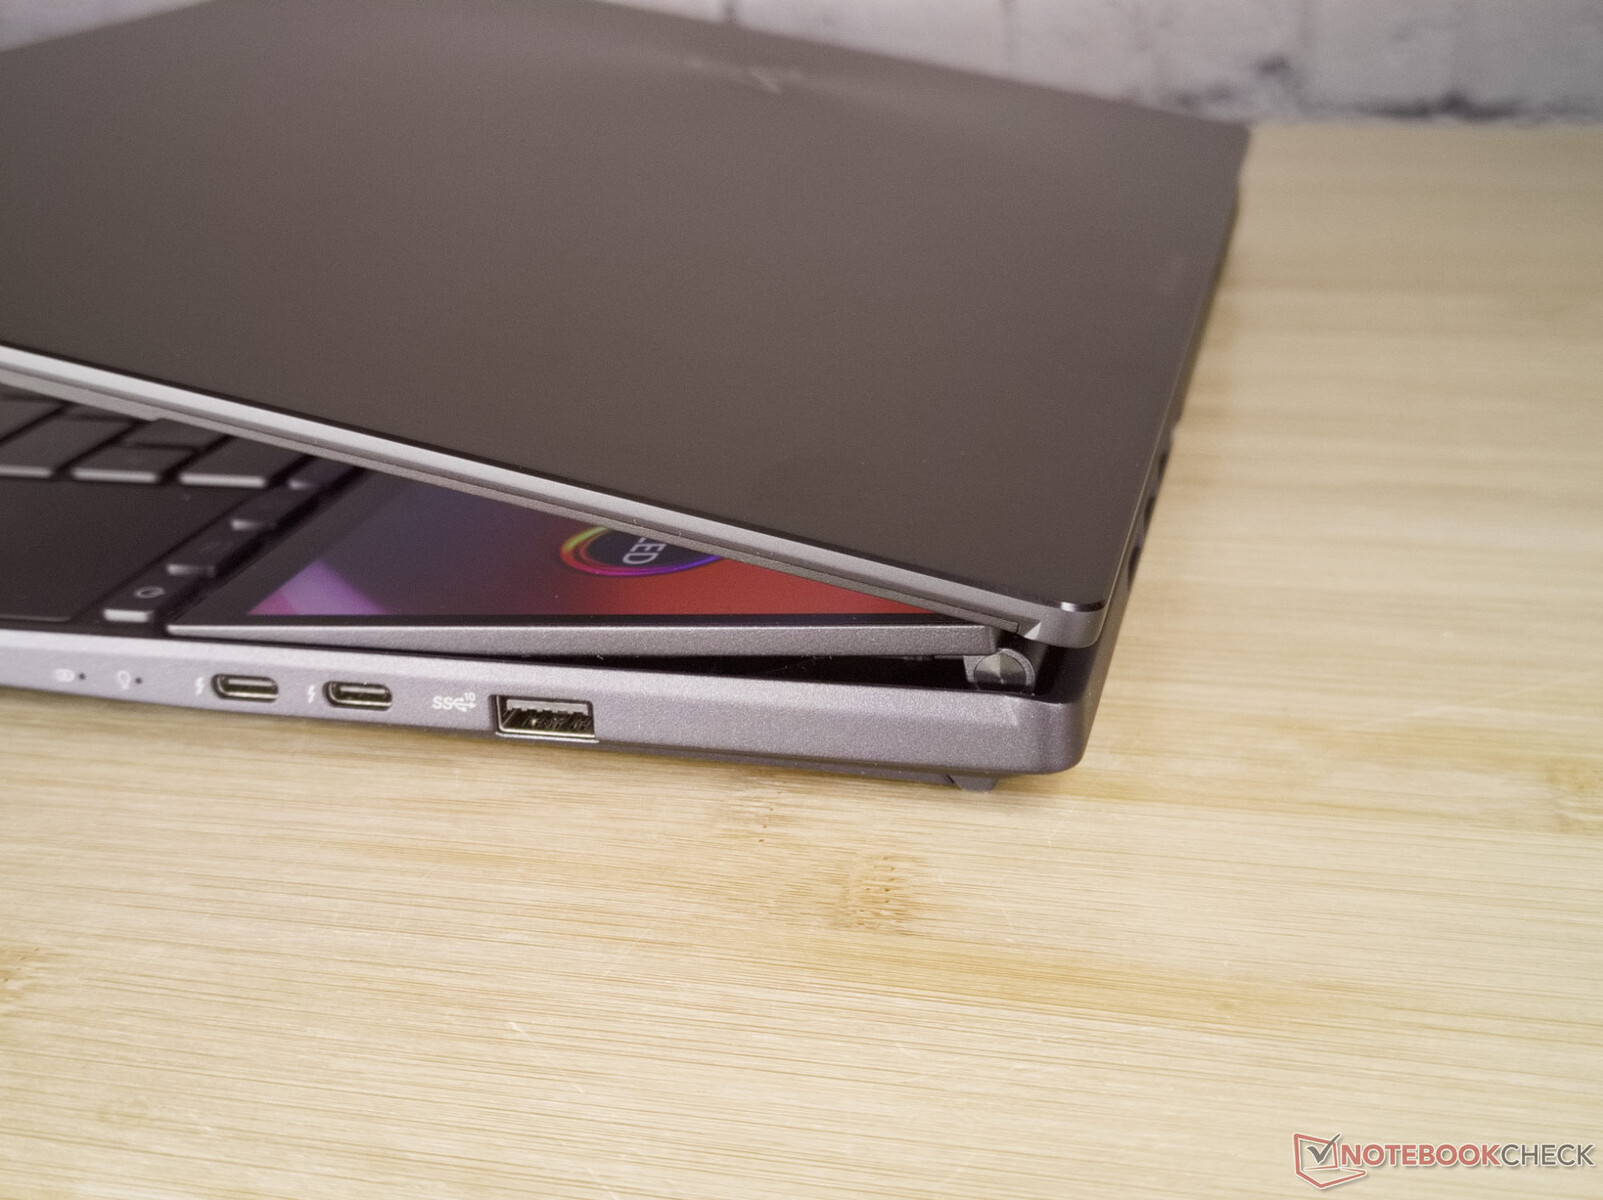
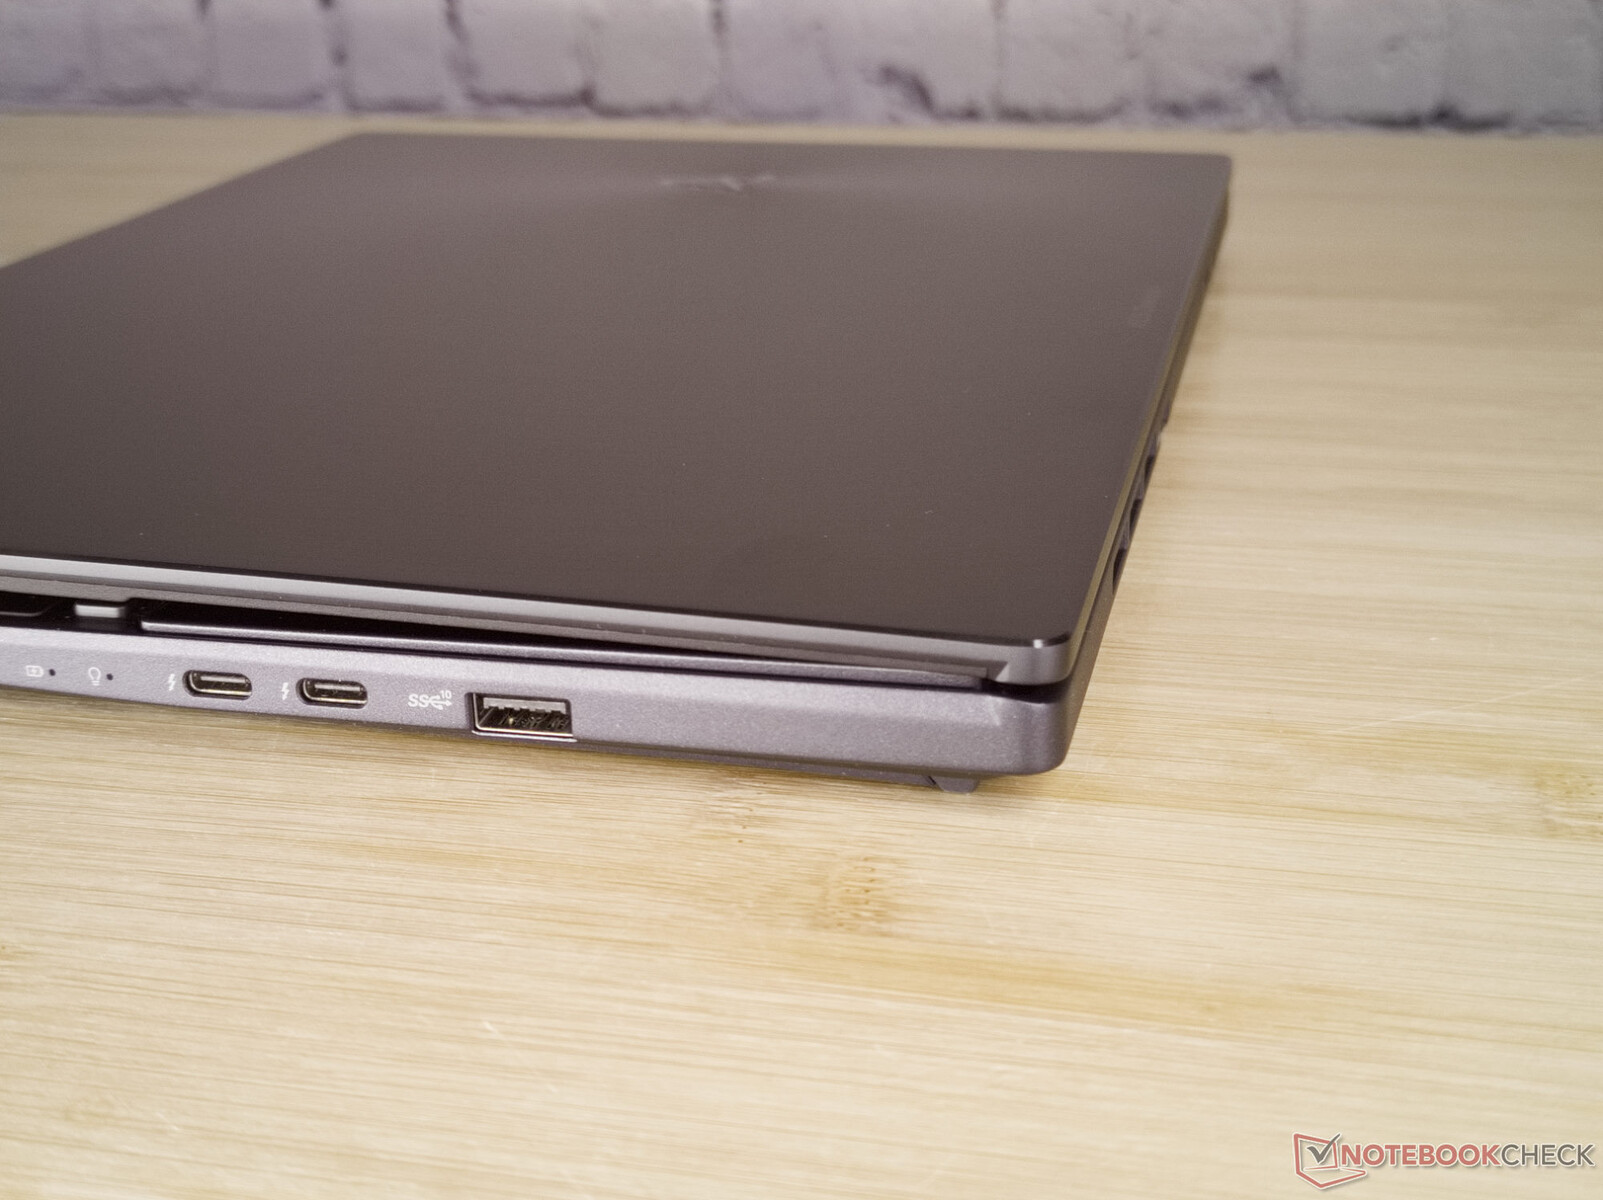
Equipamiento - lector de tarjetas microSD en la parte trasera
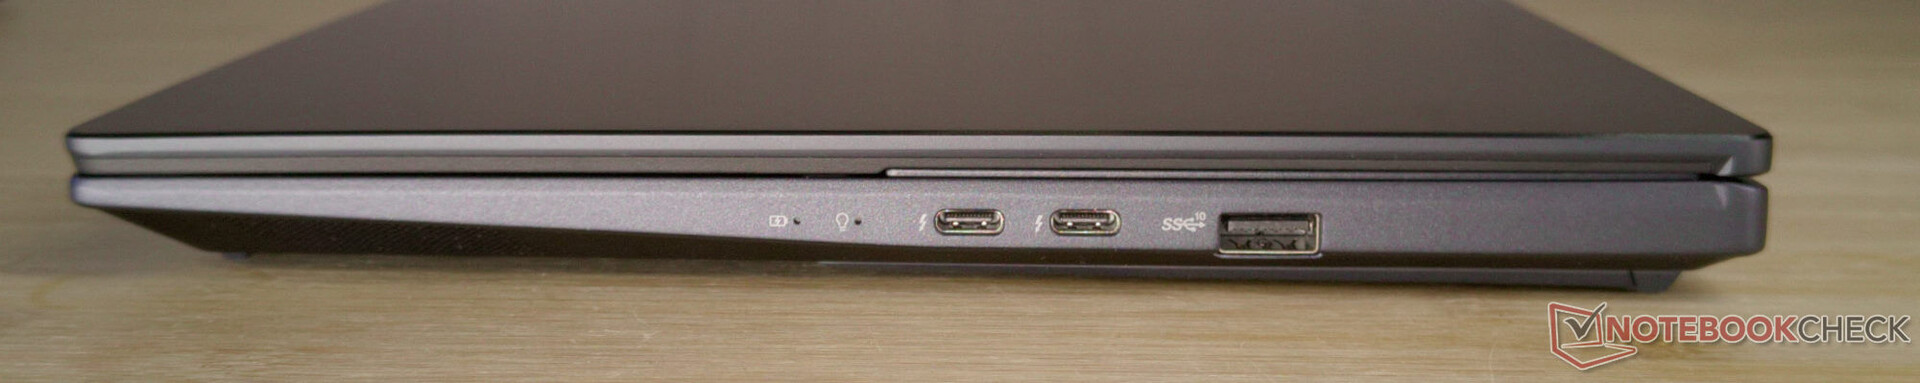
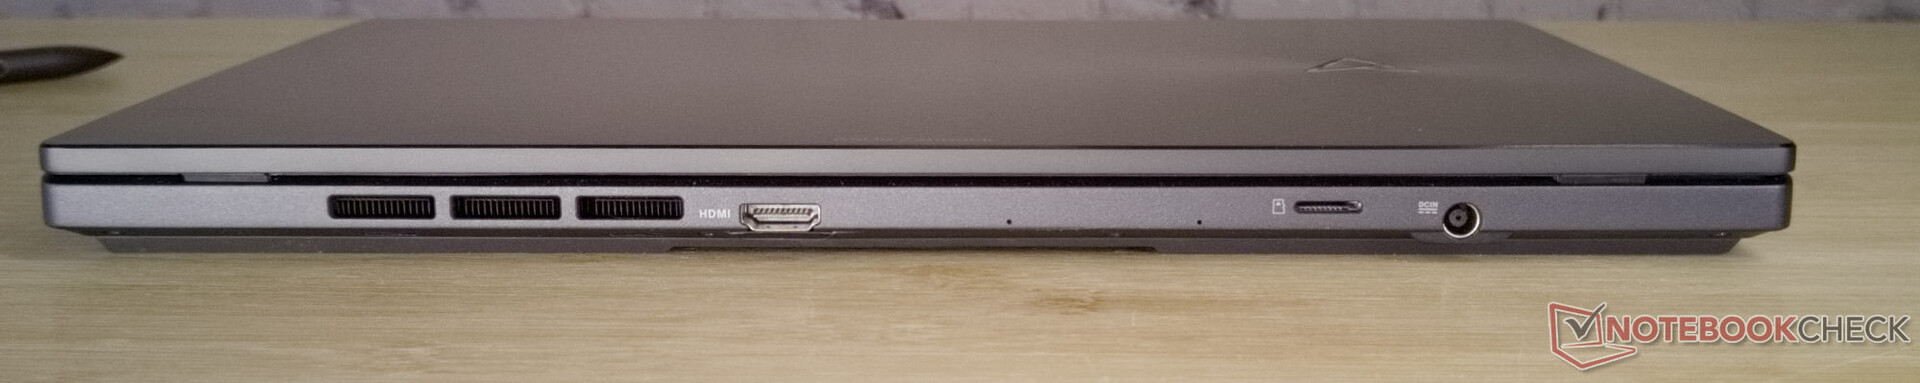
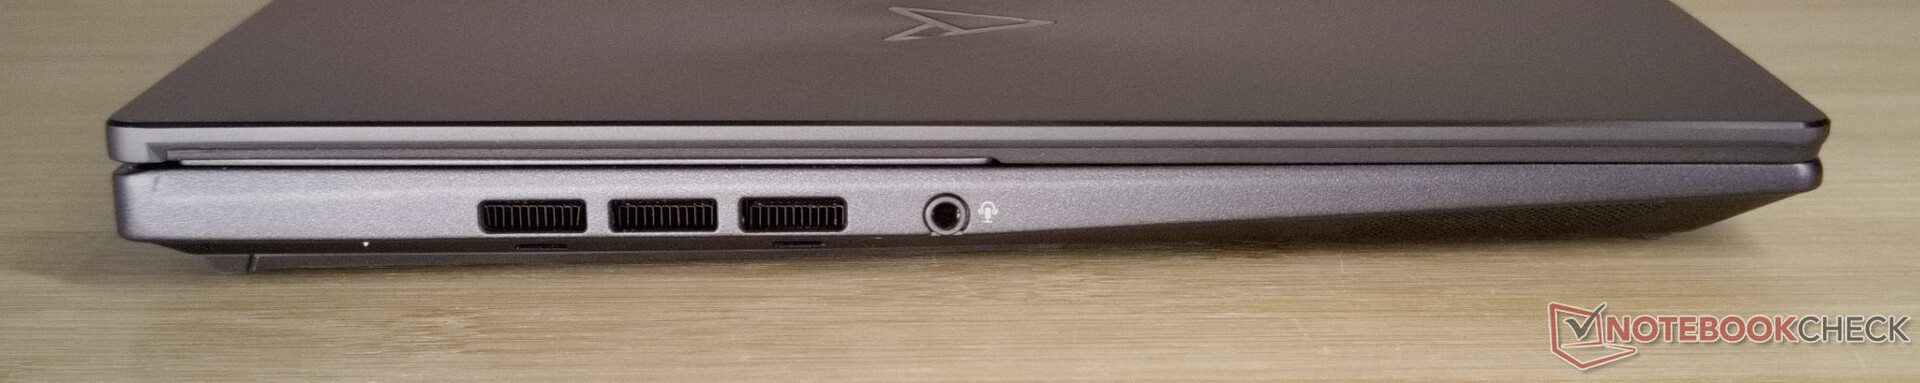
Las conexiones de los Zenbooks se distribuyen en tres lados. El lado izquierdo permanece casi completamente vacío, con sólo un puerto de audio de 3,5 mm. Junto con una conexión de alimentación y el puerto HDMI, el lector de tarjetas microSD está situado en la parte trasera del portátil, dejando sólo el lado derecho para varias conexiones USB. En general, el equipo de conexión es bastante limitado.
Lector de tarjetas SD
Usando nuestra microSD AV PRO de 128 GB de la clase de velocidad V60, las velocidades de transferencia siguen siendo bastante mediocres. El Aero 14 OLED de Gigabyte tiene un lector de tarjetas bastante más rápido, pero el del Schenker Vision 14 es más lento. Además, el lector de tarjetas microSD es difícil de alcanzar en la parte trasera.
| SD Card Reader | |
| average JPG Copy Test (av. of 3 runs) | |
| Asus Zephyrus Duo 16 GX650PY-NM006W (Angelbird AV Pro V60) | |
| Gigabyte Aero 14 OLED BMF | |
| Media de la clase Multimedia (23 - 531, n=37, últimos 2 años) | |
| Asus Zenbook Pro 14 Duo OLED UX8402ZA (Angelbird AV Pro V60) | |
| Asus ZenBook Pro 14 Duo UX8402VV-P1021W (AV Pro SD microSD 128 GB V60) | |
| Schenker Vision 14 2022 RTX 3050 Ti | |
| maximum AS SSD Seq Read Test (1GB) | |
| Asus Zephyrus Duo 16 GX650PY-NM006W (Angelbird AV Pro V60) | |
| Media de la clase Multimedia (37.3 - 1455, n=36, últimos 2 años) | |
| Gigabyte Aero 14 OLED BMF | |
| Asus ZenBook Pro 14 Duo UX8402VV-P1021W (AV Pro SD microSD 128 GB V60) | |
| Asus Zenbook Pro 14 Duo OLED UX8402ZA (Angelbird AV Pro V60) | |
| Schenker Vision 14 2022 RTX 3050 Ti | |
Comunicación
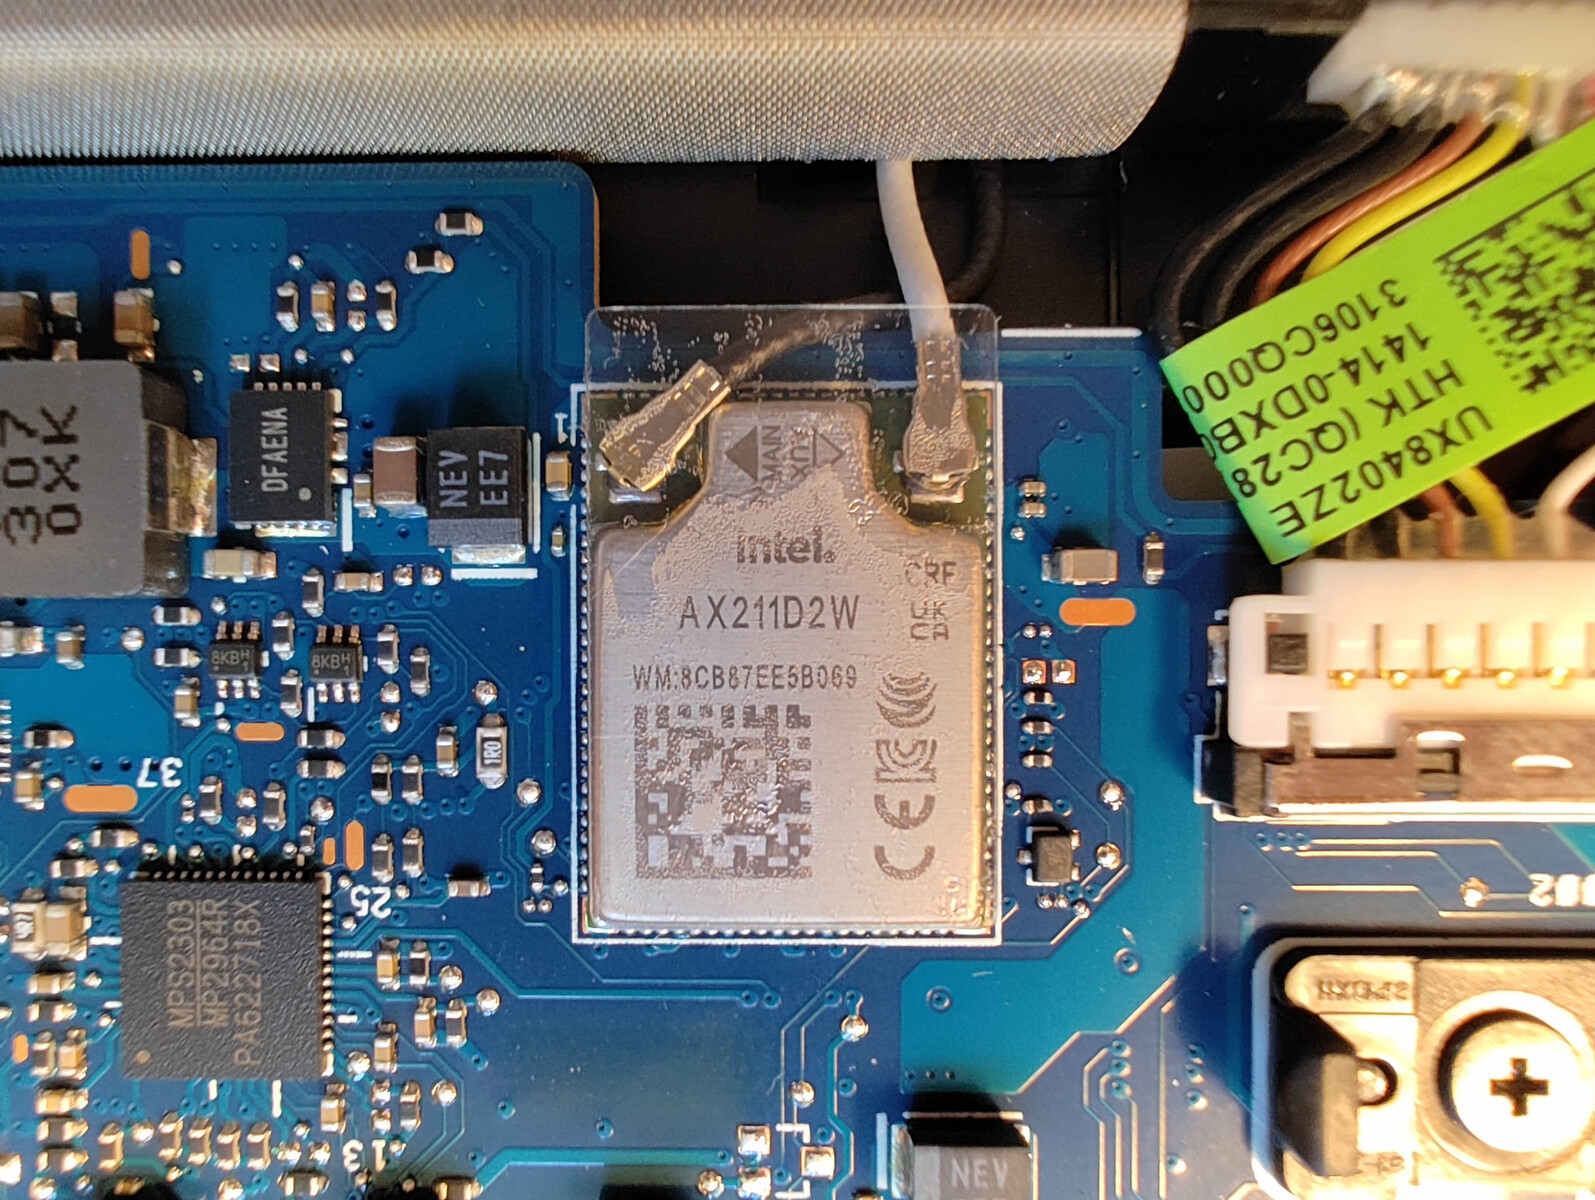
El módulo WLAN AX 211 de Intel muestra su rendimiento máximo por segunda vez. Las velocidades de transferencia del Asus Zenbook Pro Duo son altas y estables con nuestro router AXE11000. Sin embargo, lo que destaca es que la conexión en la red de 5 GHz es más rápida que en la de 6 GHz.
Cámara web
En buenas condiciones de luz, la webcam Full-HD del Zenbook ofrece una imagen nítida y una reproducción del color satisfactoria. También se usa para el reconocimiento facial a través de Windows Hello y debería poder ofrecer resultados correctos en malas condiciones de luz gracias al uso de infrarrojos. Sin embargo, la imagen de la webcam normal pierde calidad en cuanto las condiciones de luz se debilitan.


Seguridad
Un TPM es estándar en los portátiles modernos. Aparte de eso, las demás funciones de seguridad del Zenbook Pro Duo 14 son limitadas. Sólo la cámara con reconocimiento facial y las características de seguridad integradas del Intel Core i9 podrían enumerarse aquí.
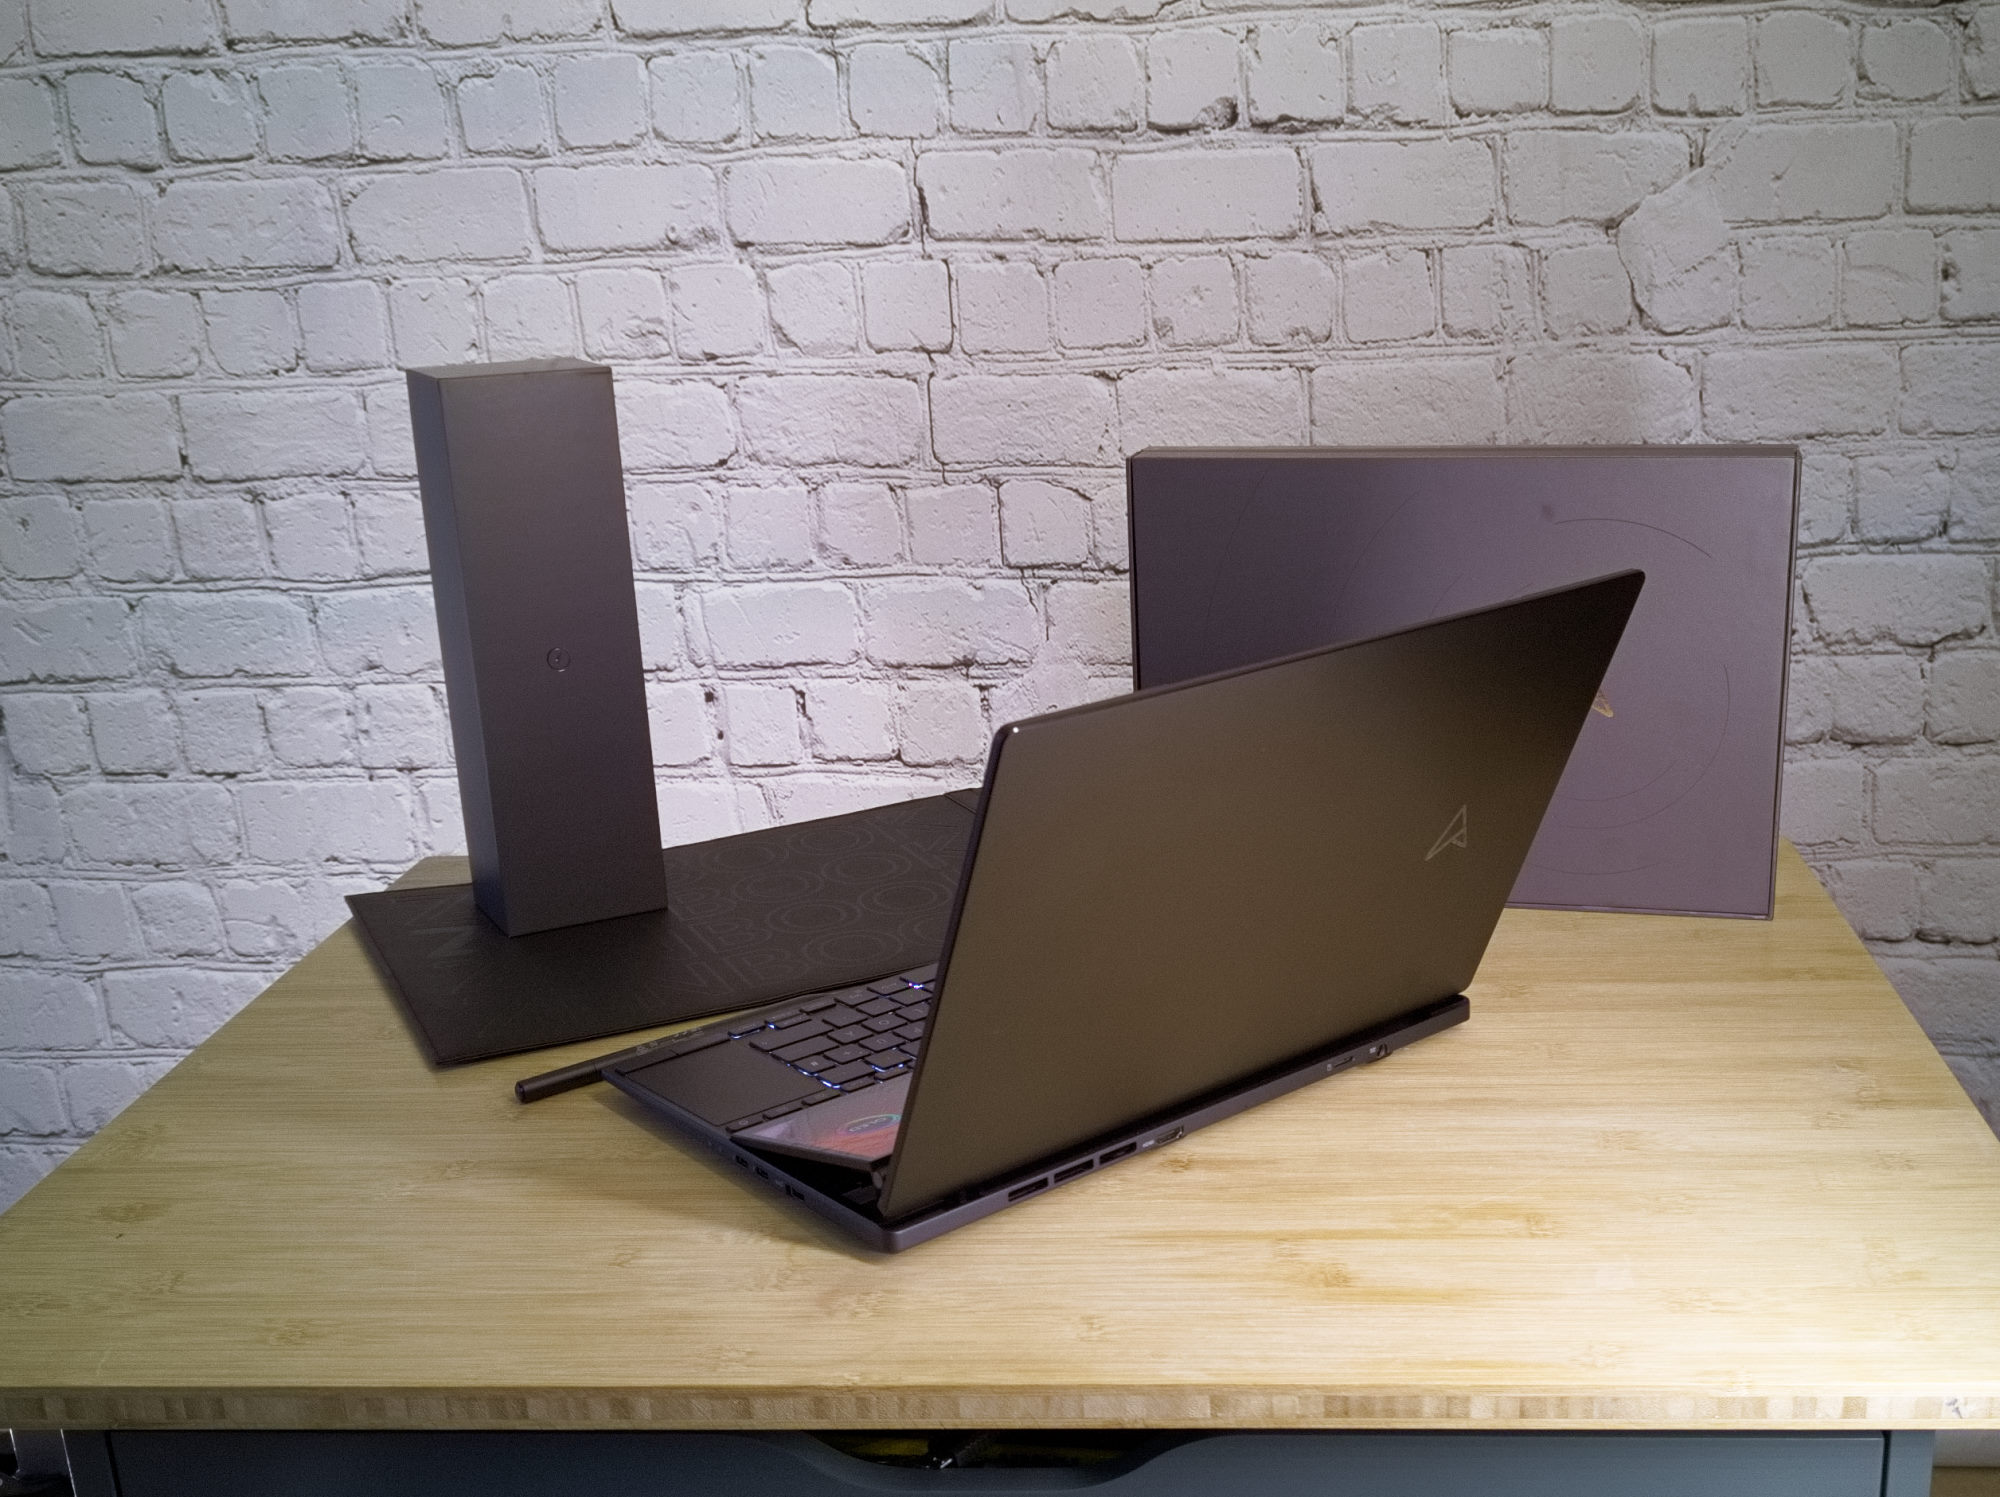
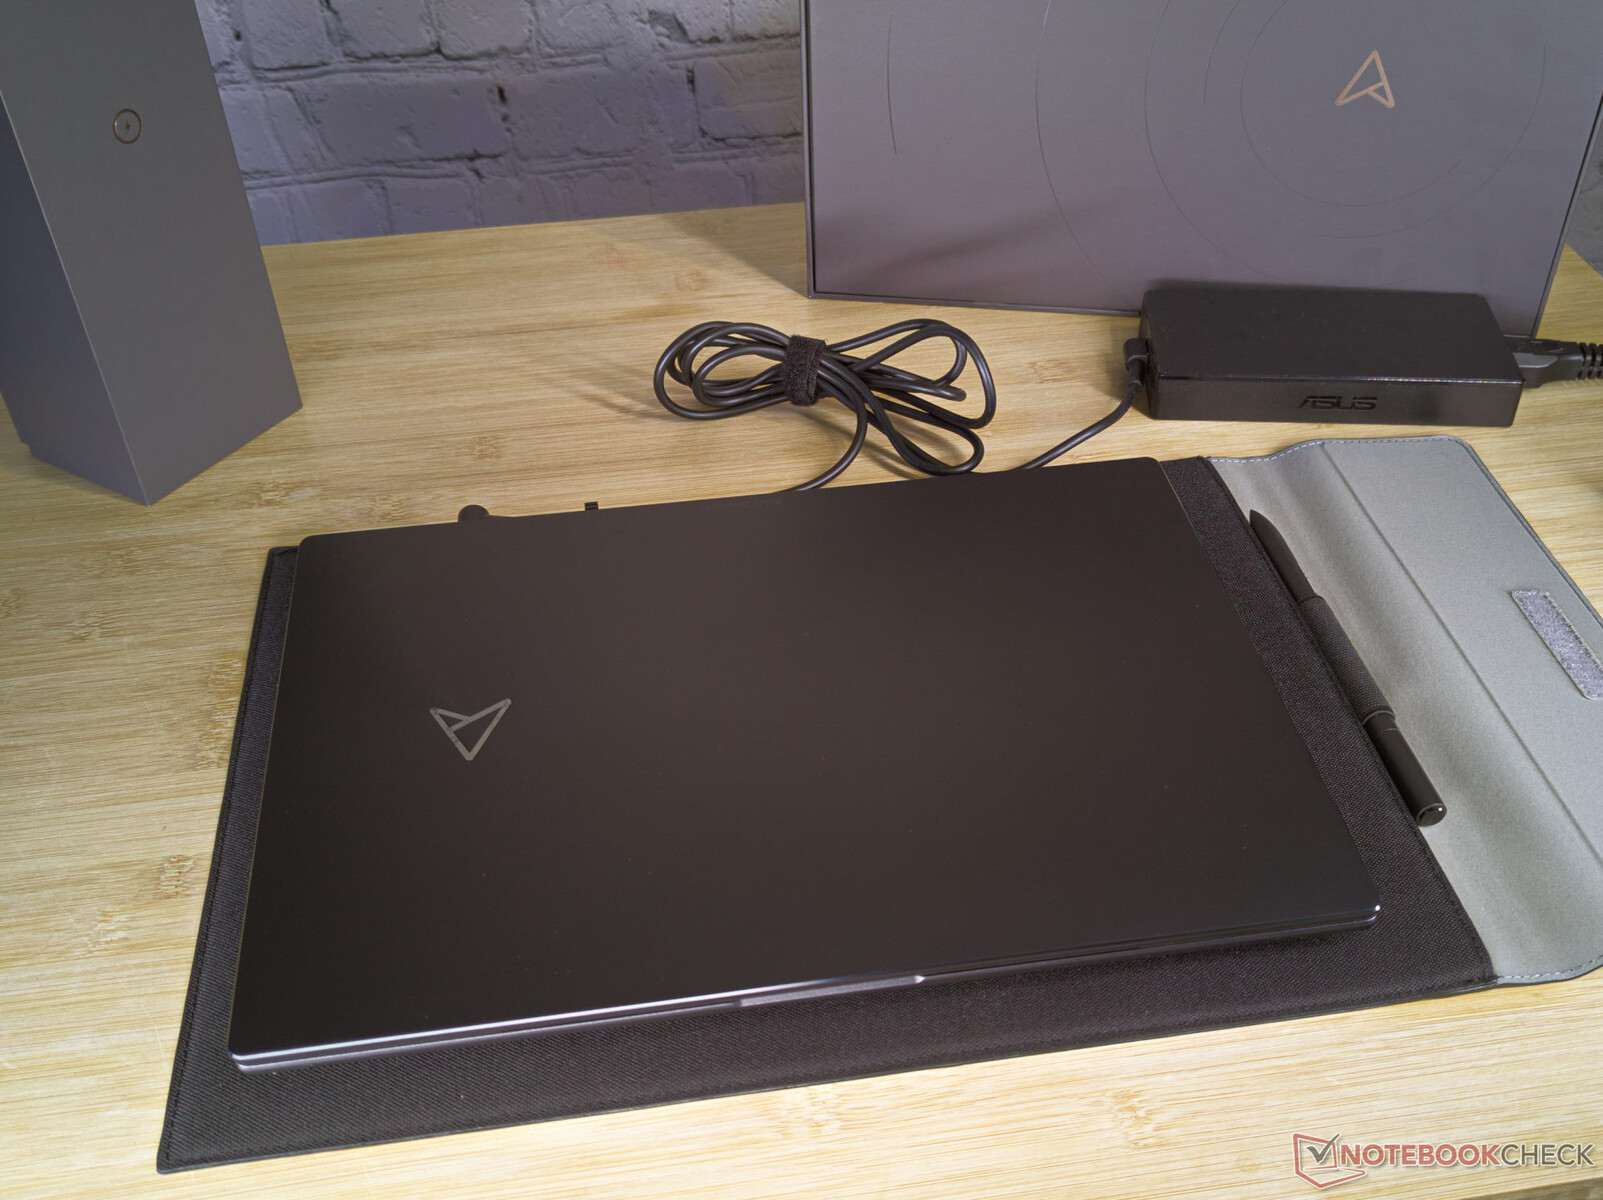
Accesorios
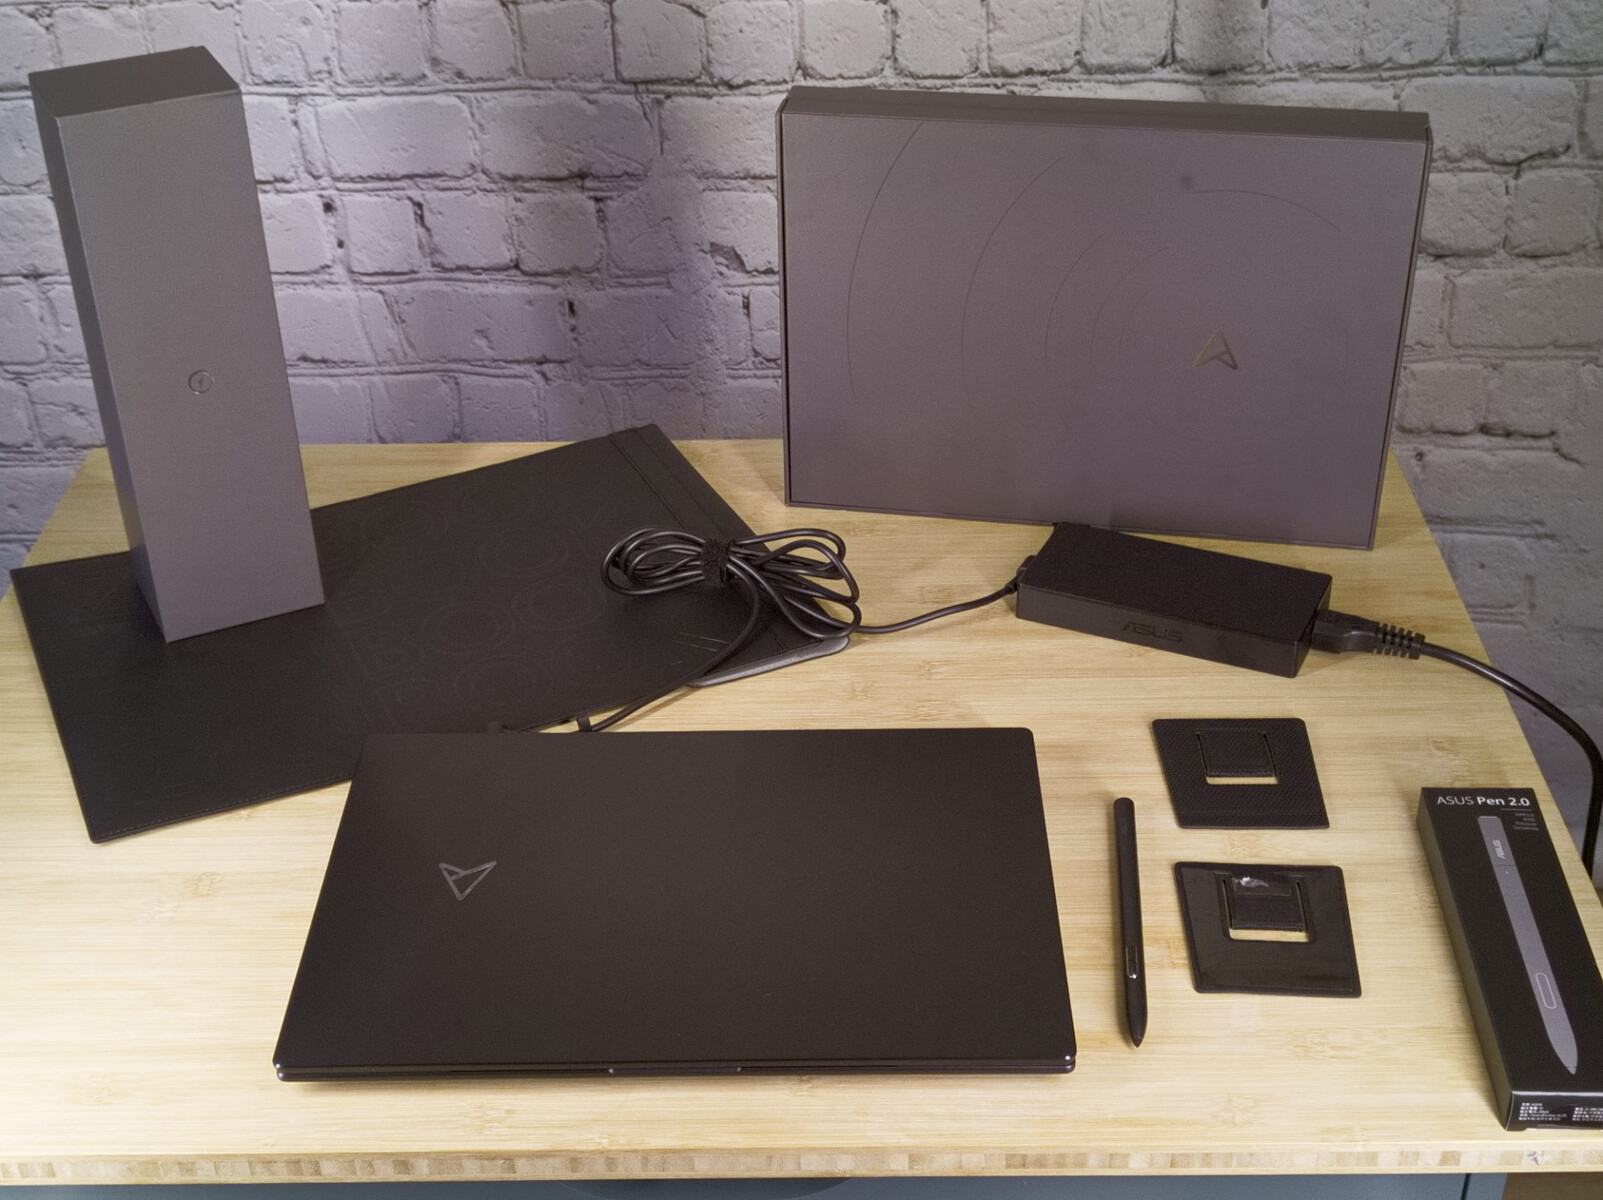
La caja del inusual portátil está llena hasta los topes. Además del cargador correspondiente y la obligatoria colección de papeles, también podemos encontrar un juego de pies, una funda protectora y el Asus Stylus.
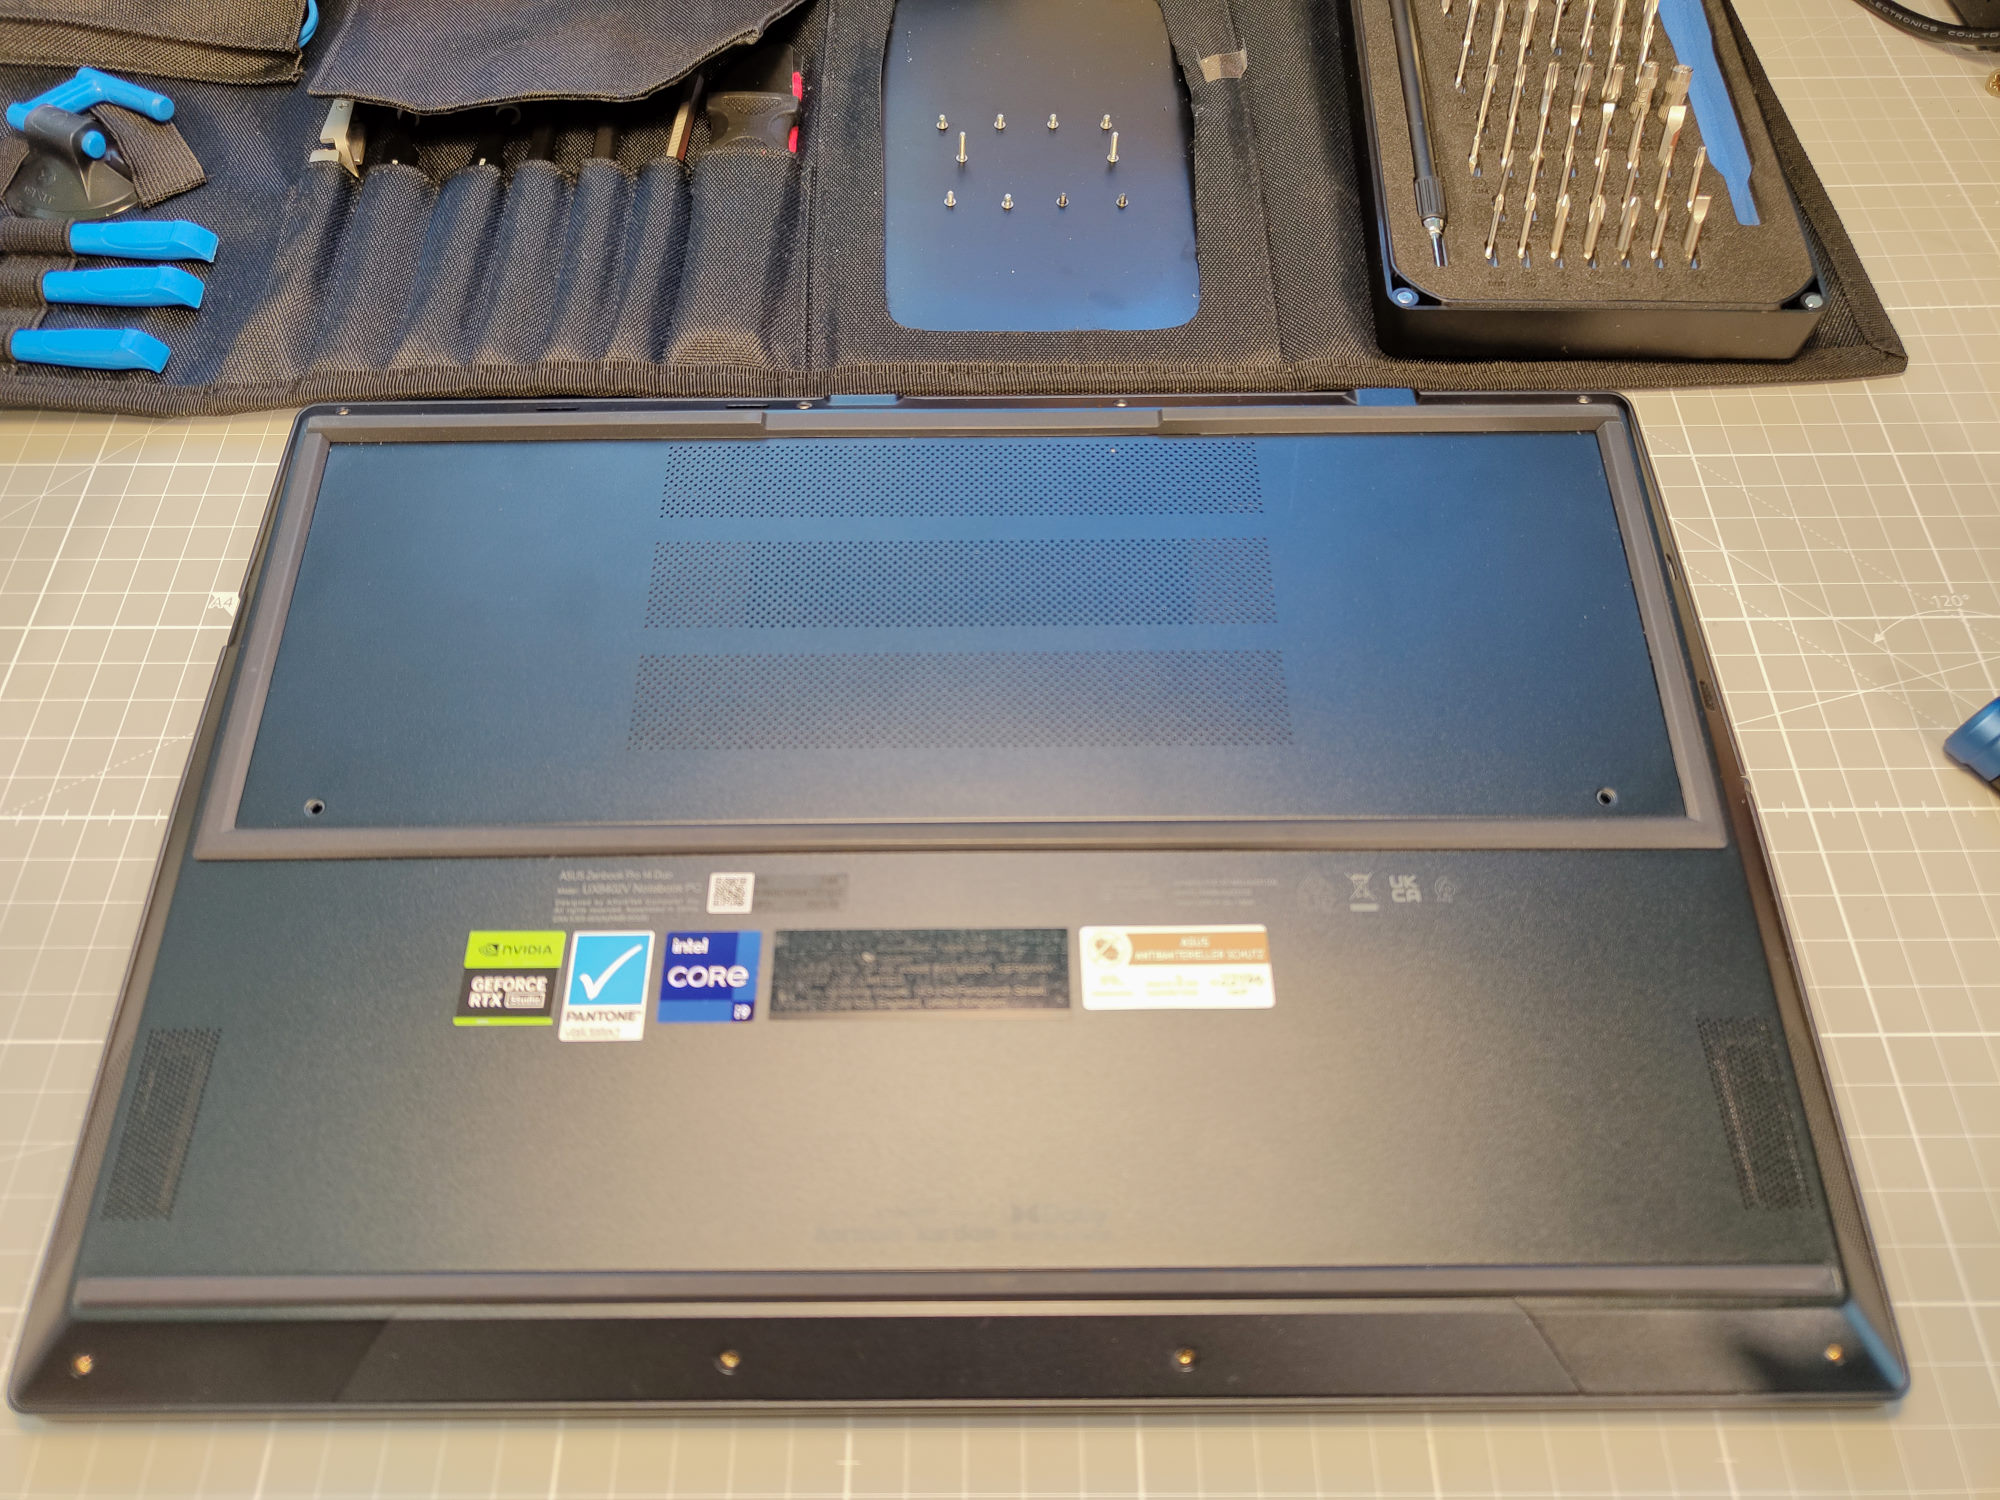
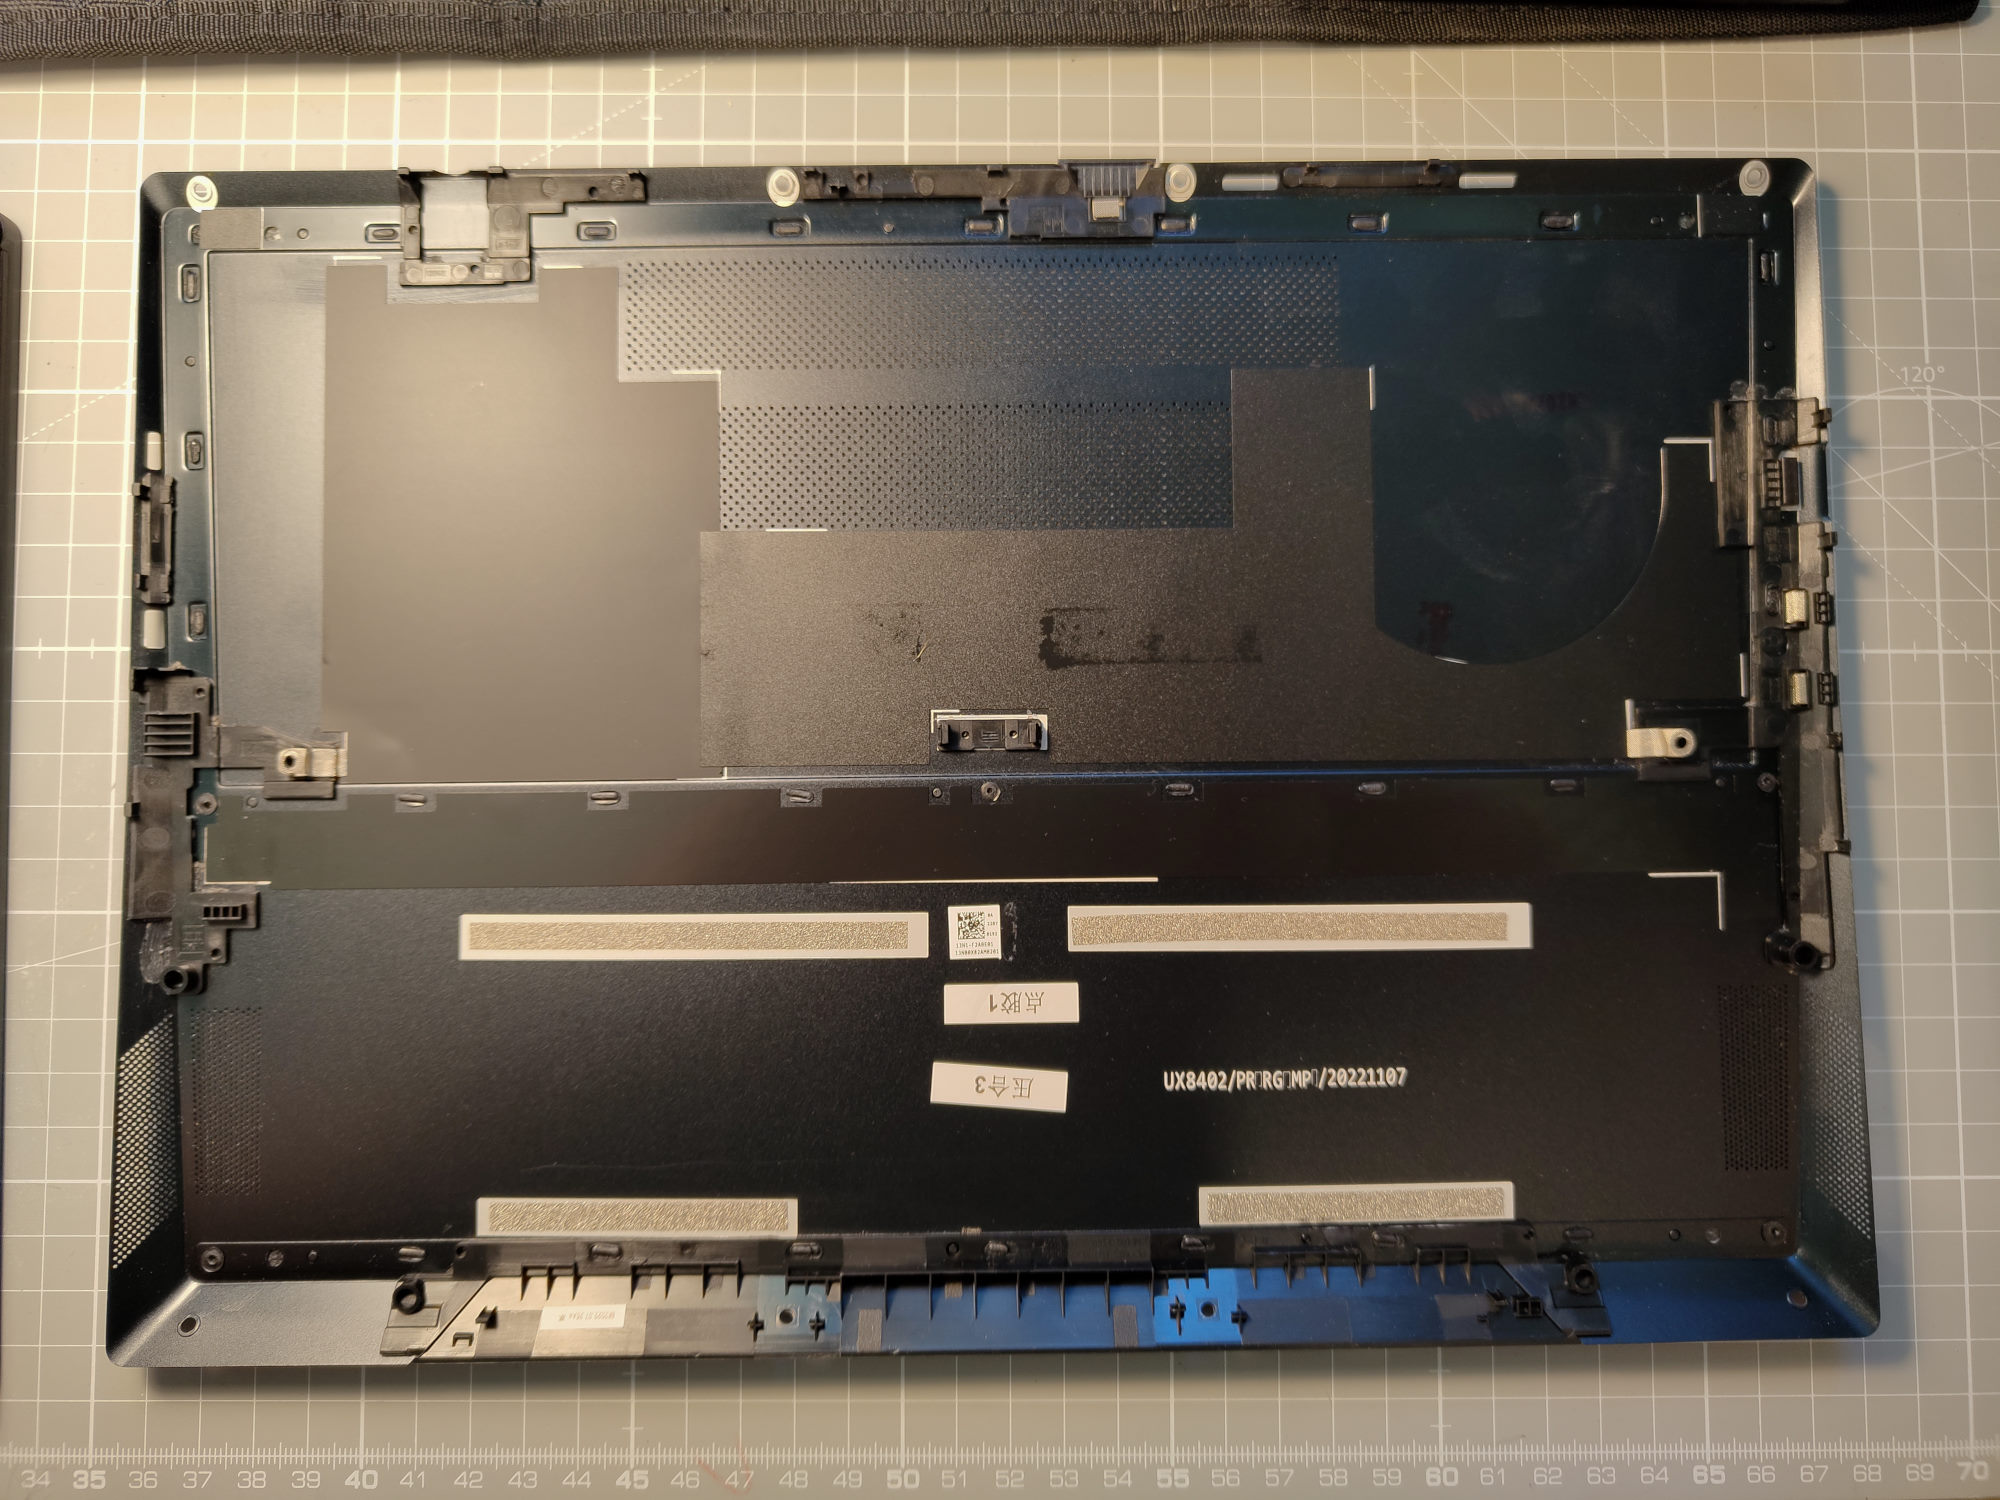
Mantenimiento
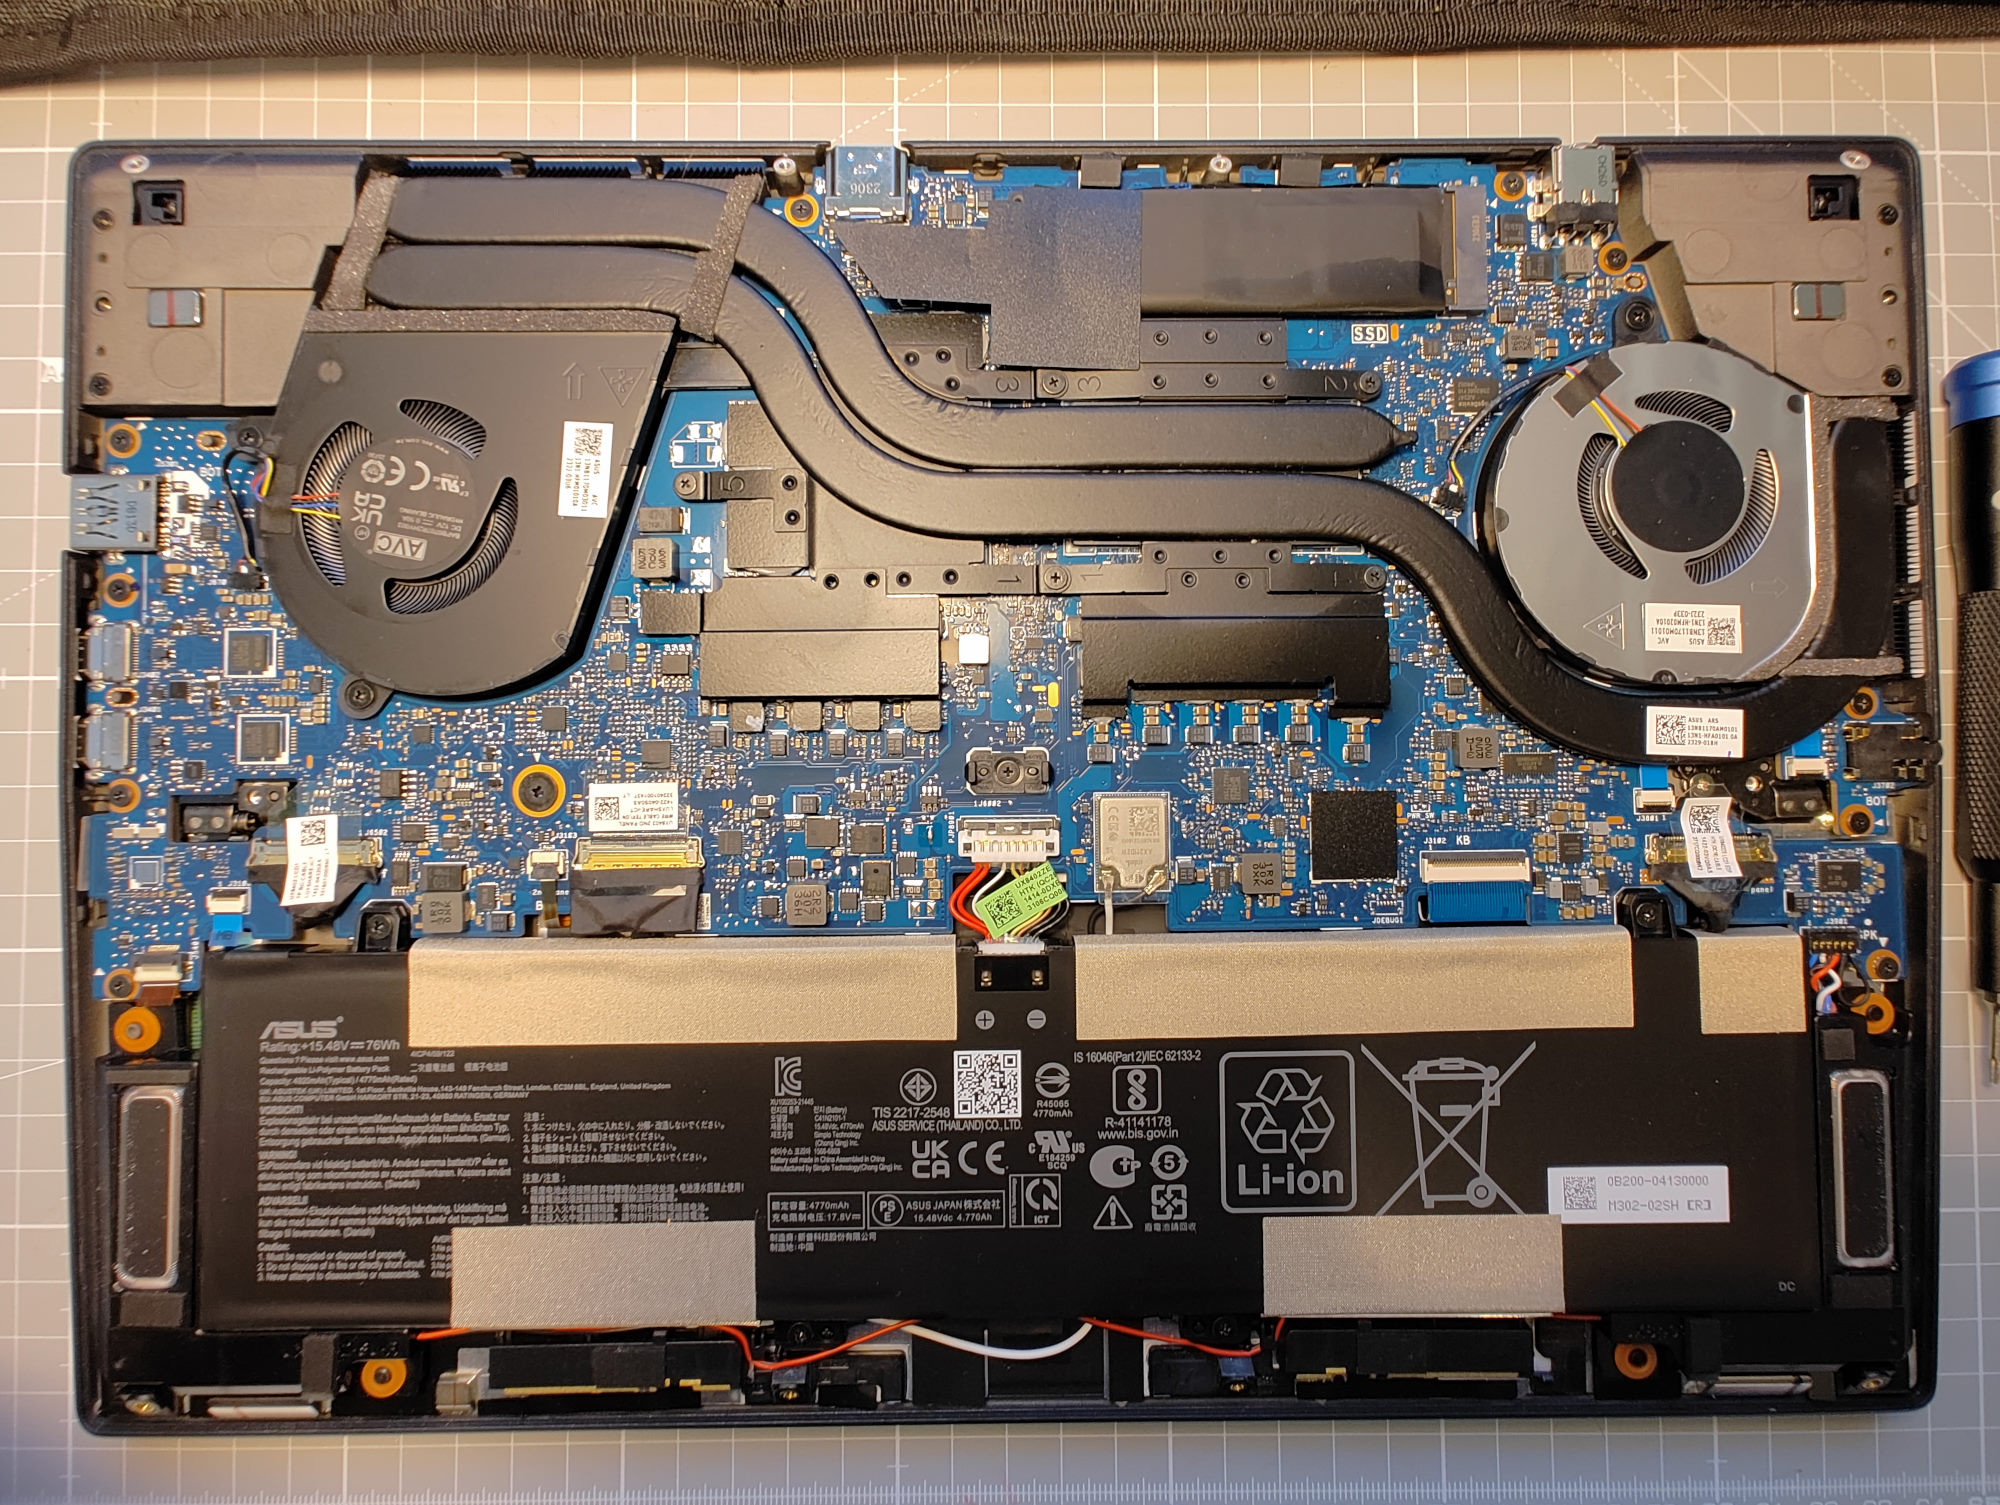
El Asus Zenbook Pro Duo 14 puede abrirse rápidamente sin tener que usar muchas herramientas. La parte inferior de la carcasa está fijada por una docena de tornillos TX5. Una vez retirados, puedes sacar fácilmente la cubierta inferior, ya que entonces sólo está sujeta por dos clips de plástico en el centro del portátil. Tras un suave tirón, sujetas la cubierta con las manos. Debajo, puedes ver muchos componentes soldados. De todos los componentes de hardware, sólo el SSD se puede sustituir fácilmente. No hay ni una ranura M.2 libre ni ranuras SO-DIMM para memoria de trabajo adicional. Reemplazar la batería también sería muy difícil, ya que está asegurada con varias tiras de pegamento y tornillos. Aparte de limpiar los ventiladores, no puedes realizar muchas tareas dentro del portátil.
Garantía
Asus ofrece una garantía mundial de dos años para nuestra unidad de prueba. Otras configuraciones pueden tener condiciones de garantía diferentes.
Dispositivos de entrada - Con los dedos, lápiz de entrada, ratón y teclado
El Zenbook Pro Duo 14 y sus hermanos mayores con una segunda pantalla son bastante únicos en términos de sus dispositivos de entrada. Primero, la distribución del teclado y el touchpad son inusuales. En lugar de poder colocar las manos en los reposamuñecas, hay que colocarlas delante del portátil. Pero uno se acostumbra rápidamente a la posición y el formato del touchpad. Ya después de unas horas en nuestra prueba, lo buscamos en vano en cualquier otro portátil a la derecha del teclado. Luego, los dispositivos de entrada también incluyen ambas pantallas, ya que son sensibles al tacto y también soportan entradas a través del lápiz MPP 2.0. Asus ha incluido el correspondiente Asus Pen 2.0.
Teclado
El teclado del Zenbook Pro Duo ofrece un desplazamiento de tecla bastante largo de 1.4 mm. Pero aún tiene que ponerse al día respecto a la respuesta háptica. Por desgracia, la experiencia de mecanografiado debe describirse como bastante esponjosa. Con el inusual diseño del portátil, no había forma de evitar algunos ajustes también en la distribución del teclado. Esto significa que la tecla Enter se ha vuelto ligeramente pequeña y las teclas de dirección se han encogido significativamente.
Panel táctil
El touchpad también resultó bastante pequeño, ya que mide sólo 5,4 x 7,7 cm (~2,1 x 3,0 in), que es aproximadamente el tamaño del de un Portátil Asus eee pcde 2008. Por otro lado, el Zenbook parece significativamente mejor hoy en día en términos de acabado. El touchpad consiste en una placa de vidrio bastante gruesa y mate. Responde a hasta cinco puntos táctiles y muestra una baja latencia. A pesar de su pequeño tamaño, no tienes la sensación de tener que cambiar constantemente la posición del dedo o de que las entradas no sean lo bastante precisas. Por desgracia, las dos teclas situadas debajo del touchpad también son ligeramente esponjosas, al igual que el teclado.
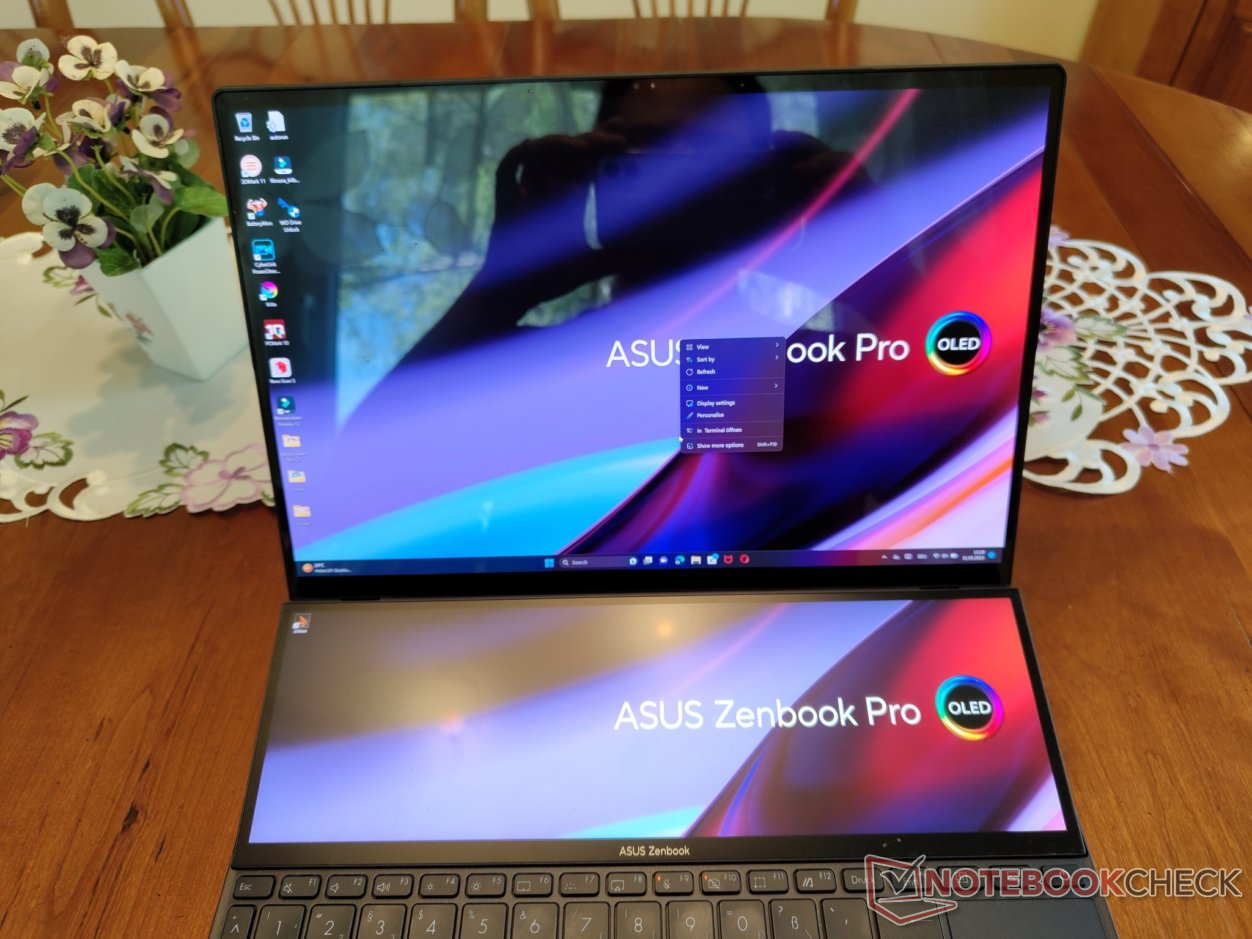
Screenpad+ y pantalla táctil
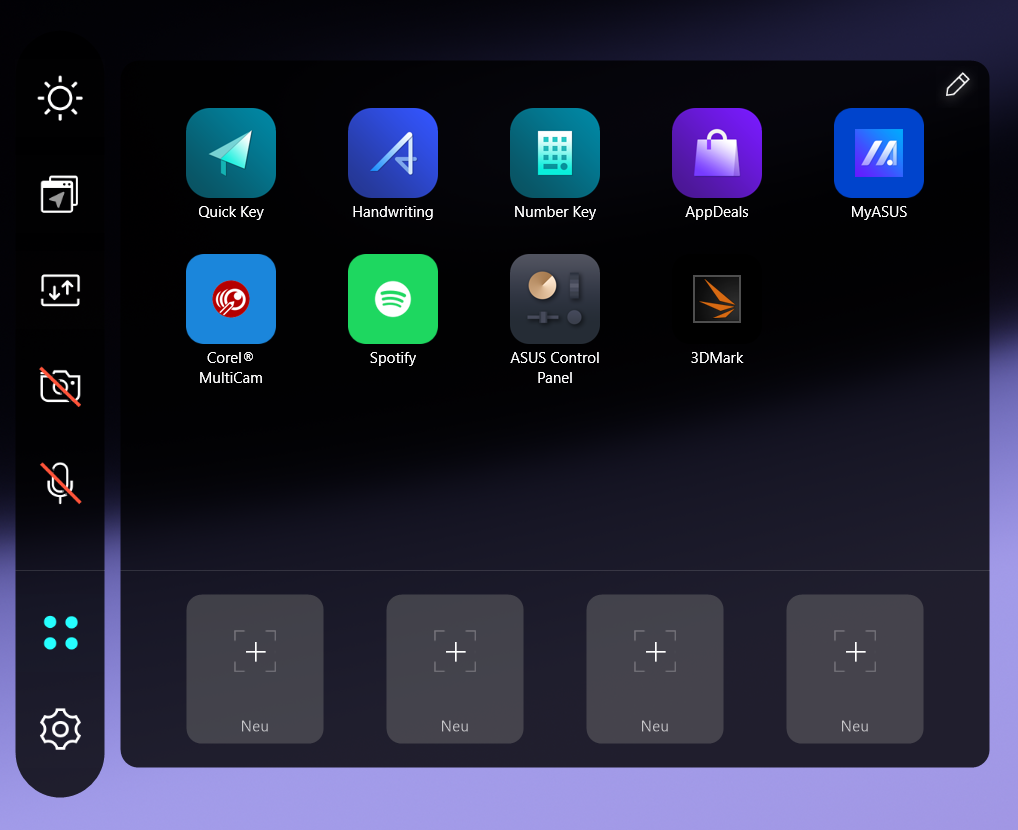
Ambas pantallas del Zenbook Pro Duo responden a entradas táctiles con hasta 10 dedos simultáneamente. Sin embargo, la pantalla principal es un auténtico imán de huellas con su superficie lustrosa, y la superficie mate del Screenpad+ es más adecuada para las entradas táctiles. Asus ha incluido aquí varias funciones adicionales en una práctica barra de menú. La pantalla secundaria también puede usarse como touchpad o bloque numérico.
Desafortunadamente, también vimos en nuestra prueba que Windows ocasionalmente tiene problemas para asociar el hardware de entrada a la pantalla correspondiente. A veces, la entrada táctil o entrada de lápiz MPP 2.0 fue transferida del Screenpad+ a la pantalla principal. Sólo el ASUS Sceenpad 2 Optimizer que es ofrecido por el fabricante para descargaproporcionará un remedio aquí. Esta aplicación asociará todos los dispositivos con la pantalla correcta, pero también requiere reiniciar Windows.
El panel de control del ProArt Creator Hub ofrece barras de control ajustables para el Screenpad+. Aquí puedes encontrar perfiles precreados para varias aplicaciones de Adobe, Microsoft Office y varios navegadores. El Centro de control también ofrece la opción de crear tú mismo las barras de control correspondientes para otros programas. Pero también tenemos que señalar que tenemos algunas dificultades con las entradas necesarias de combinaciones de teclas para lograr esto en nuestra prueba. La razón de esto es que el ProArt Creator Hub utiliza una distribución de teclado en inglés para las entradas, a pesar de que el portátil utiliza una distribución de teclado en alemán y el idioma alemán. Sólo podemos crear entradas útiles mediante la conexión de un teclado externo con el diseño de EE.UU., ya que incluso el teclado en pantalla de Windows tiene el diseño equivocado aquí.
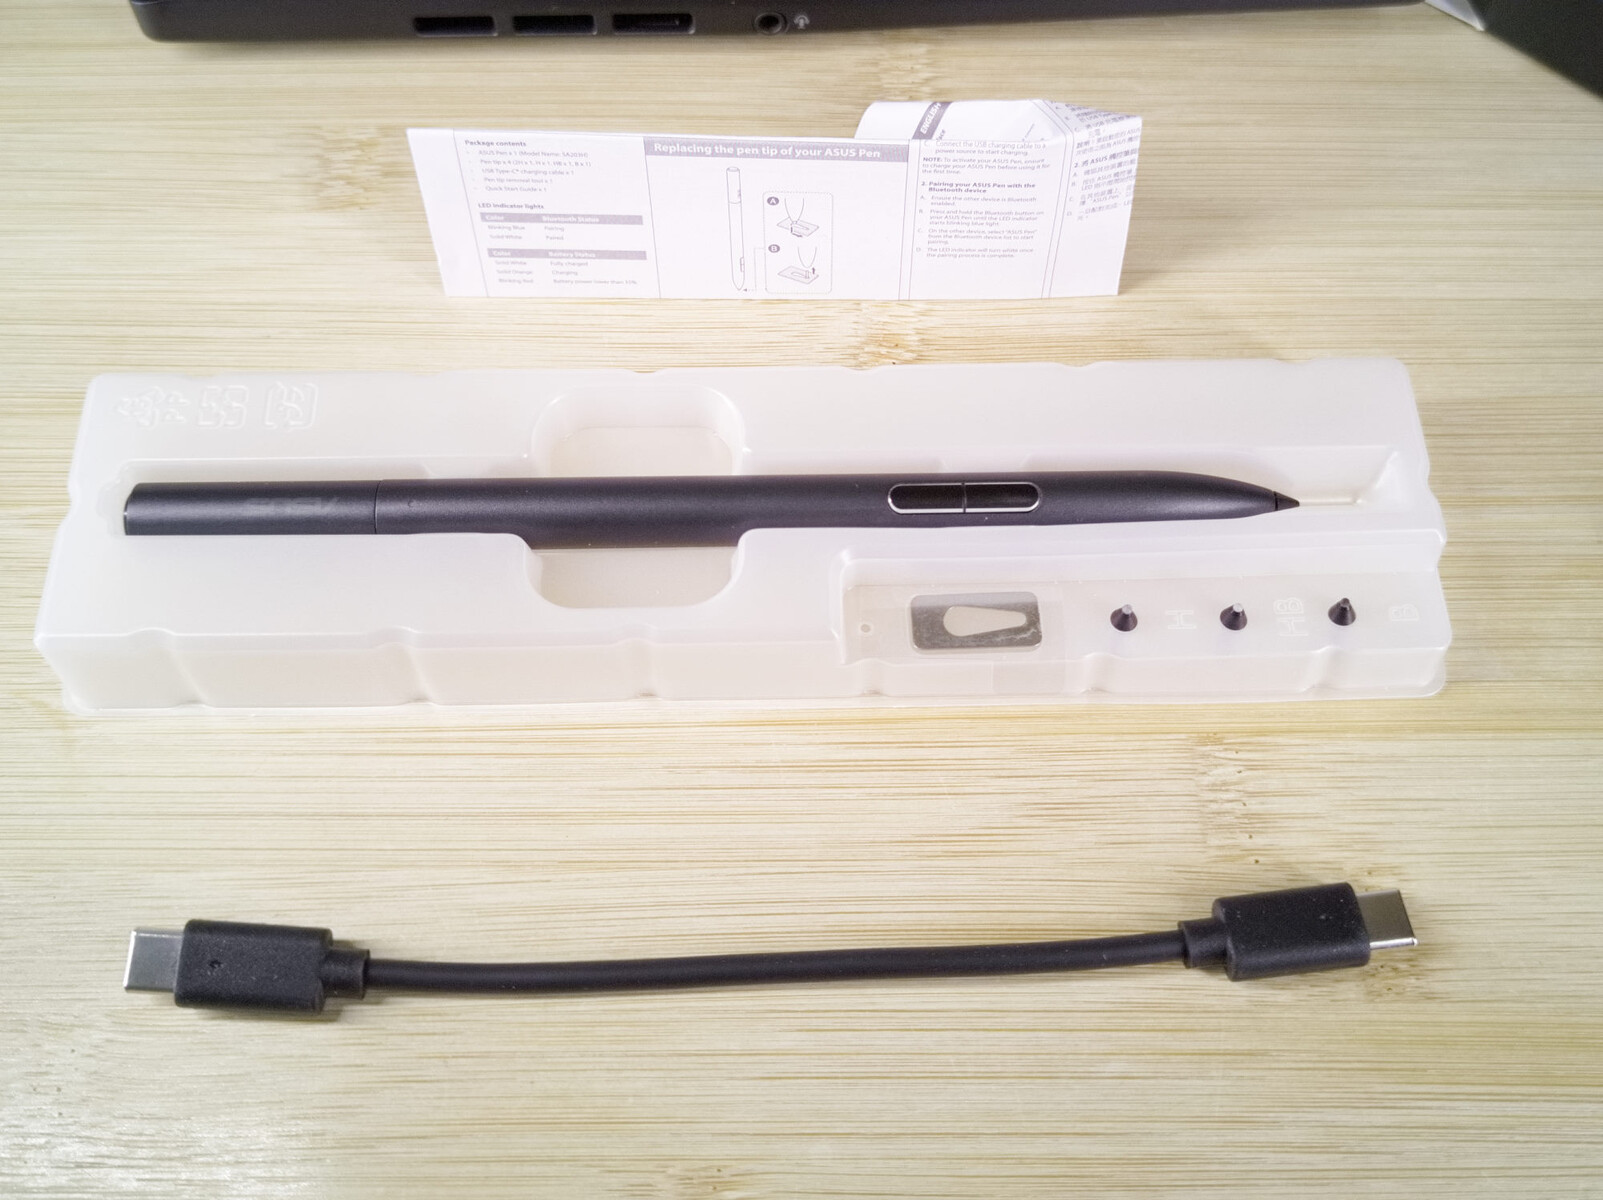
Bolígrafo Asus 2.0
El Asus Pen 2.0 es compatible con el estándar MPP 2. Gracias a su batería interna y al puerto USB-C, el lápiz de entrada no necesita pilas. Asus también incluye varias puntas de entrada que producen diferentes cantidades de fricción en la pantalla. No se puede sujetar o insertar el lápiz en el propio portátil, pero la funda incluida tiene un bucle para el lápiz.
El lápiz ofrece tres teclas programables. Soporta 4096 niveles de presión pero no tiene sensor de posición. Esto significa que el punto de entrada no siempre está exactamente debajo de la punta del bolígrafo.
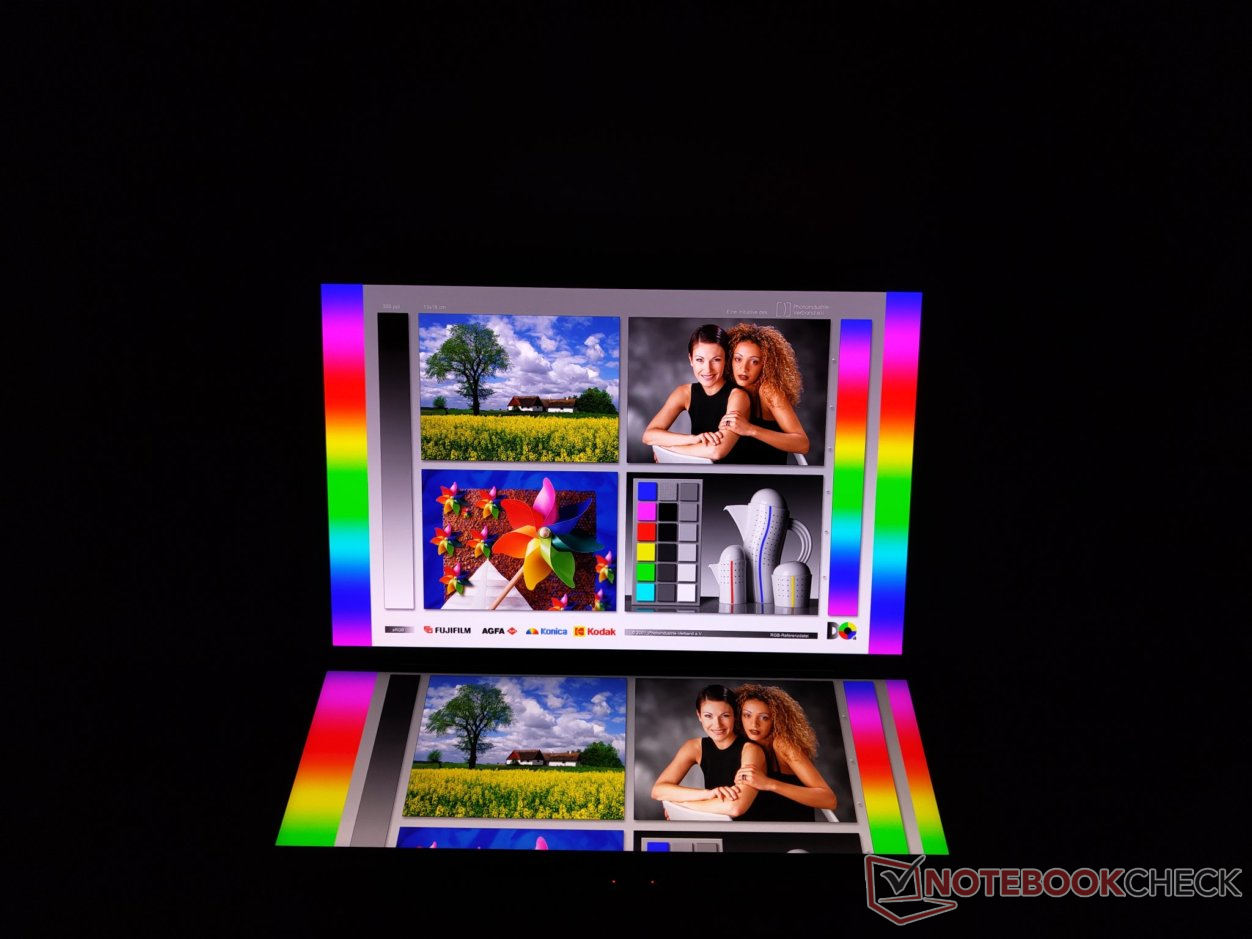
Pantalla - Superficie de pantalla significativamente mayor
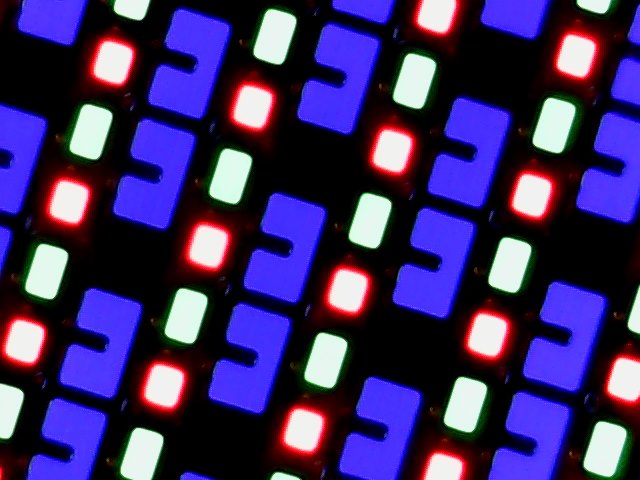
Asus usa un display OLED rico en contraste con 120 Hz como display principal del Zenbook Pro Duo. Sus puntos fuertes son los cortos tiempos de respuesta y una excelente reproducción del color. Con 2,880 × 1,800 pixels, tiene una alta resolución de 243 ppi. Sin embargo, el display reflectante también tiene sus debilidades, y particularmente algunos reflejos siguen molestando al usuario. Las fuentes de luz se reflejan claramente en las distintas capas de la pantalla táctil, lo que permite ver incluso las trazas conductoras individuales. Como es típico en las pantallas OLED, no hay fallos en la iluminación.
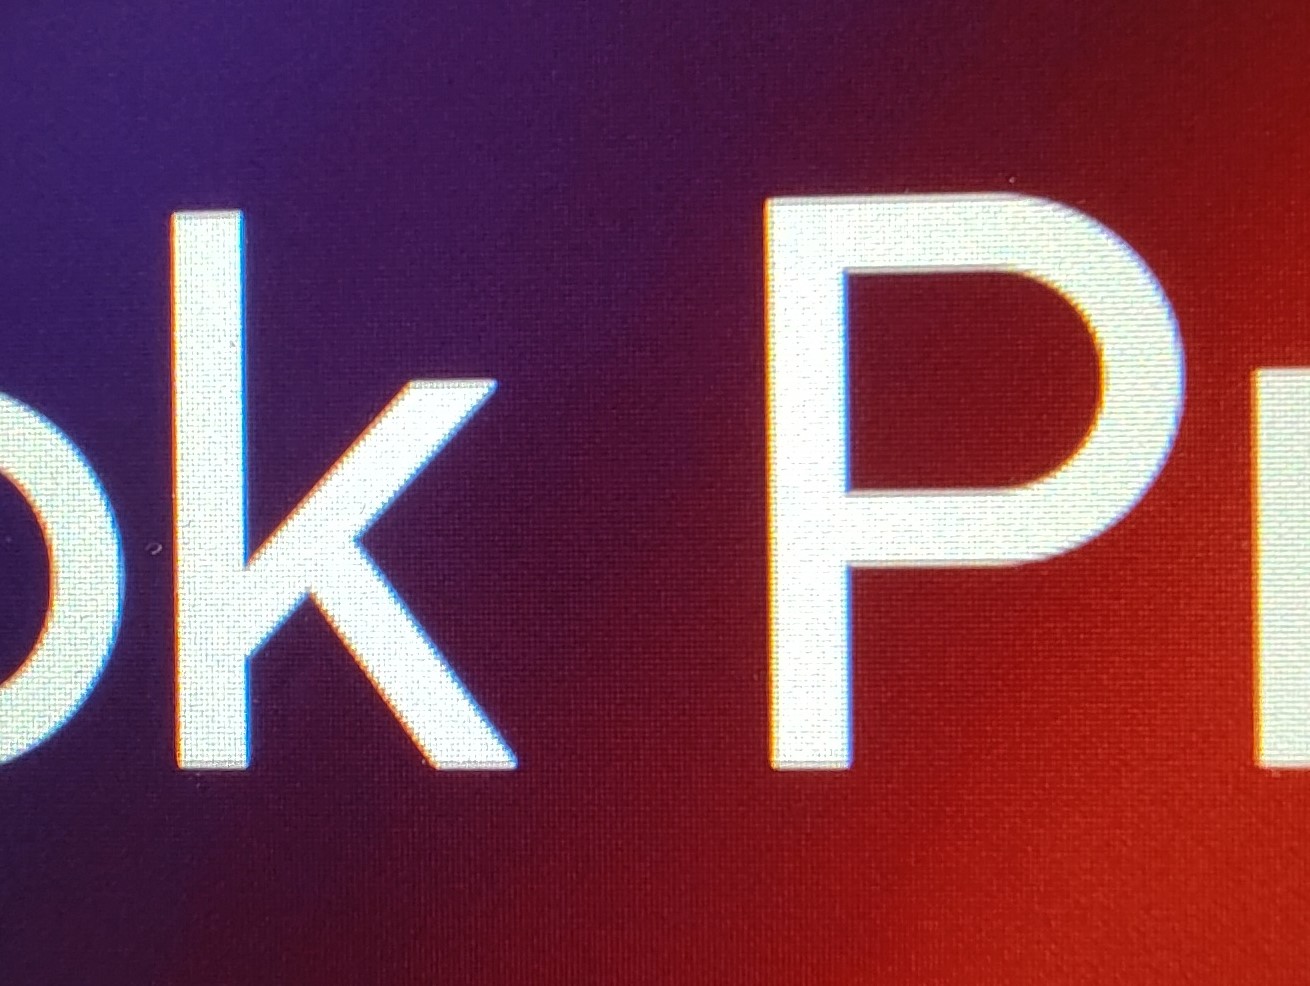
Mientras que Asus utiliza un nuevo panel para la pantalla principal, el Screenpad+ permanece sin cambios. Para un análisis más detallado de la pantalla secundaria, le remitimos a nuestra prueba del modelo hermano. La pantalla secundaria mate usa un panel IPS con una resolución de 2.880 × 864 píxeles. Sin embargo, debido a la superficie mate, la alta resolución no es del todo efectiva, y la imagen aparece ligeramente granulada aquí. Esto puede verse principalmente en las transiciones de color de alto contraste. Además, la mayor parte del tiempo Windows es incapaz de usar la segunda pantalla tanto como esperábamos. Mientras que la pantalla principal puede ajustarse con escalado de 100% a 250%, la pantalla secundaria sólo ofrece 100% y 125%. Esto también significa que al mover Windows entre la pantalla principal y la secundaria, el tamaño de los elementos mostrados cambia constantemente.
| |||||||||||||||||||||||||
iluminación: 99 %
Brillo con batería: 336 cd/m²
Contraste: 170000:1 (Negro: 0.002 cd/m²)
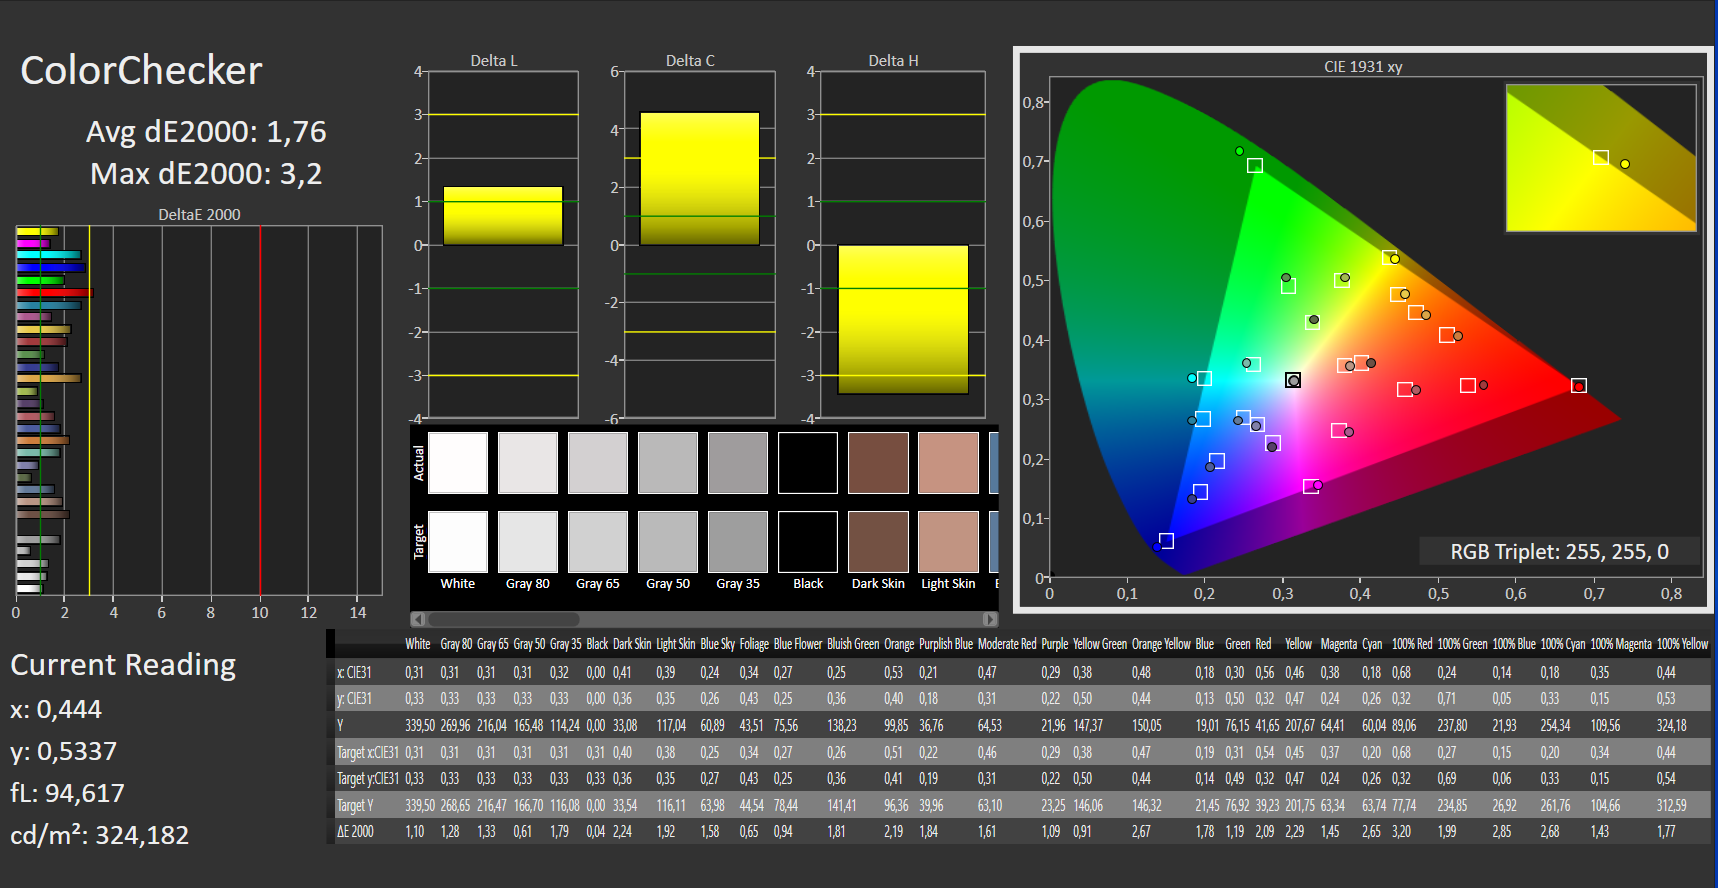
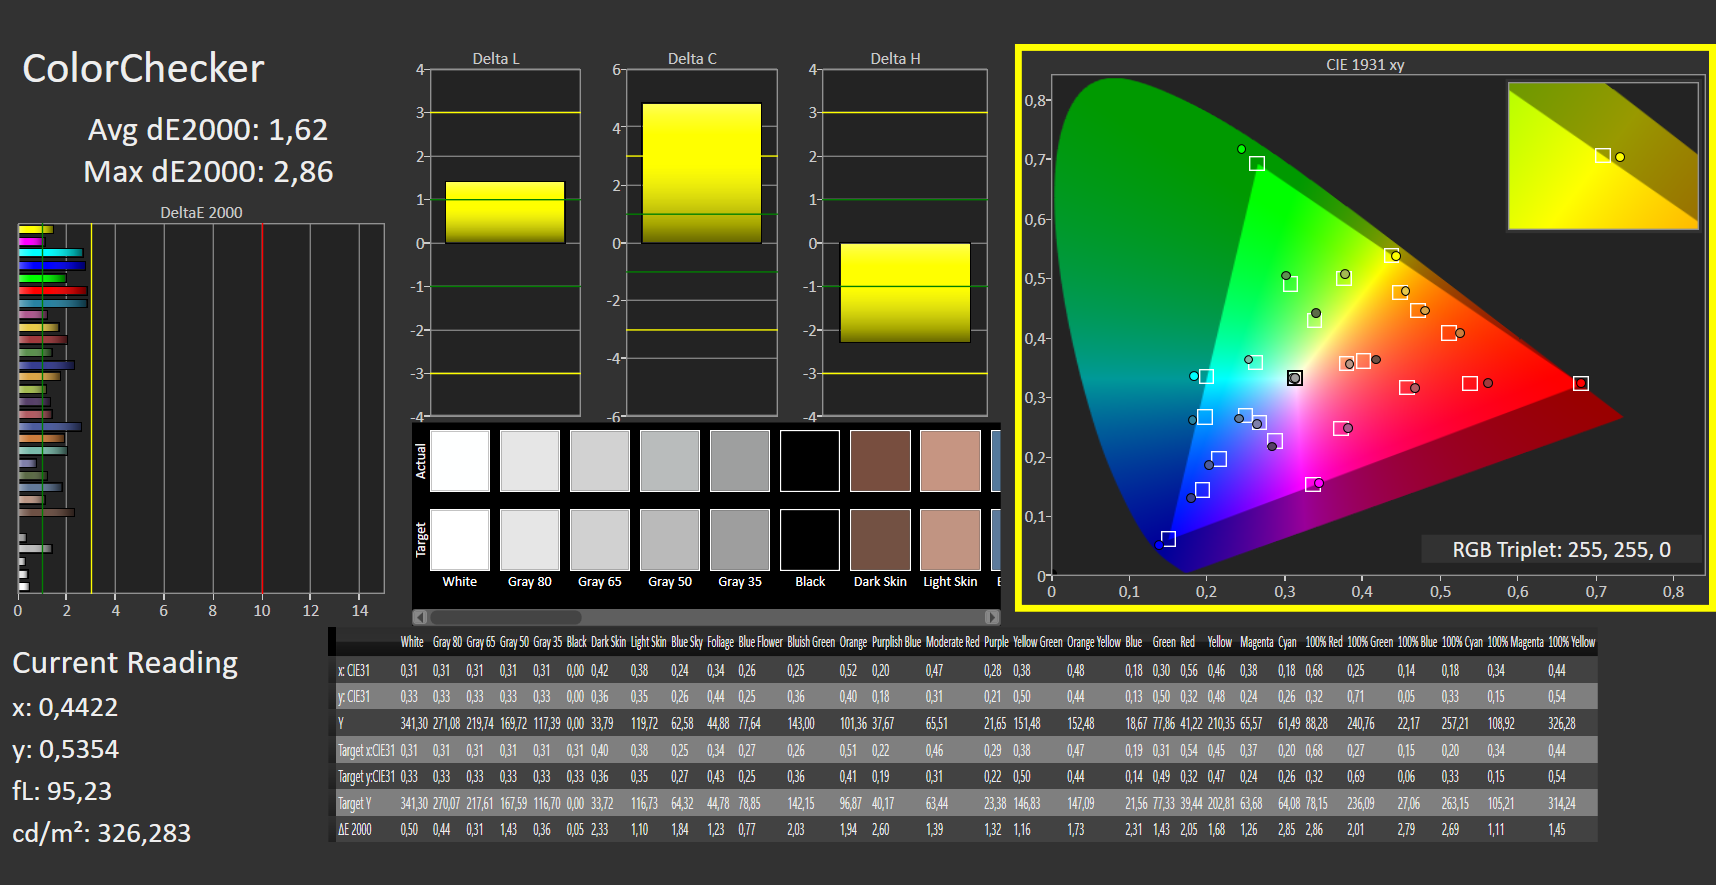
ΔE ColorChecker Calman: 1.76 | ∀{0.5-29.43 Ø4.71}
calibrated: 1.62
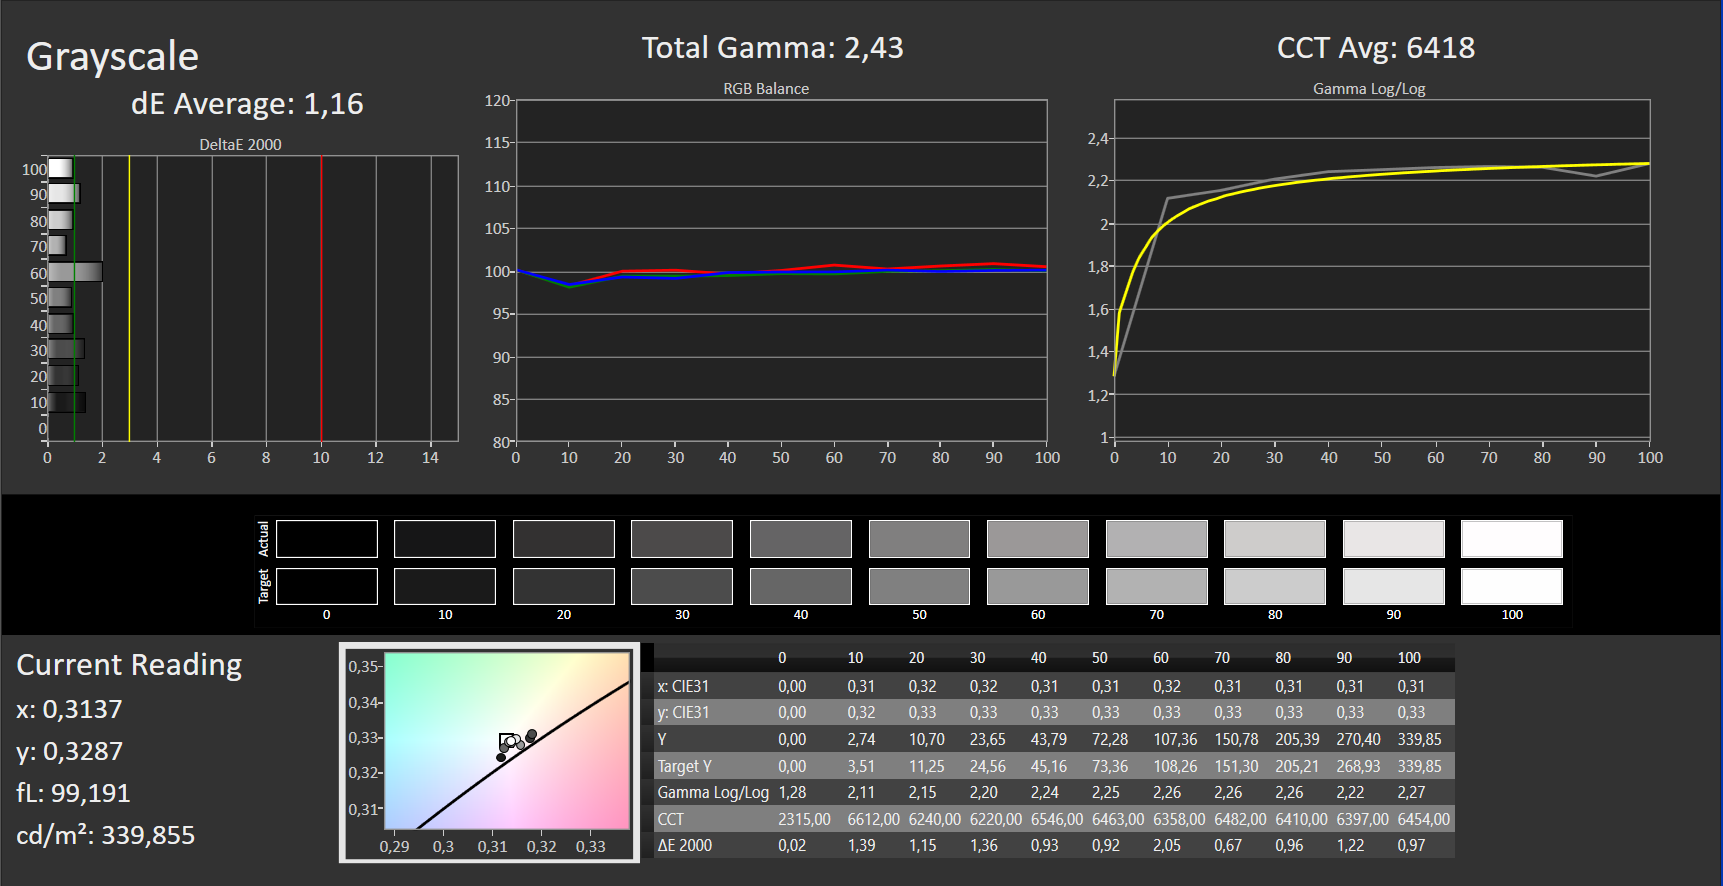
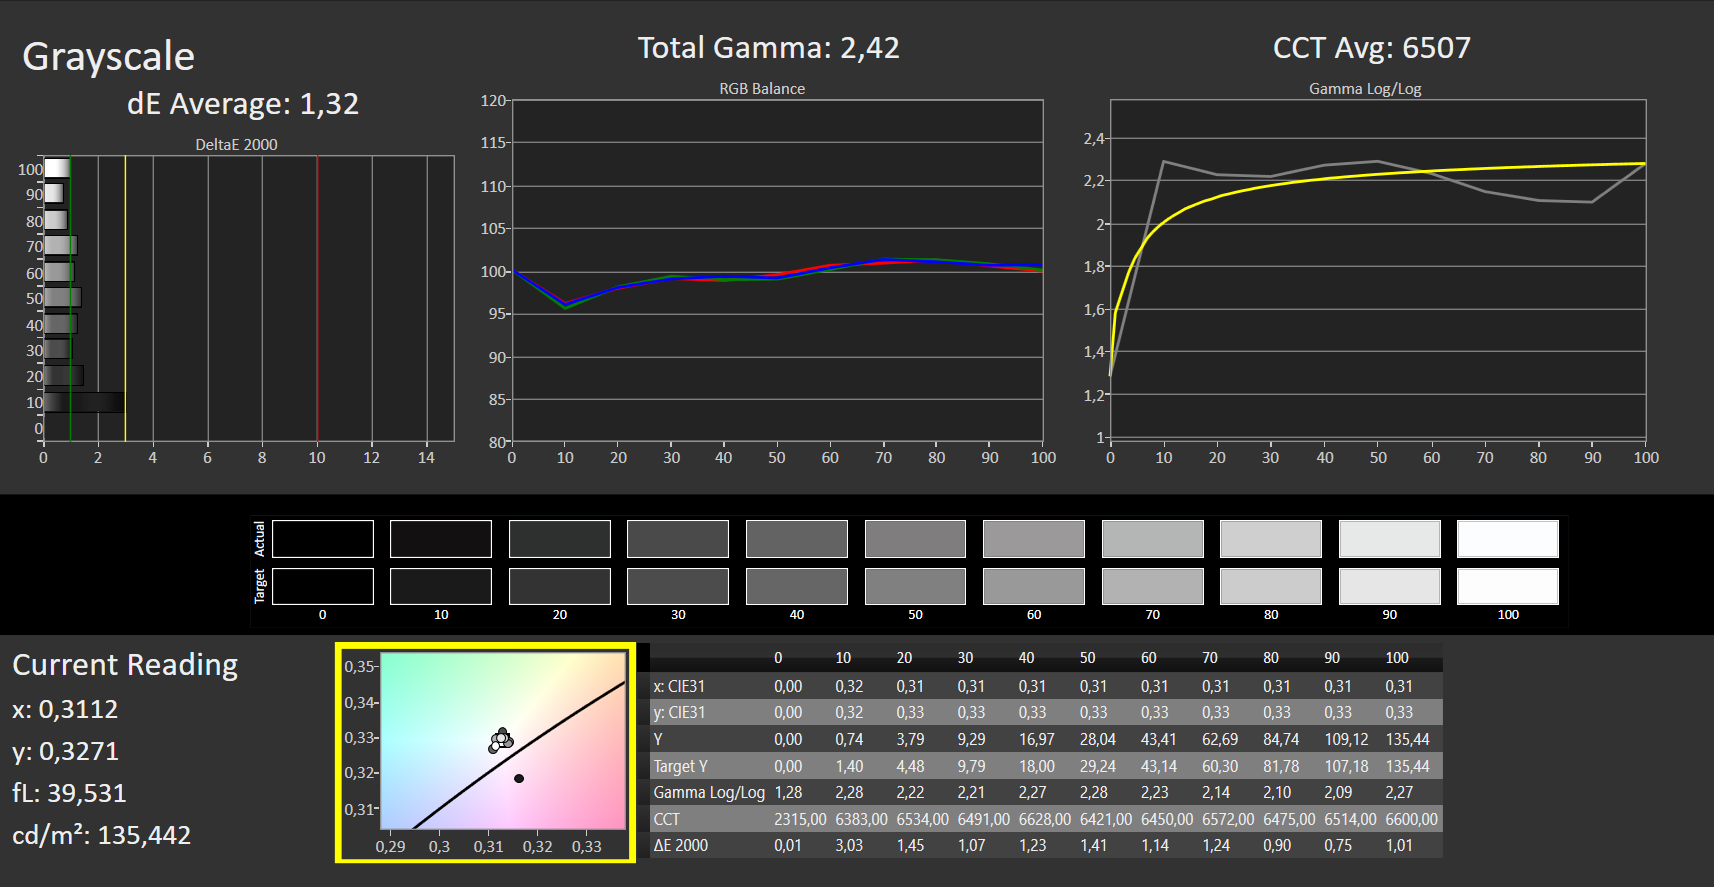
ΔE Greyscale Calman: 1.16 | ∀{0.09-98 Ø4.96}
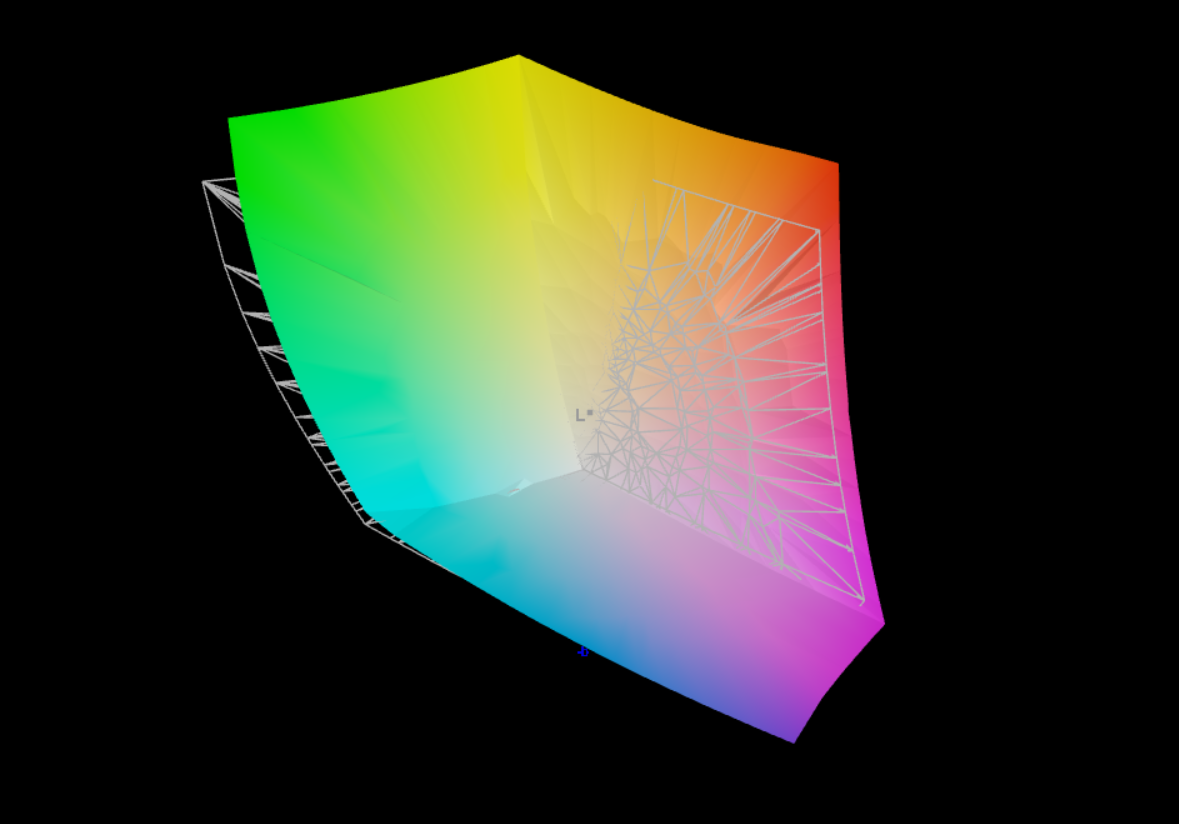
95.35% AdobeRGB 1998 (Argyll 3D)
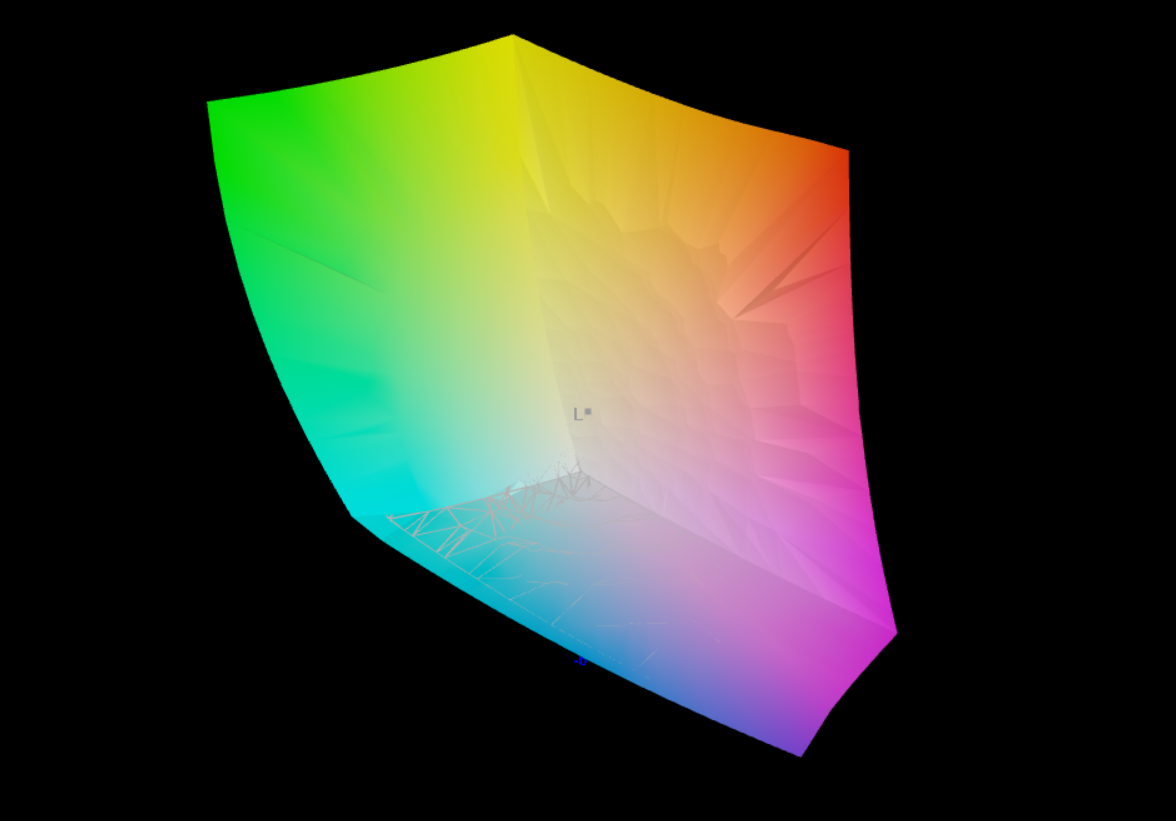
100% sRGB (Argyll 3D)
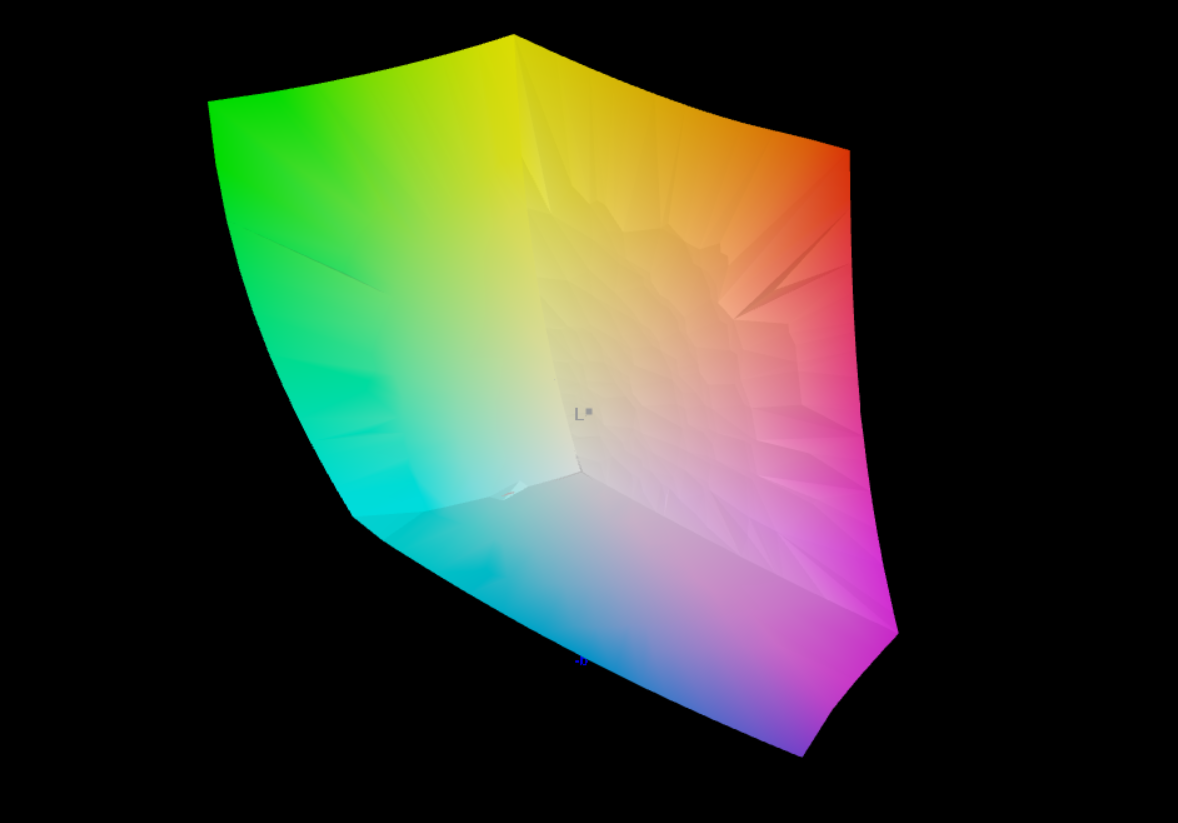
99.91% Display P3 (Argyll 3D)
Gamma: 2.43
CCT: 6418 K
| Asus ZenBook Pro 14 Duo UX8402VV-P1021W ATNA45AF04-0 , OLED, 2880x1800, 14.5" | Acer Predator Triton 300 SE Samsung ATNA40YK07-0, OLED, 2880x1800, 14" | Lenovo Yoga Pro 7 14IRH G8 LEN145-3K, IPS, 3072x1920, 14.5" | Gigabyte Aero 14 OLED BMF Samsung SDC4192 (ATNA40YK14-0), OLED, 2880x1800, 14" | Asus Zephyrus Duo 16 GX650PY-NM006W NE160QDM-NM4, MiniLED, 2560x1600, 16" | Schenker Vision 14 2022 RTX 3050 Ti MNE007ZA1-1, IPS, 2880x1800, 14" | Asus Zenbook Pro 14 Duo OLED UX8402ZA ATNA45AF01-0, OLED, 2880x1800, 14.5" | Asus VivoBook S 14X S5402Z Samsung ATNA45AF01-0, OLED, 2880x1800, 14.5" | |
|---|---|---|---|---|---|---|---|---|
| Display | 1% | -3% | -2% | -2% | -17% | 1% | 0% | |
| Display P3 Coverage (%) | 99.91 | 99.9 0% | 98.7 -1% | 99.8 0% | 99.4 -1% | 74.1 -26% | 99.9 0% | 99.9 0% |
| sRGB Coverage (%) | 100 | 100 0% | 100 0% | 100 0% | 100 0% | 97.4 -3% | 100 0% | 100 0% |
| AdobeRGB 1998 Coverage (%) | 95.35 | 99 4% | 87.6 -8% | 88.7 -7% | 90.8 -5% | 75.3 -21% | 97.4 2% | 95.5 0% |
| Response Times | 32% | -1083% | -20% | -755% | -1050% | -20% | 57% | |
| Response Time Grey 50% / Grey 80% * (ms) | 2 ? | 1.36 ? 32% | 31.5 ? -1475% | 2.4 ? -20% | 15.2 ? -660% | 31.5 ? -1475% | 2.4 ? -20% | 0.73 ? 63% |
| Response Time Black / White * (ms) | 2 ? | 1.36 ? 32% | 15.8 ? -690% | 2.4 ? -20% | 19 ? -850% | 14.5 ? -625% | 2.4 ? -20% | 1 ? 50% |
| PWM Frequency (Hz) | 240 | 367.6 ? | 300 | 12000 ? | 240 ? | 240.4 ? | ||
| Screen | -53% | -1858% | -527% | -380% | -1602% | -131% | -21% | |
| Brightness middle (cd/m²) | 340 | 414.3 22% | 441 30% | 423 24% | 712 109% | 421 24% | 356 5% | 373 10% |
| Brightness (cd/m²) | 340 | 416 22% | 453 33% | 427 26% | 703 107% | 416 22% | 357 5% | 375 10% |
| Brightness Distribution (%) | 99 | 99 0% | 92 -7% | 98 -1% | 95 -4% | 89 -10% | 99 0% | 99 0% |
| Black Level * (cd/m²) | 0.002 | 0.34 -16900% | 0.1 -4900% | 0.07 -3400% | 0.28 -13900% | 0.02 -900% | ||
| Contrast (:1) | 170000 | 1297 -99% | 4230 -98% | 10171 -94% | 1504 -99% | 17800 -90% | ||
| Colorchecker dE 2000 * | 1.76 | 4.68 -166% | 0.6 66% | 0.55 69% | 1.7 3% | 3.2 -82% | 2.6 -48% | 2.26 -28% |
| Colorchecker dE 2000 max. * | 3.2 | 7.78 -143% | 1.3 59% | 1.15 64% | 4 -25% | 5.5 -72% | 4.5 -41% | 6.22 -94% |
| Colorchecker dE 2000 calibrated * | 1.62 | 0.6 63% | 1.15 29% | 1.2 26% | 2 -23% | 2 -23% | ||
| Greyscale dE 2000 * | 1.16 | 1.8 -55% | 0.8 31% | 0.69 41% | 2.8 -141% | 4.4 -279% | 2.2 -90% | 1.4 -21% |
| Gamma | 2.43 91% | 2.22 99% | 2.2 100% | 2.42 91% | 2.21 100% | 2.22 99% | 2.2 100% | 2.22 99% |
| CCT | 6418 101% | 6207 105% | 6597 99% | 6479 100% | 6978 93% | 6384 102% | 6246 104% | 6417 101% |
| Media total (Programa/Opciones) | -7% /
-23% | -981% /
-1350% | -183% /
-342% | -379% /
-353% | -890% /
-1184% | -50% /
-87% | 12% /
-1% |
* ... más pequeño es mejor
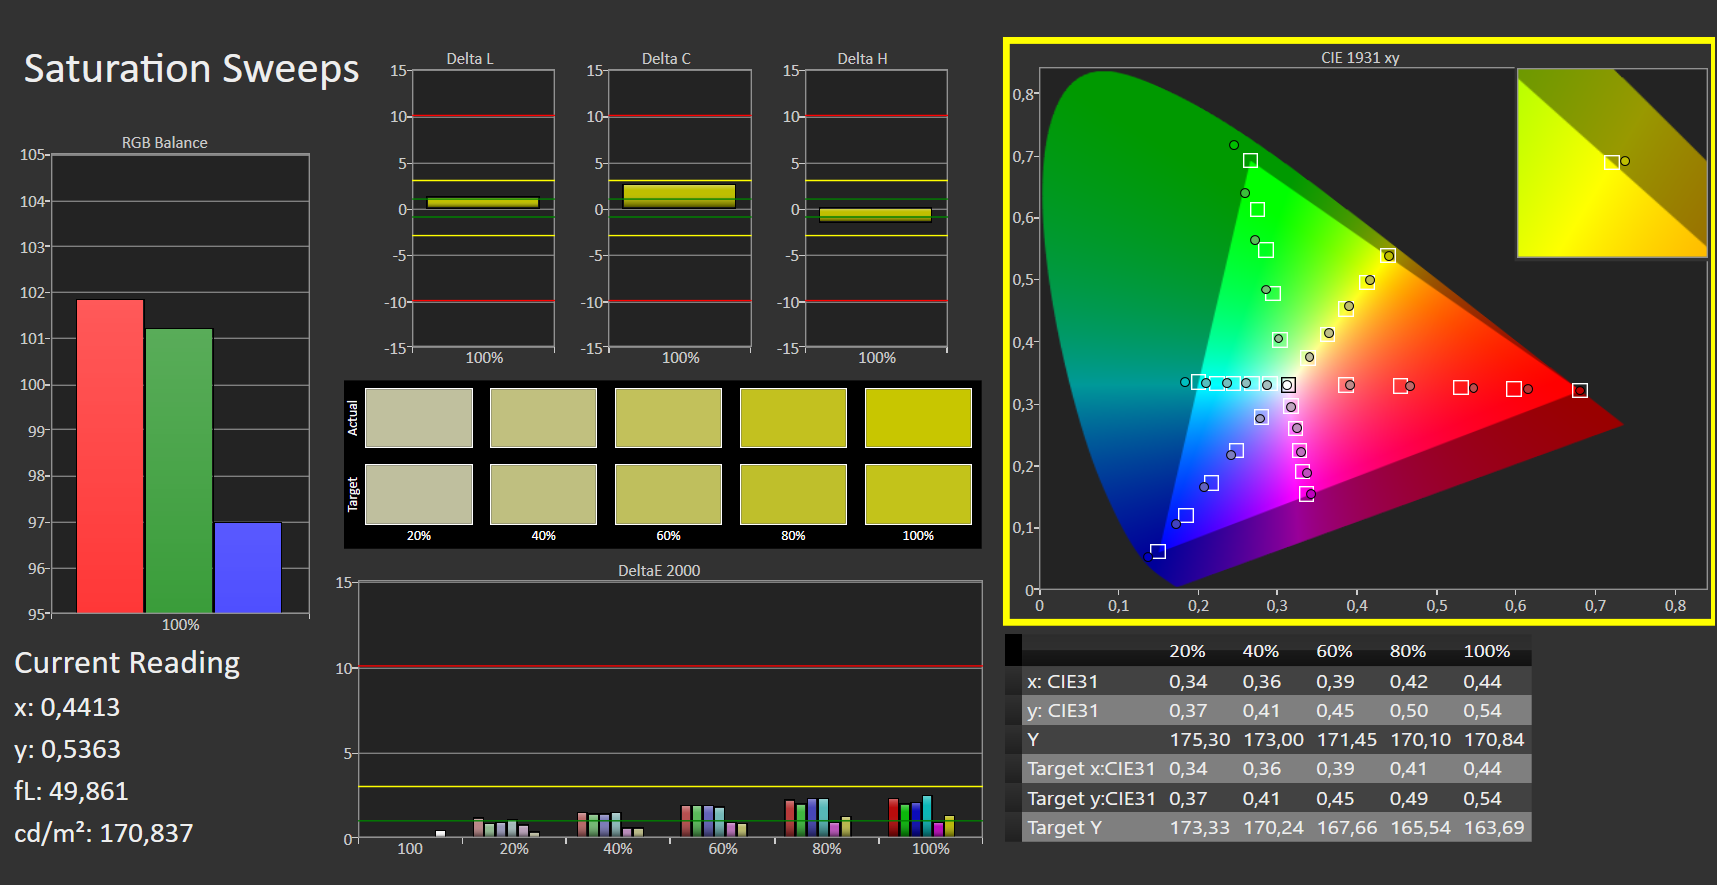
La pantalla OLED es capaz de reproducir los espacios de color sRGB y DisplayP3 casi por completo, y el Zenbook también cubre el 95% del espacio de color AdobeRGB, más importante para los fotógrafos.
El perfil ICC que creamos (enlace de descarga en el cuadro de información anterior) sólo mejora ligeramente la reproducción del color del Zenbook Pro 14 Duo, que ya era muy buena, haciendo que las desviaciones absolutas de color caigan ligeramente por debajo de ΔΕ 3. Sin embargo, esto también va en detrimento de la Escala de grises, dónde las desviaciones de color aumentan ligeramente. Sin embargo, esto también va en detrimento de la Escala de Grises, dónde las desviaciones de color aumentan ligeramente.
Antes del calibrado del display usando X-Rite i1 Pro y Calman ColorChecker, los valores de color ya son muy precisos, y sólo ojos entrenados reconocerán alguna diferencia. El ProArt Creator Hub también ofrece una opción para calibrar los colores, pero actualmente sólo soporta el calibrador de color i1Display.

Tiempos de respuesta del display
| ↔ Tiempo de respuesta de Negro a Blanco | ||
|---|---|---|
| 2 ms ... subida ↗ y bajada ↘ combinada | ↗ 1 ms subida |  |
| ↘ 1 ms bajada | ||
| La pantalla mostró tiempos de respuesta muy rápidos en nuestros tests y debería ser adecuada para juegos frenéticos. En comparación, todos los dispositivos de prueba van de ##min### (mínimo) a 240 (máximo) ms. » 11 % de todos los dispositivos son mejores. Esto quiere decir que el tiempo de respuesta medido es mejor que la media (19.8 ms) de todos los dispositivos testados. | ||
| ↔ Tiempo de respuesta 50% Gris a 80% Gris | ||
| 2 ms ... subida ↗ y bajada ↘ combinada | ↗ 1 ms subida |  |
| ↘ 1 ms bajada | ||
| La pantalla mostró tiempos de respuesta muy rápidos en nuestros tests y debería ser adecuada para juegos frenéticos. En comparación, todos los dispositivos de prueba van de ##min### (mínimo) a 636 (máximo) ms. » 10 % de todos los dispositivos son mejores. Esto quiere decir que el tiempo de respuesta medido es mejor que la media (31 ms) de todos los dispositivos testados. | ||
Parpadeo de Pantalla / PWM (Pulse-Width Modulation)
| Parpadeo de Pantalla / PWM detectado | 240 Hz |  | |
La retroiluminación del display parpadea a 240 Hz (seguramente usa PWM - Pulse-Width Modulation) . La frecuencia de 240 Hz es relativamente baja, por lo que la gente sensible debería ver parpadeos y padecer fatiga visual por la pantalla (usado al brillo indicado a continuación). Comparación: 52 % de todos los dispositivos testados no usaron PWM para atenuar el display. Si se usó, medimos una media de 7754 (mínimo: 5 - máxmo: 343500) Hz. | |||


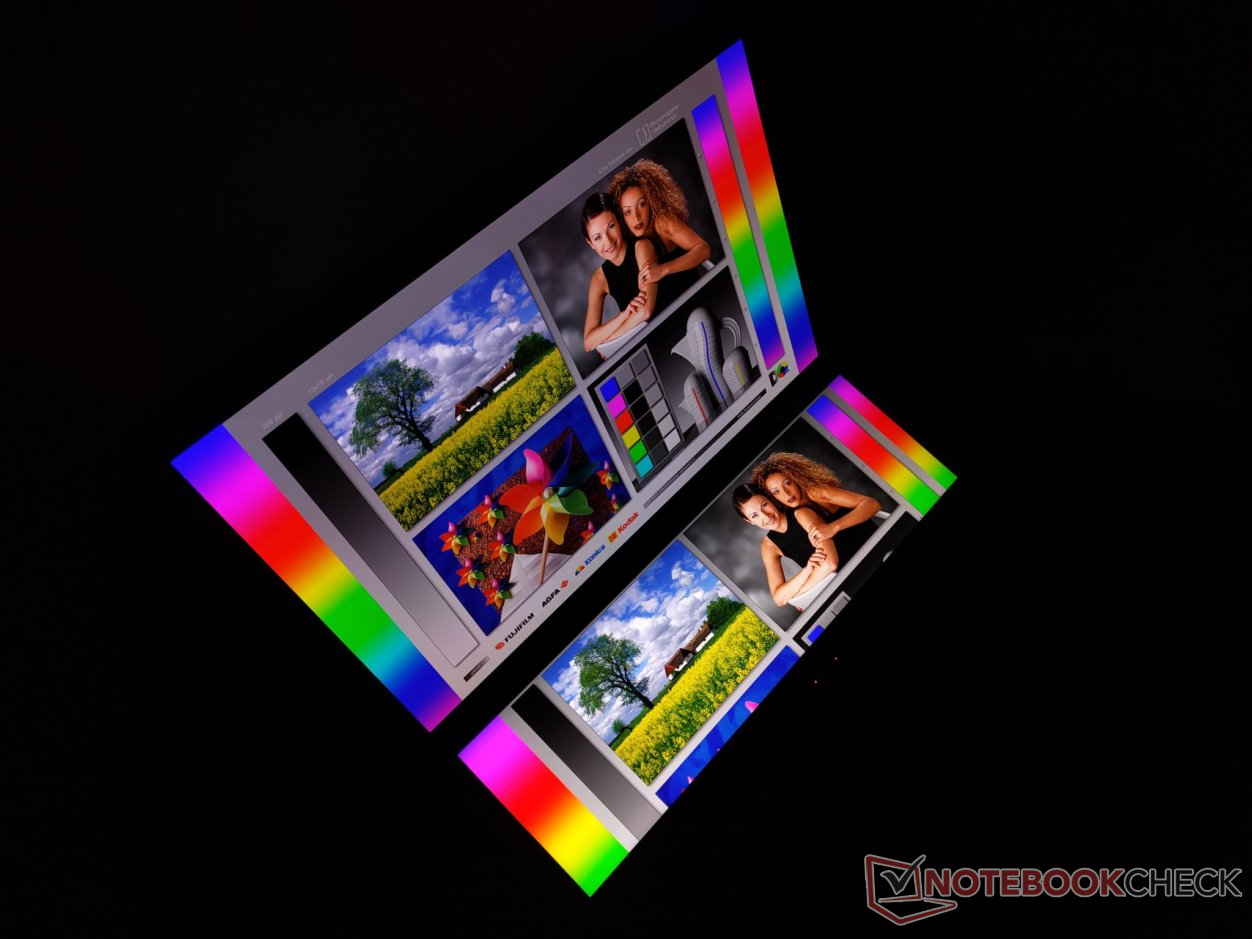
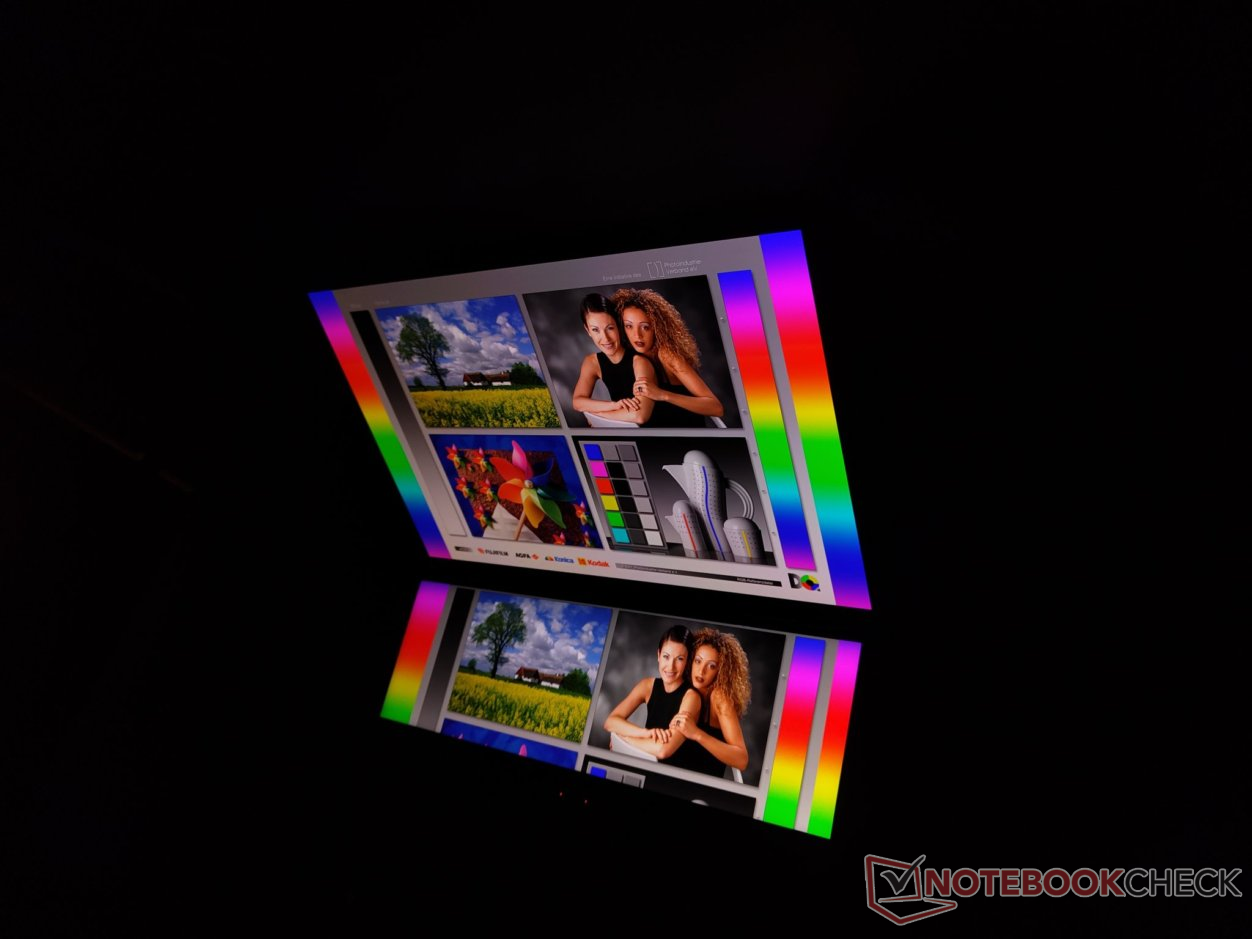
En exteriores, el Screenpad+ es mucho más fácil de leer que la pantalla principal. Sin embargo, la legibilidad de la pequeña pantalla también se ve afectada en cierta medida por fuentes de luz intensa desde arriba.
Como es típico de las pantallas OLED e IPS, ambas pantallas también ofrecen una buena imagen incluso desde ángulos de visión más pronunciados. Apenas se aprecian desviaciones de color ni cambios de brillo.
Rendimiento: una potente combinación de RTX 4060 e Intel Core i9
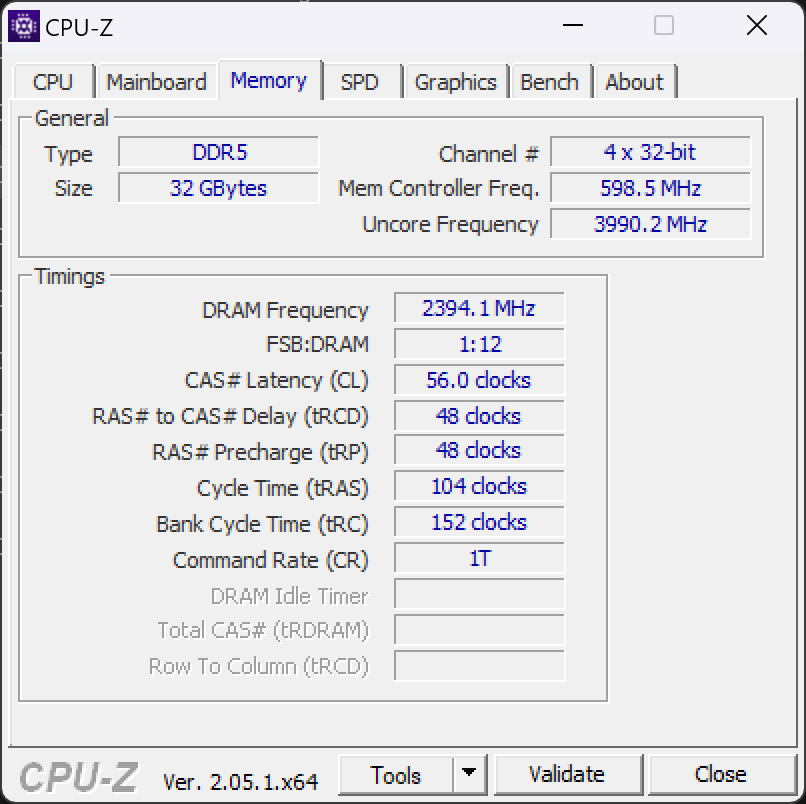
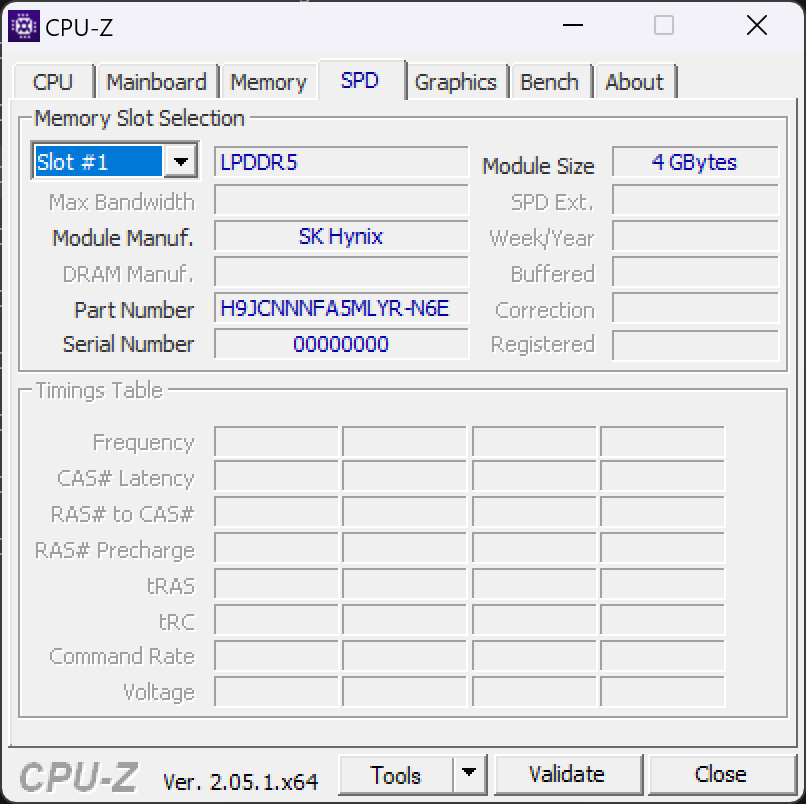
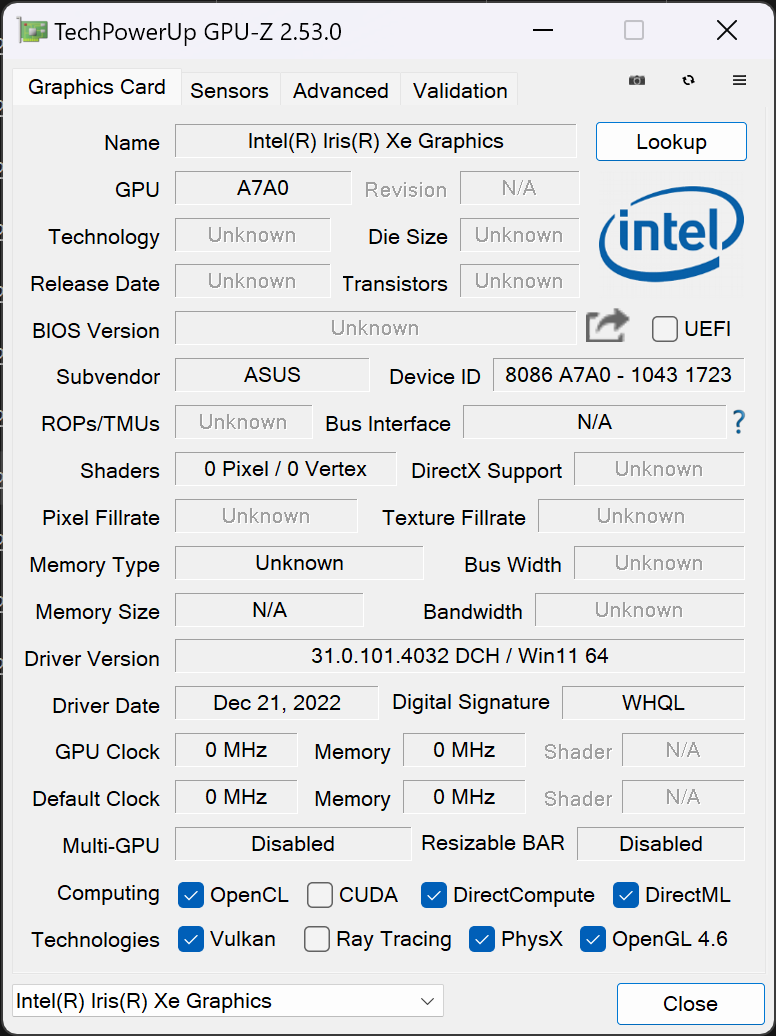
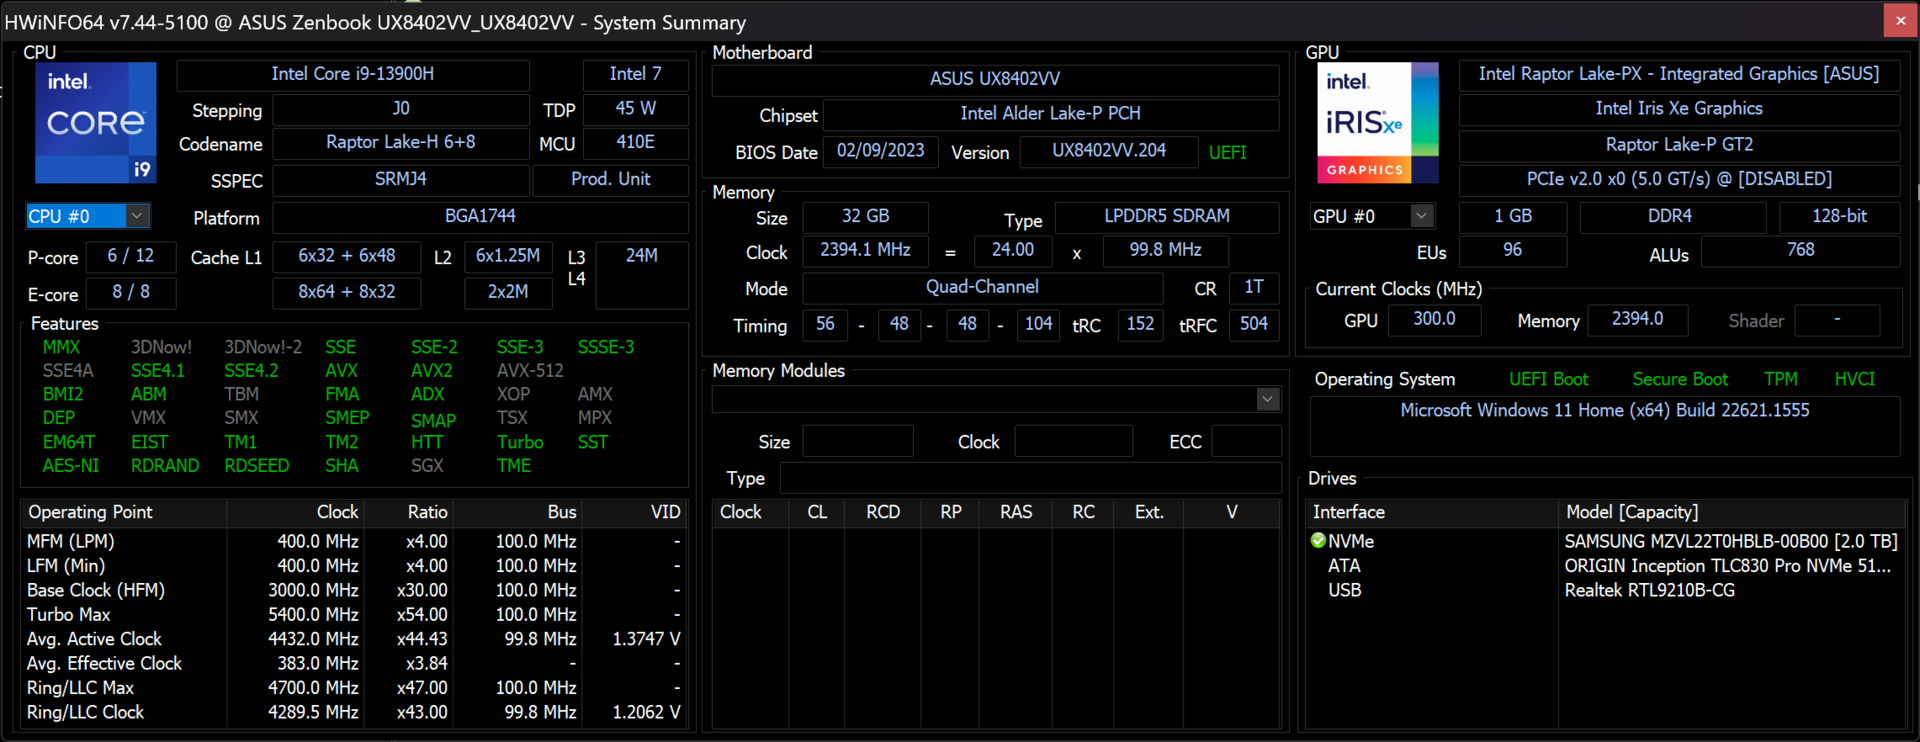
El Asus Zenbook Pro 14 Duo está disponible en varias configuraciones de equipo. Puedes elegir entre procesadores Intel Core i7 e i9 de la 12ª y 13ª generación que se apoyan en hasta 32 GB de memoria de trabajo. También hay varias versiones de equipamiento en cuanto a los chips gráficos, y las opciones disponibles van desde la IGPU Intel Iris Xedel i7, pasando por la Nvidia GeForce RTX 3050y 4050hasta la RTX 4060.
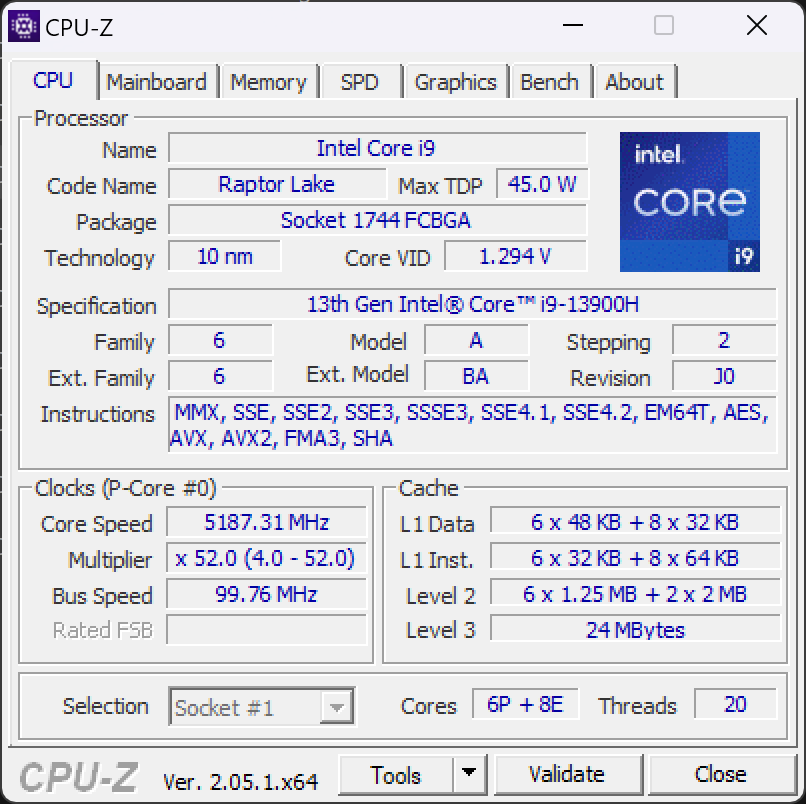
Nuestra unidad de prueba está equipada con un Intel Core i9-13900Hy Nvidia GeForce RTX 4060. El procesador está respaldado por 32 GB de almacenamiento DDR5. Con el equipo superior, el portátil es extremadamente productivo, pero también es capaz de funcionar eficientemente usando el conmutador MUX. Juegos, aplicaciones 3D, procesamiento creativo de imágenes y vídeo, así como aplicaciones CAD no representan ningún problema para el portátil.
Control del rendimiento y condiciones de ensayo
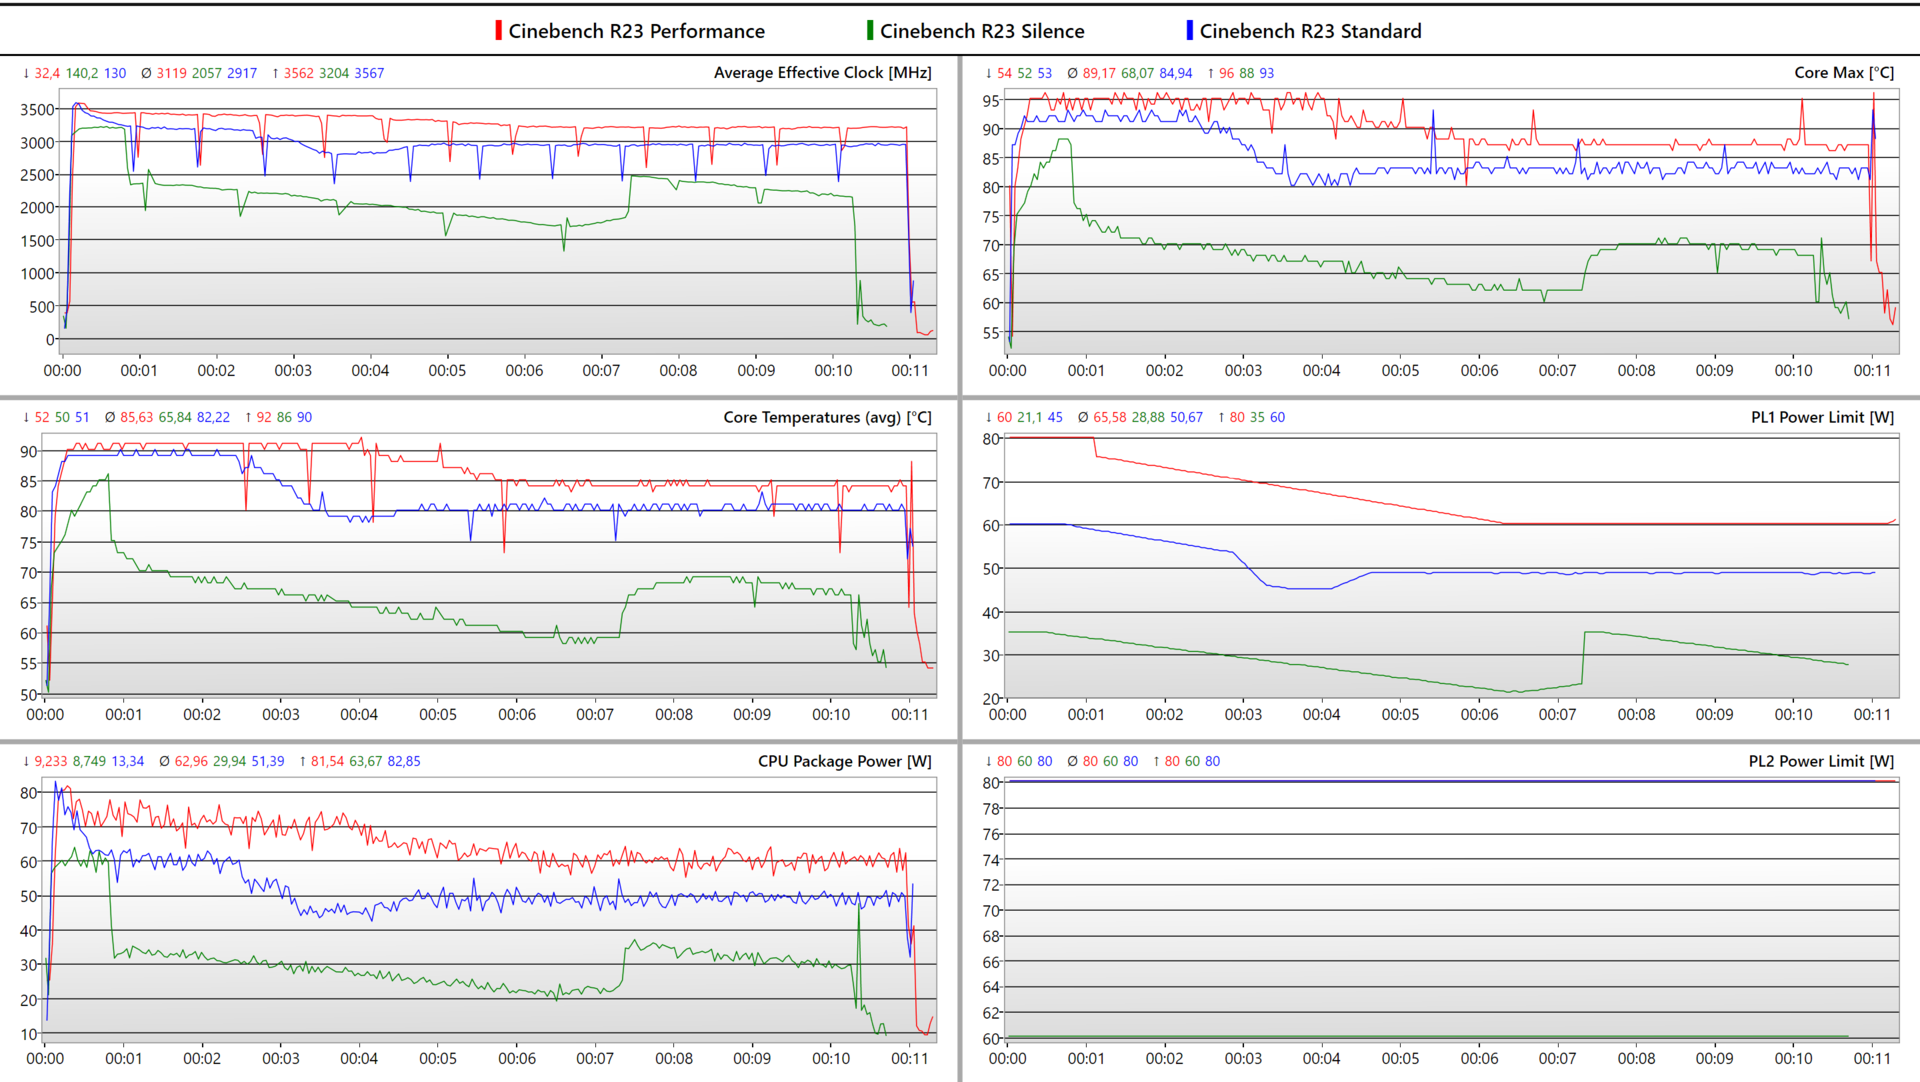
Usando ProArt Creator Hub o MyAsus App, puedes seleccionar entre los tres perfiles de energía Rendimiento, Estándar y Silencioso. Ninguno de los perfiles permite al procesador mantener su rendimiento constantemente. En los modos Rendimiento y Estándar, el rendimiento Boost del i9 está limitado a 80 vatios, y el modo Silencioso permite un PL2 de 60 vatios. En el modo Rendimiento, el PL1 del Intel Core i9-13900Htambién es de 80 vatios al principio, mientras que es de 60 y 35 vatios en los modos Estándar y Silencioso respectivamente. El PL1 se ajusta dinámicamente aquí. Durante nuestro test, tenemos que notar que el Zenbook es incapaz de mantener estos rendimientos durante un periodo de tiempo más largo. En 10 minutos bajo carga, el límite de potencia se reduce en todos los modos de energía entre 10 y 20 vatios.
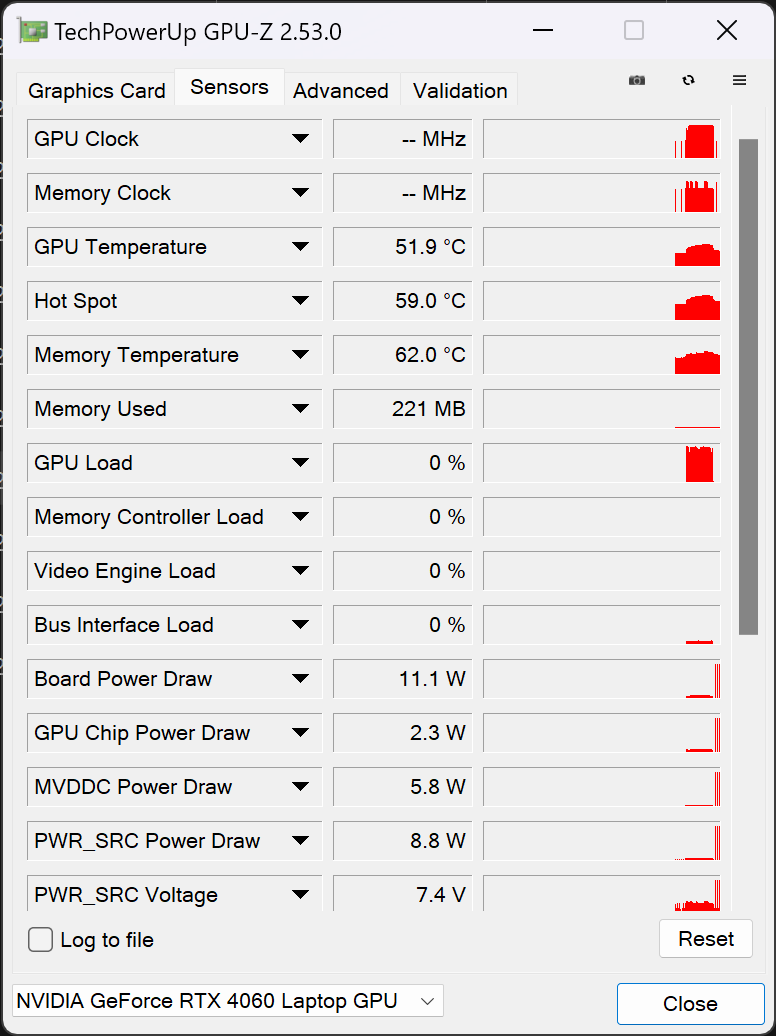
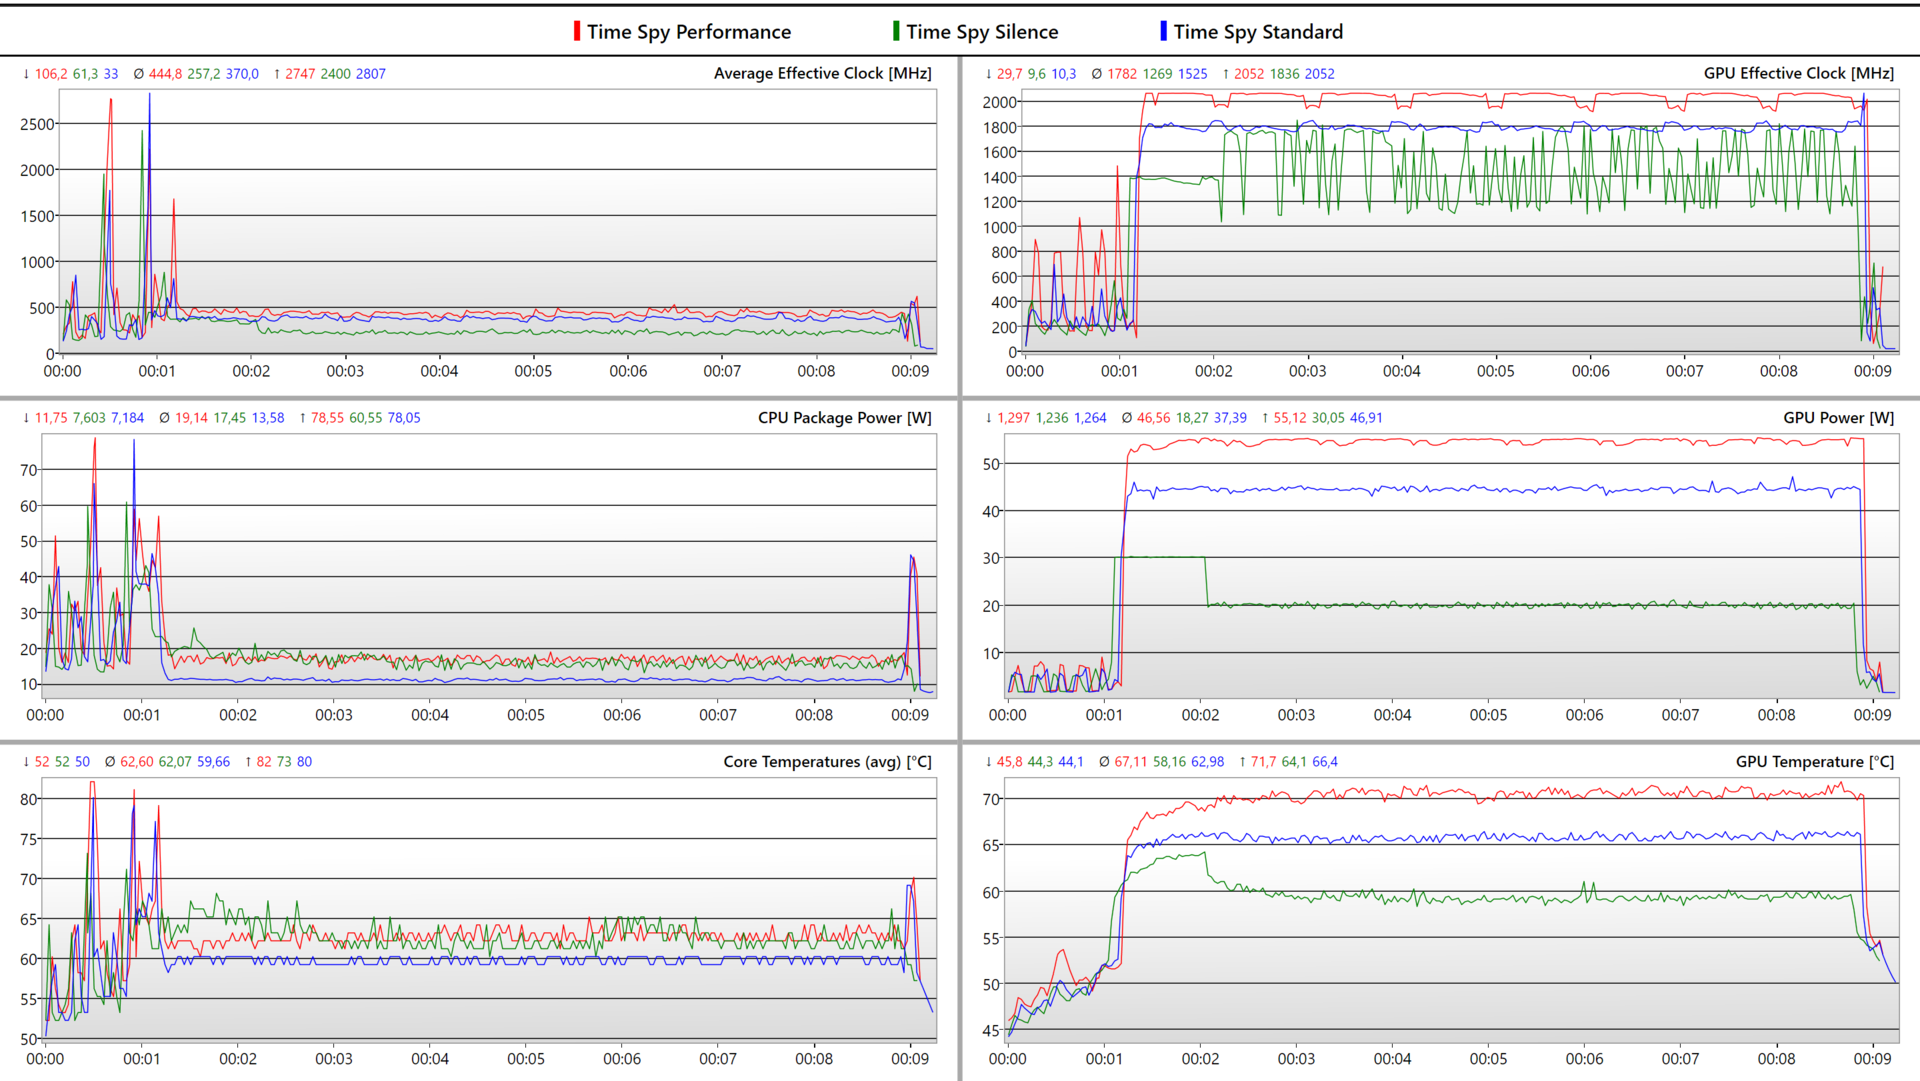
El rendimiento de la RTX 4060también está controlado por la gestión de energía. Según el modo de alimentación seleccionado, puede consumir 55 vatios, 45 vatios o 20 vatios. Hasta 15 vatios consume la CPU (Dynamic Power Shift). Los registros muestran que, a diferencia del procesador, la tarjeta gráfica es capaz de mantener constantemente su rendimiento.
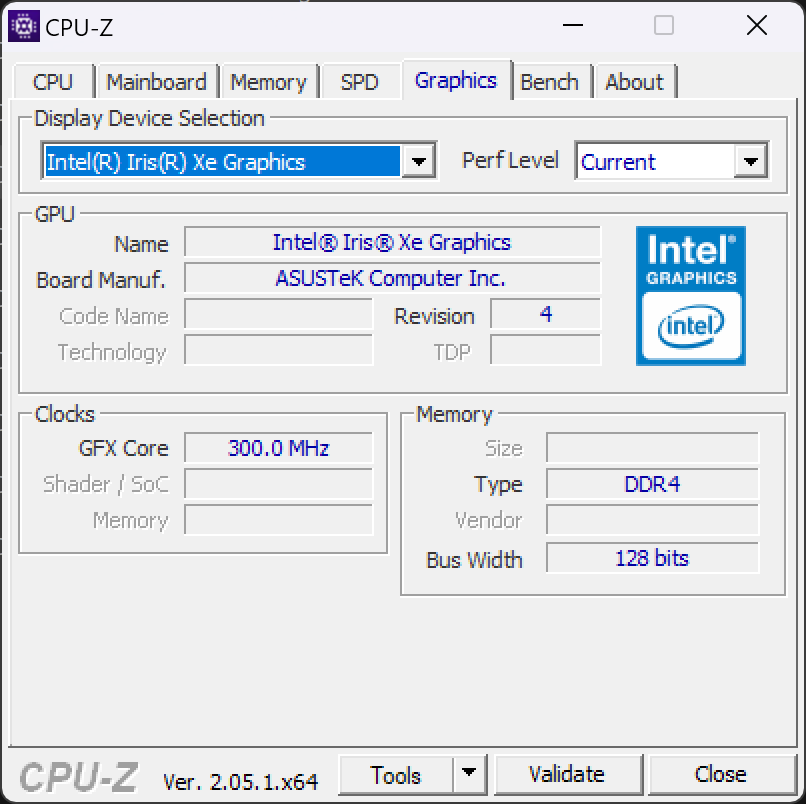
El portátil incluye un interruptor MUX para controlar la tarjeta gráfica. Las pantallas pueden conectarse directamente a la iGPU del Core i9 o a la GeForce RTX 4060. Esto también ofrece la opción de apagar completamente la iGPU o la dGPU.
Para los benchmarks sobre el rendimiento del sistema, decidimos usar el modo Estándar para el portátil, ya que este exige principalmente el rendimiento Boost idéntico al modo Rendimiento. Los benchmarks de juegos se ejecutaron usando el modo Rendimiento, desactivando adicionalmente la iGPU y Screenpad+.
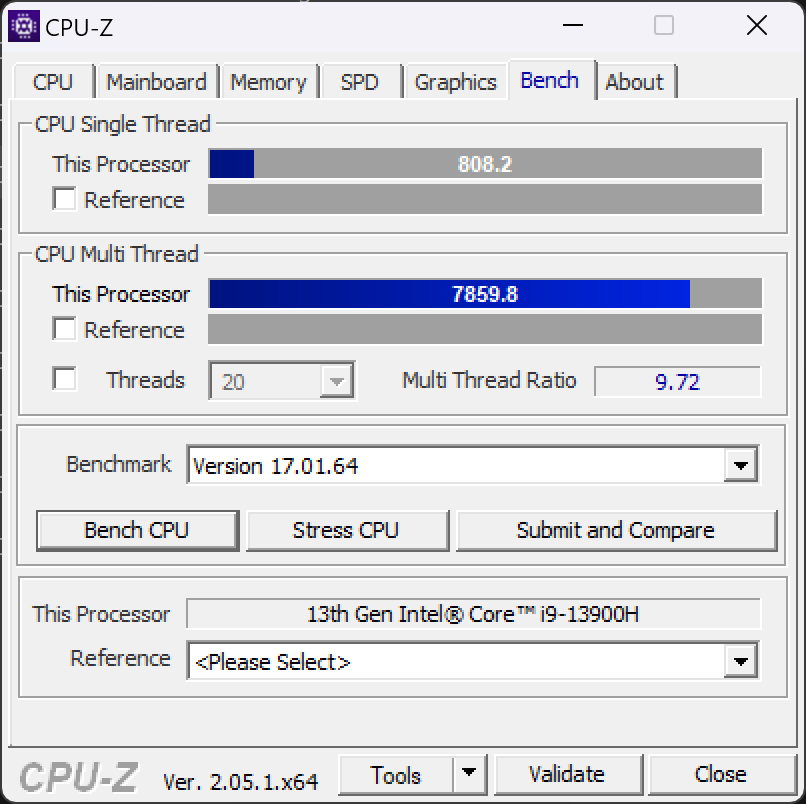
Procesador
Como CPU de gama alta de la serie Raptor Lake H, el i9-13900Hes una de las CPUs más potentes del mercado. Si bien el i9 funciona a una velocidad superior a la media durante breves picos de carga en nuestra unidad de pruebas, es incapaz de mantener este rendimiento a largo plazo. Independientemente del nivel de carga, el rendimiento, por lo demás alto, cae ligeramente tras unos minutos. Sin embargo, con sus 20 hilos distribuidos en seis núcleos P y ocho núcleos E, la caída de rendimiento apenas se nota, y el i9 realiza todas las tareas pendientes con rapidez. Un factor para que el i9-13900H del Zenbook Pro 14 Duo aparezca con una potencia superior a la media debería ser también el hecho de que, a pesar de su ligera ralentización, el procesador puede consumir más que el TDP de 45 vatios sugerido por Intel.
La comparación de los benchmarks del procesador da una imagen bastante clara, y no vemos una clara ventaja de rendimiento proveniente de la refrigeración AAS en el Zenbook Pro 14 Duo. Por ejemplo, el Asus Zenbook Pro 14 OLEDofrece un rendimiento informático similar con el mismo hardware de procesador incluso sin el sistema de refrigeración especial. Pero también tenemos que considerar que las pruebas de ese portátil se ejecutaron usando el modo Rendimiento. Así que al final, el Intel Core i9-13900H ofrece aquí exactamente el alto rendimiento que deberíamos poder esperar de la serie Raptor Lake H. Con esto no se nota una clara ventaja respecto a Alder Lake. El AMD Ryzen 9 7945HX en elZephyrus Duo 16es por tanto significativamente más potente.
Cinebench R15 Multi Constant Load Test
Cinebench R23: Multi Core | Single Core
Cinebench R20: CPU (Multi Core) | CPU (Single Core)
Cinebench R15: CPU Multi 64Bit | CPU Single 64Bit
Blender: v2.79 BMW27 CPU
7-Zip 18.03: 7z b 4 | 7z b 4 -mmt1
Geekbench 5.5: Multi-Core | Single-Core
HWBOT x265 Benchmark v2.2: 4k Preset
LibreOffice : 20 Documents To PDF
R Benchmark 2.5: Overall mean
| CPU Performance rating | |
| Asus Zephyrus Duo 16 GX650PY-NM006W | |
| Asus Zenbook Pro 14 OLED UX6404VI | |
| Asus ROG Flow Z13 GZ301V | |
| Asus ZenBook Pro 14 Duo UX8402VV-P1021W | |
| Lenovo Yoga Pro 7 14IRH G8 | |
| Acer Predator Triton 300 SE | |
| Medio Intel Core i9-13900H | |
| Media de la clase Multimedia | |
| Gigabyte Aero 14 OLED BMF | |
| Schenker Vision 14 2022 RTX 3050 Ti | |
| Cinebench R23 / Multi Core | |
| Asus Zephyrus Duo 16 GX650PY-NM006W | |
| Asus Zenbook Pro 14 OLED UX6404VI | |
| Asus ROG Flow Z13 GZ301V | |
| Lenovo Yoga Pro 7 14IRH G8 | |
| Asus ZenBook Pro 14 Duo UX8402VV-P1021W | |
| Medio Intel Core i9-13900H (11997 - 20385, n=28) | |
| Media de la clase Multimedia (4861 - 33362, n=74, últimos 2 años) | |
| Acer Predator Triton 300 SE | |
| Schenker Vision 14 2022 RTX 3050 Ti | |
| Gigabyte Aero 14 OLED BMF | |
| Cinebench R23 / Single Core | |
| Asus Zenbook Pro 14 OLED UX6404VI | |
| Asus ROG Flow Z13 GZ301V | |
| Asus ZenBook Pro 14 Duo UX8402VV-P1021W | |
| Media de la clase Multimedia (1128 - 2459, n=66, últimos 2 años) | |
| Asus Zephyrus Duo 16 GX650PY-NM006W | |
| Acer Predator Triton 300 SE | |
| Medio Intel Core i9-13900H (1297 - 2054, n=26) | |
| Lenovo Yoga Pro 7 14IRH G8 | |
| Gigabyte Aero 14 OLED BMF | |
| Schenker Vision 14 2022 RTX 3050 Ti | |
| Cinebench R20 / CPU (Multi Core) | |
| Asus Zephyrus Duo 16 GX650PY-NM006W | |
| Asus Zenbook Pro 14 OLED UX6404VI | |
| Asus ROG Flow Z13 GZ301V | |
| Lenovo Yoga Pro 7 14IRH G8 | |
| Asus ZenBook Pro 14 Duo UX8402VV-P1021W | |
| Medio Intel Core i9-13900H (4935 - 7716, n=25) | |
| Media de la clase Multimedia (1887 - 12912, n=57, últimos 2 años) | |
| Acer Predator Triton 300 SE | |
| Schenker Vision 14 2022 RTX 3050 Ti | |
| Gigabyte Aero 14 OLED BMF | |
| Cinebench R20 / CPU (Single Core) | |
| Asus ROG Flow Z13 GZ301V | |
| Asus Zenbook Pro 14 OLED UX6404VI | |
| Asus ZenBook Pro 14 Duo UX8402VV-P1021W | |
| Asus Zephyrus Duo 16 GX650PY-NM006W | |
| Acer Predator Triton 300 SE | |
| Lenovo Yoga Pro 7 14IRH G8 | |
| Media de la clase Multimedia (425 - 853, n=57, últimos 2 años) | |
| Medio Intel Core i9-13900H (428 - 792, n=25) | |
| Gigabyte Aero 14 OLED BMF | |
| Schenker Vision 14 2022 RTX 3050 Ti | |
| Cinebench R15 / CPU Multi 64Bit | |
| Asus Zephyrus Duo 16 GX650PY-NM006W | |
| Asus Zenbook Pro 14 OLED UX6404VI | |
| Asus ROG Flow Z13 GZ301V | |
| Asus ZenBook Pro 14 Duo UX8402VV-P1021W | |
| Medio Intel Core i9-13900H (2061 - 3100, n=26) | |
| Media de la clase Multimedia (856 - 5224, n=61, últimos 2 años) | |
| Lenovo Yoga Pro 7 14IRH G8 | |
| Gigabyte Aero 14 OLED BMF | |
| Acer Predator Triton 300 SE | |
| Schenker Vision 14 2022 RTX 3050 Ti | |
| Cinebench R15 / CPU Single 64Bit | |
| Asus Zephyrus Duo 16 GX650PY-NM006W | |
| Asus Zenbook Pro 14 OLED UX6404VI | |
| Asus ROG Flow Z13 GZ301V | |
| Asus ZenBook Pro 14 Duo UX8402VV-P1021W | |
| Media de la clase Multimedia (184.8 - 326, n=59, últimos 2 años) | |
| Lenovo Yoga Pro 7 14IRH G8 | |
| Acer Predator Triton 300 SE | |
| Medio Intel Core i9-13900H (211 - 297, n=26) | |
| Gigabyte Aero 14 OLED BMF | |
| Schenker Vision 14 2022 RTX 3050 Ti | |
| Blender / v2.79 BMW27 CPU | |
| Schenker Vision 14 2022 RTX 3050 Ti | |
| Media de la clase Multimedia (100 - 557, n=58, últimos 2 años) | |
| Gigabyte Aero 14 OLED BMF | |
| Medio Intel Core i9-13900H (166 - 268, n=24) | |
| Acer Predator Triton 300 SE | |
| Lenovo Yoga Pro 7 14IRH G8 | |
| Asus ROG Flow Z13 GZ301V | |
| Asus ZenBook Pro 14 Duo UX8402VV-P1021W | |
| Asus Zenbook Pro 14 OLED UX6404VI | |
| Asus Zephyrus Duo 16 GX650PY-NM006W | |
| 7-Zip 18.03 / 7z b 4 | |
| Asus Zephyrus Duo 16 GX650PY-NM006W | |
| Asus Zenbook Pro 14 OLED UX6404VI | |
| Asus ZenBook Pro 14 Duo UX8402VV-P1021W | |
| Asus ROG Flow Z13 GZ301V | |
| Lenovo Yoga Pro 7 14IRH G8 | |
| Medio Intel Core i9-13900H (45045 - 79032, n=25) | |
| Acer Predator Triton 300 SE | |
| Gigabyte Aero 14 OLED BMF | |
| Media de la clase Multimedia (26062 - 130368, n=55, últimos 2 años) | |
| Schenker Vision 14 2022 RTX 3050 Ti | |
| 7-Zip 18.03 / 7z b 4 -mmt1 | |
| Asus Zephyrus Duo 16 GX650PY-NM006W | |
| Asus ROG Flow Z13 GZ301V | |
| Asus Zenbook Pro 14 OLED UX6404VI | |
| Asus ZenBook Pro 14 Duo UX8402VV-P1021W | |
| Medio Intel Core i9-13900H (3665 - 6600, n=25) | |
| Gigabyte Aero 14 OLED BMF | |
| Lenovo Yoga Pro 7 14IRH G8 | |
| Media de la clase Multimedia (3666 - 7545, n=56, últimos 2 años) | |
| Schenker Vision 14 2022 RTX 3050 Ti | |
| Acer Predator Triton 300 SE | |
| Geekbench 5.5 / Multi-Core | |
| Asus Zephyrus Duo 16 GX650PY-NM006W | |
| Asus Zenbook Pro 14 OLED UX6404VI | |
| Asus ROG Flow Z13 GZ301V | |
| Lenovo Yoga Pro 7 14IRH G8 | |
| Media de la clase Multimedia (4652 - 20422, n=56, últimos 2 años) | |
| Acer Predator Triton 300 SE | |
| Asus ZenBook Pro 14 Duo UX8402VV-P1021W | |
| Medio Intel Core i9-13900H (9094 - 15410, n=26) | |
| Schenker Vision 14 2022 RTX 3050 Ti | |
| Gigabyte Aero 14 OLED BMF | |
| Geekbench 5.5 / Single-Core | |
| Asus Zephyrus Duo 16 GX650PY-NM006W | |
| Asus ROG Flow Z13 GZ301V | |
| Asus Zenbook Pro 14 OLED UX6404VI | |
| Media de la clase Multimedia (805 - 2974, n=56, últimos 2 años) | |
| Asus ZenBook Pro 14 Duo UX8402VV-P1021W | |
| Medio Intel Core i9-13900H (1140 - 2043, n=26) | |
| Lenovo Yoga Pro 7 14IRH G8 | |
| Gigabyte Aero 14 OLED BMF | |
| Acer Predator Triton 300 SE | |
| Schenker Vision 14 2022 RTX 3050 Ti | |
| HWBOT x265 Benchmark v2.2 / 4k Preset | |
| Asus Zephyrus Duo 16 GX650PY-NM006W | |
| Asus Zenbook Pro 14 OLED UX6404VI | |
| Asus ROG Flow Z13 GZ301V | |
| Lenovo Yoga Pro 7 14IRH G8 | |
| Acer Predator Triton 300 SE | |
| Media de la clase Multimedia (5.26 - 36.1, n=56, últimos 2 años) | |
| Medio Intel Core i9-13900H (14.1 - 22.3, n=25) | |
| Asus ZenBook Pro 14 Duo UX8402VV-P1021W | |
| Gigabyte Aero 14 OLED BMF | |
| Schenker Vision 14 2022 RTX 3050 Ti | |
| LibreOffice / 20 Documents To PDF | |
| Asus Zephyrus Duo 16 GX650PY-NM006W | |
| Media de la clase Multimedia (23.9 - 146.7, n=57, últimos 2 años) | |
| Medio Intel Core i9-13900H (34.4 - 82.8, n=25) | |
| Lenovo Yoga Pro 7 14IRH G8 | |
| Asus Zenbook Pro 14 OLED UX6404VI | |
| Schenker Vision 14 2022 RTX 3050 Ti | |
| Acer Predator Triton 300 SE | |
| Gigabyte Aero 14 OLED BMF | |
| Asus ZenBook Pro 14 Duo UX8402VV-P1021W | |
| Asus ROG Flow Z13 GZ301V | |
| R Benchmark 2.5 / Overall mean | |
| Media de la clase Multimedia (0.3604 - 0.947, n=56, últimos 2 años) | |
| Schenker Vision 14 2022 RTX 3050 Ti | |
| Medio Intel Core i9-13900H (0.4052 - 0.723, n=25) | |
| Gigabyte Aero 14 OLED BMF | |
| Asus ZenBook Pro 14 Duo UX8402VV-P1021W | |
| Lenovo Yoga Pro 7 14IRH G8 | |
| Acer Predator Triton 300 SE | |
| Asus Zenbook Pro 14 OLED UX6404VI | |
| Asus ROG Flow Z13 GZ301V | |
| Asus Zephyrus Duo 16 GX650PY-NM006W | |
* ... más pequeño es mejor
AIDA64: FP32 Ray-Trace | FPU Julia | CPU SHA3 | CPU Queen | FPU SinJulia | FPU Mandel | CPU AES | CPU ZLib | FP64 Ray-Trace | CPU PhotoWorxx
| Performance rating | |
| Asus Zenbook Pro 14 OLED UX6404VI | |
| Acer Predator Triton 300 SE | |
| Asus ROG Flow Z13 GZ301V | |
| Media de la clase Multimedia | |
| Medio Intel Core i9-13900H | |
| Lenovo Yoga Pro 7 14IRH G8 | |
| Gigabyte Aero 14 OLED BMF | |
| Asus ZenBook Pro 14 Duo UX8402VV-P1021W | |
| Schenker Vision 14 2022 RTX 3050 Ti | |
| AIDA64 / FP32 Ray-Trace | |
| Media de la clase Multimedia (2214 - 50388, n=53, últimos 2 años) | |
| Asus Zenbook Pro 14 OLED UX6404VI | |
| Asus ROG Flow Z13 GZ301V | |
| Acer Predator Triton 300 SE | |
| Medio Intel Core i9-13900H (6788 - 19557, n=25) | |
| Asus ZenBook Pro 14 Duo UX8402VV-P1021W | |
| Lenovo Yoga Pro 7 14IRH G8 | |
| Gigabyte Aero 14 OLED BMF | |
| Schenker Vision 14 2022 RTX 3050 Ti | |
| AIDA64 / FPU Julia | |
| Asus Zenbook Pro 14 OLED UX6404VI | |
| Media de la clase Multimedia (12867 - 201874, n=54, últimos 2 años) | |
| Asus ROG Flow Z13 GZ301V | |
| Medio Intel Core i9-13900H (22551 - 95579, n=25) | |
| Acer Predator Triton 300 SE | |
| Lenovo Yoga Pro 7 14IRH G8 | |
| Asus ZenBook Pro 14 Duo UX8402VV-P1021W | |
| Gigabyte Aero 14 OLED BMF | |
| Schenker Vision 14 2022 RTX 3050 Ti | |
| AIDA64 / CPU SHA3 | |
| Asus Zenbook Pro 14 OLED UX6404VI | |
| Media de la clase Multimedia (626 - 8623, n=54, últimos 2 años) | |
| Acer Predator Triton 300 SE | |
| Medio Intel Core i9-13900H (2491 - 4270, n=25) | |
| Asus ROG Flow Z13 GZ301V | |
| Lenovo Yoga Pro 7 14IRH G8 | |
| Asus ZenBook Pro 14 Duo UX8402VV-P1021W | |
| Gigabyte Aero 14 OLED BMF | |
| Schenker Vision 14 2022 RTX 3050 Ti | |
| AIDA64 / CPU Queen | |
| Asus Zenbook Pro 14 OLED UX6404VI | |
| Asus ROG Flow Z13 GZ301V | |
| Acer Predator Triton 300 SE | |
| Asus ZenBook Pro 14 Duo UX8402VV-P1021W | |
| Gigabyte Aero 14 OLED BMF | |
| Lenovo Yoga Pro 7 14IRH G8 | |
| Medio Intel Core i9-13900H (65121 - 120936, n=25) | |
| Schenker Vision 14 2022 RTX 3050 Ti | |
| Media de la clase Multimedia (13483 - 181505, n=41, últimos 2 años) | |
| AIDA64 / FPU SinJulia | |
| Asus Zenbook Pro 14 OLED UX6404VI | |
| Asus ROG Flow Z13 GZ301V | |
| Lenovo Yoga Pro 7 14IRH G8 | |
| Acer Predator Triton 300 SE | |
| Medio Intel Core i9-13900H (6108 - 11631, n=25) | |
| Asus ZenBook Pro 14 Duo UX8402VV-P1021W | |
| Media de la clase Multimedia (886 - 28794, n=54, últimos 2 años) | |
| Gigabyte Aero 14 OLED BMF | |
| Schenker Vision 14 2022 RTX 3050 Ti | |
| AIDA64 / FPU Mandel | |
| Media de la clase Multimedia (6395 - 105740, n=53, últimos 2 años) | |
| Asus Zenbook Pro 14 OLED UX6404VI | |
| Asus ROG Flow Z13 GZ301V | |
| Medio Intel Core i9-13900H (11283 - 48474, n=25) | |
| Acer Predator Triton 300 SE | |
| Lenovo Yoga Pro 7 14IRH G8 | |
| Asus ZenBook Pro 14 Duo UX8402VV-P1021W | |
| Gigabyte Aero 14 OLED BMF | |
| Schenker Vision 14 2022 RTX 3050 Ti | |
| AIDA64 / CPU AES | |
| Acer Predator Triton 300 SE | |
| Gigabyte Aero 14 OLED BMF | |
| Medio Intel Core i9-13900H (3691 - 149377, n=25) | |
| Asus Zenbook Pro 14 OLED UX6404VI | |
| Lenovo Yoga Pro 7 14IRH G8 | |
| Asus ROG Flow Z13 GZ301V | |
| Schenker Vision 14 2022 RTX 3050 Ti | |
| Media de la clase Multimedia (8171 - 126790, n=54, últimos 2 años) | |
| Asus ZenBook Pro 14 Duo UX8402VV-P1021W | |
| AIDA64 / CPU ZLib | |
| Asus Zenbook Pro 14 OLED UX6404VI | |
| Lenovo Yoga Pro 7 14IRH G8 | |
| Asus ROG Flow Z13 GZ301V | |
| Medio Intel Core i9-13900H (789 - 1254, n=25) | |
| Acer Predator Triton 300 SE | |
| Media de la clase Multimedia (143.8 - 2022, n=54, últimos 2 años) | |
| Schenker Vision 14 2022 RTX 3050 Ti | |
| Asus ZenBook Pro 14 Duo UX8402VV-P1021W | |
| Gigabyte Aero 14 OLED BMF | |
| AIDA64 / FP64 Ray-Trace | |
| Media de la clase Multimedia (1014 - 26875, n=54, últimos 2 años) | |
| Asus Zenbook Pro 14 OLED UX6404VI | |
| Asus ROG Flow Z13 GZ301V | |
| Medio Intel Core i9-13900H (3655 - 10716, n=25) | |
| Acer Predator Triton 300 SE | |
| Asus ZenBook Pro 14 Duo UX8402VV-P1021W | |
| Lenovo Yoga Pro 7 14IRH G8 | |
| Gigabyte Aero 14 OLED BMF | |
| Schenker Vision 14 2022 RTX 3050 Ti | |
| AIDA64 / CPU PhotoWorxx | |
| Gigabyte Aero 14 OLED BMF | |
| Media de la clase Multimedia (8187 - 88154, n=54, últimos 2 años) | |
| Acer Predator Triton 300 SE | |
| Asus ROG Flow Z13 GZ301V | |
| Asus Zenbook Pro 14 OLED UX6404VI | |
| Lenovo Yoga Pro 7 14IRH G8 | |
| Asus ZenBook Pro 14 Duo UX8402VV-P1021W | |
| Medio Intel Core i9-13900H (10871 - 50488, n=25) | |
| Schenker Vision 14 2022 RTX 3050 Ti | |
Rendimiento del sistema
En los benchmarks sobre el rendimiento del sistema con PCMark10 y Crossmark, el Zenbook Pro 14 Duo no muestra ninguna debilidad, entregando muy buenos resultados en todas las sub-disciplinas. Lo que más destaca aquí es otro portátil de nuestra comparativa. ElAcer Predator Triton 300 SEque es más pequeño, más ligero y está equipado con hardware supuestamente más débil de la generación anterior, es capaz de situarse por delante de nuestra unidad de pruebas Asus una y otra vez. Con valores de TGP y TDP más altos, Acer es capaz de exprimir un rendimiento significativamente mayor de los procesadores y chips gráficos. Por otro lado, el portátil Acer también tiene un consumo de energía considerablemente mayor con esto.
CrossMark: Overall | Productivity | Creativity | Responsiveness
| PCMark 10 / Score | |
| Asus Zephyrus Duo 16 GX650PY-NM006W | |
| Media de la clase Multimedia (4325 - 10386, n=52, últimos 2 años) | |
| Medio Intel Core i9-13900H, NVIDIA GeForce RTX 4060 Laptop GPU (7578 - 7884, n=3) | |
| Acer Predator Triton 300 SE | |
| Asus ZenBook Pro 14 Duo UX8402VV-P1021W | |
| Lenovo Yoga Pro 7 14IRH G8 | |
| Gigabyte Aero 14 OLED BMF | |
| Schenker Vision 14 2022 RTX 3050 Ti | |
| Asus Zenbook Pro 14 Duo OLED UX8402ZA | |
| Asus VivoBook S 14X S5402Z | |
| PCMark 10 / Essentials | |
| Asus Zephyrus Duo 16 GX650PY-NM006W | |
| Gigabyte Aero 14 OLED BMF | |
| Medio Intel Core i9-13900H, NVIDIA GeForce RTX 4060 Laptop GPU (11235 - 11539, n=3) | |
| Asus ZenBook Pro 14 Duo UX8402VV-P1021W | |
| Acer Predator Triton 300 SE | |
| Asus Zenbook Pro 14 Duo OLED UX8402ZA | |
| Lenovo Yoga Pro 7 14IRH G8 | |
| Asus VivoBook S 14X S5402Z | |
| Media de la clase Multimedia (8025 - 11664, n=51, últimos 2 años) | |
| Schenker Vision 14 2022 RTX 3050 Ti | |
| PCMark 10 / Productivity | |
| Asus Zephyrus Duo 16 GX650PY-NM006W | |
| Media de la clase Multimedia (7323 - 18233, n=51, últimos 2 años) | |
| Acer Predator Triton 300 SE | |
| Medio Intel Core i9-13900H, NVIDIA GeForce RTX 4060 Laptop GPU (9888 - 10222, n=3) | |
| Asus ZenBook Pro 14 Duo UX8402VV-P1021W | |
| Gigabyte Aero 14 OLED BMF | |
| Lenovo Yoga Pro 7 14IRH G8 | |
| Schenker Vision 14 2022 RTX 3050 Ti | |
| Asus VivoBook S 14X S5402Z | |
| Asus Zenbook Pro 14 Duo OLED UX8402ZA | |
| PCMark 10 / Digital Content Creation | |
| Asus Zephyrus Duo 16 GX650PY-NM006W | |
| Medio Intel Core i9-13900H, NVIDIA GeForce RTX 4060 Laptop GPU (10418 - 11272, n=3) | |
| Acer Predator Triton 300 SE | |
| Asus ZenBook Pro 14 Duo UX8402VV-P1021W | |
| Media de la clase Multimedia (3651 - 16240, n=51, últimos 2 años) | |
| Lenovo Yoga Pro 7 14IRH G8 | |
| Gigabyte Aero 14 OLED BMF | |
| Schenker Vision 14 2022 RTX 3050 Ti | |
| Asus Zenbook Pro 14 Duo OLED UX8402ZA | |
| Asus VivoBook S 14X S5402Z | |
| CrossMark / Overall | |
| Asus Zephyrus Duo 16 GX650PY-NM006W | |
| Acer Predator Triton 300 SE | |
| Medio Intel Core i9-13900H, NVIDIA GeForce RTX 4060 Laptop GPU (1874 - 1983, n=3) | |
| Media de la clase Multimedia (866 - 2728, n=60, últimos 2 años) | |
| Asus ZenBook Pro 14 Duo UX8402VV-P1021W | |
| Gigabyte Aero 14 OLED BMF | |
| Asus Zenbook Pro 14 Duo OLED UX8402ZA | |
| Lenovo Yoga Pro 7 14IRH G8 | |
| Schenker Vision 14 2022 RTX 3050 Ti | |
| Asus VivoBook S 14X S5402Z | |
| CrossMark / Productivity | |
| Asus Zephyrus Duo 16 GX650PY-NM006W | |
| Acer Predator Triton 300 SE | |
| Medio Intel Core i9-13900H, NVIDIA GeForce RTX 4060 Laptop GPU (1779 - 1889, n=3) | |
| Gigabyte Aero 14 OLED BMF | |
| Asus ZenBook Pro 14 Duo UX8402VV-P1021W | |
| Media de la clase Multimedia (931 - 2489, n=60, últimos 2 años) | |
| Asus Zenbook Pro 14 Duo OLED UX8402ZA | |
| Lenovo Yoga Pro 7 14IRH G8 | |
| Schenker Vision 14 2022 RTX 3050 Ti | |
| Asus VivoBook S 14X S5402Z | |
| CrossMark / Creativity | |
| Asus Zephyrus Duo 16 GX650PY-NM006W | |
| Media de la clase Multimedia (907 - 3465, n=60, últimos 2 años) | |
| Medio Intel Core i9-13900H, NVIDIA GeForce RTX 4060 Laptop GPU (2104 - 2195, n=3) | |
| Acer Predator Triton 300 SE | |
| Asus ZenBook Pro 14 Duo UX8402VV-P1021W | |
| Lenovo Yoga Pro 7 14IRH G8 | |
| Asus Zenbook Pro 14 Duo OLED UX8402ZA | |
| Gigabyte Aero 14 OLED BMF | |
| Schenker Vision 14 2022 RTX 3050 Ti | |
| Asus VivoBook S 14X S5402Z | |
| CrossMark / Responsiveness | |
| Acer Predator Triton 300 SE | |
| Gigabyte Aero 14 OLED BMF | |
| Asus Zephyrus Duo 16 GX650PY-NM006W | |
| Medio Intel Core i9-13900H, NVIDIA GeForce RTX 4060 Laptop GPU (1548 - 1698, n=3) | |
| Asus ZenBook Pro 14 Duo UX8402VV-P1021W | |
| Asus Zenbook Pro 14 Duo OLED UX8402ZA | |
| Schenker Vision 14 2022 RTX 3050 Ti | |
| Media de la clase Multimedia (605 - 2024, n=60, últimos 2 años) | |
| Lenovo Yoga Pro 7 14IRH G8 | |
| Asus VivoBook S 14X S5402Z | |
| PCMark 10 Score | 7578 puntos | |
ayuda | ||
| AIDA64 / Memory Copy | |
| Media de la clase Multimedia (11299 - 132135, n=54, últimos 2 años) | |
| Medio Intel Core i9-13900H (37448 - 74486, n=25) | |
| Asus ZenBook Pro 14 Duo UX8402VV-P1021W | |
| AIDA64 / Memory Read | |
| Media de la clase Multimedia (11624 - 174586, n=54, últimos 2 años) | |
| Medio Intel Core i9-13900H (41599 - 75433, n=25) | |
| Asus ZenBook Pro 14 Duo UX8402VV-P1021W | |
| AIDA64 / Memory Write | |
| Media de la clase Multimedia (11755 - 134998, n=54, últimos 2 años) | |
| Asus ZenBook Pro 14 Duo UX8402VV-P1021W | |
| Medio Intel Core i9-13900H (36152 - 88505, n=25) | |
| AIDA64 / Memory Latency | |
| Media de la clase Multimedia (7 - 535, n=53, últimos 2 años) | |
| Asus ZenBook Pro 14 Duo UX8402VV-P1021W | |
| Medio Intel Core i9-13900H (75.8 - 102.3, n=25) | |
* ... más pequeño es mejor
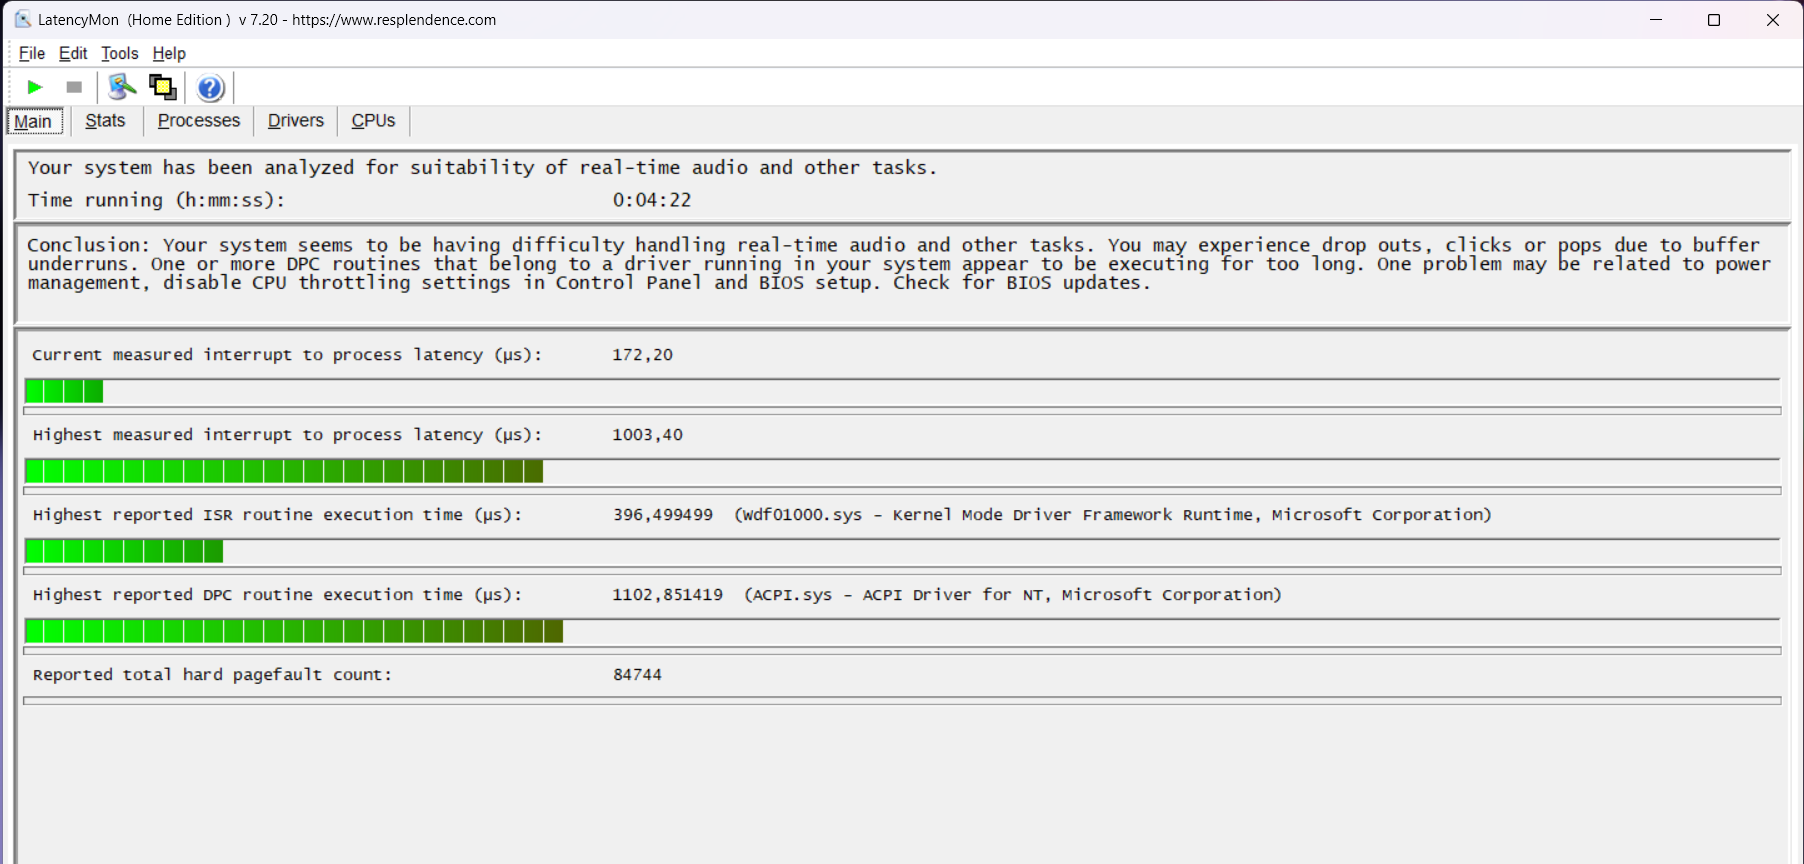
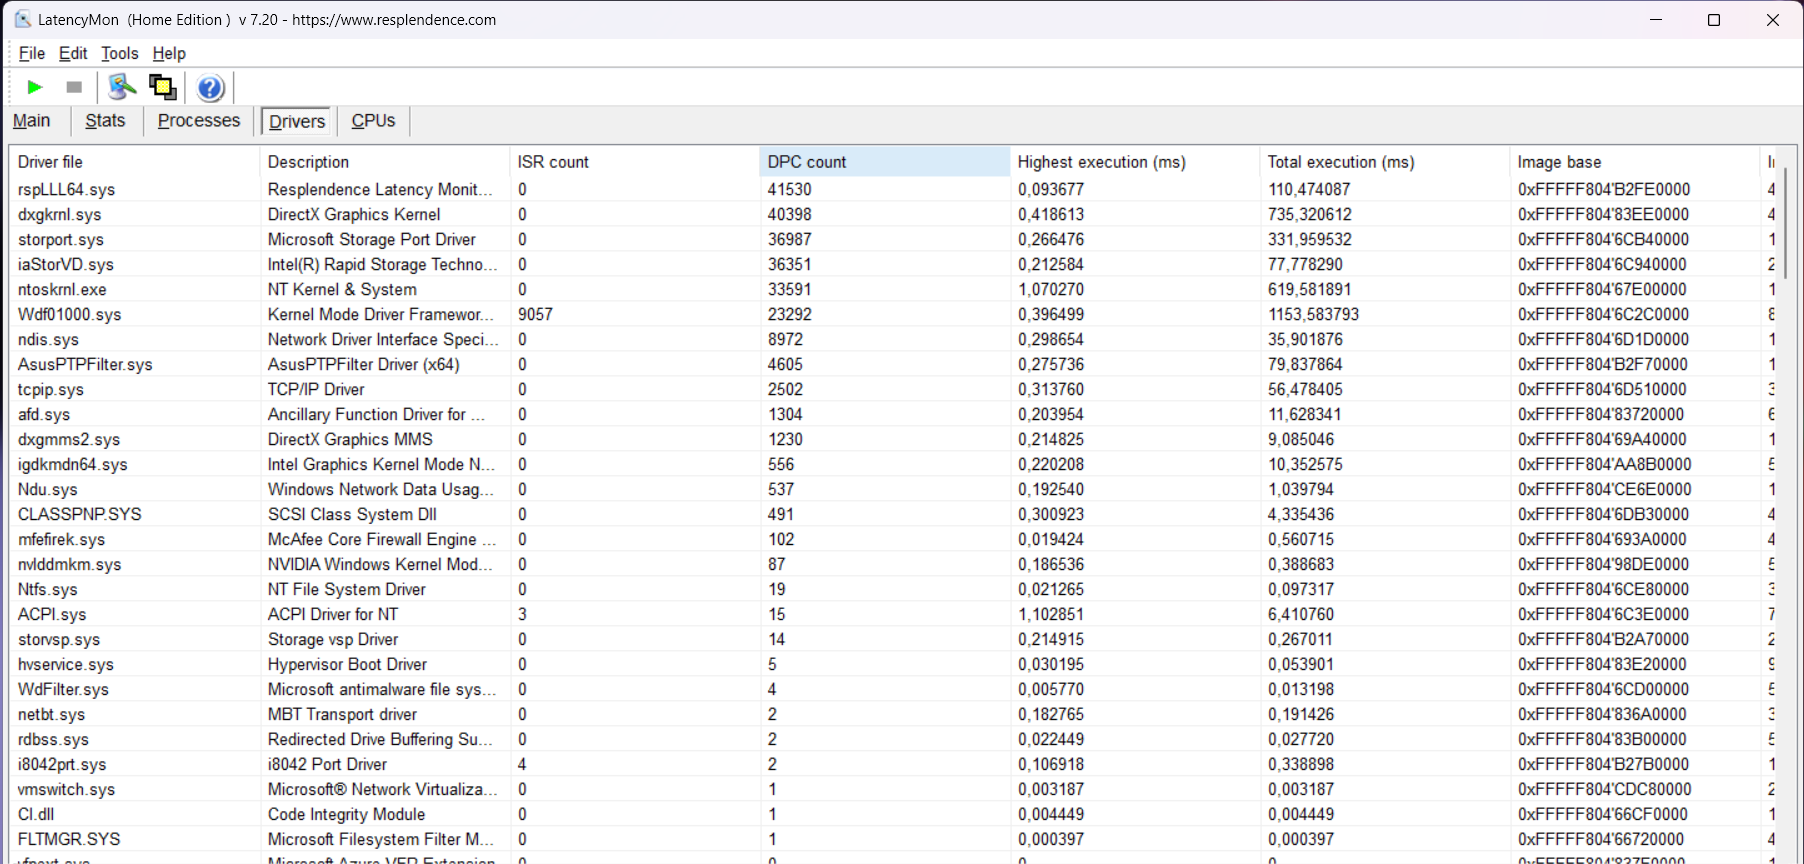
Latencias del CPD
Con los drivers actuales en el momento de esta prueba, las latencias DPC del Asus Zenbook Pro 14 Duo caen en un rango que puede llevar a problemas con aplicaciones de vídeo y audio en tiempo real. En aplicaciones de audio, las latencias de 1003 µs podrían llevar a tartamudeos audibles.
| DPC Latencies / LatencyMon - interrupt to process latency (max), Web, Youtube, Prime95 | |
| Asus ROG Flow Z13 GZ301V | |
| Asus Zephyrus Duo 16 GX650PY-NM006W | |
| Acer Predator Triton 300 SE | |
| Gigabyte Aero 14 OLED BMF | |
| Asus Zenbook Pro 14 OLED UX6404VI | |
| Asus ZenBook Pro 14 Duo UX8402VV-P1021W | |
| Lenovo Yoga Pro 7 14IRH G8 | |
| Schenker Vision 14 2022 RTX 3050 Ti | |
* ... más pequeño es mejor
Solución de almacenamiento
El Samsung PM9A1 con 2 TB de capacidad de almacenamiento utilizado aquí es capaz de mantener su alto rendimiento incluso durante largos periodos de tiempo. En el bucle DiskSpd, los resultados varían sólo un 1%. Sin embargo, también notamos que el comportamiento del SSD difiere significativamente aquí de otros portátiles que probamos hasta ahora que también usaban este SSD. Durante las pruebas de acceso aleatorio de lectura y escritura, la solución de almacenamiento es considerablemente más lenta en nuestra unidad de pruebas que la media del Samsung PM9A1 probado en nuestra lista de referencia de SSDs y HDDs. Posiblemente, Samsung podría usar algunos chips RAM o controladores de almacenamiento diferentes a los anteriores.

* ... más pequeño es mejor
Disk Throttling: DiskSpd Read Loop, Queue Depth 8
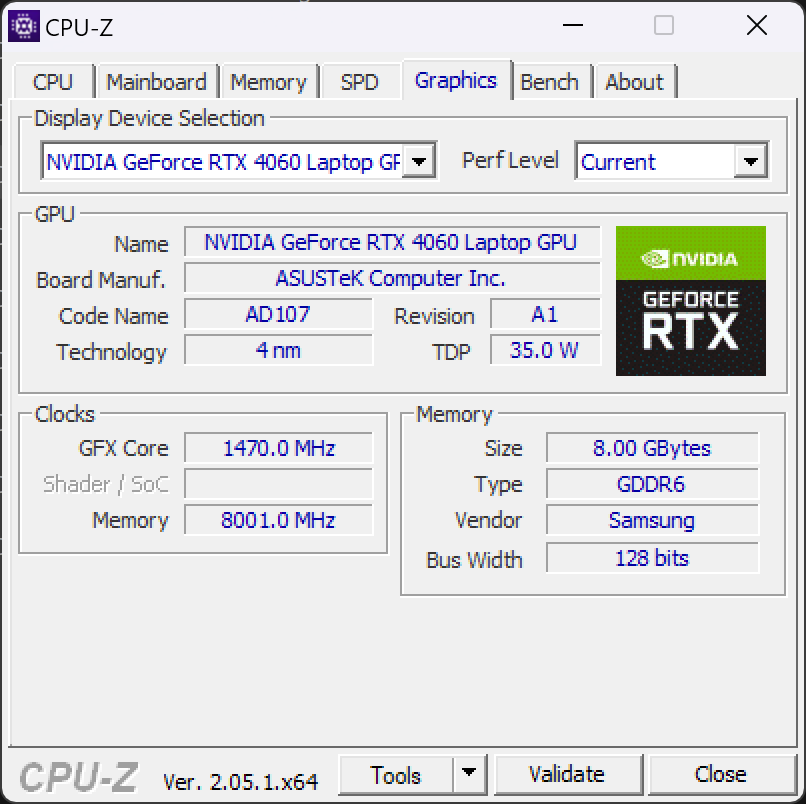
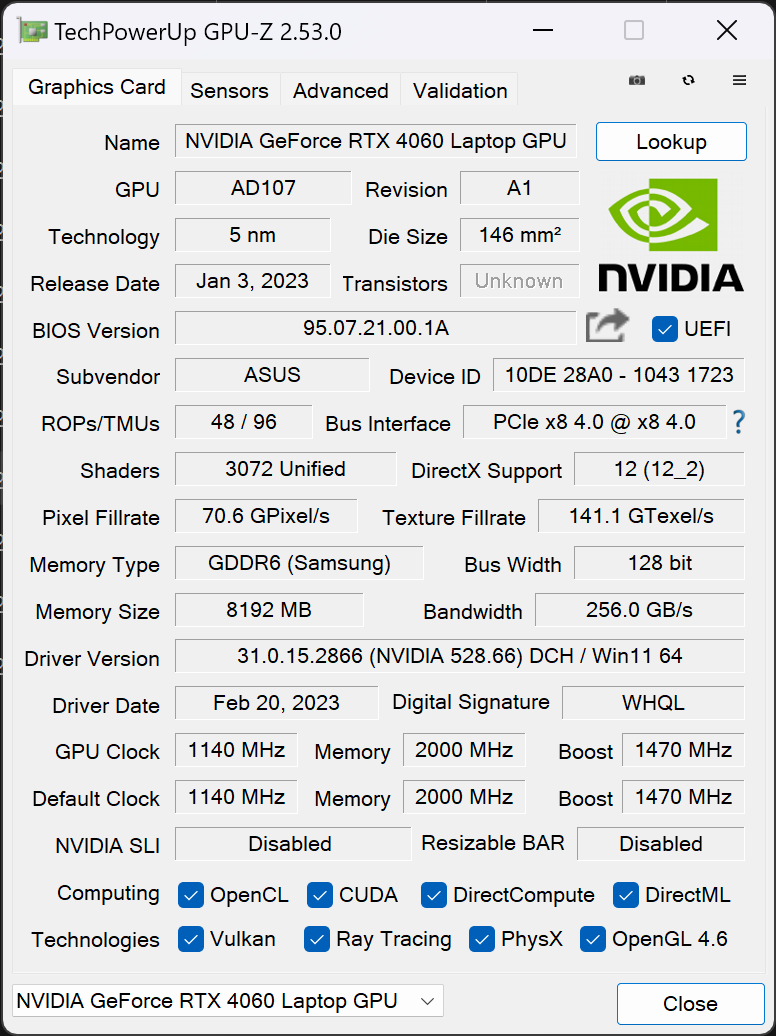
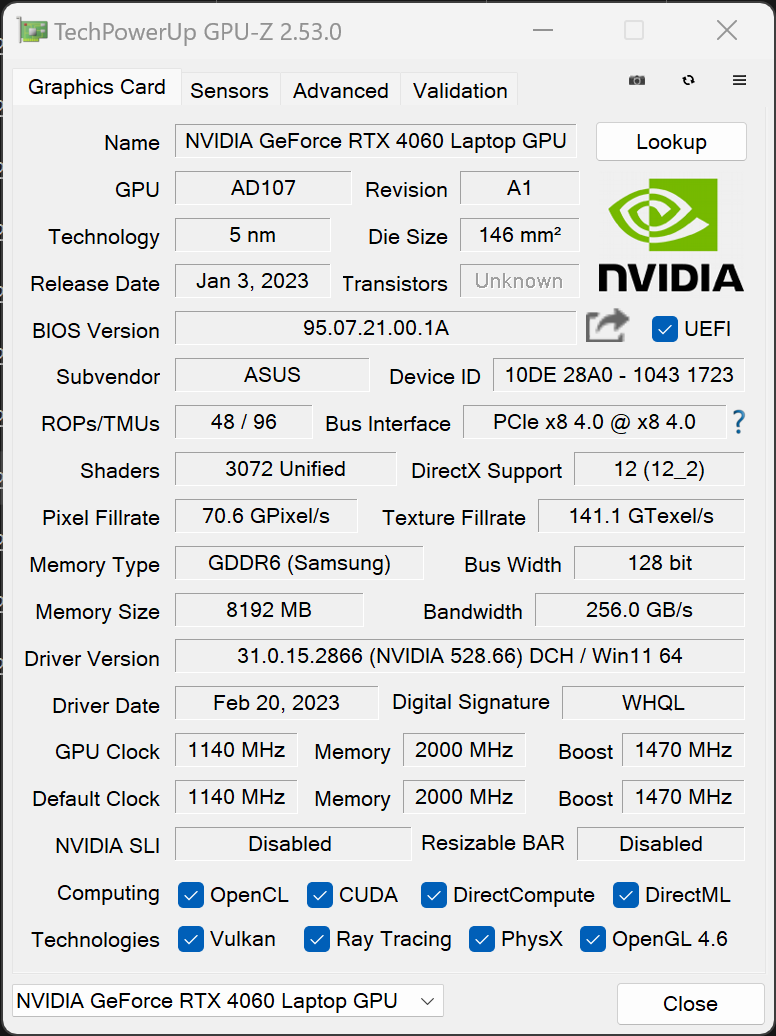
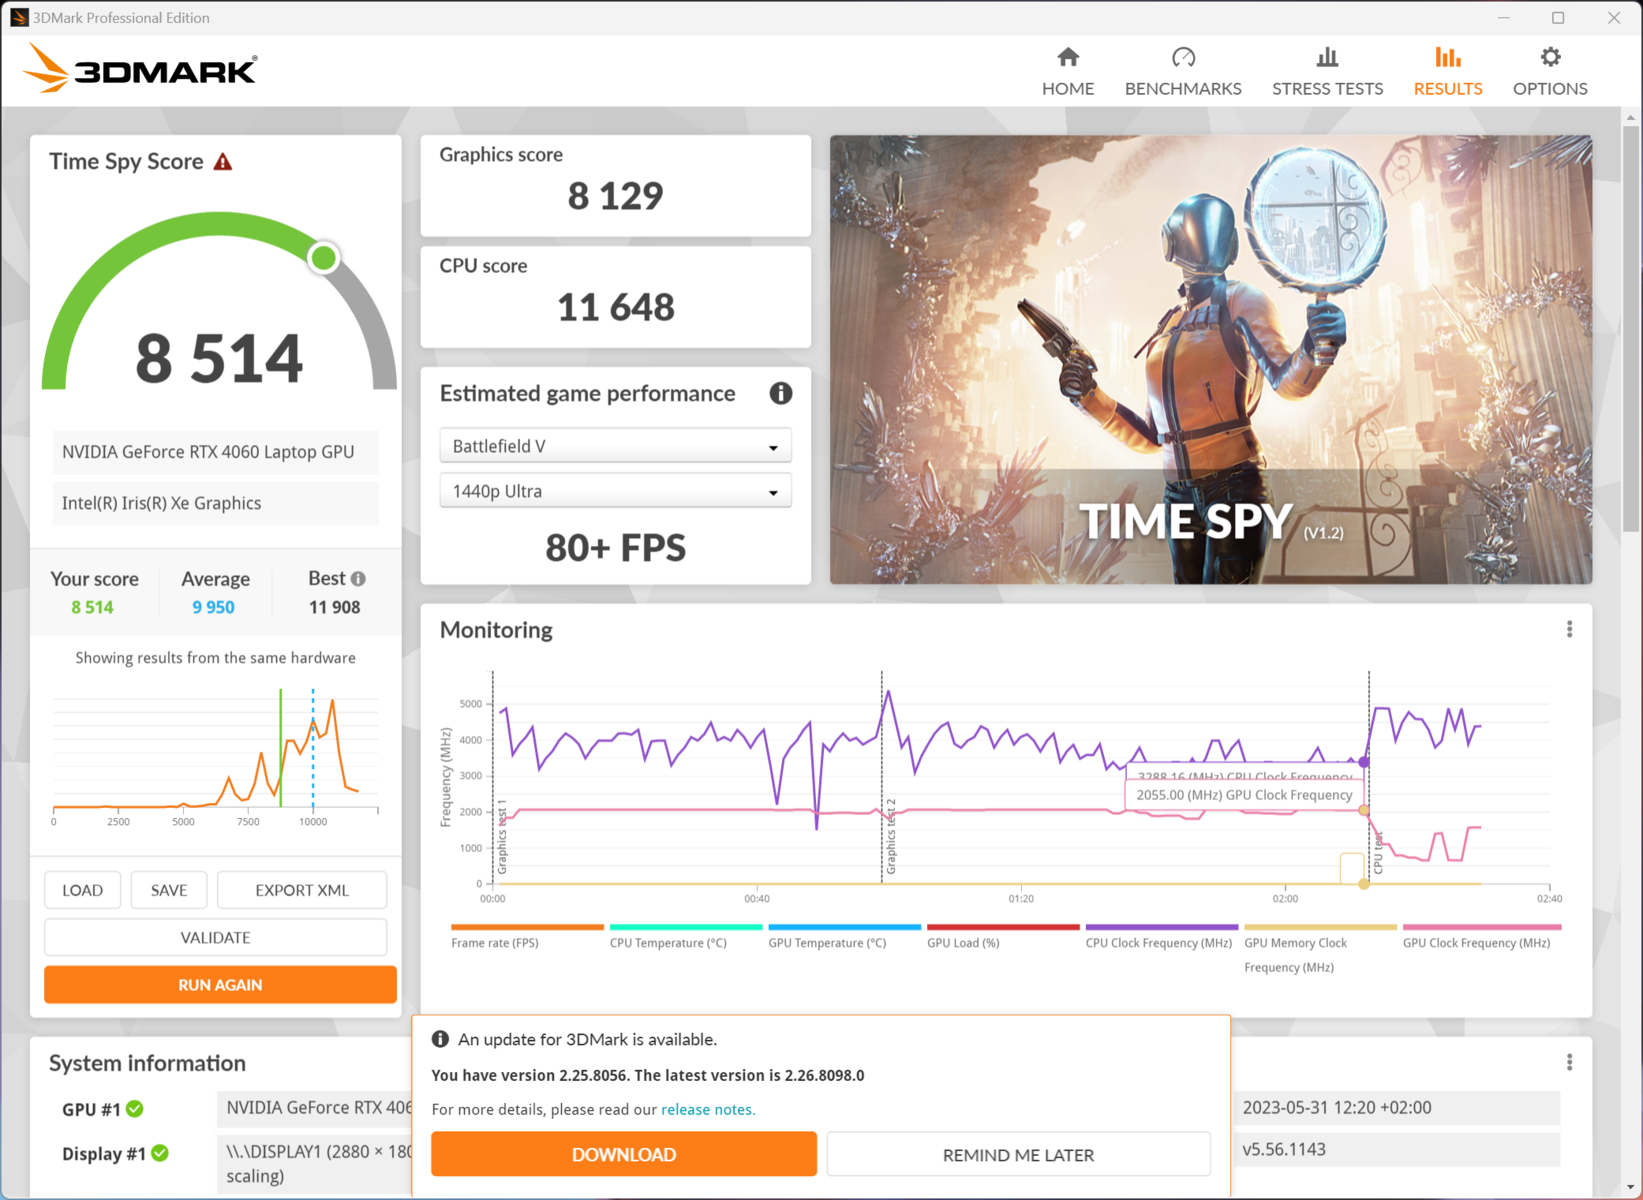
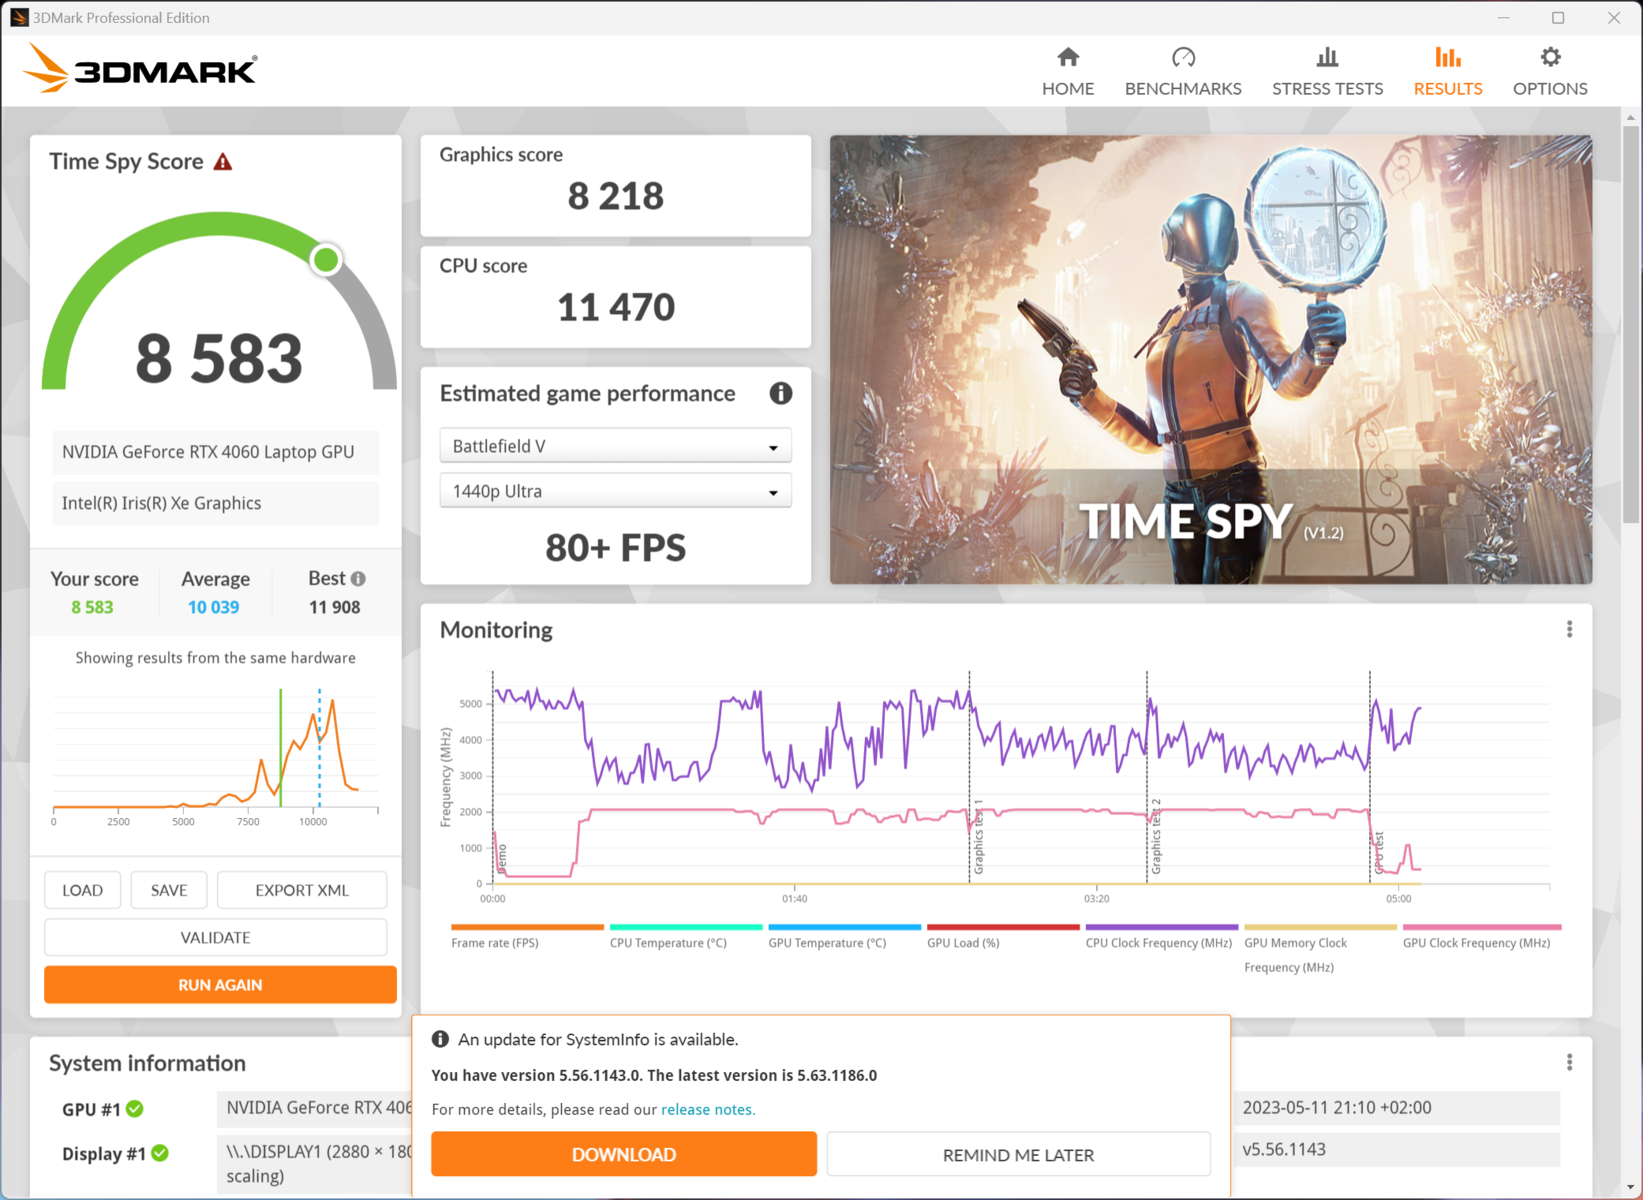
Tarjeta gráfica
Nuestra configuración de pruebas está equipada con el Nvidia GeForce RTX4060, que actualmente es el chip gráfico más potente del Asus Zenbook Pro 14 Duo. El chip es capaz de consumir un máximo de 55w en nuestra unidad de pruebas. Gracias al interruptor MUX, la GeForce RTX 4060 puede funcionar sola o junto con la iGPU del Intel Core i9. El chip de gama media de la generación Ada Lovelace de Nvidia es significativamente más eficiente que sus predecesores. Así, la 4060 del Zenbook es como mínimo igual a la 3060 del Acer Predator Triton 300 SE, aunque este es capaz de consumir 40 vatios más. Sin embargo, en funcionamiento con batería, la tarjeta gráfica sólo ofrece la mitad de rendimiento del que puede ofrecer en funcionamiento conectado a la red.
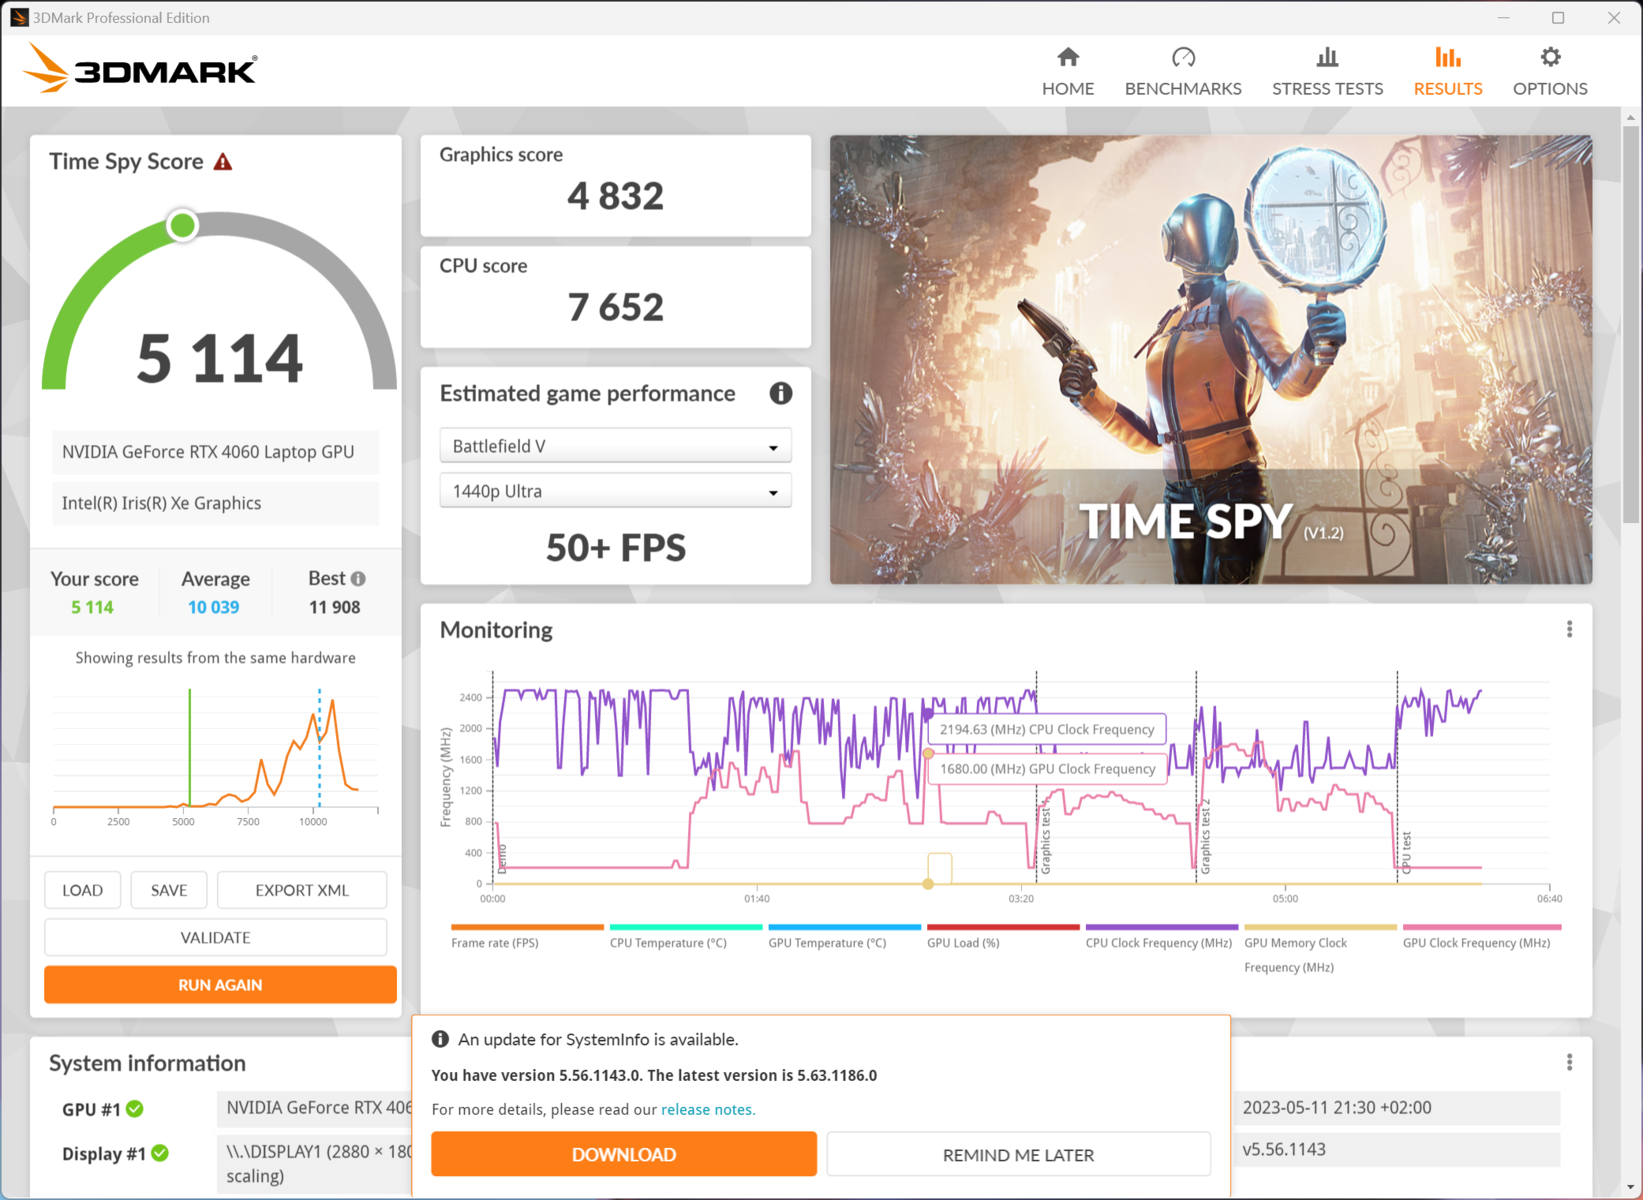
| 3DMark 11 Performance | 27133 puntos | |
| 3DMark Ice Storm Standard Score | 155098 puntos | |
| 3DMark Cloud Gate Standard Score | 58342 puntos | |
| 3DMark Fire Strike Score | 19869 puntos | |
| 3DMark Time Spy Score | 8514 puntos | |
ayuda | ||
* ... más pequeño es mejor
Rendimiento en juegos
El Zenbook Pro 14 Duo es adecuado para juegos HD casi sin limitaciones en nuestro test. Pero con sólo 8 GB de almacenamiento gráfico, los juegos más actuales podrían crear algunos problemas incluso en resoluciones bajas. En la resolución nativa del display, al menos más de 30 FPS son posibles en muchos juegos, mientras que el raytracing muestra claramente los límites de la GPU de gama media. Así que en general, el portátil también es adecuado para jugar, pero un portátil de juego puro debería ser capaz de ofrecer un rendimiento significativamente mayor.
| bajo | medio | alto | ultra | QHD | 4K | |
|---|---|---|---|---|---|---|
| GTA V (2015) | 183.5 | 153.7 | 86.5 | 64.9 | 60.1 | |
| The Witcher 3 (2015) | 333 | 176.4 | 163.5 | 143.2 | ||
| Dota 2 Reborn (2015) | 188.8 | 166.9 | 161.7 | 144.9 | 95.3 | |
| Final Fantasy XV Benchmark (2018) | 171 | 116.9 | 84 | 61 | 34.3 | |
| X-Plane 11.11 (2018) | 154.9 | 135 | 105.4 | 95.2 | ||
| Strange Brigade (2018) | 420 | 226 | 181.8 | 155.2 | ||
| F1 22 (2022) | 199.2 | 189.2 | 145.5 | 52.4 |
Emisiones - La refrigeración del AAS hace mucho ruido
Niveles de ruido
Mediante varios perfiles de potencia, puedes alternar entre un portátil muy silencioso o muy potente pero también ruidoso. En el modo Rendimiento, determinamos un nivel de ruido máximo de más de 60 dB(A) a una distancia de 15 cm (~6 in). El ruido del ventilador suena significativamente más fuerte delante del portátil que con otros portátiles. Esto se debe probablemente al sistema AAS, en el que sentimos una corriente de aire mucho más fuerte en los laterales del portátil que con muchos otros portátiles cuando tienen que rendir al máximo.
Por otro lado, el Zenbook casi siempre permanece muy silencioso en el funcionamiento diario, y sólo cuando la tarjeta gráfica y el procesador del portátil tienen que rendir al máximo los ventiladores alcanzan su máxima velocidad. Bajo carga media, medimos sólo unos silenciosos 32 dB(A).
Ruido
| Ocioso |
| 25.2 / 25.2 / 32.5 dB(A) |
| Carga |
| 59.7 / 60.9 dB(A) |
 | ||
30 dB silencioso 40 dB(A) audible 50 dB(A) ruidosamente alto |
||
min: | ||
| Asus ZenBook Pro 14 Duo UX8402VV-P1021W GeForce RTX 4060 Laptop GPU, i9-13900H, Samsung PM9A1 MZVL22T0HBLB | Acer Predator Triton 300 SE GeForce RTX 3060 Laptop GPU, i9-12900H, Micron 3400 1TB MTFDKBA1T0TFH | Lenovo Yoga Pro 7 14IRH G8 GeForce RTX 4050 Laptop GPU, i7-13700H, Samsung PM9A1 MZVL21T0HCLR | Gigabyte Aero 14 OLED BMF GeForce RTX 4050 Laptop GPU, i7-13700H, Gigabyte AG470S1TB-SI B10 | Asus Zephyrus Duo 16 GX650PY-NM006W GeForce RTX 4090 Laptop GPU, R9 7945HX, SK hynix PC801 HFS002TEJ9X101N | Schenker Vision 14 2022 RTX 3050 Ti GeForce RTX 3050 Ti Laptop GPU, i7-12700H, Samsung SSD 980 Pro 1TB MZ-V8P1T0BW | Asus Zenbook Pro 14 OLED UX6404VI GeForce RTX 4070 Laptop GPU, i9-13900H, Micron 3400 2TB MTFDKBA2T0TFH | Asus ROG Flow Z13 GZ301V GeForce RTX 4060 Laptop GPU, i9-13900H, WD PC SN740 SDDPTQD-1T00 | |
|---|---|---|---|---|---|---|---|---|
| Noise | 9% | 11% | 4% | 1% | 12% | 18% | 17% | |
| apagado / medio ambiente * (dB) | 25.2 | 23.8 6% | 22.9 9% | 24 5% | 23.9 5% | 24.4 3% | 23.3 8% | 24 5% |
| Idle Minimum * (dB) | 25.2 | 23.8 6% | 22.9 9% | 24 5% | 23.9 5% | 24.4 3% | 23.3 8% | 24 5% |
| Idle Average * (dB) | 25.2 | 23.8 6% | 22.9 9% | 24 5% | 32.9 -31% | 24.4 3% | 23.3 8% | 24 5% |
| Idle Maximum * (dB) | 32.5 | 30.6 6% | 36.8 -13% | 35.71 -10% | 36.5 -12% | 27.8 14% | 23.3 28% | 24 26% |
| Load Average * (dB) | 59.7 | 44.2 26% | 43.7 27% | 42.9 28% | 43.3 27% | 39.3 34% | 38.61 35% | |
| Load Maximum * (dB) | 60.9 | 60 1% | 46.2 24% | 51.93 15% | 56 8% | 48.8 20% | 48.8 20% | 43.59 28% |
| Witcher 3 ultra * (dB) | 60.1 | 46.2 | 40.22 | 51.2 | 48.2 | 48.8 | 41.24 |
* ... más pequeño es mejor
Temperaturas
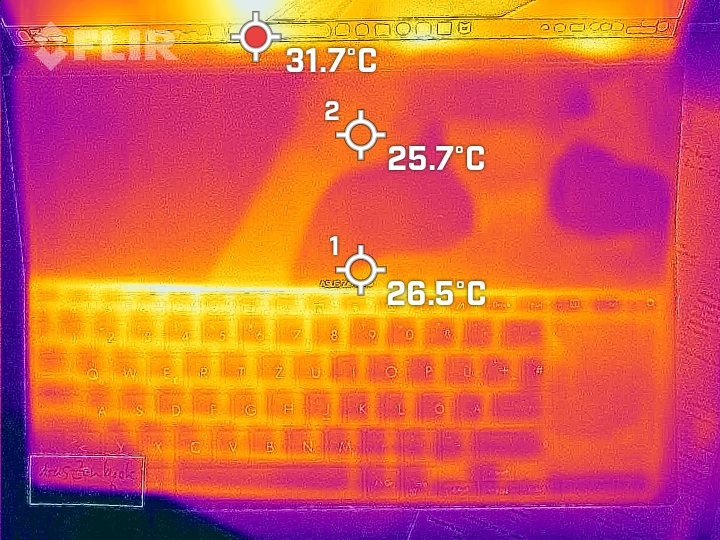
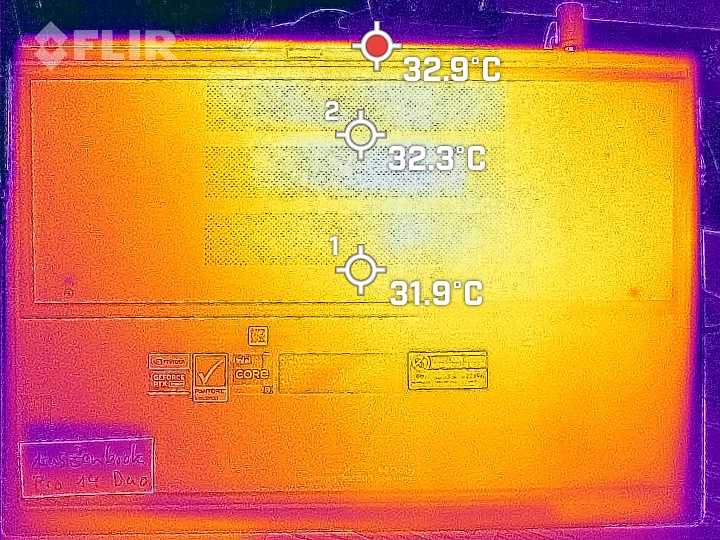
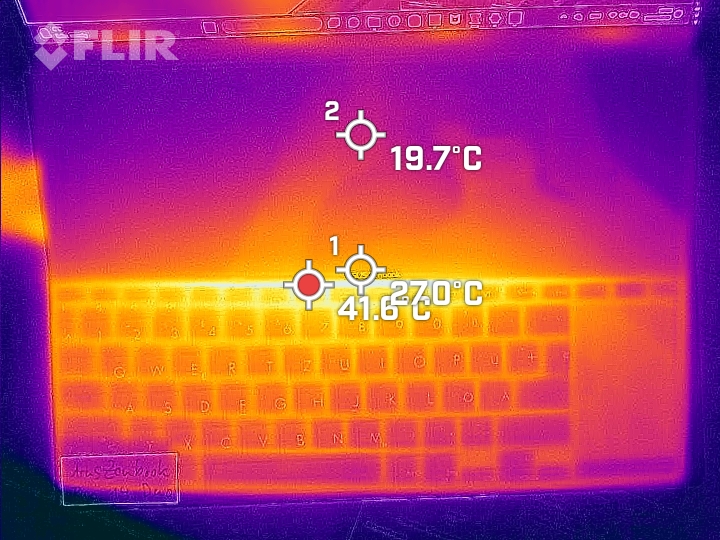
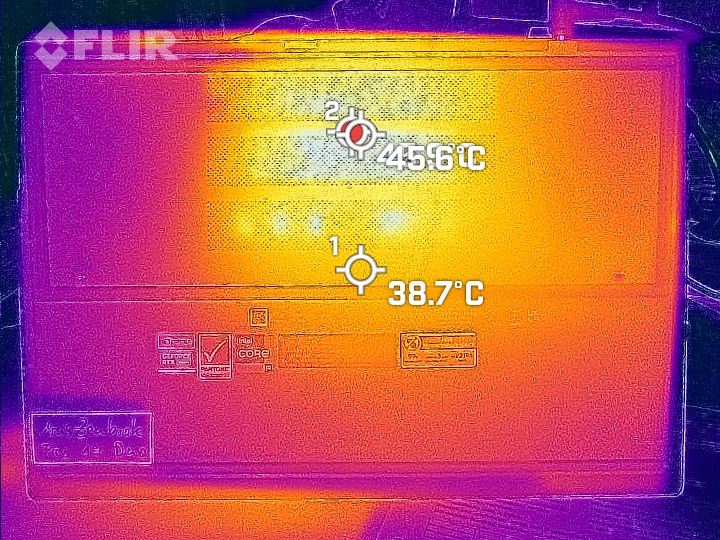
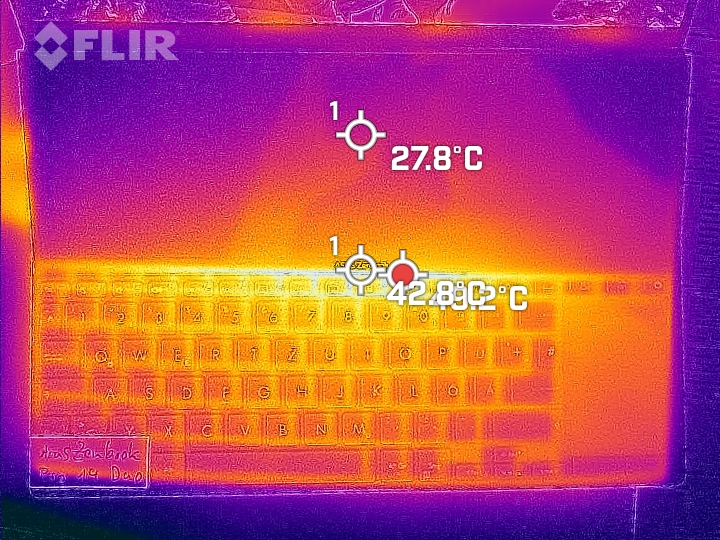
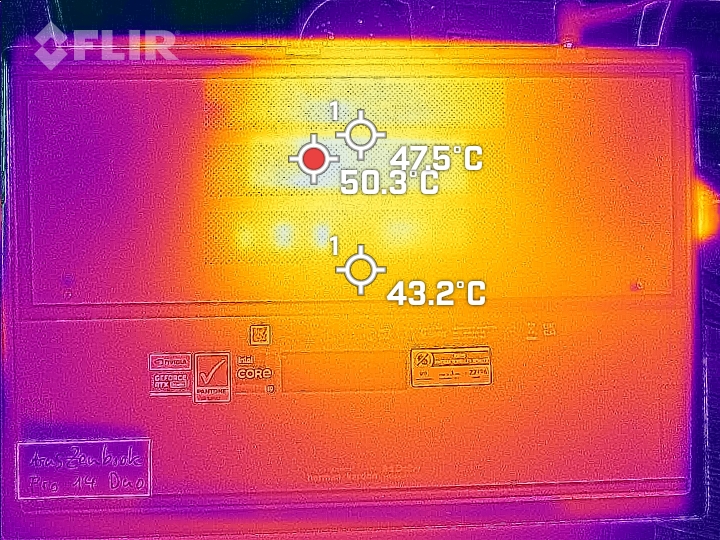
Dado que este portátil carece de reposamanos y apenas puedes usarlo en el regazo, tampoco tienes que preocuparte tanto por las temperaturas superficiales del portátil. Pero aún así merece la pena mencionar que el Zenbook puede mantener temperaturas superficiales mayormente cómodas. Sólo una pequeña franja entre el Screenpad+ y el teclado alcanza más de 40 °C en la parte superior. En nuestros mapas de calor de la parte inferior, puedes ver los tubos de calor brillando entre la CPU y la GPU. Cuando medimos con un sensor de temperatura, las temperaturas en la rejilla se acercan a los 40 °C (104 °F).
(+) La temperatura máxima en la parte superior es de 37.1 °C / 99 F, frente a la media de 36.8 °C / 98 F, que oscila entre 21 y 71 °C para la clase Multimedia.
(-) El fondo se calienta hasta un máximo de 49.4 °C / 121 F, frente a la media de 39.1 °C / 102 F
(+) En reposo, la temperatura media de la parte superior es de 27.7 °C / 82# F, frente a la media del dispositivo de 31.3 °C / 88 F.
(+) Jugando a The Witcher 3, la temperatura media de la parte superior es de 30.1 °C / 86 F, frente a la media del dispositivo de 31.3 °C / 88 F.
(±) El reposamanos y el touchpad pueden calentarse mucho al tacto con un máximo de 37.1 °C / 98.8 F.
(-) La temperatura media de la zona del reposamanos de dispositivos similares fue de 28.7 °C / 83.7 F (-8.4 °C / -15.1 F).
| Asus ZenBook Pro 14 Duo UX8402VV-P1021W Intel Core i9-13900H, NVIDIA GeForce RTX 4060 Laptop GPU | Acer Predator Triton 300 SE Intel Core i9-12900H, NVIDIA GeForce RTX 3060 Laptop GPU | Lenovo Yoga Pro 7 14IRH G8 Intel Core i7-13700H, NVIDIA GeForce RTX 4050 Laptop GPU | Gigabyte Aero 14 OLED BMF Intel Core i7-13700H, NVIDIA GeForce RTX 4050 Laptop GPU | Asus Zephyrus Duo 16 GX650PY-NM006W AMD Ryzen 9 7945HX, NVIDIA GeForce RTX 4090 Laptop GPU | Schenker Vision 14 2022 RTX 3050 Ti Intel Core i7-12700H, NVIDIA GeForce RTX 3050 Ti Laptop GPU | Asus Zenbook Pro 14 OLED UX6404VI Intel Core i9-13900H, NVIDIA GeForce RTX 4070 Laptop GPU | Asus ROG Flow Z13 GZ301V Intel Core i9-13900H, NVIDIA GeForce RTX 4060 Laptop GPU | |
|---|---|---|---|---|---|---|---|---|
| Heat | 2% | 1% | 3% | -1% | -8% | 1% | 2% | |
| Maximum Upper Side * (°C) | 37.1 | 43 -16% | 41.6 -12% | 42 -13% | 44.2 -19% | 48.4 -30% | 40.6 -9% | 42 -13% |
| Maximum Bottom * (°C) | 49.4 | 46.4 6% | 55.7 -13% | 52 -5% | 46.8 5% | 57.1 -16% | 49.5 -0% | 47 5% |
| Idle Upper Side * (°C) | 30 | 28.2 6% | 25.9 14% | 26 13% | 29.2 3% | 28.1 6% | 28.2 6% | 27 10% |
| Idle Bottom * (°C) | 32.4 | 28.4 12% | 28 14% | 27 17% | 30.2 7% | 29 10% | 30.6 6% | 30 7% |
* ... más pequeño es mejor
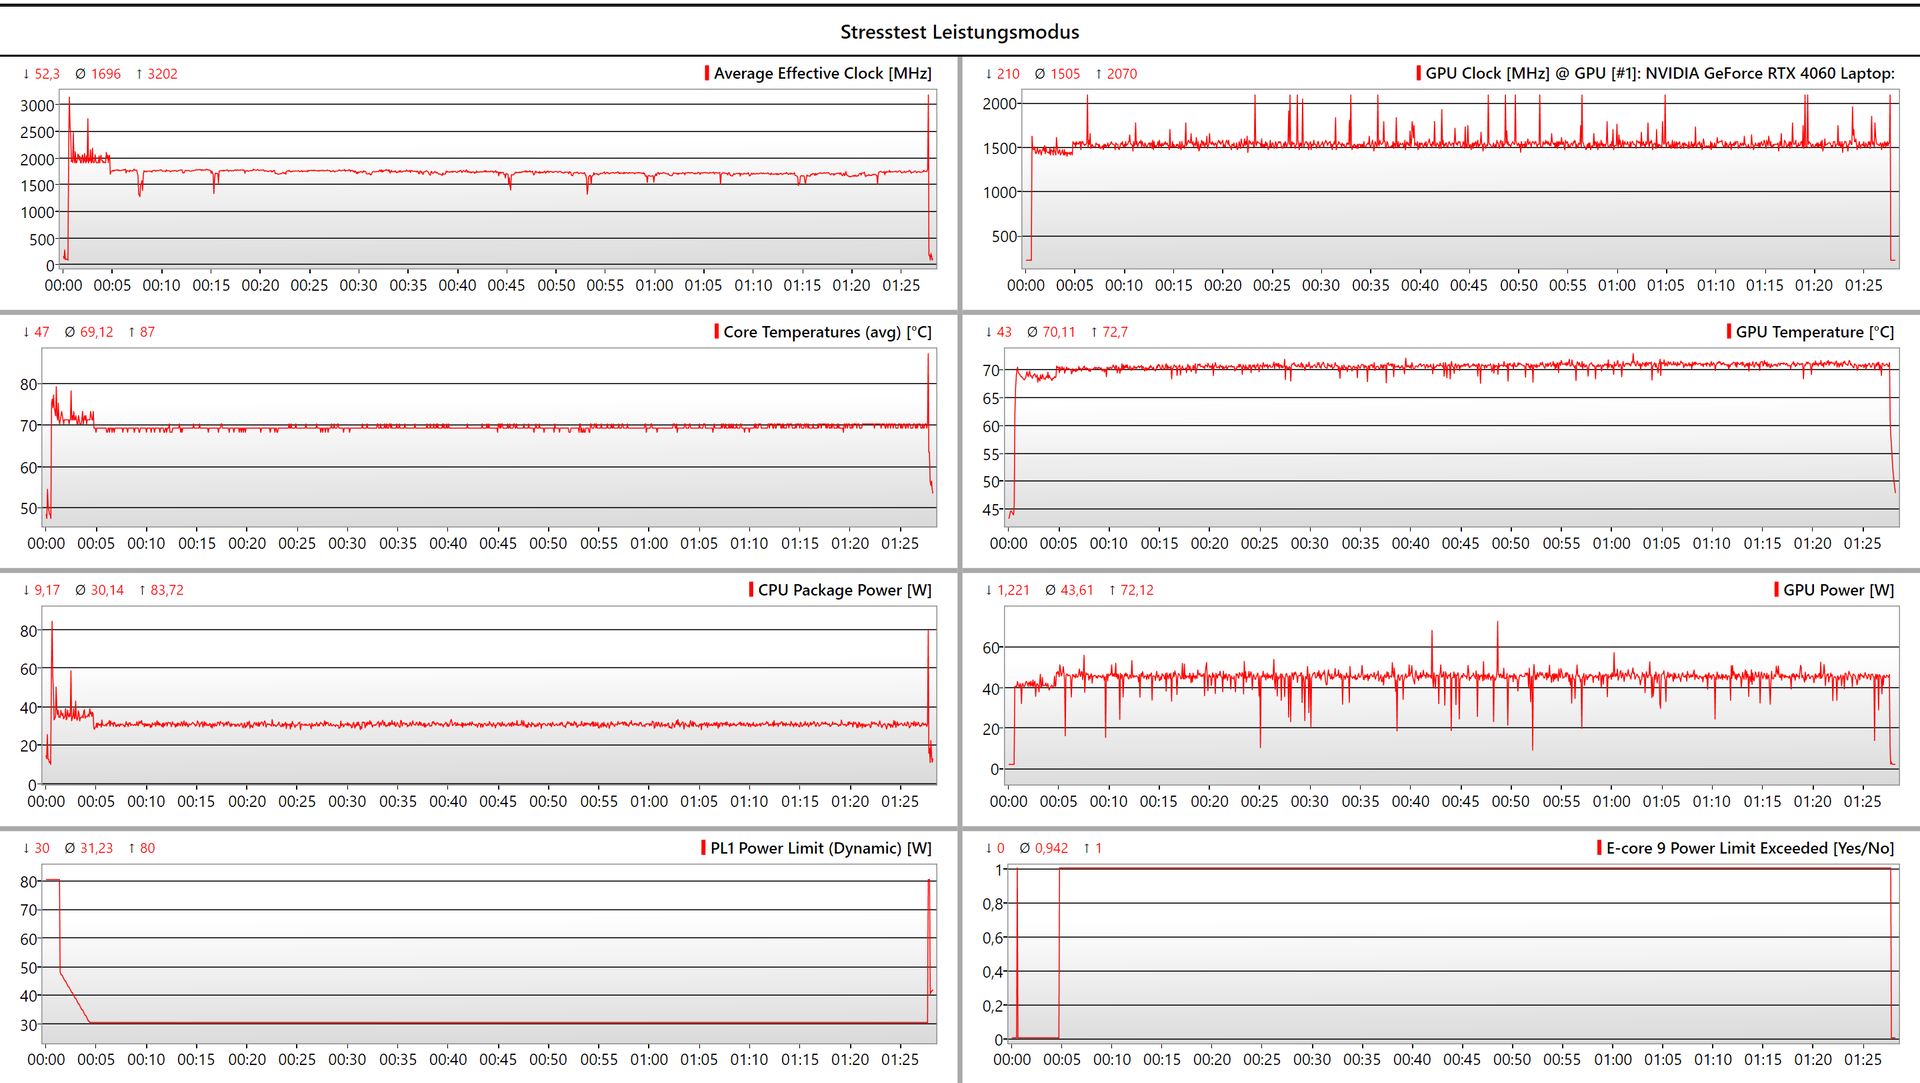
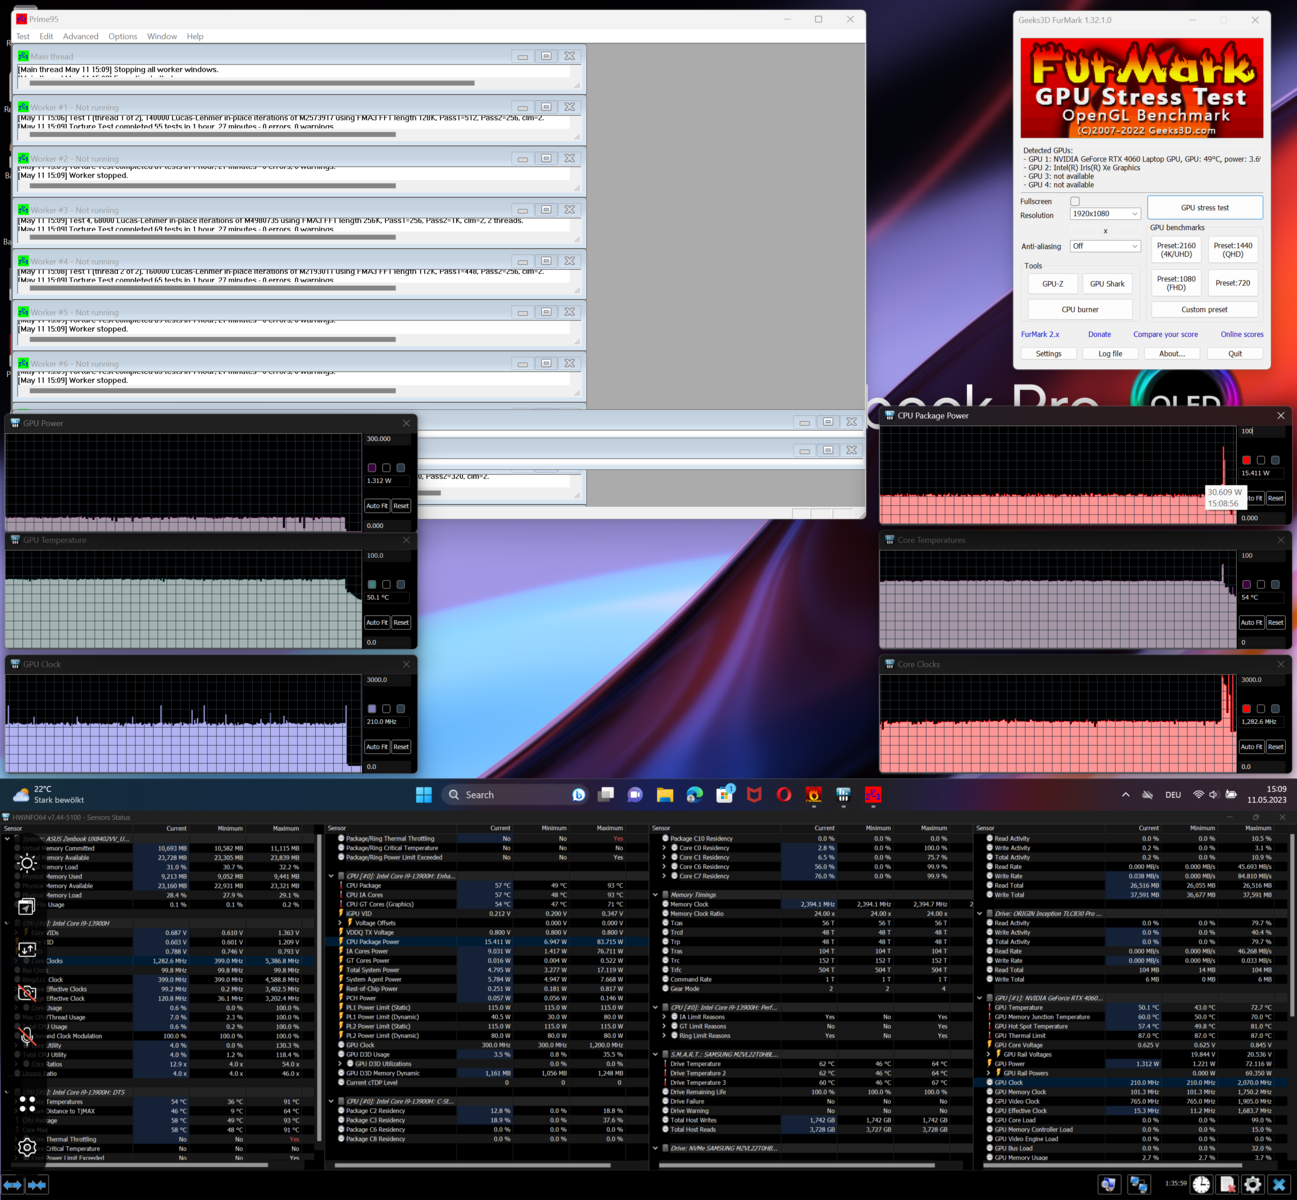
Prueba de resistencia
Tras unos cinco minutos en la prueba de estrés, los consumos de energía de la CPU y la GPU se estabilizan en 35 y 45 vatios respectivamente. Ambos chips alcanzan entonces una temperatura constante de 70 °C. No vemos fluctuaciones significativas en el rendimiento, la velocidad de reloj o las temperaturas durante la hora de carga con Prime95 y FurMark.
Altavoces
Al medir los altavoces durante la prueba, determinamos que apenas ofrecen graves y que los agudos están significativamente sobreacentuados. Pero al menos, puedes ajustar los agudos usando el ecualizador de Windows. Aunque con 66 dB(A), el volumen medio de los dos altavoces del Zenbook es bastante más alto que los ventiladores del portátil, su sonido no siempre es capaz de atravesar el ruido del ventilador. A veces, los auriculares conectados por Bluetooth o el puerto de audio de 3.5 mm parecen ser la mejor opción aquí.
Asus ZenBook Pro 14 Duo UX8402VV-P1021W análisis de audio
(+) | los altavoces pueden reproducir a un volumen relativamente alto (#83.7 dB)
Graves 100 - 315 Hz
(-) | casi sin bajos - de media 19.9% inferior a la mediana
(±) | la linealidad de los graves es media (11.9% delta a frecuencia anterior)
Medios 400 - 2000 Hz
(+) | medios equilibrados - a sólo 1.2% de la mediana
(+) | los medios son lineales (4.7% delta a la frecuencia anterior)
Altos 2 - 16 kHz
(±) | máximos más altos - de media 5.5% más altos que la mediana
(+) | los máximos son lineales (5.9% delta a la frecuencia anterior)
Total 100 - 16.000 Hz
(±) | la linealidad del sonido global es media (16.1% de diferencia con la mediana)
En comparación con la misma clase
» 41% de todos los dispositivos probados de esta clase eran mejores, 6% similares, 53% peores
» El mejor tuvo un delta de 5%, la media fue 17%, el peor fue ###max##%
En comparación con todos los dispositivos probados
» 26% de todos los dispositivos probados eran mejores, 5% similares, 69% peores
» El mejor tuvo un delta de 4%, la media fue 23%, el peor fue ###max##%
Apple MacBook Pro 16 2021 M1 Pro análisis de audio
(+) | los altavoces pueden reproducir a un volumen relativamente alto (#84.7 dB)
Graves 100 - 315 Hz
(+) | buen bajo - sólo 3.8% lejos de la mediana
(+) | el bajo es lineal (5.2% delta a la frecuencia anterior)
Medios 400 - 2000 Hz
(+) | medios equilibrados - a sólo 1.3% de la mediana
(+) | los medios son lineales (2.1% delta a la frecuencia anterior)
Altos 2 - 16 kHz
(+) | máximos equilibrados - a sólo 1.9% de la mediana
(+) | los máximos son lineales (2.7% delta a la frecuencia anterior)
Total 100 - 16.000 Hz
(+) | el sonido global es lineal (4.6% de diferencia con la mediana)
En comparación con la misma clase
» 0% de todos los dispositivos probados de esta clase eran mejores, 0% similares, 100% peores
» El mejor tuvo un delta de 5%, la media fue 17%, el peor fue ###max##%
En comparación con todos los dispositivos probados
» 0% de todos los dispositivos probados eran mejores, 0% similares, 100% peores
» El mejor tuvo un delta de 4%, la media fue 23%, el peor fue ###max##%
Gestión de la energía - Una batería de larga duración con 76 Wh
Consumo de energía
En algunas situaciones, el Asus Zenbook Pro 14 Duo es bastante más eficiente que sus competidores. Al menos entre los competidores con dGPU, el portátil se sitúa en el medio del campo. La RTX 4060 también muestra aquí que es capaz de funcionar significativamente más eficientemente que la RTX 3060. Bajo la misma carga, el consumo de energía del Zenbook se mantiene claramente por debajo del del Acer Predator Triton.
Asus incluye una fuente de alimentación de 180W con el Zenbook. Medimos un consumo máximo de 140w bajo todas las condiciones de carga, por lo que la fuente de alimentación incluida ofrece potencia más que suficiente.
| Off / Standby | |
| Ocioso | |
| Carga |
|
Clave:
min: | |
| Asus ZenBook Pro 14 Duo UX8402VV-P1021W i9-13900H, GeForce RTX 4060 Laptop GPU, Samsung PM9A1 MZVL22T0HBLB, OLED, 2880x1800, 14.5" | Acer Predator Triton 300 SE i9-12900H, GeForce RTX 3060 Laptop GPU, Micron 3400 1TB MTFDKBA1T0TFH, OLED, 2880x1800, 14" | Lenovo Yoga Pro 7 14IRH G8 i7-13700H, GeForce RTX 4050 Laptop GPU, Samsung PM9A1 MZVL21T0HCLR, IPS, 3072x1920, 14.5" | Gigabyte Aero 14 OLED BMF i7-13700H, GeForce RTX 4050 Laptop GPU, Gigabyte AG470S1TB-SI B10, OLED, 2880x1800, 14" | Asus Zephyrus Duo 16 GX650PY-NM006W R9 7945HX, GeForce RTX 4090 Laptop GPU, SK hynix PC801 HFS002TEJ9X101N, MiniLED, 2560x1600, 16" | Schenker Vision 14 2022 RTX 3050 Ti i7-12700H, GeForce RTX 3050 Ti Laptop GPU, Samsung SSD 980 Pro 1TB MZ-V8P1T0BW, IPS, 2880x1800, 14" | Asus Zenbook Pro 14 OLED UX6404VI i9-13900H, GeForce RTX 4070 Laptop GPU, Micron 3400 2TB MTFDKBA2T0TFH, OLED, 2880x1800, 14.5" | Asus ROG Flow Z13 GZ301V i9-13900H, GeForce RTX 4060 Laptop GPU, WD PC SN740 SDDPTQD-1T00, IPS, 2560x1600, 13.4" | Medio NVIDIA GeForce RTX 4060 Laptop GPU | Media de la clase Multimedia | |
|---|---|---|---|---|---|---|---|---|---|---|
| Power Consumption | -23% | -1% | 21% | -128% | 12% | -9% | 1% | -36% | 19% | |
| Idle Minimum * (Watt) | 8.5 | 7.6 11% | 7.6 11% | 7.4 13% | 19.2 -126% | 7.5 12% | 7.5 12% | 8.5 -0% | 11.5 ? -35% | 5.66 ? 33% |
| Idle Average * (Watt) | 8.8 | 12.3 -40% | 13.3 -51% | 8.3 6% | 29.7 -237% | 10.4 -18% | 11.1 -26% | 12.4 -41% | 16 ? -82% | 10.2 ? -16% |
| Idle Maximum * (Watt) | 16.5 | 17.6 -7% | 13.7 17% | 8.7 47% | 30.8 -87% | 11.4 31% | 11.6 30% | 13.3 19% | 20.3 ? -23% | 12.5 ? 24% |
| Load Average * (Watt) | 102 | 111 -9% | 88.2 14% | 76 25% | 126 -24% | 83.3 18% | 91.9 10% | 93 9% | 92.9 ? 9% | 65.2 ? 36% |
| Witcher 3 ultra * (Watt) | 101.2 | 117.1 -16% | 94.2 7% | 70 31% | 258 -155% | 92.7 8% | 132.2 -31% | 87.8 13% | ||
| Load Maximum * (Watt) | 140 | 245.8 -76% | 143 -2% | 132 6% | 330 -136% | 110.3 21% | 208 -49% | 135 4% | 210 ? -50% | 113.5 ? 19% |
* ... más pequeño es mejor
Power Consumption The Witcher 3 / Stress Test
Power Consumption With External Monitor
Duración de la batería
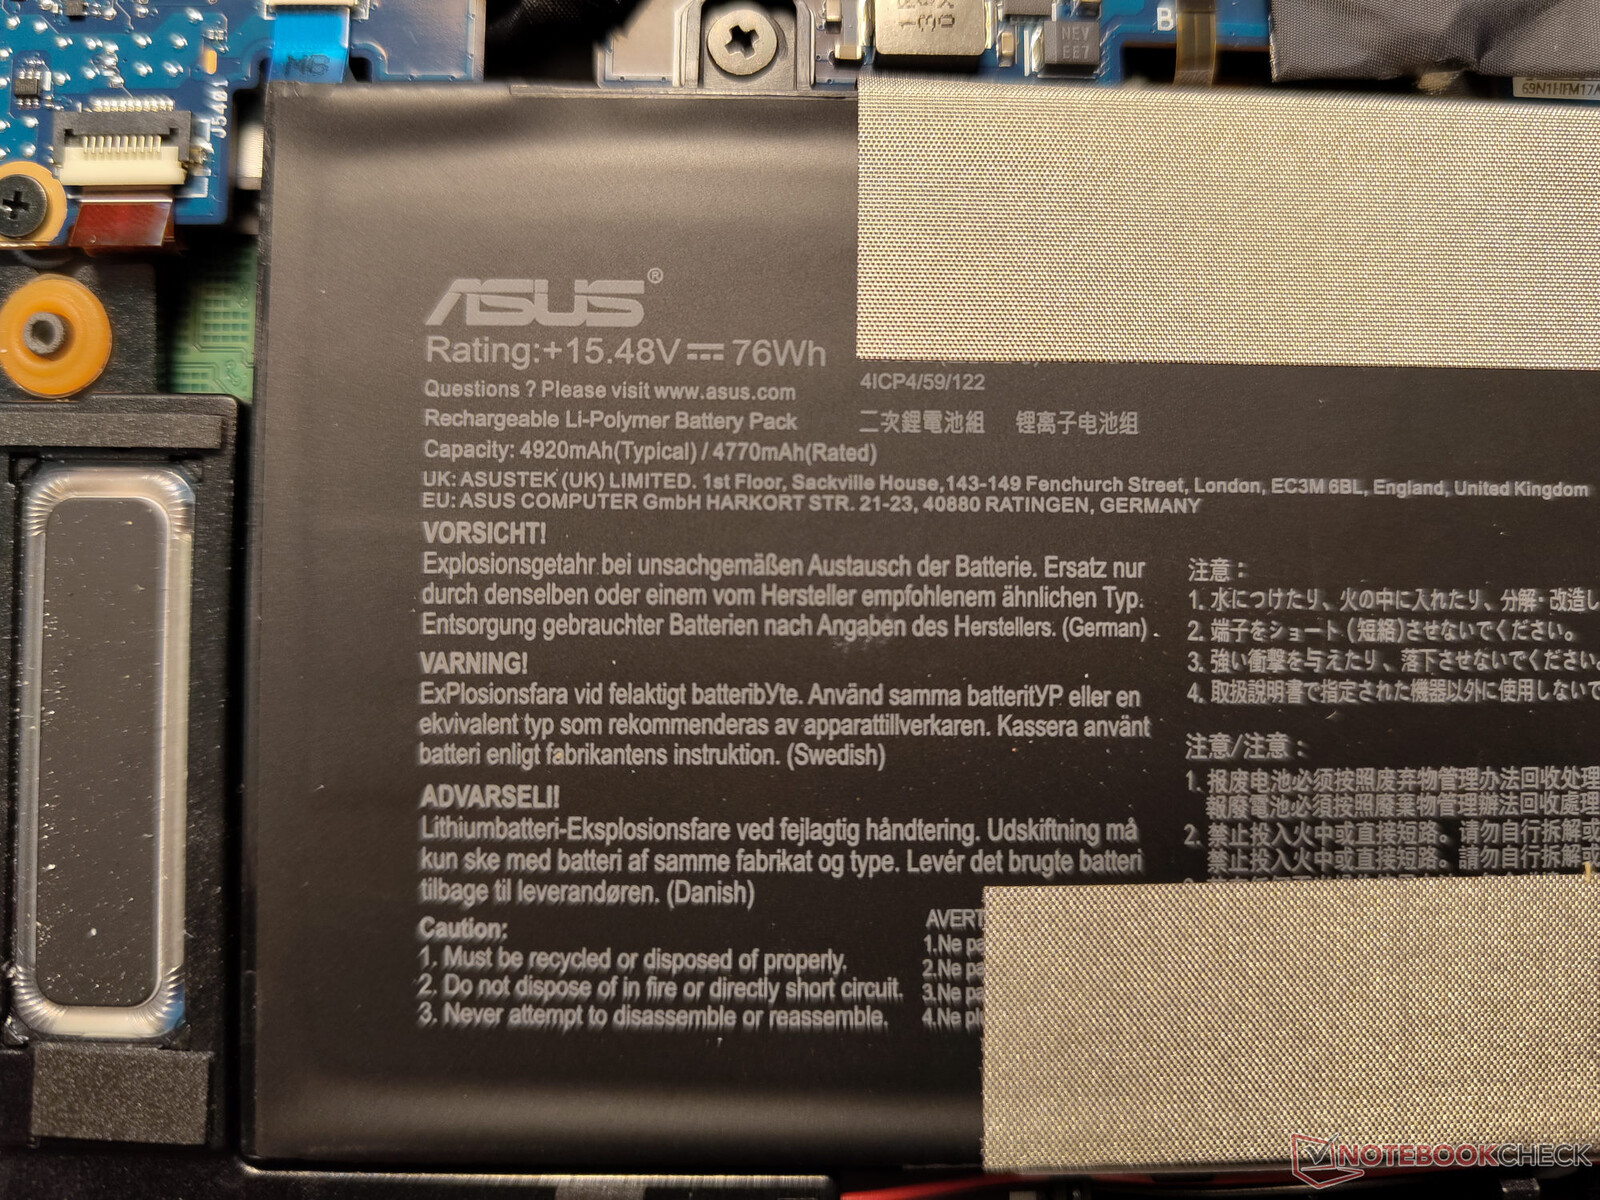
Dependiendo de los escenarios de uso y las cargas del portátil, también obtenemos duraciones muy diferentes. Durante nuestro test de navegación web Wi-Fi con un brillo de display de 150 cd/m², desactivamos el segundo display, resultando en que el Zenbook Pro 14 Duo dura nueve horas lejos del cargador. Con ambas pantallas a brillo máximo son tres horas y media menos, empero. Ambas pruebas usan el modo GPU híbrido, en el que se puede desactivar el chip gráfico Nvidia. En el test Battery Eater bajo carga media, la batería de 76 Wh aún dura más de tres horas. Dependiendo del escenario de uso, el portátil es adecuado para uso móvil con esto. Por el camino, también puedes cargar el Zenbook usando un cargador USB-C, aunque debería ofrecer al menos 45w para poder seguir cargando la batería durante el funcionamiento del portátil.
| Asus ZenBook Pro 14 Duo UX8402VV-P1021W i9-13900H, GeForce RTX 4060 Laptop GPU, 76 Wh | Acer Predator Triton 300 SE i9-12900H, GeForce RTX 3060 Laptop GPU, 76 Wh | Lenovo Yoga Pro 7 14IRH G8 i7-13700H, GeForce RTX 4050 Laptop GPU, 73 Wh | Asus Zephyrus Duo 16 GX650PY-NM006W R9 7945HX, GeForce RTX 4090 Laptop GPU, 90 Wh | Schenker Vision 14 2022 RTX 3050 Ti i7-12700H, GeForce RTX 3050 Ti Laptop GPU, 99.8 Wh | Media de la clase Multimedia | |
|---|---|---|---|---|---|---|
| Duración de Batería | -47% | -34% | -64% | -14% | -8% | |
| WiFi v1.3 (h) | 9 | 6.2 -31% | 9.9 10% | 4 -56% | 10.1 12% | 12.2 ? 36% |
| Load (h) | 3.5 | 1.3 -63% | 0.8 -77% | 1 -71% | 2.1 -40% | 1.664 ? -52% |
| Reader / Idle (h) | 8.1 | 24.9 ? | ||||
| H.264 (h) | 12.4 | 3.8 | 11.1 | 17.1 ? |
Pro
Contra
Veredicto - No es para todos
Con su equipamiento, el Zenbook Pro 14 Duo está preparado para muchos escenarios de aplicación. El hardware es potente con el Intel Core i9-13900Hy Nvidia GeForce RTX 4060, ofreciendo también un rendimiento elevado en el Zenbook. Con la pantalla secundaria, la productividad del portátil puede aumentar significativamente. Sin embargo, debido a su inusual diseño, el portátil no es tan móvil como otros dispositivos. Es mejor, si permanece en el escritorio, pero también requiere más espacio allí que otros portátiles. En las mesas pequeñas de trenes, aviones o aulas, el espacio puede ser reducido para el Zenbook Pro 14 Duo, y pierde claramente la ventaja de movilidad de ser un portátil de 14.5 pulgadas.
Aunque puedes ser más productivo con la segunda pantalla, también necesitas más espacio para el Zenbook Pro 14 Duo.
El alto rendimiento del portátil se ve empañado por el hecho de que la refrigeración AAS no aporta ninguna ventaja significativa comparado con otros portátiles de 14 o 15 pulgadas. Ni en rendimiento, ni en consumo de energía ni en temperaturas logra el Zenbook Pro 14 Duo situarse significativamente por delante de la competencia.
Los 3,600 Euros que Asus pide por el portátil sólo están justificados si puedes hacer uso completo del segundo display. Si no, dispositivos como el Lenovo Yoga Pro 7 o el Asus VivoBook S 14Xpodrían ser una mejor opción.
Precio y disponibilidad
El Zenbook Pro 14 Duo está disponible en el fabricante a partir de ~$2000 en EE.UU. Con Nvidia GeForce RTX 4060, el Zenbook Pro 14 Duo cuesta ~$2,400del fabricante. Amazon también tiene una versión con la RTX 3050 Ti por ~$2,200.
Asus ZenBook Pro 14 Duo UX8402VV-P1021W
- 05/31/2023 v7 (old)
Marc Herter
Transparencia
La selección de los dispositivos que se van a reseñar corre a cargo de nuestro equipo editorial. La muestra de prueba fue proporcionada al autor en calidad de préstamo por el fabricante o el minorista a los efectos de esta reseña. El prestamista no tuvo ninguna influencia en esta reseña, ni el fabricante recibió una copia de la misma antes de su publicación. No había ninguna obligación de publicar esta reseña. Como empresa de medios independiente, Notebookcheck no está sujeta a la autoridad de fabricantes, minoristas o editores.
Así es como prueba Notebookcheck
Cada año, Notebookcheck revisa de forma independiente cientos de portátiles y smartphones utilizando procedimientos estandarizados para asegurar que todos los resultados son comparables. Hemos desarrollado continuamente nuestros métodos de prueba durante unos 20 años y hemos establecido los estándares de la industria en el proceso. En nuestros laboratorios de pruebas, técnicos y editores experimentados utilizan equipos de medición de alta calidad. Estas pruebas implican un proceso de validación en varias fases. Nuestro complejo sistema de clasificación se basa en cientos de mediciones y puntos de referencia bien fundamentados, lo que mantiene la objetividad.Price comparison

