Análisis para el Intel Core i9-12900H procesador
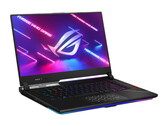
Análisis del Asus ROG Strix Scar 15 G533zm: Moderno portátil para juegos RTX 3060 con muchos puntos fuertes
Después de probar el Scar 15 G533zw con una RTX 3070 Ti, ahora también tenemos en nuestras manos el G533zm con una RTX 3060. El portátil Scar es personalizable y ofrece muchas características modernas, como Wi-Fi 6E, memoria RAM DDR5 y Thunderbolt 4. En nuestro análisis, analizaremos si estas características son suficientes para justificar el precio bastante elevado de 1.999 euros (2.166 dólares) por un portátil para juegos con RTX 3060.
Intel Core i9-12900H, NVIDIA GeForce RTX 3060 Laptop GPU, 15.6", 2.3 kgReseña del mini PC Beelink GTI12 Ultra EX Docking Station: Más asequible de lo esperado
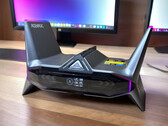
Las estaciones de acoplamiento para mini PC eGPU eran poco comunes y caras hace tan sólo unos años, pero la base Beelink EX es una de las opciones menos caras hasta la fecha sin necesidad de sacrificar funciones o calidad por el camino.
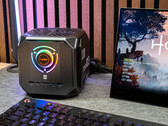
Intel Core i9-12900H, NVIDIA GeForce RTX 3070, 1.3 kgAnálisis del Acemagic M2A Starship: PC para juegos con aspecto de nave espacial futurista basado en Intel Core i9-12900H y GPU para portátiles Nvidia GeForce RTX 3080
Con el M2A Starship, Acemagic tiene en cartera un PC para juegos muy llamativo. El inusual diseño en forma de nave espacial del mini PC llama la atención, sin embargo, hay hardware familiar ya utilizado en el Acemagic Tank03. En esta reseña, analizamos el rendimiento práctico del Intel Core i9-12900H y la GPU NvidiaGeForce-RTX-3080 para portátiles en la exclusiva carcasa.
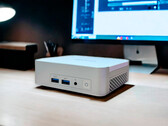
Intel Core i9-12900H, NVIDIA GeForce RTX 3080 Laptop GPU, 2.1 kgReseña del Geekom XT12 Pro: Elegante alternativa al mini-PC NUC con Intel Core i9-12900H, 32 GB de RAM DDR4 y 1 TB de SSD
Geekom presentó hace unos días el XT12 Pro como un mini-PC NUC potente y eficiente. Sin embargo, al estar basado en un Intel Core i9-12900H, tiene que conformarse con un procesador algo más antiguo. Utilizando numerosas mediciones y pruebas comparativas, hemos analizado si Geekom puede mantener aquí su promesa de eficiencia y qué tal se comporta el XT12 Pro frente a la competencia.
Intel Core i9-12900H, Iris Xe G7 96EUs, 545 gAnálisis del PC para juegos Acemagic Tank 03: El pequeño mini PC con Intel Core i9-12900H y GPU Nvidia GeForce RTX 3080 también domina los juegos actuales
Con el Tank 03, Acemagic ofrece un mini PC muy especial en su cartera que destaca por un enorme rendimiento empaquetado en el mínimo espacio. Al menos, esto es lo que prometen sus especificaciones técnicas. Descubra en este análisis, lo que el Intel Core i9-12900H en combinación con la GPU Nvidia GeForce RTX-3080 para portátiles puede hacer en la práctica. Como característica especial, el mini PC también ofrece tres perfiles de rendimiento diferentes que también examinamos en detalle.
Intel Core i9-12900H, NVIDIA GeForce RTX 3080 Laptop GPUAcemagic Tank03: NVIDIA GeForce RTX 3080 Laptop GPU
análise » Análisis del PC para juegos Acemagic Tank 03: El pequeño mini PC con Intel Core i9-12900H y GPU Nvidia GeForce RTX 3080 también domina los juegos actuales
análise » Análisis del PC para juegos Acemagic Tank 03: El pequeño mini PC con Intel Core i9-12900H y GPU Nvidia GeForce RTX 3080 también domina los juegos actuales
Razer Blade 15 OLED (Early 2022): NVIDIA GeForce RTX 3070 Ti Laptop GPU, 15.60", 2 kg
análise » Análisis del Razer Blade 15 OLED (principios de 2022): Un portátil de juegos compacto con una RTX 3070 Ti
Asus ProArt StudioBook 16 H7600ZW: NVIDIA GeForce RTX 3070 Ti Laptop GPU, 16.00", 2.4 kg
análise » Análisis del Asus ProArt StudioBook 16 H7600ZW: La alternativa definitiva al MacBook Pro para creadores de contenidos
Asus ROG Zephyrus M16 GU603Z: NVIDIA GeForce RTX 3070 Ti Laptop GPU, 16.00", 2.1 kg
análise » Análisis del portátil Asus ROG Zephyrus M16: Un paquete de juegos completo
Minisforum Neptune Series NAD9: Intel Iris Xe Graphics G7 96EUs, 1.2 kg
análise » Análisis del PC de sobremesa Neptune Series NAD9 de Minisforum: Potencia compacta con Intel Core i9-12900H
Asus ZenBook Pro 16X OLED UX7602ZM-ME115W: NVIDIA GeForce RTX 3060 Laptop GPU, 16.00", 2.4 kg
análise » Asus Zenbook Pro 16X OLED - Portátil extremo con un truco especial
Acer Predator Triton 300 SE: NVIDIA GeForce RTX 3060 Laptop GPU, 14.00", 1.7 kg
análise » Análisis del Acer Predator Triton 300 SE PT314: Refrigeración por metal líquido para un portátil de 14 pulgadas
Uniwell Technology GM7AG8N Liquid Cooling Box: NVIDIA GeForce RTX 3080 Ti Laptop GPU, 17.00", 2.7 kg
análise » La caja de refrigeración líquida es más silenciosa de lo esperado: Análisis del portátil Uniwell Technology GM7AG8N
Alienware x15 R2 P111F: NVIDIA GeForce RTX 3080 Ti Laptop GPU, 15.60", 2.4 kg
análise » Análisis del portátil Alienware x15 R2: El ultrabook UFO se dispara con el Core i9-12900H y la RTX 3080 Ti de 140 W
MSI Creator Z17 A12UGST-054: NVIDIA GeForce RTX 3070 Ti Laptop GPU, 17.00", 2.5 kg
análise » Análisis del portátil MSI Creator Z17: ¿Qué obtienen los creativos y los jugadores por unos 4.000 euros?
Dell Precision 5000 5470: NVIDIA RTX A1000 Laptop GPU, 14.00", 1.6 kg
análise » Análisis de la estación de trabajo Dell Precision 5470: Debut de la Nvidia RTX A1000
Schenker XMG Pro 17 E22: NVIDIA GeForce RTX 3080 Ti Laptop GPU, 17.30", 2.8 kg
análise » Análisis del Schenker XMG Pro 17 E22: El portátil para juegos con RTX 3080 Ti ofrece lo mejor
Razer Blade 17 Early 2022: NVIDIA GeForce RTX 3080 Ti Laptop GPU, 17.30", 2.8 kg
análise » Análisis del Razer Blade 17 (principios de 2022): Elegante portátil para juegos 4k con una pantalla brillante
MSI Creator Z16P B12UHST: NVIDIA GeForce RTX 3080 Ti Laptop GPU, 16.00", 2.4 kg
análise » Análisis del portátil MSI Creator Z16P: Trabajo creativo con un i9 y la RTX 3080 Ti
Asus ROG Strix Scar 15 G533ZW-LN106WS: NVIDIA GeForce RTX 3070 Ti Laptop GPU, 15.60", 2.3 kg
análise » Análisis del portátil Asus ROG Strix Scar 15 G533ZW: potencia para juegos a 1440p y 240 Hz con Alder Lake Core i9 y RTX 3070 Ti de 150 W
MSI Pulse GL66 12UEK: NVIDIA GeForce RTX 3060 Laptop GPU, 15.60", 2.3 kg
análise » Análisis del MSI Pulse GL66: ¿El i9-12900H mejora el portátil para juegos RTX-3060 o sólo lo encarece?
MSI Vector GP66 12UGS: NVIDIA GeForce RTX 3070 Ti Laptop GPU, 15.60", 2.3 kg
análise » Análisis del portátil MSI Vector GP66 12UGS: 150 W TGP GeForce RTX 3070 Ti punto dulce
Asus ROG Flow Z13 GZ301ZE: NVIDIA GeForce RTX 3050 Ti Laptop GPU, 13.40", 1.2 kg
análise » Asus ROG Flow Z13 en revisión: Tableta para juegos con una potente CPU Alder Lake i9
Schenker Uniwill Technology GM7AG8P: NVIDIA GeForce RTX 3080 Ti Laptop GPU, 17.30", 2.3 kg
análise » Estreno del Intel Core i9-12900H: Análisis del portátil Uniwill Technology GM7AG8P
Acer Nitro 5 AN515-58, i9-12900H RTX 4060: NVIDIA GeForce RTX 4060 Laptop GPU, 15.60", 2.6 kg
análise externo » Acer Nitro 5 AN515-58, i9-12900H RTX 4060
Acer Nitro 5 AN517-55-96S6: NVIDIA GeForce RTX 4060 Laptop GPU, 17.30", 3 kg
análise externo » Acer Nitro 5 AN517-55-96S6
Asus ZenBook Pro 16X OLED UX7602ZM-ME115W: NVIDIA GeForce RTX 3060 Laptop GPU, 16.00", 2.4 kg
análise externo » Asus ZenBook Pro 16X OLED UX7602ZM-ME115W
MSI Crosshair 15 B12UEZ, i9-12900H: NVIDIA GeForce RTX 3060 Laptop GPU, 15.60", 2.3 kg
análise externo » MSI Crosshair 15 B12UEZ, i9-12900H
Acer Predator Helios 300 PH315-55-98R7: NVIDIA GeForce RTX 3070 Ti Laptop GPU, 15.60", 2.6 kg
análise externo » Acer Predator Helios 300 PH315-55-98R7
Razer Blade 15 OLED (Early 2022): NVIDIA GeForce RTX 3070 Ti Laptop GPU, 15.60", 2 kg
análise externo » Razer Blade 15 OLED (Early 2022)
Alienware x15 R2 P111F: NVIDIA GeForce RTX 3080 Ti Laptop GPU, 15.60", 2.4 kg
análise externo » Alienware x15 R2 P111F
HP ZBook Studio 16 G9, i9-12900H RTX 3080 Ti: NVIDIA GeForce RTX 3080 Ti Laptop GPU, 16.00", 1.7 kg
análise externo » HP ZBook Studio 16 G9, i9-12900H RTX 3080 Ti
HP Omen 16-k0097ng: NVIDIA GeForce RTX 3070 Ti Laptop GPU, 16.10", 2.4 kg
análise externo » HP Omen 16-k0097ng
Acer Predator Helios 300 PH315-55s-98TX: NVIDIA GeForce RTX 3080 Laptop GPU, 15.60", 2.6 kg
análise externo » Acer Predator Helios 300 PH315-55s-98TX
Acer Predator Helios 300 PH317-56-94RD: NVIDIA GeForce RTX 3080 Laptop GPU, 17.30", 3 kg
análise externo » Acer Predator Helios 300 PH317-56-94RD
Asus ROG Strix SCAR 15 G533ZX-LN060W: NVIDIA GeForce RTX 3080 Ti Laptop GPU, 15.60", 2.4 kg
análise externo » Asus ROG Strix SCAR 15 G533ZX-LN060W
HP ZBook Studio 16 G9 62U30EA: NVIDIA RTX A3000 Laptop GPU, 16.00", 1.7 kg
análise externo » HP ZBook Studio 16 G9 62U30EA
Asus ProArt StudioBook 16 H7600ZM-L2038X: NVIDIA GeForce RTX 3060 Laptop GPU, 16.00", 2.4 kg
análise externo » Asus ProArt StudioBook 16 H7600ZM-L2038X
Lenovo Legion 5 Pro 16IAH7H, i9-12900H RTX 3070 Ti: NVIDIA GeForce RTX 3070 Ti Laptop GPU, 16.00", 2.5 kg
análise externo » Lenovo Legion 5 Pro 16IAH7H, i9-12900H RTX 3070 Ti
Razer Blade 15 2022 RZ09-0421NGG3-R3G1: NVIDIA GeForce RTX 3070 Ti Laptop GPU, 15.60", 2 kg
análise externo » Razer Blade 15 2022 RZ09-0421NGG3-R3G1
Acer Predator Helios 300 PH315-55-902L: NVIDIA GeForce RTX 3070 Ti Laptop GPU, 15.60", 2.6 kg
análise externo » Acer Predator Helios 300 PH315-55-902L
HP Envy 16-h0795ng: NVIDIA GeForce RTX 3060 Laptop GPU, 16.00", 2.7 kg
análise externo » HP Envy 16-h0795ng
Dell Precision 5000 5470: NVIDIA RTX A1000 Laptop GPU, 14.00", 1.6 kg
análise externo » Dell Precision 5000 5470
MSI Pulse GL76 12UGK-091UK: NVIDIA GeForce RTX 3070 Laptop GPU, 17.30", 2.6 kg
análise externo » MSI Pulse GL76 12UGK-091UK
Acer Predator Triton 300SE PT314-52s-99PC: NVIDIA GeForce RTX 3060 Laptop GPU, 14.00", 1.7 kg
análise externo » Acer Predator Triton 300SE PT314-52s-99PC
MSI Creator Pro Z17 A12UMST: NVIDIA RTX A5500 Laptop GPU, 17.00", 2.5 kg
análise externo » MSI Creator Pro Z17 A12UMST
MSI Creator Z16P B12UGST: NVIDIA GeForce RTX 3070 Ti Laptop GPU, 16.00", 2.4 kg
análise externo » MSI Creator Z16P B12UGST
Dell XPS 15 9520, i9-12900H 3050 Ti: NVIDIA GeForce RTX 3050 Ti Laptop GPU, 15.60", 1.9 kg
análise externo » Dell XPS 15 9520, i9-12900H 3050 Ti
Dell Precision 15 3571, 12900H RTX A1000: NVIDIA RTX A1000 Laptop GPU, 15.60", 1.8 kg
análise externo » Dell Precision 15 3571, 12900H RTX A1000
MSI Pulse GL66 12UEK: NVIDIA GeForce RTX 3060 Laptop GPU, 15.60", 2.3 kg
análise externo » MSI Pulse GL66 12UEK
MSI Stealth GS66 12UGS-025: NVIDIA GeForce RTX 3070 Ti Laptop GPU, 15.60", 2.1 kg
análise externo » MSI Stealth GS66 12UGS-025
Origin PC EVO17-S 2022, i9 3080 Ti: NVIDIA GeForce RTX 3080 Ti Laptop GPU, 17.30", 2.7 kg
análise externo » Origin PC EVO17-S 2022, i9 3080 Ti
MSI Creator Z17 A12UHST-052: NVIDIA GeForce RTX 3080 Ti Laptop GPU, 17.30", 2.5 kg
análise externo » MSI Creator Z17 A12UHST-052
Asus Zenbook Pro 14 Duo UX8402ZE-M3030W: NVIDIA GeForce RTX 3050 Ti Laptop GPU, 14.50", 1.8 kg
análise externo » Asus Zenbook Pro Duo 14 UX8402ZE-M3030W
Asus Zenbook Pro 16X UX7602ZM-ME023W: NVIDIA GeForce RTX 3060 Laptop GPU, 16.00", 2.4 kg
análise externo » Asus Zenbook Pro 16X UX7602ZM-ME023W
Asus ROG Strix G17 G733ZM-LL034W: NVIDIA GeForce RTX 3060 Laptop GPU, 17.30", 2.9 kg
análise externo » Asus ROG Strix G17 G733ZM-LL034W
Asus ZenBook 14X UX5401ZA-L7078W: Intel Iris Xe Graphics G7 96EUs, 14.00", 1.4 kg
análise externo » Asus ZenBook 14X UX5401ZA-L7078W
Asus ROG Strix Scar 15 G533ZW-AS94: NVIDIA GeForce RTX 3070 Ti Laptop GPU, 15.60", 2.4 kg
análise externo » Asus ROG Strix Scar 15 G533ZW-AS94
Acer Predator Triton 500SE PT516-52s-98LC: NVIDIA GeForce RTX 3080 Ti Laptop GPU, 16.00", 2.4 kg
análise externo » Acer Predator Triton 500SE PT516-52s-98LC
Razer Blade 17 Early 2022: NVIDIA GeForce RTX 3080 Ti Laptop GPU, 17.30", 2.8 kg
análise externo » Razer Blade 17 Early 2022
Asus ROG Zephyrus M16 GU603ZX-K8001W: NVIDIA GeForce RTX 3080 Ti Laptop GPU, 16.00", 1.9 kg
análise externo » Asus ROG Zephyrus M16 GU603ZX-K8001W
MSI Stealth GS66 12UHS-091: NVIDIA GeForce RTX 3080 Ti Laptop GPU, 15.60", 2.1 kg
análise externo » MSI Stealth GS66 12UHS-091
MSI Creator Z16P B12UHST-046: NVIDIA GeForce RTX 3080 Ti Laptop GPU, 16.00", 2.3 kg
análise externo » MSI Creator Z16P B12UHST-046
Asus ROG Zephyrus M16 GU603ZW-K8062W: NVIDIA GeForce RTX 3070 Ti Laptop GPU, 16.00", 1.9 kg
análise externo » Asus ROG Zephyrus M16 GU603ZW-K8062W
Asus ROG Strix G17 G733ZX-LL009W: NVIDIA GeForce RTX 3080 Ti Laptop GPU, 17.30", 2.9 kg
análise externo » Asus ROG Strix G17 G733ZX-LL009W
Asus ROG Strix Scar 15 G533zm: NVIDIA GeForce RTX 3060 Laptop GPU, 15.60", 2.3 kg
análise externo » Asus ROG Strix Scar 15 G533zm
Asus ROG Strix Scar 15 G533ZW-LN106WS: NVIDIA GeForce RTX 3070 Ti Laptop GPU, 15.60", 2.3 kg
análise externo » Asus ROG Strix Scar 15 G533ZW-LN106WS
Asus ROG Strix Scar 15 G533ZW-LN017W: NVIDIA GeForce RTX 3070 Ti Laptop GPU, 15.60", 2.4 kg
análise externo » Asus ROG Strix Scar 15 G533ZW-LN017W
Asus ROG Strix Scar 15 G533ZX-XS96: NVIDIA GeForce RTX 3080 Ti Laptop GPU, 15.60", 2.4 kg
análise externo » Asus ROG Strix Scar 15 G533ZX-XS96
Asus ROG Strix G17 G733ZW-LL103W: NVIDIA GeForce RTX 3070 Ti Laptop GPU, 17.30", 2.9 kg
análise externo » Asus ROG Strix G17 G733ZW-LL103W
MSI Stealth GS77 12UHS-063: NVIDIA GeForce RTX 3080 Ti Laptop GPU, 17.30", 2.8 kg
análise externo » MSI Stealth GS77 12UHS-063
Asus ROG Flow Z13 GZ301ZE: NVIDIA GeForce RTX 3050 Ti Laptop GPU, 13.40", 1.2 kg
análise externo » Asus ROG Flow Z13 GZ301ZE
Acemagic M2A: NVIDIA GeForce RTX 3080 Laptop GPU, 2.1 kg
» Aniversario de Acemagic 2026: gran campaña de descuentos en mini PC, portátiles y sistemas NAS
Acemagic Tank03: NVIDIA GeForce RTX 3080 Laptop GPU, 2.2 kg
» Aniversario de Acemagic 2026: gran campaña de descuentos en mini PC, portátiles y sistemas NAS
Beelink GTI12 Ultra EX Docking Station: NVIDIA GeForce RTX 3070, 1.3 kg
» La base para mini PC eGPU de Beelink con ranura PCIe de tamaño completo pasa a ser de código abierto
MSI Vector GP66 12UGS: NVIDIA GeForce RTX 3070 Ti Laptop GPU, 15.60", 2.3 kg
» MSI GP66 Leopard vs. Vector GP66: ¿Cuál es la diferencia?
Schenker Uniwill Technology GM7AG8P: NVIDIA GeForce RTX 3080 Ti Laptop GPU, 17.30", 2.3 kg
» 27 PC AMD Ryzen 9 5900HX frente al Core i9-12900H: Intel sale ganando, pero hay una trampa