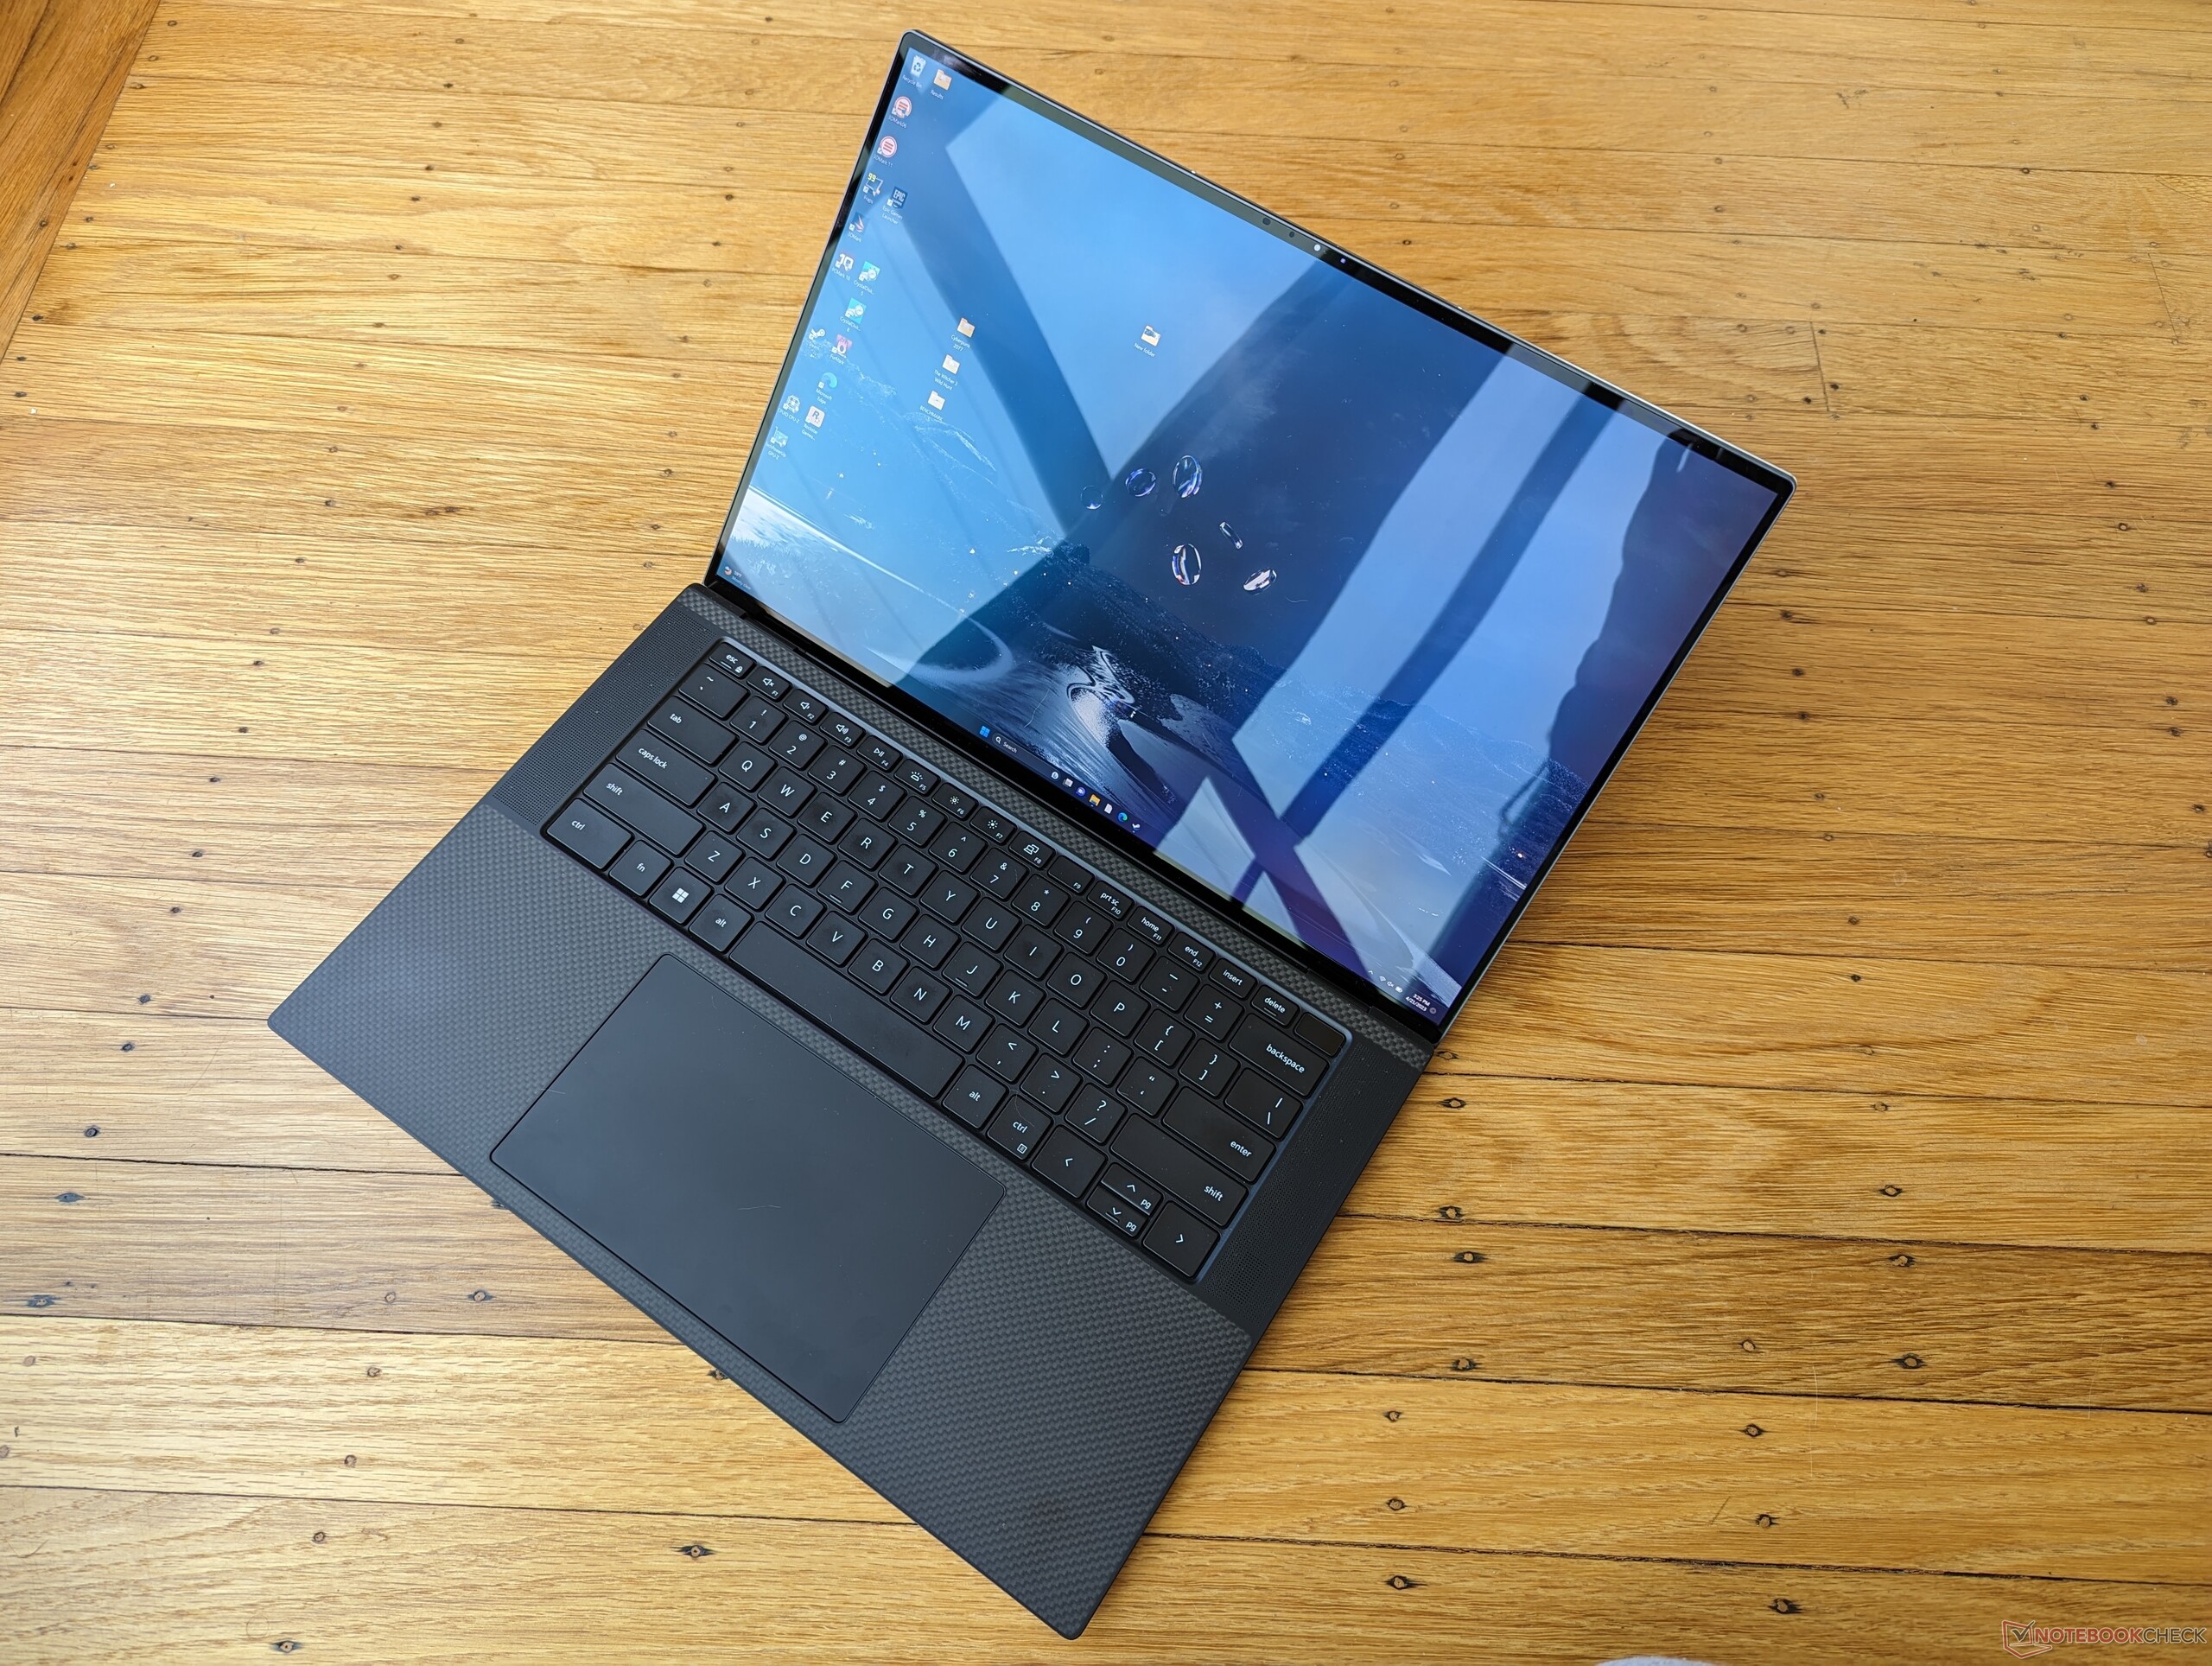
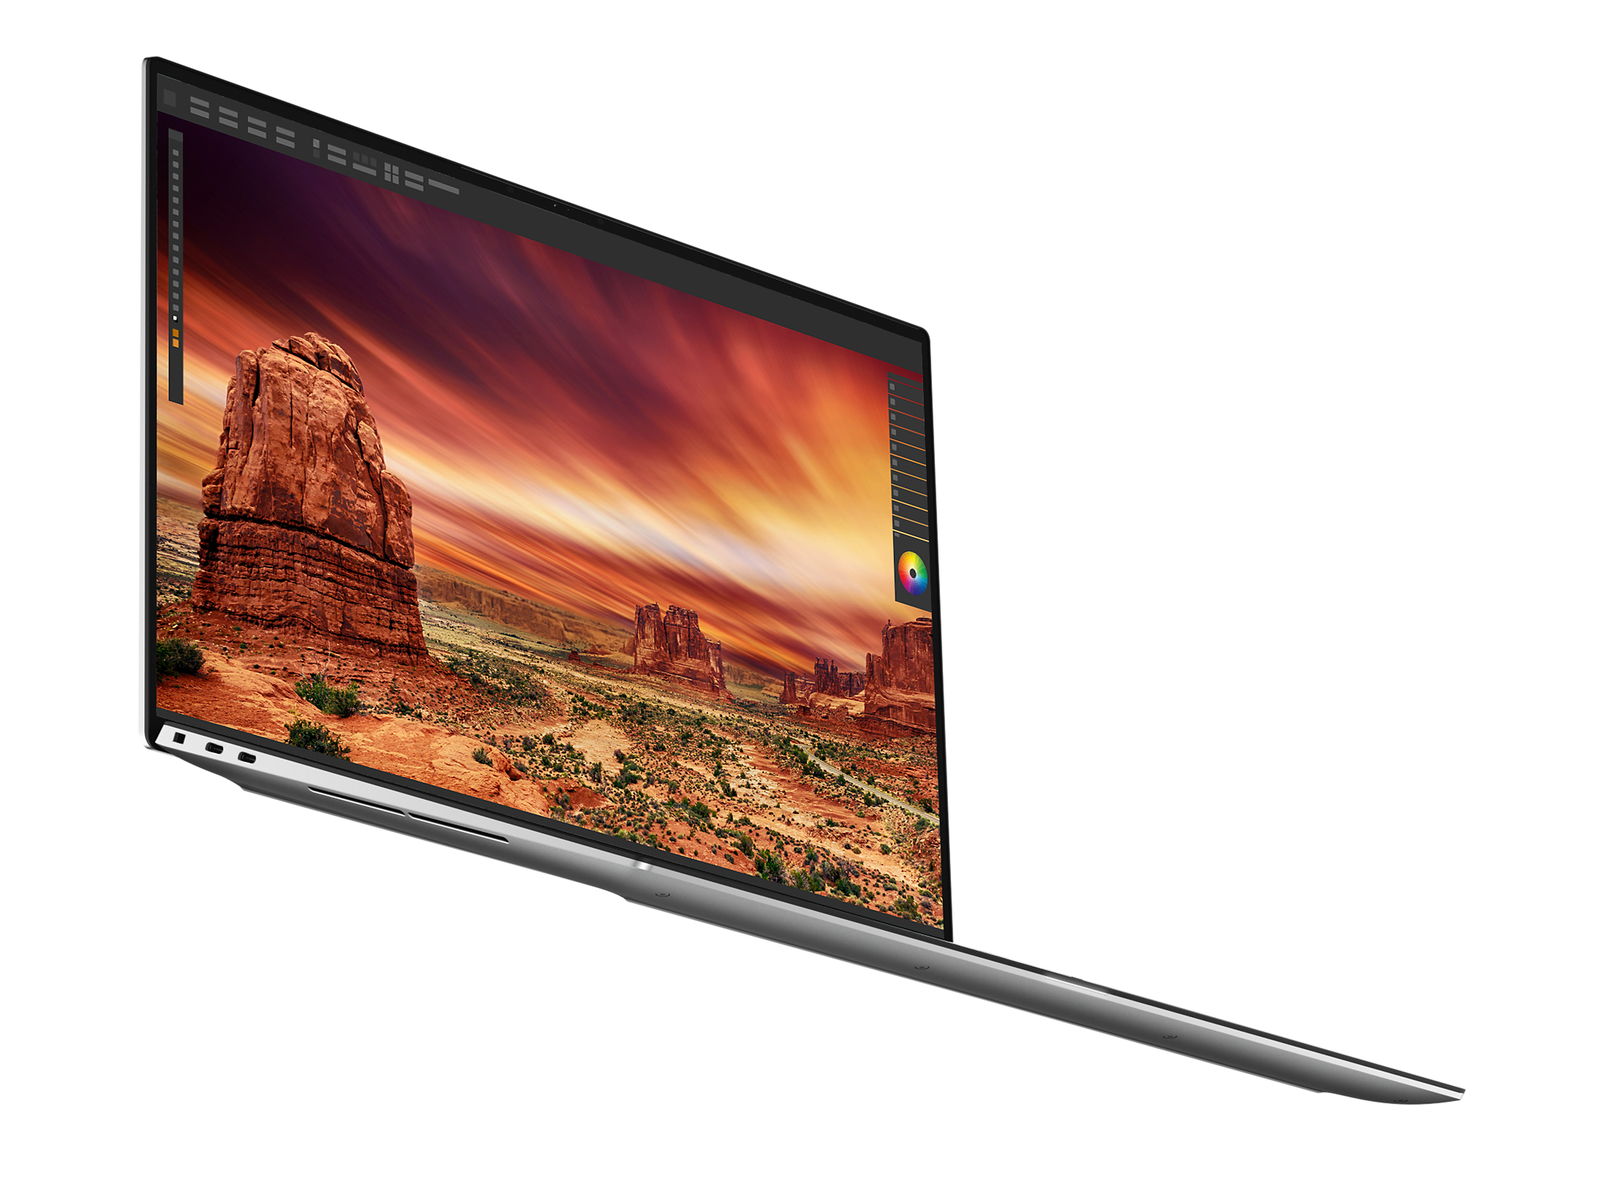
Análisis del portátil Dell XPS 15 9530 RTX 4070: Impresionante y decepcionante a la vez

El XPS 15 9530 es una actualización interna del XPS 15 9520 de 2022. Las CPUs Alder Lake-H de 12ª generación y las GPUs Nvidia Ampere del modelo del año pasado se han actualizado a las opciones Raptor Lake-H y Ada Lovelace de 13ª generación, respectivamente. Por lo demás, las opciones de chasis y pantalla siguen siendo idénticas año tras año, por lo que recomendamos consultar nuestros análisis del XPS 15 9520, 9510y 9500 para obtener más información sobre las características físicas del modelo.
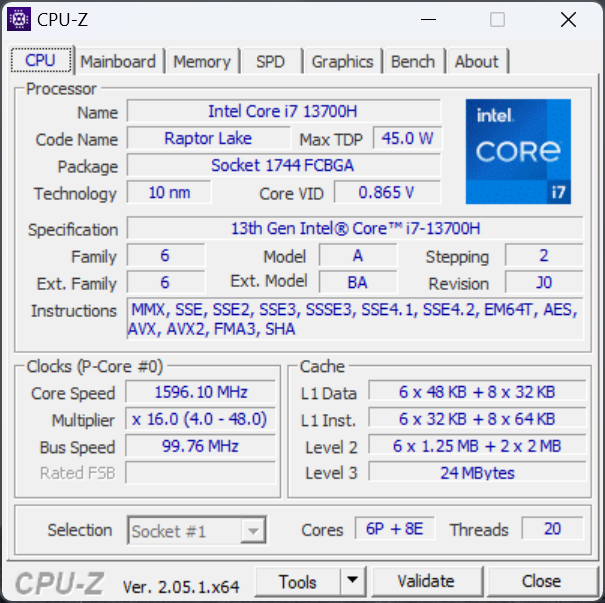
Nuestra unidad de pruebas específica es una configuración de gama alta con Core i7-13700H, RTX 4070, 32 GB RAM, 1 TB SSD y pantalla táctil OLED brillante de 3,5K por unos 2800 $. Hay otras versiones disponibles con el Core i9-13900H más rápido, la RTX 4060 más lenta o un panel FHD+ mate de menor resolución. Hay que tener en cuenta que este es uno de los pocos portátiles con una RTX 4070 de 50 W GeForce en comparación con los 100 W o más de la mayoría de los demás portátiles con la misma GPU.
La competencia incluye otros portátiles multimedia de 15 pulgadas de gama alta como elAsus Zenbook Pro 15, MSI Summit E15,Gigabyte Aero 15o el Razer Blade 15 Studio.
Más opiniones sobre Dell:
Posibles contendientes en la comparación
Valoración | Fecha | Modelo | Peso | Altura | Tamaño | Resolución | Precio |
|---|---|---|---|---|---|---|---|
| 90.3 % v7 (old) | 04/2023 | Dell XPS 15 9530 RTX 4070 i7-13700H, GeForce RTX 4070 Laptop GPU | 1.9 kg | 18 mm | 15.60" | 3456x2160 | |
| 89.5 % v7 (old) | 05/2022 | Dell XPS 15 9520 RTX 3050 Ti i7-12700H, GeForce RTX 3050 Ti Laptop GPU | 1.9 kg | 18 mm | 15.60" | 3456x2160 | |
| 90.1 % v7 (old) | 06/2020 | Dell XPS 15 9500 Core i7 4K UHD i7-10875H, GeForce GTX 1650 Ti Mobile | 2 kg | 18 mm | 15.60" | 3840x2400 | |
| 87.7 % v7 (old) | 05/2022 | Asus Zenbook Pro 15 OLED UM535Q R9 5900HX, GeForce RTX 3050 Ti Laptop GPU | 1.9 kg | 18 mm | 15.60" | 1920x1080 | |
| 85.4 % v7 (old) | 12/2022 | MSI Prestige 15 A12UD-093 i7-1280P, GeForce RTX 3050 Ti Laptop GPU | 1.8 kg | 20.1 mm | 15.60" | 3840x2160 | |
| 85.6 % v7 (old) | 08/2021 | Gigabyte Aero 15 OLED XD i7-11800H, GeForce RTX 3070 Laptop GPU | 2.2 kg | 20 mm | 15.60" | 3840x2160 |
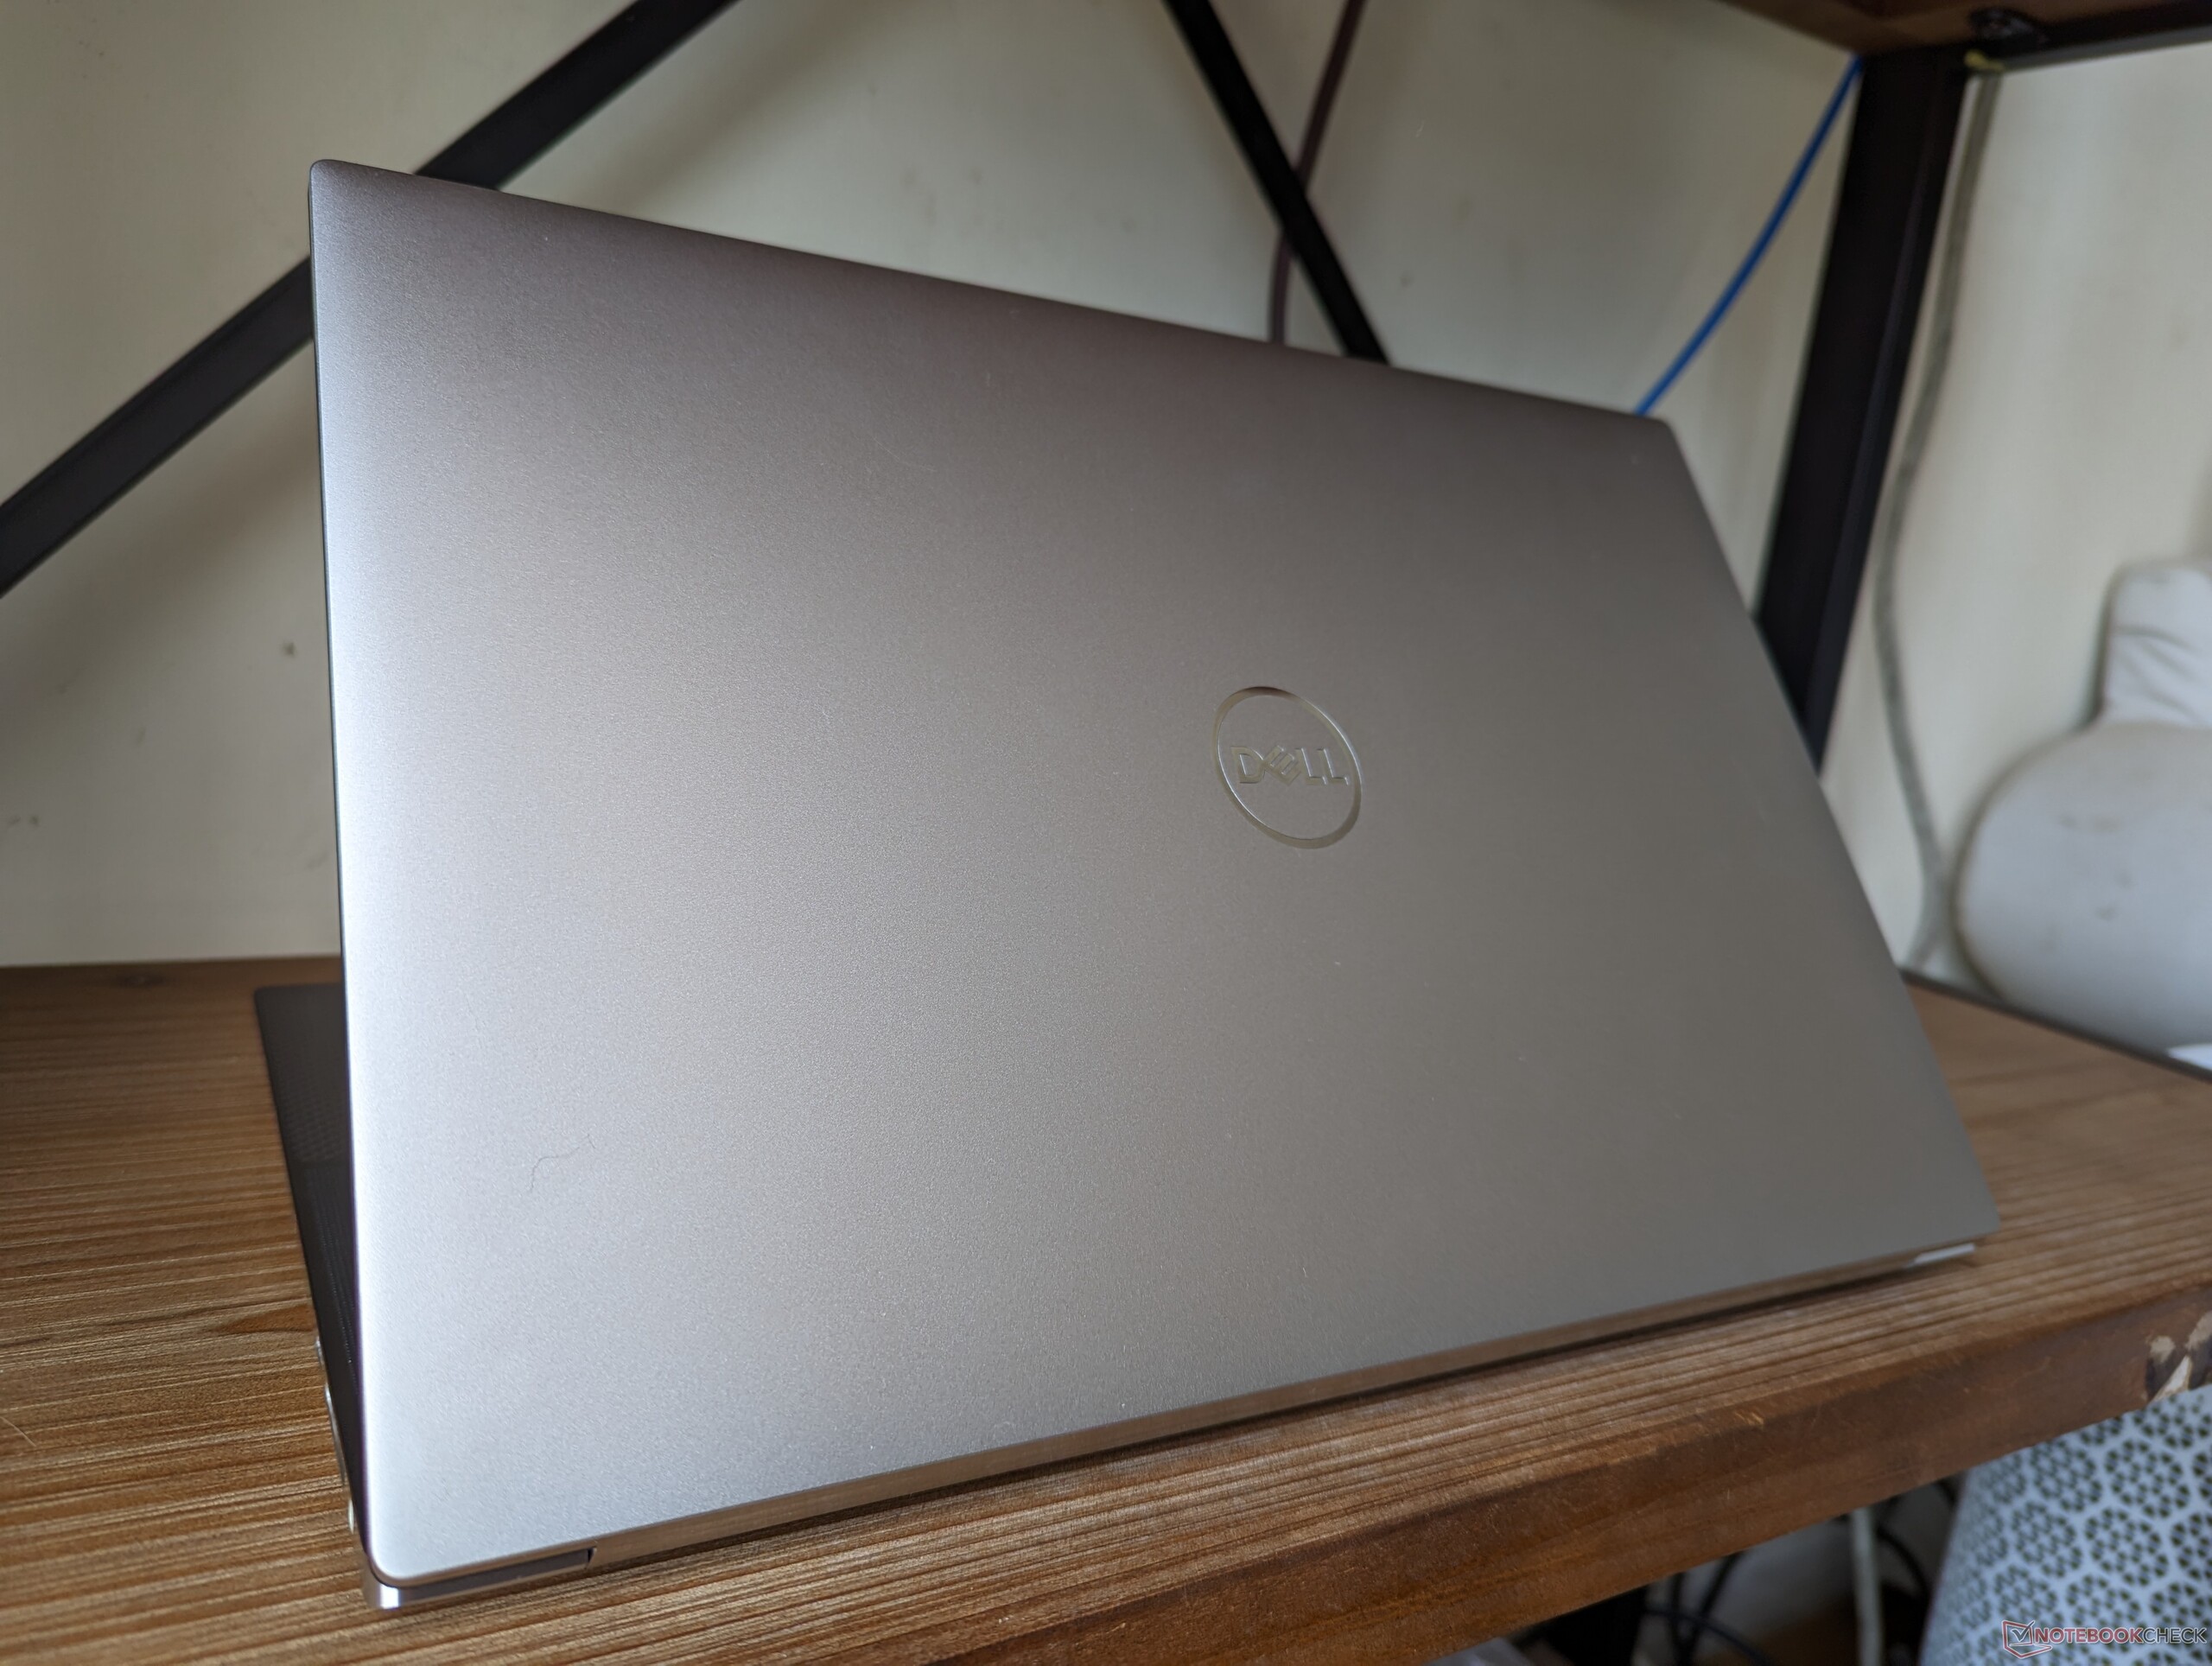
Carcasa - Sin grandes cambios desde el XPS 15 9500
Lector de tarjetas SD
| SD Card Reader | |
| average JPG Copy Test (av. of 3 runs) | |
| Dell XPS 15 9500 Core i7 4K UHD (Toshiba Exceria Pro SDXC 64 GB UHS-II) | |
| Gigabyte Aero 15 OLED XD (AV PRO microSD 128 GB V60) | |
| Dell XPS 15 9520 RTX 3050 Ti (Toshiba Exceria Pro SDXC 64 GB UHS-II) | |
| Dell XPS 15 9530 RTX 4070 (Toshiba Exceria Pro SDXC 64 GB UHS-II) | |
| Asus Zenbook Pro 15 OLED UM535Q (Toshiba Exceria Pro SDXC 64 GB UHS-II) | |
| MSI Prestige 15 A12UD-093 (AV Pro SD microSD 128 GB V60) | |
| maximum AS SSD Seq Read Test (1GB) | |
| Dell XPS 15 9500 Core i7 4K UHD (Toshiba Exceria Pro SDXC 64 GB UHS-II) | |
| Gigabyte Aero 15 OLED XD (AV PRO microSD 128 GB V60) | |
| Dell XPS 15 9530 RTX 4070 (Toshiba Exceria Pro SDXC 64 GB UHS-II) | |
| Dell XPS 15 9520 RTX 3050 Ti (Toshiba Exceria Pro SDXC 64 GB UHS-II) | |
| MSI Prestige 15 A12UD-093 (AV Pro SD microSD 128 GB V60) | |
| Asus Zenbook Pro 15 OLED UM535Q (Toshiba Exceria Pro SDXC 64 GB UHS-II) | |
Comunicación
Un Intel AX211 viene de serie para Wi-Fi 6E y soporte Bluetooth 5.2. Pudimos conectarnos a nuestra red Asus AXE11000 Wi-Fi 6 sin problemas, pero el portátil extrañamente no reconocía ni se conectaba a nuestra red Wi-Fi 6E de 6 GHz. Otros dispositivos con Wi-Fi 6E como el Pixel 7 Pro podrían reconocer y conectarse a nuestra red de 6 GHz sin problemas.
| Networking | |
| iperf3 transmit AX12 | |
| Gigabyte Aero 15 OLED XD | |
| Dell XPS 15 9500 Core i7 4K UHD | |
| Asus Zenbook Pro 15 OLED UM535Q | |
| iperf3 receive AX12 | |
| Dell XPS 15 9500 Core i7 4K UHD | |
| Gigabyte Aero 15 OLED XD | |
| Asus Zenbook Pro 15 OLED UM535Q | |
| iperf3 transmit AXE11000 | |
| Dell XPS 15 9530 RTX 4070 | |
| Dell XPS 15 9520 RTX 3050 Ti | |
| MSI Prestige 15 A12UD-093 | |
| iperf3 receive AXE11000 | |
| Dell XPS 15 9520 RTX 3050 Ti | |
| Dell XPS 15 9530 RTX 4070 | |
| MSI Prestige 15 A12UD-093 | |
| iperf3 transmit AXE11000 6GHz | |
| MSI Prestige 15 A12UD-093 | |
| iperf3 receive AXE11000 6GHz | |
| MSI Prestige 15 A12UD-093 | |
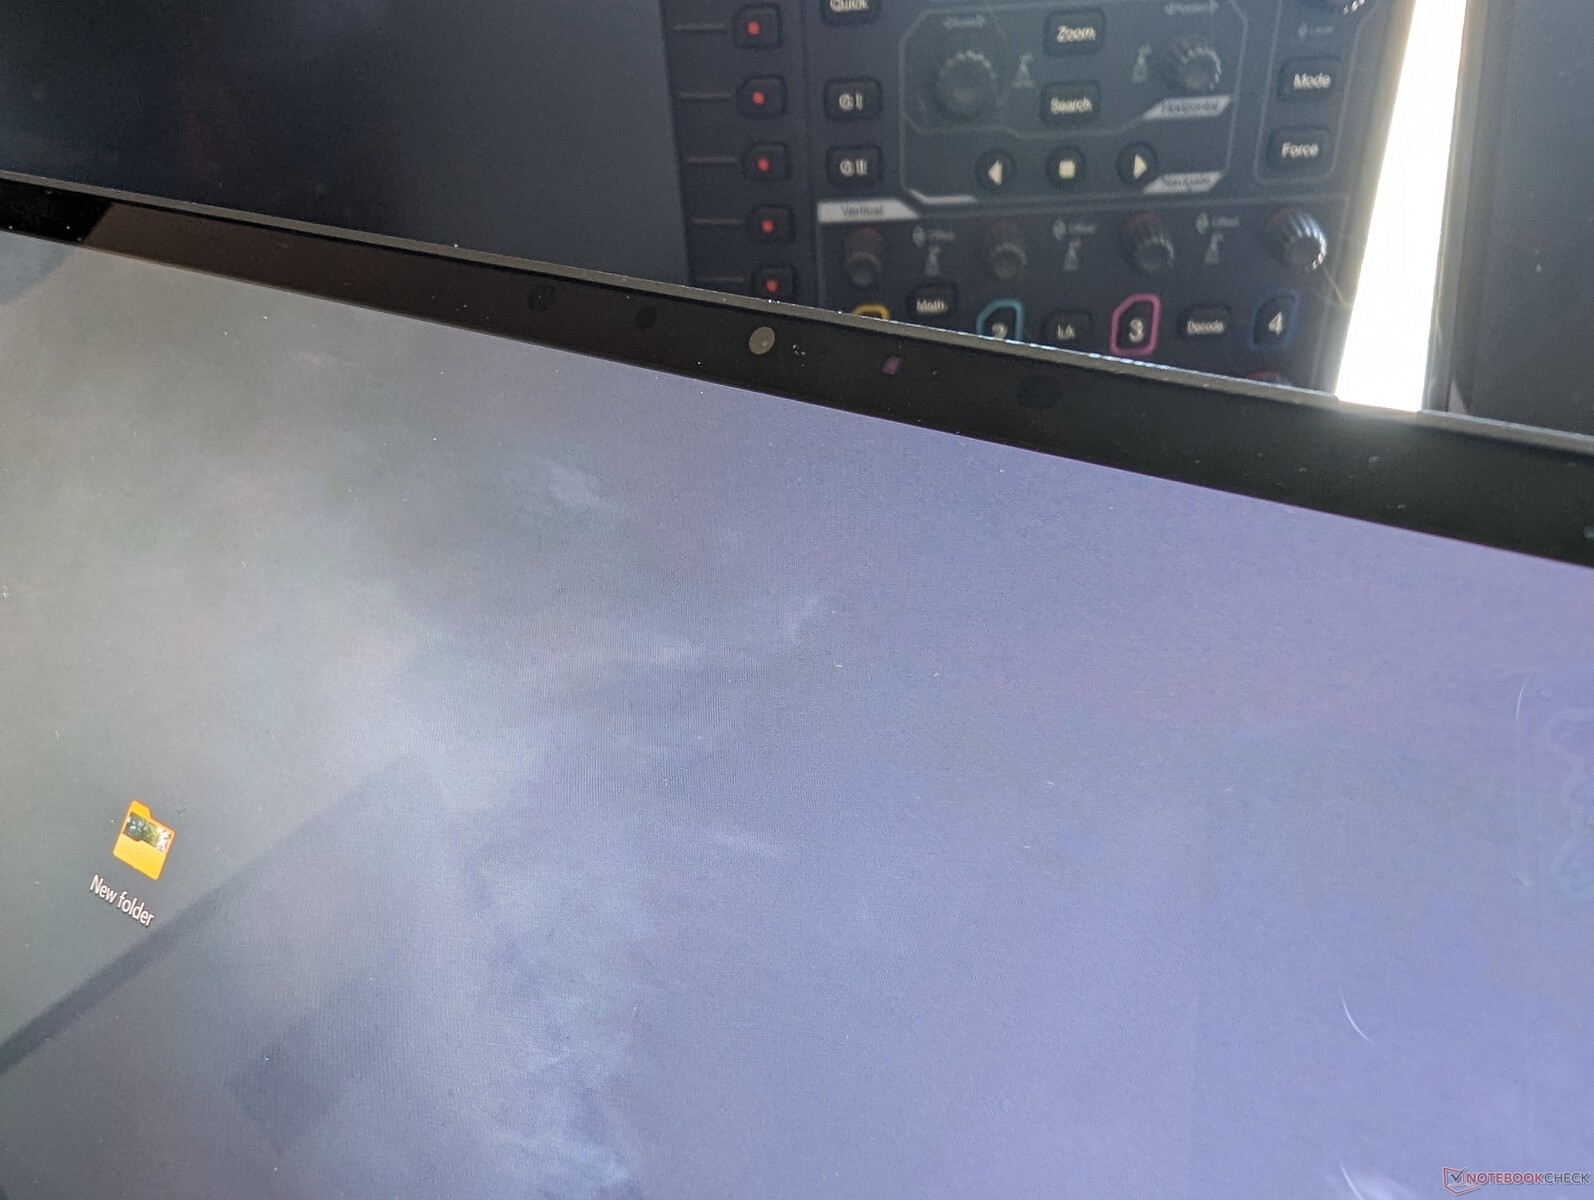
Webcam - La resolución de 1 MP empieza a ser vergonzosa
El último XPS 15 *todavía* cuenta con una webcam de baja resolución de 1 MP/720p sin obturador de privacidad a pesar de su precio de venta de más de 2.000 dólares. Modelos de la competencia como el HP Spectre x360 16 o la serie Razer Blade ya han pasado a sensores de 2 MP o incluso 5 MP. Ni que decir tiene que la calidad de imagen es muy borrosa en una pantalla OLED por lo demás preciosa. Al menos admite infrarrojos.
Dell dice que la baja resolución de la webcam es consecuencia de tener uno de los biseles más estrechos de un portátil. Una webcam de mayor resolución supuestamente engrosaría el bisel.


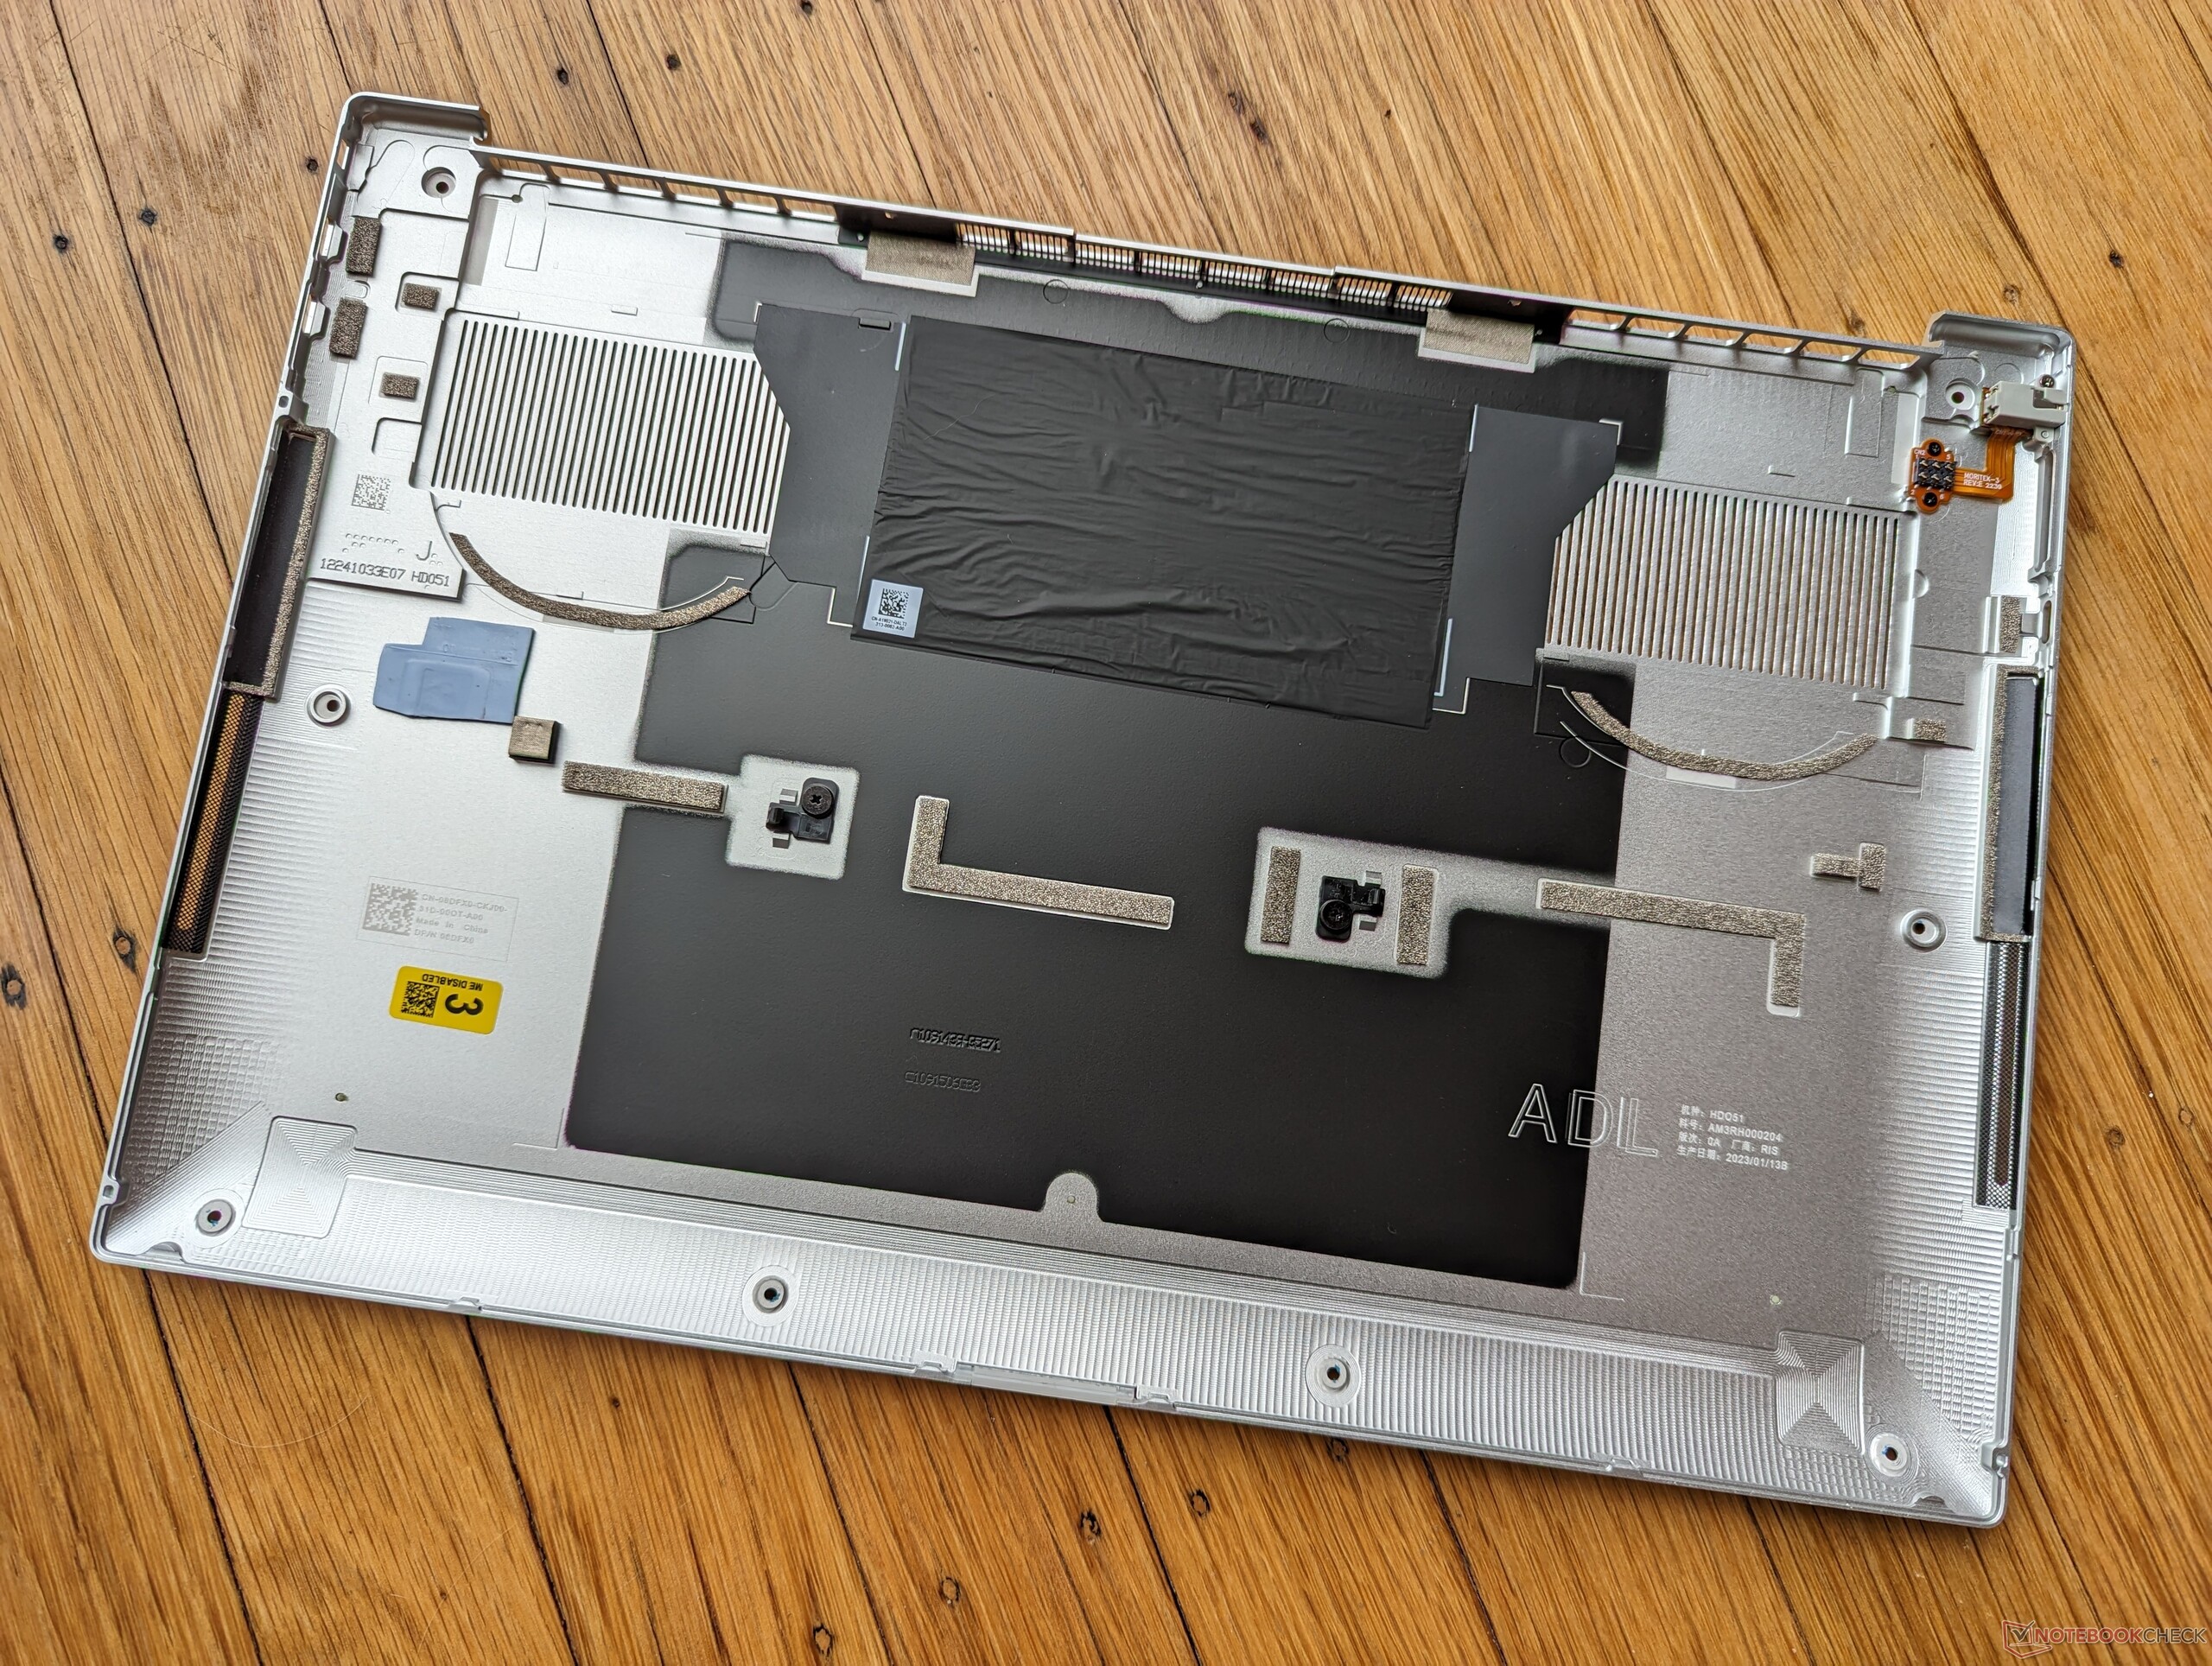
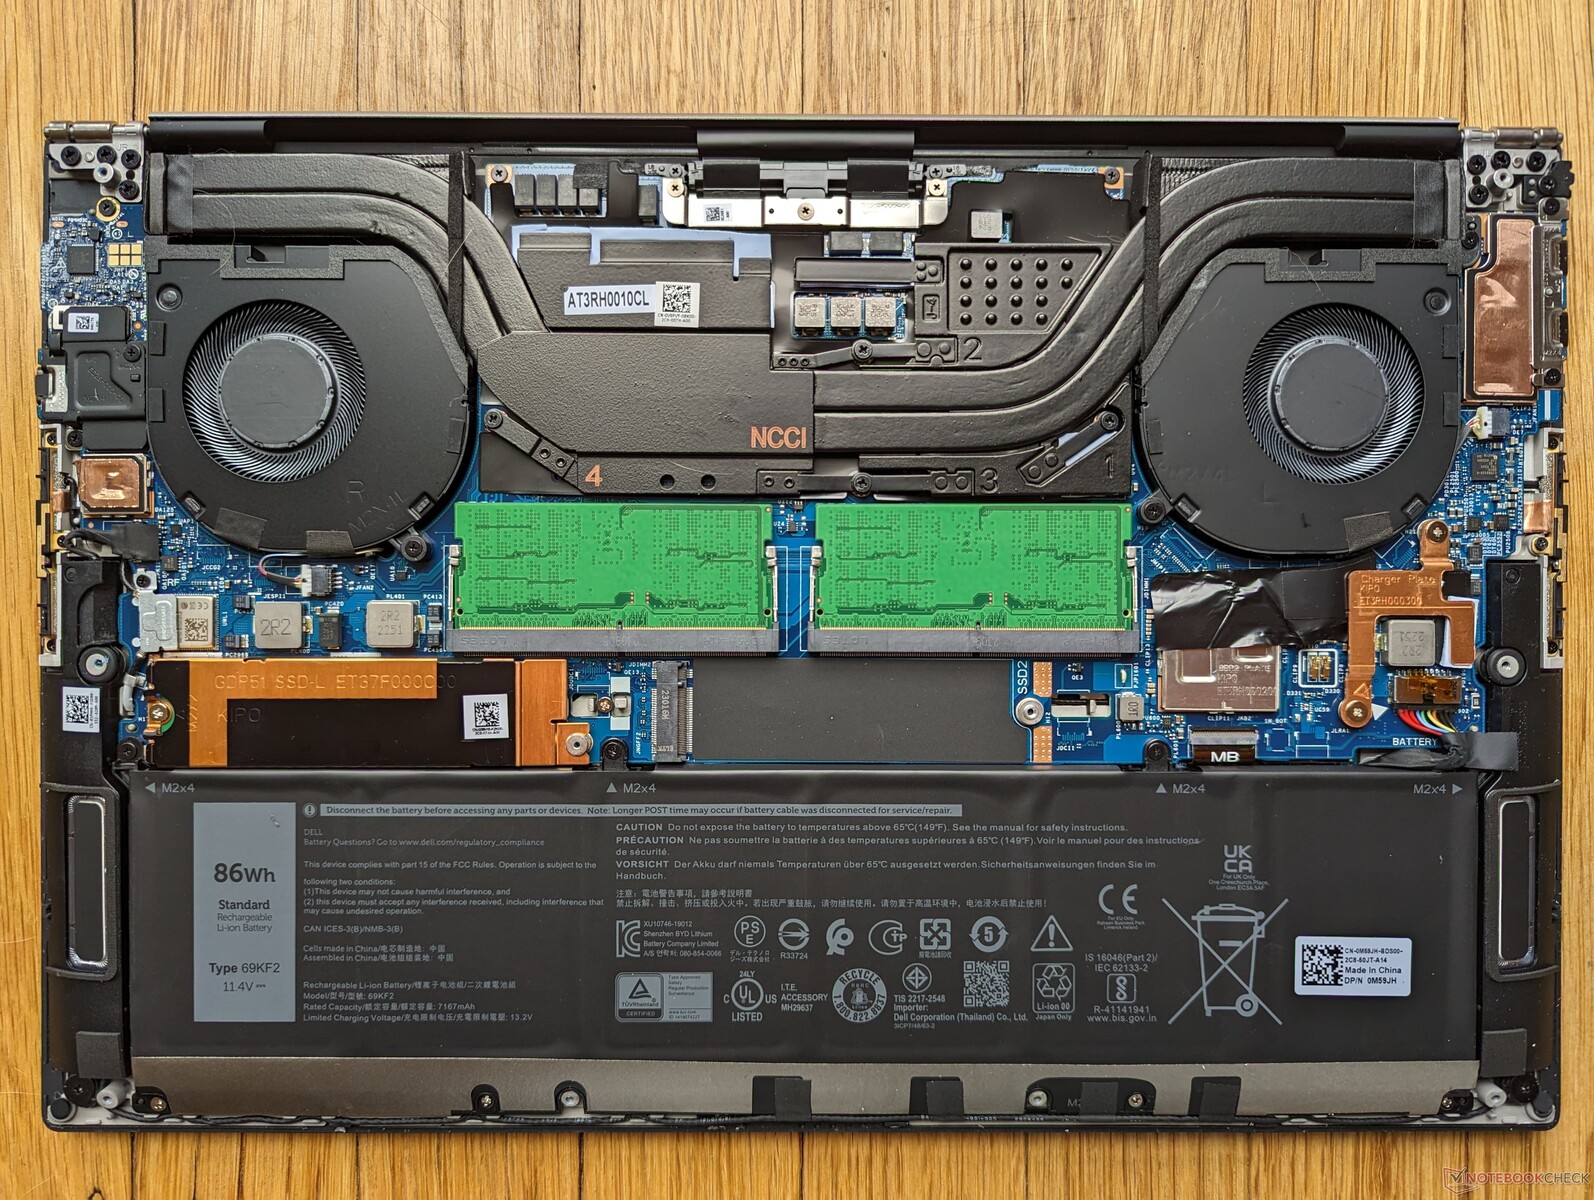
Mantenimiento
Accesorios y garantía
Dell sigue incluyendo un práctico adaptador USB-C a USB-A y HDMI dentro de cada caja, lo que agradecemos. Se aplica la habitual garantía limitada de un año del fabricante.
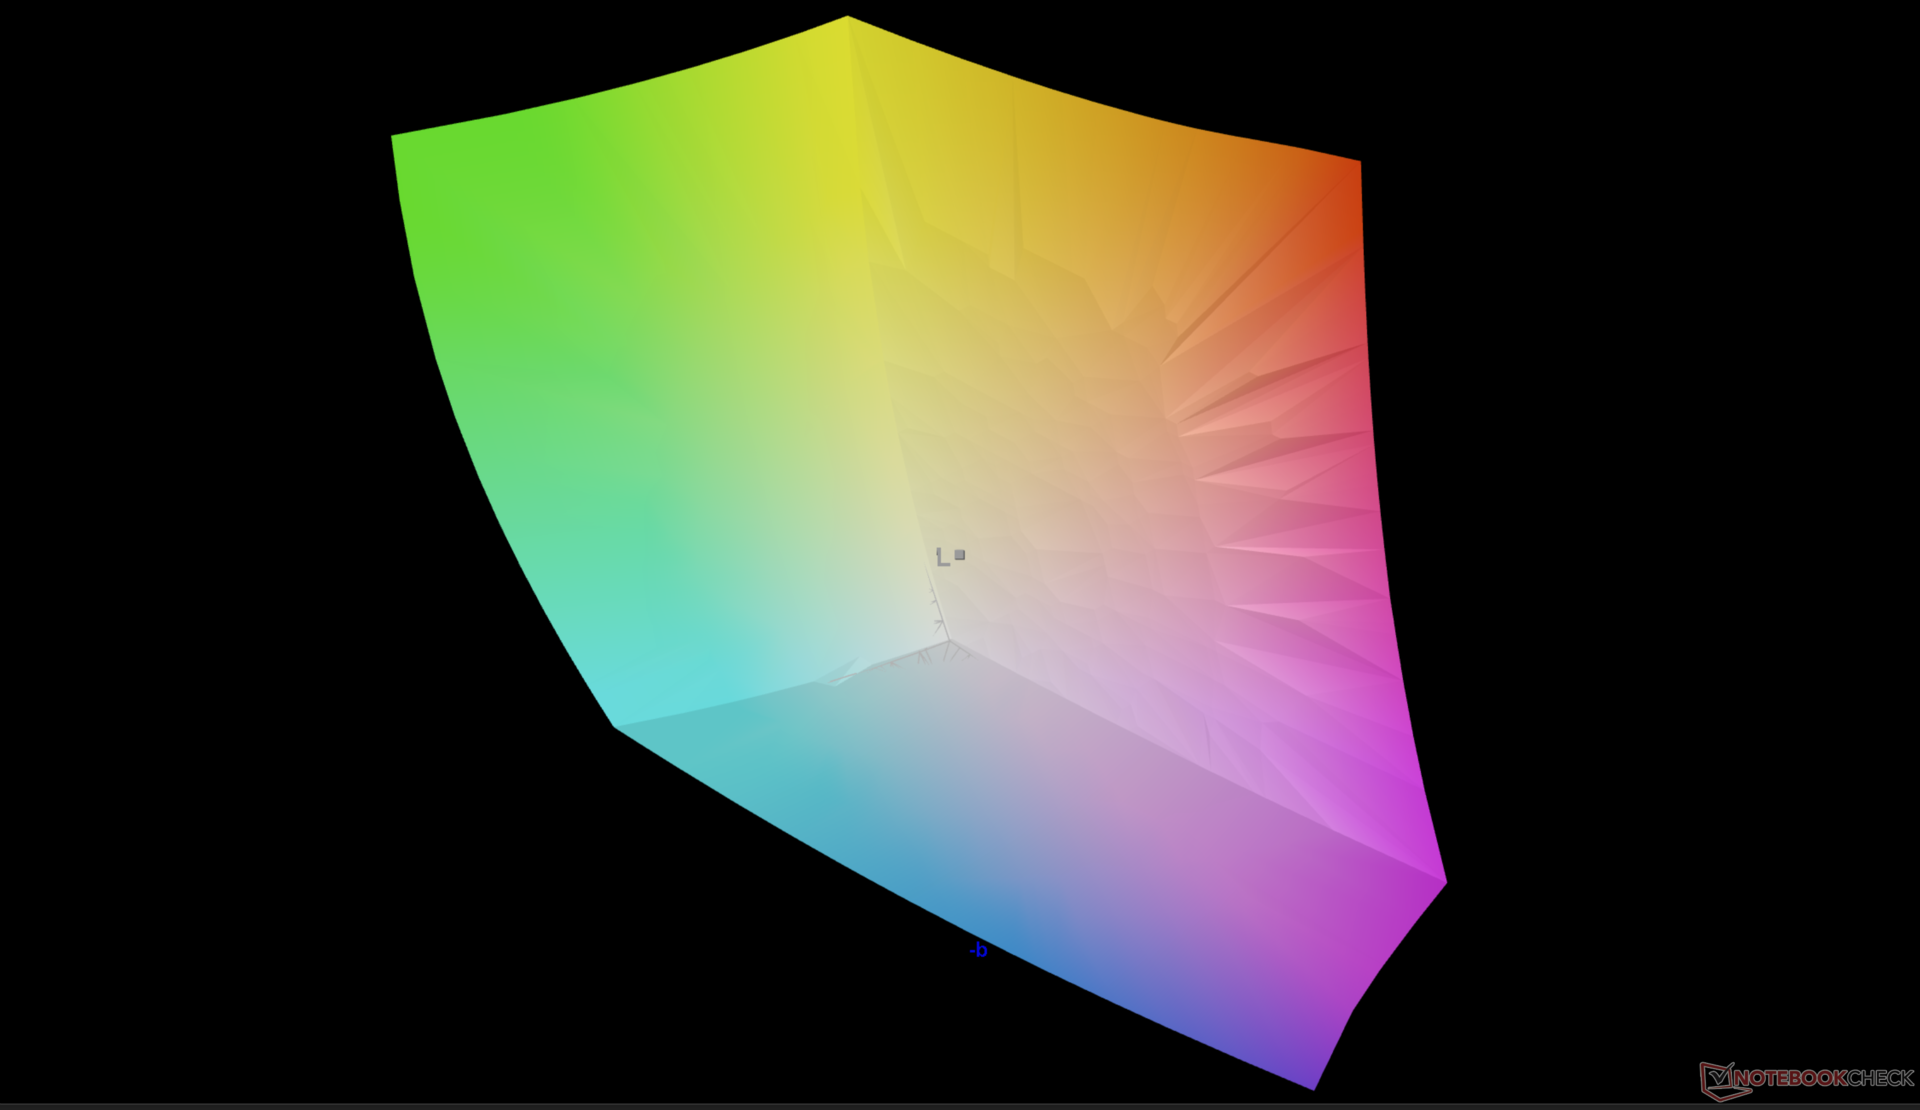
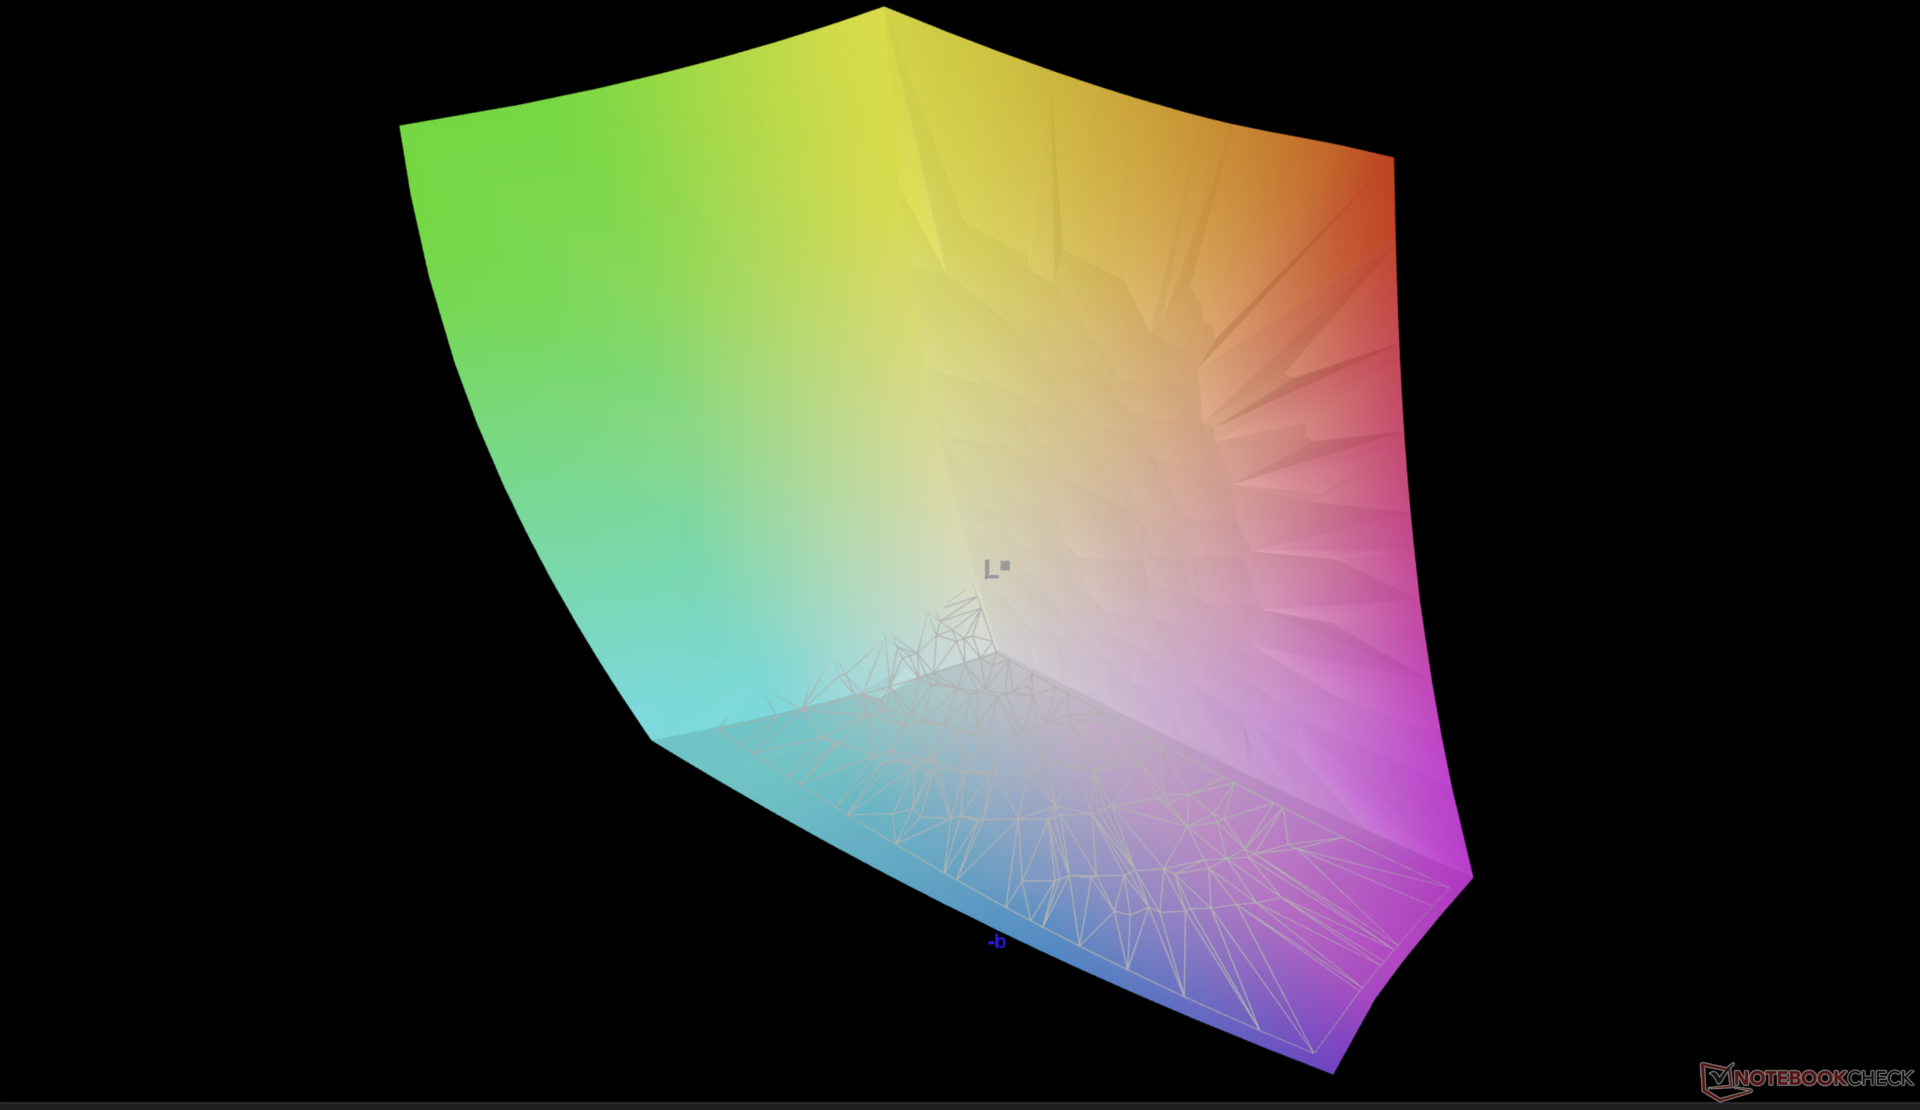
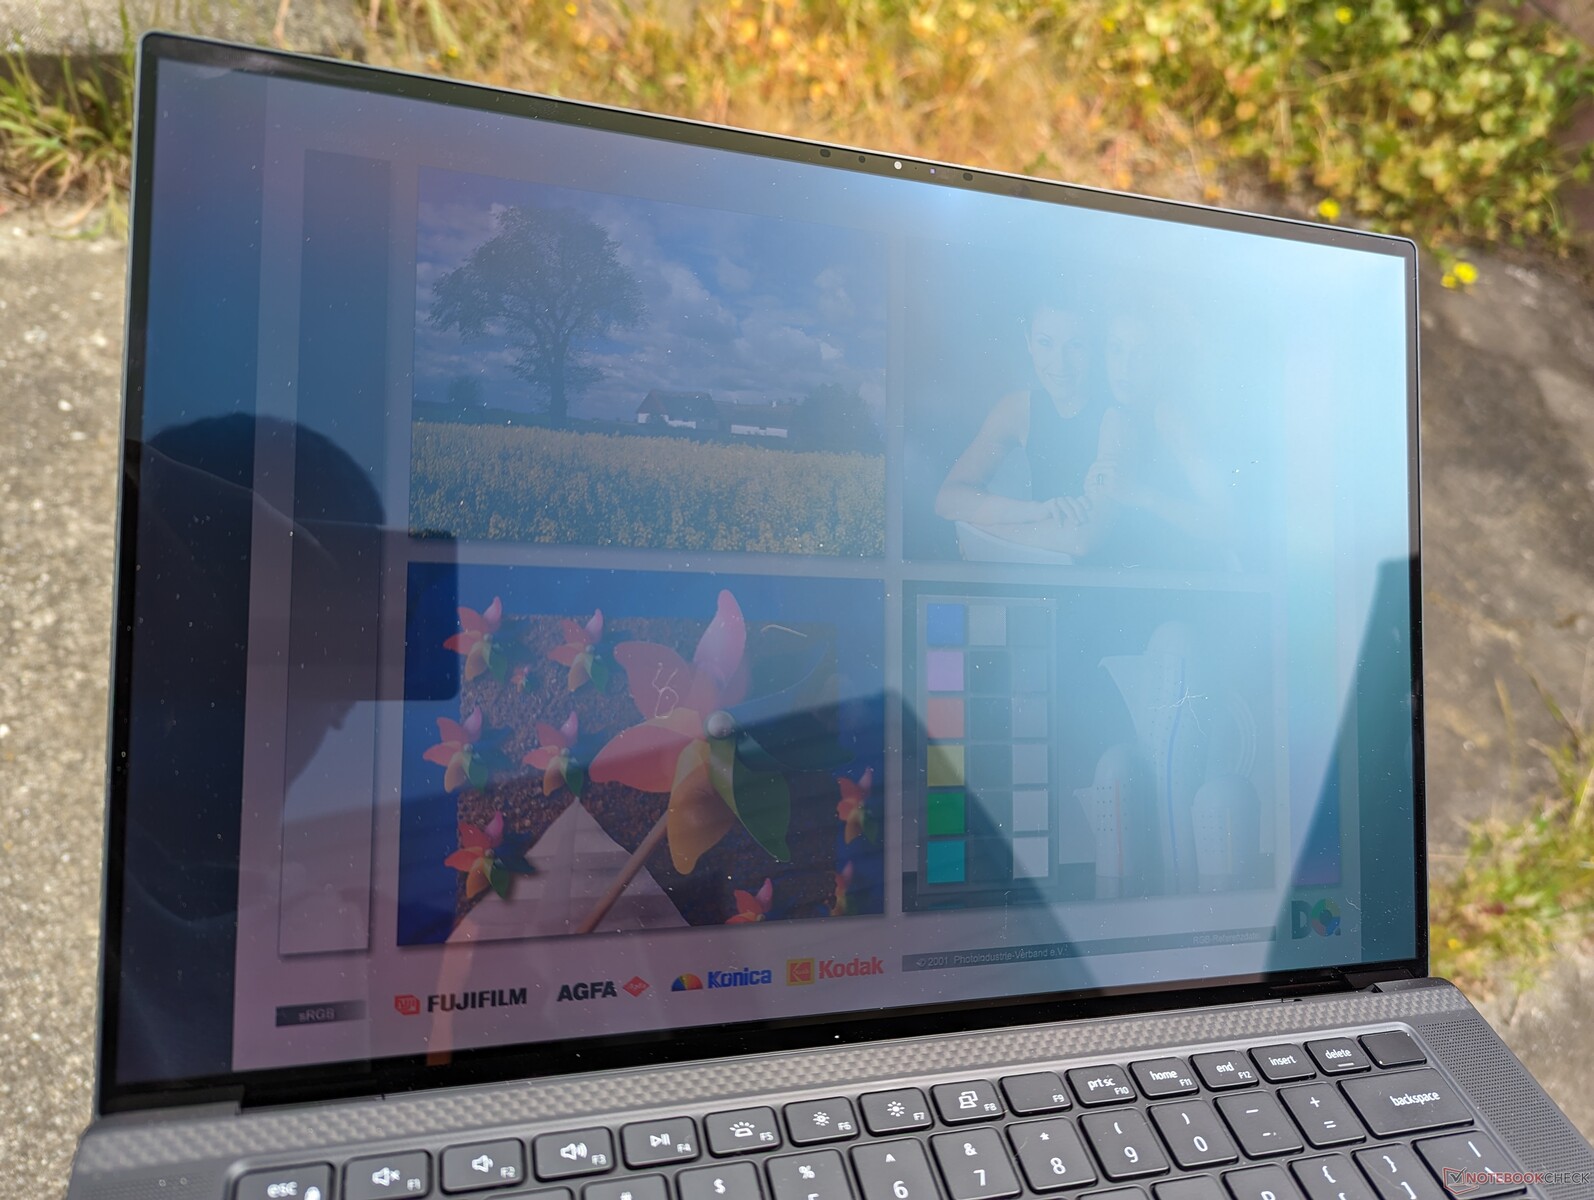
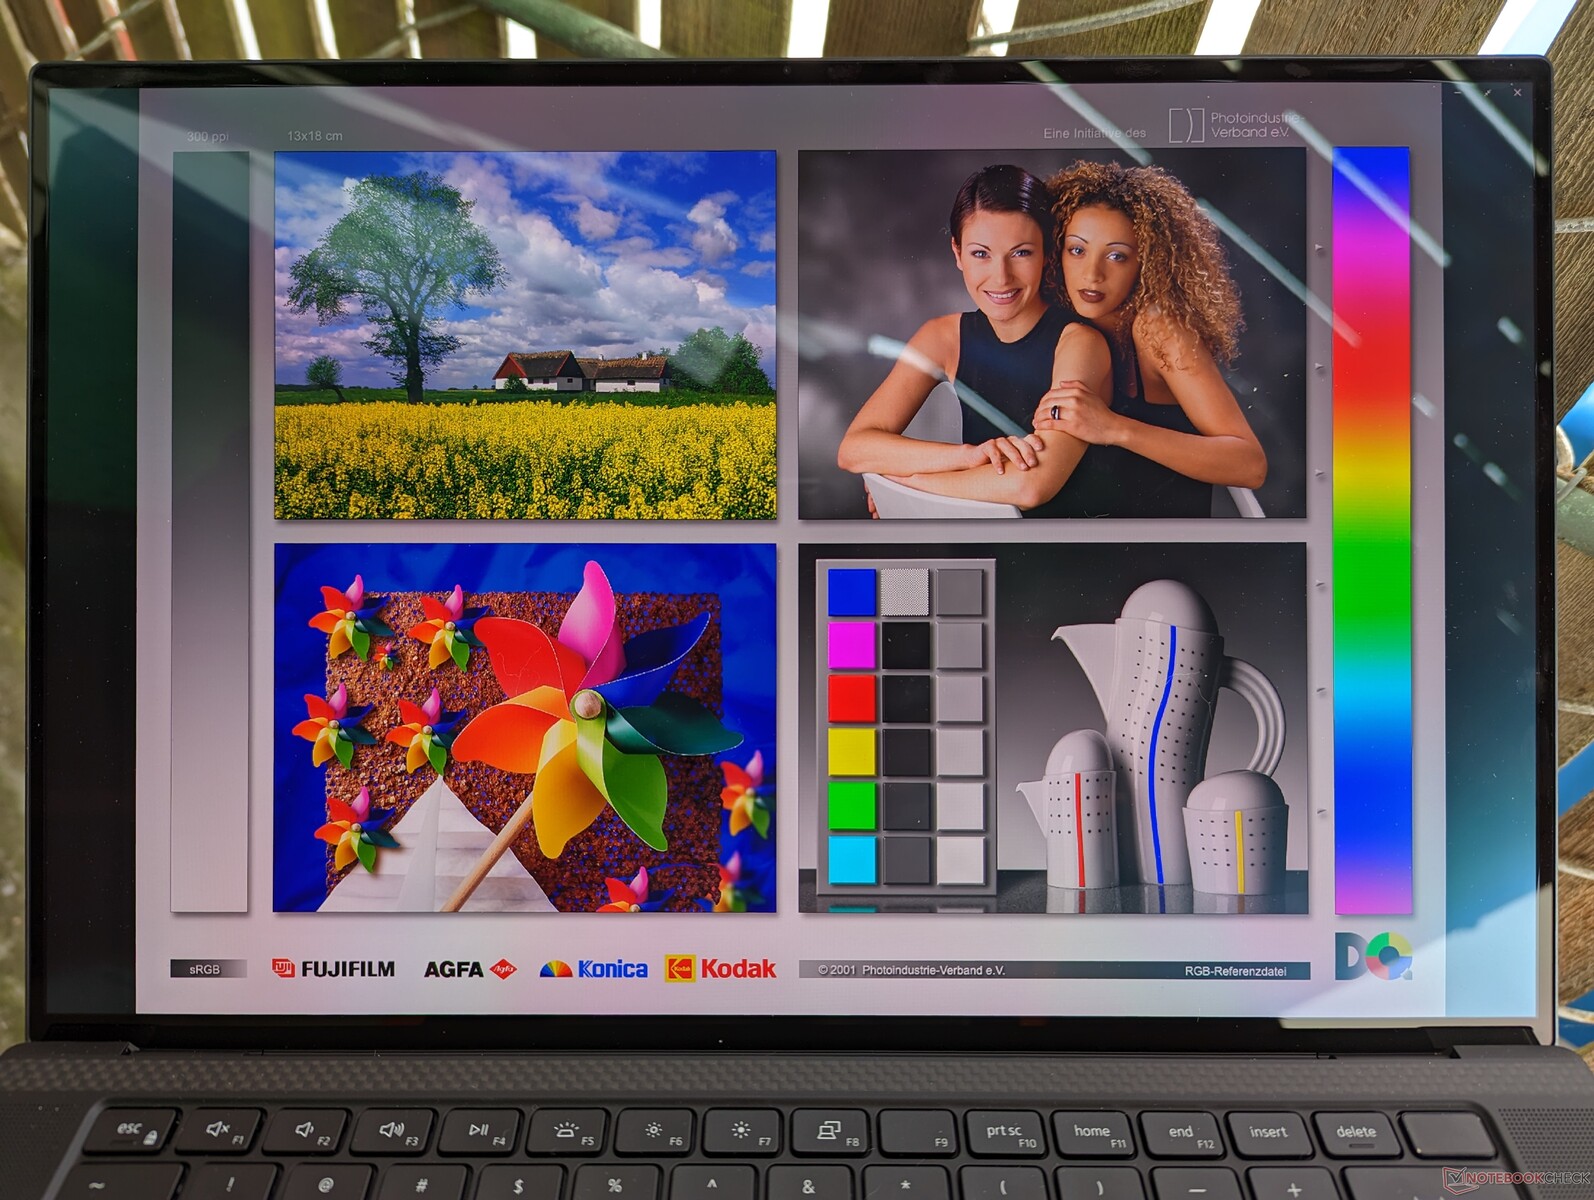
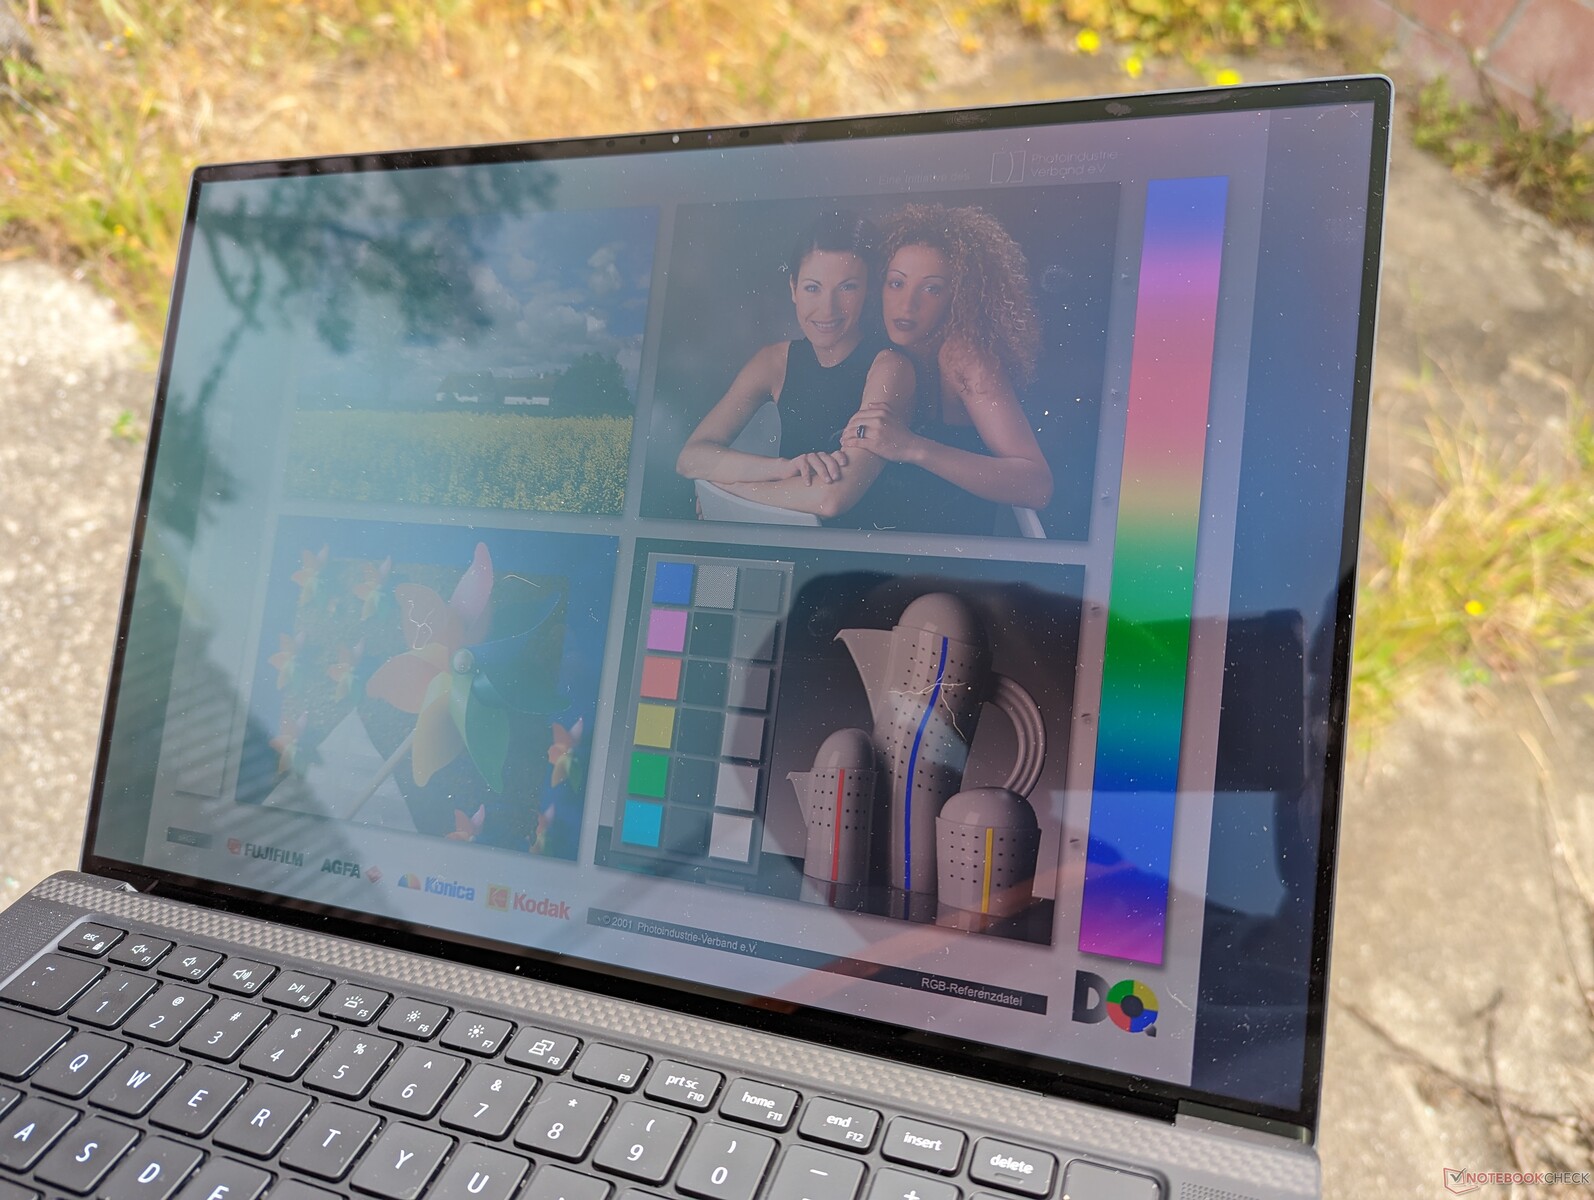
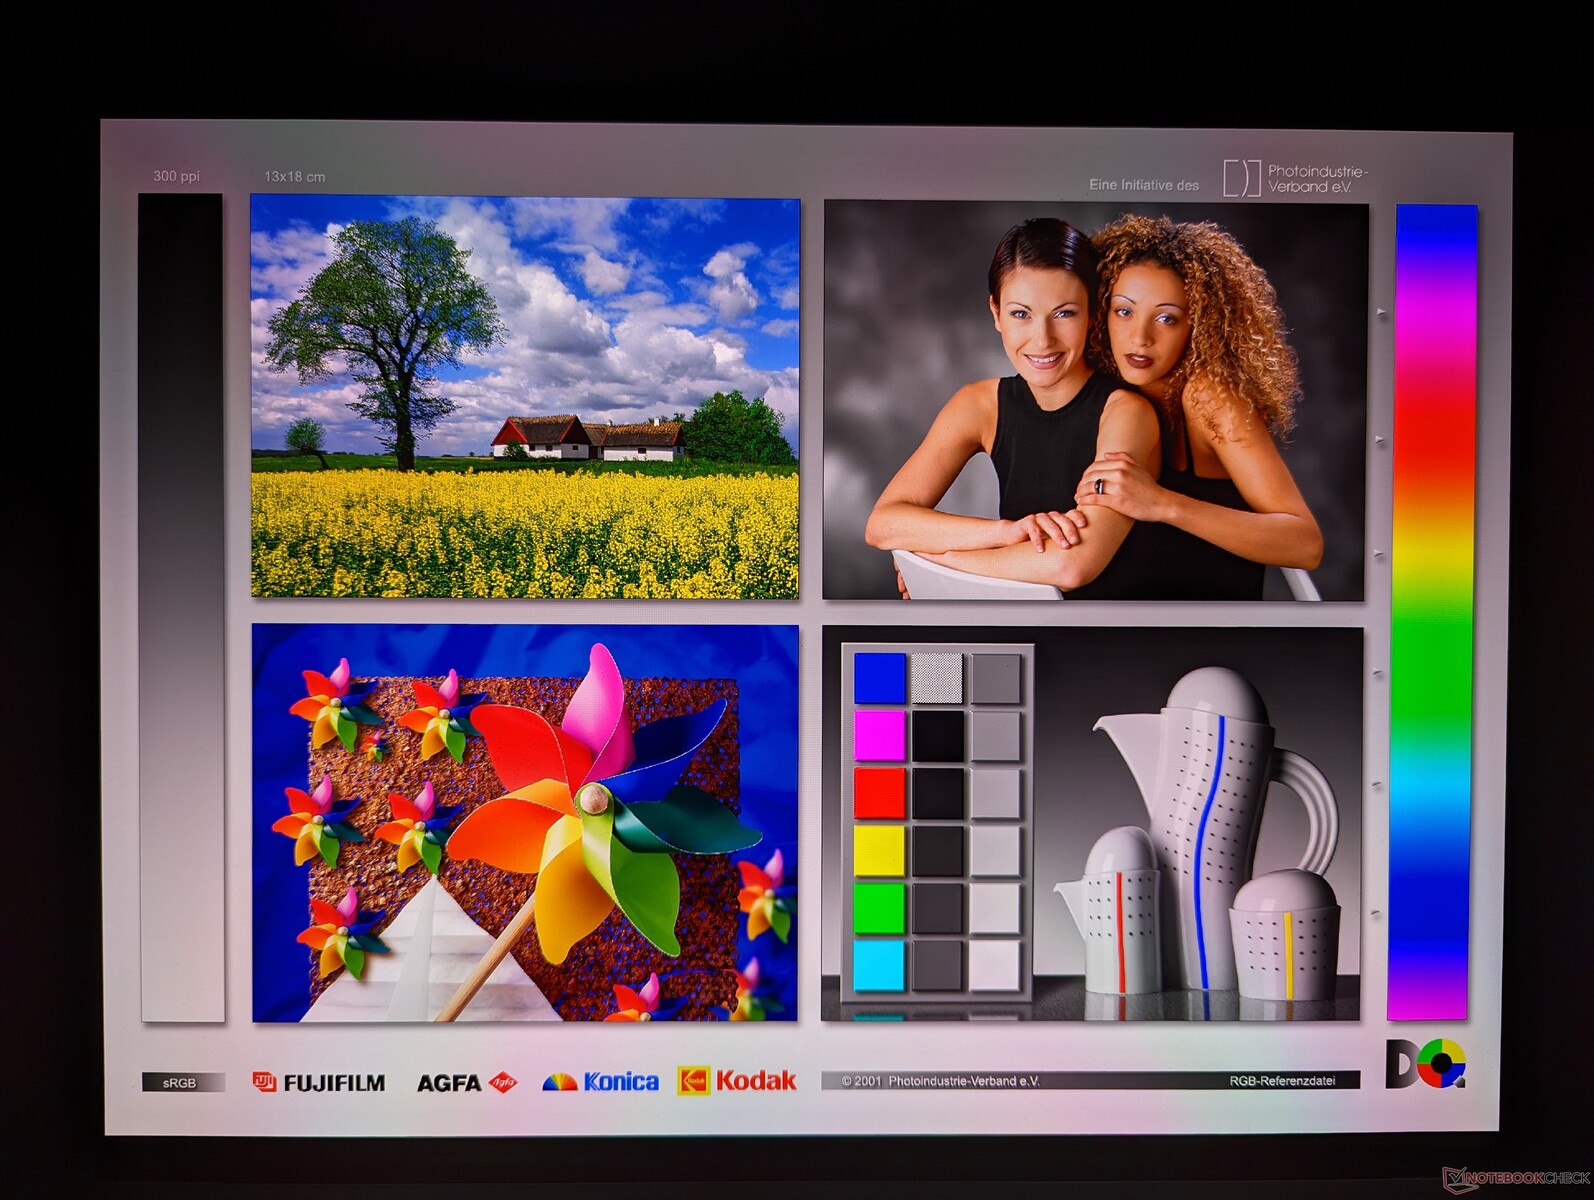
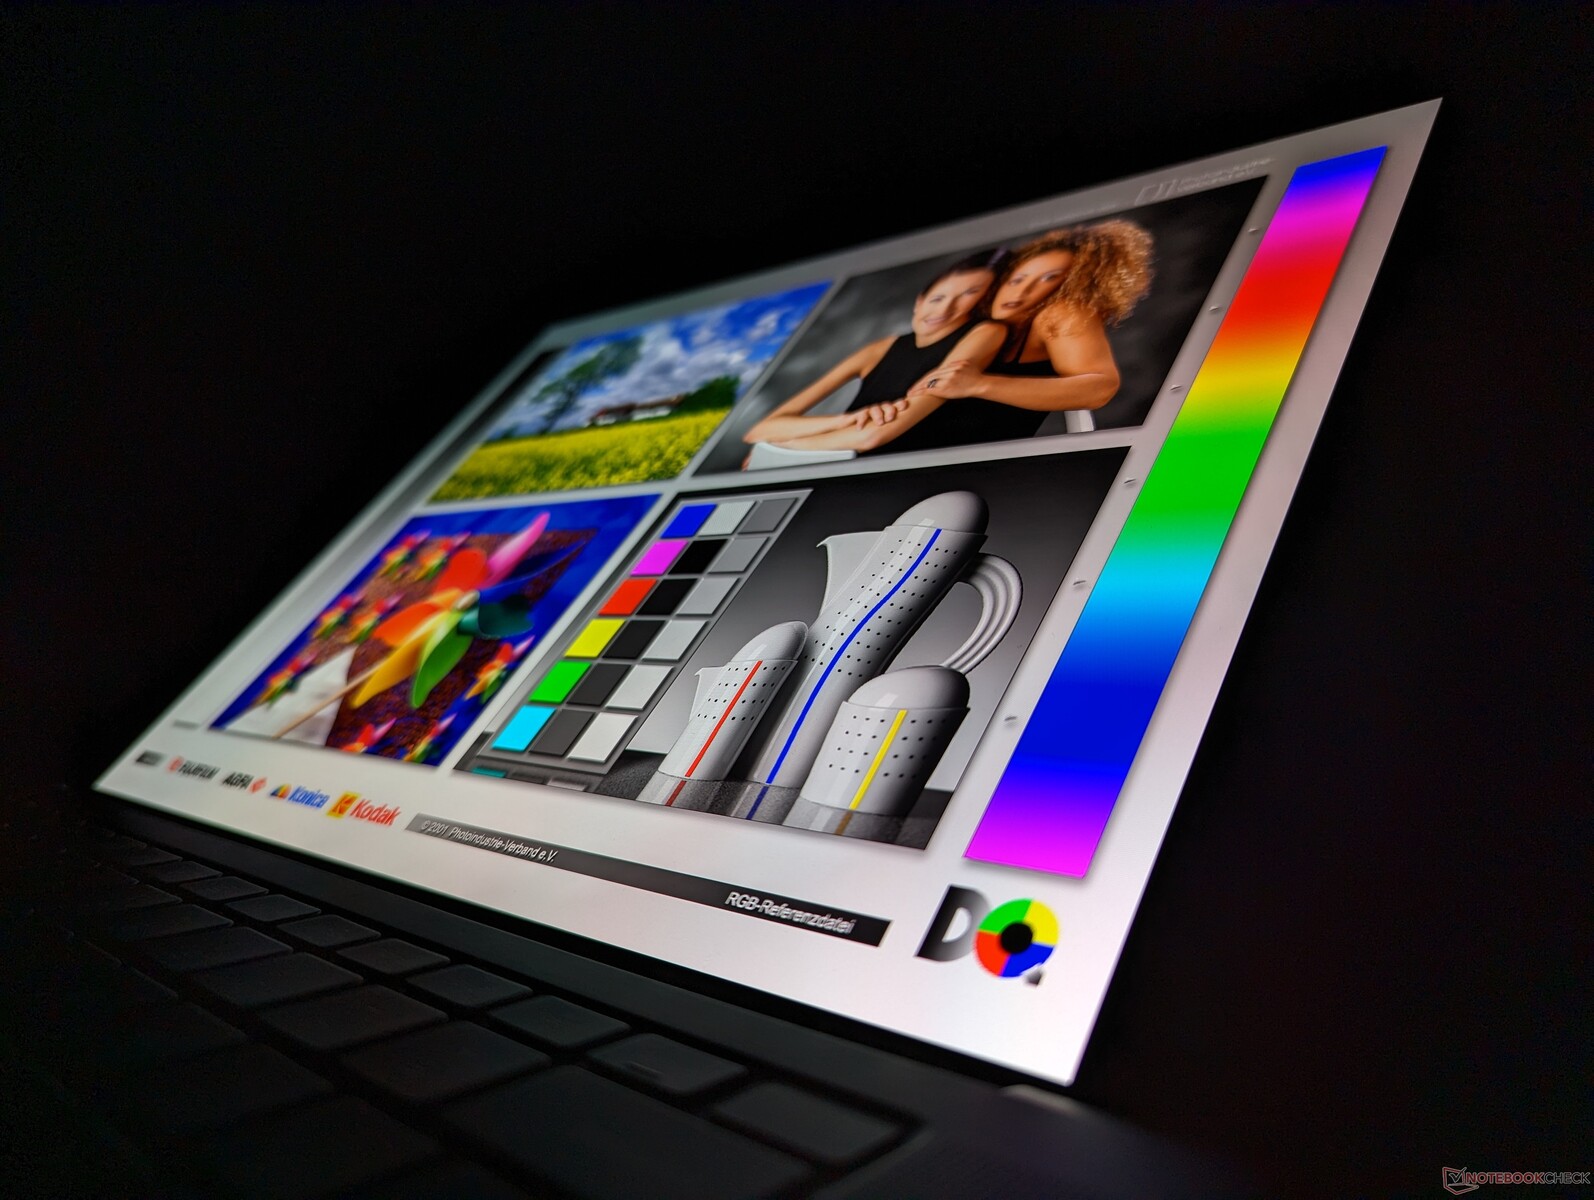
Pantalla - 3.5K Samsung OLED todavía se ve increíble
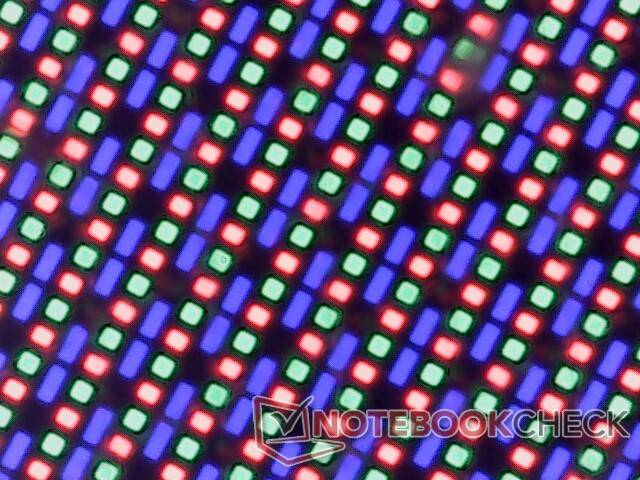
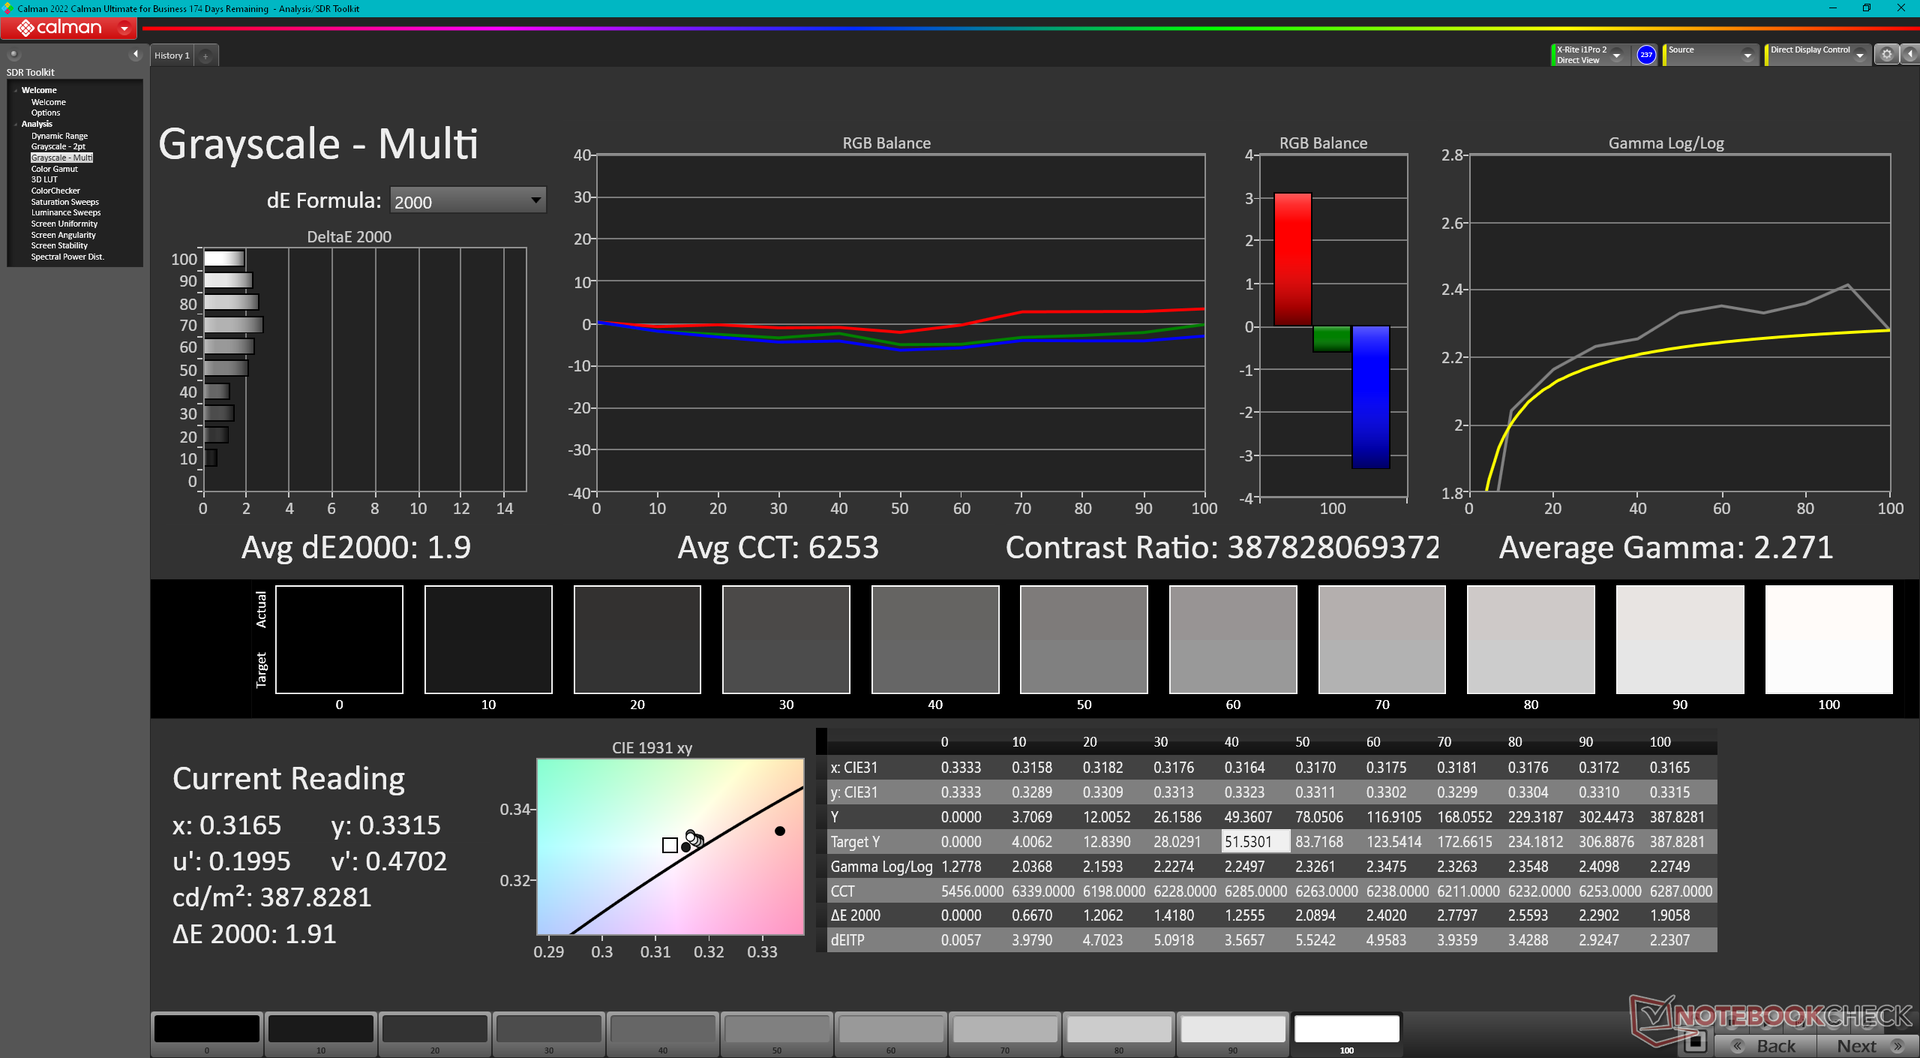
Dell usa el mismo panel OLED Samsung 156XG01 en sus modelos XPS 15 2023 y 2022 para una experiencia de visión similar entre ellos. Esto no es necesariamente malo, ya que el panel Samsung sigue ofreciendo colores DCI-P3 completos y una imagen nítida, pero nos encantaría ver opciones de panel de 90 Hz o más rápidas en el futuro. Algunos modelos Asus VivoBookpor ejemplo, vienen con paneles OLED de 120 Hz para una experiencia visual mucho más fluida.
| |||||||||||||||||||||||||
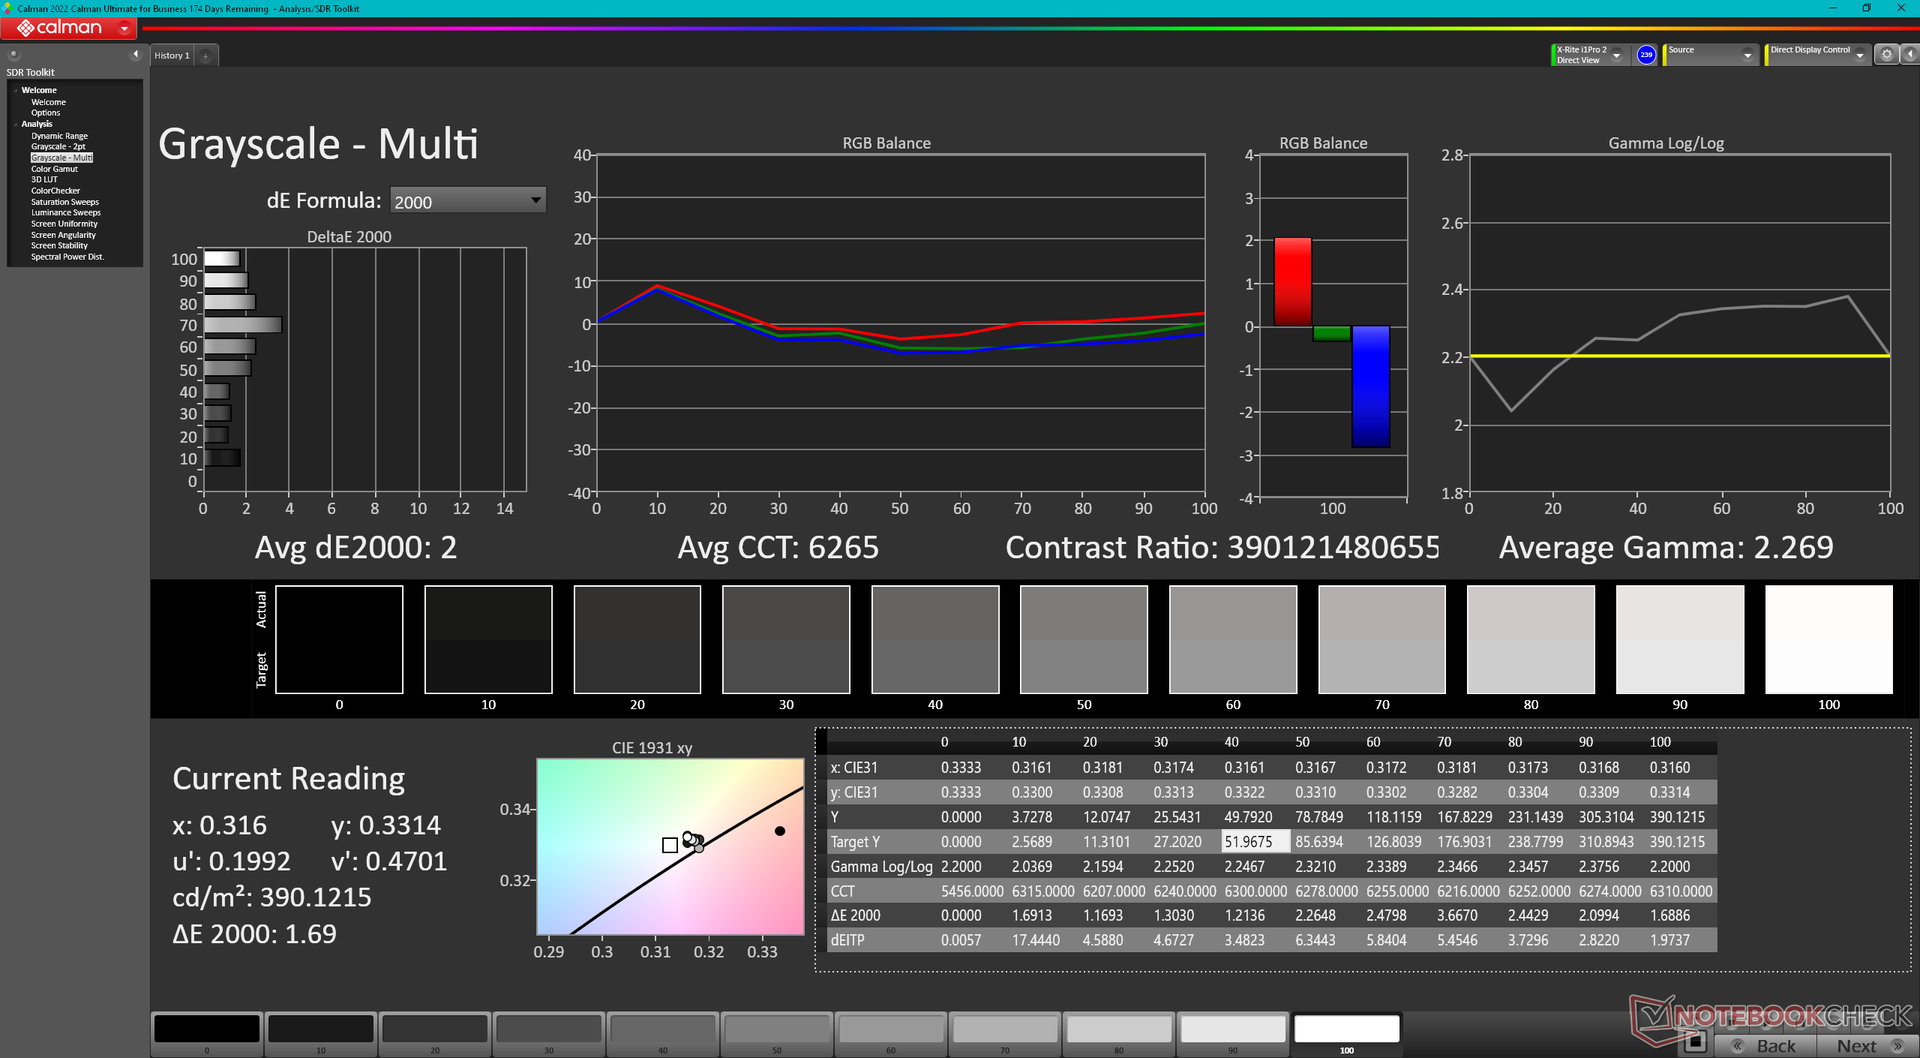
iluminación: 98 %
Brillo con batería: 389.5 cd/m²
Contraste: ∞:1 (Negro: 0 cd/m²)
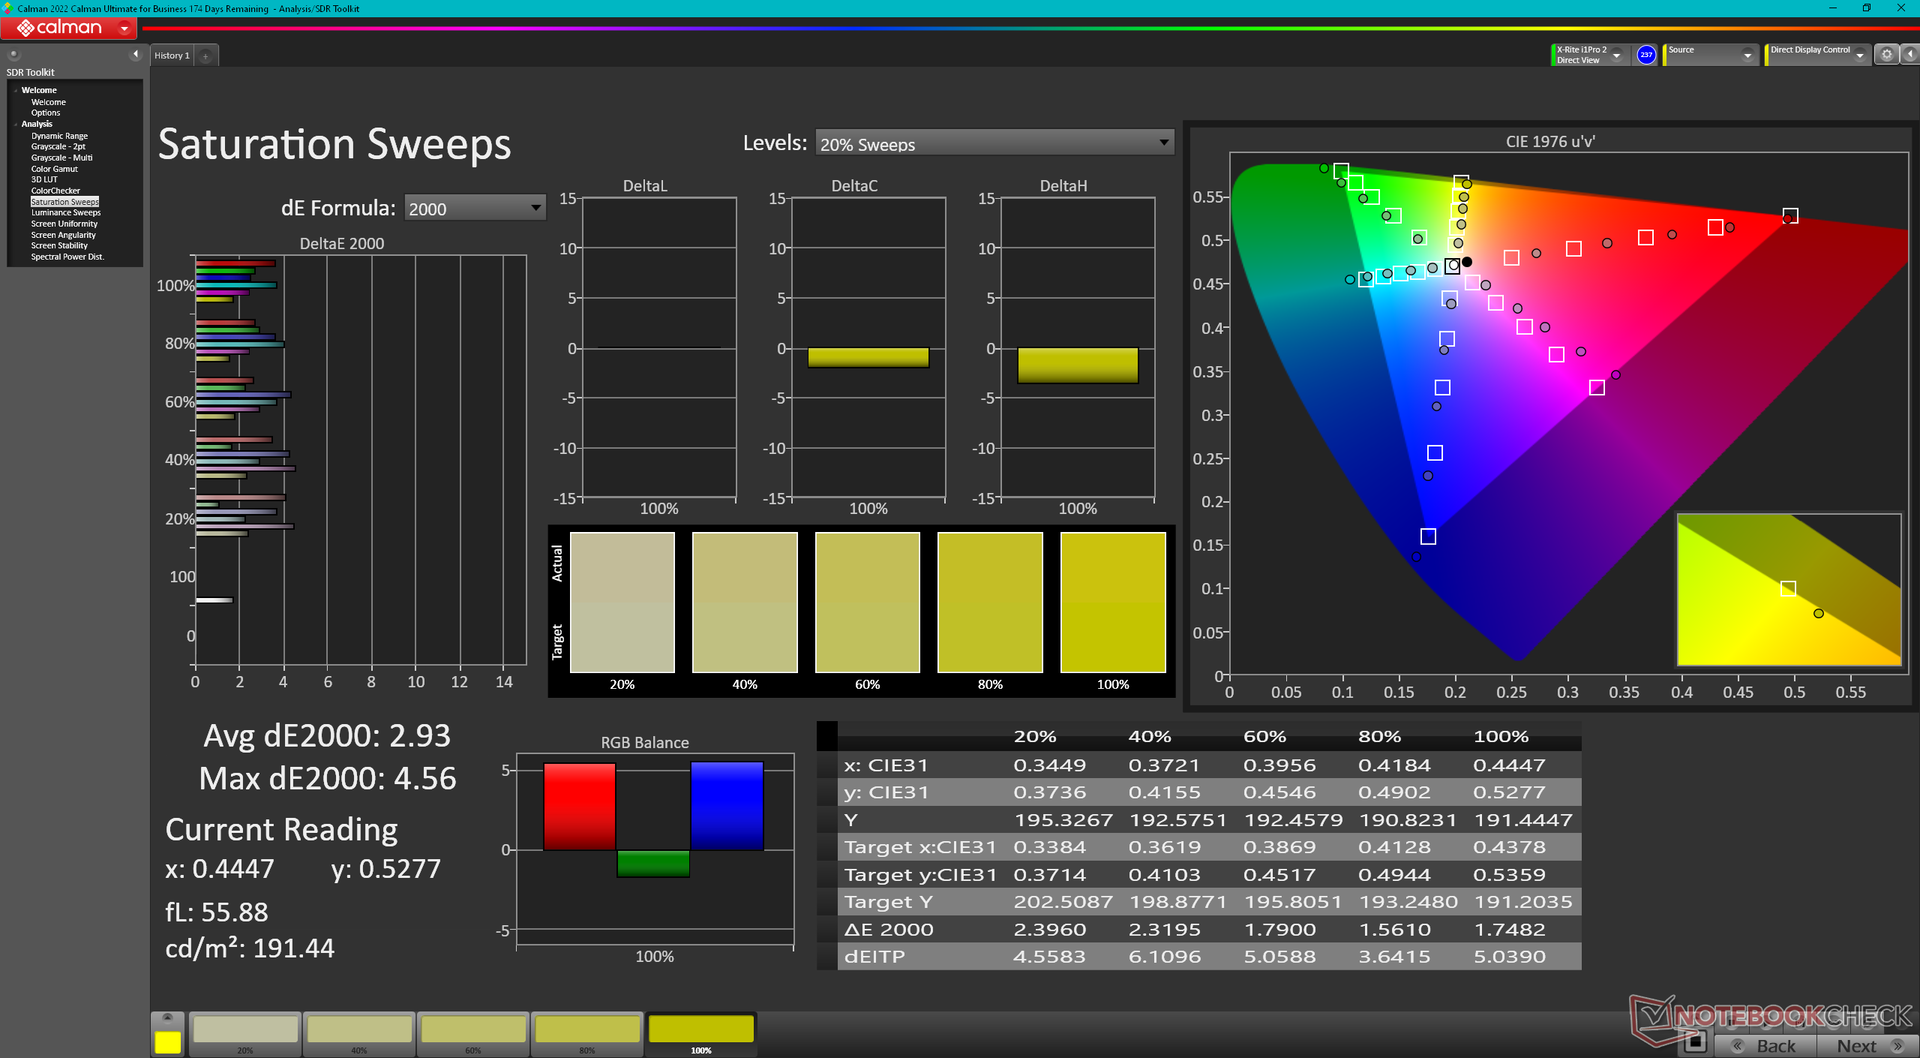
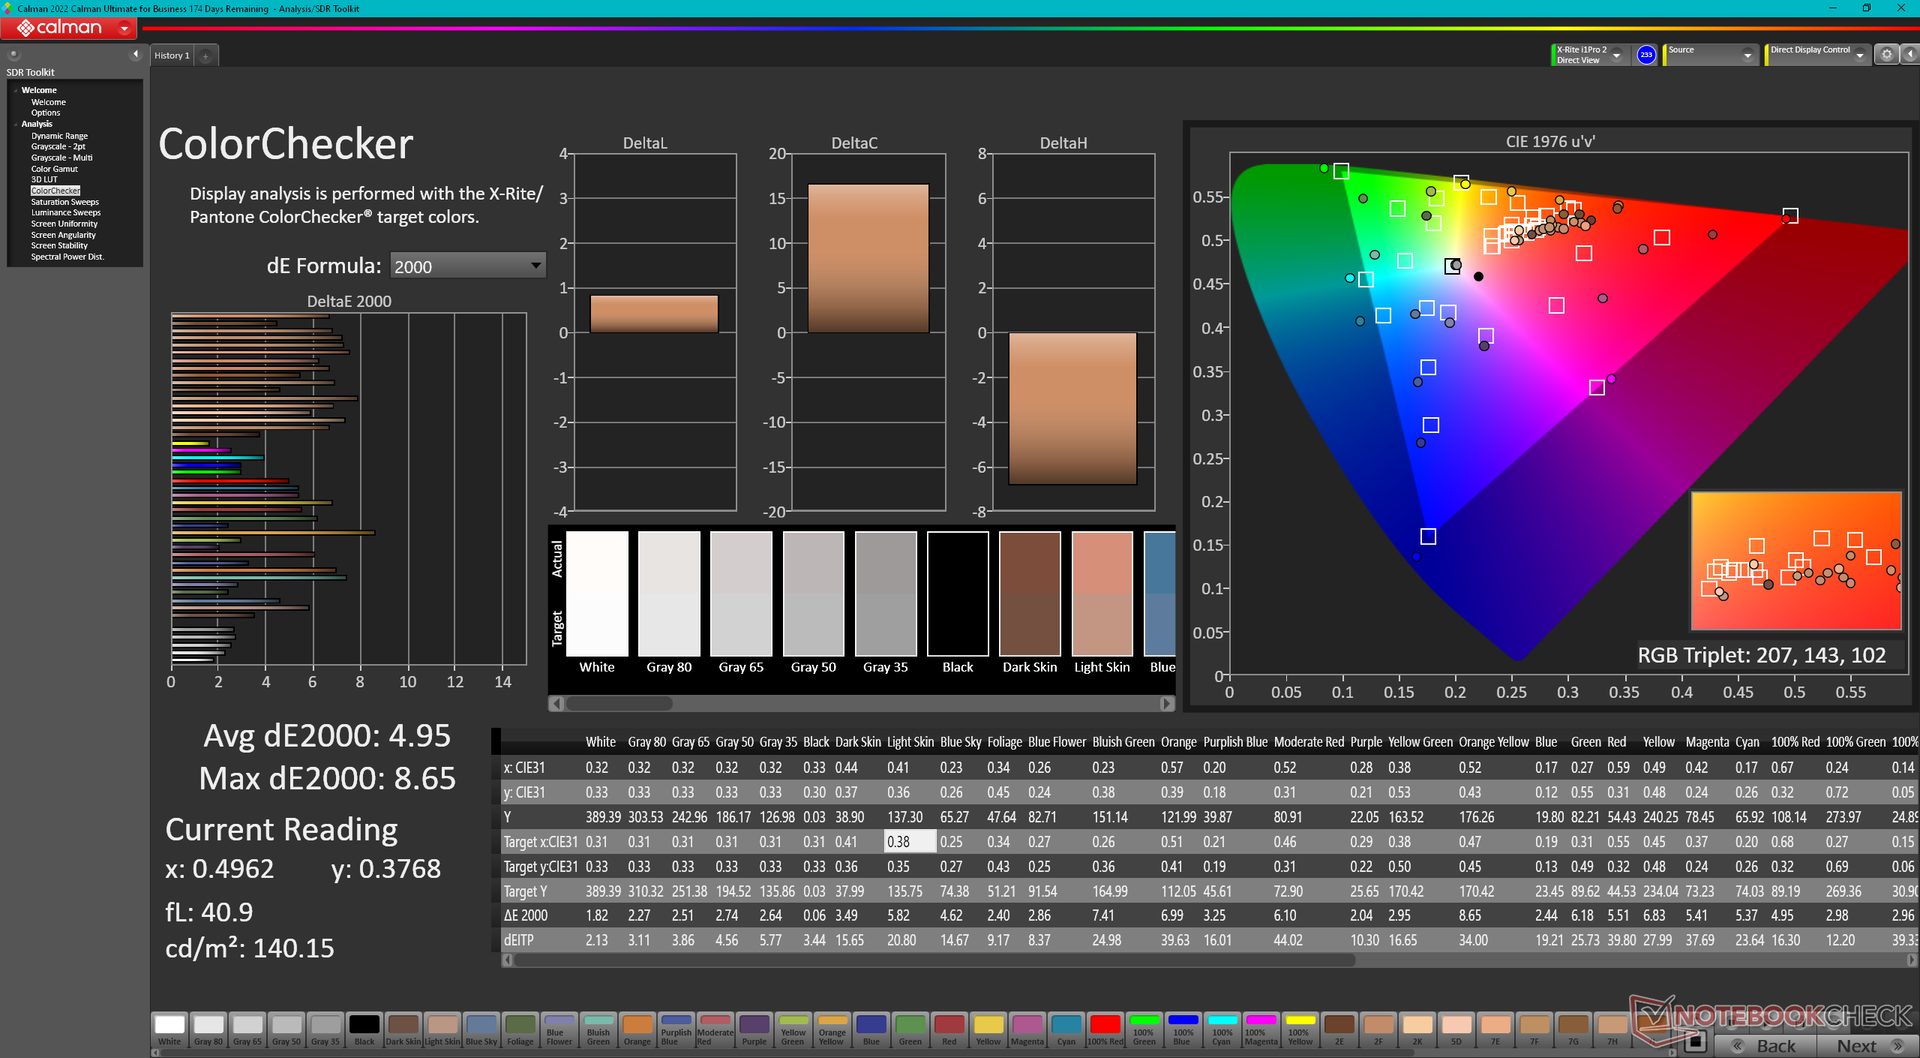
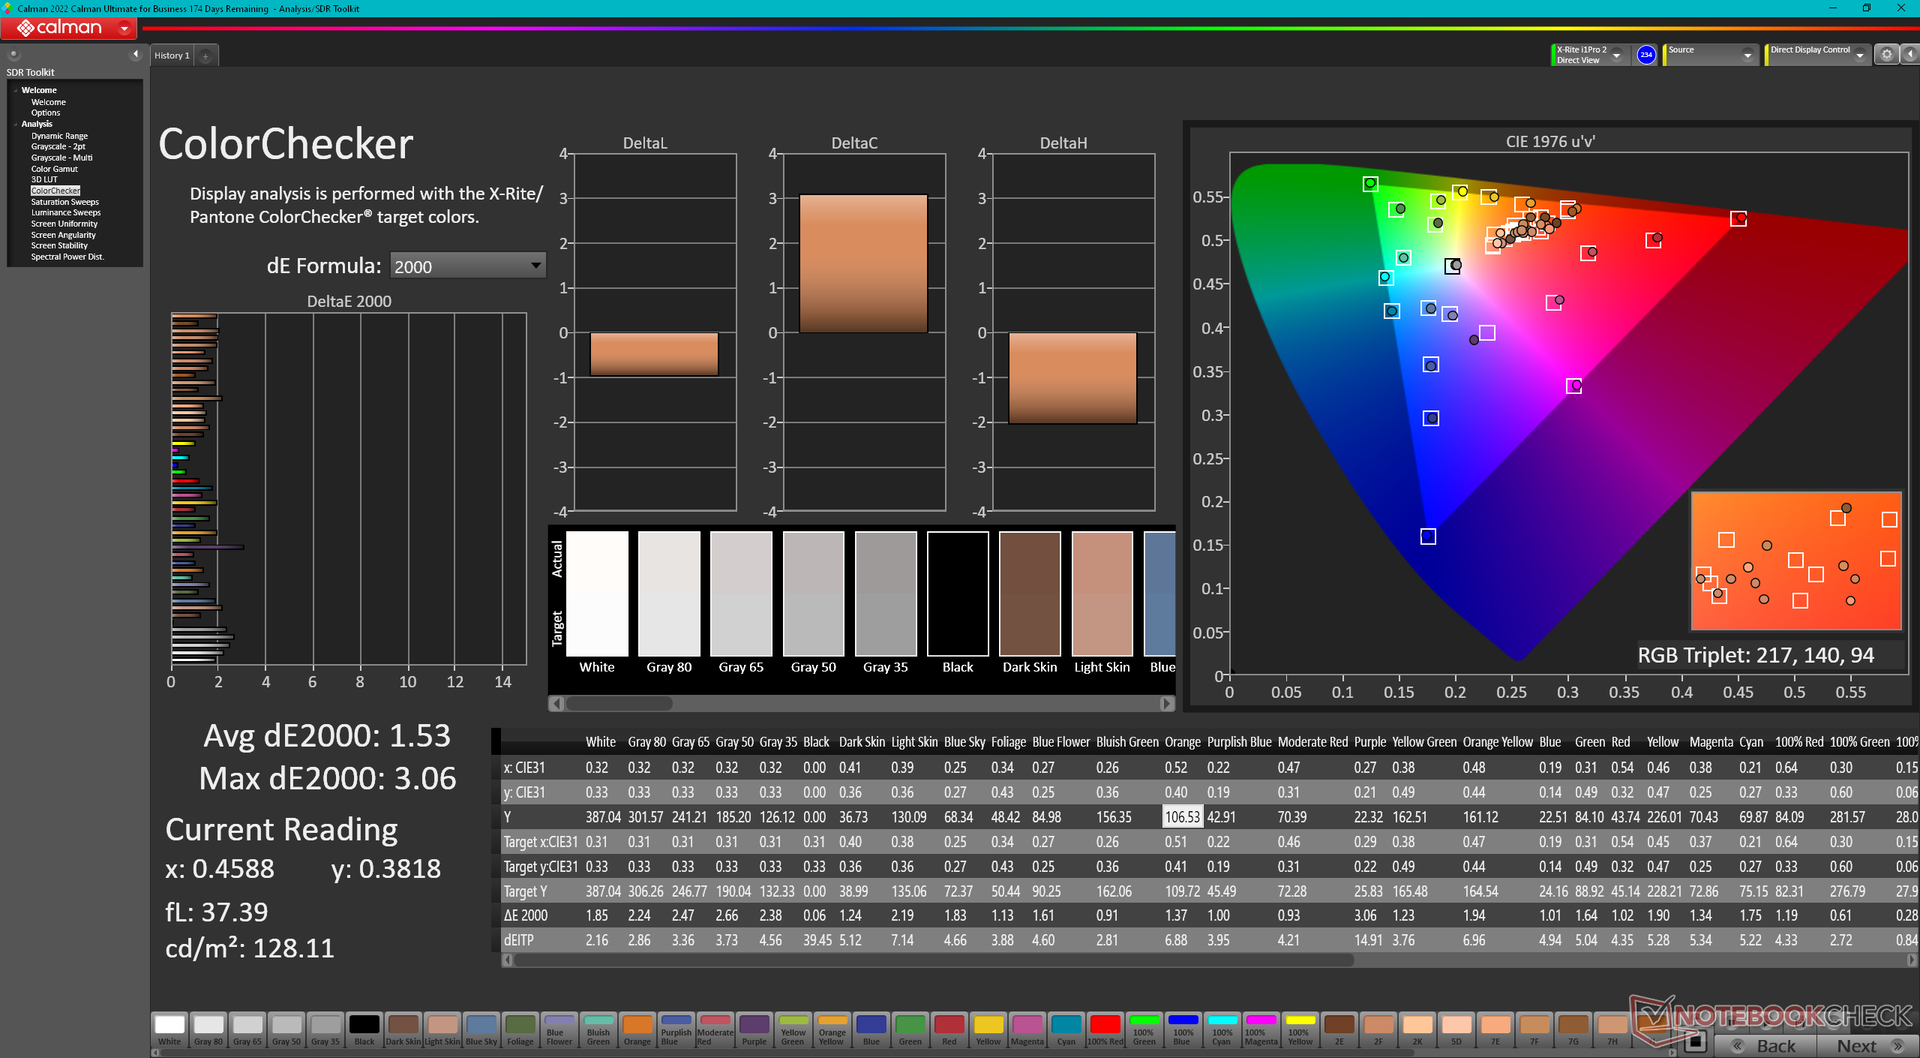
ΔE ColorChecker Calman: 4.95 | ∀{0.5-29.43 Ø4.71}
calibrated: 1.53
ΔE Greyscale Calman: 2 | ∀{0.09-98 Ø4.96}
98.4% AdobeRGB 1998 (Argyll 3D)
100% sRGB (Argyll 3D)
99.8% Display P3 (Argyll 3D)
Gamma: 2.27
CCT: 6265 K
| Dell XPS 15 9530 RTX 4070 Samsung 156XG01, OLED, 3456x2160, 15.6" | Dell XPS 15 9520 RTX 3050 Ti Samsung 156XG01, OLED, 3456x2160, 15.6" | Dell XPS 15 9500 Core i7 4K UHD Sharp LQ156R1, IPS, 3840x2400, 15.6" | Asus Zenbook Pro 15 OLED UM535Q Samsung ATNA56YX03-0, OLED, 1920x1080, 15.6" | MSI Prestige 15 A12UD-093 Sharp LQ156D1JW42, IPS, 3840x2160, 15.6" | Gigabyte Aero 15 OLED XD Samsung SDC4143, OLED, 3840x2160, 15.6" | |
|---|---|---|---|---|---|---|
| Display | -5% | -3% | -12% | -9% | 0% | |
| Display P3 Coverage (%) | 99.8 | 97.8 -2% | 89.7 -10% | 79.3 -21% | 80.48 -19% | 99.9 0% |
| sRGB Coverage (%) | 100 | 99.9 0% | 100 0% | 95.6 -4% | 96.95 -3% | 100 0% |
| AdobeRGB 1998 Coverage (%) | 98.4 | 86 -13% | 99.8 1% | 87.3 -11% | 94.02 -4% | 99.5 1% |
| Response Times | -6% | -2363% | -22% | -2088% | -35% | |
| Response Time Grey 50% / Grey 80% * (ms) | 1.68 ? | 1.9 ? -13% | 54 ? -3114% | 2.1 ? -25% | 51 ? -2936% | 2.8 ? -67% |
| Response Time Black / White * (ms) | 1.94 ? | 1.9 ? 2% | 33.2 ? -1611% | 2.3 ? -19% | 26 ? -1240% | 2 ? -3% |
| PWM Frequency (Hz) | 239 | 59.52 ? | 60.2 | 240 ? | ||
| Screen | -0% | -17% | 13% | 18% | 7% | |
| Brightness middle (cd/m²) | 389.5 | 381.4 -2% | 557.9 43% | 342.9 -12% | 441 13% | 440 13% |
| Brightness (cd/m²) | 392 | 384 -2% | 541 38% | 346 -12% | 416 6% | 446 14% |
| Brightness Distribution (%) | 98 | 95 -3% | 91 -7% | 98 0% | 85 -13% | 92 -6% |
| Black Level * (cd/m²) | 0.39 | 0.155 | 0.04 | |||
| Colorchecker dE 2000 * | 4.95 | 4.34 12% | 4.54 8% | 2.42 51% | 1.51 69% | 2.53 49% |
| Colorchecker dE 2000 max. * | 8.65 | 9.24 -7% | 7.92 8% | 4.05 53% | 3.56 59% | 7.82 10% |
| Colorchecker dE 2000 calibrated * | 1.53 | 3.82 -150% | 2.57 -68% | |||
| Greyscale dE 2000 * | 2 | 2 -0% | 3.2 -60% | 2.1 -5% | 2.49 -25% | 1.2 40% |
| Gamma | 2.27 97% | 2.13 103% | 1.99 111% | 2.21 100% | 2.17 101% | 2.206 100% |
| CCT | 6265 104% | 6210 105% | 6451 101% | 6364 102% | 6292 103% | 6371 102% |
| Contrast (:1) | 1431 | 2845 | 11000 | |||
| Color Space (Percent of AdobeRGB 1998) (%) | 89.5 | |||||
| Color Space (Percent of sRGB) (%) | 100 | |||||
| Media total (Programa/Opciones) | -4% /
-3% | -794% /
-405% | -7% /
-0% | -693% /
-372% | -9% /
-1% |
* ... más pequeño es mejor
El panel se calibra decentemente al sacarlo de la caja, pero los usuarios pueden aplicar nuestro perfil ICM calibrado anterior para mejorar ligeramente la precisión del color. Dell ha integrado por fin los distintos perfiles de color, como sRGB, AdobeRGB, DCI-P3 y otros, en el menú Pantalla de Windows para facilitar el cambio de perfil.
Tiempos de respuesta del display
| ↔ Tiempo de respuesta de Negro a Blanco | ||
|---|---|---|
| 1.94 ms ... subida ↗ y bajada ↘ combinada | ↗ 0.97 ms subida | 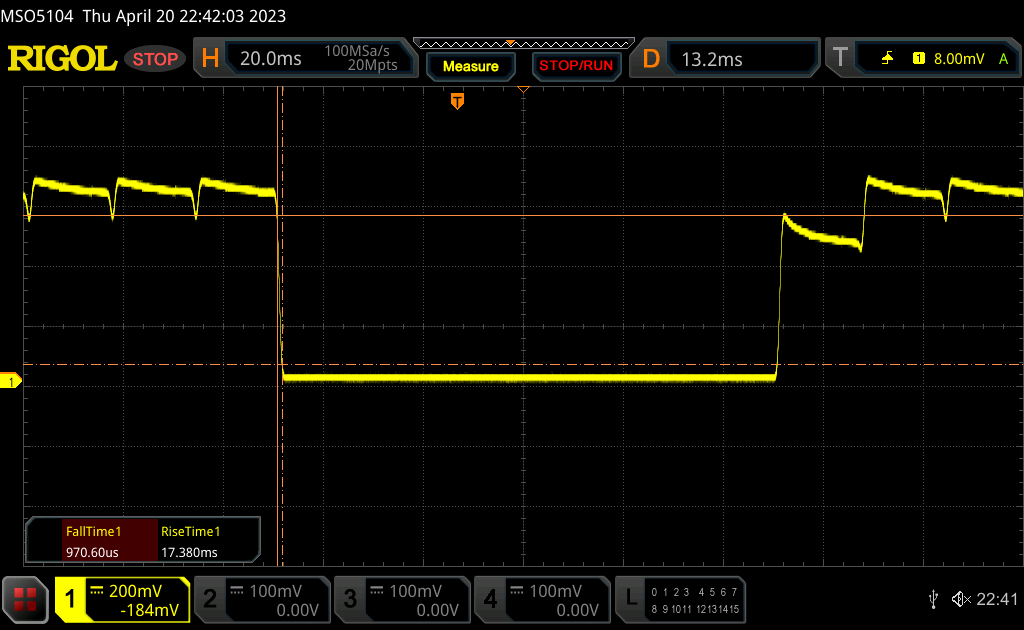 |
| ↘ 0.97 ms bajada | ||
| La pantalla mostró tiempos de respuesta muy rápidos en nuestros tests y debería ser adecuada para juegos frenéticos. En comparación, todos los dispositivos de prueba van de ##min### (mínimo) a 240 (máximo) ms. » 11 % de todos los dispositivos son mejores. Esto quiere decir que el tiempo de respuesta medido es mejor que la media (19.8 ms) de todos los dispositivos testados. | ||
| ↔ Tiempo de respuesta 50% Gris a 80% Gris | ||
| 1.68 ms ... subida ↗ y bajada ↘ combinada | ↗ 0.8 ms subida | 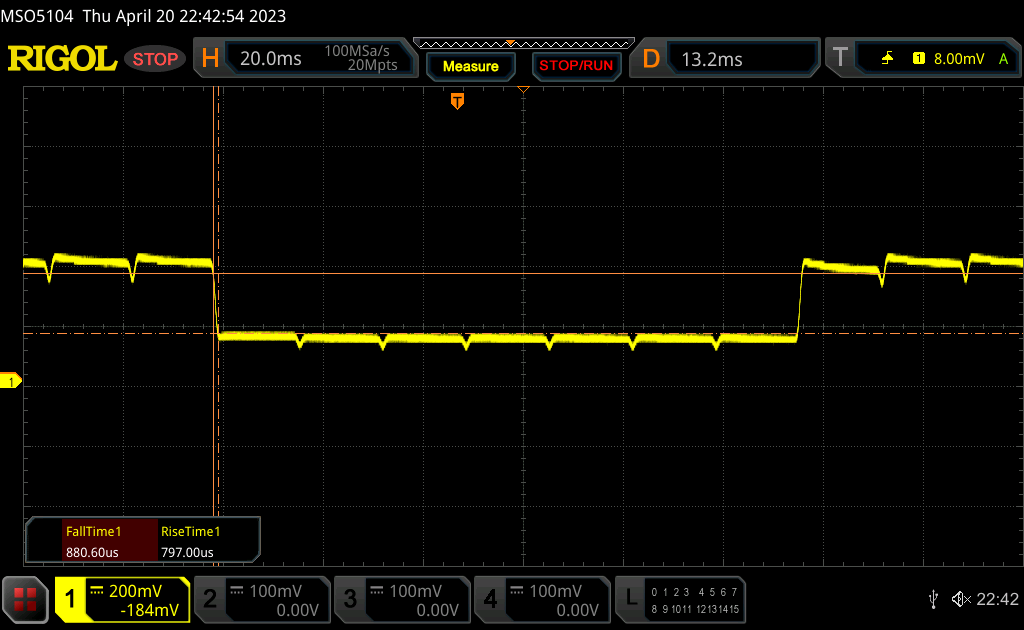 |
| ↘ 0.88 ms bajada | ||
| La pantalla mostró tiempos de respuesta muy rápidos en nuestros tests y debería ser adecuada para juegos frenéticos. En comparación, todos los dispositivos de prueba van de ##min### (mínimo) a 636 (máximo) ms. » 8 % de todos los dispositivos son mejores. Esto quiere decir que el tiempo de respuesta medido es mejor que la media (31 ms) de todos los dispositivos testados. | ||
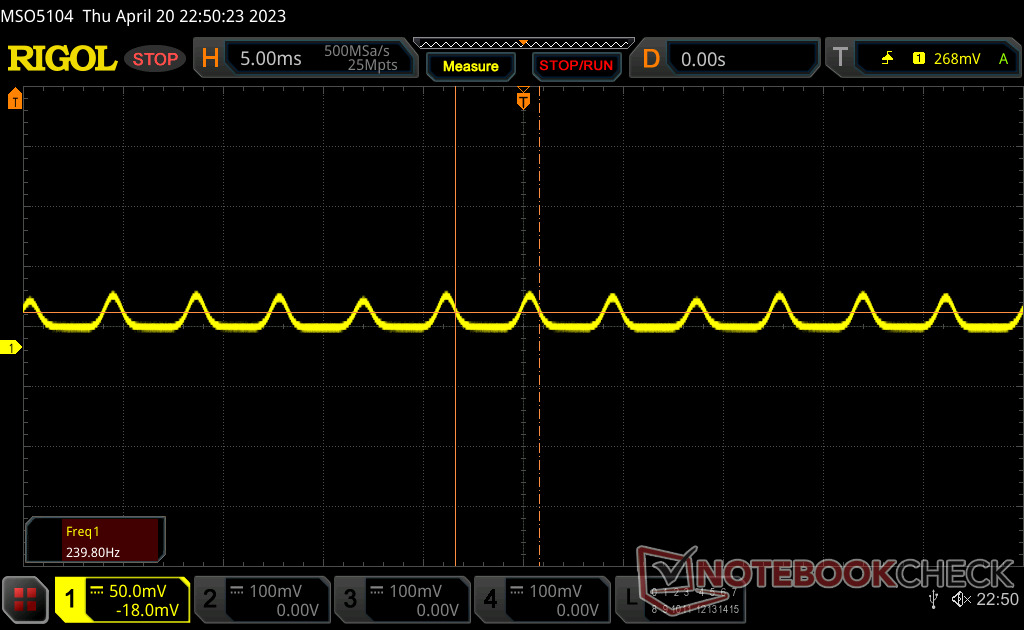
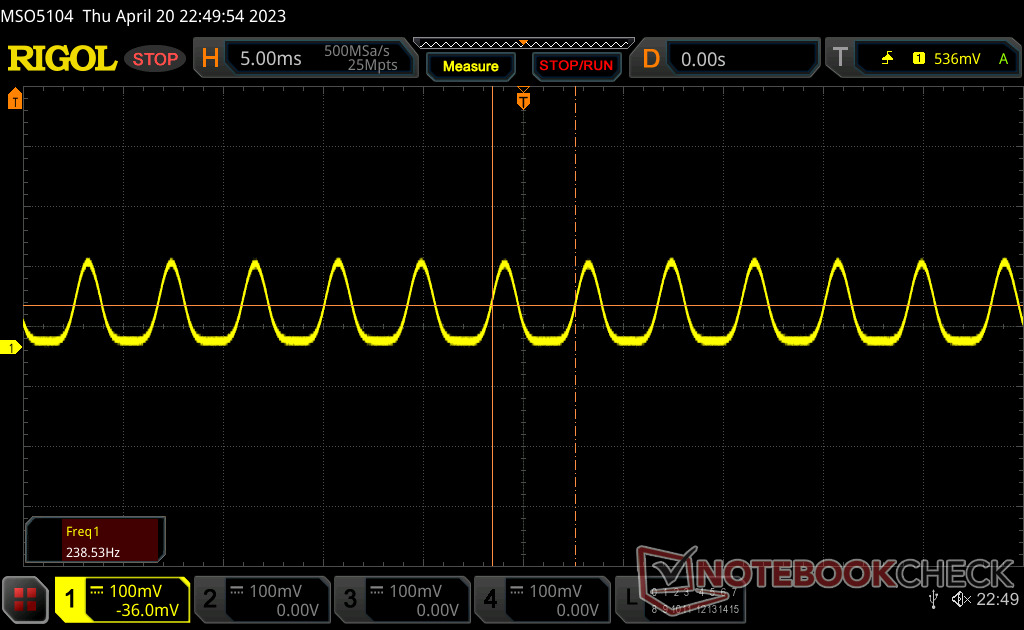
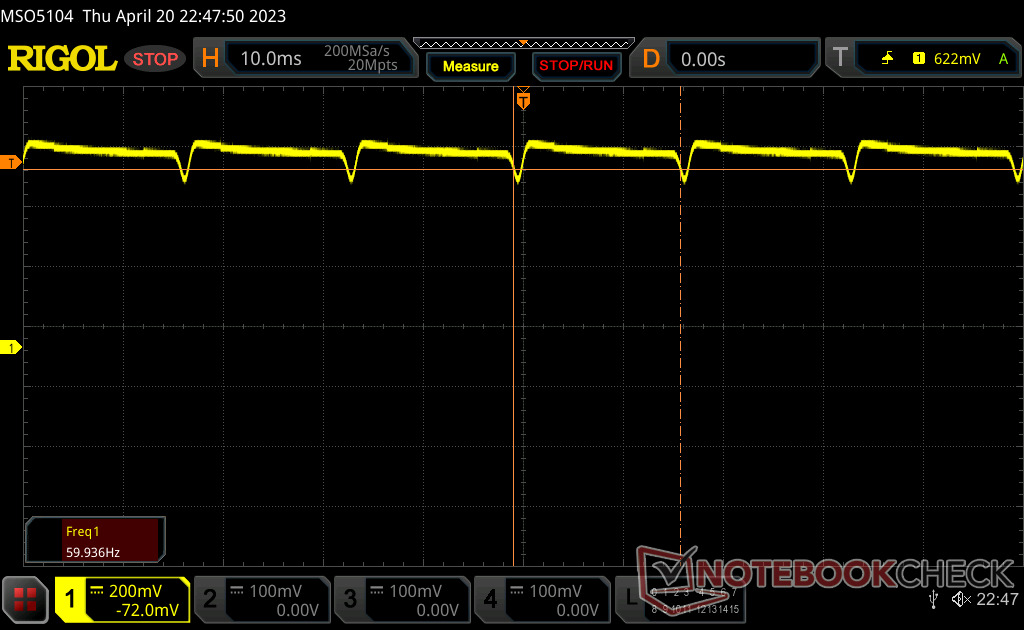
Parpadeo de Pantalla / PWM (Pulse-Width Modulation)
| Parpadeo de Pantalla / PWM detectado | 239 Hz | 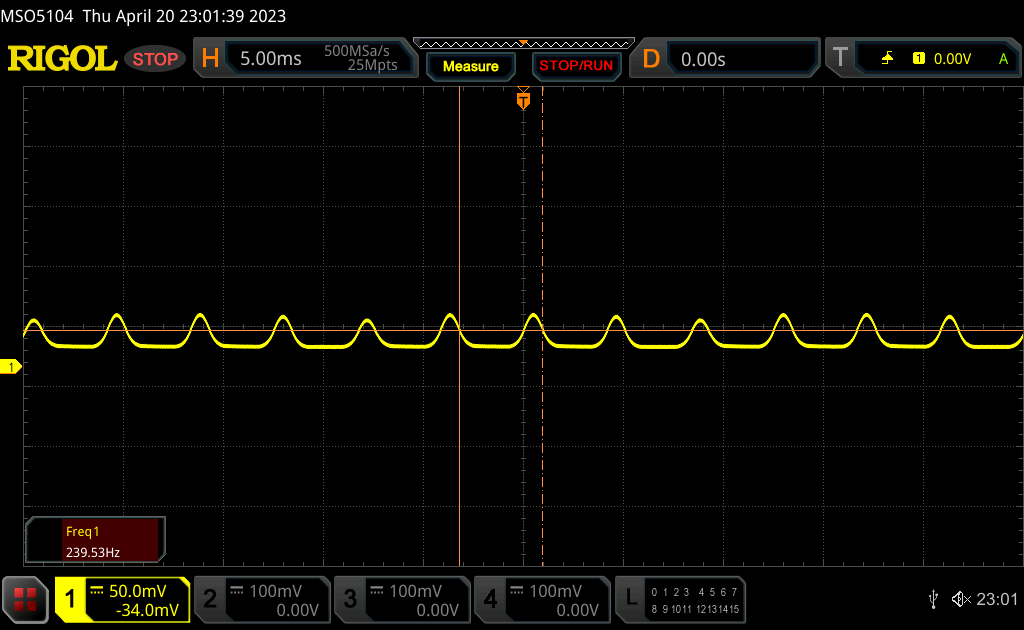 | |
La retroiluminación del display parpadea a 239 Hz (seguramente usa PWM - Pulse-Width Modulation) . La frecuencia de 239 Hz es relativamente baja, por lo que la gente sensible debería ver parpadeos y padecer fatiga visual por la pantalla (usado al brillo indicado a continuación). Comparación: 52 % de todos los dispositivos testados no usaron PWM para atenuar el display. Si se usó, medimos una media de 7757 (mínimo: 5 - máxmo: 343500) Hz. | |||
El parpadeo está presente en todos los niveles de brillo de forma muy parecida a los paneles OLED de otros portátiles. Registramos frecuencias de 240 Hz de 0 a 52% de brillo y de 60 Hz de 53% a 100% de brillo.

Rendimiento - 13ª generación Intel + gráficos GeForce RTX 4070
Condiciones de ensayo
Configuramos nuestra unidad en los modos Rendimiento y dGPU antes de ejecutar las pruebas de rendimiento que se indican a continuación. Los modos Advanced Optimus o MUX no son compatibles.
Procesador
El rendimiento de la CPU es desigual debido al limitado potencial Turbo Boost del sistema. Por ejemplo, nuestro Core i7-13700H CineBench R15 xT sería un 19 por ciento superior a la del i7-12700H del XPS 15 9520 del año pasado. Tras varios ciclos de pruebas, sin embargo, la diferencia de rendimiento se redujo y se acercó mucho más al procesador del año pasado. El más pequeño MSI Stealth 14 Studio, que utiliza la misma CPU Core i7-13700H que nuestro XPS 15 9530, mostraría un comportamiento de ralentización similar.
Actualizando al Core i9-13900H se espera que aumente el rendimiento entre un 15 y un 25 por ciento. Sin embargo, los beneficios podrían ser mínimos, ya que las CPU Core i9 tienden a ralentizarse más en portátiles multimedia delgados como el XPS 15.
Cinebench R15 Multi Loop
Cinebench R23: Multi Core | Single Core
Cinebench R20: CPU (Multi Core) | CPU (Single Core)
Cinebench R15: CPU Multi 64Bit | CPU Single 64Bit
Blender: v2.79 BMW27 CPU
7-Zip 18.03: 7z b 4 | 7z b 4 -mmt1
Geekbench 5.5: Multi-Core | Single-Core
HWBOT x265 Benchmark v2.2: 4k Preset
LibreOffice : 20 Documents To PDF
R Benchmark 2.5: Overall mean
| CPU Performance rating | |
| Asus Zephyrus Duo 16 GX650PY-NM006W | |
| Uniwill GM6PX7X RTX 4070 | |
| Asus ROG Zephyrus M16 GU604VY-NM042X | |
| Alienware x15 R2 P111F | |
| Dell XPS 15 9530 RTX 4070 | |
| Medio Intel Core i7-13700H | |
| Dell XPS 15 9520 RTX 3050 Ti | |
| MSI Prestige 15 A12UD-093 -1! | |
| Asus ROG Strix G15 G513RW | |
| Asus Zenbook Pro 15 OLED UM535Q | |
| Gigabyte Aero 15 OLED XD | |
| Dell XPS 15 9500 Core i7 4K UHD -2! | |
| Cinebench R23 / Multi Core | |
| Asus Zephyrus Duo 16 GX650PY-NM006W | |
| Uniwill GM6PX7X RTX 4070 | |
| Asus ROG Zephyrus M16 GU604VY-NM042X | |
| Alienware x15 R2 P111F | |
| Dell XPS 15 9530 RTX 4070 | |
| Medio Intel Core i7-13700H (5890 - 20034, n=29) | |
| Dell XPS 15 9520 RTX 3050 Ti | |
| Asus ROG Strix G15 G513RW | |
| Asus Zenbook Pro 15 OLED UM535Q | |
| MSI Prestige 15 A12UD-093 | |
| Gigabyte Aero 15 OLED XD | |
| Cinebench R23 / Single Core | |
| Asus ROG Zephyrus M16 GU604VY-NM042X | |
| Asus Zephyrus Duo 16 GX650PY-NM006W | |
| Alienware x15 R2 P111F | |
| Dell XPS 15 9530 RTX 4070 | |
| Uniwill GM6PX7X RTX 4070 | |
| Medio Intel Core i7-13700H (1323 - 1914, n=29) | |
| Dell XPS 15 9520 RTX 3050 Ti | |
| MSI Prestige 15 A12UD-093 | |
| Asus ROG Strix G15 G513RW | |
| Asus Zenbook Pro 15 OLED UM535Q | |
| Gigabyte Aero 15 OLED XD | |
| Cinebench R20 / CPU (Multi Core) | |
| Asus Zephyrus Duo 16 GX650PY-NM006W | |
| Uniwill GM6PX7X RTX 4070 | |
| Asus ROG Zephyrus M16 GU604VY-NM042X | |
| Alienware x15 R2 P111F | |
| Dell XPS 15 9530 RTX 4070 | |
| Medio Intel Core i7-13700H (2322 - 7674, n=29) | |
| Dell XPS 15 9520 RTX 3050 Ti | |
| Asus ROG Strix G15 G513RW | |
| Asus Zenbook Pro 15 OLED UM535Q | |
| MSI Prestige 15 A12UD-093 | |
| Gigabyte Aero 15 OLED XD | |
| Dell XPS 15 9500 Core i7 4K UHD | |
| Cinebench R20 / CPU (Single Core) | |
| Asus Zephyrus Duo 16 GX650PY-NM006W | |
| Asus ROG Zephyrus M16 GU604VY-NM042X | |
| Alienware x15 R2 P111F | |
| Uniwill GM6PX7X RTX 4070 | |
| Dell XPS 15 9530 RTX 4070 | |
| Medio Intel Core i7-13700H (508 - 741, n=29) | |
| Dell XPS 15 9520 RTX 3050 Ti | |
| MSI Prestige 15 A12UD-093 | |
| Asus ROG Strix G15 G513RW | |
| Asus Zenbook Pro 15 OLED UM535Q | |
| Gigabyte Aero 15 OLED XD | |
| Dell XPS 15 9500 Core i7 4K UHD | |
| Cinebench R15 / CPU Multi 64Bit | |
| Asus Zephyrus Duo 16 GX650PY-NM006W | |
| Uniwill GM6PX7X RTX 4070 | |
| Asus ROG Zephyrus M16 GU604VY-NM042X | |
| Alienware x15 R2 P111F | |
| Dell XPS 15 9530 RTX 4070 | |
| Medio Intel Core i7-13700H (905 - 2982, n=29) | |
| MSI Prestige 15 A12UD-093 | |
| Dell XPS 15 9520 RTX 3050 Ti | |
| Asus ROG Strix G15 G513RW | |
| Asus Zenbook Pro 15 OLED UM535Q | |
| Gigabyte Aero 15 OLED XD | |
| Dell XPS 15 9500 Core i7 4K UHD | |
| Cinebench R15 / CPU Single 64Bit | |
| Asus Zephyrus Duo 16 GX650PY-NM006W | |
| Asus ROG Zephyrus M16 GU604VY-NM042X | |
| Alienware x15 R2 P111F | |
| Dell XPS 15 9530 RTX 4070 | |
| Uniwill GM6PX7X RTX 4070 | |
| Medio Intel Core i7-13700H (213 - 278, n=29) | |
| Dell XPS 15 9520 RTX 3050 Ti | |
| Asus ROG Strix G15 G513RW | |
| Asus Zenbook Pro 15 OLED UM535Q | |
| Dell XPS 15 9500 Core i7 4K UHD | |
| Gigabyte Aero 15 OLED XD | |
| MSI Prestige 15 A12UD-093 | |
| Blender / v2.79 BMW27 CPU | |
| Dell XPS 15 9500 Core i7 4K UHD | |
| Gigabyte Aero 15 OLED XD | |
| MSI Prestige 15 A12UD-093 | |
| Asus Zenbook Pro 15 OLED UM535Q | |
| Asus ROG Strix G15 G513RW | |
| Medio Intel Core i7-13700H (169 - 555, n=29) | |
| Dell XPS 15 9520 RTX 3050 Ti | |
| Dell XPS 15 9530 RTX 4070 | |
| Alienware x15 R2 P111F | |
| Asus ROG Zephyrus M16 GU604VY-NM042X | |
| Uniwill GM6PX7X RTX 4070 | |
| Asus Zephyrus Duo 16 GX650PY-NM006W | |
| 7-Zip 18.03 / 7z b 4 | |
| Asus Zephyrus Duo 16 GX650PY-NM006W | |
| Uniwill GM6PX7X RTX 4070 | |
| Asus ROG Zephyrus M16 GU604VY-NM042X | |
| Alienware x15 R2 P111F | |
| Dell XPS 15 9520 RTX 3050 Ti | |
| Medio Intel Core i7-13700H (27322 - 76344, n=29) | |
| Dell XPS 15 9530 RTX 4070 | |
| Asus ROG Strix G15 G513RW | |
| Asus Zenbook Pro 15 OLED UM535Q | |
| MSI Prestige 15 A12UD-093 | |
| Gigabyte Aero 15 OLED XD | |
| Dell XPS 15 9500 Core i7 4K UHD | |
| 7-Zip 18.03 / 7z b 4 -mmt1 | |
| Asus Zephyrus Duo 16 GX650PY-NM006W | |
| Asus ROG Zephyrus M16 GU604VY-NM042X | |
| Dell XPS 15 9530 RTX 4070 | |
| Uniwill GM6PX7X RTX 4070 | |
| Medio Intel Core i7-13700H (4825 - 6238, n=29) | |
| Alienware x15 R2 P111F | |
| Asus ROG Strix G15 G513RW | |
| Dell XPS 15 9520 RTX 3050 Ti | |
| Asus Zenbook Pro 15 OLED UM535Q | |
| MSI Prestige 15 A12UD-093 | |
| Gigabyte Aero 15 OLED XD | |
| Dell XPS 15 9500 Core i7 4K UHD | |
| Geekbench 5.5 / Multi-Core | |
| Asus Zephyrus Duo 16 GX650PY-NM006W | |
| Uniwill GM6PX7X RTX 4070 | |
| Asus ROG Zephyrus M16 GU604VY-NM042X | |
| Alienware x15 R2 P111F | |
| Dell XPS 15 9530 RTX 4070 | |
| Dell XPS 15 9520 RTX 3050 Ti | |
| MSI Prestige 15 A12UD-093 | |
| Medio Intel Core i7-13700H (6165 - 14215, n=29) | |
| Asus ROG Strix G15 G513RW | |
| Gigabyte Aero 15 OLED XD | |
| Asus Zenbook Pro 15 OLED UM535Q | |
| Dell XPS 15 9500 Core i7 4K UHD | |
| Geekbench 5.5 / Single-Core | |
| Asus Zephyrus Duo 16 GX650PY-NM006W | |
| Asus ROG Zephyrus M16 GU604VY-NM042X | |
| Dell XPS 15 9530 RTX 4070 | |
| Alienware x15 R2 P111F | |
| Uniwill GM6PX7X RTX 4070 | |
| Medio Intel Core i7-13700H (1362 - 1919, n=29) | |
| Dell XPS 15 9520 RTX 3050 Ti | |
| Asus ROG Strix G15 G513RW | |
| MSI Prestige 15 A12UD-093 | |
| Asus Zenbook Pro 15 OLED UM535Q | |
| Gigabyte Aero 15 OLED XD | |
| Dell XPS 15 9500 Core i7 4K UHD | |
| HWBOT x265 Benchmark v2.2 / 4k Preset | |
| Asus Zephyrus Duo 16 GX650PY-NM006W | |
| Uniwill GM6PX7X RTX 4070 | |
| Asus ROG Zephyrus M16 GU604VY-NM042X | |
| Alienware x15 R2 P111F | |
| Dell XPS 15 9530 RTX 4070 | |
| Medio Intel Core i7-13700H (6.72 - 21.2, n=29) | |
| Asus ROG Strix G15 G513RW | |
| Asus Zenbook Pro 15 OLED UM535Q | |
| Dell XPS 15 9520 RTX 3050 Ti | |
| Gigabyte Aero 15 OLED XD | |
| Dell XPS 15 9500 Core i7 4K UHD | |
| LibreOffice / 20 Documents To PDF | |
| Asus ROG Strix G15 G513RW | |
| MSI Prestige 15 A12UD-093 | |
| MSI Prestige 15 A12UD-093 | |
| Asus Zephyrus Duo 16 GX650PY-NM006W | |
| Dell XPS 15 9500 Core i7 4K UHD | |
| Asus ROG Zephyrus M16 GU604VY-NM042X | |
| Asus Zenbook Pro 15 OLED UM535Q | |
| Medio Intel Core i7-13700H (31.3 - 62.4, n=29) | |
| Gigabyte Aero 15 OLED XD | |
| Alienware x15 R2 P111F | |
| Dell XPS 15 9530 RTX 4070 | |
| Dell XPS 15 9520 RTX 3050 Ti | |
| Uniwill GM6PX7X RTX 4070 | |
| R Benchmark 2.5 / Overall mean | |
| Gigabyte Aero 15 OLED XD | |
| Dell XPS 15 9500 Core i7 4K UHD | |
| Asus Zenbook Pro 15 OLED UM535Q | |
| Asus ROG Strix G15 G513RW | |
| Medio Intel Core i7-13700H (0.4308 - 0.607, n=29) | |
| Uniwill GM6PX7X RTX 4070 | |
| Dell XPS 15 9520 RTX 3050 Ti | |
| MSI Prestige 15 A12UD-093 | |
| Dell XPS 15 9530 RTX 4070 | |
| Alienware x15 R2 P111F | |
| Asus ROG Zephyrus M16 GU604VY-NM042X | |
| Asus Zephyrus Duo 16 GX650PY-NM006W | |
* ... más pequeño es mejor
AIDA64: FP32 Ray-Trace | FPU Julia | CPU SHA3 | CPU Queen | FPU SinJulia | FPU Mandel | CPU AES | CPU ZLib | FP64 Ray-Trace | CPU PhotoWorxx
| Performance rating | |
| Asus Zenbook Pro 15 OLED UM535Q | |
| Dell XPS 15 9530 RTX 4070 | |
| Medio Intel Core i7-13700H | |
| MSI Prestige 15 A12UD-093 | |
| Dell XPS 15 9520 RTX 3050 Ti | |
| Dell XPS 15 9500 Core i7 4K UHD | |
| Gigabyte Aero 15 OLED XD -9! | |
| AIDA64 / FP32 Ray-Trace | |
| Asus Zenbook Pro 15 OLED UM535Q | |
| Dell XPS 15 9530 RTX 4070 | |
| Medio Intel Core i7-13700H (4986 - 18908, n=29) | |
| MSI Prestige 15 A12UD-093 | |
| Dell XPS 15 9500 Core i7 4K UHD | |
| Dell XPS 15 9520 RTX 3050 Ti | |
| AIDA64 / FPU Julia | |
| Asus Zenbook Pro 15 OLED UM535Q | |
| Medio Intel Core i7-13700H (25360 - 92359, n=29) | |
| Dell XPS 15 9530 RTX 4070 | |
| Dell XPS 15 9500 Core i7 4K UHD | |
| MSI Prestige 15 A12UD-093 | |
| Dell XPS 15 9520 RTX 3050 Ti | |
| AIDA64 / CPU SHA3 | |
| Asus Zenbook Pro 15 OLED UM535Q | |
| Medio Intel Core i7-13700H (1339 - 4224, n=29) | |
| Dell XPS 15 9530 RTX 4070 | |
| Dell XPS 15 9500 Core i7 4K UHD | |
| Dell XPS 15 9520 RTX 3050 Ti | |
| MSI Prestige 15 A12UD-093 | |
| AIDA64 / CPU Queen | |
| Dell XPS 15 9530 RTX 4070 | |
| Asus Zenbook Pro 15 OLED UM535Q | |
| Dell XPS 15 9520 RTX 3050 Ti | |
| Medio Intel Core i7-13700H (59324 - 107159, n=29) | |
| Dell XPS 15 9500 Core i7 4K UHD | |
| MSI Prestige 15 A12UD-093 | |
| AIDA64 / FPU SinJulia | |
| Asus Zenbook Pro 15 OLED UM535Q | |
| Dell XPS 15 9500 Core i7 4K UHD | |
| Medio Intel Core i7-13700H (4800 - 11050, n=29) | |
| Dell XPS 15 9530 RTX 4070 | |
| Dell XPS 15 9520 RTX 3050 Ti | |
| MSI Prestige 15 A12UD-093 | |
| AIDA64 / FPU Mandel | |
| Asus Zenbook Pro 15 OLED UM535Q | |
| Medio Intel Core i7-13700H (12321 - 45118, n=29) | |
| Dell XPS 15 9530 RTX 4070 | |
| Dell XPS 15 9500 Core i7 4K UHD | |
| MSI Prestige 15 A12UD-093 | |
| Dell XPS 15 9520 RTX 3050 Ti | |
| AIDA64 / CPU AES | |
| Asus Zenbook Pro 15 OLED UM535Q | |
| MSI Prestige 15 A12UD-093 | |
| Dell XPS 15 9520 RTX 3050 Ti | |
| Medio Intel Core i7-13700H (28769 - 151254, n=29) | |
| Dell XPS 15 9530 RTX 4070 | |
| Dell XPS 15 9500 Core i7 4K UHD | |
| AIDA64 / CPU ZLib | |
| Medio Intel Core i7-13700H (389 - 1215, n=29) | |
| Dell XPS 15 9530 RTX 4070 | |
| Dell XPS 15 9520 RTX 3050 Ti | |
| Asus Zenbook Pro 15 OLED UM535Q | |
| MSI Prestige 15 A12UD-093 | |
| Dell XPS 15 9500 Core i7 4K UHD | |
| Gigabyte Aero 15 OLED XD | |
| AIDA64 / FP64 Ray-Trace | |
| Asus Zenbook Pro 15 OLED UM535Q | |
| Dell XPS 15 9530 RTX 4070 | |
| Medio Intel Core i7-13700H (2540 - 10135, n=29) | |
| MSI Prestige 15 A12UD-093 | |
| Dell XPS 15 9520 RTX 3050 Ti | |
| Dell XPS 15 9500 Core i7 4K UHD | |
| AIDA64 / CPU PhotoWorxx | |
| Dell XPS 15 9530 RTX 4070 | |
| MSI Prestige 15 A12UD-093 | |
| Medio Intel Core i7-13700H (12872 - 52727, n=29) | |
| Dell XPS 15 9520 RTX 3050 Ti | |
| Dell XPS 15 9500 Core i7 4K UHD | |
| Asus Zenbook Pro 15 OLED UM535Q | |
Rendimiento del sistema
CrossMark: Overall | Productivity | Creativity | Responsiveness
| PCMark 10 / Score | |
| Medio Intel Core i7-13700H, NVIDIA GeForce RTX 4070 Laptop GPU (7158 - 7956, n=8) | |
| Dell XPS 15 9530 RTX 4070 | |
| Dell XPS 15 9520 RTX 3050 Ti | |
| Gigabyte Aero 15 OLED XD | |
| Asus Zenbook Pro 15 OLED UM535Q | |
| MSI Prestige 15 A12UD-093 | |
| Dell XPS 15 9500 Core i7 4K UHD | |
| PCMark 10 / Essentials | |
| Dell XPS 15 9530 RTX 4070 | |
| Dell XPS 15 9520 RTX 3050 Ti | |
| Medio Intel Core i7-13700H, NVIDIA GeForce RTX 4070 Laptop GPU (10252 - 11449, n=8) | |
| Asus Zenbook Pro 15 OLED UM535Q | |
| MSI Prestige 15 A12UD-093 | |
| Gigabyte Aero 15 OLED XD | |
| Dell XPS 15 9500 Core i7 4K UHD | |
| PCMark 10 / Productivity | |
| Gigabyte Aero 15 OLED XD | |
| Asus Zenbook Pro 15 OLED UM535Q | |
| Dell XPS 15 9520 RTX 3050 Ti | |
| Medio Intel Core i7-13700H, NVIDIA GeForce RTX 4070 Laptop GPU (8501 - 10769, n=8) | |
| MSI Prestige 15 A12UD-093 | |
| Dell XPS 15 9530 RTX 4070 | |
| Dell XPS 15 9500 Core i7 4K UHD | |
| PCMark 10 / Digital Content Creation | |
| Medio Intel Core i7-13700H, NVIDIA GeForce RTX 4070 Laptop GPU (10358 - 12908, n=8) | |
| Dell XPS 15 9530 RTX 4070 | |
| Gigabyte Aero 15 OLED XD | |
| Dell XPS 15 9520 RTX 3050 Ti | |
| Asus Zenbook Pro 15 OLED UM535Q | |
| MSI Prestige 15 A12UD-093 | |
| Dell XPS 15 9500 Core i7 4K UHD | |
| CrossMark / Overall | |
| Dell XPS 15 9530 RTX 4070 | |
| Medio Intel Core i7-13700H, NVIDIA GeForce RTX 4070 Laptop GPU (1768 - 2073, n=6) | |
| Dell XPS 15 9520 RTX 3050 Ti | |
| MSI Prestige 15 A12UD-093 | |
| Asus Zenbook Pro 15 OLED UM535Q | |
| CrossMark / Productivity | |
| Dell XPS 15 9520 RTX 3050 Ti | |
| Medio Intel Core i7-13700H, NVIDIA GeForce RTX 4070 Laptop GPU (1645 - 2006, n=6) | |
| Dell XPS 15 9530 RTX 4070 | |
| MSI Prestige 15 A12UD-093 | |
| Asus Zenbook Pro 15 OLED UM535Q | |
| CrossMark / Creativity | |
| Dell XPS 15 9530 RTX 4070 | |
| Medio Intel Core i7-13700H, NVIDIA GeForce RTX 4070 Laptop GPU (1936 - 2137, n=6) | |
| Dell XPS 15 9520 RTX 3050 Ti | |
| MSI Prestige 15 A12UD-093 | |
| Asus Zenbook Pro 15 OLED UM535Q | |
| CrossMark / Responsiveness | |
| Dell XPS 15 9520 RTX 3050 Ti | |
| Medio Intel Core i7-13700H, NVIDIA GeForce RTX 4070 Laptop GPU (1451 - 2202, n=6) | |
| Dell XPS 15 9530 RTX 4070 | |
| MSI Prestige 15 A12UD-093 | |
| Asus Zenbook Pro 15 OLED UM535Q | |
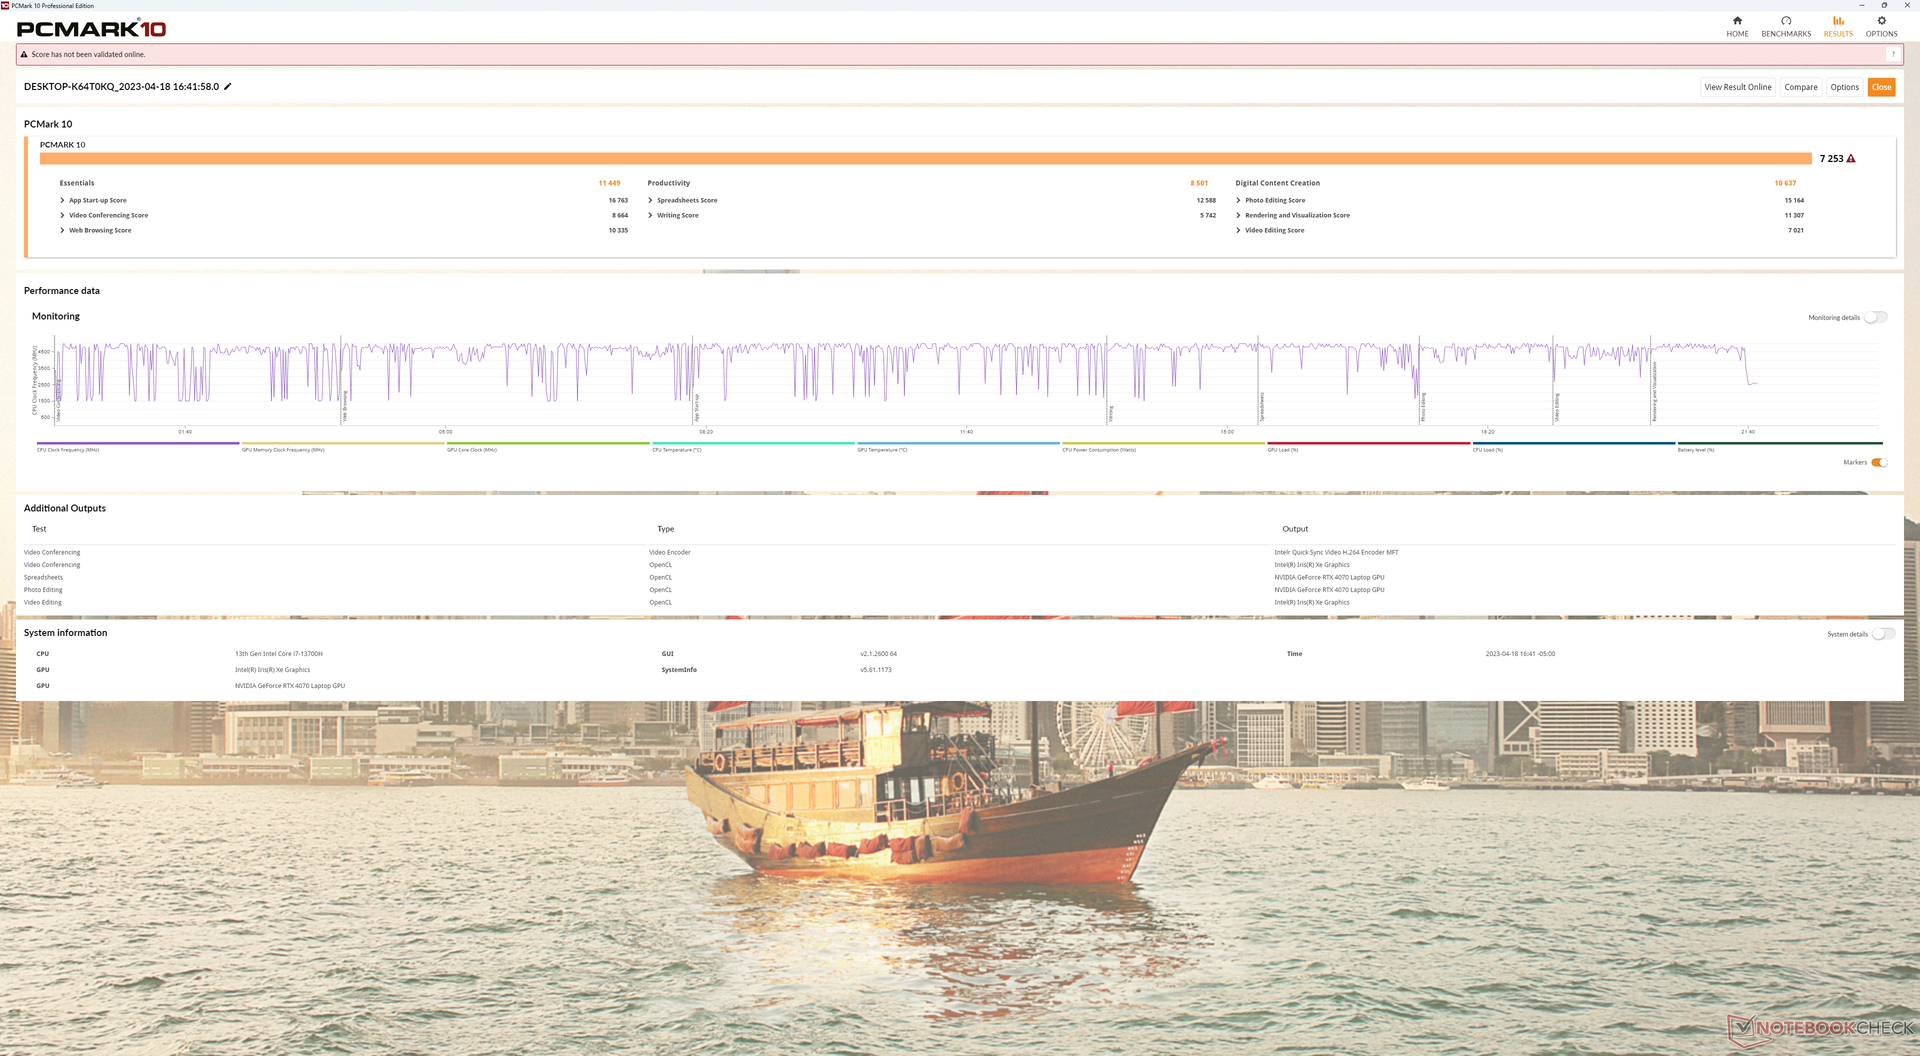
| PCMark 10 Score | 7253 puntos | |
ayuda | ||
| AIDA64 / Memory Copy | |
| Dell XPS 15 9530 RTX 4070 | |
| MSI Prestige 15 A12UD-093 | |
| Medio Intel Core i7-13700H (24334 - 78081, n=29) | |
| Dell XPS 15 9520 RTX 3050 Ti | |
| Asus Zenbook Pro 15 OLED UM535Q | |
| Dell XPS 15 9500 Core i7 4K UHD | |
| AIDA64 / Memory Read | |
| Dell XPS 15 9530 RTX 4070 | |
| Medio Intel Core i7-13700H (23681 - 79656, n=29) | |
| MSI Prestige 15 A12UD-093 | |
| Dell XPS 15 9520 RTX 3050 Ti | |
| Asus Zenbook Pro 15 OLED UM535Q | |
| Dell XPS 15 9500 Core i7 4K UHD | |
| AIDA64 / Memory Write | |
| Medio Intel Core i7-13700H (22986 - 99898, n=29) | |
| Dell XPS 15 9530 RTX 4070 | |
| MSI Prestige 15 A12UD-093 | |
| Dell XPS 15 9520 RTX 3050 Ti | |
| Asus Zenbook Pro 15 OLED UM535Q | |
| Dell XPS 15 9500 Core i7 4K UHD | |
| AIDA64 / Memory Latency | |
| Dell XPS 15 9520 RTX 3050 Ti | |
| MSI Prestige 15 A12UD-093 | |
| Asus Zenbook Pro 15 OLED UM535Q | |
| Medio Intel Core i7-13700H (82.4 - 136.8, n=29) | |
| Dell XPS 15 9530 RTX 4070 | |
| Dell XPS 15 9500 Core i7 4K UHD | |
| Gigabyte Aero 15 OLED XD | |
* ... más pequeño es mejor
Latencia del CPD
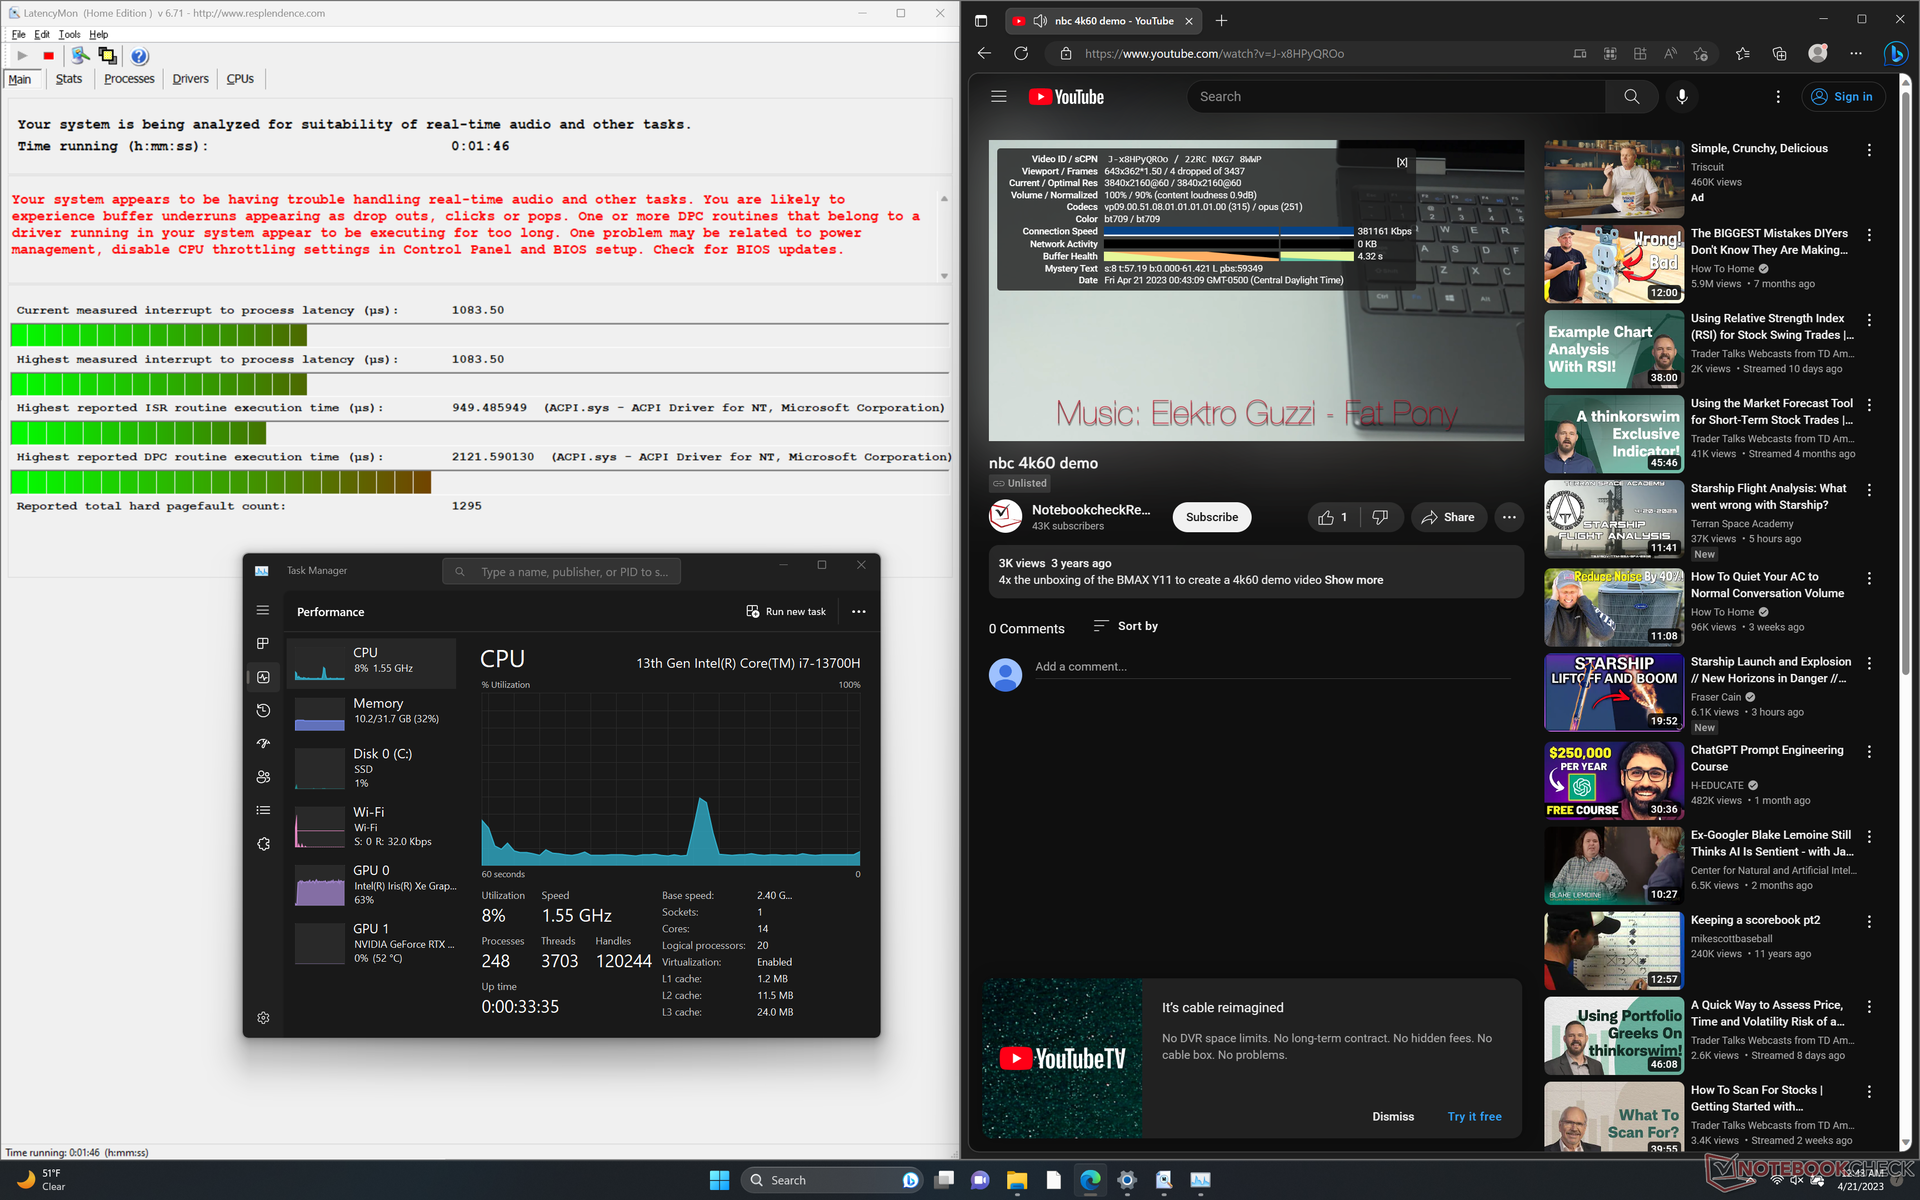
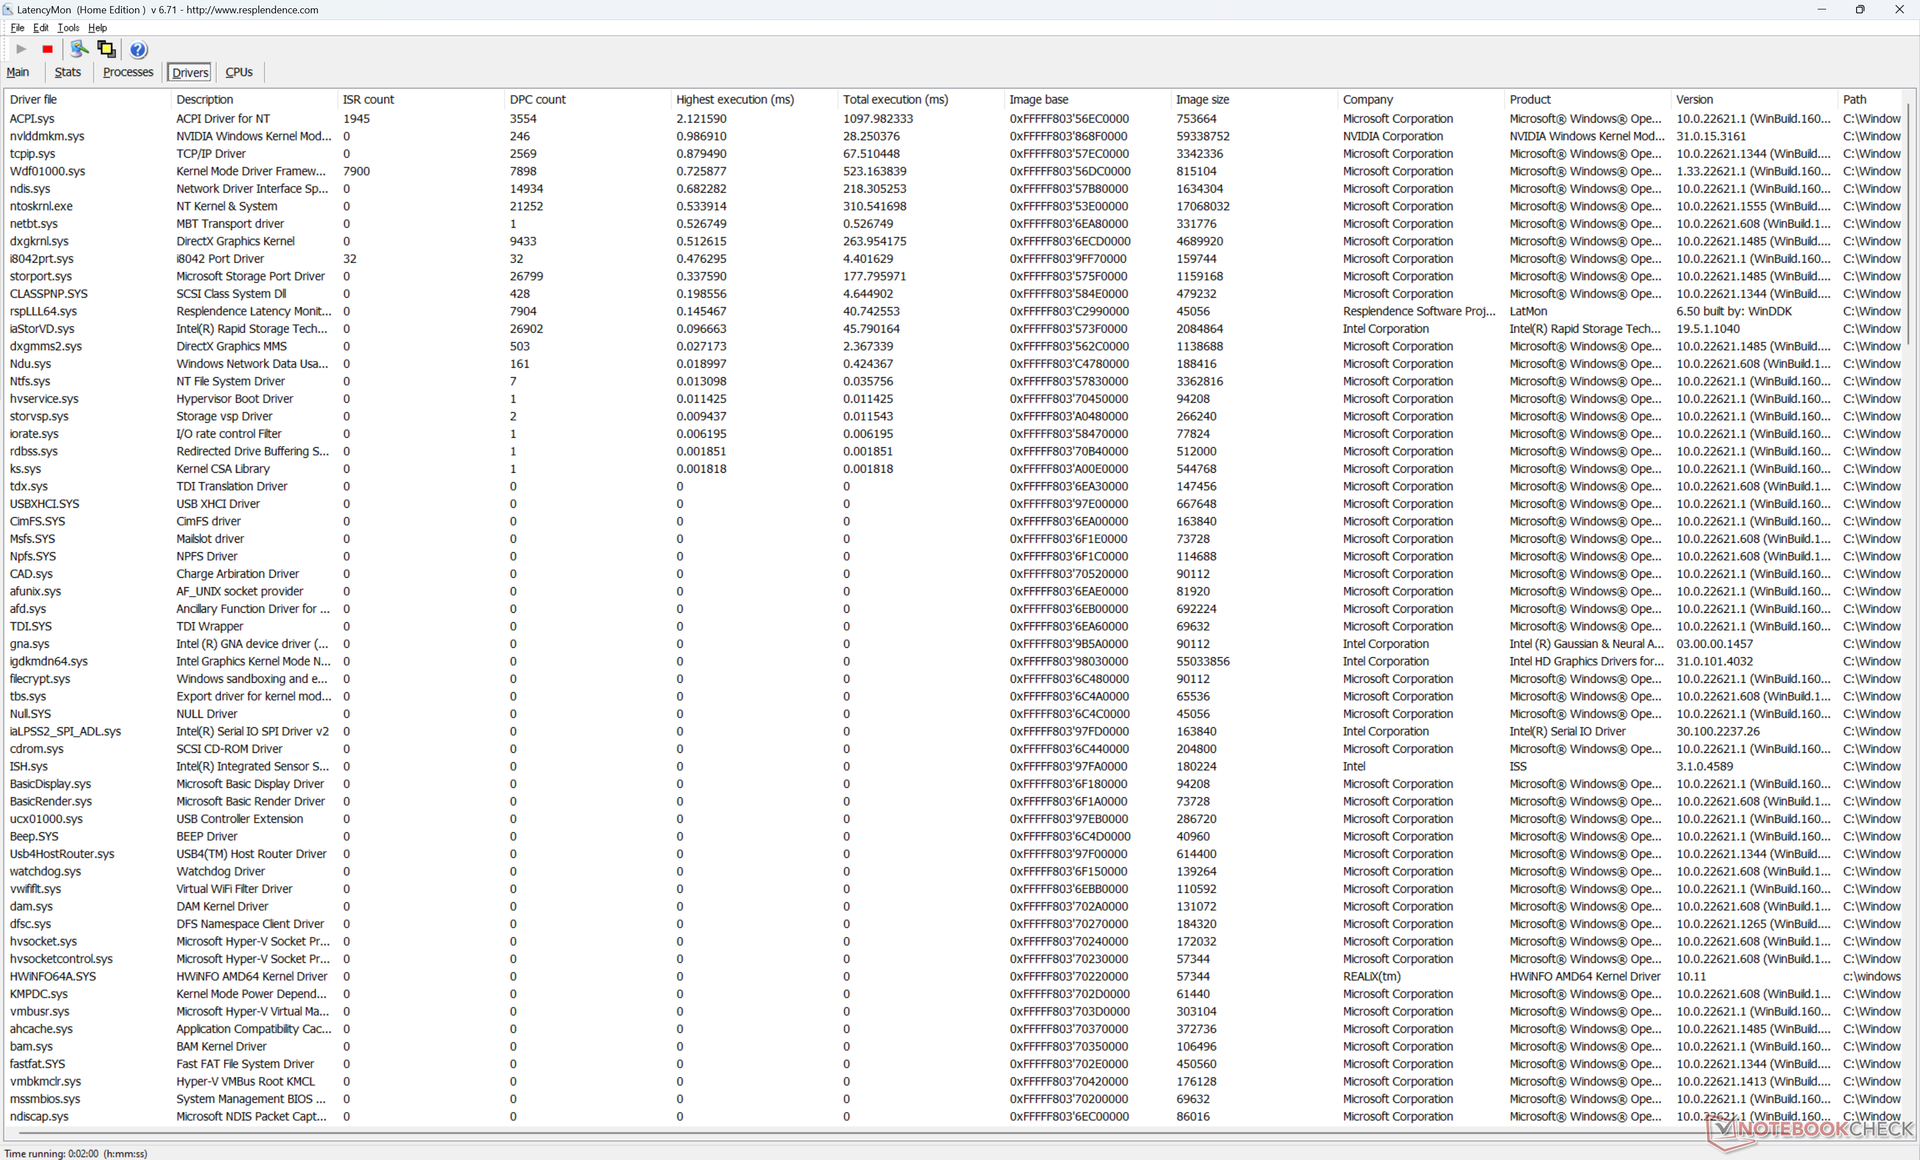
LatencyMon revela problemas de CPD al abrir varias pestañas de nuestra página de inicio. la reproducción de vídeo 4K60 también es imperfecta, con 4 fotogramas perdidos durante nuestro vídeo de prueba de un minuto.
| DPC Latencies / LatencyMon - interrupt to process latency (max), Web, Youtube, Prime95 | |
| Dell XPS 15 9500 Core i7 4K UHD | |
| MSI Prestige 15 A12UD-093 | |
| Dell XPS 15 9530 RTX 4070 | |
| Dell XPS 15 9520 RTX 3050 Ti | |
| Gigabyte Aero 15 OLED XD | |
| Asus Zenbook Pro 15 OLED UM535Q | |
* ... más pequeño es mejor
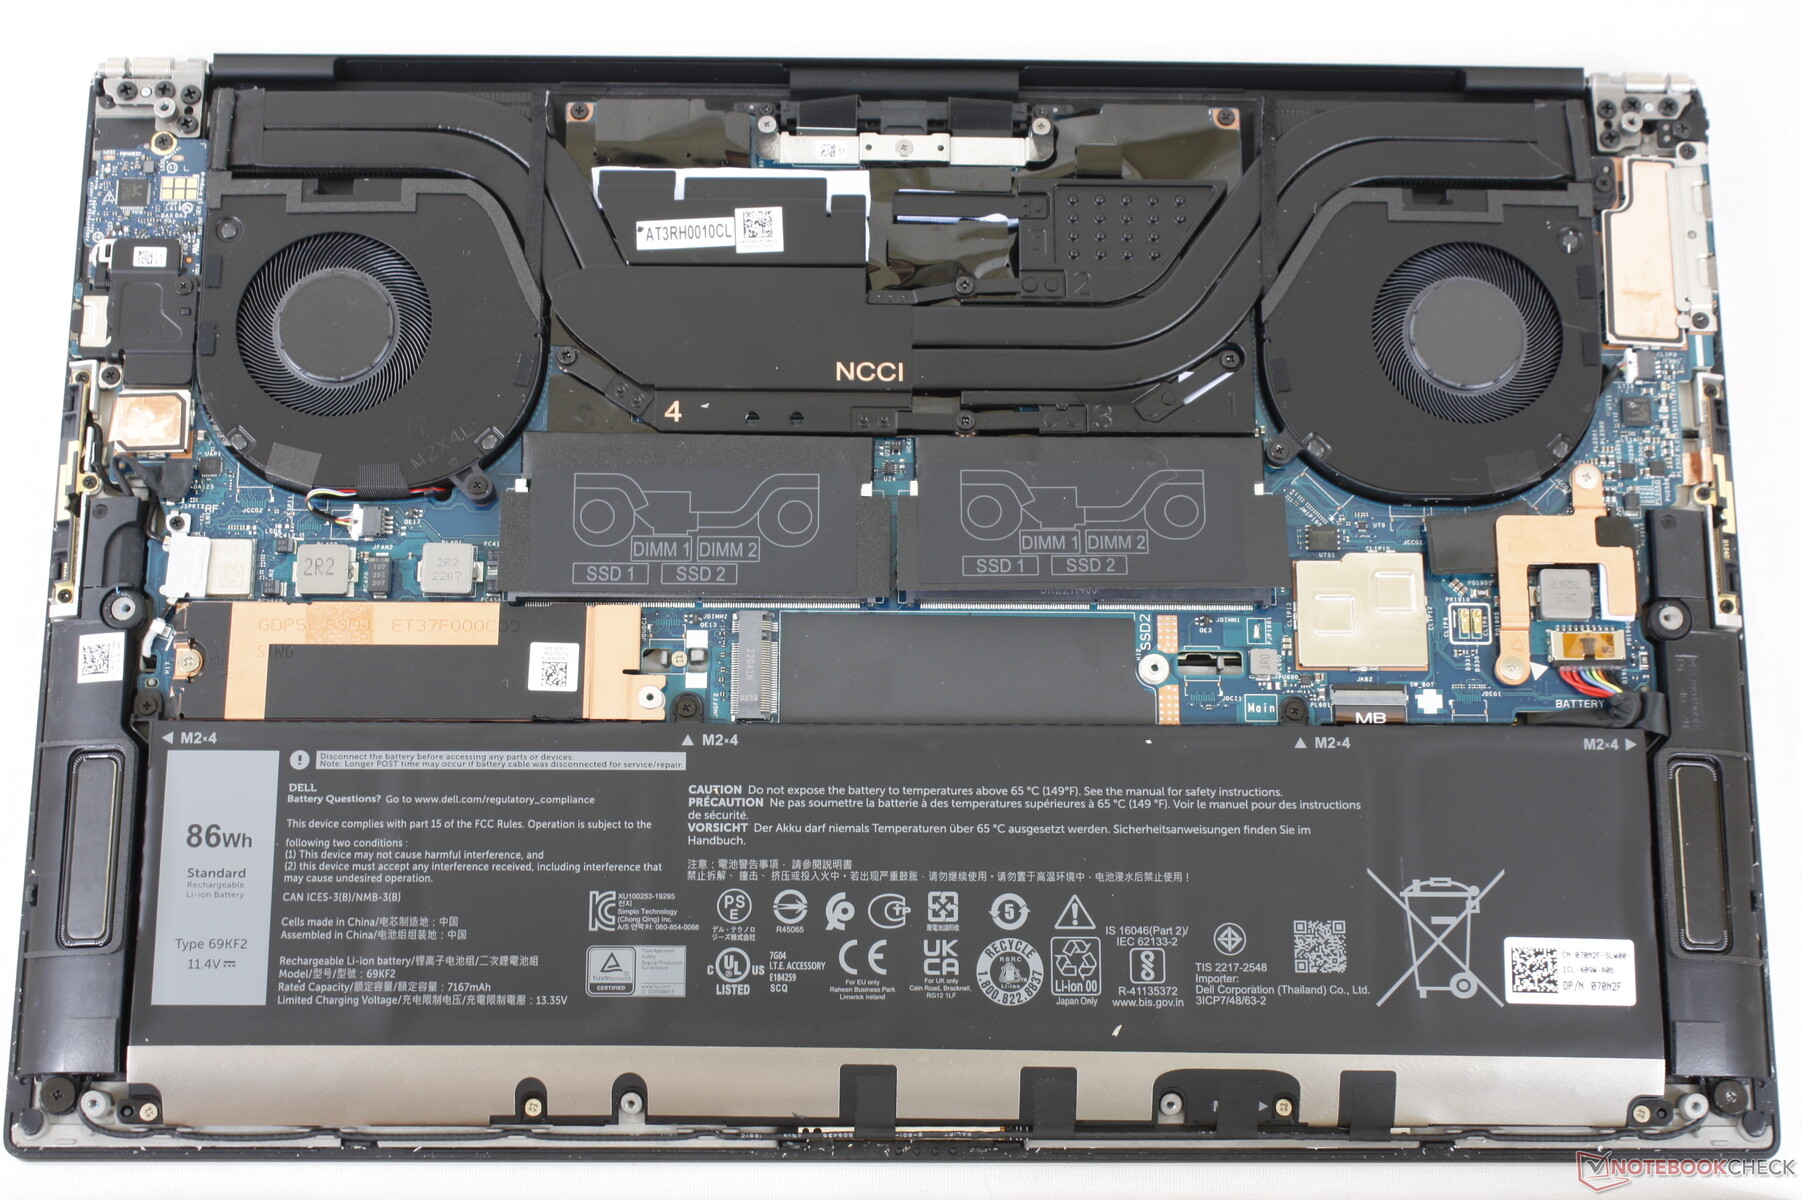
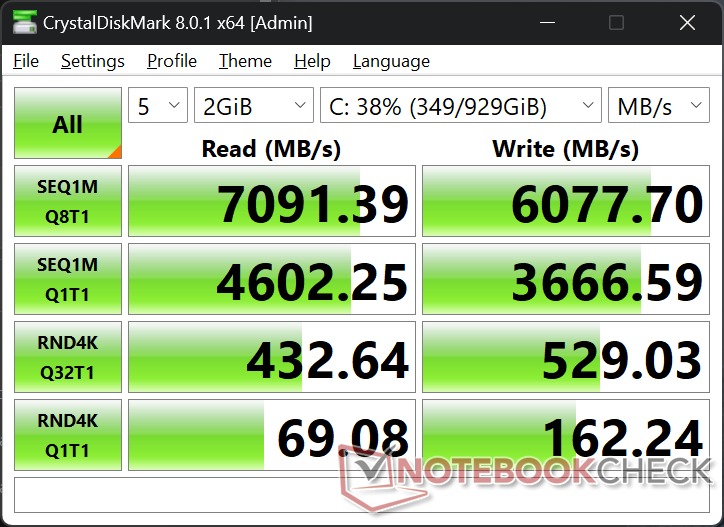
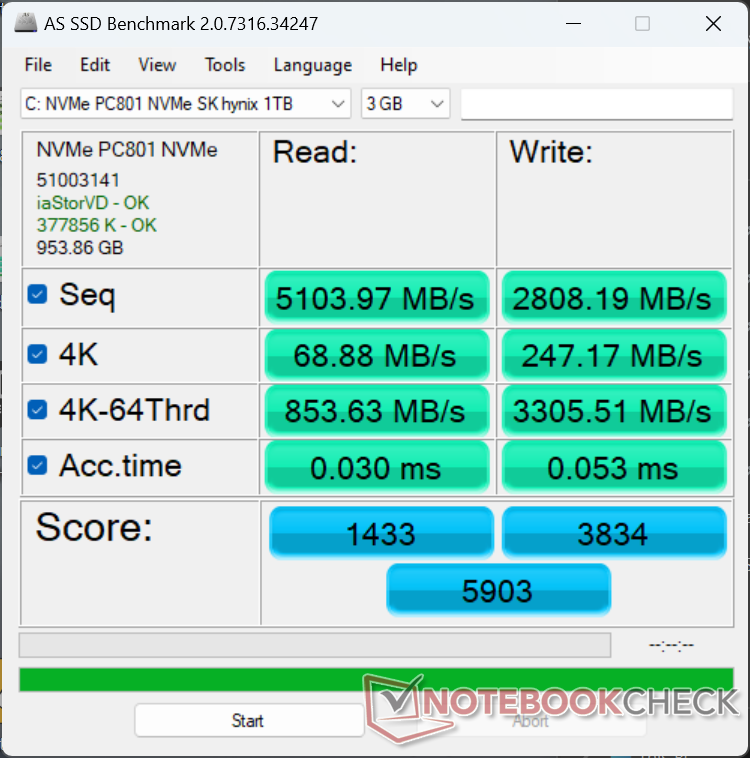
Dispositivos de almacenamiento: hasta dos unidades PCIe4
Nuestra unidad de prueba lleva un SK Hynix PC801 PCIe4 x4 NVMe en vez del WD SN810 de nuestro antiguo XPS 15 9510. El rendimiento es comparable en general entre los dos SSDs, pero quedan por detrás del popular Samsung PM9A1.
La sostenibilidad del rendimiento es excelente sin ralentización bajo estrés. Es una pena que los SSDs PCIe5 no se ofrezcan en la caja.

| Drive Performance rating - Percent | |
| Gigabyte Aero 15 OLED XD | |
| Dell XPS 15 9530 RTX 4070 | |
| Dell XPS 15 9520 RTX 3050 Ti | |
| MSI Prestige 15 A12UD-093 | |
| Asus Zenbook Pro 15 OLED UM535Q | |
| Dell XPS 15 9500 Core i7 4K UHD | |
* ... más pequeño es mejor
Disk Throttling: DiskSpd Read Loop, Queue Depth 8
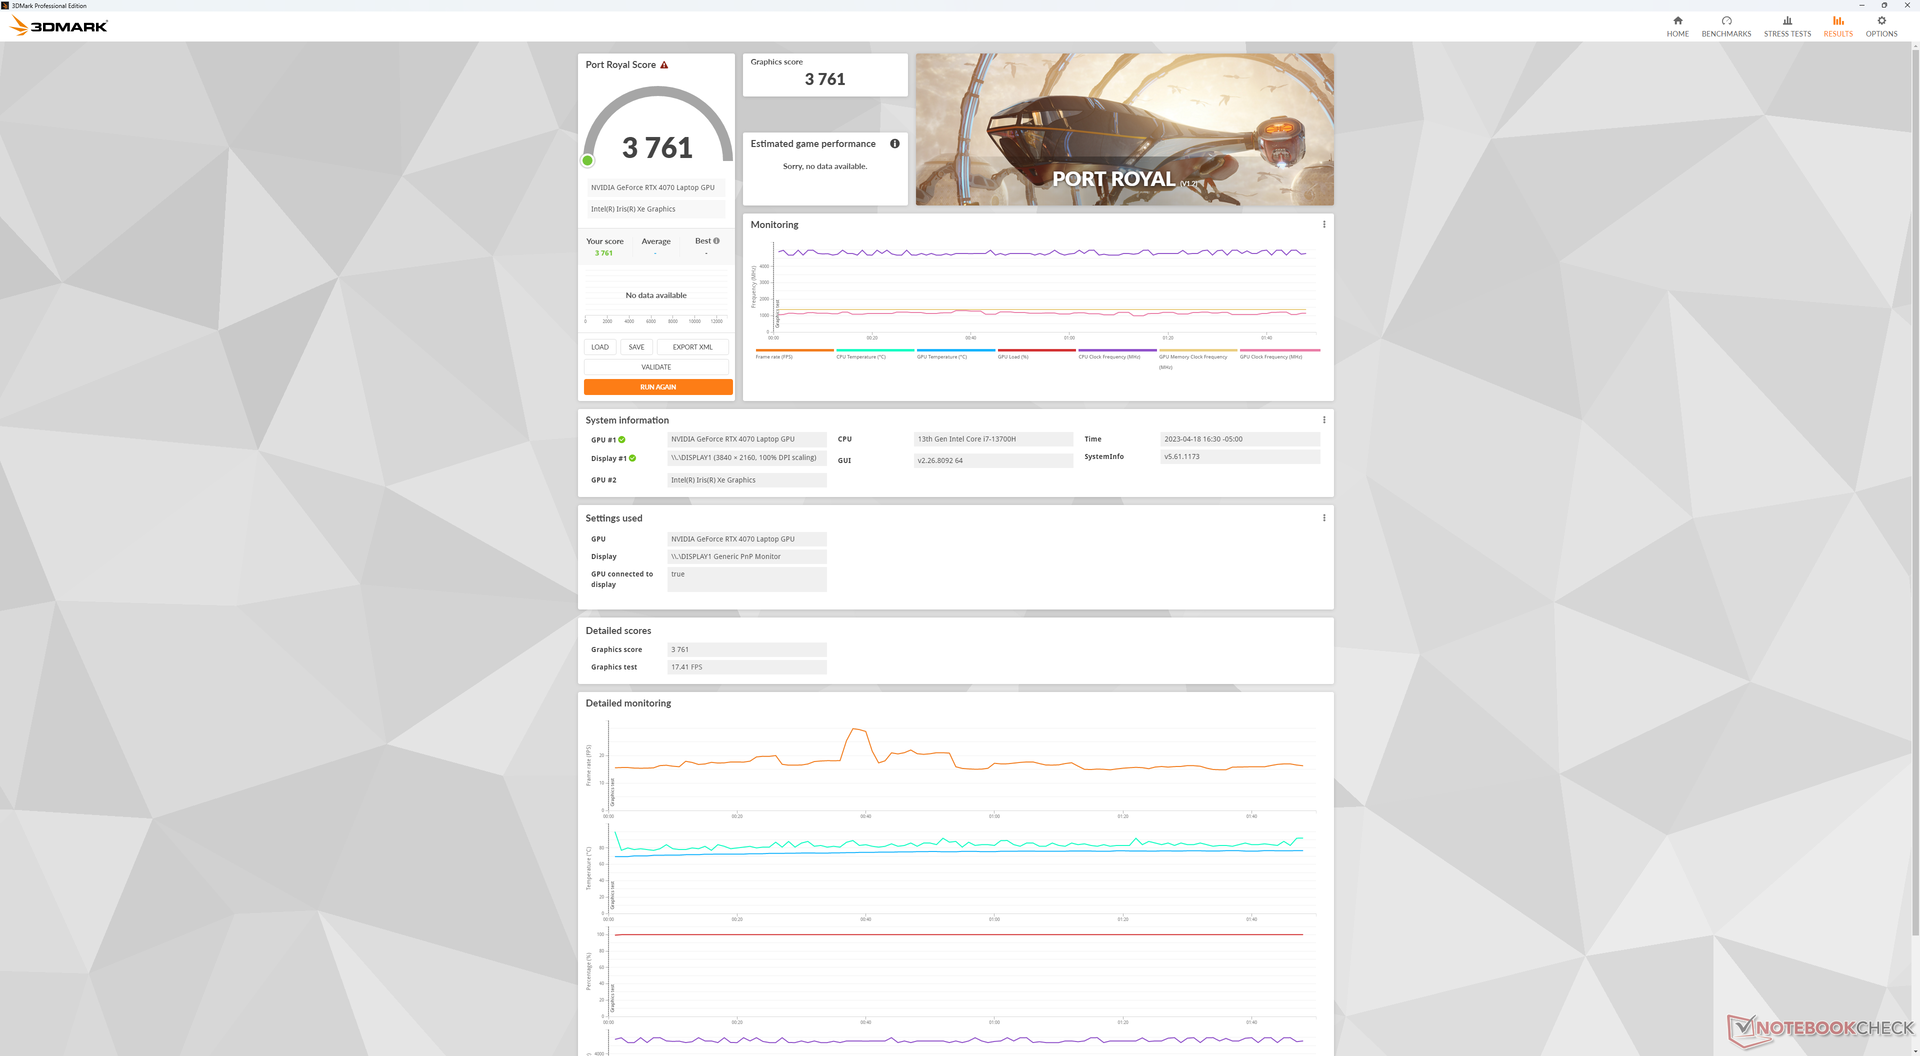
Rendimiento de la GPU: la mitad de TGP equivale a la mitad de potencia
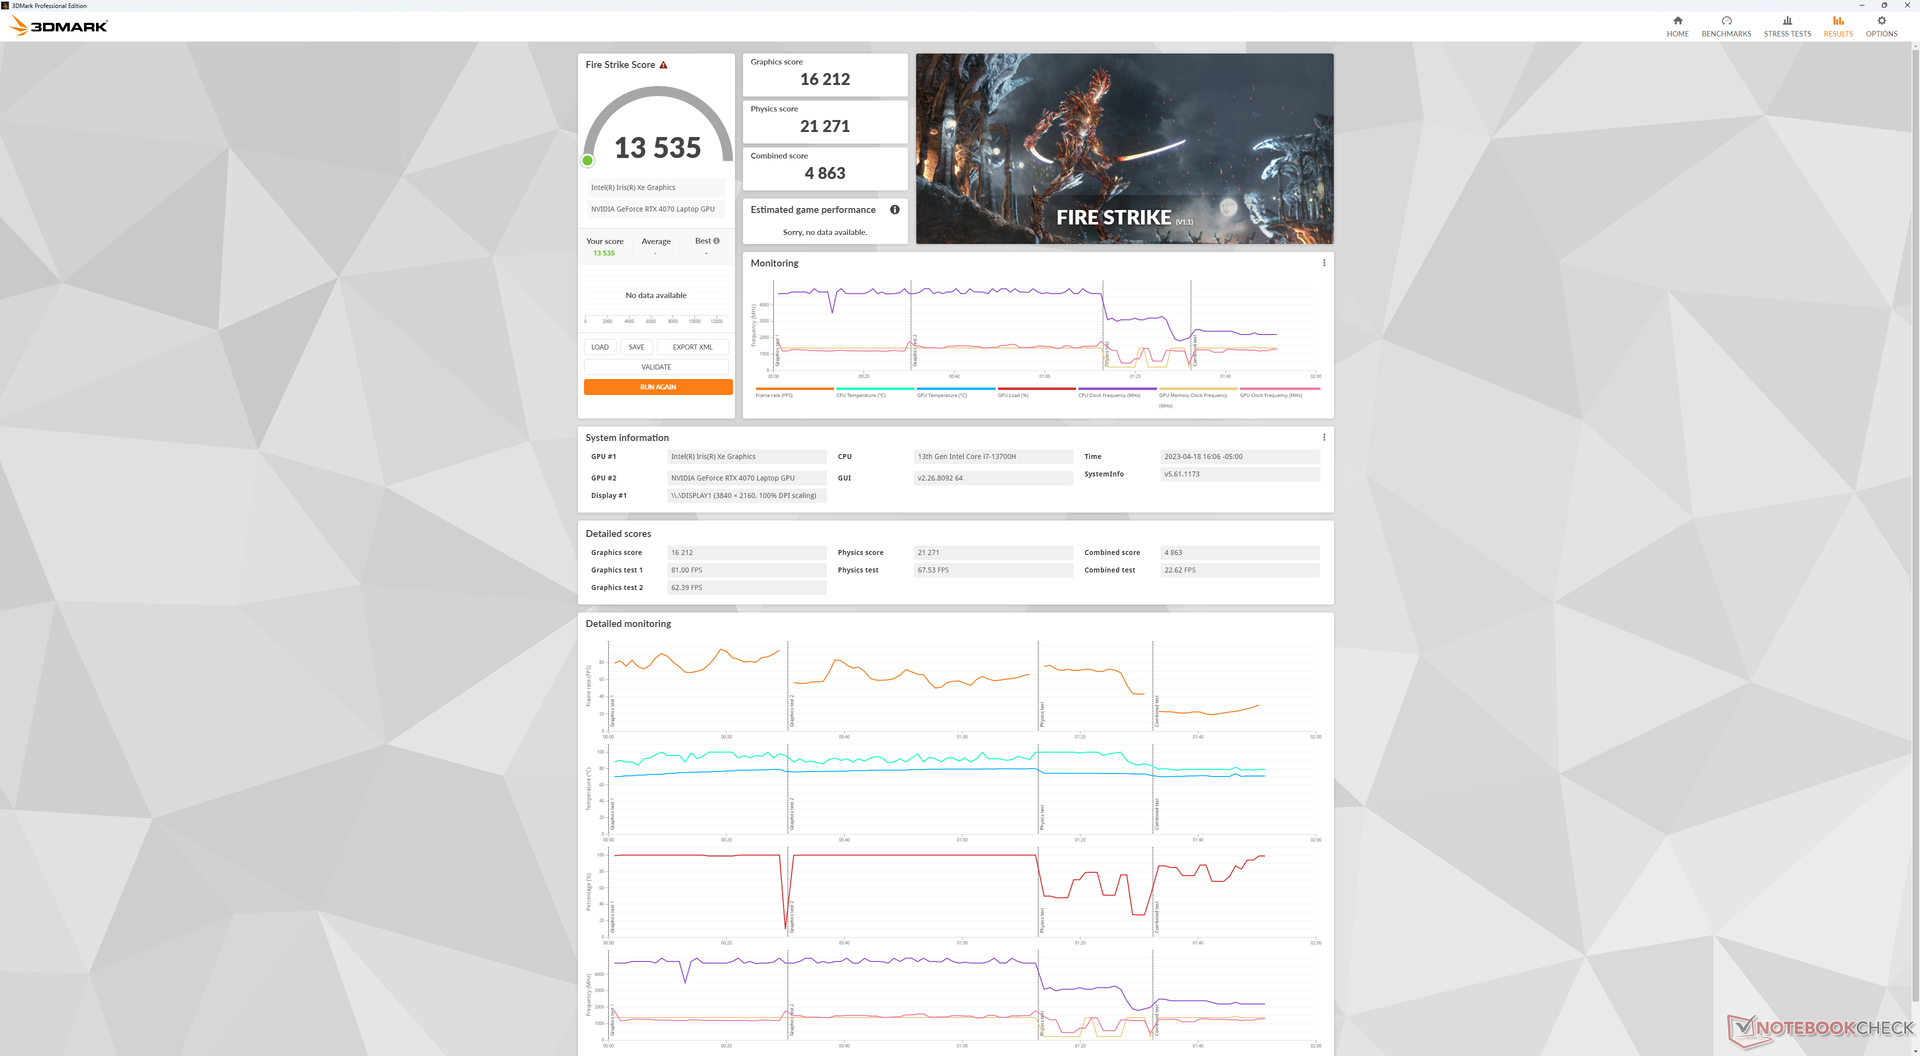
Obviamente, el rendimiento gráfico debería ser más lento que el del portátil "medio" GeForce RTX 4070 debido al bajo objetivo de 50 W TGP del XPS 15, pero no teníamos ni idea de por cuánto. Ahora que tenemos una unidad de pruebas en la mano, el déficit puede ser bastante sorprendente de hasta un 40 a 50 por ciento más lento que la media de nuestra base de datos según los benchmarks 3DMark. Es tan malo que incluso un portátil RTX 2070 de hace cuatro años como el HP Omen 15 puede rendir casi lo mismo que nuestro más caro RTX 4070 XPS 15. Si pretendes jugar a muchos juegos, entonces el XPS 15 se convierte en una propuesta de valor pobre.
La buena noticia es que el rendimiento gráfico sigue siendo superior al de la RTX 3050 Ti del XPS 15 9520 del año pasado en un 30-35%. Por lo tanto, hay una apreciable mejora año tras año a pesar de que esta es fácilmente una de las iteraciones más lentas de la RTX 4070 móvil que hemos visto.
Curiosamente, la aceleración gráfica al ejecutar herramientas de software 3D es mucho más rápida de lo esperado en relación con la TGP de 50 W. Blender Classroom con aceleración CUDA, por ejemplo, se completaría en sólo 46 segundos, lo que es sólo un 25 por ciento más lento que la media de portátiles RTX 4070 en los que los TGP de 100 W o más son típicos. La RTX 3050 Ti más antigua tardaría casi 2,5 veces más en la misma prueba. Por tanto, los creadores de contenidos serán los más beneficiados al elegir el XPS 15 2023 en lugar de los modelos más antiguos.
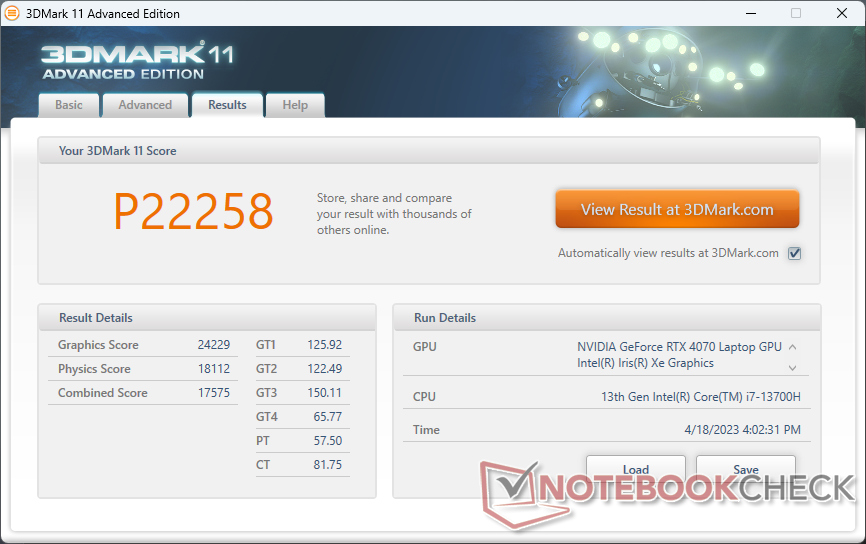
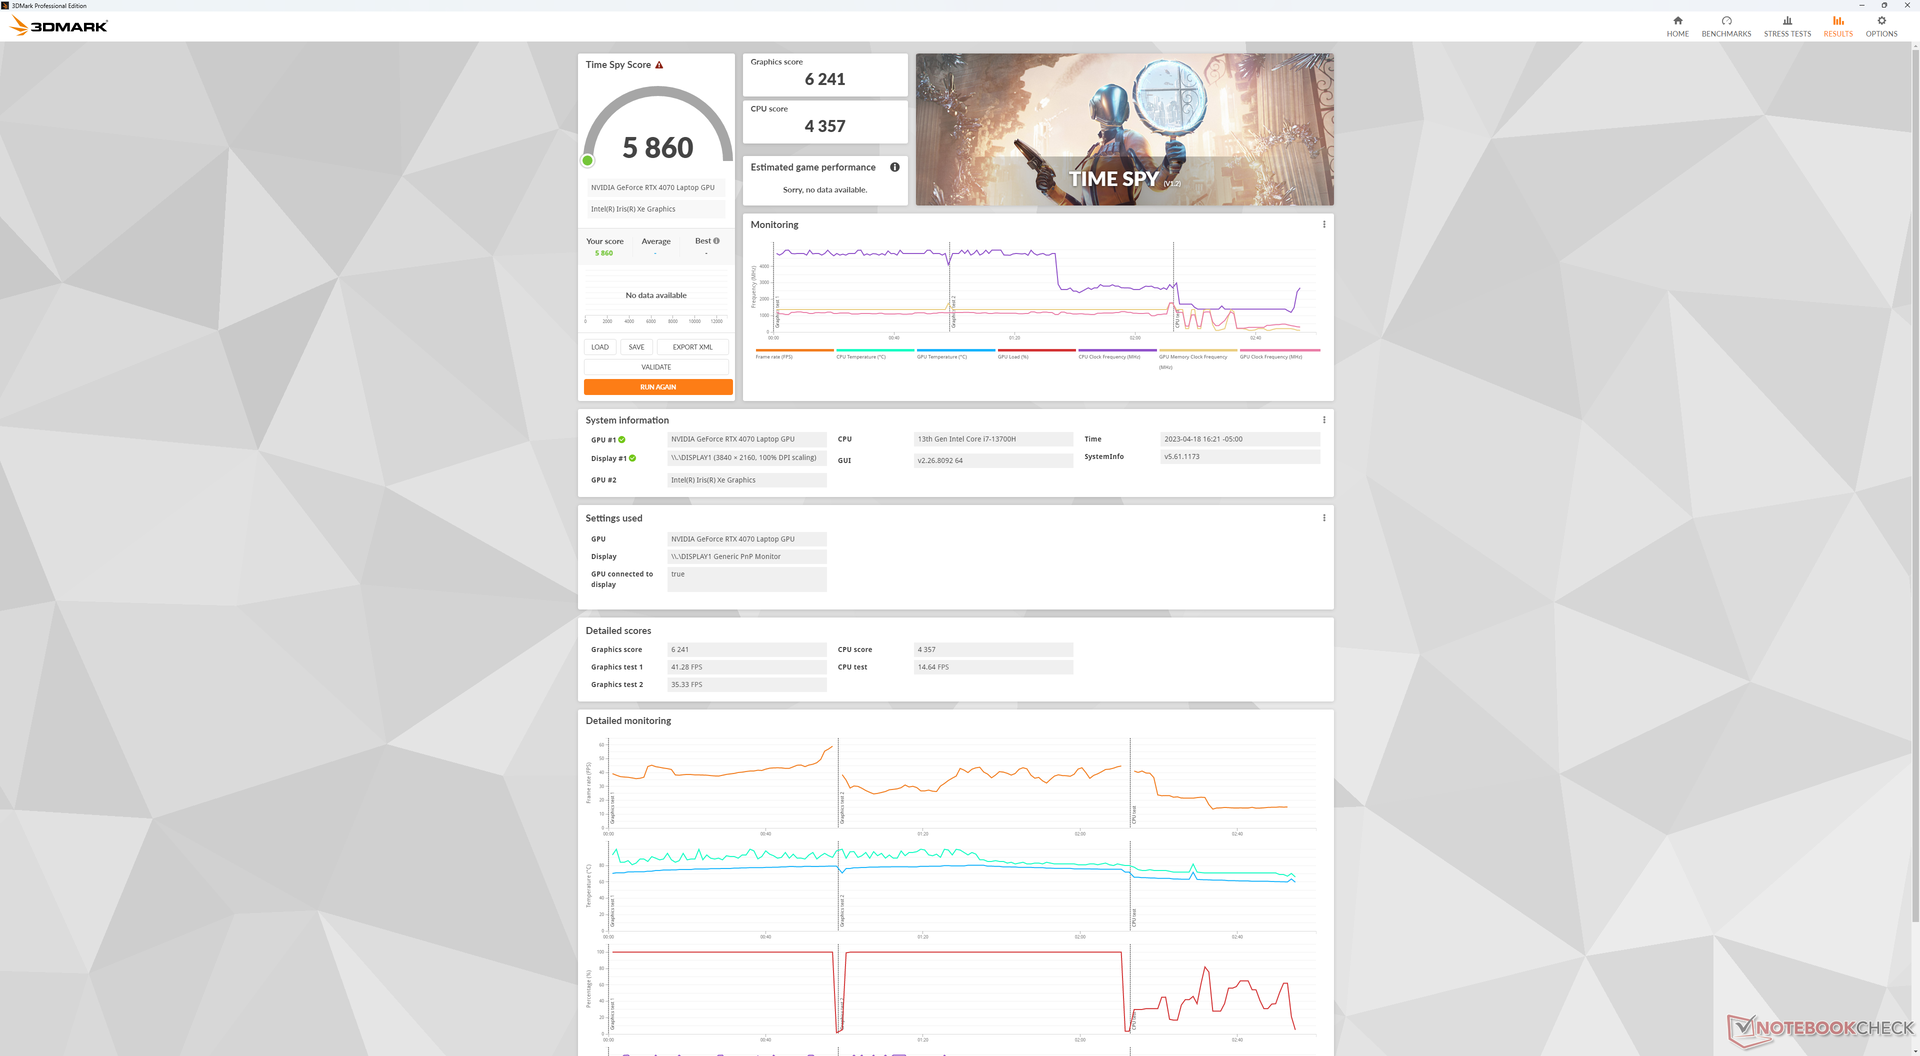
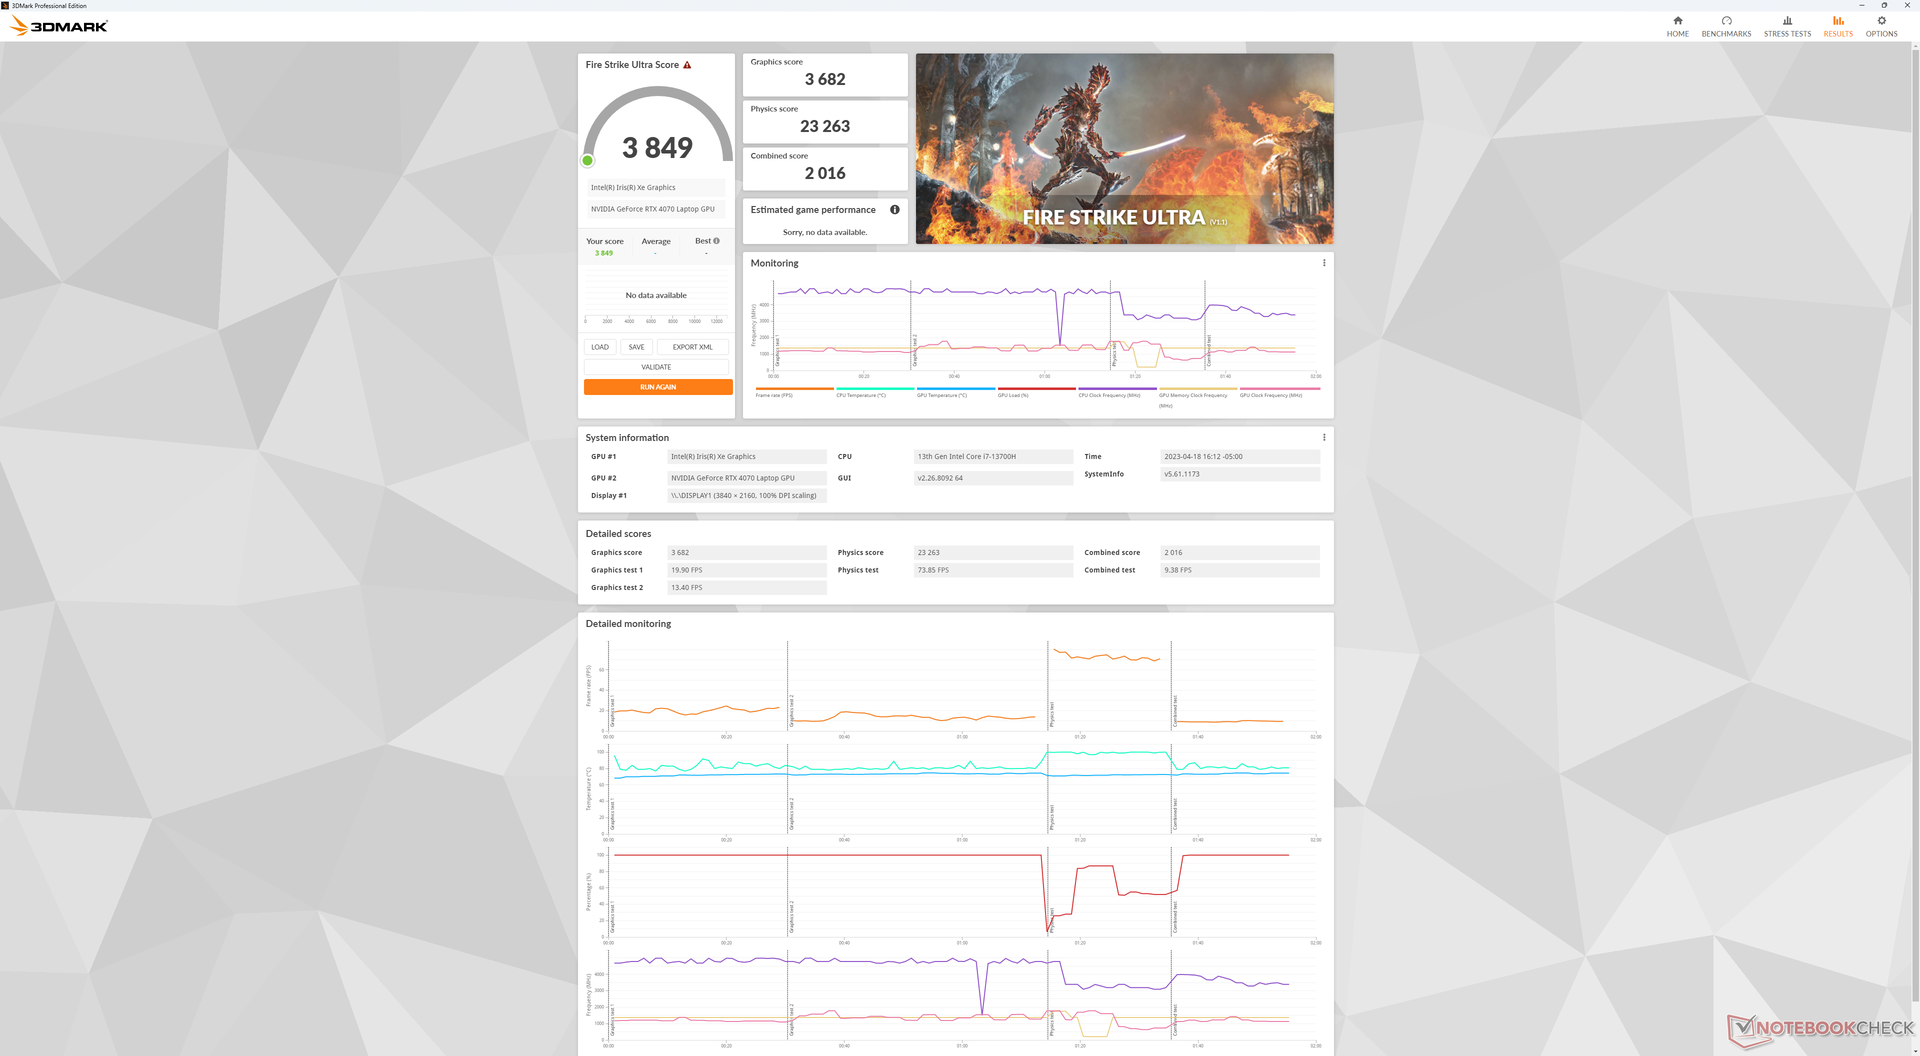
| 3DMark 11 Performance | 22258 puntos | |
| 3DMark Fire Strike Score | 13535 puntos | |
| 3DMark Time Spy Score | 5860 puntos | |
ayuda | ||
| Blender | |
| v3.3 Classroom OPTIX/RTX | |
| MSI Prestige 15 A12UD-093 | |
| Dell XPS 15 9530 RTX 4070 | |
| Medio NVIDIA GeForce RTX 4070 Laptop GPU (18 - 30, n=68) | |
| v3.3 Classroom CUDA | |
| MSI Prestige 15 A12UD-093 | |
| Dell XPS 15 9530 RTX 4070 | |
| Medio NVIDIA GeForce RTX 4070 Laptop GPU (32 - 50, n=67) | |
| v3.3 Classroom CPU | |
| MSI Prestige 15 A12UD-093 | |
| Dell XPS 15 9530 RTX 4070 | |
| Medio NVIDIA GeForce RTX 4070 Laptop GPU (158 - 440, n=67) | |
* ... más pequeño es mejor
Rendimiento en juegos
A pesar del decepcionante rendimiento de la RTX 4070 mencionado anteriormente, el sistema puede ejecutar cualquier título actual con ajustes medios-altos a 1080p y 60 FPS. Sin embargo, a más velocidad, la GPU empieza a tener problemas. Los títulos más exigentes, como Cyberpunk 2077 o Returnal , caen hasta los 40 FPS si la configuración es superior a media, lo que provoca un notable tearing de pantalla sin la ayuda de G-Sync. La mayoría de juegos, aparte de los multijugador poco exigentes como DOTA 2, apenas pueden ejecutarse en la resolución nativa de 3.5K.
Además, el rendimiento puede ser inestable cuando se juega. Las velocidades de fotogramas en reposo en Witcher 3 bajaban periódicamente de 50 FPS a 40 FPS antes de volver a subir a 50 FPS sin motivo aparente. Este comportamiento sugiere una mala priorización de las actividades en segundo plano.
Otra desventaja desafortunada es que las velocidades de fotogramas en configuraciones muy bajas a veces pueden ser más lentas que las velocidades de fotogramas en configuraciones más altas. Esto se observó al ejecutar Cyberpunk 2077 y Returnal en configuraciones bajas de 1080p, donde las velocidades de fotogramas eran consistentemente más lentas que en configuraciones medias de 1080p, incluso después de repetir las pruebas. Este comportamiento sugiere una limitación de la fuente de alimentación y la consiguiente lucha de potencia entre la CPU y la GPU cuando ambas están bajo tensión.
| The Witcher 3 - 1920x1080 Ultra Graphics & Postprocessing (HBAO+) | |
| Asus Zephyrus Duo 16 GX650PY-NM006W | |
| Uniwill GM6PX7X RTX 4070 | |
| Alienware x15 R2 P111F | |
| Gigabyte Aero 15 OLED XD | |
| Dell XPS 15 9530 RTX 4070 | |
| MSI Stealth 15M A11SEK | |
| Dell XPS 15 9500 Core i7 4K UHD | |
| Dell XPS 15 9520 RTX 3050 Ti | |
| GTA V - 1920x1080 Highest AA:4xMSAA + FX AF:16x | |
| Asus Zephyrus Duo 16 GX650PY-NM006W | |
| Uniwill GM6PX7X RTX 4070 | |
| Gigabyte Aero 15 OLED XD | |
| MSI Stealth 15M A11SEK | |
| Dell XPS 15 9530 RTX 4070 | |
| Dell XPS 15 9520 RTX 3050 Ti | |
| Final Fantasy XV Benchmark - 1920x1080 High Quality | |
| Asus Zephyrus Duo 16 GX650PY-NM006W | |
| Uniwill GM6PX7X RTX 4070 | |
| Alienware x15 R2 P111F | |
| Gigabyte Aero 15 OLED XD | |
| Dell XPS 15 9530 RTX 4070 | |
| MSI Stealth 15M A11SEK | |
| Dell XPS 15 9520 RTX 3050 Ti | |
| Strange Brigade - 1920x1080 ultra AA:ultra AF:16 | |
| Asus Zephyrus Duo 16 GX650PY-NM006W | |
| Uniwill GM6PX7X RTX 4070 | |
| Alienware x15 R2 P111F | |
| Gigabyte Aero 15 OLED XD | |
| Dell XPS 15 9530 RTX 4070 | |
| MSI Stealth 15M A11SEK | |
| Dell XPS 15 9520 RTX 3050 Ti | |
| Returnal | |
| 1920x1080 Low Preset | |
| Medio NVIDIA GeForce RTX 4070 Laptop GPU (65 - 119, n=11) | |
| Dell XPS 15 9530 RTX 4070 | |
| 1920x1080 Medium Preset | |
| Medio NVIDIA GeForce RTX 4070 Laptop GPU (69 - 117, n=12) | |
| Dell XPS 15 9530 RTX 4070 | |
| 1920x1080 High Preset | |
| Medio NVIDIA GeForce RTX 4070 Laptop GPU (64 - 106, n=12) | |
| Dell XPS 15 9530 RTX 4070 | |
| 1920x1080 Epic Preset | |
| Medio NVIDIA GeForce RTX 4070 Laptop GPU (54 - 90, n=12) | |
| Dell XPS 15 9530 RTX 4070 | |
| 2560x1440 Epic Preset | |
| Medio NVIDIA GeForce RTX 4070 Laptop GPU (39 - 66, n=12) | |
| Dell XPS 15 9530 RTX 4070 | |
| 3840x2160 Epic Preset | |
| Medio NVIDIA GeForce RTX 4070 Laptop GPU (21 - 39, n=8) | |
| Dell XPS 15 9530 RTX 4070 | |
Witcher 3 FPS Chart
| bajo | medio | alto | ultra | QHD | 4K | |
|---|---|---|---|---|---|---|
| GTA V (2015) | 180 | 168.1 | 134.3 | 63.5 | 52.9 | 53 |
| The Witcher 3 (2015) | 354.2 | 233.3 | 123.9 | 69.8 | 47 | 26.5 |
| Dota 2 Reborn (2015) | 189.5 | 163.1 | 147.6 | 137 | 88.4 | |
| Final Fantasy XV Benchmark (2018) | 108.6 | 84 | 66 | 48.8 | 26.6 | |
| X-Plane 11.11 (2018) | 134.2 | 91.6 | 90.6 | 67.3 | ||
| Strange Brigade (2018) | 334 | 172.1 | 136.6 | 117.7 | 79.9 | 42.7 |
| Cyberpunk 2077 1.6 (2022) | 55.3 | 70 | 57.5 | 48 | 30 | 12.8 |
| Tiny Tina's Wonderlands (2022) | 98.1 | 92.5 | 74.3 | 58.6 | 49.8 | 39.2 |
| F1 22 (2022) | 155.1 | 148.5 | 123.5 | 39.2 | 10.6 | 4.7 |
| Returnal (2023) | 65 | 69 | 64 | 54 | 39 | 21 |
Emisiones
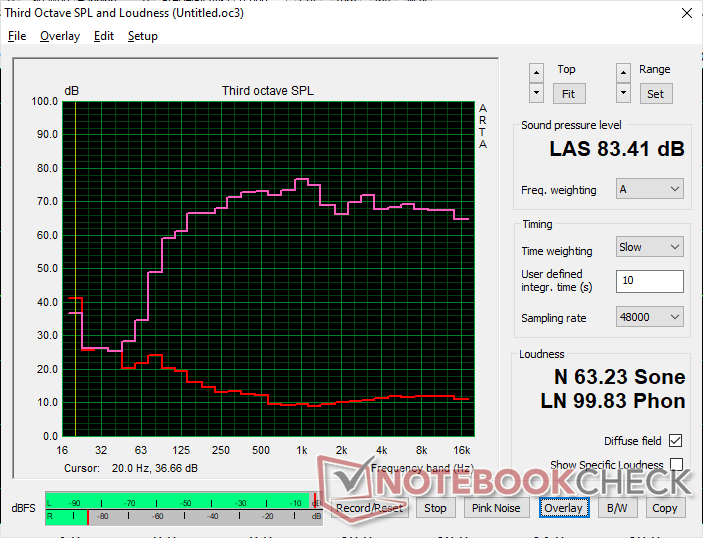
Ruido del sistema - No demasiado alto para el tamaño
El ruido del ventilador cuando se navega por Internet o se reproduce vídeo en streaming tiende a rondar los 24 dB(A) frente a un fondo silencioso de 23 dB(A) para ser casi inaudible. Introducir cargas más altas como juegos induciría un ruido de ventilador de entre 40 y 45 dB(A) que es más silencioso que el delAsus Zenbook Pro 15 oGigabyte Aero 15 bajo cargas. En general, el XPS 15 no es tan ruidoso como otros portátiles multimedia de 15" de alto rendimiento.
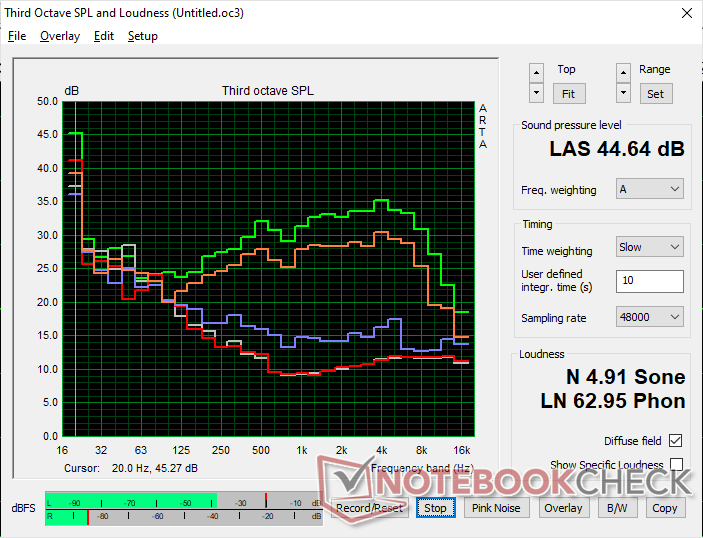
Ruido
| Ocioso |
| 23.1 / 23.1 / 24.2 dB(A) |
| Carga |
| 27.1 / 44.6 dB(A) |
 | ||
30 dB silencioso 40 dB(A) audible 50 dB(A) ruidosamente alto |
||
min: | ||
| Dell XPS 15 9530 RTX 4070 GeForce RTX 4070 Laptop GPU, i7-13700H, SK hynix PC801 HFS001TEJ9X101N | Dell XPS 15 9520 RTX 3050 Ti GeForce RTX 3050 Ti Laptop GPU, i7-12700H, WDC PC SN810 512GB | Dell XPS 15 9500 Core i7 4K UHD GeForce GTX 1650 Ti Mobile, i7-10875H, SK Hynix PC611 512GB | Asus Zenbook Pro 15 OLED UM535Q GeForce RTX 3050 Ti Laptop GPU, R9 5900HX, WDC PC SN730 SDBPNTY-1T00 | MSI Prestige 15 A12UD-093 GeForce RTX 3050 Ti Laptop GPU, i7-1280P, Micron 3400 1TB MTFDKBA1T0TFH | Gigabyte Aero 15 OLED XD GeForce RTX 3070 Laptop GPU, i7-11800H, Samsung PM9A1 MZVL21T0HCLR | |
|---|---|---|---|---|---|---|
| Noise | 0% | -24% | -7% | -22% | -35% | |
| apagado / medio ambiente * (dB) | 23.1 | 22.8 1% | 28.4 -23% | 22.8 1% | 26 -13% | 25 -8% |
| Idle Minimum * (dB) | 23.1 | 22.9 1% | 28.4 -23% | 22.9 1% | 26 -13% | 30 -30% |
| Idle Average * (dB) | 23.1 | 22.9 1% | 28.4 -23% | 22.9 1% | 30.7 -33% | 32 -39% |
| Idle Maximum * (dB) | 24.2 | 22.9 5% | 28.4 -17% | 22.9 5% | 30.7 -27% | 35 -45% |
| Load Average * (dB) | 27.1 | 30.9 -14% | 46 -70% | 33.2 -23% | 41.9 -55% | 44 -62% |
| Witcher 3 ultra * (dB) | 40.1 | 37.8 6% | 42 -5% | 47.3 -18% | 51 -27% | |
| Load Maximum * (dB) | 44.6 | 44.7 -0% | 47.1 -6% | 52.8 -18% | 40.7 9% | 60 -35% |
* ... más pequeño es mejor
Temperatura
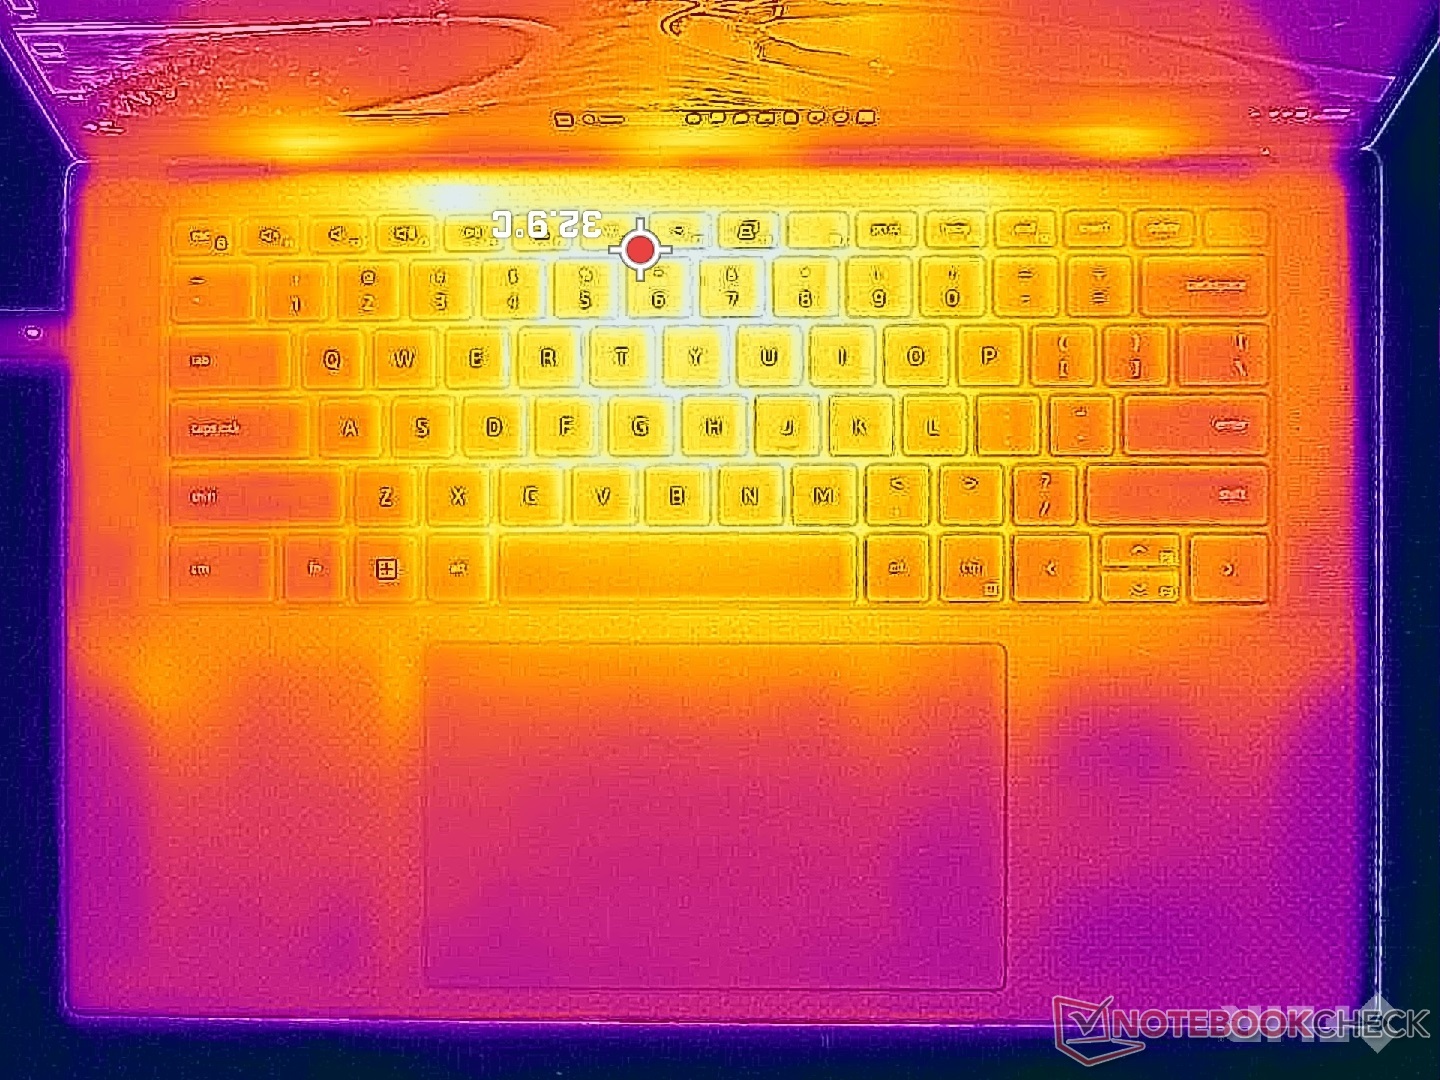
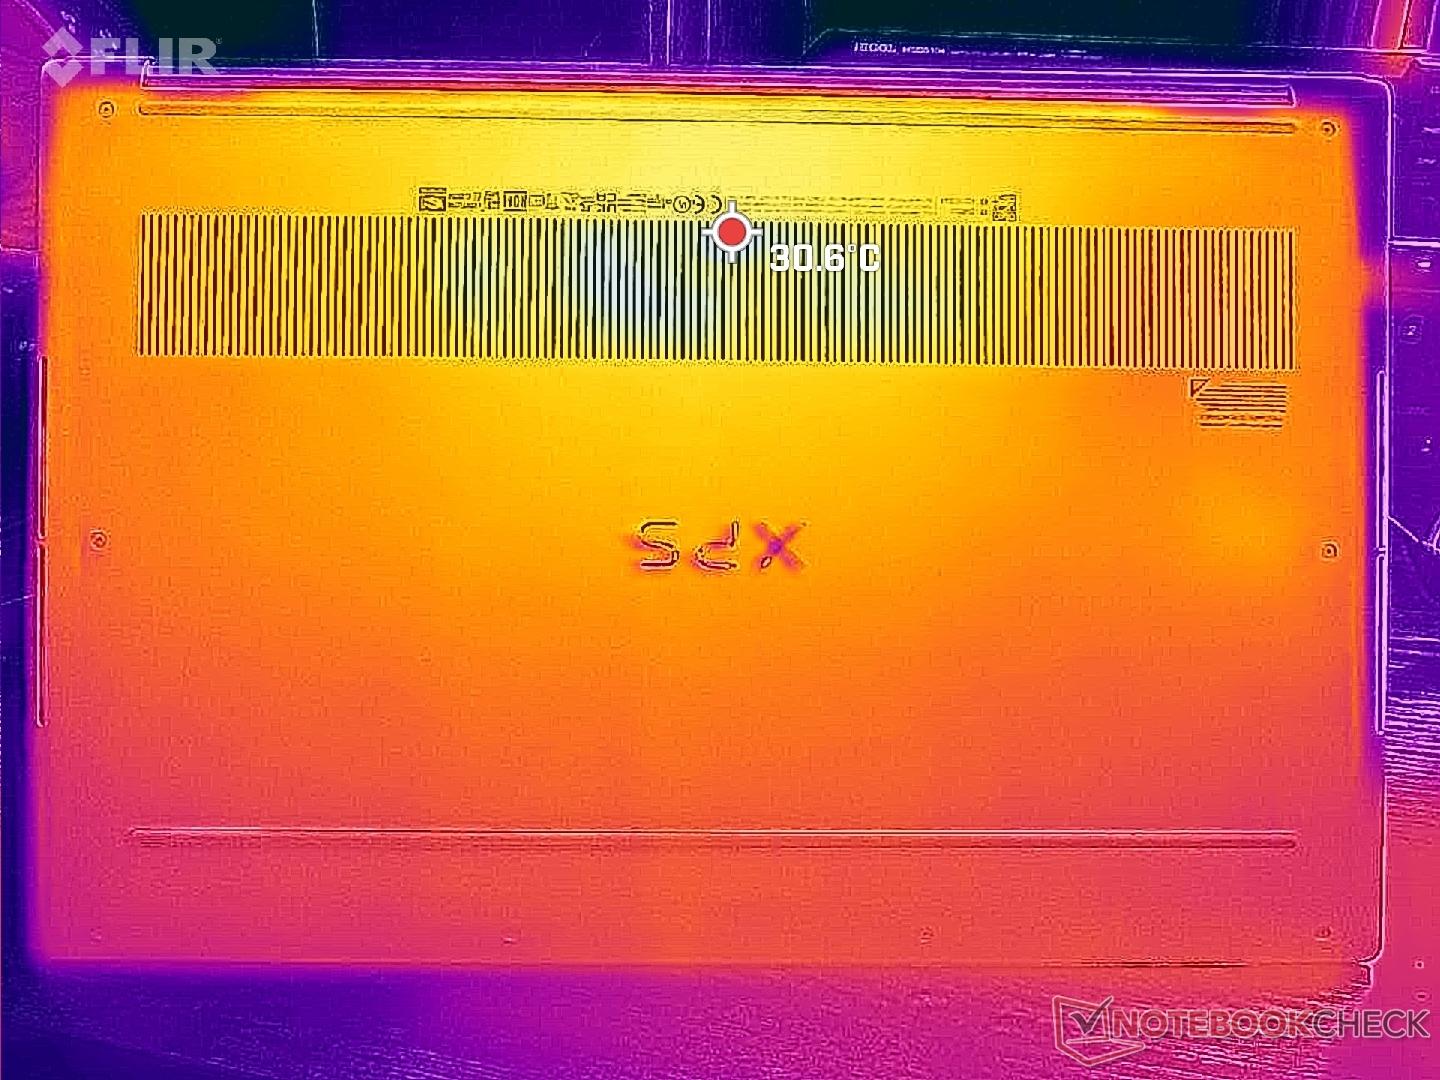
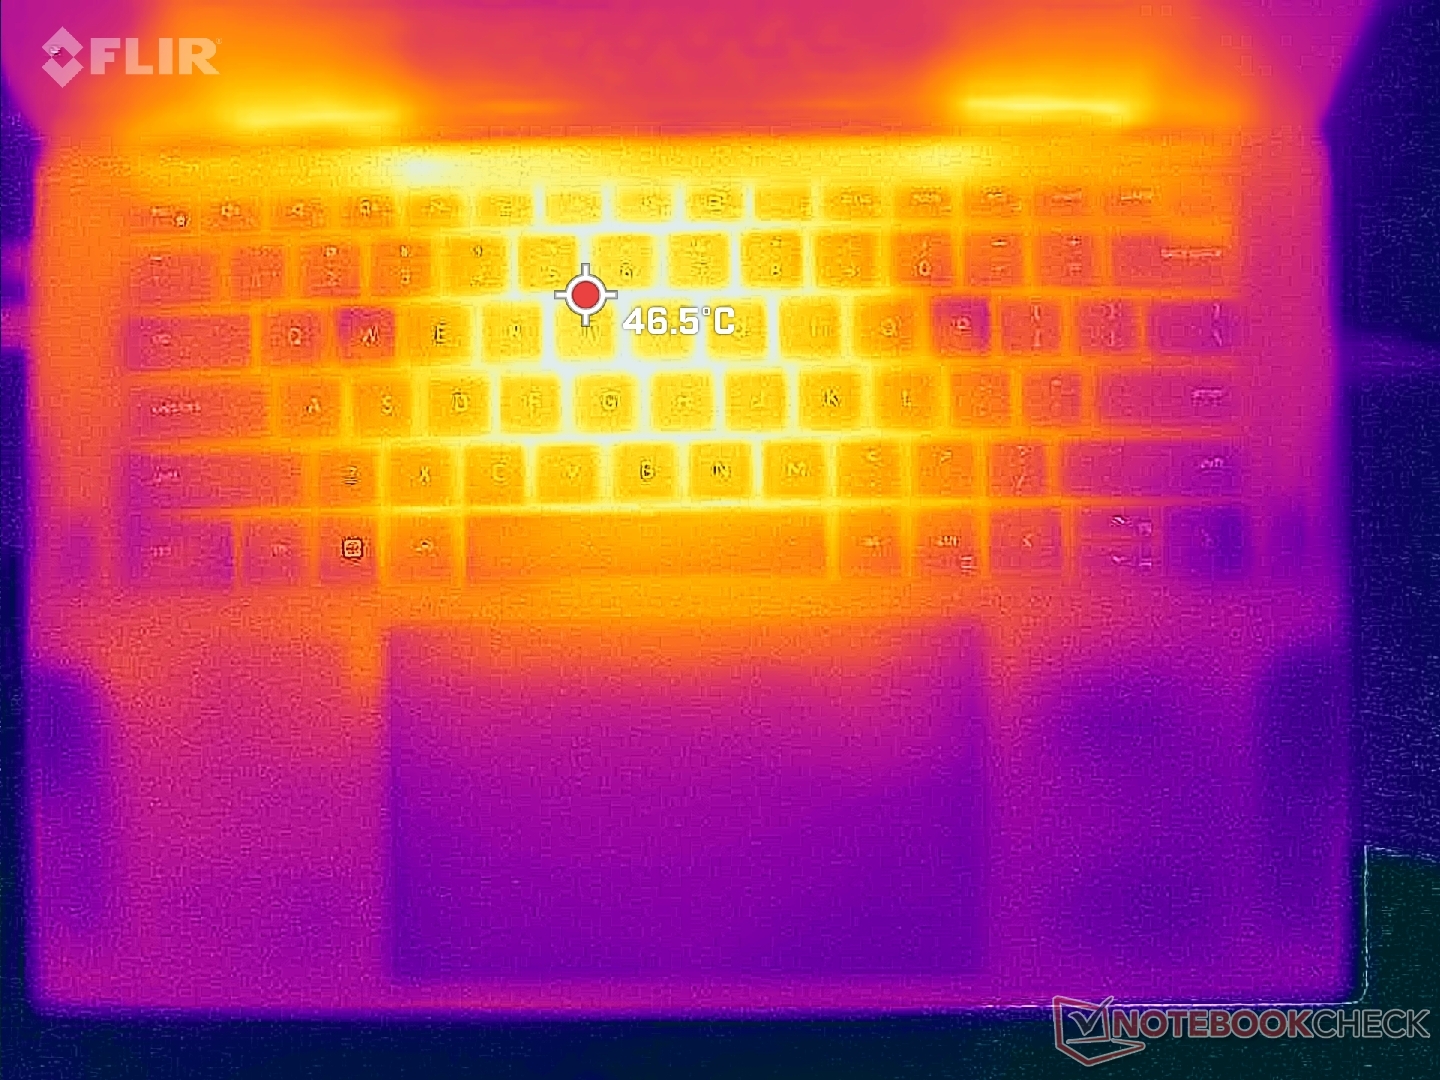
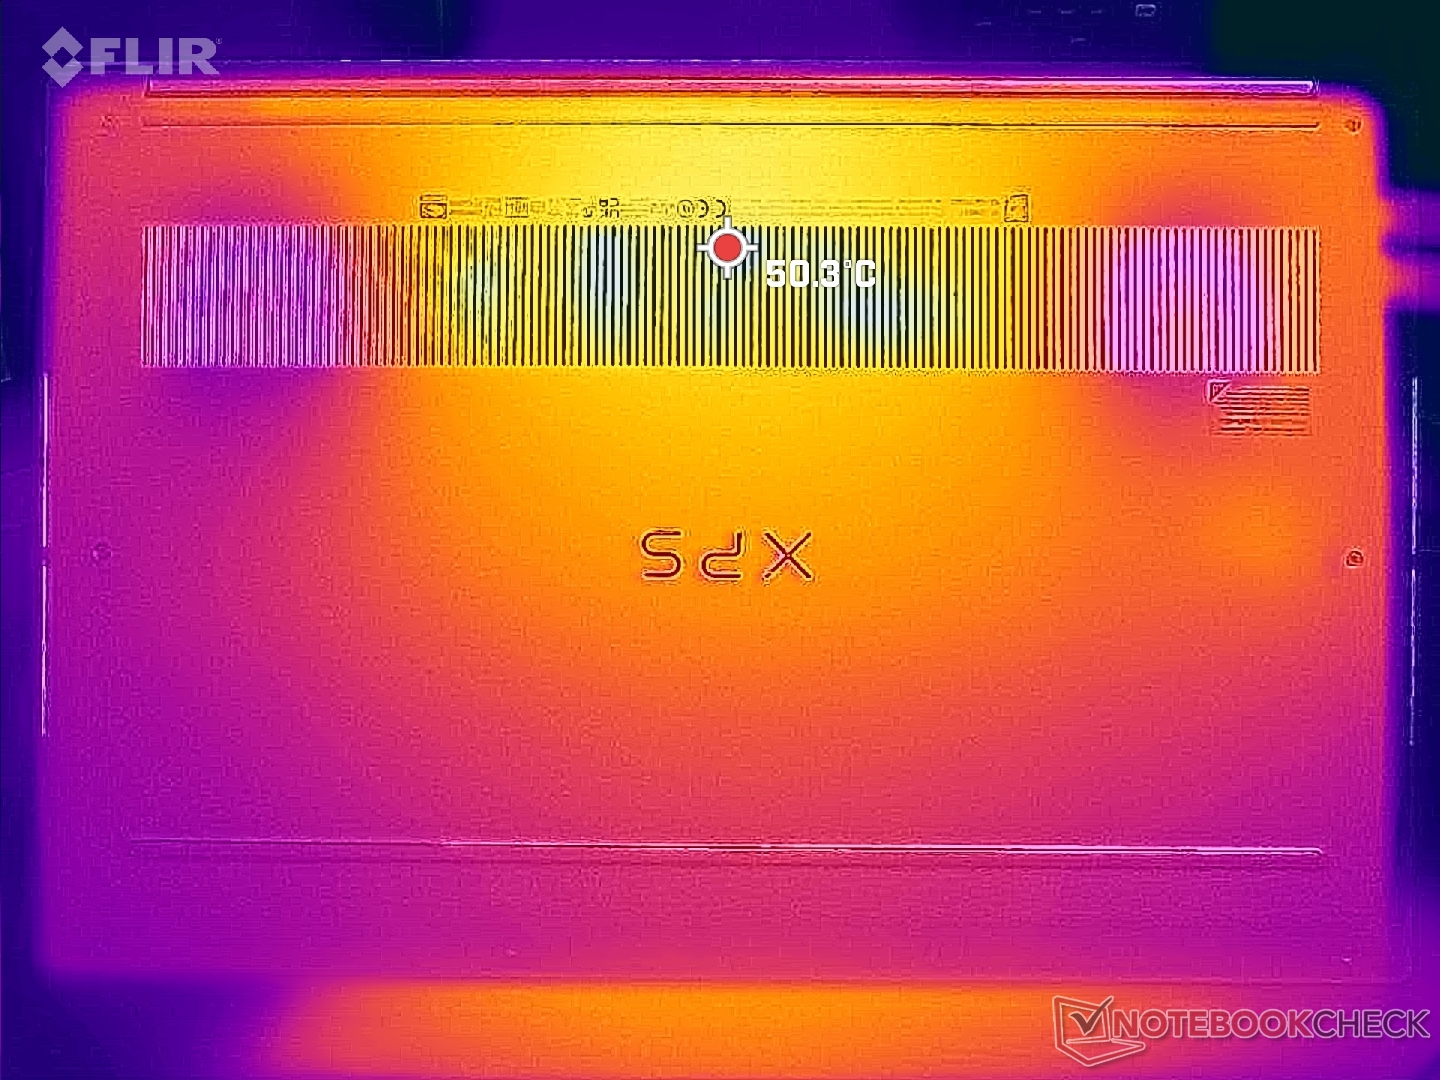
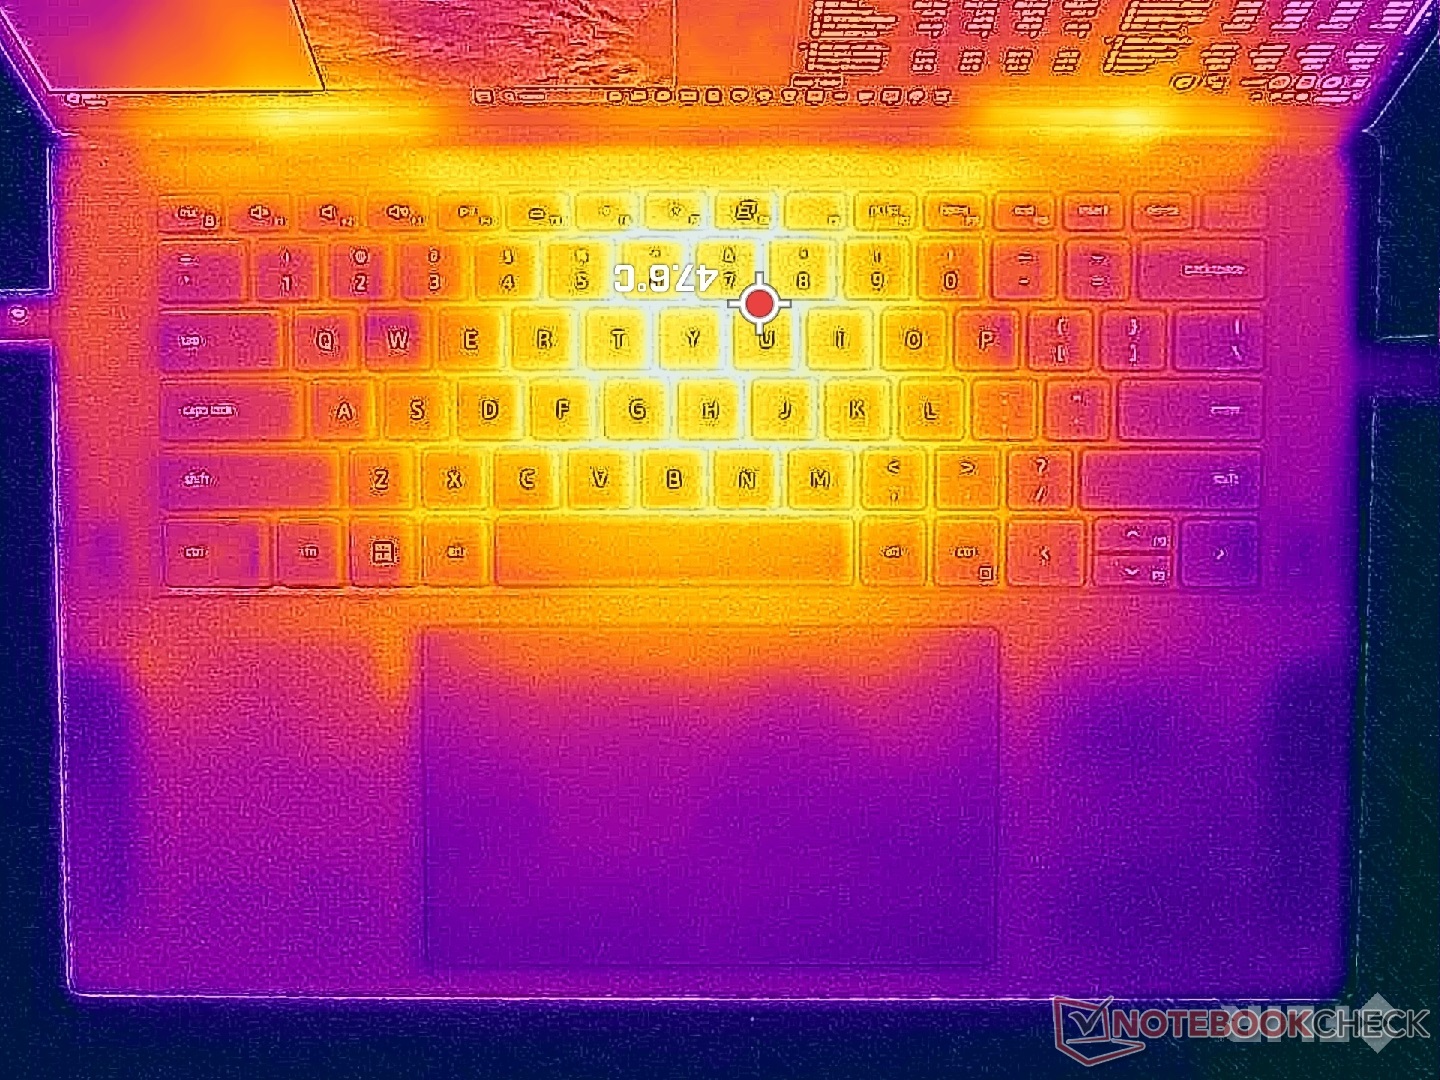
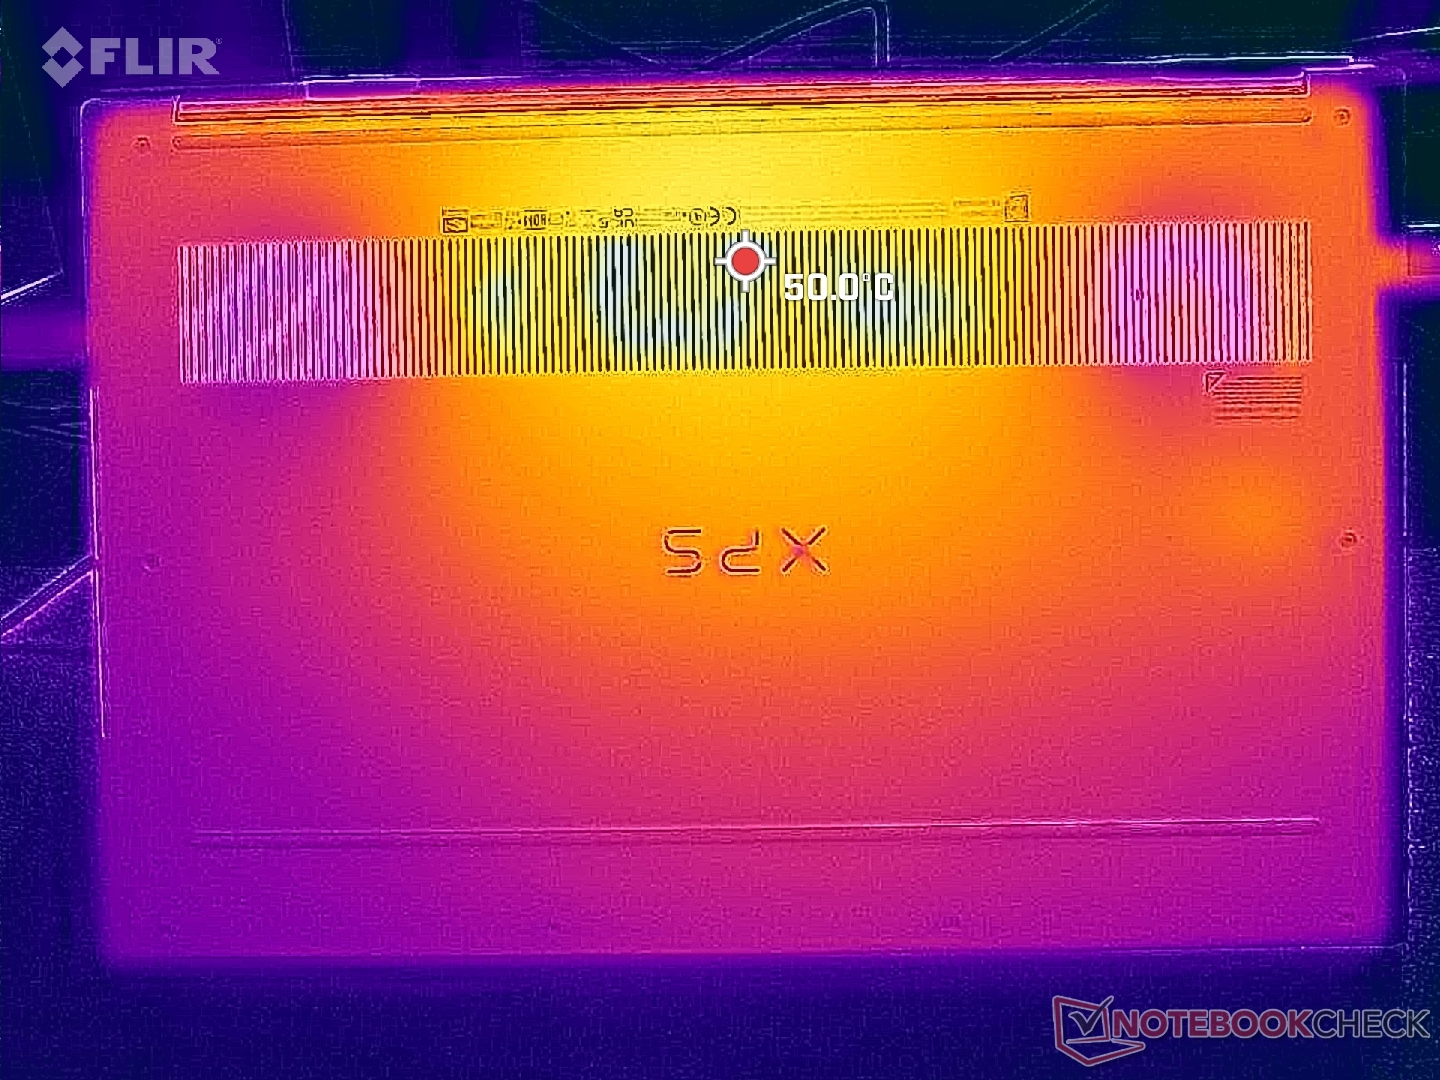
Las temperaturas superficiales son relativamente cálidas, en torno a los 30 C, incluso en reposo sobre el escritorio, debido a la alta densidad de potencia del delgado chasis. Esto no es diferente del modelo del año pasado, sin embargo, ya que la envolvente de potencia se ha mantenido más o menos igual. La temperatura de la piel puede ser incómodamente cálida a 45 C en la parte inferior del chasis cuando se ejecutan cargas exigentes como juegos.
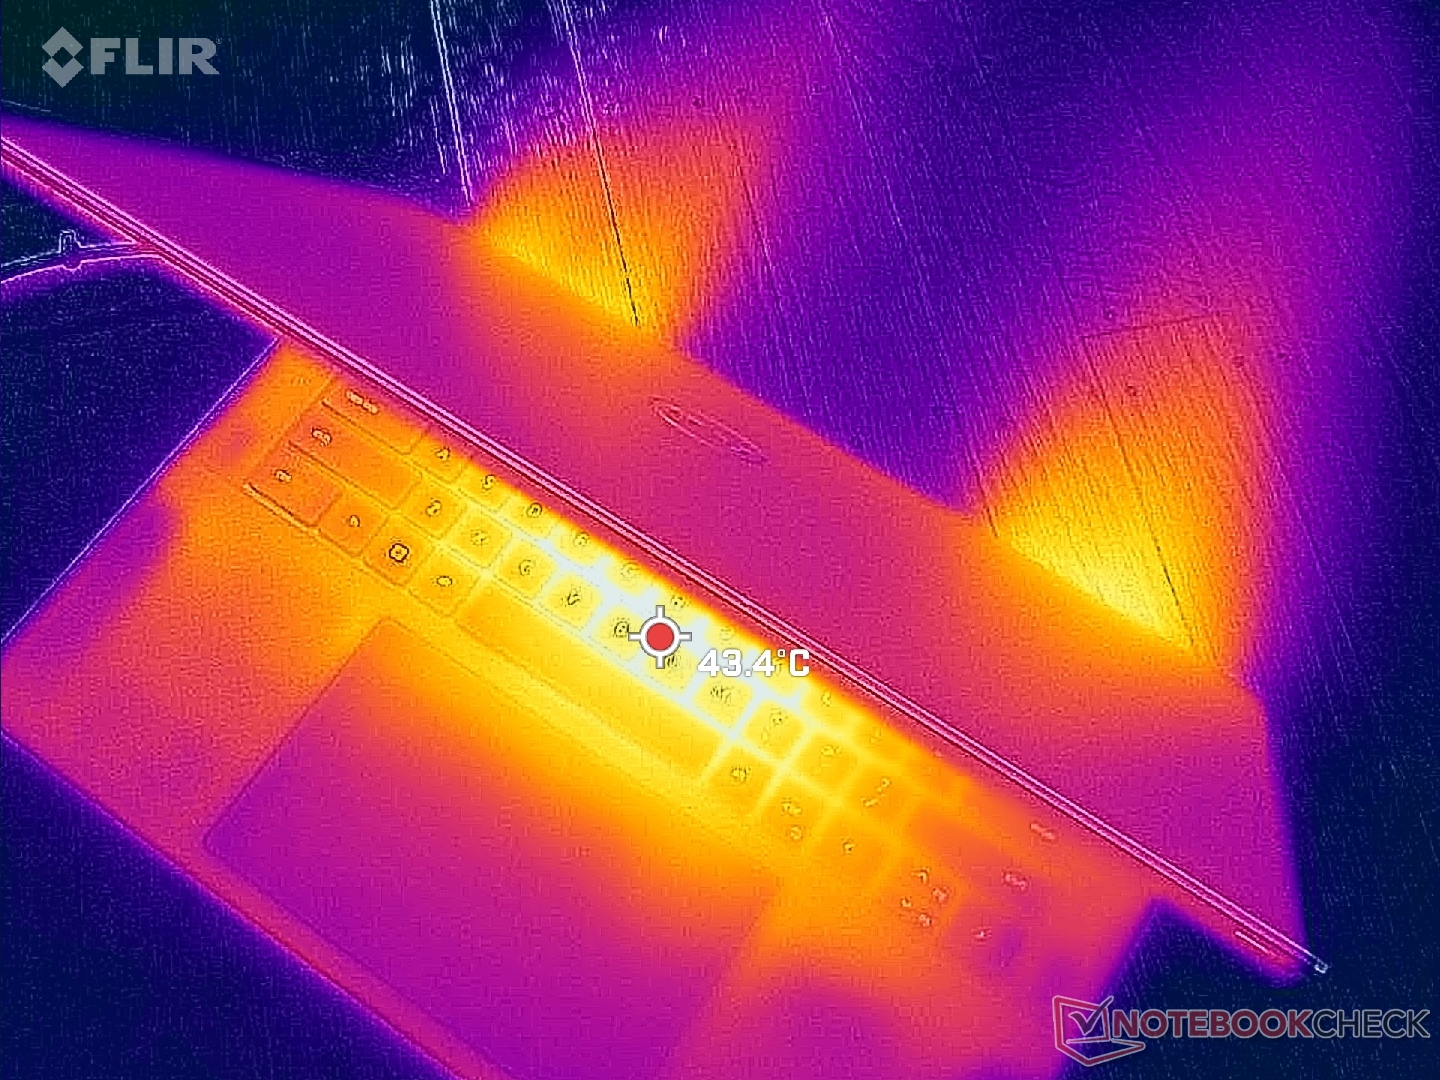
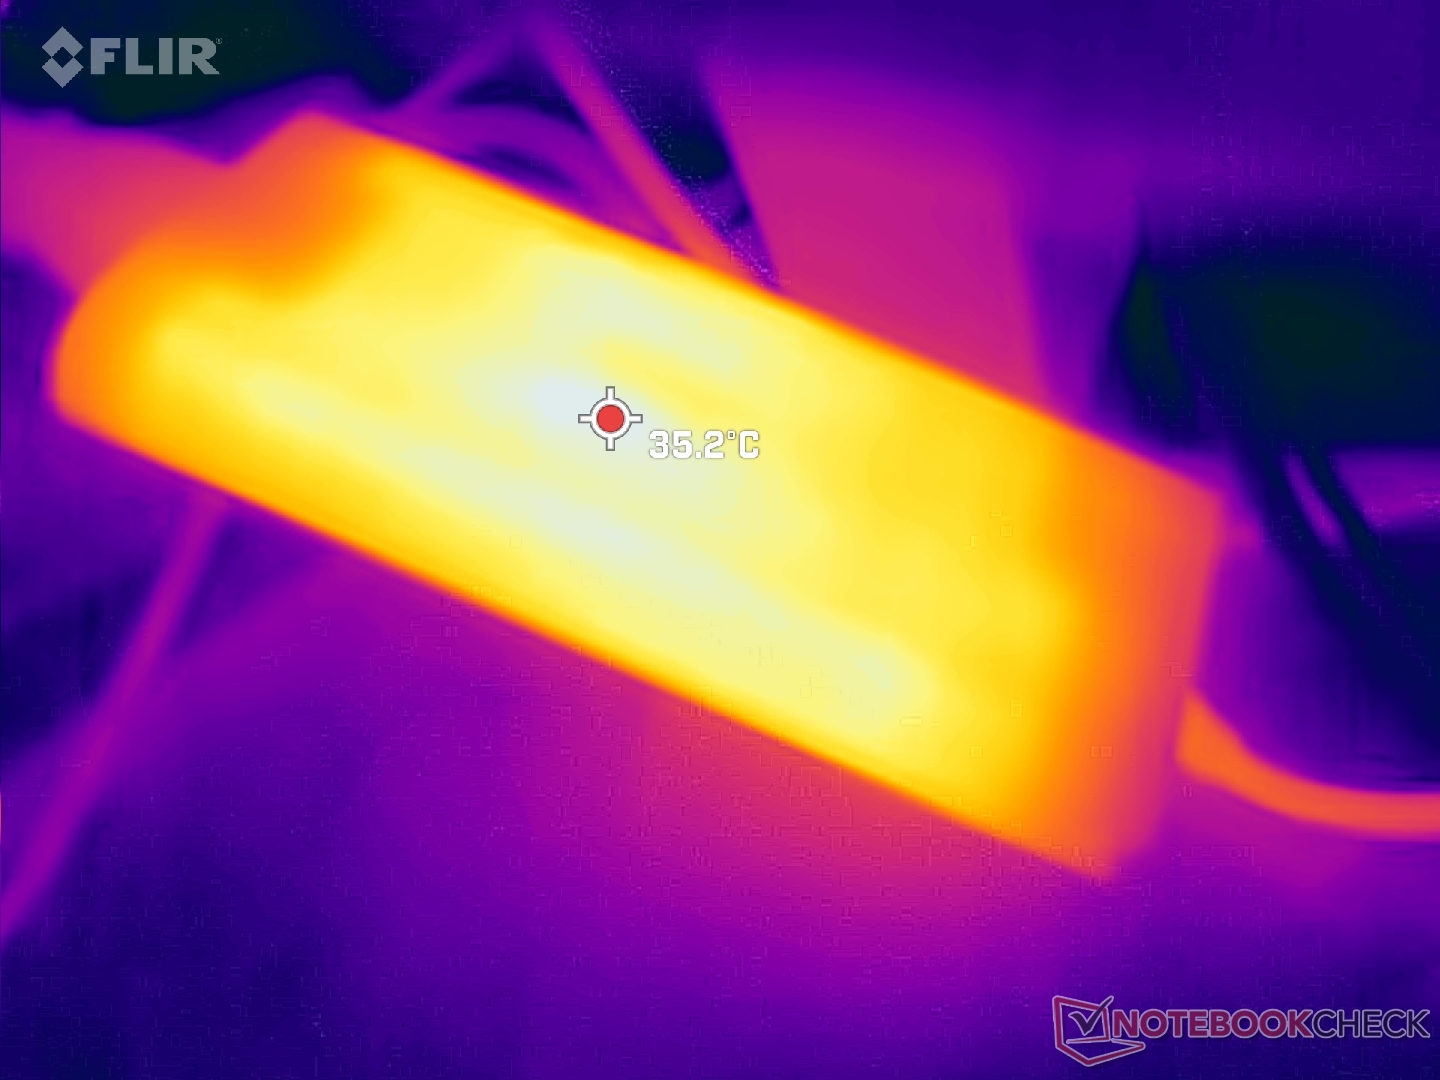
(-) La temperatura máxima en la parte superior es de 45.6 °C / 114 F, frente a la media de 36.8 °C / 98 F, que oscila entre 21 y 71 °C para la clase Multimedia.
(±) El fondo se calienta hasta un máximo de 42 °C / 108 F, frente a la media de 39.1 °C / 102 F
(+) En reposo, la temperatura media de la parte superior es de 31.1 °C / 88# F, frente a la media del dispositivo de 31.3 °C / 88 F.
(±) Jugando a The Witcher 3, la temperatura media de la parte superior es de 37.2 °C / 99 F, frente a la media del dispositivo de 31.3 °C / 88 F.
(+) El reposamanos y el panel táctil están a una temperatura inferior a la de la piel, con un máximo de 30.6 °C / 87.1 F y, por tanto, son fríos al tacto.
(±) La temperatura media de la zona del reposamanos de dispositivos similares fue de 28.7 °C / 83.7 F (-1.9 °C / -3.4 F).
| Dell XPS 15 9530 RTX 4070 Intel Core i7-13700H, NVIDIA GeForce RTX 4070 Laptop GPU | Dell XPS 15 9520 RTX 3050 Ti Intel Core i7-12700H, NVIDIA GeForce RTX 3050 Ti Laptop GPU | Dell XPS 15 9500 Core i7 4K UHD Intel Core i7-10875H, NVIDIA GeForce GTX 1650 Ti Mobile | Asus Zenbook Pro 15 OLED UM535Q AMD Ryzen 9 5900HX, NVIDIA GeForce RTX 3050 Ti Laptop GPU | MSI Prestige 15 A12UD-093 Intel Core i7-1280P, NVIDIA GeForce RTX 3050 Ti Laptop GPU | Gigabyte Aero 15 OLED XD Intel Core i7-11800H, NVIDIA GeForce RTX 3070 Laptop GPU | |
|---|---|---|---|---|---|---|
| Heat | -5% | -2% | -4% | -3% | -9% | |
| Maximum Upper Side * (°C) | 45.6 | 51.4 -13% | 44 4% | 36 21% | 49 -7% | 45 1% |
| Maximum Bottom * (°C) | 42 | 51 -21% | 48.8 -16% | 47.2 -12% | 52.6 -25% | 54 -29% |
| Idle Upper Side * (°C) | 34.4 | 30 13% | 33 4% | 37 -8% | 29.7 14% | 34 1% |
| Idle Bottom * (°C) | 33.2 | 33 1% | 32.4 2% | 39.2 -18% | 30.7 8% | 36 -8% |
* ... más pequeño es mejor
Prueba de estrés - Altas temperaturas de la CPU
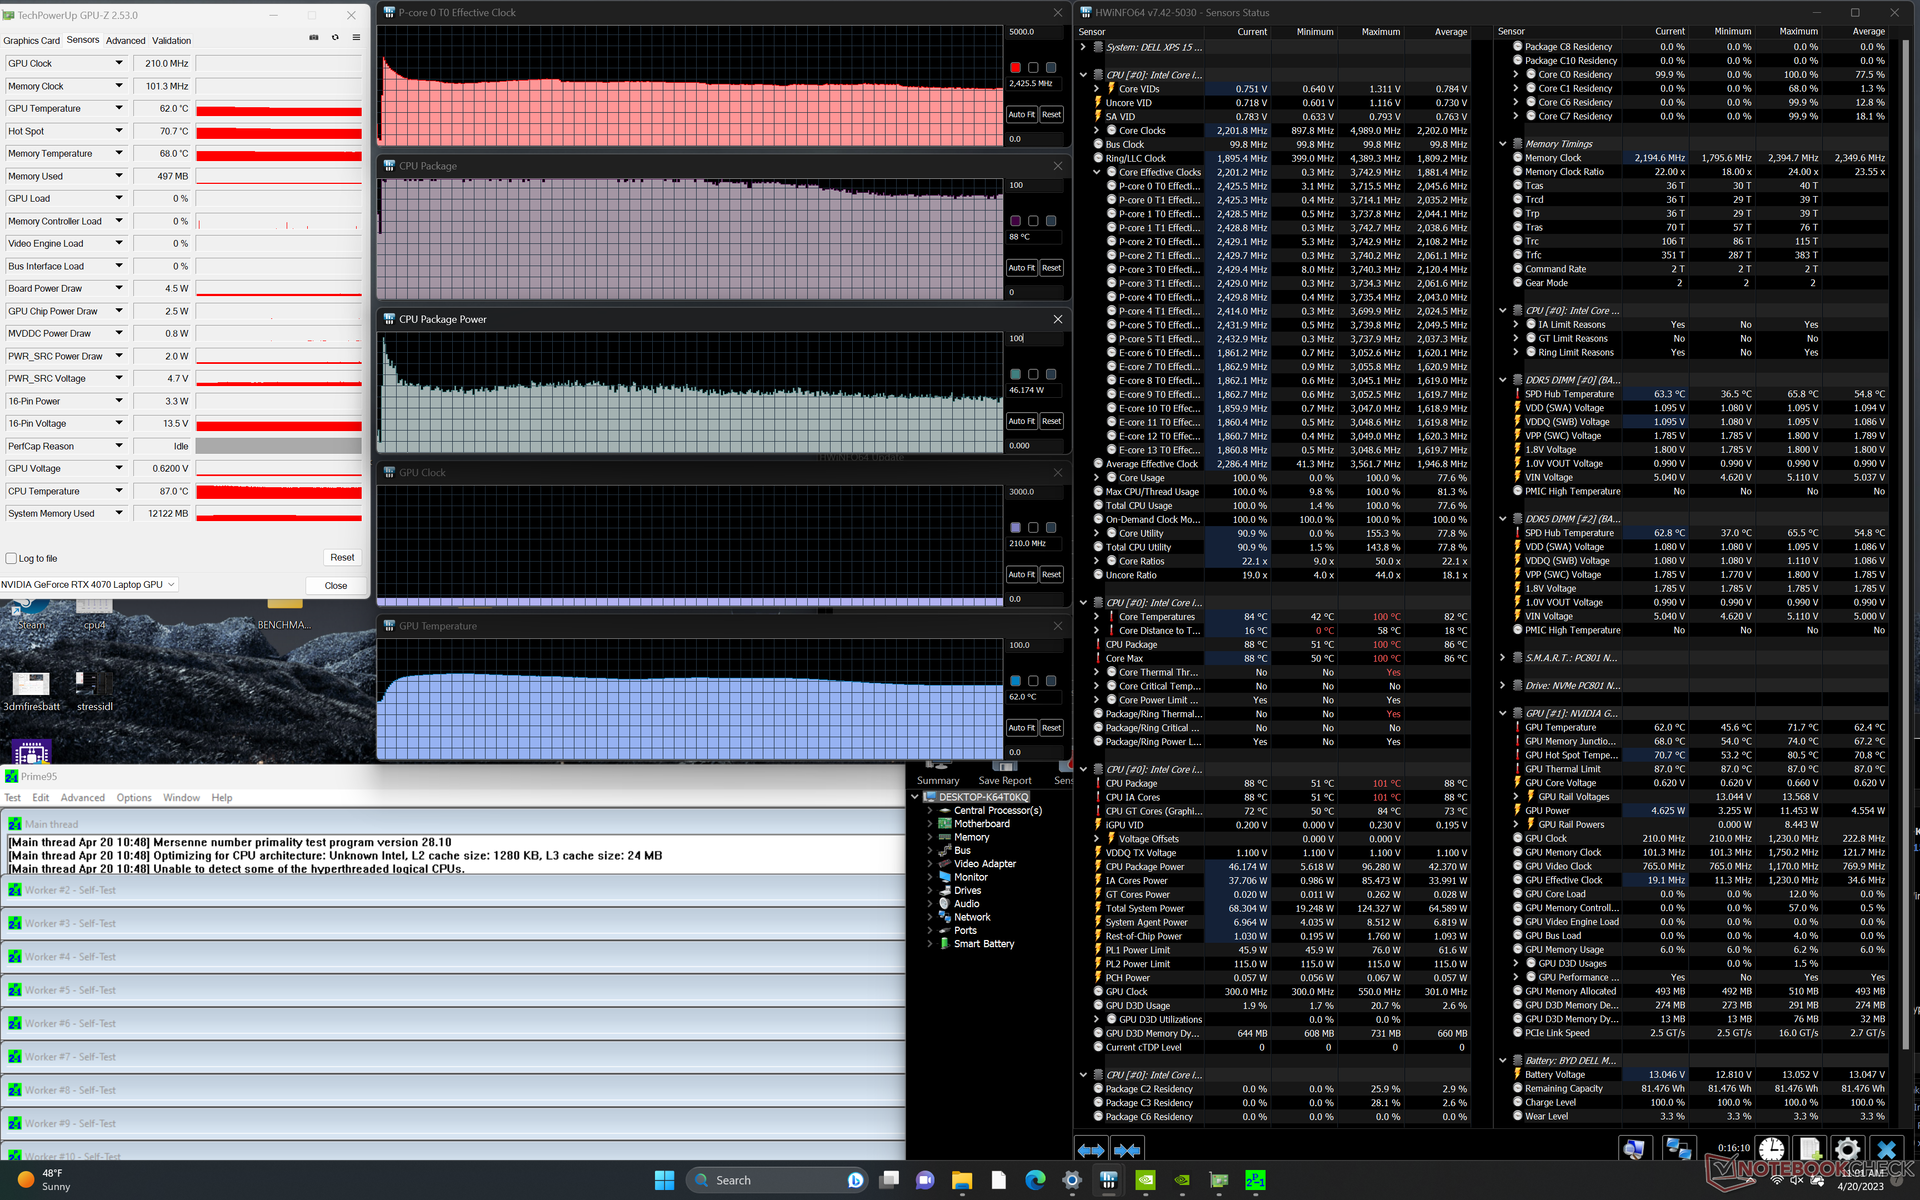
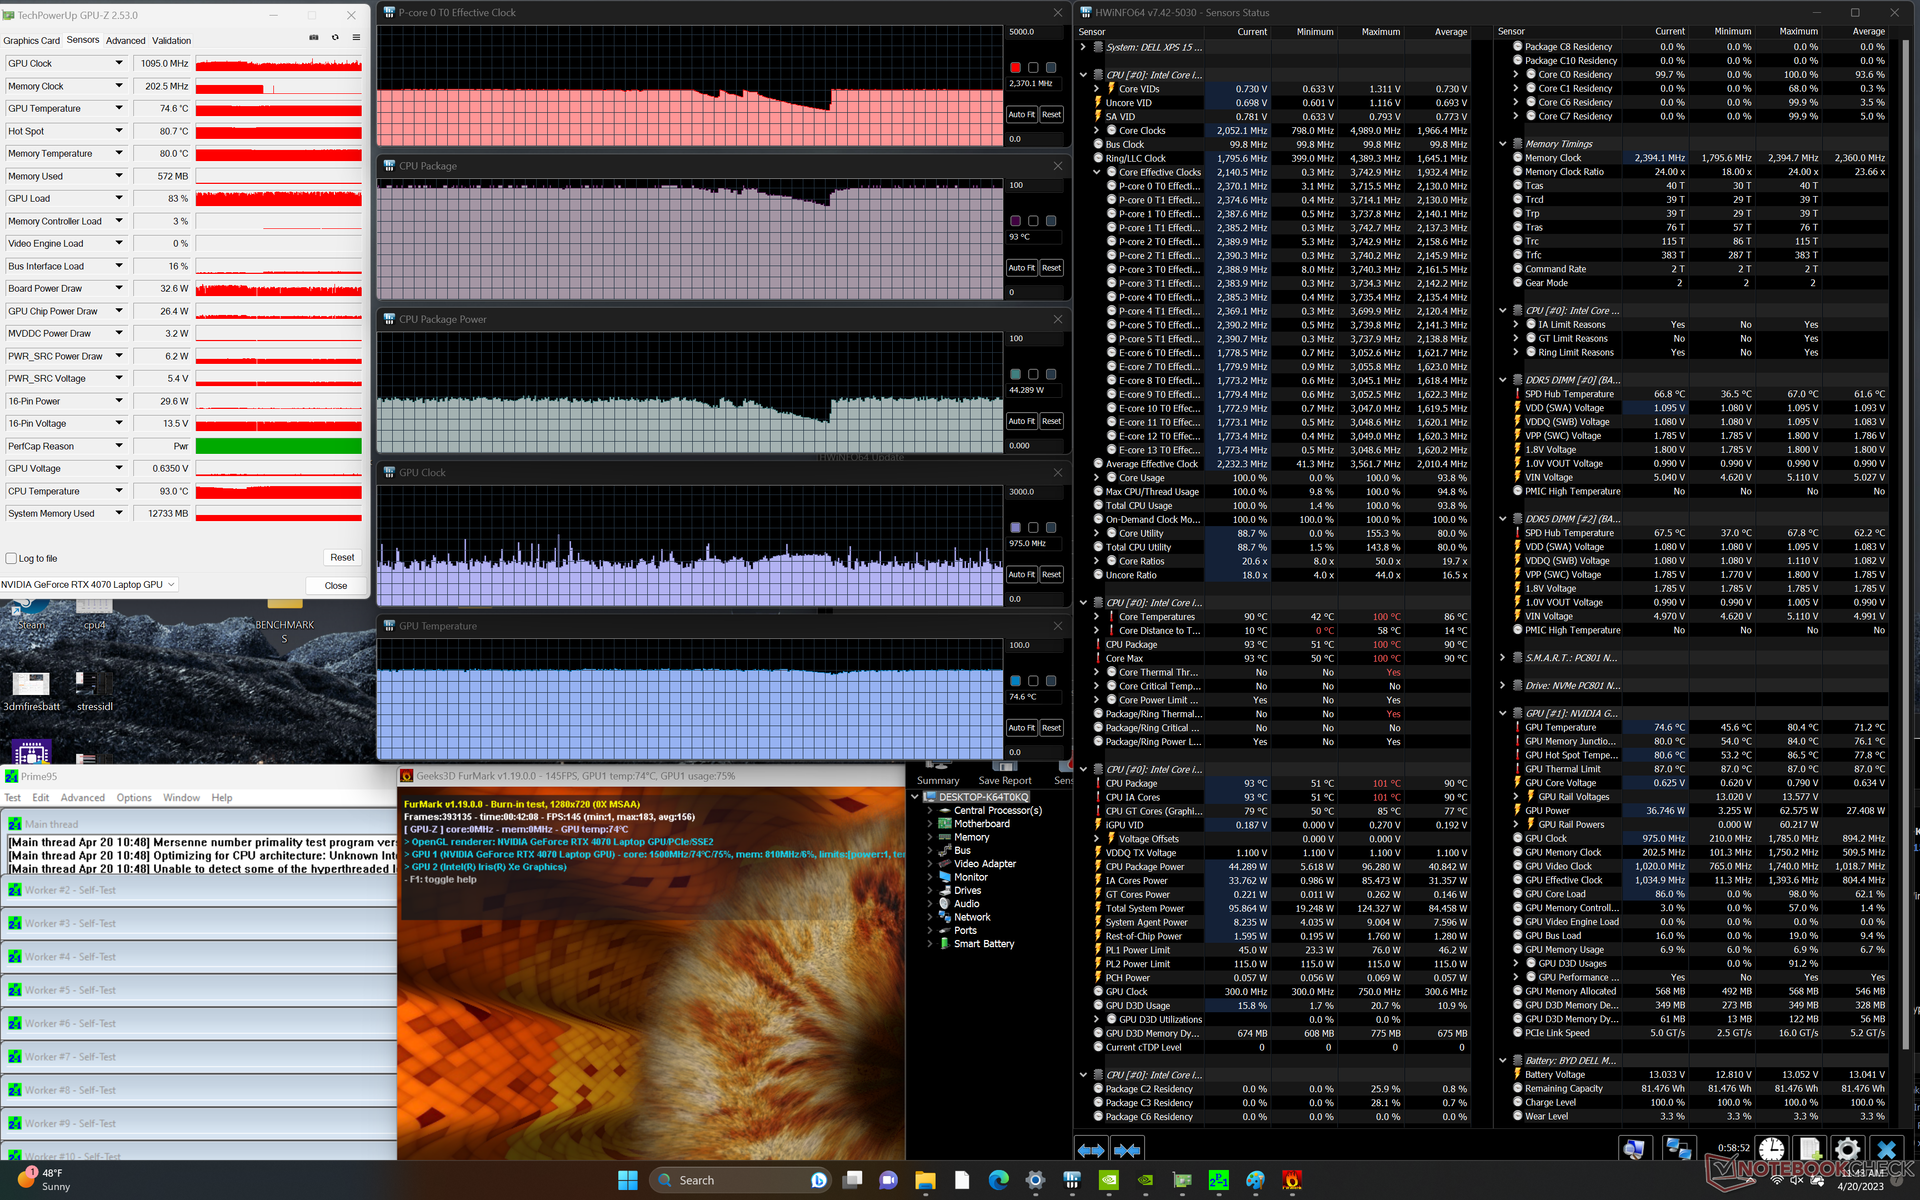
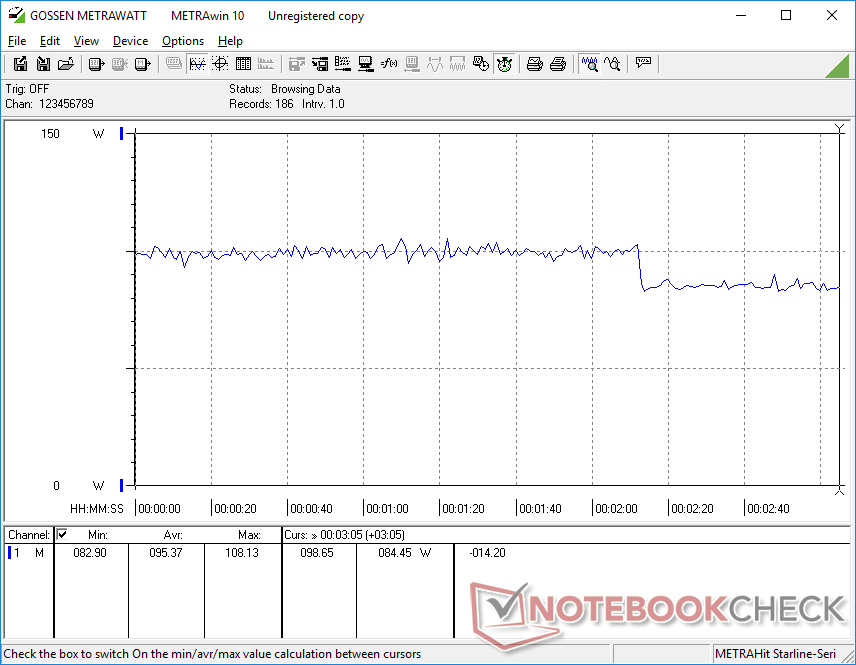
La CPU aumentaría a 3,7 GHz y 96 W durante sólo uno o dos segundos al iniciar el estrés Prime95. La temperatura del núcleo, entre 88 y 100 ºC, es muy elevada cuando la CPU está sometida a un estrés total, por lo que la potencia cae de forma constante hasta los 2,7 GHz y 55 W. En comparación, repitiendo esta misma prueba en el AMD-powered Asus Zenbook Pro 15 UM535Q resultaría en una temperatura de núcleo más fresca de sólo 76 C. La temperatura de núcleo superior a la media en el sistema Dell no sorprende ya que es una característica común de la serie XPS 15. Actualizar a la configuración Core i9 puede, por tanto, traer ligeros beneficios en el mejor de los casos ya que nuestra configuración Core i7 ya está rozando el techo de los 100 C.
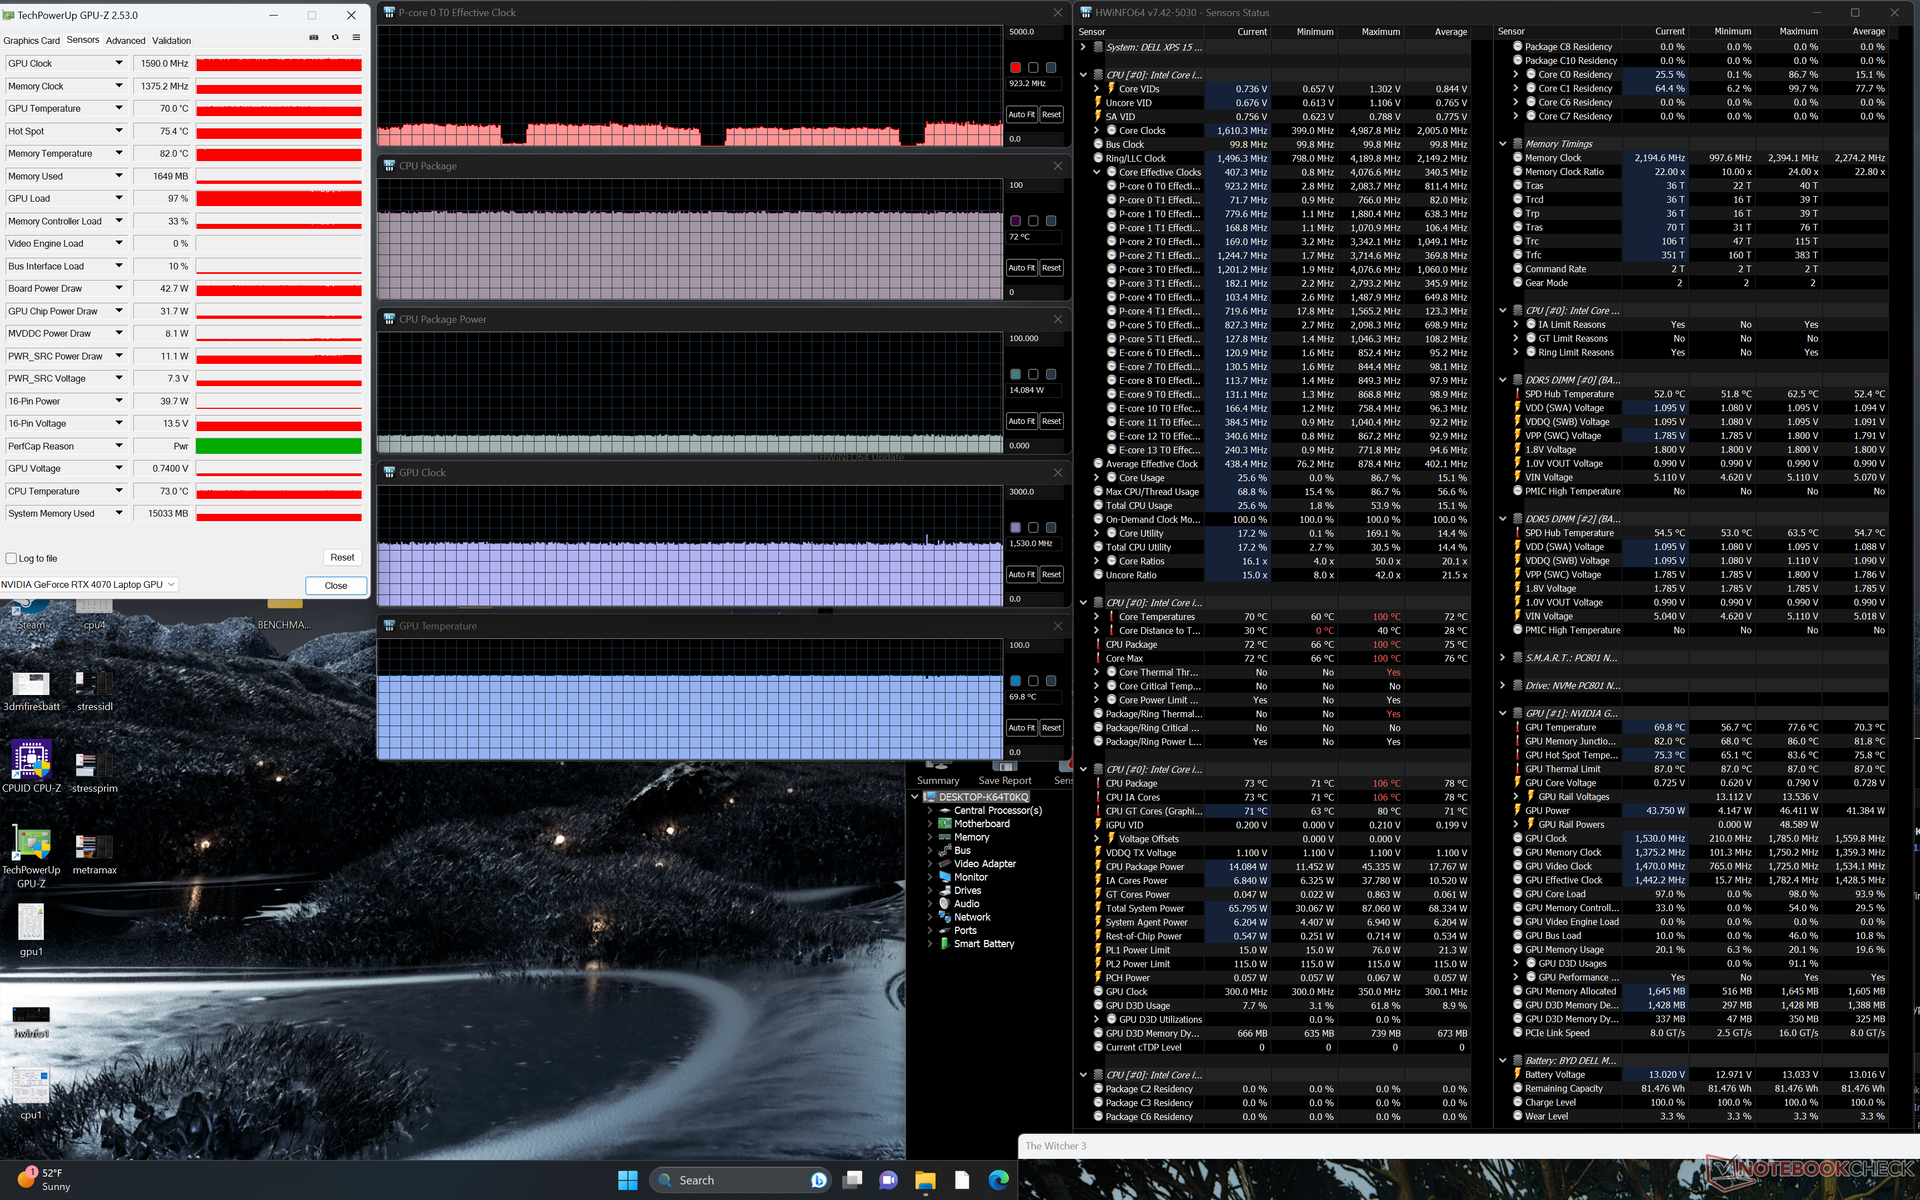
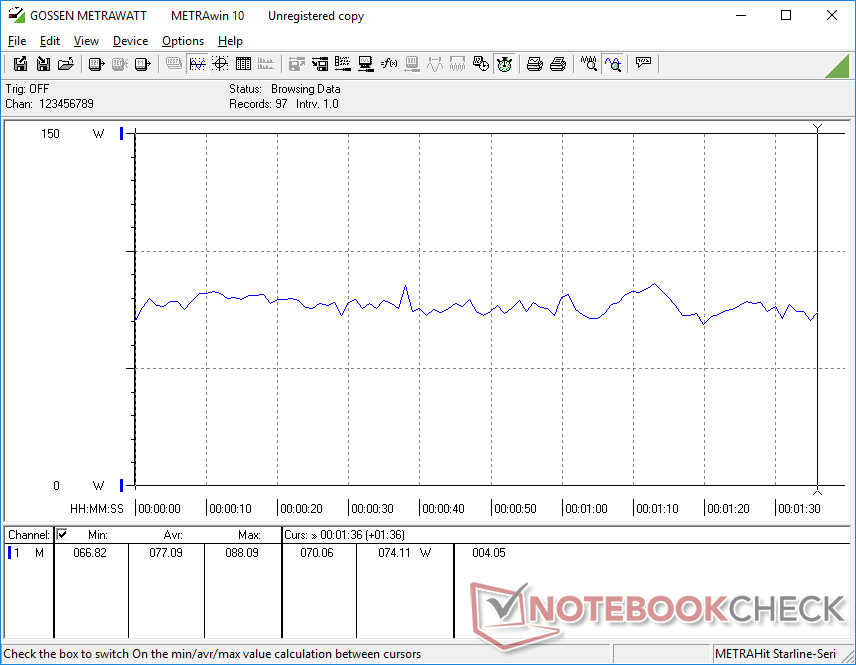
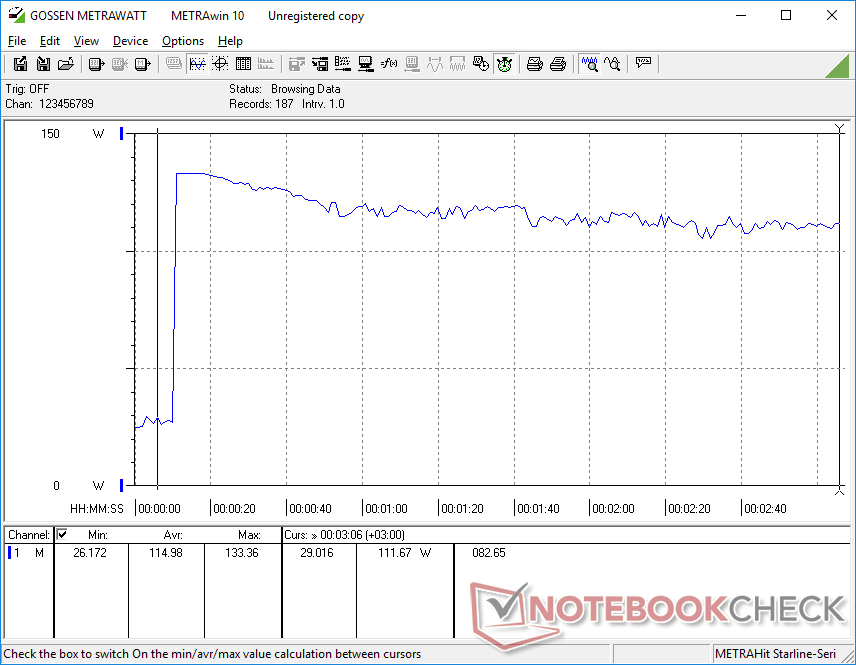
Cuando se ejecuta Witcher 3 para representar cargas de juego típicas, la GPU se estabilizaría a 1590 MHz de núcleo, 1375 MHz de memoria, 70 C, y 43 W frente a un objetivo de 50 W. Repitiendo esta misma prueba en elUniwill GM6PX7X IDX con una RTX 4070 más potente de 130 W, el resultado sería un reloj del núcleo, un reloj de la memoria, una temperatura y una potencia de la GPU estables de 2370 MHz, 2125 MHz, 73 C y 100 W, respectivamente. La diferencia de rendimiento entre la RTX 4070 de 50 W y la de más de 100 W es muy clara en este ejemplo.
Sorprendentemente, funcionar con batería no afecta al rendimiento, lo que es raro en cualquier portátil con RTX de GeForce. Una prueba 3DMark 11 a pilas arrojaría unas puntuaciones de Física y Gráficos de 20751 y 24569 puntos, respectivamente, frente a 18112 y 24229 puntos cuando está conectado a la red.
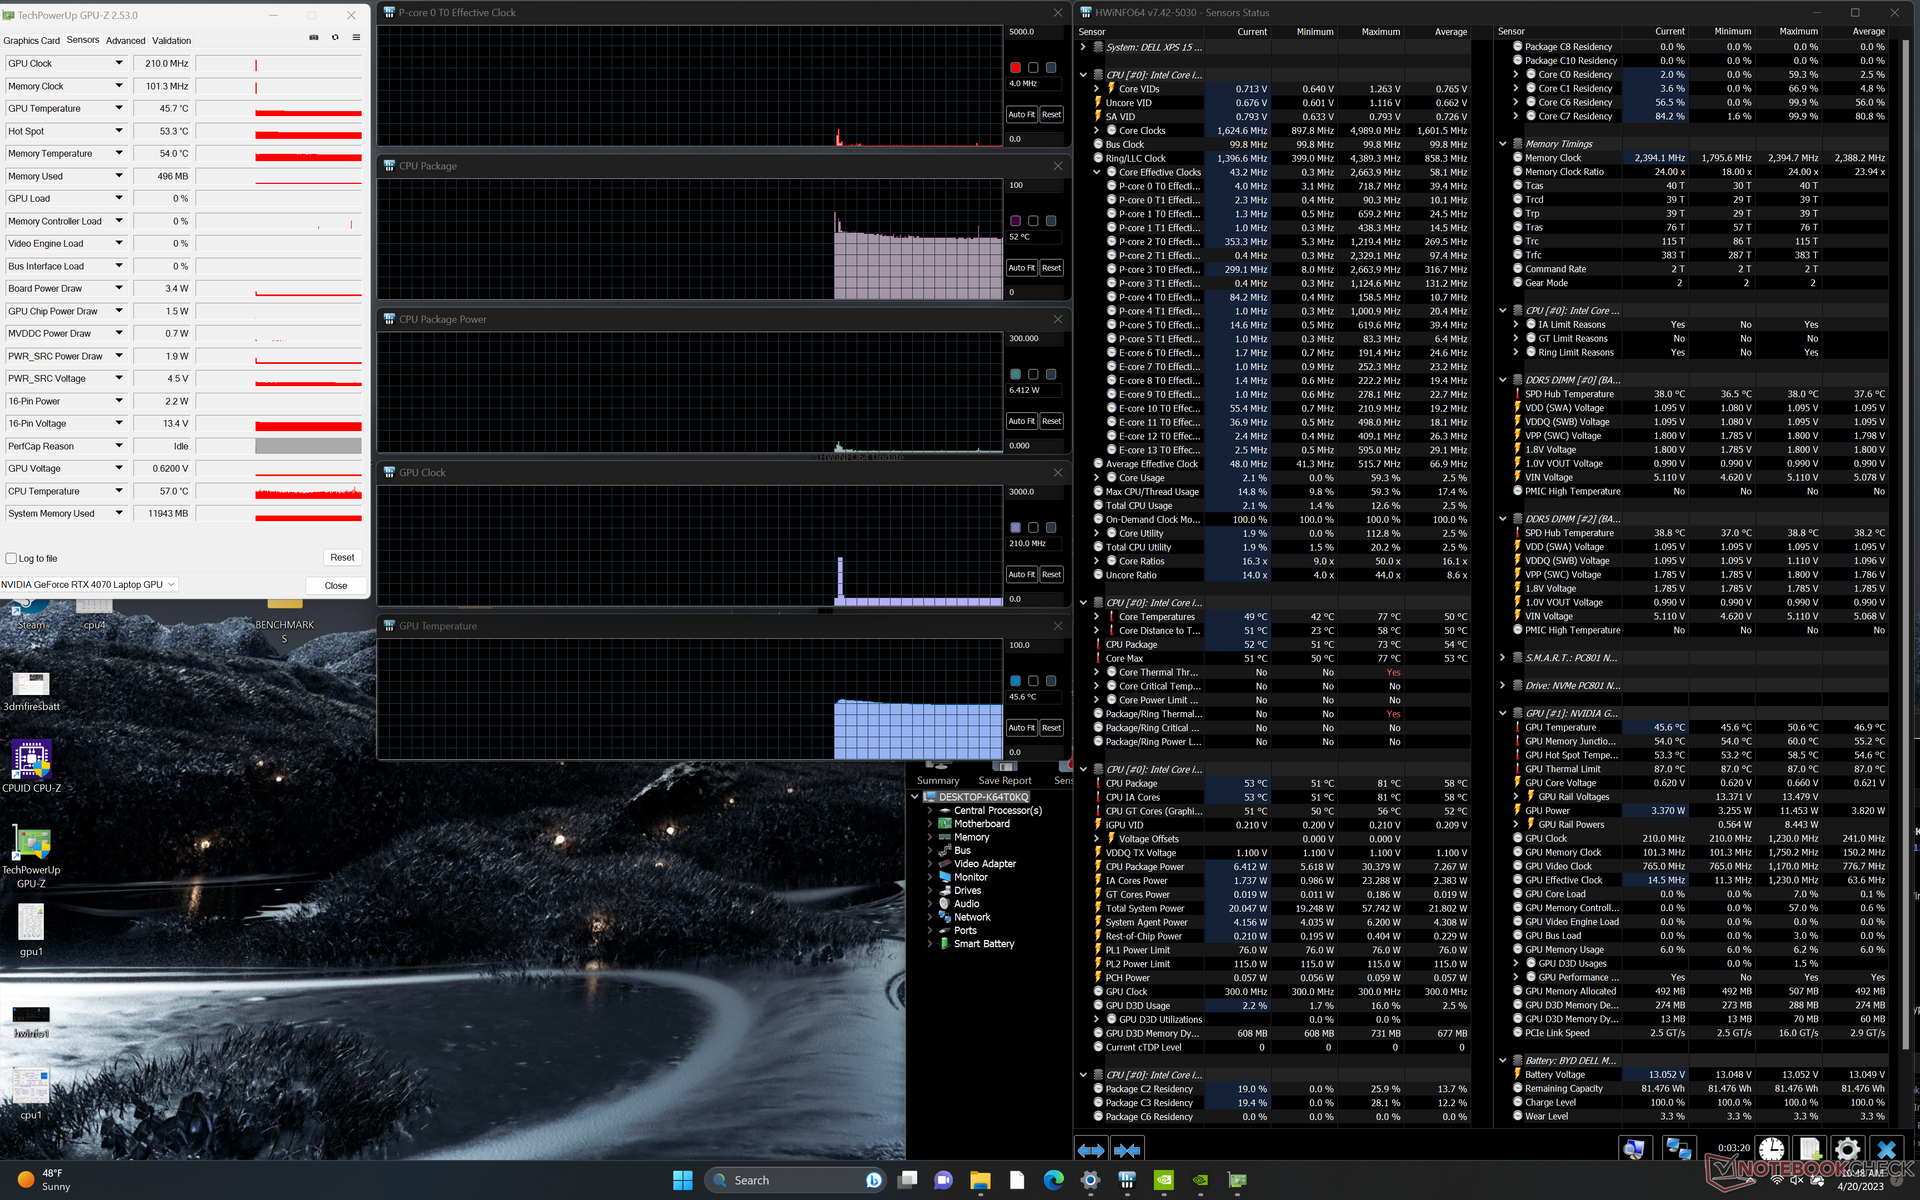
| RelojCPU (GHz) | Reloj GPU (MHz) | Temperatura mediaCPU (°C) | Temperatura media GPU (°C) | |
| Sistema en reposo | -- | -- | 52 | 46 |
| Prime95Stress | 2.4 | -- | 88 | 62 |
| Prime95+ FurMark Estrés | 2,4 | ~1095 | 93 | 75 |
| Witcher 3 Tensión | ~0,9 | 1590 | 72 | 70 |
Altavoces
Dell XPS 15 9530 RTX 4070 análisis de audio
(+) | los altavoces pueden reproducir a un volumen relativamente alto (#83.4 dB)
Graves 100 - 315 Hz
(+) | buen bajo - sólo 3.9% lejos de la mediana
(+) | el bajo es lineal (6.8% delta a la frecuencia anterior)
Medios 400 - 2000 Hz
(+) | medios equilibrados - a sólo 4.4% de la mediana
(+) | los medios son lineales (4.1% delta a la frecuencia anterior)
Altos 2 - 16 kHz
(+) | máximos equilibrados - a sólo 1.1% de la mediana
(+) | los máximos son lineales (3.3% delta a la frecuencia anterior)
Total 100 - 16.000 Hz
(+) | el sonido global es lineal (6.4% de diferencia con la mediana)
En comparación con la misma clase
» 4% de todos los dispositivos probados de esta clase eran mejores, 1% similares, 95% peores
» El mejor tuvo un delta de 5%, la media fue 17%, el peor fue ###max##%
En comparación con todos los dispositivos probados
» 1% de todos los dispositivos probados eran mejores, 0% similares, 99% peores
» El mejor tuvo un delta de 4%, la media fue 23%, el peor fue ###max##%
Apple MacBook Pro 16 2021 M1 Pro análisis de audio
(+) | los altavoces pueden reproducir a un volumen relativamente alto (#84.7 dB)
Graves 100 - 315 Hz
(+) | buen bajo - sólo 3.8% lejos de la mediana
(+) | el bajo es lineal (5.2% delta a la frecuencia anterior)
Medios 400 - 2000 Hz
(+) | medios equilibrados - a sólo 1.3% de la mediana
(+) | los medios son lineales (2.1% delta a la frecuencia anterior)
Altos 2 - 16 kHz
(+) | máximos equilibrados - a sólo 1.9% de la mediana
(+) | los máximos son lineales (2.7% delta a la frecuencia anterior)
Total 100 - 16.000 Hz
(+) | el sonido global es lineal (4.6% de diferencia con la mediana)
En comparación con la misma clase
» 0% de todos los dispositivos probados de esta clase eran mejores, 0% similares, 100% peores
» El mejor tuvo un delta de 5%, la media fue 17%, el peor fue ###max##%
En comparación con todos los dispositivos probados
» 0% de todos los dispositivos probados eran mejores, 0% similares, 100% peores
» El mejor tuvo un delta de 4%, la media fue 23%, el peor fue ###max##%
Gestión de la energía - Core H y GeForce RTX en USB-C
Consumo de energía
El consumo de energía es generalmente mayor en comparación con el modelo del año pasado. Por ejemplo, cuando está en reposo en el escritorio con los ajustes más bajos, el XPS 15 9530 consume unos 20 W frente a los 5 o 6 W del antiguo XPS 15 9520. En juegos, el consumo es un 25% superior, lo que significa que el rendimiento extra respecto a la antigua RTX 3050 Ti no es precisamente gratis.
Pudimos registrar un consumo máximo temporal de 133 W con el adaptador de CA pequeño-mediano (~14.3 x 6.6 x 2.2cm) de 130 W. El XPS 15 es uno de los primeros portátiles con CPU Core serie H y GPU GeForce RTX 4070 que se alimentan exclusivamente por USB-C.
Esto tiene sus ventajas en términos de rendimiento.Esto sin duda tiene sus ventajas en términos de portabilidad y versatilidad, pero el rendimiento y la carga pueden verse afectados debido a la limitada potencia disponible. La carga de vacío a lleno, por ejemplo, es más lenta de lo habitual, unas 2,5 horas, y será aún más lenta si se ejecutan cargas exigentes simultáneamente.
Afortunadamente, la batería no se agota lentamente cuando se juega o se ejecutan cargas exigentes a diferencia de lo que observamos en modelos XPS 17 más antiguos.
| Off / Standby | |
| Ocioso | |
| Carga |
|
Clave:
min: | |
| Dell XPS 15 9530 RTX 4070 i7-13700H, GeForce RTX 4070 Laptop GPU, SK hynix PC801 HFS001TEJ9X101N, OLED, 3456x2160, 15.6" | Dell XPS 15 9520 RTX 3050 Ti i7-12700H, GeForce RTX 3050 Ti Laptop GPU, WDC PC SN810 512GB, OLED, 3456x2160, 15.6" | Dell XPS 15 9500 Core i7 4K UHD i7-10875H, GeForce GTX 1650 Ti Mobile, SK Hynix PC611 512GB, IPS, 3840x2400, 15.6" | Asus Zenbook Pro 15 OLED UM535Q R9 5900HX, GeForce RTX 3050 Ti Laptop GPU, WDC PC SN730 SDBPNTY-1T00, OLED, 1920x1080, 15.6" | MSI Prestige 15 A12UD-093 i7-1280P, GeForce RTX 3050 Ti Laptop GPU, Micron 3400 1TB MTFDKBA1T0TFH, IPS, 3840x2160, 15.6" | Gigabyte Aero 15 OLED XD i7-11800H, GeForce RTX 3070 Laptop GPU, Samsung PM9A1 MZVL21T0HCLR, OLED, 3840x2160, 15.6" | |
|---|---|---|---|---|---|---|
| Power Consumption | 28% | 12% | 34% | 51% | -39% | |
| Idle Minimum * (Watt) | 20 | 5.5 72% | 5.7 71% | 5.5 72% | 5.4 73% | 23 -15% |
| Idle Average * (Watt) | 20.7 | 7.2 65% | 13.5 35% | 7.4 64% | 11.8 43% | 26 -26% |
| Idle Maximum * (Watt) | 22.4 | 16 29% | 19.6 12% | 14.9 33% | 12.7 43% | 34 -52% |
| Load Average * (Watt) | 77.1 | 91.8 -19% | 114.1 -48% | 78.2 -1% | 45.9 40% | 99 -28% |
| Witcher 3 ultra * (Watt) | 95.4 | 74.6 22% | 93 3% | 80.1 16% | 45.7 52% | 163 -71% |
| Load Maximum * (Watt) | 133.4 | 134.7 -1% | 135.2 -1% | 110.9 17% | 63 53% | 190 -42% |
* ... más pequeño es mejor
Power Consumption Witcher 3 / Stresstest
Power Consumption external Monitor
Duración de la batería - Algo más corta, pero no mala
Los tiempos de ejecución son generalmente más cortos que en el modelo del año pasado, lo que no sorprende ya que la CPU Intel de 13ª generación y la GPU GeForce 40 están bajo envolventes de energía similares a las de sus respectivos predecesores. Podemos registrar 8 horas de uso real de WLAN o 40 minutos menos que en el XPS 15 de 2022. Sigue estando bien aunque es algo inferior a modelos de la competencia como el Asus Zenbook Pro 15.
La duración de la batería puede ampliarse mostrando colores más oscuros en vez de blanco en la configuración OLED como se detalla aquí. Esperamos que la SKU IPS de menor resolución ofrezca duraciones superiores a las que hemos registrado aquí.
| Dell XPS 15 9530 RTX 4070 i7-13700H, GeForce RTX 4070 Laptop GPU, 86 Wh | Dell XPS 15 9520 RTX 3050 Ti i7-12700H, GeForce RTX 3050 Ti Laptop GPU, 86 Wh | Dell XPS 15 9500 Core i7 4K UHD i7-10875H, GeForce GTX 1650 Ti Mobile, 86 Wh | Asus Zenbook Pro 15 OLED UM535Q R9 5900HX, GeForce RTX 3050 Ti Laptop GPU, 96 Wh | MSI Prestige 15 A12UD-093 i7-1280P, GeForce RTX 3050 Ti Laptop GPU, 80 Wh | Gigabyte Aero 15 OLED XD i7-11800H, GeForce RTX 3070 Laptop GPU, 99 Wh | |
|---|---|---|---|---|---|---|
| Duración de Batería | 51% | 49% | 109% | 2% | 6% | |
| Reader / Idle (h) | 11.5 | 14.8 29% | 23 100% | 26.2 128% | ||
| WiFi v1.3 (h) | 8 | 8.8 10% | 9.1 14% | 12.8 60% | 8.9 11% | 8.5 6% |
| Load (h) | 1.5 | 3.2 113% | 2 33% | 3.6 140% | 1.4 -7% | |
| H.264 (h) | 7.1 | |||||
| Witcher 3 ultra (h) | 2.2 |
Pro
Contra
Veredicto - Sacrificar el rendimiento por la delgadez
El Core i7-13700H y GeForce RTX 4070 suelen reservarse para portátiles de juego más grandes como elAsus ROG Strix G18 oAorus 15X ASF cada uno con voluminosos bloques de potencia de más de 200 W. Atiborrarlos en diseños más delgados y de bajo consumo como el XPS 15 puede funcionar, pero el rendimiento inevitablemente se resiente. En este caso, el TGP se ha reducido a la mitad o más, lo que supone un bajo rendimiento por dólar. Si planeas ejecutar editores gráficos y juegos por igual, entonces una máquina dedicada a juegos como el Alienware x15 superará con creces a nuestro XPS 15 incluso configurándolo con la misma CPU y GPU.
El impacto en el rendimiento cuando se ejecutan editores gráficos no es tan grave como el impacto en el rendimiento de juego cuando se compara con portátiles más grandes con objetivos TGP más altos. Esto se debe en gran parte a que incluso una RTX 4070 de 50 W lleva el mismo número de núcleos CUDA para aceleración que una versión de más de 100 W. El XPS 15 9530, por tanto, sobresale en la creación de contenidos con sólo el juego ocasional. Al fin y al cabo, es un portátil Nvidia Studio.
El XPS 15 9530 es el portátil de creación de contenidos que debes tener si quieres equilibrar rendimiento y portabilidad. Sin embargo, no esperes que rinda como la mayoría de portátiles con la misma GPU.
Hay muchos cambios que nos gustaría ver en futuros modelos. En primer lugar, nuevas opciones de pantalla con frecuencias de refresco de 90 Hz o 120 Hz mejorarían mucho la experiencia de usuario. En segundo lugar, la webcam de 720p es pésima, ya que no ha cambiado desde hace una década. En tercer lugar, una solución de refrigeración revisada potencialmente con metal líquido podría ayudar a aumentar el rendimiento Turbo Boost sin necesidad de engrosar el diseño. Y, por último, los problemas de DPC, saltos y caídas de fotogramas deberían revisarse, especialmente en un portátil insignia orientado a la creación de contenidos. Hay muchas cosas que gustan del XPS 15, especialmente si valoras su portabilidad similar a la de un MacBook Pro, pero los procesadores de su interior se están quedando pequeños para el chasis y se sienten algo limitados por ello.
Precio y disponibilidad
El XPS 15 9530 aún no está ampliamente disponible a través de los minoristas en el momento de escribir este artículo. La mejor forma de conseguir un modelo es directamente a través de Dell. Los precios empiezan en $2250 USD para la configuración base hasta $4700 si está totalmente configurado con el máximo de almacenamiento y RAM.
Dell XPS 15 9530 RTX 4070
- 04/23/2023 v7 (old)
Allen Ngo
Transparencia
La selección de los dispositivos que se van a reseñar corre a cargo de nuestro equipo editorial. La muestra de prueba fue proporcionada al autor en calidad de préstamo por el fabricante o el minorista a los efectos de esta reseña. El prestamista no tuvo ninguna influencia en esta reseña, ni el fabricante recibió una copia de la misma antes de su publicación. No había ninguna obligación de publicar esta reseña. Como empresa de medios independiente, Notebookcheck no está sujeta a la autoridad de fabricantes, minoristas o editores.
Así es como prueba Notebookcheck
Cada año, Notebookcheck revisa de forma independiente cientos de portátiles y smartphones utilizando procedimientos estandarizados para asegurar que todos los resultados son comparables. Hemos desarrollado continuamente nuestros métodos de prueba durante unos 20 años y hemos establecido los estándares de la industria en el proceso. En nuestros laboratorios de pruebas, técnicos y editores experimentados utilizan equipos de medición de alta calidad. Estas pruebas implican un proceso de validación en varias fases. Nuestro complejo sistema de clasificación se basa en cientos de mediciones y puntos de referencia bien fundamentados, lo que mantiene la objetividad.Price comparison

