Análisis del portátil HP Envy 17: GeForce La GPU juega en la elegante pantalla 4K del portátil multimedia
La serie de modelos Envy de HP es sinónimo de portátiles potentes para profesionales creativos móviles. En esta serie, el fabricante ofrece modelos que van desde los compactos de 13,3 hasta los grandes de 17,3 pulgadas. El HP Envy 17-cr0079ng se sitúa en el extremo superior, con una gran pantalla UHD de 17,3 pulgadas.
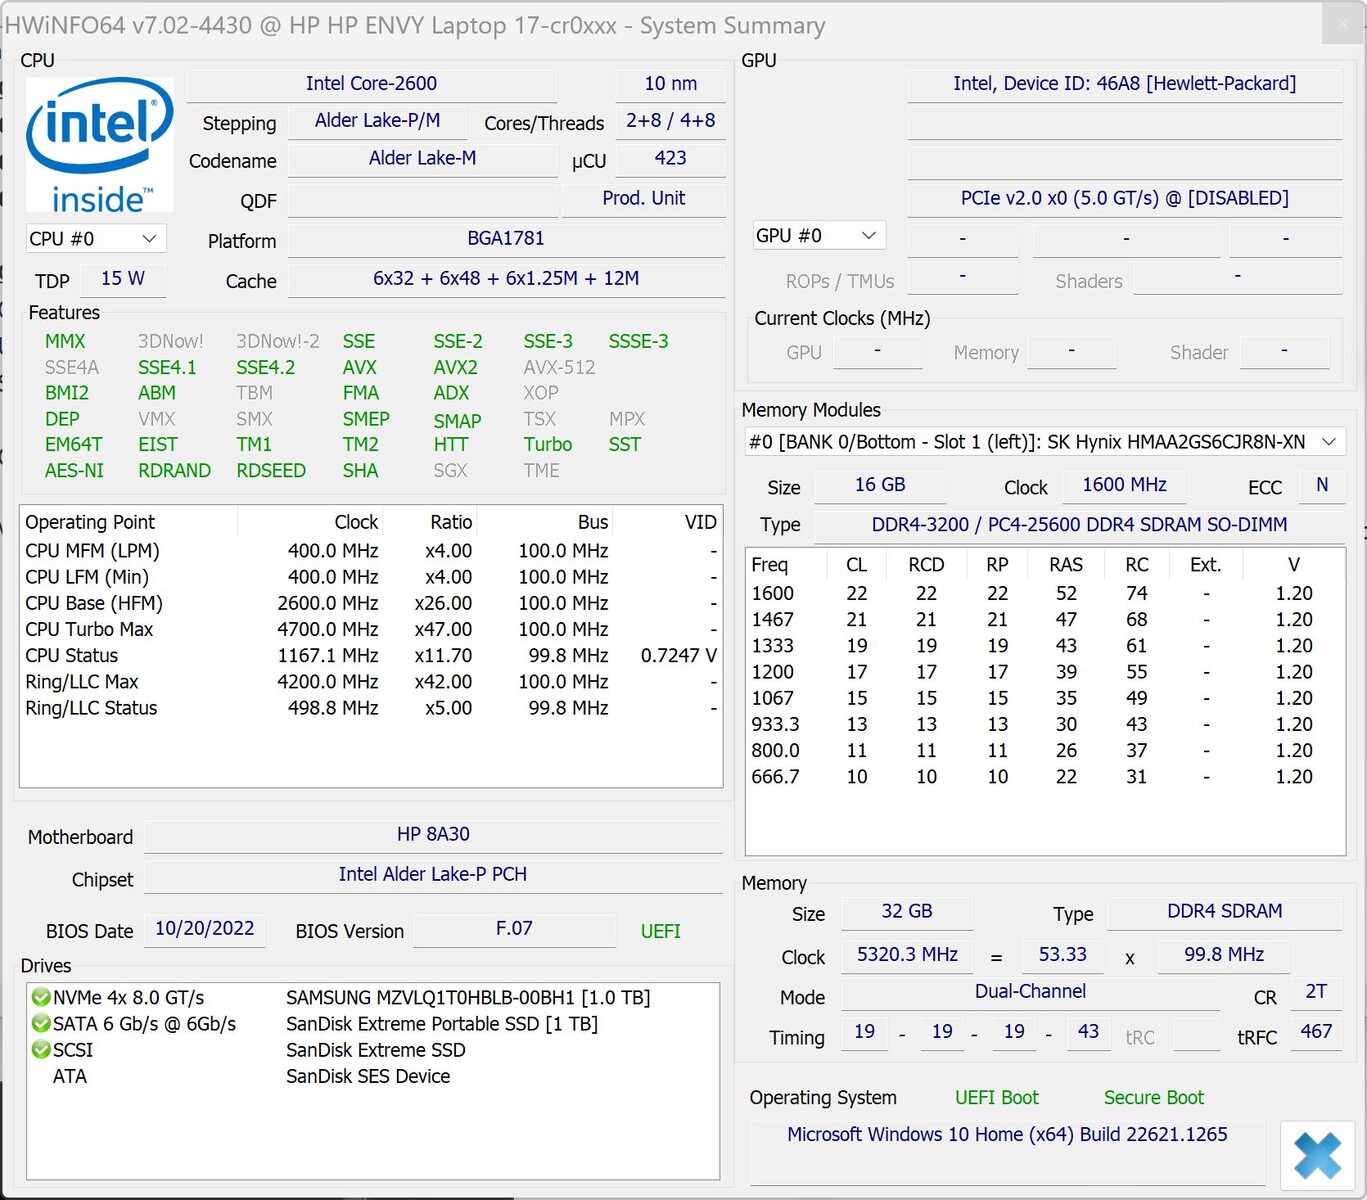
Bajo el capó, el HP Envy 17-cr0079ng también es capaz de ofrecer un buen equipamiento: HP utiliza el procesador Intel Core i7-1255Ude la 12ª generación (Alder Lake), combinándolo con un procesador dedicado Portátil Nvidia GeForce RTX 2050 gPU de gama media-baja con 4 GB GDDR6, 32 GB de memoria de trabajo DDR4, y un gran SSD de 1 TB. Junto con una batería de 55 Wh, esto da como resultado un portátil de 17 pulgadas de ~2,5 kg que ahora tiene que demostrar su valía en nuestra prueba.
En nuestro análisis, el Envy 17 tiene que competir contra otros portátiles con Core i7-1255U, como el más compacto HP ProBook 450 G9 6A180EAy también con la misma solución gráfica, como el Acer Aspire 5 A515-57G-53N8y el 17 pulgadas LG Gram 17campeón de resistencia.
Posibles contendientes en la comparación
Valoración | Fecha | Modelo | Peso | Altura | Tamaño | Resolución | Precio |
|---|---|---|---|---|---|---|---|
| 86.3 % v7 (old) | 04/2023 | HP Envy 17-cr0079ng i7-1255U, GeForce RTX 2050 Mobile | 2.6 kg | 19.6 mm | 17.30" | 3840x2160 | |
| 85 % v7 (old) | 08/2022 | HP ProBook 450 G9 6A180EA i7-1255U, Iris Xe G7 96EUs | 1.7 kg | 19.9 mm | 15.60" | 1920x1080 | |
| 86.4 % v7 (old) | 03/2023 | LG Gram 17Z90Q-E.AD78G i7-1260P, GeForce RTX 2050 Mobile | 1.4 kg | 17.8 mm | 17.00" | 2560x1600 | |
| 80.7 % v7 (old) | 09/2022 | Acer Aspire 5 A515-57G-53N8 i5-1240P, GeForce RTX 2050 Mobile | 1.8 kg | 18 mm | 15.60" | 1920x1080 | |
| 89.3 % v7 (old) | 06/2022 | Dell XPS 17 9720 i7-12700H, GeForce RTX 3050 4GB Laptop GPU | 2.5 kg | 19.5 mm | 17.00" | 3840x2400 | |
| 79.4 % v7 (old) | 03/2023 | Lenovo IdeaPad 3 17ABA7 R5 5625U, Vega 7 | 2 kg | 19.9 mm | 17.30" | 1920x1080 |
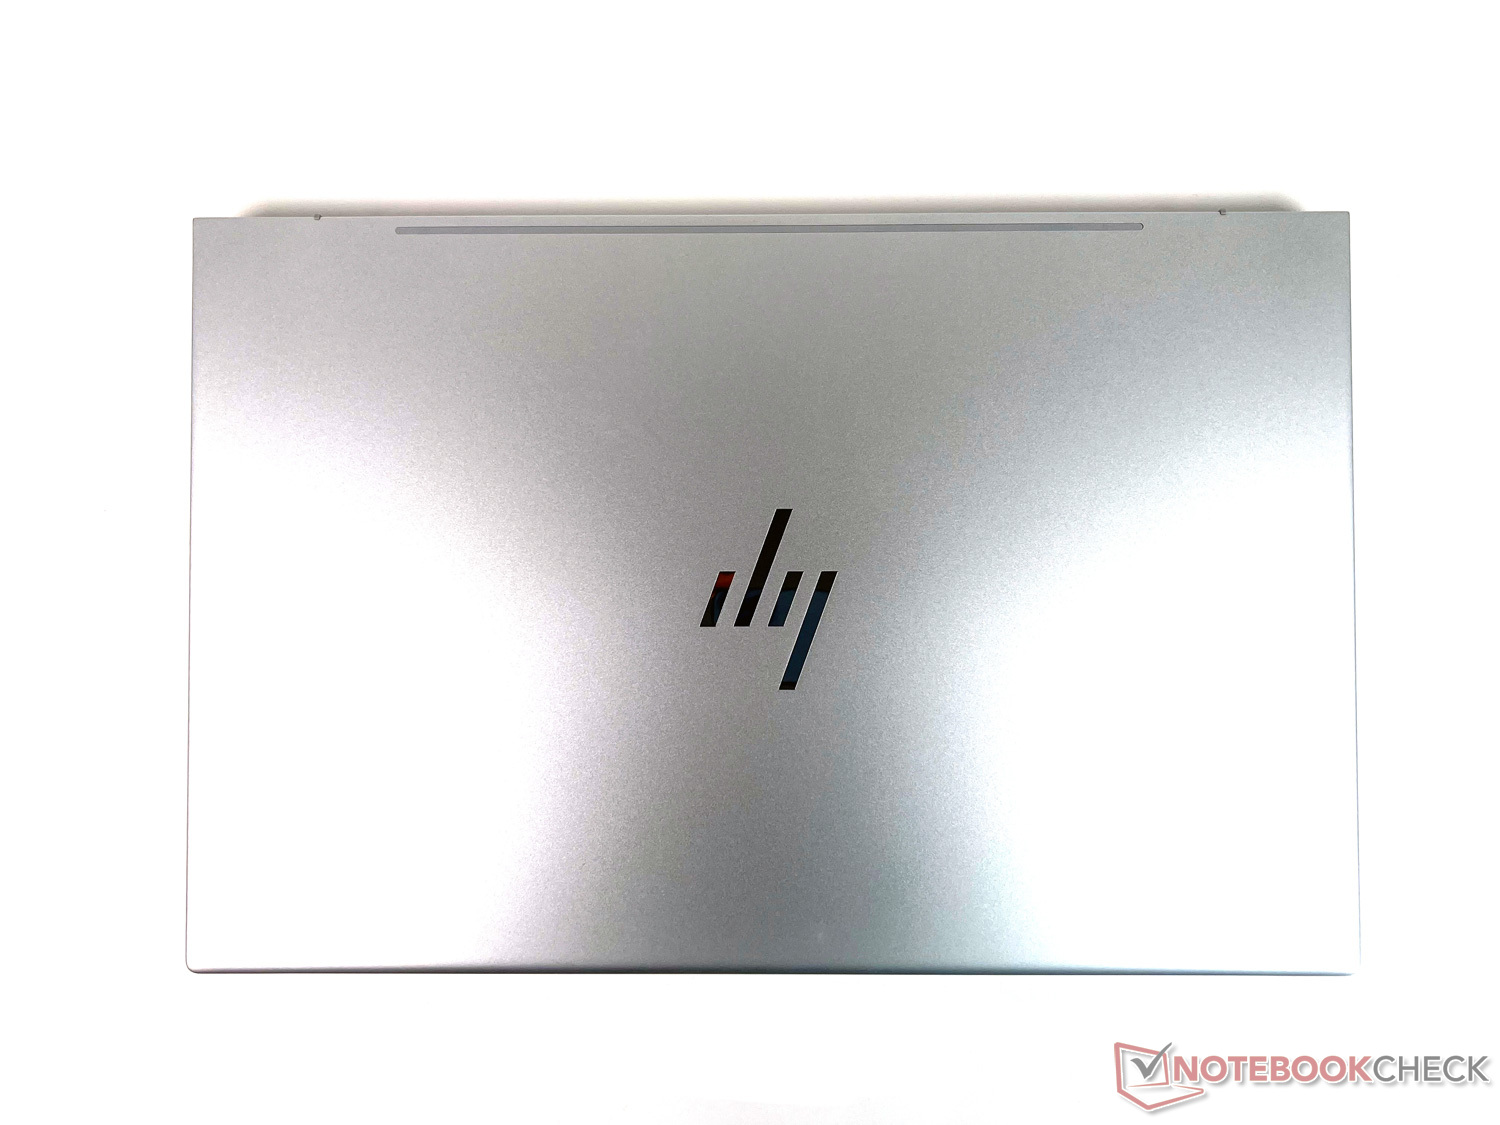
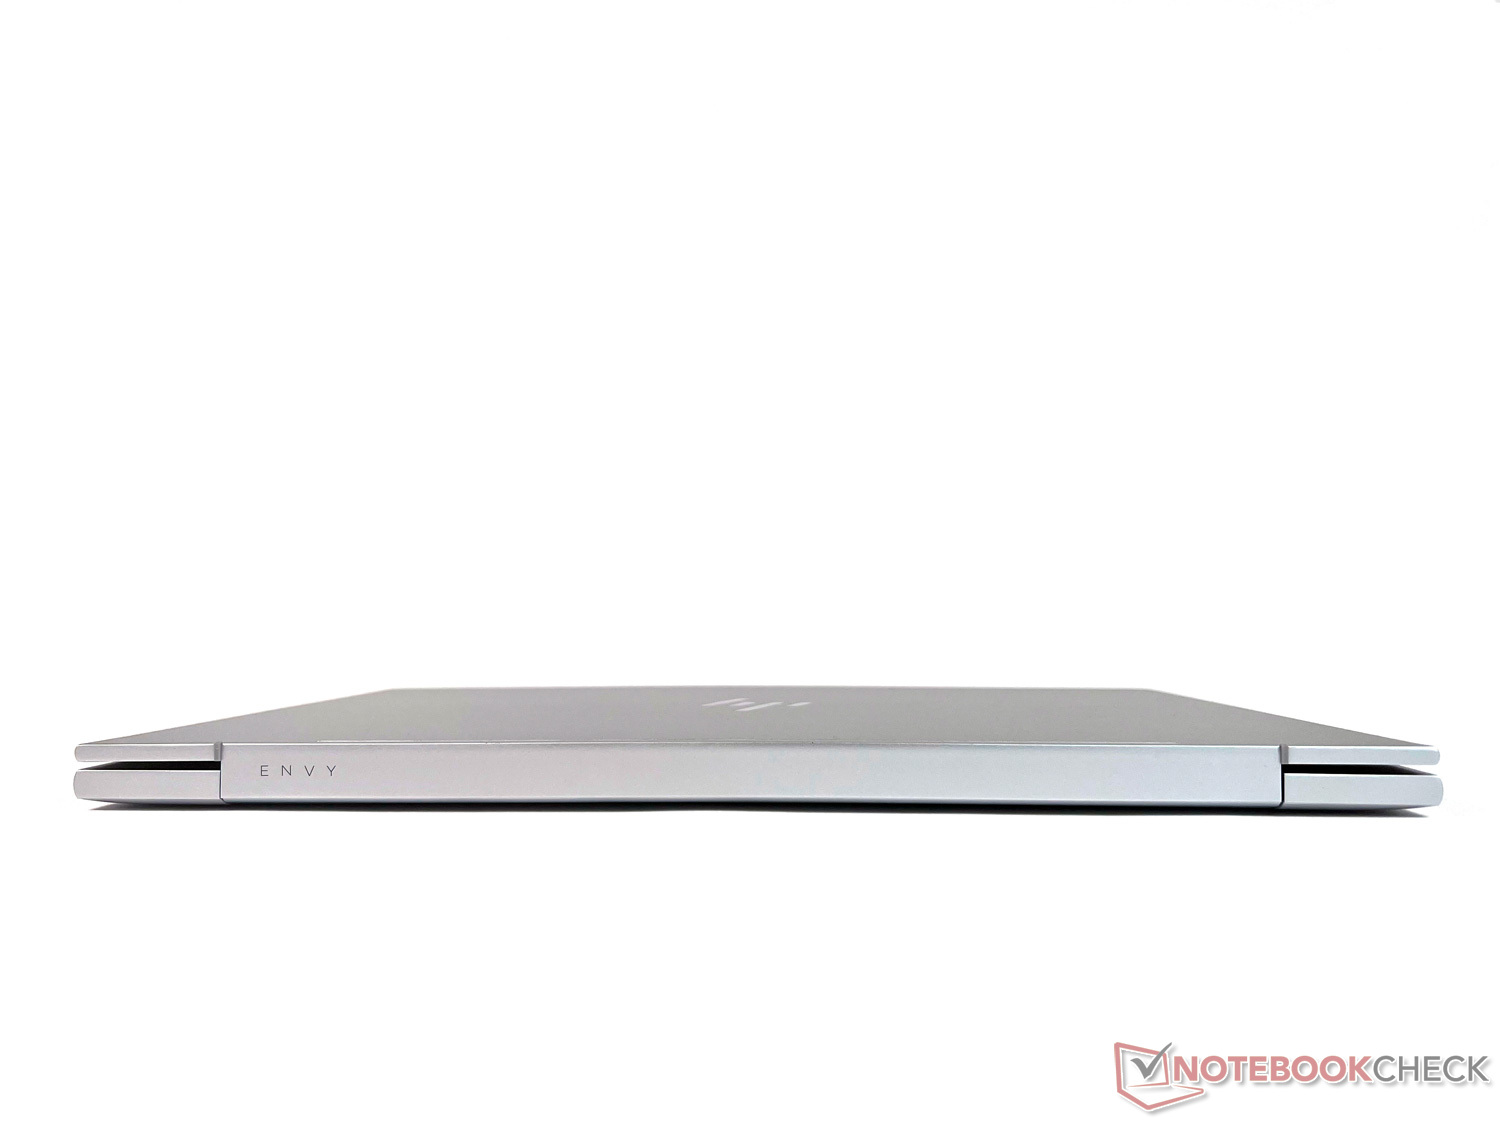
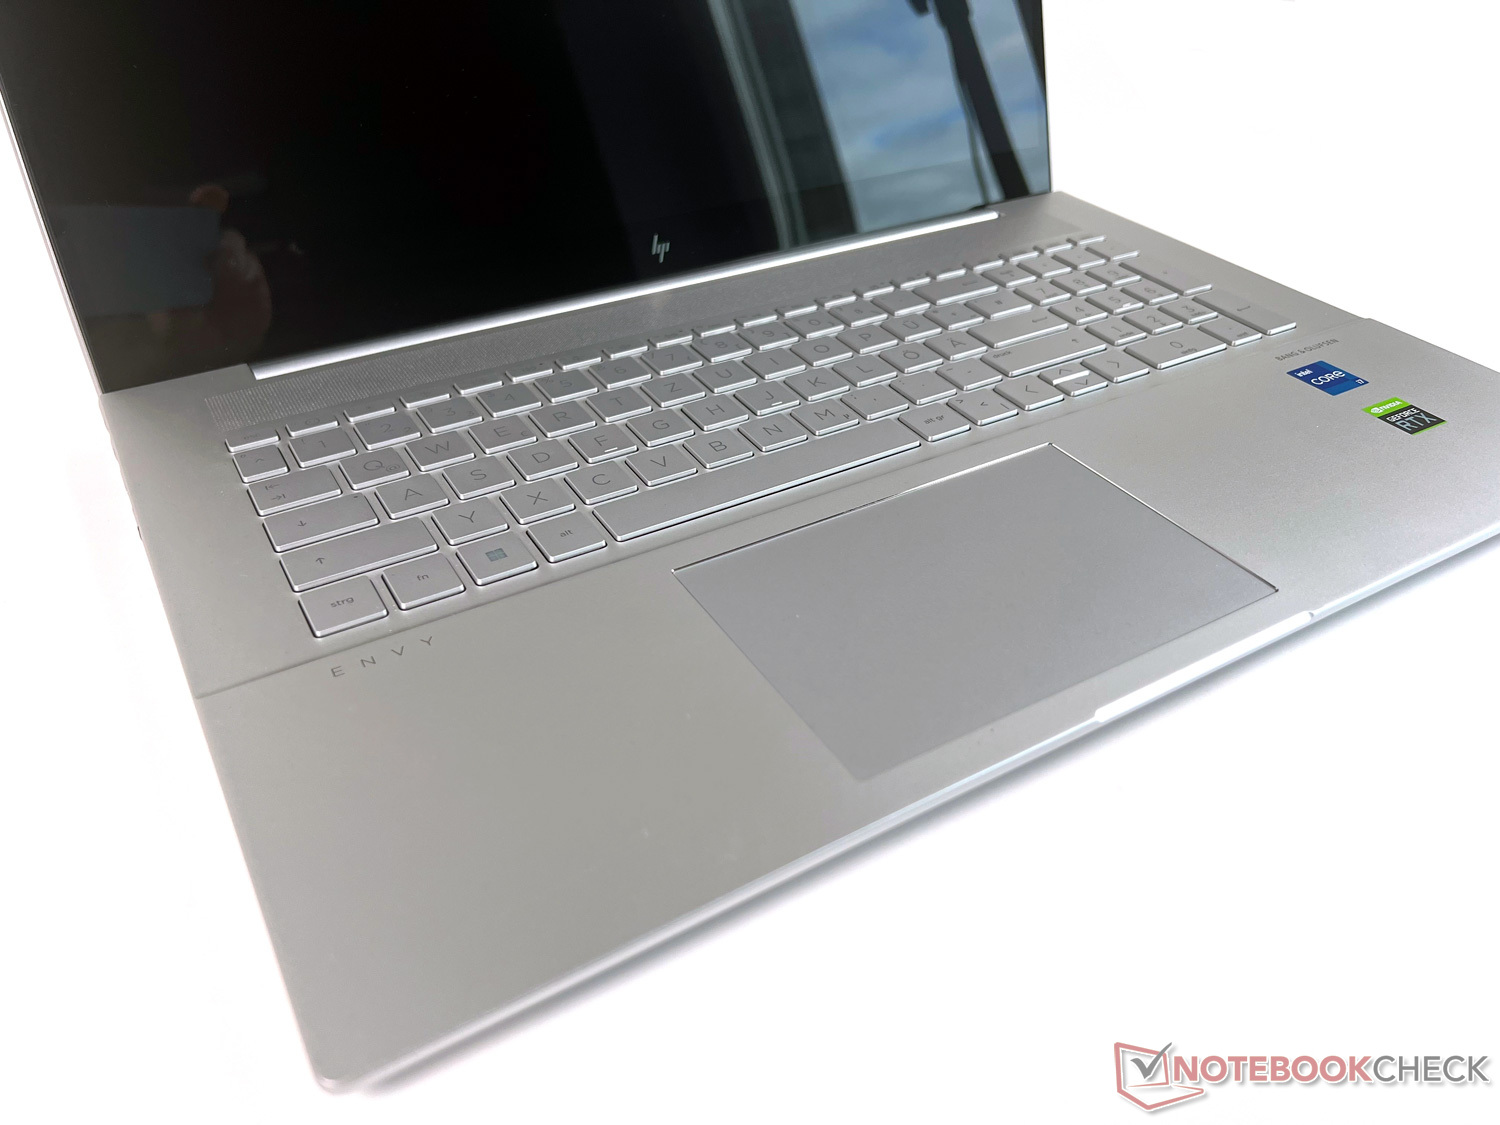
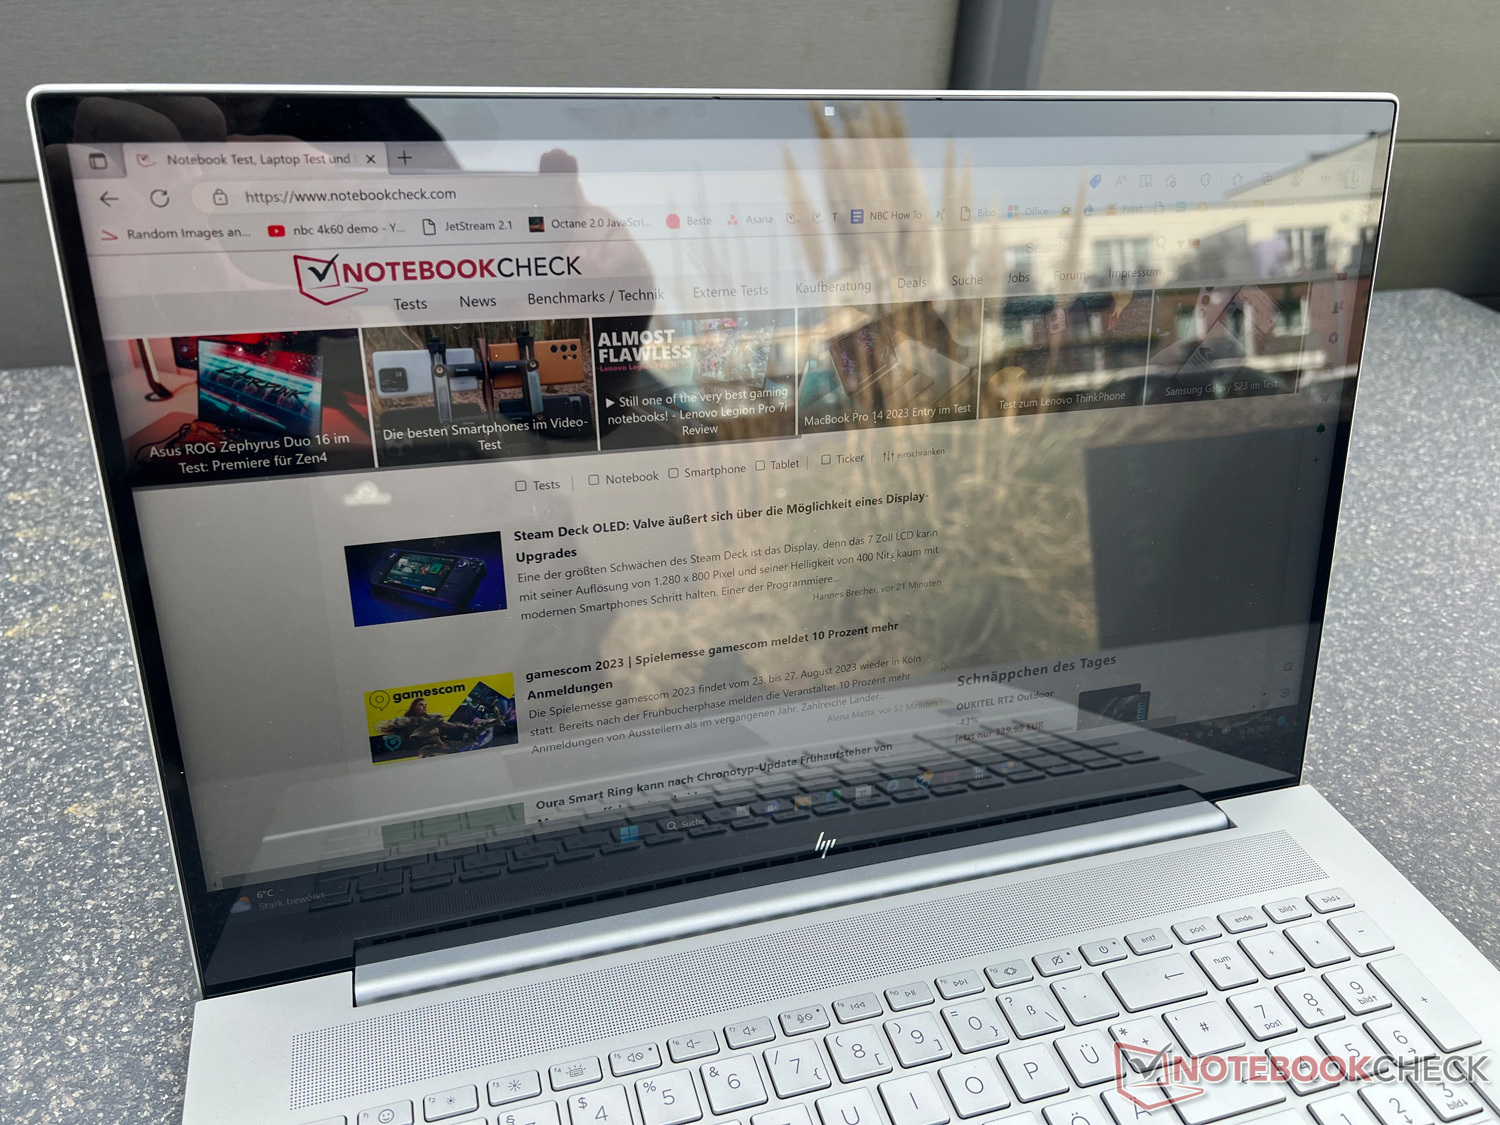
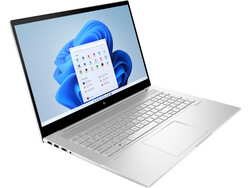
Caja: Elegante y sencilla en color plata
El HP Envy 17 se presenta con un diseño sencillo en color plateado. Aunque la mayor parte de la carcasa está hecha de plástico, ofrece una impresión de alta calidad con buena mano de obra. La amplia bisagra mantiene la gran pantalla bastante apretada en su sitio, por lo que hay que usar ambas manos para abrir el portátil.
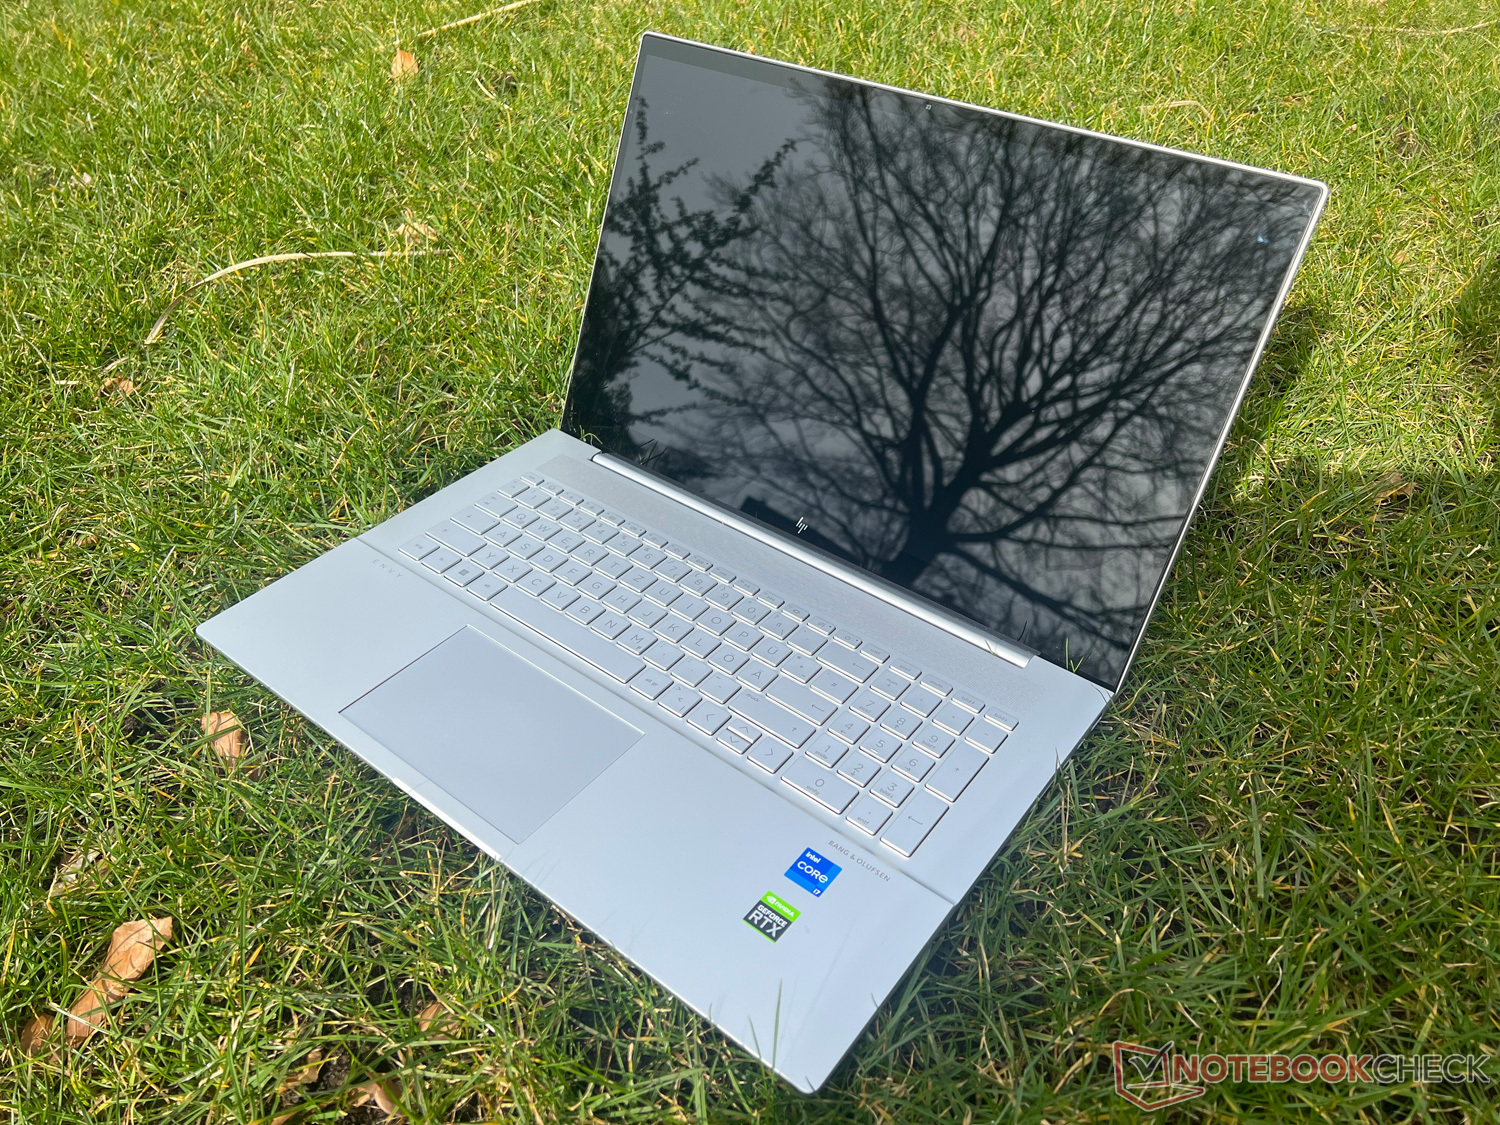
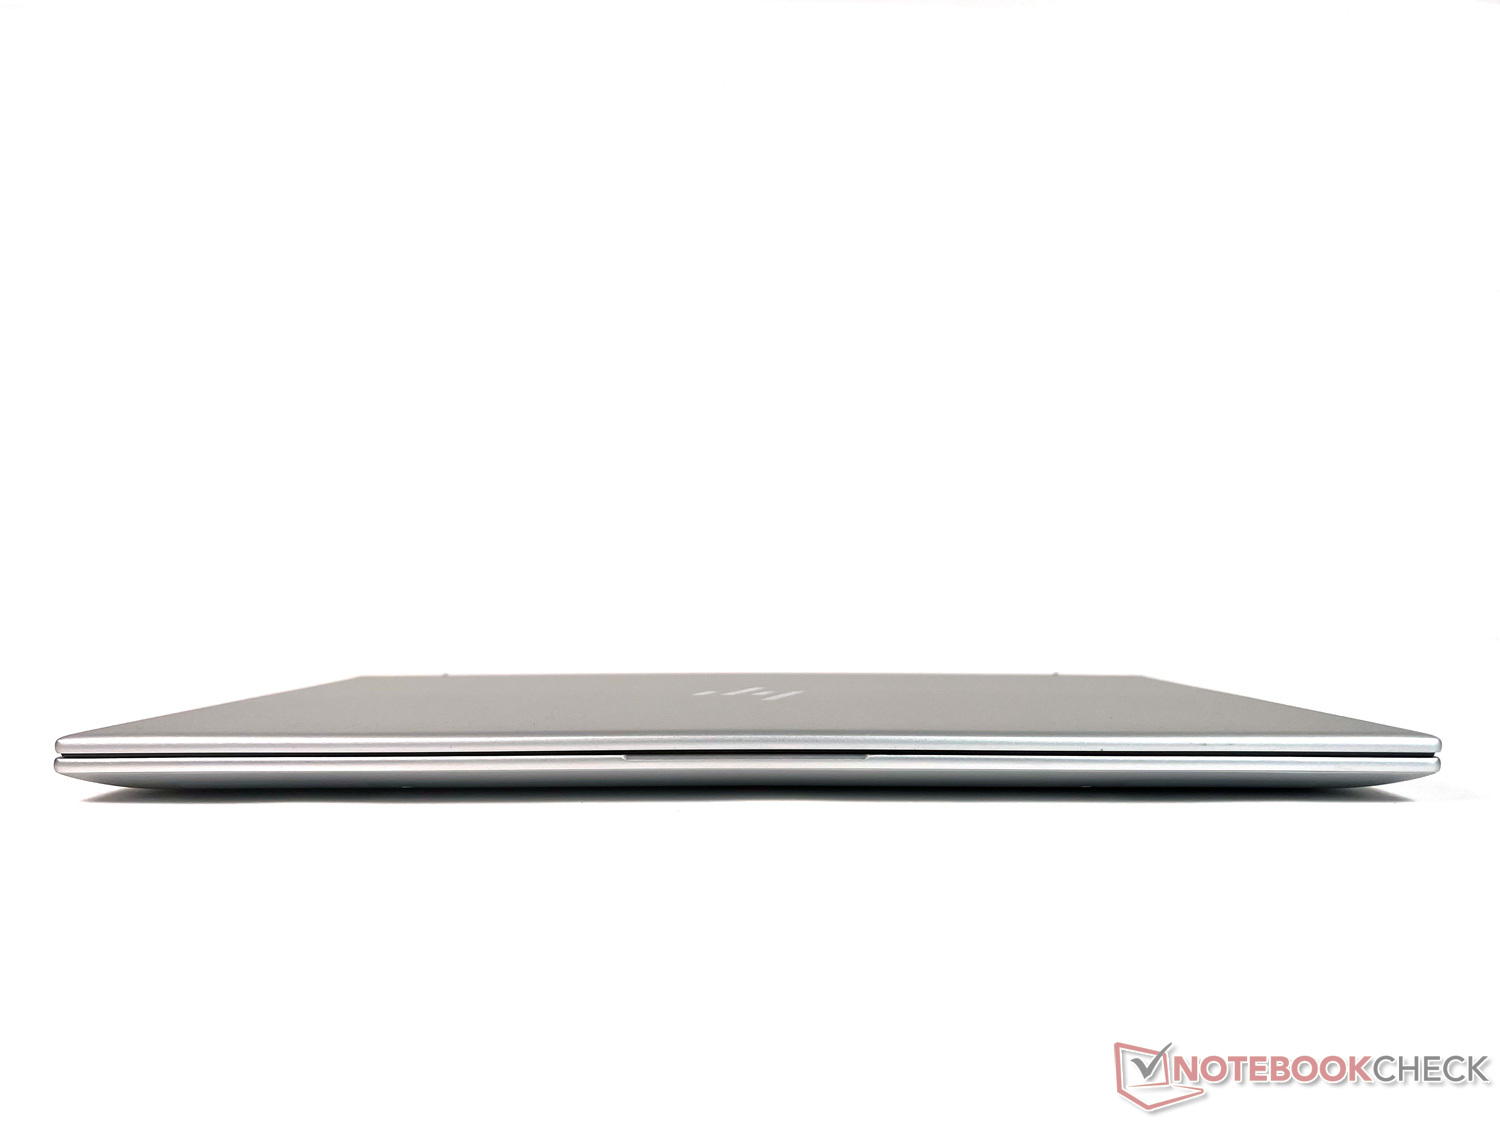
Como portátil de 17 pulgadas, el HP Envy 17 no es, por supuesto, muy compacto. Pero gracias a los delgados biseles de la pantalla, particularmente en los lados izquierdo y derecho, el tamaño total se mantiene dentro de los límites. Comparado con otros dispositivos grandes de 17 pulgadas, se sitúa en el medio del campo de pruebas.
Los ~2,5 kg de peso más los 500 g del cargador repercuten en el uso móvil. La gran diagonal de pantalla exige lo suyo. Sin embargo, incluso con ese tamaño, los portátiles pueden ser más ligeros, como demuestran los competidores. Nuestra unidad de pruebas es uno de los modelos más pesados aquí, lo que es un punto negativo para el uso móvil.
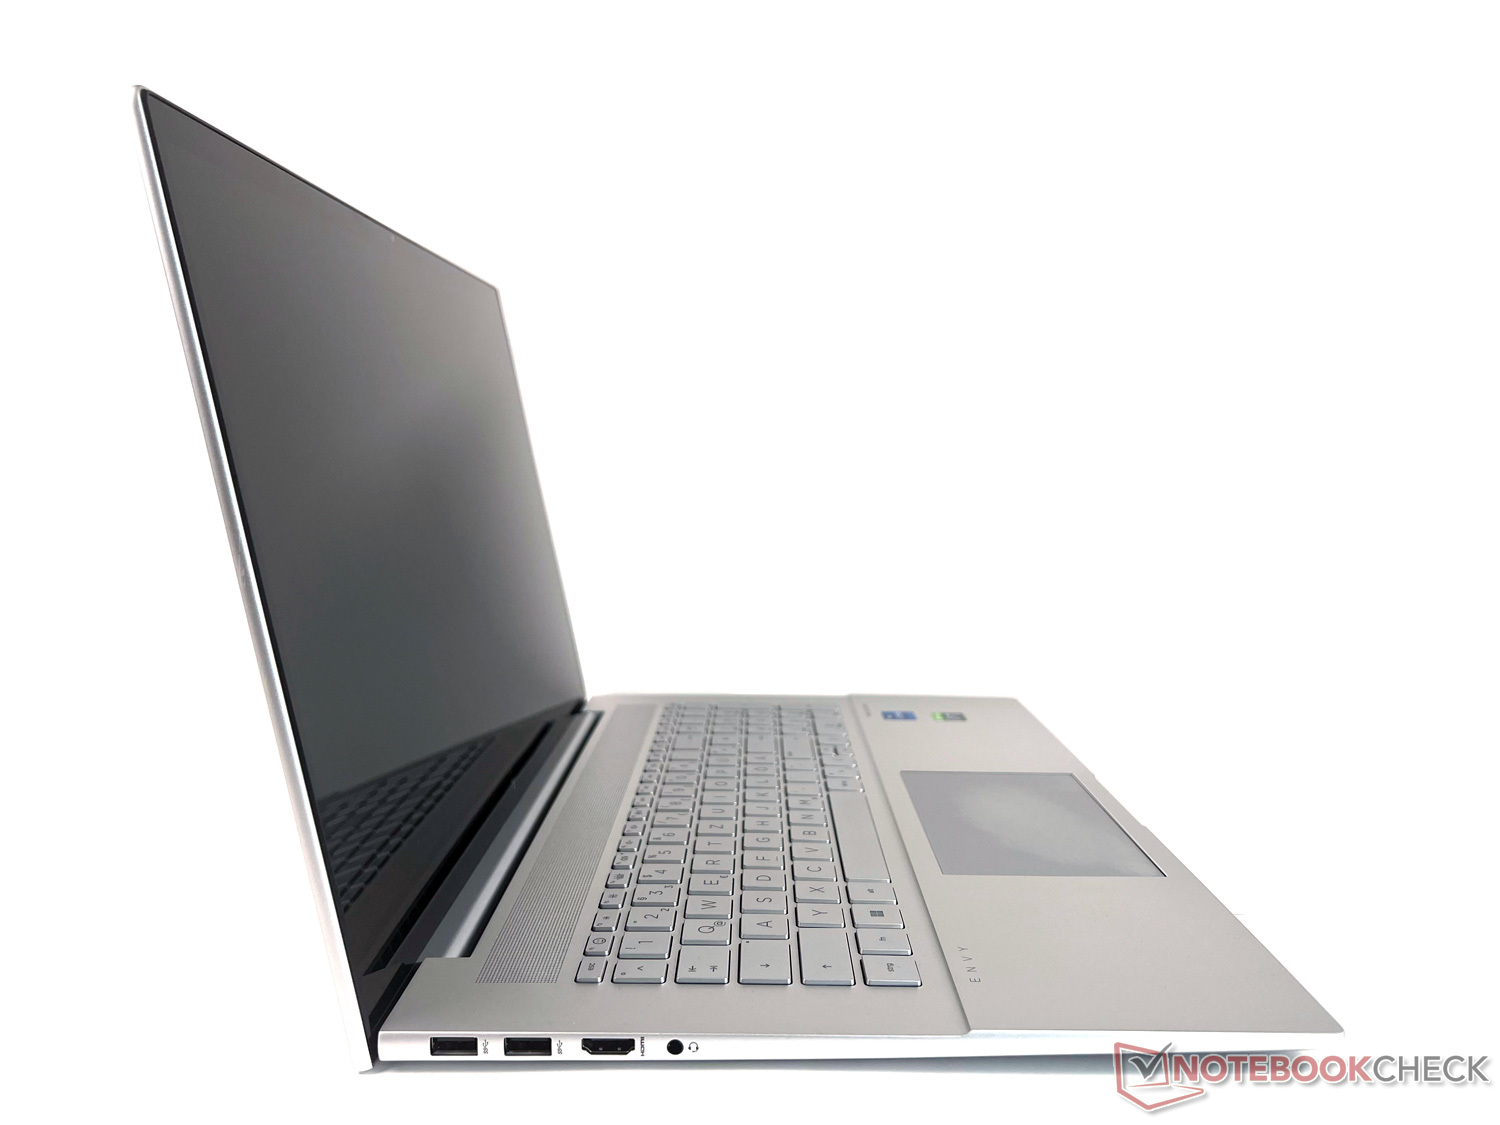
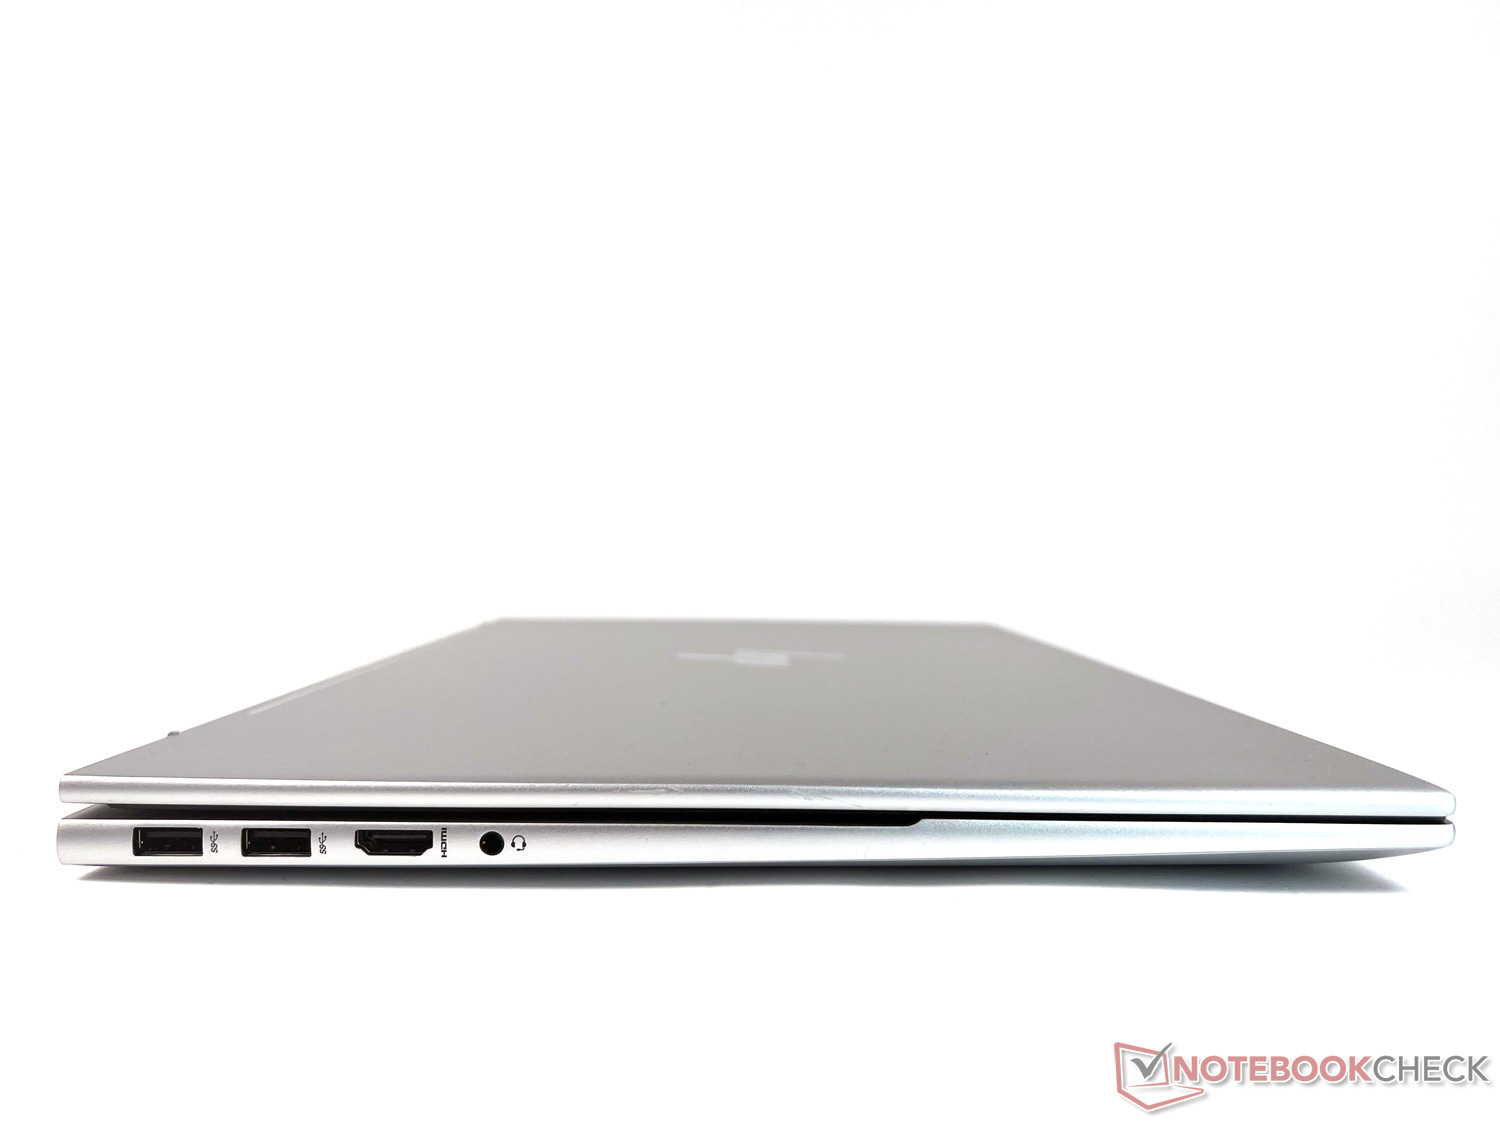
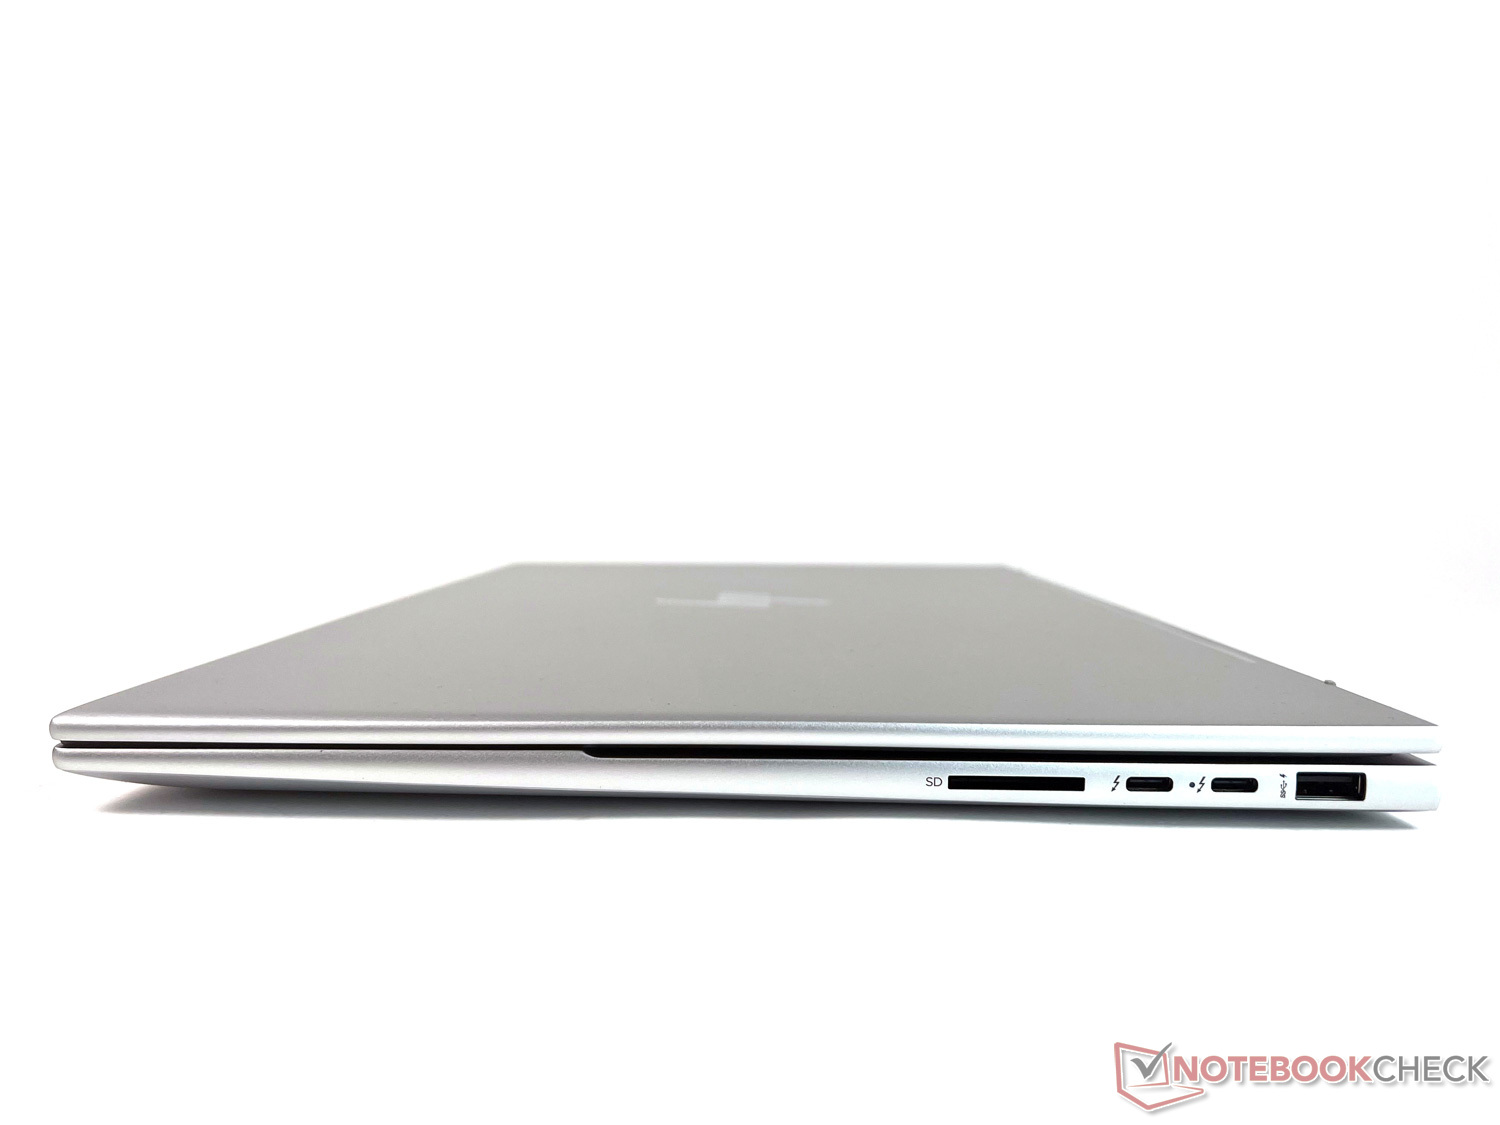
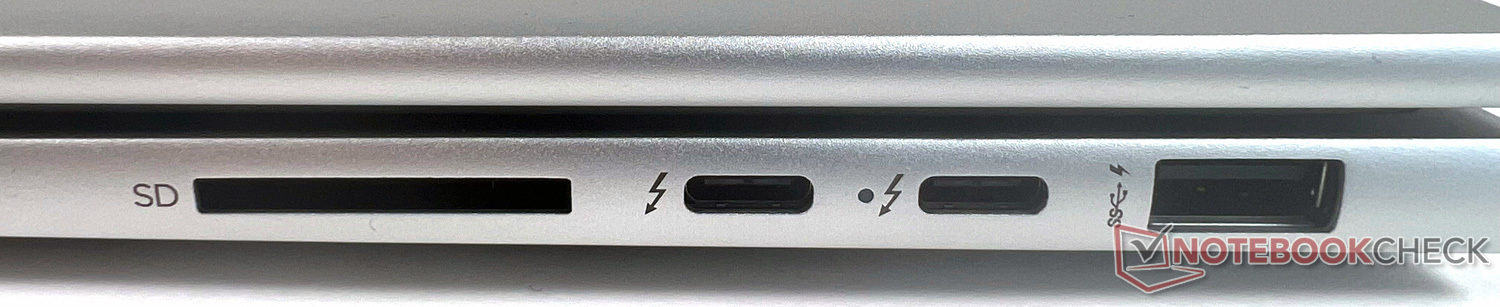
Equipamiento: Portátil multimedia con 2x Thunderbolt 4
El Envy 17 ofrece un amplio equipamiento de puertos, salvo un puerto LAN. Incluye dos puertos Thunderbolt 4 con USB 4 Type-C para transferencia de datos de hasta 40 Gbit/s, carga, y DisplayPort 1.4, con ambos puertos situados en el lado derecho. En algunas situaciones, distribuirlos por ambos lados sería más deseable. Uno de los puertos Thunderbolt es utilizado por el cargador incluido para suministrar la energía.
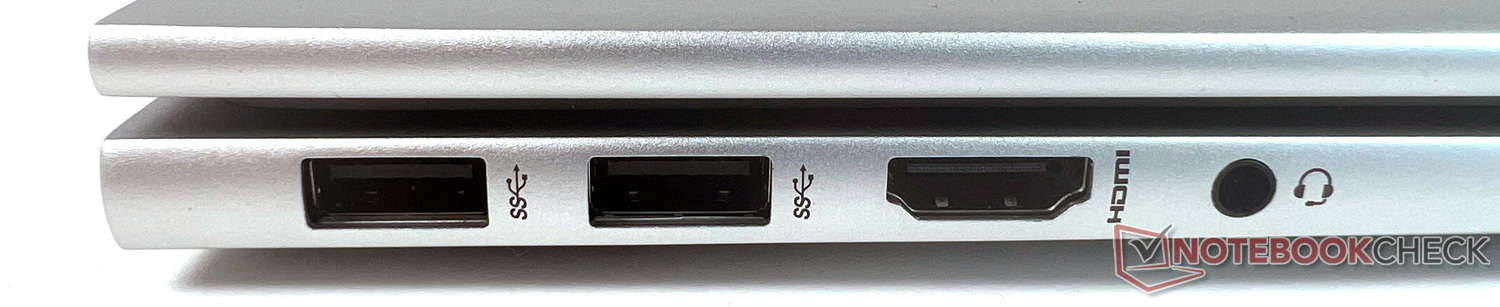
En el lado izquierdo, un puerto HDMI-2.1 permite conectar un monitor externo, alternativamente a la conexión DisplayPort. Tres puertos USB-A adicionales distribuidos por ambos lados son suficientes, y también hay un lector de tarjetas SD. Todas las conexiones son fácilmente accesibles.
Lector de tarjetas SD
El lector de tarjetas SD integrado no es uno de los representantes más rápidos de su clase. En nuestras mediciones utilizando nuestra tarjeta de almacenamiento de referencia AV PRO microSD 128 GB V60, siempre queda en último lugar, pero la distancia que le separa de la mayoría de los competidores no es muy grande. Sin embargo, quienes necesiten copiar a menudo grandes cantidades de datos de una tarjeta de almacenamiento seguirán estando mejor servidos por otros dispositivos.
| SD Card Reader | |
| average JPG Copy Test (av. of 3 runs) | |
| Dell XPS 17 9720 (Toshiba Exceria Pro SDXC 64 GB UHS-II) | |
| Media de la clase Multimedia (23 - 531, n=37, últimos 2 años) | |
| Lenovo IdeaPad 3 17ABA7 (AV Pro SD microSD 128 GB V60) | |
| LG Gram 17Z90Q-E.AD78G (AV Pro SD microSD 128 GB V60) | |
| HP Envy 17-cr0079ng (AV Pro SD microSD 128 GB V60) | |
| maximum AS SSD Seq Read Test (1GB) | |
| Media de la clase Multimedia (37.3 - 1455, n=36, últimos 2 años) | |
| Dell XPS 17 9720 (Toshiba Exceria Pro SDXC 64 GB UHS-II) | |
| LG Gram 17Z90Q-E.AD78G (AV Pro SD microSD 128 GB V60) | |
| Lenovo IdeaPad 3 17ABA7 (AV Pro SD microSD 128 GB V60) | |
| HP Envy 17-cr0079ng (AV Pro SD microSD 128 GB V60) | |
Comunicación
El módulo Wi-Fi 6E AX211 de Intel usado aquí asegura una conexión WLAN rápida que casi permanece constante en el tiempo. Nuestras mediciones están al nivel de la media para este módulo WLAN. No hay disponible una conexión de red por cable en forma de puerto LAN o conexión móvil.
Cámara web
La cámara de infrarrojos HP True Vision está situada en el centro del bisel superior de la pantalla. Ofrece supresión temporal del ruido y un micrófono digital integrado de doble matriz. Con 5 MP, su resolución es bastante alta, y también puede usarse para Windows Hello. Aunque la calidad de imagen es buena, tiene un ligero tinte rojizo. Comparado con los competidores de nuestra prueba, tiene la segunda desviación de color más baja, con un sólido ∆E de 8. Esto es absolutamente suficiente para videollamadas profesionales o privadas.
Un truco simpático: el obturador de privacidad no se abre y cierra manualmente mediante un deslizador, sino pulsando una tecla del teclado. Además, una pequeña luz junto a la cámara indica cuándo está activado.


Seguridad
Además de la protección de privacidad para la cámara, el HP Envy 17 también soporta el Trusted Platform Module (firmware TPM). No hay Bloqueo Kensington ni sensor de huellas, pero Windows Hello es compatible con el desbloqueo por reconocimiento facial.
Accesorios
HP incluye un potente cargador USB-C de 90W con el portátil. Opcionalmente, HP también ofrece varios accesorios, pero no están diseñados específicamente para este portátil.
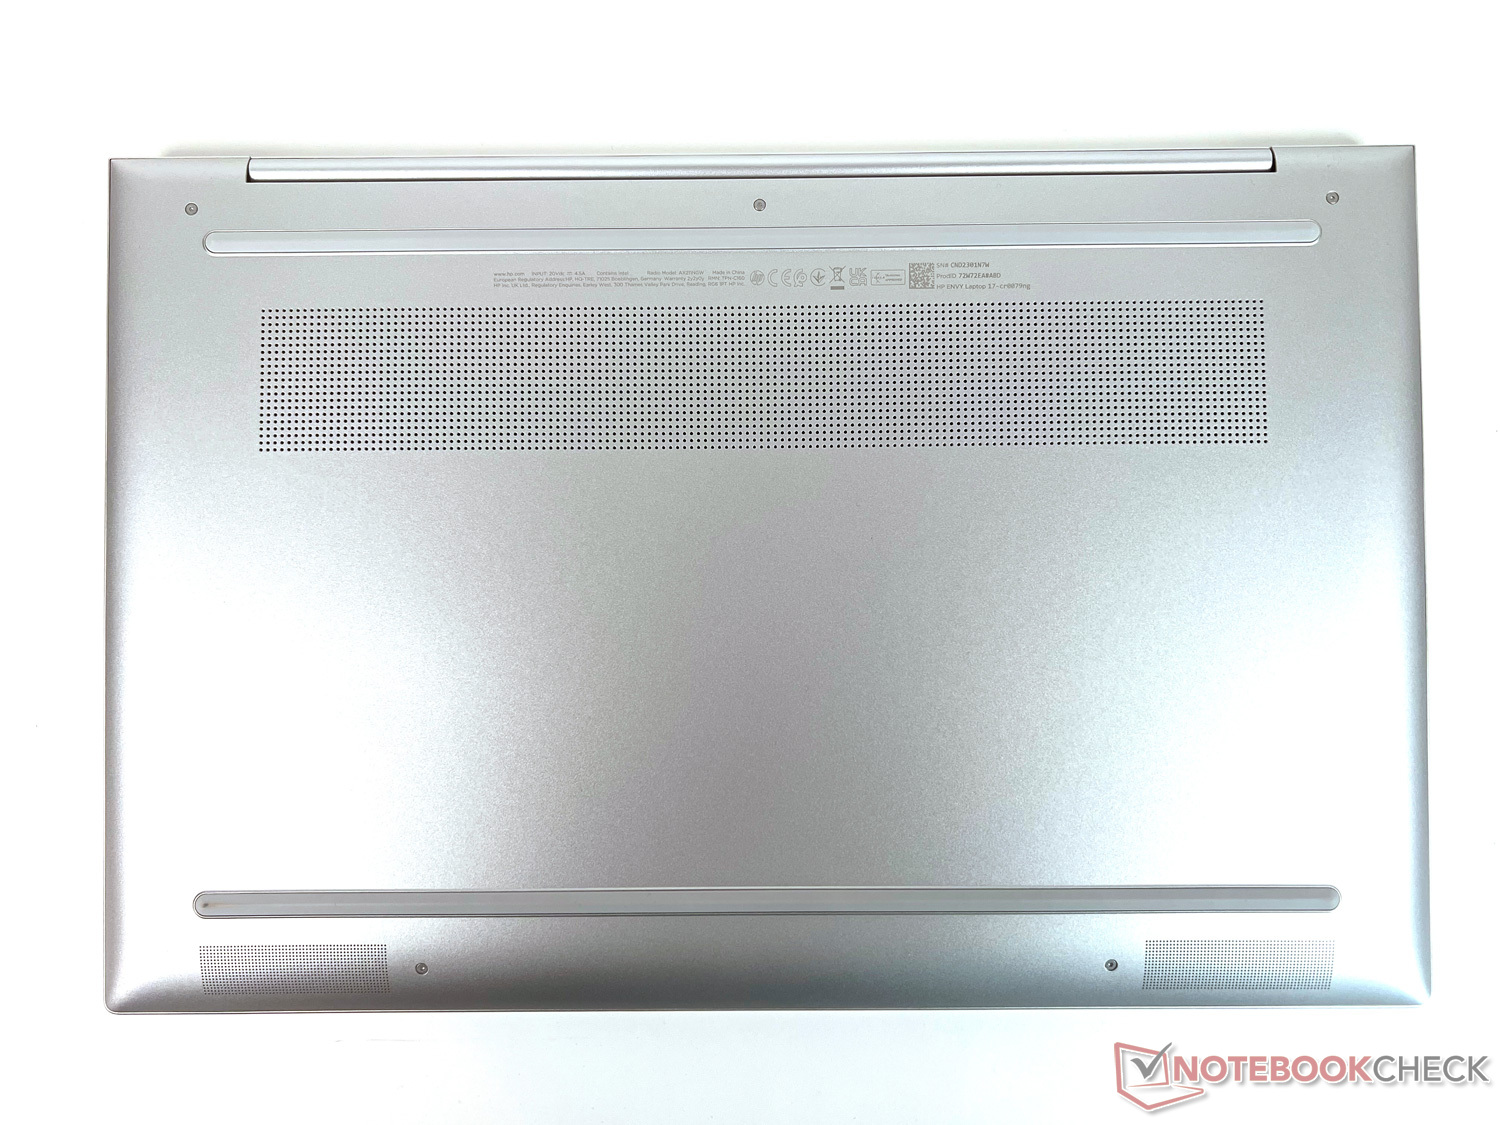
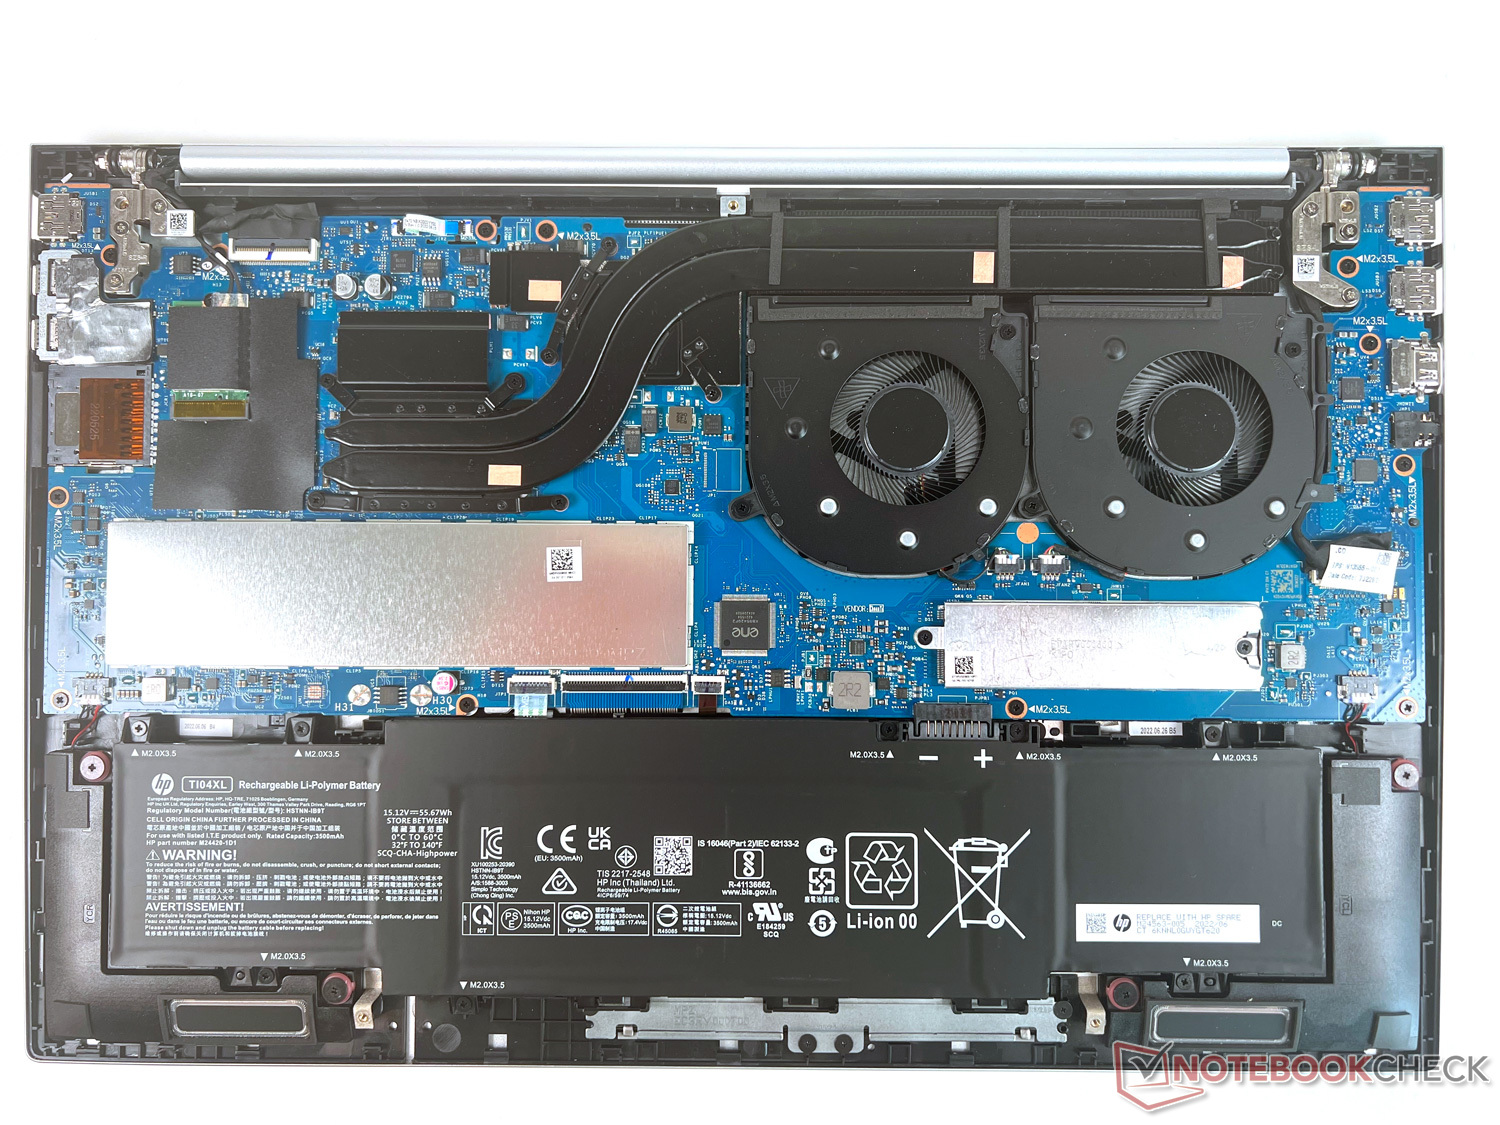
Mantenimiento
El acceso a las entrañas está bloqueado por cinco diminutos tornillos Torx. Una vez conseguido el acceso, apenas se ofrecen posibilidades de mantenimiento. No hay ranuras libres para ampliar el almacenamiento, pero teniendo en cuenta que ya ofrece 32 GB de RAM, esto no debería ser demasiado difícil de aceptar. La batería, el SSD M.2 y el módulo Wi-Fi se pueden cambiar.
Garantía
En Alemania, HP ofrece una garantía del fabricante de 2 años para piezas y mano de obra.
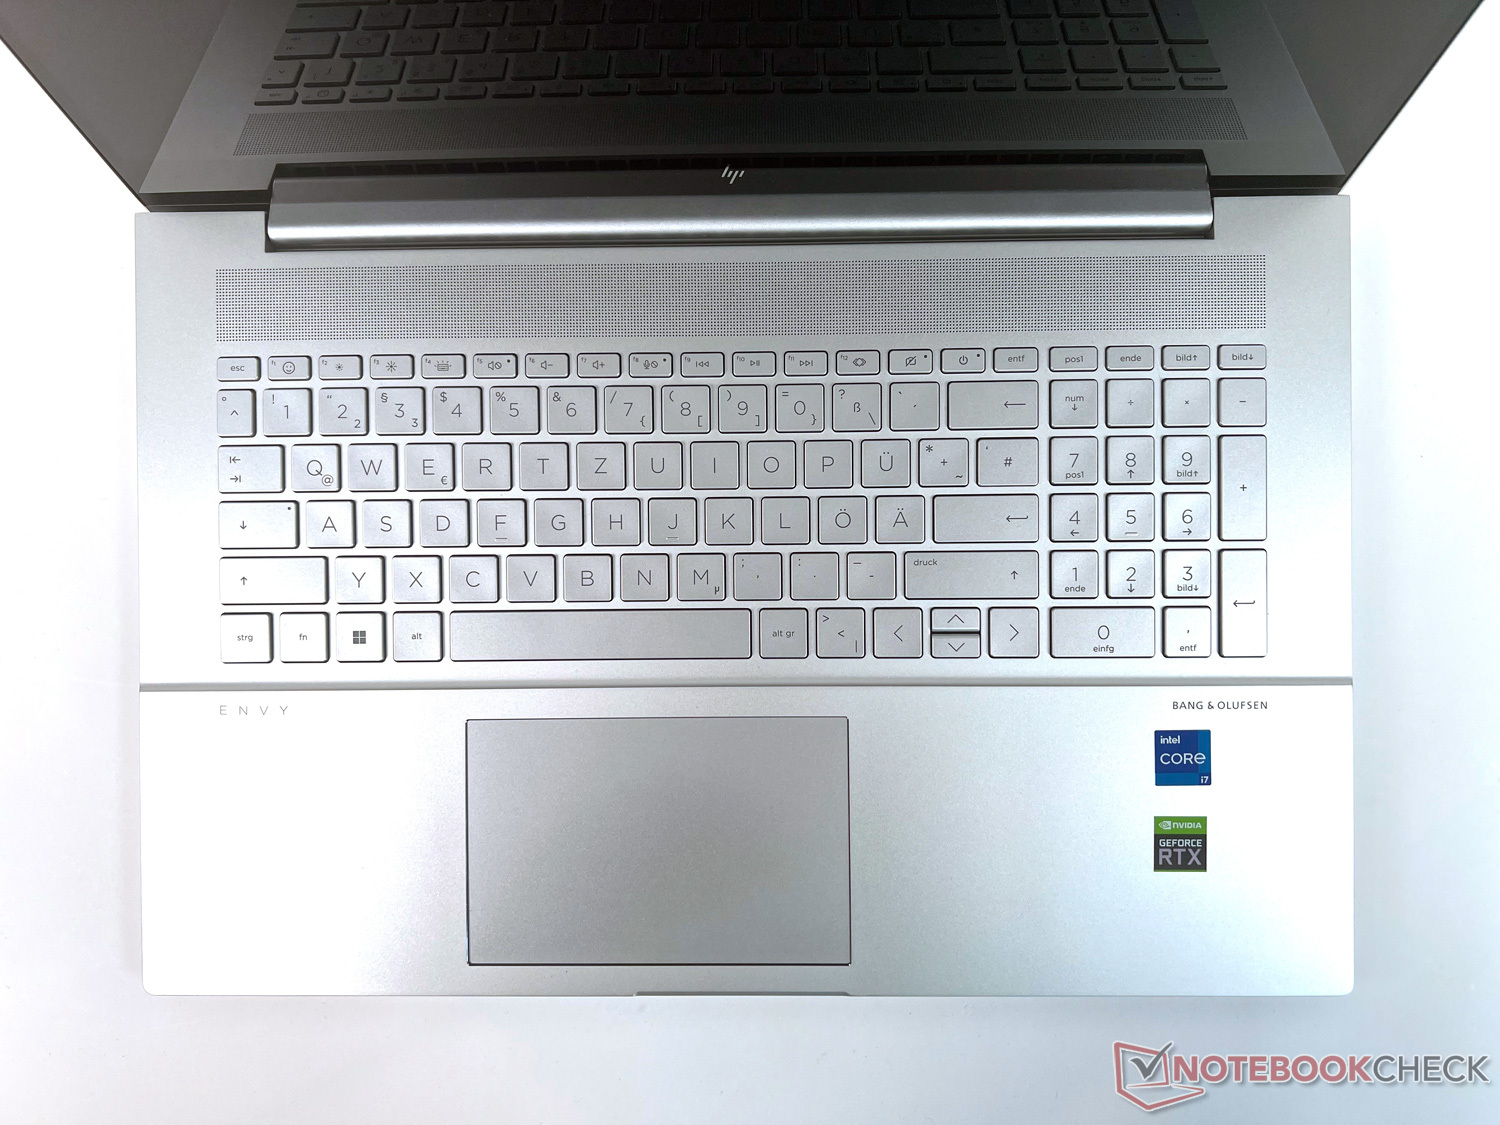
Dispositivos de entrada: El gran teclado no da motivos de queja
Una pantalla de 17,3 pulgadas de diagonal también significa que hay mucho espacio para el teclado. Aparte de unos 3 cm en los bordes, HP usa este espacio para un teclado suficientemente grande junto con un numpad en el lateral.
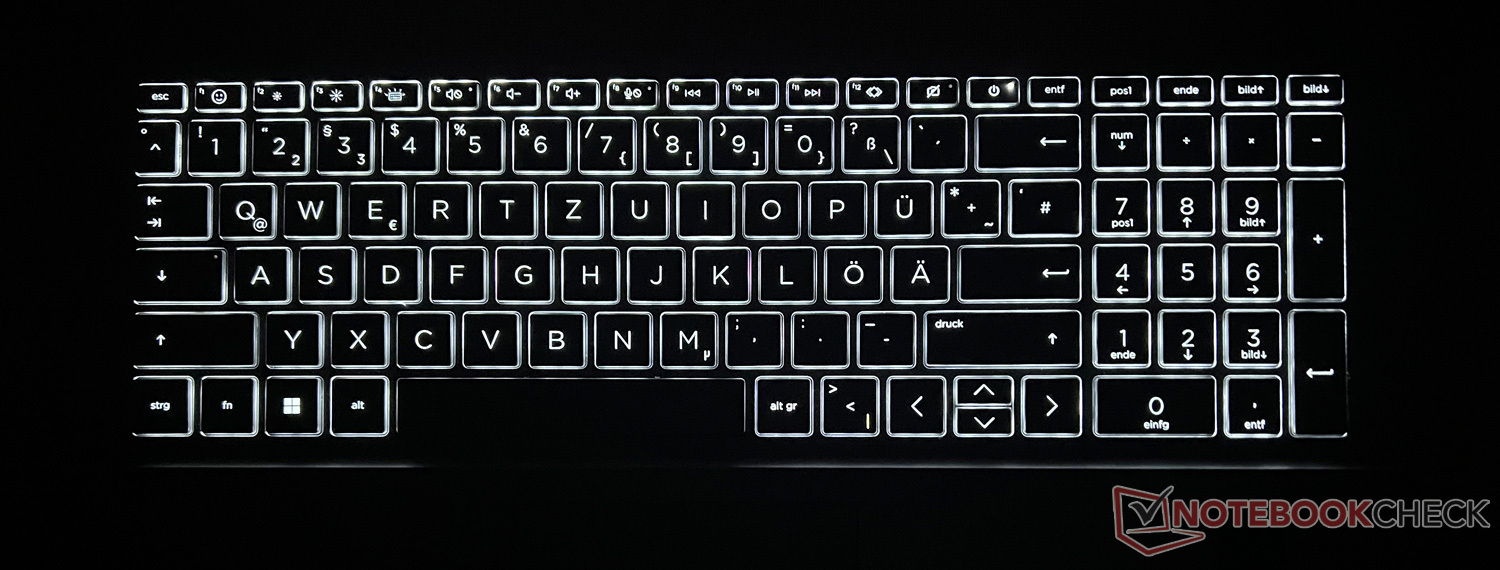
Teclado
Con unas dimensiones de 1,7 x 1,7 cm, las teclas son suficientemente grandes, y con un paso de tecla de unos 2 mm, el teclado ofrece una cómoda experiencia de mecanografiado. El fabricante ocupa las teclas F1 a F12 con las habituales funciones adicionales, por ejemplo para controlar la iluminación del teclado de tres pasos, el volumen, el brillo de la pantalla o el obturador de la cámara que ya hemos mencionado. En el lado derecho está la tecla de encendido para encender el dispositivo.
El teclado numérico es práctico sobre todo para introducir números. La iluminación del teclado garantiza una iluminación uniforme de las teclas y una buena legibilidad de las etiquetas.
Panel táctil
El touchpad está situado debajo del teclado, ligeramente a la izquierda del centro. Con unos 12.5 x 8 cm, no tenemos motivo de queja ni del tamaño ni de la háptica, gracias a la suave superficie. Los clicks izquierdos son posibles en casi toda la superficie del touchpad, y aparte de la esquina inferior derecha, los clicks derechos también. No hay separación háptica de las áreas, pero en la operación diaria no notarás que falte.
La respuesta a las entradas es rápida y sin problemas. Se admiten gestos multitáctiles como el desplazamiento con dos dedos o el acercamiento y alejamiento.
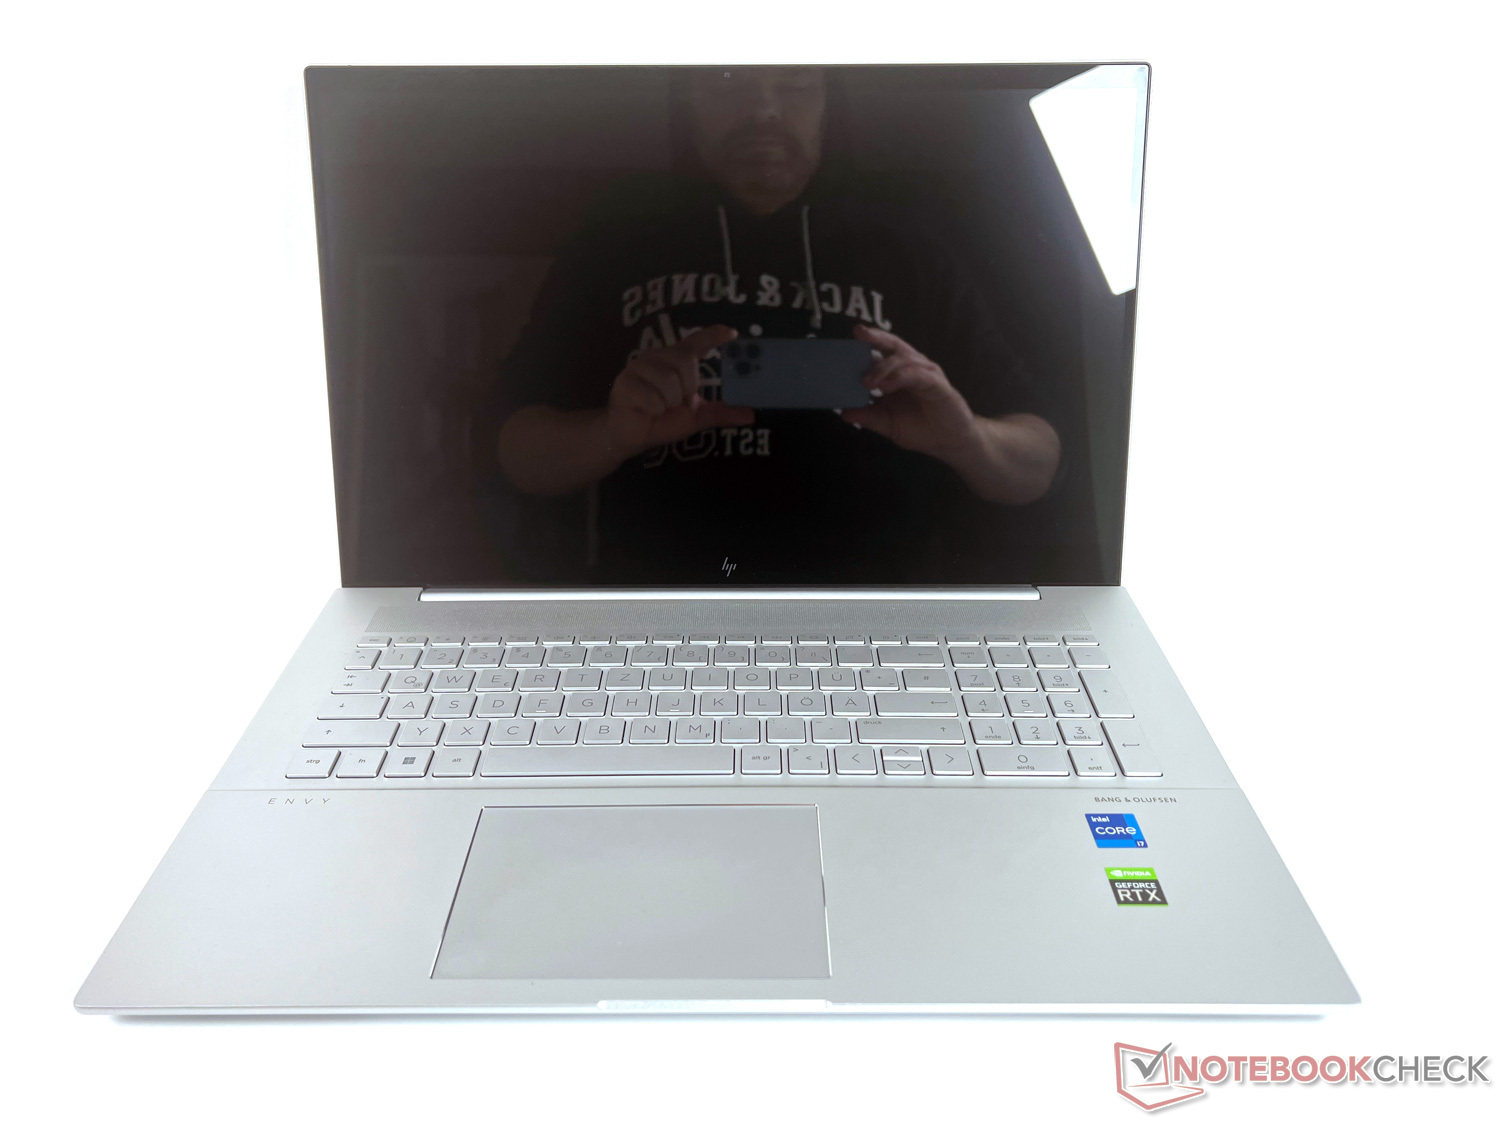
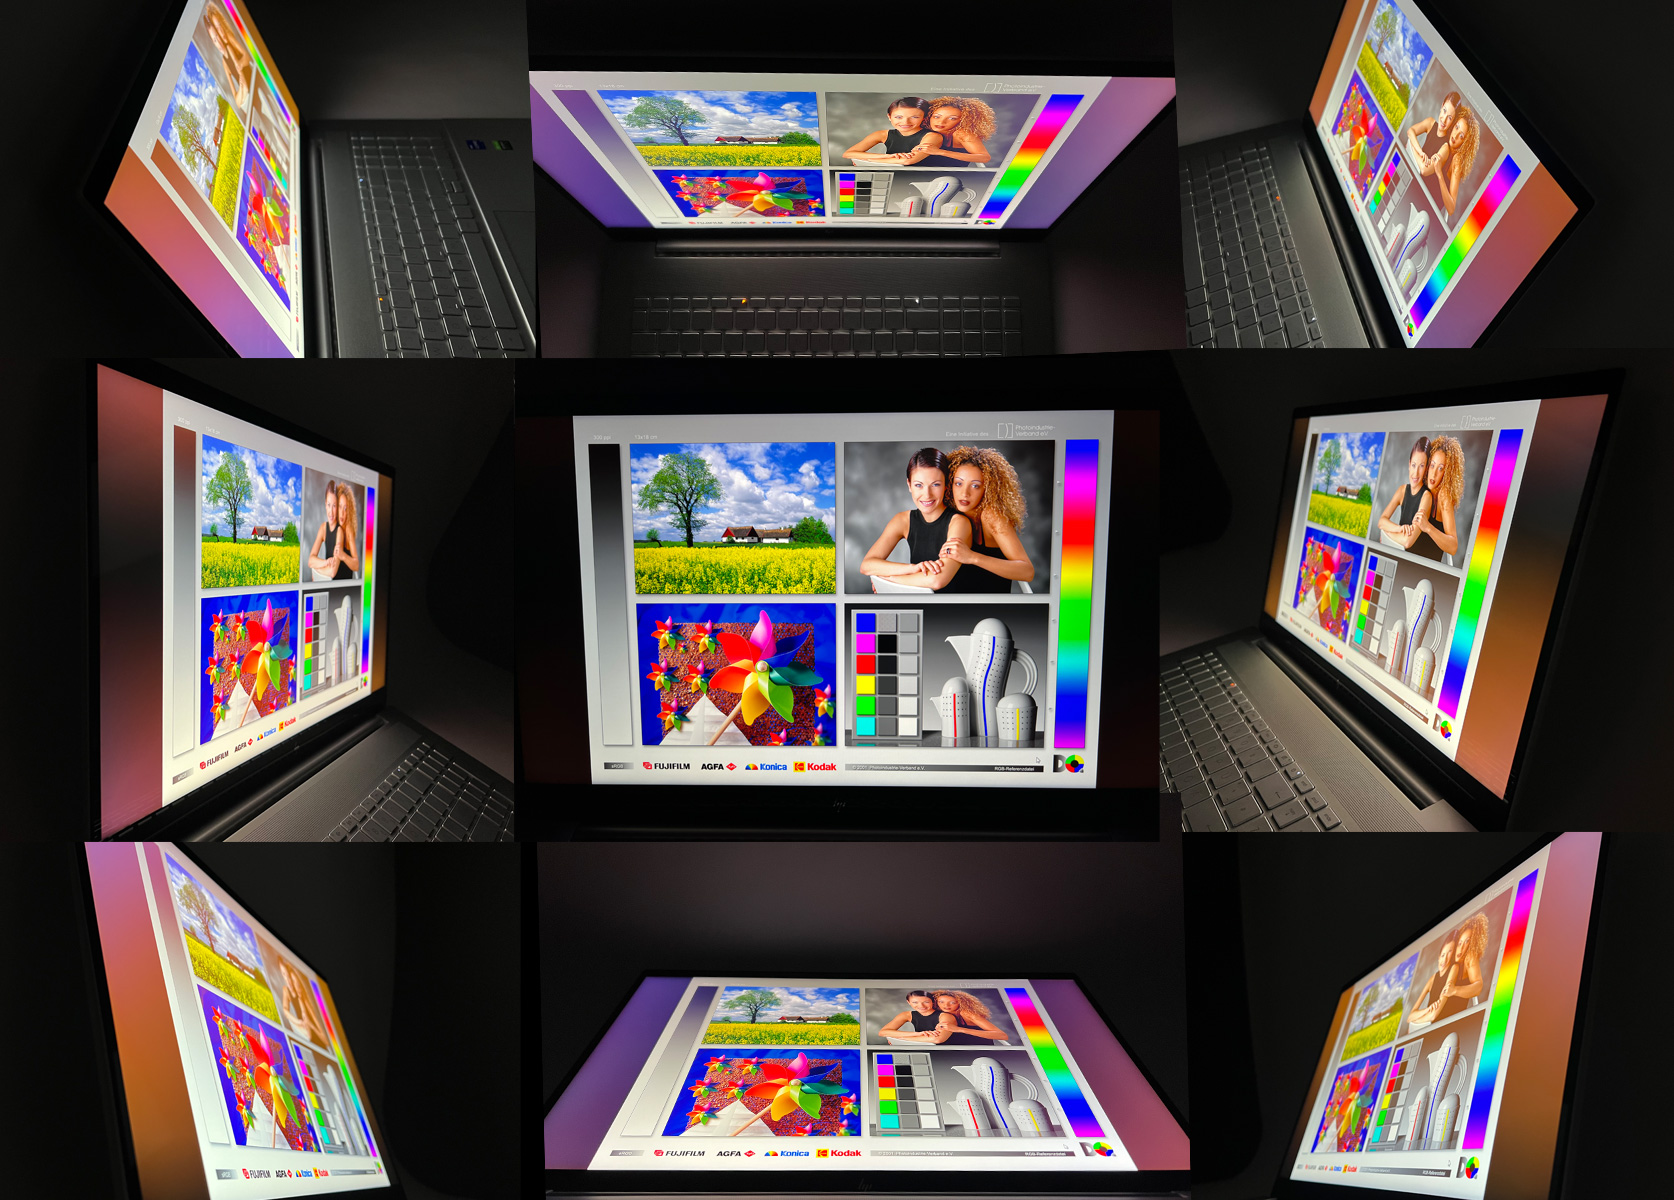
Pantalla: Alta resolución y buena, pero muy reflectante
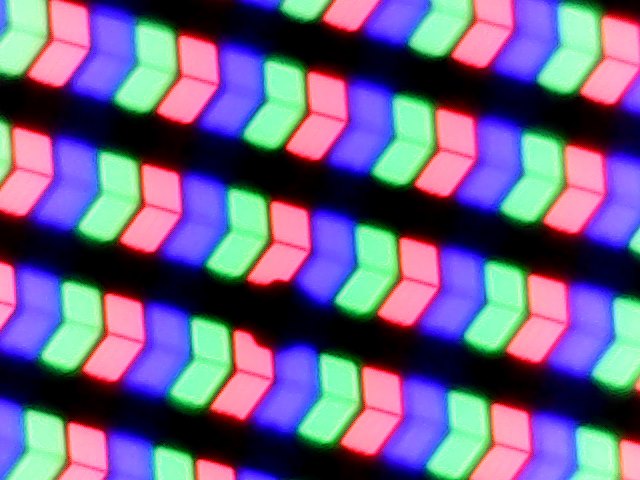

HP ha equipado el Envy 17-cr0079ng con un gran panel IPS 4K de alta resolución de 17,3 pulgadas de BOE con 3.840 x 2.160 píxeles, 60 Hz y tiempos de respuesta cortos. Como alternativa, también puedes elegir versiones con pantalla FHD en esta serie de modelos.
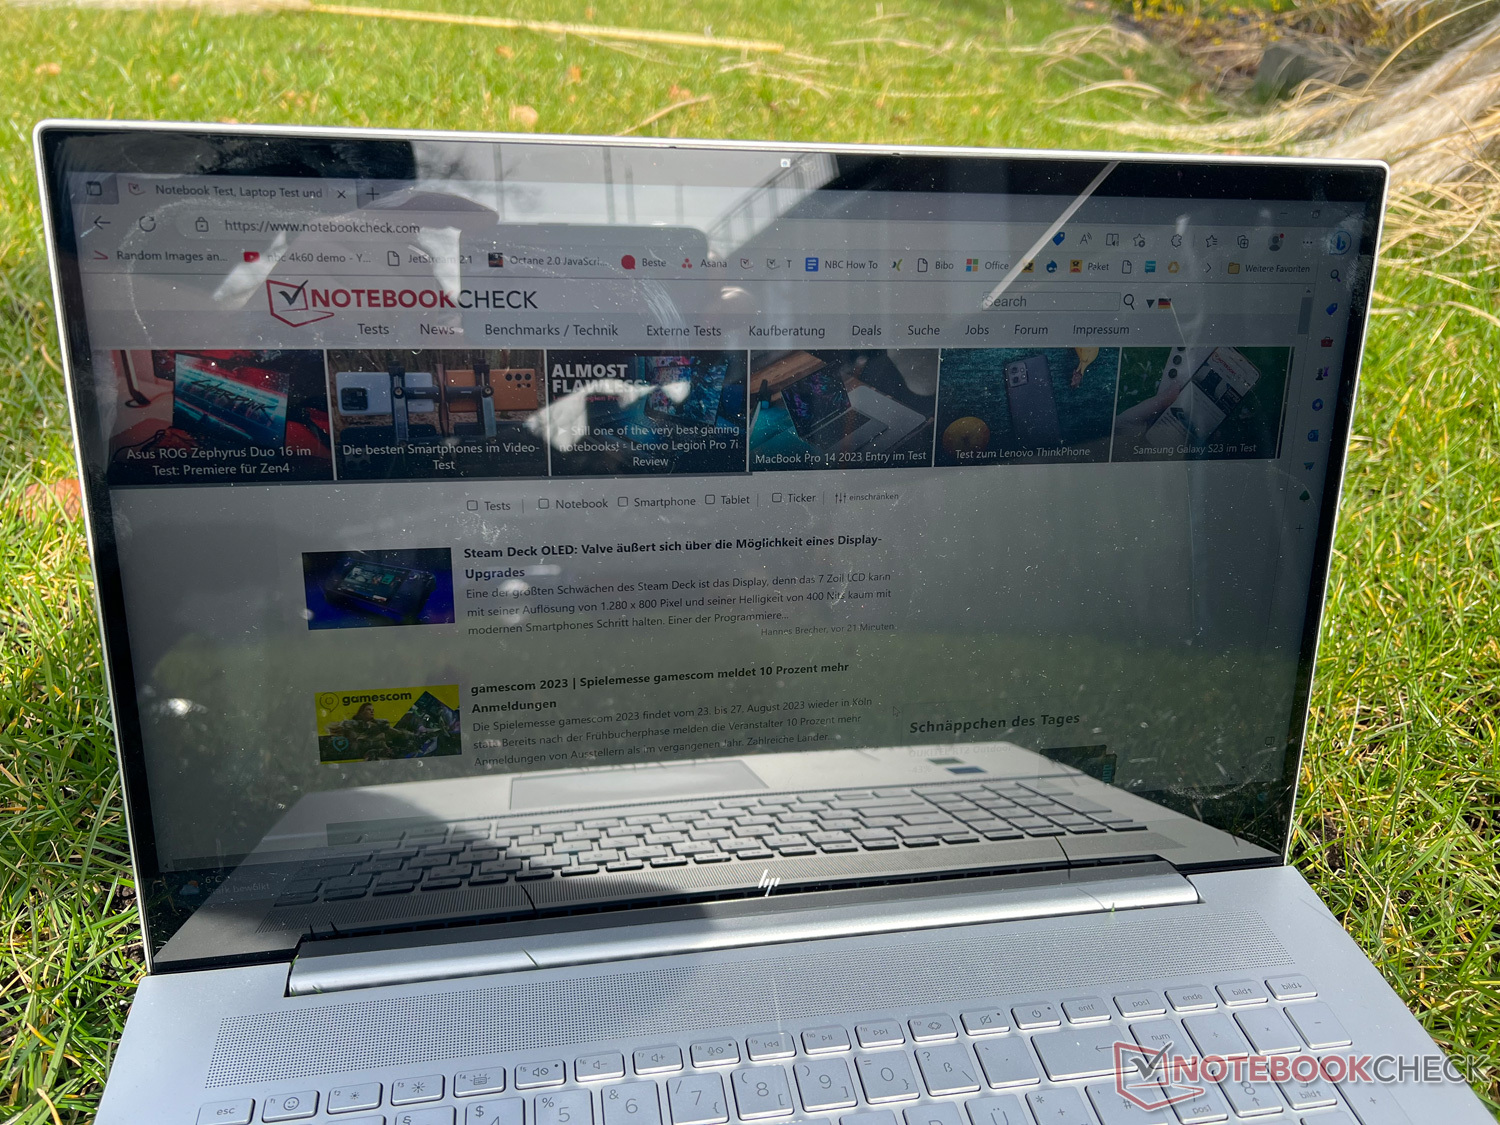
El fabricante promete un brillo de pantalla de 400 Nits, que podemos confirmar en nuestras mediciones de prueba en algunos puntos y también casi de media en toda la superficie. En nuestro campo de comparación, nuestra unidad de pruebas ofrece uno de los displays más brillantes, pero por desgracia eso no ayuda al usarlo en exteriores, ya que el fabricante ha decidido usar una versión reflectante. Aunque queda muy bien, también crea fuertes reflejos, lo que hace que el contenido sea difícilmente reconocible en exteriores (véanse las imágenes a continuación). En interiores, funciona mejor, pero se siguen produciendo molestos reflejos de fuentes de luz como lámparas o ventanas.
En términos de valor de negro y contraste, el HP Envy 17 es superado por la mayoría de nuestros competidores. En nuestro campo de comparación, la pantalla produce uno de los mejores resultados generales, pero también sufre de un ligero clouding y un sangrado de retroiluminación significativo, lo que significa que se pueden ver algunos puntos más claros en la iluminación de fondo en los bordes cuando se muestran contenidos oscuros.
| |||||||||||||||||||||||||
iluminación: 86 %
Brillo con batería: 390 cd/m²
Contraste: 987:1 (Negro: 0.395 cd/m²)
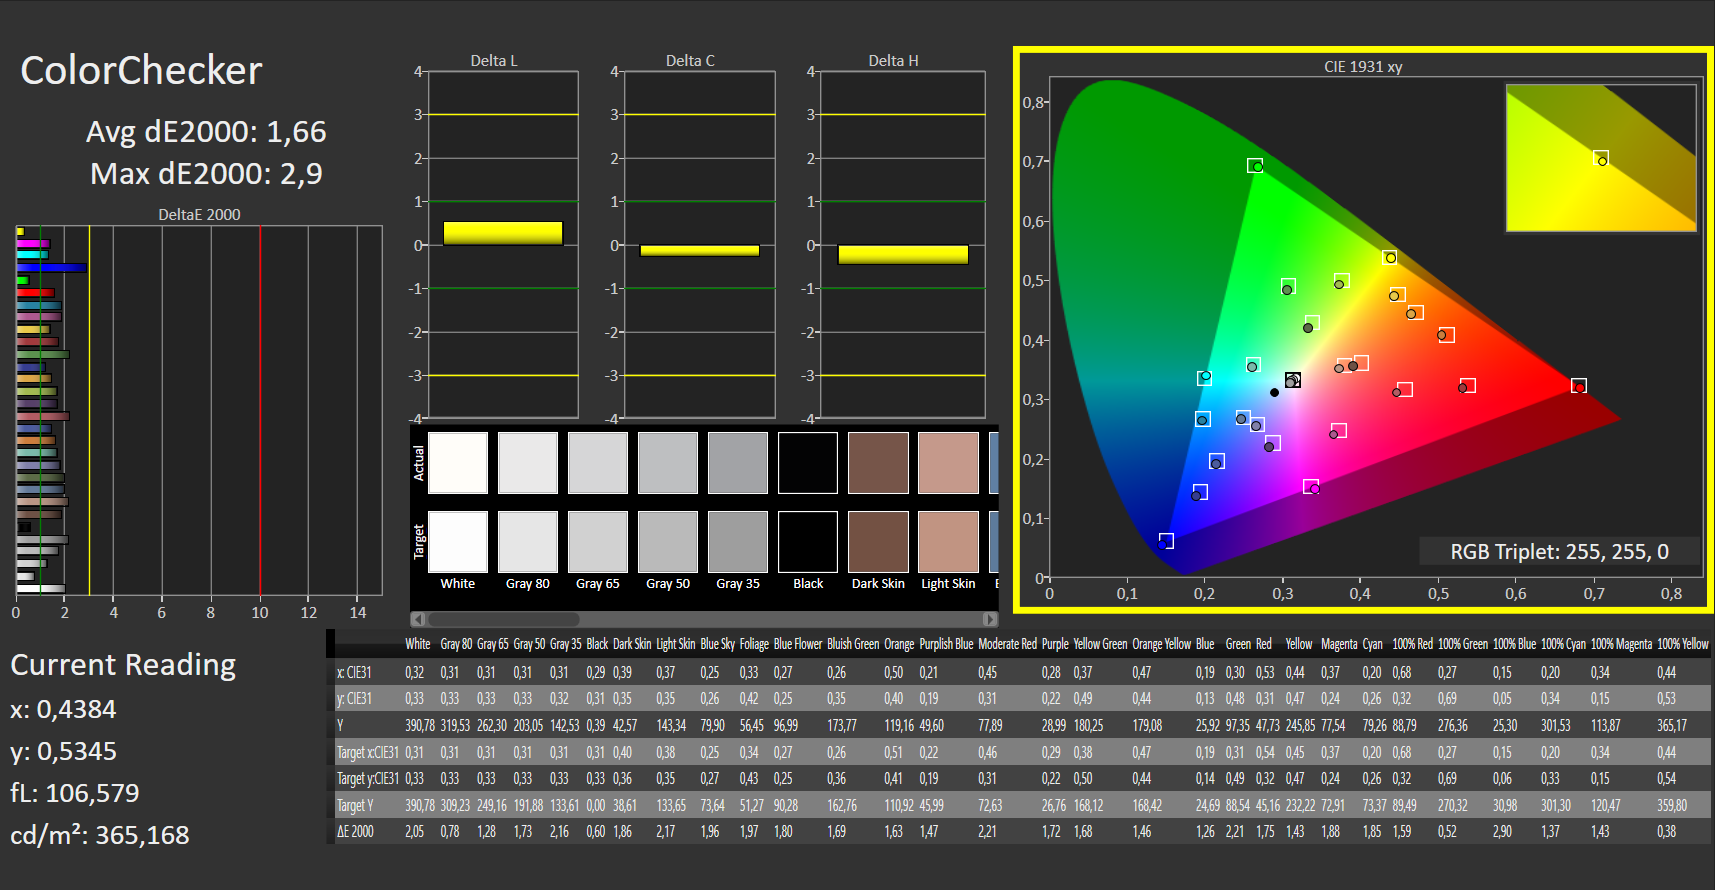
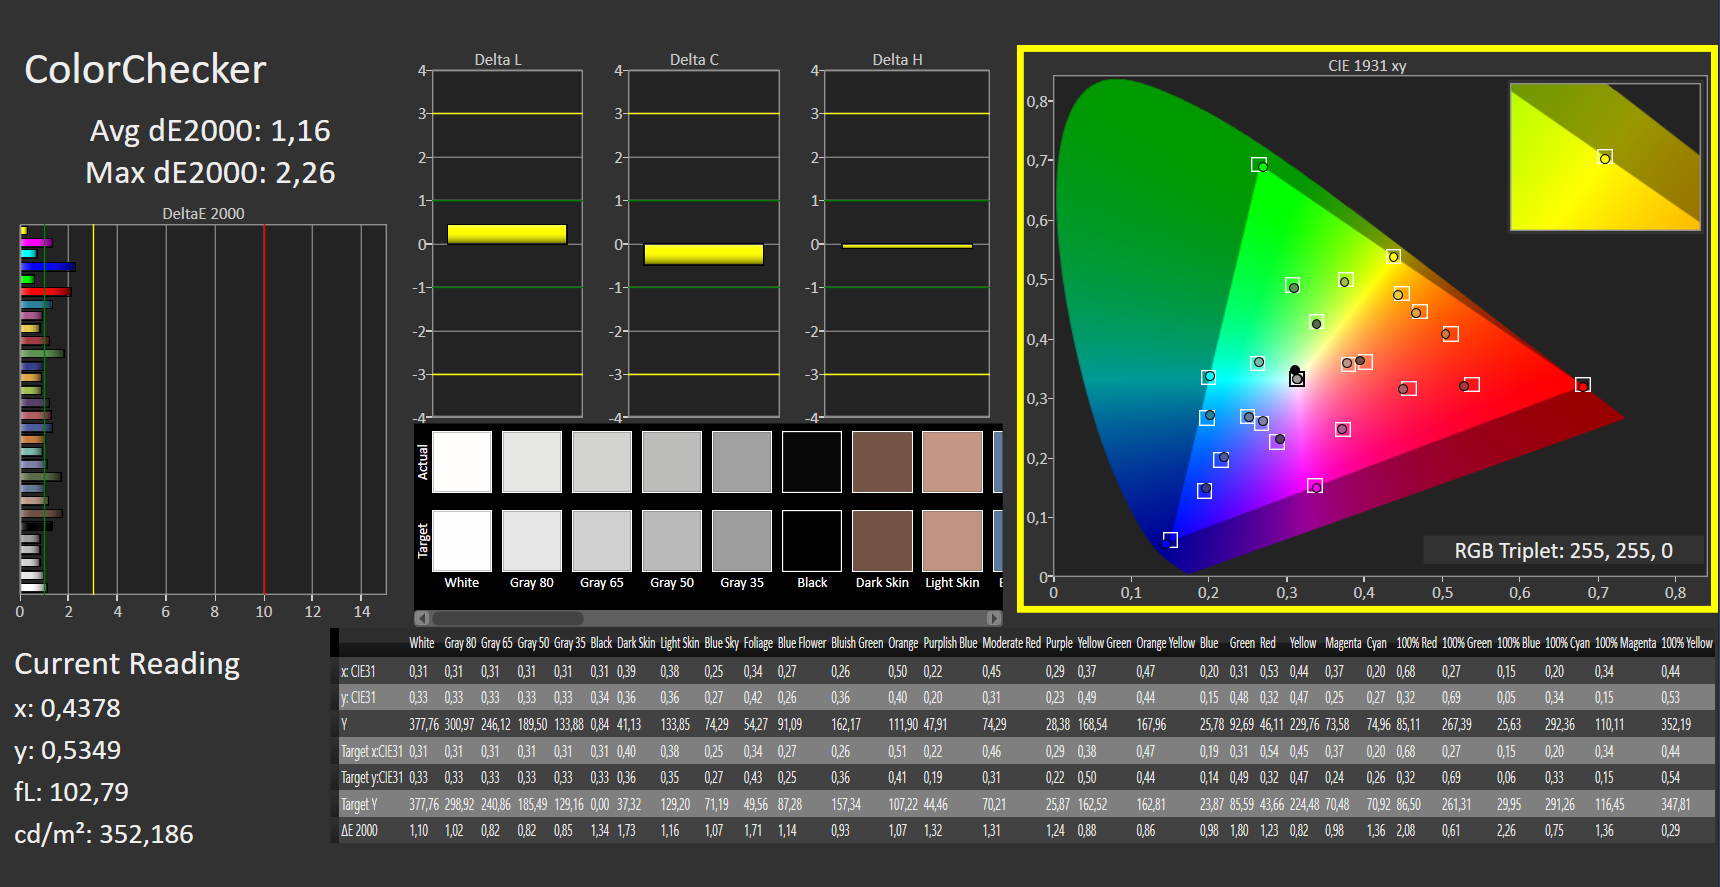
ΔE ColorChecker Calman: 1.66 | ∀{0.5-29.43 Ø4.71}
calibrated: 1.16
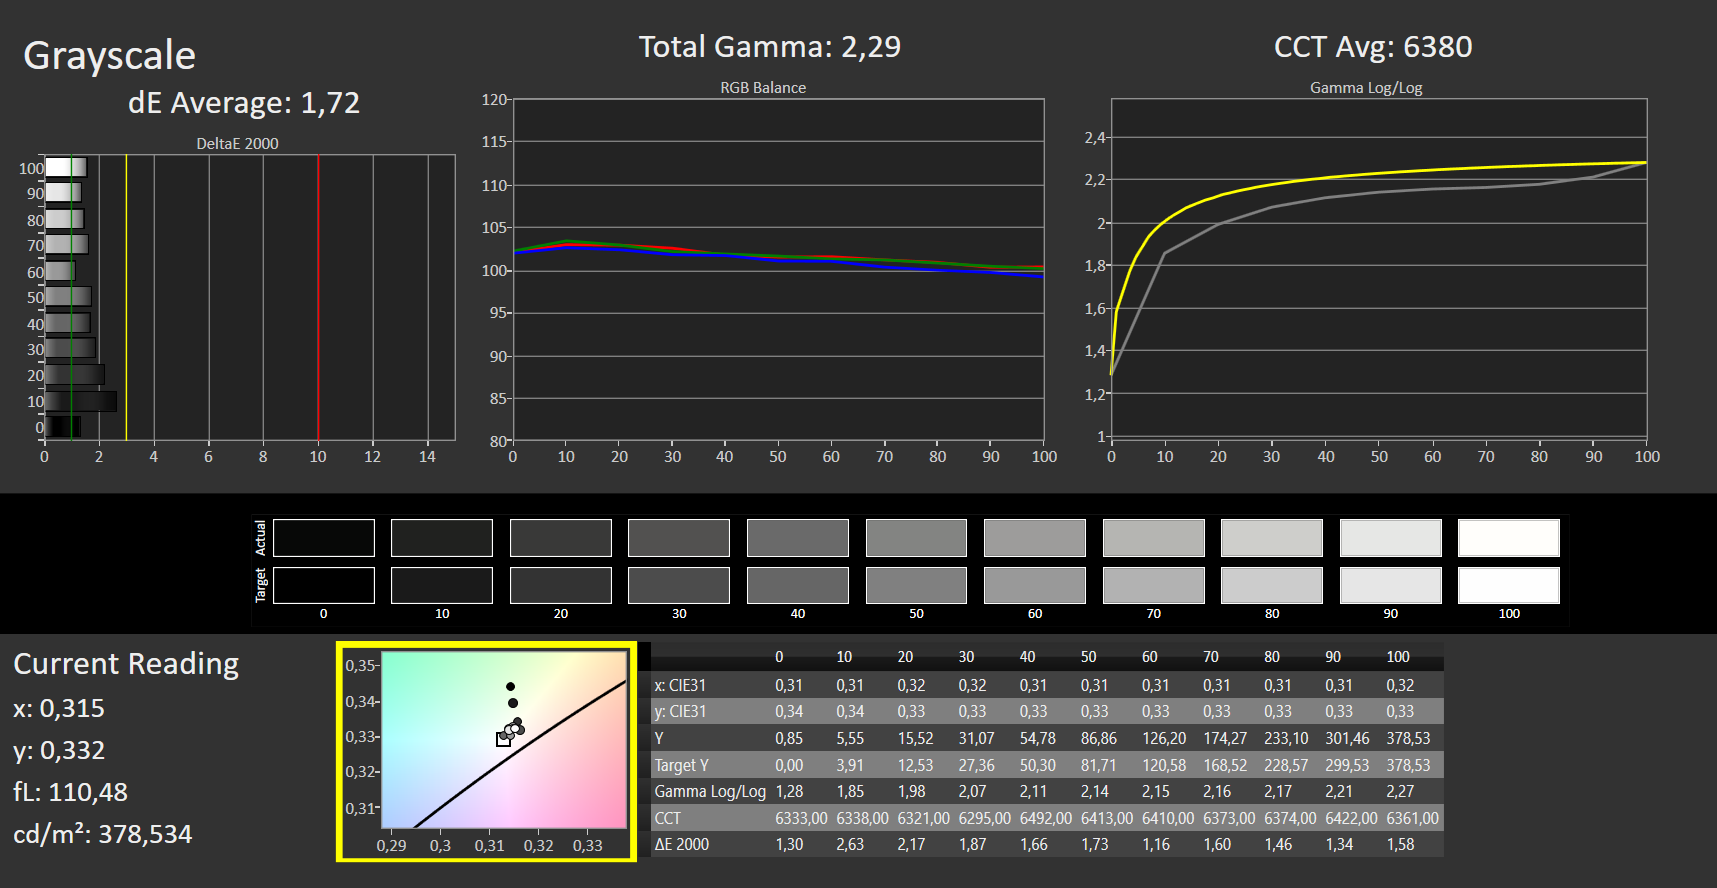
ΔE Greyscale Calman: 1.83 | ∀{0.09-98 Ø4.96}
87.03% AdobeRGB 1998 (Argyll 3D)
100% sRGB (Argyll 3D)
98.31% Display P3 (Argyll 3D)
Gamma: 2.25
CCT: 6727 K
| HP Envy 17-cr0079ng BOE0A66, IPS, 3840x2160, 17.3" | HP ProBook 450 G9 6A180EA Chi Mei CMN1512, , 1920x1080, 15.6" | LG Gram 17Z90Q-E.AD78G LG Display LP170WQ1-SPF2, IPS, 2560x1600, 17" | Acer Aspire 5 A515-57G-53N8 CMN N156HCA-EAB, IPS, 1920x1080, 15.6" | Dell XPS 17 9720 Sharp LQ170R1, IPS, 3840x2400, 17" | Lenovo IdeaPad 3 17ABA7 Lenovo LEN173FHD, IPS, 1920x1080, 17.3" | |
|---|---|---|---|---|---|---|
| Display | -47% | -4% | -47% | 4% | -22% | |
| Display P3 Coverage (%) | 98.31 | 42.76 -57% | 92.2 -6% | 43.3 -56% | 94.8 -4% | 67.8 -31% |
| sRGB Coverage (%) | 100 | 63.9 -36% | 98.66 -1% | 65 -35% | 100 0% | 88.9 -11% |
| AdobeRGB 1998 Coverage (%) | 87.03 | 44.2 -49% | 82.98 -5% | 44.8 -49% | 100 15% | 65 -25% |
| Response Times | -1443% | -1086% | -1855% | -2763% | -443% | |
| Response Time Grey 50% / Grey 80% * (ms) | 1 | 28 ? -2700% | 22 ? -2100% | 35.6 ? -3460% | 53.2 ? -5220% | 10 ? -900% |
| Response Time Black / White * (ms) | 7 ? | 20 ? -186% | 12 ? -71% | 24.5 ? -250% | 28.4 ? -306% | 6 ? 14% |
| PWM Frequency (Hz) | 17990 ? | |||||
| Screen | -124% | -36% | -97% | -17% | -109% | |
| Brightness middle (cd/m²) | 390 | 234 -40% | 391 0% | 250 -36% | 438 12% | 353 -9% |
| Brightness (cd/m²) | 385 | 218 -43% | 358 -7% | 234 -39% | 411 7% | 307 -20% |
| Brightness Distribution (%) | 86 | 85 -1% | 84 -2% | 79 -8% | 86 0% | 78 -9% |
| Black Level * (cd/m²) | 0.395 | 0.17 57% | 0.29 27% | 0.19 52% | 0.27 32% | 0.775 -96% |
| Contrast (:1) | 987 | 1376 39% | 1348 37% | 1316 33% | 1622 64% | 455 -54% |
| Colorchecker dE 2000 * | 1.66 | 5.04 -204% | 3.52 -112% | 3.94 -137% | 2.5 -51% | 5.48 -230% |
| Colorchecker dE 2000 max. * | 2.9 | 18.04 -522% | 6.06 -109% | 16.73 -477% | 6.3 -117% | 10.13 -249% |
| Colorchecker dE 2000 calibrated * | 1.16 | 4.13 -256% | 1.43 -23% | 3.09 -166% | 0.8 31% | 2.44 -110% |
| Greyscale dE 2000 * | 1.83 | 4.43 -142% | 4.27 -133% | 3.6 -97% | 4.2 -130% | 5.56 -204% |
| Gamma | 2.25 98% | 2.41 91% | 2.3 96% | 2.081 106% | 2.22 99% | 2.43 91% |
| CCT | 6727 97% | 6350 102% | 7203 90% | 6476 100% | 7034 92% | 7582 86% |
| Media total (Programa/Opciones) | -538% /
-296% | -375% /
-179% | -666% /
-338% | -925% /
-405% | -191% /
-138% |
* ... más pequeño es mejor
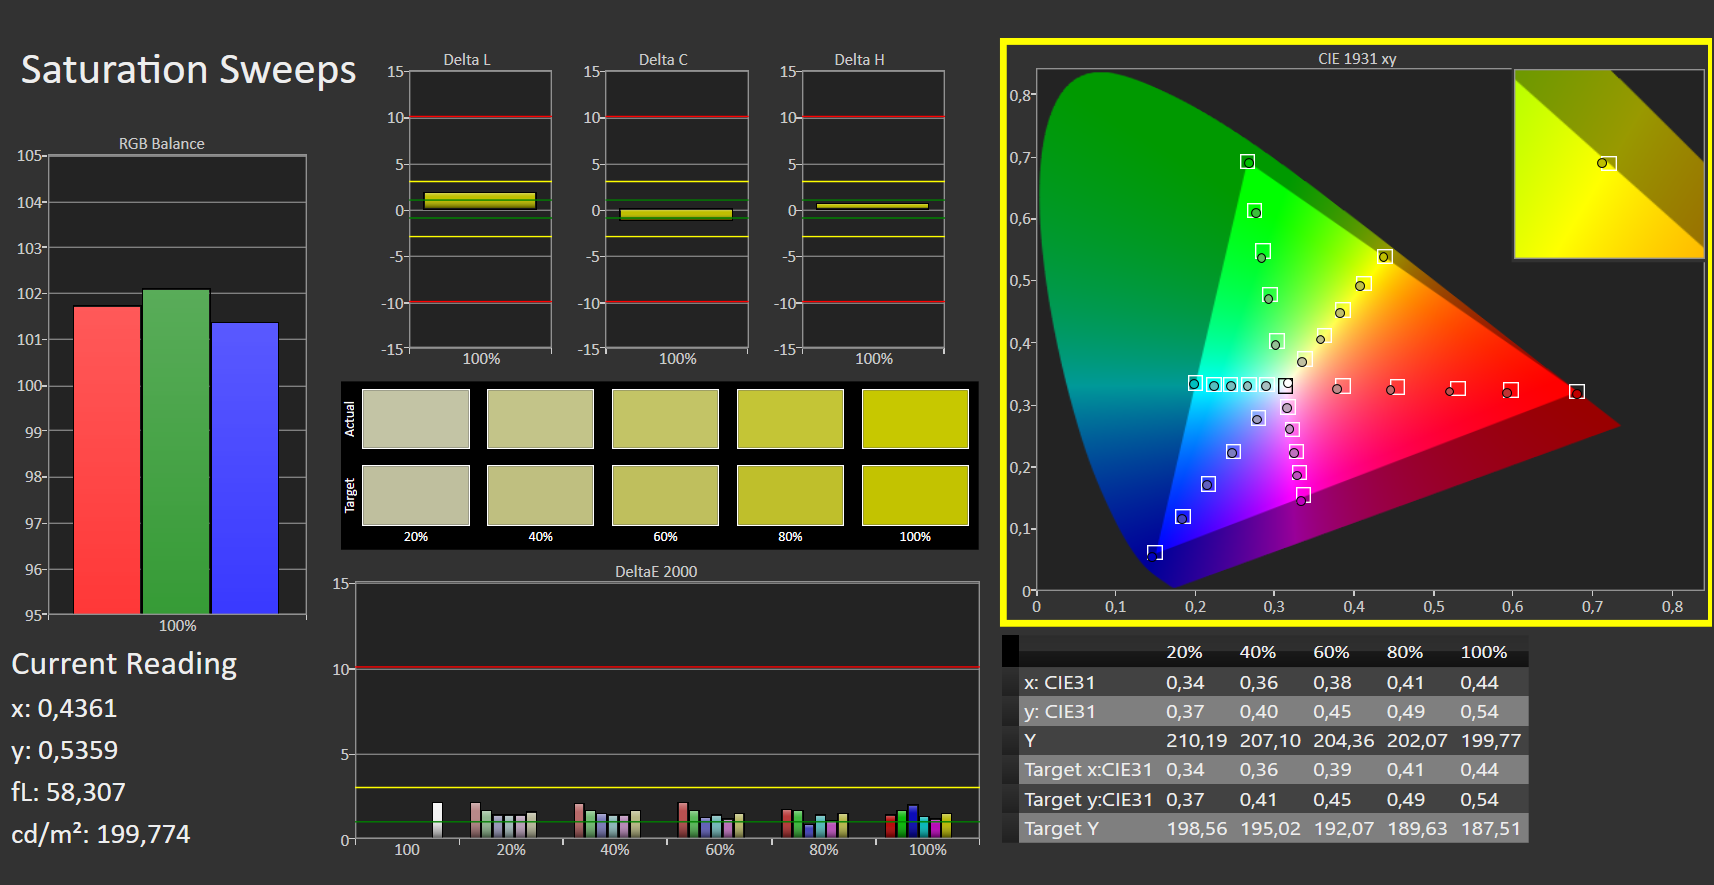
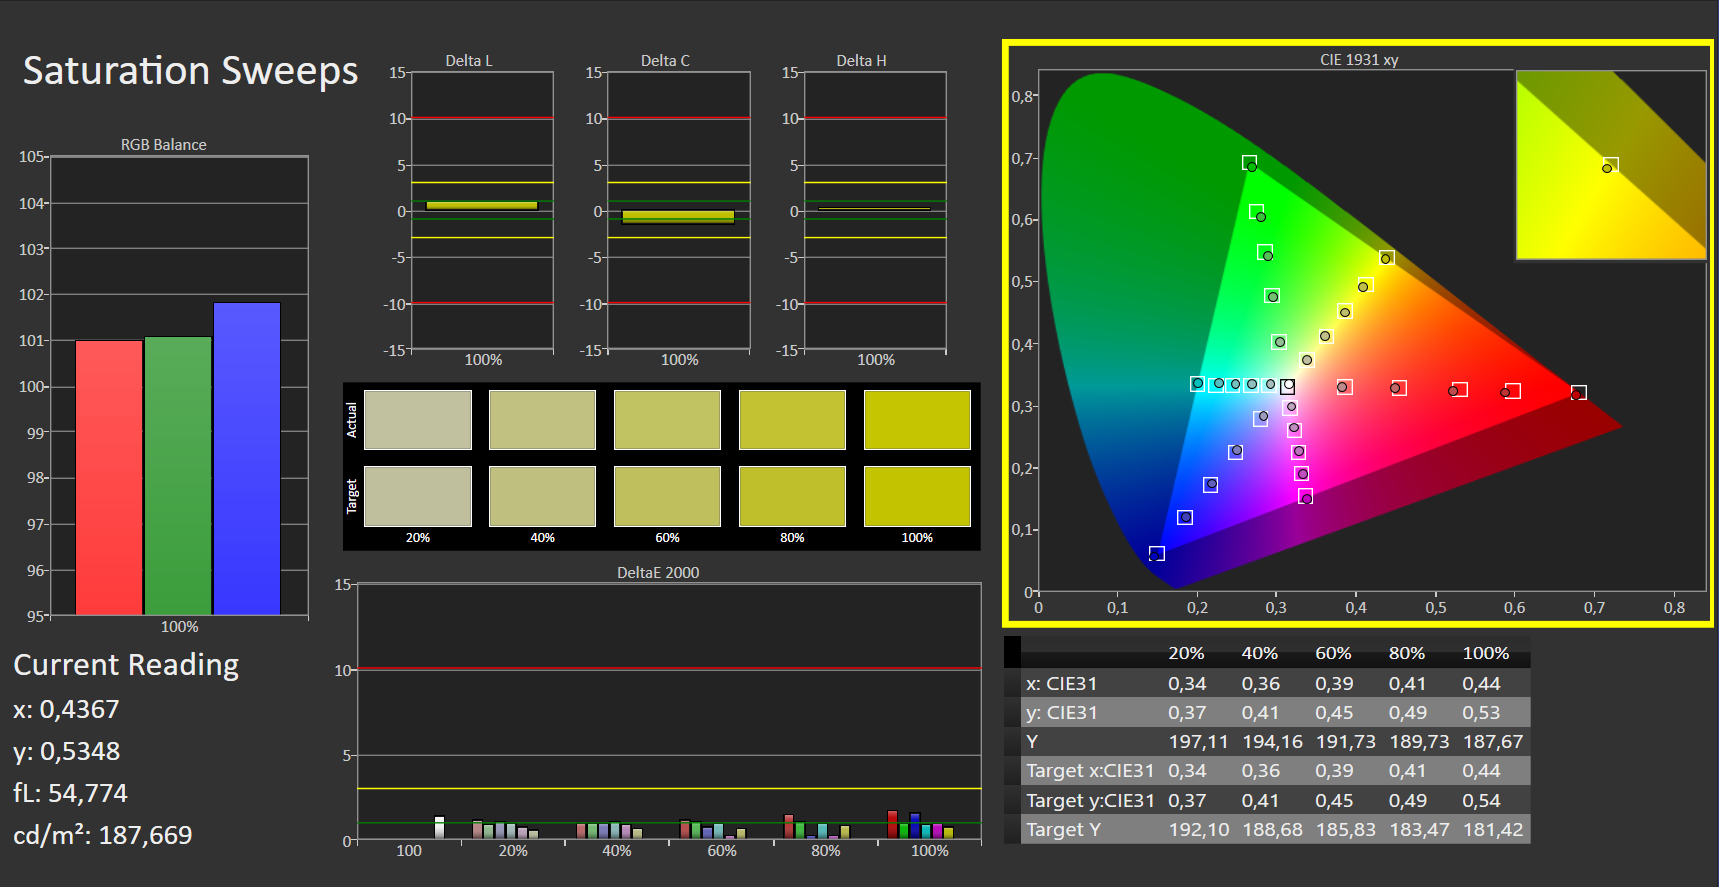
En comparación con los otros candidatos de la prueba, la cobertura del espacio de color es buena. El panel cubre el 100% del espacio de color más pequeño sRGB. Con un buen 98% del P3 y un 87% del espacio de color AdobeRGB, alcanza buenos valores, pero aún así no sería la elección perfecta para los diseñadores gráficos.
El aparato también ofrece una buena reproducción del color en comparación con la competencia, como demuestran las bajas mediciones de Delta E. Los valores que ya están bastante equilibrados en el estado de entrega se pueden mejorar aún más con una calibración.

Tiempos de respuesta del display
| ↔ Tiempo de respuesta de Negro a Blanco | ||
|---|---|---|
| 7 ms ... subida ↗ y bajada ↘ combinada | ↗ 1 ms subida |  |
| ↘ 6 ms bajada | ||
| La pantalla mostró tiempos de respuesta muy rápidos en nuestros tests y debería ser adecuada para juegos frenéticos. En comparación, todos los dispositivos de prueba van de ##min### (mínimo) a 240 (máximo) ms. » 21 % de todos los dispositivos son mejores. Esto quiere decir que el tiempo de respuesta medido es mejor que la media (19.8 ms) de todos los dispositivos testados. | ||
| ↔ Tiempo de respuesta 50% Gris a 80% Gris | ||
| 1 ms ... subida ↗ y bajada ↘ combinada | ↗ 0 ms subida |  |
| ↘ 0 ms bajada | ||
| La pantalla mostró tiempos de respuesta muy rápidos en nuestros tests y debería ser adecuada para juegos frenéticos. En comparación, todos los dispositivos de prueba van de ##min### (mínimo) a 636 (máximo) ms. » 4 % de todos los dispositivos son mejores. Esto quiere decir que el tiempo de respuesta medido es mejor que la media (31 ms) de todos los dispositivos testados. | ||
Parpadeo de Pantalla / PWM (Pulse-Width Modulation)
| Parpadeo de Pantalla / PWM no detectado |  | ||
Comparación: 52 % de todos los dispositivos testados no usaron PWM para atenuar el display. Si se usó, medimos una media de 7757 (mínimo: 5 - máxmo: 343500) Hz. | |||
La pantalla reflectante crea algunos problemas cuando se usa en exteriores. La pantalla IPS ofrece la buena estabilidad de ángulos de visión típica de este tipo de paneles.
Rendimiento: Con GeForce RTX 2050 también apta para juegos
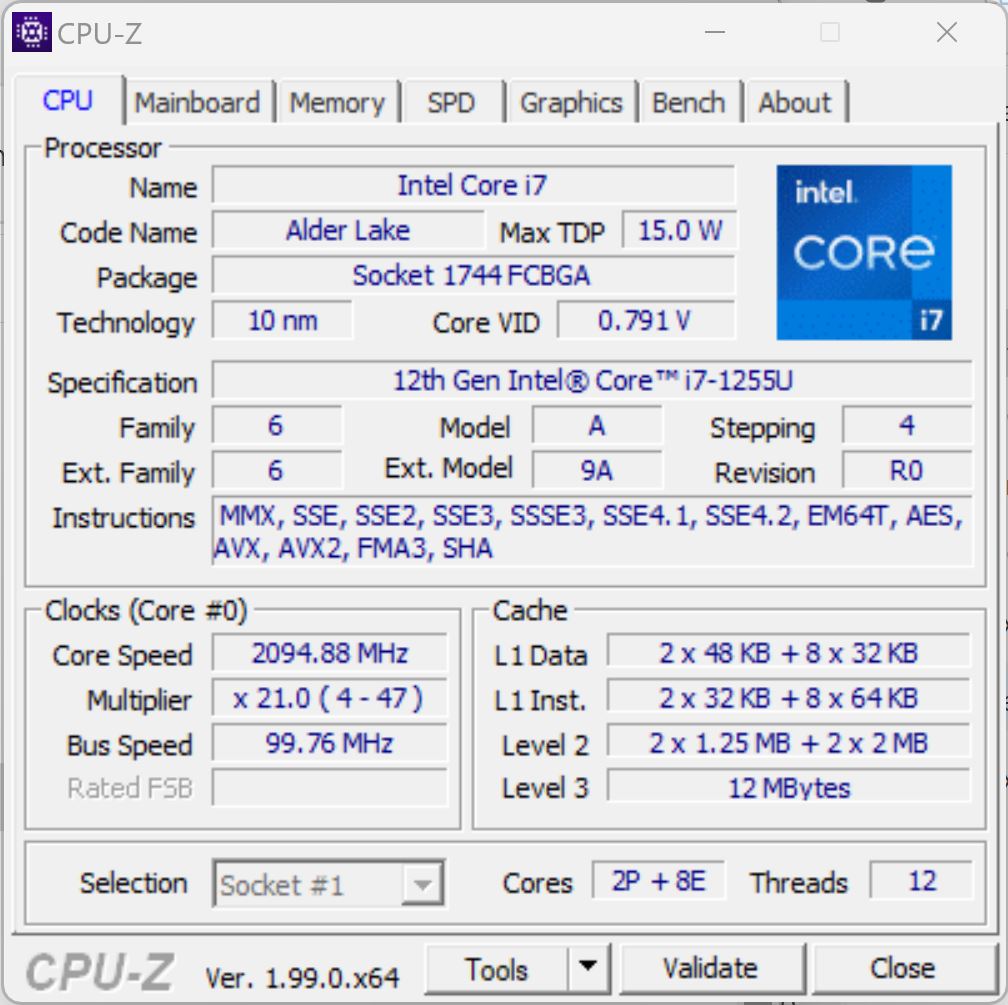
En nuestra configuración de prueba cr0079ng (72W72EA), el HP Envy 17 está equipado con el Core i7-1255Ude la 12ª generación de procesadores Intel (Alder Lake U). El fabricante lo combina con 32 GB adicionales de RAM DDR4 3200 MHz (2x 16 GB) y un gran SSD PCIe NVMe M.2 de 1 TB. Dependiendo de las demandas, el procesador dedicado Nvidia GeForce RTX 2050 para portátiles GPU con 4 GB GDDR6 o los gráficos internos Intel Iris Xe se encargan de la salida gráfica.
Como alternativa, HP también ofrece el Envy 17 en muchas otras configuraciones, por ejemplo con menos RAM y almacenamiento o diferentes CPUs como la Intel Core i5-1235U o Core i7-1260P.
Condiciones de la prueba
Con el Centro de Comandos, HP ofrece su propia herramienta, permitiéndote elegir entre los modos de rendimiento "Equilibrado", "Rendimiento" y "Frío", así como un modo de "Ahorro de Energía" en funcionamiento con batería, o también puedes seleccionar un modo automático de "Ajuste Inteligente". Para nuestras pruebas de rendimiento, normalmente elegimos el modo "Rendimiento" de HP junto con el ajuste "Mejor rendimiento" de Windows.
| Modo Rendimiento" | Modo "Ajuste Inteligente" | Modo "Frío | |
|---|---|---|---|
| Límite de potencia 1 | 18 vatios | 15 vatios | 10 vatios |
| Límite de potencia 2 | 51 vatios | 46 vatios | 15 vatios |
Procesador
El Core i7-1255Uutilizado aquí procede de la 12ª generación de procesadores de Intel (Alder Lake) y está diseñado para portátiles de gama alta. El procesador de diez núcleos consta de dos núcleos de Rendimiento y ocho de Eficiencia, lo que resulta en doce hilos gracias al hyperthreading de los núcleos P. La velocidad de reloj oscila entre 1,7 y 4,7 GHz.
En los benchmarks de CPU durante nuestras pruebas, el HP Envy 17 entrega en su mayoría muy buenos resultados, usualmente posicionándose por encima del promedio para el CPU y los competidores con el mismo CPU. En nuestra prueba de carga constante, el rendimiento también está disponible constantemente. En funcionamiento con batería, el rendimiento se reduce en torno al 70%.
Cinebench R15 Multi Constant Load Test
Cinebench R23: Multi Core | Single Core
Cinebench R20: CPU (Multi Core) | CPU (Single Core)
Cinebench R15: CPU Multi 64Bit | CPU Single 64Bit
Blender: v2.79 BMW27 CPU
7-Zip 18.03: 7z b 4 | 7z b 4 -mmt1
Geekbench 5.5: Multi-Core | Single-Core
HWBOT x265 Benchmark v2.2: 4k Preset
LibreOffice : 20 Documents To PDF
R Benchmark 2.5: Overall mean
| CPU Performance rating | |
| Media de la clase Multimedia | |
| Dell XPS 17 9720 | |
| Acer Aspire 5 A515-57G-53N8 | |
| HP Envy 17-cr0079ng | |
| LG Gram 17Z90Q-E.AD78G | |
| Medio Intel Core i7-1255U | |
| Lenovo IdeaPad 3 17ABA7 | |
| HP ProBook 450 G9 6A180EA | |
| HP Envy 17-cg | |
| Cinebench R23 / Multi Core | |
| Media de la clase Multimedia (4861 - 33362, n=74, últimos 2 años) | |
| Dell XPS 17 9720 | |
| Acer Aspire 5 A515-57G-53N8 | |
| HP Envy 17-cr0079ng | |
| LG Gram 17Z90Q-E.AD78G | |
| LG Gram 17Z90Q-E.AD78G | |
| Lenovo IdeaPad 3 17ABA7 | |
| Medio Intel Core i7-1255U (5269 - 9628, n=11) | |
| HP ProBook 450 G9 6A180EA | |
| HP Envy 17-cg | |
| Cinebench R23 / Single Core | |
| Media de la clase Multimedia (1128 - 2459, n=66, últimos 2 años) | |
| Dell XPS 17 9720 | |
| Acer Aspire 5 A515-57G-53N8 | |
| Medio Intel Core i7-1255U (1408 - 1775, n=11) | |
| LG Gram 17Z90Q-E.AD78G | |
| HP Envy 17-cr0079ng | |
| HP ProBook 450 G9 6A180EA | |
| Lenovo IdeaPad 3 17ABA7 | |
| HP Envy 17-cg | |
| Cinebench R20 / CPU (Multi Core) | |
| Media de la clase Multimedia (1887 - 12912, n=57, últimos 2 años) | |
| Dell XPS 17 9720 | |
| Acer Aspire 5 A515-57G-53N8 | |
| HP Envy 17-cr0079ng | |
| Lenovo IdeaPad 3 17ABA7 | |
| LG Gram 17Z90Q-E.AD78G | |
| Medio Intel Core i7-1255U (2095 - 3702, n=11) | |
| HP ProBook 450 G9 6A180EA | |
| HP Envy 17-cg | |
| Cinebench R20 / CPU (Single Core) | |
| Media de la clase Multimedia (425 - 853, n=57, últimos 2 años) | |
| Dell XPS 17 9720 | |
| Acer Aspire 5 A515-57G-53N8 | |
| Medio Intel Core i7-1255U (550 - 682, n=11) | |
| HP Envy 17-cr0079ng | |
| LG Gram 17Z90Q-E.AD78G | |
| HP ProBook 450 G9 6A180EA | |
| Lenovo IdeaPad 3 17ABA7 | |
| HP Envy 17-cg | |
| Cinebench R15 / CPU Multi 64Bit | |
| Dell XPS 17 9720 | |
| Dell XPS 17 9720 | |
| Media de la clase Multimedia (856 - 5224, n=61, últimos 2 años) | |
| Acer Aspire 5 A515-57G-53N8 | |
| LG Gram 17Z90Q-E.AD78G | |
| Lenovo IdeaPad 3 17ABA7 | |
| HP Envy 17-cr0079ng | |
| Medio Intel Core i7-1255U (919 - 1577, n=11) | |
| HP ProBook 450 G9 6A180EA | |
| HP Envy 17-cg | |
| Cinebench R15 / CPU Single 64Bit | |
| Media de la clase Multimedia (184.8 - 326, n=59, últimos 2 años) | |
| Dell XPS 17 9720 | |
| HP Envy 17-cr0079ng | |
| Acer Aspire 5 A515-57G-53N8 | |
| Medio Intel Core i7-1255U (161 - 251, n=12) | |
| Lenovo IdeaPad 3 17ABA7 | |
| LG Gram 17Z90Q-E.AD78G | |
| HP ProBook 450 G9 6A180EA | |
| HP Envy 17-cg | |
| Blender / v2.79 BMW27 CPU | |
| HP ProBook 450 G9 6A180EA | |
| HP Envy 17-cg | |
| HP Envy 17-cr0079ng | |
| Medio Intel Core i7-1255U (372 - 601, n=11) | |
| LG Gram 17Z90Q-E.AD78G | |
| Acer Aspire 5 A515-57G-53N8 | |
| Lenovo IdeaPad 3 17ABA7 | |
| Media de la clase Multimedia (100 - 557, n=58, últimos 2 años) | |
| Dell XPS 17 9720 | |
| 7-Zip 18.03 / 7z b 4 | |
| Dell XPS 17 9720 | |
| Media de la clase Multimedia (26062 - 130368, n=55, últimos 2 años) | |
| Acer Aspire 5 A515-57G-53N8 | |
| LG Gram 17Z90Q-E.AD78G | |
| HP Envy 17-cr0079ng | |
| Lenovo IdeaPad 3 17ABA7 | |
| Medio Intel Core i7-1255U (24126 - 37365, n=11) | |
| HP ProBook 450 G9 6A180EA | |
| HP Envy 17-cg | |
| 7-Zip 18.03 / 7z b 4 -mmt1 | |
| Media de la clase Multimedia (3666 - 7545, n=56, últimos 2 años) | |
| Dell XPS 17 9720 | |
| HP Envy 17-cr0079ng | |
| Medio Intel Core i7-1255U (5059 - 5529, n=11) | |
| Lenovo IdeaPad 3 17ABA7 | |
| HP ProBook 450 G9 6A180EA | |
| Acer Aspire 5 A515-57G-53N8 | |
| LG Gram 17Z90Q-E.AD78G | |
| HP Envy 17-cg | |
| Geekbench 5.5 / Multi-Core | |
| Dell XPS 17 9720 | |
| Media de la clase Multimedia (4652 - 20422, n=56, últimos 2 años) | |
| Acer Aspire 5 A515-57G-53N8 | |
| LG Gram 17Z90Q-E.AD78G | |
| HP Envy 17-cr0079ng | |
| Medio Intel Core i7-1255U (4463 - 8821, n=12) | |
| HP ProBook 450 G9 6A180EA | |
| Lenovo IdeaPad 3 17ABA7 | |
| HP Envy 17-cg | |
| Geekbench 5.5 / Single-Core | |
| Media de la clase Multimedia (805 - 2974, n=56, últimos 2 años) | |
| Dell XPS 17 9720 | |
| HP Envy 17-cr0079ng | |
| HP ProBook 450 G9 6A180EA | |
| Medio Intel Core i7-1255U (1560 - 1712, n=12) | |
| Acer Aspire 5 A515-57G-53N8 | |
| LG Gram 17Z90Q-E.AD78G | |
| HP Envy 17-cg | |
| Lenovo IdeaPad 3 17ABA7 | |
| HWBOT x265 Benchmark v2.2 / 4k Preset | |
| Media de la clase Multimedia (5.26 - 36.1, n=56, últimos 2 años) | |
| Dell XPS 17 9720 | |
| Acer Aspire 5 A515-57G-53N8 | |
| HP Envy 17-cr0079ng | |
| LG Gram 17Z90Q-E.AD78G | |
| Lenovo IdeaPad 3 17ABA7 | |
| Medio Intel Core i7-1255U (6.31 - 10.1, n=11) | |
| HP ProBook 450 G9 6A180EA | |
| HP Envy 17-cg | |
| LibreOffice / 20 Documents To PDF | |
| LG Gram 17Z90Q-E.AD78G | |
| Acer Aspire 5 A515-57G-53N8 | |
| HP Envy 17-cg | |
| Lenovo IdeaPad 3 17ABA7 | |
| HP ProBook 450 G9 6A180EA | |
| Media de la clase Multimedia (23.9 - 146.7, n=57, últimos 2 años) | |
| Medio Intel Core i7-1255U (35.6 - 52.5, n=11) | |
| HP Envy 17-cr0079ng | |
| Dell XPS 17 9720 | |
| R Benchmark 2.5 / Overall mean | |
| HP Envy 17-cg | |
| Lenovo IdeaPad 3 17ABA7 | |
| HP ProBook 450 G9 6A180EA | |
| LG Gram 17Z90Q-E.AD78G | |
| Medio Intel Core i7-1255U (0.4688 - 0.558, n=11) | |
| Acer Aspire 5 A515-57G-53N8 | |
| HP Envy 17-cr0079ng | |
| Media de la clase Multimedia (0.3604 - 0.947, n=56, últimos 2 años) | |
| Dell XPS 17 9720 | |
* ... más pequeño es mejor
AIDA64: FP32 Ray-Trace | FPU Julia | CPU SHA3 | CPU Queen | FPU SinJulia | FPU Mandel | CPU AES | CPU ZLib | FP64 Ray-Trace | CPU PhotoWorxx
| Performance rating | |
| Media de la clase Multimedia | |
| Lenovo IdeaPad 3 17ABA7 | |
| Dell XPS 17 9720 | |
| HP Envy 17-cr0079ng | |
| Acer Aspire 5 A515-57G-53N8 | |
| Medio Intel Core i7-1255U | |
| LG Gram 17Z90Q-E.AD78G | |
| HP ProBook 450 G9 6A180EA | |
| HP Envy 17-cg -9! | |
| AIDA64 / FP32 Ray-Trace | |
| Media de la clase Multimedia (2214 - 50388, n=53, últimos 2 años) | |
| Lenovo IdeaPad 3 17ABA7 | |
| HP Envy 17-cr0079ng | |
| Dell XPS 17 9720 | |
| Medio Intel Core i7-1255U (4313 - 8127, n=11) | |
| Acer Aspire 5 A515-57G-53N8 | |
| HP ProBook 450 G9 6A180EA | |
| LG Gram 17Z90Q-E.AD78G | |
| AIDA64 / FPU Julia | |
| Media de la clase Multimedia (12867 - 201874, n=54, últimos 2 años) | |
| Lenovo IdeaPad 3 17ABA7 | |
| HP Envy 17-cr0079ng | |
| Medio Intel Core i7-1255U (19813 - 41353, n=11) | |
| Dell XPS 17 9720 | |
| Acer Aspire 5 A515-57G-53N8 | |
| HP ProBook 450 G9 6A180EA | |
| LG Gram 17Z90Q-E.AD78G | |
| AIDA64 / CPU SHA3 | |
| Media de la clase Multimedia (626 - 8623, n=54, últimos 2 años) | |
| Dell XPS 17 9720 | |
| Lenovo IdeaPad 3 17ABA7 | |
| HP Envy 17-cr0079ng | |
| Medio Intel Core i7-1255U (1325 - 2135, n=11) | |
| Acer Aspire 5 A515-57G-53N8 | |
| LG Gram 17Z90Q-E.AD78G | |
| HP ProBook 450 G9 6A180EA | |
| AIDA64 / CPU Queen | |
| Dell XPS 17 9720 | |
| Acer Aspire 5 A515-57G-53N8 | |
| Lenovo IdeaPad 3 17ABA7 | |
| Media de la clase Multimedia (13483 - 181505, n=41, últimos 2 años) | |
| LG Gram 17Z90Q-E.AD78G | |
| HP Envy 17-cr0079ng | |
| Medio Intel Core i7-1255U (61375 - 65892, n=11) | |
| HP ProBook 450 G9 6A180EA | |
| AIDA64 / FPU SinJulia | |
| Lenovo IdeaPad 3 17ABA7 | |
| Media de la clase Multimedia (886 - 28794, n=54, últimos 2 años) | |
| Dell XPS 17 9720 | |
| Acer Aspire 5 A515-57G-53N8 | |
| LG Gram 17Z90Q-E.AD78G | |
| HP Envy 17-cr0079ng | |
| Medio Intel Core i7-1255U (3577 - 5095, n=11) | |
| HP ProBook 450 G9 6A180EA | |
| AIDA64 / FPU Mandel | |
| Media de la clase Multimedia (6395 - 105740, n=53, últimos 2 años) | |
| Lenovo IdeaPad 3 17ABA7 | |
| HP Envy 17-cr0079ng | |
| Dell XPS 17 9720 | |
| Medio Intel Core i7-1255U (11759 - 20187, n=11) | |
| Acer Aspire 5 A515-57G-53N8 | |
| LG Gram 17Z90Q-E.AD78G | |
| HP ProBook 450 G9 6A180EA | |
| AIDA64 / CPU AES | |
| Lenovo IdeaPad 3 17ABA7 | |
| Dell XPS 17 9720 | |
| Media de la clase Multimedia (8171 - 126790, n=54, últimos 2 años) | |
| HP Envy 17-cr0079ng | |
| Medio Intel Core i7-1255U (27900 - 67458, n=11) | |
| Acer Aspire 5 A515-57G-53N8 | |
| LG Gram 17Z90Q-E.AD78G | |
| HP ProBook 450 G9 6A180EA | |
| AIDA64 / CPU ZLib | |
| Media de la clase Multimedia (143.8 - 2022, n=54, últimos 2 años) | |
| Dell XPS 17 9720 | |
| Acer Aspire 5 A515-57G-53N8 | |
| HP Envy 17-cr0079ng | |
| LG Gram 17Z90Q-E.AD78G | |
| Lenovo IdeaPad 3 17ABA7 | |
| Medio Intel Core i7-1255U (393 - 640, n=11) | |
| HP ProBook 450 G9 6A180EA | |
| HP Envy 17-cg | |
| AIDA64 / FP64 Ray-Trace | |
| Media de la clase Multimedia (1014 - 26875, n=54, últimos 2 años) | |
| Lenovo IdeaPad 3 17ABA7 | |
| HP Envy 17-cr0079ng | |
| Dell XPS 17 9720 | |
| Medio Intel Core i7-1255U (2474 - 4400, n=11) | |
| Acer Aspire 5 A515-57G-53N8 | |
| LG Gram 17Z90Q-E.AD78G | |
| HP ProBook 450 G9 6A180EA | |
| AIDA64 / CPU PhotoWorxx | |
| Media de la clase Multimedia (8187 - 88154, n=54, últimos 2 años) | |
| Dell XPS 17 9720 | |
| LG Gram 17Z90Q-E.AD78G | |
| Medio Intel Core i7-1255U (13899 - 44054, n=11) | |
| HP Envy 17-cr0079ng | |
| Acer Aspire 5 A515-57G-53N8 | |
| HP ProBook 450 G9 6A180EA | |
| Lenovo IdeaPad 3 17ABA7 | |
Rendimiento del sistema
En la práctica, el hardware utilizado ofrece un rendimiento más que sólido. En pruebas como PCMark 10, el portátil es capaz de mantenerse a la altura de los mejores y sólo es superado por los dos portátiles equipados con hardware más potente. Los que quieran aún más rendimiento están mejor servidos con el Intel Core i7-12700H delDell XPS 17 9720por ejemplo.
Por alguna extraña razón, el test Creative Benchmark de PCMark 8 siempre se interrumpía a la mitad con la configuración de hardware y drivers de nuestra unidad de pruebas. Por lo tanto, dejamos de lado este benchmark.
CrossMark: Overall | Productivity | Creativity | Responsiveness
| PCMark 10 / Score | |
| Media de la clase Multimedia (4325 - 10386, n=52, últimos 2 años) | |
| Dell XPS 17 9720 | |
| LG Gram 17Z90Q-E.AD78G | |
| HP Envy 17-cr0079ng | |
| Medio Intel Core i7-1255U, NVIDIA GeForce RTX 2050 Mobile (n=1) | |
| Acer Aspire 5 A515-57G-53N8 | |
| Lenovo IdeaPad 3 17ABA7 | |
| HP Envy 17-cg | |
| HP ProBook 450 G9 6A180EA | |
| PCMark 10 / Essentials | |
| Media de la clase Multimedia (8025 - 11664, n=51, últimos 2 años) | |
| Lenovo IdeaPad 3 17ABA7 | |
| Dell XPS 17 9720 | |
| HP Envy 17-cr0079ng | |
| Medio Intel Core i7-1255U, NVIDIA GeForce RTX 2050 Mobile (n=1) | |
| LG Gram 17Z90Q-E.AD78G | |
| HP ProBook 450 G9 6A180EA | |
| Acer Aspire 5 A515-57G-53N8 | |
| HP Envy 17-cg | |
| PCMark 10 / Productivity | |
| Media de la clase Multimedia (7323 - 18233, n=51, últimos 2 años) | |
| LG Gram 17Z90Q-E.AD78G | |
| Dell XPS 17 9720 | |
| Lenovo IdeaPad 3 17ABA7 | |
| HP Envy 17-cr0079ng | |
| Medio Intel Core i7-1255U, NVIDIA GeForce RTX 2050 Mobile (n=1) | |
| HP Envy 17-cg | |
| Acer Aspire 5 A515-57G-53N8 | |
| HP ProBook 450 G9 6A180EA | |
| PCMark 10 / Digital Content Creation | |
| Media de la clase Multimedia (3651 - 16240, n=51, últimos 2 años) | |
| Dell XPS 17 9720 | |
| LG Gram 17Z90Q-E.AD78G | |
| HP Envy 17-cr0079ng | |
| Medio Intel Core i7-1255U, NVIDIA GeForce RTX 2050 Mobile (n=1) | |
| Acer Aspire 5 A515-57G-53N8 | |
| HP Envy 17-cg | |
| Lenovo IdeaPad 3 17ABA7 | |
| HP ProBook 450 G9 6A180EA | |
| CrossMark / Overall | |
| Media de la clase Multimedia (866 - 2728, n=60, últimos 2 años) | |
| Dell XPS 17 9720 | |
| LG Gram 17Z90Q-E.AD78G | |
| HP Envy 17-cr0079ng | |
| Medio Intel Core i7-1255U, NVIDIA GeForce RTX 2050 Mobile (n=1) | |
| HP ProBook 450 G9 6A180EA | |
| Lenovo IdeaPad 3 17ABA7 | |
| CrossMark / Productivity | |
| Media de la clase Multimedia (931 - 2489, n=60, últimos 2 años) | |
| Dell XPS 17 9720 | |
| LG Gram 17Z90Q-E.AD78G | |
| HP Envy 17-cr0079ng | |
| Medio Intel Core i7-1255U, NVIDIA GeForce RTX 2050 Mobile (n=1) | |
| HP ProBook 450 G9 6A180EA | |
| Lenovo IdeaPad 3 17ABA7 | |
| CrossMark / Creativity | |
| Media de la clase Multimedia (907 - 3465, n=60, últimos 2 años) | |
| Dell XPS 17 9720 | |
| LG Gram 17Z90Q-E.AD78G | |
| HP Envy 17-cr0079ng | |
| Medio Intel Core i7-1255U, NVIDIA GeForce RTX 2050 Mobile (n=1) | |
| HP ProBook 450 G9 6A180EA | |
| Lenovo IdeaPad 3 17ABA7 | |
| CrossMark / Responsiveness | |
| Dell XPS 17 9720 | |
| Media de la clase Multimedia (605 - 2024, n=60, últimos 2 años) | |
| LG Gram 17Z90Q-E.AD78G | |
| HP Envy 17-cr0079ng | |
| Medio Intel Core i7-1255U, NVIDIA GeForce RTX 2050 Mobile (n=1) | |
| Lenovo IdeaPad 3 17ABA7 | |
| HP ProBook 450 G9 6A180EA | |
| PCMark 8 Home Score Accelerated v2 | 5469 puntos | |
| PCMark 8 Work Score Accelerated v2 | 5812 puntos | |
| PCMark 10 Score | 6351 puntos | |
ayuda | ||
| AIDA64 / Memory Copy | |
| Media de la clase Multimedia (11299 - 132135, n=54, últimos 2 años) | |
| LG Gram 17Z90Q-E.AD78G | |
| Dell XPS 17 9720 | |
| Medio Intel Core i7-1255U (22846 - 67017, n=11) | |
| HP Envy 17-cr0079ng | |
| Acer Aspire 5 A515-57G-53N8 | |
| HP ProBook 450 G9 6A180EA | |
| Lenovo IdeaPad 3 17ABA7 | |
| AIDA64 / Memory Read | |
| Media de la clase Multimedia (11624 - 174586, n=54, últimos 2 años) | |
| LG Gram 17Z90Q-E.AD78G | |
| Dell XPS 17 9720 | |
| Medio Intel Core i7-1255U (22877 - 67398, n=11) | |
| HP Envy 17-cr0079ng | |
| Acer Aspire 5 A515-57G-53N8 | |
| HP ProBook 450 G9 6A180EA | |
| Lenovo IdeaPad 3 17ABA7 | |
| AIDA64 / Memory Write | |
| Media de la clase Multimedia (11755 - 134998, n=54, últimos 2 años) | |
| Dell XPS 17 9720 | |
| LG Gram 17Z90Q-E.AD78G | |
| Medio Intel Core i7-1255U (22883 - 65839, n=11) | |
| HP Envy 17-cr0079ng | |
| Acer Aspire 5 A515-57G-53N8 | |
| HP ProBook 450 G9 6A180EA | |
| Lenovo IdeaPad 3 17ABA7 | |
| AIDA64 / Memory Latency | |
| Media de la clase Multimedia (7 - 535, n=53, últimos 2 años) | |
| LG Gram 17Z90Q-E.AD78G | |
| Dell XPS 17 9720 | |
| Lenovo IdeaPad 3 17ABA7 | |
| Medio Intel Core i7-1255U (76 - 163.2, n=11) | |
| HP ProBook 450 G9 6A180EA | |
| HP Envy 17-cr0079ng | |
| HP Envy 17-cg | |
* ... más pequeño es mejor
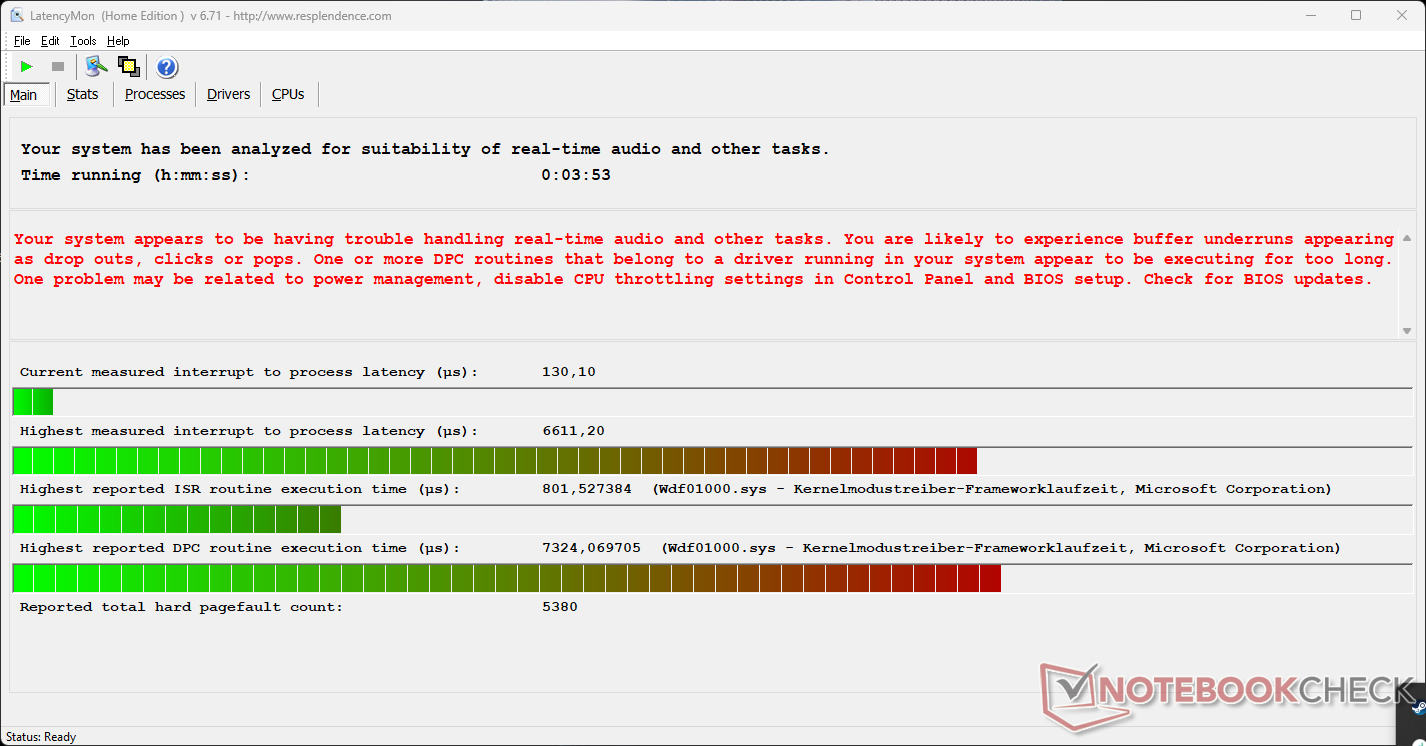
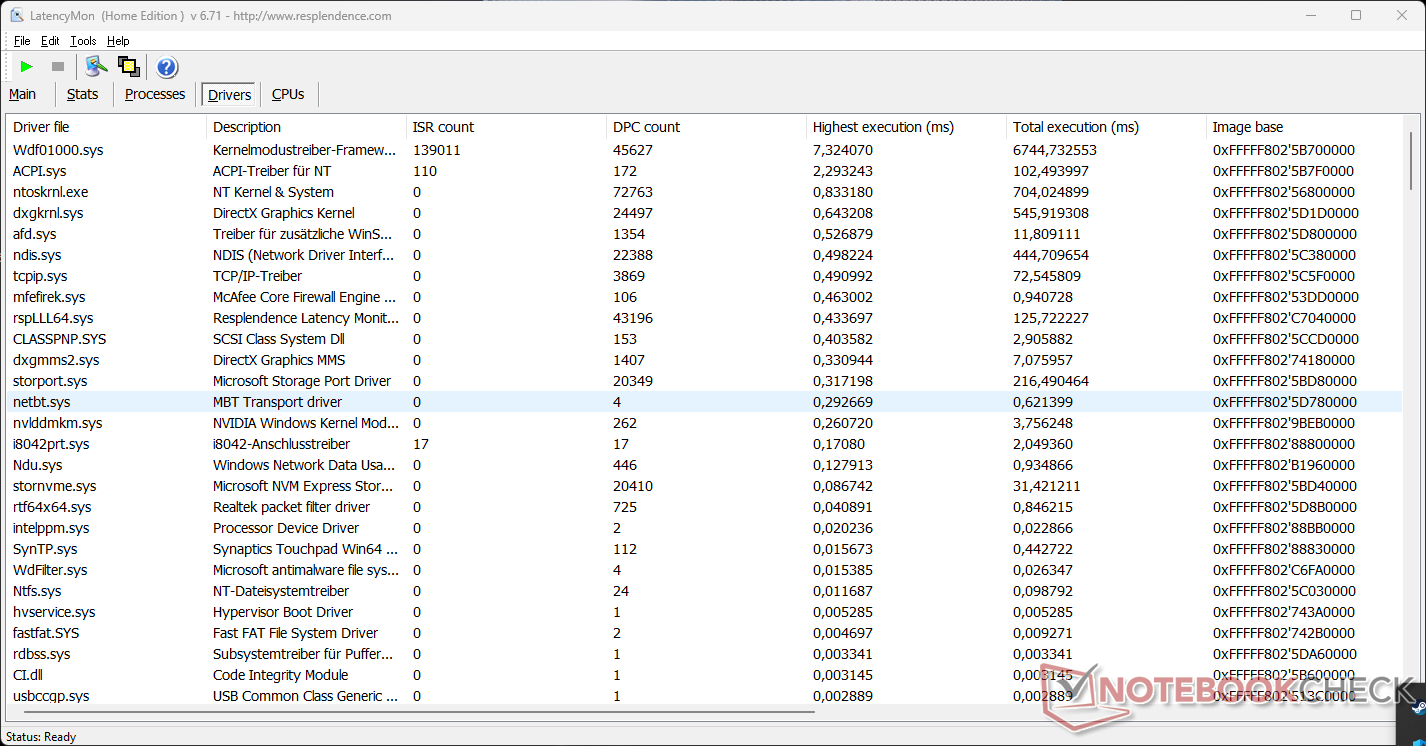
Latencias del CPD
Nuestra unidad de prueba muestra latencias DPC relativamente altas. Aunque esto podría ser un indicio de que podrían producirse algunos problemas con el procesamiento de audio y vídeo en tiempo real, como siempre esto también es sólo una instantánea momentánea de la configuración actual del controlador.
| DPC Latencies / LatencyMon - interrupt to process latency (max), Web, Youtube, Prime95 | |
| HP ProBook 450 G9 6A180EA | |
| HP Envy 17-cr0079ng | |
| LG Gram 17Z90Q-E.AD78G | |
| HP Envy 17-cg | |
| Acer Aspire 5 A515-57G-53N8 | |
| Lenovo IdeaPad 3 17ABA7 | |
| Dell XPS 17 9720 | |
* ... más pequeño es mejor
Solución de almacenamiento
La unidad SSD de 1 TB de Samsung no rinde especialmente bien en nuestras mediciones de prueba. No sólo queda por detrás de la mayoría de los demás competidores, sino también por debajo del nivel medio de SSD. HP no se hizo ningún favor con esta elección, pero aún así no notarías ninguna limitación durante el funcionamiento diario. Al menos los valores se mantienen casi idénticos en el rendimiento constante, sin empezar a ralentizarse.

* ... más pequeño es mejor
Disk Throttling: DiskSpd Read Loop, Queue Depth 8
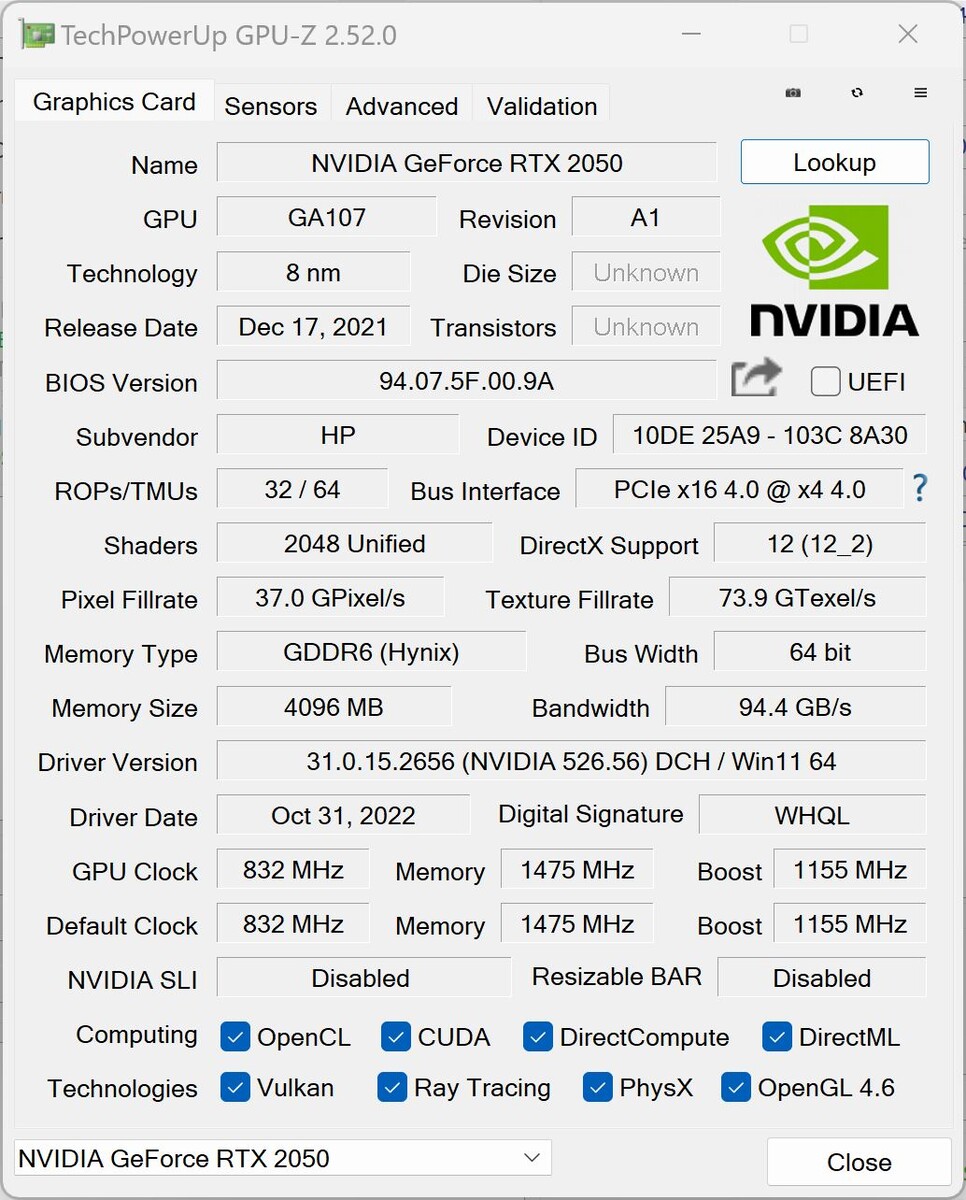
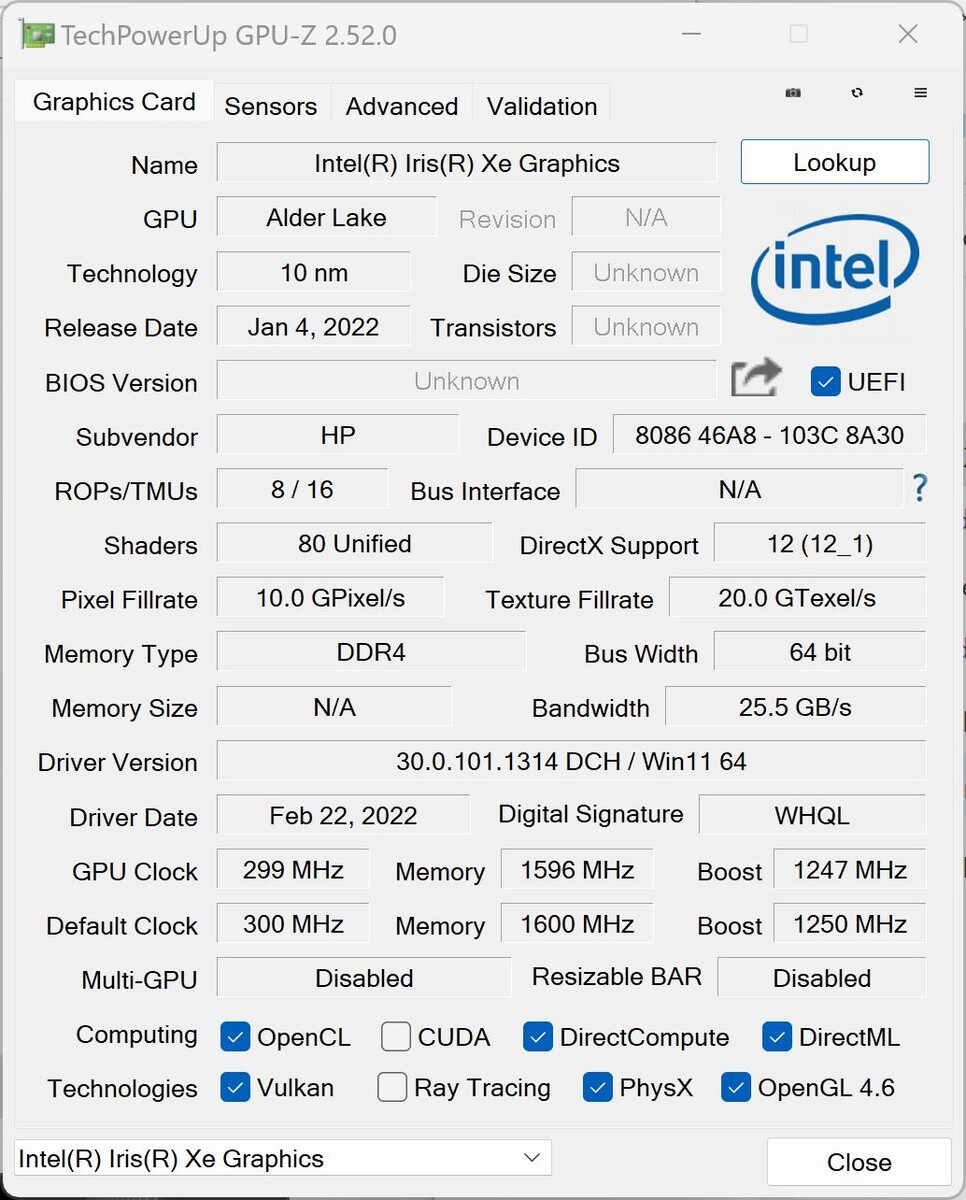
Tarjeta gráfica
Mientras que la iGPU Intel Iris Xe Graphics se encarga de las tareas gráficas menos exigentes, con mayores exigencias la Nvidia GeForce RTX 2050 para portátiles Se activa. Sin embargo, la GPU también viene de 2021, por lo que ya no es ninguna gallina de los huevos de oro. La tarjeta gráfica está equipada con 4 GB de almacenamiento gráfico GDDR6 y funciona a una velocidad de reloj de hasta 1.477 MHz. No está a la altura de la GeForce RTX 4050presentada recientemente por Nvidia, lo que la deja muy atrás.
En las pruebas gráficas, el HP Envy 17-cr0079ng alcanza valores sólidos en nuestro test. Aunque se quedan en partes por debajo de la media de esta solución gráfica, siempre están por encima de los del ligero LG Gram 17Z90Qcampeón de resistencia y al nivel del Acer Aspire 5 A515ambos equipados con la misma dGPU.
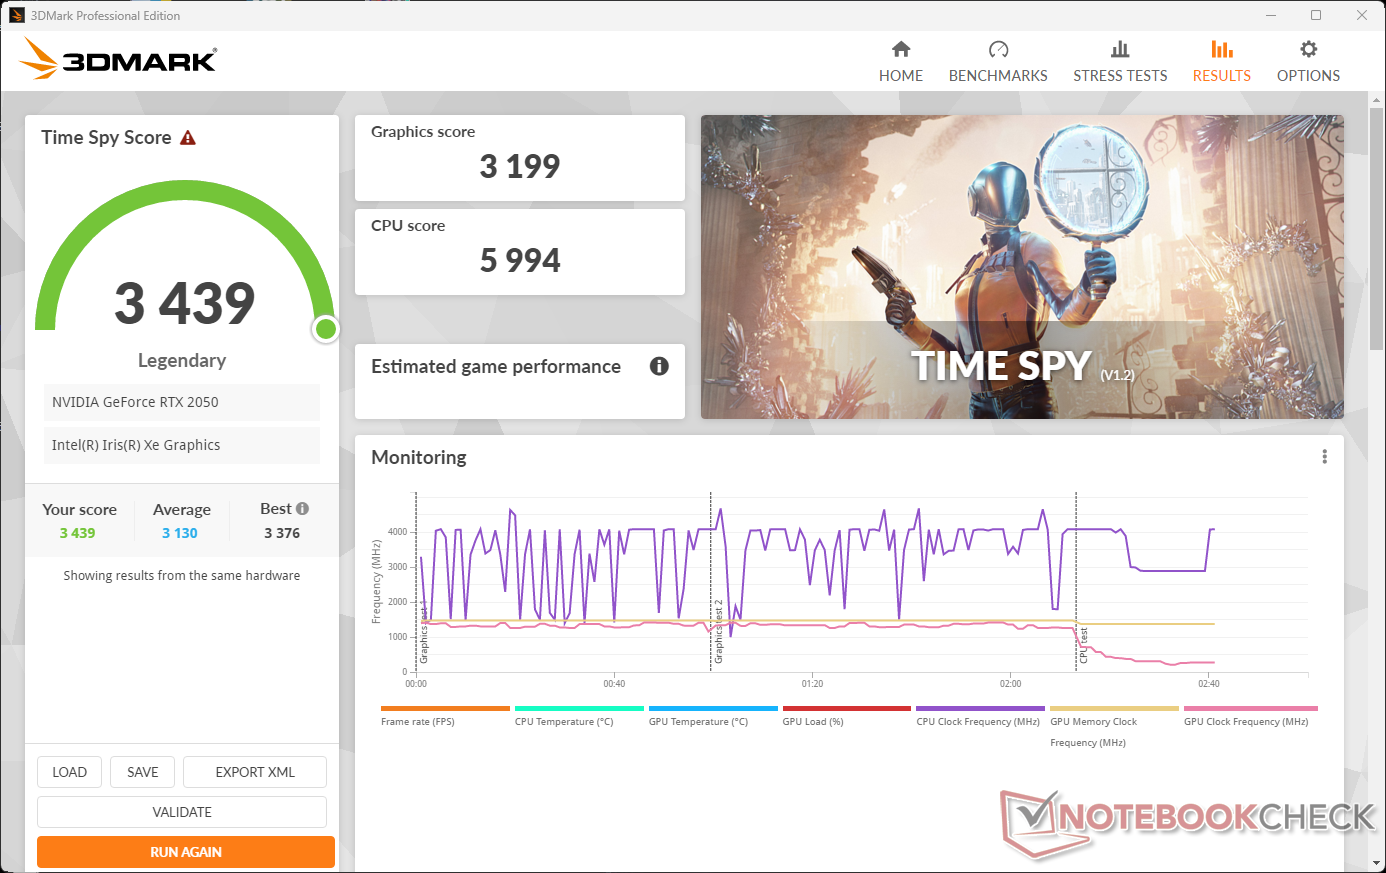
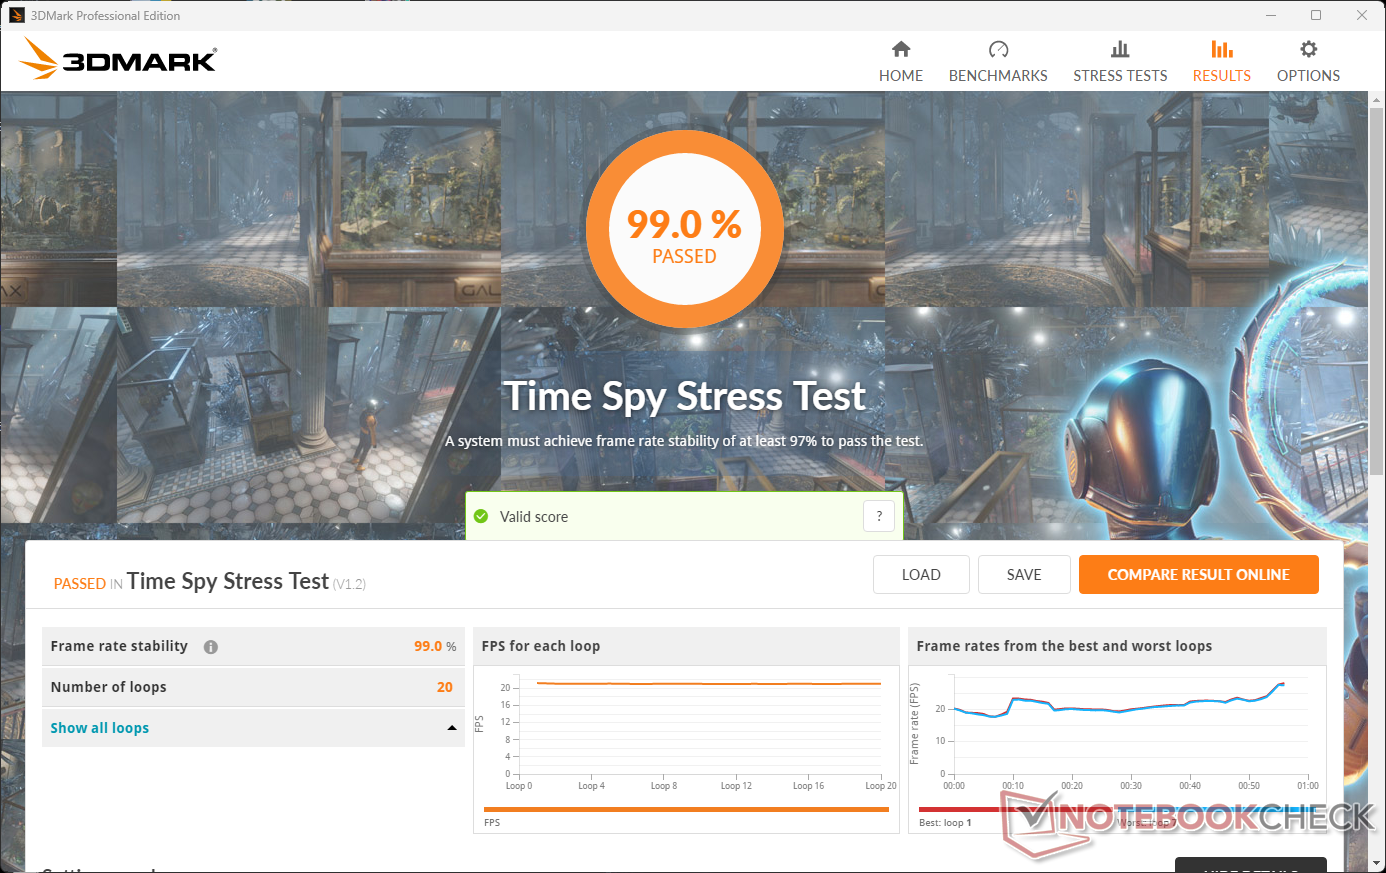
En funcionamiento de red, el rendimiento gráfico se mantiene constante a lo largo del tiempo, como muestra la prueba de estrés de 3DMark (resultado: 99%). En funcionamiento con batería, el portátil sigue alcanzando entre el 80 y el 90% dependiendo del benchmark (3DMark 11: 11.017 puntos gráficos).
| 3DMark 11 Performance | 12472 puntos | |
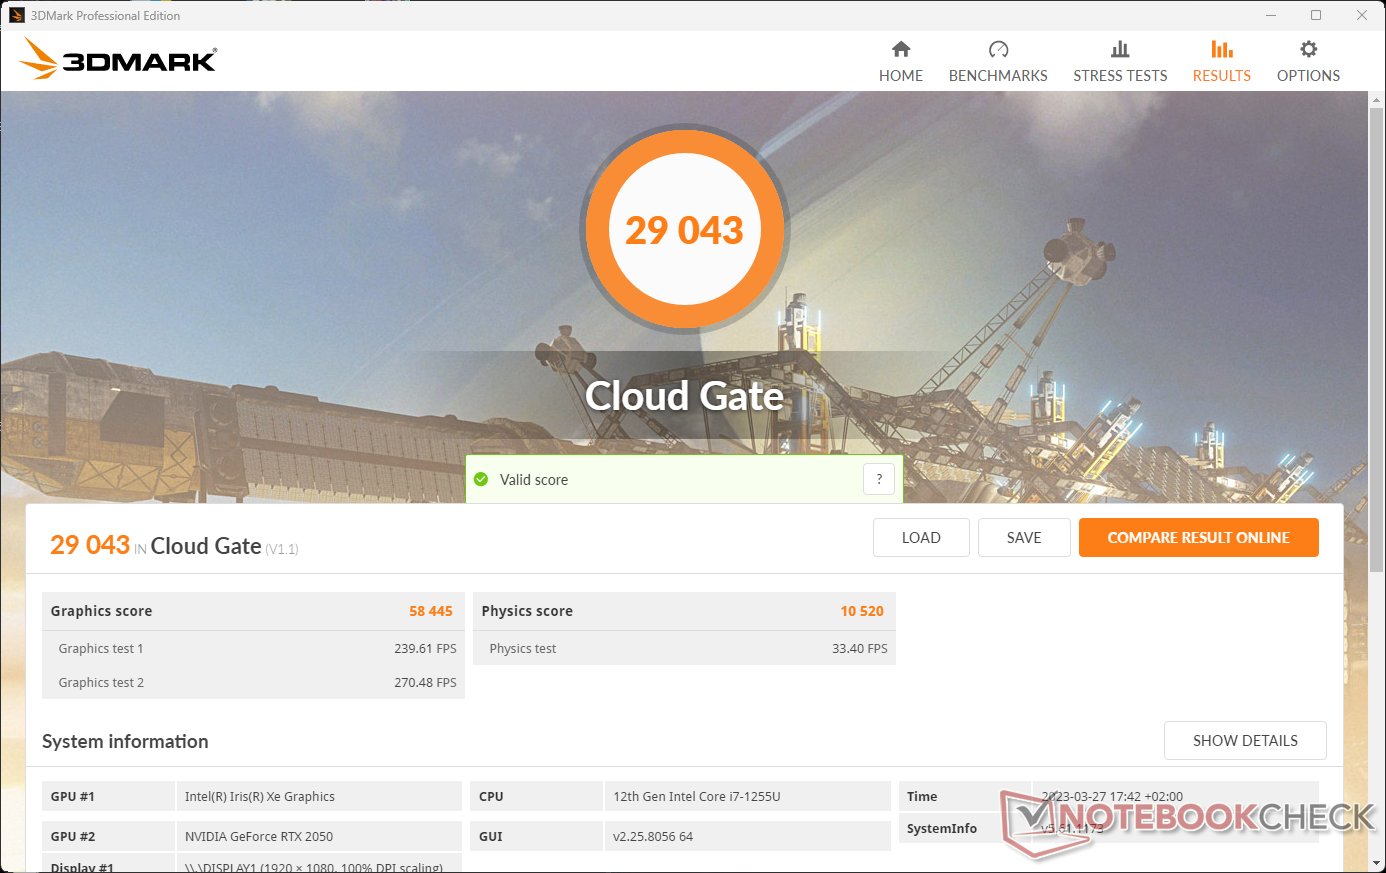
| 3DMark Cloud Gate Standard Score | 29043 puntos | |
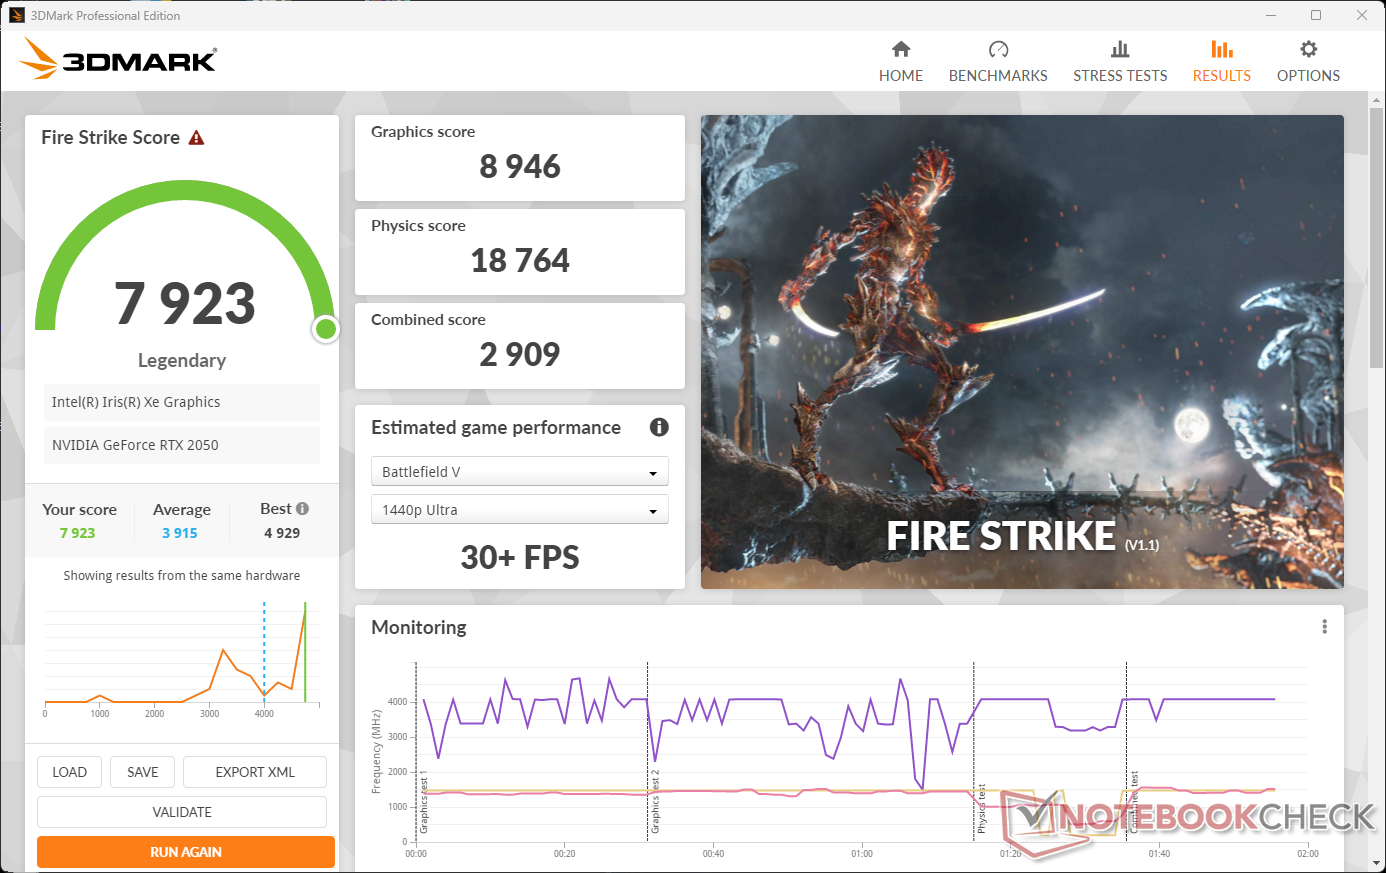
| 3DMark Fire Strike Score | 7923 puntos | |
| 3DMark Time Spy Score | 3439 puntos | |
ayuda | ||
* ... más pequeño es mejor
Rendimiento en juegos
Para una ronda cultivada de juegos con el portátil multimedia HP Envy 17, la solución gráfica dedicada es fácilmente suficiente. La mayoría de los juegos que elegimos para nuestro test van fluidos con ajustes gráficos altos o incluso al máximo en resolución FHD. Sin embargo, la GPU apenas te permitirá disfrutar de la resolución 4K completa de la pantalla.
Una molestia: Usando el modo "Rendimiento" en el HP Command Center, muchos juegos se minimizaron al cambiar la resolución de pantalla, y no pudimos continuarlos después, o incluso se bloquearon por completo. No pudimos controlar este problema durante nuestras pruebas del HP Envy 17. Por tanto, algunas de las mediciones de juegos sólo se realizaron usando el modo "Ajuste Inteligente", donde el problema no ocurrió.
| The Witcher 3 - 1920x1080 Ultra Graphics & Postprocessing (HBAO+) | |
| MSI Katana 15 B12VEK | |
| Media de la clase Multimedia (11 - 121, n=7, últimos 2 años) | |
| Dell XPS 17 9720 | |
| LG Gram 17Z90Q-E.AD78G | |
| HP Envy 17-cr0079ng | |
| Acer Aspire 5 A515-57G-53N8 | |
| HP ProBook 450 G9 6A180EA | |
| Lenovo IdeaPad 3 17ABA7 | |
| GTA V - 1920x1080 Highest AA:4xMSAA + FX AF:16x | |
| MSI Katana 15 B12VEK | |
| Dell XPS 17 9720 | |
| Media de la clase Multimedia (7.92 - 141.6, n=55, últimos 2 años) | |
| HP Envy 17-cr0079ng | |
| Acer Aspire 5 A515-57G-53N8 | |
| LG Gram 17Z90Q-E.AD78G | |
| Lenovo IdeaPad 3 17ABA7 | |
| Final Fantasy XV Benchmark - 1920x1080 High Quality | |
| MSI Katana 15 B12VEK | |
| Media de la clase Multimedia (7.61 - 144.4, n=57, últimos 2 años) | |
| Dell XPS 17 9720 | |
| HP Envy 17-cr0079ng | |
| Acer Aspire 5 A515-57G-53N8 | |
| LG Gram 17Z90Q-E.AD78G | |
| HP ProBook 450 G9 6A180EA | |
| Lenovo IdeaPad 3 17ABA7 | |
| Strange Brigade - 1920x1080 ultra AA:ultra AF:16 | |
| MSI Katana 15 B12VEK | |
| Media de la clase Multimedia (13.3 - 303, n=57, últimos 2 años) | |
| Dell XPS 17 9720 | |
| HP Envy 17-cr0079ng | |
| LG Gram 17Z90Q-E.AD78G | |
| HP ProBook 450 G9 6A180EA | |
| Lenovo IdeaPad 3 17ABA7 | |
| Dota 2 Reborn - 1920x1080 ultra (3/3) best looking | |
| Dell XPS 17 9720 | |
| MSI Katana 15 B12VEK | |
| HP Envy 17-cr0079ng | |
| Media de la clase Multimedia (29 - 179.9, n=59, últimos 2 años) | |
| Acer Aspire 5 A515-57G-53N8 | |
| LG Gram 17Z90Q-E.AD78G | |
| HP ProBook 450 G9 6A180EA | |
| Lenovo IdeaPad 3 17ABA7 | |
En nuestra prueba de carga constante "The Witcher 3", la frecuencia de imagen se mantiene a un nivel constante y no medimos ninguna caída.
The Witcher 3 FPS Chart
| bajo | medio | alto | ultra | QHD | 4K | |
|---|---|---|---|---|---|---|
| GTA V (2015) | 150.7 | 139.3 | 90.2 | 44.8 | ||
| The Witcher 3 (2015) | 175.7 | 106.4 | 58.2 | 33.4 | ||
| Dota 2 Reborn (2015) | 140.9 | 125.8 | 119.5 | 112.6 | 54.8 | |
| Final Fantasy XV Benchmark (2018) | 90.5 | 49 | 35 | 25 | 13.4 | |
| X-Plane 11.11 (2018) | 97.8 | 83.9 | 68.1 | 51.7 | ||
| Far Cry 5 (2018) | 107 | 59 | 53 | 49 | 35 | 18 |
| Strange Brigade (2018) | 170.8 | 74.2 | 60.9 | 53.3 | ||
| Monster Hunter Stories 2 (2021) | 94.4 | 91.2 | 89.7 | 72.5 | ||
| F1 2021 (2021) | 190.7 | 105.6 | 66.2 | 36.1 | 27 | 11 |
| GRID Legends (2022) | 100.6 | 80.8 | 67.9 | 49.5 | 39.4 | 23.3 |
| F1 22 (2022) | 167.7 | 106.6 | 92.7 | 59 | 12 | |
| Dead Space Remake (2023) | 30.8 | 25.8 | 20.4 | 17.8 | 7.4 |
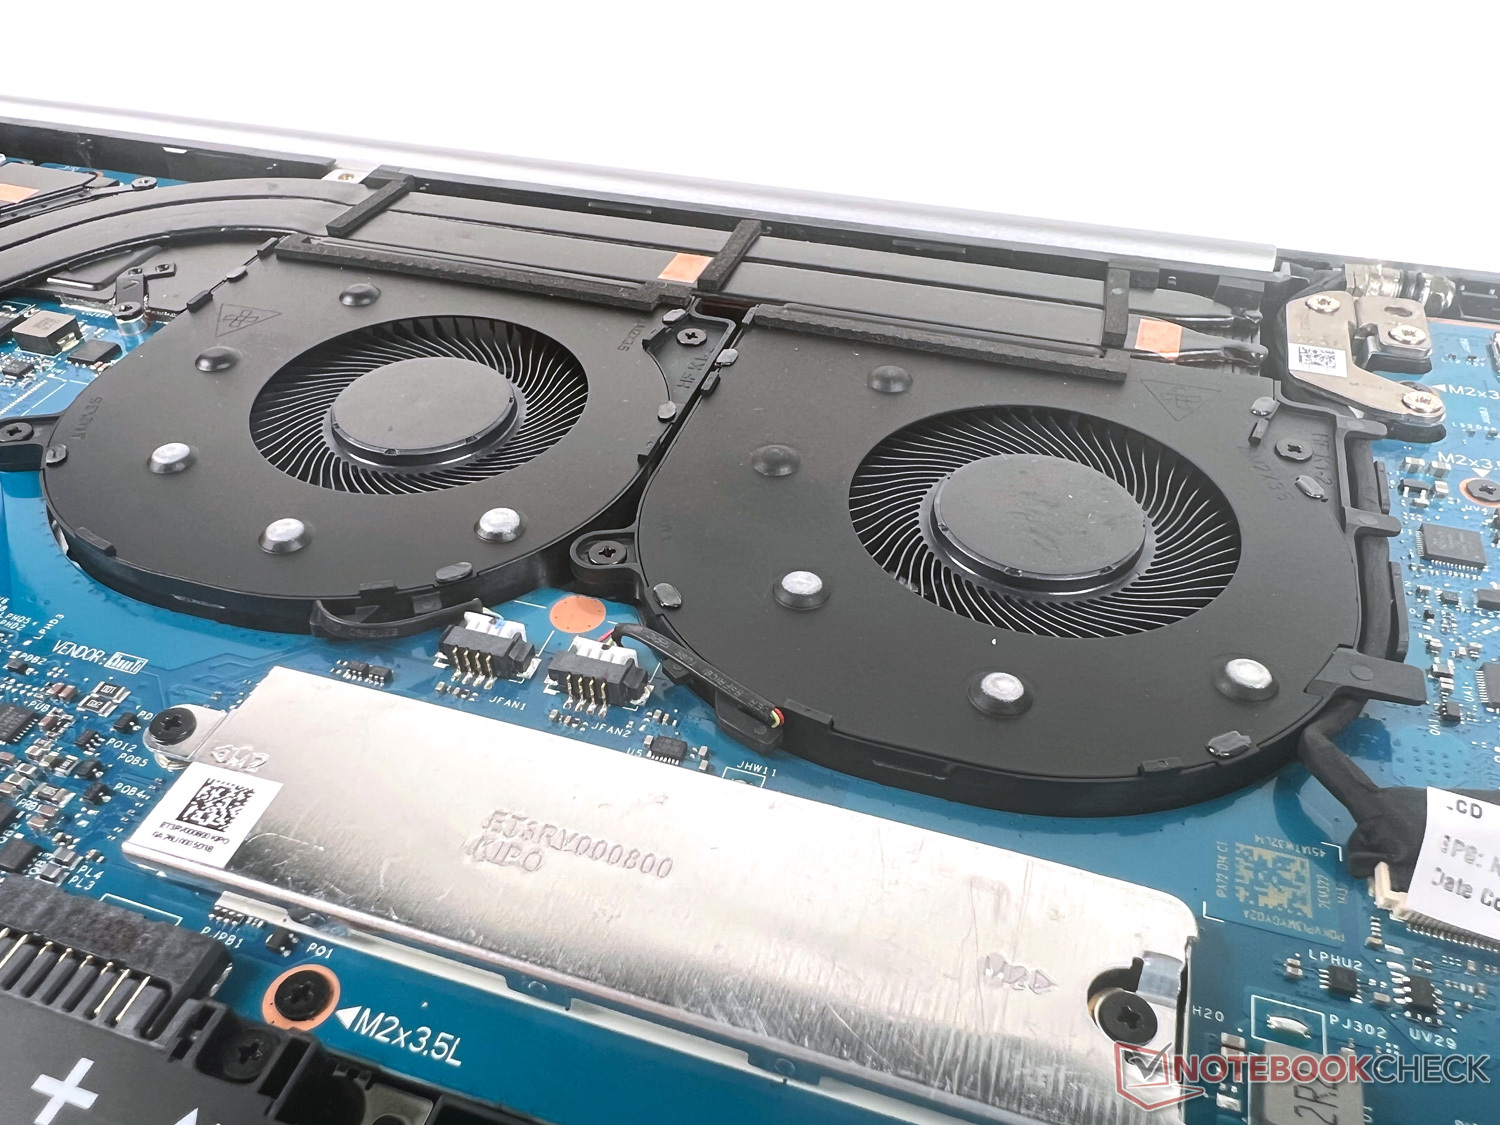
Emisiones: Bajo, bajo, dónde está el bajo...
Niveles de ruido
Durante el funcionamiento en reposo y con poca carga, el HP Envy 17 no es audible. Bajo algunas demandas ligeras, los dos ventiladores para CPU y GPU ronronean constantemente, sin ser particularmente molestos. Por otro lado, si desafías al hardware integrado (por ejemplo, durante los juegos), el dispositivo alcanza un nivel de ruido de hasta 48 dB. El modo "Ajuste Inteligente" apenas aporta ventajas de ruido cuando se baja ligeramente la carga.
Nuestra unidad de pruebas no produce ningún otro ruido molesto.
Ruido
| Ocioso |
| 28.5 / 28.5 / 29.7 dB(A) |
| Carga |
| 39.5 / 48 dB(A) |
 | ||
30 dB silencioso 40 dB(A) audible 50 dB(A) ruidosamente alto |
||
min: | ||
| HP Envy 17-cr0079ng GeForce RTX 2050 Mobile, i7-1255U, Samsung PM991a MZVLQ1T0HBLB | HP ProBook 450 G9 6A180EA Iris Xe G7 96EUs, i7-1255U, SK Hynix HFM512GD3JX013N | LG Gram 17Z90Q-E.AD78G GeForce RTX 2050 Mobile, i7-1260P, Samsung PM9A1 MZVL21T0HCLR | Acer Aspire 5 A515-57G-53N8 GeForce RTX 2050 Mobile, i5-1240P, Micron 2450 512GB MTFDKBA512TFK | Dell XPS 17 9720 GeForce RTX 3050 4GB Laptop GPU, i7-12700H, Micron 3400 MTFDKBA512TFH 512GB | Lenovo IdeaPad 3 17ABA7 Vega 7, R5 5625U, Intel SSDPEKNW512GZL | |
|---|---|---|---|---|---|---|
| Noise | 19% | -3% | -0% | 8% | -5% | |
| apagado / medio ambiente * (dB) | 26.5 | 25.5 4% | 26 2% | 25 6% | 24 9% | 26 2% |
| Idle Minimum * (dB) | 28.5 | 25.5 11% | 28 2% | 25 12% | 24 16% | 26 9% |
| Idle Average * (dB) | 28.5 | 25.5 11% | 28 2% | 29 -2% | 24 16% | 30.8 -8% |
| Idle Maximum * (dB) | 29.7 | 25.5 14% | 28.8 3% | 31 -4% | 24 19% | 33.4 -12% |
| Load Average * (dB) | 39.5 | 28 29% | 49.3 -25% | 46 -16% | 43.9 -11% | 47.6 -21% |
| Load Maximum * (dB) | 48 | 27.7 42% | 49.1 -2% | 47 2% | 48.4 -1% | 47.5 1% |
| Witcher 3 ultra * (dB) | 42 | 48.4 |
* ... más pequeño es mejor
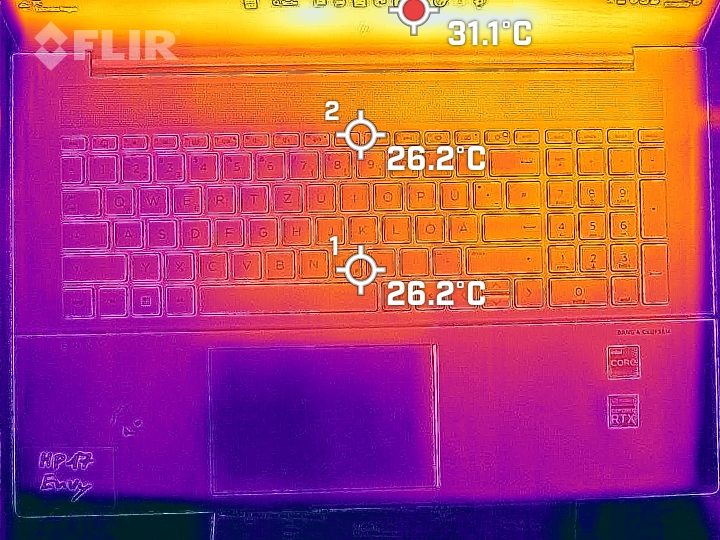
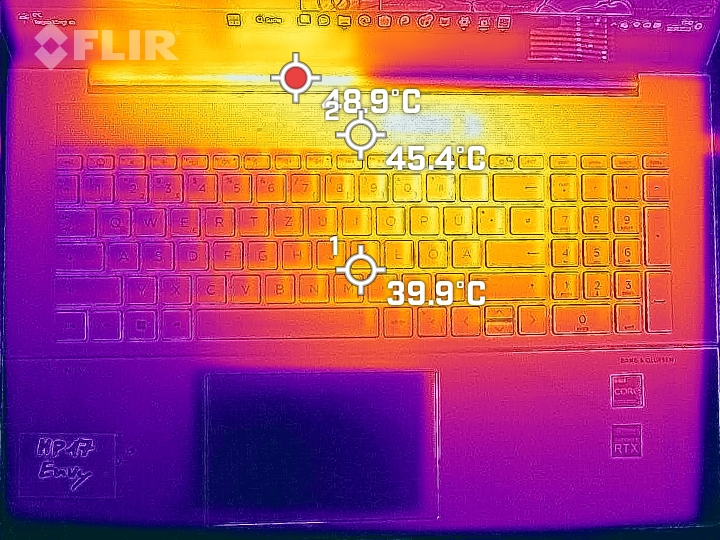
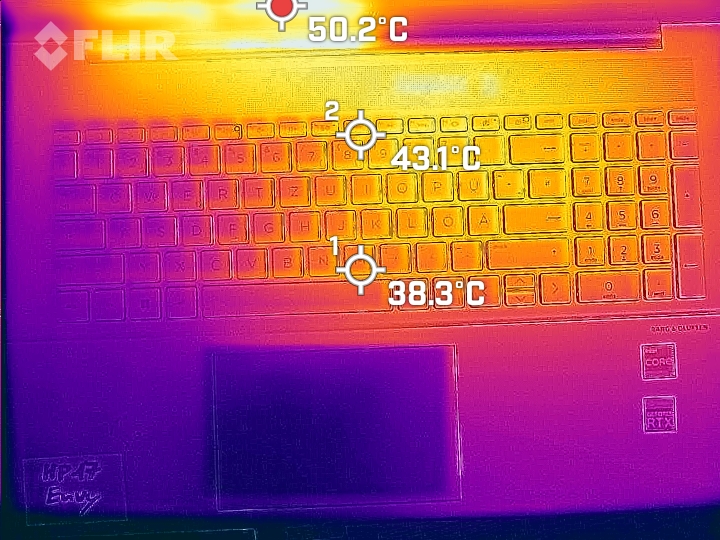
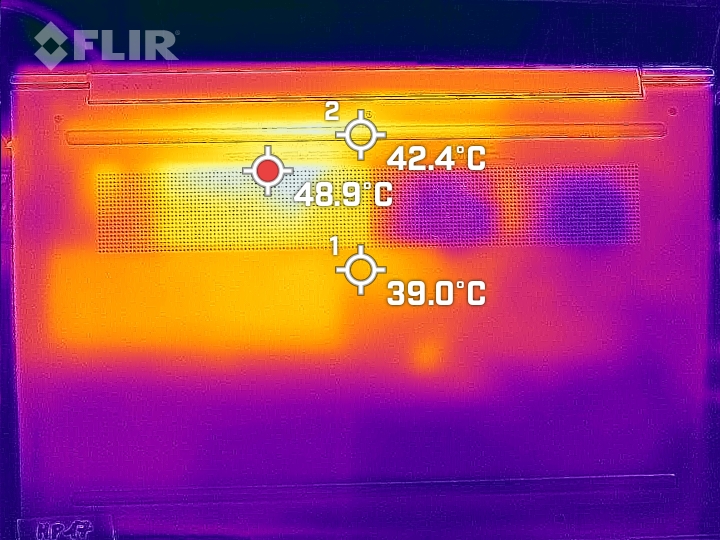
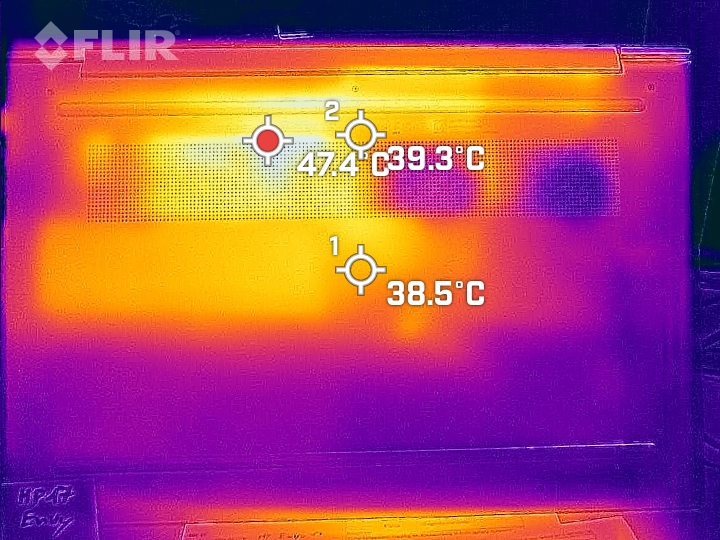
Temperatura
En reposo, el portátil apenas se calienta por encima de la temperatura ambiente. Bajo carga, un punto caliente se desarrolla en el centro delante de la pantalla, que luego se expande hacia el teclado, alcanzando temperaturas cercanas a la marca de 50°C (122 °F). Aunque este calentamiento se nota al teclear, no llega a ser demasiado incómodo.
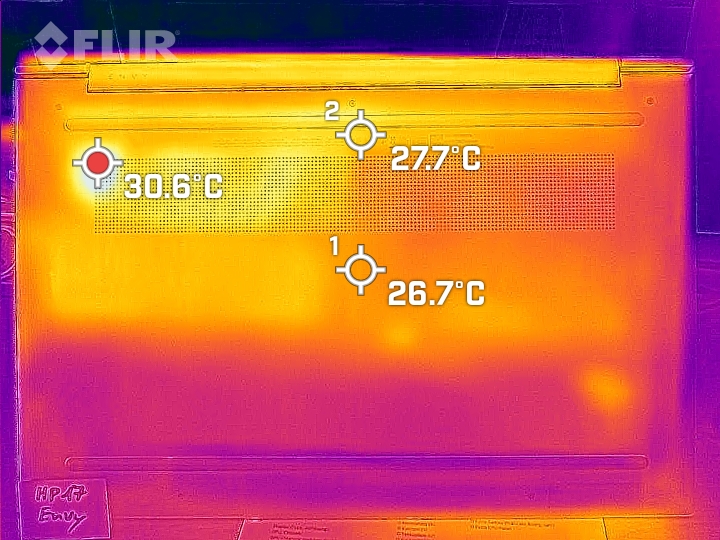
(-) La temperatura máxima en la parte superior es de 47.1 °C / 117 F, frente a la media de 36.8 °C / 98 F, que oscila entre 21 y 71 °C para la clase Multimedia.
(±) El fondo se calienta hasta un máximo de 43.8 °C / 111 F, frente a la media de 39.1 °C / 102 F
(+) En reposo, la temperatura media de la parte superior es de 23.9 °C / 75# F, frente a la media del dispositivo de 31.3 °C / 88 F.
(±) Jugando a The Witcher 3, la temperatura media de la parte superior es de 34.5 °C / 94 F, frente a la media del dispositivo de 31.3 °C / 88 F.
(+) El reposamanos y el panel táctil están a una temperatura inferior a la de la piel, con un máximo de 31.7 °C / 89.1 F y, por tanto, son fríos al tacto.
(-) La temperatura media de la zona del reposamanos de dispositivos similares fue de 28.7 °C / 83.7 F (-3 °C / -5.4 F).
| HP Envy 17-cr0079ng Intel Core i7-1255U, NVIDIA GeForce RTX 2050 Mobile | HP ProBook 450 G9 6A180EA Intel Core i7-1255U, Intel Iris Xe Graphics G7 96EUs | LG Gram 17Z90Q-E.AD78G Intel Core i7-1260P, NVIDIA GeForce RTX 2050 Mobile | Acer Aspire 5 A515-57G-53N8 Intel Core i5-1240P, NVIDIA GeForce RTX 2050 Mobile | Dell XPS 17 9720 Intel Core i7-12700H, NVIDIA GeForce RTX 3050 4GB Laptop GPU | Lenovo IdeaPad 3 17ABA7 AMD Ryzen 5 5625U, AMD Radeon RX Vega 7 | Media de la clase Multimedia | |
|---|---|---|---|---|---|---|---|
| Heat | -14% | -9% | -2% | -3% | 1% | -0% | |
| Maximum Upper Side * (°C) | 47.1 | 40.5 14% | 50.3 -7% | 43 9% | 49.5 -5% | 43.1 8% | 41.1 ? 13% |
| Maximum Bottom * (°C) | 43.8 | 47.6 -9% | 52.5 -20% | 48 -10% | 38.4 12% | 43.6 -0% | 43.6 ? -0% |
| Idle Upper Side * (°C) | 25.2 | 32.6 -29% | 26.9 -7% | 26 -3% | 28 -11% | 25.1 -0% | 26.9 ? -7% |
| Idle Bottom * (°C) | 25.9 | 34.2 -32% | 26.5 -2% | 27 -4% | 27.8 -7% | 27 -4% | 27.8 ? -7% |
* ... más pequeño es mejor
Prueba de resistencia
En nuestra prueba de estrés con Prime95 y Furmark desafiando al hardware durante al menos una hora, la CPU y la GPU mantienen un resultado constante sin caídas mayores durante la prueba. La CPU se nivela a una media de 71 °C y alrededor de 1,65 GHz, lo que está ligeramente por debajo de la velocidad de reloj básica de 1,7 GHz. Sin embargo, esto no tiene ningún impacto en el funcionamiento diario. La GPU consume 35 vatios y funciona a unos 1,1 GHz con temperaturas en torno a los 75 °C.
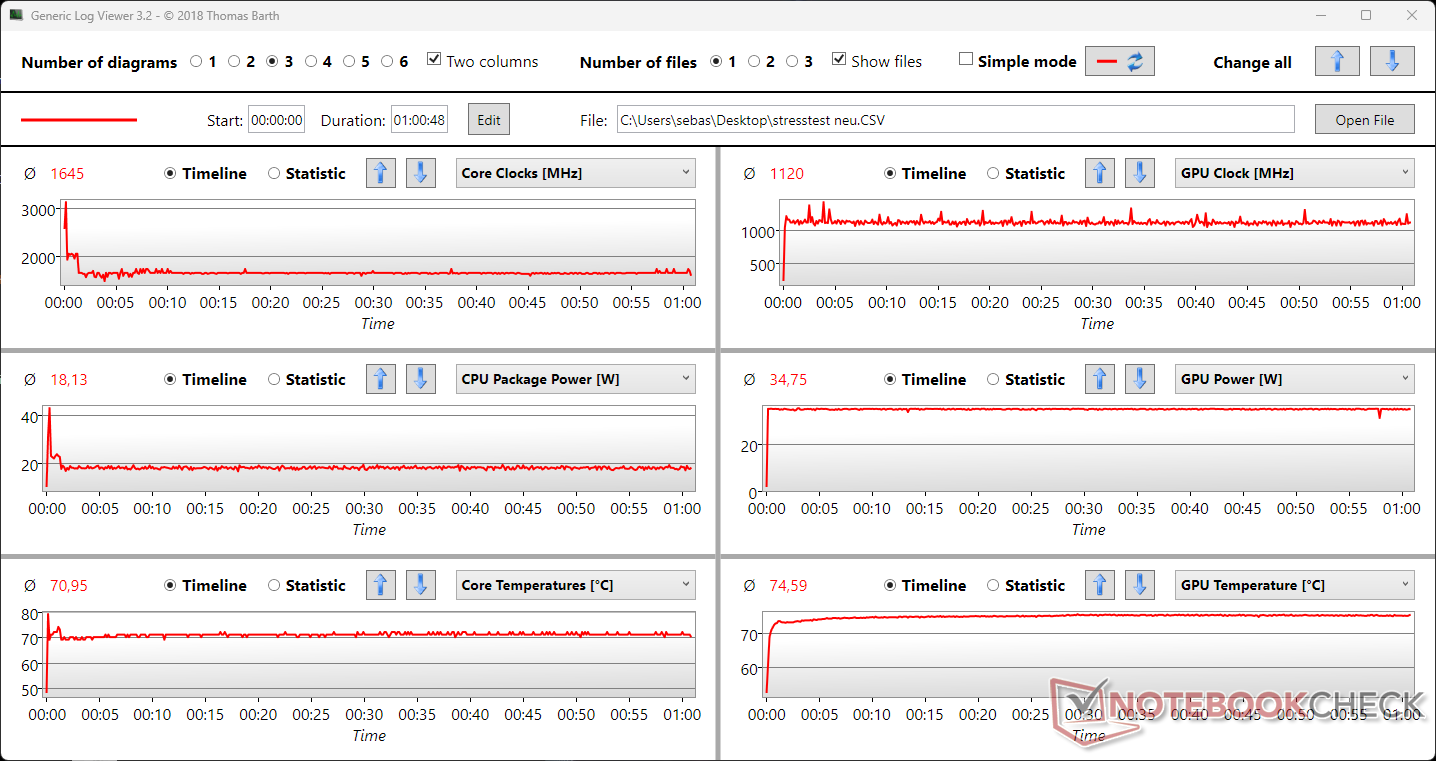
| Reloj dela CPU (GHz) | Reloj de la GPU (MHz) | Temperatura media dela CPU (°C) | Temperatura media de la GPU (°C) | |
| Sistema en reposo | 2.0 | 0 | 49 | 55 |
| Prime95,estrés | 2,5 | 0 | 68 | 55 |
| Prime95+ FurMark, Estrés | 1,65 | 1,1 | 71 | 75 |
| Witcher 3, Stress | 3,3 | 1,3 | 65 | 71 |
Altavoces
Los altavoces estéreo de Bang & Olufsen pueden sonar relativamente alto y ofrecen medios y agudos bastante equilibrados. Sin embargo, carecen casi por completo de graves. En general, nuestra unidad de pruebas se sitúa en la mitad inferior del campo multimedia en cuanto a reproducción de audio. Especialmente para música o juegos, recomendamos conectar auriculares o cascos a través del puerto de audio de 3,5 mm.
HP Envy 17-cr0079ng análisis de audio
(+) | los altavoces pueden reproducir a un volumen relativamente alto (#86.2 dB)
Graves 100 - 315 Hz
(-) | casi sin bajos - de media 17.6% inferior a la mediana
(±) | la linealidad de los graves es media (12.4% delta a frecuencia anterior)
Medios 400 - 2000 Hz
(+) | medios equilibrados - a sólo 2.5% de la mediana
(+) | los medios son lineales (3.6% delta a la frecuencia anterior)
Altos 2 - 16 kHz
(±) | máximos más altos - de media 10.1% más altos que la mediana
(+) | los máximos son lineales (4.2% delta a la frecuencia anterior)
Total 100 - 16.000 Hz
(±) | la linealidad del sonido global es media (18.3% de diferencia con la mediana)
En comparación con la misma clase
» 56% de todos los dispositivos probados de esta clase eran mejores, 7% similares, 38% peores
» El mejor tuvo un delta de 5%, la media fue 17%, el peor fue ###max##%
En comparación con todos los dispositivos probados
» 40% de todos los dispositivos probados eran mejores, 8% similares, 52% peores
» El mejor tuvo un delta de 4%, la media fue 23%, el peor fue ###max##%
Apple MacBook Pro 16 2021 M1 Pro análisis de audio
(+) | los altavoces pueden reproducir a un volumen relativamente alto (#84.7 dB)
Graves 100 - 315 Hz
(+) | buen bajo - sólo 3.8% lejos de la mediana
(+) | el bajo es lineal (5.2% delta a la frecuencia anterior)
Medios 400 - 2000 Hz
(+) | medios equilibrados - a sólo 1.3% de la mediana
(+) | los medios son lineales (2.1% delta a la frecuencia anterior)
Altos 2 - 16 kHz
(+) | máximos equilibrados - a sólo 1.9% de la mediana
(+) | los máximos son lineales (2.7% delta a la frecuencia anterior)
Total 100 - 16.000 Hz
(+) | el sonido global es lineal (4.6% de diferencia con la mediana)
En comparación con la misma clase
» 0% de todos los dispositivos probados de esta clase eran mejores, 0% similares, 100% peores
» El mejor tuvo un delta de 5%, la media fue 17%, el peor fue ###max##%
En comparación con todos los dispositivos probados
» 0% de todos los dispositivos probados eran mejores, 0% similares, 100% peores
» El mejor tuvo un delta de 4%, la media fue 23%, el peor fue ###max##%
Gestión de la energía: El HP Envy 17 no es un campeón de resistencia
Consumo de energía
El HP Envy 17-cr0079ng no es muy eficiente. Comparado con el LG Gram 17con la misma diagonal de pantalla y dGPU, así como la mayoría de los otros modelos de la comparación, consume más energía del cargador, que con 90 W es suficientemente grande para un consumo de energía de alrededor de 70 W. Sólo bajo carga máxima absoluta, el consumo llega apenas más alto a 93 W.
| Off / Standby | |
| Ocioso | |
| Carga |
|
Clave:
min: | |
| HP Envy 17-cr0079ng i7-1255U, GeForce RTX 2050 Mobile, Samsung PM991a MZVLQ1T0HBLB, IPS, 3840x2160, 17.3" | HP ProBook 450 G9 6A180EA i7-1255U, Iris Xe G7 96EUs, SK Hynix HFM512GD3JX013N, , 1920x1080, 15.6" | LG Gram 17Z90Q-E.AD78G i7-1260P, GeForce RTX 2050 Mobile, Samsung PM9A1 MZVL21T0HCLR, IPS, 2560x1600, 17" | Acer Aspire 5 A515-57G-53N8 i5-1240P, GeForce RTX 2050 Mobile, Micron 2450 512GB MTFDKBA512TFK, IPS, 1920x1080, 15.6" | Dell XPS 17 9720 i7-12700H, GeForce RTX 3050 4GB Laptop GPU, Micron 3400 MTFDKBA512TFH 512GB, IPS, 3840x2400, 17" | Lenovo IdeaPad 3 17ABA7 R5 5625U, Vega 7, Intel SSDPEKNW512GZL, IPS, 1920x1080, 17.3" | Medio NVIDIA GeForce RTX 2050 Mobile | Media de la clase Multimedia | |
|---|---|---|---|---|---|---|---|---|
| Power Consumption | 47% | 31% | 26% | -35% | 42% | 18% | 10% | |
| Idle Minimum * (Watt) | 5.8 | 4.5 22% | 4.1 29% | 4 31% | 7.8 -34% | 5.1 12% | 5.11 ? 12% | 5.66 ? 2% |
| Idle Average * (Watt) | 14.3 | 7.3 49% | 9.8 31% | 8 44% | 15.1 -6% | 8.3 42% | 9.15 ? 36% | 10.2 ? 29% |
| Idle Maximum * (Watt) | 18.4 | 8.1 56% | 12 35% | 13 29% | 17 8% | 9.6 48% | 11.2 ? 39% | 12.5 ? 32% |
| Load Average * (Watt) | 70 | 32.8 53% | 49.3 30% | 62 11% | 114 -63% | 33.6 52% | 70.6 ? -1% | 65.2 ? 7% |
| Witcher 3 ultra * (Watt) | 69.4 | 32 54% | 49.3 29% | 60 14% | 115.2 -66% | 33.3 52% | ||
| Load Maximum * (Watt) | 93 | 47 49% | 66 29% | 70 25% | 135.6 -46% | 51.9 44% | 87.4 ? 6% | 113.5 ? -22% |
* ... más pequeño es mejor
Power Consumption The Witcher 3 / Stress Test
Power Consumption with External Monitor
Duración de la batería
HP ha equipado nuestra unidad de pruebas Envy 17 con una batería de 55 Wh. Con esto, es ligeramente mayor que la de la mayoría de dispositivos de la comparación. Sólo el campeón de resistencia LG Gram 17 y el portátil potente Dell XPS 17 tienen baterías significativamente mayores.
Sin embargo, el tamaño de la batería sólo se refleja de forma limitada en la duración de la batería de nuestra unidad de pruebas. En el campo de la comparación, nuestro dispositivo ocupa el último lugar, lo que probablemente se deba principalmente a la pantalla 4K bastante brillante y de alta resolución. Bajo carga, la batería se agota tras sólo unos 90 minutos, y al navegar o ver vídeos, los valores tampoco invitan al entusiasmo, con unas 4,5 y 5,5 horas respectivamente.
| HP Envy 17-cr0079ng i7-1255U, GeForce RTX 2050 Mobile, 55 Wh | HP ProBook 450 G9 6A180EA i7-1255U, Iris Xe G7 96EUs, 51 Wh | LG Gram 17Z90Q-E.AD78G i7-1260P, GeForce RTX 2050 Mobile, 90 Wh | Acer Aspire 5 A515-57G-53N8 i5-1240P, GeForce RTX 2050 Mobile, 50 Wh | Dell XPS 17 9720 i7-12700H, GeForce RTX 3050 4GB Laptop GPU, 97 Wh | Lenovo IdeaPad 3 17ABA7 R5 5625U, Vega 7, 38 Wh | Media de la clase Multimedia | |
|---|---|---|---|---|---|---|---|
| Duración de Batería | 111% | 124% | 19% | 58% | 45% | 125% | |
| H.264 (h) | 5.5 | 11.2 104% | 17.1 ? 211% | ||||
| WiFi v1.3 (h) | 4.7 | 10.1 115% | 14.5 209% | 7.1 51% | 9.2 96% | 6.8 45% | 12.2 ? 160% |
| Load (h) | 1.6 | 3.3 106% | 2.2 38% | 1.4 -13% | 1.2 -25% | 1.664 ? 4% | |
| Witcher 3 ultra (h) | 2.7 | 1.7 | |||||
| Reader / Idle (h) | 15.8 | 24.9 ? |
Pro
Contra
Veredicto: El HP Envy 17 es un buen todoterreno con pocos aspectos destacables
En nuestra prueba, el HP Envy 17-cr0079ng se presenta como un portátil multimedia equilibrado. Gracias al sólido rendimiento de su CPU y a la web dedicada GeForce, también puede usarse para jugar a videojuegos, siempre que las exigencias no sean demasiado altas. Los que busquen más pueden encontrarlo en el Dell XPS 17 por ejemplo.
Uno de los aspectos más destacados debería ser la gran y brillante pantalla con resolución UHD. Gracias a su diseño de alto brillo también se ve muy bien, pero eso resulta ser un problema con reflejos de luz o en exteriores.
El portátil también muestra algunas debilidades en la duración de la batería, por lo que no es un compañero ideal para uso en exteriores o móvil. Aquellos que quieran poder trabajar lejos de la toma de corriente el mayor tiempo posible deberían elegir definitivamente otro portátil como el extremadamente duraderoLG Gram 17.
En general, el HP Envy 17 puntúa en nuestra prueba con más puntos fuertes que débiles, pero es incapaz de destacar realmente en ningún área. Ofrece una buena mezcla para multimedia, juegos y Office, pero también cuesta un precio elevado con un MSRP de casi 2.000 Euros. Otros dispositivos ofrecen más por lo que cuestan, como el Acer Aspire 5 A515-57Gcon la misma dGPU pero sin pantalla 4K que cuesta sólo la mitad, o el aún más caro pero también más potente y en general más "perfecto" Dell XPS 17.
Precio y disponibilidad
El HP Envy 17 está disponible en muchas configuraciones a partir de 699,99 $. Un modelo con una configuración casi similar a la de nuestra unidad de pruebas (Intel Core i7-1260P en vez de i7-1255U, 32 GB RAM, SSD de 1 TB, pantalla QHD) pero sin la tarjeta gráfica dedicada está disponible por 1309,99 $, y otra configuración con la tarjeta gráfica pero menos RAM y una pantalla FHD más pequeña cuesta 1049,99 $.
HP Envy 17-cr0079ng
- 03/28/2023 v7 (old)
Marcus Schwarten
Transparencia
La selección de los dispositivos que se van a reseñar corre a cargo de nuestro equipo editorial. La muestra de prueba fue proporcionada al autor en calidad de préstamo por el fabricante o el minorista a los efectos de esta reseña. El prestamista no tuvo ninguna influencia en esta reseña, ni el fabricante recibió una copia de la misma antes de su publicación. No había ninguna obligación de publicar esta reseña. Como empresa de medios independiente, Notebookcheck no está sujeta a la autoridad de fabricantes, minoristas o editores.
Así es como prueba Notebookcheck
Cada año, Notebookcheck revisa de forma independiente cientos de portátiles y smartphones utilizando procedimientos estandarizados para asegurar que todos los resultados son comparables. Hemos desarrollado continuamente nuestros métodos de prueba durante unos 20 años y hemos establecido los estándares de la industria en el proceso. En nuestros laboratorios de pruebas, técnicos y editores experimentados utilizan equipos de medición de alta calidad. Estas pruebas implican un proceso de validación en varias fases. Nuestro complejo sistema de clasificación se basa en cientos de mediciones y puntos de referencia bien fundamentados, lo que mantiene la objetividad.Price comparison

