Análisis del portátil MSI Katana 15: Gamer económico con RTX 4050 y CPU Alder Lake
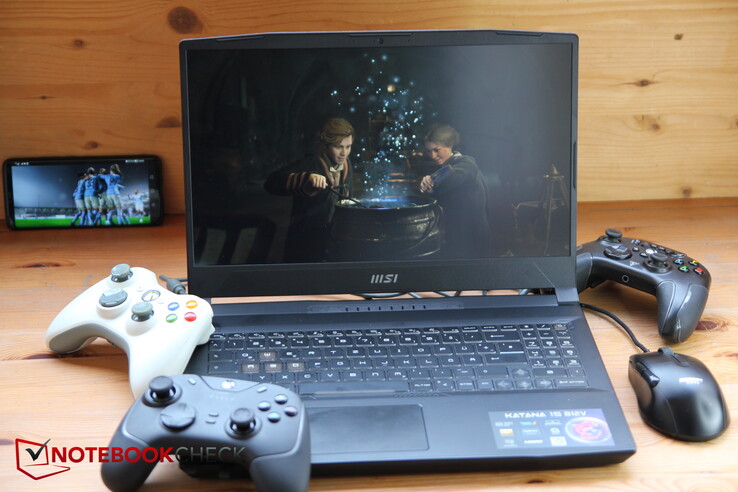
MSI tiene una línea de portátiles que visualmente parecen muy similares. El año pasado analizamos su casi predecesor de 15,6 pulgadas, elMSI Katana GF66 12UGSpero el Pulse GL66o el MSI Sword también tienen el mismo aspecto. Nuestra configuración de análisis actual es interesante porque MSI ha decidido combinar un "viejo" procesador Alder Lake con una nueva RTX 4050 para posiblemente estar entre los primeros en lanzar un portátil gaming con una tarjeta RTX 40xx. La denominación es Katana 15 B12, mientras que el Katana 15 B13 ya cuenta con un Intel Gen13 y una RTX 40xx. Vamos a echar un vistazo a cómo se comparan las dos generaciones de CPU/GPU en nuestro modelo B12.
Dado que el Katana 15 es uno de los primeros portátiles con una RTX 4050 que se analizan, recurrimos en gran medida a la generación anterior de gamers de nivel básico a medio con laRTX 3060para comparar. Estos incluyen el Lenovo Legion 5el Schenker XMG Core 15el MSI Pulse GL66 y el Asus TUF Gaming F15el predecesor también se incluye para comparar, pero los lectores deben tener en cuenta que estaba equipado con la más potente RTX 3070 Ti.
Posibles contendientes en la comparación
Valoración | Fecha | Modelo | Peso | Altura | Tamaño | Resolución | Precio |
|---|---|---|---|---|---|---|---|
| 82.9 % v7 (old) | 03/2023 | MSI Katana 15 B12VEK i7-12650H, GeForce RTX 4050 Laptop GPU | 2.3 kg | 24.9 mm | 15.60" | 1920x1080 | |
| 80.3 % v7 (old) | 06/2022 | MSI Katana GF66 12UGS i7-12700H, GeForce RTX 3070 Ti Laptop GPU | 2.3 kg | 27.5 mm | 15.60" | 1920x1080 | |
| 80.7 % v7 (old) | 04/2022 | MSI Pulse GL66 12UEK i9-12900H, GeForce RTX 3060 Laptop GPU | 2.3 kg | 25 mm | 15.60" | 1920x1080 | |
| 87.5 % v7 (old) | 11/2022 | Lenovo Legion 5 15IAH7H 82RB i7-12700H, GeForce RTX 3060 Laptop GPU | 2.4 kg | 19.99 mm | 15.60" | 1920x1080 | |
| 87.2 % v7 (old) | 03/2022 | Asus TUF Gaming F15 FX507ZM i7-12700H, GeForce RTX 3060 Laptop GPU | 2.1 kg | 24.95 mm | 15.60" | 1920x1080 | |
| 87.9 % v7 (old) | 01/2023 | Schenker XMG Core 15 (M22) R7 6800H, GeForce RTX 3060 Laptop GPU | 2.1 kg | 23 mm | 15.60" | 2560x1440 |
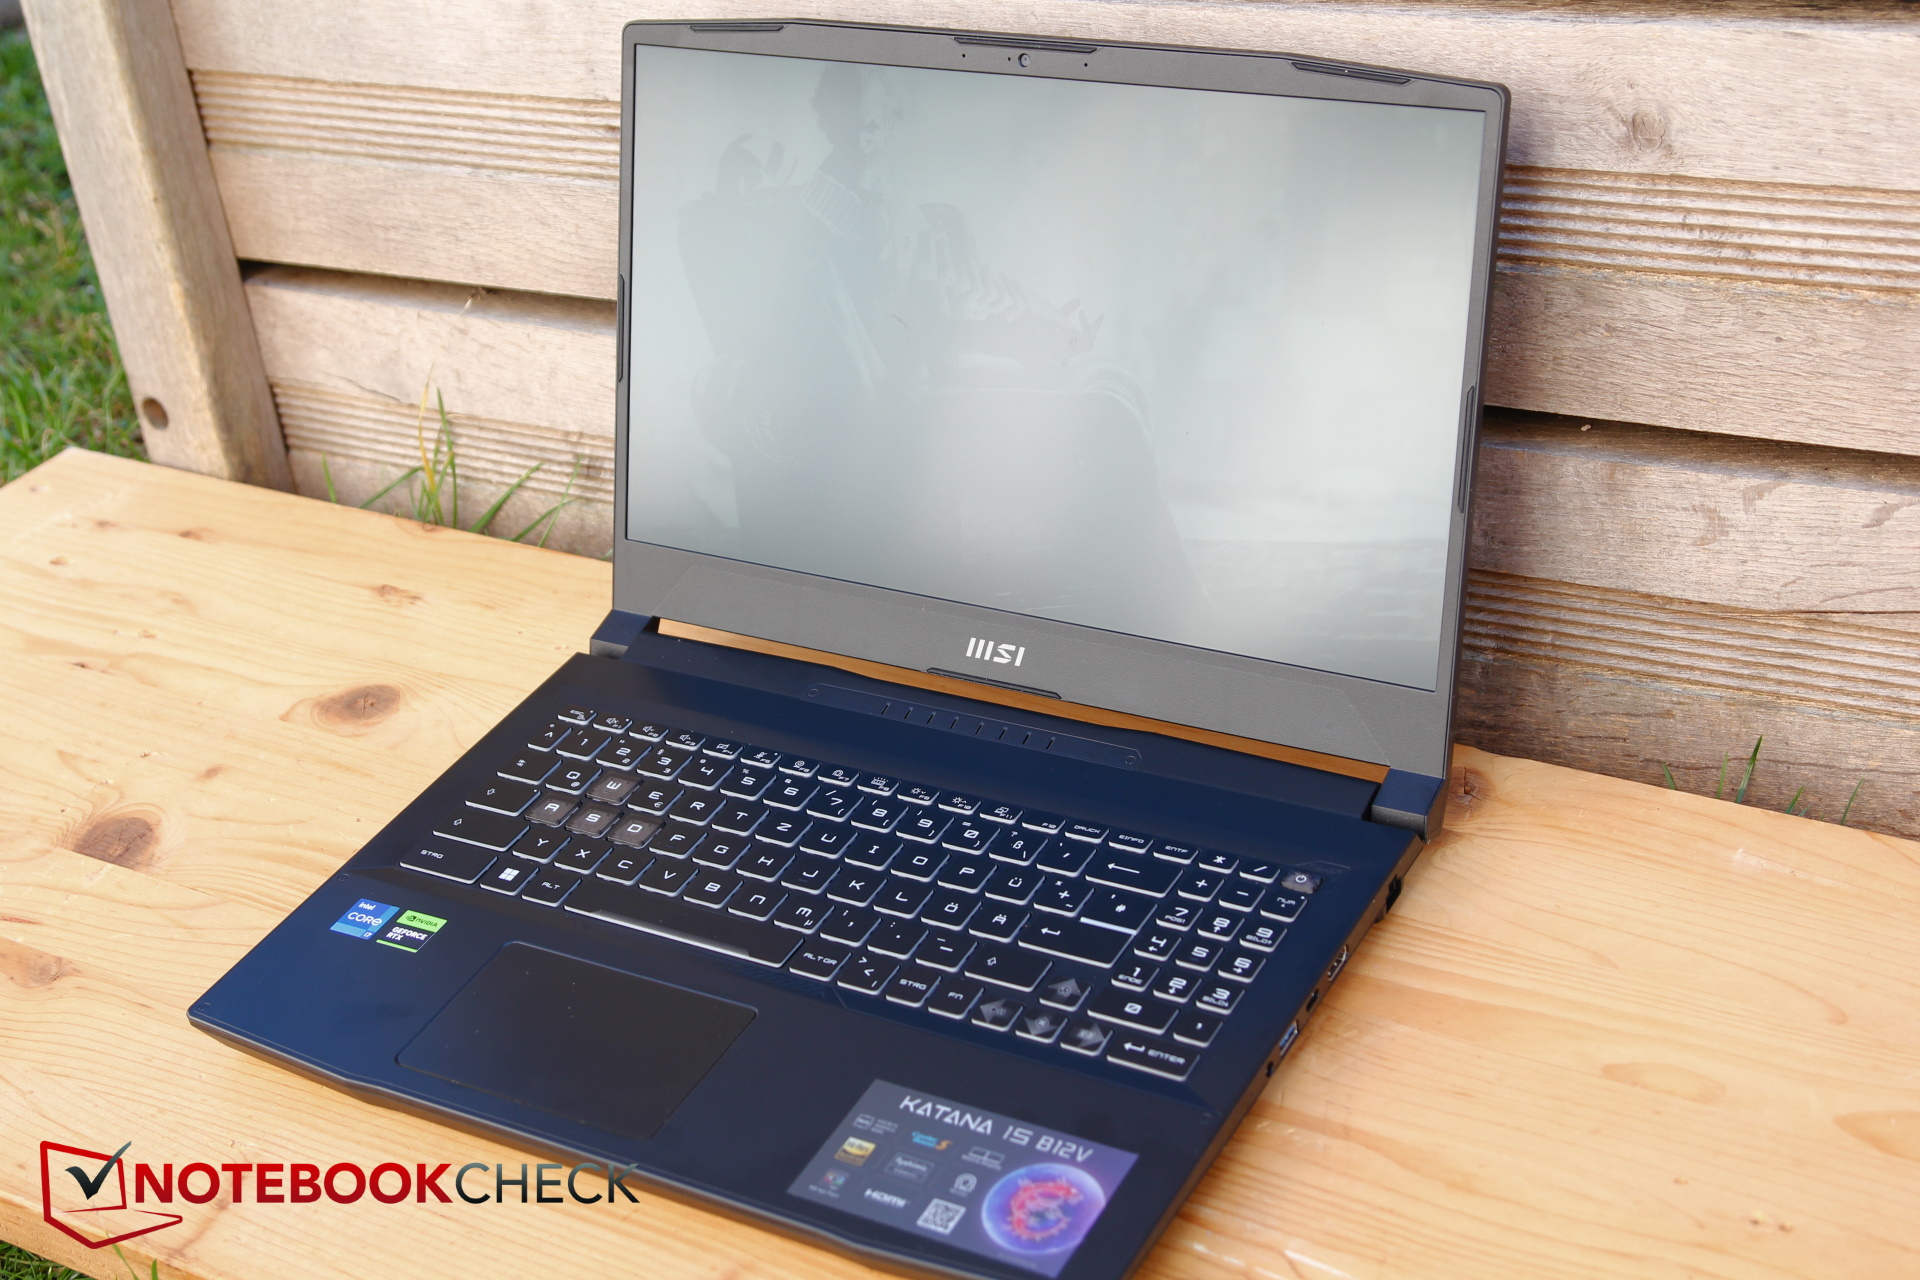
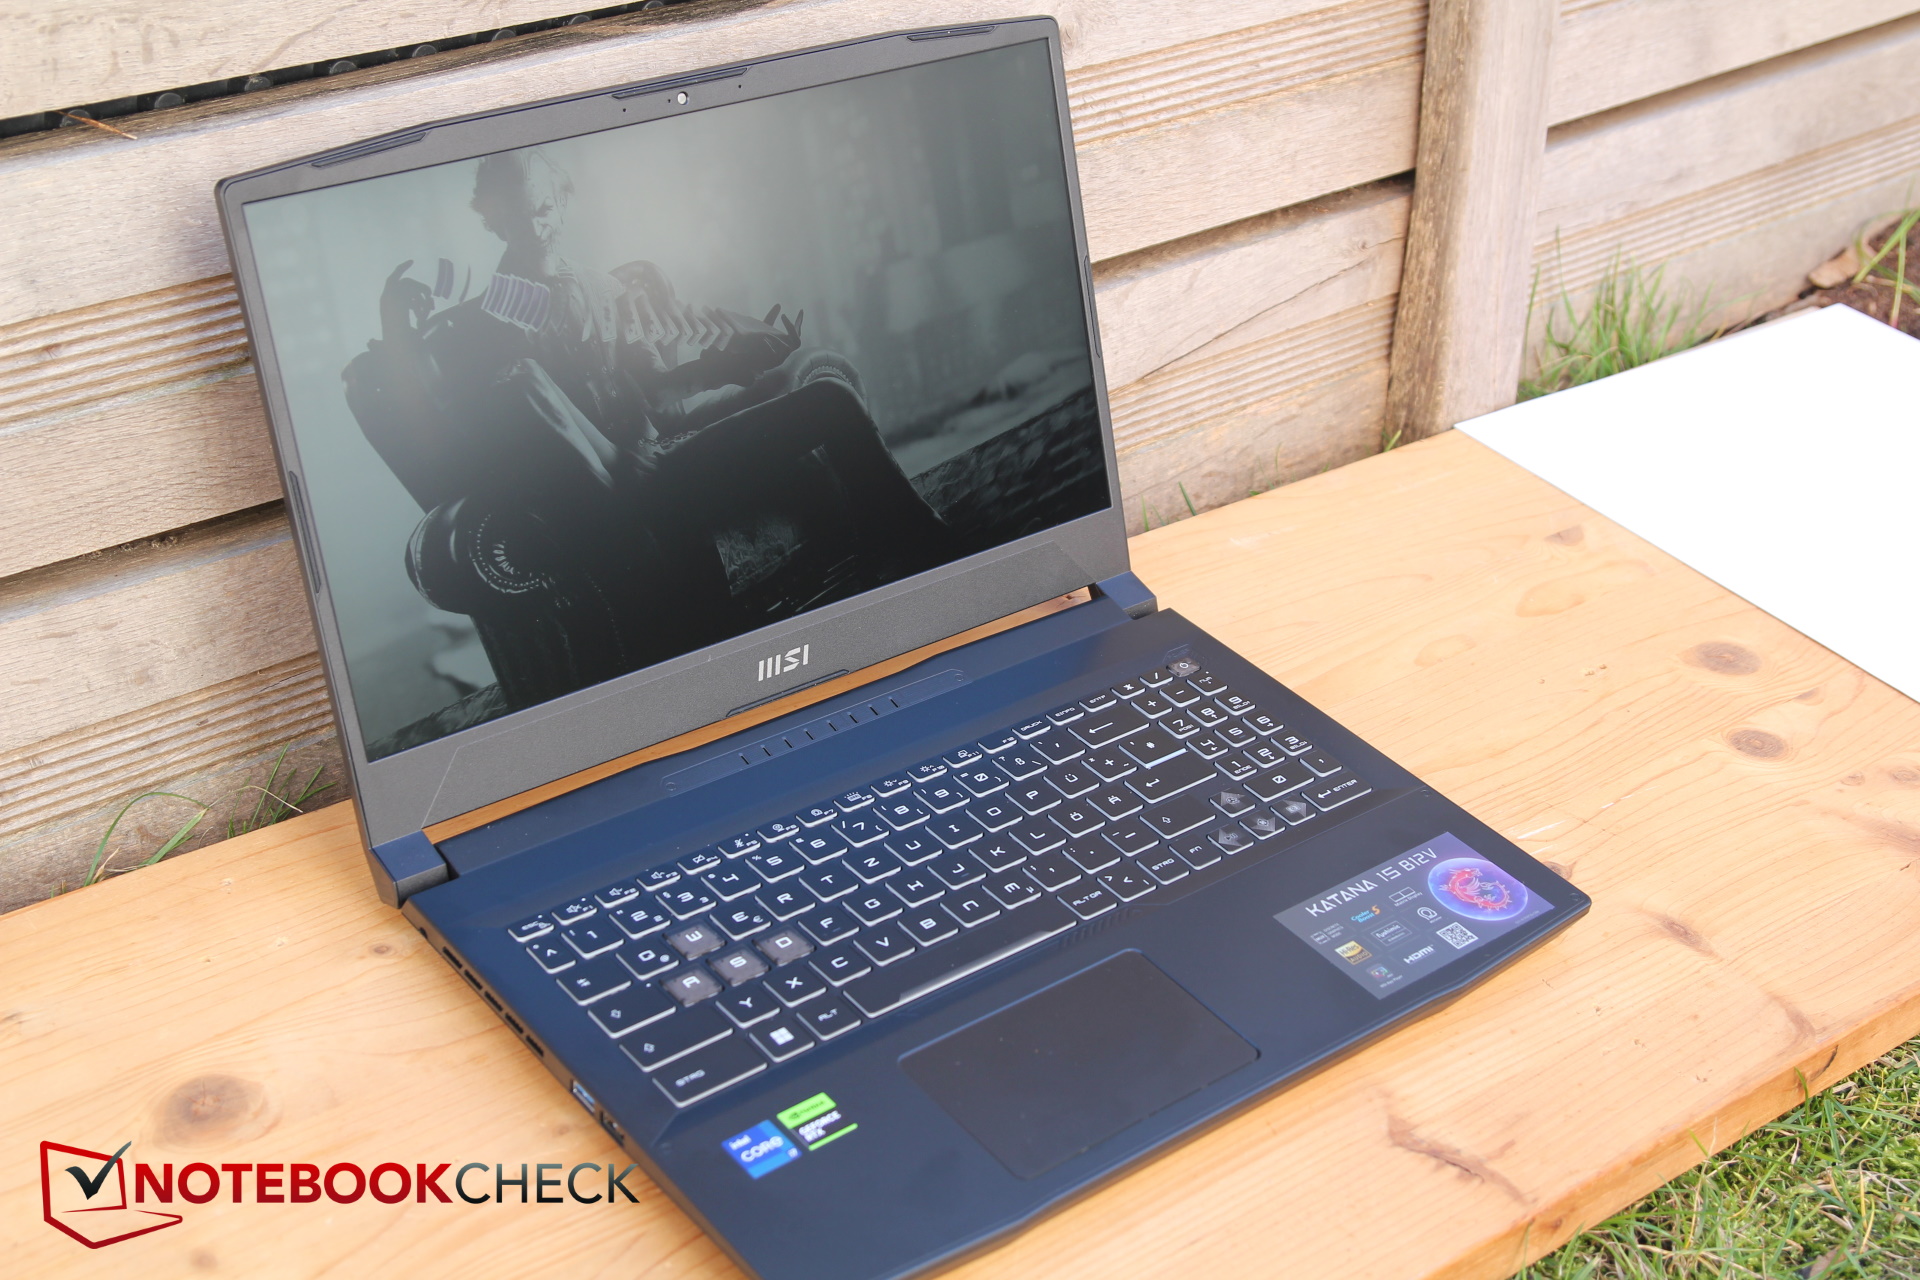
Funda - Katana de plástico
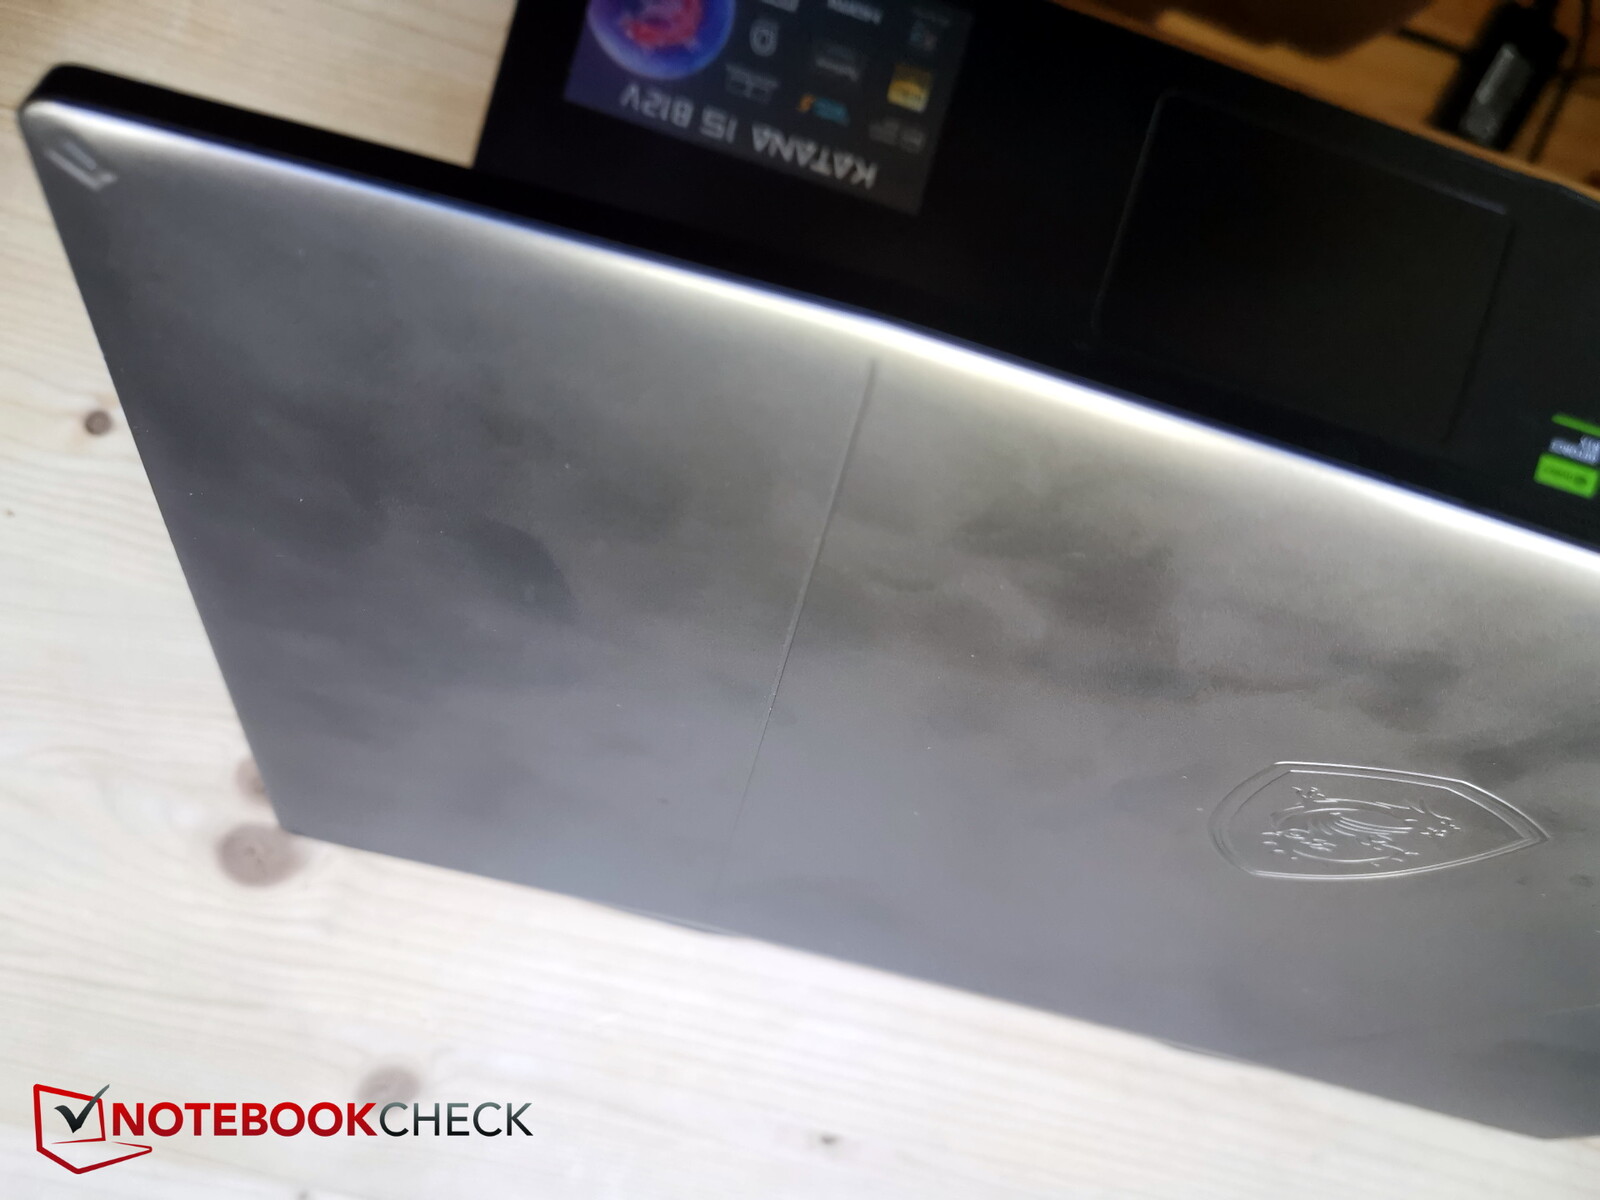
La carcasa del Katana 15 es totalmente de plástico, aunque los materiales de la superficie lisa de la tapa de la pantalla y la base parecen casi metálicos. Los laterales muestran un patrón negro y gris. Por desgracia, la carcasa también resulta muy susceptible a las huellas dactilares
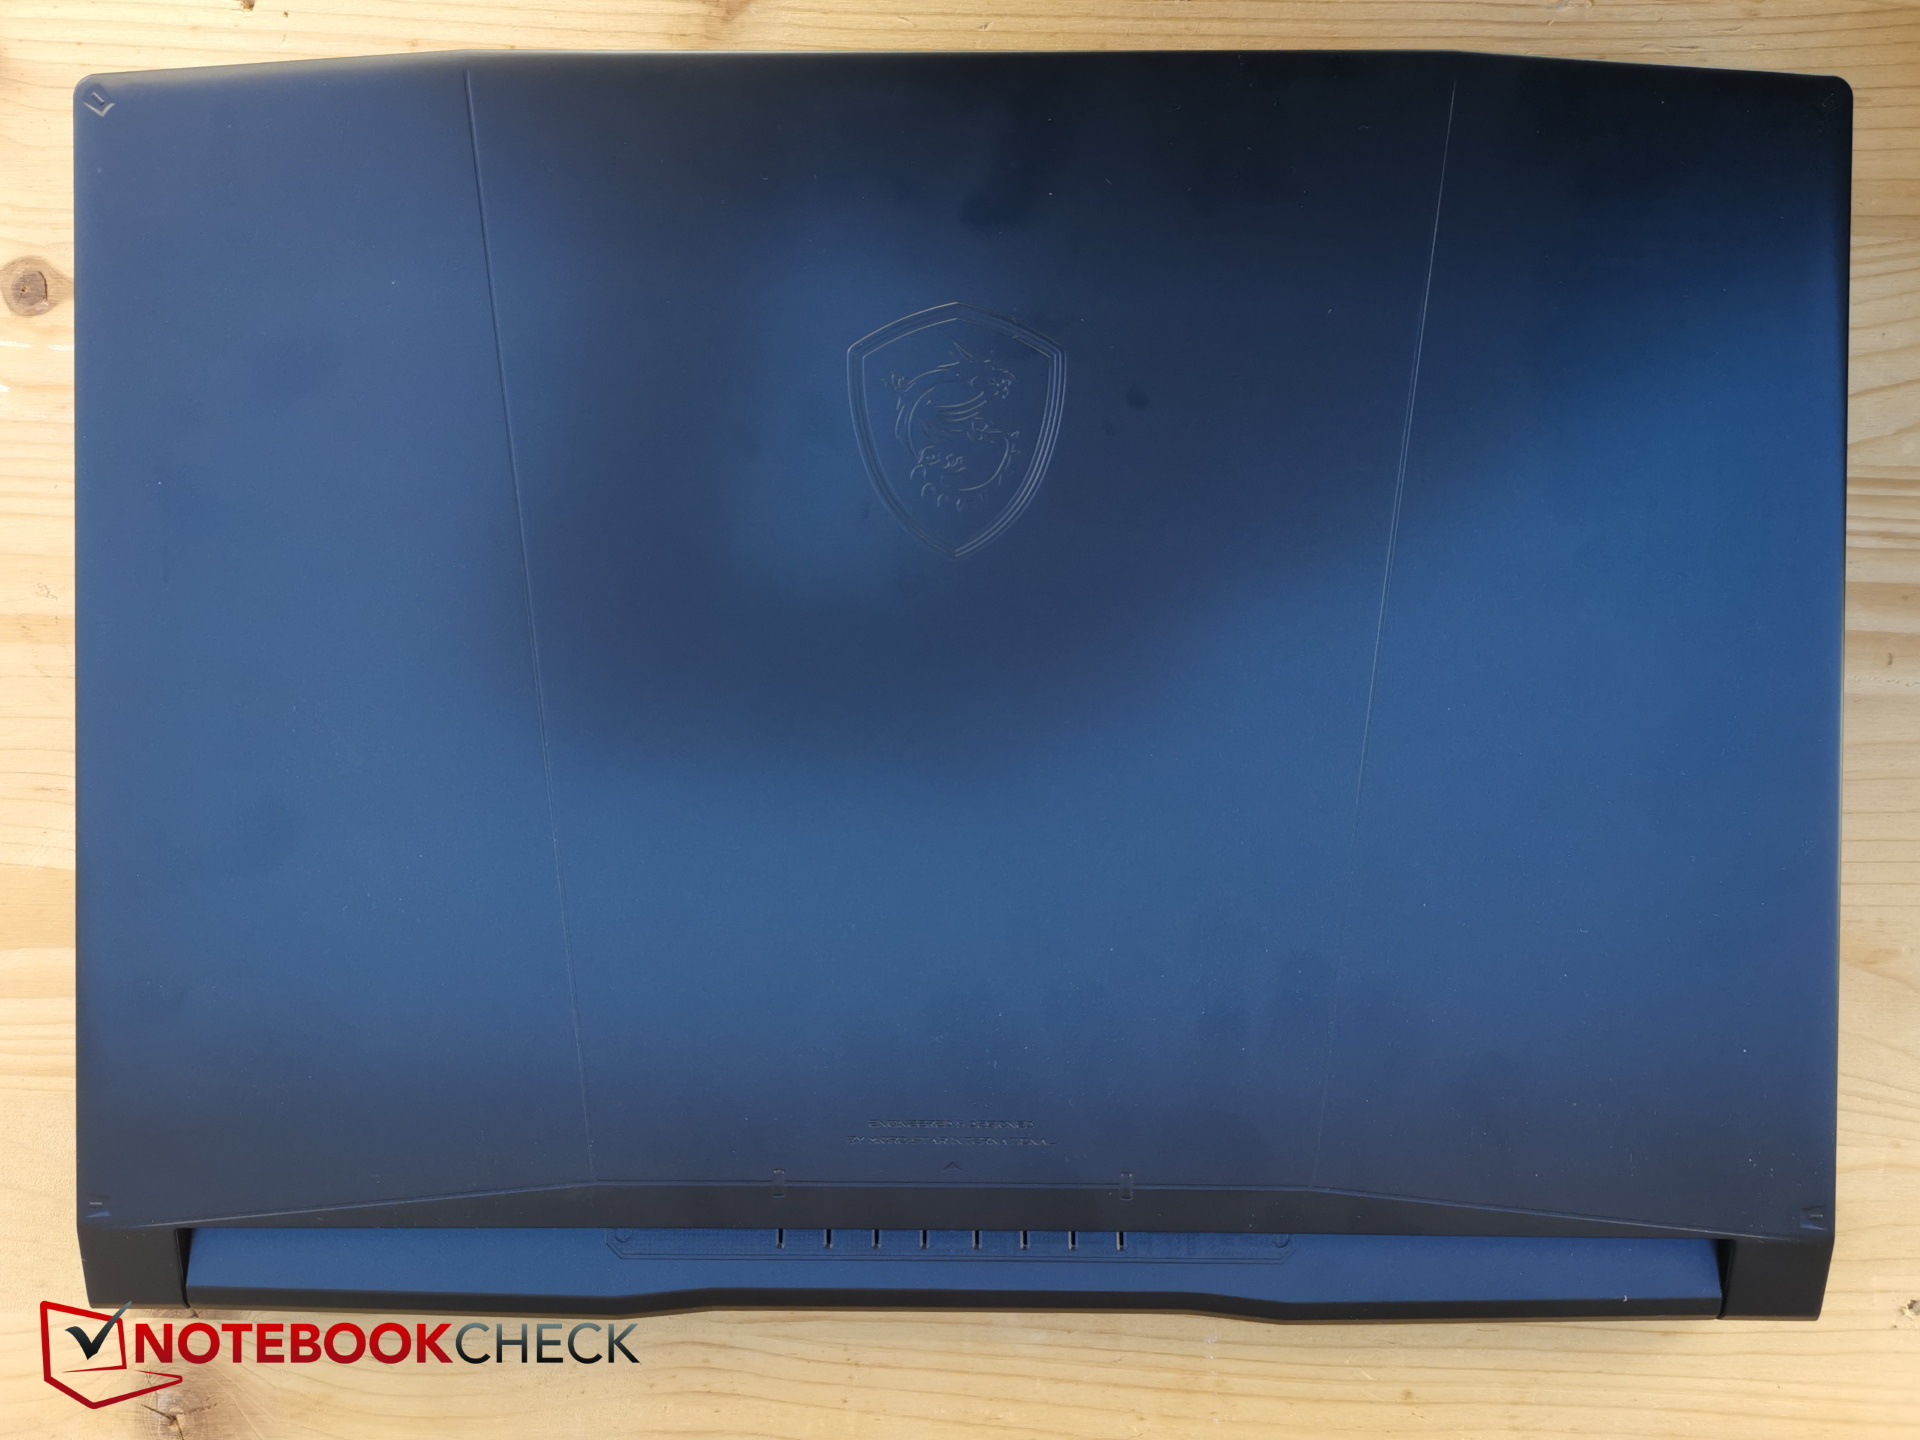
El ángulo de apertura es de 180 grados. Junto al logotipo, algunas líneas y troquelados decoran la brillante superficie negra de la tapa. La pantalla se tambalea durante más tiempo de lo habitual después de abrirla o ajustar el ángulo
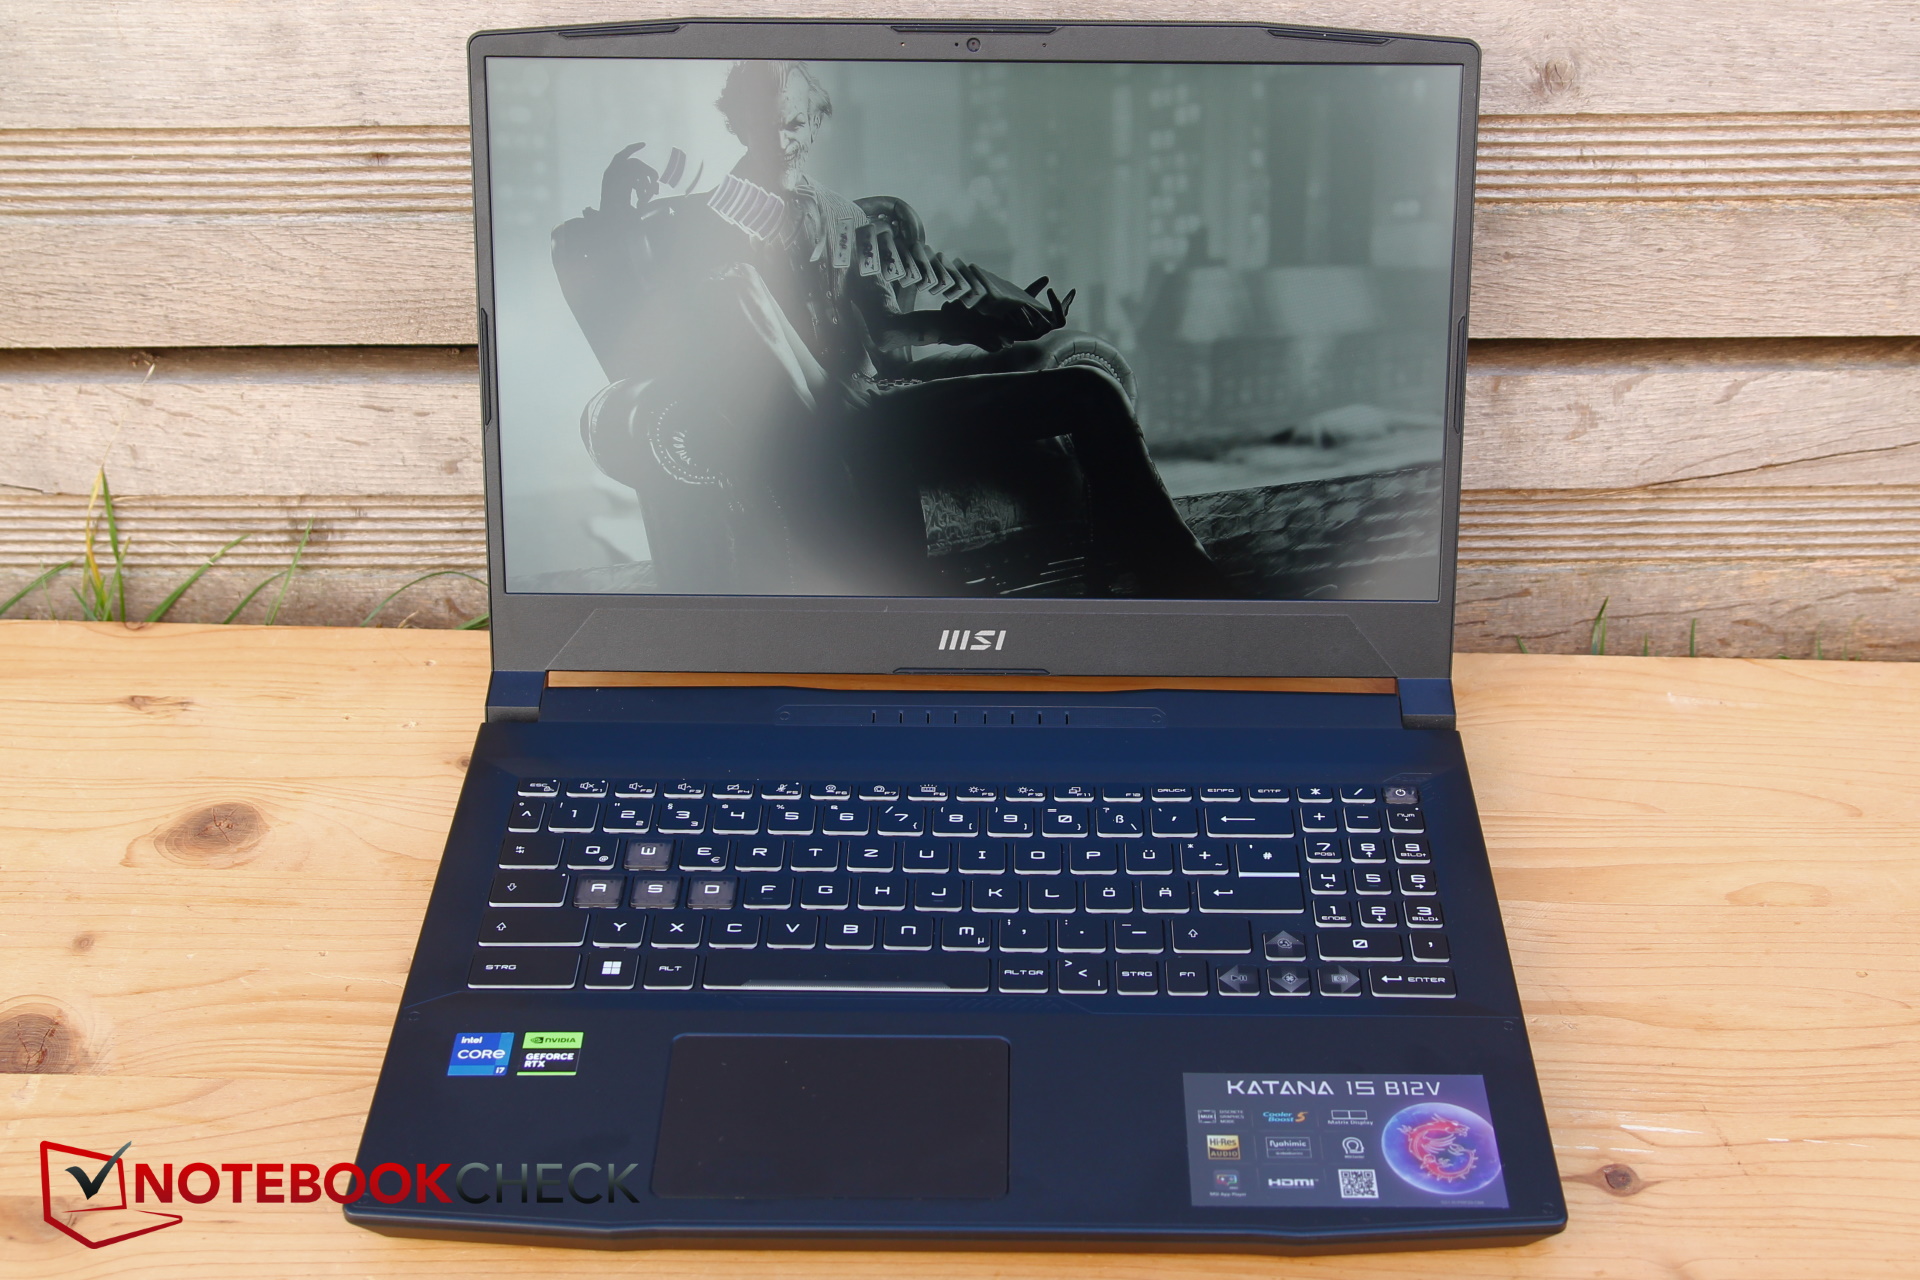
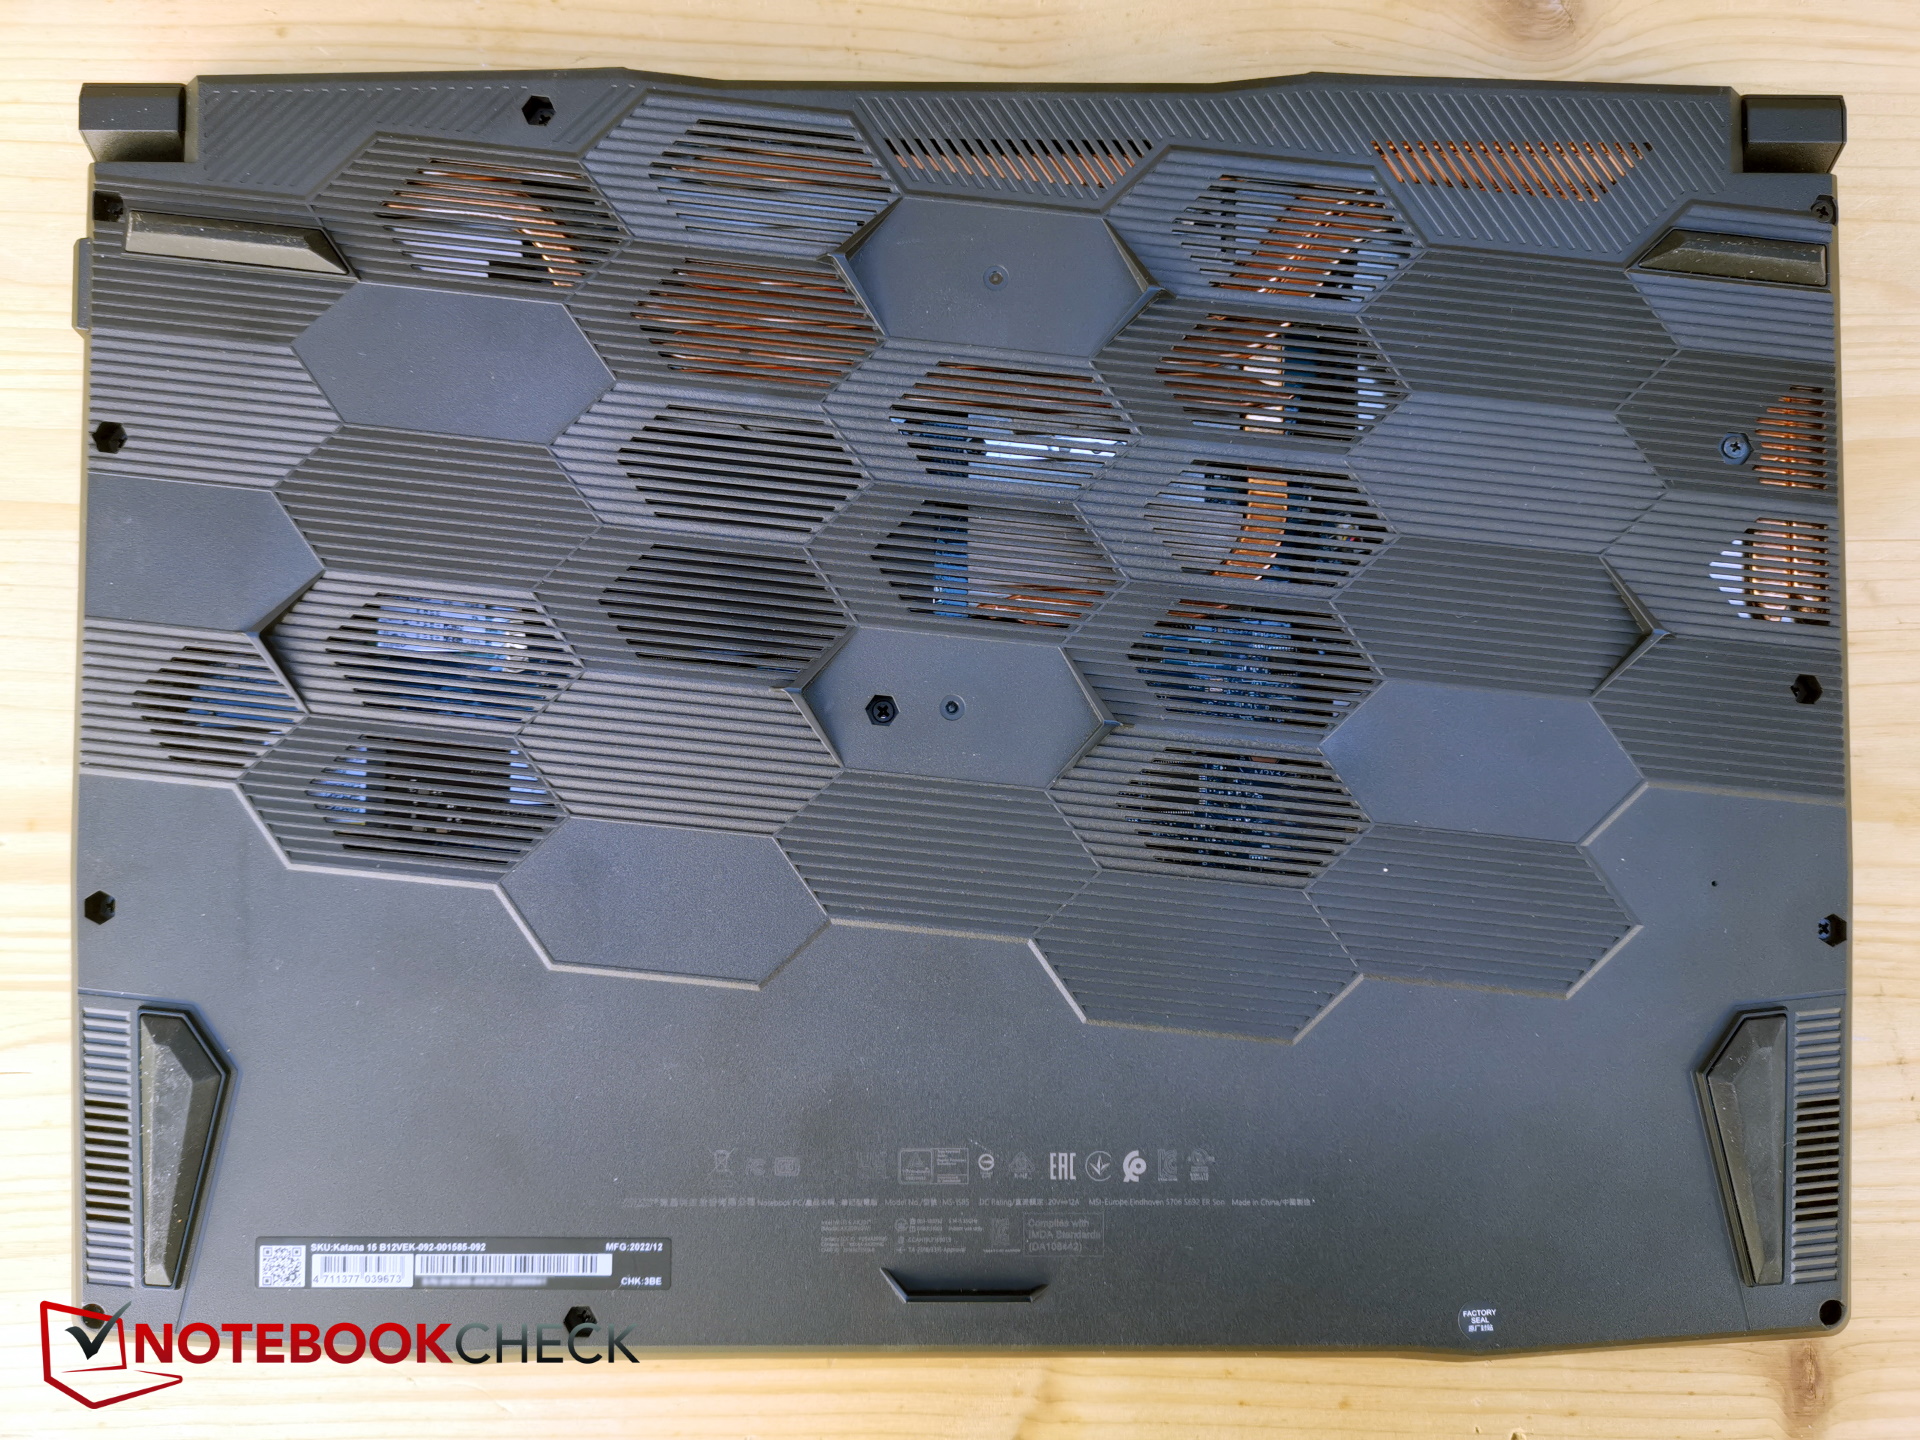
La parte inferior es de plástico más blando. La base es relativamente resistente a la torsión, pero emite algunos crujidos. Por el contrario, la tapa es mucho más fácil de doblar y emite un sonido chirriante. Los bordes de la pantalla son estrechos en los laterales, pero bastante anchos en la parte superior e inferior para los estándares actuales.
La Katana 15 2023 es ligeramente más delgada que la del año pasado Katana GF66y hereda las dimensiones y el peso del Pulse GL66el Legion 5 vuelve a ser aún más delgado, pero también lo es el Core 15, aunque mínimamente.
Equipamiento - Última generación
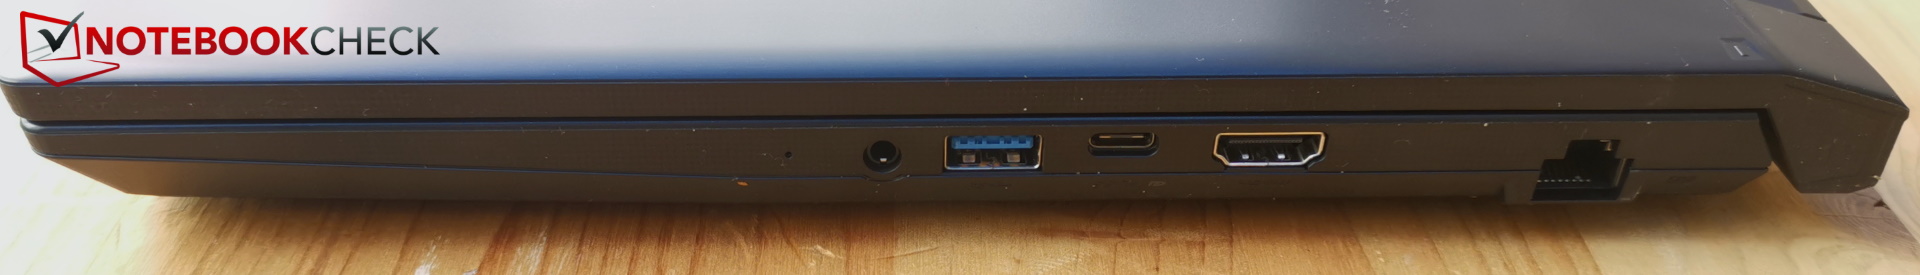
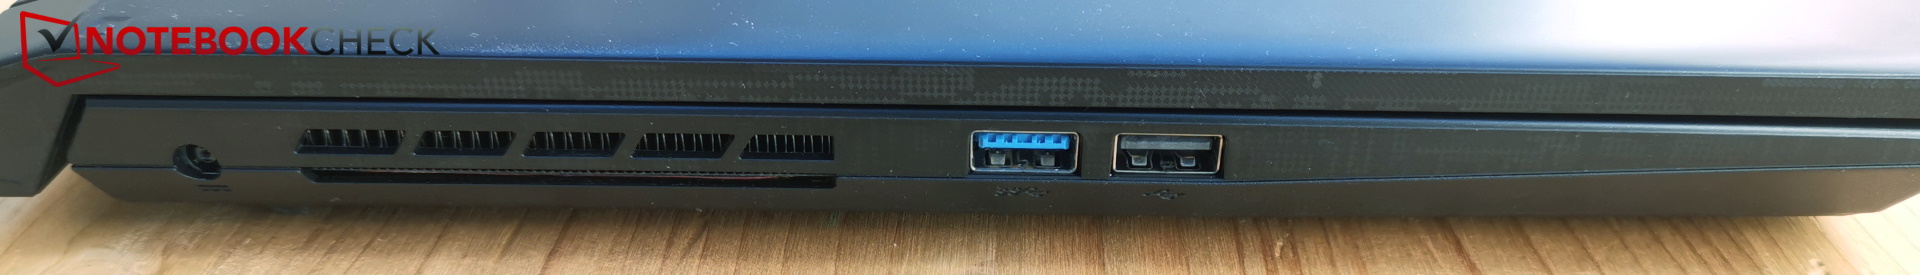
La disposición de los puertos es la misma en los tres modelos de MSI. De hecho, uno de los tres puertos USB-A sigue siendo de tipo 2.0, lo que realmente no pertenece a la era actual. Lo mismo cabe decir de la única ranura USB-C, que no soporta Thunderbolt y sólo ofrece velocidad 3.0.
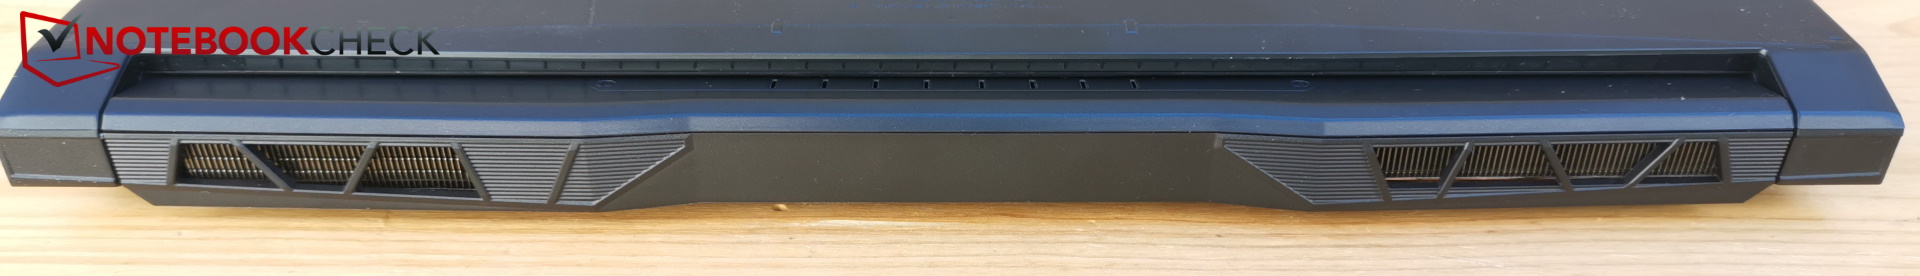
Falta un lector SD, pero al menos hay LAN y HDMI. La clavija de auriculares está inusualmente situada en el lado derecho, igual que el puerto HDMI, y ambos pueden interferir con la mano del ratón. A pesar del espacio suficiente, no hay puertos en la parte trasera.
Comunicación
MSI ha instalado el módulo WLAN Intel Wi-Fi 6 AX201, que aún no soporta Wi-Fi 6E, por lo que la conexión a la red de 6 GHz no es posible actualmente. Pero sí funciona en el rango de 5 GHz (y por supuesto 2.4 GHz) y esto sigue siendo bastante rápido.
Cámara web
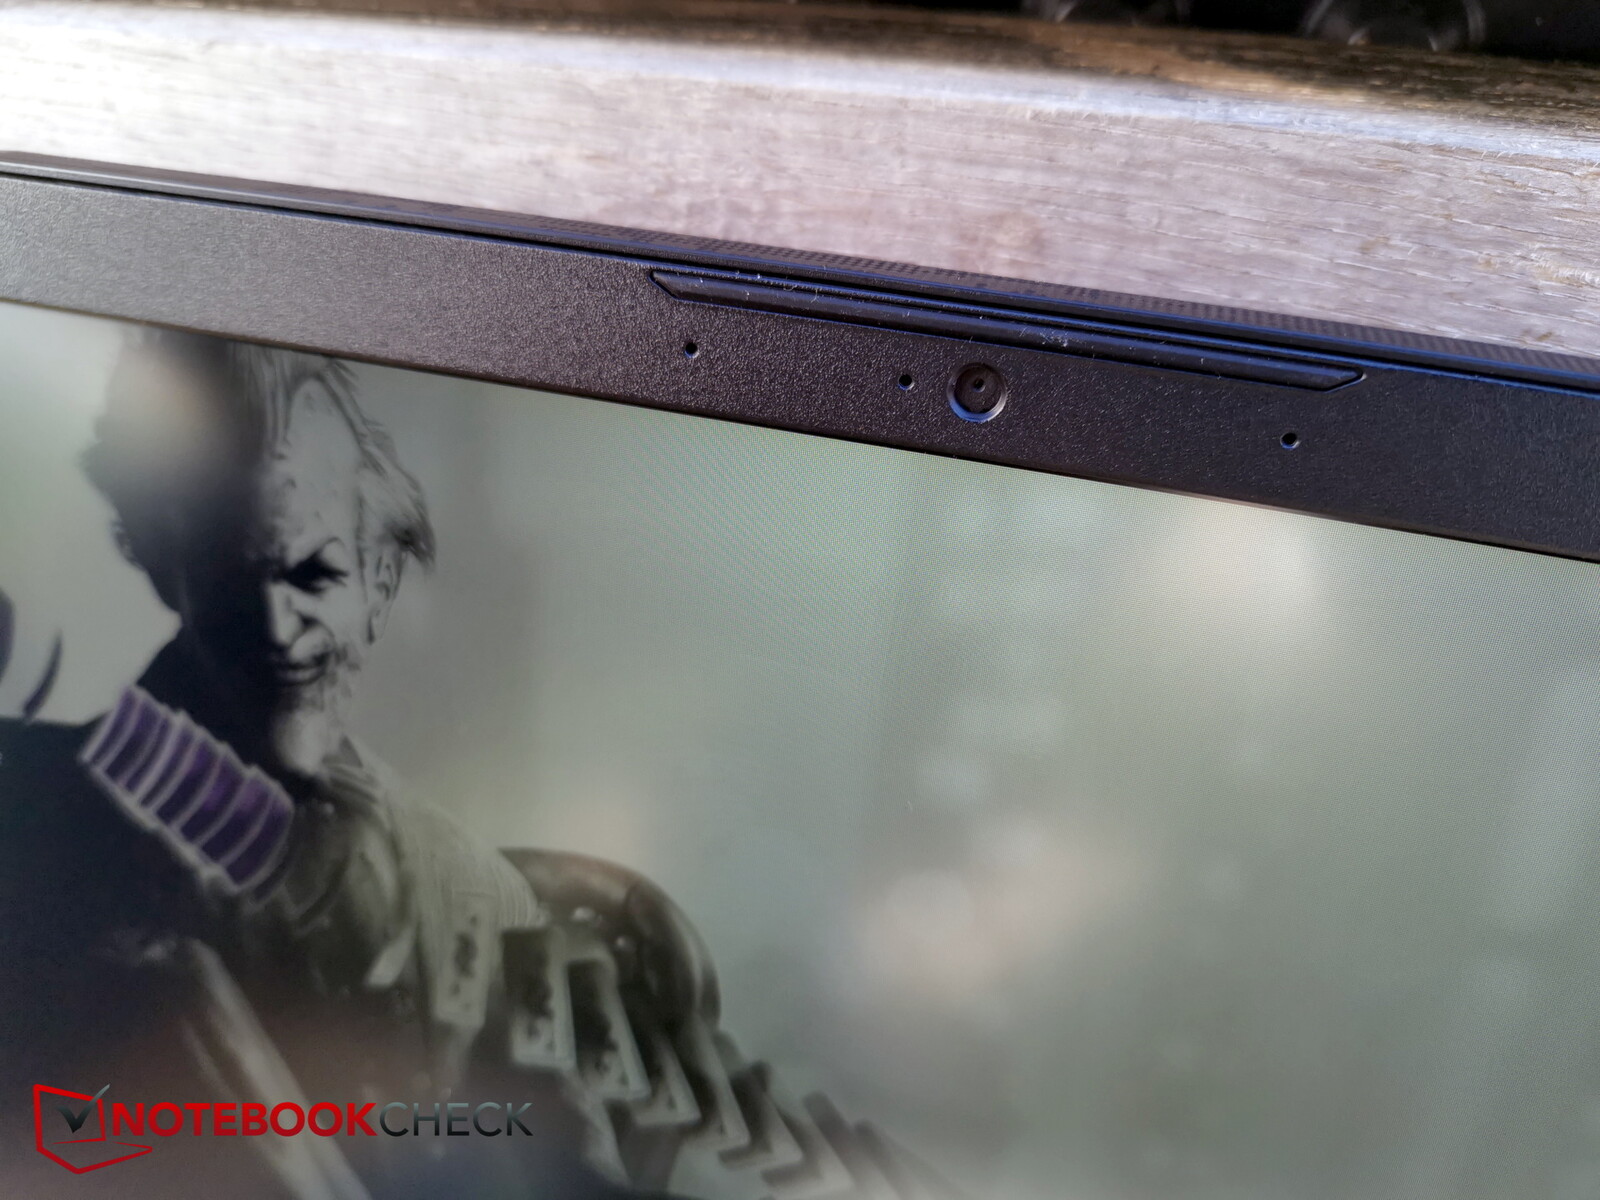
La webcam también es de última generación con su resolución de 720p. Incluso el nuevo B13 sigue teniendo una cámara de 720p. Se puede encender y apagar con fn+F6.
Las desviaciones de color son en general bastante altas y la calidad de imagen bastante subóptima.


Seguridad
TPM está a bordo, por lo demás falta una ranura Kensington. Tampoco hay sensor de huellas dactilares.
Accesorios y garantía
Los portátiles baratos no suelen venir con extras. Este también es el caso del Katana 15.
MSI ofrece una garantía de 24 meses y se incluye un servicio de recogida y devolución.
Mantenimiento
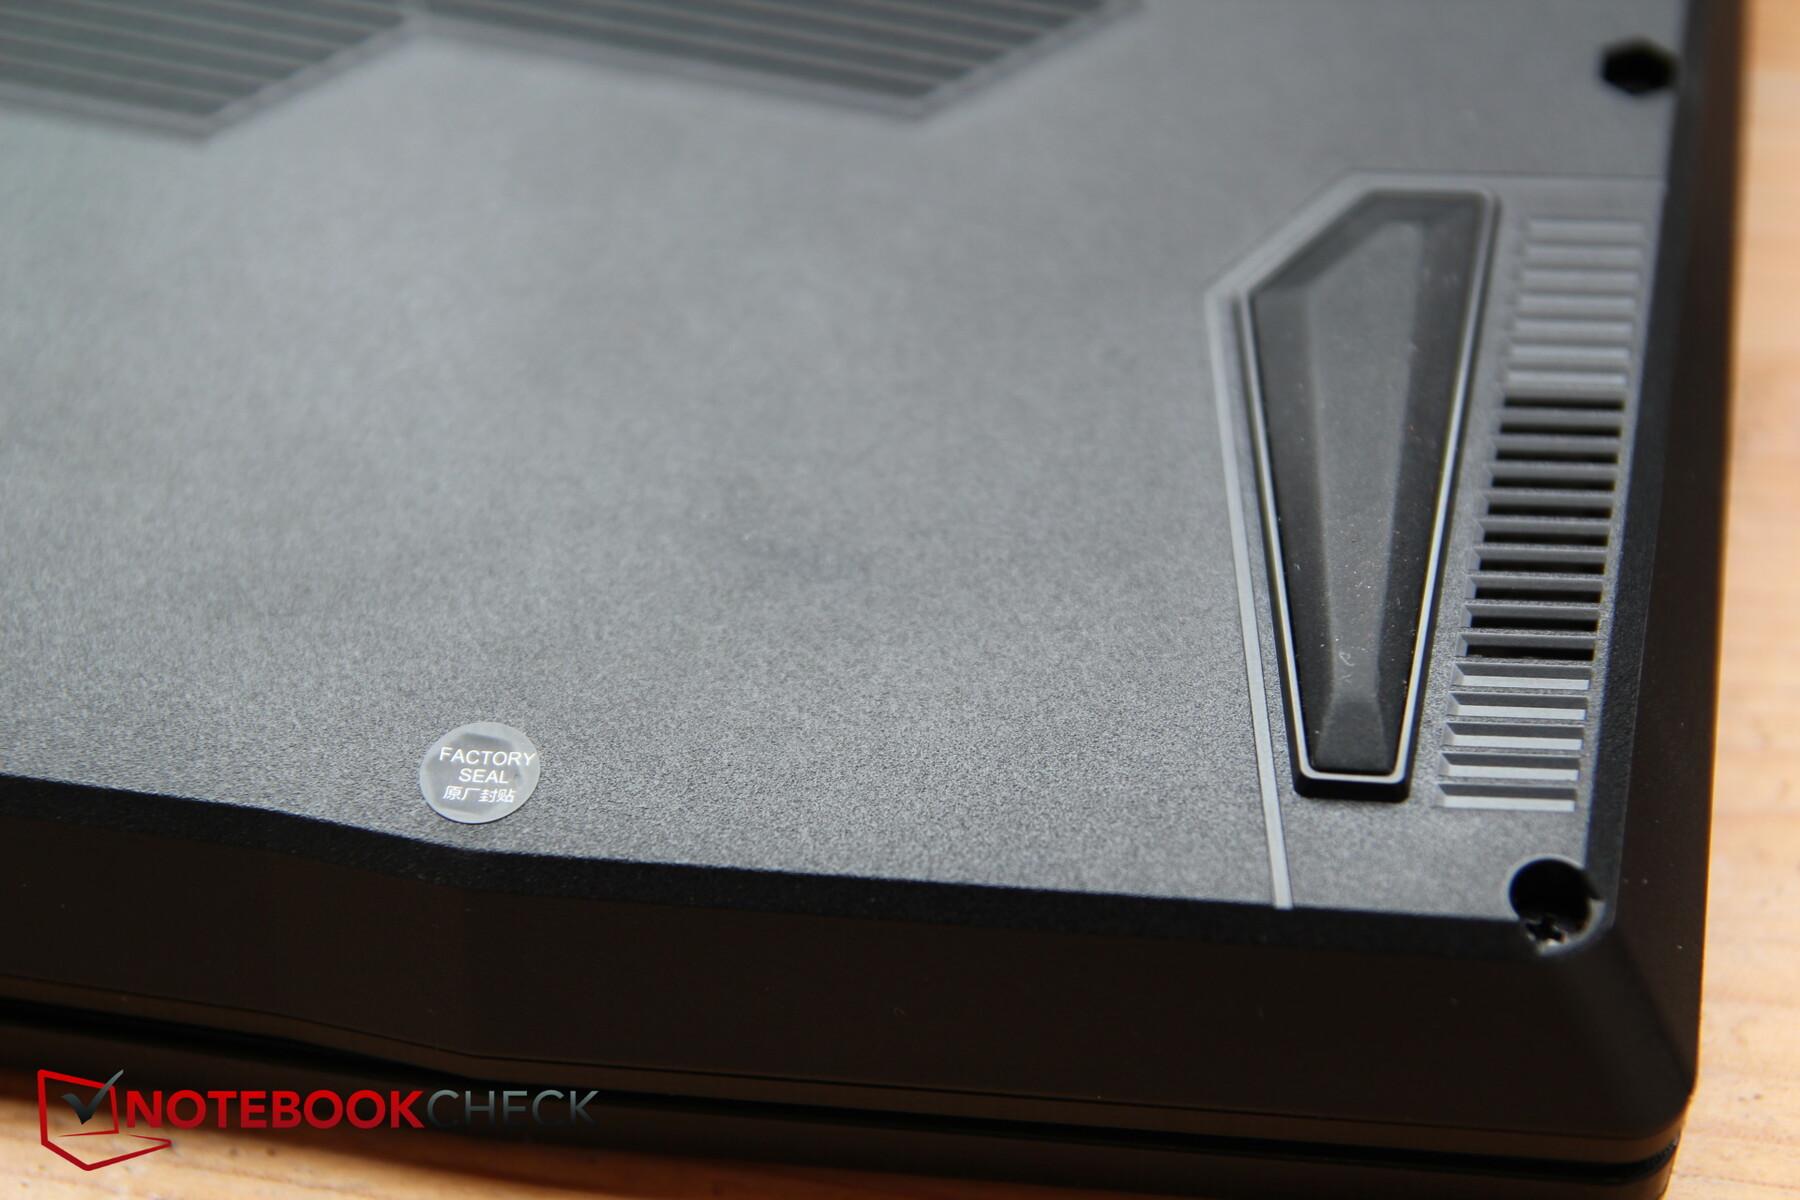
Por desgracia, MSI utiliza una pegatina de precinto para determinar si los usuarios ya han abierto el dispositivo por sí mismos. Como nuestro modelo de pruebas viene de Cyberport, nos abstuvimos de abrirlo para no dañar el dispositivo de nuestro prestamista.
Según MSI, el propietario también puede abrir el dispositivo para realizar tareas de mantenimiento. Siempre que se haga de forma "profesional", la garantía del dispositivo no se verá afectada.
Dispositivos de entrada - Teclado decente, touchpad pequeño
Teclado
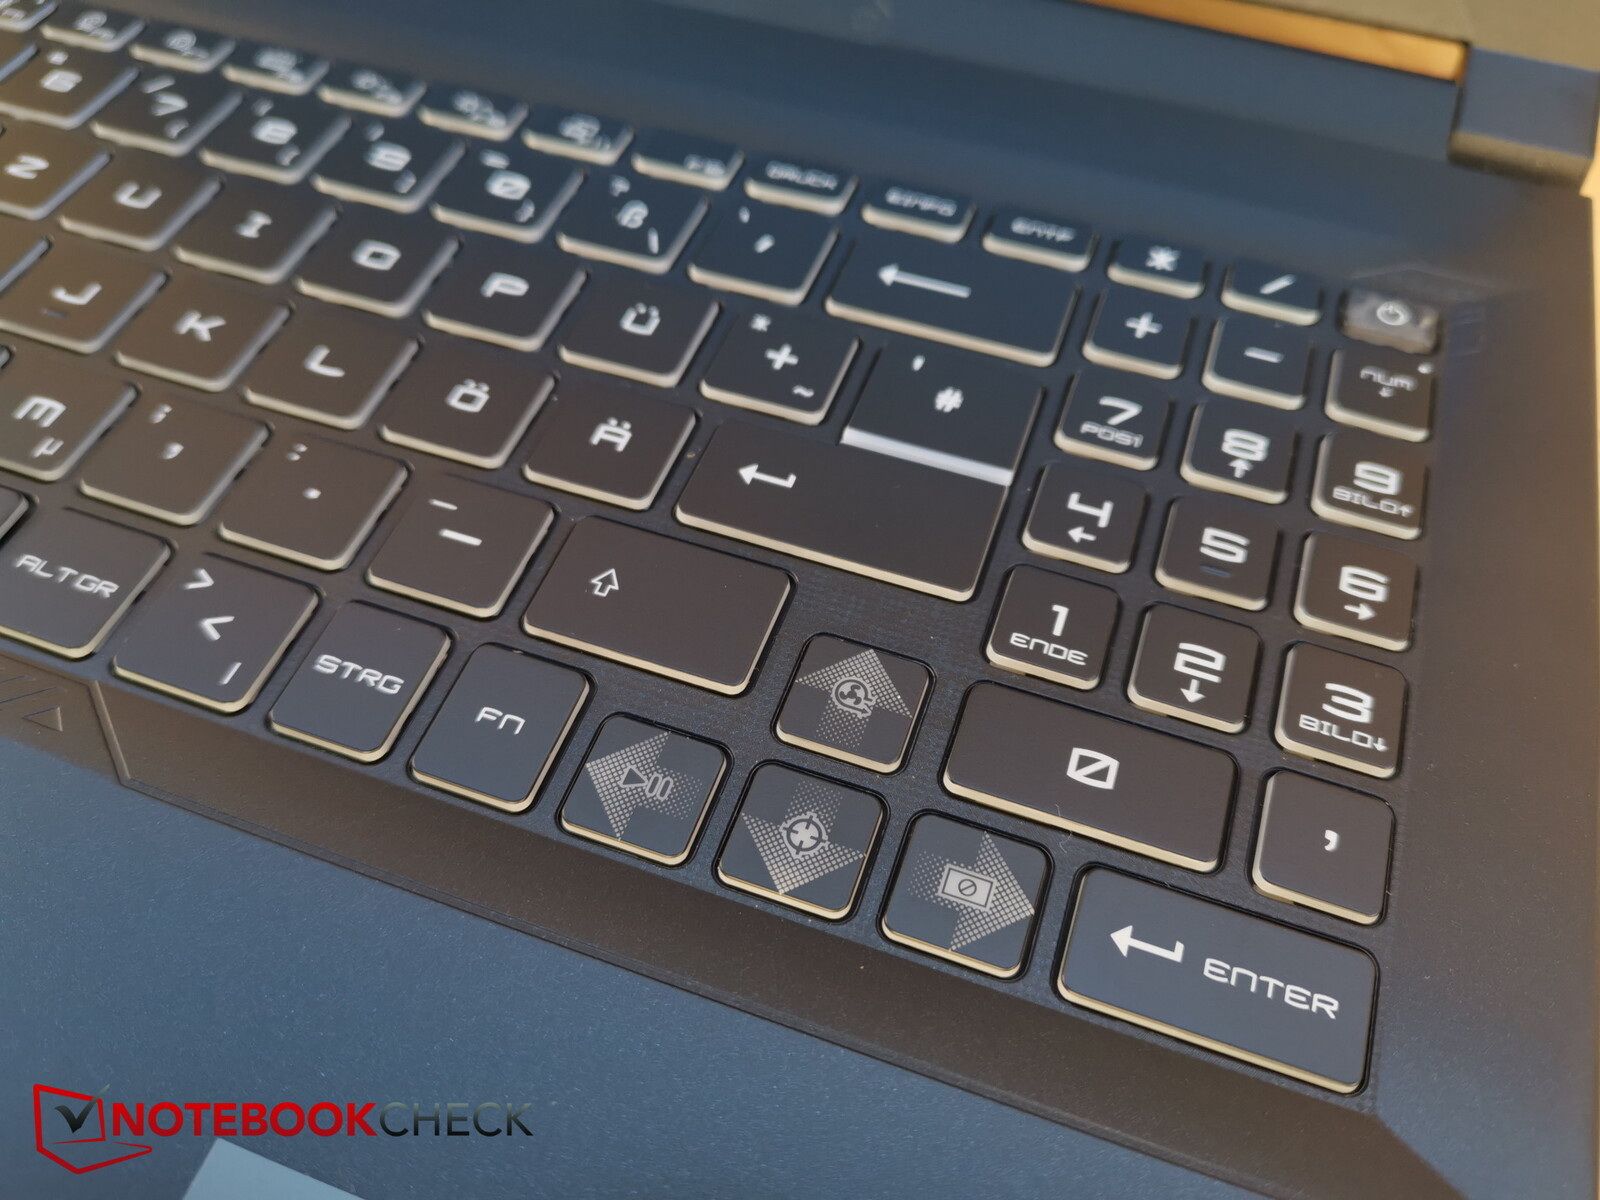
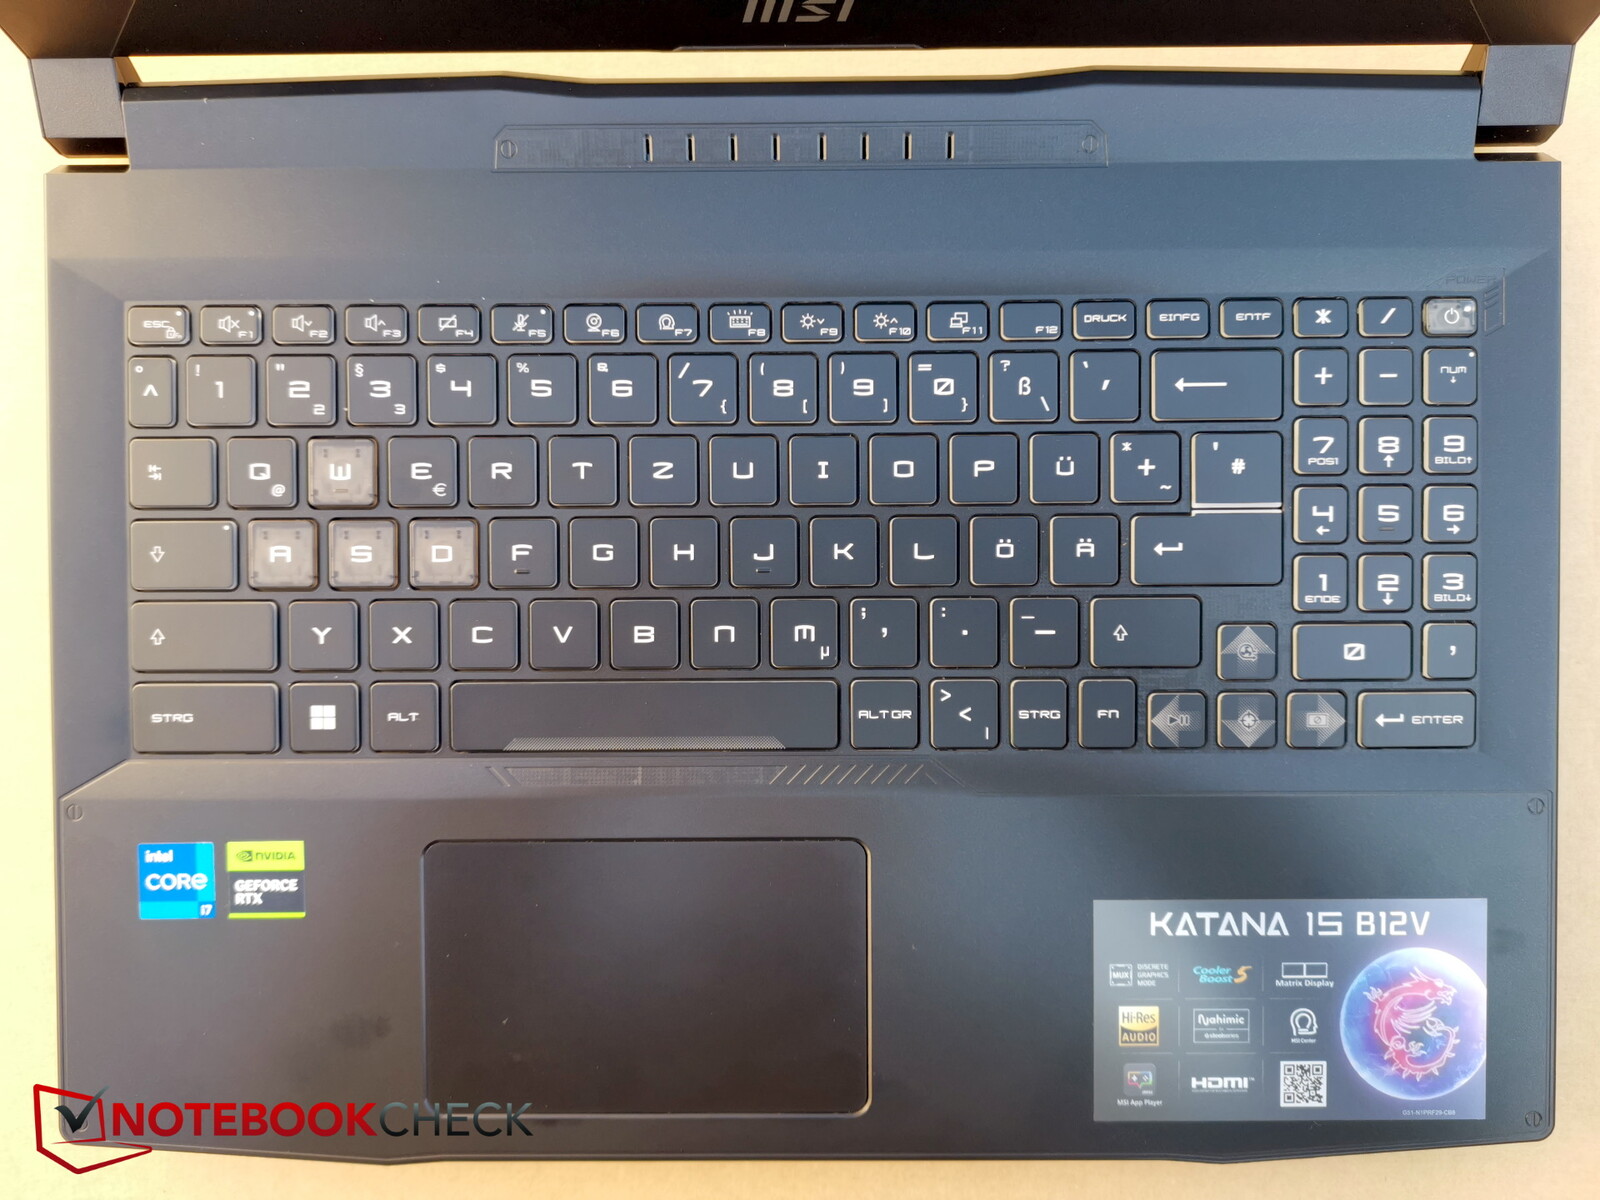
La disposición es muy similar en todos los modelos Katana: parece muy ordenada, pero el teclado numérico de la derecha parece mal encajado, aunque al menos hay uno.
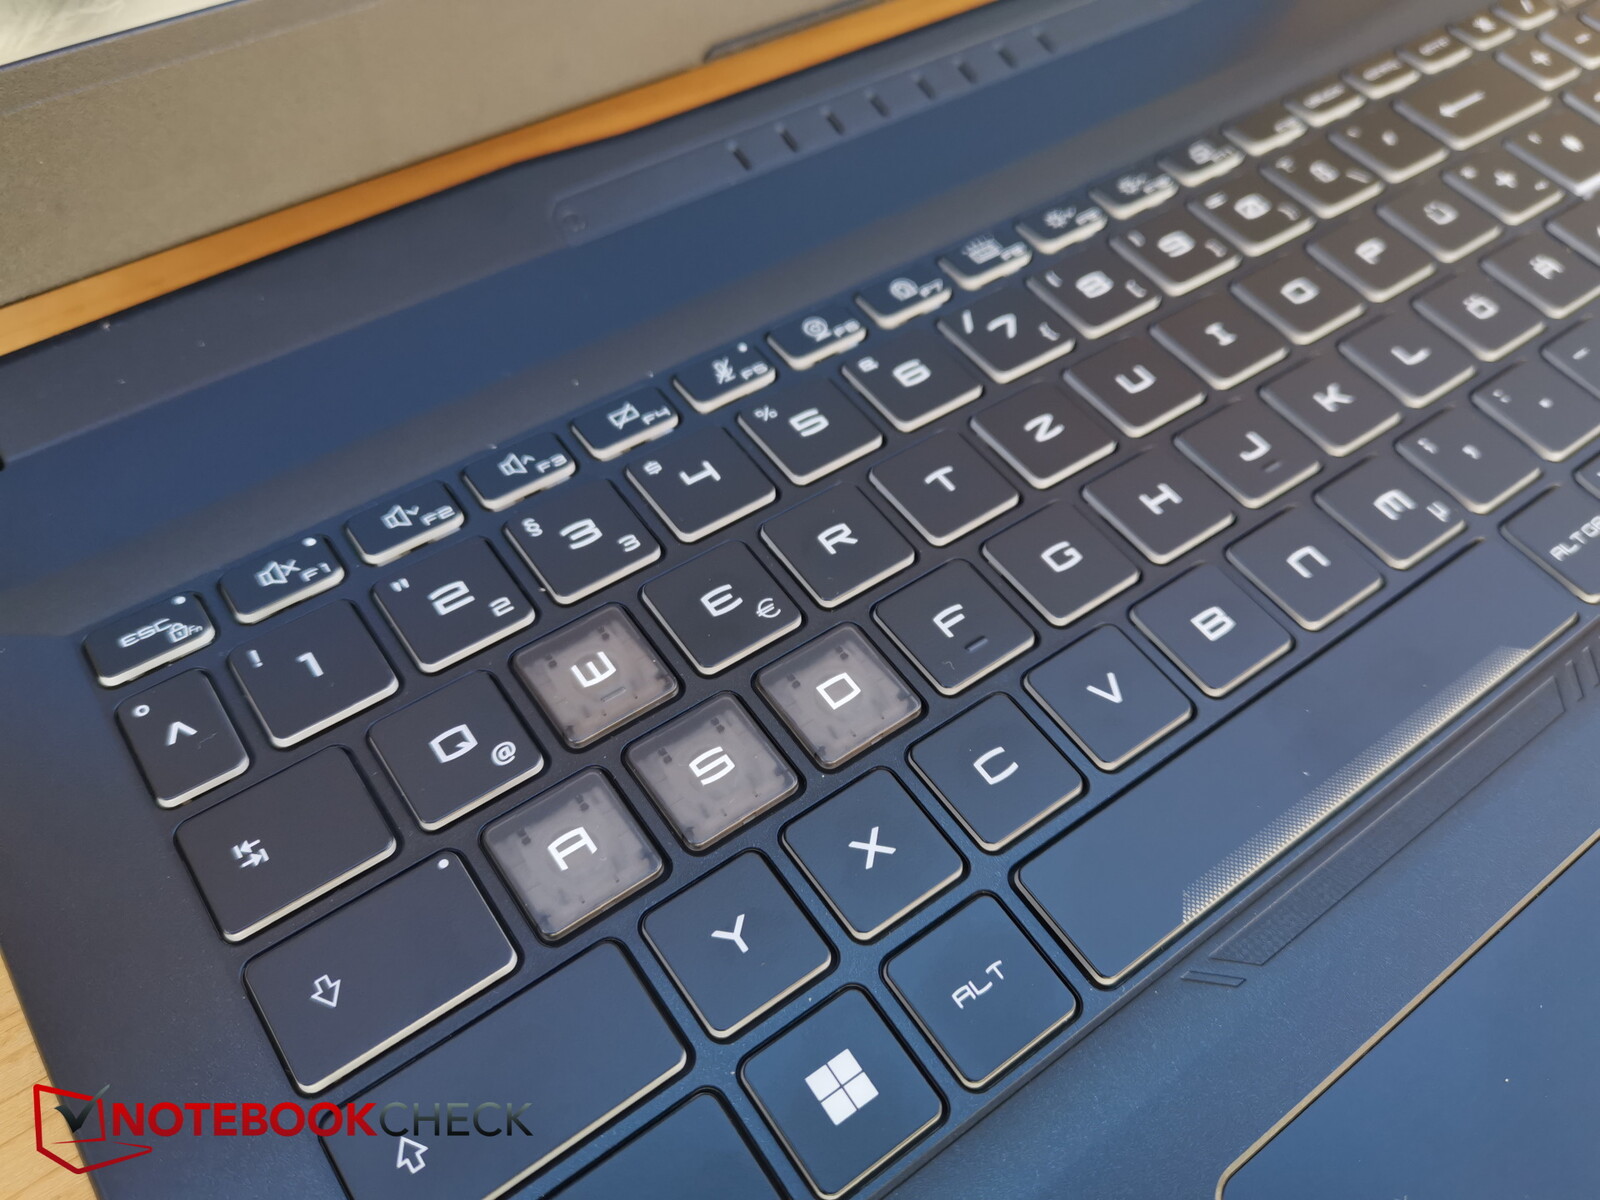
Las teclas de dirección intermedias no se han reducido a la mitad, como suele ocurrir, sino que son algo más pequeñas en longitud y altura. Las teclas WASD son transparentes y destacan por su color. Las teclas F y especiales también son muy pequeñas.
Por desgracia, MSI ha vuelto a desplazar la tecla fn a la derecha de la barra espaciadora, lo que requiere acostumbrarse. Es extraño por qué MSI sigue su propio camino. Si es necesario, puedes intercambiar las funciones de las teclas fn y Windows, pero entonces tienes el mismo problema con la tecla Windows, que está a la derecha en lugar de la tecla fn.
El recorrido de las teclas es bastante corto, pero la respuesta es claramente perceptible, por lo que la sensación de tecleo es bastante rápida. El ruido de pulsación es moderado, y la base permanece estable y no se dobla al escribir.
La retroiluminación del teclado ofrece cuatro zonas, cada una con cuatro niveles de brillo ajustables.
Panel táctil
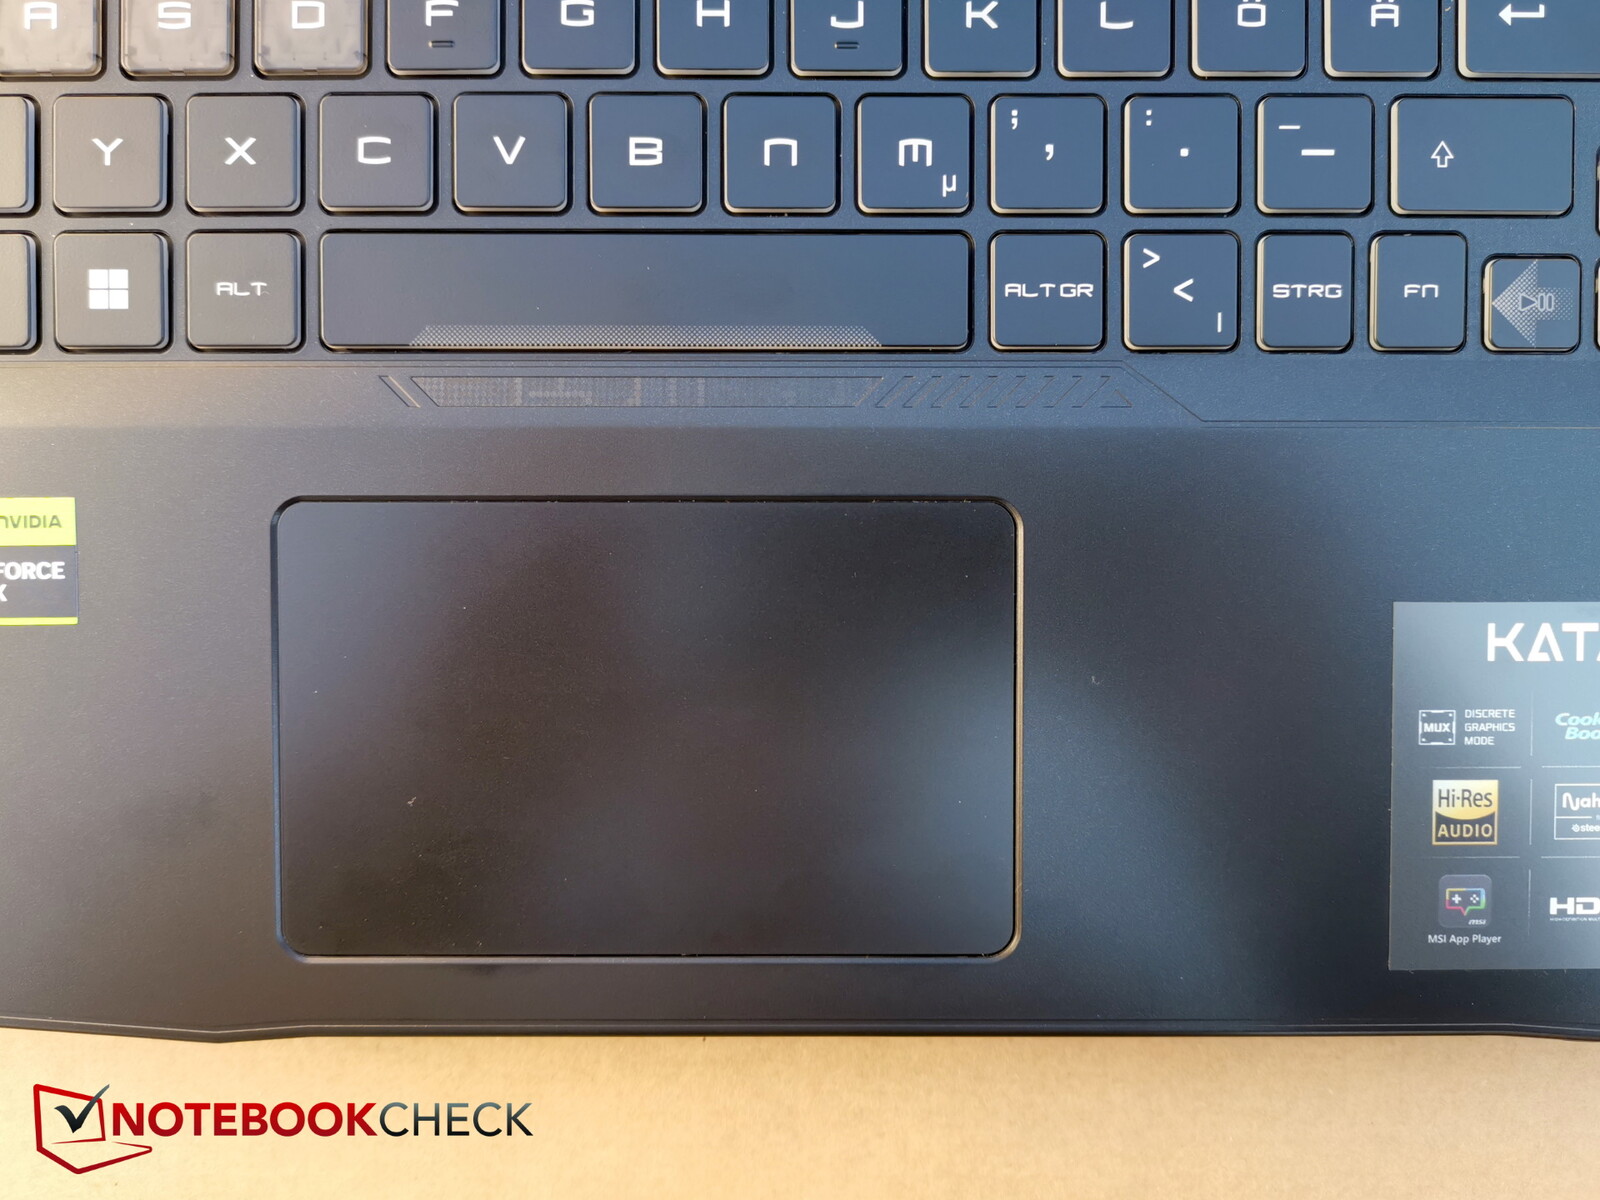
El Katana 15 tiene lo que parece uno de los touchpads más pequeños del mercado. Parece un poco retro. Claro, los jugadores suelen conectar un ratón de todos modos, pero un touchpad más grande es simplemente más cómodo para usar sobre la marcha
El touchpad está justo debajo de la barra espaciadora y, por tanto, muy a la izquierda en el diseño. Una colocación ligeramente más central habría sido más ventajosa
Los clics de las teclas integradas son algo más ruidosos y no parecen de gran calidad, pero reaccionan con fiabilidad y precisión.
Pantalla - 250 nits y 57% sRGB son valores de presupuesto
MSI sigue usando un display Full HD para el Katana, mientras que muchos competidores ya usan QHD y superiores. Esto no es necesariamente un problema, ya que la resolución y los 144 Hz deberían encajar bien con la RTX 4050. Hasta ahora, tampoco parece haber opciones de pantalla alternativas para el B13. A fin de cuentas, es el mismo panel que en el Katana GF66 y el Pulse GL66.
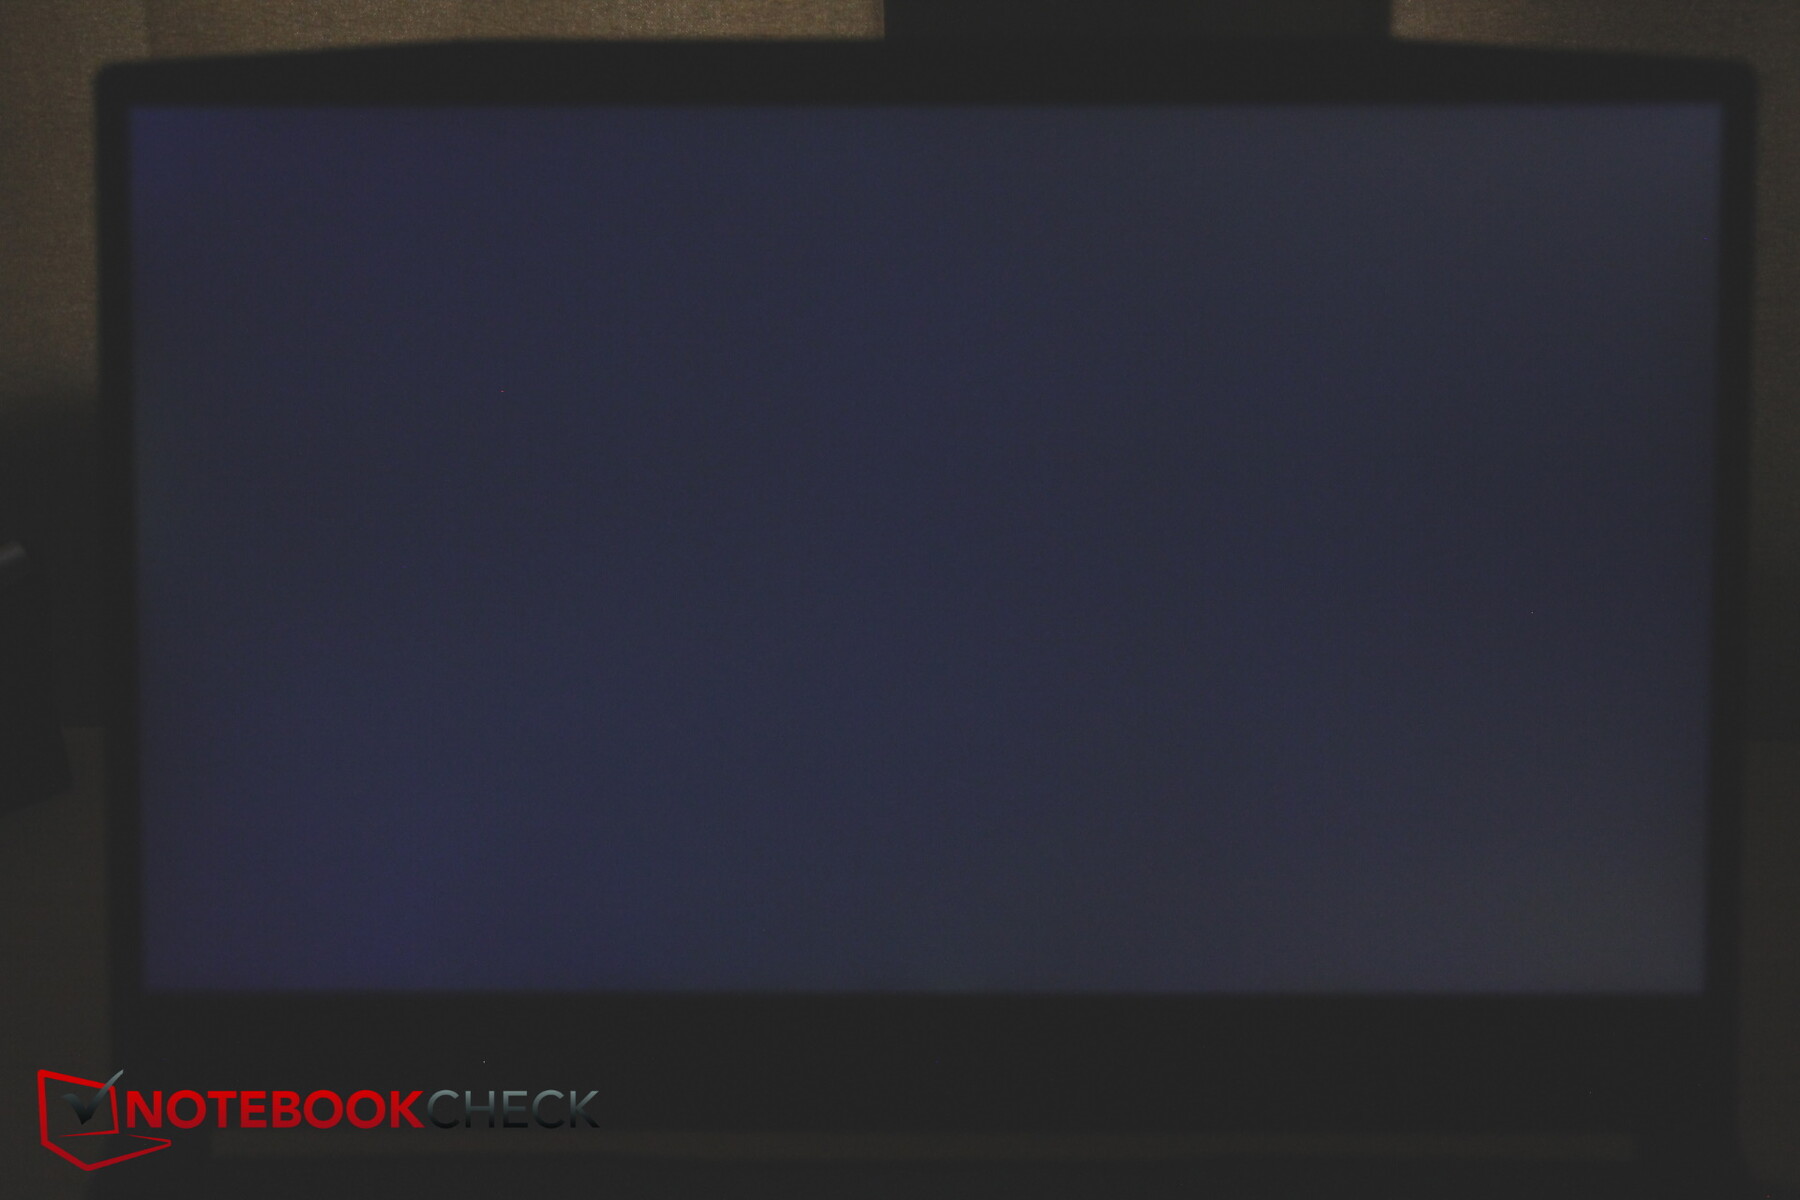
Por desgracia, el brillo medio de 258 nits está bastante por debajo de la media hoy en día, ya que la mayoría de portátiles de la competencia ofrecen pantallas más brillantes. Al menos la iluminación del 92% es bastante uniforme, y el brillo disminuye algo hacia la parte inferior derecha
Los tiempos de respuesta son entre subóptimos y mediocres para un jugador. Al menos el PWM no es un problema en nuestro modelo. El sangrado de pantalla es leve y no se nota en la mayoría de situaciones.
| |||||||||||||||||||||||||
iluminación: 92 %
Brillo con batería: 257 cd/m²
Contraste: 1374:1 (Negro: 0.19 cd/m²)
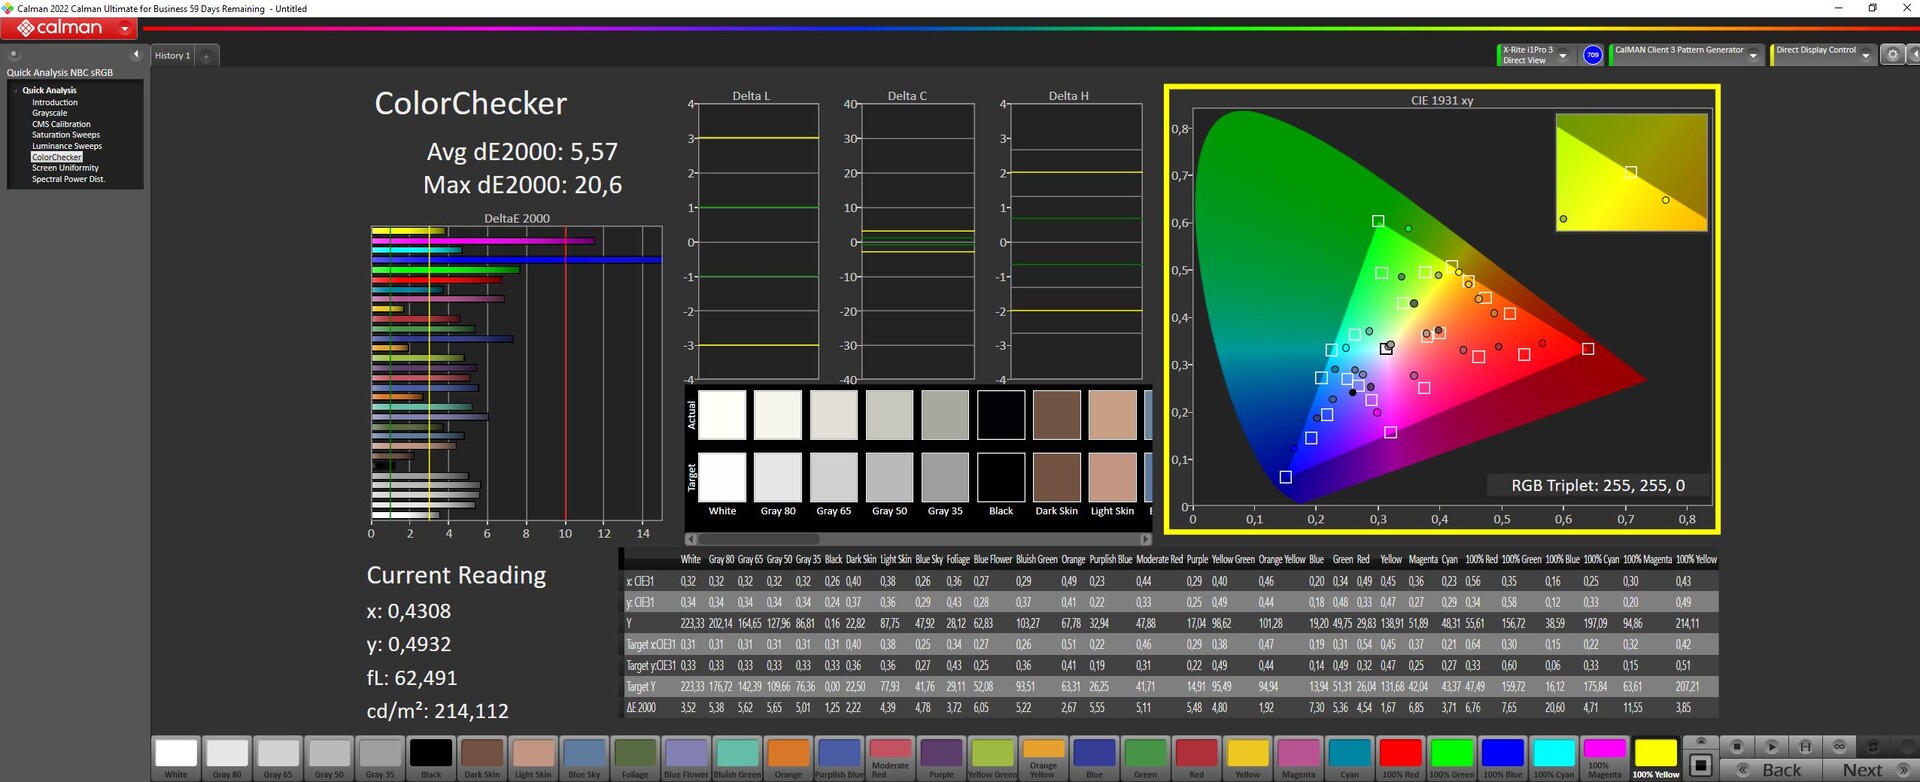
ΔE ColorChecker Calman: 5.57 | ∀{0.5-29.43 Ø4.72}
calibrated: 4.63
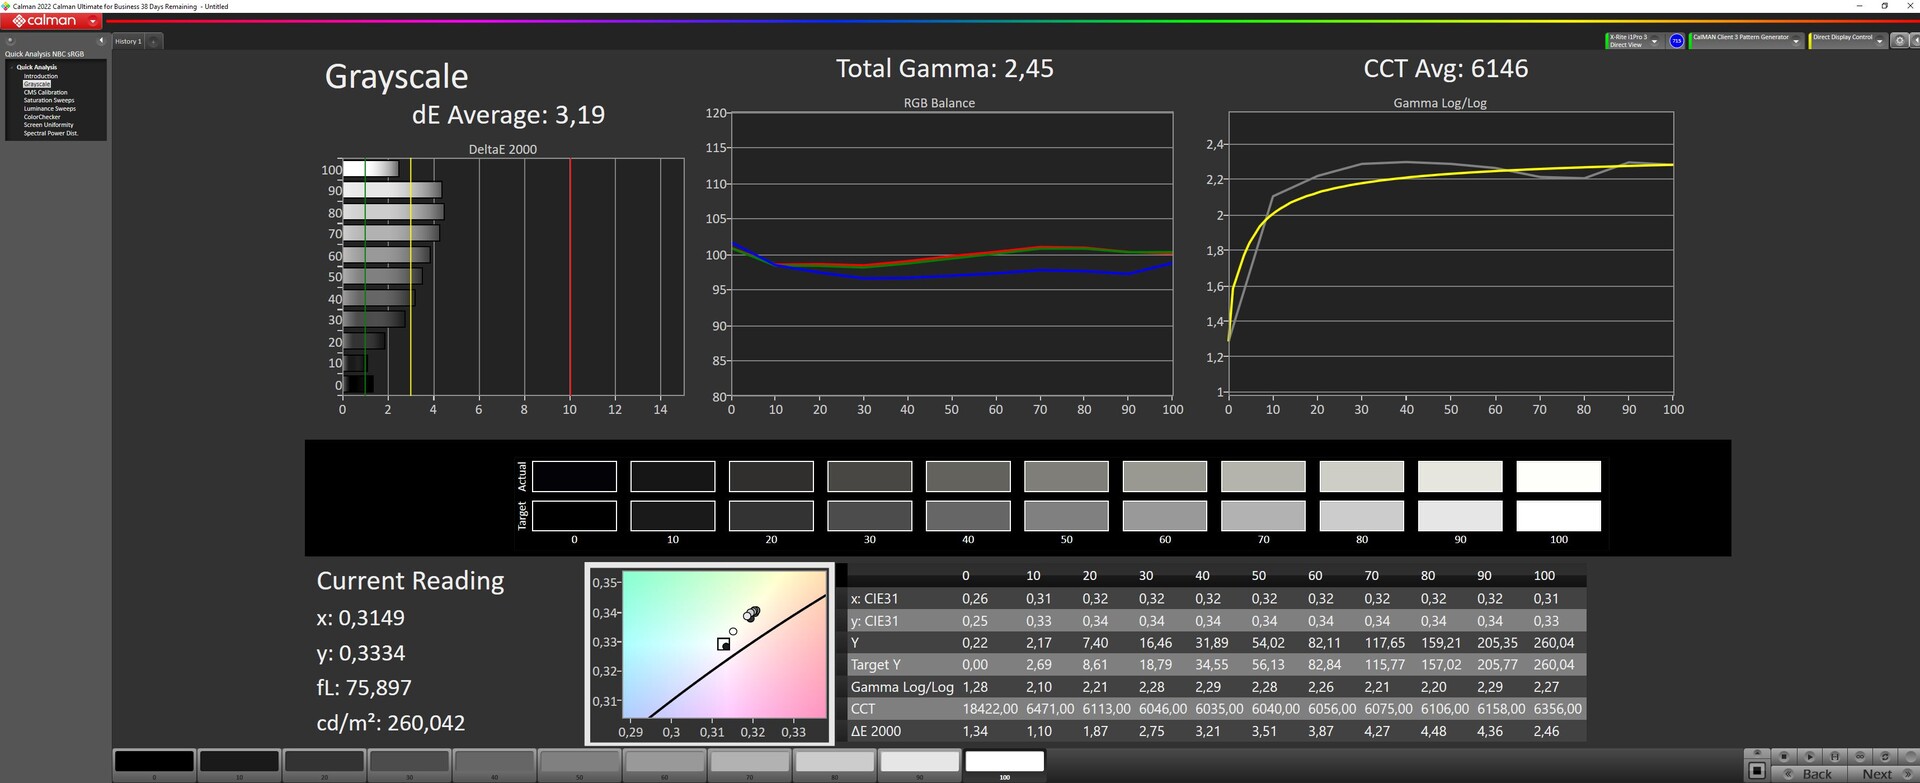
ΔE Greyscale Calman: 3.19 | ∀{0.09-98 Ø4.97}
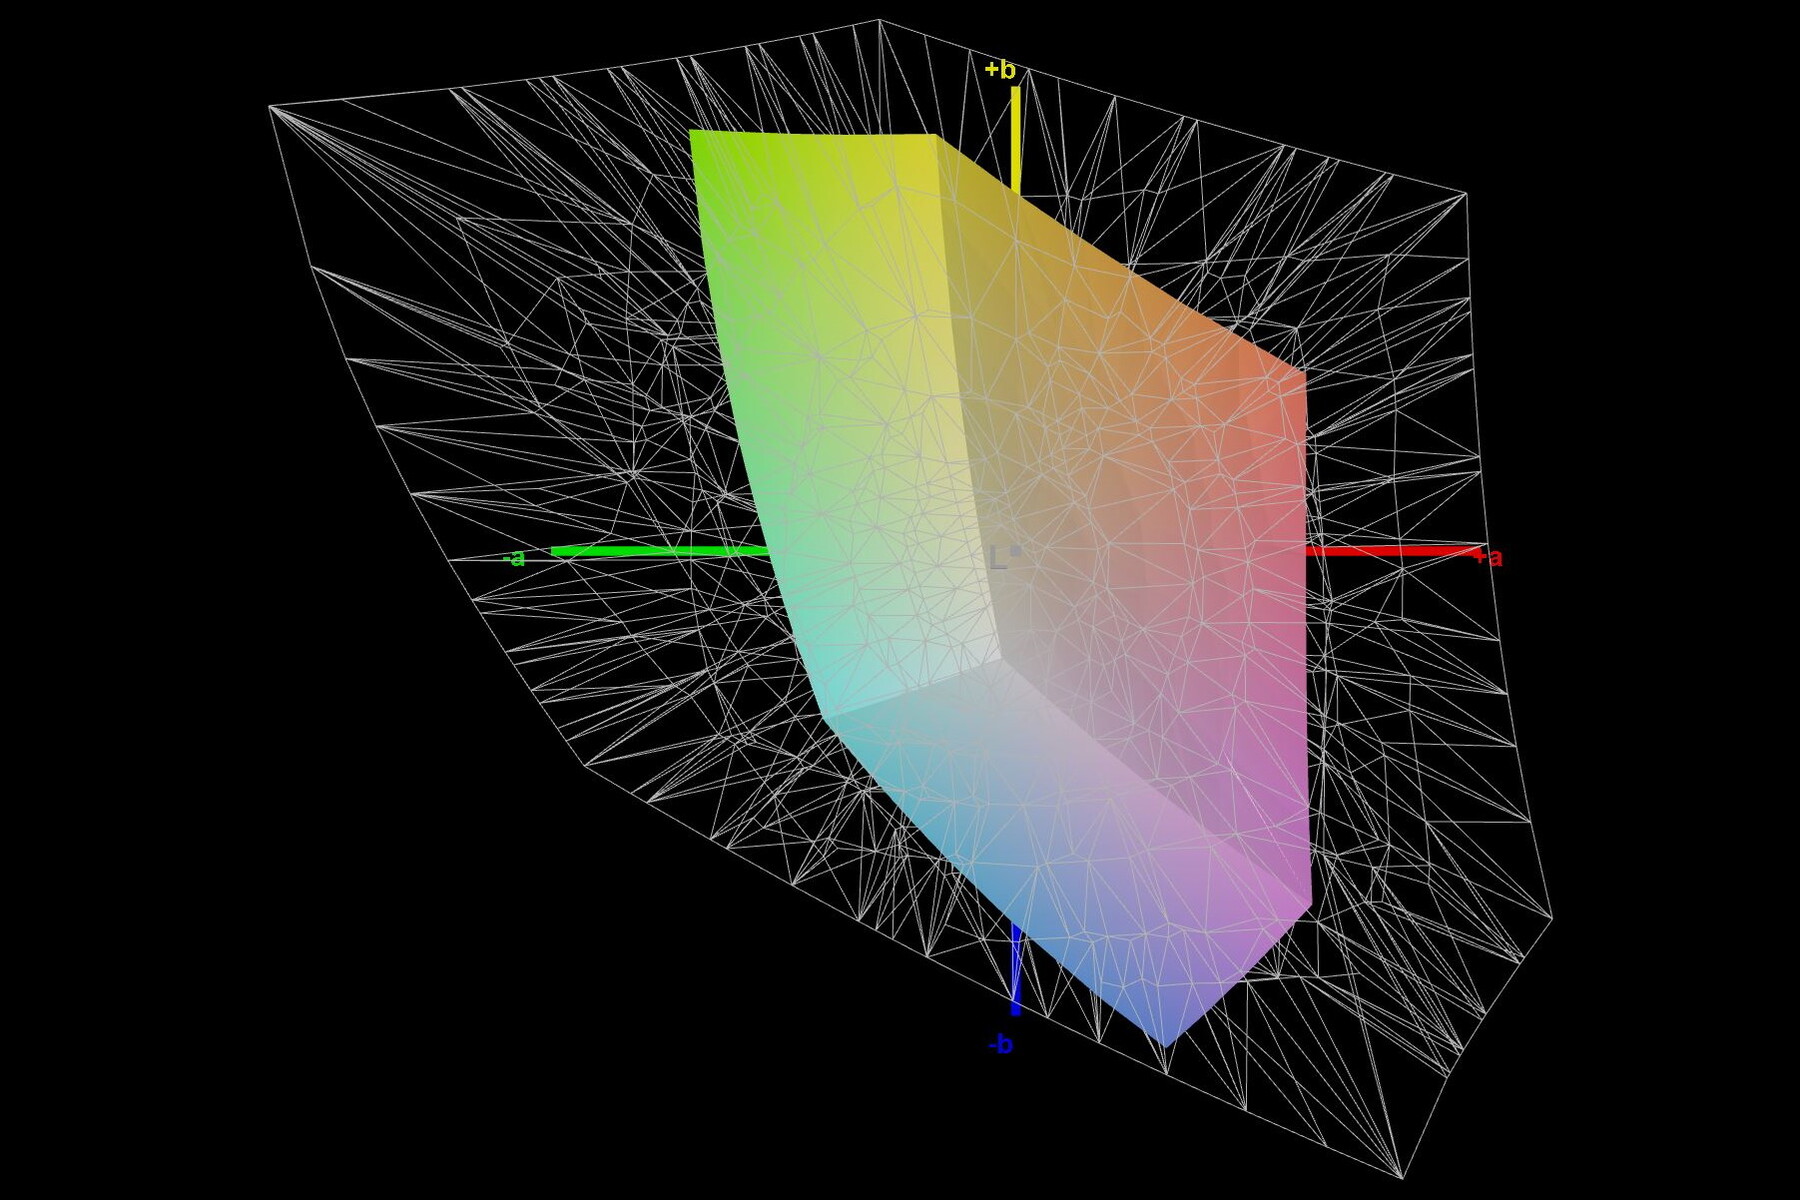
39.3% AdobeRGB 1998 (Argyll 3D)
56.8% sRGB (Argyll 3D)
38.1% Display P3 (Argyll 3D)
Gamma: 2.45
CCT: 6146 K
| MSI Katana 15 B12VEK AUOAF90 (B156HAN08.4), IPS, 1920x1080, 15.6" | MSI Katana GF66 12UGS AU Optronics AUOAF90, IPS, 1920x1080, 15.6" | MSI Pulse GL66 12UEK AU Optronics B156HAN08.4 (AUOAF90), IPS, 1920x1080, 15.6" | Lenovo Legion 5 15IAH7H 82RB CSOT MNF601CA1-3, IPS, 1920x1080, 15.6" | Asus TUF Gaming F15 FX507ZM TL156VDXP0101, IPS, 1920x1080, 15.6" | Schenker XMG Core 15 (M22) CSOT MNF601CA1-1, IPS, 2560x1440, 15.6" | |
|---|---|---|---|---|---|---|
| Display | 3% | 3% | 78% | 73% | 78% | |
| Display P3 Coverage (%) | 38.1 | 39.1 3% | 39 2% | 69.1 81% | 66.4 74% | 68.8 81% |
| sRGB Coverage (%) | 56.8 | 58.3 3% | 58.4 3% | 99.5 75% | 97 71% | 99.3 75% |
| AdobeRGB 1998 Coverage (%) | 39.3 | 40.4 3% | 40.3 3% | 70 78% | 68.5 74% | 69.9 78% |
| Response Times | -5% | -2% | 59% | 69% | 66% | |
| Response Time Grey 50% / Grey 80% * (ms) | 38.8 ? | 40 ? -3% | 38.8 ? -0% | 14.8 ? 62% | 5.6 ? 86% | 16 ? 59% |
| Response Time Black / White * (ms) | 26.8 ? | 28.4 ? -6% | 28 ? -4% | 12 ? 55% | 12.8 ? 52% | 7.6 ? 72% |
| PWM Frequency (Hz) | ||||||
| Screen | 1% | 29% | 1% | 26% | 15% | |
| Brightness middle (cd/m²) | 261 | 227 -13% | 248 -5% | 363.5 39% | 353.7 36% | 378 45% |
| Brightness (cd/m²) | 258 | 225 -13% | 245 -5% | 350 36% | 340 32% | 371 44% |
| Brightness Distribution (%) | 92 | 90 -2% | 86 -7% | 89 -3% | 89 -3% | 93 1% |
| Black Level * (cd/m²) | 0.19 | 0.21 -11% | 0.13 32% | 0.39 -105% | 0.34 -79% | 0.33 -74% |
| Contrast (:1) | 1374 | 1081 -21% | 1908 39% | 932 -32% | 1040 -24% | 1145 -17% |
| Colorchecker dE 2000 * | 5.57 | 4.19 25% | 3.14 44% | 3.68 34% | 1.74 69% | 2.84 49% |
| Colorchecker dE 2000 max. * | 20.6 | 17.45 15% | 5.82 72% | 8.92 57% | 3.63 82% | 5.51 73% |
| Colorchecker dE 2000 calibrated * | 4.63 | 3.81 18% | 3.14 32% | 0.53 89% | 0.5 89% | 2.75 41% |
| Greyscale dE 2000 * | 3.19 | 2.7 15% | 1.2 62% | 6.5 -104% | 2.1 34% | 4.08 -28% |
| Gamma | 2.45 90% | 2.208 100% | 2.49 88% | 2.2 100% | 2.3 96% | 2.4 92% |
| CCT | 6146 106% | 6176 105% | 6468 100% | 5995 108% | 6257 104% | 5841 111% |
| Media total (Programa/Opciones) | -0% /
1% | 10% /
19% | 46% /
26% | 56% /
42% | 53% /
36% |
* ... más pequeño es mejor
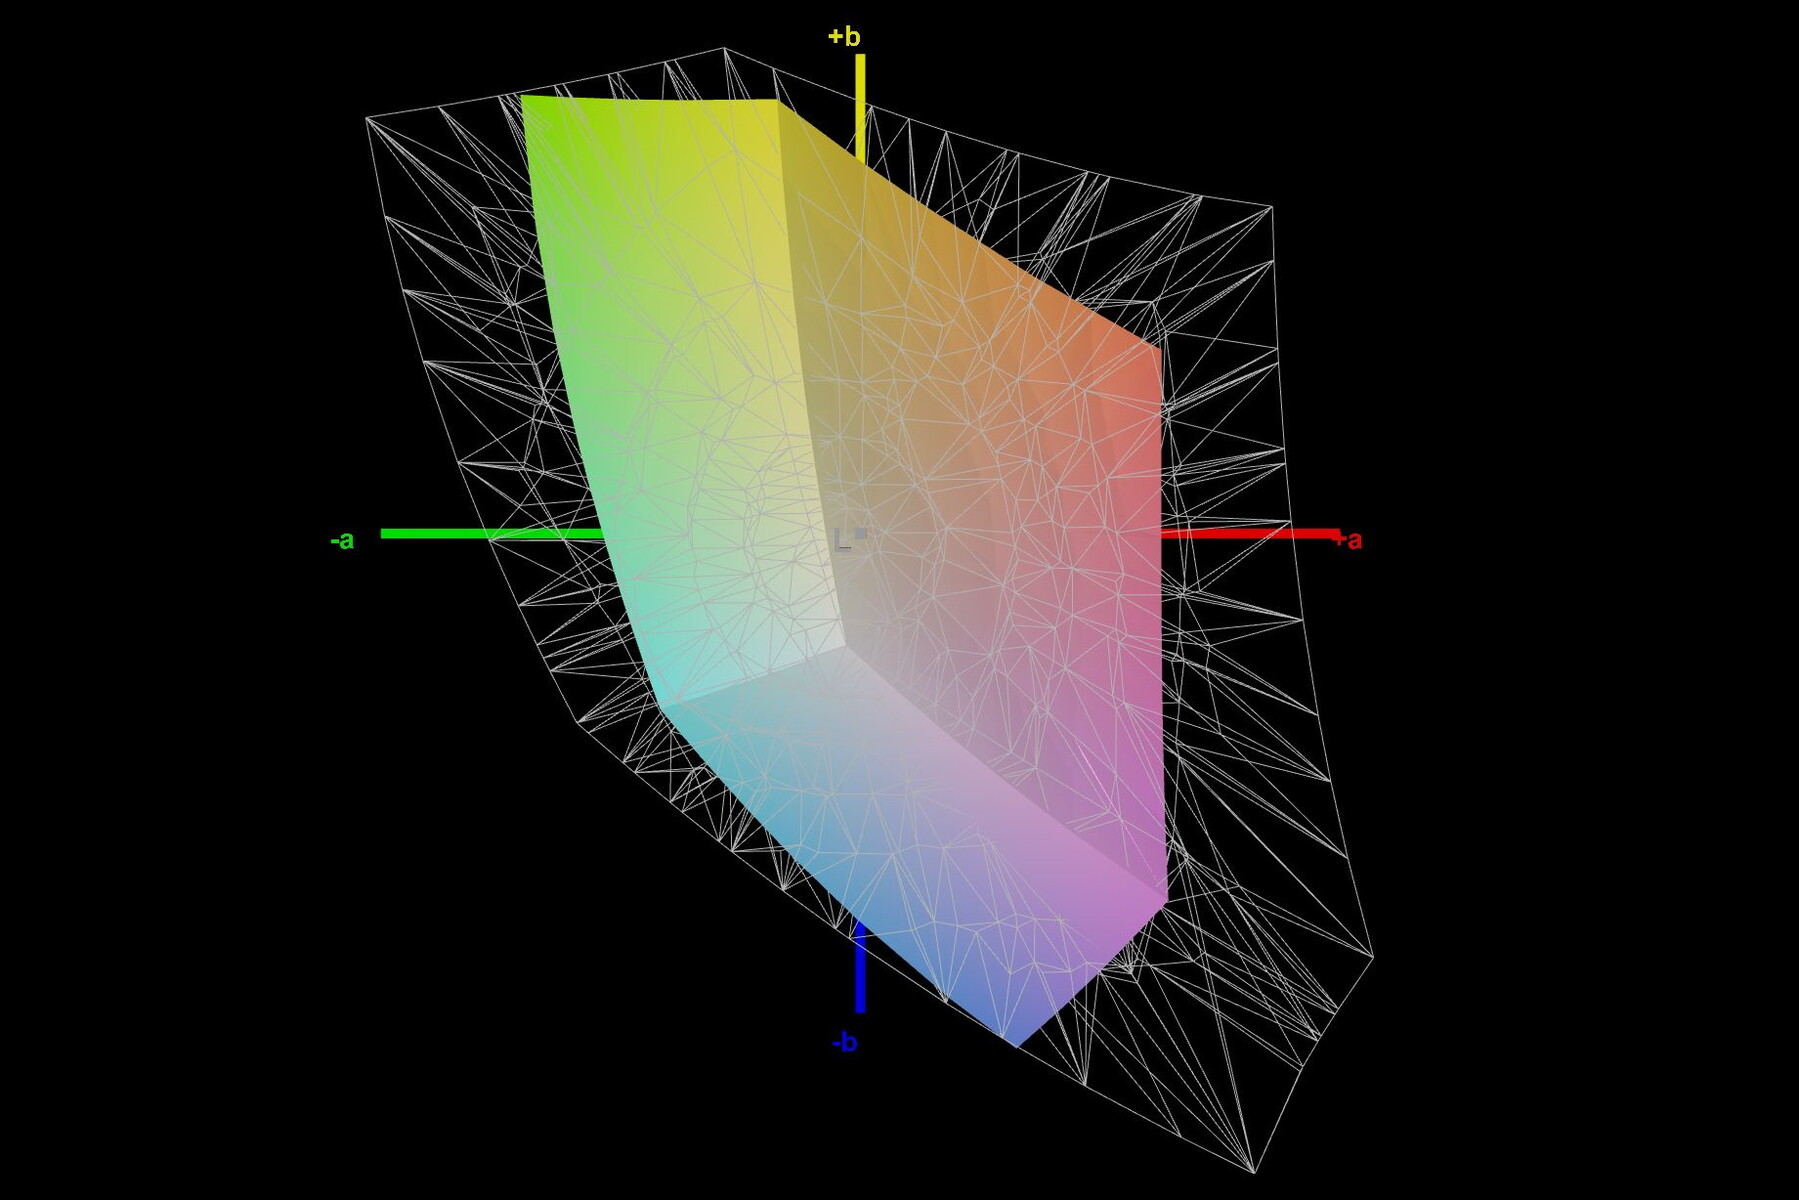
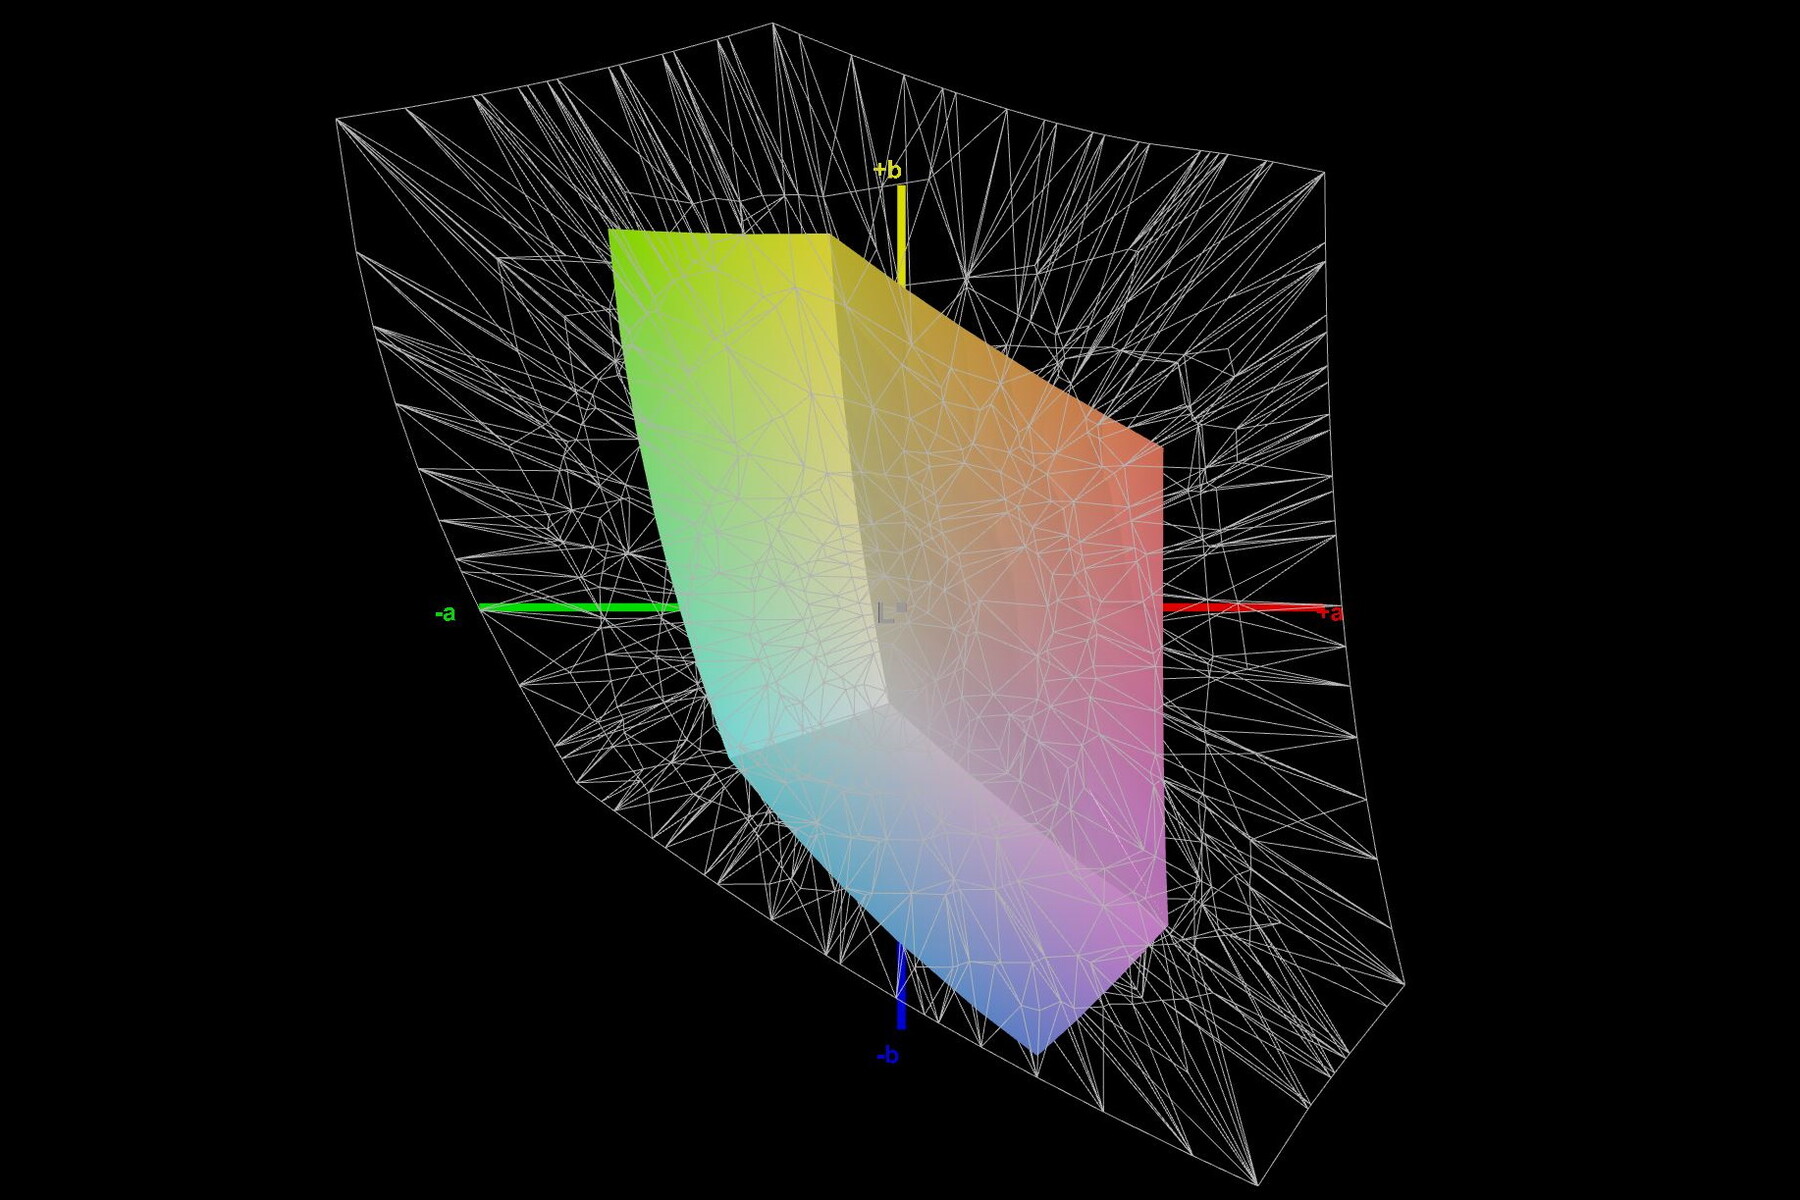
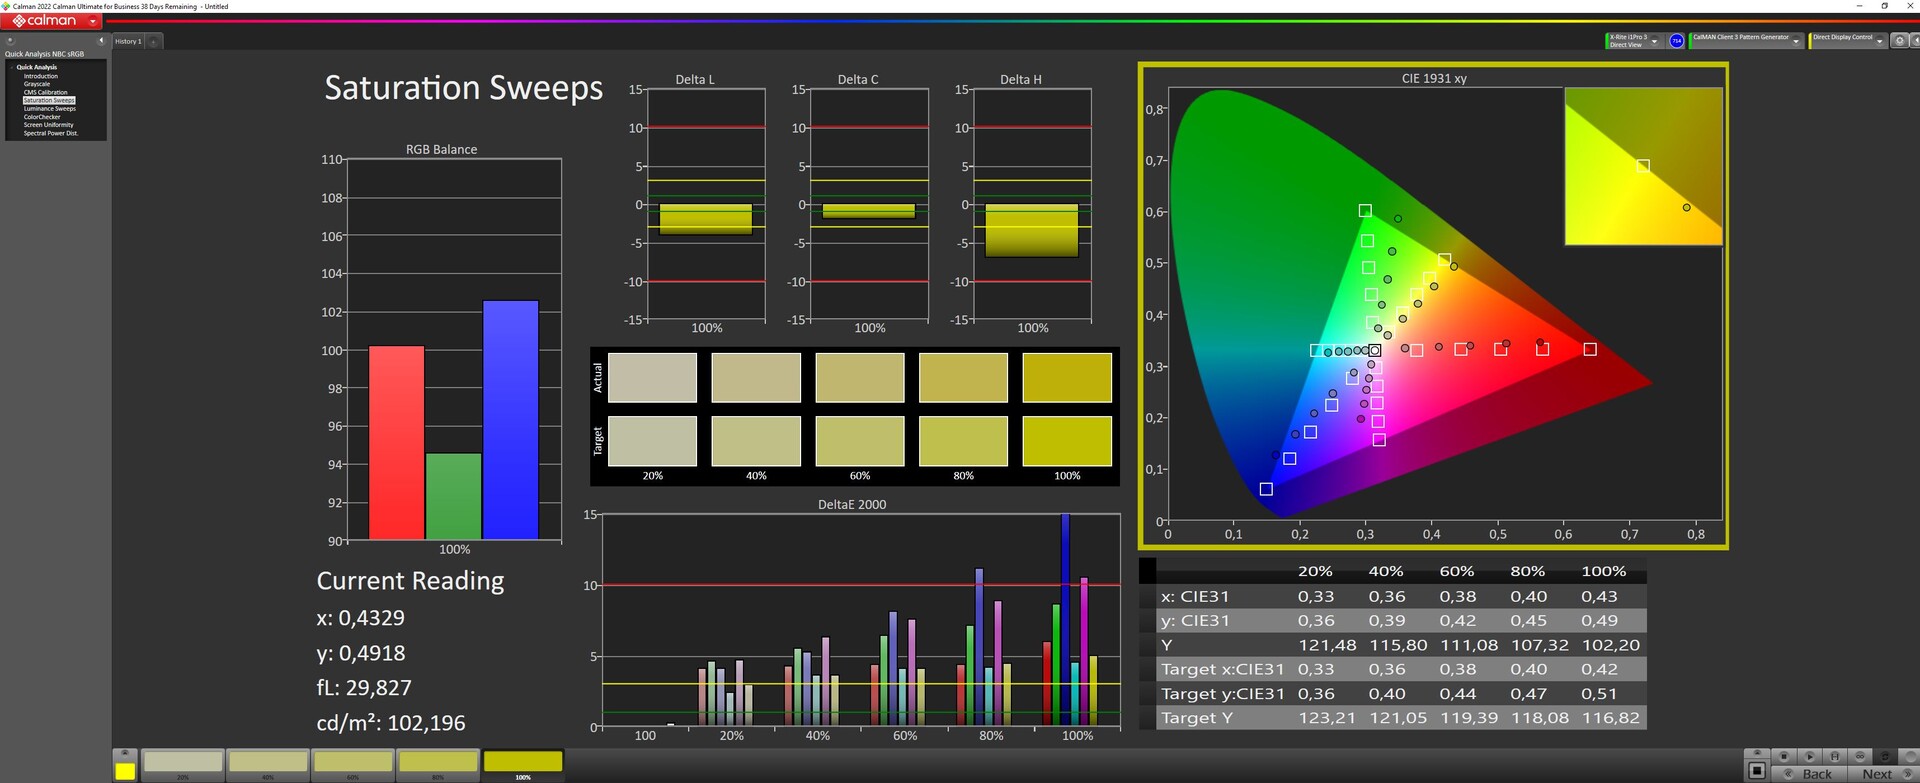
El fabricante no da ninguna información sobre la cobertura del espacio de color. Medimos algo menos del 57% en sRGB y alrededor del 39% en AdobeRGB y DisplayP3. Aquí también se hace evidente el carácter económico del Katana 15; la competencia ofrece una mayor cobertura del espacio de color.
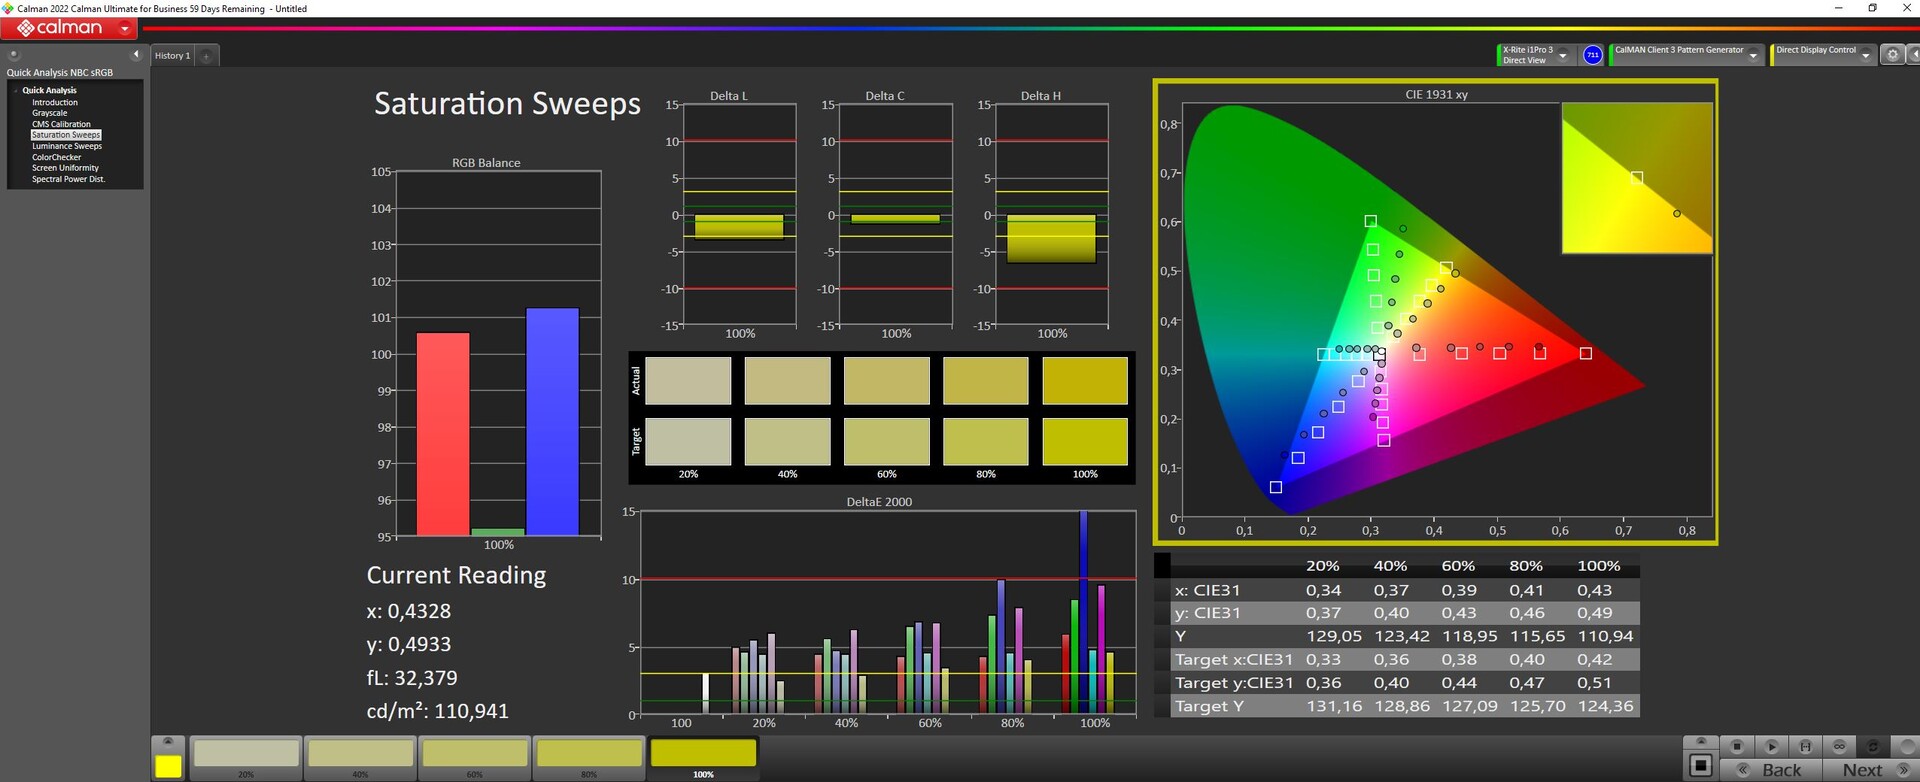
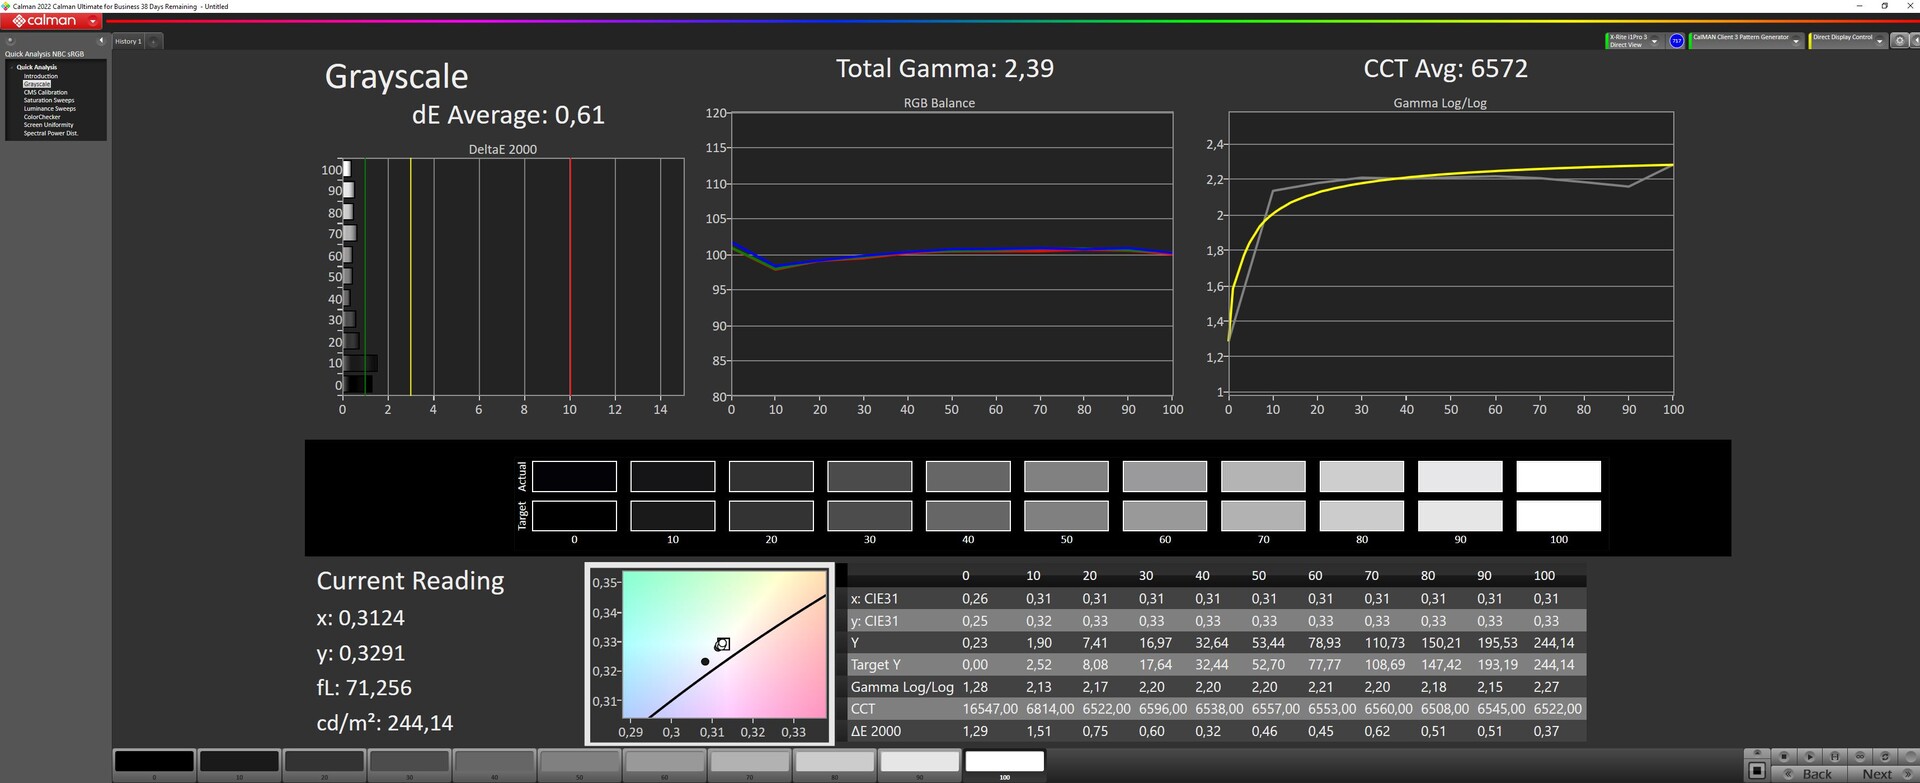
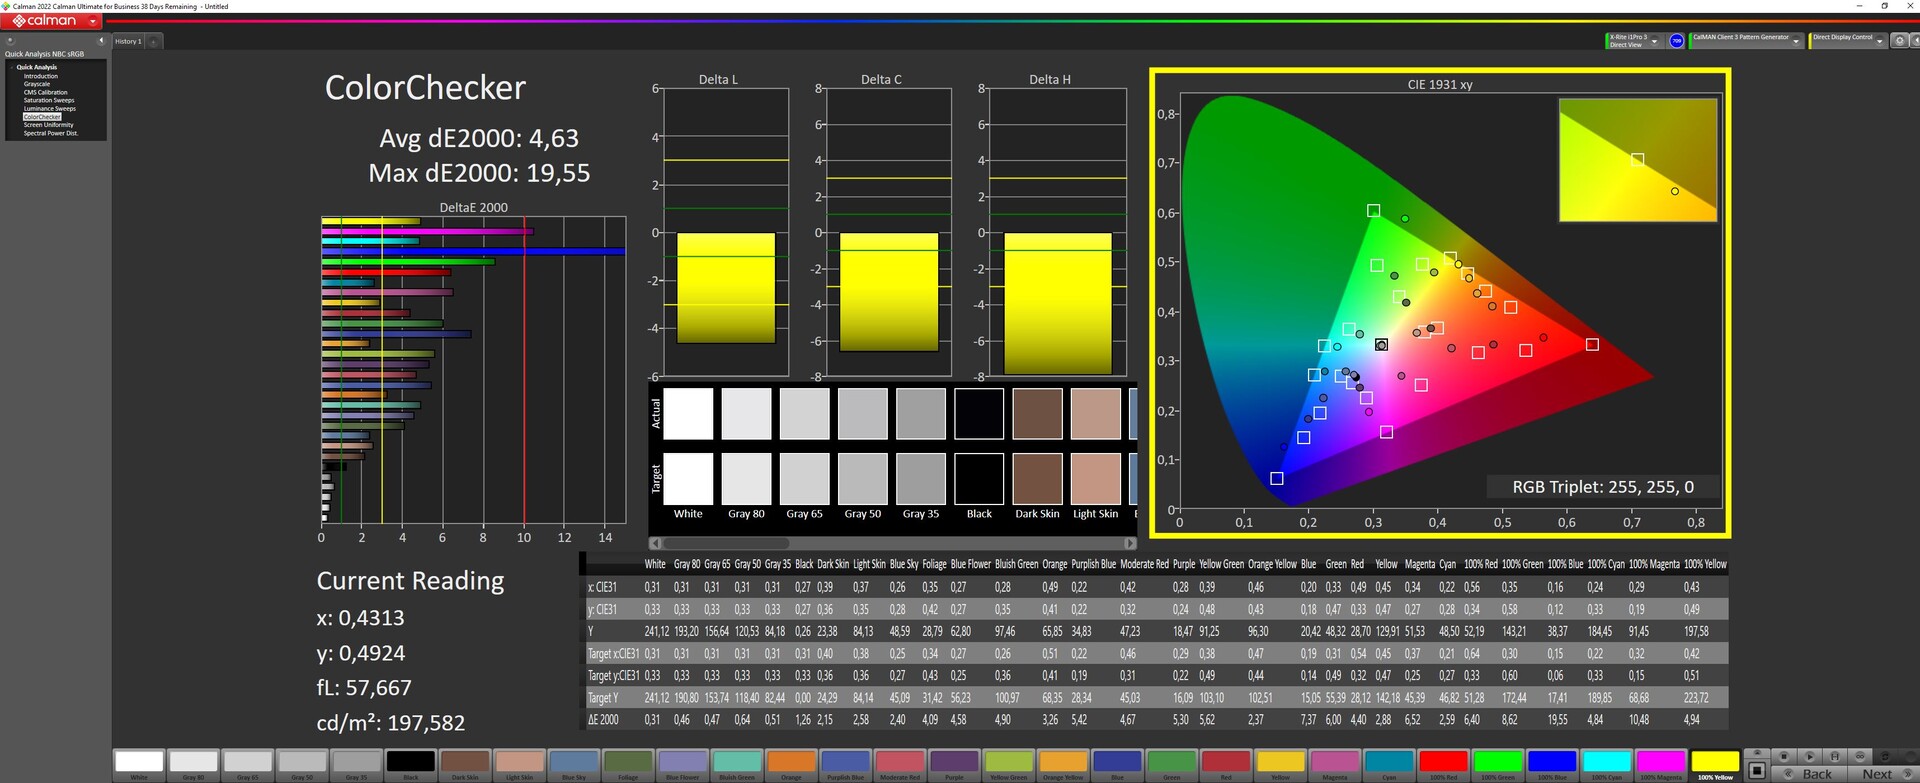
La pantalla no está muy bien ajustada de fábrica. Aquí sólo medimos contra el estándar sRGB. Reducir el brillo sólo baja ligeramente el valor DeltaE para los niveles de gris, pero sigue estando justo por debajo de 3. Sin embargo, el Calman ColorChecker muestra altas desviaciones de color. Sin embargo, el Calman ColorChecker muestra altas desviaciones de color.
La calibración manual minimiza las desviaciones de la escala de grises a un buen 0.61, pero el valor DeltaE del ColorChecker de 4.63 sigue siendo demasiado alto. La pantalla no parece ser capaz de más. Nuestro perfil de color icc calibrado puede descargarse más arriba.
Tiempos de respuesta del display
| ↔ Tiempo de respuesta de Negro a Blanco | ||
|---|---|---|
| 26.8 ms ... subida ↗ y bajada ↘ combinada | ↗ 14.2 ms subida | 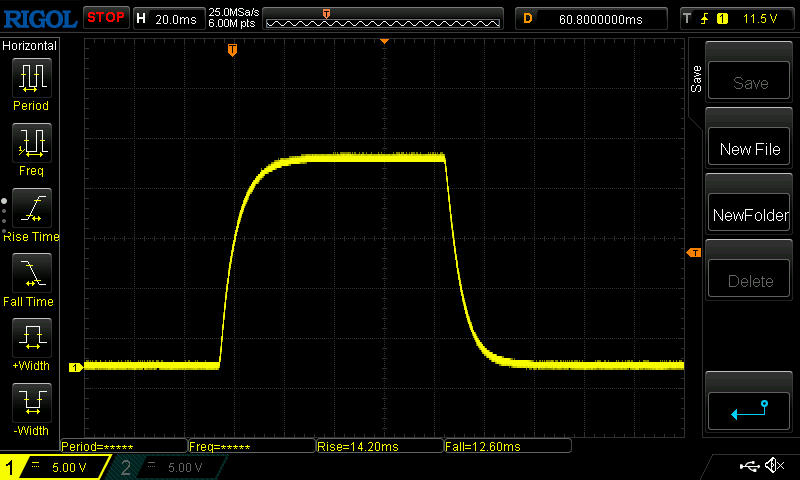 |
| ↘ 12.6 ms bajada | ||
| La pantalla mostró tiempos de respuesta relativamente lentos en nuestros tests pero podría ser demasiado lenta para los jugones. En comparación, todos los dispositivos de prueba van de ##min### (mínimo) a 240 (máximo) ms. » 67 % de todos los dispositivos son mejores. Eso quiere decir que el tiempo de respuesta es peor que la media (19.8 ms) de todos los dispositivos testados. | ||
| ↔ Tiempo de respuesta 50% Gris a 80% Gris | ||
| 38.8 ms ... subida ↗ y bajada ↘ combinada | ↗ 18.6 ms subida | 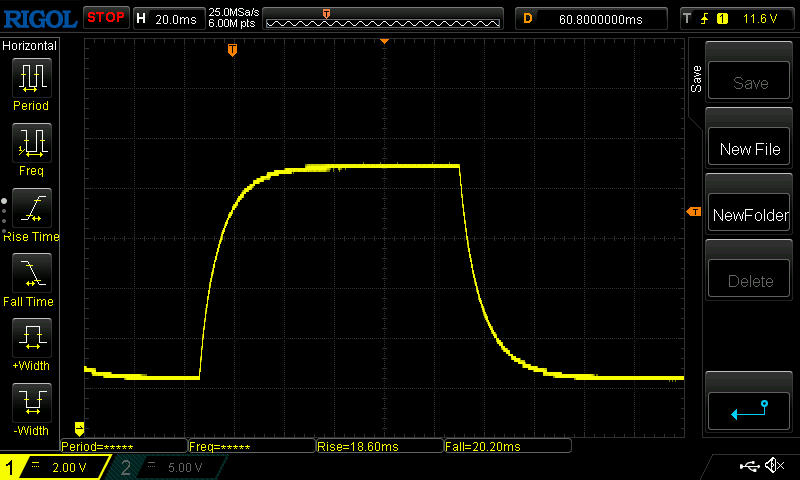 |
| ↘ 20.2 ms bajada | ||
| La pantalla mostró tiempos de respuesta lentos en nuestros tests y podría ser demasiado lenta para los jugones. En comparación, todos los dispositivos de prueba van de ##min### (mínimo) a 636 (máximo) ms. » 58 % de todos los dispositivos son mejores. Eso quiere decir que el tiempo de respuesta es peor que la media (31 ms) de todos los dispositivos testados. | ||
Parpadeo de Pantalla / PWM (Pulse-Width Modulation)
| Parpadeo de Pantalla / PWM no detectado | 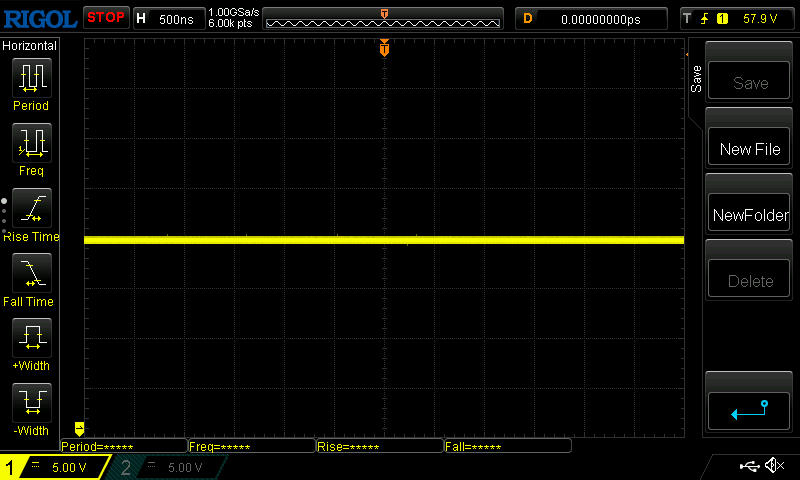 | ||
Comparación: 52 % de todos los dispositivos testados no usaron PWM para atenuar el display. Si se usó, medimos una media de 7772 (mínimo: 5 - máxmo: 343500) Hz. | |||
La superficie mate filtra los reflejos agresivos en exteriores. Sin embargo, el escaso brillo del panel exige sin duda un lugar a la sombra.
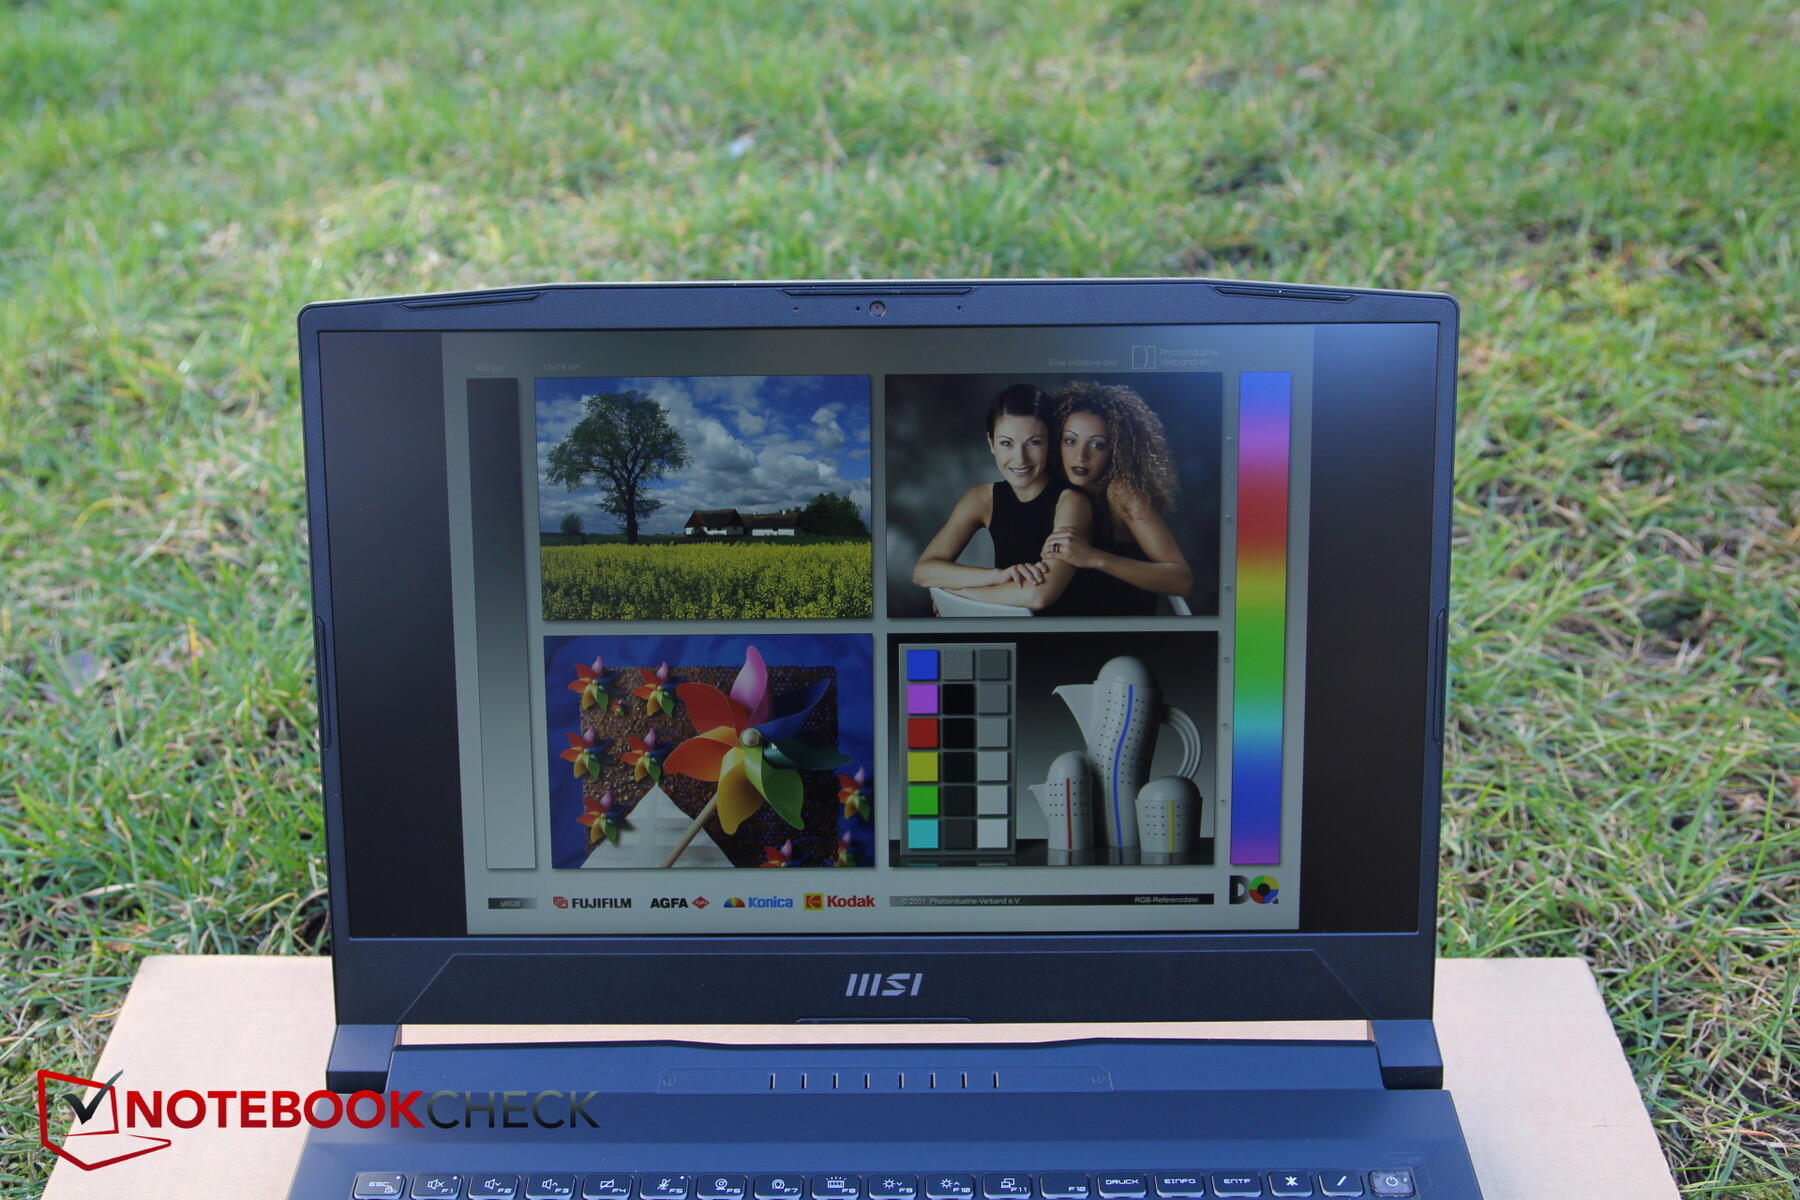
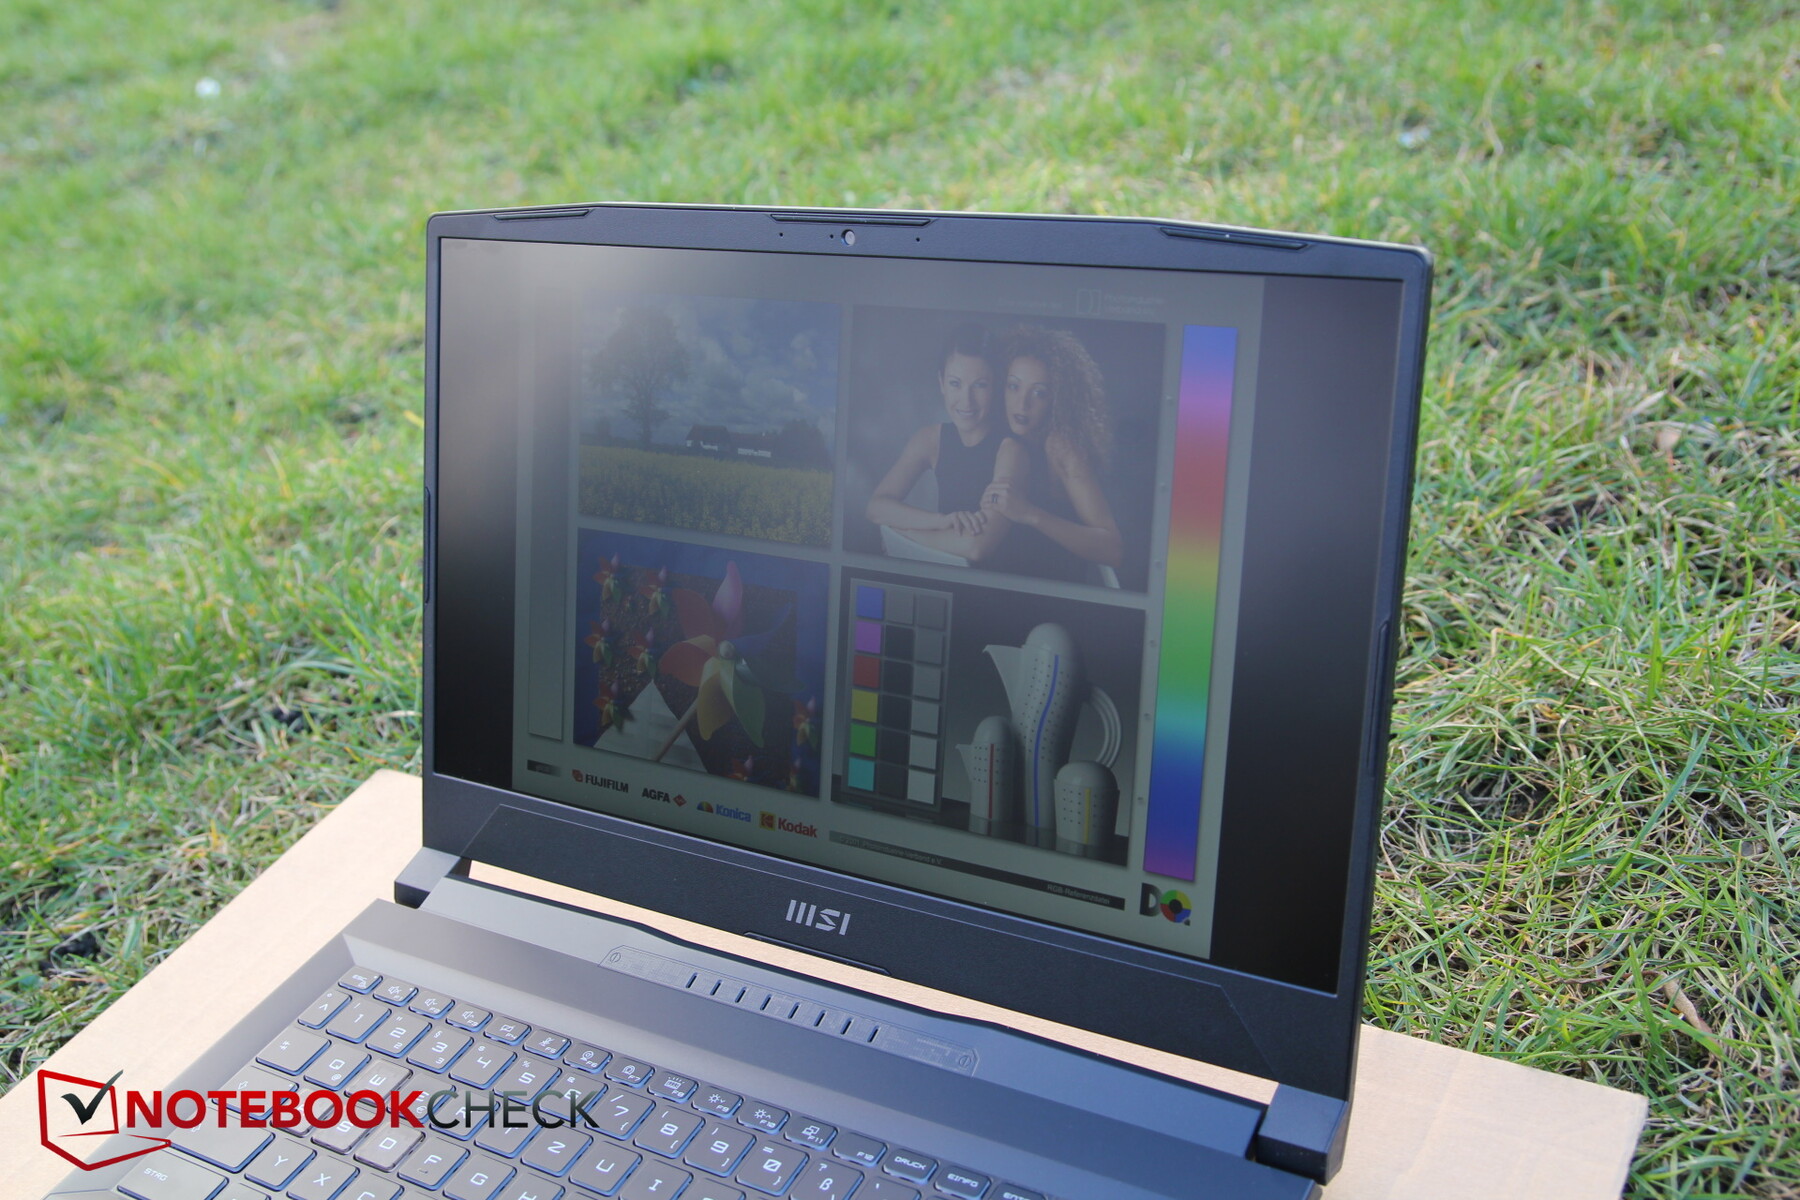
La estabilidad del ángulo de visión es buena. Sólo se aprecia una caída del brillo en ángulos de visión extremos.

Rendimiento - Katana 15 al nivel de RTX 3060
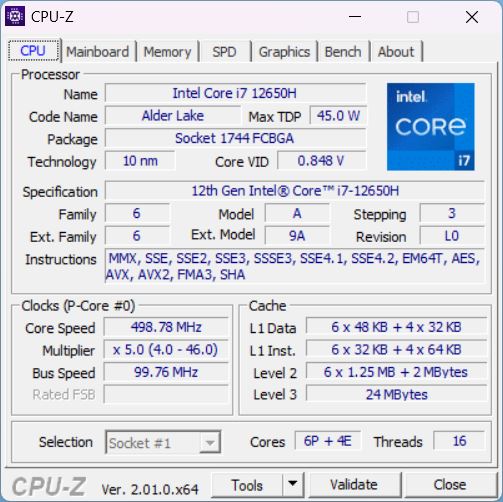
El MSI Katana 15 se anuncia como un portátil para juegos, y aunque suCore i7-12650Hpertenece a la serie Alder Lake del año pasado, definitivamente forma parte de la gama baja alta.
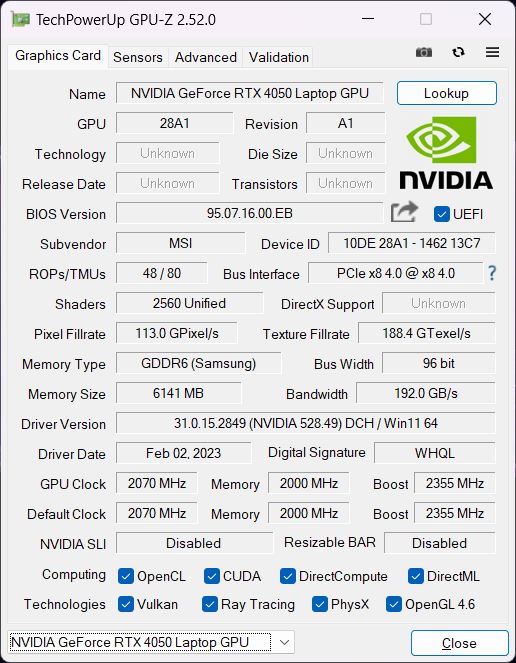
La CPU se combina con unaNvidia RTX 4050la tarjeta básica de los nuevos modelos RTX 40xx. En el Katana, puede consumir hasta 105 W. 16 GB de RAM es el estándar (inferior) para un jugador en estos días.
Condiciones de ensayo
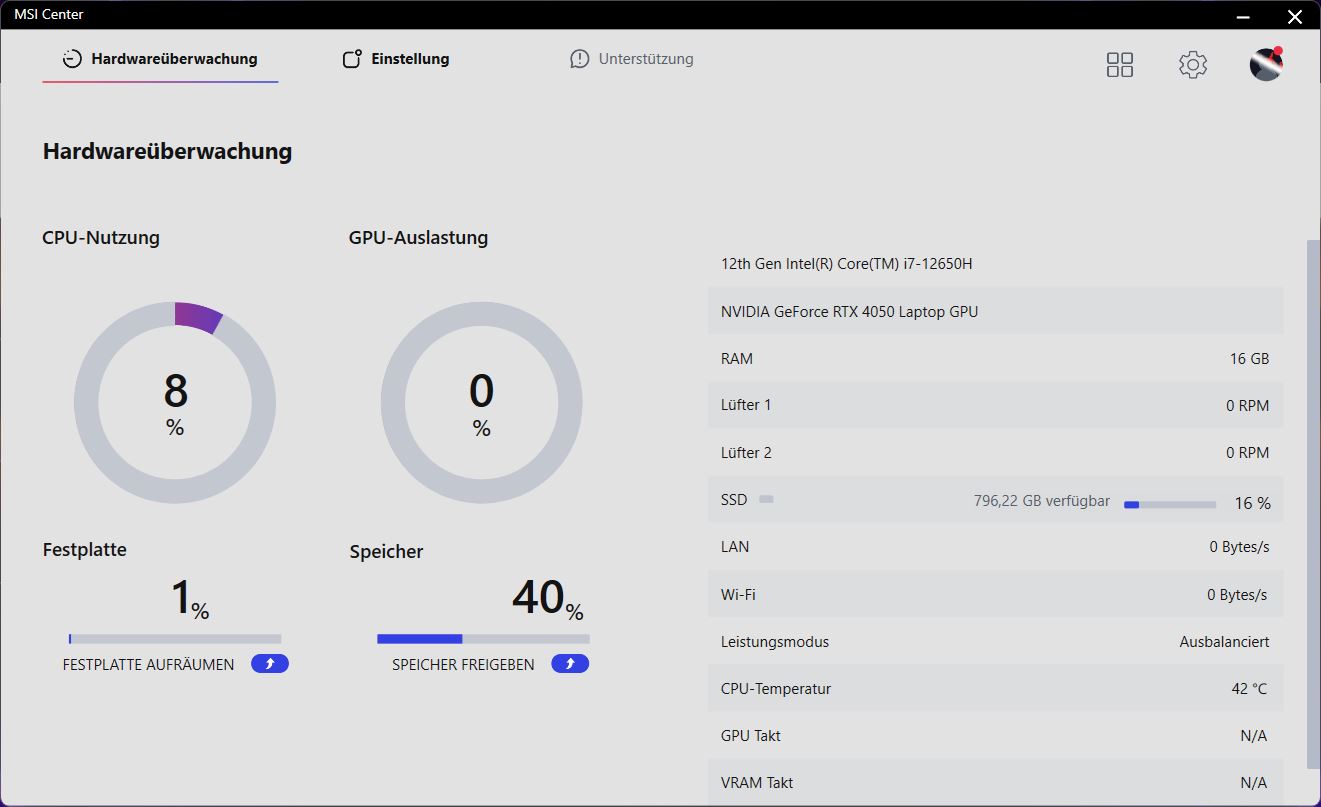
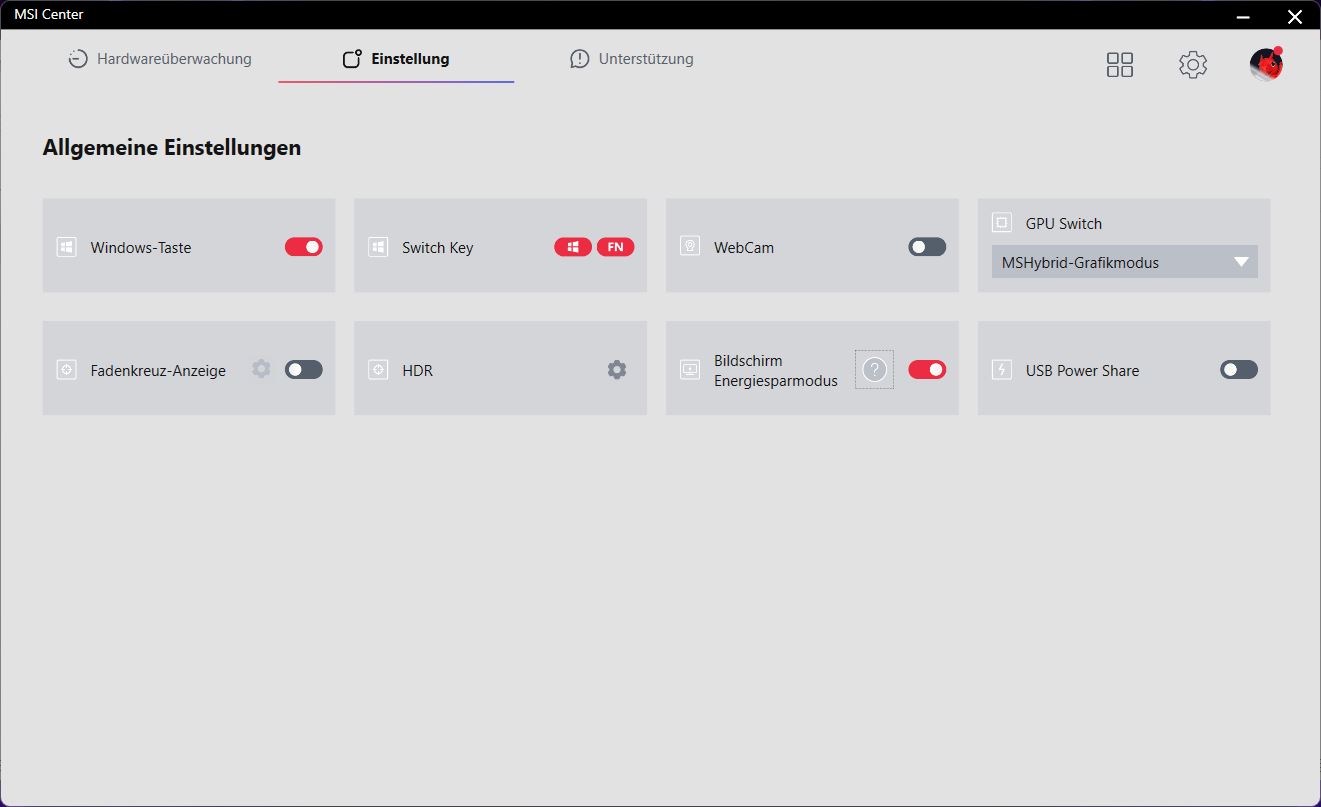
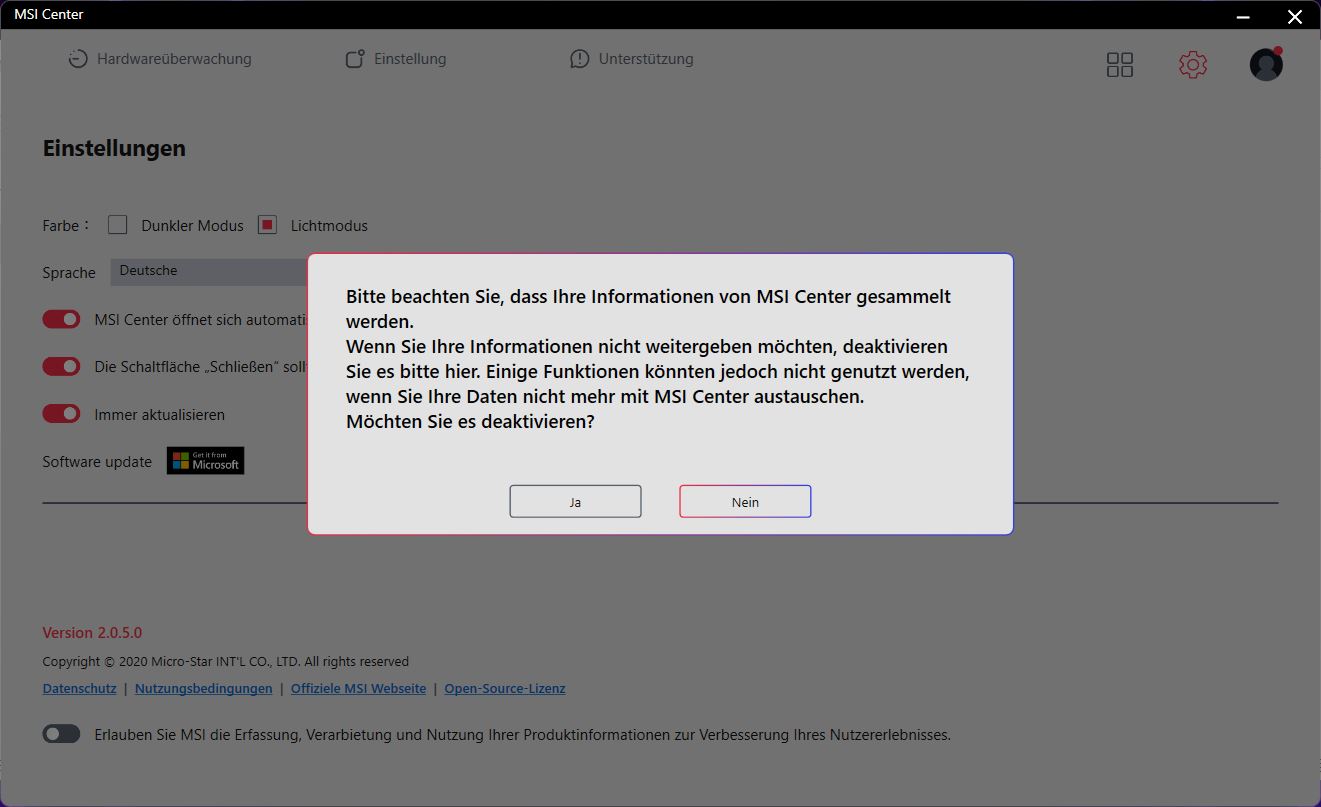
El MSI Center es el centro de control, que el fabricante usa para recoger varios tipos de datos, por supuesto. Entre otras cosas, aquí se ajustan los valores de rendimiento. El modo AI está preestablecido por defecto aquí, que ajusta automáticamente los valores de rendimiento dependiendo de la carga aplicada. Confiamos en la competencia de la IA y ejecutamos todas las pruebas en este modo.
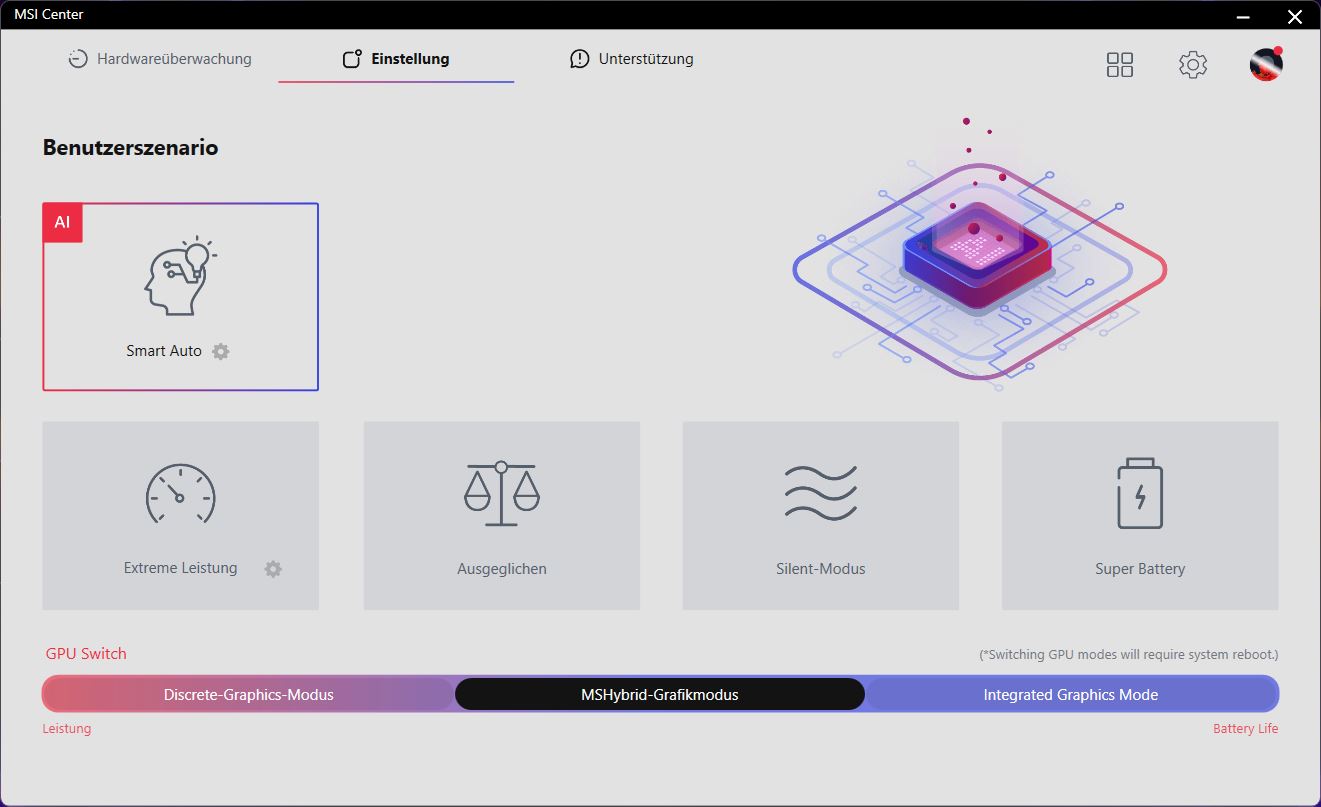
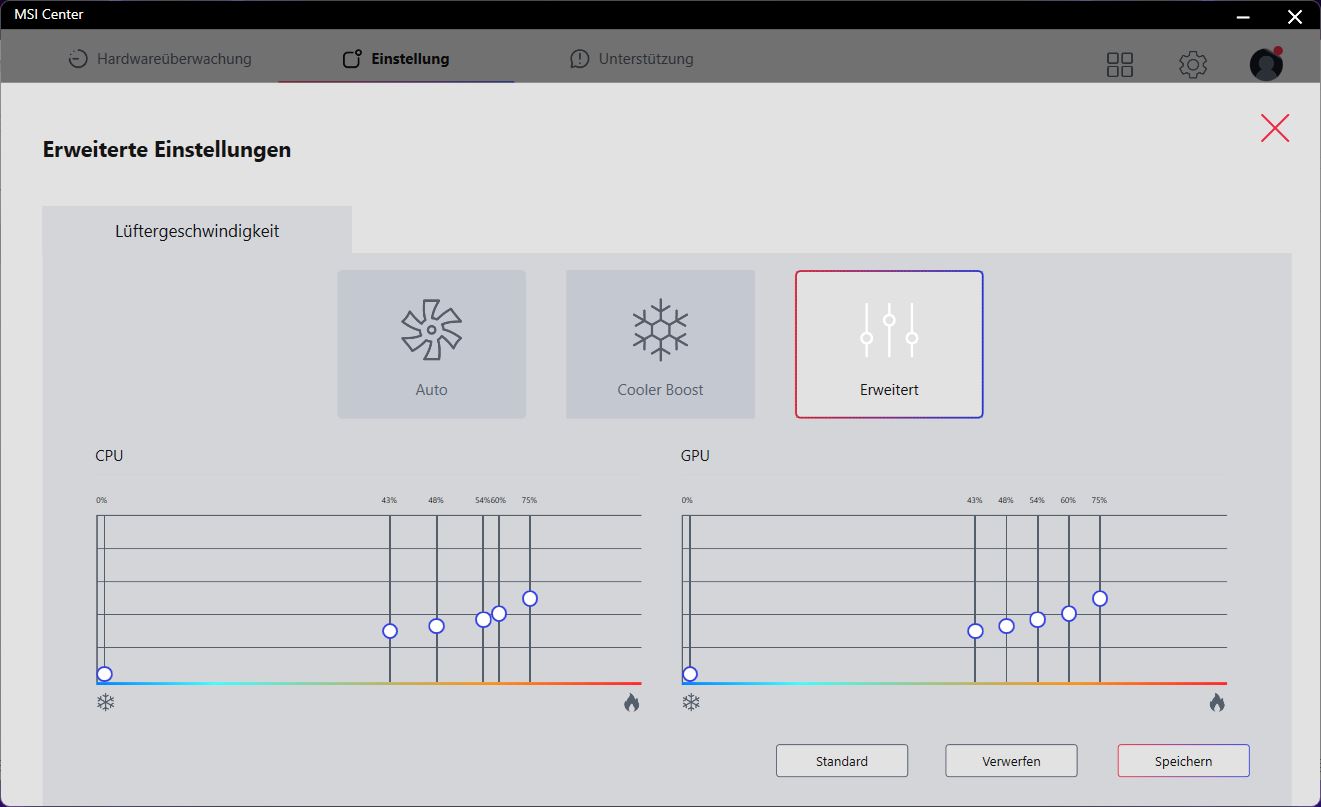
Además del rendimiento, se pueden ajustar otros parámetros en el Centro MSI. Por ejemplo, se intercambian las funciones de las teclas fn y Windows, se ajustan manualmente las curvas de los ventiladores en el modo Rendimiento Extremo, o se conmutan iGPU y dGPU. La herramienta tiene problemas con ciertas resoluciones
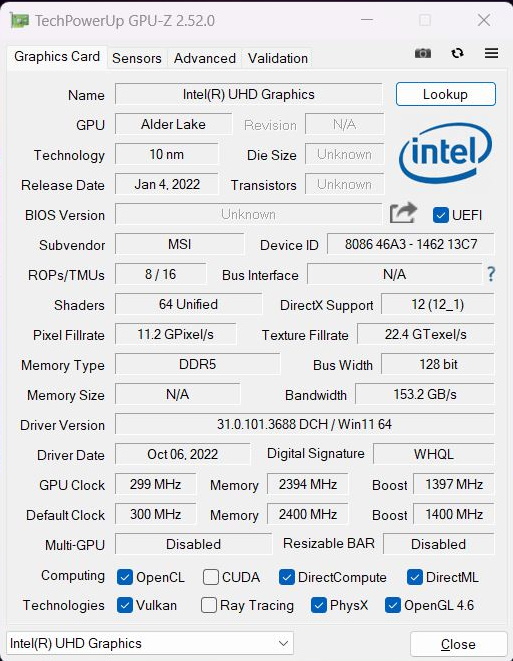
La mayoría de las veces, se activó el modo híbrido GPU en el Centro MSI, que cambia automáticamente entre iGPU y dGPU. Sin embargo, esto no funcionó de forma fiable en nuestros benchmarks. Por ejemplo, tuvimos que activar manualmente la dGPU para Blender porque la prueba se ejecutaba automáticamente sólo con iGPU y producía resultados muy pobres.
Procesador
A diferencia deli7-12700Hel i7-12650H sólo tiene 4 de los 8 núcleos E, pero los 6 núcleos P son los mismos. Estos últimos alcanzan los 4,7 GHz. La CPU pertenece a la gama alta inferior de la última generación de Intel. Como alternativa, ahora también existe el Katana 15 B13 con una CPU Gen13 de Intel, cuyo precio probablemente sea más elevado.
En el bucle Cinebench, observamos una pequeña caída del rendimiento en las dos primeras ejecuciones. Después, el rendimiento es bastante constante, pero no demasiado alto en general. Nuestro Katana está en desventaja frente a la competencia con i7-12700H, y también es superado por el Ryzen 7 6800H.
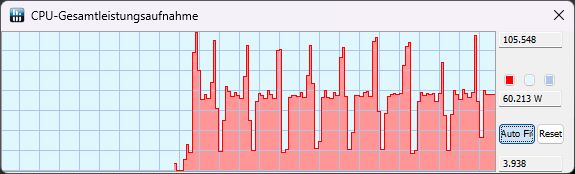
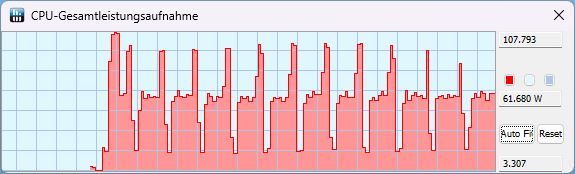
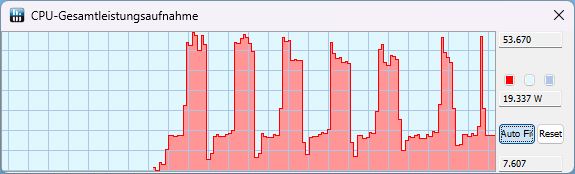
El TDP sigue siendo casi el mismo tanto en modo KI como en modo Extreme: medimos unos 105 W al principio y al final de una ejecución, respectivamente, y el consumo de energía baja a 60 W en el transcurso de la ejecución. En modo batería, el pico es de sólo 53 W, por lo demás sólo se dispone de 19 W
En general, el rendimiento de la CPU está en el nivel esperado, pero el rendimiento mononúcleo del Katana es algo más débil.
Cinebench R15 Multi Sustained Load
Cinebench R23: Multi Core | Single Core
Cinebench R20: CPU (Multi Core) | CPU (Single Core)
Cinebench R15: CPU Multi 64Bit | CPU Single 64Bit
Blender: v2.79 BMW27 CPU
7-Zip 18.03: 7z b 4 | 7z b 4 -mmt1
Geekbench 5.5: Multi-Core | Single-Core
HWBOT x265 Benchmark v2.2: 4k Preset
LibreOffice : 20 Documents To PDF
R Benchmark 2.5: Overall mean
| CPU Performance rating | |
| Media de la clase Gaming | |
| Lenovo Legion 5 15IAH7H 82RB | |
| MSI Pulse GL66 12UEK | |
| Asus TUF Gaming F15 FX507ZM | |
| MSI Katana GF66 12UGS | |
| MSI Katana 15 B12VEK | |
| Schenker XMG Core 15 (M22) | |
| Medio Intel Core i7-12650H | |
| Cinebench R23 / Multi Core | |
| Media de la clase Gaming (10488 - 40970, n=111, últimos 2 años) | |
| Lenovo Legion 5 15IAH7H 82RB | |
| Asus TUF Gaming F15 FX507ZM | |
| MSI Pulse GL66 12UEK | |
| MSI Katana GF66 12UGS | |
| MSI Katana 15 B12VEK | |
| Schenker XMG Core 15 (M22) | |
| Medio Intel Core i7-12650H (5362 - 15537, n=14) | |
| Cinebench R23 / Single Core | |
| Media de la clase Gaming (1166 - 2356, n=111, últimos 2 años) | |
| MSI Pulse GL66 12UEK | |
| MSI Katana GF66 12UGS | |
| Lenovo Legion 5 15IAH7H 82RB | |
| Asus TUF Gaming F15 FX507ZM | |
| Medio Intel Core i7-12650H (1428 - 1808, n=14) | |
| MSI Katana 15 B12VEK | |
| Schenker XMG Core 15 (M22) | |
| Cinebench R20 / CPU (Multi Core) | |
| Media de la clase Gaming (4029 - 16108, n=110, últimos 2 años) | |
| Lenovo Legion 5 15IAH7H 82RB | |
| Asus TUF Gaming F15 FX507ZM | |
| MSI Pulse GL66 12UEK | |
| MSI Katana GF66 12UGS | |
| MSI Katana 15 B12VEK | |
| Schenker XMG Core 15 (M22) | |
| Medio Intel Core i7-12650H (2106 - 6009, n=14) | |
| Cinebench R20 / CPU (Single Core) | |
| Media de la clase Gaming (442 - 895, n=110, últimos 2 años) | |
| MSI Pulse GL66 12UEK | |
| MSI Katana GF66 12UGS | |
| Lenovo Legion 5 15IAH7H 82RB | |
| Asus TUF Gaming F15 FX507ZM | |
| Medio Intel Core i7-12650H (552 - 696, n=14) | |
| MSI Katana 15 B12VEK | |
| Schenker XMG Core 15 (M22) | |
| Cinebench R15 / CPU Multi 64Bit | |
| Media de la clase Gaming (1578 - 6271, n=109, últimos 2 años) | |
| Lenovo Legion 5 15IAH7H 82RB | |
| Asus TUF Gaming F15 FX507ZM | |
| MSI Pulse GL66 12UEK | |
| MSI Katana GF66 12UGS | |
| MSI Katana GF66 12UGS | |
| Schenker XMG Core 15 (M22) | |
| MSI Katana 15 B12VEK | |
| Medio Intel Core i7-12650H (753 - 2253, n=14) | |
| Cinebench R15 / CPU Single 64Bit | |
| Media de la clase Gaming (188.8 - 343, n=110, últimos 2 años) | |
| MSI Pulse GL66 12UEK | |
| MSI Katana GF66 12UGS | |
| MSI Katana GF66 12UGS | |
| Lenovo Legion 5 15IAH7H 82RB | |
| Asus TUF Gaming F15 FX507ZM | |
| Schenker XMG Core 15 (M22) | |
| MSI Katana 15 B12VEK | |
| Medio Intel Core i7-12650H (206 - 261, n=14) | |
| Blender / v2.79 BMW27 CPU | |
| Medio Intel Core i7-12650H (222 - 553, n=15) | |
| MSI Katana GF66 12UGS | |
| MSI Katana 15 B12VEK | |
| Schenker XMG Core 15 (M22) | |
| MSI Pulse GL66 12UEK | |
| Asus TUF Gaming F15 FX507ZM | |
| Lenovo Legion 5 15IAH7H 82RB | |
| Media de la clase Gaming (80 - 330, n=108, últimos 2 años) | |
| 7-Zip 18.03 / 7z b 4 | |
| Media de la clase Gaming (33491 - 148086, n=109, últimos 2 años) | |
| Lenovo Legion 5 15IAH7H 82RB | |
| Asus TUF Gaming F15 FX507ZM | |
| MSI Pulse GL66 12UEK | |
| Schenker XMG Core 15 (M22) | |
| MSI Katana 15 B12VEK | |
| MSI Katana GF66 12UGS | |
| Medio Intel Core i7-12650H (27053 - 59034, n=14) | |
| 7-Zip 18.03 / 7z b 4 -mmt1 | |
| Media de la clase Gaming (4199 - 7436, n=109, últimos 2 años) | |
| MSI Pulse GL66 12UEK | |
| MSI Katana GF66 12UGS | |
| Lenovo Legion 5 15IAH7H 82RB | |
| Schenker XMG Core 15 (M22) | |
| Medio Intel Core i7-12650H (5265 - 6116, n=14) | |
| MSI Katana 15 B12VEK | |
| Asus TUF Gaming F15 FX507ZM | |
| Geekbench 5.5 / Multi-Core | |
| Media de la clase Gaming (6460 - 27010, n=109, últimos 2 años) | |
| Lenovo Legion 5 15IAH7H 82RB | |
| Asus TUF Gaming F15 FX507ZM | |
| MSI Pulse GL66 12UEK | |
| MSI Katana GF66 12UGS | |
| MSI Katana 15 B12VEK | |
| Schenker XMG Core 15 (M22) | |
| Medio Intel Core i7-12650H (6478 - 11284, n=16) | |
| Geekbench 5.5 / Single-Core | |
| Media de la clase Gaming (986 - 2474, n=109, últimos 2 años) | |
| MSI Pulse GL66 12UEK | |
| MSI Katana GF66 12UGS | |
| Lenovo Legion 5 15IAH7H 82RB | |
| Asus TUF Gaming F15 FX507ZM | |
| Medio Intel Core i7-12650H (1590 - 1797, n=16) | |
| MSI Katana 15 B12VEK | |
| Schenker XMG Core 15 (M22) | |
| HWBOT x265 Benchmark v2.2 / 4k Preset | |
| Media de la clase Gaming (11.5 - 44.3, n=109, últimos 2 años) | |
| Lenovo Legion 5 15IAH7H 82RB | |
| Asus TUF Gaming F15 FX507ZM | |
| MSI Pulse GL66 12UEK | |
| Schenker XMG Core 15 (M22) | |
| MSI Katana 15 B12VEK | |
| Medio Intel Core i7-12650H (6.62 - 17.4, n=16) | |
| MSI Katana GF66 12UGS | |
| LibreOffice / 20 Documents To PDF | |
| Schenker XMG Core 15 (M22) | |
| Asus TUF Gaming F15 FX507ZM | |
| Media de la clase Gaming (19 - 88.8, n=109, últimos 2 años) | |
| MSI Katana 15 B12VEK | |
| Medio Intel Core i7-12650H (35.1 - 58.5, n=14) | |
| MSI Pulse GL66 12UEK | |
| Lenovo Legion 5 15IAH7H 82RB | |
| MSI Katana GF66 12UGS | |
| R Benchmark 2.5 / Overall mean | |
| MSI Katana 15 B12VEK | |
| Schenker XMG Core 15 (M22) | |
| Medio Intel Core i7-12650H (0.4584 - 0.515, n=14) | |
| Asus TUF Gaming F15 FX507ZM | |
| Lenovo Legion 5 15IAH7H 82RB | |
| MSI Katana GF66 12UGS | |
| Media de la clase Gaming (0.3439 - 0.759, n=110, últimos 2 años) | |
| MSI Pulse GL66 12UEK | |
* ... más pequeño es mejor
AIDA64: FP32 Ray-Trace | FPU Julia | CPU SHA3 | CPU Queen | FPU SinJulia | FPU Mandel | CPU AES | CPU ZLib | FP64 Ray-Trace | CPU PhotoWorxx
| Performance rating | |
| Media de la clase Gaming | |
| Lenovo Legion 5 15IAH7H 82RB | |
| Schenker XMG Core 15 (M22) | |
| MSI Katana 15 B12VEK | |
| MSI Pulse GL66 12UEK | |
| Asus TUF Gaming F15 FX507ZM | |
| MSI Katana GF66 12UGS | |
| Medio Intel Core i7-12650H | |
| AIDA64 / FP32 Ray-Trace | |
| Media de la clase Gaming (10227 - 85542, n=108, últimos 2 años) | |
| Lenovo Legion 5 15IAH7H 82RB | |
| Schenker XMG Core 15 (M22) | |
| MSI Katana 15 B12VEK | |
| Medio Intel Core i7-12650H (5422 - 15620, n=14) | |
| Asus TUF Gaming F15 FX507ZM | |
| MSI Pulse GL66 12UEK | |
| MSI Katana GF66 12UGS | |
| AIDA64 / FPU Julia | |
| Media de la clase Gaming (51376 - 238426, n=108, últimos 2 años) | |
| Schenker XMG Core 15 (M22) | |
| Lenovo Legion 5 15IAH7H 82RB | |
| MSI Katana 15 B12VEK | |
| Medio Intel Core i7-12650H (26386 - 76434, n=14) | |
| Asus TUF Gaming F15 FX507ZM | |
| MSI Pulse GL66 12UEK | |
| MSI Katana GF66 12UGS | |
| AIDA64 / CPU SHA3 | |
| Media de la clase Gaming (2180 - 9817, n=108, últimos 2 años) | |
| Lenovo Legion 5 15IAH7H 82RB | |
| Schenker XMG Core 15 (M22) | |
| Asus TUF Gaming F15 FX507ZM | |
| MSI Katana 15 B12VEK | |
| MSI Pulse GL66 12UEK | |
| MSI Katana GF66 12UGS | |
| Medio Intel Core i7-12650H (1479 - 3244, n=14) | |
| AIDA64 / CPU Queen | |
| Media de la clase Gaming (49785 - 173351, n=96, últimos 2 años) | |
| MSI Pulse GL66 12UEK | |
| Lenovo Legion 5 15IAH7H 82RB | |
| MSI Katana GF66 12UGS | |
| Asus TUF Gaming F15 FX507ZM | |
| Schenker XMG Core 15 (M22) | |
| MSI Katana 15 B12VEK | |
| Medio Intel Core i7-12650H (59278 - 89537, n=14) | |
| AIDA64 / FPU SinJulia | |
| Media de la clase Gaming (4424 - 33636, n=108, últimos 2 años) | |
| Schenker XMG Core 15 (M22) | |
| Lenovo Legion 5 15IAH7H 82RB | |
| MSI Pulse GL66 12UEK | |
| Asus TUF Gaming F15 FX507ZM | |
| MSI Katana GF66 12UGS | |
| MSI Katana 15 B12VEK | |
| Medio Intel Core i7-12650H (4690 - 8726, n=14) | |
| AIDA64 / FPU Mandel | |
| Media de la clase Gaming (25115 - 128721, n=108, últimos 2 años) | |
| Schenker XMG Core 15 (M22) | |
| Lenovo Legion 5 15IAH7H 82RB | |
| MSI Katana 15 B12VEK | |
| Medio Intel Core i7-12650H (15001 - 37738, n=14) | |
| Asus TUF Gaming F15 FX507ZM | |
| MSI Pulse GL66 12UEK | |
| MSI Katana GF66 12UGS | |
| AIDA64 / CPU AES | |
| Lenovo Legion 5 15IAH7H 82RB | |
| Media de la clase Gaming (39258 - 247074, n=108, últimos 2 años) | |
| MSI Pulse GL66 12UEK | |
| MSI Katana GF66 12UGS | |
| Schenker XMG Core 15 (M22) | |
| MSI Katana 15 B12VEK | |
| Asus TUF Gaming F15 FX507ZM | |
| Medio Intel Core i7-12650H (32702 - 92530, n=14) | |
| AIDA64 / CPU ZLib | |
| Media de la clase Gaming (574 - 2531, n=108, últimos 2 años) | |
| Asus TUF Gaming F15 FX507ZM | |
| Lenovo Legion 5 15IAH7H 82RB | |
| MSI Pulse GL66 12UEK | |
| MSI Katana GF66 12UGS | |
| Schenker XMG Core 15 (M22) | |
| MSI Katana 15 B12VEK | |
| Medio Intel Core i7-12650H (443 - 891, n=14) | |
| AIDA64 / FP64 Ray-Trace | |
| Media de la clase Gaming (5509 - 45446, n=108, últimos 2 años) | |
| Lenovo Legion 5 15IAH7H 82RB | |
| Schenker XMG Core 15 (M22) | |
| MSI Katana 15 B12VEK | |
| Medio Intel Core i7-12650H (3096 - 8448, n=14) | |
| Asus TUF Gaming F15 FX507ZM | |
| MSI Pulse GL66 12UEK | |
| MSI Katana GF66 12UGS | |
| AIDA64 / CPU PhotoWorxx | |
| Media de la clase Gaming (12271 - 89891, n=108, últimos 2 años) | |
| MSI Katana 15 B12VEK | |
| Lenovo Legion 5 15IAH7H 82RB | |
| Asus TUF Gaming F15 FX507ZM | |
| Medio Intel Core i7-12650H (22046 - 44164, n=14) | |
| Schenker XMG Core 15 (M22) | |
| MSI Katana GF66 12UGS | |
| MSI Pulse GL66 12UEK | |
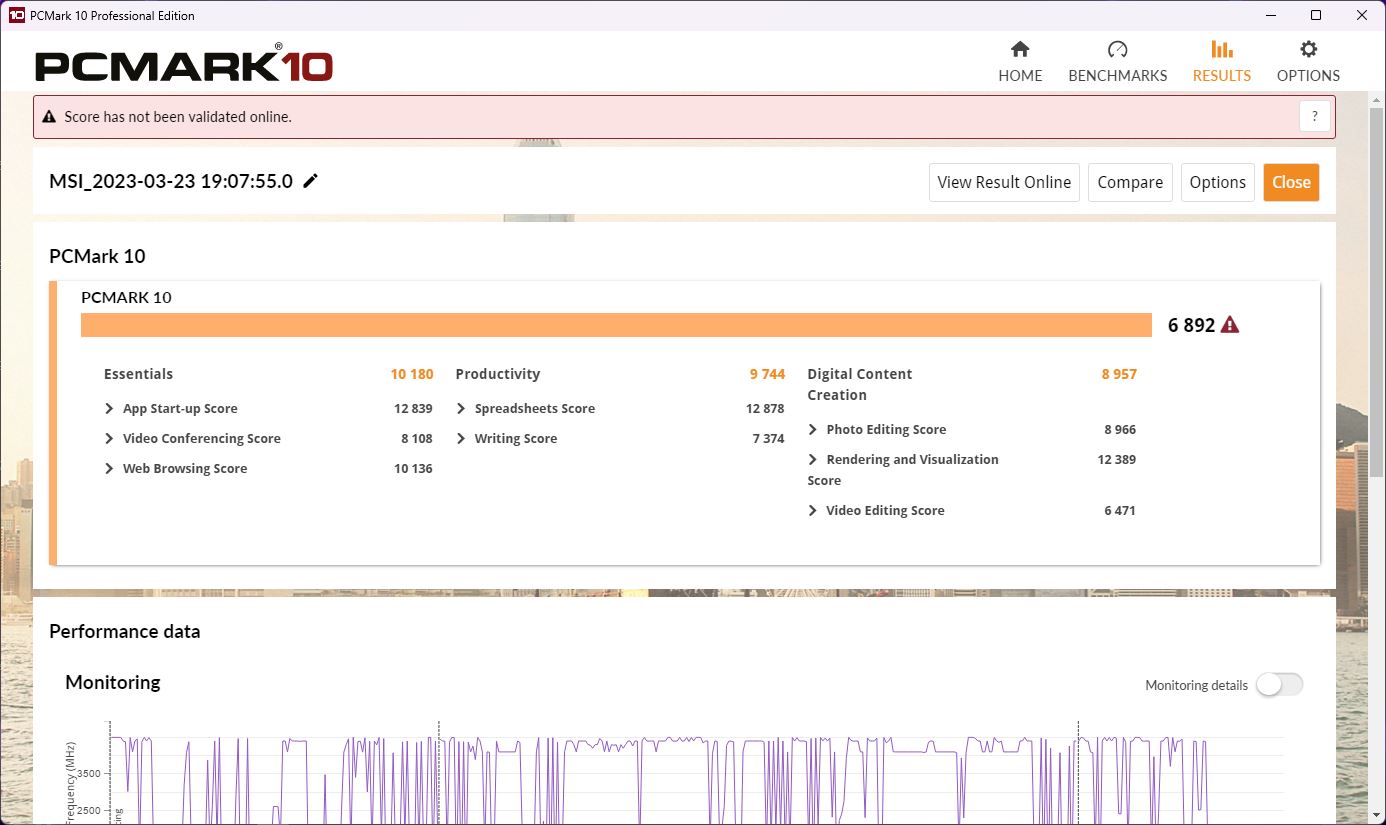
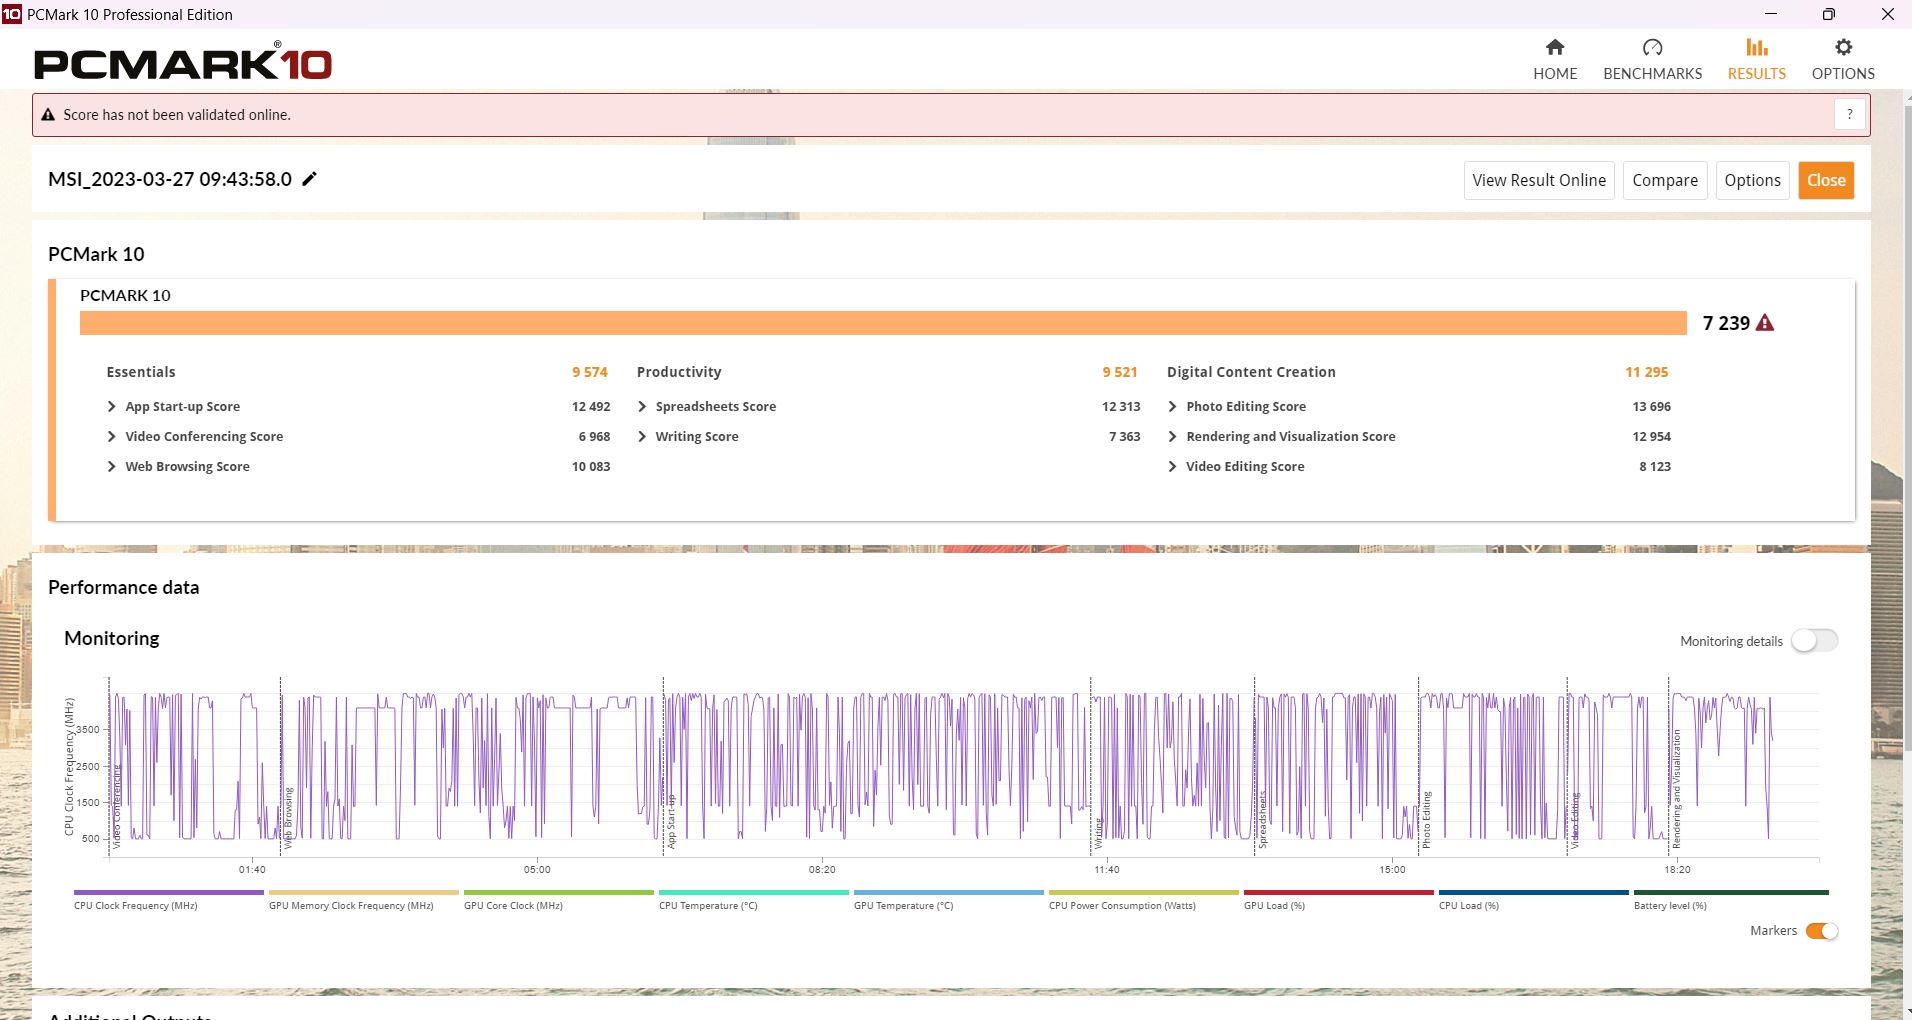
Rendimiento del sistema
Como era de esperar, la Katana no puede diferenciarse de sus modelos hermanosGF66 o GL66 en términos de rendimiento del sistema. En comparación, alcanza una puntuación bastante inferior. La puntuación es mejor con la dGPU activada manualmente, pero no en todas las subpruebas.
CrossMark: Overall | Productivity | Creativity | Responsiveness
| PCMark 10 / Score | |
| Media de la clase Gaming (5828 - 11574, n=96, últimos 2 años) | |
| Lenovo Legion 5 15IAH7H 82RB | |
| MSI Katana GF66 12UGS | |
| Asus TUF Gaming F15 FX507ZM | |
| Schenker XMG Core 15 (M22) | |
| MSI Pulse GL66 12UEK | |
| MSI Katana 15 B12VEK | |
| Medio Intel Core i7-12650H, NVIDIA GeForce RTX 4050 Laptop GPU (n=1) | |
| PCMark 10 / Essentials | |
| Lenovo Legion 5 15IAH7H 82RB | |
| Schenker XMG Core 15 (M22) | |
| Media de la clase Gaming (8810 - 12600, n=100, últimos 2 años) | |
| Asus TUF Gaming F15 FX507ZM | |
| MSI Pulse GL66 12UEK | |
| MSI Katana GF66 12UGS | |
| MSI Katana 15 B12VEK | |
| Medio Intel Core i7-12650H, NVIDIA GeForce RTX 4050 Laptop GPU (n=1) | |
| PCMark 10 / Productivity | |
| Media de la clase Gaming (6845 - 21327, n=98, últimos 2 años) | |
| Lenovo Legion 5 15IAH7H 82RB | |
| MSI Katana GF66 12UGS | |
| MSI Pulse GL66 12UEK | |
| MSI Katana 15 B12VEK | |
| Medio Intel Core i7-12650H, NVIDIA GeForce RTX 4050 Laptop GPU (n=1) | |
| Schenker XMG Core 15 (M22) | |
| Asus TUF Gaming F15 FX507ZM | |
| PCMark 10 / Digital Content Creation | |
| Media de la clase Gaming (7602 - 19657, n=98, últimos 2 años) | |
| Lenovo Legion 5 15IAH7H 82RB | |
| Asus TUF Gaming F15 FX507ZM | |
| MSI Katana GF66 12UGS | |
| Schenker XMG Core 15 (M22) | |
| MSI Pulse GL66 12UEK | |
| MSI Katana 15 B12VEK | |
| Medio Intel Core i7-12650H, NVIDIA GeForce RTX 4050 Laptop GPU (n=1) | |
| CrossMark / Overall | |
| MSI Pulse GL66 12UEK | |
| Lenovo Legion 5 15IAH7H 82RB | |
| Media de la clase Gaming (1366 - 2409, n=96, últimos 2 años) | |
| MSI Katana GF66 12UGS | |
| MSI Katana 15 B12VEK | |
| Medio Intel Core i7-12650H, NVIDIA GeForce RTX 4050 Laptop GPU (n=1) | |
| Schenker XMG Core 15 (M22) | |
| CrossMark / Productivity | |
| MSI Pulse GL66 12UEK | |
| Lenovo Legion 5 15IAH7H 82RB | |
| MSI Katana GF66 12UGS | |
| Media de la clase Gaming (1386 - 2254, n=96, últimos 2 años) | |
| MSI Katana 15 B12VEK | |
| Medio Intel Core i7-12650H, NVIDIA GeForce RTX 4050 Laptop GPU (n=1) | |
| Schenker XMG Core 15 (M22) | |
| CrossMark / Creativity | |
| Media de la clase Gaming (1343 - 2729, n=96, últimos 2 años) | |
| MSI Pulse GL66 12UEK | |
| Lenovo Legion 5 15IAH7H 82RB | |
| MSI Katana GF66 12UGS | |
| MSI Katana 15 B12VEK | |
| Medio Intel Core i7-12650H, NVIDIA GeForce RTX 4050 Laptop GPU (n=1) | |
| Schenker XMG Core 15 (M22) | |
| CrossMark / Responsiveness | |
| MSI Pulse GL66 12UEK | |
| Lenovo Legion 5 15IAH7H 82RB | |
| MSI Katana GF66 12UGS | |
| Media de la clase Gaming (1226 - 2334, n=96, últimos 2 años) | |
| MSI Katana 15 B12VEK | |
| Medio Intel Core i7-12650H, NVIDIA GeForce RTX 4050 Laptop GPU (n=1) | |
| Schenker XMG Core 15 (M22) | |
| PCMark 10 Score | 6892 puntos | |
ayuda | ||
| AIDA64 / Memory Copy | |
| Media de la clase Gaming (21750 - 129946, n=108, últimos 2 años) | |
| MSI Katana 15 B12VEK | |
| Asus TUF Gaming F15 FX507ZM | |
| Lenovo Legion 5 15IAH7H 82RB | |
| Medio Intel Core i7-12650H (43261 - 69735, n=14) | |
| Schenker XMG Core 15 (M22) | |
| MSI Katana GF66 12UGS | |
| MSI Pulse GL66 12UEK | |
| AIDA64 / Memory Read | |
| Media de la clase Gaming (22956 - 118858, n=108, últimos 2 años) | |
| MSI Katana 15 B12VEK | |
| Lenovo Legion 5 15IAH7H 82RB | |
| Asus TUF Gaming F15 FX507ZM | |
| Medio Intel Core i7-12650H (47313 - 67412, n=14) | |
| Schenker XMG Core 15 (M22) | |
| MSI Pulse GL66 12UEK | |
| MSI Katana GF66 12UGS | |
| AIDA64 / Memory Write | |
| Media de la clase Gaming (22297 - 135096, n=108, últimos 2 años) | |
| Lenovo Legion 5 15IAH7H 82RB | |
| Asus TUF Gaming F15 FX507ZM | |
| MSI Katana 15 B12VEK | |
| Schenker XMG Core 15 (M22) | |
| Medio Intel Core i7-12650H (45617 - 59361, n=14) | |
| MSI Katana GF66 12UGS | |
| MSI Pulse GL66 12UEK | |
| AIDA64 / Memory Latency | |
| Media de la clase Gaming (75.3 - 259, n=108, últimos 2 años) | |
| Lenovo Legion 5 15IAH7H 82RB | |
| MSI Katana GF66 12UGS | |
| MSI Katana 15 B12VEK | |
| MSI Pulse GL66 12UEK | |
| Schenker XMG Core 15 (M22) | |
| Medio Intel Core i7-12650H (71.6 - 103.9, n=14) | |
| Asus TUF Gaming F15 FX507ZM | |
* ... más pequeño es mejor
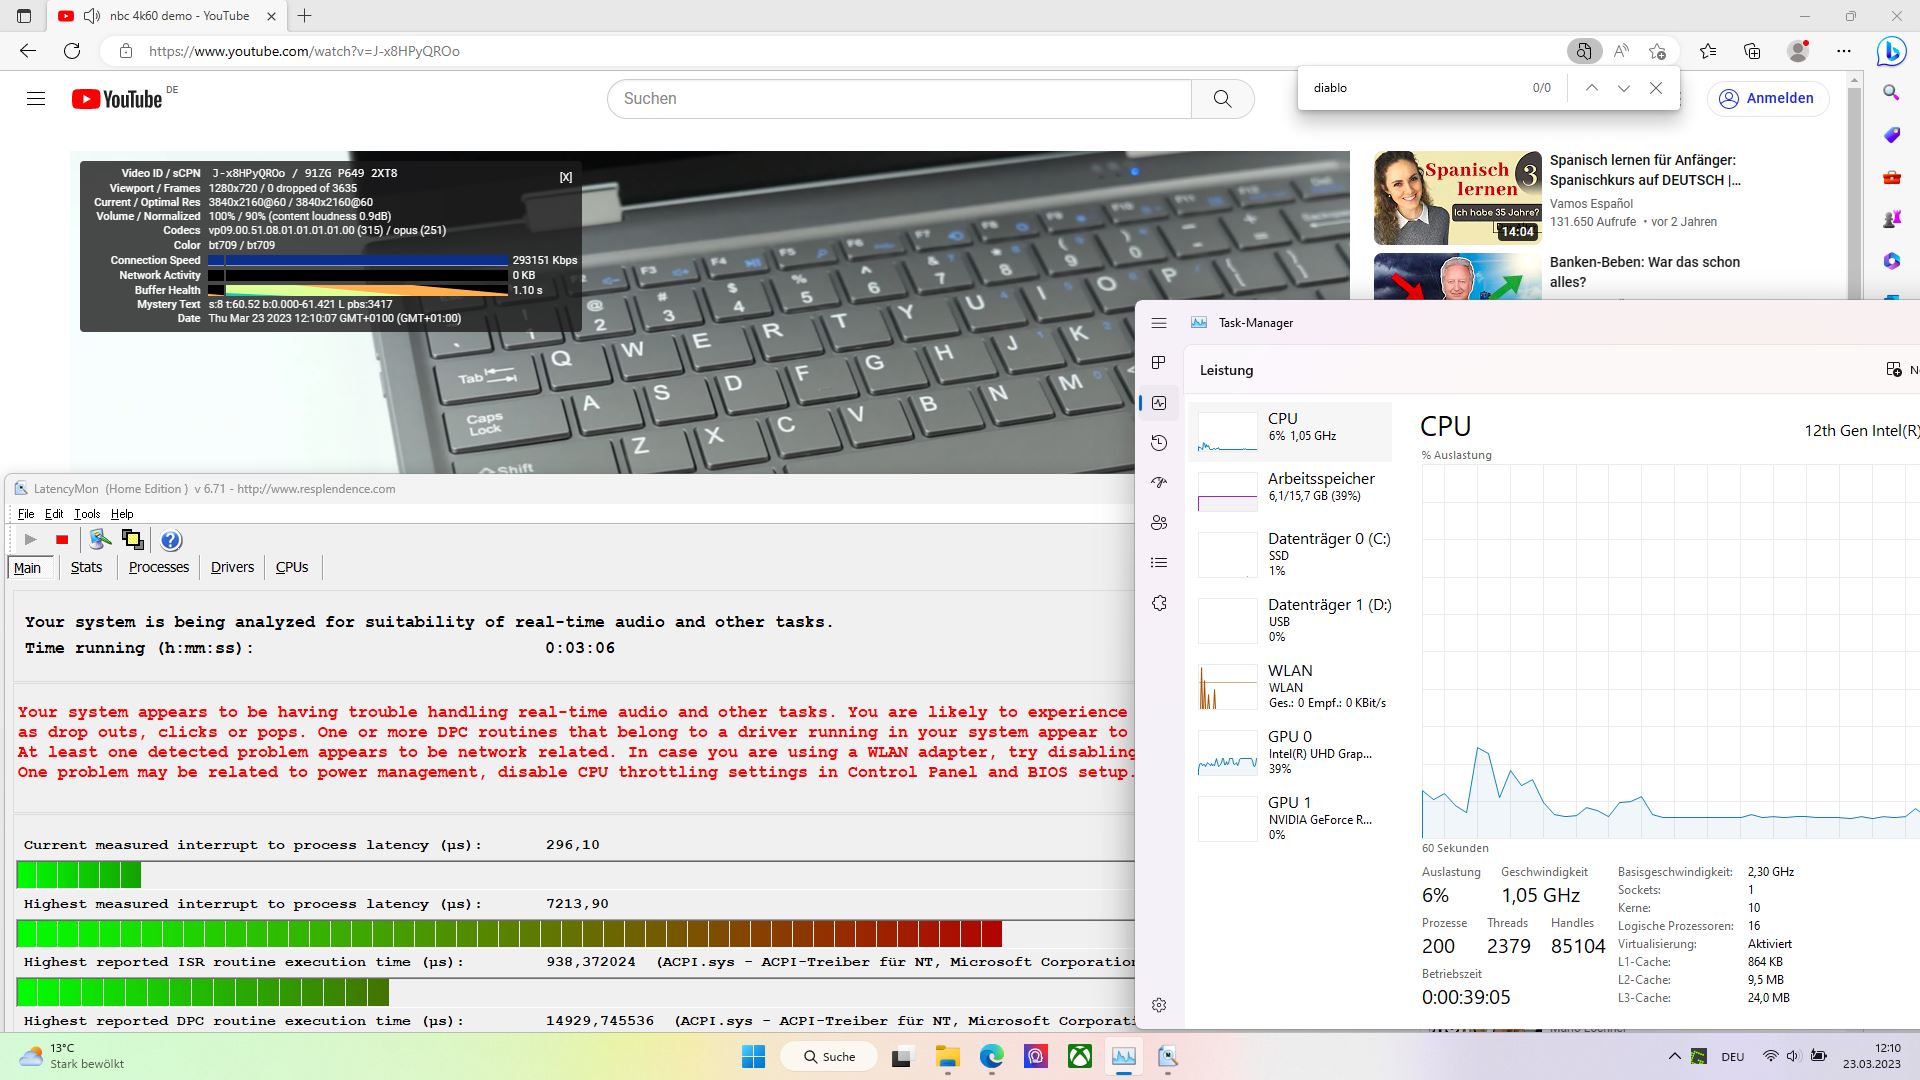
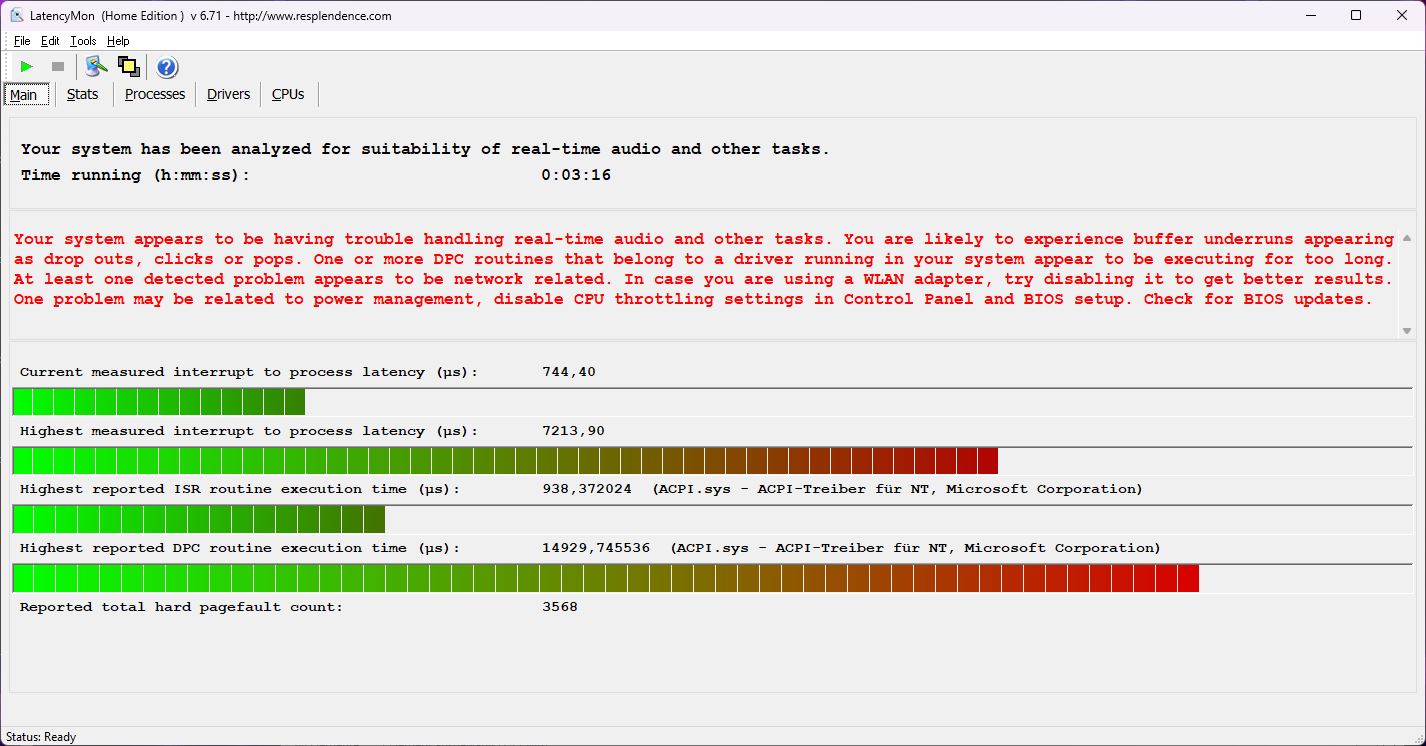
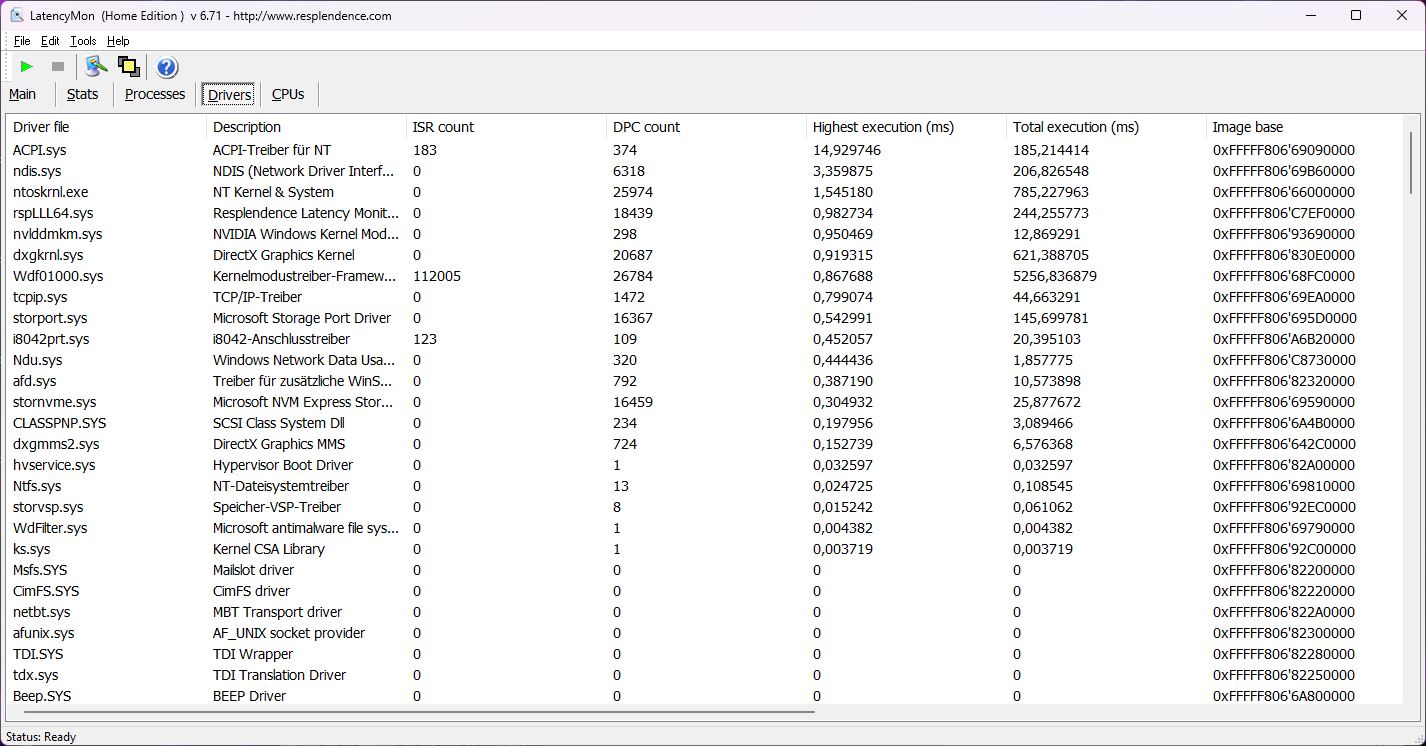
Latencia del CPD
Actualmente, los controladores Nvidia para portátiles con una tarjeta RTX 40xx siguen teniendo latencias muy altas bajo LatencyMon y nuestra Katana no es una excepción. Las primeras latencias aparecen nada más iniciar la herramienta. Abrir varias pestañas del navegador y reproducir nuestro vídeo 4K/60 fps de YouTube empuja el valor bruscamente hacia arriba. Pero no se saltaron fotogramas.
| DPC Latencies / LatencyMon - interrupt to process latency (max), Web, Youtube, Prime95 | |
| MSI Katana 15 B12VEK | |
| Schenker XMG Core 15 (M22) | |
| MSI Pulse GL66 12UEK | |
| Lenovo Legion 5 15IAH7H 82RB | |
| Asus TUF Gaming F15 FX507ZM | |
| MSI Katana GF66 12UGS | |
* ... más pequeño es mejor
Dispositivos de almacenamiento
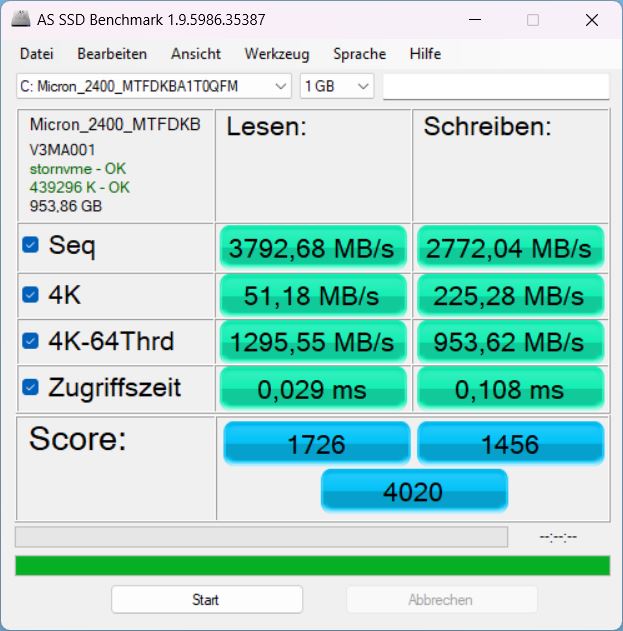
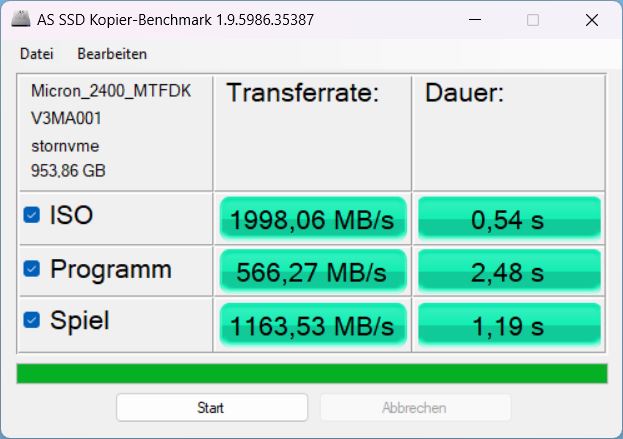
Un SSD NVMe PCIe 4.0 x4 de 1 TB de Micron sirve como dispositivo de almacenamiento principal. En el Katana, no aprovecha del todo su potencial de rendimiento y queda muy por detrás de los modelos Micron 2450 delKatana GF66 o el Pulse GL66.
Al menos su rendimiento es relativamente constante, disminuyendo sólo mínimamente tras largos periodos de tiempo. Puede encontrar más información sobre este modelo en nuestra Lista de superventas SSD.

* ... más pequeño es mejor
Sustained Read Performance: DiskSpd Read Loop, Queue Depth 8
Tarjeta gráfica
En Nvidia Geforce RTX 4050es la tarjeta de entrada de la nueva generación RTX 40xx. Su rendimiento debería estar más o menos a la par con una antigua RTX 3060dependiendo del TGP seleccionado (en este caso 105 W), aunque las pruebas actuales sugieren que la tarjeta apenas se beneficia de más de 100 W.
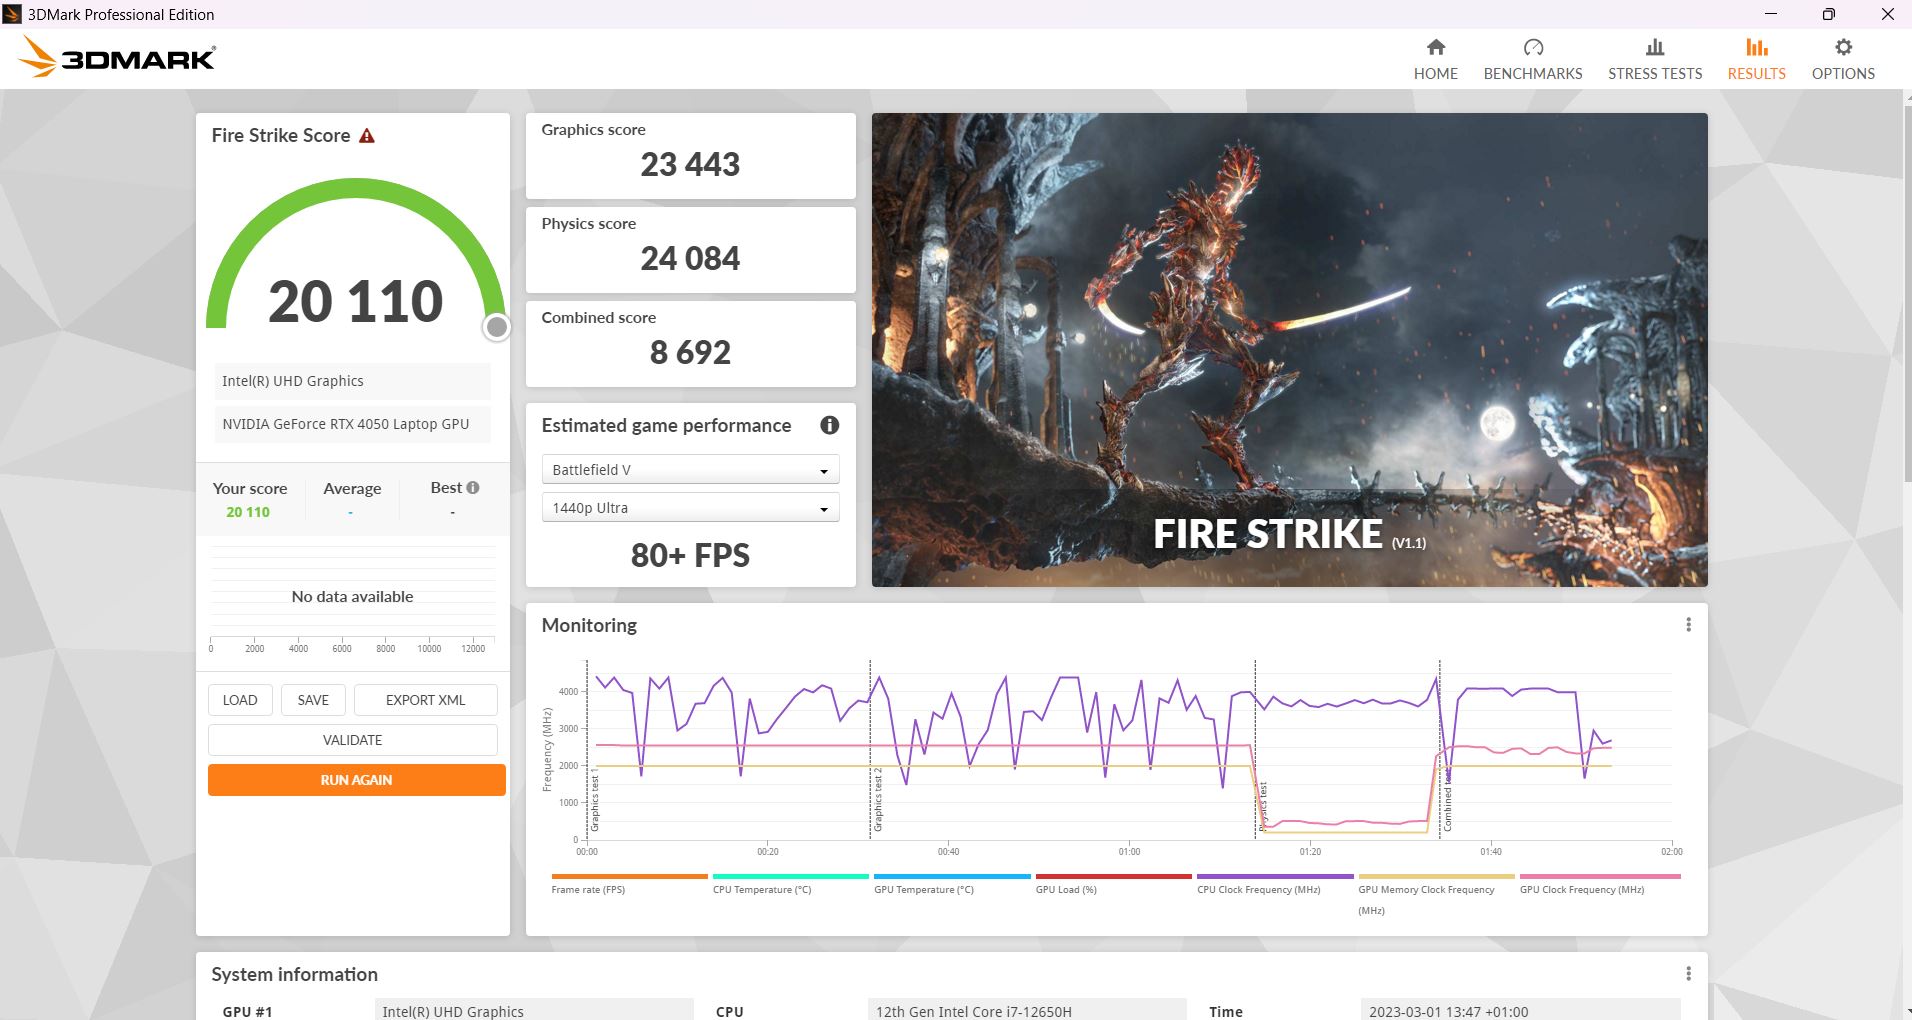
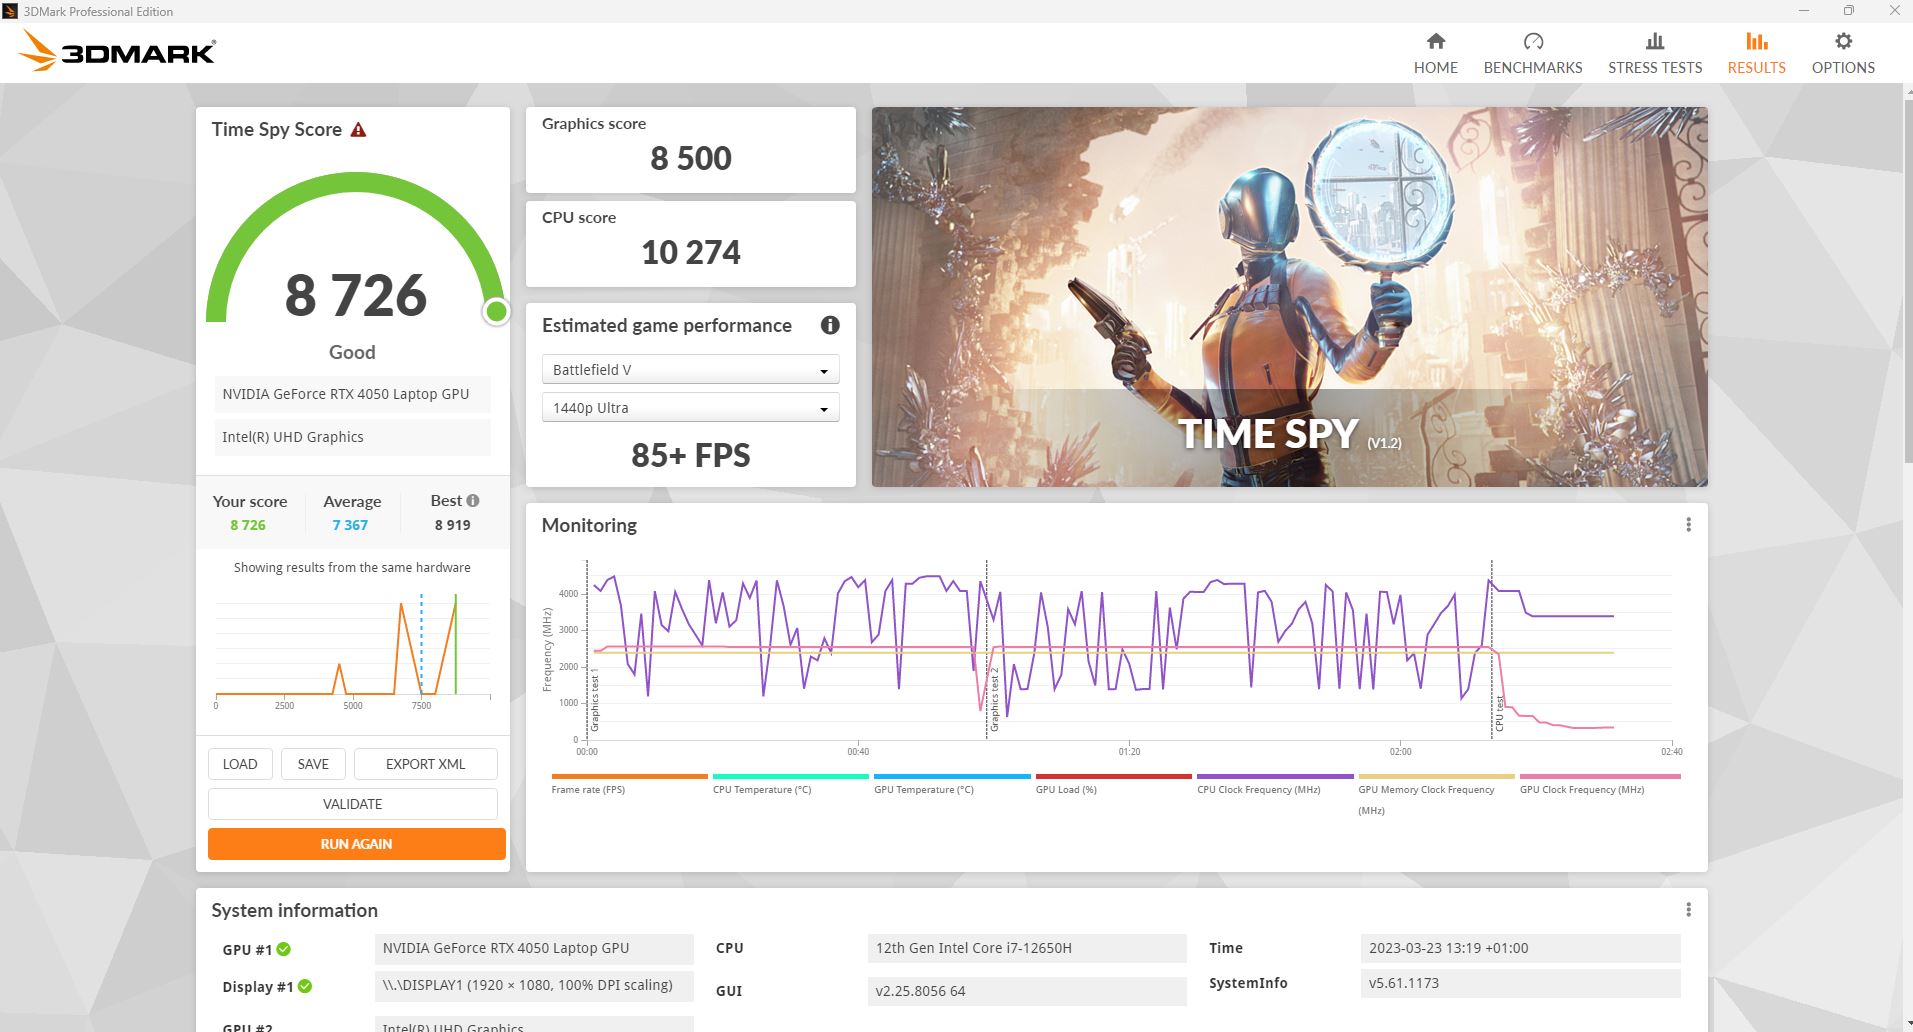
En el 3DMarks sintético, la GPU rinde más o menos al nivel esperado y se sitúa justo por delante de la competencia del año pasado con la RTX 3060. LaKatana GF66 con la RTX 3070 Tisólo está un 10% por delante.
Lejos del enchufe, por supuesto, el rendimiento se resiente. En otra ejecución de Fire Strike en modo batería, la Katana sólo alcanzó 14.446 puntos gráficos en lugar de los 23.443 puntos cuando estaba enchufada.
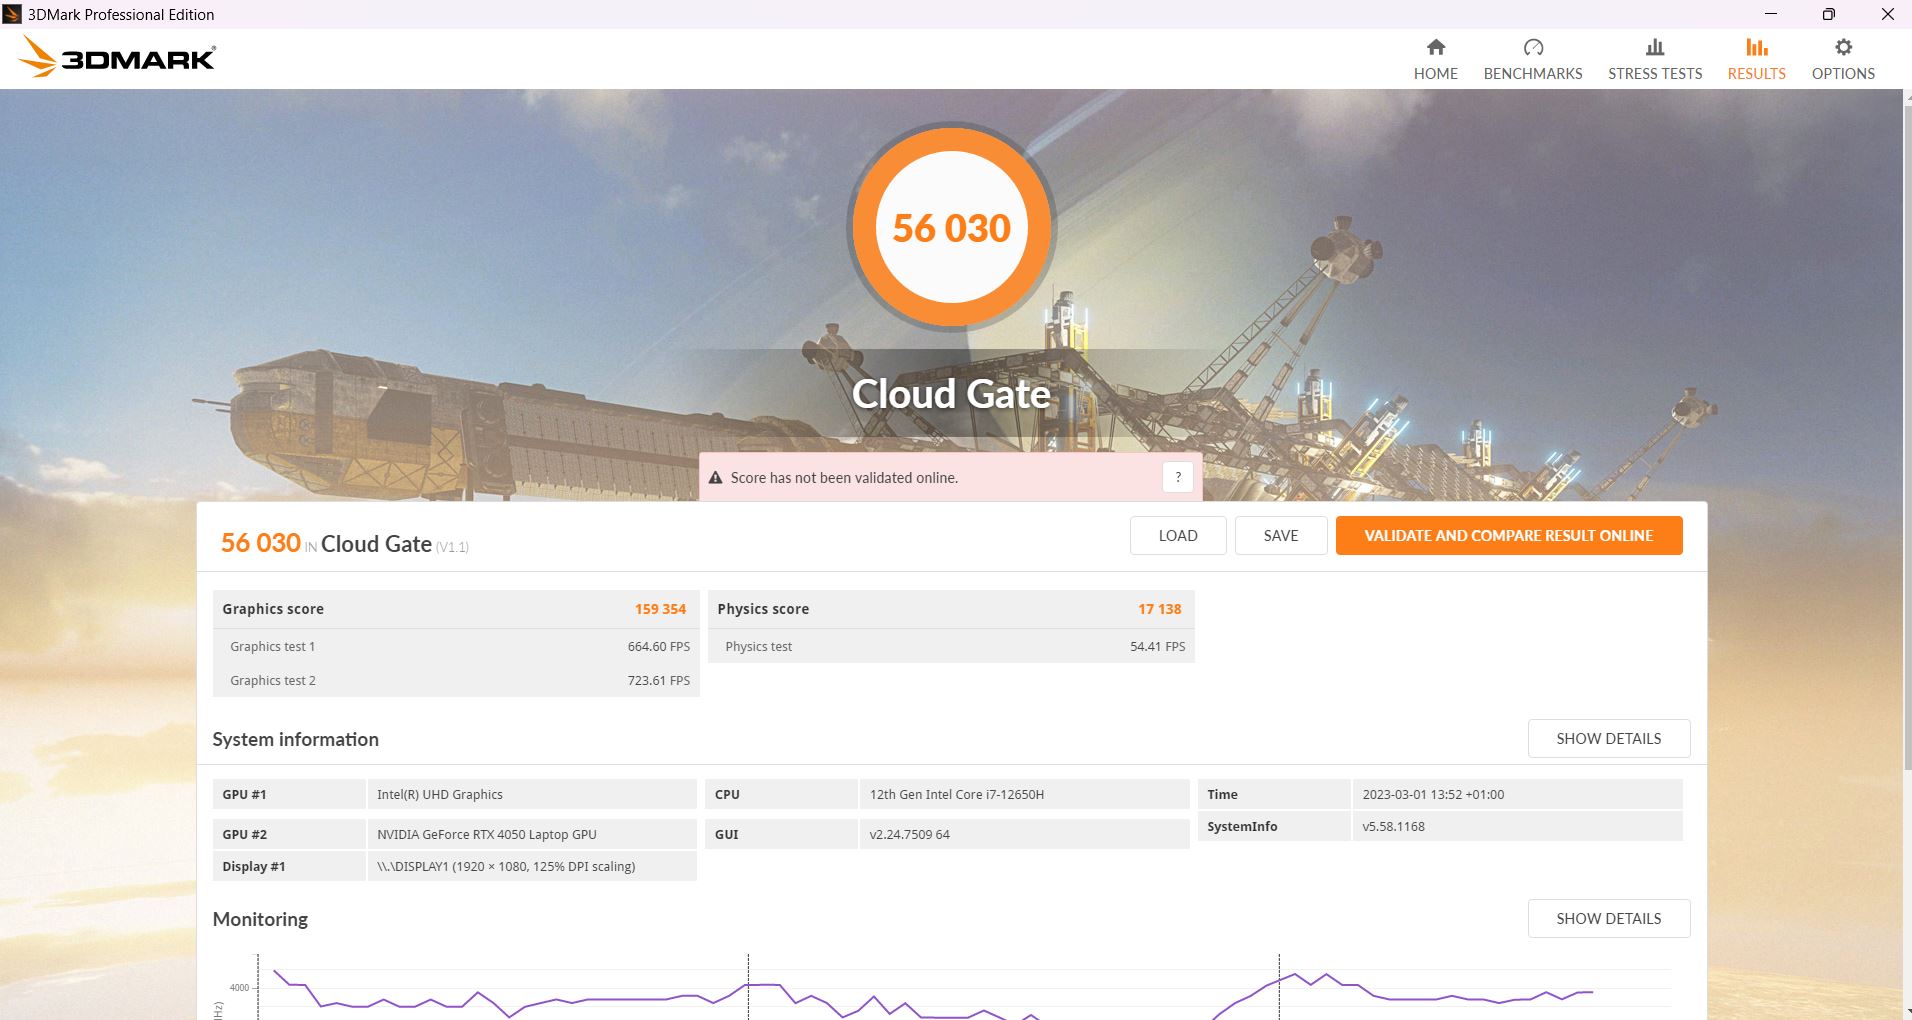
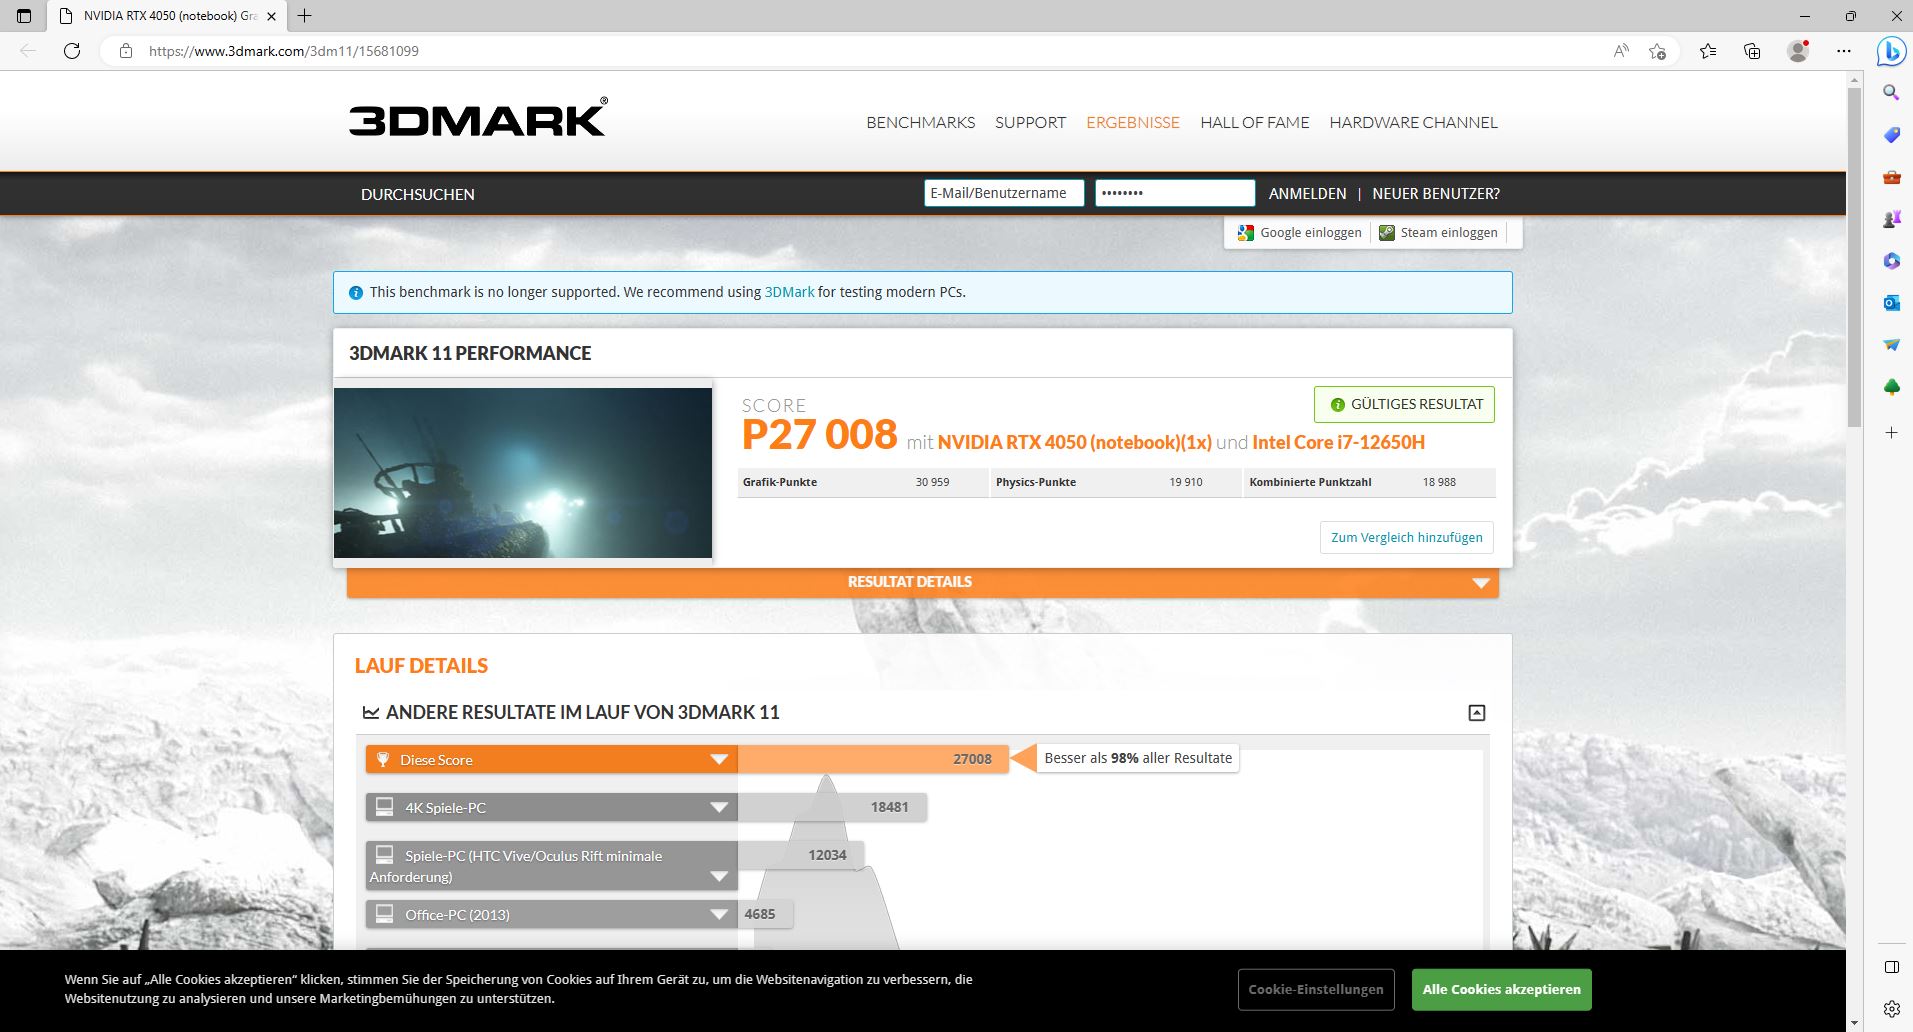
| 3DMark 11 Performance | 27008 puntos | |
| 3DMark Cloud Gate Standard Score | 56030 puntos | |
| 3DMark Fire Strike Score | 20110 puntos | |
| 3DMark Time Spy Score | 8726 puntos | |
ayuda | ||
* ... más pequeño es mejor
Rendimiento en juegos
En los benchmarks de juegos, el Katana 15 tiende a asumir un rango inferior en comparación con la competencia directa. Sólo elXMG Core 15 con su RTX 3060es ligeramente más lento, mientras que el Pulse GL66 con una RTX 3060 es casi igual de rápido. El Legion 5 en particular, también con una RTX 3060, es notablemente más rápido.
En Far Cry 5, por otro lado, el Katana está incluso ligeramente por delante de la competencia. Así que también depende mucho del juego al que juegues.
| The Witcher 3 - 1920x1080 Ultra Graphics & Postprocessing (HBAO+) | |
| Media de la clase Gaming (95 - 240, n=8, últimos 2 años) | |
| MSI Katana GF66 12UGS | |
| Asus TUF Gaming F15 FX507ZM | |
| Lenovo Legion 5 15IAH7H 82RB | |
| MSI Katana 15 B12VEK | |
| Schenker XMG Core 15 (M22) | |
| MSI Pulse GL66 12UEK | |
| GTA V - 1920x1080 Highest AA:4xMSAA + FX AF:16x | |
| Media de la clase Gaming (48.3 - 186.9, n=99, últimos 2 años) | |
| Lenovo Legion 5 15IAH7H 82RB | |
| MSI Katana GF66 12UGS | |
| Asus TUF Gaming F15 FX507ZM | |
| Schenker XMG Core 15 (M22) | |
| MSI Katana 15 B12VEK | |
| Final Fantasy XV Benchmark - 1920x1080 High Quality | |
| Media de la clase Gaming (41 - 215, n=100, últimos 2 años) | |
| Lenovo Legion 5 15IAH7H 82RB | |
| Asus TUF Gaming F15 FX507ZM | |
| Schenker XMG Core 15 (M22) | |
| MSI Katana GF66 12UGS | |
| MSI Katana 15 B12VEK | |
| Strange Brigade - 1920x1080 ultra AA:ultra AF:16 | |
| Media de la clase Gaming (76.3 - 456, n=90, últimos 2 años) | |
| MSI Katana GF66 12UGS | |
| Lenovo Legion 5 15IAH7H 82RB | |
| Asus TUF Gaming F15 FX507ZM | |
| Schenker XMG Core 15 (M22) | |
| MSI Katana 15 B12VEK | |
| Dota 2 Reborn - 1920x1080 ultra (3/3) best looking | |
| Lenovo Legion 5 15IAH7H 82RB | |
| Media de la clase Gaming (84.8 - 248, n=111, últimos 2 años) | |
| Asus TUF Gaming F15 FX507ZM | |
| MSI Pulse GL66 12UEK | |
| MSI Katana 15 B12VEK | |
| MSI Katana GF66 12UGS | |
| Schenker XMG Core 15 (M22) | |
Hay disponible un interruptor MUX, que permite elegir entre la iGPU o la dGPU en el MSI Center, lo que siempre implica un reinicio.
La tasa de frames de Witcher 3 se mantiene estable dentro de las fluctuaciones habituales (ciclo día/noche en el juego). Pero los portátiles de la competencia suelen ser ligeramente más rápidos, incluso los que tienen la RTX 3060.
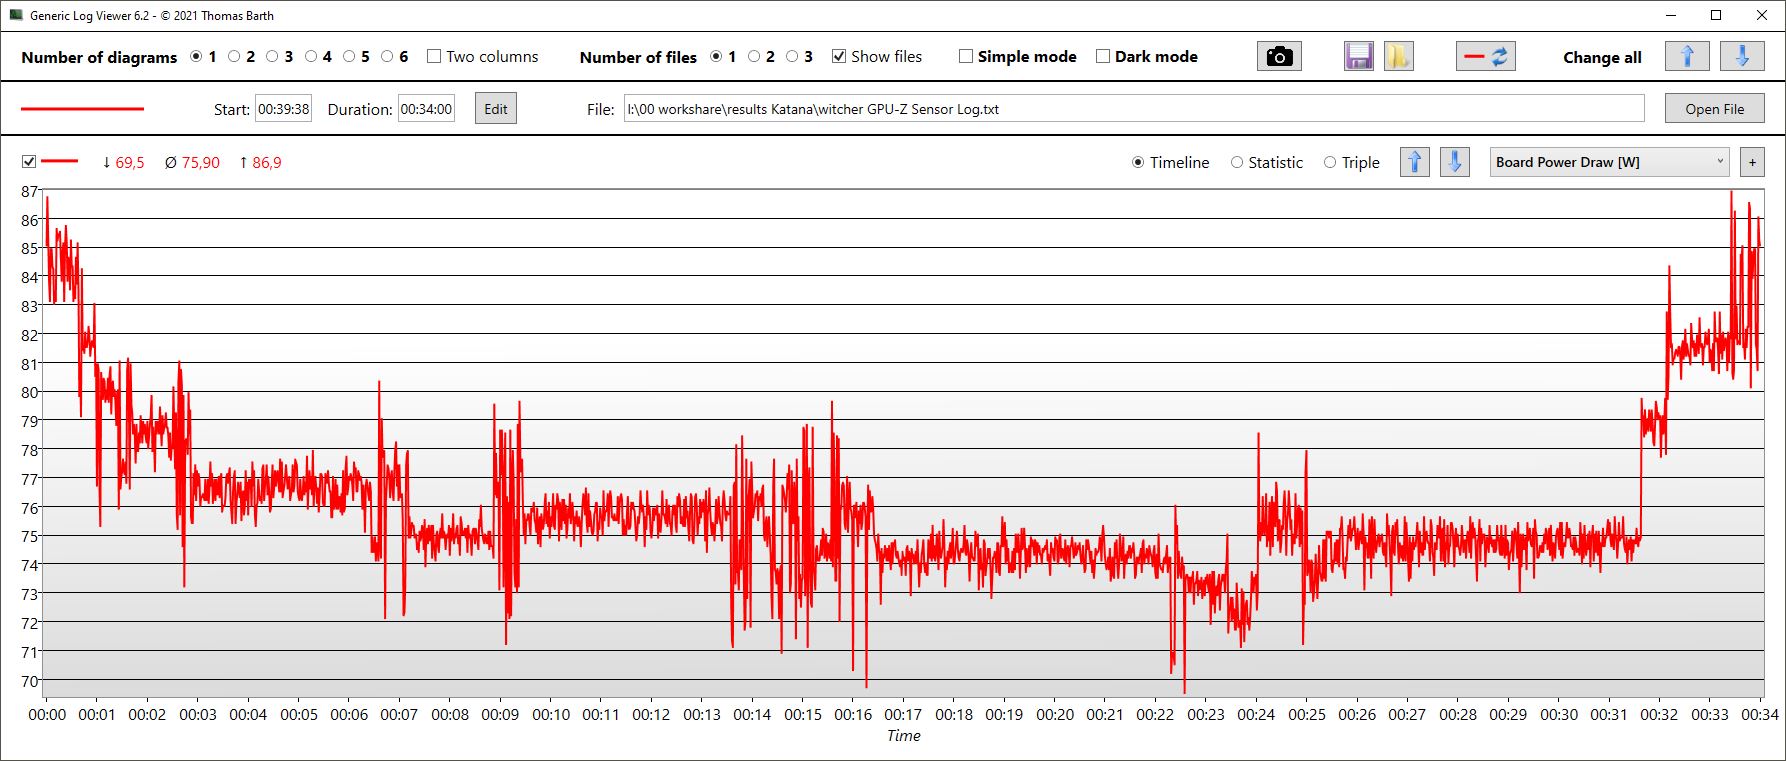
La frecuencia de reloj de la GPU es bastante estable a 2.4 GHz, y la de la memoria también es constante a 2 GHz. Las temperaturas de la GPU no superan los 76 °C y rondan los 75 °C de media. El consumo de energía de 76 W de media queda lejos de los 105 W especificados.
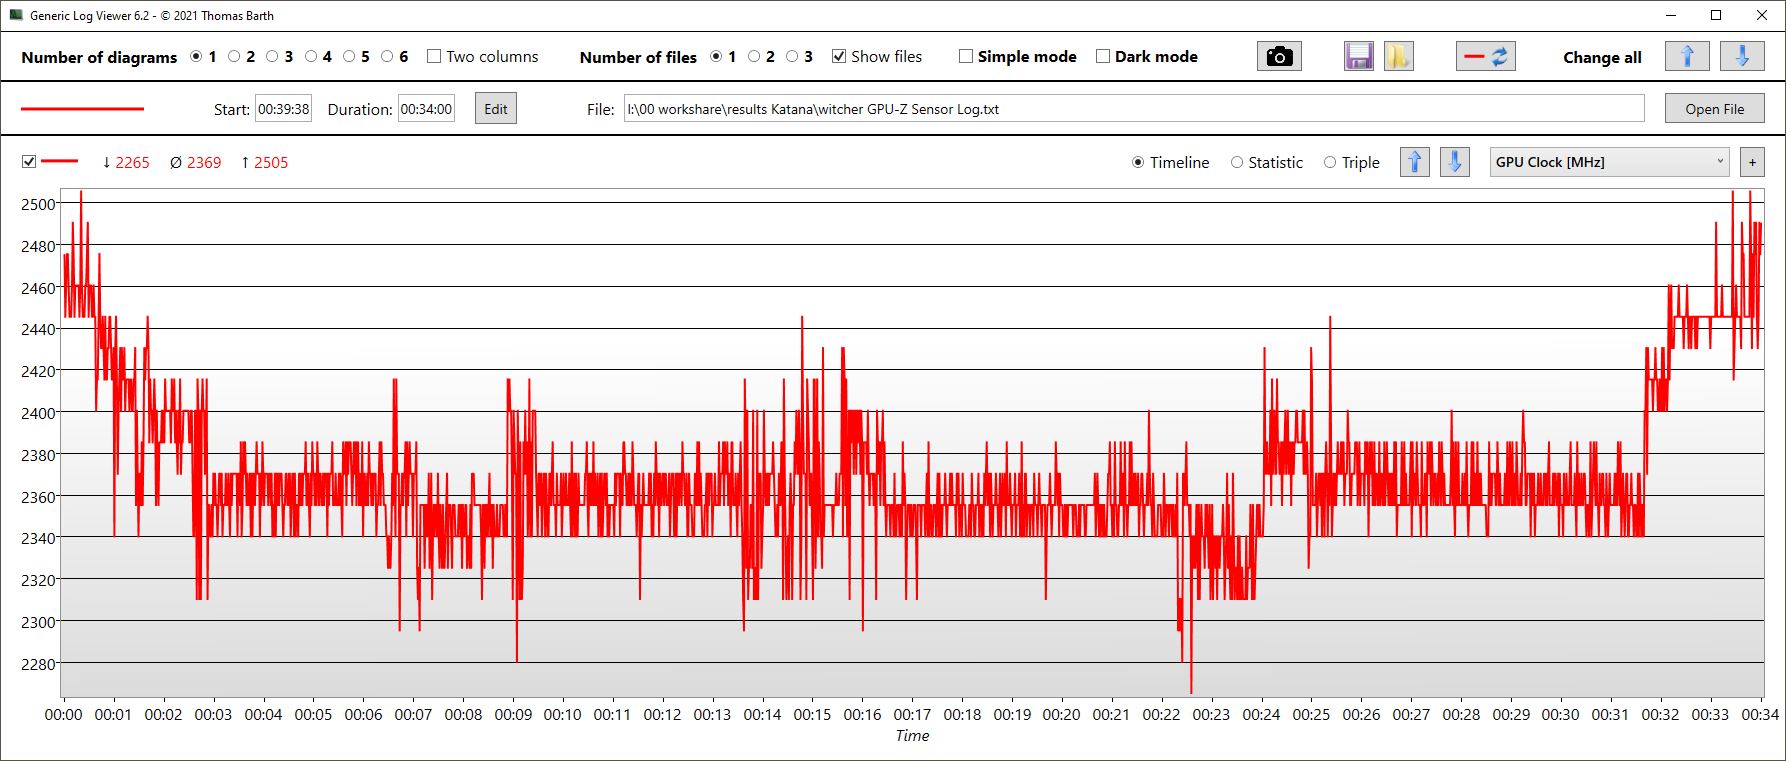
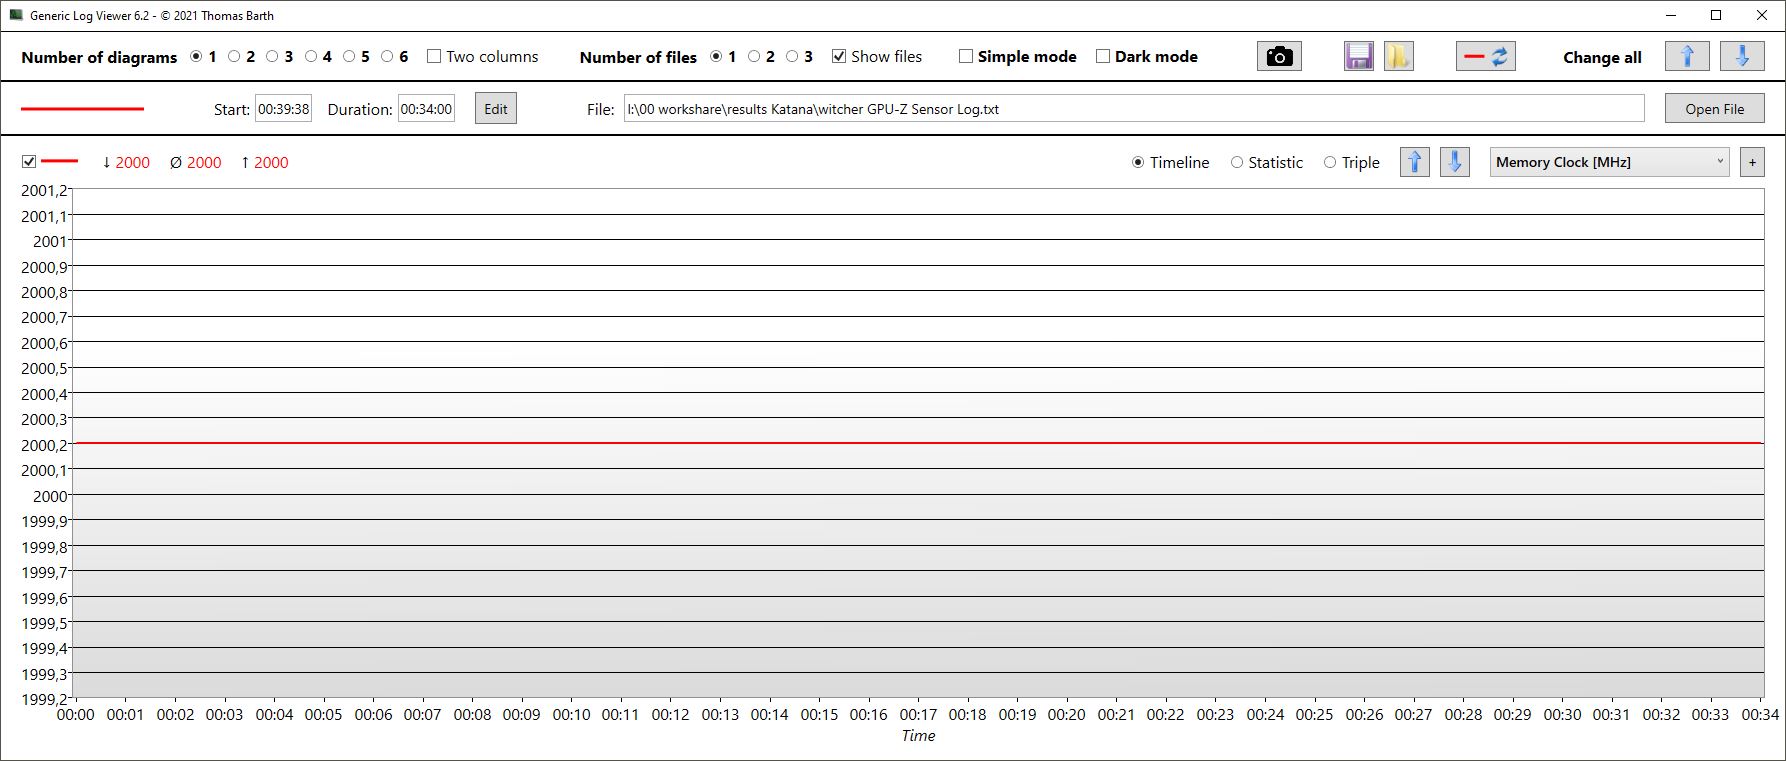
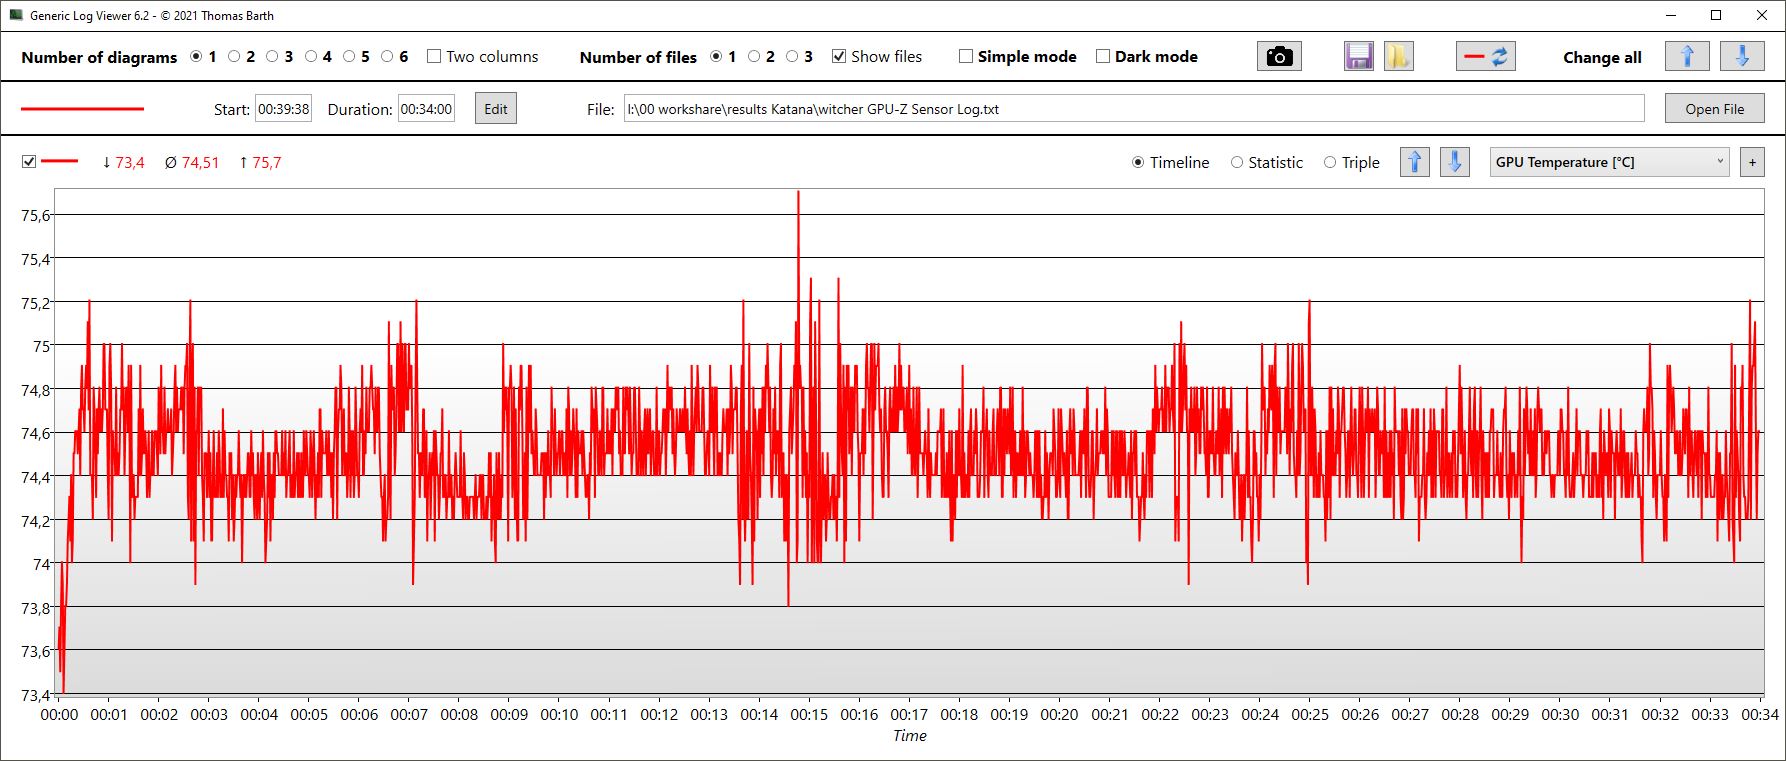
Witcher 3 FPS Chart
| bajo | medio | alto | ultra | |
|---|---|---|---|---|
| GTA V (2015) | 183.5 | 176.6 | 172.7 | 92.2 |
| The Witcher 3 (2015) | 395 | 293 | 161 | 83 |
| Dota 2 Reborn (2015) | 175.1 | 158.1 | 150.5 | 142.5 |
| Final Fantasy XV Benchmark (2018) | 188 | 120.7 | 82.8 | |
| X-Plane 11.11 (2018) | 139.9 | 122.4 | 97 | |
| Far Cry 5 (2018) | 170 | 135 | 126 | 119 |
| Strange Brigade (2018) | 214 | 173 | 148.7 | |
| Dying Light 2 (2022) | 122.1 | 75.2 | 62.4 |
Emisiones - En la tranquilidad reside el poder de la espada
Ruido
En reposo en el escritorio, los ventiladores son casi silenciosos, incluso en modo de Rendimiento Extremo, lo que no es habitual. E incluso en 3DMark06, los ventiladores arrancan relativamente tarde y sólo alcanzan los 37,7 dB al final del primer escenario de pruebas. Sólo los Legion 5es más silencioso, el Asus TUF Gaming es igual de silencioso, mientras que los modelos hermanos y el XMG Core son más ruidosos.
El moderado desarrollo de ruido también es evidente en juegos (modo AI), y el Katana sólo se vuelve ruidoso durante el estrés combinado CPU/GPU.
Ruido
| Ocioso |
| 24 / 24 / 24 dB(A) |
| Carga |
| 37.71 / 54.55 dB(A) |
 | ||
30 dB silencioso 40 dB(A) audible 50 dB(A) ruidosamente alto |
||
min: | ||
| MSI Katana 15 B12VEK GeForce RTX 4050 Laptop GPU, i7-12650H, Micron 2400 MTFDKBA1T0QFM | MSI Katana GF66 12UGS GeForce RTX 3070 Ti Laptop GPU, i7-12700H, Micron 2450 1TB MTFDKBA1T0TFK | MSI Pulse GL66 12UEK GeForce RTX 3060 Laptop GPU, i9-12900H, Micron 2450 512GB MTFDKBA512TFK | Lenovo Legion 5 15IAH7H 82RB GeForce RTX 3060 Laptop GPU, i7-12700H | Asus TUF Gaming F15 FX507ZM GeForce RTX 3060 Laptop GPU, i7-12700H, SK Hynix HFM001TD3JX013N | Schenker XMG Core 15 (M22) GeForce RTX 3060 Laptop GPU, R7 6800H, Samsung SSD 980 Pro 1TB MZ-V8P1T0BW | |
|---|---|---|---|---|---|---|
| Noise | -9% | -11% | 1% | -3% | -2% | |
| apagado / medio ambiente * (dB) | 24 | 26 -8% | 23 4% | 23.3 3% | 23.2 3% | 23 4% |
| Idle Minimum * (dB) | 24 | 27 -13% | 23 4% | 23.5 2% | 23.6 2% | 23 4% |
| Idle Average * (dB) | 24 | 28 -17% | 27 -13% | 23.5 2% | 23.6 2% | 23 4% |
| Idle Maximum * (dB) | 24 | 31 -29% | 27 -13% | 26.8 -12% | 25.4 -6% | 23 4% |
| Load Average * (dB) | 37.71 | 44 -17% | 48.2 -28% | 29.3 22% | 38 -1% | 42.41 -12% |
| Witcher 3 ultra * (dB) | 45.75 | 44 4% | 56.9 -24% | 51.4 -12% | 54.1 -18% | 54.71 -20% |
| Load Maximum * (dB) | 54.55 | 45 18% | 56.94 -4% | 53 3% | 57.2 -5% | 55.05 -1% |
* ... más pequeño es mejor
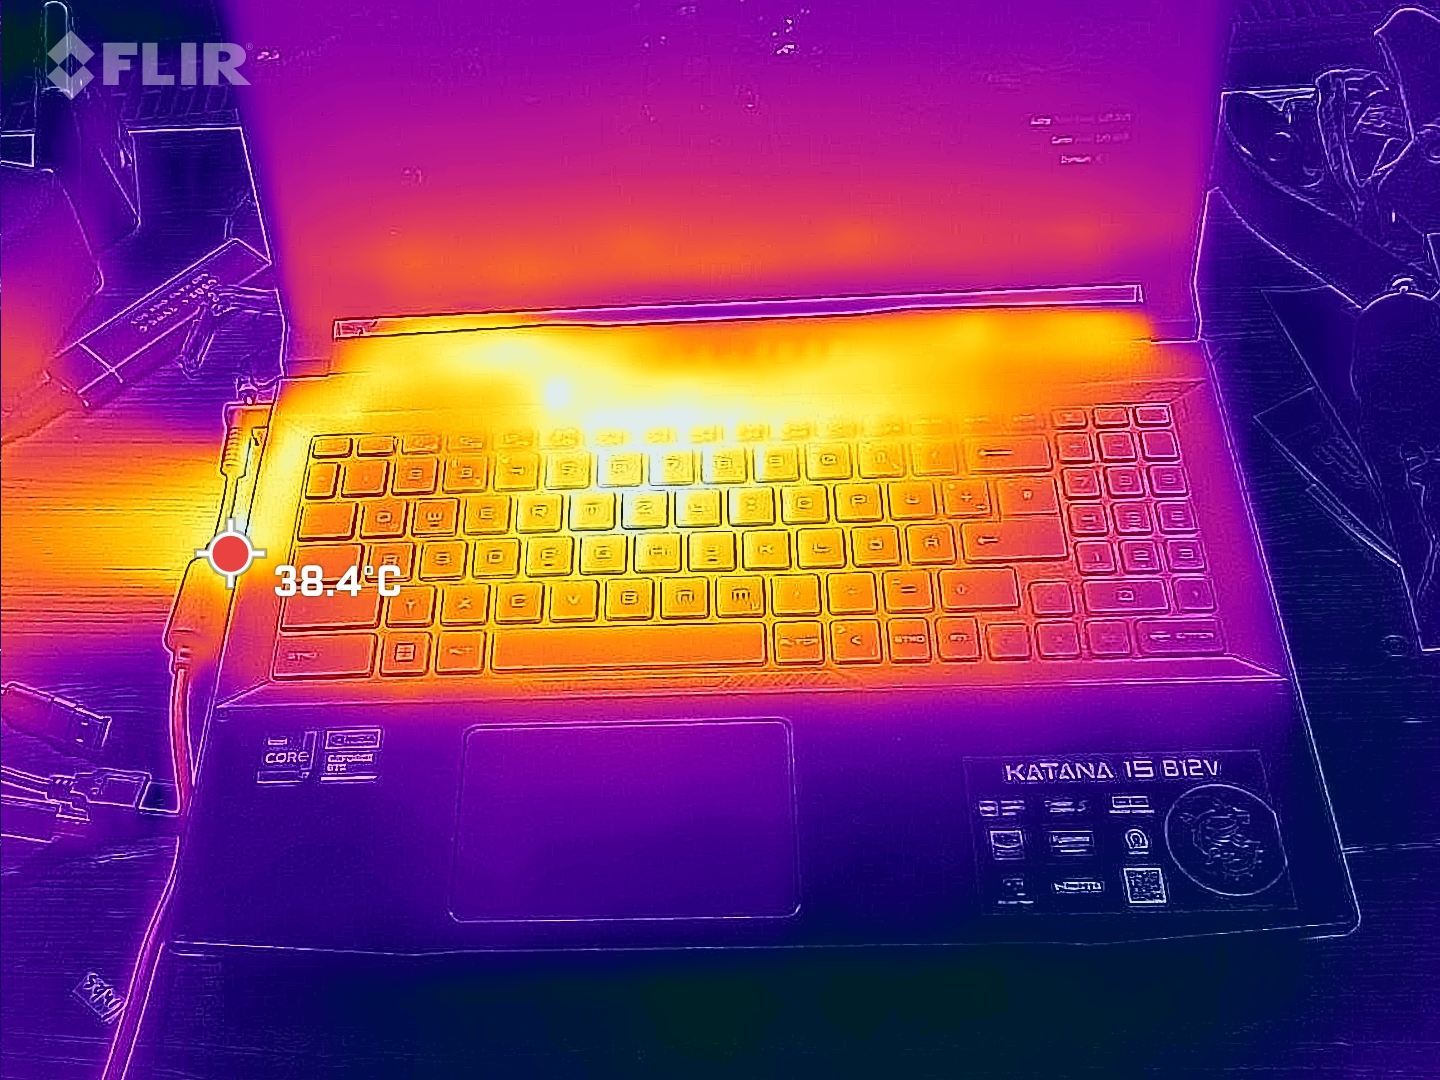
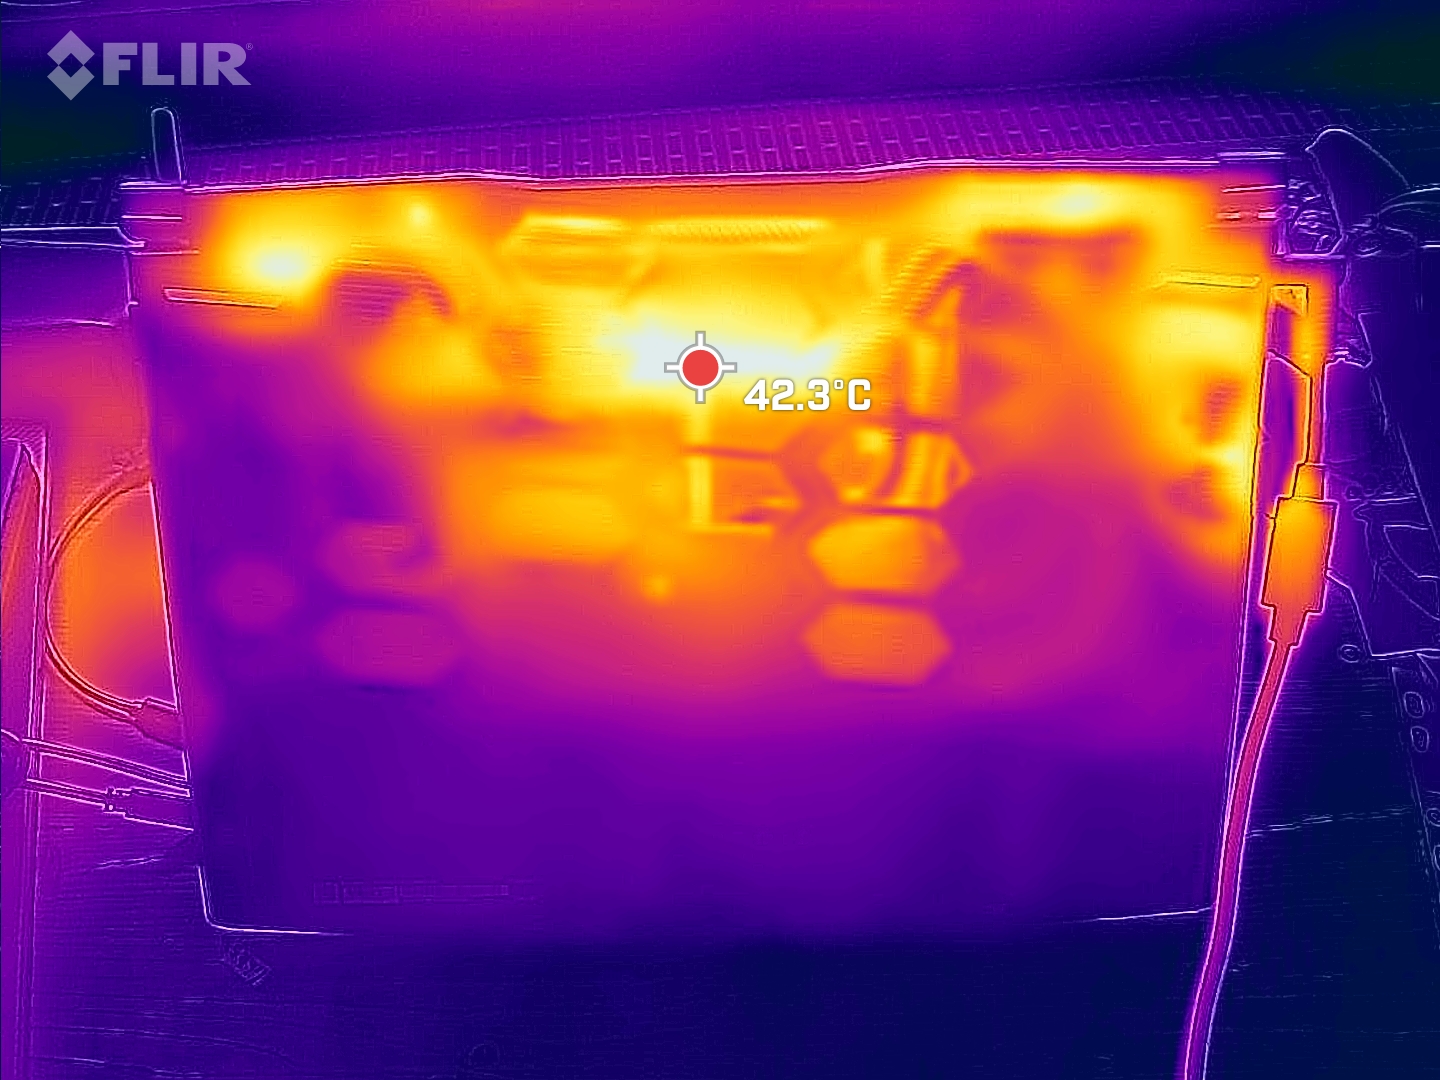
Temperatura
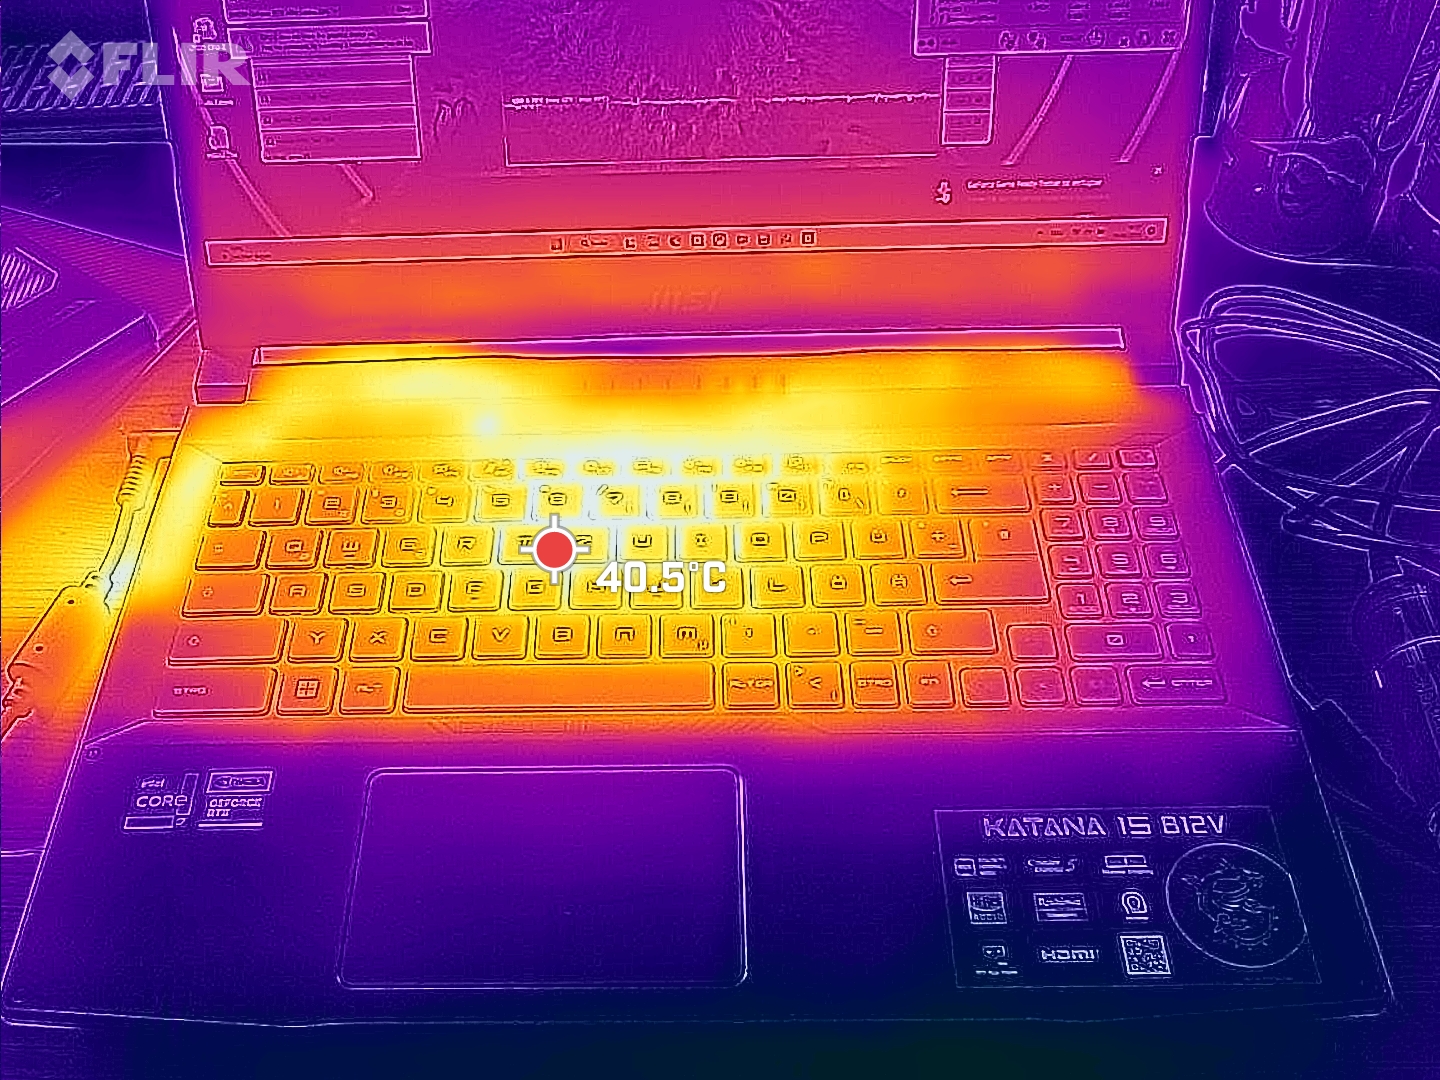
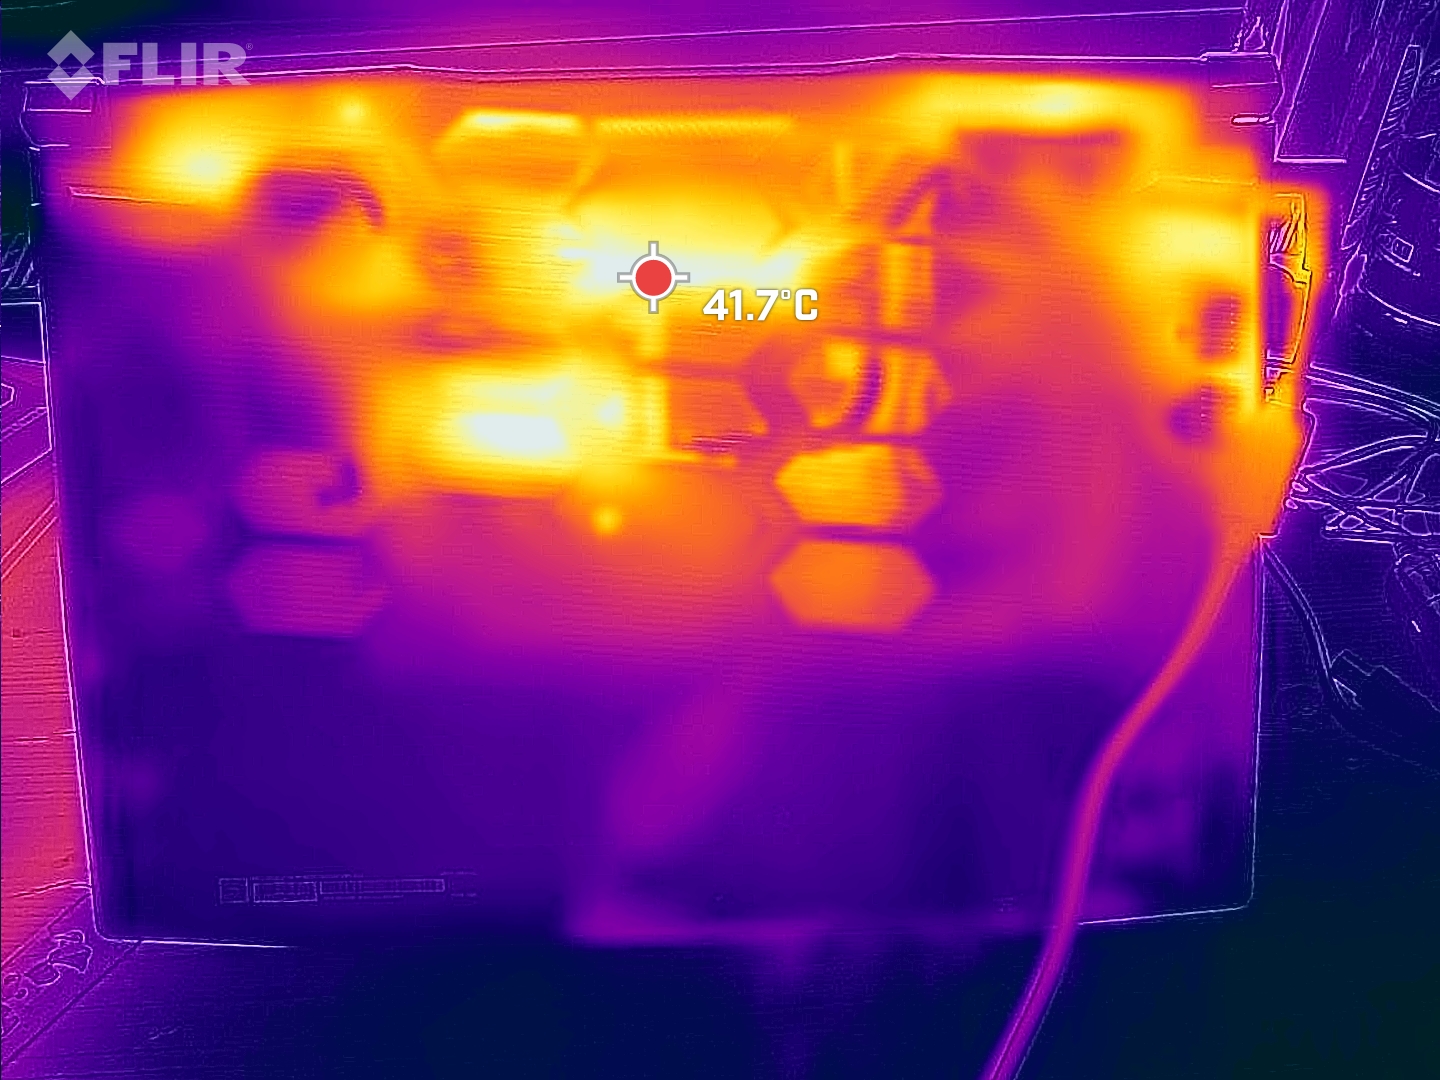
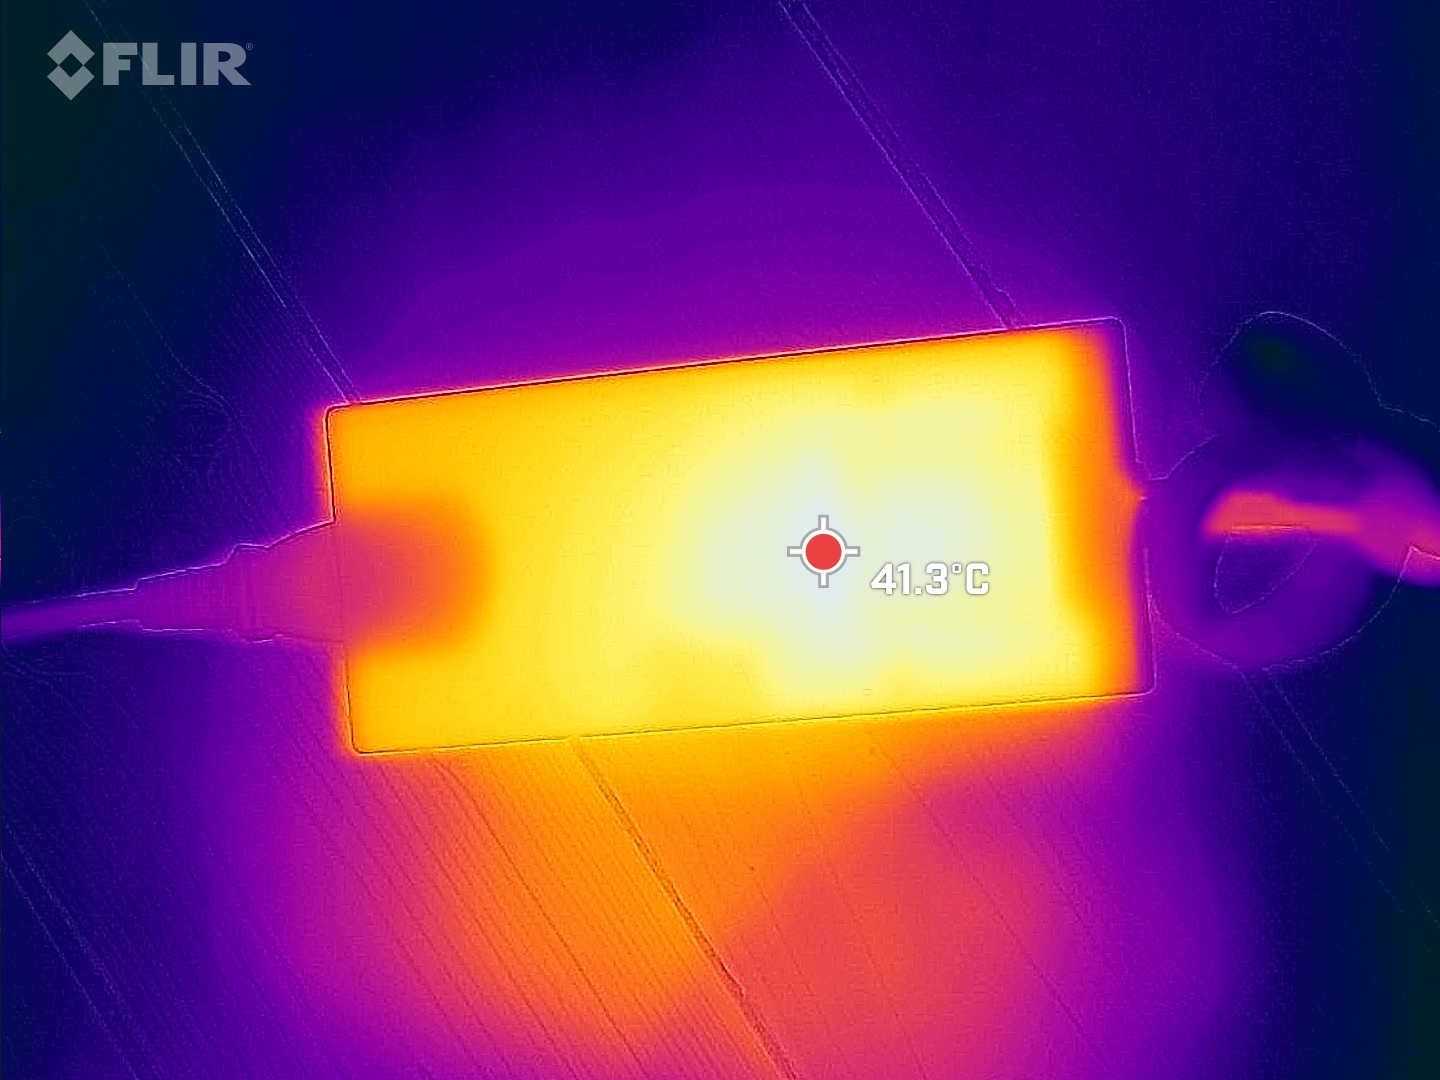
Los puntos calientes están justo por debajo de los 50 °C en el centro hacia la parte trasera. Los reposamanos permanecen frescos en todo momento, pero las teclas WASD pueden calentarse un poco incómodamente bajo mucho estrés.
(-) La temperatura máxima en la parte superior es de 47 °C / 117 F, frente a la media de 40.4 °C / 105 F, que oscila entre 21.2 y 68.8 °C para la clase Gaming.
(-) El fondo se calienta hasta un máximo de 48 °C / 118 F, frente a la media de 43.2 °C / 110 F
(+) En reposo, la temperatura media de la parte superior es de 29 °C / 84# F, frente a la media del dispositivo de 33.9 °C / 93 F.
(±) Jugando a The Witcher 3, la temperatura media de la parte superior es de 35 °C / 95 F, frente a la media del dispositivo de 33.9 °C / 93 F.
(+) El reposamanos y el panel táctil están a una temperatura inferior a la de la piel, con un máximo de 23 °C / 73.4 F y, por tanto, son fríos al tacto.
(+) La temperatura media de la zona del reposamanos de dispositivos similares fue de 28.8 °C / 83.8 F (+5.8 °C / 10.4 F).
| MSI Katana 15 B12VEK Intel Core i7-12650H, NVIDIA GeForce RTX 4050 Laptop GPU | MSI Katana GF66 12UGS Intel Core i7-12700H, NVIDIA GeForce RTX 3070 Ti Laptop GPU | MSI Pulse GL66 12UEK Intel Core i9-12900H, NVIDIA GeForce RTX 3060 Laptop GPU | Lenovo Legion 5 15IAH7H 82RB Intel Core i7-12700H, NVIDIA GeForce RTX 3060 Laptop GPU | Asus TUF Gaming F15 FX507ZM Intel Core i7-12700H, NVIDIA GeForce RTX 3060 Laptop GPU | Schenker XMG Core 15 (M22) AMD Ryzen 7 6800H, NVIDIA GeForce RTX 3060 Laptop GPU | |
|---|---|---|---|---|---|---|
| Heat | -17% | -2% | 16% | -2% | 6% | |
| Maximum Upper Side * (°C) | 47 | 61 -30% | 50 -6% | 37.8 20% | 44.4 6% | 48 -2% |
| Maximum Bottom * (°C) | 48 | 55 -15% | 47 2% | 51 -6% | 48.8 -2% | 51 -6% |
| Idle Upper Side * (°C) | 35 | 43 -23% | 36 -3% | 25.8 26% | 37.8 -8% | 28 20% |
| Idle Bottom * (°C) | 38 | 38 -0% | 38 -0% | 28.8 24% | 39.6 -4% | 33 13% |
* ... más pequeño es mejor
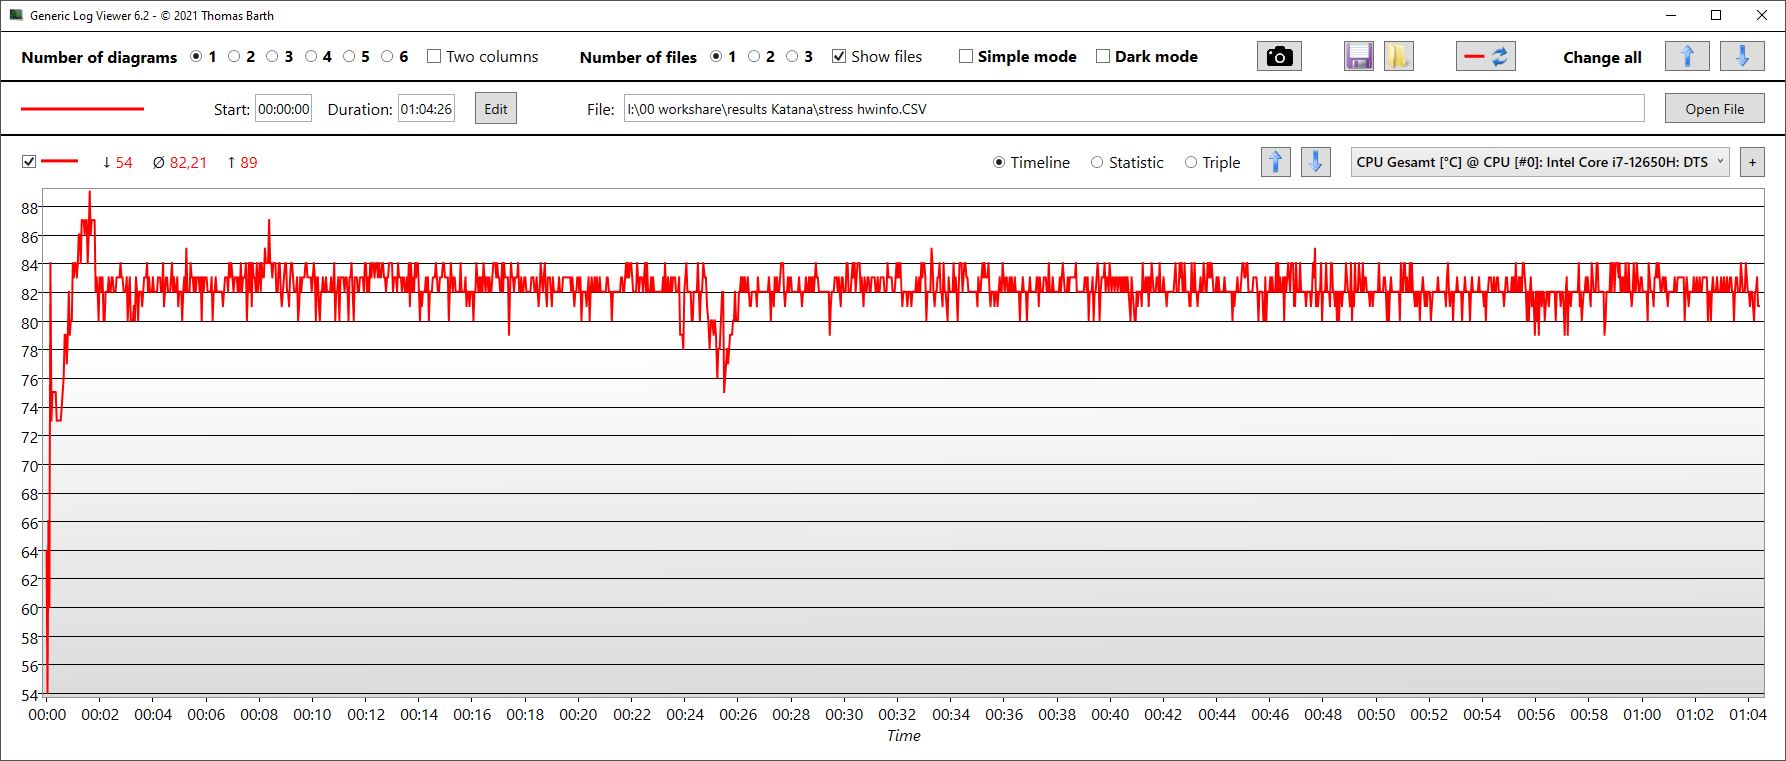
Prueba de resistencia
Los núcleos comienzan nuestra prueba de estrés a 3,1 GHz muy brevemente. Tras unos segundos, las temperaturas de los núcleos suben hasta los 89 °C, tras lo cual las frecuencias de reloj descienden y alcanzan una media estable de 2,5 GHz. El consumo medio es de 50 W. Las temperaturas se estabilizan en torno a los 82 °C
El reloj de la GPU fluctúa entre 2 y 2,5 GHz. Se alcanzan temperaturas medias de 75 °C, mientras que el consumo de energía ronda los 62 W.
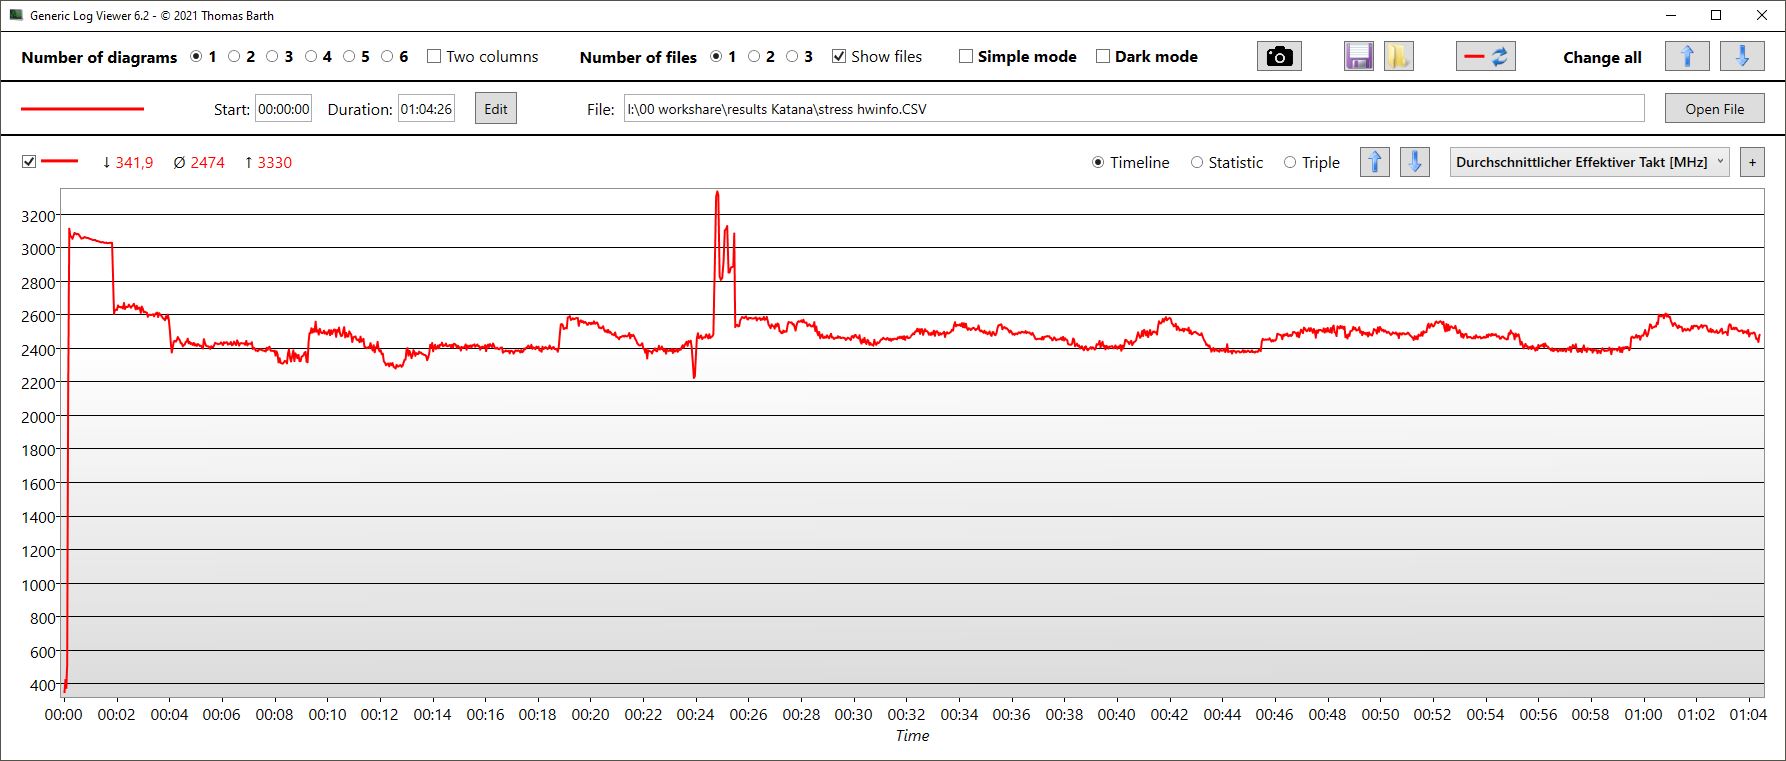
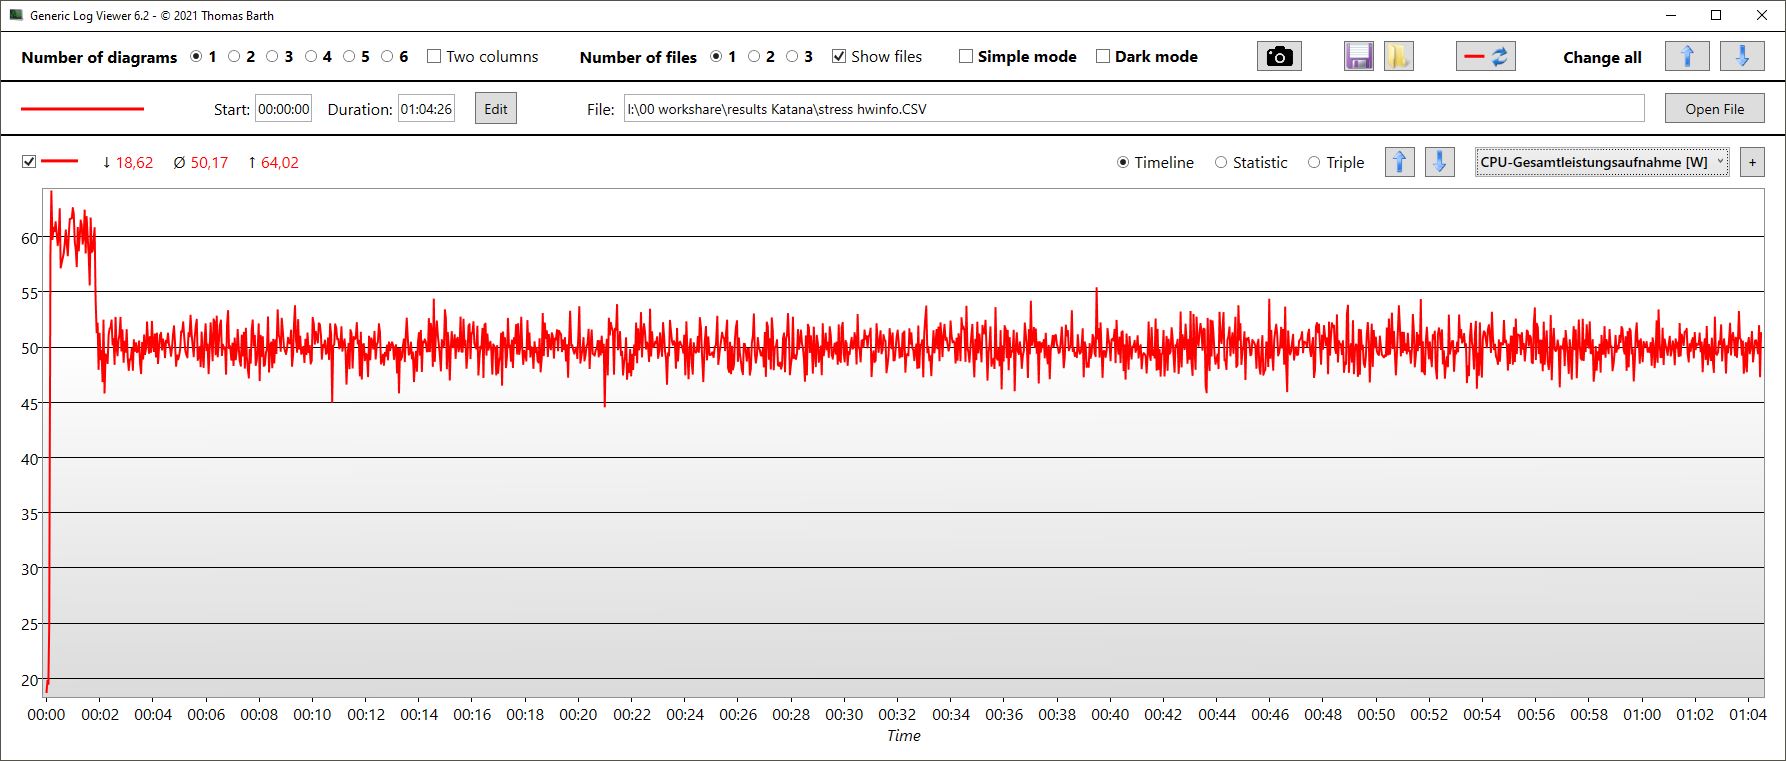
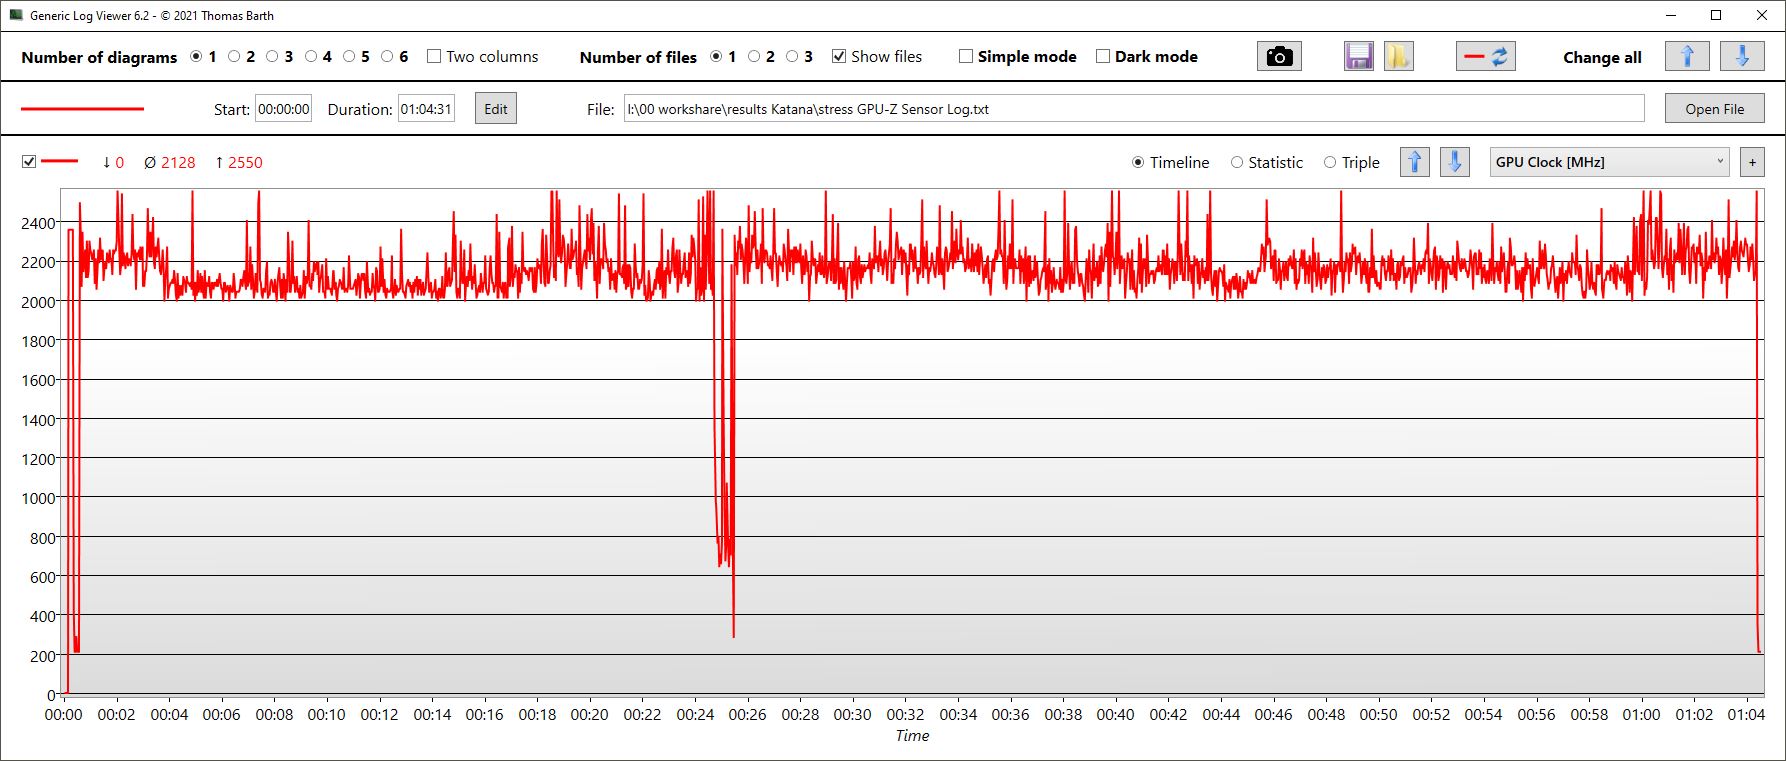
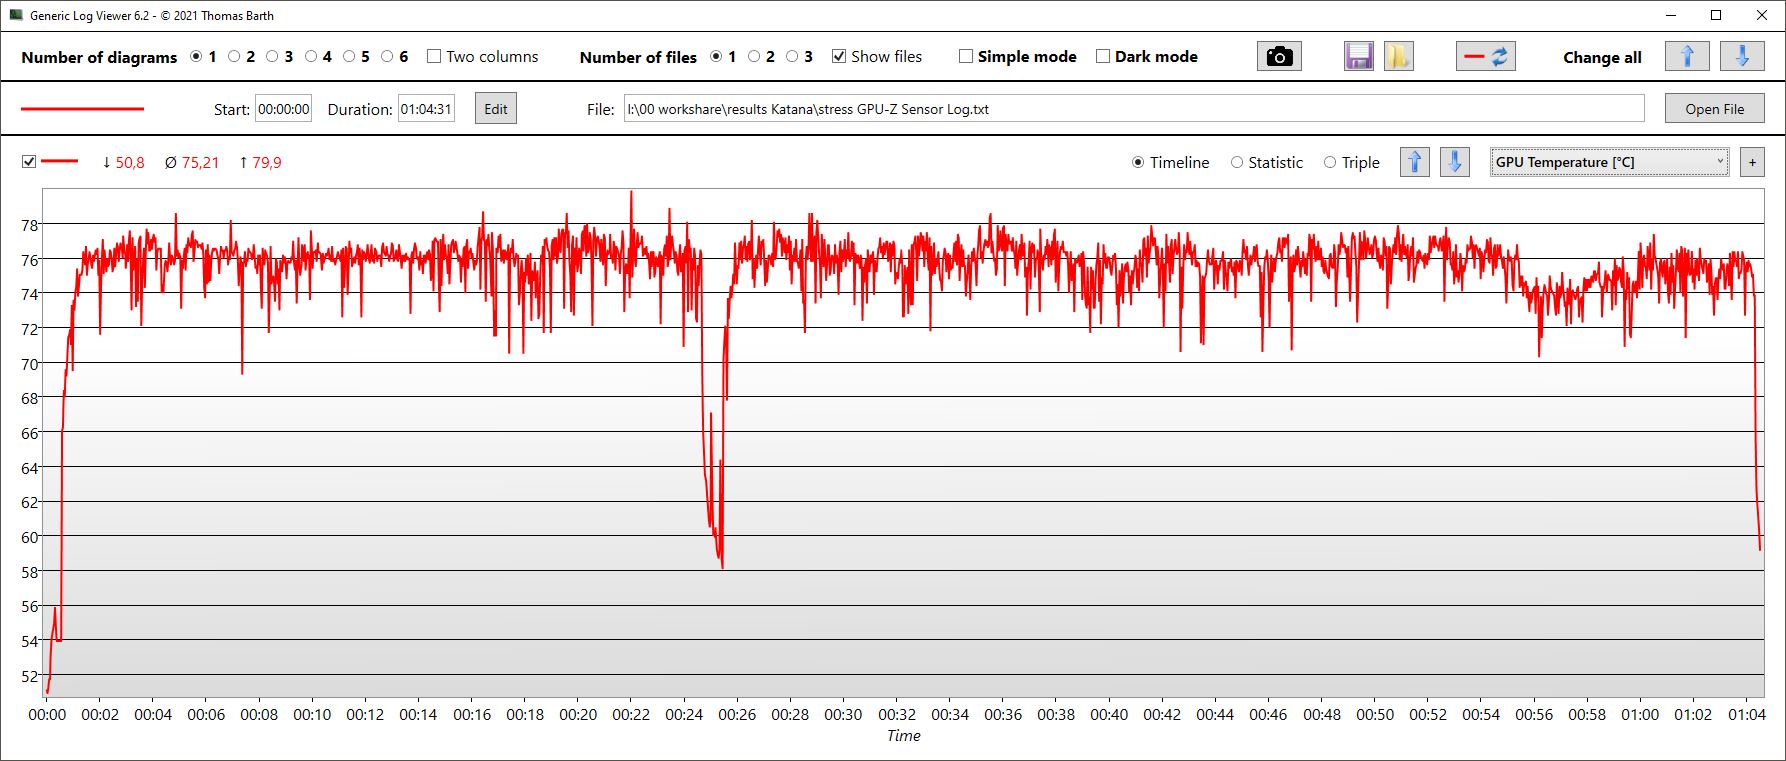
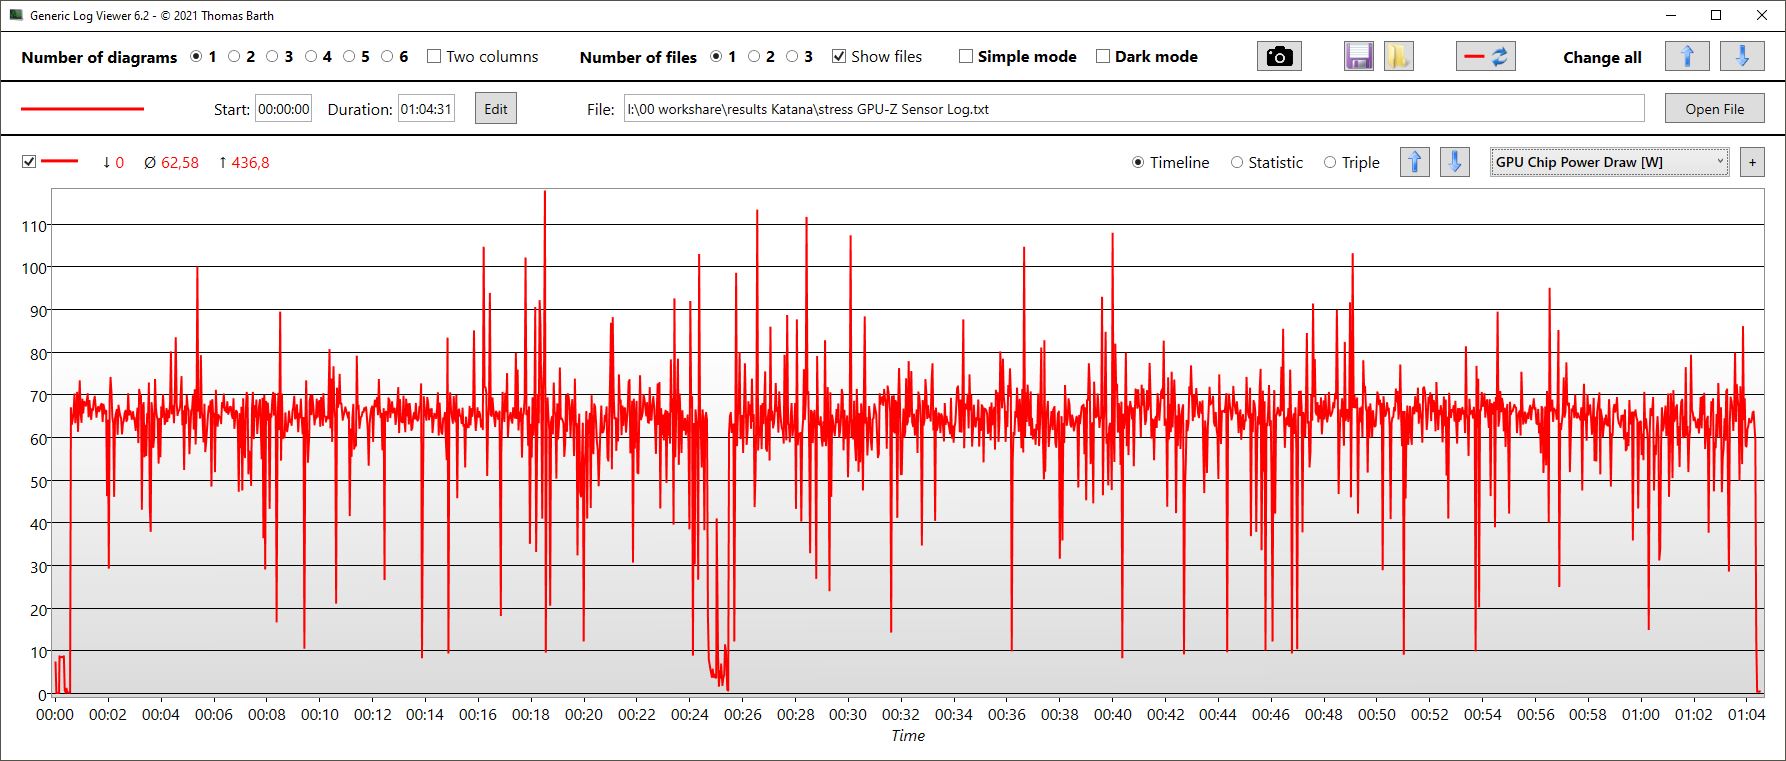
| RelojCPU (GHz) | Reloj GPU (MHz) | Temperatura mediaCPU (°C) | Temperatura media GPU (°C) | |
| Prime95 + FurMark Estrés | 2,5 | 2.121 | 82 | 75 |
| Witcher 3 Estrés | 0,6 | 2.400 | 75 | 75 |
Altavoces
Los altavoces estéreo ofrecen medios y agudos equilibrados, pero apenas graves y un volumen medio en el mejor de los casos. La toma de auriculares es ideal para dispositivos analógicos.
MSI Katana 15 B12VEK análisis de audio
(±) | la sonoridad del altavoz es media pero buena (75.69 dB)
Graves 100 - 315 Hz
(-) | casi sin bajos - de media 21.5% inferior a la mediana
(±) | la linealidad de los graves es media (8.8% delta a frecuencia anterior)
Medios 400 - 2000 Hz
(+) | medios equilibrados - a sólo 4.1% de la mediana
(+) | los medios son lineales (4.8% delta a la frecuencia anterior)
Altos 2 - 16 kHz
(+) | máximos equilibrados - a sólo 2.3% de la mediana
(+) | los máximos son lineales (4% delta a la frecuencia anterior)
Total 100 - 16.000 Hz
(±) | la linealidad del sonido global es media (17.3% de diferencia con la mediana)
En comparación con la misma clase
» 47% de todos los dispositivos probados de esta clase eran mejores, 12% similares, 41% peores
» El mejor tuvo un delta de 6%, la media fue 18%, el peor fue ###max##%
En comparación con todos los dispositivos probados
» 32% de todos los dispositivos probados eran mejores, 8% similares, 59% peores
» El mejor tuvo un delta de 4%, la media fue 24%, el peor fue ###max##%
Lenovo Legion 5 15IAH7H 82RB análisis de audio
(+) | los altavoces pueden reproducir a un volumen relativamente alto (#83.3 dB)
Graves 100 - 315 Hz
(-) | casi sin bajos - de media 28.2% inferior a la mediana
(±) | la linealidad de los graves es media (12.9% delta a frecuencia anterior)
Medios 400 - 2000 Hz
(±) | medias más altas - de media 5.7% más altas que la mediana
(±) | la linealidad de los medios es media (7.4% delta respecto a la frecuencia anterior)
Altos 2 - 16 kHz
(+) | máximos equilibrados - a sólo 3.3% de la mediana
(+) | los máximos son lineales (6.4% delta a la frecuencia anterior)
Total 100 - 16.000 Hz
(±) | la linealidad del sonido global es media (23.6% de diferencia con la mediana)
En comparación con la misma clase
» 86% de todos los dispositivos probados de esta clase eran mejores, 4% similares, 10% peores
» El mejor tuvo un delta de 6%, la media fue 18%, el peor fue ###max##%
En comparación con todos los dispositivos probados
» 71% de todos los dispositivos probados eran mejores, 6% similares, 23% peores
» El mejor tuvo un delta de 4%, la media fue 24%, el peor fue ###max##%
Gestión de energía - RTX 4050 eficiente en el MSI Katana
Consumo de energía
En términos de consumo de energía, el nuevo Katana 15 es más económico que la competencia con una GPU de última generación. Nuestro modelo de pruebas tiene buenas tasas en reposo, y sigue así incluso cuando se juega o se somete a mucho estrés. Aunque el rendimiento 3D también es ligeramente inferior, la diferencia de consumo es mucho mayor que la diferencia de rendimiento.
Por ejemplo, tanto el Legion 5 como el XMG Core 15 hasta el Asus TUF Gaming F15 ¡consumen casi un 50 por ciento más cuando juegan con Witcher 3 que nuestro Katana 15! Pero la Katana GF66 con su RTX 3070 Ti también consume sólo un 16 por ciento más en juegos.
Medimos un consumo máximo a corto plazo de hasta 189 W. La fuente de alimentación Chicony estándar, que está diseñada para 240 W, debería poder aguantar esto muy bien.
| Off / Standby | |
| Ocioso | |
| Carga |
|
Clave:
min: | |
| MSI Katana 15 B12VEK i7-12650H, GeForce RTX 4050 Laptop GPU, Micron 2400 MTFDKBA1T0QFM, IPS, 1920x1080, 15.6" | MSI Katana GF66 12UGS i7-12700H, GeForce RTX 3070 Ti Laptop GPU, Micron 2450 1TB MTFDKBA1T0TFK, IPS, 1920x1080, 15.6" | MSI Pulse GL66 12UEK i9-12900H, GeForce RTX 3060 Laptop GPU, Micron 2450 512GB MTFDKBA512TFK, IPS, 1920x1080, 15.6" | Lenovo Legion 5 15IAH7H 82RB i7-12700H, GeForce RTX 3060 Laptop GPU, , IPS, 1920x1080, 15.6" | Asus TUF Gaming F15 FX507ZM i7-12700H, GeForce RTX 3060 Laptop GPU, SK Hynix HFM001TD3JX013N, IPS, 1920x1080, 15.6" | Schenker XMG Core 15 (M22) R7 6800H, GeForce RTX 3060 Laptop GPU, Samsung SSD 980 Pro 1TB MZ-V8P1T0BW, IPS, 2560x1440, 15.6" | Medio NVIDIA GeForce RTX 4050 Laptop GPU | Media de la clase Gaming | |
|---|---|---|---|---|---|---|---|---|
| Power Consumption | -26% | -6% | -121% | -34% | -34% | -30% | -63% | |
| Idle Minimum * (Watt) | 8.5 | 9 -6% | 7 18% | 19.8 -133% | 6.3 26% | 11.8 -39% | 9.95 ? -17% | 13.1 ? -54% |
| Idle Average * (Watt) | 10.2 | 13 -27% | 13 -27% | 26.2 -157% | 9.8 4% | 14.7 -44% | 15.8 ? -55% | 18.8 ? -84% |
| Idle Maximum * (Watt) | 11.3 | 20 -77% | 13.7 -21% | 48.2 -327% | 26.5 -135% | 15 -33% | 20.1 ? -78% | 24.4 ? -116% |
| Load Average * (Watt) | 84 | 100 -19% | 48.4 42% | 102.9 -23% | 103.8 -24% | 100 -19% | 88 ? -5% | 108.5 ? -29% |
| Witcher 3 ultra * (Watt) | 128 | 149 -16% | 148 -16% | 186.7 -46% | 189 -48% | 184 -44% | ||
| Load Maximum * (Watt) | 189 | 212 -12% | 244 -29% | 268 -42% | 241.9 -28% | 237 -25% | 176.3 ? 7% | 254 ? -34% |
* ... más pequeño es mejor
Power Consumption Witcher 3 / Stresstest
Power Consumption with an External Monitor
Duración de la batería
¿Dónde más ahorran dinero los portátiles económicos? Correcto, la batería. El modelo en el Katana 15 sólo tiene 53 Wh, que es estándar en el Katana o Pulse. El resto de la competencia tiene baterías de entre 62 y 90 Wh. En consecuencia, los tiempos de funcionamiento son más bien mediocres, a pesar de la eficiencia energética comparativamente buena.
Se puede planear una noche de cine de unas 4 horas y 20 minutos. Nuestra prueba WLAN arroja resultados significativamente diferentes, dependiendo del modo seleccionado. En modo equilibrado a brillo máximo (258 nits), la batería dura sólo 2 horas y 20 minutos. En Ahorro de Energía a 150 nits, por otro lado, medimos más o menos el mismo tiempo que en el test de vídeo.
| MSI Katana 15 B12VEK i7-12650H, GeForce RTX 4050 Laptop GPU, 53.5 Wh | MSI Katana GF66 12UGS i7-12700H, GeForce RTX 3070 Ti Laptop GPU, 52 Wh | MSI Pulse GL66 12UEK i9-12900H, GeForce RTX 3060 Laptop GPU, 53.5 Wh | Lenovo Legion 5 15IAH7H 82RB i7-12700H, GeForce RTX 3060 Laptop GPU, 80 Wh | Asus TUF Gaming F15 FX507ZM i7-12700H, GeForce RTX 3060 Laptop GPU, 90 Wh | Schenker XMG Core 15 (M22) R7 6800H, GeForce RTX 3060 Laptop GPU, 62 Wh | Media de la clase Gaming | |
|---|---|---|---|---|---|---|---|
| Duración de Batería | -26% | 9% | -6% | -8% | 27% | 49% | |
| H.264 (h) | 4.4 | 4 -9% | 8.26 ? 88% | ||||
| WiFi v1.3 (h) | 4.3 | 2.4 -44% | 5 16% | 4.8 12% | 7.8 81% | 6.98 ? 62% | |
| Load (h) | 1.5 | 1.4 -7% | 1.9 27% | 1.1 -27% | 1.1 -27% | 1.1 -27% | 1.47 ? -2% |
| Reader / Idle (h) | 8.1 | 15.8 | 8.71 ? |
Pro
Contra
Veredicto - La económica RTX 4050 sigue siendo demasiado cara

La MSI Katana 15 B12 combina una CPU Gen12 con una RTX 4050lo que no es mala idea para un gamer económico. La CPU es de todo menos mala y la GPU del Katana 15 demuestra ser bastante más eficiente que los modelos del año pasado.
Sin embargo, nuestra principal crítica para los jugadores de bajo presupuesto es el precio: mientras que puedes conseguir portátiles económicos con RTX 3060 a partir de unos 800 dólares, aquí pagas ¡1.499,99 dólares! Las ventajas de eficiencia de la RTX 4050 no justifican este sobreprecio. Más aún teniendo en cuenta que casi todos los demás componentes del Katana 15 son claramente de clase económica, desde los puertos parcialmente anticuados hasta la pantalla Full HD bastante oscura y la batería comparativamente pequeña. A esto se añade el hecho de que el rendimiento del portátil tiende a quedarse por detrás de la mayoría de los jugadores de RTX 3060 y la RTX 4050 falla claramente su objetivo TGP de 105.
El MSI Katana 15 B12 combina una buena CPU de última generación con una RTX 4050 actual, pero falla a la hora de fijar un precio razonable para los muchos componentes de presupuesto. Actualmente, el Katana 15 es sencillamente demasiado caro.
Después de todo, hay muchas alternativas. Si quieres más rendimiento y menos componentes económicos a precios aún más bajos, tu mejor apuesta es el Lenovo Legion 5 con su RTX 3060. Pero la mayoría de los otros gamers RTX 3060 también deberían ser más baratos, mejor equipados y sobre todo más rápidos.
Precio y disponibilidad
En la tienda web oficial de MSI US, el Katana 15 B12VGK-082 tiene un precio de 1.499,99 dólares. Los compradores interesados (dependiendo de la ubicación) pueden encontrar el mismo modelo a precios más baratos en revendedores como Amazon.
MSI Katana 15 B12VEK
- 03/28/2023 v7 (old)
Christian Hintze
Transparencia
La selección de los dispositivos que se van a reseñar corre a cargo de nuestro equipo editorial. La muestra de prueba fue proporcionada al autor en calidad de préstamo por el fabricante o el minorista a los efectos de esta reseña. El prestamista no tuvo ninguna influencia en esta reseña, ni el fabricante recibió una copia de la misma antes de su publicación. No había ninguna obligación de publicar esta reseña. Como empresa de medios independiente, Notebookcheck no está sujeta a la autoridad de fabricantes, minoristas o editores.
Así es como prueba Notebookcheck
Cada año, Notebookcheck revisa de forma independiente cientos de portátiles y smartphones utilizando procedimientos estandarizados para asegurar que todos los resultados son comparables. Hemos desarrollado continuamente nuestros métodos de prueba durante unos 20 años y hemos establecido los estándares de la industria en el proceso. En nuestros laboratorios de pruebas, técnicos y editores experimentados utilizan equipos de medición de alta calidad. Estas pruebas implican un proceso de validación en varias fases. Nuestro complejo sistema de clasificación se basa en cientos de mediciones y puntos de referencia bien fundamentados, lo que mantiene la objetividad.Price comparison

