Análisis del portátil Lenovo ThinkPad T14s G3 AMD: Silencioso y eficiente con la potencia de Ryzen

La línea de Lenovo para clientes empresariales está claramente alineada: El portátil estándar para la oficina es el Lenovo ThinkPad T14 G3. Para la planta ejecutiva y los usuarios particularmente móviles, Lenovo ofrece el significativamente más caro ThinkPad X1 Carbon Gen 10. Y si eso es demasiado caro pero la movilidad sigue siendo importante, el Lenovo ThinkPad T14s G3 representa otra opción que se supone que combina lo mejor de ambos modelos. Una ventaja en comparación con el ThinkPad X1 Carbon es que el T14s también está disponible con procesadores AMD, como el AMD Ryzen Pro 6850Uincluido en nuestra unidad de pruebas de hoy.
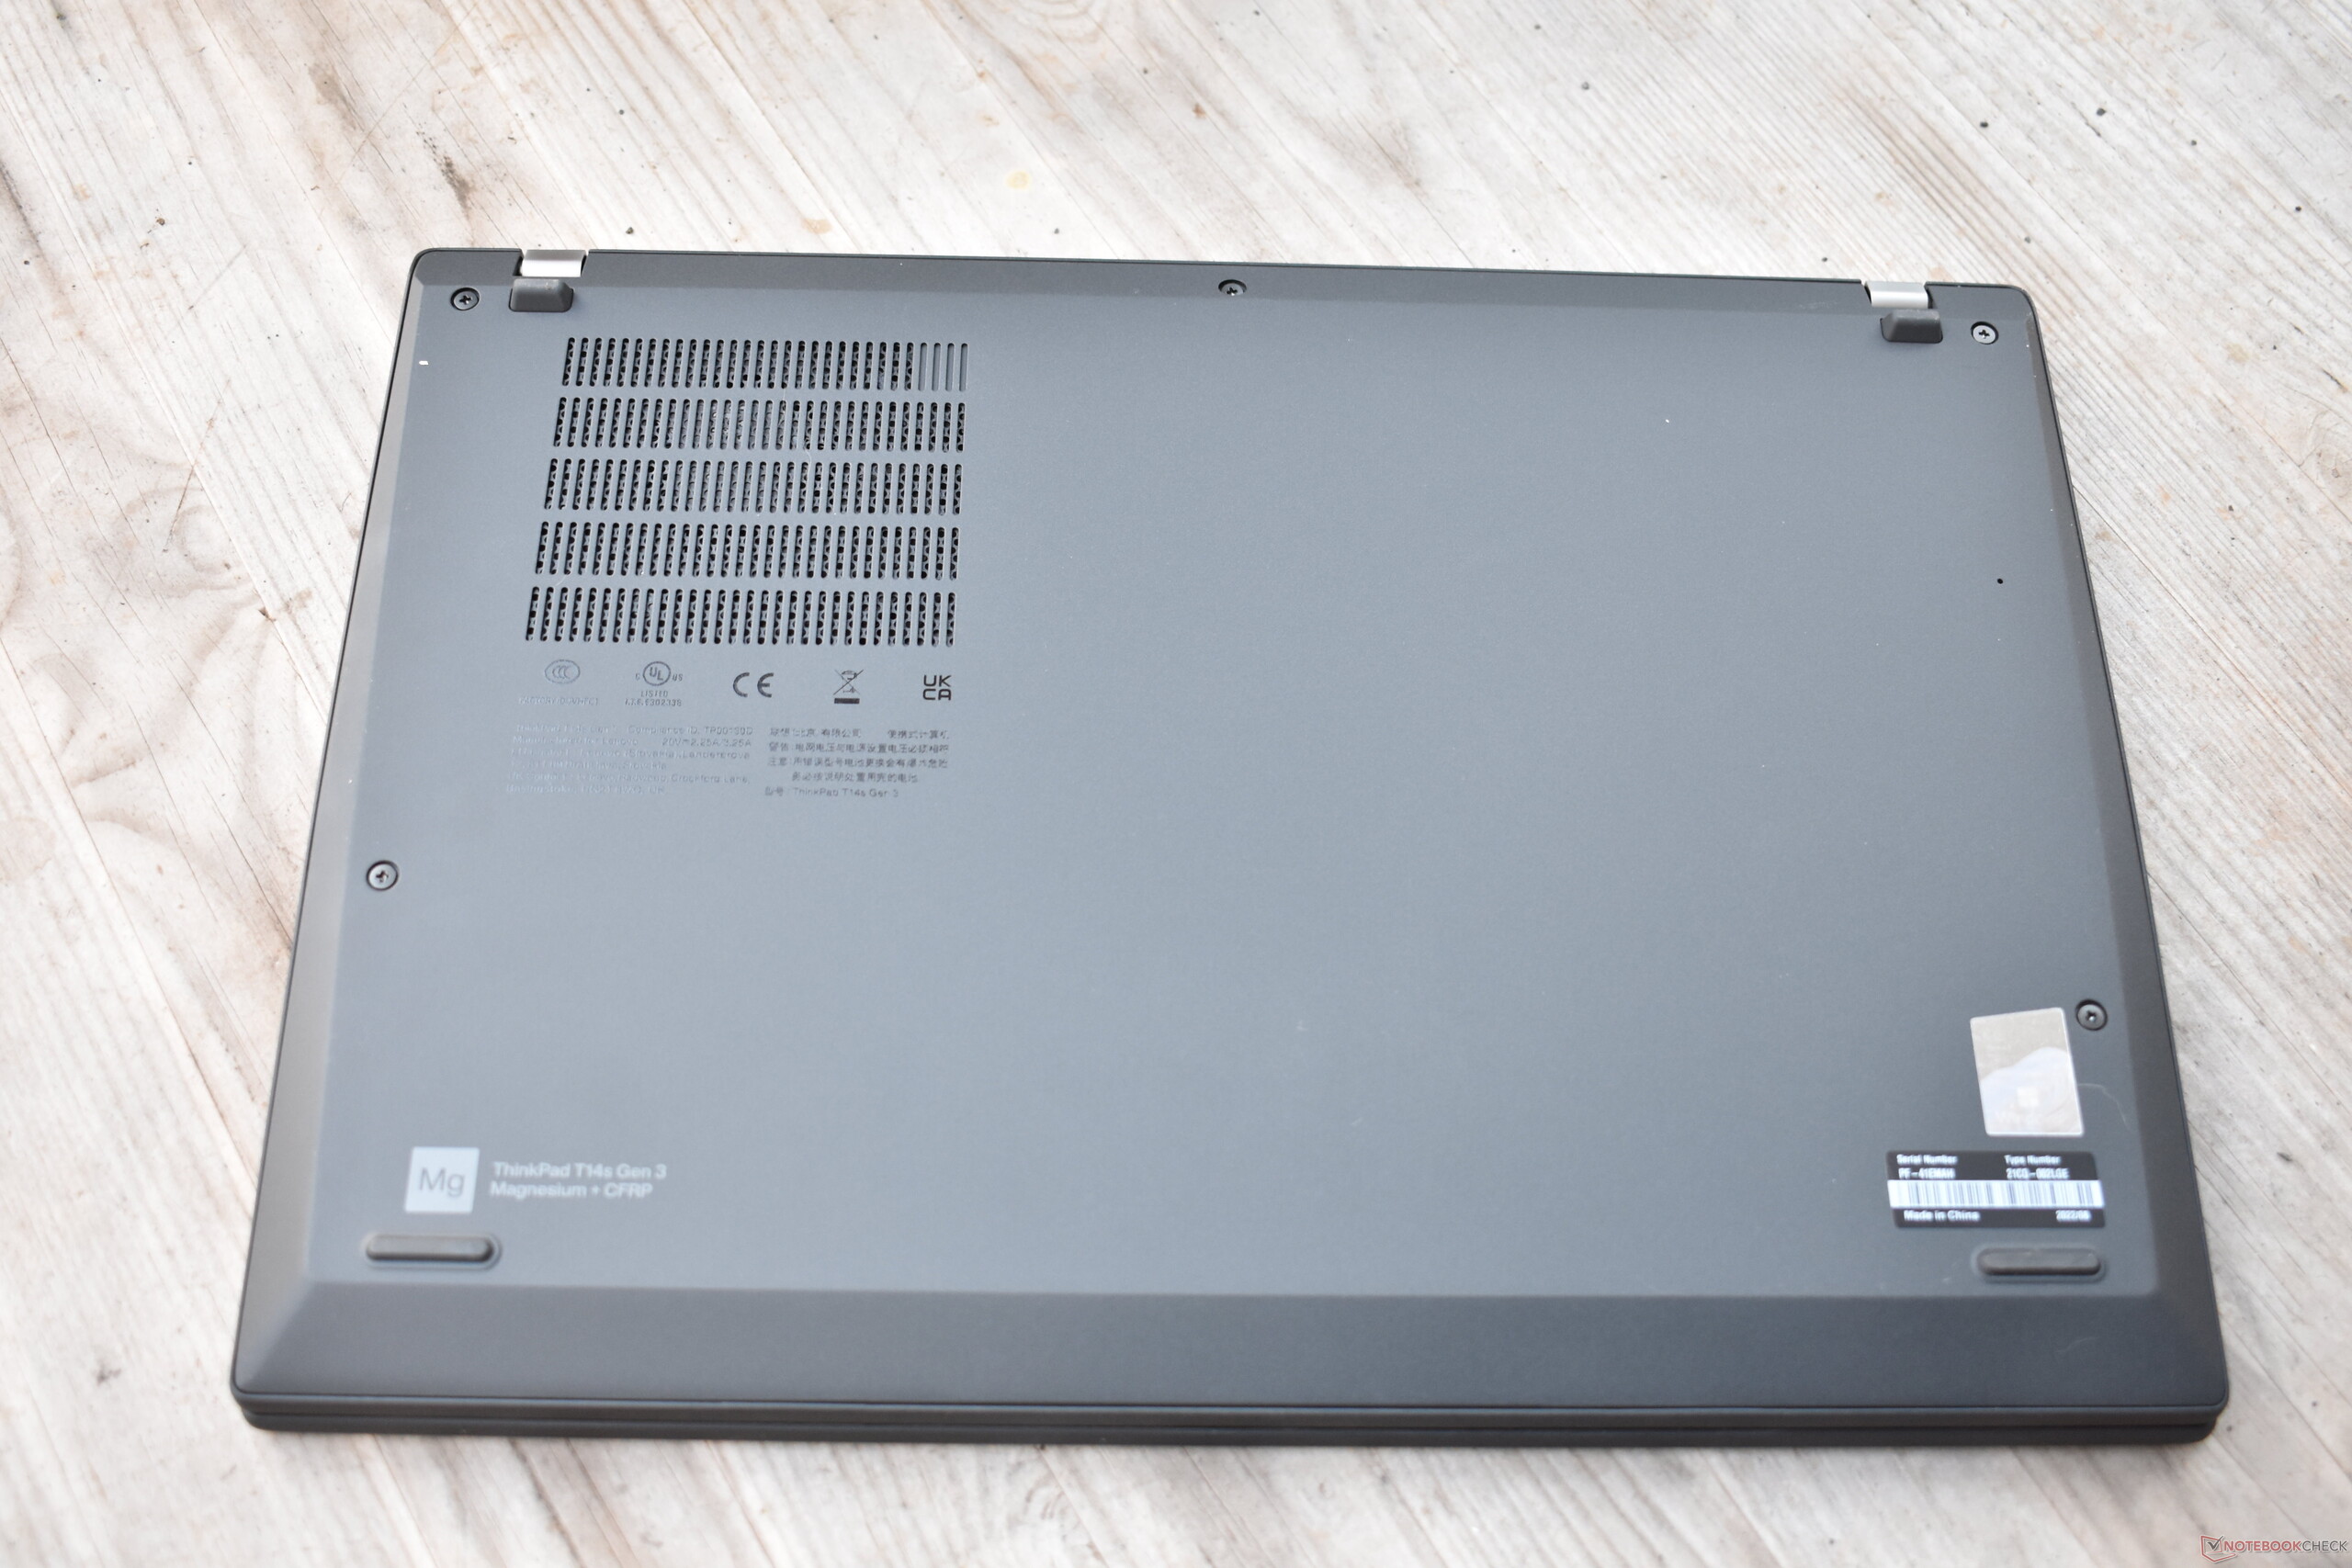
Dado que el T14s G3 siempre utiliza la misma carcasa, independientemente de si alberga un procesador Intel o AMD, este análisis es una actualización de prueba. Puede encontrar información sobre la carcasa y el diseño, el equipo y los dispositivos de entrada en nuestro análisis del Lenovo ThinkPad T14s G3 Intel.
Posibles contendientes en la comparación
Valoración | Fecha | Modelo | Peso | Altura | Tamaño | Resolución | Precio |
|---|---|---|---|---|---|---|---|
| 90.6 % v7 (old) | 01/2023 | Lenovo ThinkPad T14s G3 21CQ002LGE R7 PRO 6850U, Radeon 680M | 1.3 kg | 16.9 mm | 14.00" | 1920x1200 | |
| 89.1 % v7 (old) | 12/2022 | Lenovo ThinkPad T14s G3 21BR00CDGE i5-1235U, Iris Xe G7 80EUs | 1.3 kg | 16.9 mm | 14.00" | 1920x1200 | |
| 90.1 % v7 (old) | 03/2022 | Lenovo ThinkPad T14s G2 20XGS01100 R7 PRO 5850U, Vega 8 | 1.3 kg | 16.14 mm | 14.00" | 1920x1080 | |
| 89.8 % v7 (old) | 08/2022 | Dell Latitude 9430 2-in-1 i7-1265U, Iris Xe G7 96EUs | 1.5 kg | 13.94 mm | 14.00" | 2560x1600 | |
| 88.6 % v7 (old) | 11/2022 | HP EliteBook 845 G9 6F6H9EA R5 PRO 6650U, Radeon 660M | 1.4 kg | 19 mm | 14.00" | 1920x1200 |

Conexiones
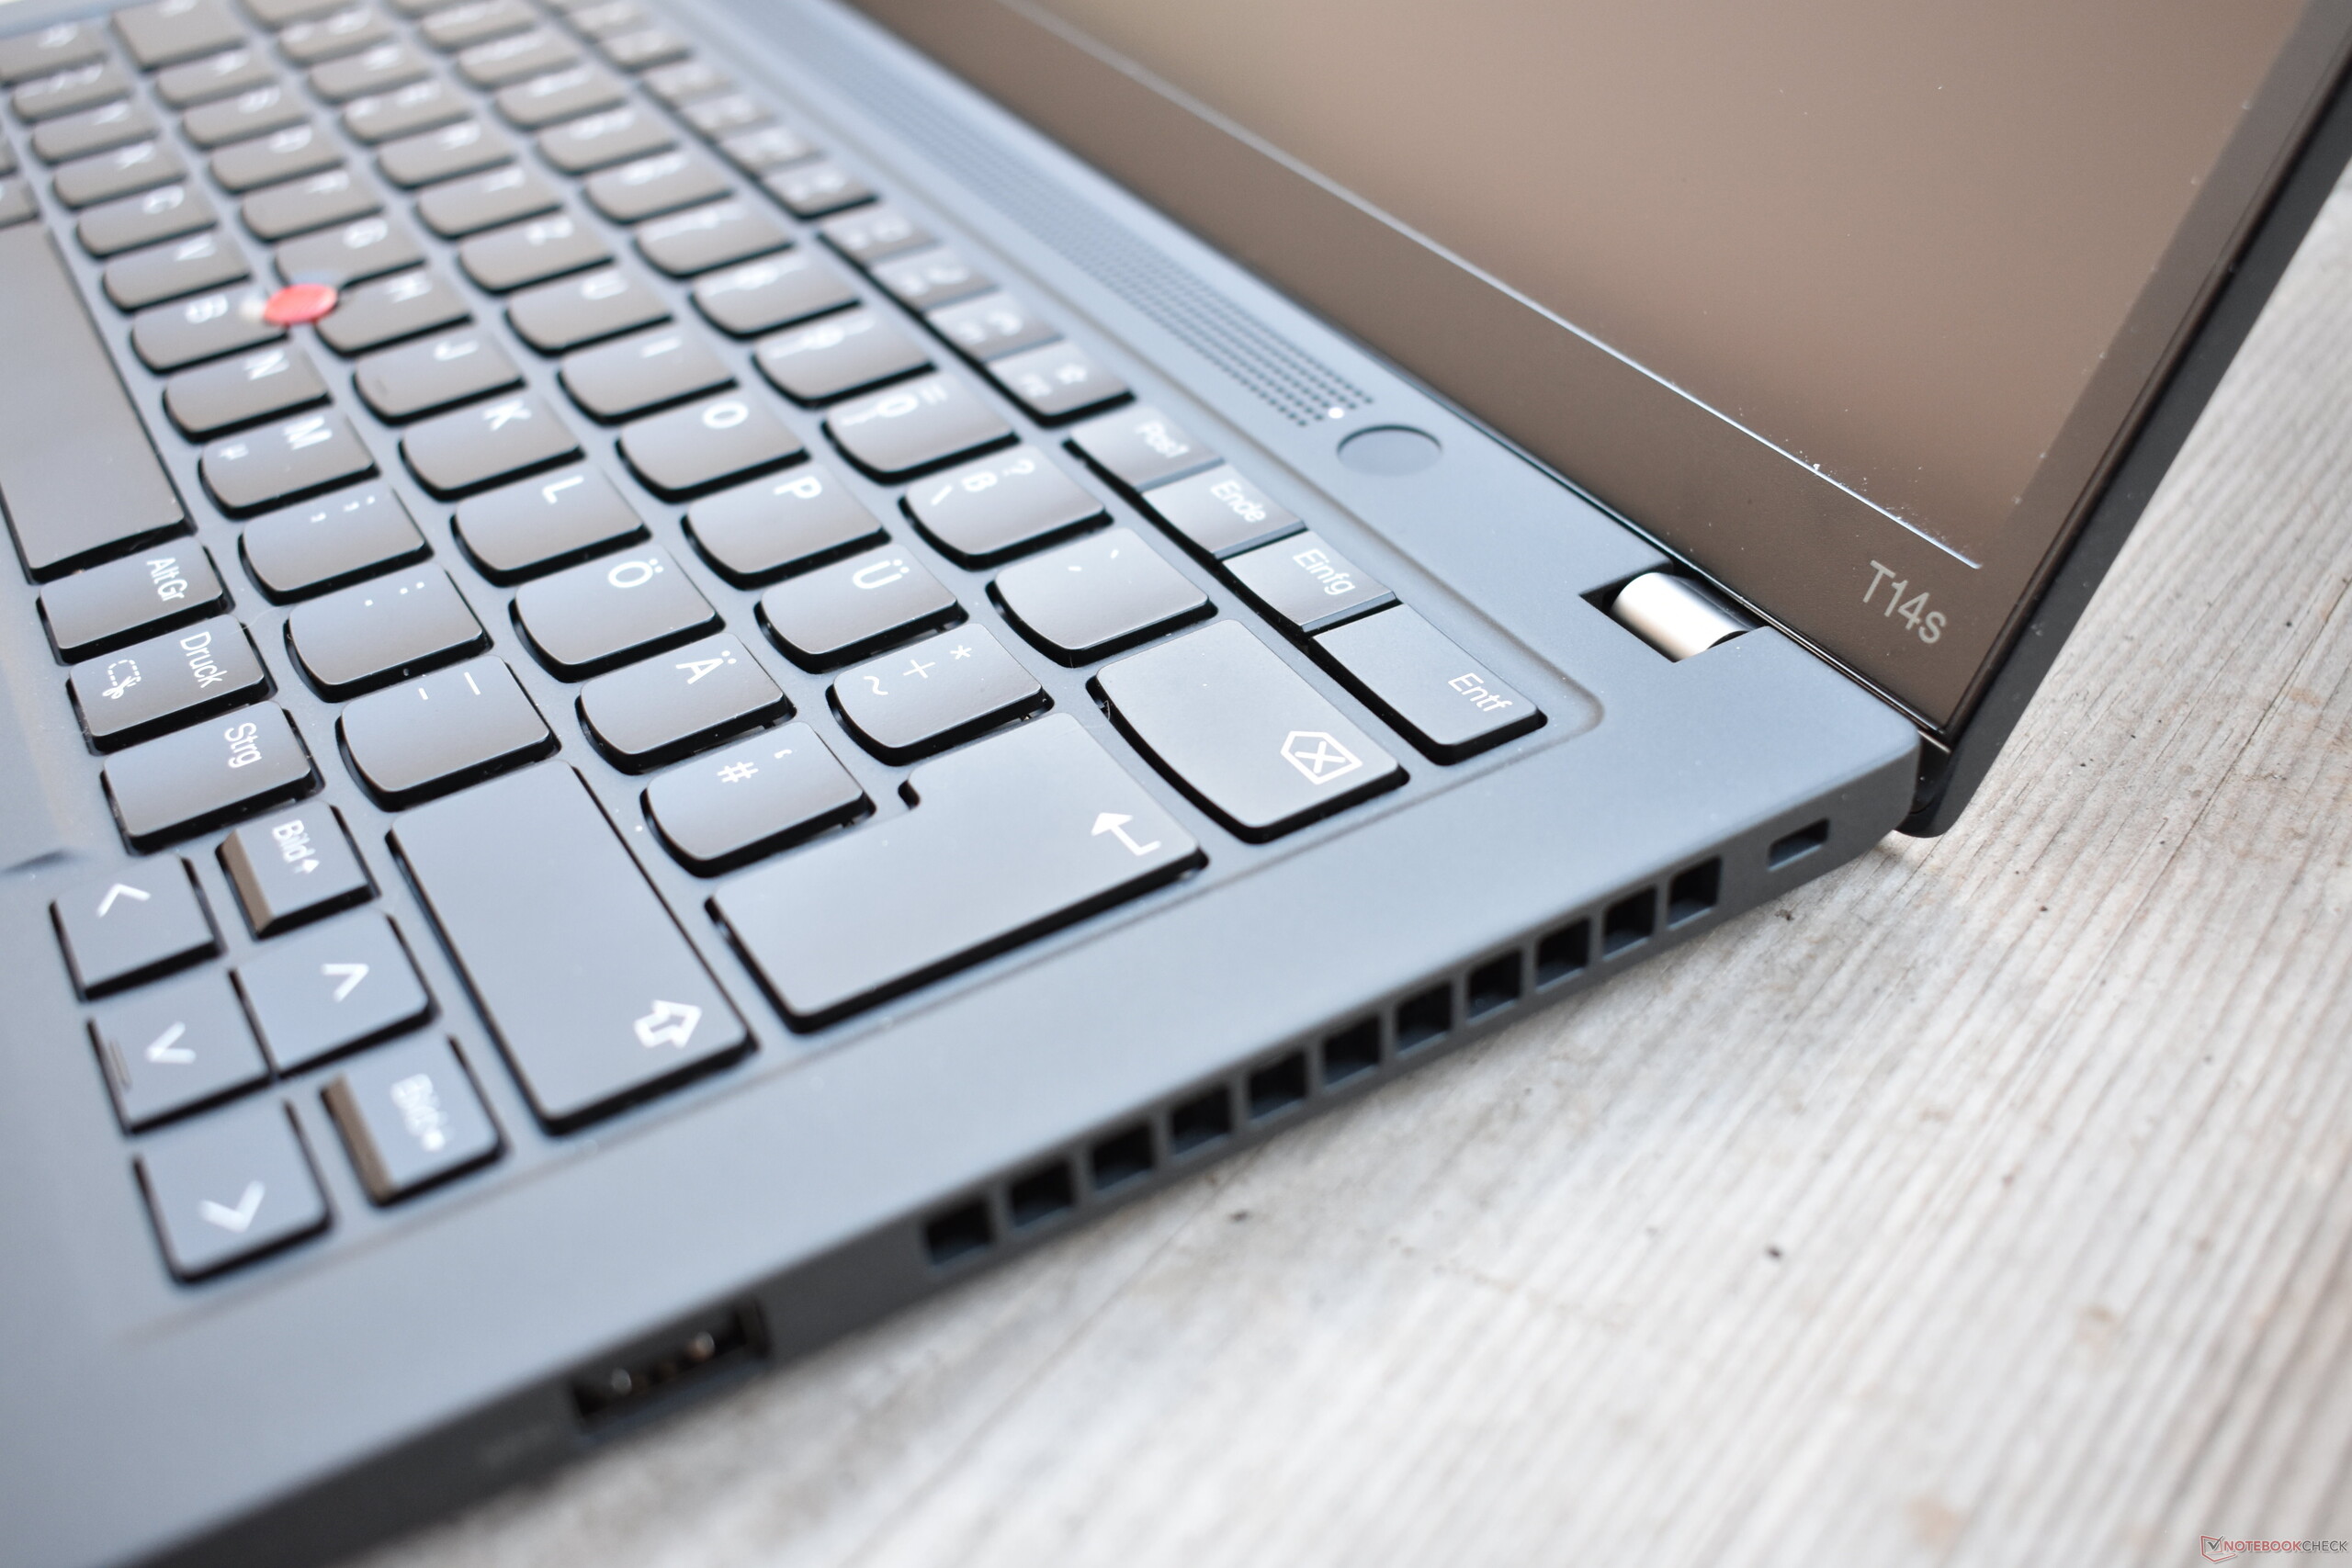
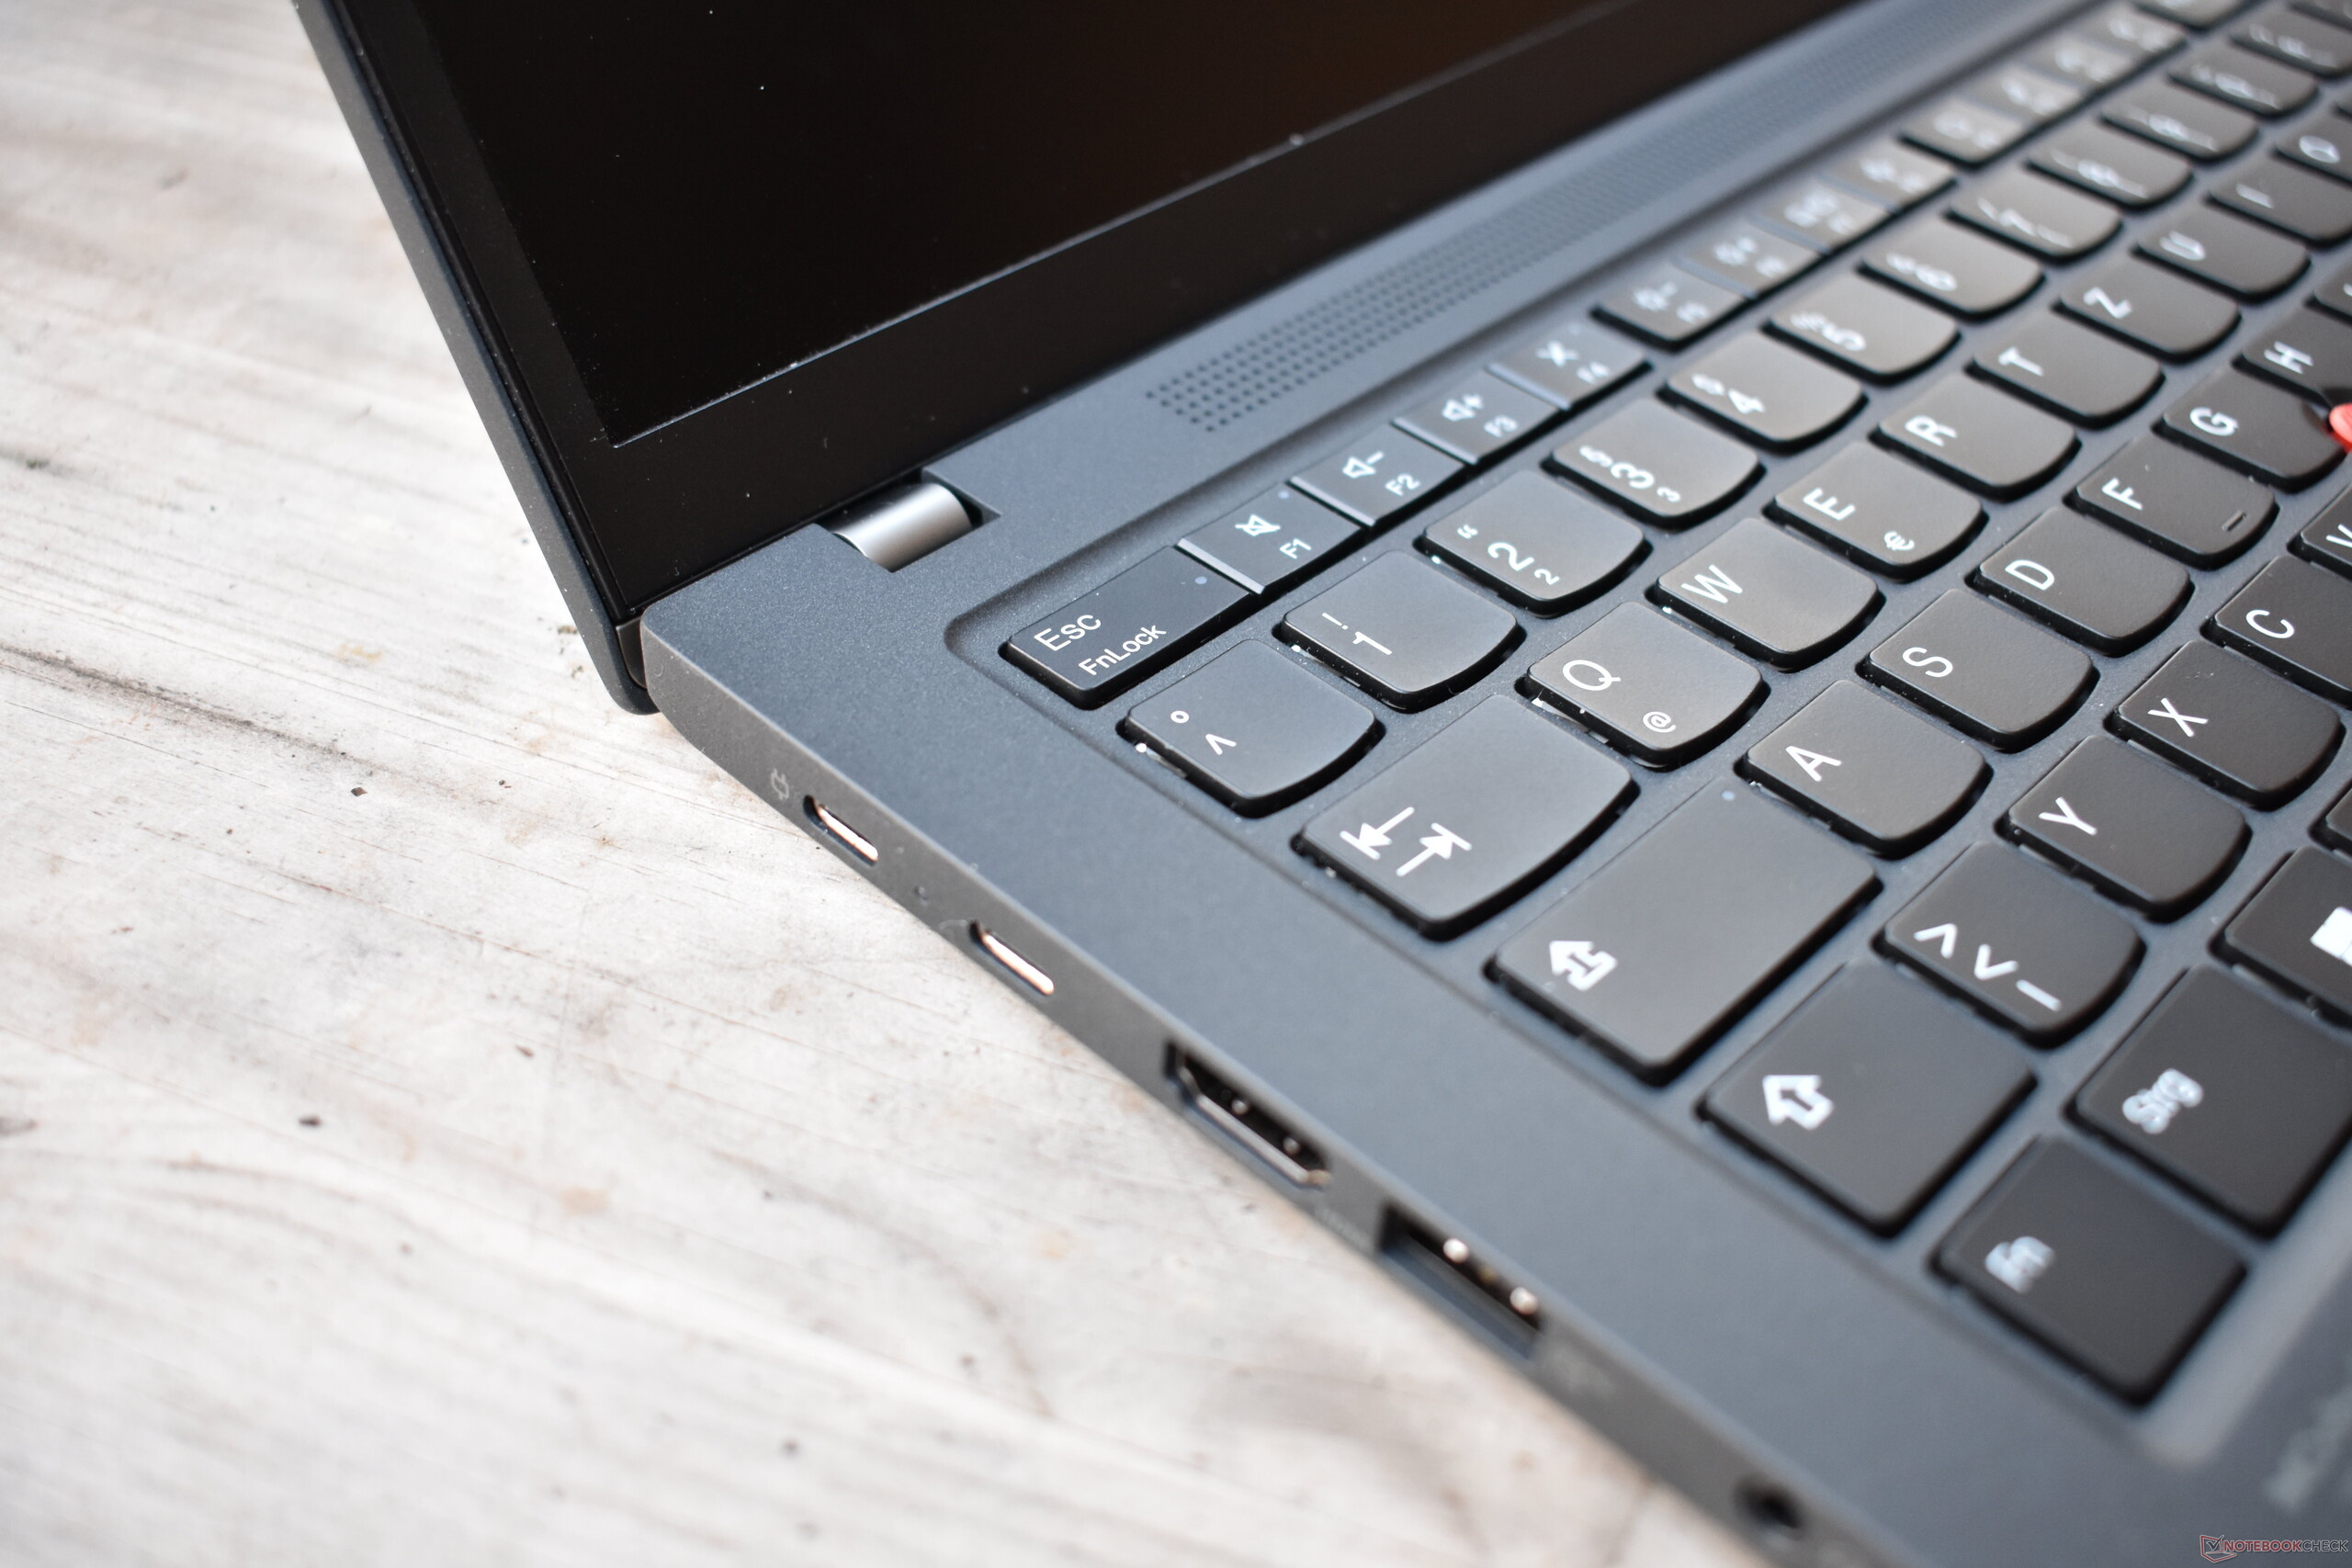
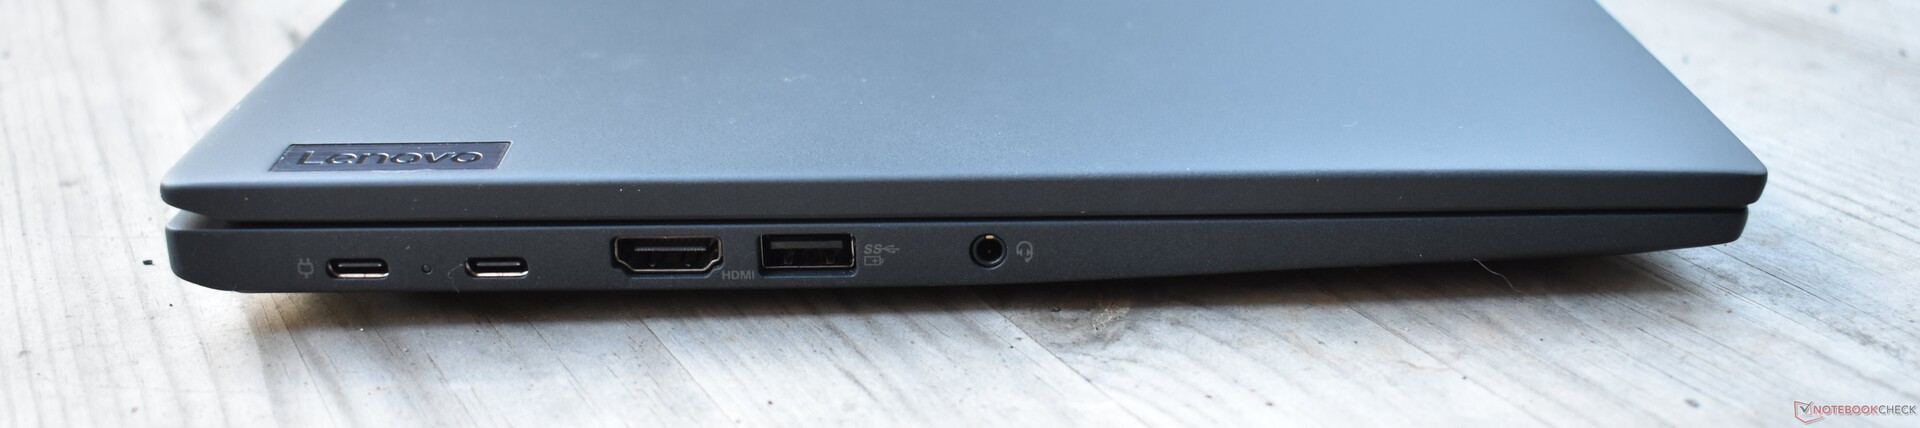
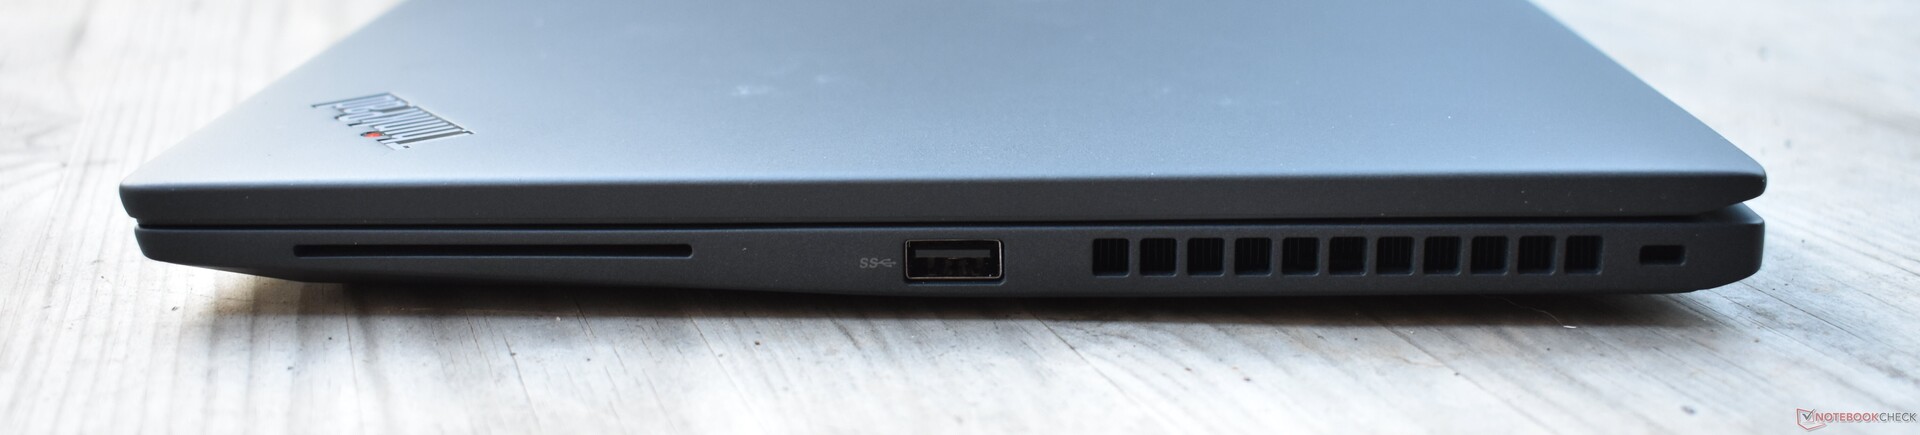
Las conexiones son casi idénticas a las delLenovo ThinkPad T14s G3 Intel. La única diferencia es que en vez de dos puertos Thunderbolt 4, el ThinkPad T14s G3 AMD ofrece una conexión USB 4 y un puerto USB-C que soporta un máximo de USB 3.2 Gen 2. Ambas conexiones se pueden usar para cargar a través de USB-C power delivery, y ambos también tienen el modo alternativo DisplayPort. Para probarlo, conectamos una eGPU Thunderbolt 3 y un display Thunderbolt al ThinkPad, y ambos funcionaron sin problemas usando el puerto USB 4.
Comunicación
El equipo de comunicación es idéntico, salvo por el chip WiFi: Mientras que elT14s G3 Inteltiene un módulo WiFi de Intel, el T14s G3 AMD usa un chip WiFi de Qualcomm. Las especificaciones de rendimiento son casi idénticas, y ambas soluciones también rinden de forma similar en los benchmarks.
Cámara web
La cámara web de 1080p es idéntica a la del ThinkPad T14s G3 Intel.


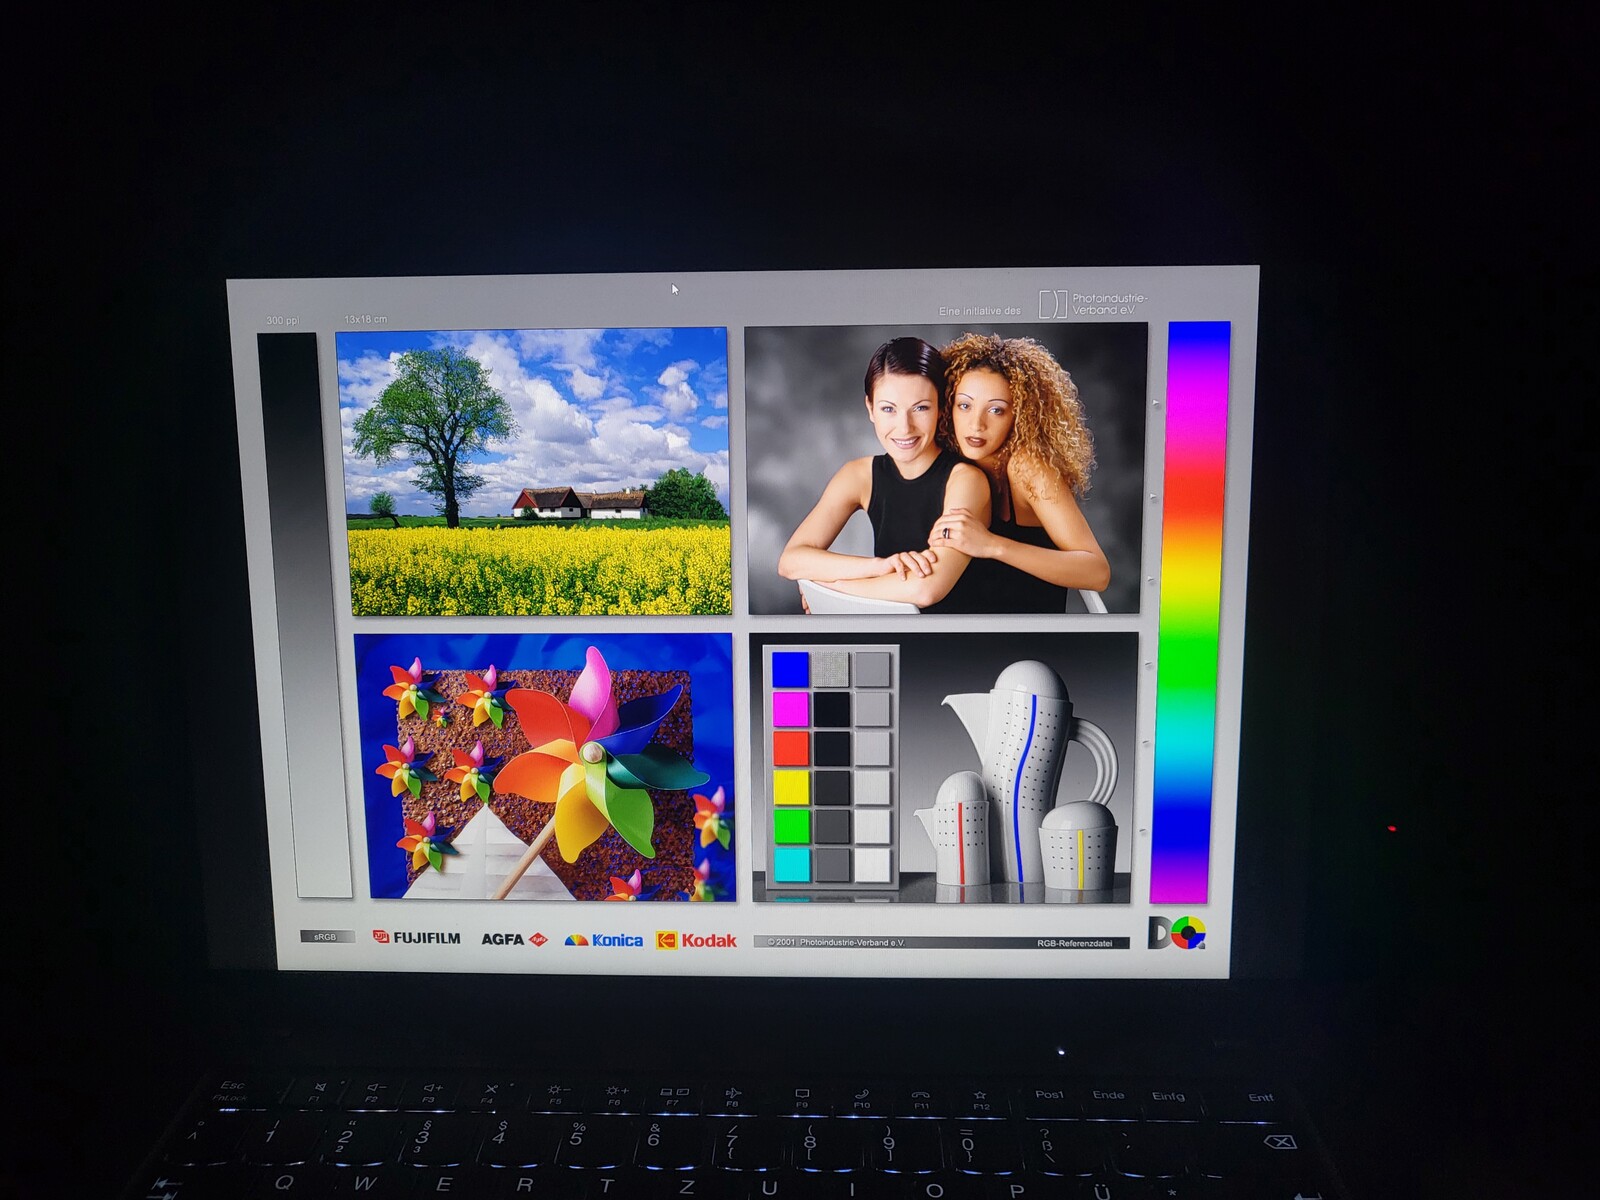
Pantalla de bajo consumo con superficie mate
En cuanto a la pantalla, también hay muchas similitudes con elLenovo ThinkPad T14s G3 Intel. Las opciones de display disponibles así como el modelo de display usado en nuestra unidad de pruebas son idénticos. Incluso los números de modelo de la pantalla 16:10 de 14 pulgadas son los mismos: MNE007JA1-1. Se trata de un panel de bajo consumo sobre base IPS con una resolución WUXGA (1.920 x 1.200).
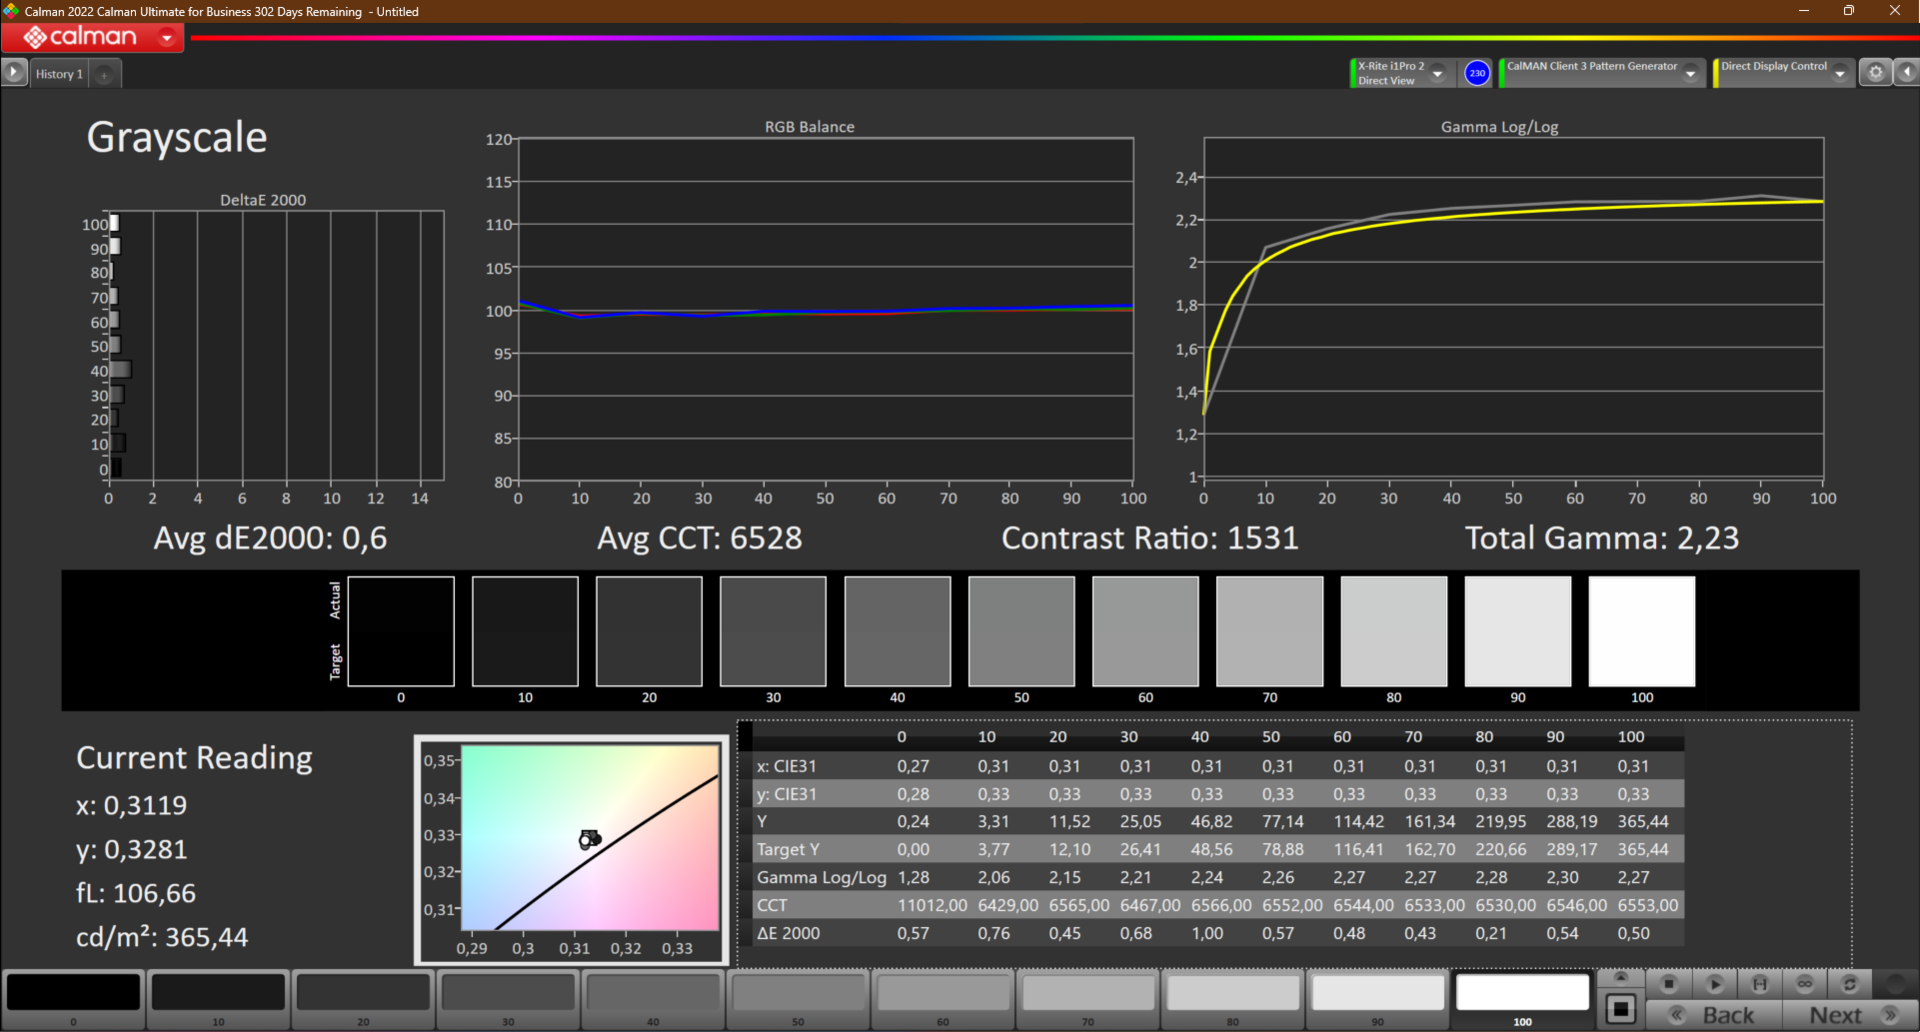
Lenovo especifica un valor de brillo de 400 cd/m², pero la pantalla de nuestra unidad de pruebas Intel quedó muy por debajo. Afortunadamente, nuestra unidad de pruebas ThinkPad T14s G3 AMD no confirma este resultado, y con unos 379 cd/m² de media, está mucho más cerca del valor objetivo que el T14s G3 Intel, que sólo ofrecía 301 cd/m².
| |||||||||||||||||||||||||
iluminación: 92 %
Brillo con batería: 396 cd/m²
Contraste: 1523:1 (Negro: 0.26 cd/m²)
ΔE ColorChecker Calman: 1.3 | ∀{0.5-29.43 Ø4.71}
calibrated: 0.7
ΔE Greyscale Calman: 1.6 | ∀{0.09-98 Ø4.96}
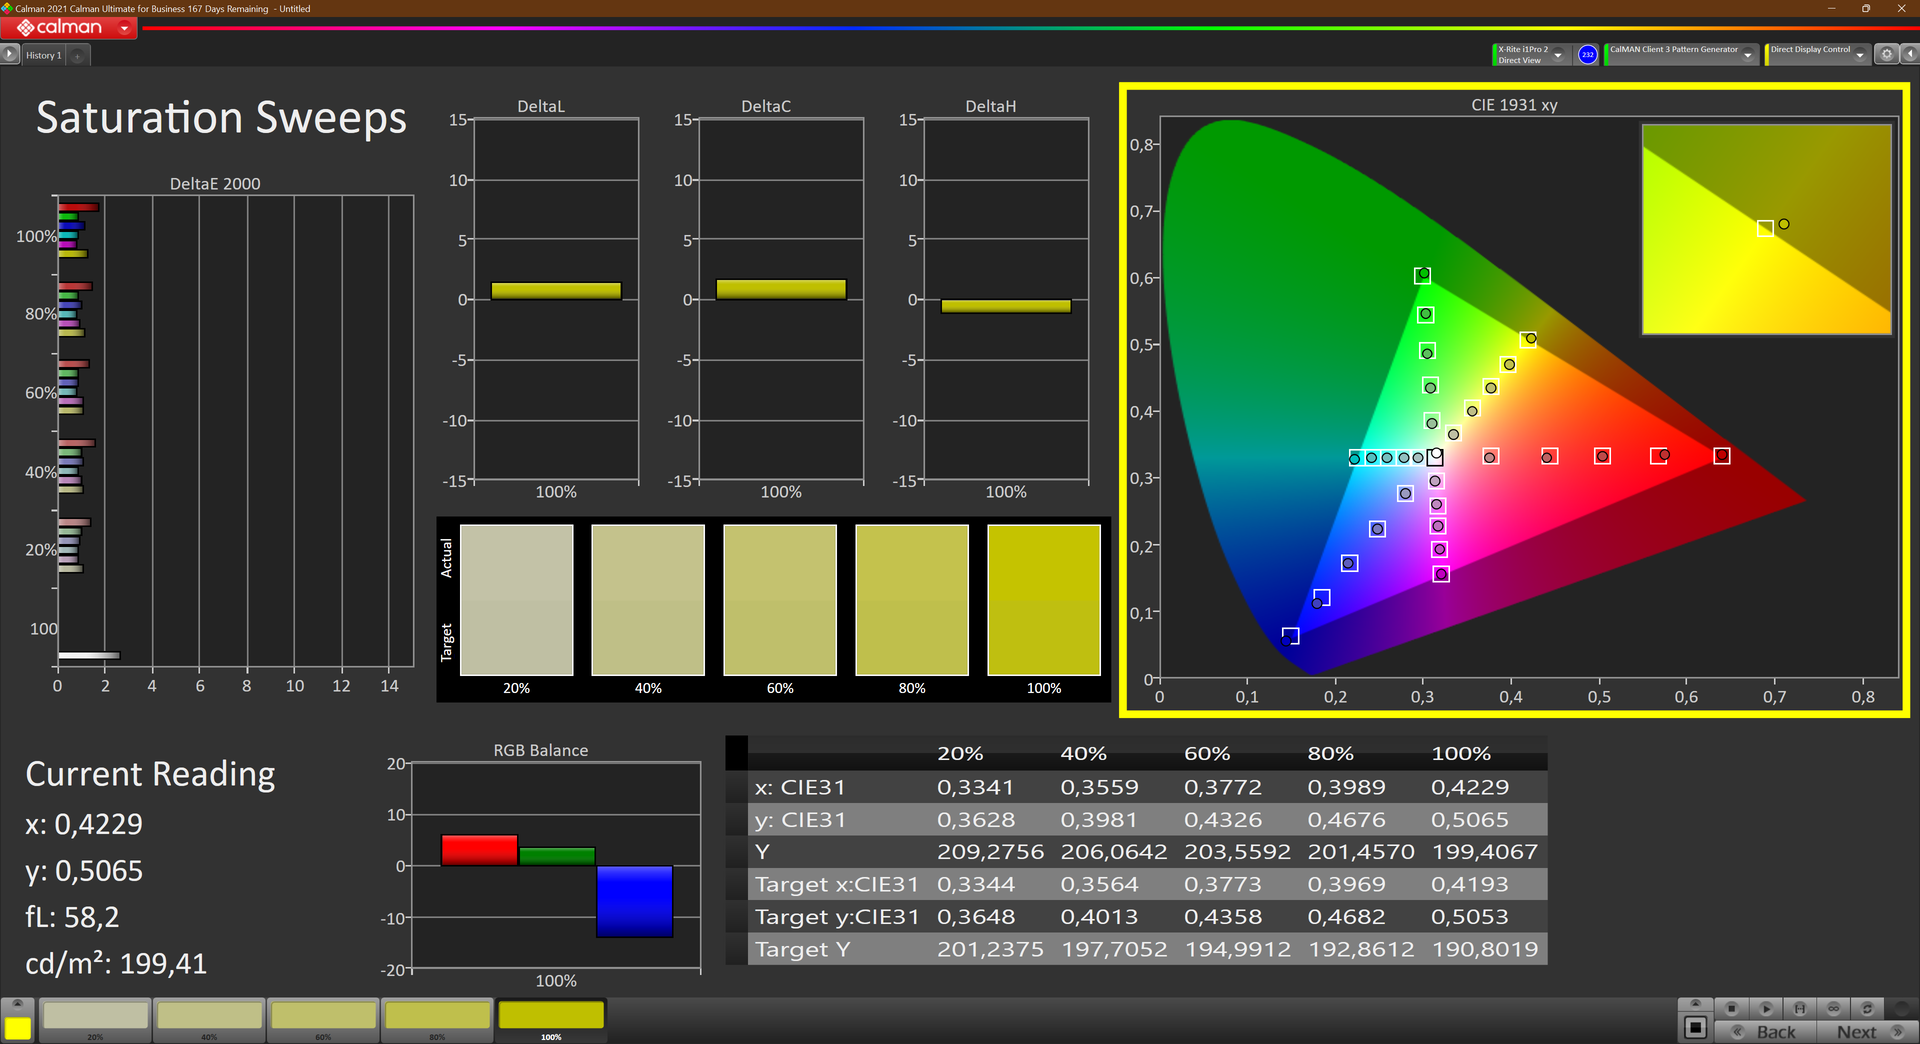
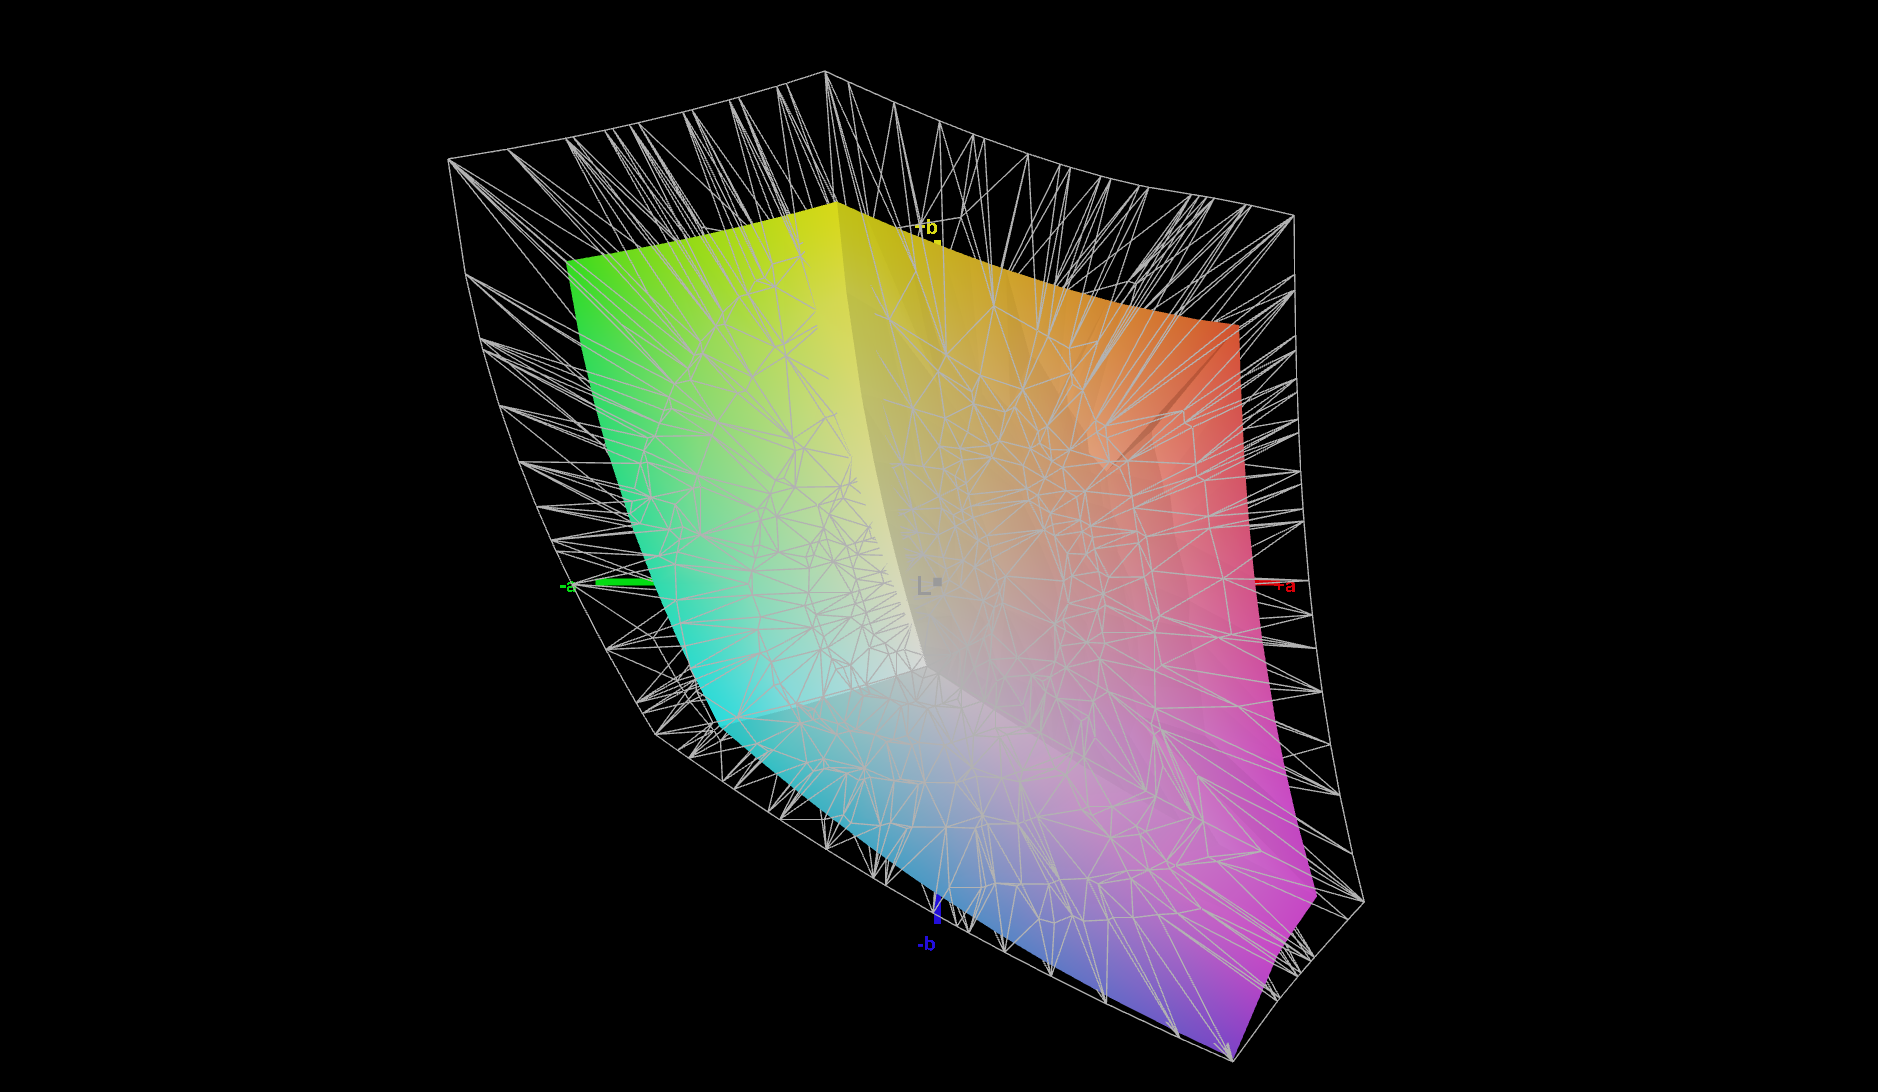
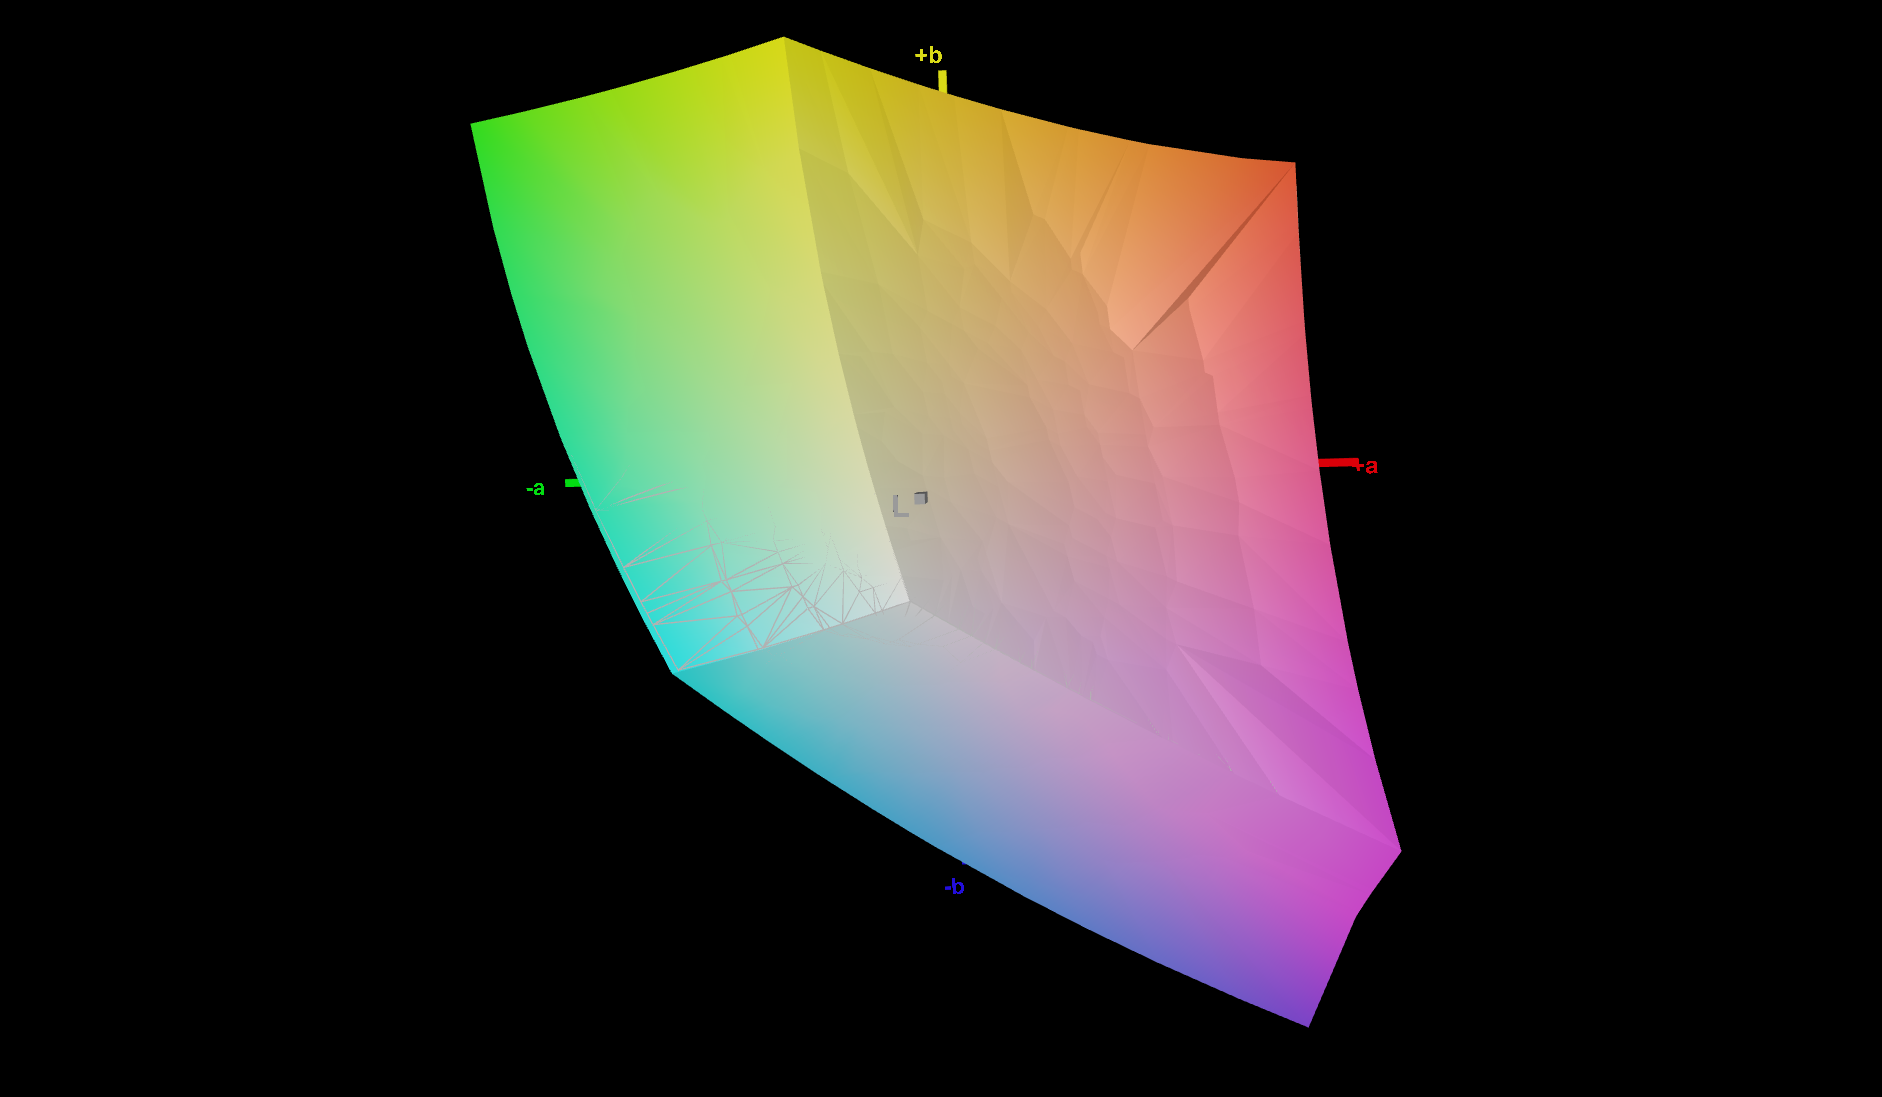
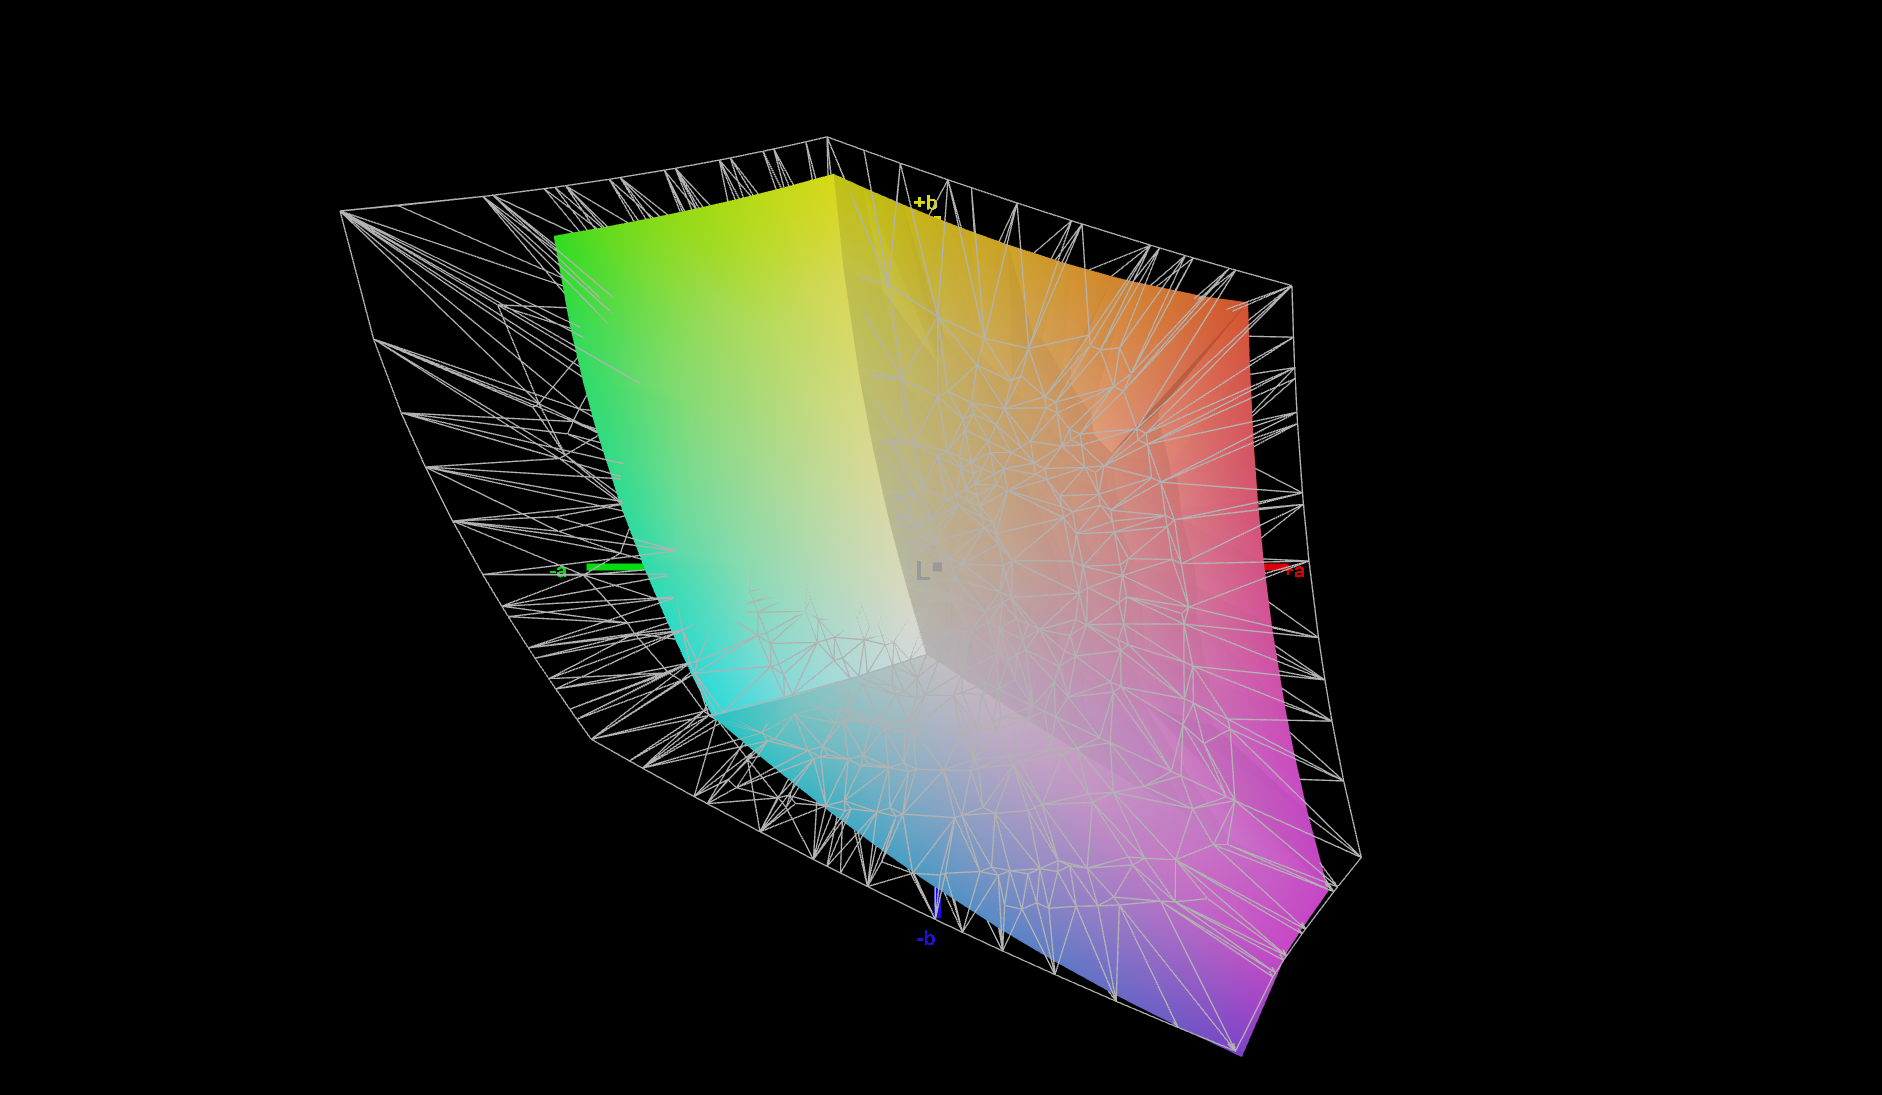
71.4% AdobeRGB 1998 (Argyll 3D)
99.8% sRGB (Argyll 3D)
69.4% Display P3 (Argyll 3D)
Gamma: 2.14
CCT: 6554 K
| Lenovo ThinkPad T14s G3 21CQ002LGE MNE007JA1-1, LTPS IPS LED, 1920x1200, 14" | Lenovo ThinkPad T14s G3 21BR00CDGE MNE007JA1-1, IPS LED, 1920x1200, 14" | Lenovo ThinkPad T14s G2 20XGS01100 NE140FHM-N61, IPS LED, 1920x1080, 14" | Dell Latitude 9430 2-in-1 AU Optronics B140QAN, IPS, 2560x1600, 14" | HP EliteBook 845 G9 6F6H9EA AUOA49A, IPS, 1920x1200, 14" | |
|---|---|---|---|---|---|
| Display | -2% | -5% | 8% | 5% | |
| Display P3 Coverage (%) | 69.4 | 67.8 -2% | 69.7 0% | 79.4 14% | 75.4 9% |
| sRGB Coverage (%) | 99.8 | 98.6 -1% | 91.8 -8% | 100 0% | 100 0% |
| AdobeRGB 1998 Coverage (%) | 71.4 | 70.1 -2% | 67.2 -6% | 79.4 11% | 76.6 7% |
| Response Times | -16% | -137% | -60% | -39% | |
| Response Time Grey 50% / Grey 80% * (ms) | 36.3 ? | 41.4 ? -14% | 84 ? -131% | 63.6 ? -75% | 58.8 ? -62% |
| Response Time Black / White * (ms) | 23.1 ? | 27.2 ? -18% | 56 ? -142% | 33.6 ? -45% | 26.7 ? -16% |
| PWM Frequency (Hz) | 2451 ? | ||||
| Screen | -34% | -147% | -41% | -28% | |
| Brightness middle (cd/m²) | 396 | 312 -21% | 397 0% | 517.7 31% | 408 3% |
| Brightness (cd/m²) | 379 | 301 -21% | 386 2% | 493 30% | 402 6% |
| Brightness Distribution (%) | 92 | 93 1% | 88 -4% | 90 -2% | 92 0% |
| Black Level * (cd/m²) | 0.26 | 0.16 38% | 0.28 -8% | 0.33 -27% | 0.24 8% |
| Contrast (:1) | 1523 | 1950 28% | 1418 -7% | 1569 3% | 1700 12% |
| Colorchecker dE 2000 * | 1.3 | 2.2 -69% | 5.8 -346% | 3.38 -160% | 2.09 -61% |
| Colorchecker dE 2000 max. * | 2.7 | 5.6 -107% | 12.6 -367% | 6.25 -131% | 5.09 -89% |
| Colorchecker dE 2000 calibrated * | 0.7 | 1.3 -86% | 1.9 -171% | 0.41 41% | 1.56 -123% |
| Greyscale dE 2000 * | 1.6 | 2.7 -69% | 8.3 -419% | 4 -150% | 1.7 -6% |
| Gamma | 2.14 103% | 2.11 104% | 2.07 106% | 2.13 103% | 2.138 103% |
| CCT | 6554 99% | 6196 105% | 6867 95% | 6186 105% | 6628 98% |
| Media total (Programa/Opciones) | -17% /
-25% | -96% /
-115% | -31% /
-33% | -21% /
-22% |
* ... más pequeño es mejor
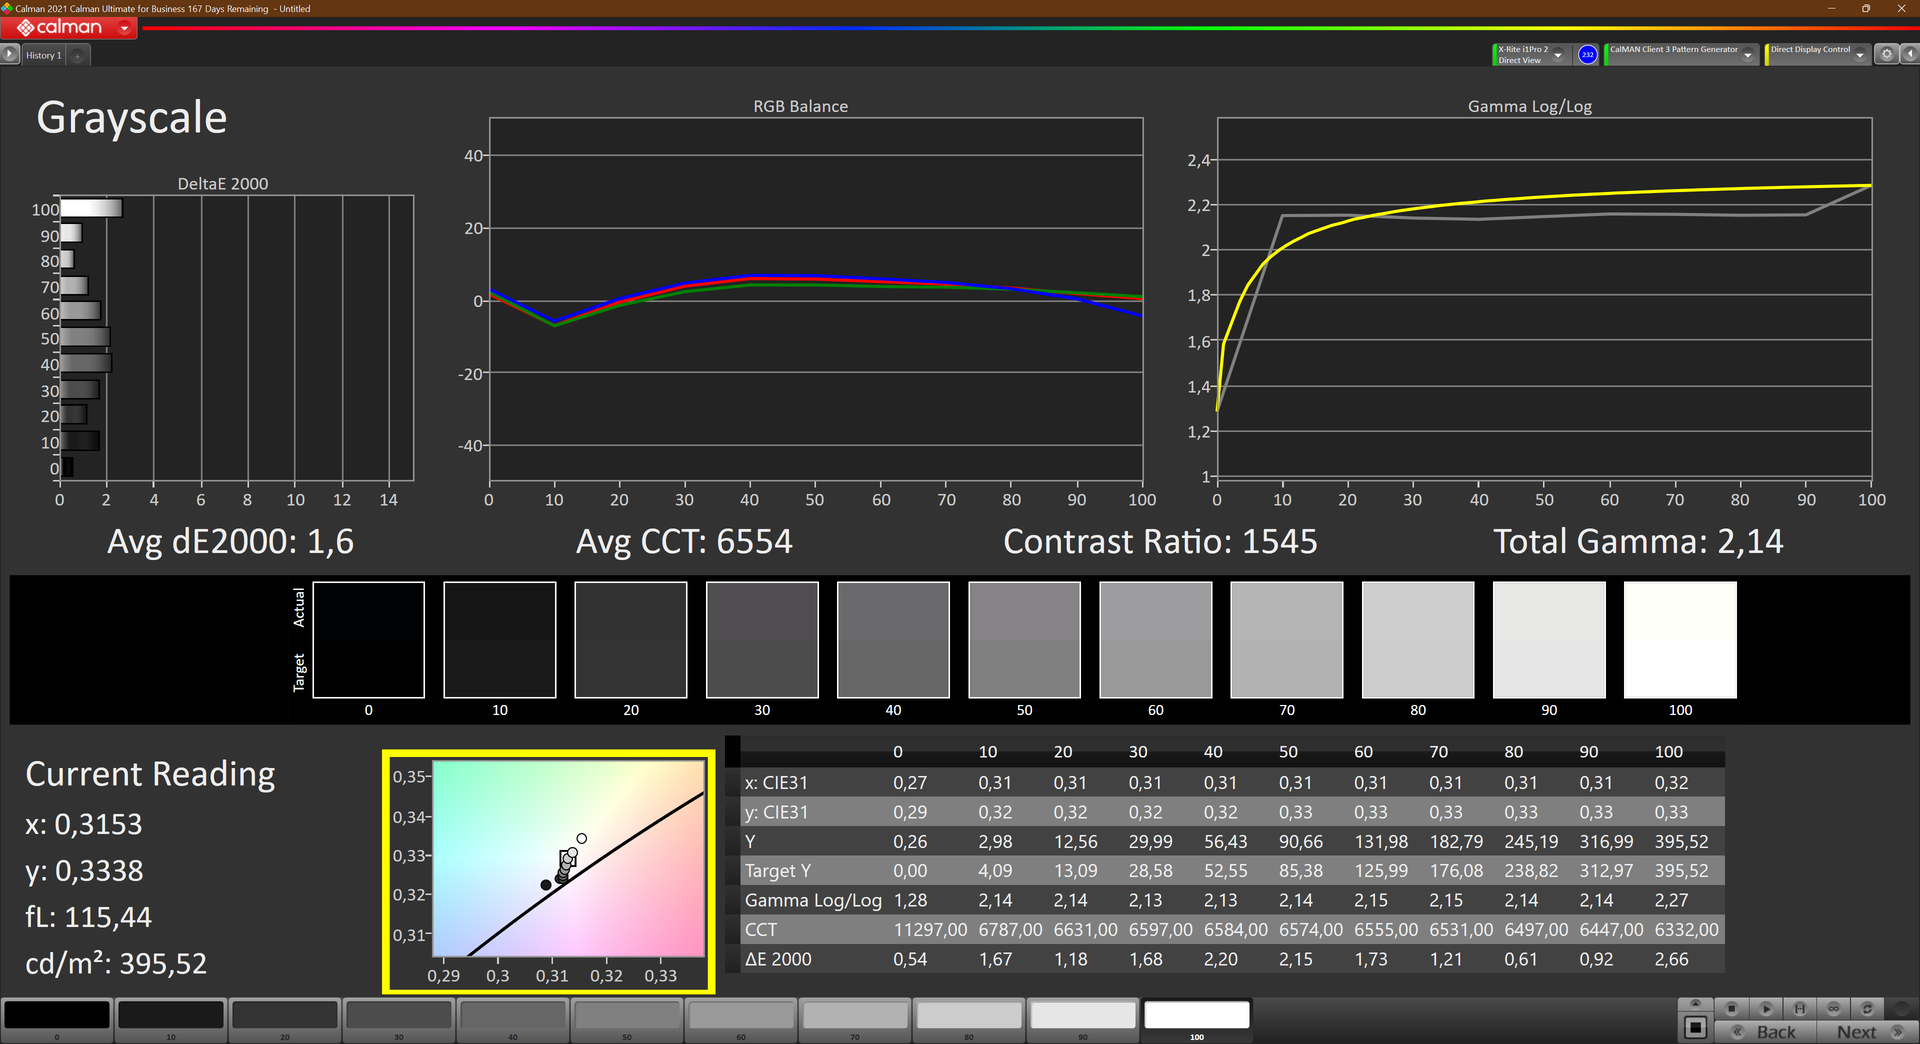
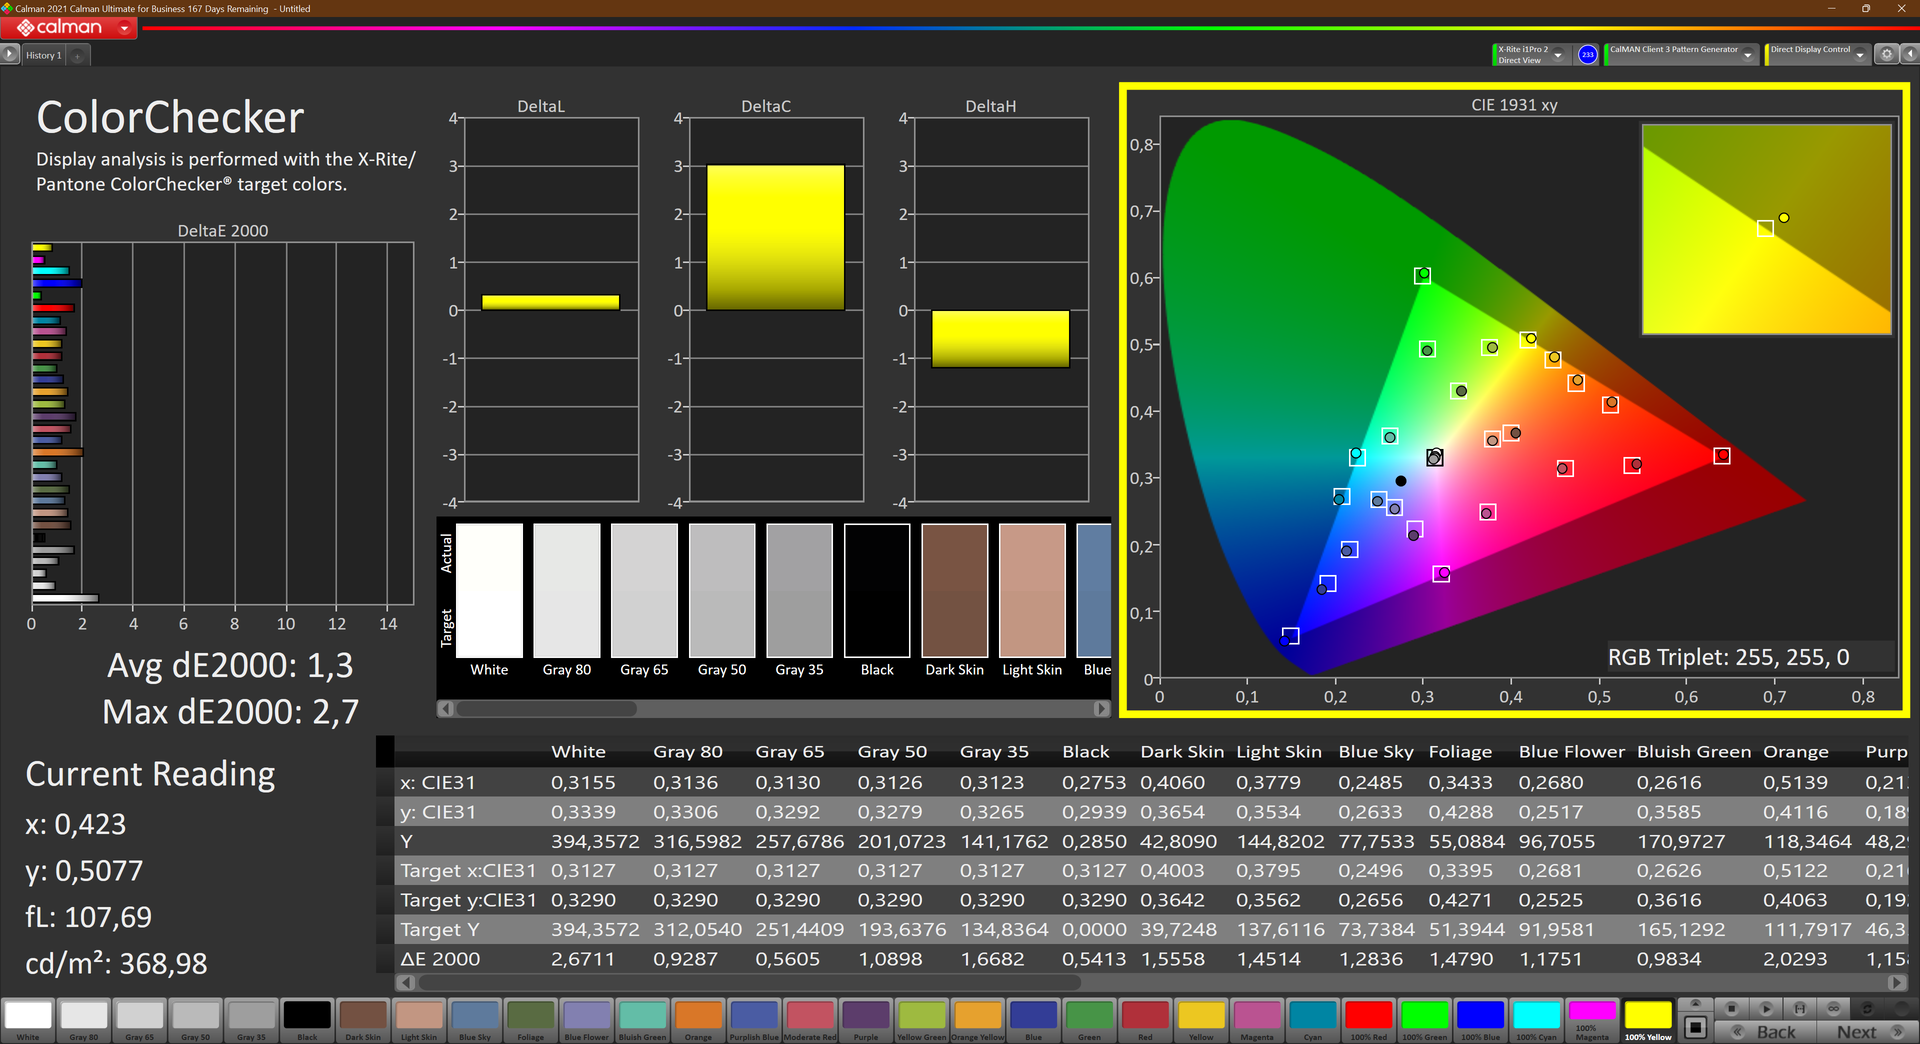
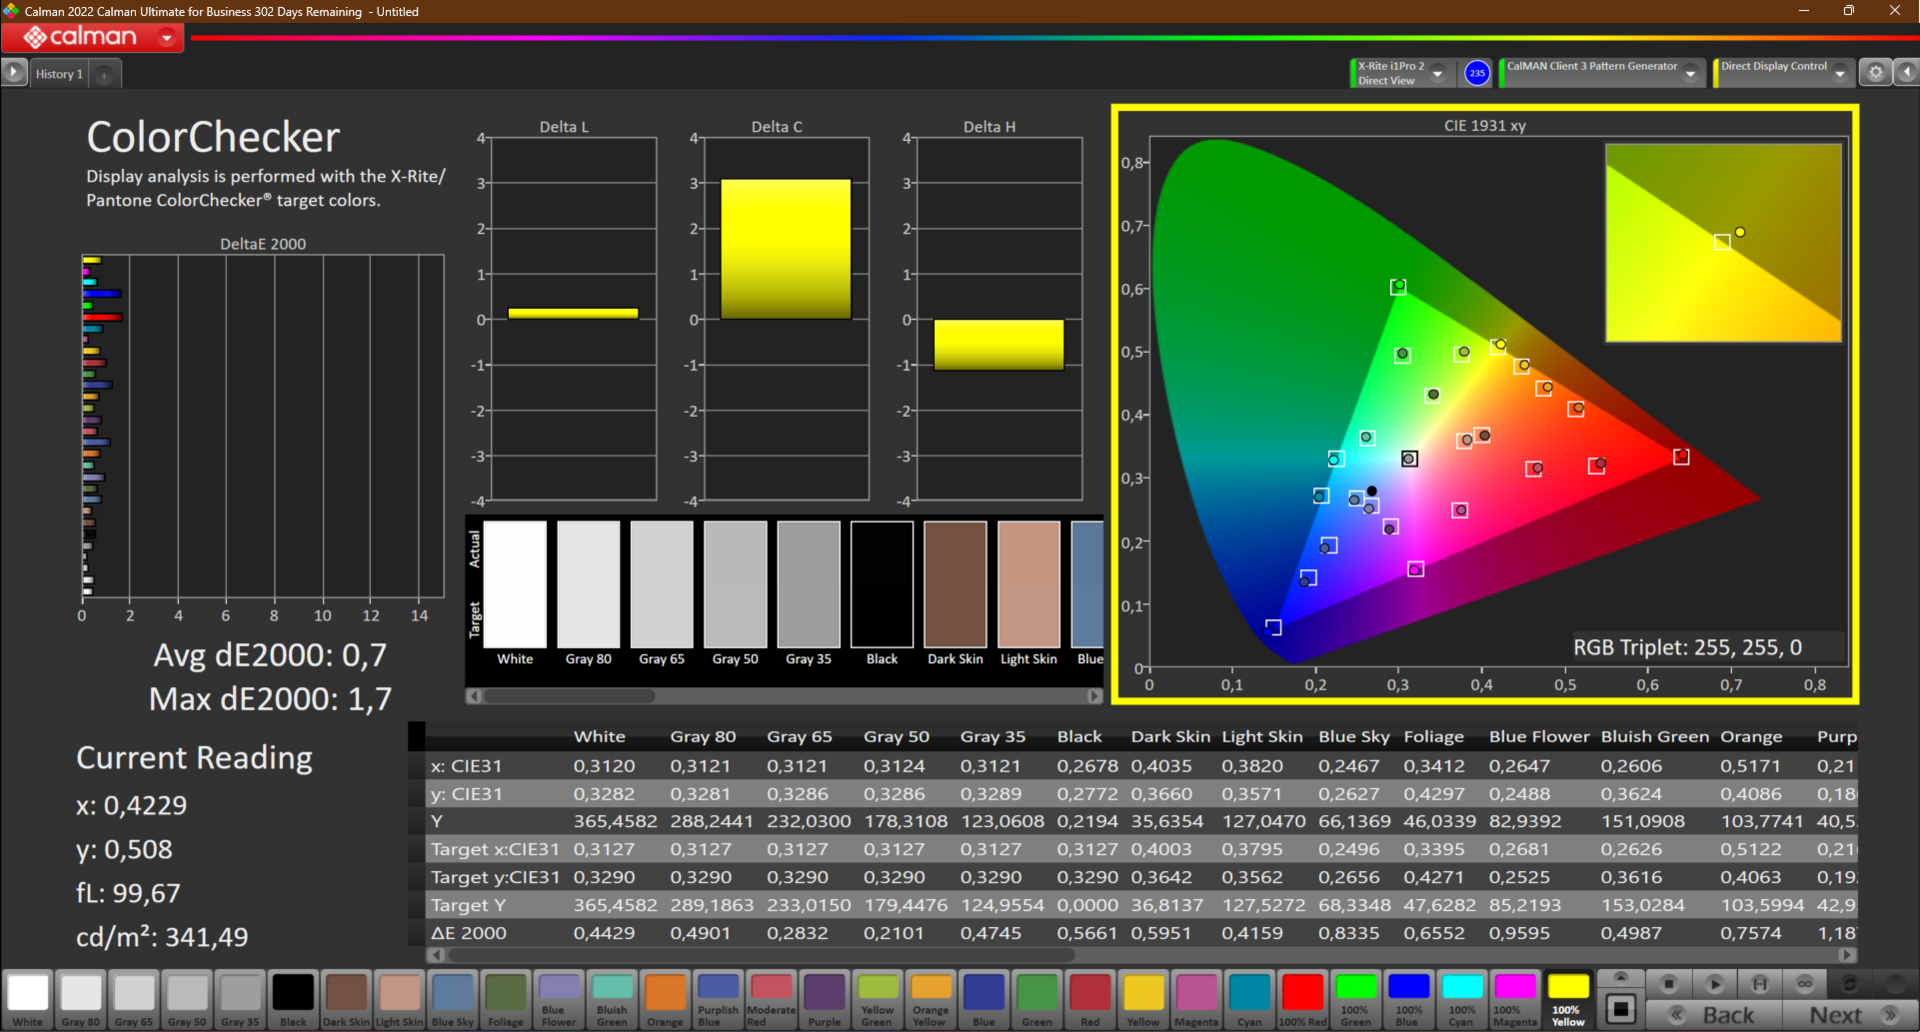
Los valores DeltaE ya son muy bajos en el estado de entrega, y una media de 1,3 en el Calman ColorChecker es muy buena. Mediante una calibración con el colorímetro X-Rite i1Pro 2, incluso conseguimos mejorar aún más el valor DeltaE del ColorChecker hasta un excelente 0,7, que corresponde a una visualización del color precisa y sin ningún matiz. Como siempre, puedes descargar gratuitamente el perfil que hemos creado desde el enlace anterior.
Lenovo anuncia un 100% de sRGB para el panel de bajo consumo, y nosotros medimos un 99.8%. Esto significa que nada debería impedirte usarlo para tareas de procesado de imagen a un nivel sencillo. Sin embargo, para la visualización de los espacios de color más amplios AdobeRGB y DCI-P3, necesitarías usar una pantalla externa.
El Lenovo ThinkPad T14s Gen 3 se muestra bastante usable en exteriores, pero esto no es particularmente sorprendente, ya que el brillo es relativamente alto y ofrece una superficie de pantalla mate.
Tiempos de respuesta del display
| ↔ Tiempo de respuesta de Negro a Blanco | ||
|---|---|---|
| 23.1 ms ... subida ↗ y bajada ↘ combinada | ↗ 10.4 ms subida | 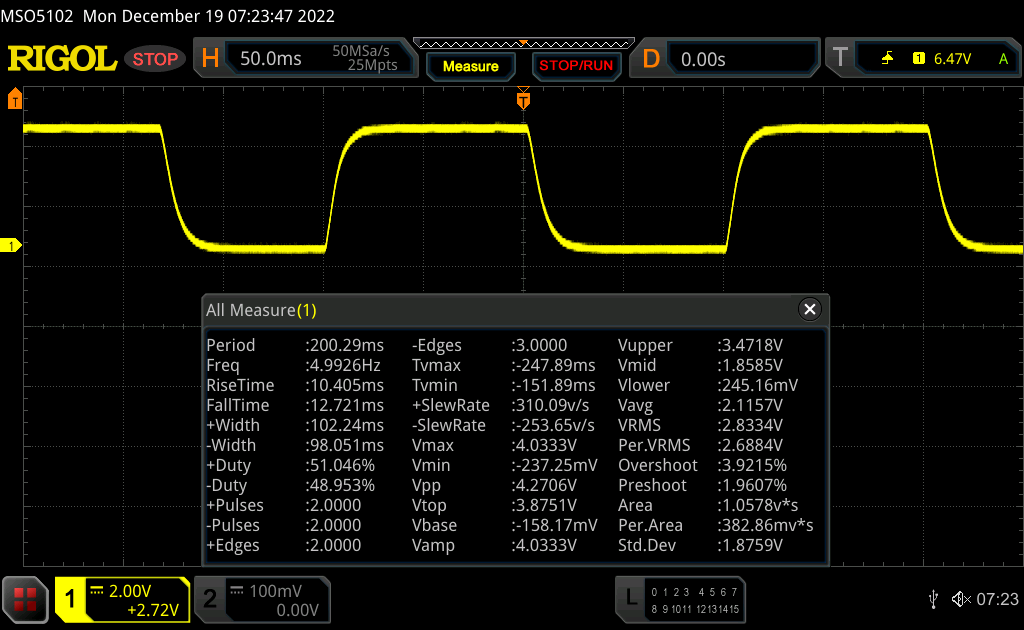 |
| ↘ 12.7 ms bajada | ||
| La pantalla mostró buenos tiempos de respuesta en nuestros tests pero podría ser demasiado lenta para los jugones competitivos. En comparación, todos los dispositivos de prueba van de ##min### (mínimo) a 240 (máximo) ms. » 53 % de todos los dispositivos son mejores. Eso quiere decir que el tiempo de respuesta es peor que la media (19.8 ms) de todos los dispositivos testados. | ||
| ↔ Tiempo de respuesta 50% Gris a 80% Gris | ||
| 36.3 ms ... subida ↗ y bajada ↘ combinada | ↗ 16.4 ms subida |  |
| ↘ 19.8 ms bajada | ||
| La pantalla mostró tiempos de respuesta lentos en nuestros tests y podría ser demasiado lenta para los jugones. En comparación, todos los dispositivos de prueba van de ##min### (mínimo) a 636 (máximo) ms. » 52 % de todos los dispositivos son mejores. Eso quiere decir que el tiempo de respuesta es peor que la media (30.9 ms) de todos los dispositivos testados. | ||
Parpadeo de Pantalla / PWM (Pulse-Width Modulation)
| Parpadeo de Pantalla / PWM no detectado |  | ||
Comparación: 52 % de todos los dispositivos testados no usaron PWM para atenuar el display. Si se usó, medimos una media de 7744 (mínimo: 5 - máxmo: 343500) Hz. | |||
Rendimiento: Ryzen 6000 supera significativamente a Intel en el rendimiento multinúcleo
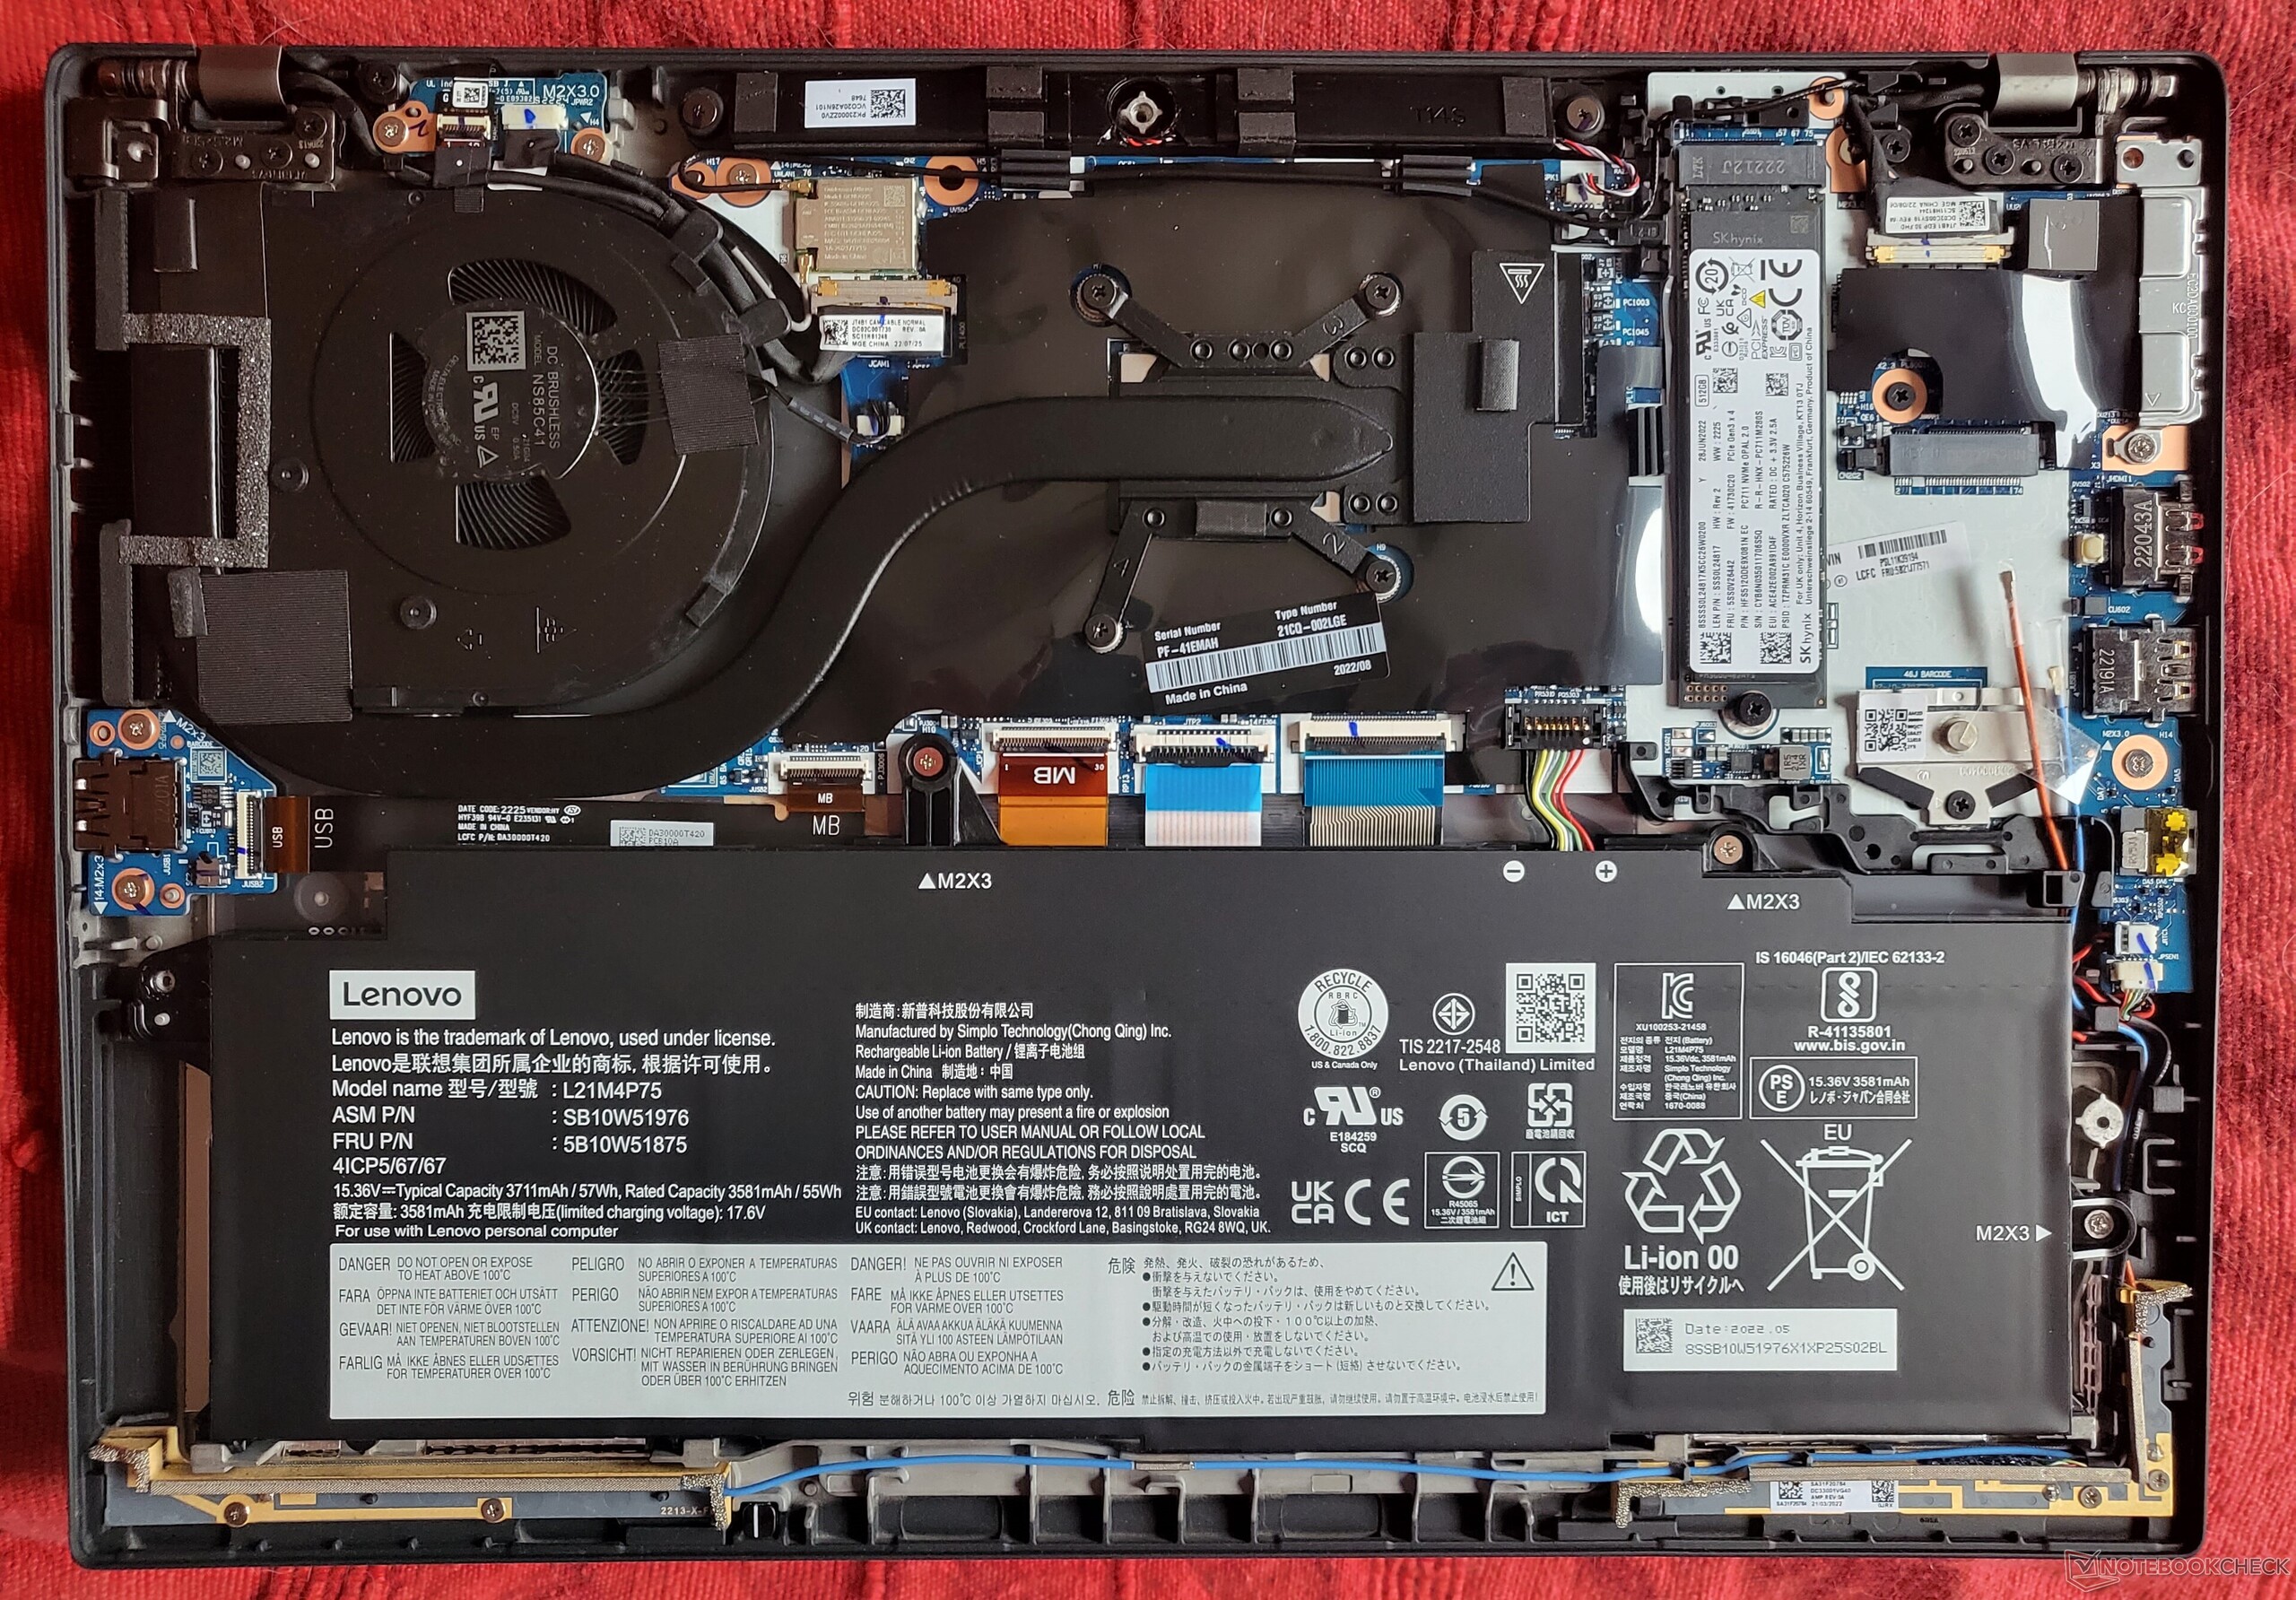
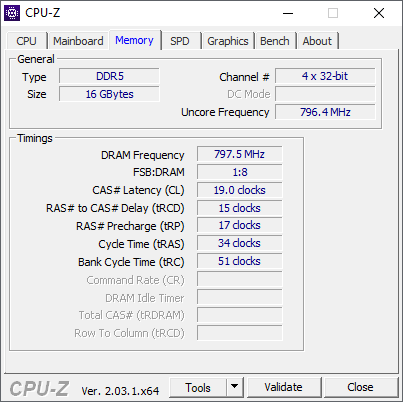
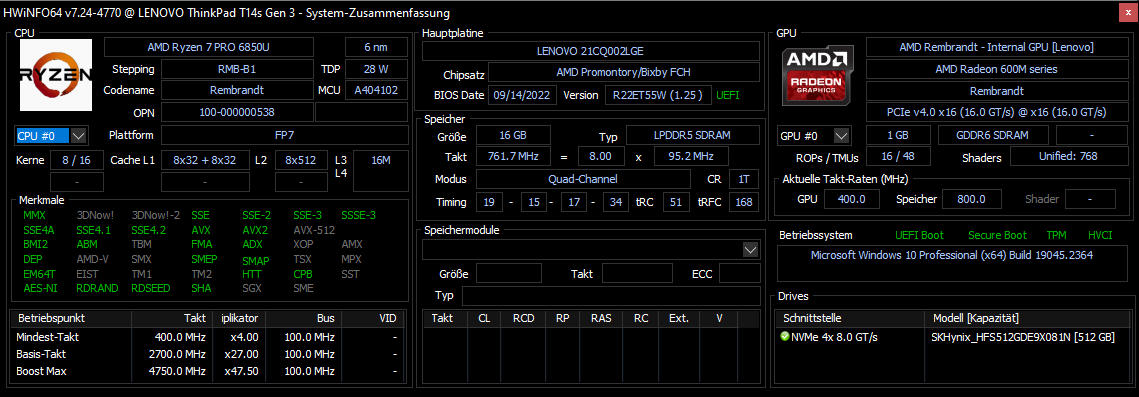
Lenovo vende el ThinkPad T14s G3 AMD con dos opciones de procesador diferentes: elAMD Ryzen 7 Pro 6850Uy el Ryzen 5 Pro 6650U. No hay GPU dedicada, y tienes que usar la AMD Radeon integrada, que es más potente en el Ryzen 7 (Radeon 680M) que en el Ryzen 5 (Radeon 660M). La memoria de trabajo está soldada. Lenovo usa el almacenamiento más actual LPDDR5-6400. El máximo disponible es de 32 GB, pero para los clientes menos exigentes, también se ofrecen 8 y 16 GB. Como solución de almacenamiento, hay un SSD M.2-2280 que se conecta por NVMe PCIe 4.0 x4.
Condiciones de la prueba
Lenovo no utiliza su propio software de gestión de energía en sus portátiles ThinkPad, pero los modos de rendimiento se pueden seleccionar directamente desde la Configuración de Windows. Hay tres modos diferentes que difieren en términos de límites de consumo de energía (PL2, que es el límite de energía a corto plazo, y PL1, que es el límite de energía a largo plazo):
- Mejor Eficiencia Energética: PL2 12 vatios, PL1 12 vatios
- Equilibrado: PL2 24 vatios, PL1 16,5 vatios
- Mejor rendimiento: PL2 30 vatios, PL1 24 vatios
Realizamos nuestras pruebas de rendimiento utilizando únicamente el modo "Mejor rendimiento", y "Equilibrado" se utiliza durante la prueba de batería WiFi.
Procesador
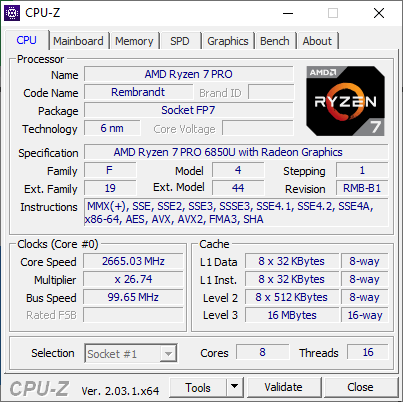
EnAMD Ryzen 7 Pro 6850U es un procesador de la generación Ryzen 6000 con el nombre en clave "Rembrandt" Se trata de un chip Zen3+ con un total de 8 núcleos y 16 hilos. La velocidad de reloj máxima es de 4,7 GHz y la velocidad de reloj básica de 2,7 GHz. AMD especifica que el TDP típico de esta CPU es de 15 a 28 vatios. Puedes encontrar comparaciones más exhaustivas en nuestra Lista de pruebas de CPU.
En el Lenovo ThinkPad T14s G3, el Ryzen 7 ofrece un rendimiento muy bueno. En las pruebas multinúcleo, el T14s queda por encima de todos los modelos de la competencia, incluso en el rendimiento bajo carga constante. Sin embargo, el panorama cambia en el rendimiento mononúcleo, donde el modelo Intel actual y también el Apple M2 rinden ligeramente mejor. Además, el rendimiento general de la CPU es mínimamente mejor en el ThinkPad T14 G3con el mismo procesador.
El rendimiento de la CPU no está limitado en funcionamiento con batería.
Cinebench R15 Multi Constant Load Test
Cinebench R23: Multi Core | Single Core
Cinebench R20: CPU (Multi Core) | CPU (Single Core)
Cinebench R15: CPU Multi 64Bit | CPU Single 64Bit
Blender: v2.79 BMW27 CPU
7-Zip 18.03: 7z b 4 | 7z b 4 -mmt1
Geekbench 5.5: Multi-Core | Single-Core
HWBOT x265 Benchmark v2.2: 4k Preset
LibreOffice : 20 Documents To PDF
R Benchmark 2.5: Overall mean
| CPU Performance rating | |
| Media de la clase Office | |
| Dell Latitude 9430 2-in-1 -1! | |
| Medio AMD Ryzen 7 PRO 6850U | |
| Lenovo ThinkPad T14 G3-21CF004NGE | |
| Lenovo ThinkPad T14s G3 21CQ002LGE | |
| Lenovo ThinkPad T14s G3 21BR00CDGE | |
| Lenovo ThinkPad X1 Carbon G10 21CB00DCGE | |
| Apple MacBook Pro 13 2022 M2 -5! | |
| Lenovo ThinkPad T14s G2 20XGS01100 | |
| HP EliteBook 845 G9 6F6H9EA | |
| Cinebench R23 / Multi Core | |
| Media de la clase Office (1673 - 22808, n=76, últimos 2 años) | |
| Medio AMD Ryzen 7 PRO 6850U (9923 - 12945, n=7) | |
| Lenovo ThinkPad T14 G3-21CF004NGE | |
| Lenovo ThinkPad T14s G3 21CQ002LGE | |
| Lenovo ThinkPad X1 Carbon G10 21CB00DCGE | |
| Dell Latitude 9430 2-in-1 | |
| Lenovo ThinkPad T14s G3 21BR00CDGE | |
| Apple MacBook Pro 13 2022 M2 | |
| Lenovo ThinkPad T14s G2 20XGS01100 | |
| HP EliteBook 845 G9 6F6H9EA | |
| Cinebench R23 / Single Core | |
| Dell Latitude 9430 2-in-1 | |
| Media de la clase Office (708 - 2130, n=76, últimos 2 años) | |
| Lenovo ThinkPad T14s G3 21BR00CDGE | |
| Lenovo ThinkPad X1 Carbon G10 21CB00DCGE | |
| Apple MacBook Pro 13 2022 M2 | |
| Lenovo ThinkPad T14s G3 21CQ002LGE | |
| Medio AMD Ryzen 7 PRO 6850U (1409 - 1536, n=7) | |
| Lenovo ThinkPad T14 G3-21CF004NGE | |
| HP EliteBook 845 G9 6F6H9EA | |
| Lenovo ThinkPad T14s G2 20XGS01100 | |
| Cinebench R20 / CPU (Multi Core) | |
| Media de la clase Office (648 - 8840, n=75, últimos 2 años) | |
| Medio AMD Ryzen 7 PRO 6850U (3784 - 5022, n=7) | |
| Lenovo ThinkPad T14 G3-21CF004NGE | |
| Lenovo ThinkPad T14s G3 21CQ002LGE | |
| Lenovo ThinkPad X1 Carbon G10 21CB00DCGE | |
| Dell Latitude 9430 2-in-1 | |
| Lenovo ThinkPad T14s G3 21BR00CDGE | |
| Lenovo ThinkPad T14s G2 20XGS01100 | |
| HP EliteBook 845 G9 6F6H9EA | |
| Apple MacBook Pro 13 2022 M2 | |
| Cinebench R20 / CPU (Single Core) | |
| Dell Latitude 9430 2-in-1 | |
| Media de la clase Office (345 - 816, n=75, últimos 2 años) | |
| Lenovo ThinkPad T14s G3 21BR00CDGE | |
| Lenovo ThinkPad X1 Carbon G10 21CB00DCGE | |
| Lenovo ThinkPad T14s G3 21CQ002LGE | |
| Medio AMD Ryzen 7 PRO 6850U (587 - 596, n=7) | |
| Lenovo ThinkPad T14 G3-21CF004NGE | |
| HP EliteBook 845 G9 6F6H9EA | |
| Lenovo ThinkPad T14s G2 20XGS01100 | |
| Apple MacBook Pro 13 2022 M2 | |
| Cinebench R15 / CPU Multi 64Bit | |
| Media de la clase Office (250 - 3380, n=77, últimos 2 años) | |
| Medio AMD Ryzen 7 PRO 6850U (1652 - 2092, n=7) | |
| Lenovo ThinkPad T14 G3-21CF004NGE | |
| Lenovo ThinkPad T14s G3 21CQ002LGE | |
| Lenovo ThinkPad X1 Carbon G10 21CB00DCGE | |
| Lenovo ThinkPad T14s G3 21BR00CDGE | |
| Dell Latitude 9430 2-in-1 | |
| Lenovo ThinkPad T14s G2 20XGS01100 | |
| HP EliteBook 845 G9 6F6H9EA | |
| Apple MacBook Pro 13 2022 M2 | |
| Cinebench R15 / CPU Single 64Bit | |
| Dell Latitude 9430 2-in-1 | |
| Media de la clase Office (99.5 - 316, n=77, últimos 2 años) | |
| Lenovo ThinkPad T14s G3 21BR00CDGE | |
| Lenovo ThinkPad T14s G3 21CQ002LGE | |
| Lenovo ThinkPad T14 G3-21CF004NGE | |
| Medio AMD Ryzen 7 PRO 6850U (228 - 244, n=7) | |
| HP EliteBook 845 G9 6F6H9EA | |
| Lenovo ThinkPad T14s G2 20XGS01100 | |
| Apple MacBook Pro 13 2022 M2 | |
| Lenovo ThinkPad X1 Carbon G10 21CB00DCGE | |
| Blender / v2.79 BMW27 CPU | |
| Apple MacBook Pro 13 2022 M2 | |
| Lenovo ThinkPad T14s G3 21BR00CDGE | |
| HP EliteBook 845 G9 6F6H9EA | |
| Media de la clase Office (158 - 1940, n=76, últimos 2 años) | |
| Lenovo ThinkPad X1 Carbon G10 21CB00DCGE | |
| Lenovo ThinkPad T14s G2 20XGS01100 | |
| Lenovo ThinkPad T14s G3 21CQ002LGE | |
| Lenovo ThinkPad T14 G3-21CF004NGE | |
| Medio AMD Ryzen 7 PRO 6850U (241 - 307, n=7) | |
| 7-Zip 18.03 / 7z b 4 | |
| Lenovo ThinkPad T14 G3-21CF004NGE | |
| Medio AMD Ryzen 7 PRO 6850U (44011 - 59045, n=7) | |
| Lenovo ThinkPad T14s G3 21CQ002LGE | |
| Lenovo ThinkPad T14s G2 20XGS01100 | |
| Media de la clase Office (7098 - 76886, n=77, últimos 2 años) | |
| Lenovo ThinkPad X1 Carbon G10 21CB00DCGE | |
| Lenovo ThinkPad T14s G3 21BR00CDGE | |
| Dell Latitude 9430 2-in-1 | |
| HP EliteBook 845 G9 6F6H9EA | |
| 7-Zip 18.03 / 7z b 4 -mmt1 | |
| Dell Latitude 9430 2-in-1 | |
| HP EliteBook 845 G9 6F6H9EA | |
| Media de la clase Office (3387 - 6469, n=77, últimos 2 años) | |
| Medio AMD Ryzen 7 PRO 6850U (5057 - 5662, n=7) | |
| Lenovo ThinkPad T14s G3 21CQ002LGE | |
| Lenovo ThinkPad T14 G3-21CF004NGE | |
| Lenovo ThinkPad T14s G2 20XGS01100 | |
| Lenovo ThinkPad T14s G3 21BR00CDGE | |
| Lenovo ThinkPad X1 Carbon G10 21CB00DCGE | |
| Geekbench 5.5 / Multi-Core | |
| Media de la clase Office (1483 - 16999, n=73, últimos 2 años) | |
| Dell Latitude 9430 2-in-1 | |
| Apple MacBook Pro 13 2022 M2 | |
| Lenovo ThinkPad X1 Carbon G10 21CB00DCGE | |
| Lenovo ThinkPad T14s G3 21BR00CDGE | |
| Medio AMD Ryzen 7 PRO 6850U (7044 - 9241, n=7) | |
| Lenovo ThinkPad T14 G3-21CF004NGE | |
| Lenovo ThinkPad T14s G3 21CQ002LGE | |
| Lenovo ThinkPad T14s G2 20XGS01100 | |
| HP EliteBook 845 G9 6F6H9EA | |
| Geekbench 5.5 / Single-Core | |
| Apple MacBook Pro 13 2022 M2 | |
| Media de la clase Office (811 - 2175, n=73, últimos 2 años) | |
| Dell Latitude 9430 2-in-1 | |
| Lenovo ThinkPad X1 Carbon G10 21CB00DCGE | |
| Lenovo ThinkPad T14s G3 21BR00CDGE | |
| Lenovo ThinkPad T14 G3-21CF004NGE | |
| Medio AMD Ryzen 7 PRO 6850U (1433 - 1533, n=7) | |
| Lenovo ThinkPad T14s G3 21CQ002LGE | |
| HP EliteBook 845 G9 6F6H9EA | |
| Lenovo ThinkPad T14s G2 20XGS01100 | |
| HWBOT x265 Benchmark v2.2 / 4k Preset | |
| Media de la clase Office (2.21 - 26, n=76, últimos 2 años) | |
| Lenovo ThinkPad T14 G3-21CF004NGE | |
| Medio AMD Ryzen 7 PRO 6850U (11.7 - 16.3, n=7) | |
| Lenovo ThinkPad T14s G3 21CQ002LGE | |
| Lenovo ThinkPad T14s G2 20XGS01100 | |
| Dell Latitude 9430 2-in-1 | |
| HP EliteBook 845 G9 6F6H9EA | |
| Lenovo ThinkPad T14s G3 21BR00CDGE | |
| Lenovo ThinkPad X1 Carbon G10 21CB00DCGE | |
| LibreOffice / 20 Documents To PDF | |
| HP EliteBook 845 G9 6F6H9EA | |
| Media de la clase Office (39.9 - 102.3, n=76, últimos 2 años) | |
| Medio AMD Ryzen 7 PRO 6850U (46.3 - 74, n=7) | |
| Lenovo ThinkPad T14s G3 21CQ002LGE | |
| Lenovo ThinkPad T14 G3-21CF004NGE | |
| Lenovo ThinkPad T14s G2 20XGS01100 | |
| Lenovo ThinkPad X1 Carbon G10 21CB00DCGE | |
| Dell Latitude 9430 2-in-1 | |
| Lenovo ThinkPad T14s G3 21BR00CDGE | |
| R Benchmark 2.5 / Overall mean | |
| Lenovo ThinkPad T14s G2 20XGS01100 | |
| Lenovo ThinkPad X1 Carbon G10 21CB00DCGE | |
| Lenovo ThinkPad T14 G3-21CF004NGE | |
| HP EliteBook 845 G9 6F6H9EA | |
| Medio AMD Ryzen 7 PRO 6850U (0.4932 - 0.544, n=7) | |
| Media de la clase Office (0.393 - 0.888, n=76, últimos 2 años) | |
| Lenovo ThinkPad T14s G3 21CQ002LGE | |
| Lenovo ThinkPad T14s G3 21BR00CDGE | |
| Dell Latitude 9430 2-in-1 | |
* ... más pequeño es mejor
AIDA64: FP32 Ray-Trace | FPU Julia | CPU SHA3 | CPU Queen | FPU SinJulia | FPU Mandel | CPU AES | CPU ZLib | FP64 Ray-Trace | CPU PhotoWorxx
| Performance rating | |
| Medio AMD Ryzen 7 PRO 6850U | |
| Media de la clase Office | |
| Lenovo ThinkPad T14s G3 21CQ002LGE | |
| Lenovo ThinkPad T14s G2 20XGS01100 | |
| HP EliteBook 845 G9 6F6H9EA | |
| Dell Latitude 9430 2-in-1 | |
| Lenovo ThinkPad T14s G3 21BR00CDGE | |
| Lenovo ThinkPad X1 Carbon G10 21CB00DCGE | |
| AIDA64 / FP32 Ray-Trace | |
| Media de la clase Office (2083 - 31245, n=83, últimos 2 años) | |
| Medio AMD Ryzen 7 PRO 6850U (11272 - 14704, n=8) | |
| Lenovo ThinkPad T14s G3 21CQ002LGE | |
| Lenovo ThinkPad T14s G2 20XGS01100 | |
| HP EliteBook 845 G9 6F6H9EA | |
| Dell Latitude 9430 2-in-1 | |
| Lenovo ThinkPad T14s G3 21BR00CDGE | |
| Lenovo ThinkPad X1 Carbon G10 21CB00DCGE | |
| AIDA64 / FPU Julia | |
| Medio AMD Ryzen 7 PRO 6850U (72242 - 92957, n=8) | |
| Lenovo ThinkPad T14s G3 21CQ002LGE | |
| Lenovo ThinkPad T14s G2 20XGS01100 | |
| Media de la clase Office (8191 - 125394, n=83, últimos 2 años) | |
| HP EliteBook 845 G9 6F6H9EA | |
| Dell Latitude 9430 2-in-1 | |
| Lenovo ThinkPad T14s G3 21BR00CDGE | |
| Lenovo ThinkPad X1 Carbon G10 21CB00DCGE | |
| AIDA64 / CPU SHA3 | |
| Media de la clase Office (433 - 5755, n=83, últimos 2 años) | |
| Medio AMD Ryzen 7 PRO 6850U (2419 - 3104, n=8) | |
| Lenovo ThinkPad T14s G3 21CQ002LGE | |
| Lenovo ThinkPad T14s G2 20XGS01100 | |
| Dell Latitude 9430 2-in-1 | |
| Lenovo ThinkPad T14s G3 21BR00CDGE | |
| HP EliteBook 845 G9 6F6H9EA | |
| Lenovo ThinkPad X1 Carbon G10 21CB00DCGE | |
| AIDA64 / CPU Queen | |
| Medio AMD Ryzen 7 PRO 6850U (86644 - 96912, n=7) | |
| Lenovo ThinkPad T14s G3 21CQ002LGE | |
| Lenovo ThinkPad T14s G2 20XGS01100 | |
| Lenovo ThinkPad X1 Carbon G10 21CB00DCGE | |
| HP EliteBook 845 G9 6F6H9EA | |
| Dell Latitude 9430 2-in-1 | |
| Media de la clase Office (22784 - 115197, n=67, últimos 2 años) | |
| Lenovo ThinkPad T14s G3 21BR00CDGE | |
| AIDA64 / FPU SinJulia | |
| Medio AMD Ryzen 7 PRO 6850U (10917 - 12571, n=8) | |
| Lenovo ThinkPad T14s G3 21CQ002LGE | |
| Lenovo ThinkPad T14s G2 20XGS01100 | |
| HP EliteBook 845 G9 6F6H9EA | |
| Media de la clase Office (1378 - 18321, n=83, últimos 2 años) | |
| Dell Latitude 9430 2-in-1 | |
| Lenovo ThinkPad X1 Carbon G10 21CB00DCGE | |
| Lenovo ThinkPad T14s G3 21BR00CDGE | |
| AIDA64 / FPU Mandel | |
| Medio AMD Ryzen 7 PRO 6850U (39609 - 51296, n=8) | |
| Lenovo ThinkPad T14s G3 21CQ002LGE | |
| Lenovo ThinkPad T14s G2 20XGS01100 | |
| HP EliteBook 845 G9 6F6H9EA | |
| Media de la clase Office (4601 - 66922, n=83, últimos 2 años) | |
| Dell Latitude 9430 2-in-1 | |
| Lenovo ThinkPad T14s G3 21BR00CDGE | |
| Lenovo ThinkPad X1 Carbon G10 21CB00DCGE | |
| AIDA64 / CPU AES | |
| Lenovo ThinkPad T14s G2 20XGS01100 | |
| Media de la clase Office (4854 - 155900, n=83, últimos 2 años) | |
| Medio AMD Ryzen 7 PRO 6850U (45568 - 60867, n=8) | |
| Lenovo ThinkPad T14s G3 21CQ002LGE | |
| Dell Latitude 9430 2-in-1 | |
| HP EliteBook 845 G9 6F6H9EA | |
| Lenovo ThinkPad T14s G3 21BR00CDGE | |
| Lenovo ThinkPad X1 Carbon G10 21CB00DCGE | |
| AIDA64 / CPU ZLib | |
| Media de la clase Office (114.6 - 1366, n=83, últimos 2 años) | |
| Medio AMD Ryzen 7 PRO 6850U (641 - 805, n=8) | |
| Lenovo ThinkPad T14s G3 21CQ002LGE | |
| Dell Latitude 9430 2-in-1 | |
| Lenovo ThinkPad T14s G3 21BR00CDGE | |
| Lenovo ThinkPad T14s G2 20XGS01100 | |
| HP EliteBook 845 G9 6F6H9EA | |
| Lenovo ThinkPad X1 Carbon G10 21CB00DCGE | |
| AIDA64 / FP64 Ray-Trace | |
| Media de la clase Office (1109 - 17834, n=83, últimos 2 años) | |
| Medio AMD Ryzen 7 PRO 6850U (5967 - 7821, n=8) | |
| Lenovo ThinkPad T14s G3 21CQ002LGE | |
| Lenovo ThinkPad T14s G2 20XGS01100 | |
| HP EliteBook 845 G9 6F6H9EA | |
| Dell Latitude 9430 2-in-1 | |
| Lenovo ThinkPad T14s G3 21BR00CDGE | |
| Lenovo ThinkPad X1 Carbon G10 21CB00DCGE | |
| AIDA64 / CPU PhotoWorxx | |
| Dell Latitude 9430 2-in-1 | |
| Lenovo ThinkPad T14s G3 21BR00CDGE | |
| Media de la clase Office (11090 - 65229, n=83, últimos 2 años) | |
| Lenovo ThinkPad X1 Carbon G10 21CB00DCGE | |
| Lenovo ThinkPad T14s G3 21CQ002LGE | |
| Medio AMD Ryzen 7 PRO 6850U (19707 - 27840, n=8) | |
| HP EliteBook 845 G9 6F6H9EA | |
| Lenovo ThinkPad T14s G2 20XGS01100 | |
Rendimiento del sistema
En PCMark 10, el Lenovo ThinkPad T14s G3 se lleva el primer puesto. Aunque no ocurre lo mismo en CrossMark, la distancia a la cabeza tampoco es muy grande. Por tanto, no sorprende que el Lenovo ThinkPad T14s Gen 3 funcione muy rápido y fluido en el día a día.
CrossMark: Overall | Productivity | Creativity | Responsiveness
| PCMark 10 / Score | |
| Media de la clase Office (2601 - 9298, n=68, últimos 2 años) | |
| Lenovo ThinkPad T14s G3 21CQ002LGE | |
| Medio AMD Ryzen 7 PRO 6850U, AMD Radeon 680M (5873 - 6311, n=7) | |
| Lenovo ThinkPad T14s G2 20XGS01100 | |
| HP EliteBook 845 G9 6F6H9EA | |
| Dell Latitude 9430 2-in-1 | |
| Lenovo ThinkPad T14s G3 21BR00CDGE | |
| PCMark 10 / Essentials | |
| Dell Latitude 9430 2-in-1 | |
| Lenovo ThinkPad T14s G2 20XGS01100 | |
| Media de la clase Office (3245 - 11594, n=68, últimos 2 años) | |
| Lenovo ThinkPad T14s G3 21BR00CDGE | |
| Lenovo ThinkPad T14s G3 21CQ002LGE | |
| HP EliteBook 845 G9 6F6H9EA | |
| Medio AMD Ryzen 7 PRO 6850U, AMD Radeon 680M (9151 - 10263, n=7) | |
| PCMark 10 / Productivity | |
| Media de la clase Office (5336 - 17243, n=68, últimos 2 años) | |
| Lenovo ThinkPad T14s G2 20XGS01100 | |
| Lenovo ThinkPad T14s G3 21CQ002LGE | |
| HP EliteBook 845 G9 6F6H9EA | |
| Medio AMD Ryzen 7 PRO 6850U, AMD Radeon 680M (8435 - 8891, n=7) | |
| Dell Latitude 9430 2-in-1 | |
| Lenovo ThinkPad T14s G3 21BR00CDGE | |
| PCMark 10 / Digital Content Creation | |
| Media de la clase Office (2049 - 13541, n=68, últimos 2 años) | |
| Medio AMD Ryzen 7 PRO 6850U, AMD Radeon 680M (6796 - 8422, n=7) | |
| Lenovo ThinkPad T14s G3 21CQ002LGE | |
| Lenovo ThinkPad T14s G2 20XGS01100 | |
| Dell Latitude 9430 2-in-1 | |
| HP EliteBook 845 G9 6F6H9EA | |
| Lenovo ThinkPad T14s G3 21BR00CDGE | |
| CrossMark / Overall | |
| Dell Latitude 9430 2-in-1 | |
| Lenovo ThinkPad T14s G3 21BR00CDGE | |
| Media de la clase Office (381 - 2010, n=75, últimos 2 años) | |
| Lenovo ThinkPad T14s G3 21CQ002LGE | |
| Medio AMD Ryzen 7 PRO 6850U, AMD Radeon 680M (1154 - 1442, n=7) | |
| Lenovo ThinkPad T14s G2 20XGS01100 | |
| CrossMark / Productivity | |
| Dell Latitude 9430 2-in-1 | |
| Lenovo ThinkPad T14s G3 21BR00CDGE | |
| Media de la clase Office (464 - 1880, n=75, últimos 2 años) | |
| Lenovo ThinkPad T14s G3 21CQ002LGE | |
| Medio AMD Ryzen 7 PRO 6850U, AMD Radeon 680M (1188 - 1444, n=7) | |
| Lenovo ThinkPad T14s G2 20XGS01100 | |
| CrossMark / Creativity | |
| Dell Latitude 9430 2-in-1 | |
| Media de la clase Office (319 - 2361, n=75, últimos 2 años) | |
| Lenovo ThinkPad T14s G3 21BR00CDGE | |
| Lenovo ThinkPad T14s G3 21CQ002LGE | |
| Lenovo ThinkPad T14s G2 20XGS01100 | |
| Medio AMD Ryzen 7 PRO 6850U, AMD Radeon 680M (1180 - 1523, n=7) | |
| CrossMark / Responsiveness | |
| Dell Latitude 9430 2-in-1 | |
| Lenovo ThinkPad T14s G3 21BR00CDGE | |
| Media de la clase Office (360 - 1820, n=75, últimos 2 años) | |
| Lenovo ThinkPad T14s G3 21CQ002LGE | |
| Medio AMD Ryzen 7 PRO 6850U, AMD Radeon 680M (990 - 1282, n=7) | |
| Lenovo ThinkPad T14s G2 20XGS01100 | |
| PCMark 10 Score | 6152 puntos | |
ayuda | ||
| AIDA64 / Memory Copy | |
| Dell Latitude 9430 2-in-1 | |
| Media de la clase Office (20075 - 110930, n=80, últimos 2 años) | |
| Lenovo ThinkPad T14s G3 21BR00CDGE | |
| Lenovo ThinkPad T14s G3 21CQ002LGE | |
| Medio AMD Ryzen 7 PRO 6850U (31003 - 48605, n=8) | |
| Lenovo ThinkPad T14s G2 20XGS01100 | |
| HP EliteBook 845 G9 6F6H9EA | |
| AIDA64 / Memory Read | |
| Media de la clase Office (10084 - 128030, n=81, últimos 2 años) | |
| Lenovo ThinkPad T14s G3 21BR00CDGE | |
| Dell Latitude 9430 2-in-1 | |
| Medio AMD Ryzen 7 PRO 6850U (34682 - 45912, n=8) | |
| Lenovo ThinkPad T14s G3 21CQ002LGE | |
| Lenovo ThinkPad T14s G2 20XGS01100 | |
| HP EliteBook 845 G9 6F6H9EA | |
| AIDA64 / Memory Write | |
| Media de la clase Office (20073 - 119858, n=81, últimos 2 años) | |
| Dell Latitude 9430 2-in-1 | |
| Lenovo ThinkPad T14s G3 21BR00CDGE | |
| Lenovo ThinkPad T14s G3 21CQ002LGE | |
| Medio AMD Ryzen 7 PRO 6850U (34532 - 51096, n=8) | |
| Lenovo ThinkPad T14s G2 20XGS01100 | |
| HP EliteBook 845 G9 6F6H9EA | |
| AIDA64 / Memory Latency | |
| Lenovo ThinkPad T14s G3 21CQ002LGE | |
| Lenovo ThinkPad T14s G2 20XGS01100 | |
| Medio AMD Ryzen 7 PRO 6850U (86.1 - 135.3, n=8) | |
| Media de la clase Office (7.6 - 162.9, n=76, últimos 2 años) | |
| Dell Latitude 9430 2-in-1 | |
| HP EliteBook 845 G9 6F6H9EA | |
| Lenovo ThinkPad T14s G3 21BR00CDGE | |
* ... más pequeño es mejor
Latencias del CPD
Aunque las latencias DPC medidas no son especialmente altas, siguen siendo problemáticas para trabajar con audio y vídeo en tiempo real, al menos en la versión que probamos, con el estado de los controladores actuales en el momento de nuestras pruebas.
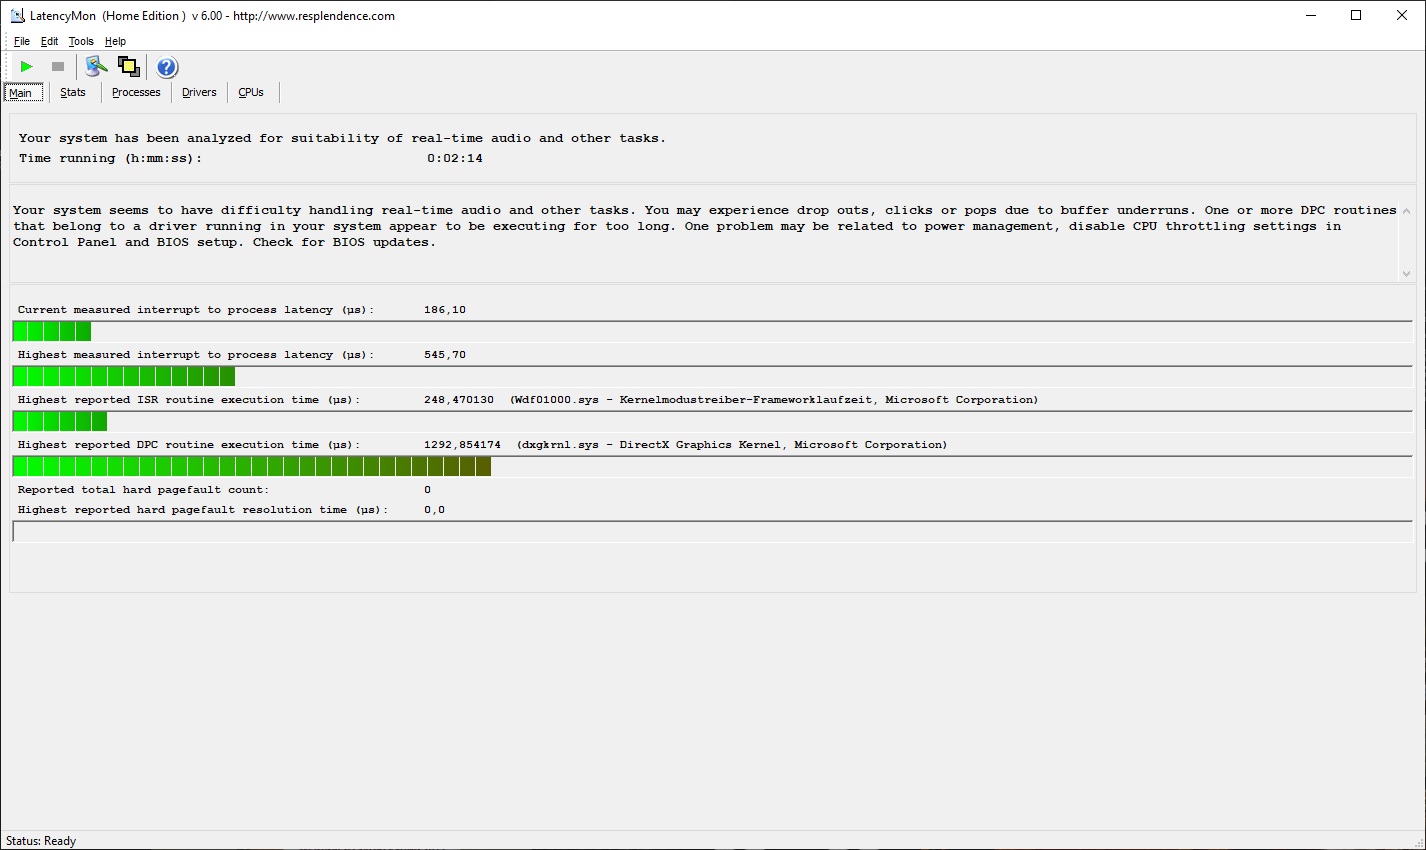
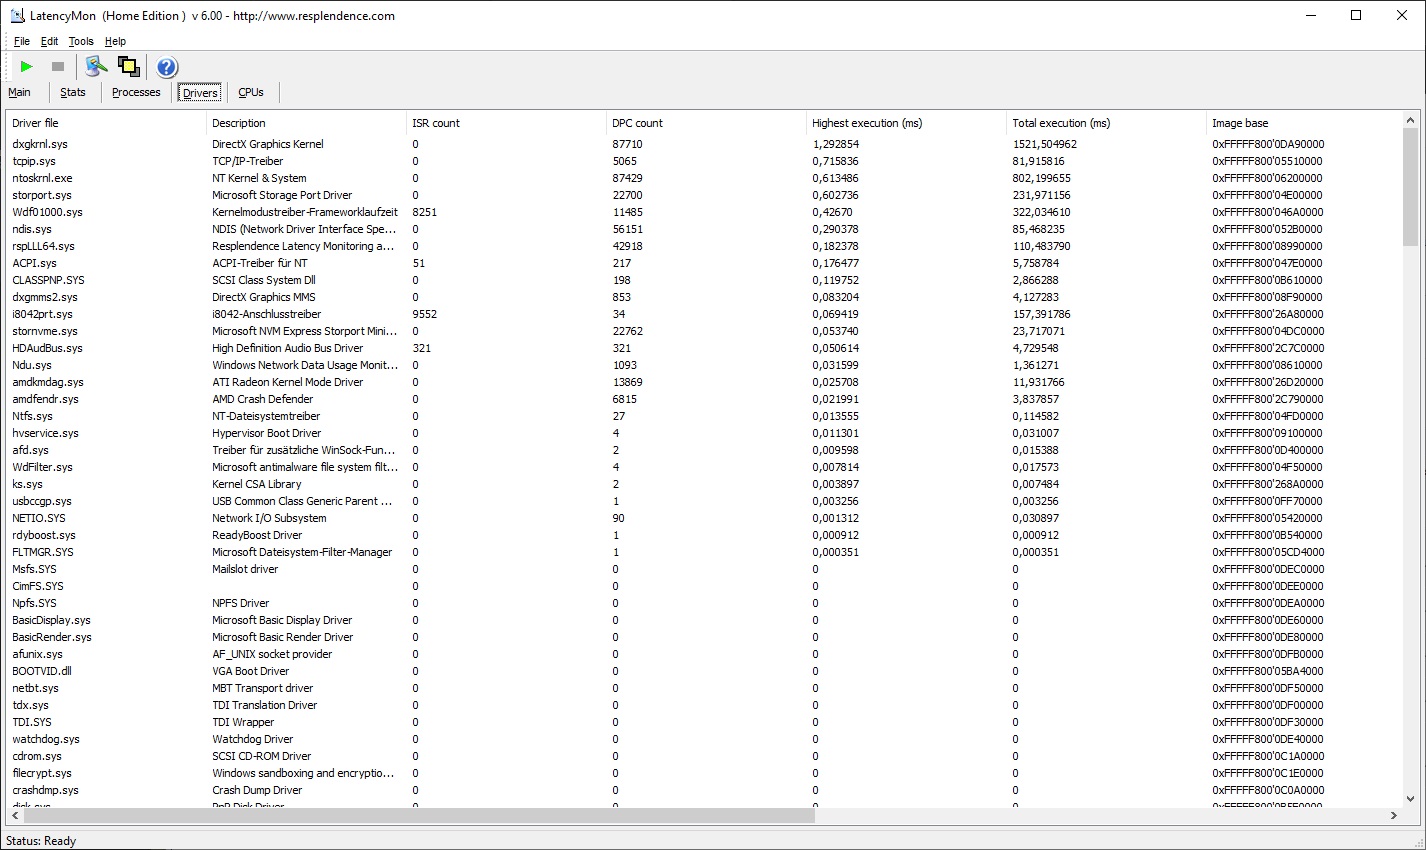
| DPC Latencies / LatencyMon - interrupt to process latency (max), Web, Youtube, Prime95 | |
| Lenovo ThinkPad T14s G2 20XGS01100 | |
| HP EliteBook 845 G9 6F6H9EA | |
| Lenovo ThinkPad T14s G3 21BR00CDGE | |
| Dell Latitude 9430 2-in-1 | |
| Lenovo ThinkPad T14s G3 21CQ002LGE | |
* ... más pequeño es mejor
Solución de almacenamiento
El SSD Hynix de nuestra unidad de pruebas del Lenovo ThinkPad T14s G3 ofrece una capacidad de 512 GB. El SSD M.2-2280 se conecta a través del veloz estándar NVMe PCIe 4.0, logrando mejores resultados de pruebas que todos los competidores de nuestra comparación. Sin embargo, bajo carga constante, puede haber algunas caídas de rendimiento, lo que podría deberse a algunas limitaciones térmicas.

* ... más pequeño es mejor
Disk Throttling: DiskSpd Read Loop, Queue Depth 8
Tarjeta gráfica
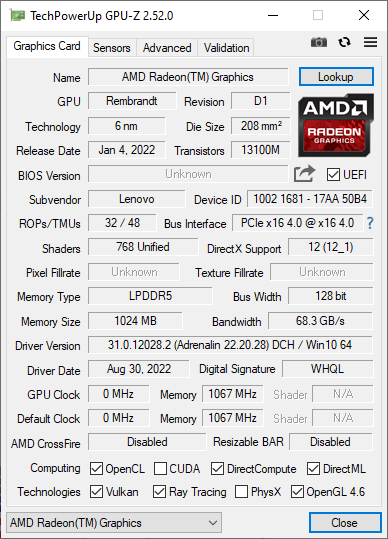
EnAMD Radeon 680M es una GPU integrada que no necesita almacenamiento propio. Esta GPU RNDA2 del Lenovo ThinkPad T14s G3 logra resultados de pruebas que están muy por delante de los competidores con GPU Intel, independientemente de si miramos las pruebas 3DMark o nuestras pruebas de juegos, aunque admitimos que esas son menos significativas para un portátil de empresa. Quizá lo más interesante sea Blender v3.3, donde la Radeon 680M del Lenovo ThinkPad corre el doble de rápido que la Radeon 660M del HP EliteBook 845 G9durante la prueba HIP. Con esto, el ThinkPad T14s G3 AMD también puede usarse bastante bien para renderizar.
| 3DMark 11 Performance | 9637 puntos | |
| 3DMark Cloud Gate Standard Score | 29621 puntos | |
| 3DMark Fire Strike Score | 5908 puntos | |
| 3DMark Time Spy Score | 2171 puntos | |
ayuda | ||
* ... más pequeño es mejor
| The Witcher 3 - 1920x1080 Ultra Graphics & Postprocessing (HBAO+) | |
| Lenovo ThinkPad T14s G3 21CQ002LGE | |
| Media de la clase Office (14.8 - 28.1, n=3, últimos 2 años) | |
| Dell Latitude 9430 2-in-1 | |
| Lenovo ThinkPad T14s G2 20XGS01100 | |
| Lenovo ThinkPad T14s G3 21BR00CDGE | |
| HP EliteBook 845 G9 6F6H9EA | |
| Final Fantasy XV Benchmark - 1920x1080 High Quality | |
| Media de la clase Office (8.09 - 79.5, n=71, últimos 2 años) | |
| Lenovo ThinkPad T14s G3 21CQ002LGE | |
| Dell Latitude 9430 2-in-1 | |
| Lenovo ThinkPad T14s G3 21BR00CDGE | |
| HP EliteBook 845 G9 6F6H9EA | |
| Dota 2 Reborn - 1920x1080 ultra (3/3) best looking | |
| Media de la clase Office (14.6 - 135, n=77, últimos 2 años) | |
| Dell Latitude 9430 2-in-1 | |
| Lenovo ThinkPad T14s G3 21CQ002LGE | |
| Lenovo ThinkPad T14s G2 20XGS01100 | |
| HP EliteBook 845 G9 6F6H9EA | |
| Lenovo ThinkPad T14s G3 21BR00CDGE | |
The Witcher 3 FPS Chart
| bajo | medio | alto | ultra | |
|---|---|---|---|---|
| The Witcher 3 (2015) | 119.7 | 40.5 | 24.5 | |
| Dota 2 Reborn (2015) | 109.1 | 90.4 | 66.3 | 56.6 |
| Final Fantasy XV Benchmark (2018) | 58.7 | 30.4 | 21.7 | |
| X-Plane 11.11 (2018) | 50.7 | 38.6 | 31.2 | |
| Strange Brigade (2018) | 133.7 | 54.7 | 45.1 | 38.3 |
Emisiones: ThinkPad T14s G3 con un ventilador casi silencioso
Niveles de ruido
Cuando empezamos a probar los niveles de ruido del ThinkPad T14s G3, primero nos preguntamos si el ventilador estaba funcionando, ya que el portátil ThinkPad permanecía muy silencioso. Durante el funcionamiento en inactivo, permanece completamente silencioso en todo momento, e incluso nuestro test para cargas medias no hace que el ventilador se active. Sólo bajo carga máxima, la refrigeración finalmente se activa, pero incluso entonces, permanece prácticamente silencioso con sólo 27.3 dB(a). Todos los modelos de la comparación sin excepción muestran niveles de ruido del ventilador más altos.
No notamos ningún quejido de bobina en el T14s Gen 3.
Ruido
| Ocioso |
| 22.8 / 22.8 / 22.8 dB(A) |
| Carga |
| 22.8 / 27.3 dB(A) |
 | ||
30 dB silencioso 40 dB(A) audible 50 dB(A) ruidosamente alto |
||
min: | ||
| Lenovo ThinkPad T14s G3 21CQ002LGE Radeon 680M, R7 PRO 6850U, SK Hynix PC711 512GB HFS512GDE9X081N | Lenovo ThinkPad T14s G3 21BR00CDGE Iris Xe G7 80EUs, i5-1235U, SK Hynix HFS512 GDE9X081N | Lenovo ThinkPad T14s G2 20XGS01100 Vega 8, R7 PRO 5850U, Lenovo UMIS AM630 RPETJ1T24MGE2QDQ | Dell Latitude 9430 2-in-1 Iris Xe G7 96EUs, i7-1265U | HP EliteBook 845 G9 6F6H9EA Radeon 660M, R5 PRO 6650U, Samsung PM991 MZVLQ512HBLU | |
|---|---|---|---|---|---|
| Noise | -16% | -21% | -26% | -23% | |
| apagado / medio ambiente * (dB) | 22.8 | 24.6 -8% | 26.81 -18% | 23.7 -4% | 24 -5% |
| Idle Minimum * (dB) | 22.8 | 24.6 -8% | 26.81 -18% | 23.7 -4% | 24 -5% |
| Idle Average * (dB) | 22.8 | 24.6 -8% | 26.81 -18% | 23.7 -4% | 25 -10% |
| Idle Maximum * (dB) | 22.8 | 24.6 -8% | 26.81 -18% | 23.7 -4% | 26 -14% |
| Load Average * (dB) | 22.8 | 26.1 -14% | 30.16 -32% | 35.1 -54% | 34 -49% |
| Witcher 3 ultra * (dB) | 27.5 | 35.9 -31% | 43.3 -57% | 38 -38% | |
| Load Maximum * (dB) | 27.3 | 36.3 -33% | 33.98 -24% | 43 -58% | 38 -39% |
* ... más pequeño es mejor
Temperatura
En general, el Lenovo ThinkPad T14s Gen 3 se mantiene muy fresco, e incluso bajo carga, casi ninguno de los puntos de medición sobrepasa los 40º Celsius. La única excepción es el área en el centro del teclado alrededor del TrackPoint, dónde particularmente el hueco entre las teclas alcanza temperaturas en el rango de 47.7 a 49.2 °C (118 - 120 °F). Como nota positiva, el reposamanos permanece cómodamente fresco en todos los casos.
No observamos ralentización alguna durante la prueba de estrés. Incluso después de una hora, el procesador es capaz de mantener su límite de energía a largo plazo de 24 vatios.
(-) La temperatura máxima en la parte superior es de 49.2 °C / 121 F, frente a la media de 34.3 °C / 94 F, que oscila entre 21.2 y 62.5 °C para la clase Office.
(+) El fondo se calienta hasta un máximo de 37.2 °C / 99 F, frente a la media de 36.8 °C / 98 F
(+) En reposo, la temperatura media de la parte superior es de 25.2 °C / 77# F, frente a la media del dispositivo de 29.5 °C / 85 F.
(±) Jugando a The Witcher 3, la temperatura media de la parte superior es de 34.7 °C / 94 F, frente a la media del dispositivo de 29.5 °C / 85 F.
(+) El reposamanos y el panel táctil están a una temperatura inferior a la de la piel, con un máximo de 28.2 °C / 82.8 F y, por tanto, son fríos al tacto.
(±) La temperatura media de la zona del reposamanos de dispositivos similares fue de 27.6 °C / 81.7 F (-0.6 °C / -1.1 F).
| Lenovo ThinkPad T14s G3 21CQ002LGE AMD Ryzen 7 PRO 6850U, AMD Radeon 680M | Lenovo ThinkPad T14s G3 21BR00CDGE Intel Core i5-1235U, Intel Iris Xe Graphics G7 80EUs | Lenovo ThinkPad T14s G2 20XGS01100 AMD Ryzen 7 PRO 5850U, AMD Radeon RX Vega 8 (Ryzen 4000/5000) | Dell Latitude 9430 2-in-1 Intel Core i7-1265U, Intel Iris Xe Graphics G7 96EUs | HP EliteBook 845 G9 6F6H9EA AMD Ryzen 5 PRO 6650U, AMD Radeon 660M | |
|---|---|---|---|---|---|
| Heat | -1% | 2% | 11% | -0% | |
| Maximum Upper Side * (°C) | 49.2 | 43.6 11% | 44.2 10% | 39.2 20% | 44 11% |
| Maximum Bottom * (°C) | 37.2 | 42 -13% | 38.9 -5% | 44.8 -20% | 45 -21% |
| Idle Upper Side * (°C) | 31.1 | 28.1 10% | 27.7 11% | 21.4 31% | 27 13% |
| Idle Bottom * (°C) | 26 | 28.9 -11% | 28.3 -9% | 22.4 14% | 27 -4% |
* ... más pequeño es mejor
Altavoces
Los altavoces son un aspecto en el que la serie ThinkPad T queda claramente superada por los modelos de gama alta de la serie X1. Los altavoces estéreo sobre el teclado producen un sonido equilibrado en medios y agudos pero también muy silencioso, falto de graves.
Lenovo ThinkPad T14s G3 21CQ002LGE análisis de audio
(-) | altavoces no muy altos (#70.2 dB)
Graves 100 - 315 Hz
(-) | casi sin bajos - de media 16.8% inferior a la mediana
(±) | la linealidad de los graves es media (14.6% delta a frecuencia anterior)
Medios 400 - 2000 Hz
(+) | medios equilibrados - a sólo 2.3% de la mediana
(+) | los medios son lineales (5.4% delta a la frecuencia anterior)
Altos 2 - 16 kHz
(+) | máximos equilibrados - a sólo 1.6% de la mediana
(+) | los máximos son lineales (3.5% delta a la frecuencia anterior)
Total 100 - 16.000 Hz
(±) | la linealidad del sonido global es media (15.7% de diferencia con la mediana)
En comparación con la misma clase
» 17% de todos los dispositivos probados de esta clase eran mejores, 5% similares, 78% peores
» El mejor tuvo un delta de 7%, la media fue 21%, el peor fue ###max##%
En comparación con todos los dispositivos probados
» 24% de todos los dispositivos probados eran mejores, 5% similares, 71% peores
» El mejor tuvo un delta de 4%, la media fue 23%, el peor fue ###max##%
Lenovo ThinkPad X1 Carbon G10 21CC001RGE análisis de audio
(±) | la sonoridad del altavoz es media pero buena (75.09 dB)
Graves 100 - 315 Hz
(±) | lubina reducida - en promedio 13.2% inferior a la mediana
(-) | los graves no son lineales (16% delta a la frecuencia anterior)
Medios 400 - 2000 Hz
(+) | medios equilibrados - a sólo 2.8% de la mediana
(+) | los medios son lineales (3.6% delta a la frecuencia anterior)
Altos 2 - 16 kHz
(+) | máximos equilibrados - a sólo 2.7% de la mediana
(+) | los máximos son lineales (4.1% delta a la frecuencia anterior)
Total 100 - 16.000 Hz
(+) | el sonido global es lineal (13.7% de diferencia con la mediana)
En comparación con la misma clase
» 9% de todos los dispositivos probados de esta clase eran mejores, 4% similares, 88% peores
» El mejor tuvo un delta de 7%, la media fue 21%, el peor fue ###max##%
En comparación con todos los dispositivos probados
» 15% de todos los dispositivos probados eran mejores, 4% similares, 81% peores
» El mejor tuvo un delta de 4%, la media fue 23%, el peor fue ###max##%
Gestión de la energía: AMD Ryzen 6000 garantiza una alta eficiencia
Consumo de energía
El Lenovo ThinkPad T14s G3 AMD es un portátil extremadamente eficiente. Comparado con el ThinkPad T14s G3 Intel, es alrededor de un 8% más eficiente de media. La distancia con el HP EliteBook 845 G9, que consume un 22% más de media, es aún mayor.
El portátil ThinkPad consume un máximo de unos 48,5 vatios, por lo que su consumo de energía está más que cubierto por su cargador de 65 vatios.
| Off / Standby | |
| Ocioso | |
| Carga |
|
Clave:
min: | |
| Lenovo ThinkPad T14s G3 21CQ002LGE R7 PRO 6850U, Radeon 680M, SK Hynix PC711 512GB HFS512GDE9X081N, LTPS IPS LED, 1920x1200, 14" | Lenovo ThinkPad T14s G3 21BR00CDGE i5-1235U, Iris Xe G7 80EUs, SK Hynix HFS512 GDE9X081N, IPS LED, 1920x1200, 14" | Lenovo ThinkPad T14s G2 20XGS01100 R7 PRO 5850U, Vega 8, Lenovo UMIS AM630 RPETJ1T24MGE2QDQ, IPS LED, 1920x1080, 14" | Dell Latitude 9430 2-in-1 i7-1265U, Iris Xe G7 96EUs, , IPS, 2560x1600, 14" | HP EliteBook 845 G9 6F6H9EA R5 PRO 6650U, Radeon 660M, Samsung PM991 MZVLQ512HBLU, IPS, 1920x1200, 14" | Medio AMD Radeon 680M | Media de la clase Office | |
|---|---|---|---|---|---|---|---|
| Power Consumption | -8% | -15% | -27% | -22% | -106% | -58% | |
| Idle Minimum * (Watt) | 2.2 | 2.3 -5% | 3.16 -44% | 2.9 -32% | 3 -36% | 6.93 ? -215% | 4.25 ? -93% |
| Idle Average * (Watt) | 4.4 | 4.6 -5% | 5.6 -27% | 5.8 -32% | 5 -14% | 8.98 ? -104% | 7.3 ? -66% |
| Idle Maximum * (Watt) | 5.1 | 5.6 -10% | 7.13 -40% | 6.6 -29% | 9 -76% | 10.5 ? -106% | 8.57 ? -68% |
| Load Average * (Watt) | 33.3 | 37.1 -11% | 30.86 7% | 49.2 -48% | 41 -23% | 53.5 ? -61% | 43.8 ? -32% |
| Witcher 3 ultra * (Watt) | 40.1 | 32.8 18% | 37 8% | 35.3 12% | 32.6 19% | ||
| Load Maximum * (Watt) | 48.5 | 65.8 -36% | 46.55 4% | 63.1 -30% | 50 -3% | 70.5 ? -45% | 64.5 ? -33% |
* ... más pequeño es mejor
Power Consumption The Witcher 3 / Stress Test
Power Consumption With External Monitor
Duración de la batería
Todos los modelos ThinkPad T14s, independientemente de su generación y del procesador que usen, tienen una batería de 57 Wh. Con esta batería interna, el portátil Lenovo logra una duración de unas 12 horas en la prueba WiFi con un brillo de pantalla de 150 cd/m². Curiosamente, esto es peor que elThinkPad T14s G2 AMDpero también significativamente más que el T14s G3 Intelque duró menos de 10 horas.
| Lenovo ThinkPad T14s G3 21CQ002LGE R7 PRO 6850U, Radeon 680M, 57 Wh | Lenovo ThinkPad T14s G3 21BR00CDGE i5-1235U, Iris Xe G7 80EUs, 57 Wh | Lenovo ThinkPad T14s G2 20XGS01100 R7 PRO 5850U, Vega 8, 57 Wh | Dell Latitude 9430 2-in-1 i7-1265U, Iris Xe G7 96EUs, 60 Wh | HP EliteBook 845 G9 6F6H9EA R5 PRO 6650U, Radeon 660M, 51 Wh | Media de la clase Office | |
|---|---|---|---|---|---|---|
| Duración de Batería | -34% | -5% | 2% | 1% | -9% | |
| WiFi v1.3 (h) | 12 | 9.6 -20% | 14.6 22% | 12.8 7% | 12.1 1% | 13.2 ? 10% |
| Load (h) | 2.5 | 1.3 -48% | 1.7 -32% | 2.4 -4% | 1.808 ? -28% |
Pro
Contra
Veredicto: El Lenovo ThinkPad T14s G3 es un ganador
Si hubiera un portátil correspondiente para el ThinkPad X1 Carbon G10con una CPU AMD, el Lenovo ThinkPad T14s Gen 3 AMD no estaría lejos de ello. Es el modelo que más se acerca a esta idea.
La combinación de las CPUs AMD Ryzen de la serie 6000 y la plataforma T14s es un gran acierto. Este es un portátil Lenovo que prácticamente no tiene debilidades, aparte de la capacidad de actualización y algunos puntos débiles en la pantalla de bajo consumo. Es relativamente ligero y compacto, sin dejar de ser robusto, gracias a la combinación de metales ligeros y fibra de carbono. El ThinkPad T14s G3 ofrece un equipamiento adecuado para empresas que incluye USB 4, muy buenos dispositivos de entrada y una pantalla mate y brillante. El Ryzen 7 Pro ofrece un alto rendimiento sin elevar demasiado el consumo de energía. El resultado es una buena duración de batería y un ventilador que casi siempre permanece silencioso.
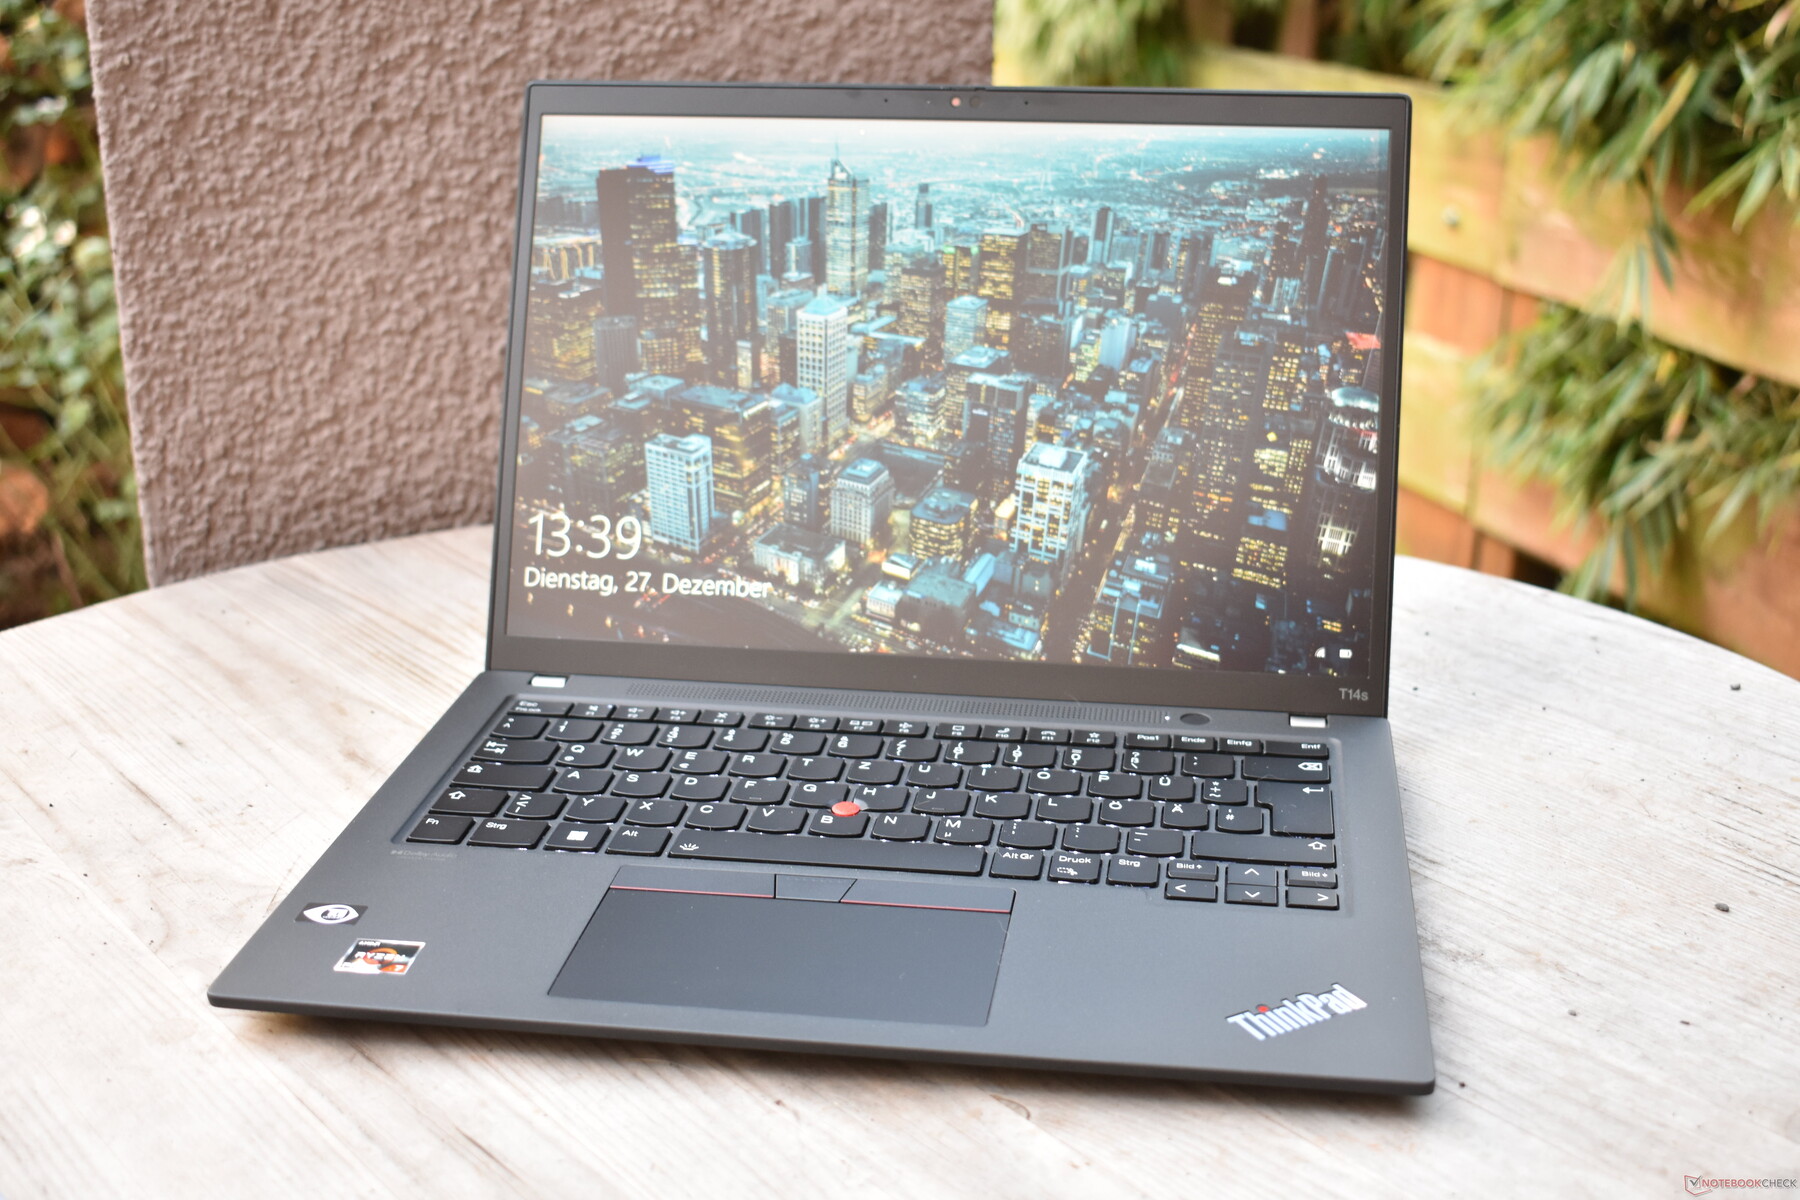
Compacto, robusto, rápido y con una batería de larga duración: el Lenovo ThinkPad T14s Gen 3 AMD tiene muchos atributos positivos
Por eso no sorprende que el Lenovo ThinkPad T14s G3 obtenga una muy buena evaluación de alrededor del 91%. Con ello, está bien posicionado en el mercado empresarial. Los competidores más calientes vienen de HP en forma del HP EliteBook 845 G9y Dell con elDell Latitude 9430 2 en 1. En la comparación con sus competidores, el ThinkPad impresiona particularmente por su menor peso, mayor duración de batería y ventiladores significativamente más silenciosos.
Precio y disponibilidad
El Lenovo ThinkPad T14s G3 AMD está disponible directamente en Lenovo a partir de unos 984 dólares. Una configuración similar a nuestra unidad de pruebas también está disponible en B&H por unos $1999por ejemplo.
Lenovo ThinkPad T14s G3 21CQ002LGE
- 01/17/2023 v7 (old)
Benjamin Herzig
Price comparison

