Análisis del portátil Lenovo ThinkPad X1 Carbon G10 30º aniversario: Edición OLED con problemas de resistencia
30 años es una eternidad en el negocio de la tecnología y también mucho tiempo en la vida humana. Lenovo celebra este hito con un modelo especial: El Lenovo ThinkPad X1 Carbon G10 Edición 30 Aniversario, que es el objeto del análisis de hoy.
Por supuesto, este no es el primer ThinkPad X1 Carbon Gen 10 que pasa bajo nuestra lupa, y por eso esta es una actualización de prueba. En términos de especificaciones, el modelo que nos ocupa es especialmente interesante por su pantalla OLED. También será emocionante ver si Lenovo ha mejorado el rendimiento de las CPU Intel Alder Lake P28desde el primer análisis del ThinkPad X1 Carbon G10entonces con un procesador i5.
Posibles contendientes en la comparación
Valoración | Fecha | Modelo | Peso | Altura | Tamaño | Resolución | Precio |
|---|---|---|---|---|---|---|---|
| 88.9 % v7 (old) | 12/2022 | Lenovo ThinkPad X1 Carbon G10 21CB00DCGE i7-1260P, Iris Xe G7 96EUs | 1.2 kg | 15.36 mm | 14.00" | 2880x1800 | |
| 90.2 % v7 (old) | 06/2022 | Lenovo ThinkPad X1 Carbon G10 21CC001RGE i5-1250P, Iris Xe G7 80EUs | 1.2 kg | 15.36 mm | 14.00" | 1920x1200 | |
| 90.3 % v7 (old) | 05/2021 | Lenovo ThinkPad X1 Carbon G9-20XWCTO1WW i7-1165G7, Iris Xe G7 96EUs | 1.2 kg | 14.9 mm | 14.00" | 3840x2400 | |
| 88.8 % v7 (old) | 10/2022 | Lenovo ThinkPad Z13 G1-21D20016GE R7 PRO 6860Z, Radeon 680M | 1.3 kg | 14 mm | 13.30" | 2880x1800 | |
| 91 % v7 (old) | 08/2022 | HP Elite Dragonfly G3 i7-1265U, Iris Xe G7 96EUs | 1.2 kg | 16.3 mm | 13.50" | 1920x1280 | |
| 89.8 % v7 (old) | 08/2022 | Dell Latitude 9430 2-in-1 i7-1265U, Iris Xe G7 96EUs | 1.5 kg | 13.94 mm | 14.00" | 2560x1600 |
Diferencias con el modelo normal
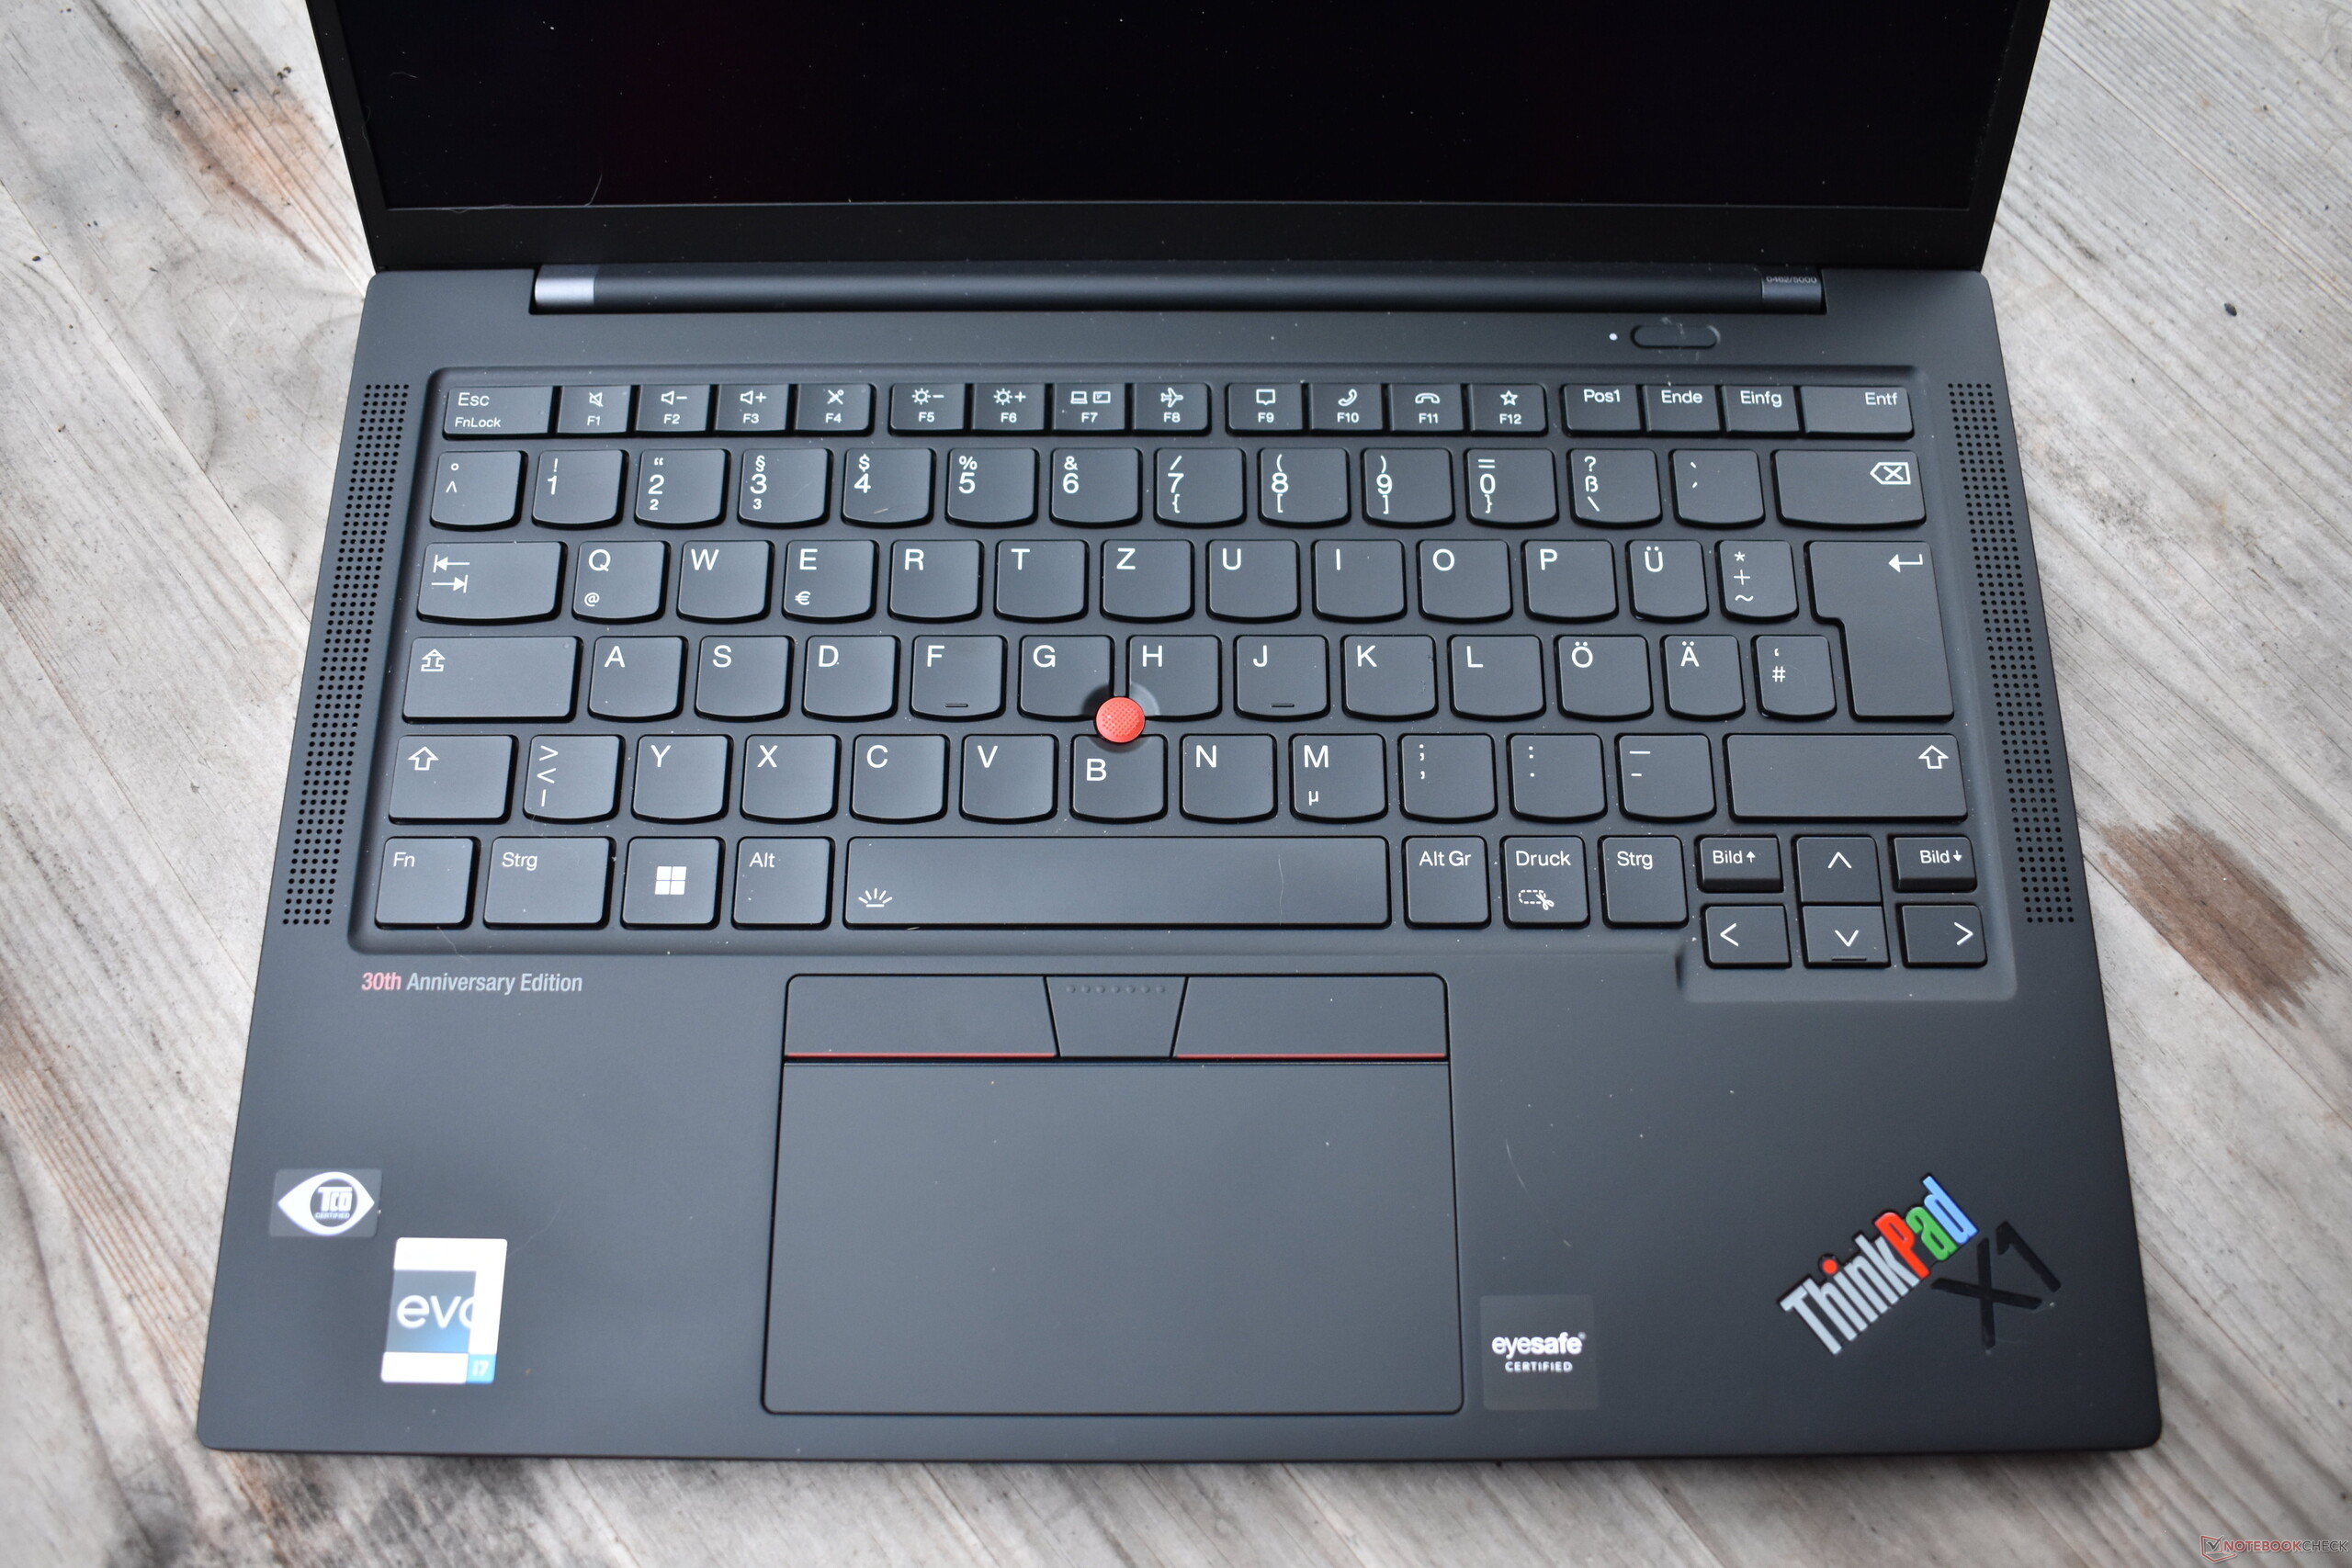
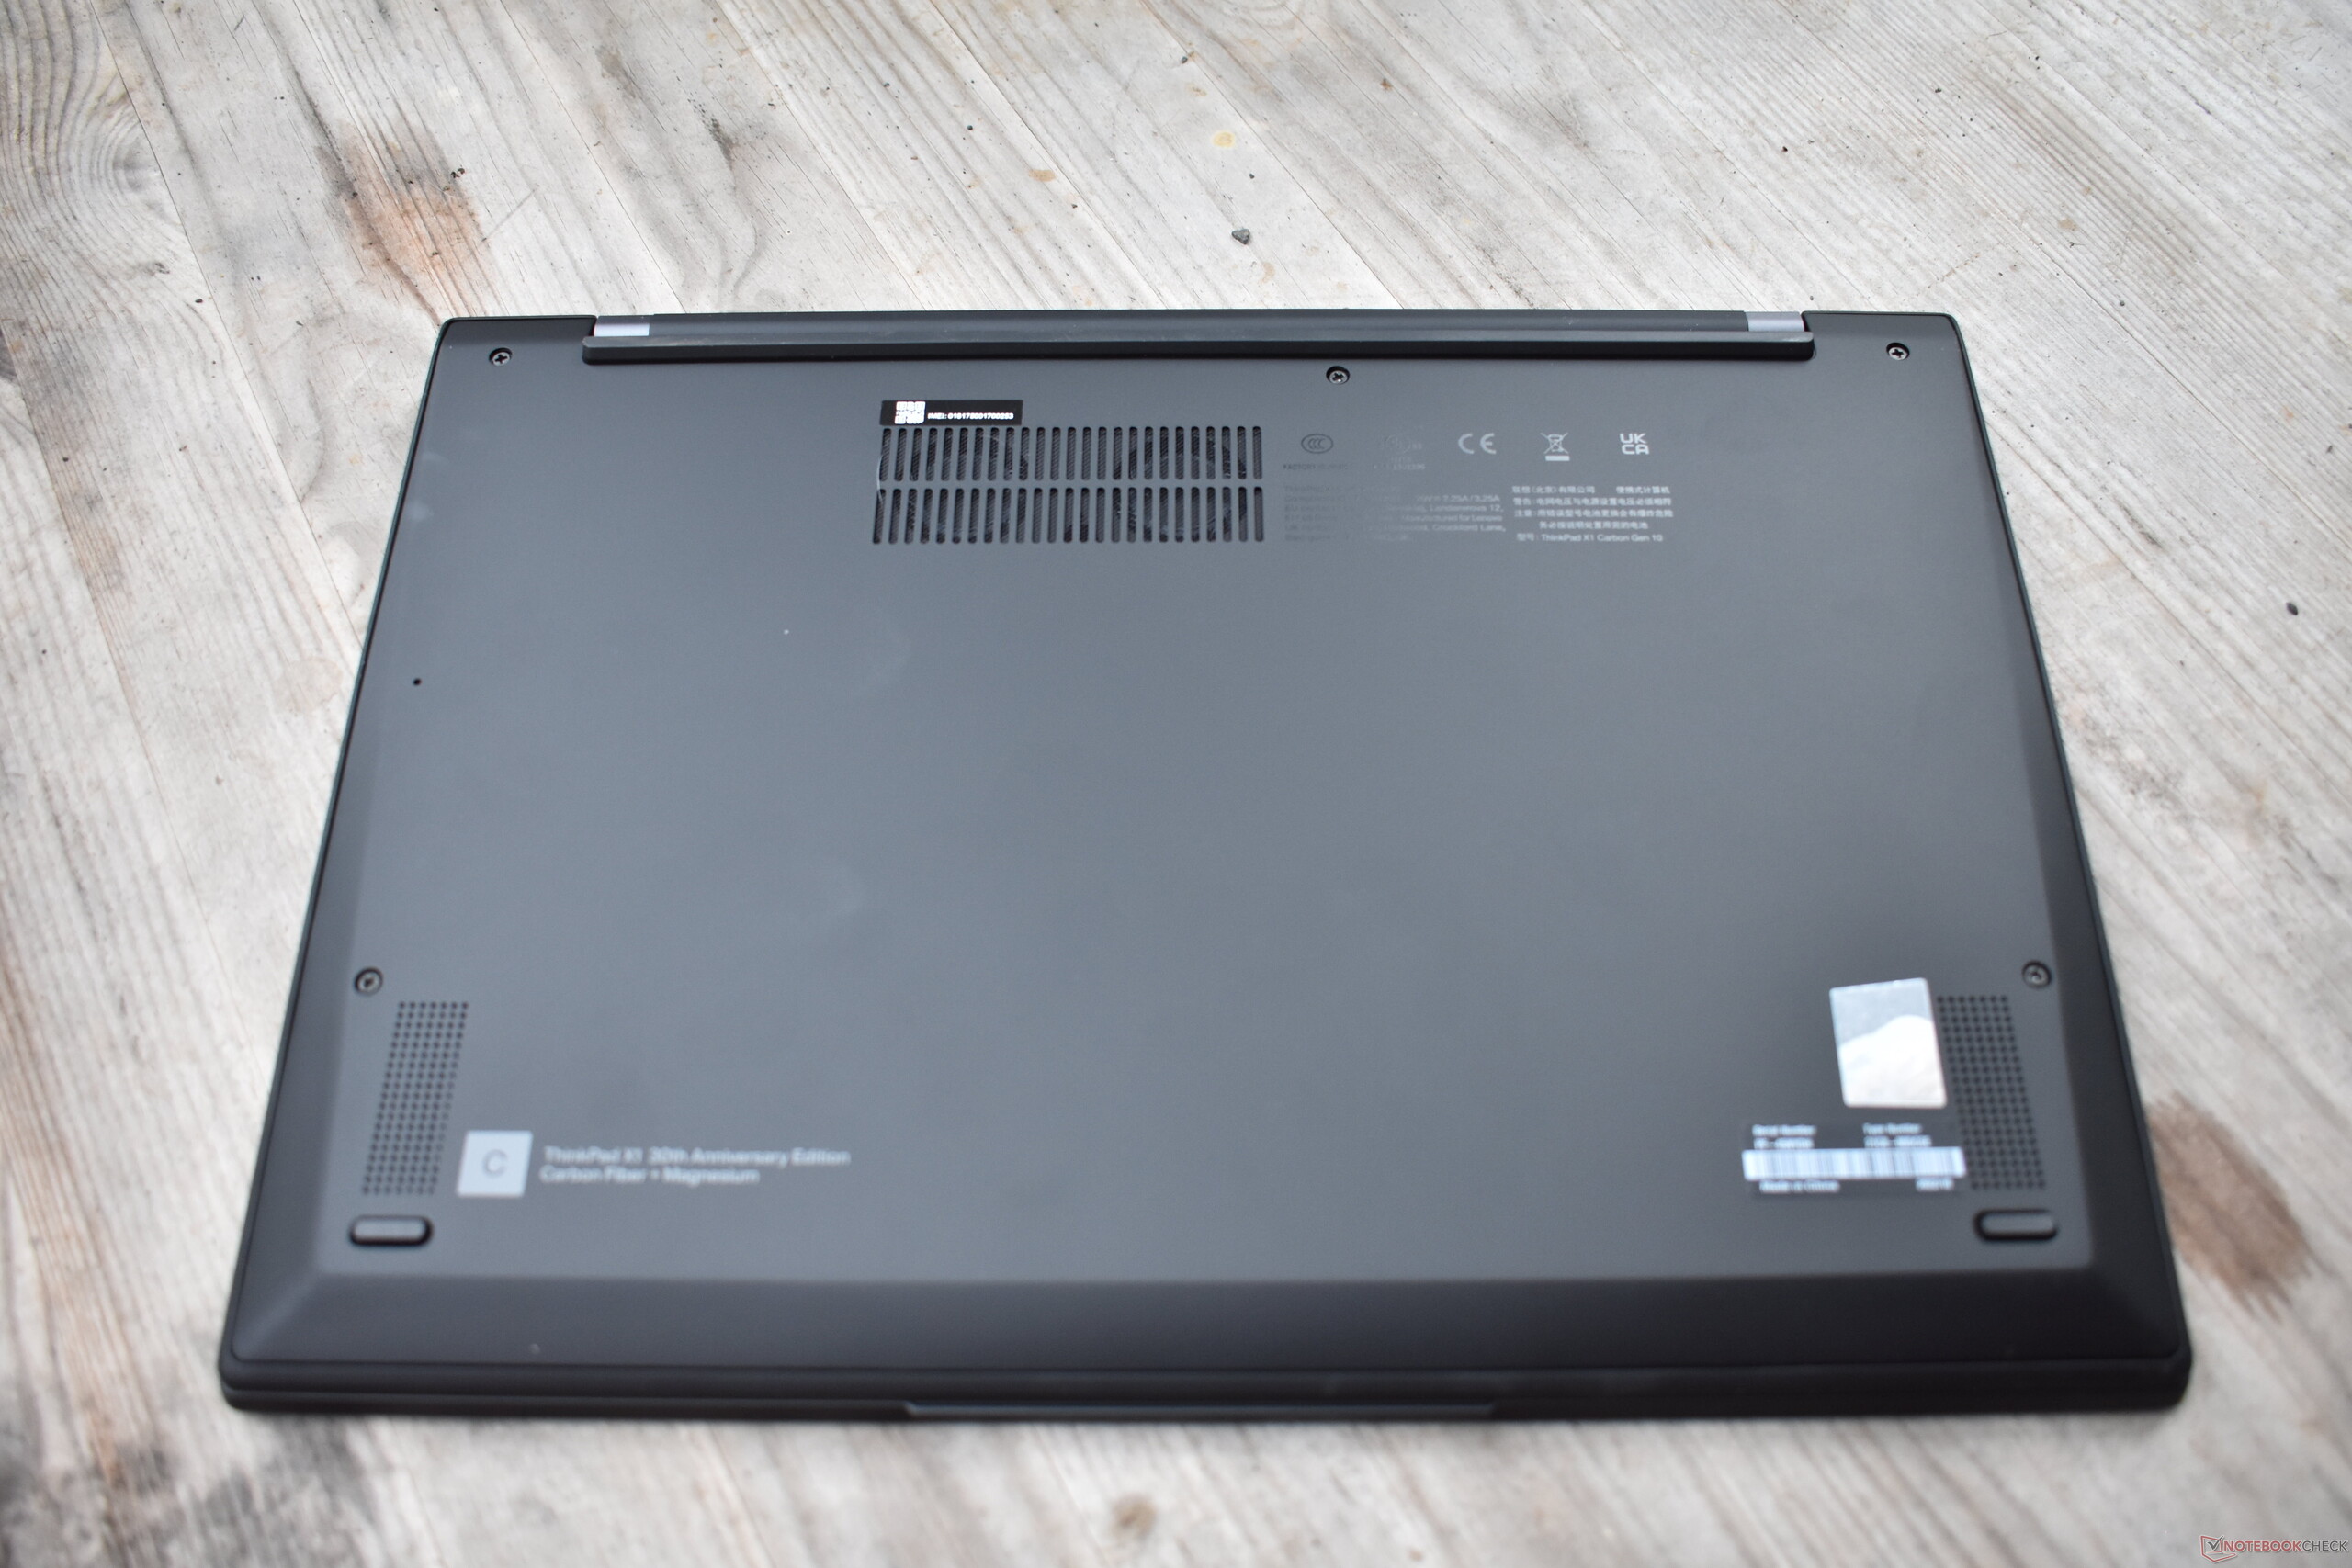
A diferencia del ThinkPad 25hace cinco años, Lenovo renuncia a cambios importantes en el hardware del X1 Carbon Gen 10 Edición 30º Aniversario. En su lugar, hay algunas modificaciones cosméticas, como el logotipo "30th Anniversary Edition" en el reposamanos, el número de unidad grabado con láser en la bisagra (hay 5.000 modelos en total) y el logotipo especial del aniversario de ThinkPad con la parte "Pad" en la combinación de colores IBM RGB Tricolor, inspirado en el antiguo logotipo de IBM ThinkPad Logotipo de IBM ThinkPadademás, el volumen de suministro incluye un embalaje de edición especial y tres tapas TrackPoint adicionales, cada una de ellas de color rojo, verde y azul. Por lo demás, es un ThinkPad X1 Carbon G10 normal. Lenovo no intenta revivir el clásico teclado ThinkPad con siete filas esta vez.

No se han hecho cambios en el equipo, y los resultados de WiFi y webcam son prácticamente idénticos a los del primer análisis del ThinkPad X1 Carbon G10. Excepción: La versión probada aquí corre Windows 10, por lo que no pudimos probar WiFi 6E.


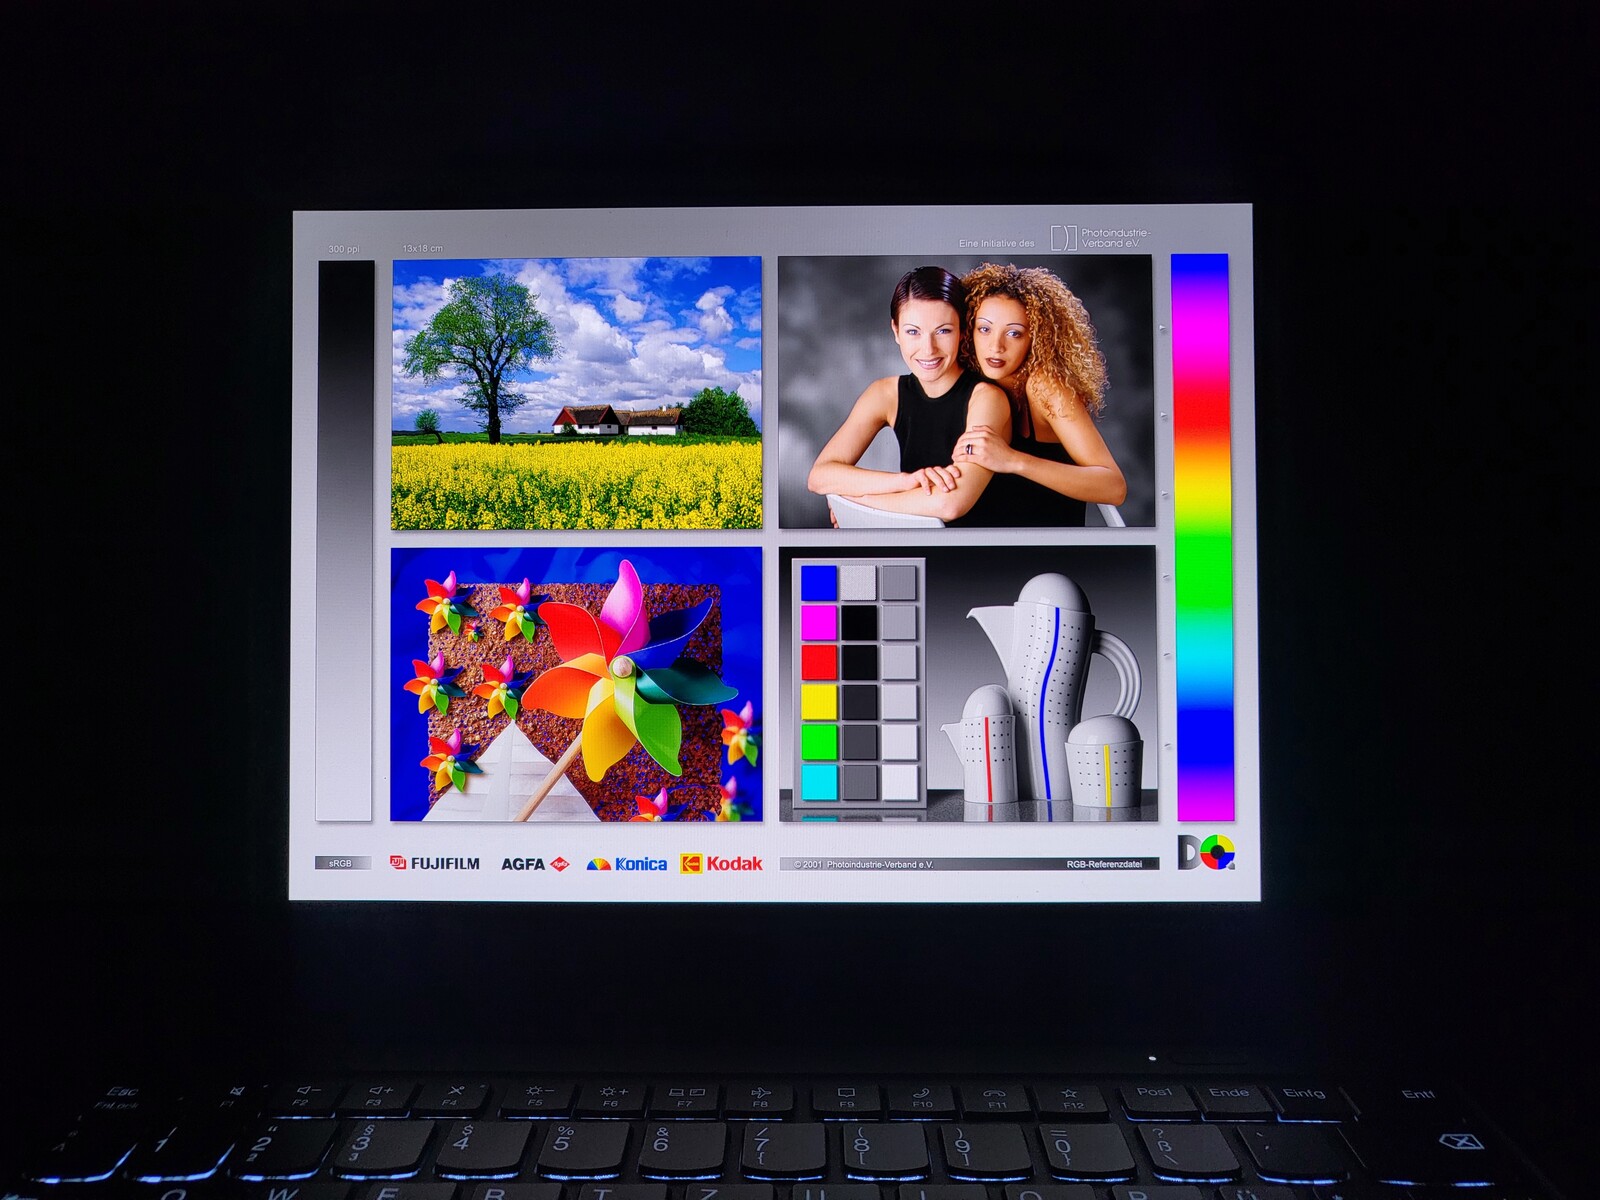
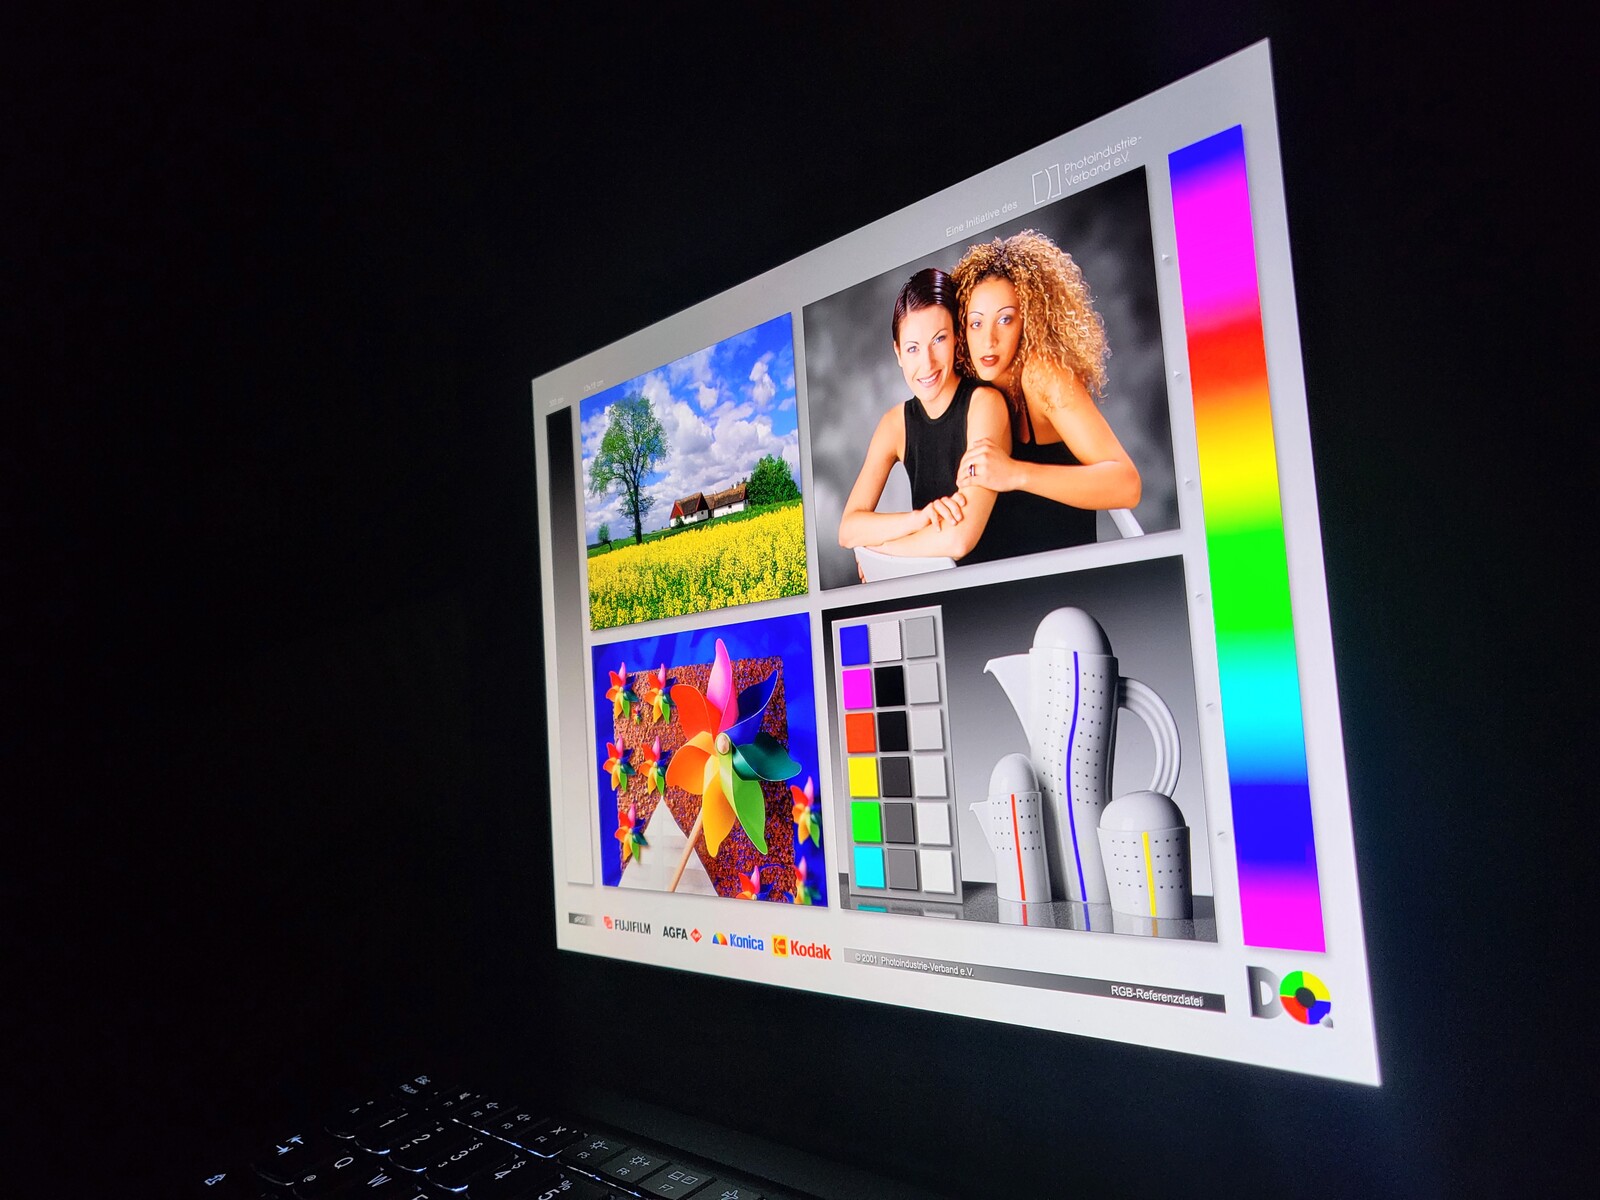
La pantalla OLED del X1 Carbon es casi mate

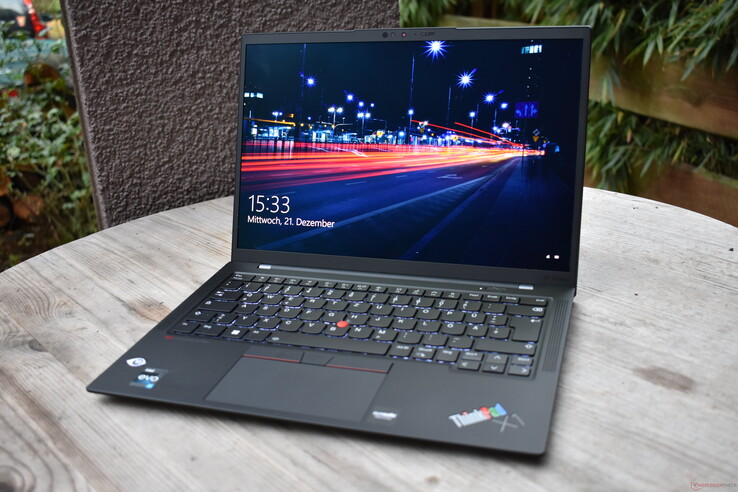
La pieza central de esta versión del Lenovo ThinkPad X1 Carbon Gen 10 es sin duda la pantalla. Como con casi todos los ThinkPad, hay varias opciones, que también enumeramos en nuestro primer análisis del X1 Carbon G10. El modelo de pruebas de hoy alberga la pantalla 2.8K de 14" (2,880 x 1,800) - el panel (número de modelo ATNA40YK01-1) viene de Samsung, y es una pantalla OLED.
Según Lenovo, la pantalla es capaz de mostrar contenido SDR a 400 cd/m² y HDR a 500 cd/m². Aunque no hemos medido este último, podemos confirmar el valor SDR. Esto hace que la pantalla sea más oscura que la pantalla 4K UHD delX1 Carbon G9 y el LCD 2.5K del Dell Latitude 9430pero a cambio, la pantalla OLED tiene otras ventajas: El brillo se distribuye muy uniformemente, no hay sangrado de retroiluminación, y los tiempos de respuesta son significativamente mejores que los de los rivales IPS. Una pena, sin embargo, que Lenovo haya dejado la tasa de refresco en 60 Hz, ya que 90 Hz habría sido un buen paso adelante.
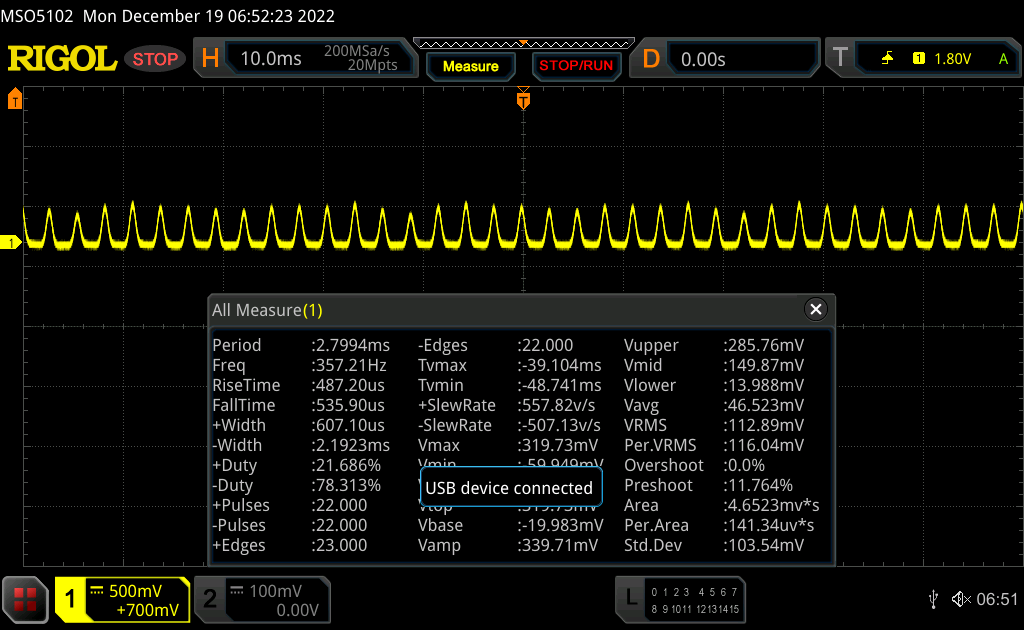
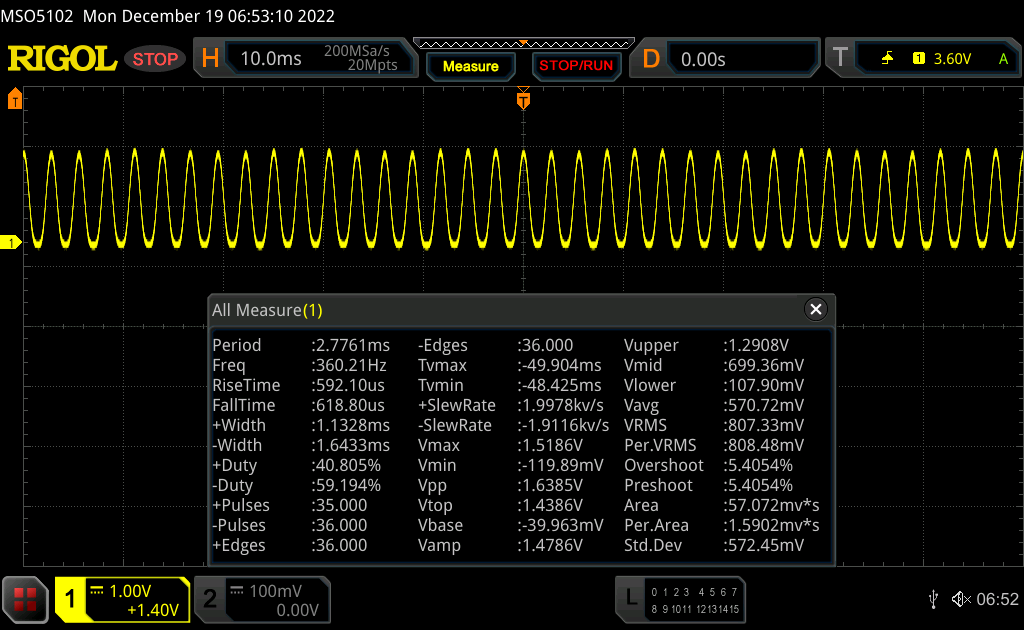
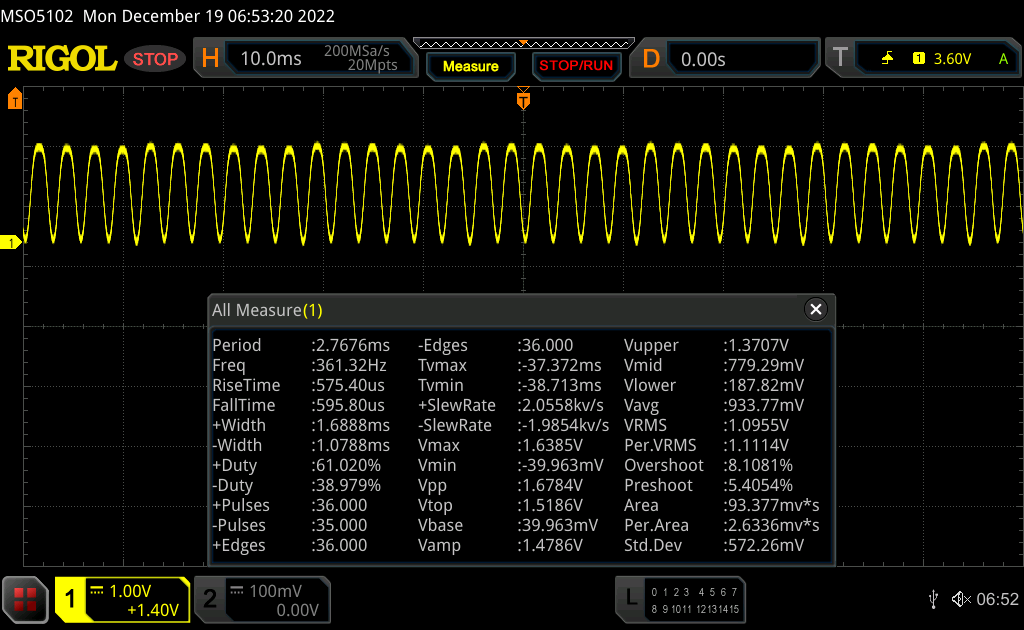
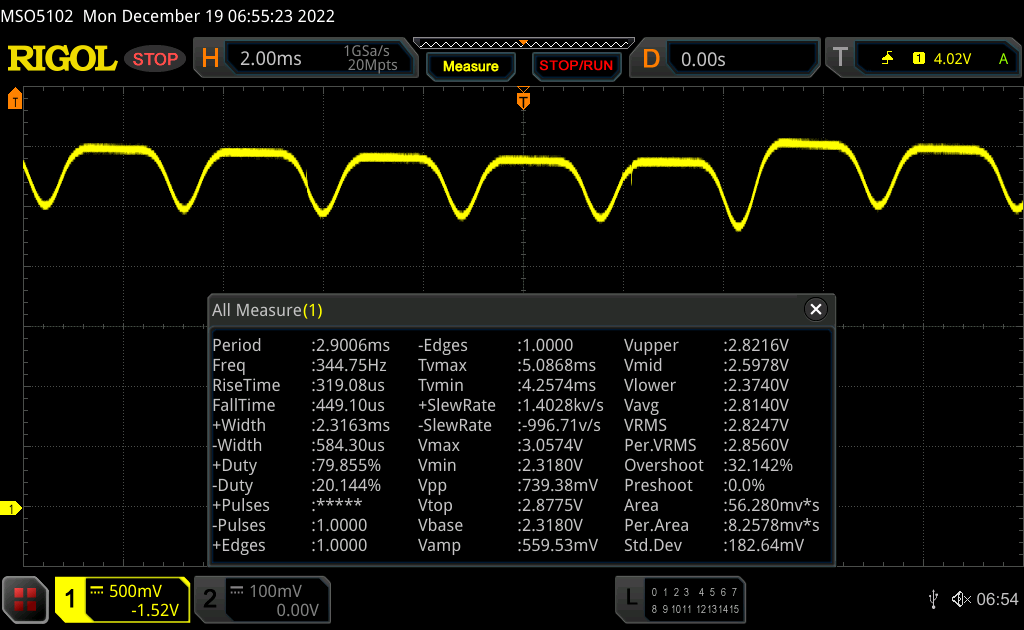
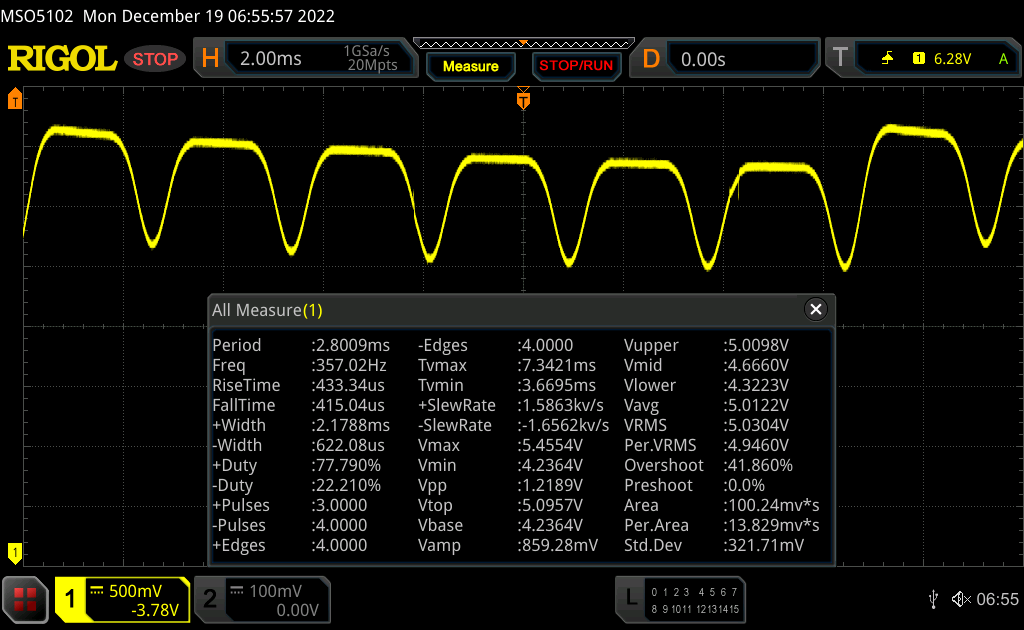
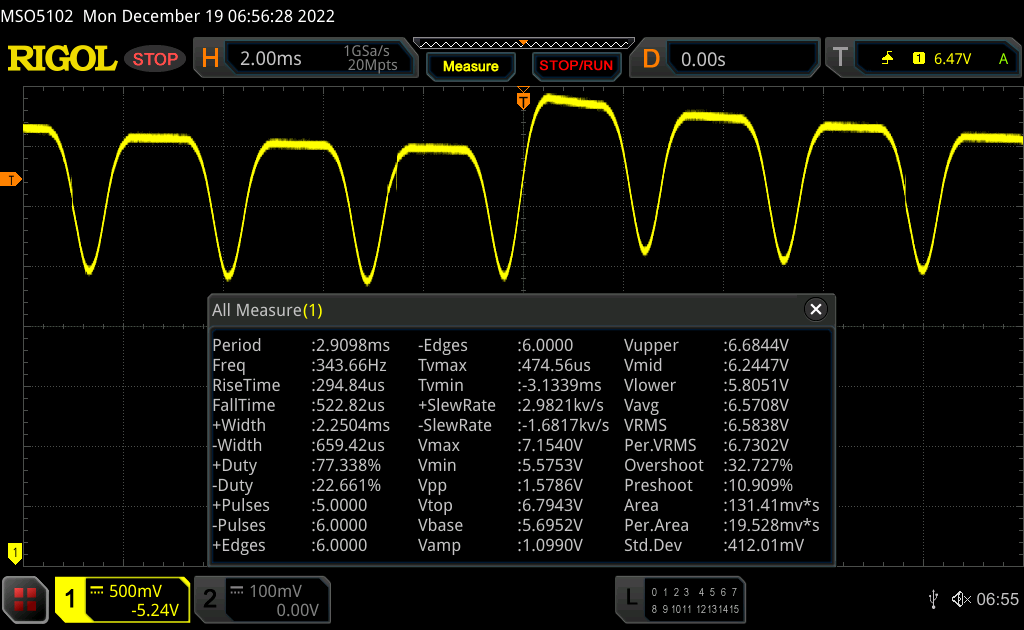
Un inconveniente de la tecnología OLED: El PWM está siempre presente. La frecuencia PWM de unos 342 Hz en todos los niveles de brillo puede causar dolores de cabeza a las personas sensibles, aunque no se aprecien parpadeos a simple vista.
| |||||||||||||||||||||||||
iluminación: 97 %
Brillo con batería: 400 cd/m²
Contraste: ∞:1 (Negro: 0 cd/m²)
ΔE ColorChecker Calman: 2.2 | ∀{0.5-29.43 Ø4.73}
calibrated: 2.6
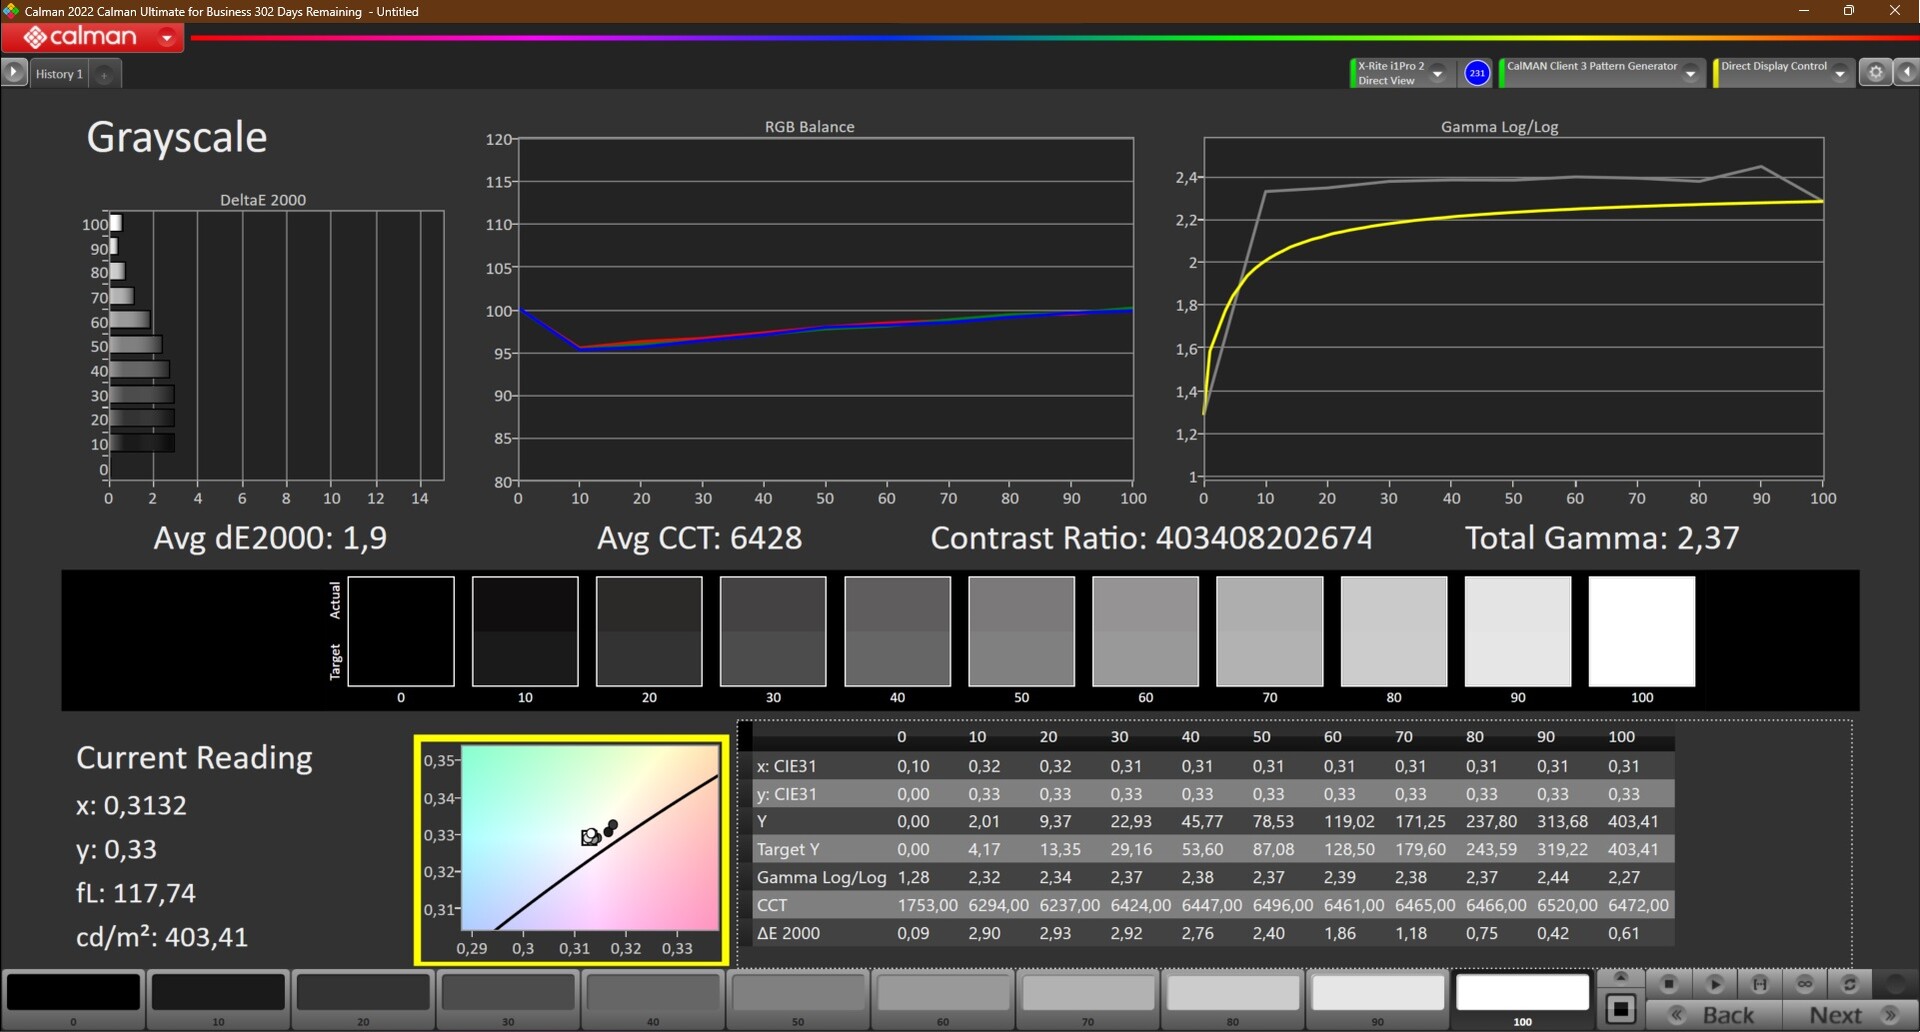
ΔE Greyscale Calman: 1.2 | ∀{0.09-98 Ø4.97}
96.5% AdobeRGB 1998 (Argyll 3D)
100% sRGB (Argyll 3D)
99.7% Display P3 (Argyll 3D)
Gamma: 2.22
CCT: 6364 K
| Lenovo ThinkPad X1 Carbon G10 21CB00DCGE ATNA40YK01-1, OLED, 2880x1800, 14" | Lenovo ThinkPad X1 Carbon G10 21CC001RGE B140UAN02.1, IPS LED, 1920x1200, 14" | Lenovo ThinkPad X1 Carbon G9-20XWCTO1WW MNE007A1-2, IPS LED, 3840x2400, 14" | Lenovo ThinkPad Z13 G1-21D20016GE ATNA33AA02-0, OLED, 2880x1800, 13.3" | HP Elite Dragonfly G3 Chi Mei CMN13C0, IPS, 1920x1280, 13.5" | Dell Latitude 9430 2-in-1 AU Optronics B140QAN, IPS, 2560x1600, 14" | |
|---|---|---|---|---|---|---|
| Display | -16% | -4% | 0% | -21% | -13% | |
| Display P3 Coverage (%) | 99.7 | 74.6 -25% | 95.2 -5% | 99.9 0% | 68 -32% | 79.4 -20% |
| sRGB Coverage (%) | 100 | 98.6 -1% | 99.8 0% | 100 0% | 98.3 -2% | 100 0% |
| AdobeRGB 1998 Coverage (%) | 96.5 | 76.5 -21% | 89.2 -8% | 97.5 1% | 69.9 -28% | 79.4 -18% |
| Response Times | -2546% | -2754% | -29% | -3117% | -3600% | |
| Response Time Grey 50% / Grey 80% * (ms) | 1.2 ? | 45.5 ? -3692% | 46 ? -3733% | 1.9 ? -58% | 50.8 ? -4133% | 63.6 ? -5200% |
| Response Time Black / White * (ms) | 1.6 ? | 24 ? -1400% | 30 ? -1775% | 1.6 ? -0% | 35.2 ? -2100% | 33.6 ? -2000% |
| PWM Frequency (Hz) | 342 ? | 53050 ? | 240 ? | |||
| Screen | -51% | 27% | -10% | -18% | -29% | |
| Brightness middle (cd/m²) | 400 | 372 -7% | 497 24% | 371 -7% | 387.2 -3% | 517.7 29% |
| Brightness (cd/m²) | 401 | 362 -10% | 488 22% | 378 -6% | 360 -10% | 493 23% |
| Brightness Distribution (%) | 97 | 94 -3% | 87 -10% | 98 1% | 80 -18% | 90 -7% |
| Black Level * (cd/m²) | 0.18 | 0.35 | 0.04 | 0.26 | 0.33 | |
| Colorchecker dE 2000 * | 2.2 | 3.4 -55% | 1.2 45% | 2.5 -14% | 2.36 -7% | 3.38 -54% |
| Colorchecker dE 2000 max. * | 4.3 | 6.7 -56% | 2.1 51% | 4.4 -2% | 4.79 -11% | 6.25 -45% |
| Colorchecker dE 2000 calibrated * | 2.6 | 1.8 31% | 0.9 65% | 1.9 27% | 0.63 76% | 0.41 84% |
| Greyscale dE 2000 * | 1.2 | 4.3 -258% | 1.3 -8% | 2 -67% | 3 -150% | 4 -233% |
| Gamma | 2.22 99% | 2.13 103% | 2.16 102% | 2.17 101% | 2.17 101% | 2.13 103% |
| CCT | 6364 102% | 6158 106% | 6690 97% | 6228 104% | 6137 106% | 6186 105% |
| Contrast (:1) | 2067 | 1420 | 9275 | 1489 | 1569 | |
| Color Space (Percent of AdobeRGB 1998) (%) | 79.37 | |||||
| Color Space (Percent of sRGB) (%) | 99.78 | |||||
| Media total (Programa/Opciones) | -871% /
-458% | -910% /
-444% | -13% /
-10% | -1052% /
-535% | -1214% /
-620% |
* ... más pequeño es mejor
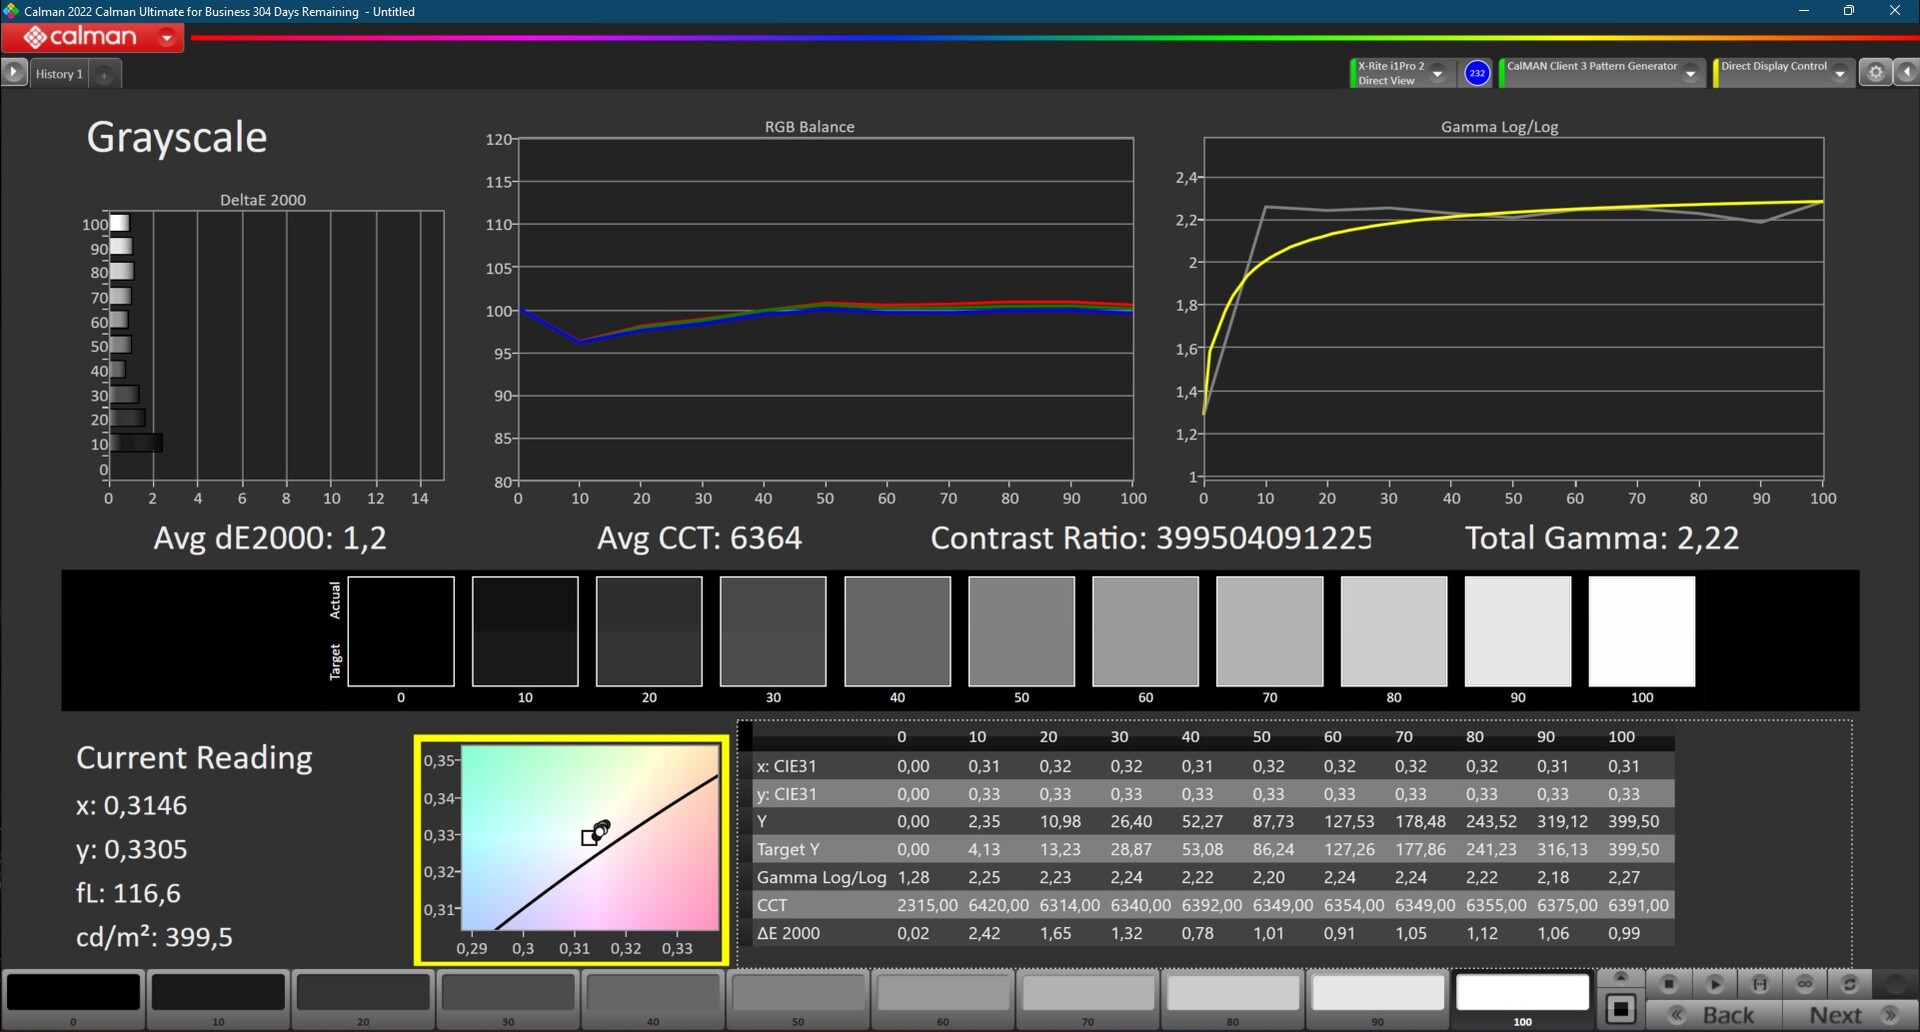
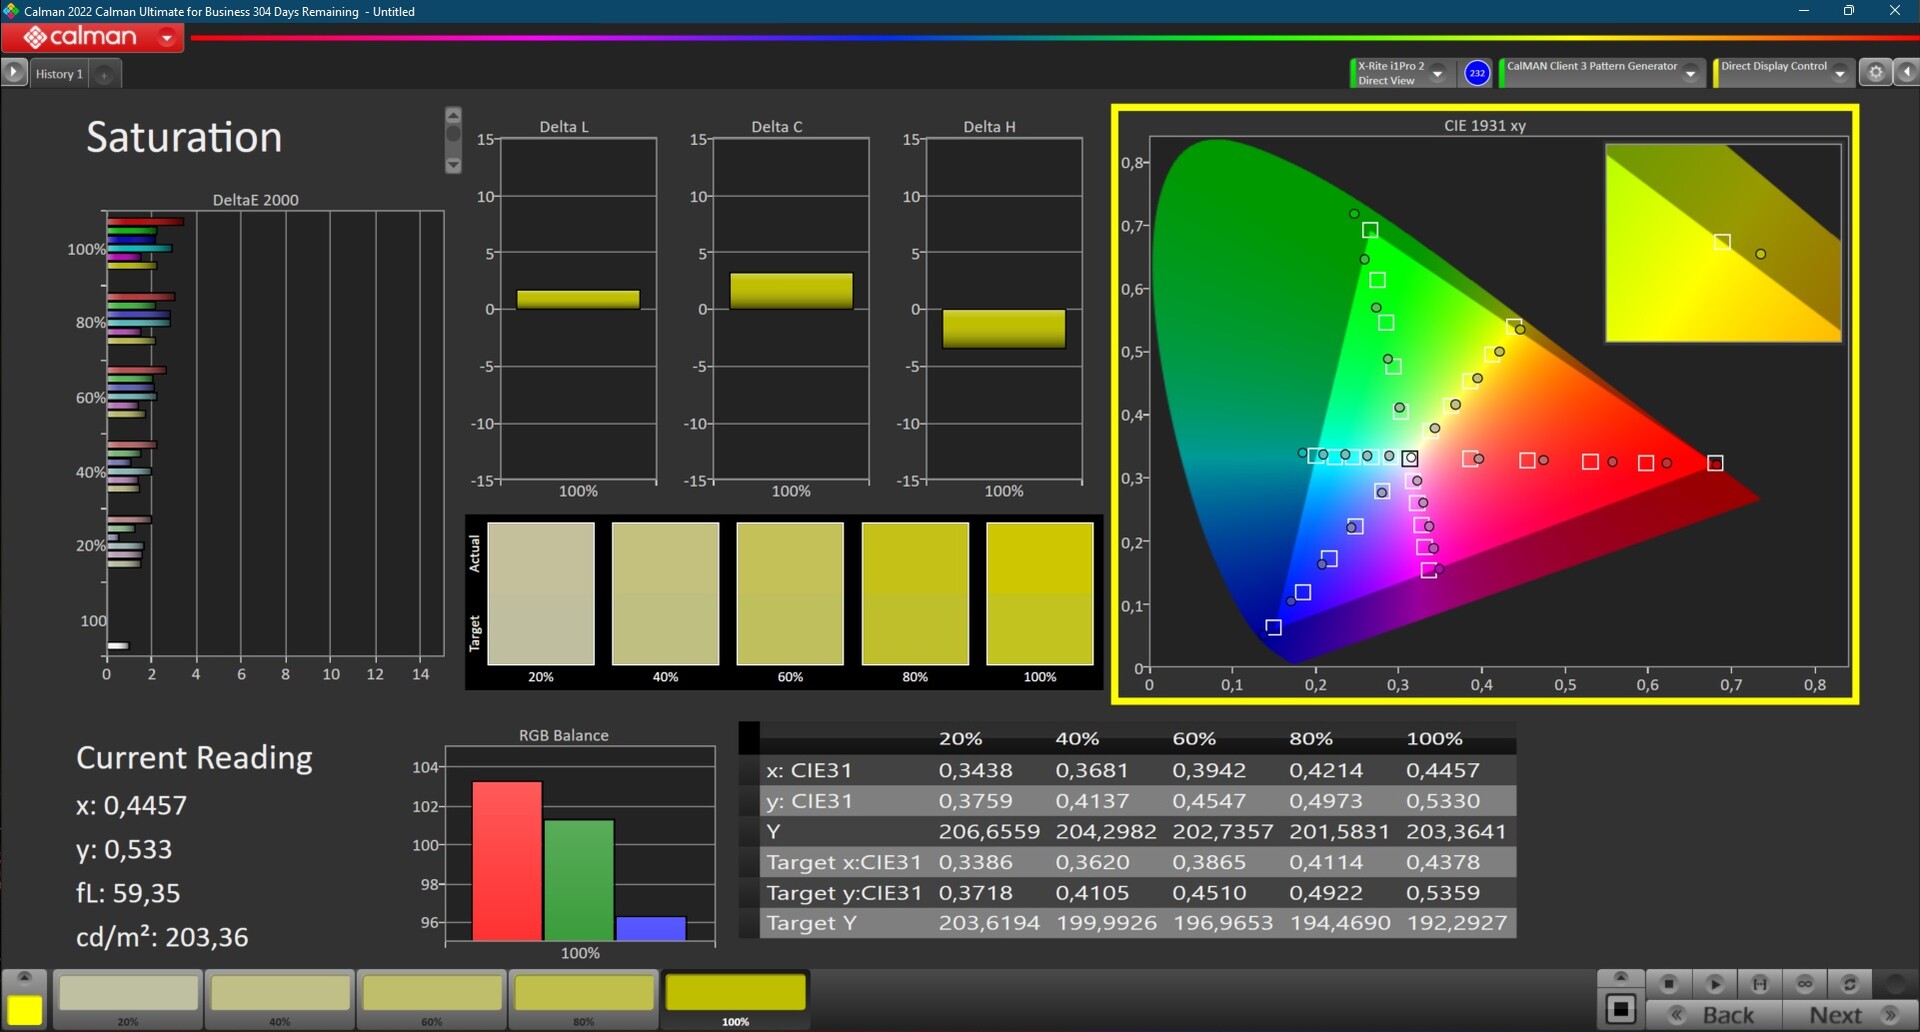
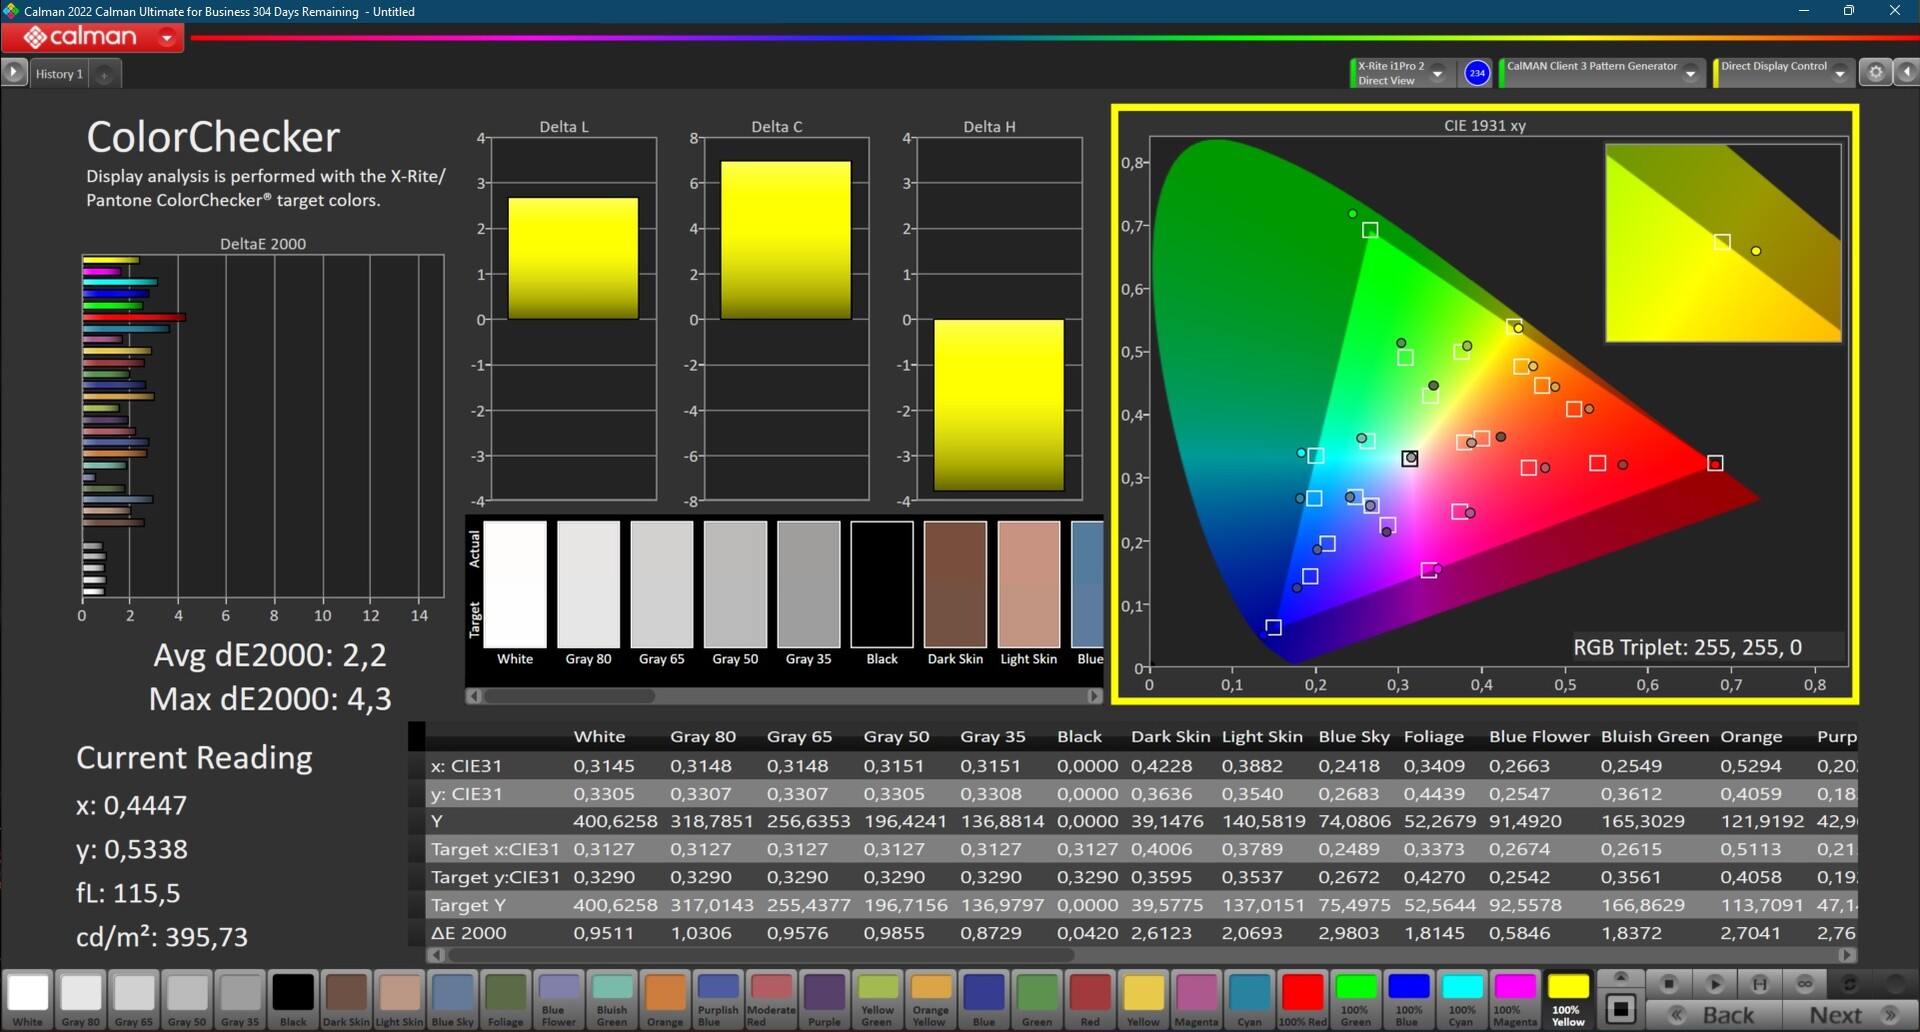
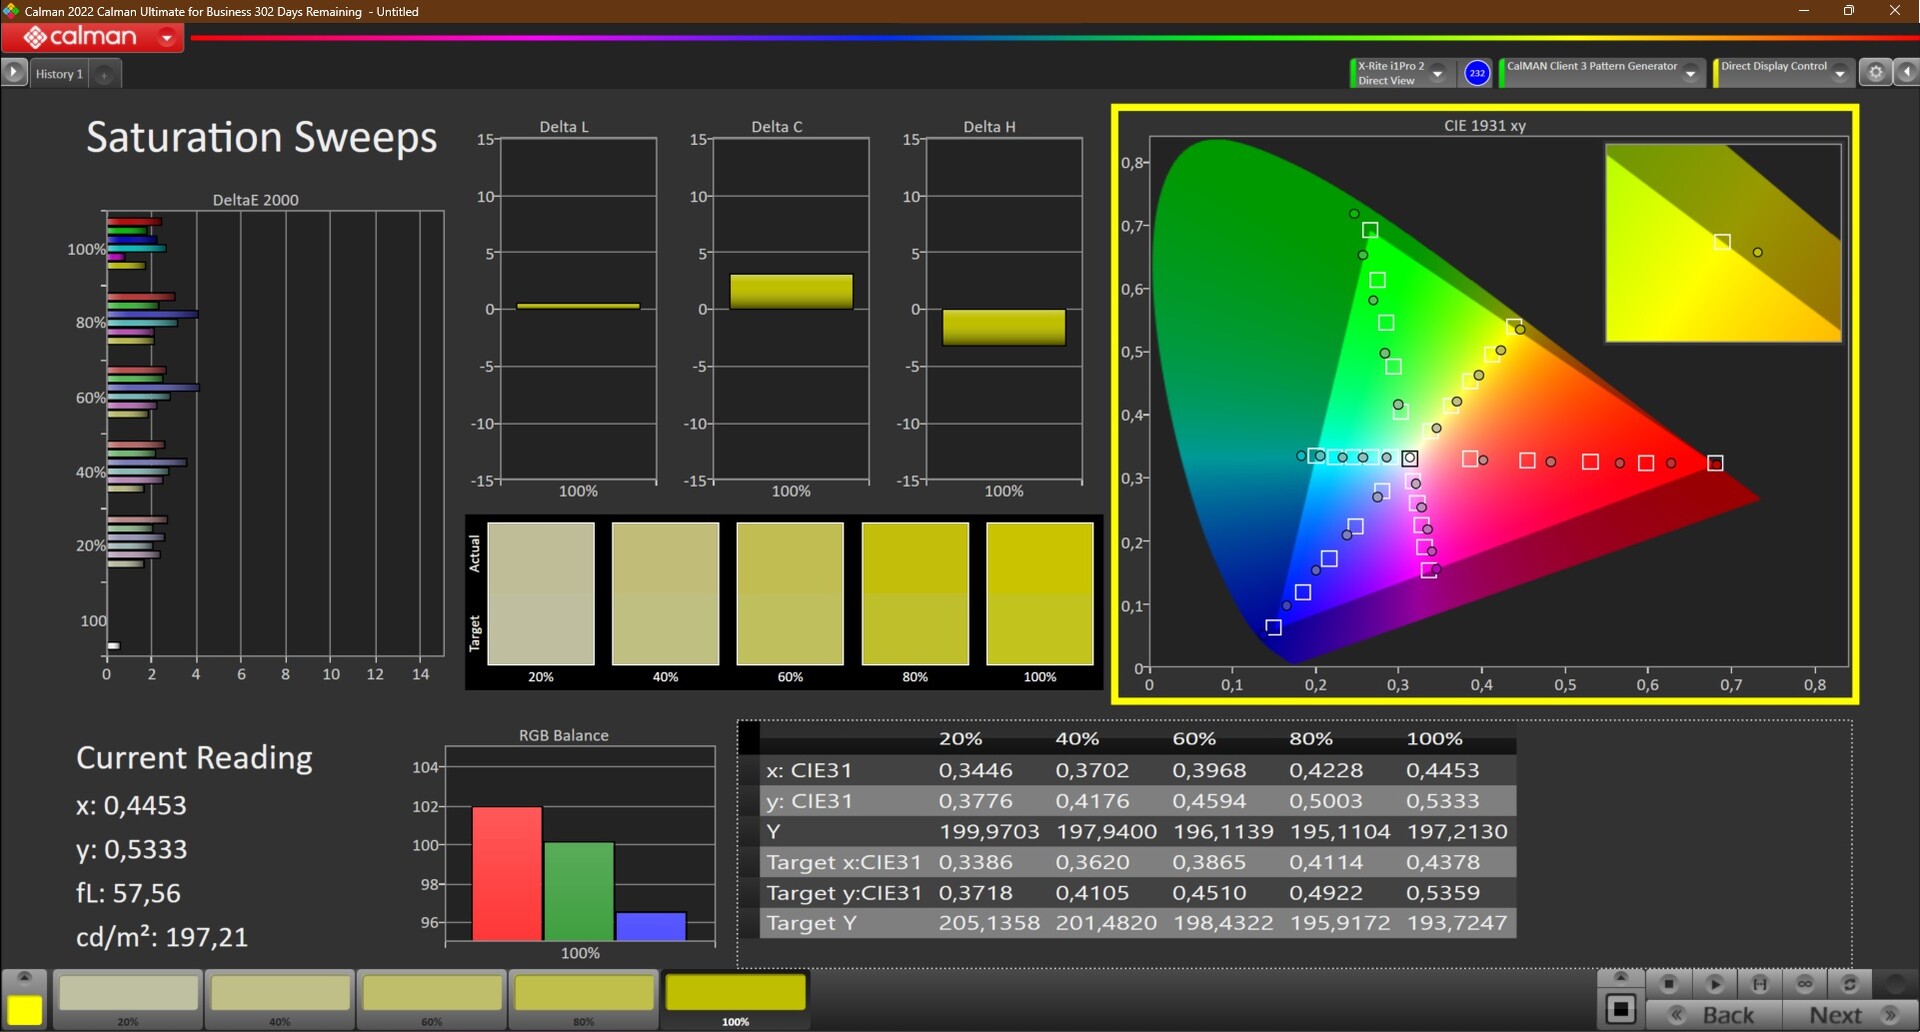
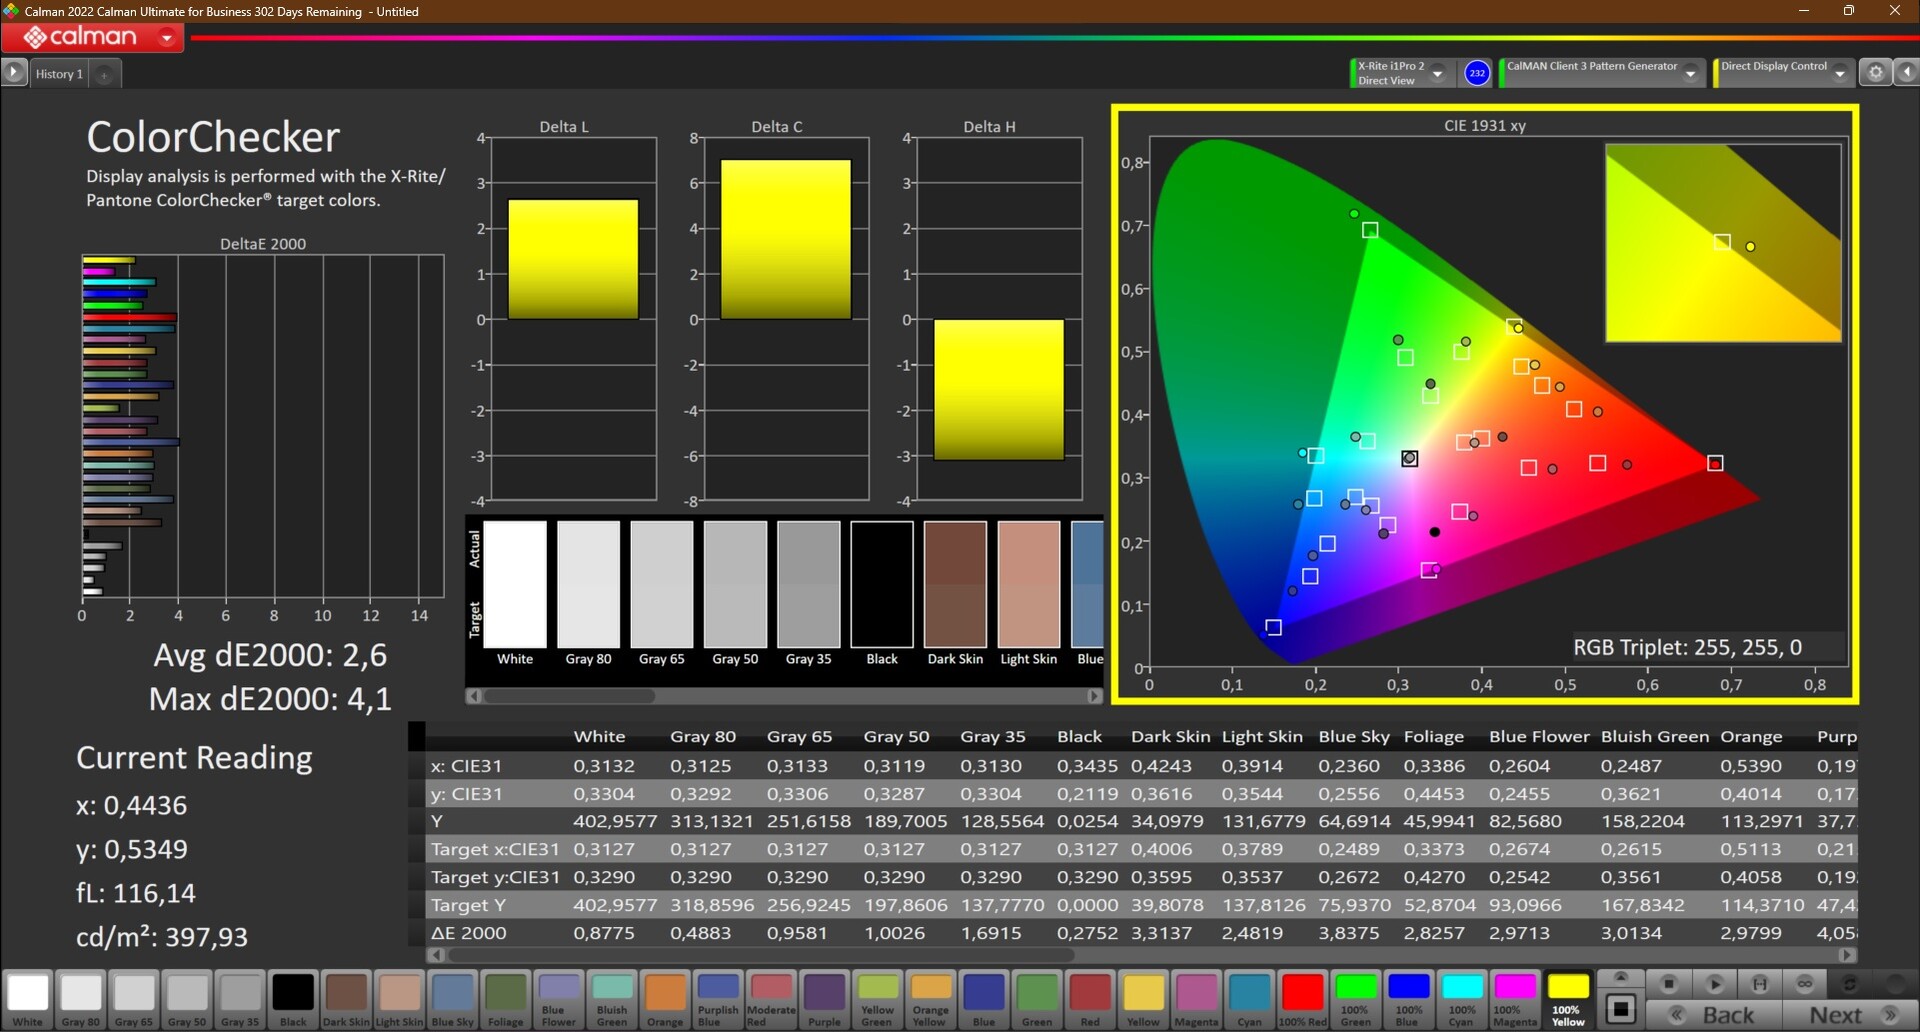
La calidad del color de la pantalla ya es extremadamente alta de fábrica; el valor de contraste prácticamente infinito da como resultado colores vivos y acentuados. Las desviaciones del ideal ya son comparativamente pequeñas para la mayoría de los colores de fábrica, y apenas pudimos mejorar la calidad mediante calibración.
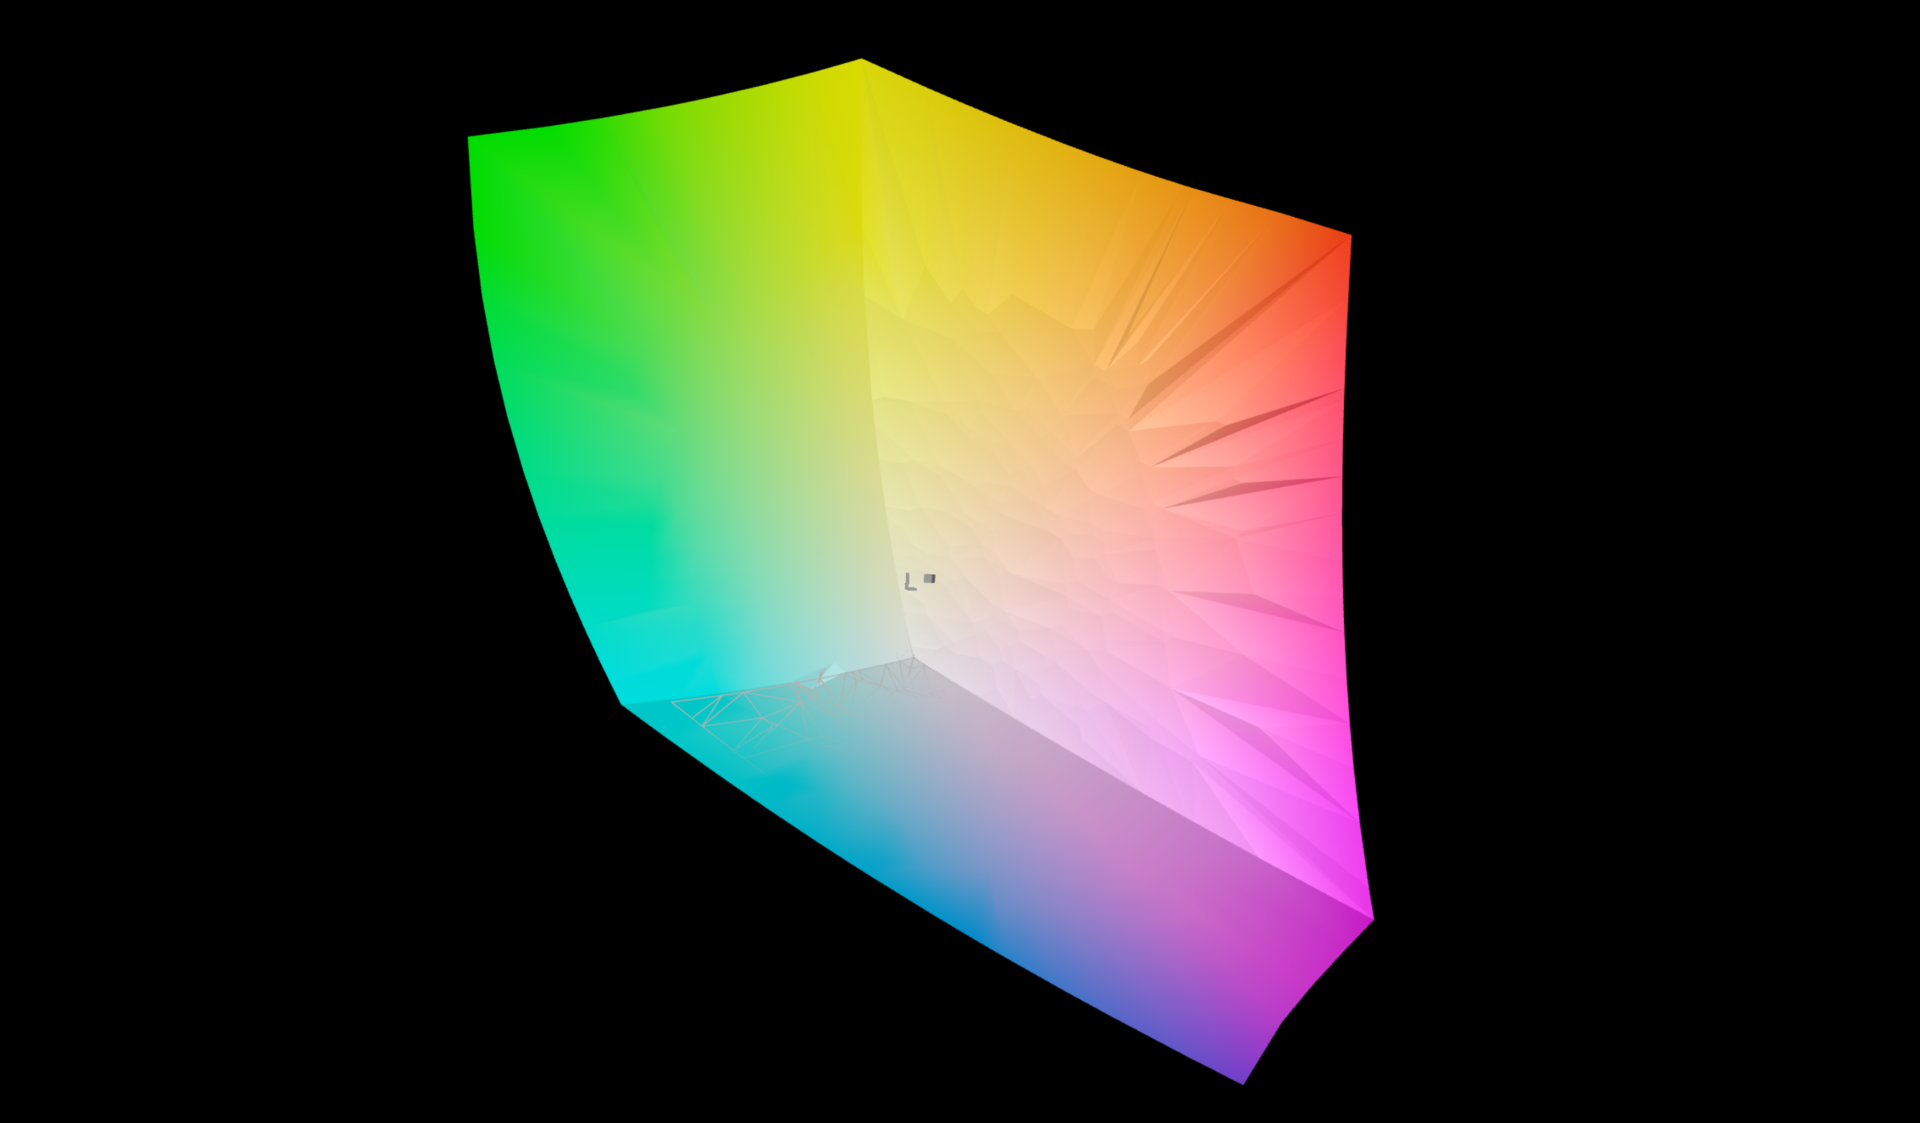
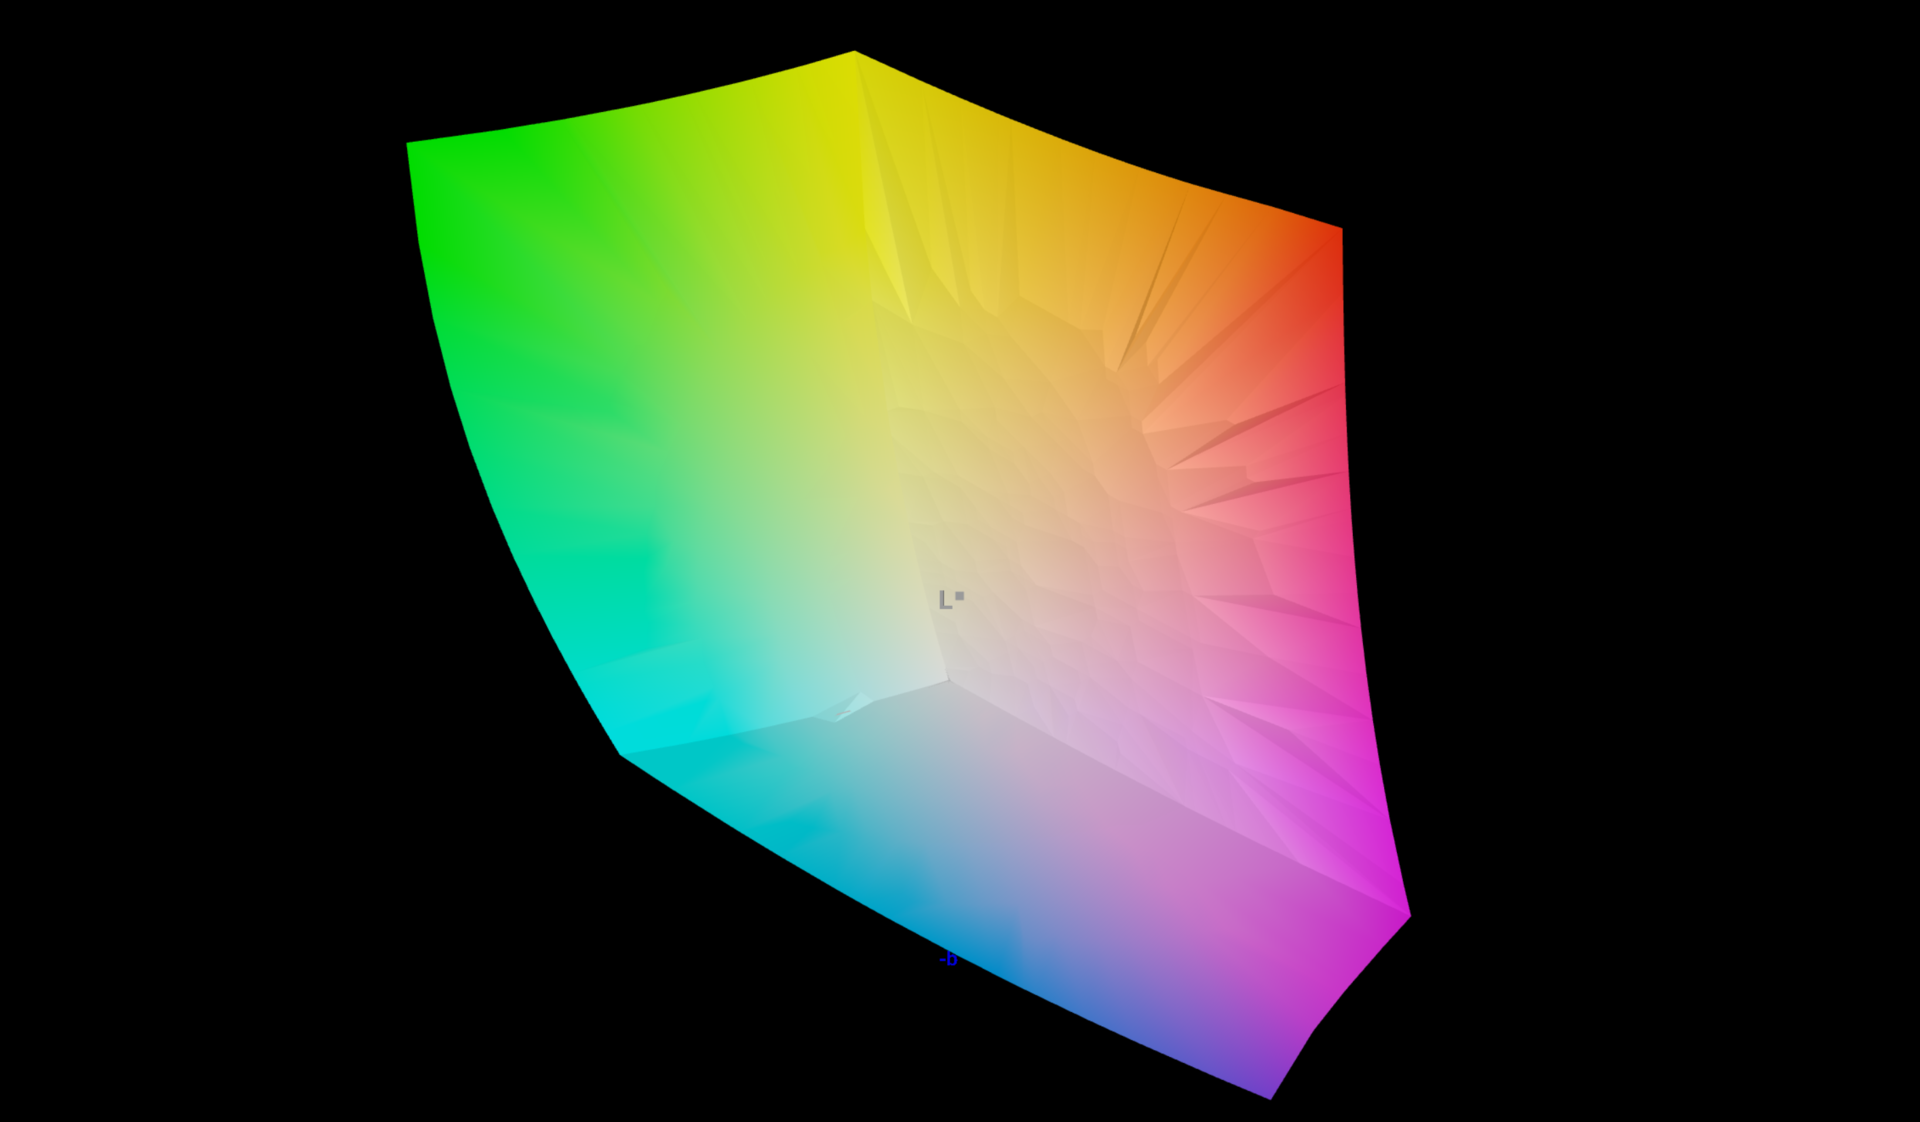
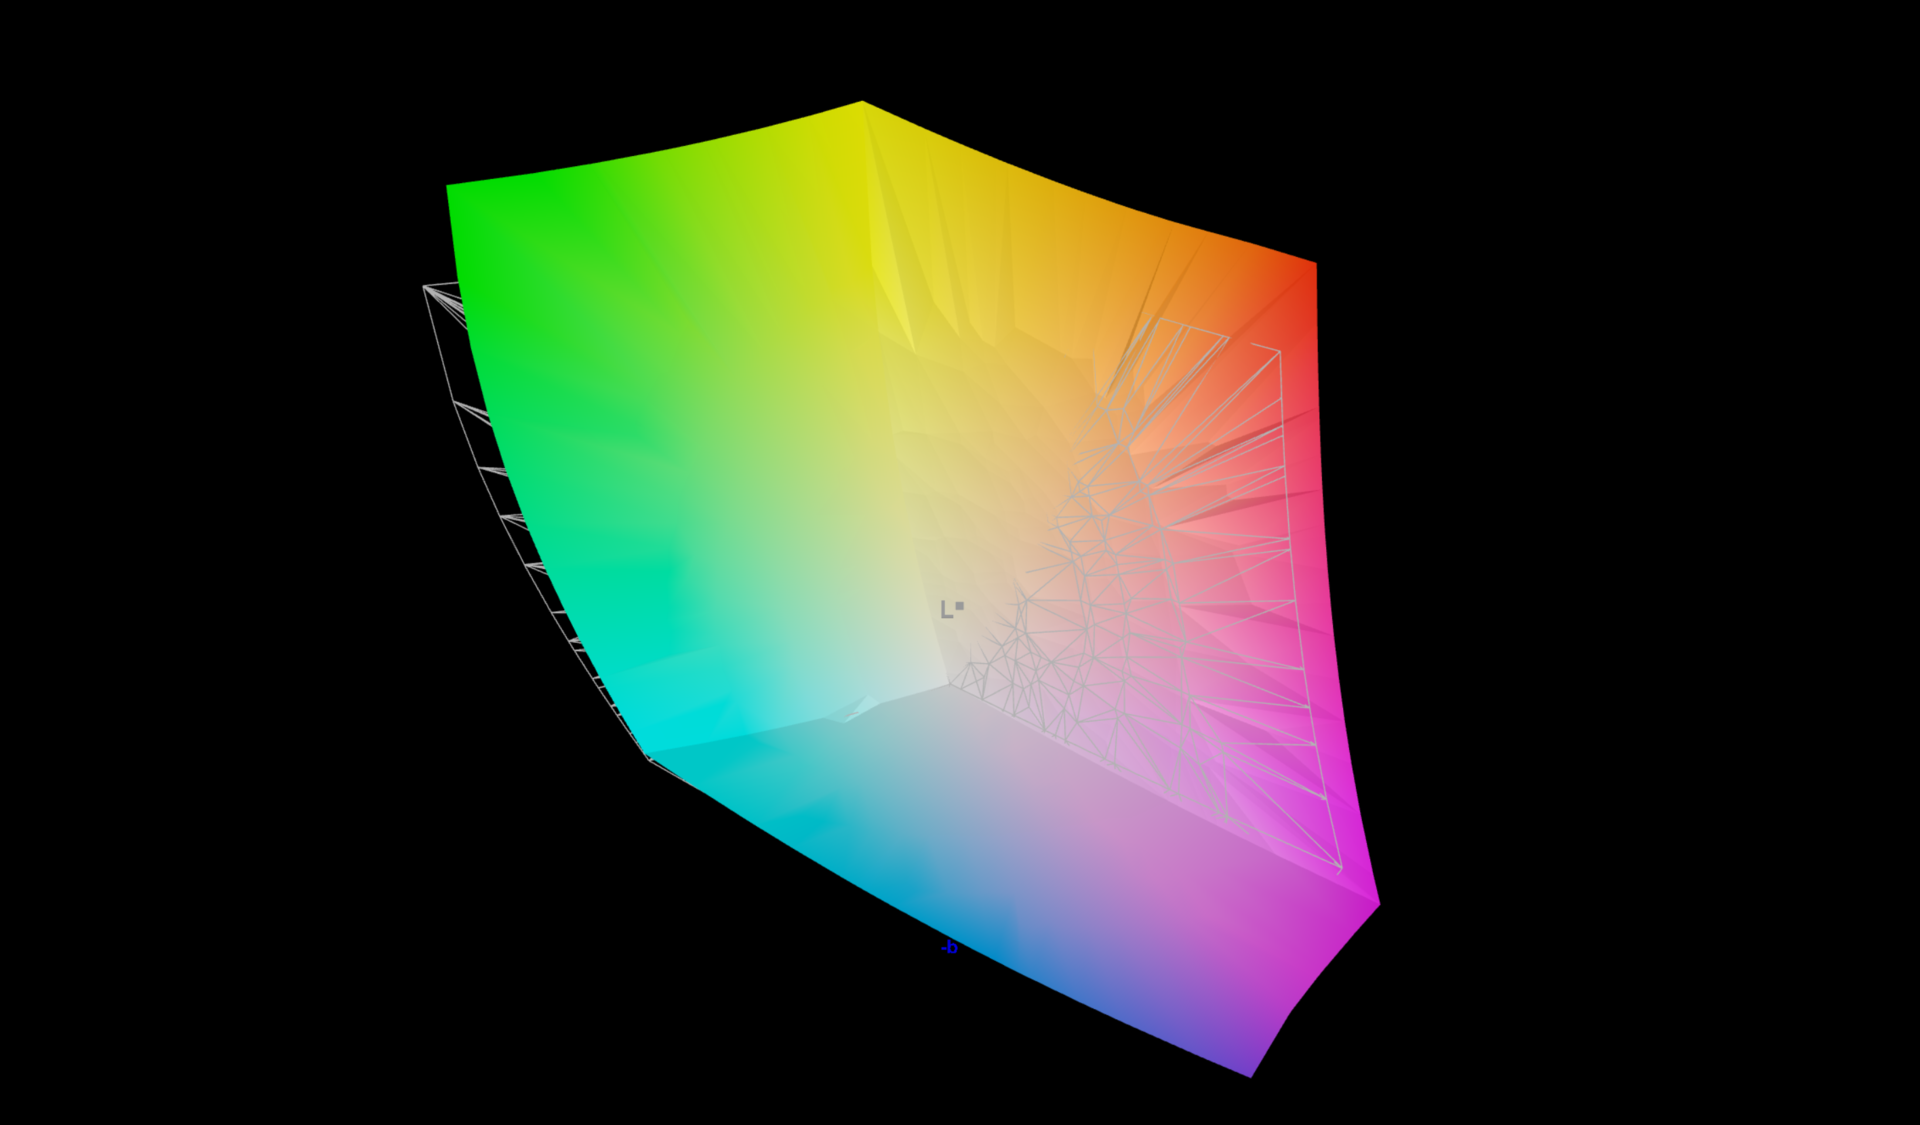
Un punto fuerte de la pantalla OLED es la muy buena cobertura del espacio de color. Lenovo promete un 100% de DCI-P3, que en realidad resulta ser el 99,7%. El panel es capaz de reproducir completamente el pequeño espacio de color sRGB, e incluso AdobeRGB no se queda corto con un 96,5%.
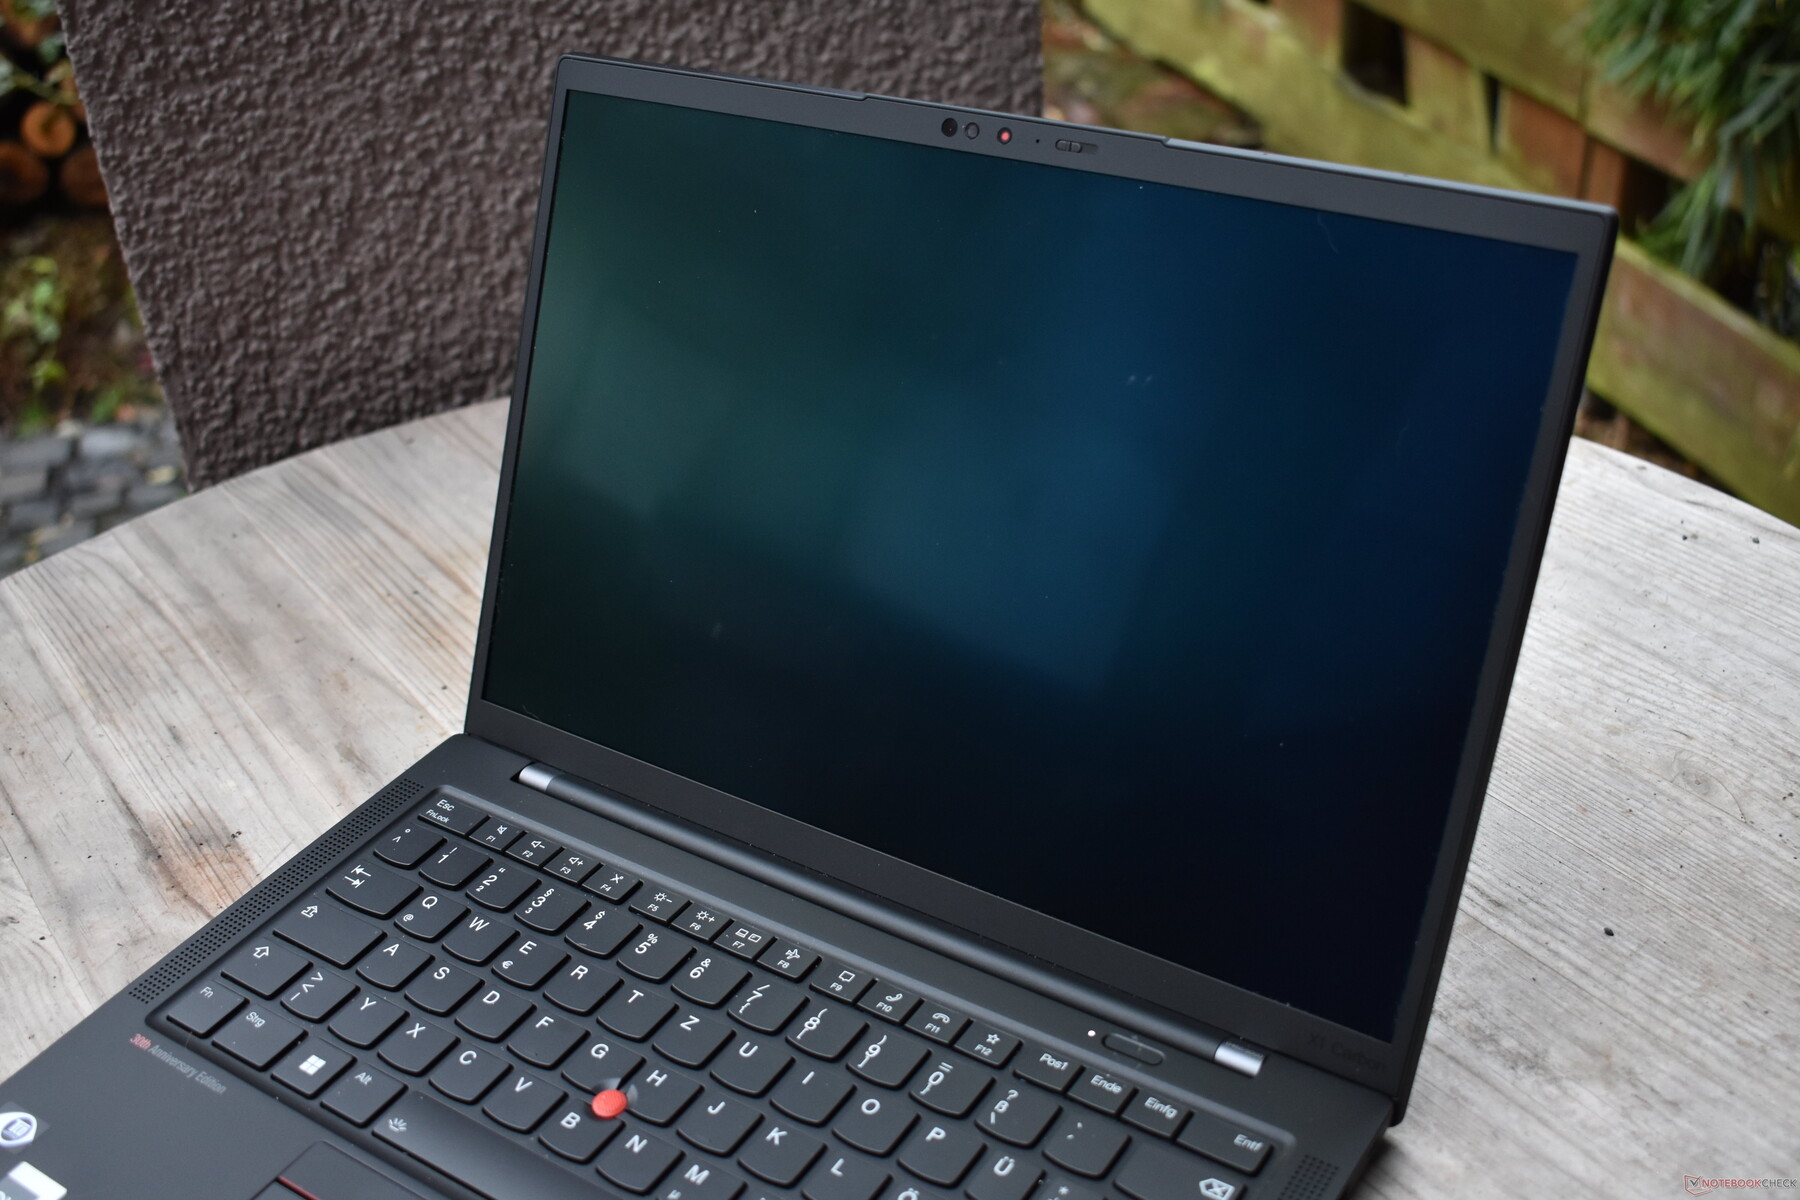
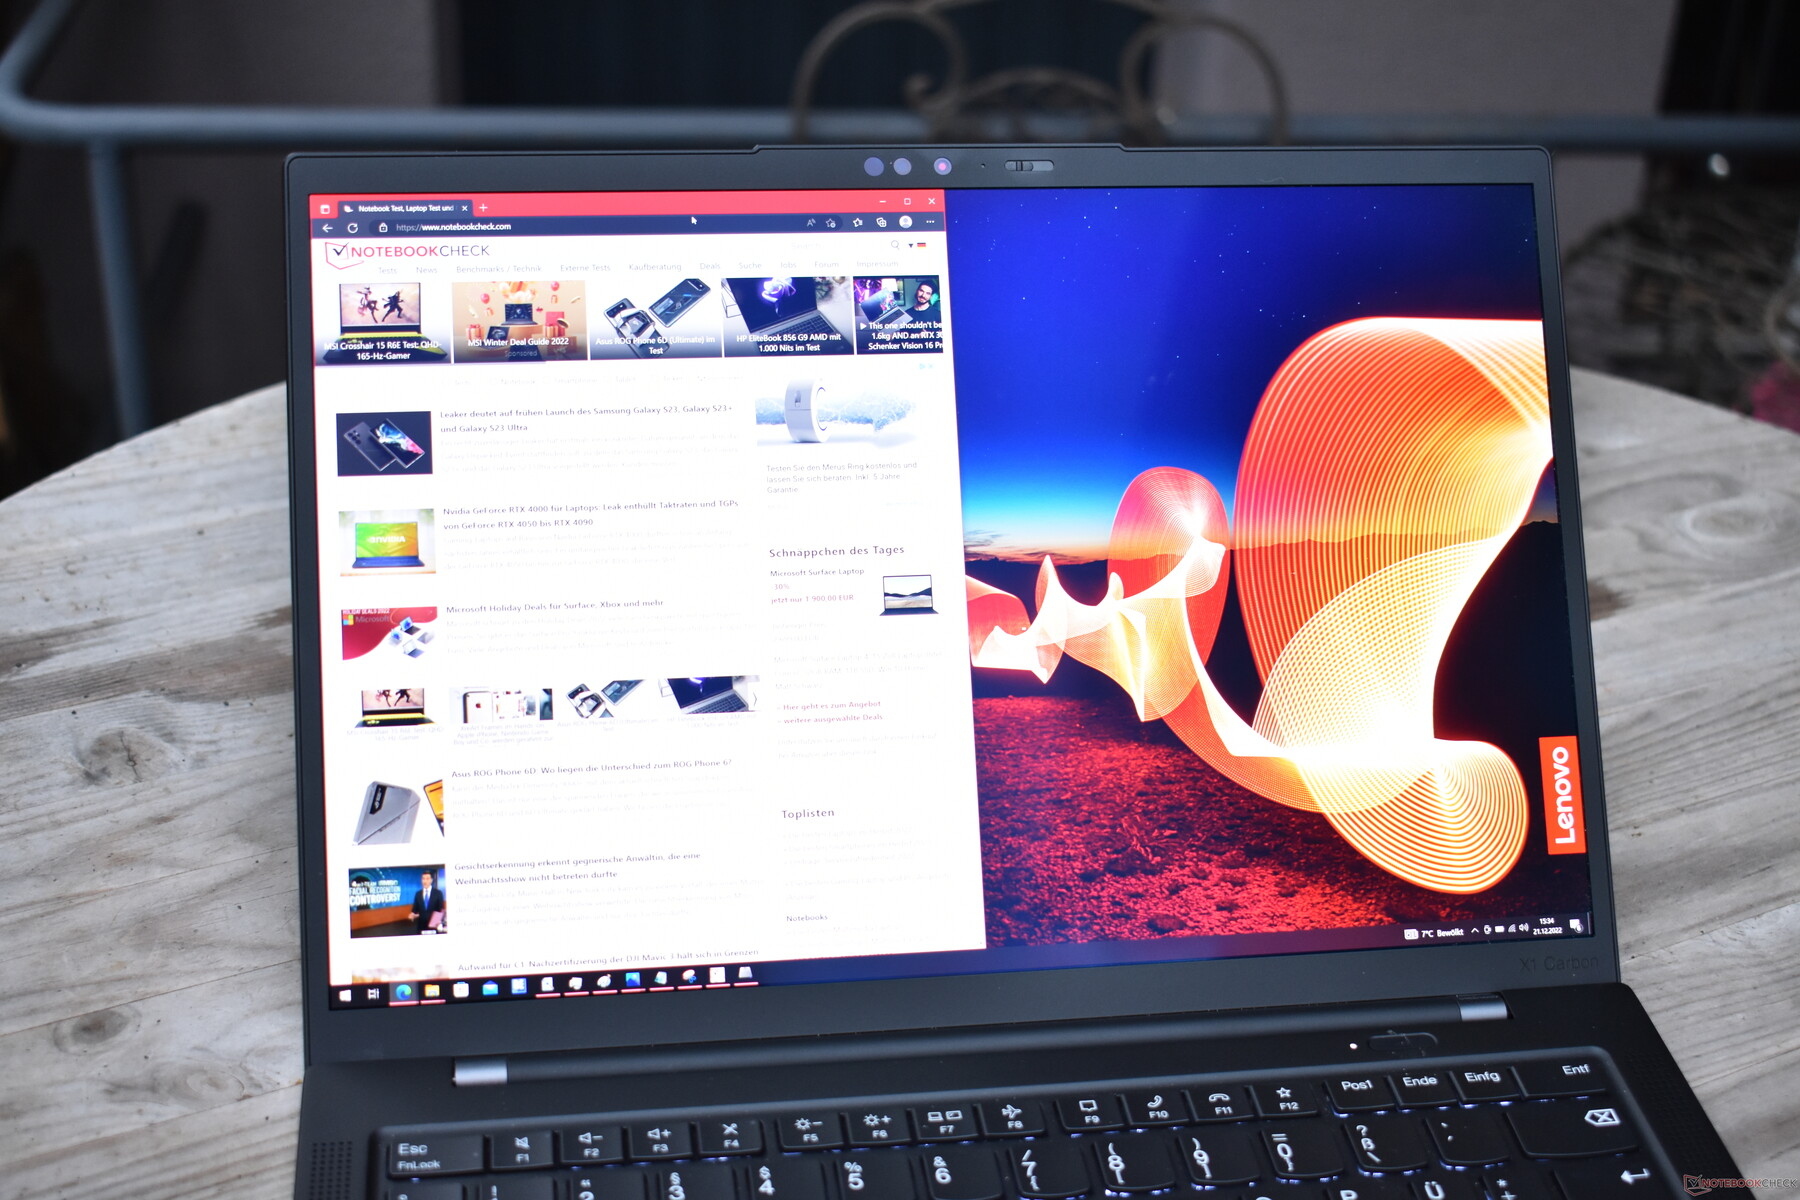
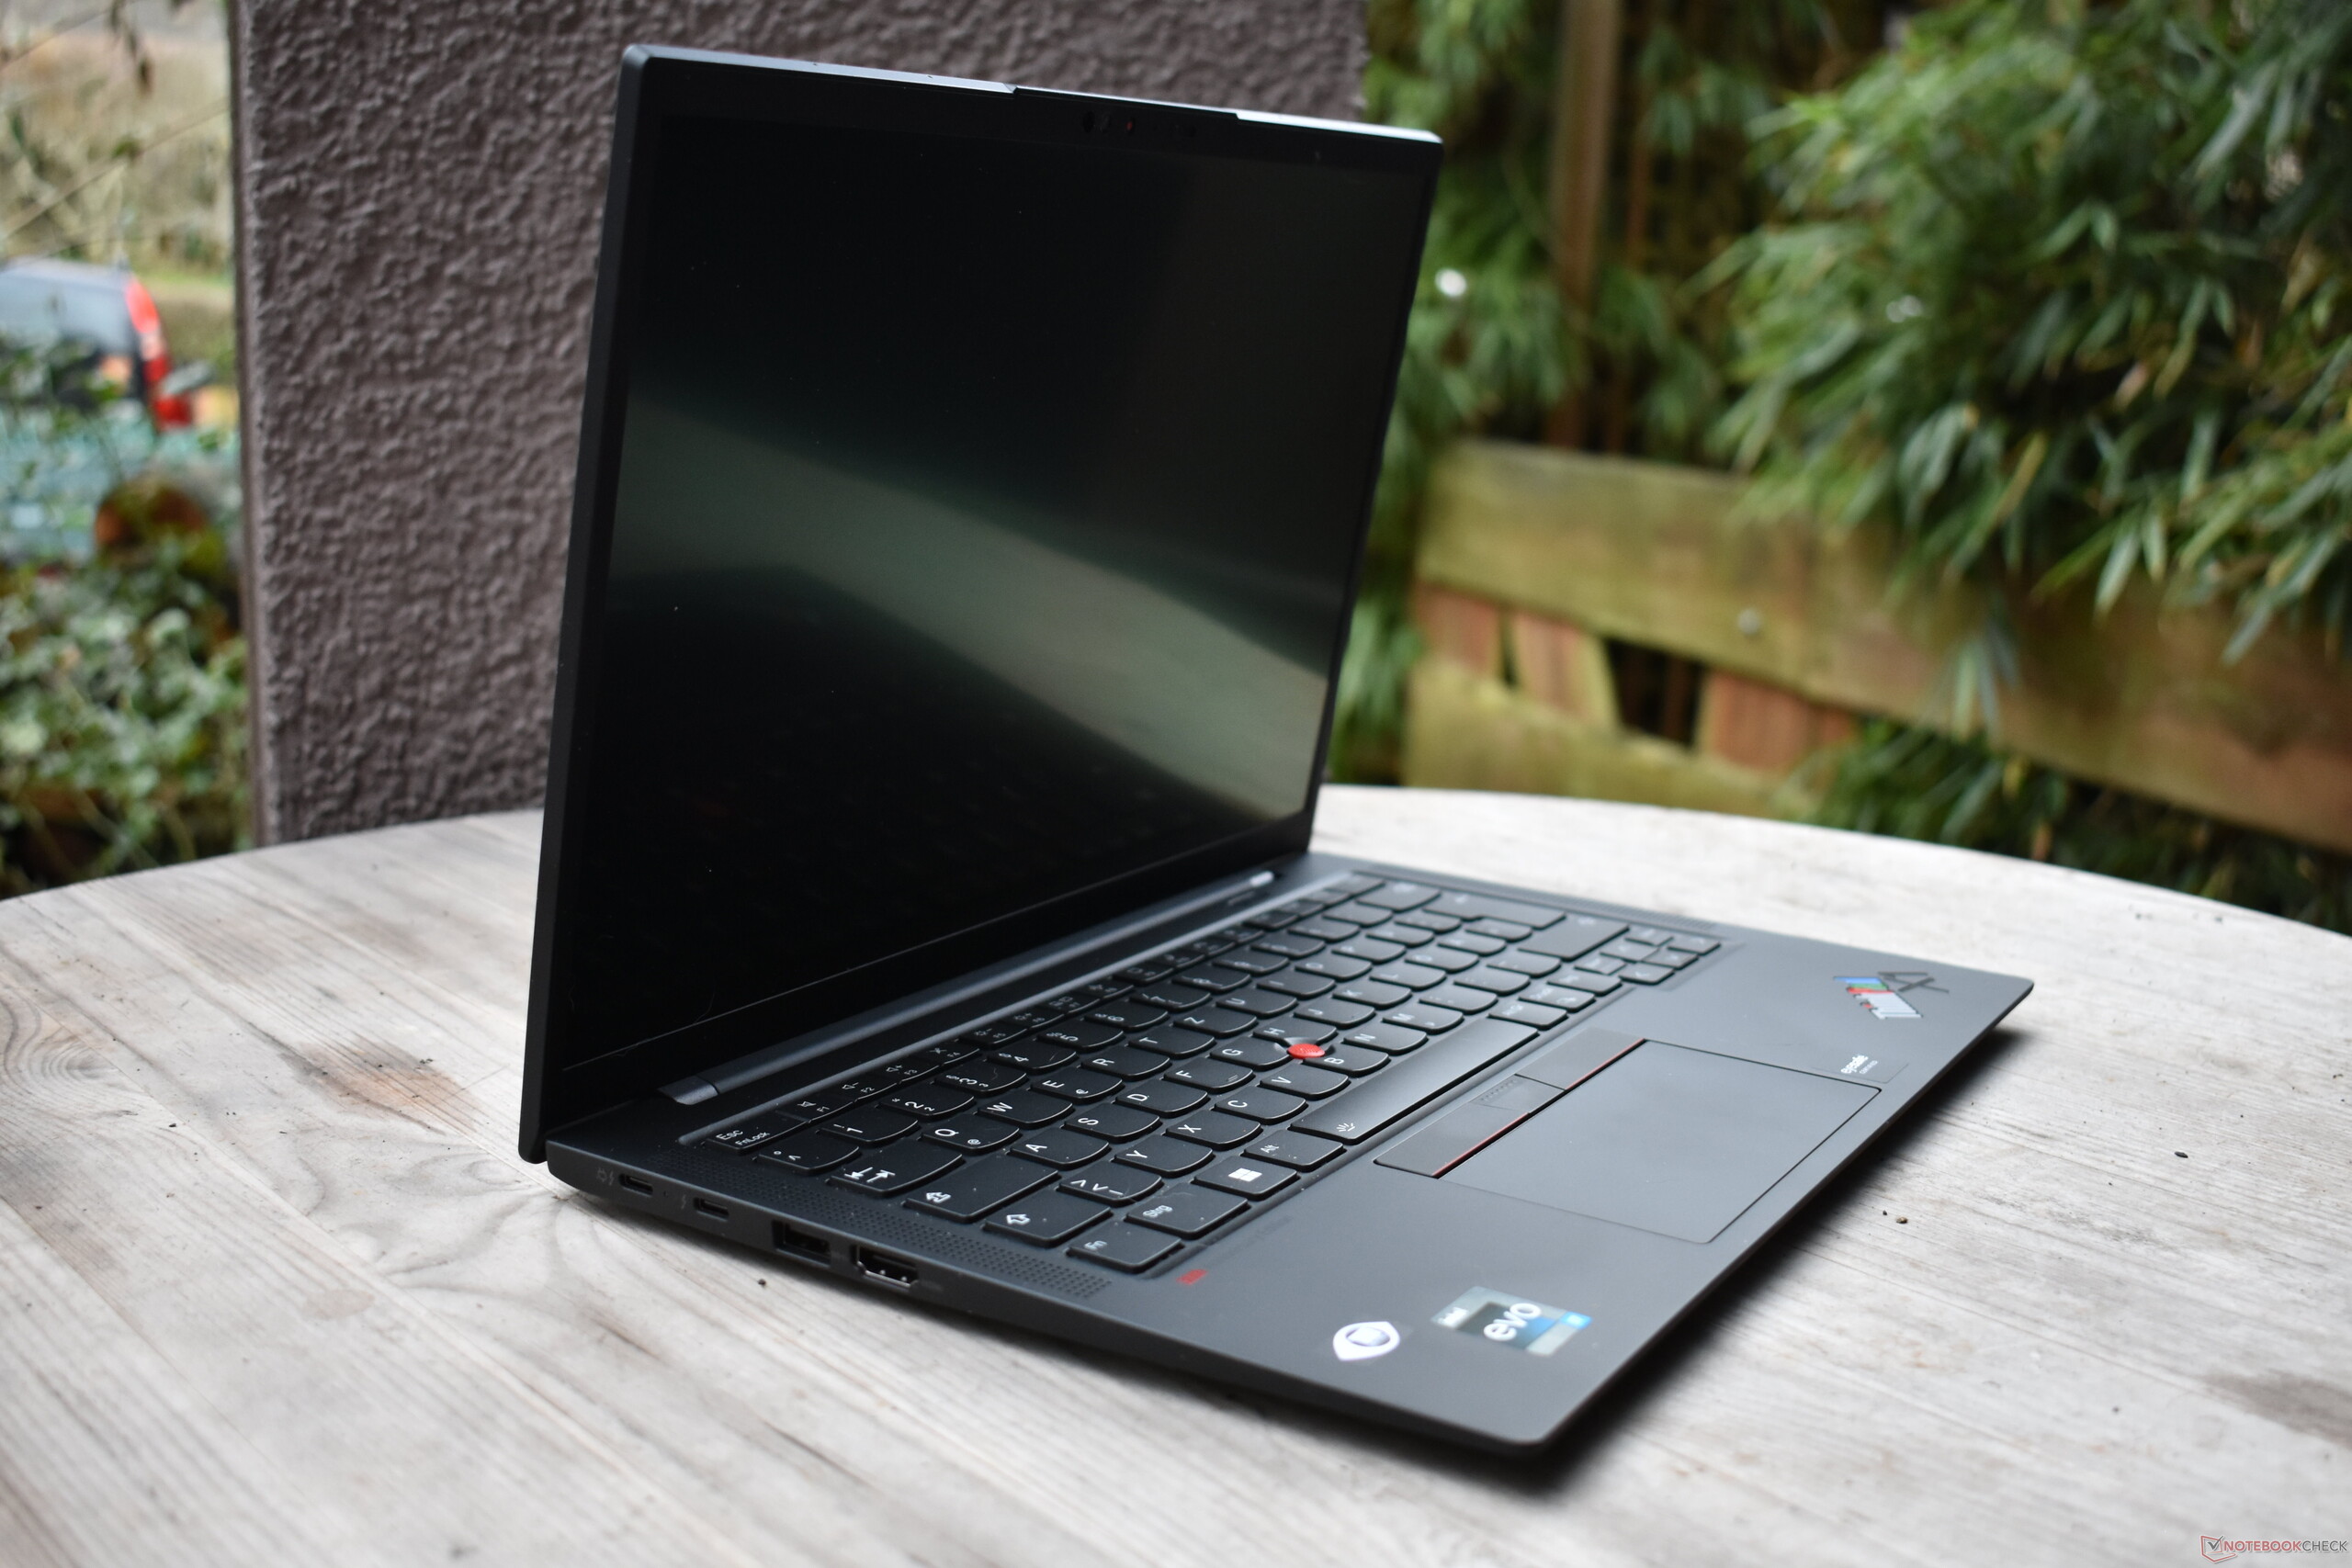
Las pantallas OLED suelen ser lustrosas - la pantalla del Lenovo ThinkPad X1 Carbon G10 también lo es, pero sólo ligeramente, y además es un panel antirreflejos. En combinación con un brillo de unos 400 cd/m² y el alto ratio de contraste, la pantalla puede usarse en exteriores sin problemas.
Tiempos de respuesta del display
| ↔ Tiempo de respuesta de Negro a Blanco | ||
|---|---|---|
| 1.6 ms ... subida ↗ y bajada ↘ combinada | ↗ 0.9 ms subida | 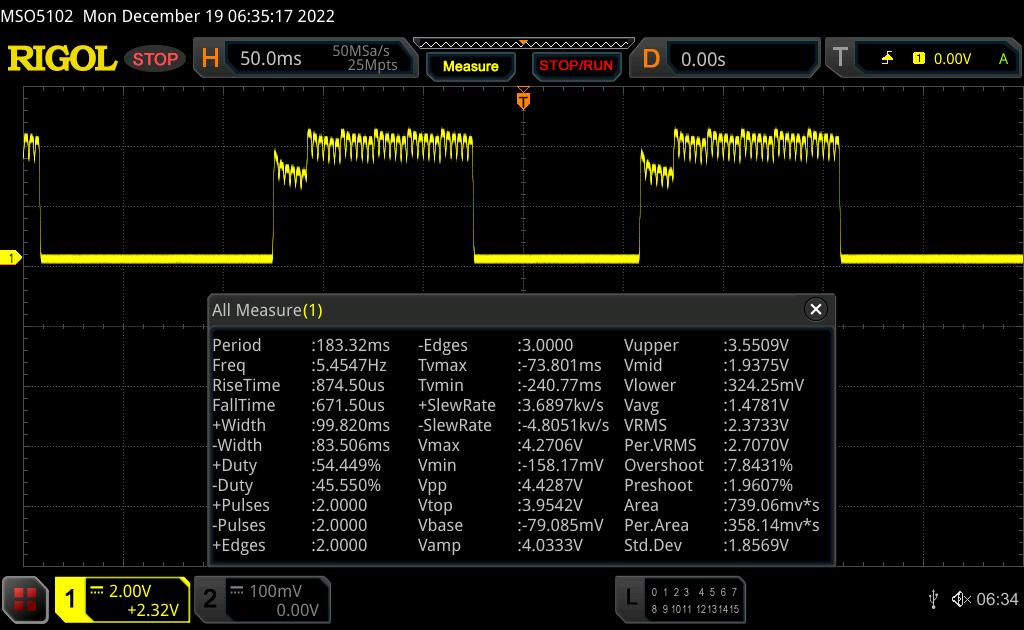 |
| ↘ 0.7 ms bajada | ||
| La pantalla mostró tiempos de respuesta muy rápidos en nuestros tests y debería ser adecuada para juegos frenéticos. En comparación, todos los dispositivos de prueba van de ##min### (mínimo) a 240 (máximo) ms. » 9 % de todos los dispositivos son mejores. Esto quiere decir que el tiempo de respuesta medido es mejor que la media (19.9 ms) de todos los dispositivos testados. | ||
| ↔ Tiempo de respuesta 50% Gris a 80% Gris | ||
| 1.2 ms ... subida ↗ y bajada ↘ combinada | ↗ 0.6 ms subida | 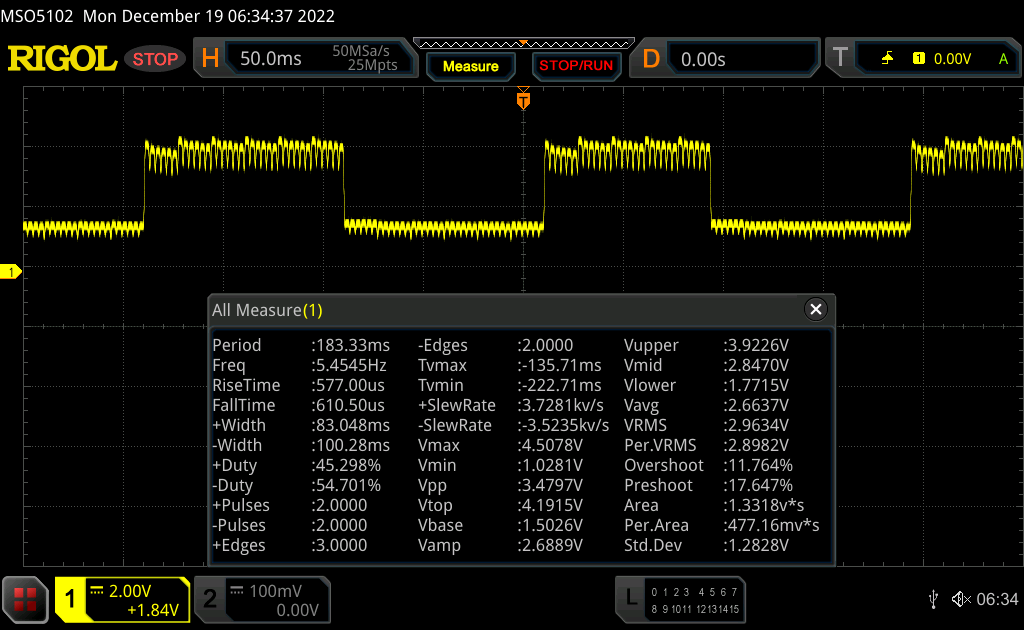 |
| ↘ 0.6 ms bajada | ||
| La pantalla mostró tiempos de respuesta muy rápidos en nuestros tests y debería ser adecuada para juegos frenéticos. En comparación, todos los dispositivos de prueba van de ##min### (mínimo) a 636 (máximo) ms. » 5 % de todos los dispositivos son mejores. Esto quiere decir que el tiempo de respuesta medido es mejor que la media (31.1 ms) de todos los dispositivos testados. | ||
Parpadeo de Pantalla / PWM (Pulse-Width Modulation)
| Parpadeo de Pantalla / PWM detectado | 342 Hz | ≤ 100 % de brillo | 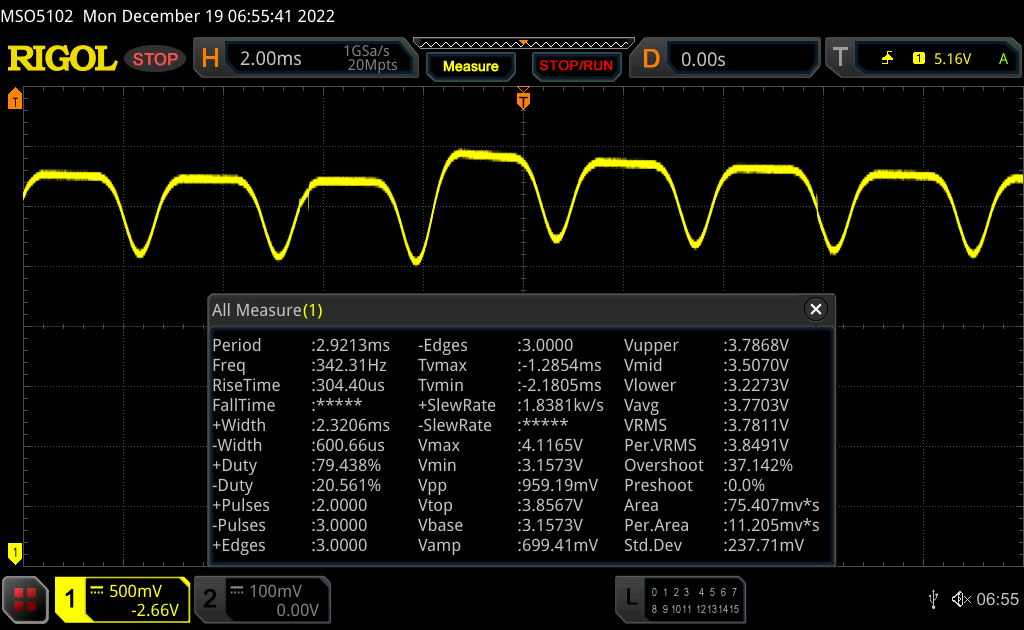 |
La retroiluminación del display parpadea a 342 Hz (seguramente usa PWM - Pulse-Width Modulation) a un brillo del 100 % e inferior. Sobre este nivel de brillo no debería darse parpadeo / PWM. La frecuencia de 342 Hz es relativamente alta, por lo que la mayoría de gente no debería ver parpadeo o tener fatiga visual. Sin embargo, hay informes de que algunas personas pueden seguir viendo parpadeos a 500 Hz y superior, por lo que cuidado. Comparación: 52 % de todos los dispositivos testados no usaron PWM para atenuar el display. Si se usó, medimos una media de 7798 (mínimo: 5 - máxmo: 343500) Hz. | |||

Rendimiento: Lenovo fija esta vez un límite de TDP más alto
Encontrará una descripción de las opciones de componentes en nuestro primer análisis del Lenovo ThinkPad X1 Carbon G10.
Condiciones de ensayo
Como siempre con los ThinkPads, Lenovo usa los modos de rendimiento de Windows que pueden configurarse en los ajustes de Windows. El modo "Mayor Duración de Batería" limita permanentemente el procesador a 11 vatios. En el nivel medio "Mejor Rendimiento", hasta 50 vatios son posibles como refuerzo, y el procesador está limitado a 19 vatios durante largos periodos de tiempo. Este límite a largo plazo también se aplica al ajuste "Mejor rendimiento", en el que son posibles hasta 56 vatios en ráfagas cortas y 28 vatios en etapas intermedias.
Procesador
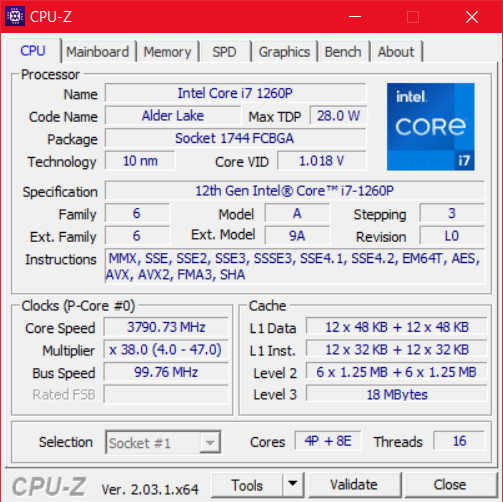
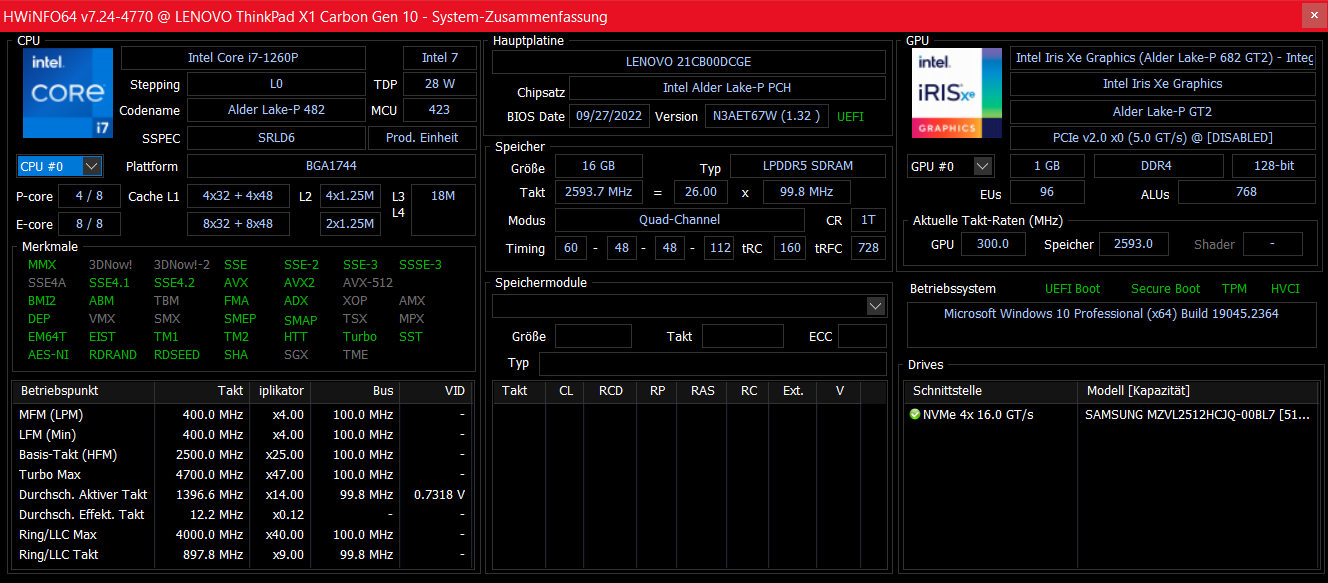
El Intel Core i7-1260Pes un procesador de la serie "Alder-Lake-P28". Como su nombre indica, un total de doce núcleos, cuatro de ellos de rendimiento y ocho de eficiencia, están diseñados para un consumo de 28 vatios. Nuestra lista de procesadores lista de procesadores puede utilizarse para realizar comparaciones más exhaustivas con otras CPU.
El consumo permanente de 19 vatios está muy por debajo de la marca de 28 vatios para la que realmente está pensado este procesador. Por otro lado, sigue siendo una mejora en comparación connuestra primera muestra del X1 Carbon G10cuyo Intel Core i5-1250P estaba permanentemente limitado a sólo 15 vatios. Además, el procesador puede mantener los 28 vatios como fase intermedia durante más tiempo que en nuestro primer análisis. En términos de rendimiento de CPU, el X1 Carbon Gen 10 es por tanto significativamente más competitivo. Sin embargo, sigue siendo claramente inferior al Lenovo ThinkPad Z13 con su procesador AMD.
El rendimiento de la CPU también está totalmente disponible en modo batería.
Cinebench R15 Multi Sustained Load
Cinebench R23: Multi Core | Single Core
Cinebench R20: CPU (Multi Core) | CPU (Single Core)
Cinebench R15: CPU Multi 64Bit | CPU Single 64Bit
Blender: v2.79 BMW27 CPU
7-Zip 18.03: 7z b 4 | 7z b 4 -mmt1
Geekbench 5.5: Multi-Core | Single-Core
HWBOT x265 Benchmark v2.2: 4k Preset
LibreOffice : 20 Documents To PDF
R Benchmark 2.5: Overall mean
| CPU Performance rating | |
| Lenovo ThinkPad Z13 G1-21D20016GE | |
| Dell Latitude 9430 2-in-1 -1! | |
| Media de la clase Office | |
| Medio Intel Core i7-1260P | |
| Lenovo ThinkPad X1 Carbon G10 21CB00DCGE | |
| HP Elite Dragonfly G3 | |
| Lenovo ThinkPad X1 Carbon G10 21CC001RGE | |
| Lenovo ThinkPad X1 Carbon G9-20XWCTO1WW | |
| Cinebench R23 / Multi Core | |
| Lenovo ThinkPad Z13 G1-21D20016GE | |
| Media de la clase Office (1673 - 22808, n=73, últimos 2 años) | |
| Lenovo ThinkPad X1 Carbon G10 21CB00DCGE | |
| Medio Intel Core i7-1260P (3173 - 12150, n=27) | |
| Dell Latitude 9430 2-in-1 | |
| Lenovo ThinkPad X1 Carbon G10 21CC001RGE | |
| HP Elite Dragonfly G3 | |
| Lenovo ThinkPad X1 Carbon G9-20XWCTO1WW | |
| Cinebench R23 / Single Core | |
| Dell Latitude 9430 2-in-1 | |
| Medio Intel Core i7-1260P (1155 - 1812, n=25) | |
| Media de la clase Office (708 - 2130, n=73, últimos 2 años) | |
| Lenovo ThinkPad X1 Carbon G10 21CB00DCGE | |
| HP Elite Dragonfly G3 | |
| Lenovo ThinkPad X1 Carbon G10 21CC001RGE | |
| Lenovo ThinkPad X1 Carbon G9-20XWCTO1WW | |
| Lenovo ThinkPad Z13 G1-21D20016GE | |
| Cinebench R20 / CPU (Multi Core) | |
| Lenovo ThinkPad Z13 G1-21D20016GE | |
| Media de la clase Office (648 - 8840, n=72, últimos 2 años) | |
| Lenovo ThinkPad X1 Carbon G10 21CB00DCGE | |
| Medio Intel Core i7-1260P (1234 - 4748, n=25) | |
| Dell Latitude 9430 2-in-1 | |
| HP Elite Dragonfly G3 | |
| Lenovo ThinkPad X1 Carbon G10 21CC001RGE | |
| Lenovo ThinkPad X1 Carbon G9-20XWCTO1WW | |
| Cinebench R20 / CPU (Single Core) | |
| Dell Latitude 9430 2-in-1 | |
| Media de la clase Office (345 - 816, n=72, últimos 2 años) | |
| Medio Intel Core i7-1260P (448 - 698, n=25) | |
| Lenovo ThinkPad X1 Carbon G10 21CB00DCGE | |
| Lenovo ThinkPad Z13 G1-21D20016GE | |
| HP Elite Dragonfly G3 | |
| Lenovo ThinkPad X1 Carbon G9-20XWCTO1WW | |
| Lenovo ThinkPad X1 Carbon G10 21CC001RGE | |
| Cinebench R15 / CPU Multi 64Bit | |
| Lenovo ThinkPad Z13 G1-21D20016GE | |
| Media de la clase Office (250 - 3380, n=74, últimos 2 años) | |
| Lenovo ThinkPad X1 Carbon G10 21CB00DCGE | |
| Dell Latitude 9430 2-in-1 | |
| Medio Intel Core i7-1260P (549 - 2034, n=29) | |
| Lenovo ThinkPad X1 Carbon G10 21CC001RGE | |
| HP Elite Dragonfly G3 | |
| Lenovo ThinkPad X1 Carbon G9-20XWCTO1WW | |
| Cinebench R15 / CPU Single 64Bit | |
| Dell Latitude 9430 2-in-1 | |
| Media de la clase Office (99.5 - 312, n=74, últimos 2 años) | |
| Lenovo ThinkPad Z13 G1-21D20016GE | |
| Medio Intel Core i7-1260P (165.4 - 260, n=27) | |
| HP Elite Dragonfly G3 | |
| Lenovo ThinkPad X1 Carbon G9-20XWCTO1WW | |
| Lenovo ThinkPad X1 Carbon G10 21CC001RGE | |
| Lenovo ThinkPad X1 Carbon G10 21CB00DCGE | |
| Blender / v2.79 BMW27 CPU | |
| Lenovo ThinkPad X1 Carbon G9-20XWCTO1WW | |
| Lenovo ThinkPad X1 Carbon G10 21CC001RGE | |
| HP Elite Dragonfly G3 | |
| Medio Intel Core i7-1260P (264 - 906, n=26) | |
| Media de la clase Office (158 - 1940, n=73, últimos 2 años) | |
| Lenovo ThinkPad X1 Carbon G10 21CB00DCGE | |
| Lenovo ThinkPad Z13 G1-21D20016GE | |
| 7-Zip 18.03 / 7z b 4 | |
| Lenovo ThinkPad Z13 G1-21D20016GE | |
| Media de la clase Office (7098 - 76886, n=75, últimos 2 años) | |
| Lenovo ThinkPad X1 Carbon G10 21CB00DCGE | |
| Medio Intel Core i7-1260P (16146 - 47064, n=25) | |
| Dell Latitude 9430 2-in-1 | |
| HP Elite Dragonfly G3 | |
| Lenovo ThinkPad X1 Carbon G10 21CC001RGE | |
| Lenovo ThinkPad X1 Carbon G9-20XWCTO1WW | |
| 7-Zip 18.03 / 7z b 4 -mmt1 | |
| Dell Latitude 9430 2-in-1 | |
| Media de la clase Office (3387 - 6469, n=74, últimos 2 años) | |
| Lenovo ThinkPad Z13 G1-21D20016GE | |
| Medio Intel Core i7-1260P (4064 - 5791, n=25) | |
| Lenovo ThinkPad X1 Carbon G10 21CB00DCGE | |
| Lenovo ThinkPad X1 Carbon G9-20XWCTO1WW | |
| HP Elite Dragonfly G3 | |
| Lenovo ThinkPad X1 Carbon G10 21CC001RGE | |
| Geekbench 5.5 / Multi-Core | |
| Dell Latitude 9430 2-in-1 | |
| Media de la clase Office (1483 - 16999, n=71, últimos 2 años) | |
| Medio Intel Core i7-1260P (3866 - 10570, n=25) | |
| Lenovo ThinkPad X1 Carbon G10 21CB00DCGE | |
| Lenovo ThinkPad Z13 G1-21D20016GE | |
| HP Elite Dragonfly G3 | |
| Lenovo ThinkPad X1 Carbon G10 21CC001RGE | |
| Lenovo ThinkPad X1 Carbon G9-20XWCTO1WW | |
| Geekbench 5.5 / Single-Core | |
| Media de la clase Office (811 - 2128, n=71, últimos 2 años) | |
| Dell Latitude 9430 2-in-1 | |
| Lenovo ThinkPad X1 Carbon G10 21CB00DCGE | |
| Medio Intel Core i7-1260P (1436 - 1786, n=25) | |
| Lenovo ThinkPad X1 Carbon G10 21CC001RGE | |
| Lenovo ThinkPad X1 Carbon G9-20XWCTO1WW | |
| HP Elite Dragonfly G3 | |
| Lenovo ThinkPad Z13 G1-21D20016GE | |
| HWBOT x265 Benchmark v2.2 / 4k Preset | |
| Lenovo ThinkPad Z13 G1-21D20016GE | |
| Media de la clase Office (2.21 - 26, n=73, últimos 2 años) | |
| Medio Intel Core i7-1260P (3.45 - 13.6, n=26) | |
| Dell Latitude 9430 2-in-1 | |
| Lenovo ThinkPad X1 Carbon G10 21CB00DCGE | |
| HP Elite Dragonfly G3 | |
| Lenovo ThinkPad X1 Carbon G10 21CC001RGE | |
| Lenovo ThinkPad X1 Carbon G9-20XWCTO1WW | |
| LibreOffice / 20 Documents To PDF | |
| HP Elite Dragonfly G3 | |
| Media de la clase Office (41.5 - 102.3, n=73, últimos 2 años) | |
| Lenovo ThinkPad X1 Carbon G10 21CC001RGE | |
| Lenovo ThinkPad Z13 G1-21D20016GE | |
| Medio Intel Core i7-1260P (40.2 - 65.7, n=25) | |
| Lenovo ThinkPad X1 Carbon G10 21CB00DCGE | |
| Dell Latitude 9430 2-in-1 | |
| Lenovo ThinkPad X1 Carbon G9-20XWCTO1WW | |
| R Benchmark 2.5 / Overall mean | |
| Lenovo ThinkPad X1 Carbon G9-20XWCTO1WW | |
| Lenovo ThinkPad X1 Carbon G10 21CC001RGE | |
| HP Elite Dragonfly G3 | |
| Media de la clase Office (0.4098 - 0.888, n=73, últimos 2 años) | |
| Lenovo ThinkPad X1 Carbon G10 21CB00DCGE | |
| Lenovo ThinkPad Z13 G1-21D20016GE | |
| Medio Intel Core i7-1260P (0.4559 - 0.727, n=25) | |
| Dell Latitude 9430 2-in-1 | |
* ... más pequeño es mejor
AIDA64: FP32 Ray-Trace | FPU Julia | CPU SHA3 | CPU Queen | FPU SinJulia | FPU Mandel | CPU AES | CPU ZLib | FP64 Ray-Trace | CPU PhotoWorxx
| Performance rating | |
| Lenovo ThinkPad Z13 G1-21D20016GE | |
| Media de la clase Office | |
| Dell Latitude 9430 2-in-1 | |
| Medio Intel Core i7-1260P | |
| Lenovo ThinkPad X1 Carbon G9-20XWCTO1WW | |
| Lenovo ThinkPad X1 Carbon G10 21CB00DCGE | |
| HP Elite Dragonfly G3 | |
| Lenovo ThinkPad X1 Carbon G10 21CC001RGE | |
| AIDA64 / FP32 Ray-Trace | |
| Media de la clase Office (2083 - 31245, n=79, últimos 2 años) | |
| Lenovo ThinkPad Z13 G1-21D20016GE | |
| Dell Latitude 9430 2-in-1 | |
| Lenovo ThinkPad X1 Carbon G9-20XWCTO1WW | |
| Lenovo ThinkPad X1 Carbon G10 21CB00DCGE | |
| Medio Intel Core i7-1260P (2176 - 10898, n=26) | |
| HP Elite Dragonfly G3 | |
| Lenovo ThinkPad X1 Carbon G10 21CC001RGE | |
| AIDA64 / FPU Julia | |
| Lenovo ThinkPad Z13 G1-21D20016GE | |
| Media de la clase Office (8191 - 125394, n=79, últimos 2 años) | |
| Dell Latitude 9430 2-in-1 | |
| Lenovo ThinkPad X1 Carbon G10 21CB00DCGE | |
| Medio Intel Core i7-1260P (11015 - 56906, n=26) | |
| HP Elite Dragonfly G3 | |
| Lenovo ThinkPad X1 Carbon G9-20XWCTO1WW | |
| Lenovo ThinkPad X1 Carbon G10 21CC001RGE | |
| AIDA64 / CPU SHA3 | |
| Lenovo ThinkPad Z13 G1-21D20016GE | |
| Media de la clase Office (433 - 5755, n=79, últimos 2 años) | |
| Dell Latitude 9430 2-in-1 | |
| Lenovo ThinkPad X1 Carbon G9-20XWCTO1WW | |
| Medio Intel Core i7-1260P (669 - 2709, n=26) | |
| HP Elite Dragonfly G3 | |
| Lenovo ThinkPad X1 Carbon G10 21CB00DCGE | |
| Lenovo ThinkPad X1 Carbon G10 21CC001RGE | |
| AIDA64 / CPU Queen | |
| Lenovo ThinkPad Z13 G1-21D20016GE | |
| Lenovo ThinkPad X1 Carbon G10 21CB00DCGE | |
| Medio Intel Core i7-1260P (42571 - 82493, n=26) | |
| Lenovo ThinkPad X1 Carbon G10 21CC001RGE | |
| Dell Latitude 9430 2-in-1 | |
| Media de la clase Office (22784 - 115197, n=69, últimos 2 años) | |
| HP Elite Dragonfly G3 | |
| Lenovo ThinkPad X1 Carbon G9-20XWCTO1WW | |
| AIDA64 / FPU SinJulia | |
| Lenovo ThinkPad Z13 G1-21D20016GE | |
| Media de la clase Office (1378 - 18321, n=79, últimos 2 años) | |
| Medio Intel Core i7-1260P (2901 - 6975, n=26) | |
| Dell Latitude 9430 2-in-1 | |
| Lenovo ThinkPad X1 Carbon G10 21CB00DCGE | |
| Lenovo ThinkPad X1 Carbon G10 21CC001RGE | |
| Lenovo ThinkPad X1 Carbon G9-20XWCTO1WW | |
| HP Elite Dragonfly G3 | |
| AIDA64 / FPU Mandel | |
| Lenovo ThinkPad Z13 G1-21D20016GE | |
| Media de la clase Office (4601 - 66922, n=79, últimos 2 años) | |
| Dell Latitude 9430 2-in-1 | |
| Lenovo ThinkPad X1 Carbon G9-20XWCTO1WW | |
| Lenovo ThinkPad X1 Carbon G10 21CB00DCGE | |
| Medio Intel Core i7-1260P (5950 - 26376, n=26) | |
| HP Elite Dragonfly G3 | |
| Lenovo ThinkPad X1 Carbon G10 21CC001RGE | |
| AIDA64 / CPU AES | |
| Lenovo ThinkPad X1 Carbon G9-20XWCTO1WW | |
| Lenovo ThinkPad Z13 G1-21D20016GE | |
| Media de la clase Office (4854 - 155900, n=79, últimos 2 años) | |
| Medio Intel Core i7-1260P (16041 - 92356, n=26) | |
| Dell Latitude 9430 2-in-1 | |
| Lenovo ThinkPad X1 Carbon G10 21CB00DCGE | |
| HP Elite Dragonfly G3 | |
| Lenovo ThinkPad X1 Carbon G10 21CC001RGE | |
| AIDA64 / CPU ZLib | |
| Media de la clase Office (114.6 - 1366, n=79, últimos 2 años) | |
| Lenovo ThinkPad Z13 G1-21D20016GE | |
| Dell Latitude 9430 2-in-1 | |
| Medio Intel Core i7-1260P (259 - 771, n=26) | |
| Lenovo ThinkPad X1 Carbon G10 21CC001RGE | |
| HP Elite Dragonfly G3 | |
| Lenovo ThinkPad X1 Carbon G10 21CB00DCGE | |
| Lenovo ThinkPad X1 Carbon G9-20XWCTO1WW | |
| AIDA64 / FP64 Ray-Trace | |
| Media de la clase Office (1109 - 17834, n=79, últimos 2 años) | |
| Lenovo ThinkPad Z13 G1-21D20016GE | |
| Dell Latitude 9430 2-in-1 | |
| Lenovo ThinkPad X1 Carbon G9-20XWCTO1WW | |
| Medio Intel Core i7-1260P (1237 - 5858, n=26) | |
| Lenovo ThinkPad X1 Carbon G10 21CB00DCGE | |
| HP Elite Dragonfly G3 | |
| Lenovo ThinkPad X1 Carbon G10 21CC001RGE | |
| AIDA64 / CPU PhotoWorxx | |
| Dell Latitude 9430 2-in-1 | |
| HP Elite Dragonfly G3 | |
| Lenovo ThinkPad X1 Carbon G9-20XWCTO1WW | |
| Lenovo ThinkPad X1 Carbon G10 21CB00DCGE | |
| Media de la clase Office (11090 - 65229, n=79, últimos 2 años) | |
| Lenovo ThinkPad X1 Carbon G10 21CC001RGE | |
| Medio Intel Core i7-1260P (13261 - 43652, n=26) | |
| Lenovo ThinkPad Z13 G1-21D20016GE | |
Rendimiento del sistema
Las pruebas sintéticas de rendimiento de sistema son similares a las de CPU. El Lenovo ThinkPad X1 Carbon Gen 10 30th Anniversary Edition funciona rápido, pero no ocupa la primera posición. En el uso diario, demuestra ser un dispositivo muy sensible.
CrossMark: Overall | Productivity | Creativity | Responsiveness
| PCMark 10 / Score | |
| Media de la clase Office (2601 - 9298, n=63, últimos 2 años) | |
| Lenovo ThinkPad Z13 G1-21D20016GE | |
| Medio Intel Core i7-1260P, Intel Iris Xe Graphics G7 96EUs (4796 - 6068, n=17) | |
| Dell Latitude 9430 2-in-1 | |
| Lenovo ThinkPad X1 Carbon G10 21CB00DCGE | |
| Lenovo ThinkPad X1 Carbon G10 21CC001RGE | |
| Lenovo ThinkPad X1 Carbon G9-20XWCTO1WW | |
| HP Elite Dragonfly G3 | |
| PCMark 10 / Essentials | |
| Dell Latitude 9430 2-in-1 | |
| Medio Intel Core i7-1260P, Intel Iris Xe Graphics G7 96EUs (9260 - 11251, n=17) | |
| Lenovo ThinkPad Z13 G1-21D20016GE | |
| Lenovo ThinkPad X1 Carbon G10 21CC001RGE | |
| Lenovo ThinkPad X1 Carbon G9-20XWCTO1WW | |
| Media de la clase Office (3245 - 11594, n=63, últimos 2 años) | |
| Lenovo ThinkPad X1 Carbon G10 21CB00DCGE | |
| HP Elite Dragonfly G3 | |
| PCMark 10 / Productivity | |
| Media de la clase Office (5336 - 17243, n=63, últimos 2 años) | |
| Lenovo ThinkPad Z13 G1-21D20016GE | |
| Dell Latitude 9430 2-in-1 | |
| Medio Intel Core i7-1260P, Intel Iris Xe Graphics G7 96EUs (6167 - 8629, n=17) | |
| Lenovo ThinkPad X1 Carbon G9-20XWCTO1WW | |
| Lenovo ThinkPad X1 Carbon G10 21CB00DCGE | |
| Lenovo ThinkPad X1 Carbon G10 21CC001RGE | |
| HP Elite Dragonfly G3 | |
| PCMark 10 / Digital Content Creation | |
| Media de la clase Office (2049 - 13541, n=63, últimos 2 años) | |
| Lenovo ThinkPad Z13 G1-21D20016GE | |
| Lenovo ThinkPad X1 Carbon G10 21CB00DCGE | |
| Medio Intel Core i7-1260P, Intel Iris Xe Graphics G7 96EUs (5231 - 6908, n=17) | |
| Dell Latitude 9430 2-in-1 | |
| HP Elite Dragonfly G3 | |
| Lenovo ThinkPad X1 Carbon G10 21CC001RGE | |
| Lenovo ThinkPad X1 Carbon G9-20XWCTO1WW | |
| CrossMark / Overall | |
| Medio Intel Core i7-1260P, Intel Iris Xe Graphics G7 96EUs (1484 - 1811, n=16) | |
| Dell Latitude 9430 2-in-1 | |
| Lenovo ThinkPad X1 Carbon G10 21CB00DCGE | |
| Lenovo ThinkPad X1 Carbon G10 21CC001RGE | |
| Lenovo ThinkPad Z13 G1-21D20016GE | |
| Media de la clase Office (381 - 2010, n=74, últimos 2 años) | |
| HP Elite Dragonfly G3 | |
| CrossMark / Productivity | |
| Medio Intel Core i7-1260P, Intel Iris Xe Graphics G7 96EUs (1486 - 1755, n=16) | |
| Dell Latitude 9430 2-in-1 | |
| Lenovo ThinkPad Z13 G1-21D20016GE | |
| Lenovo ThinkPad X1 Carbon G10 21CB00DCGE | |
| Lenovo ThinkPad X1 Carbon G10 21CC001RGE | |
| Media de la clase Office (464 - 1880, n=74, últimos 2 años) | |
| HP Elite Dragonfly G3 | |
| CrossMark / Creativity | |
| Medio Intel Core i7-1260P, Intel Iris Xe Graphics G7 96EUs (1451 - 1872, n=16) | |
| Lenovo ThinkPad X1 Carbon G10 21CB00DCGE | |
| Dell Latitude 9430 2-in-1 | |
| Lenovo ThinkPad X1 Carbon G10 21CC001RGE | |
| Media de la clase Office (319 - 2361, n=74, últimos 2 años) | |
| Lenovo ThinkPad Z13 G1-21D20016GE | |
| HP Elite Dragonfly G3 | |
| CrossMark / Responsiveness | |
| Medio Intel Core i7-1260P, Intel Iris Xe Graphics G7 96EUs (1253 - 1807, n=16) | |
| Dell Latitude 9430 2-in-1 | |
| Lenovo ThinkPad X1 Carbon G10 21CC001RGE | |
| Lenovo ThinkPad X1 Carbon G10 21CB00DCGE | |
| Lenovo ThinkPad Z13 G1-21D20016GE | |
| Media de la clase Office (360 - 1690, n=74, últimos 2 años) | |
| HP Elite Dragonfly G3 | |
| PCMark 10 Score | 5411 puntos | |
ayuda | ||
| AIDA64 / Memory Copy | |
| Dell Latitude 9430 2-in-1 | |
| HP Elite Dragonfly G3 | |
| Media de la clase Office (20075 - 110930, n=76, últimos 2 años) | |
| Lenovo ThinkPad X1 Carbon G10 21CC001RGE | |
| Lenovo ThinkPad X1 Carbon G10 21CB00DCGE | |
| Lenovo ThinkPad X1 Carbon G9-20XWCTO1WW | |
| Medio Intel Core i7-1260P (25125 - 71544, n=25) | |
| Lenovo ThinkPad Z13 G1-21D20016GE | |
| AIDA64 / Memory Read | |
| Lenovo ThinkPad X1 Carbon G10 21CC001RGE | |
| Lenovo ThinkPad X1 Carbon G10 21CB00DCGE | |
| Media de la clase Office (10084 - 128030, n=77, últimos 2 años) | |
| HP Elite Dragonfly G3 | |
| Dell Latitude 9430 2-in-1 | |
| Lenovo ThinkPad X1 Carbon G9-20XWCTO1WW | |
| Medio Intel Core i7-1260P (24983 - 72065, n=25) | |
| Lenovo ThinkPad Z13 G1-21D20016GE | |
| AIDA64 / Memory Write | |
| Media de la clase Office (20073 - 119858, n=77, últimos 2 años) | |
| Dell Latitude 9430 2-in-1 | |
| Lenovo ThinkPad X1 Carbon G10 21CB00DCGE | |
| Lenovo ThinkPad X1 Carbon G9-20XWCTO1WW | |
| Lenovo ThinkPad X1 Carbon G10 21CC001RGE | |
| HP Elite Dragonfly G3 | |
| Medio Intel Core i7-1260P (23512 - 66799, n=25) | |
| Lenovo ThinkPad Z13 G1-21D20016GE | |
| AIDA64 / Memory Latency | |
| Lenovo ThinkPad Z13 G1-21D20016GE | |
| HP Elite Dragonfly G3 | |
| Dell Latitude 9430 2-in-1 | |
| Media de la clase Office (7.6 - 162.9, n=72, últimos 2 años) | |
| Lenovo ThinkPad X1 Carbon G10 21CB00DCGE | |
| Lenovo ThinkPad X1 Carbon G9-20XWCTO1WW | |
| Medio Intel Core i7-1260P (77.9 - 118.4, n=21) | |
| Lenovo ThinkPad X1 Carbon G10 21CC001RGE | |
| Lenovo ThinkPad X1 Carbon G10 21CC001RGE | |
* ... más pequeño es mejor
Latencia del CPD
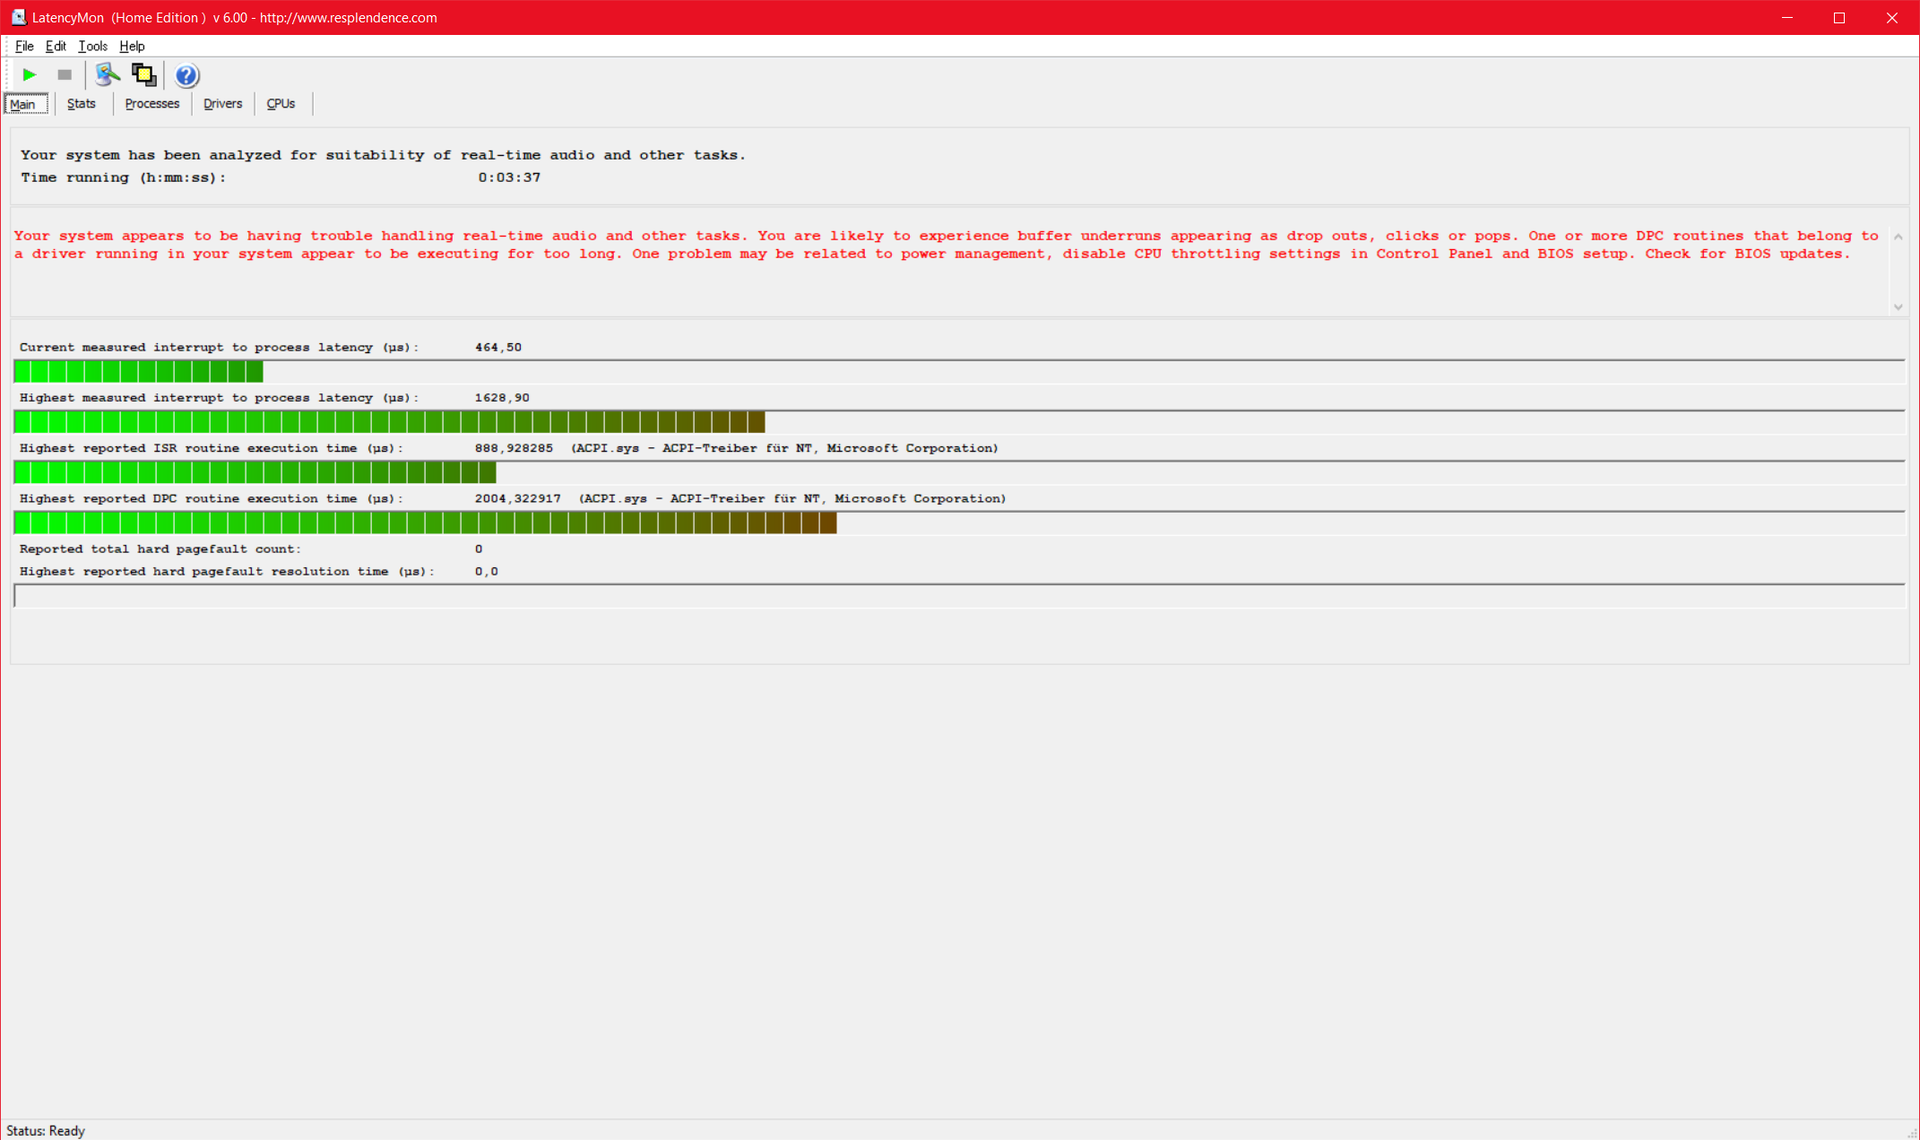
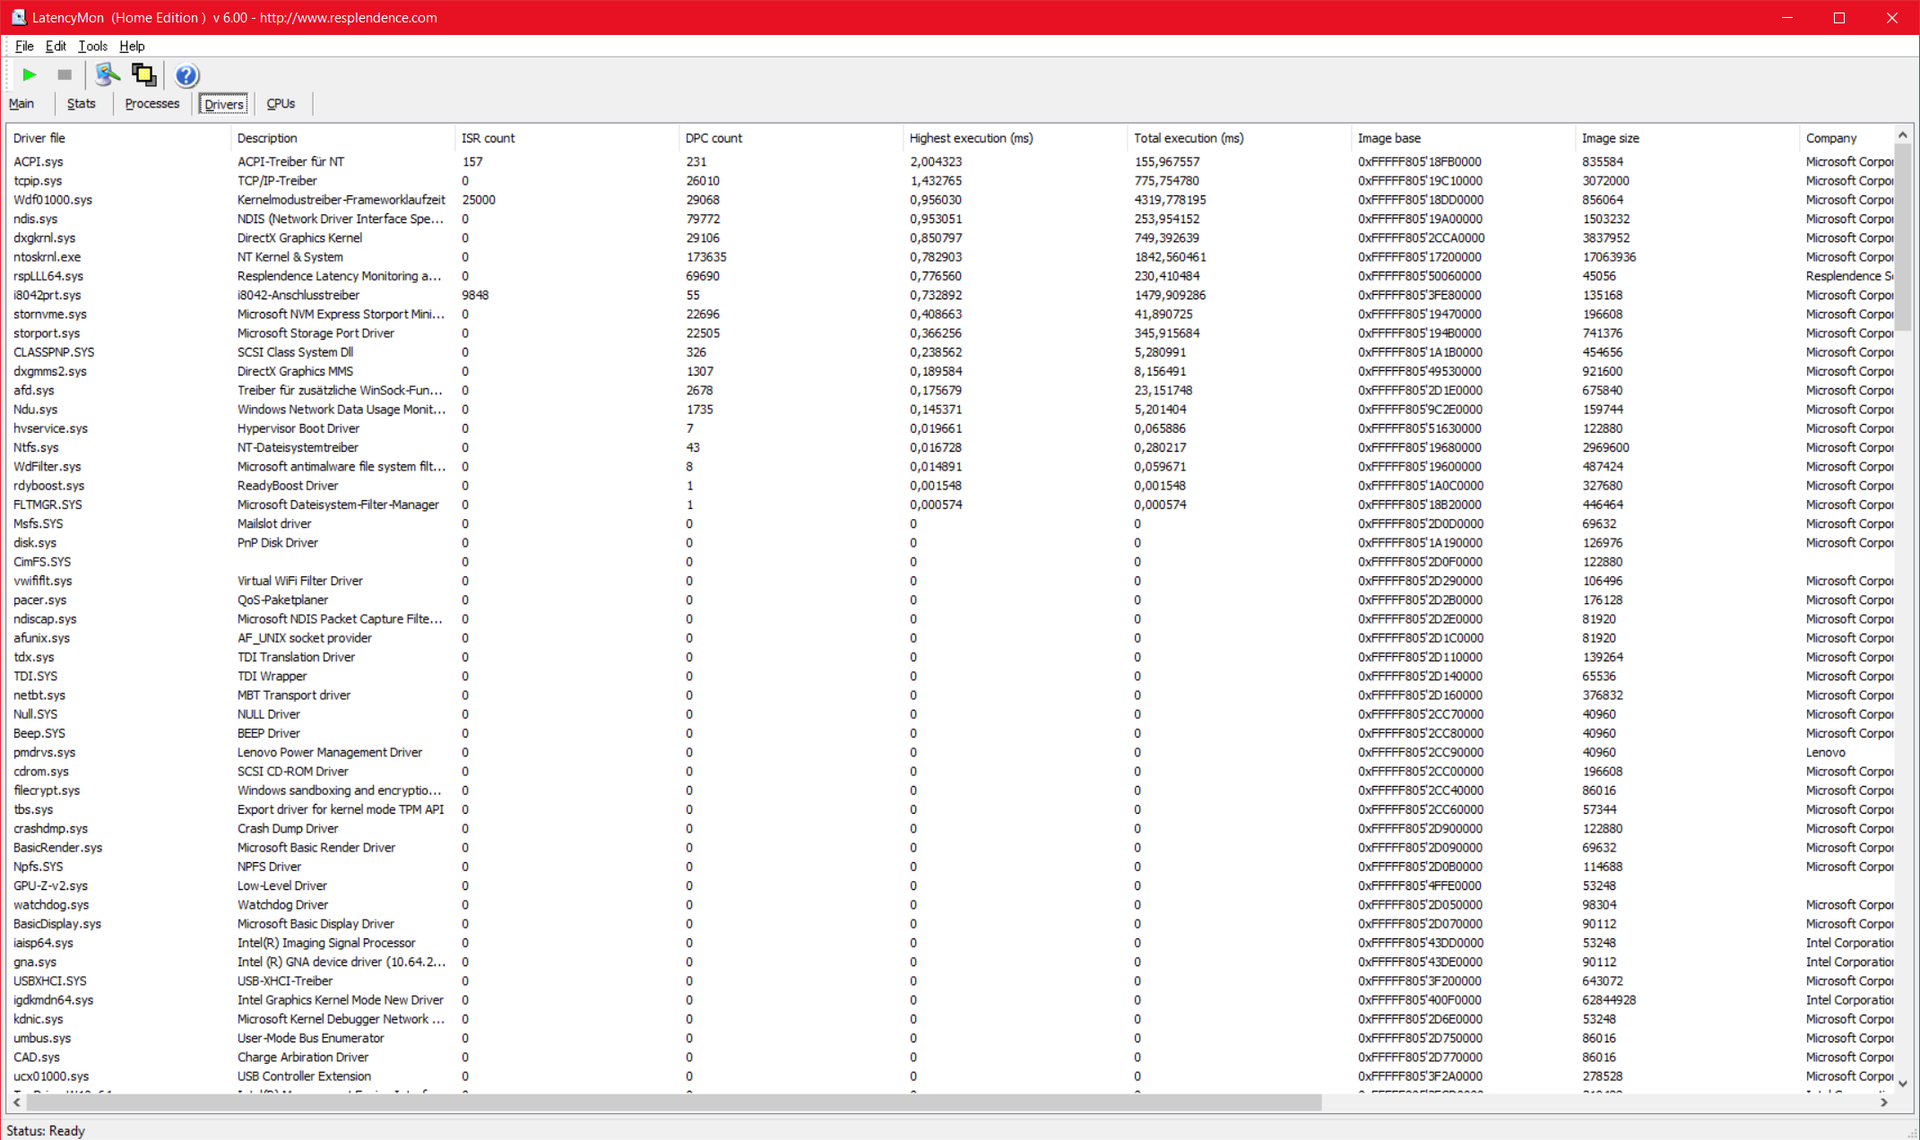
| DPC Latencies / LatencyMon - interrupt to process latency (max), Web, Youtube, Prime95 | |
| Lenovo ThinkPad X1 Carbon G10 21CC001RGE | |
| Lenovo ThinkPad X1 Carbon G10 21CB00DCGE | |
| HP Elite Dragonfly G3 | |
| Dell Latitude 9430 2-in-1 | |
| Lenovo ThinkPad Z13 G1-21D20016GE | |
| Lenovo ThinkPad X1 Carbon G9-20XWCTO1WW | |
* ... más pequeño es mejor
Dispositivos de almacenamiento
El SSD M.2 PM91A con una capacidad de 512 GB viene de Samsung. Está conectado al estándar NVMe PCIe 4.0 y funciona rápido, aunque ligeramente por debajo de la media para este SSD. Al menos el rendimiento es completamente estable, incluso bajo carga permanente.

* ... más pequeño es mejor
Sustained Read Performance: DiskSpd Read Loop, Queue Depth 8
Tarjeta gráfica
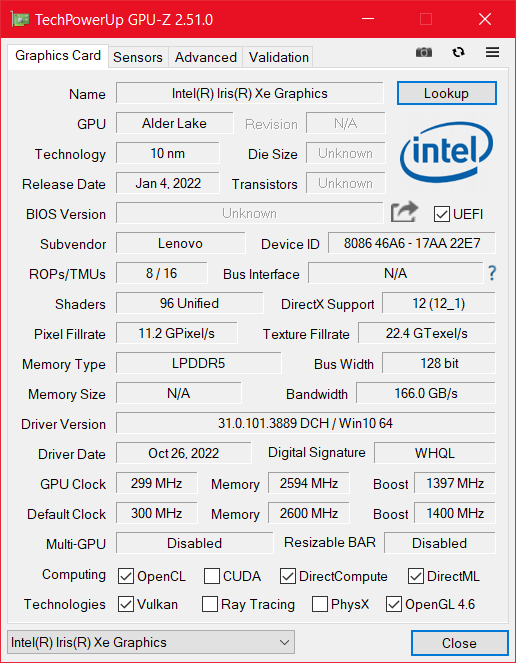
En comparación con nuestra primera muestra de revisión del X1 Carbon 2022, también se ha producido un cambio en la GPU, ya que la IntelIris Xe instalada tiene 96 en vez de 80 unidades de ejecución. Esto resulta en un ligero aumento de rendimiento, pero no supone una gran diferencia. La GPU es suficiente para tareas sencillas, pero el X1 Carbon G10 es el portátil equivocado para todo lo demás, incluyendo tanto juegos como CAD.
| 3DMark 11 Performance | 5769 puntos | |
| 3DMark Cloud Gate Standard Score | 14688 puntos | |
| 3DMark Fire Strike Score | 4154 puntos | |
| 3DMark Time Spy Score | 1722 puntos | |
ayuda | ||
* ... más pequeño es mejor
| The Witcher 3 - 1920x1080 Ultra Graphics & Postprocessing (HBAO+) | |
| Lenovo ThinkPad Z13 G1-21D20016GE | |
| Media de la clase Office (14.8 - 18.1, n=4, últimos 2 años) | |
| Dell Latitude 9430 2-in-1 | |
| HP Elite Dragonfly G3 | |
| Lenovo ThinkPad X1 Carbon G10 21CB00DCGE | |
| Lenovo ThinkPad X1 Carbon G10 21CC001RGE | |
| Final Fantasy XV Benchmark - 1920x1080 High Quality | |
| Media de la clase Office (8.09 - 79.5, n=67, últimos 2 años) | |
| Lenovo ThinkPad Z13 G1-21D20016GE | |
| Dell Latitude 9430 2-in-1 | |
| HP Elite Dragonfly G3 | |
| Lenovo ThinkPad X1 Carbon G10 21CB00DCGE | |
| Lenovo ThinkPad X1 Carbon G10 21CC001RGE | |
| Strange Brigade - 1920x1080 ultra AA:ultra AF:16 | |
| Lenovo ThinkPad Z13 G1-21D20016GE | |
| Media de la clase Office (12.9 - 142.1, n=50, últimos 2 años) | |
| Dell Latitude 9430 2-in-1 | |
| HP Elite Dragonfly G3 | |
| Lenovo ThinkPad X1 Carbon G10 21CB00DCGE | |
| Dota 2 Reborn - 1920x1080 ultra (3/3) best looking | |
| Lenovo ThinkPad Z13 G1-21D20016GE | |
| Dell Latitude 9430 2-in-1 | |
| Media de la clase Office (14.6 - 135, n=73, últimos 2 años) | |
| HP Elite Dragonfly G3 | |
| Lenovo ThinkPad X1 Carbon G10 21CB00DCGE | |
| Lenovo ThinkPad X1 Carbon G10 21CC001RGE | |
Witcher 3 FPS Chart
| bajo | medio | alto | ultra | QHD | |
|---|---|---|---|---|---|
| The Witcher 3 (2015) | 83.3 | 51 | 27.2 | 12.9 | |
| Dota 2 Reborn (2015) | 99.8 | 74.7 | 50.3 | 43.5 | |
| Final Fantasy XV Benchmark (2018) | 39.8 | 18.6 | 13 | 9.59 | |
| X-Plane 11.11 (2018) | 38.1 | 38.2 | 34.2 | ||
| Strange Brigade (2018) | 79.2 | 34.2 | 25.8 | 19.8 |
Emisiones: Un mayor rendimiento implica un mayor ruido del ventilador
Ruido
Si bien los valores de rendimiento han mejorado, ocurre lo contrario con el ruido de los ventiladores, que son más ruidosos que en nuestro primer modelo de pruebas y también funcionan con más frecuencia. Incluso en inactivo, el sistema de refrigeración entra en acción de vez en cuando. En comparación, sólo el Lenovo ThinkPad Z13 tiene una refrigeración más ruidosa bajo carga. Por tanto, el ThinkPad X1 Carbon G10 no es necesariamente la elección adecuada para los amantes del silencio, especialmente dado que los ventiladores también son relativamente de alta frecuencia.
No se detectó ningún quejido de bobina.
Ruido
| Ocioso |
| 22.8 / 22.8 / 24.6 dB(A) |
| Carga |
| 38.2 / 38.2 dB(A) |
 | ||
30 dB silencioso 40 dB(A) audible 50 dB(A) ruidosamente alto |
||
min: | ||
| Lenovo ThinkPad X1 Carbon G10 21CB00DCGE Iris Xe G7 96EUs, i7-1260P, Samsung PM9A1 MZVL2512HCJQ | Lenovo ThinkPad X1 Carbon G10 21CC001RGE Iris Xe G7 80EUs, i5-1250P, Samsung PM9A1 MZVL2512HCJQ | Lenovo ThinkPad X1 Carbon G9-20XWCTO1WW Iris Xe G7 96EUs, i7-1165G7, Samsung PM9A1 MZVL21T0HCLR | Lenovo ThinkPad Z13 G1-21D20016GE Radeon 680M, R7 PRO 6860Z, Micron 2450 1TB MTFDKCD1T0TFK | HP Elite Dragonfly G3 Iris Xe G7 96EUs, i7-1265U, Micron 3400 MTFDKBA512TFH 512GB | Dell Latitude 9430 2-in-1 Iris Xe G7 96EUs, i7-1265U | |
|---|---|---|---|---|---|---|
| Noise | 5% | 2% | -6% | 9% | -4% | |
| apagado / medio ambiente * (dB) | 22.8 | 22.81 -0% | 23.66 -4% | 24.3 -7% | 22.8 -0% | 23.7 -4% |
| Idle Minimum * (dB) | 22.8 | 22.81 -0% | 23.6 -4% | 24.3 -7% | 23.2 -2% | 23.7 -4% |
| Idle Average * (dB) | 22.8 | 22.81 -0% | 23.6 -4% | 24.3 -7% | 23.2 -2% | 23.7 -4% |
| Idle Maximum * (dB) | 24.6 | 22.81 7% | 23.6 4% | 24.3 1% | 23.2 6% | 23.7 4% |
| Load Average * (dB) | 38.2 | 31.59 17% | 33.5 12% | 41 -7% | 25.1 34% | 35.1 8% |
| Witcher 3 ultra * (dB) | 38.1 | 35.59 7% | 41 -8% | 32 16% | 43.3 -14% | |
| Load Maximum * (dB) | 38.2 | 35.47 7% | 34.3 10% | 41 -7% | 35.2 8% | 43 -13% |
* ... más pequeño es mejor
Temperatura
La mayor parte del desarrollo de calor se concentra en la esquina superior izquierda de la carcasa. Alrededor de 50 grados Celsius se alcanzan aquí bajo carga, tanto en la parte superior como en la inferior, e incluso un poco más en el test Witcher 3. Afortunadamente, estas son áreas que no suelen tocarse durante el uso, pero el Lenovo ThinkPad X1 Carbon G10 30th Anniversary Edition ciertamente no puede describirse como un portátil de funcionamiento fresco.
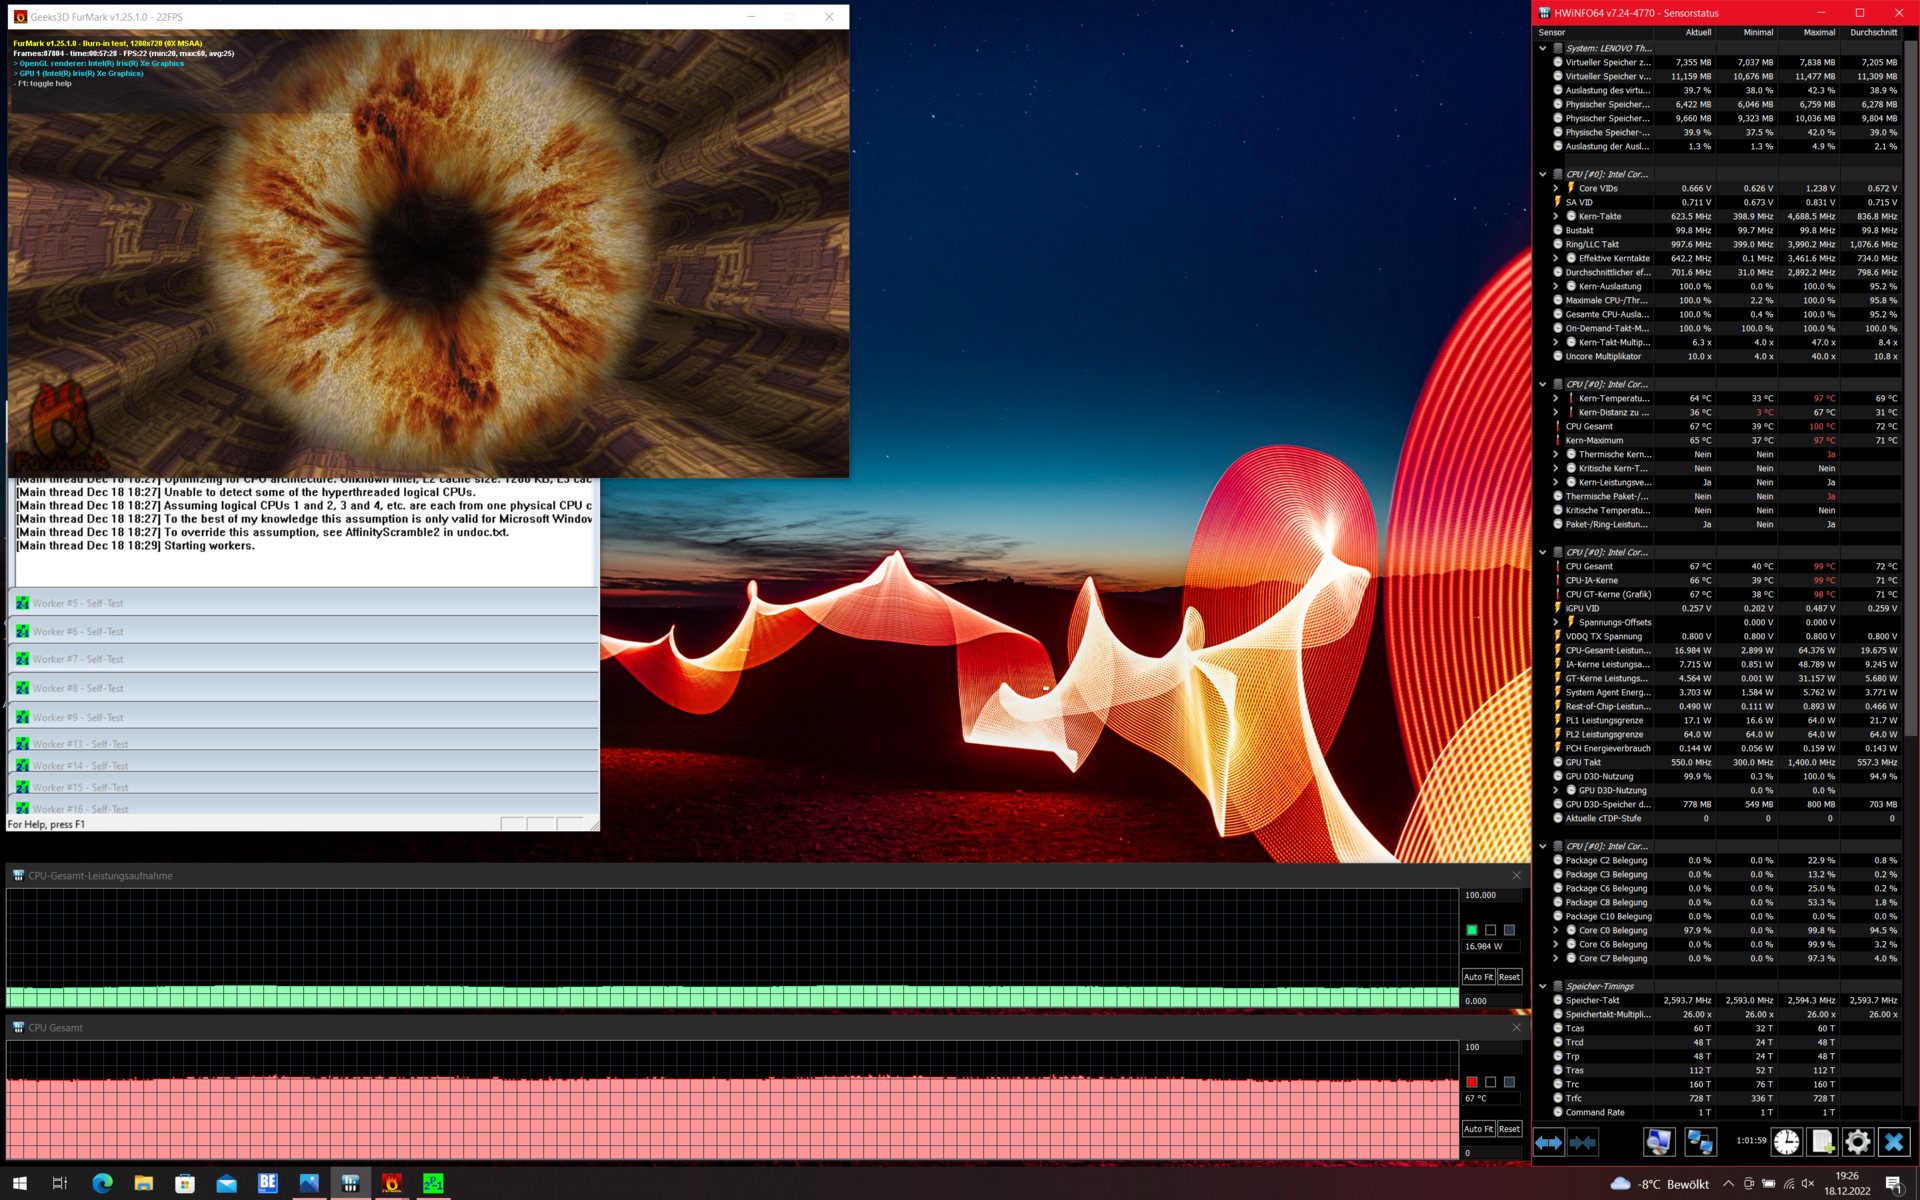
Durante las pruebas de estrés, es decir, la carga simultánea de GPU y CPU, el procesador está permanentemente limitado a sólo 17 vatios. Este estrangulamiento relacionado con el TDP no tiene más impacto en el uso diario, aparte de la limitación ya existente del rendimiento de la CPU. En este caso, la GPU consume una parte adicional del presupuesto del TDP.
(-) La temperatura máxima en la parte superior es de 50 °C / 122 F, frente a la media de 34.3 °C / 94 F, que oscila entre 21.2 y 62.5 °C para la clase Office.
(-) El fondo se calienta hasta un máximo de 49.7 °C / 121 F, frente a la media de 36.8 °C / 98 F
(+) En reposo, la temperatura media de la parte superior es de 27.1 °C / 81# F, frente a la media del dispositivo de 29.5 °C / 85 F.
(±) Jugando a The Witcher 3, la temperatura media de la parte superior es de 35.7 °C / 96 F, frente a la media del dispositivo de 29.5 °C / 85 F.
(+) El reposamanos y el panel táctil están a una temperatura inferior a la de la piel, con un máximo de 28.8 °C / 83.8 F y, por tanto, son fríos al tacto.
(±) La temperatura media de la zona del reposamanos de dispositivos similares fue de 27.5 °C / 81.5 F (-1.3 °C / -2.3 F).
| Lenovo ThinkPad X1 Carbon G10 21CB00DCGE Intel Core i7-1260P, Intel Iris Xe Graphics G7 96EUs | Lenovo ThinkPad X1 Carbon G10 21CC001RGE Intel Core i5-1250P, Intel Iris Xe Graphics G7 80EUs | Lenovo ThinkPad X1 Carbon G9-20XWCTO1WW Intel Core i7-1165G7, Intel Iris Xe Graphics G7 96EUs | Lenovo ThinkPad Z13 G1-21D20016GE AMD Ryzen 7 PRO 6860Z, AMD Radeon 680M | HP Elite Dragonfly G3 Intel Core i7-1265U, Intel Iris Xe Graphics G7 96EUs | Dell Latitude 9430 2-in-1 Intel Core i7-1265U, Intel Iris Xe Graphics G7 96EUs | |
|---|---|---|---|---|---|---|
| Heat | 6% | 6% | 9% | 17% | 24% | |
| Maximum Upper Side * (°C) | 50 | 45 10% | 51.5 -3% | 45.6 9% | 39 22% | 39.2 22% |
| Maximum Bottom * (°C) | 49.7 | 44 11% | 45.3 9% | 51 -3% | 42.2 15% | 44.8 10% |
| Idle Upper Side * (°C) | 32.4 | 31.2 4% | 29.6 9% | 27 17% | 26.8 17% | 21.4 34% |
| Idle Bottom * (°C) | 32.3 | 33.2 -3% | 30 7% | 27.9 14% | 28.2 13% | 22.4 31% |
* ... más pequeño es mejor
Altavoces
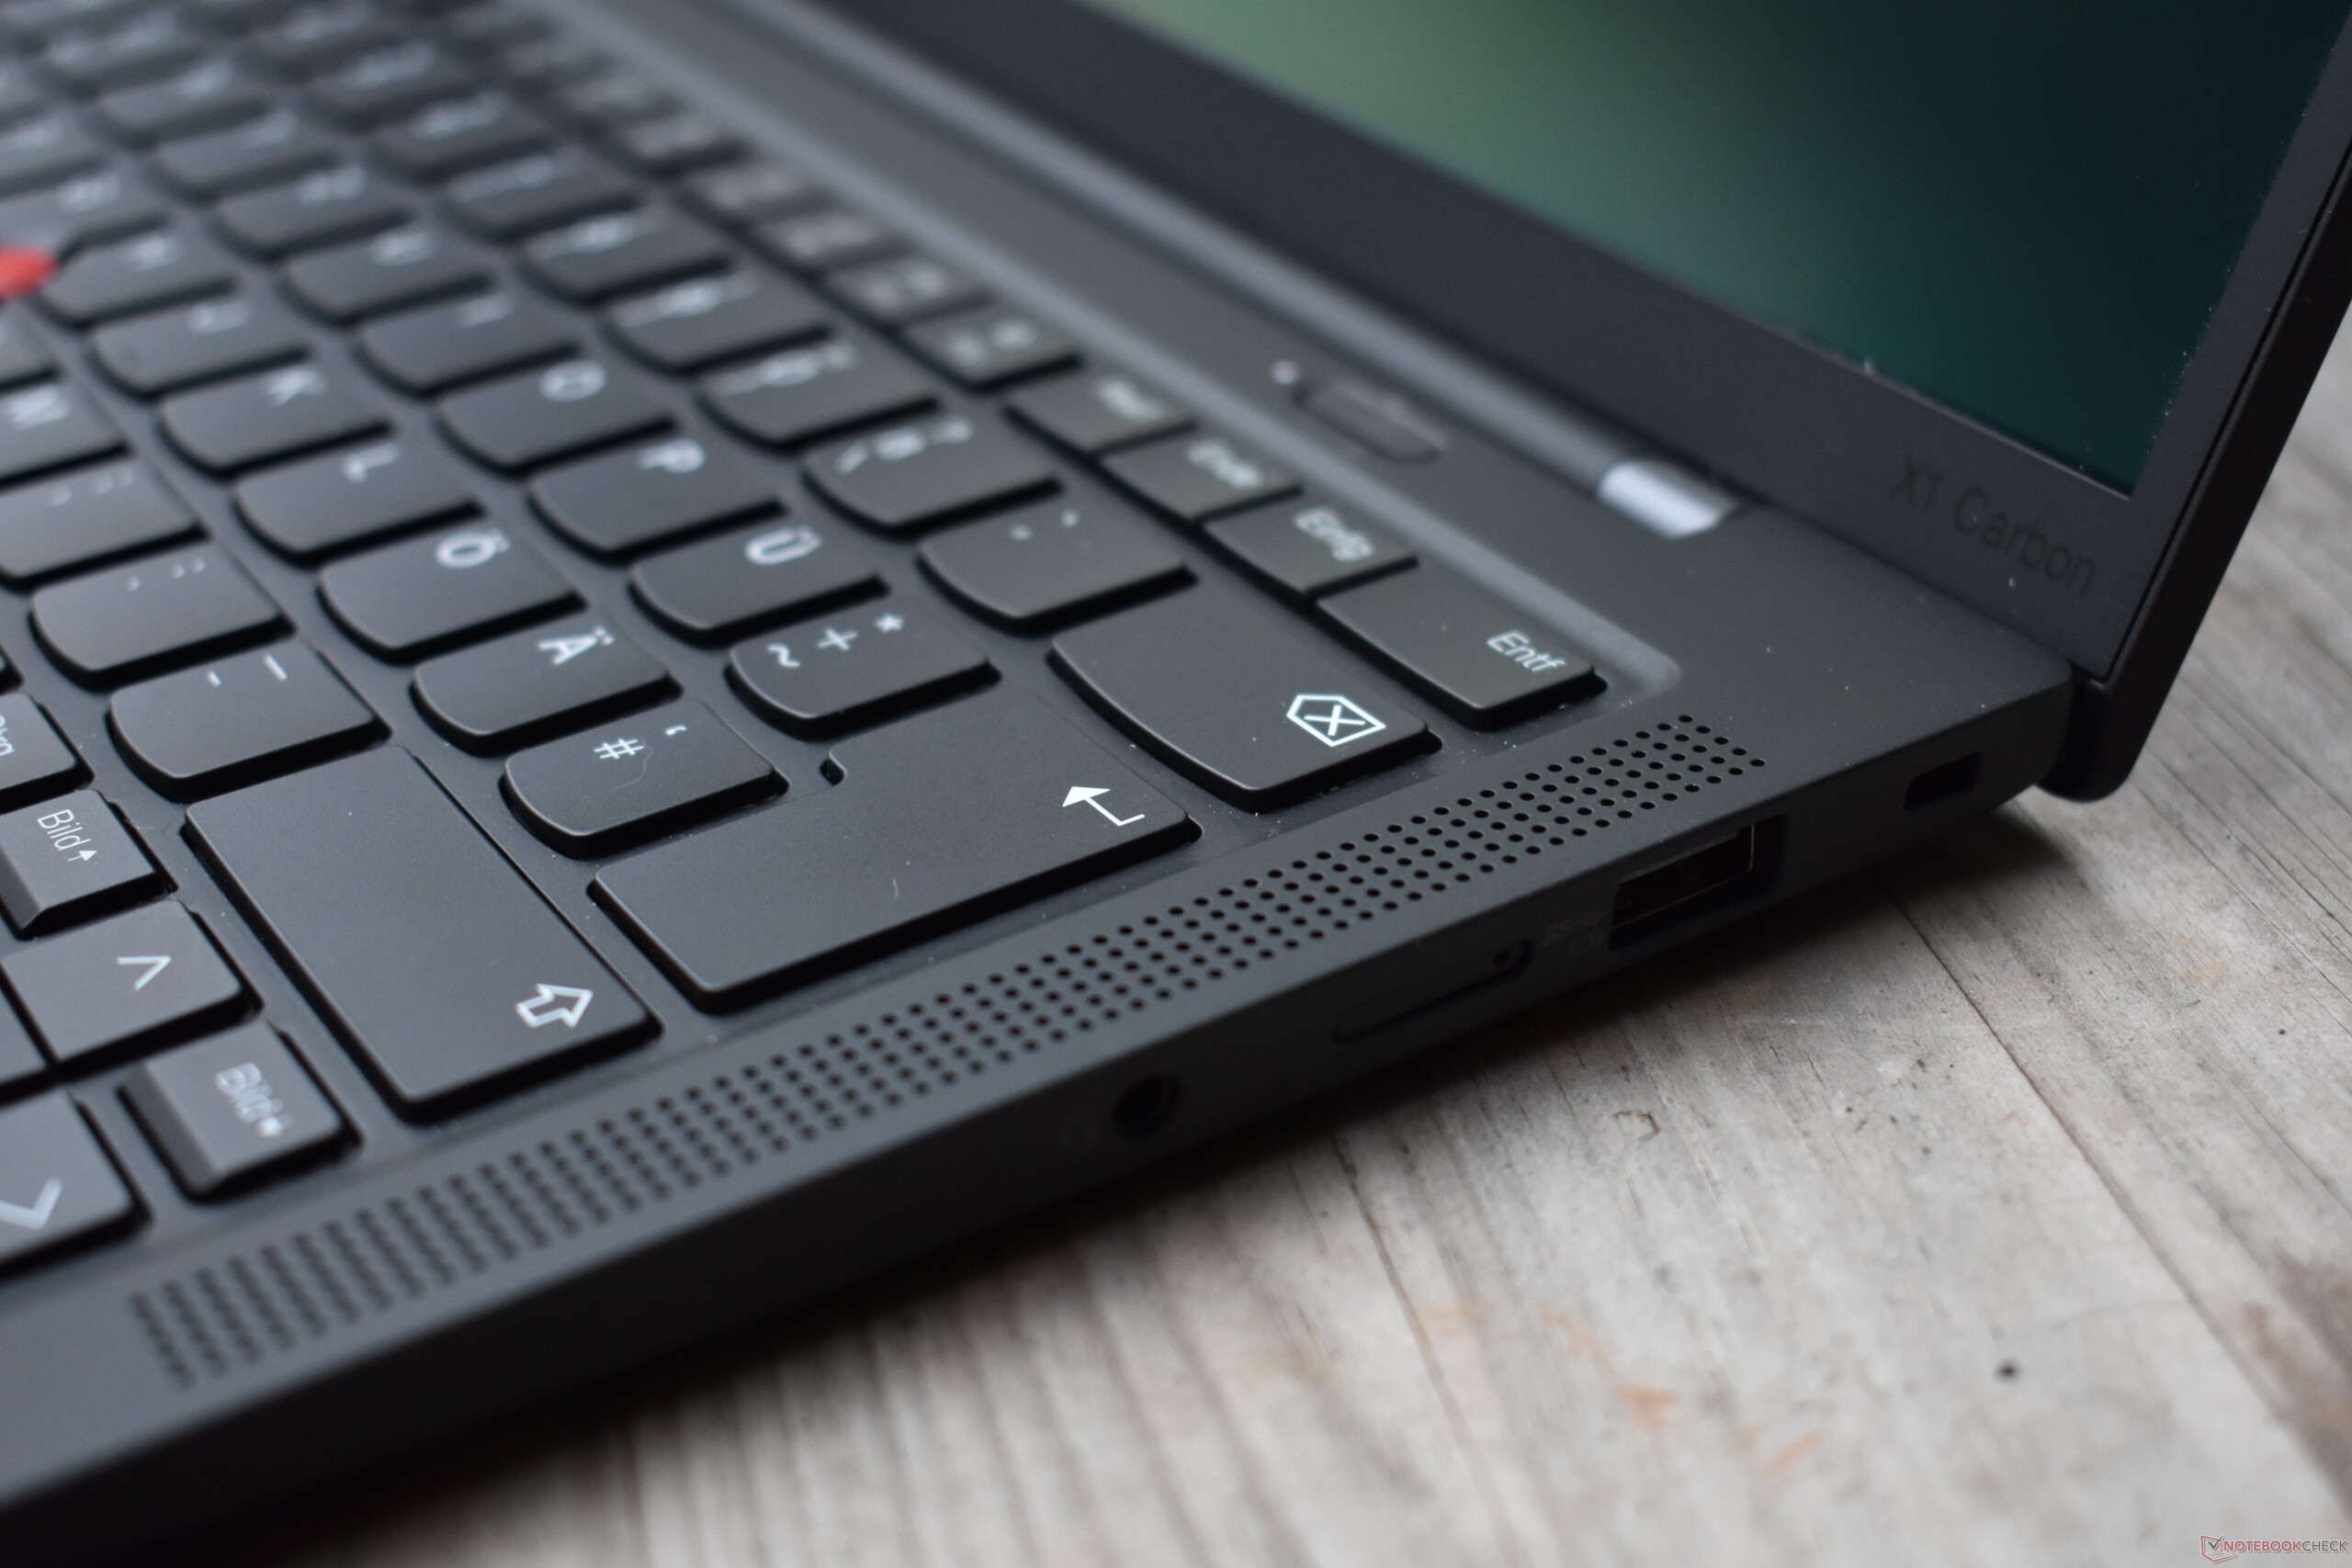
En comparación con los altavoces delDell Latitude 9430los cuatro altavoces del Lenovo ThinkPad X1 Carbon G10 son considerablemente más silenciosos, pero algo más equilibrados. La combinación de dos woofers en la parte inferior y dos tweeters en la superior es lo bastante potente como para llenar de sonido una habitación pequeña.
Lenovo ThinkPad X1 Carbon G10 21CB00DCGE análisis de audio
(±) | la sonoridad del altavoz es media pero buena (75.2 dB)
Graves 100 - 315 Hz
(±) | lubina reducida - en promedio 12.8% inferior a la mediana
(±) | la linealidad de los graves es media (14.9% delta a frecuencia anterior)
Medios 400 - 2000 Hz
(+) | medios equilibrados - a sólo 2.5% de la mediana
(+) | los medios son lineales (4.8% delta a la frecuencia anterior)
Altos 2 - 16 kHz
(+) | máximos equilibrados - a sólo 1.1% de la mediana
(+) | los máximos son lineales (2.8% delta a la frecuencia anterior)
Total 100 - 16.000 Hz
(+) | el sonido global es lineal (12.2% de diferencia con la mediana)
En comparación con la misma clase
» 5% de todos los dispositivos probados de esta clase eran mejores, 2% similares, 94% peores
» El mejor tuvo un delta de 7%, la media fue 21%, el peor fue ###max##%
En comparación con todos los dispositivos probados
» 10% de todos los dispositivos probados eran mejores, 2% similares, 88% peores
» El mejor tuvo un delta de 4%, la media fue 24%, el peor fue ###max##%
Dell Latitude 9430 2-in-1 análisis de audio
(+) | los altavoces pueden reproducir a un volumen relativamente alto (#94.3 dB)
Graves 100 - 315 Hz
(±) | lubina reducida - en promedio 12.3% inferior a la mediana
(+) | el bajo es lineal (5.3% delta a la frecuencia anterior)
Medios 400 - 2000 Hz
(+) | medios equilibrados - a sólo 2% de la mediana
(+) | los medios son lineales (4.7% delta a la frecuencia anterior)
Altos 2 - 16 kHz
(±) | máximos más altos - de media 5.4% más altos que la mediana
(+) | los máximos son lineales (3% delta a la frecuencia anterior)
Total 100 - 16.000 Hz
(+) | el sonido global es lineal (11.6% de diferencia con la mediana)
En comparación con la misma clase
» 10% de todos los dispositivos probados de esta clase eran mejores, 4% similares, 87% peores
» El mejor tuvo un delta de 6%, la media fue 20%, el peor fue ###max##%
En comparación con todos los dispositivos probados
» 8% de todos los dispositivos probados eran mejores, 2% similares, 90% peores
» El mejor tuvo un delta de 4%, la media fue 24%, el peor fue ###max##%
Gestión de la energía: OLED acorta la duración de la batería del X1 Carbon G10
Consumo de energía
El efecto de la pantalla OLED de mayor resolución sobre el consumo es claramente un aspecto negativo. El consumo mínimo en inactivo es más del doble que el del primer modelo del ThinkPad X1 Carbon G10, equipado con un panel IPS WUXGA. Al menos el X1 Carbon está casi a la par con el ThinkPad Z13, que también tiene una pantalla OLED.
La fuente de alimentación tiene un tamaño más que adecuado para el consumo máximo de 62.5 vatios, que además sólo representa el pico de carga.
| Off / Standby | |
| Ocioso | |
| Carga |
|
Clave:
min: | |
| Lenovo ThinkPad X1 Carbon G10 21CB00DCGE i7-1260P, Iris Xe G7 96EUs, Samsung PM9A1 MZVL2512HCJQ, OLED, 2880x1800, 14" | Lenovo ThinkPad X1 Carbon G10 21CC001RGE i5-1250P, Iris Xe G7 80EUs, Samsung PM9A1 MZVL2512HCJQ, IPS LED, 1920x1200, 14" | Lenovo ThinkPad X1 Carbon G9-20XWCTO1WW i7-1165G7, Iris Xe G7 96EUs, Samsung PM9A1 MZVL21T0HCLR, IPS LED, 3840x2400, 14" | Lenovo ThinkPad Z13 G1-21D20016GE R7 PRO 6860Z, Radeon 680M, Micron 2450 1TB MTFDKCD1T0TFK, OLED, 2880x1800, 13.3" | HP Elite Dragonfly G3 i7-1265U, Iris Xe G7 96EUs, Micron 3400 MTFDKBA512TFH 512GB, IPS, 1920x1280, 13.5" | Dell Latitude 9430 2-in-1 i7-1265U, Iris Xe G7 96EUs, , IPS, 2560x1600, 14" | Medio Intel Iris Xe Graphics G7 96EUs | Media de la clase Office | |
|---|---|---|---|---|---|---|---|---|
| Power Consumption | 28% | -10% | -3% | 16% | 19% | -5% | 10% | |
| Idle Minimum * (Watt) | 6.4 | 2.9 55% | 5 22% | 5.7 11% | 3.4 47% | 2.9 55% | 5.51 ? 14% | 4.4 ? 31% |
| Idle Average * (Watt) | 7.4 | 4.9 34% | 10.2 -38% | 7.6 -3% | 5.6 24% | 5.8 22% | 8.66 ? -17% | 7.32 ? 1% |
| Idle Maximum * (Watt) | 8.3 | 6 28% | 11 -33% | 8.4 -1% | 8.4 -1% | 6.6 20% | 10.9 ? -31% | 8.56 ? -3% |
| Load Average * (Watt) | 56.5 | 29.3 48% | 51.7 8% | 54.4 4% | 40.8 28% | 49.2 13% | 45.6 ? 19% | 42.5 ? 25% |
| Witcher 3 ultra * (Watt) | 37.5 | 36.6 2% | 48.1 -28% | 35.5 5% | 35.3 6% | |||
| Load Maximum * (Watt) | 62.5 | 63.3 -1% | 67.5 -8% | 62.7 -0% | 68.4 -9% | 63.1 -1% | 67.8 ? -8% | 64.1 ? -3% |
* ... más pequeño es mejor
Power consumption Witcher 3 / Stress test
Power Consumption with an external monitor
Duración de la batería
La capacidad de la batería, de 57 vatios hora, se mantiene sin cambios. El mayor consumo de la pantalla OLED afecta significativamente a la duración de la batería: El Lenovo ThinkPad X1 Carbon G10 30th Anniversary Edition se queda sin batería tras sólo cinco horas en nuestro test Wi-Fi (150 cd/m² de brillo). Esto es muy débil. En comparación: El ThinkPad Z13, también con una pantalla OLED que consume mucha energía, logró más de siete horas en el mismo test.
Una forma de lograr mayor duración de batería en portátiles OLED es el modo oscuro. Nuestra prueba WiFi consiste principalmente en sitios web con fondos brillantes, lo que implica un mayor consumo de parte de los píxeles autoiluminados. Los navegadores web modernos pueden configurarse para que todos los sitios web se muestren en modo oscuro. Repetimos la prueba Wi-Fi bajo estas condiciones. En modo oscuro, el Lenovo ThinkPad X1 Carbon G10 OLED logra una autonomía de unas siete horas en el test Wi-Fi. Los compradores de este modelo y otros portátiles OLED deberían usar el modo oscuro siempre que sea posible.
Pro
Contra
Veredicto: La pantalla OLED de alta calidad reduce la duración de la batería
Incluso sin pantalla OLED, el Lenovo ThinkPad X1 Carbon Gen 10 es un portátil business muy bueno. Nuestro primer dispositivo de pruebas, con panel IPS, logró una valoración general del 90%. Con OLED, la calidad de la pantalla aumenta significativamente, pero hay que hacer concesiones en otros aspectos: La duración de la batería sufre considerablemente debido al mayor consumo, y el X1 Carbon G10 OLED apenas puede usarse durante largos periodos de tiempo sin el modo oscuro activado para todas las apps y webs. Una pena, ya que el panel OLED antirreflejos es realmente muy adecuado para el uso en exteriores.
Otro aspecto interesante de esta actualización del análisis fue el rendimiento de la CPU, que en nuestro primer análisis del X1 Carbon G10 con CPU i5. Afortunadamente, esto ha mejorado, y Lenovo ha resuelto el problema con actualizaciones de firmware. Sin embargo, el ventilador hace un poco más de ruido bajo carga que antes.
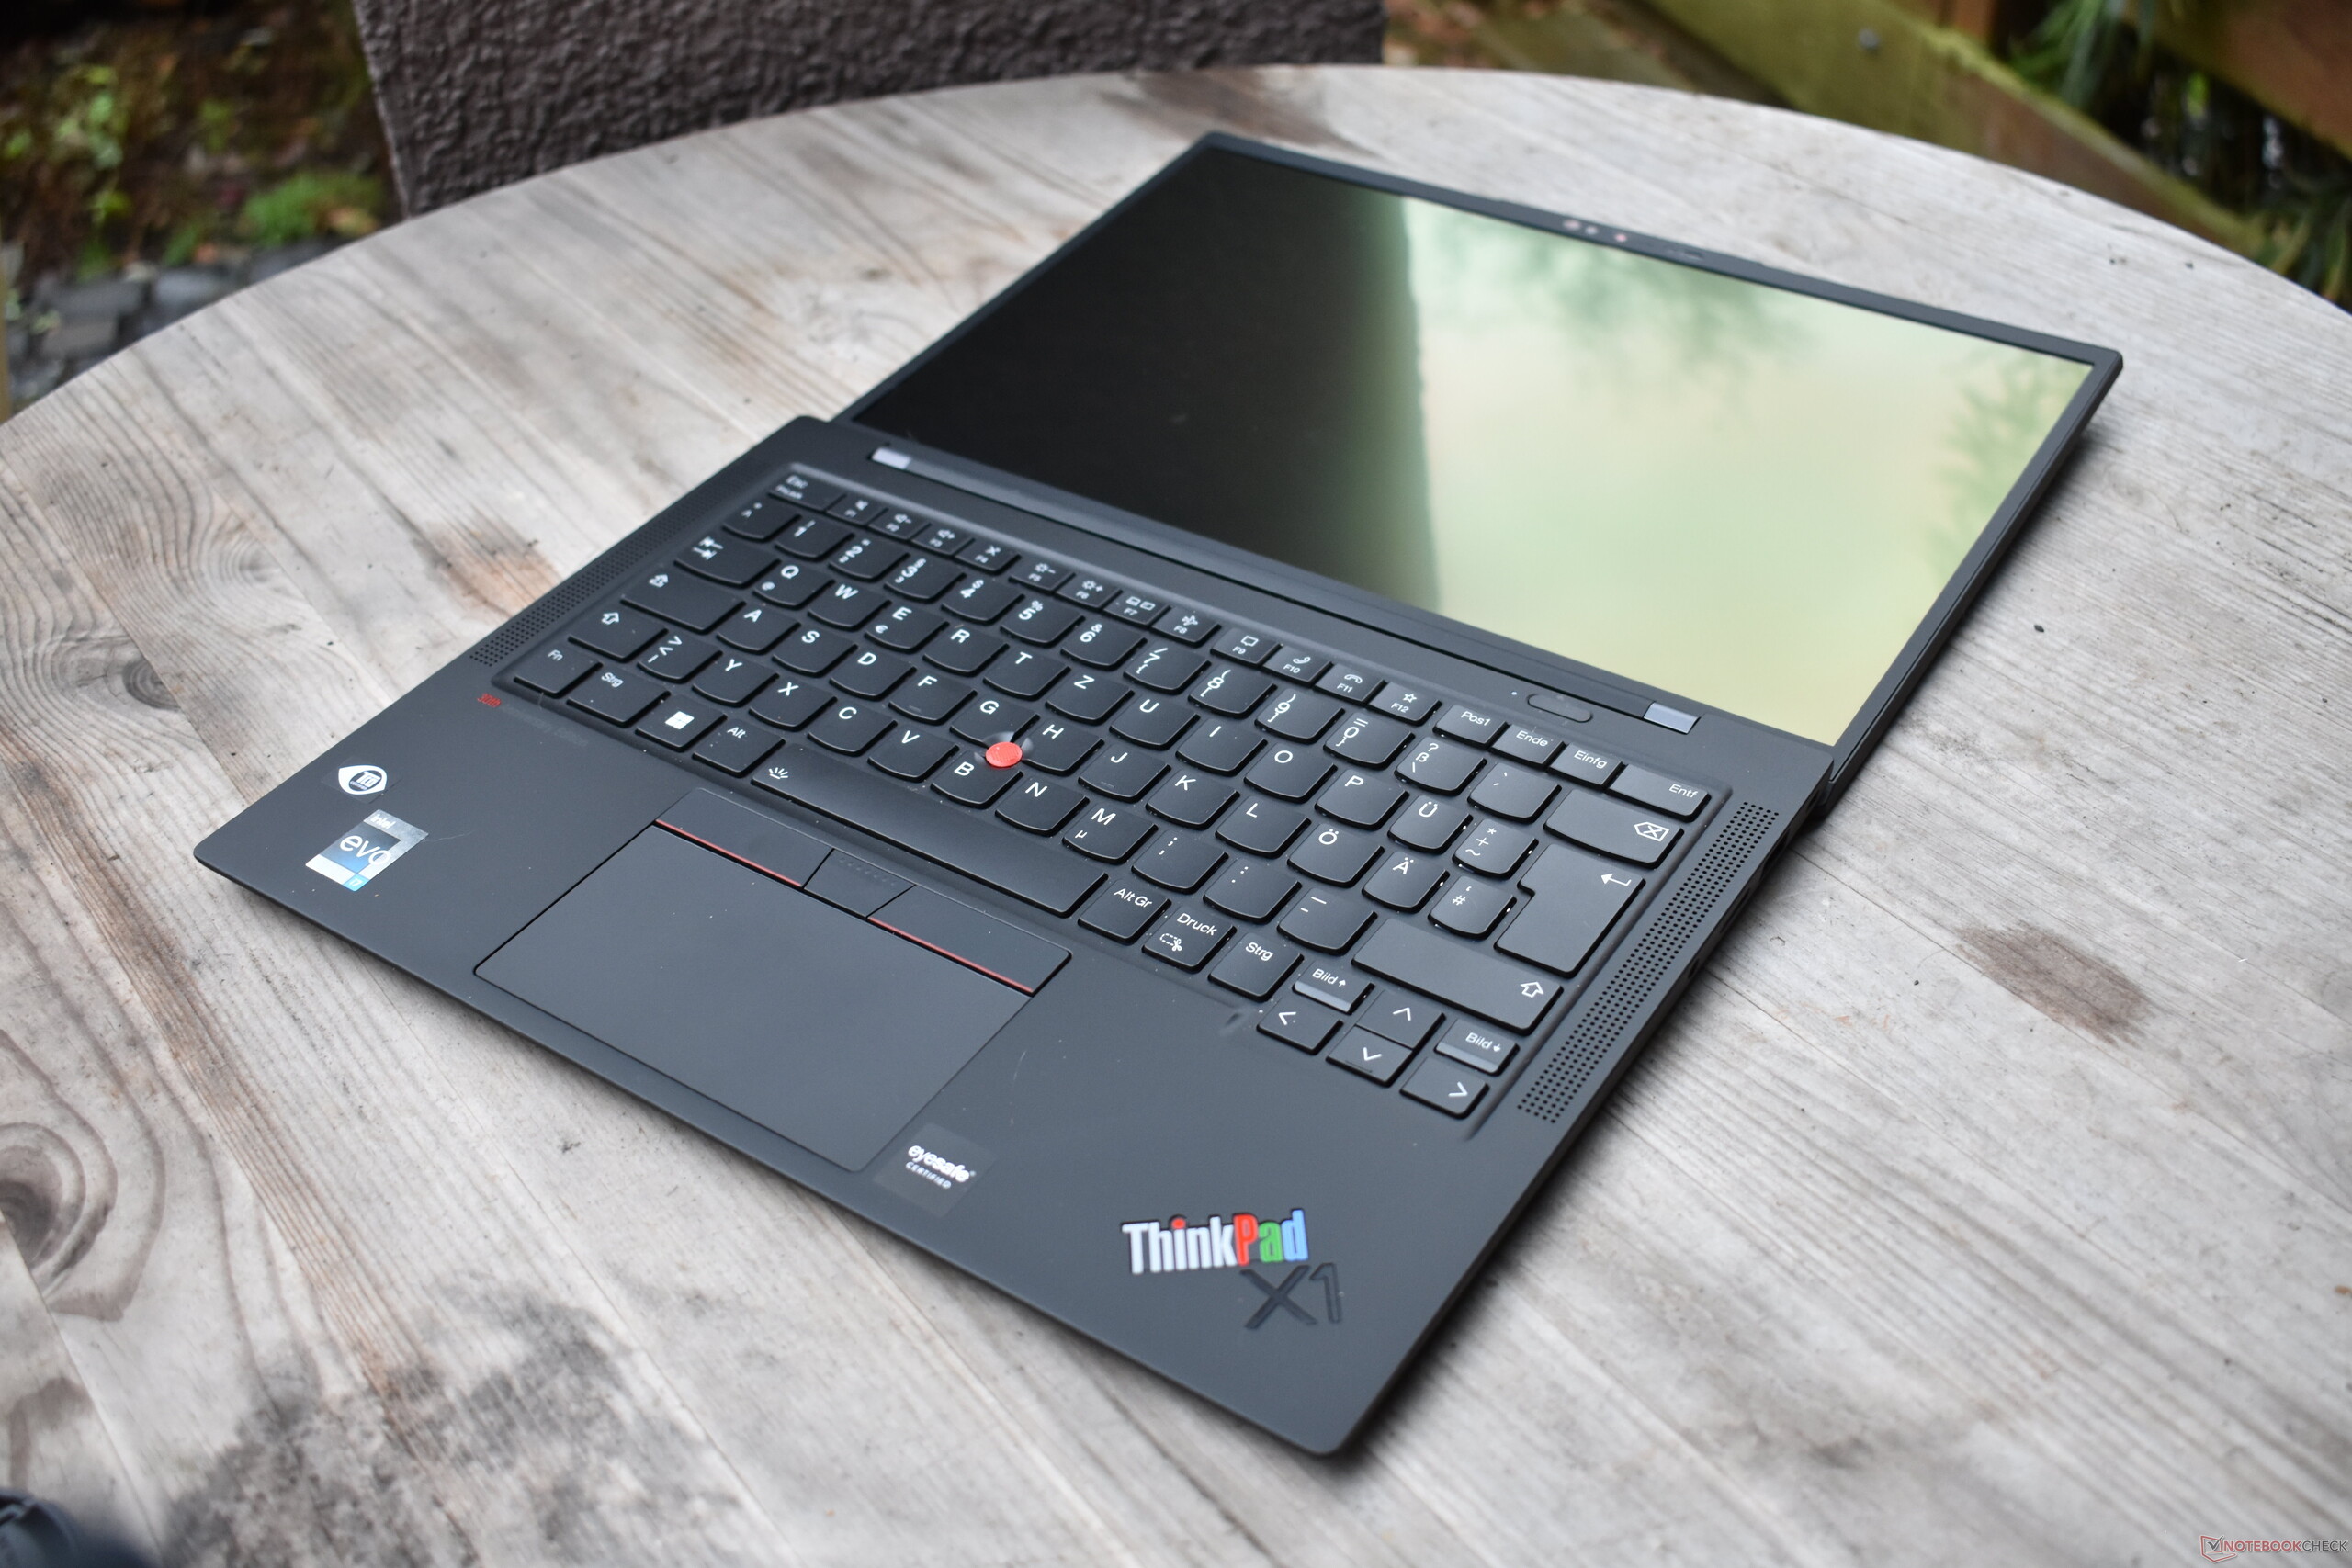
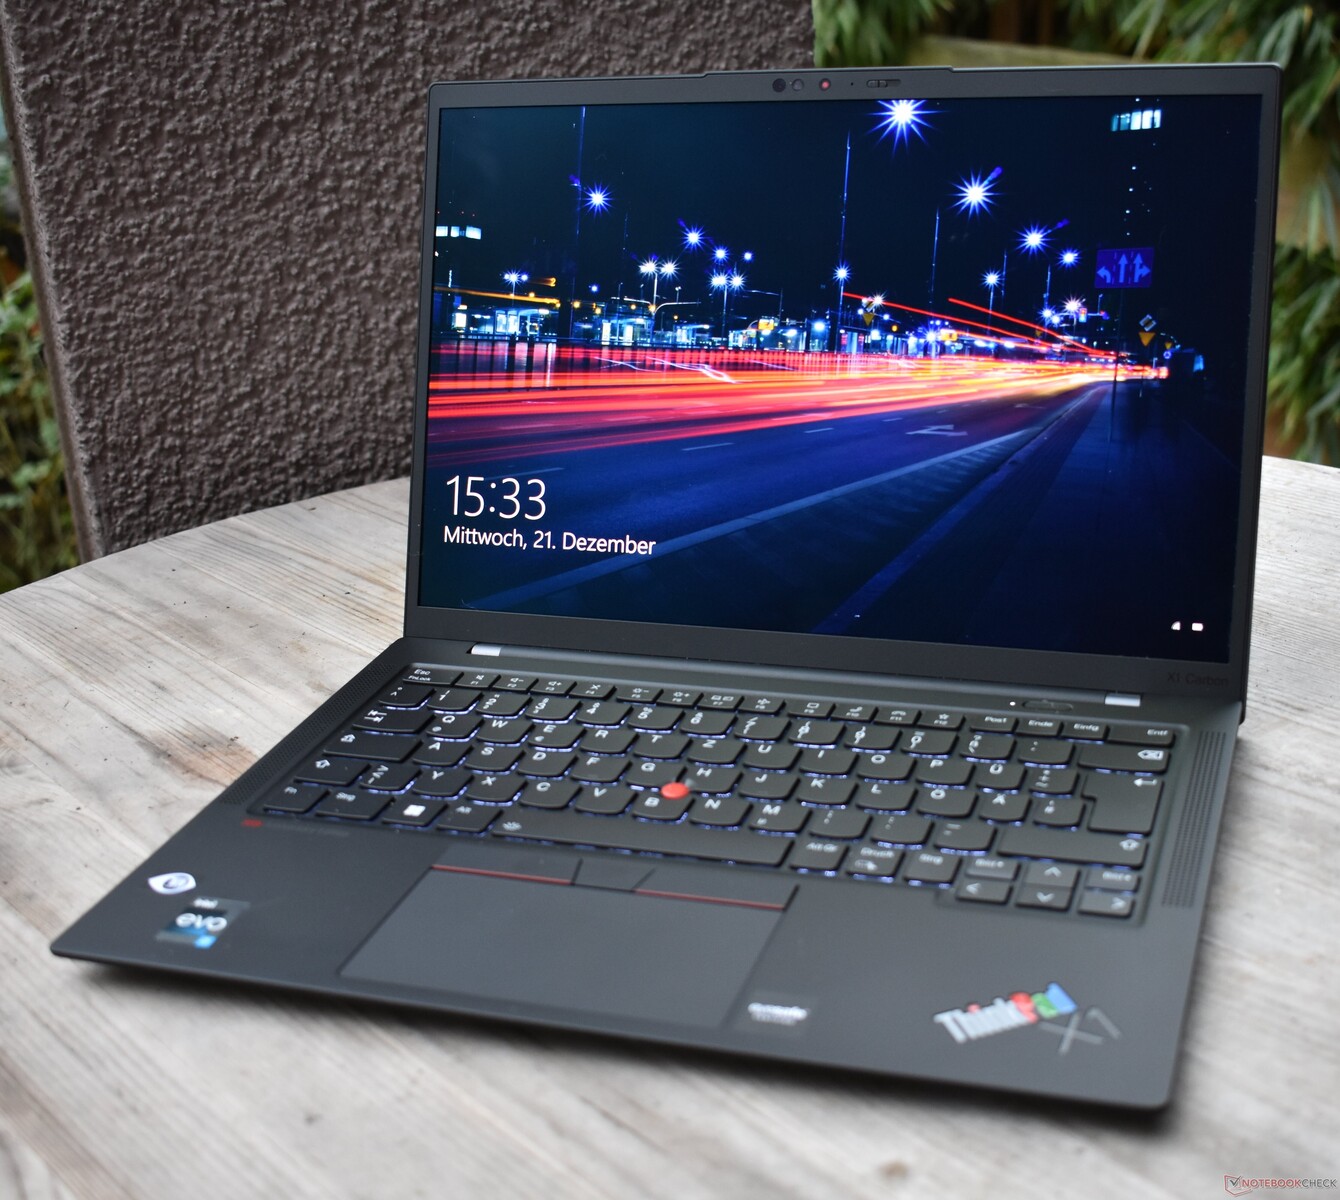
Poco espíritu de aniversario, pero una muy buena pantalla OLED: El Lenovo ThinkPad X1 Carbon Gen 10 Edición 30º Aniversario
Apenas se nota que es una edición aniversario en el uso diario, aparte del colorido logo como recordatorio. Lenovo desperdició la oportunidad de crear algo único aquí, lo que significa que la pantalla OLED es el foco principal en este modelo. En realidad sigue siendo una característica bastante rara entre los portátiles de empresa, y la alta calidad de imagen es un muy buen argumento para el X1 Carbon Gen 10 30th Anniversary Edition. Puede que no sea tan práctico como otros modelos de negocios debido a la menor duración de la batería, pero usar el monitor OLED es un placer.
Si los puertos y el diseño más clásico de ThinkPad no son tan importantes, el Lenovo ThinkPad Z13 OLED puede ser una buena alternativa. Es incluso más potente y tiene una batería de mayor duración. La competencia empresarial del resto de fabricantes no ofrece OLED, pero el HP Elite Dragonfly G3 tiene una muy buena pantalla LCD IPS en formato 3:2, que puede ser interesante para algunos lectores. El Dell Latitude 9430 2 en 1 es bastante más pesado, pero a cambio tiene una pantalla más brillante. Tanto el portátil Dell como el HP también tienen una duración de batería mucho mejor.
Precio y disponibilidad
Dependiendo de su ubicación, el Lenovo ThinkPad X1 Carbon Gen 10 30th Anniversary Edition está disponible a través del sitio web oficial de Lenovo como portátil de libre configuración. Los precios en USA empiezan en 1.397,40 dólares. Los precios de partida en el Reino Unido y Singapur son de 2.310,00 libras esterlinas y 2.303,74 dólares de Singapur, respectivamente (esta lista no es exhaustiva).
Los precios son a fecha de 22.12.2022 y están sujetos a cambios.
Lenovo ThinkPad X1 Carbon G10 21CB00DCGE
- 12/21/2022 v7 (old)
Benjamin Herzig
Price comparison

