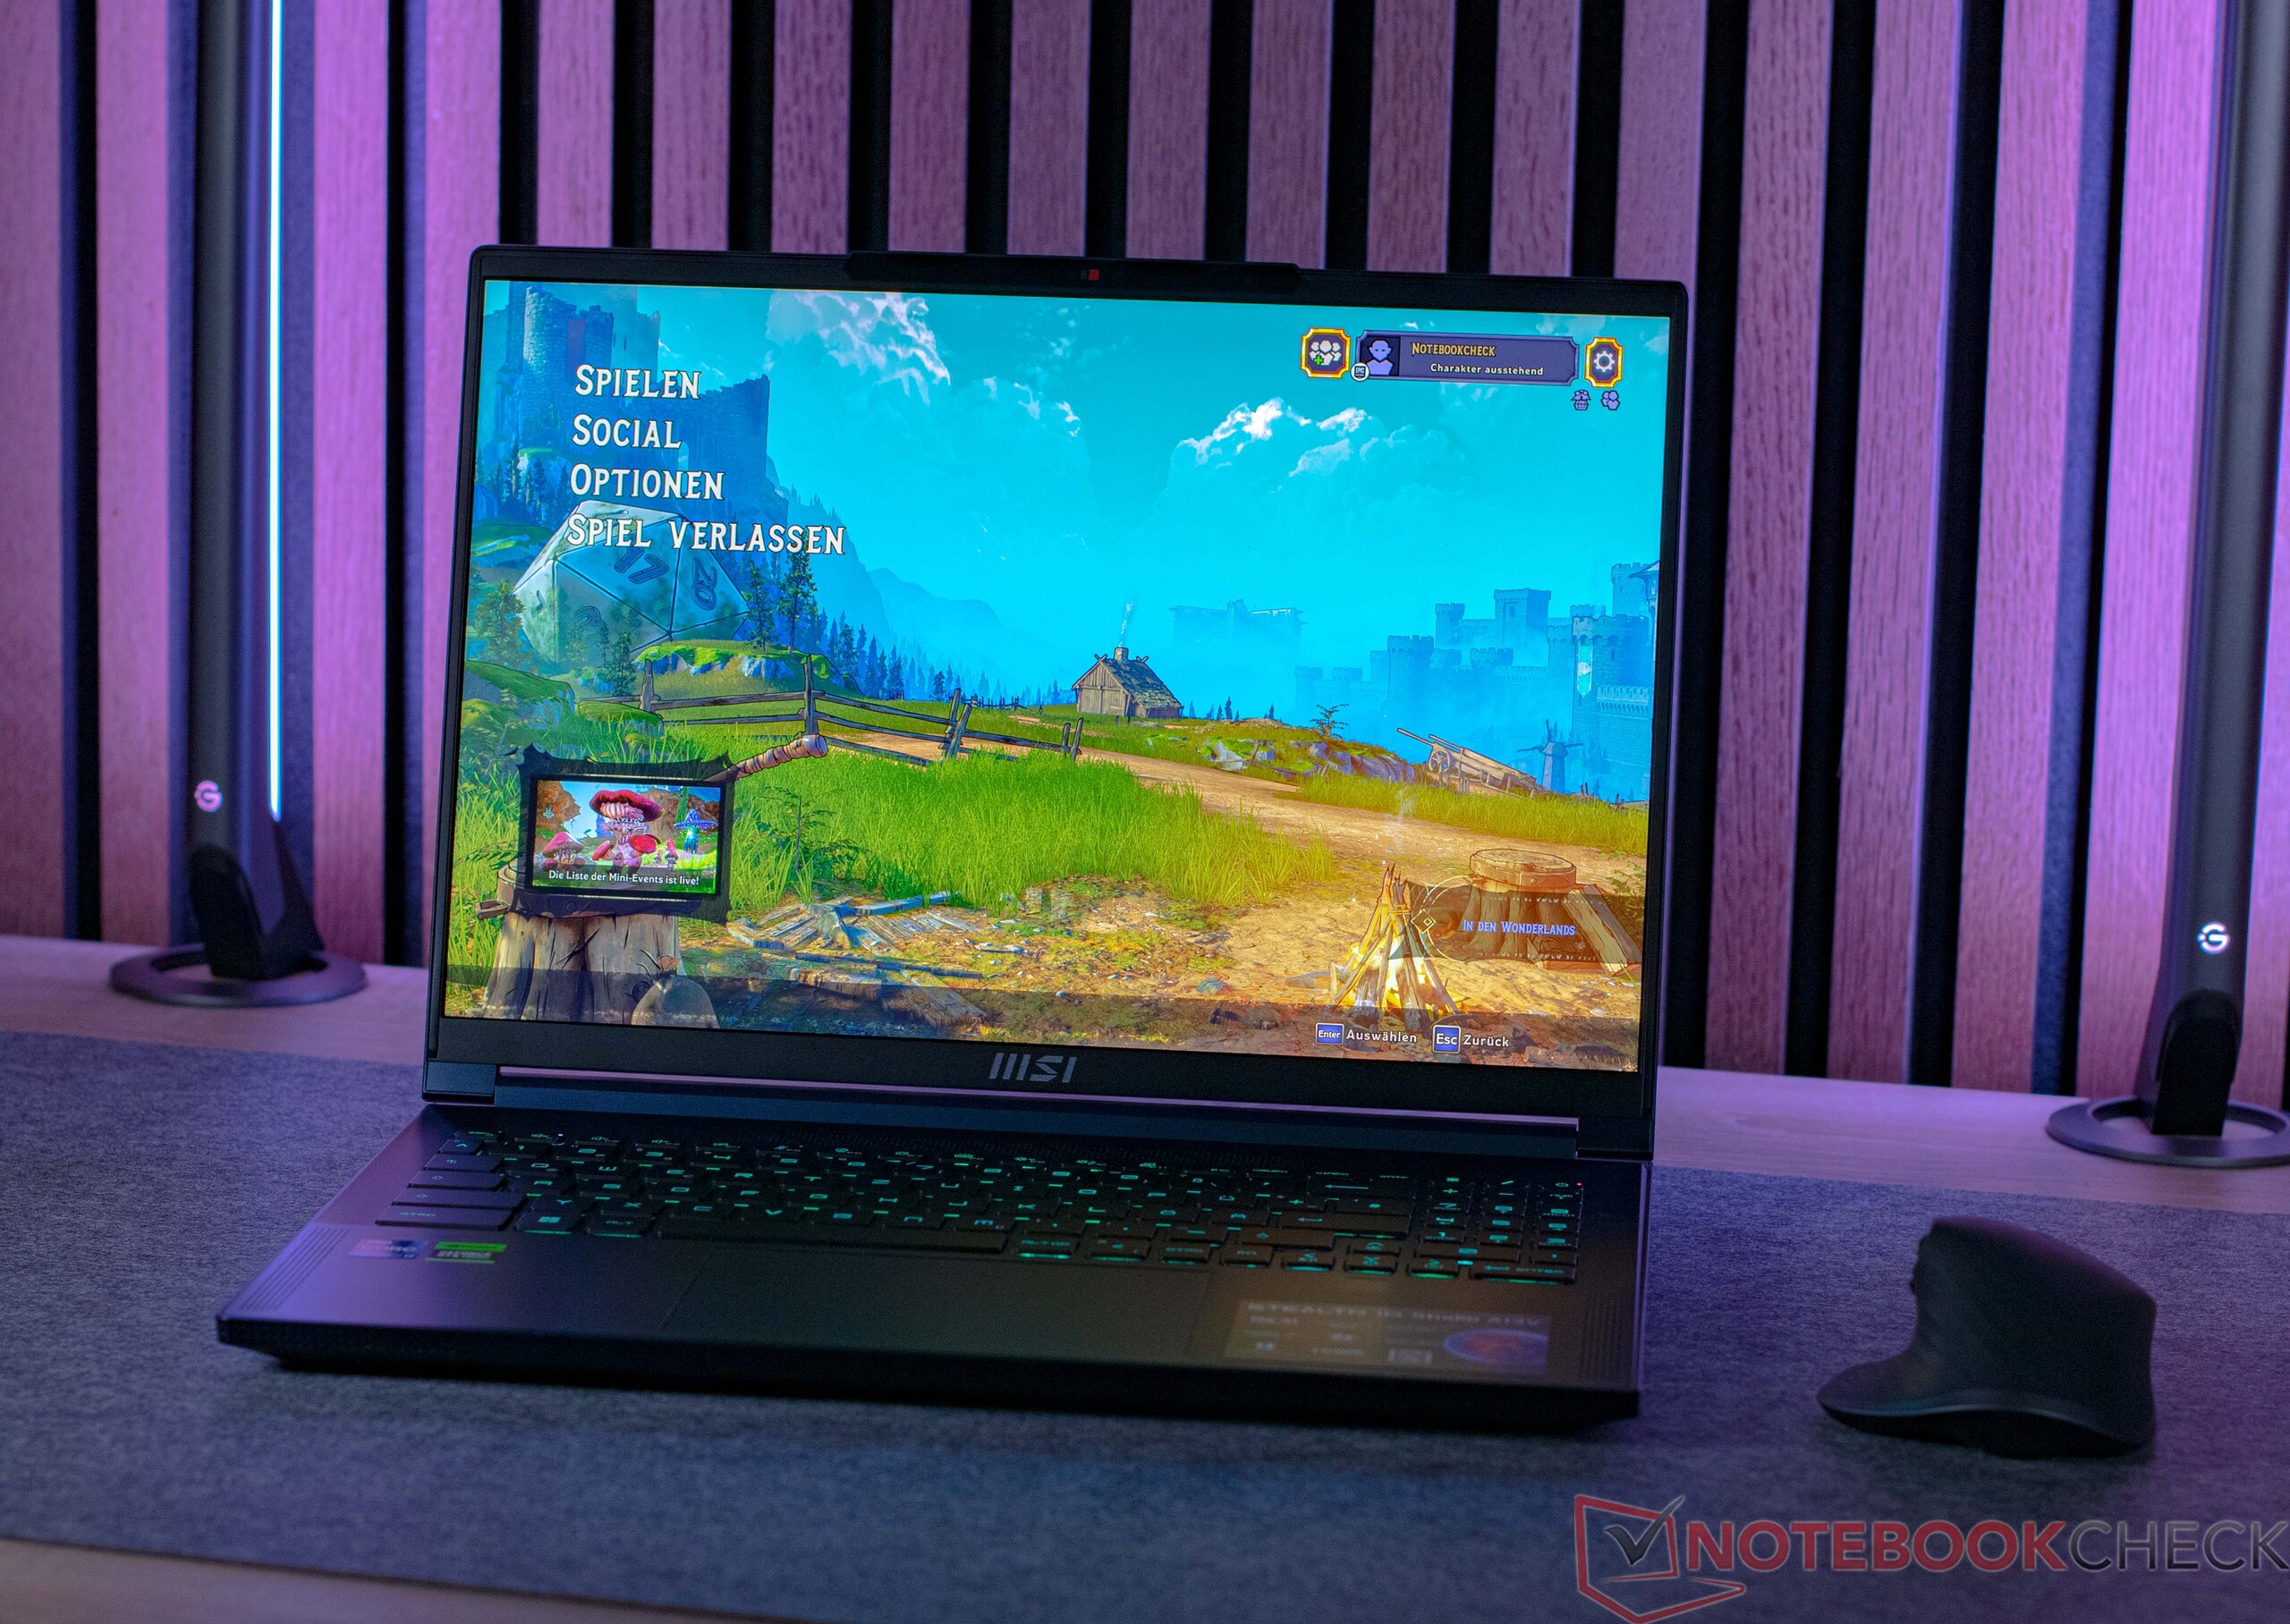
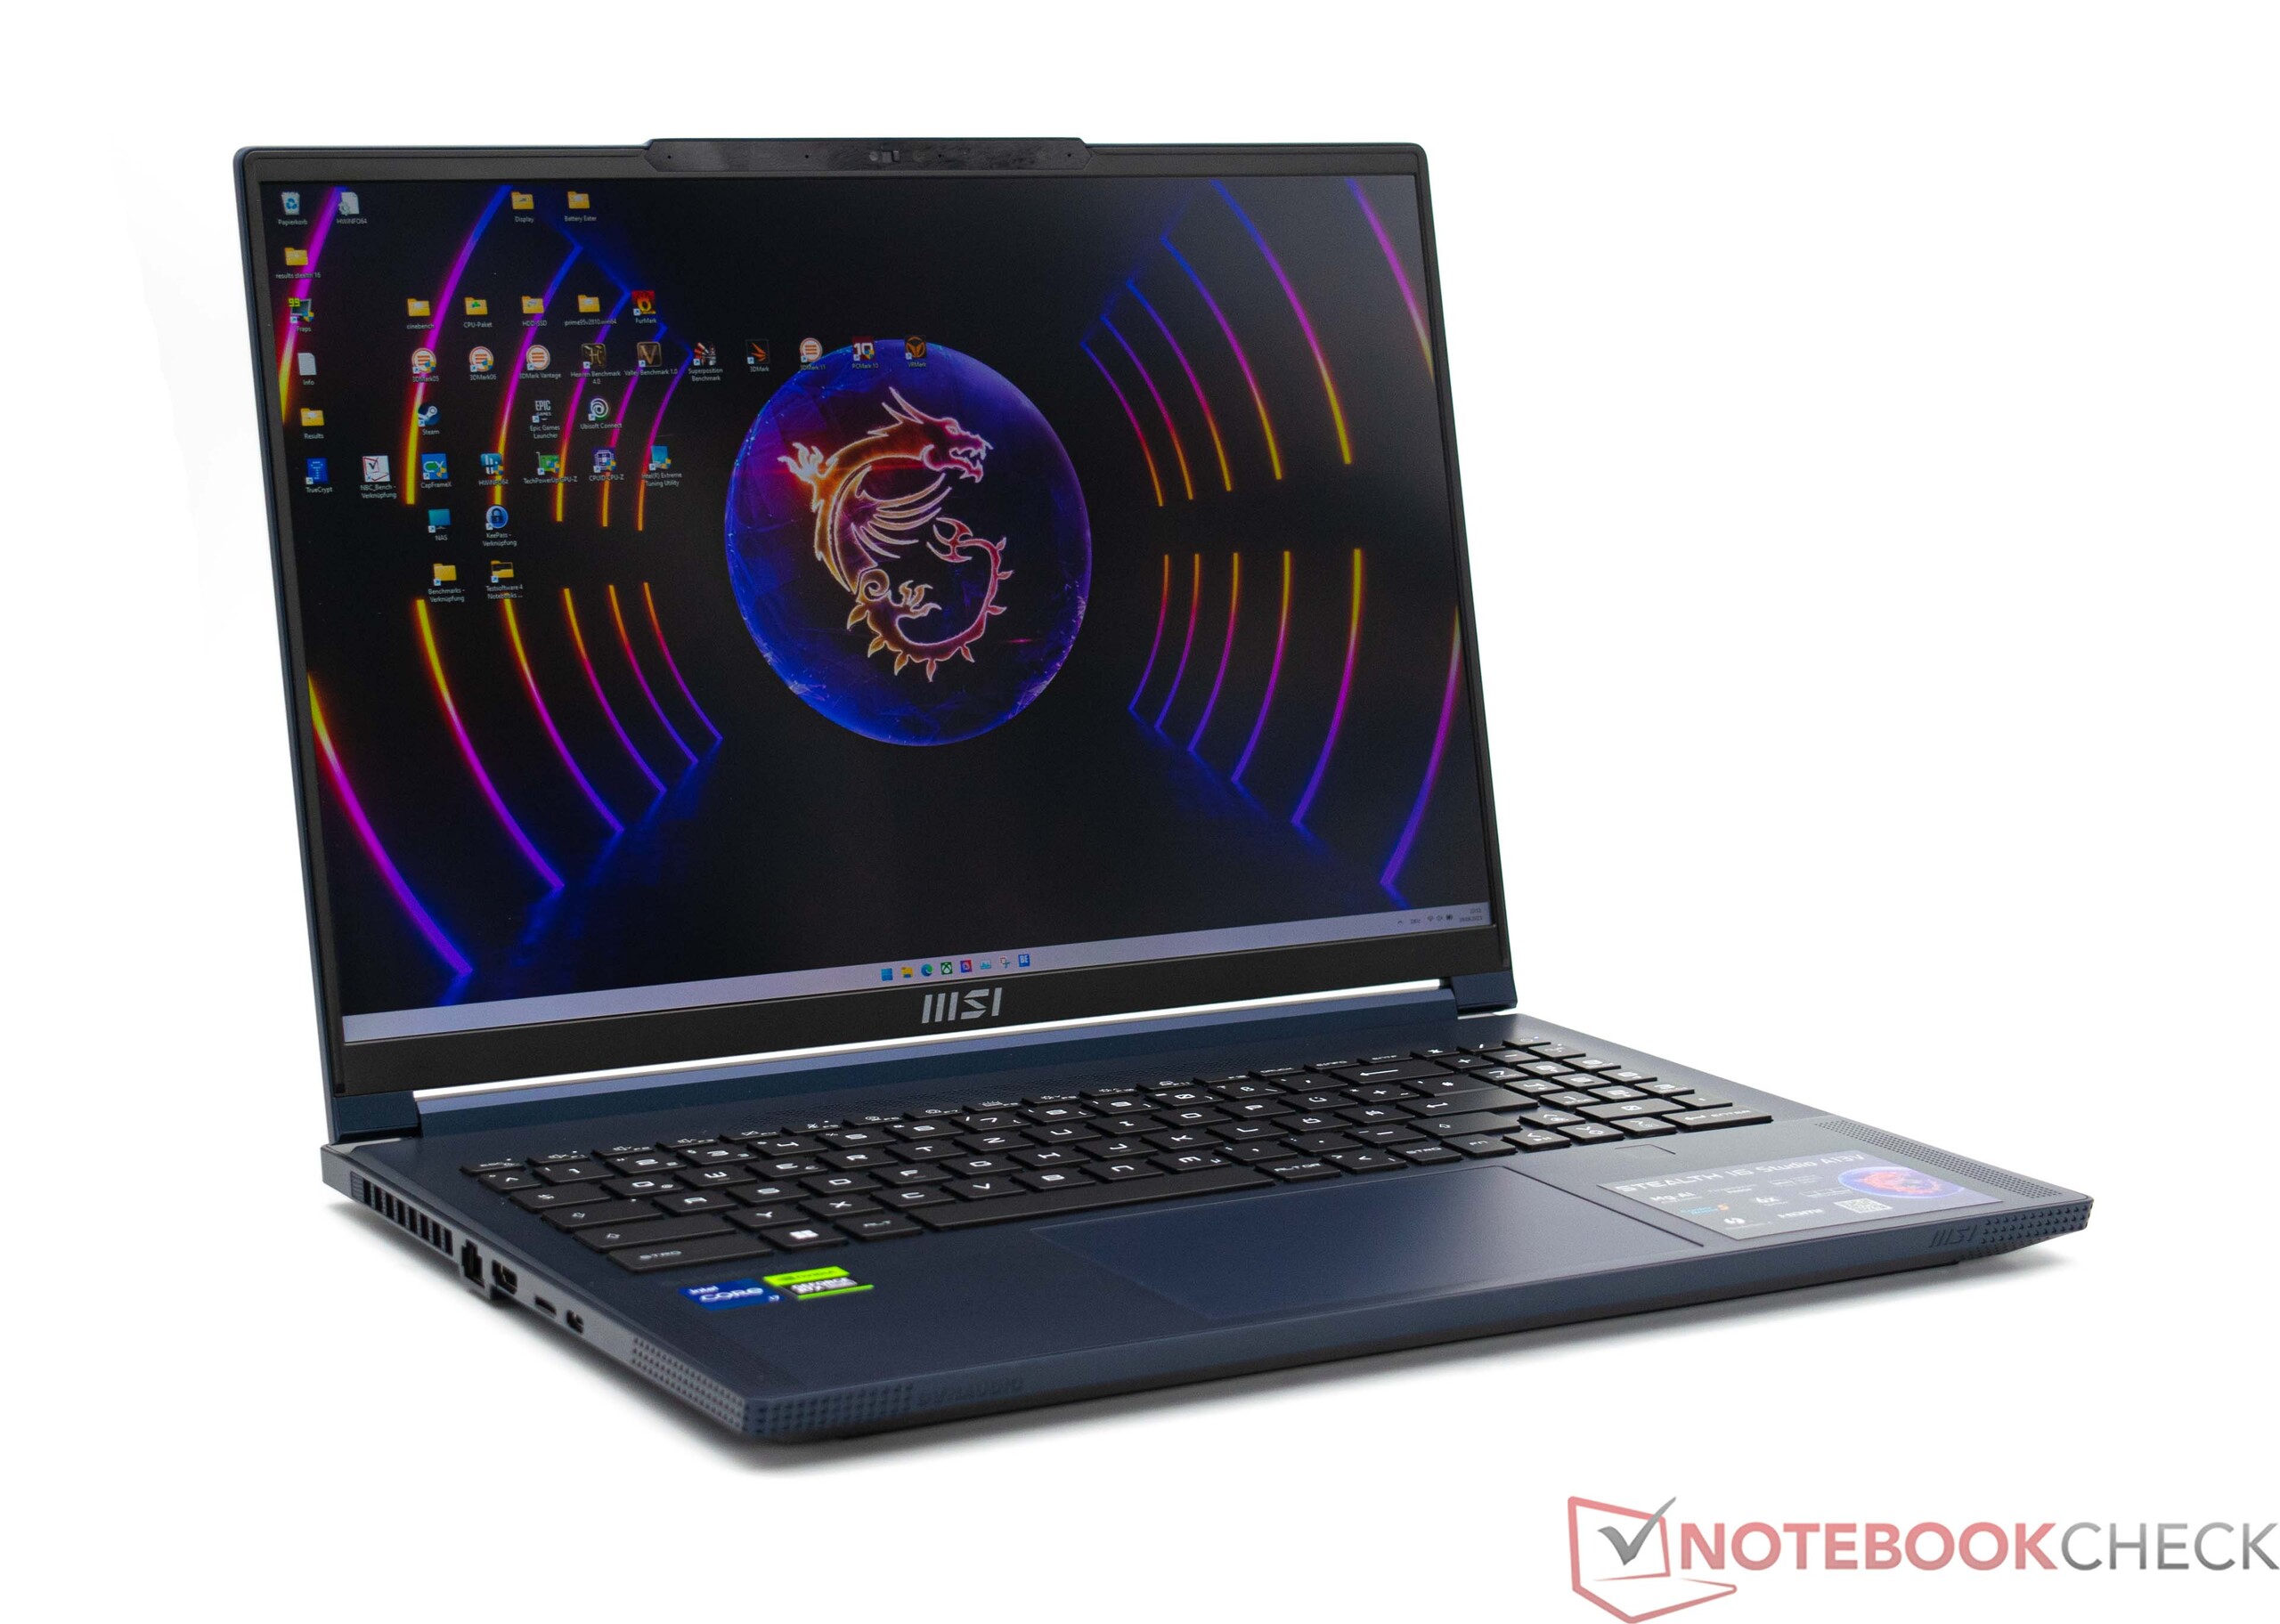
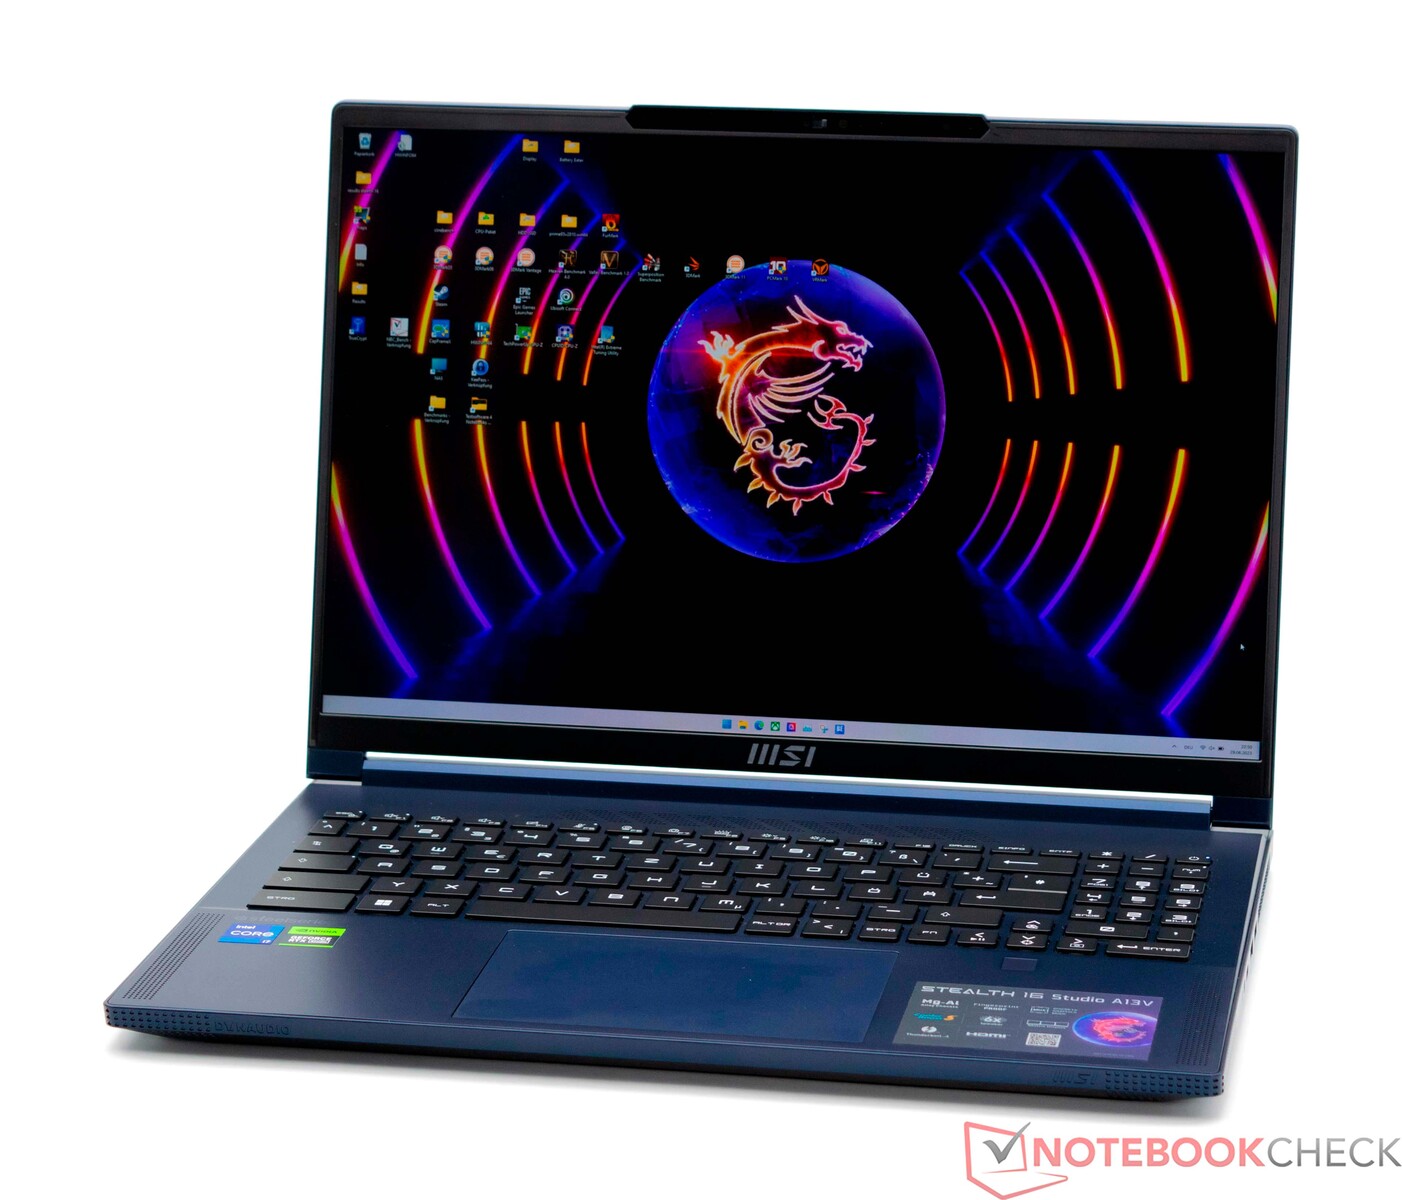
Análisis del portátil MSI Stealth 16 Studio: Un dispositivo extremadamente ligero, de 16 pulgadas, Core i7 y RTX 4070 para jugadores y creadores
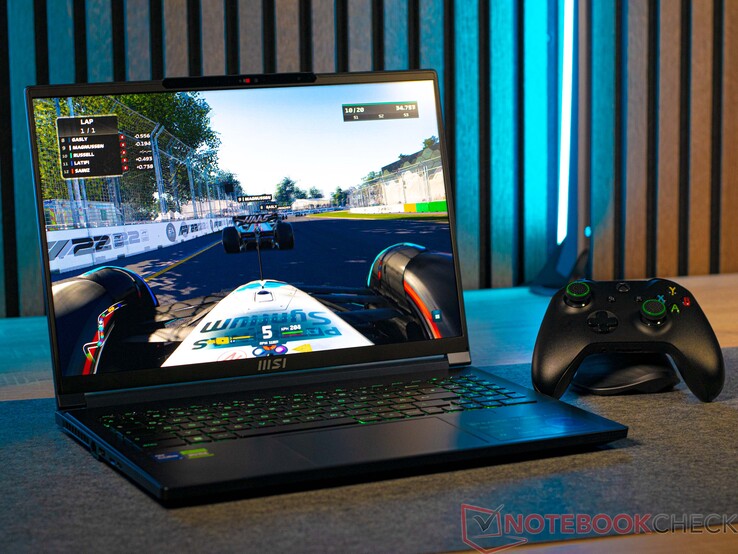
El nuevo MSI Stealth 16 Studio A13VG está basado en un Procesador Intel Raptor Lake H y una GPU móvil Nvidia actual. En cuanto a los detalles, nuestro dispositivo de análisis tiene unIntel Core i7-13700Hemparejado con unaGPU Nvidia GeForce RTX 4070 para portátiles. Sin embargo, visualmente hablando, el MSI Stealth 16 Studio A13VG es muy discreto y se las arregla para pisar la línea entre un potente portátil de negocios y un portátil de juegos. Básicamente, también vemos este dispositivo como una excelente base para los creadores que podrían verse aprovechando los puntos fuertes del MSI Stealth 16 Studio A13VG debido a sus potentes componentes y buena portabilidad.
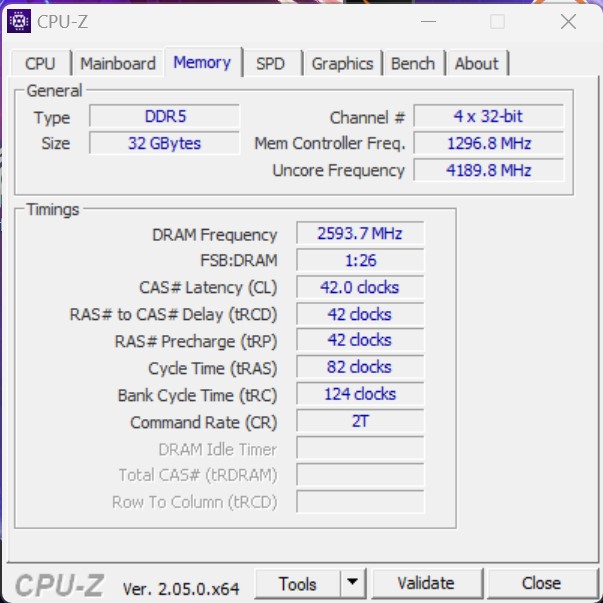
Sin embargo, en cuanto al precio, el MSI Stealth 16 Studio A13VG se encuentra en el segmento de gama alta. Pero, además de los componentes ya mencionados, cuenta con 32 GB de RAM DDR5 y un SSD con 2 TB de almacenamiento. Tampoco hay que olvidar la pantalla QHD+ de 16 pulgadas. Con su tasa de refresco de 240 Hz, está orientada directamente a la comunidad de jugadores.
En este análisis, el MSI Stealth 16 Studio A13VG tendrá que demostrar su valía frente a los actuales portátiles de 16 pulgadas. Consulta la siguiente tabla para más detalles.
Posibles contendientes en la comparación
Valoración | Fecha | Modelo | Peso | Altura | Tamaño | Resolución | Precio |
|---|---|---|---|---|---|---|---|
| 88.8 % v7 (old) | 07/2023 | MSI Stealth 16 Studio A13VG i7-13700H, GeForce RTX 4070 Laptop GPU | 2 kg | 19.95 mm | 16.00" | 2560x1600 | |
| 89.7 % v7 (old) | 06/2023 | Asus ROG Flow X16 GV601V i9-13900H, GeForce RTX 4060 Laptop GPU | 2.1 kg | 19.4 mm | 16.00" | 2560x1600 | |
| 89 % v7 (old) | 04/2023 | Medion Erazer Major X20 i9-13900HX, GeForce RTX 4070 Laptop GPU | 2.4 kg | 29 mm | 16.00" | 2560x1600 | |
| 88.1 % v7 (old) | 06/2023 | Acer Nitro 16 AN16-41 R7 7735HS, GeForce RTX 4070 Laptop GPU | 2.7 kg | 27.9 mm | 16.00" | 2560x1600 | |
| 86.6 % v7 (old) | 12/2022 | Corsair Voyager a1600 R9 6900HS, Radeon RX 6800M | 2.4 kg | 19.9 mm | 16.00" | 2560x1600 | |
| 86.2 % v7 (old) | 03/2023 | Gigabyte AERO 16 OLED BSF i9-13900H, GeForce RTX 4070 Laptop GPU | 2.1 kg | 18 mm | 16.00" | 3840x2400 |
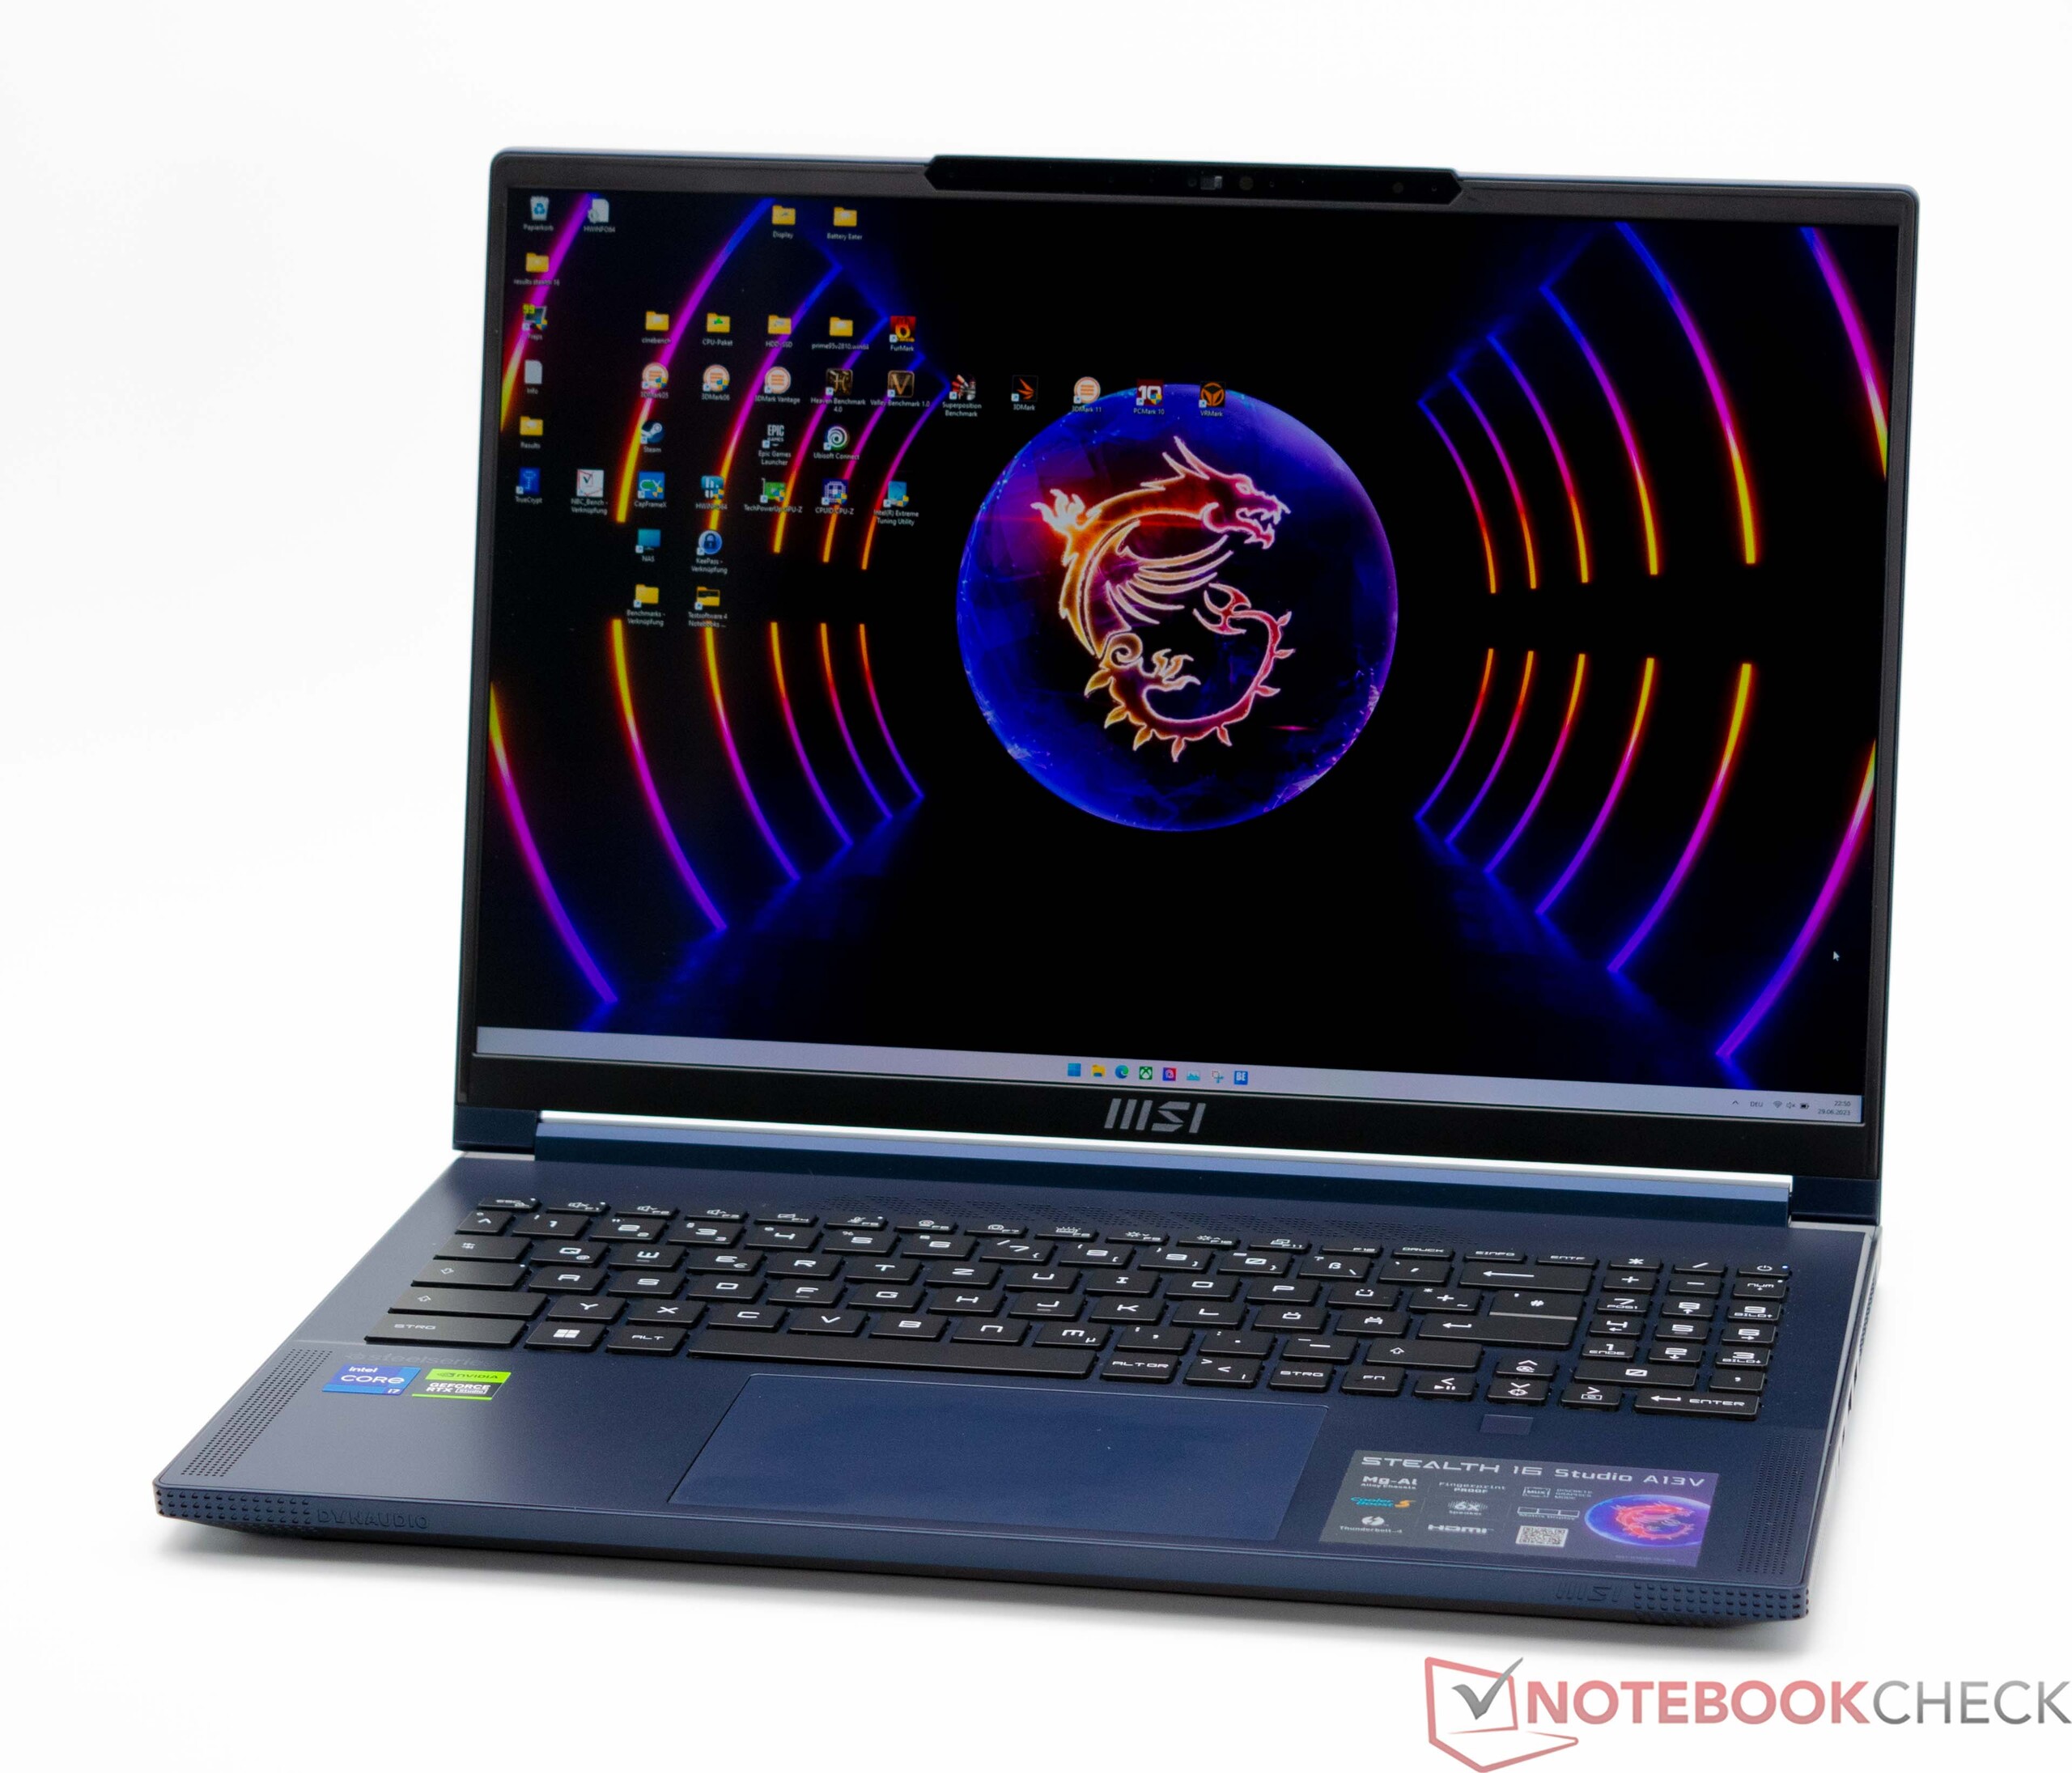
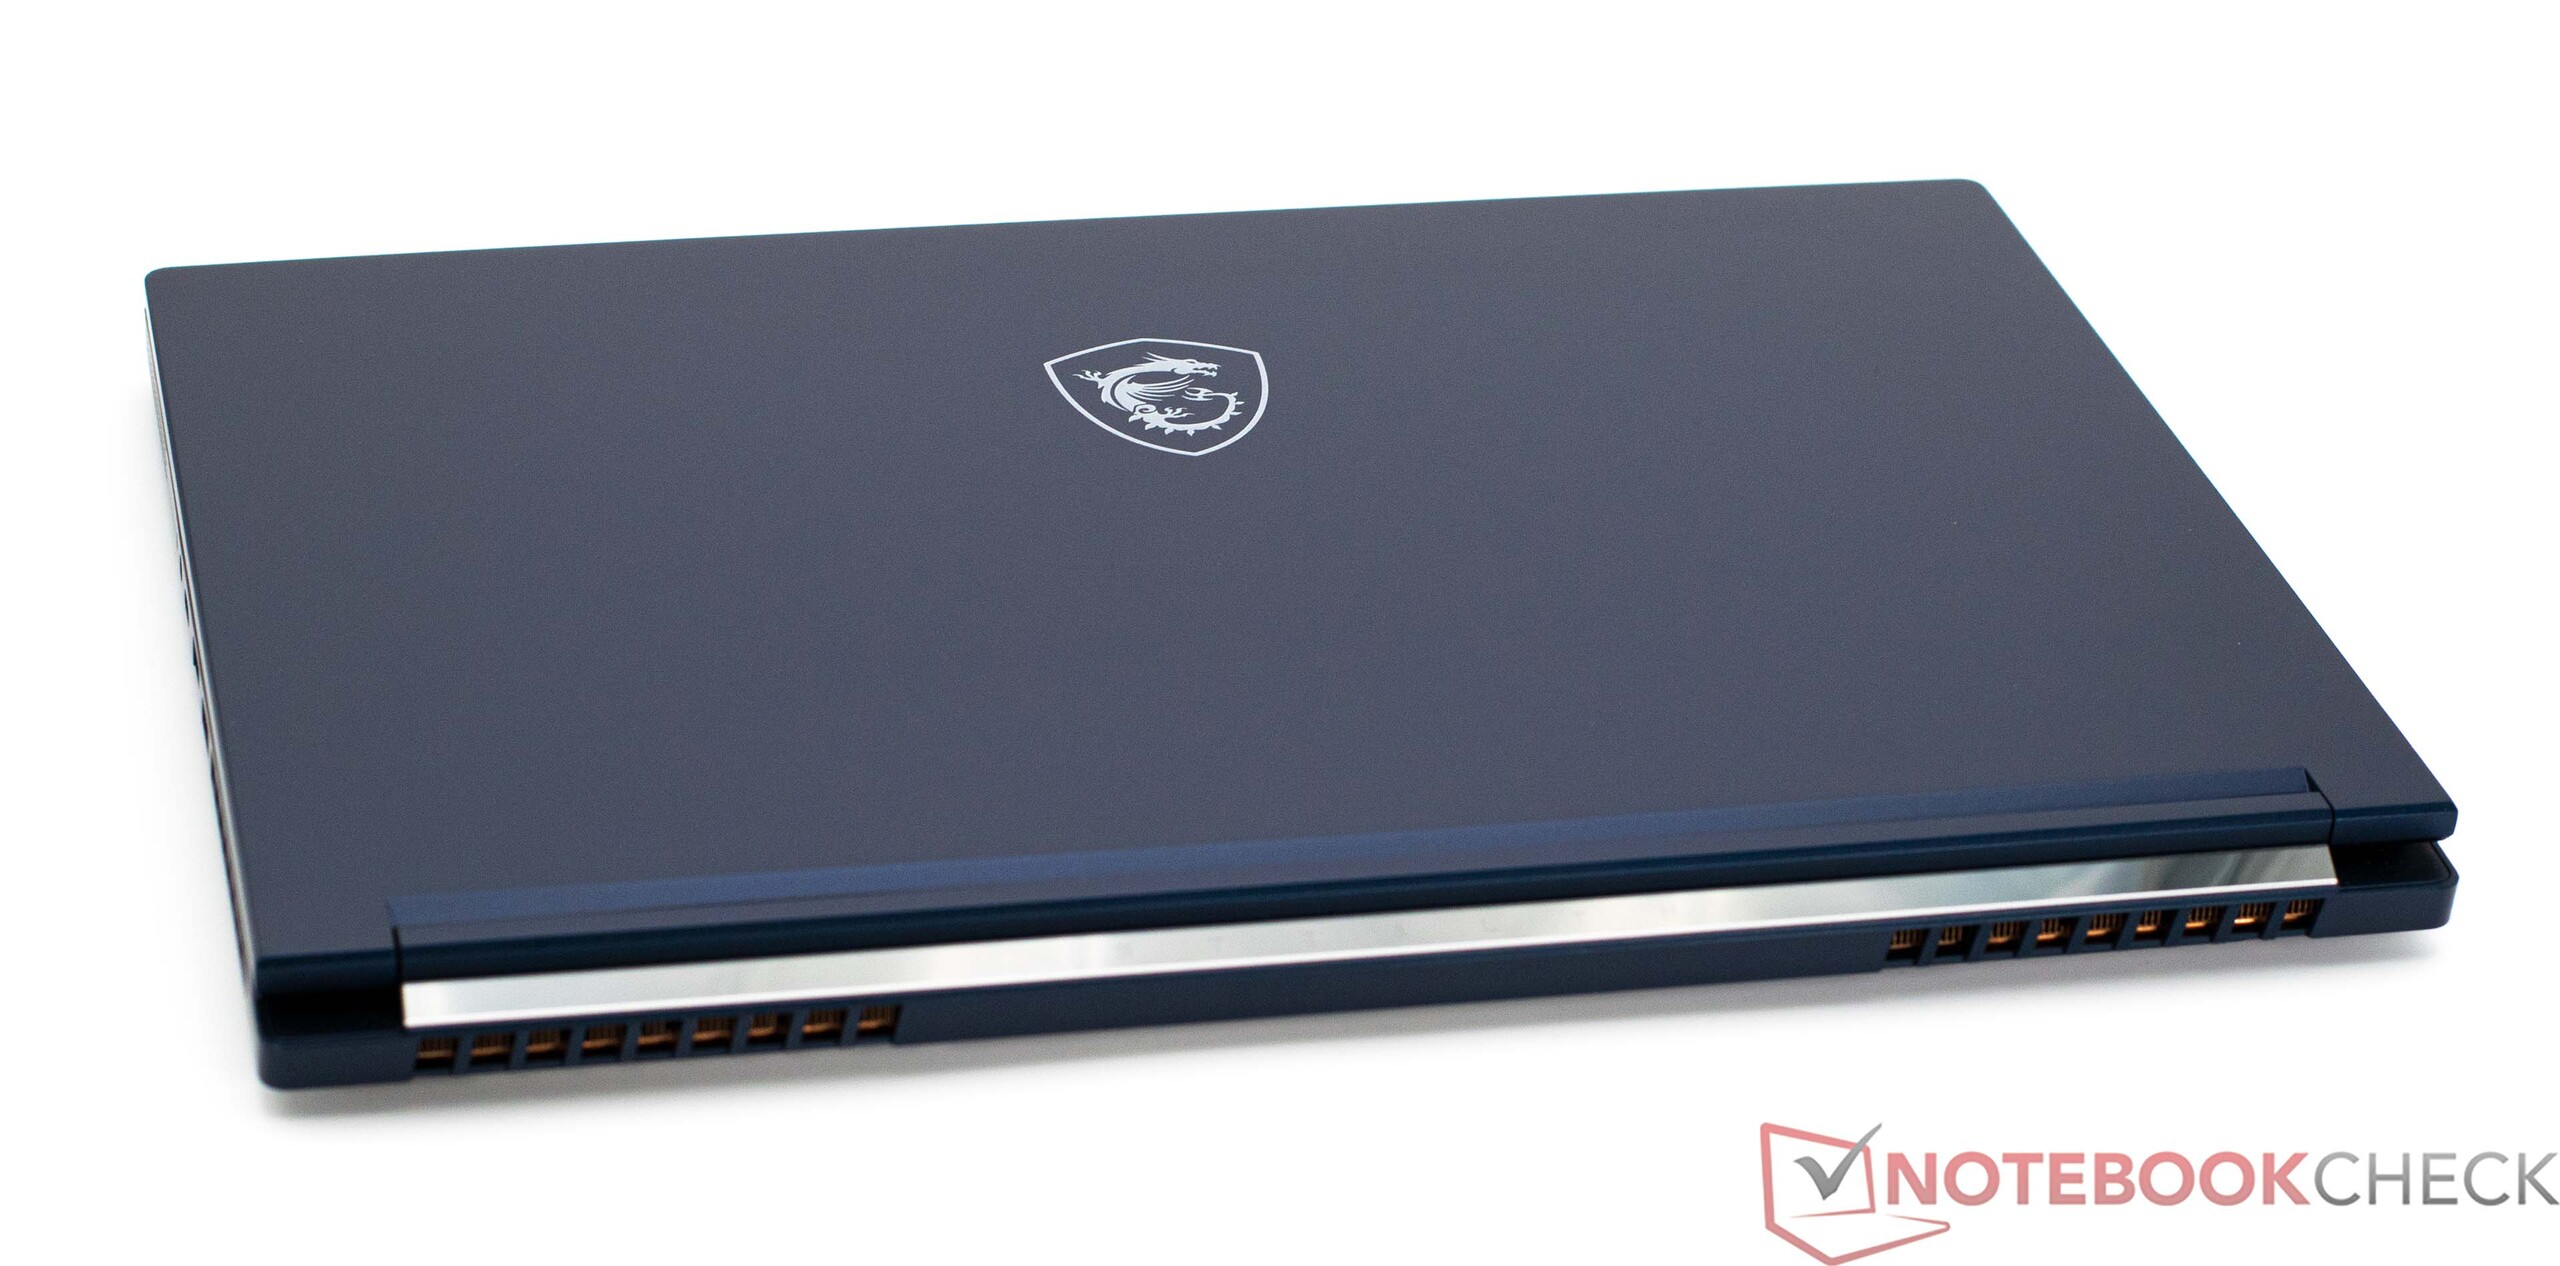
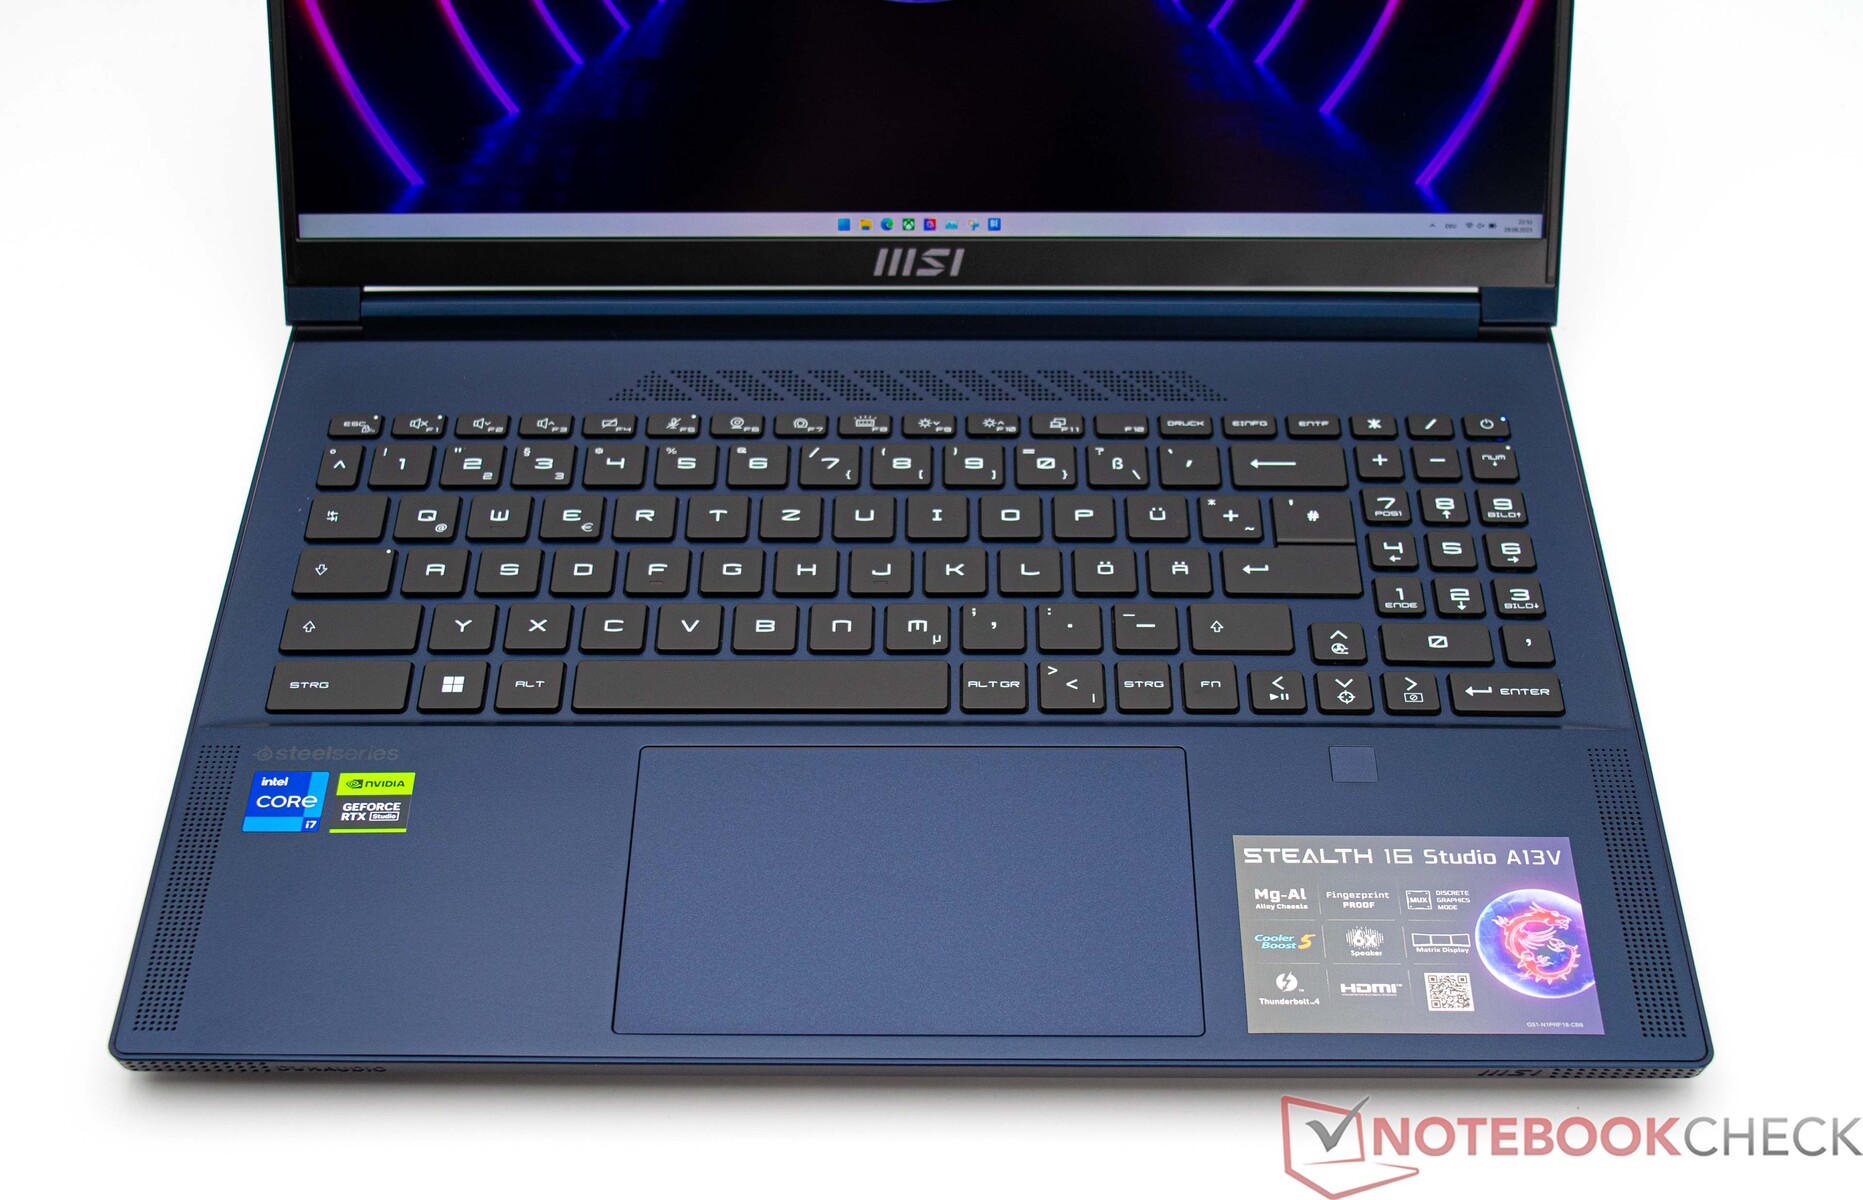
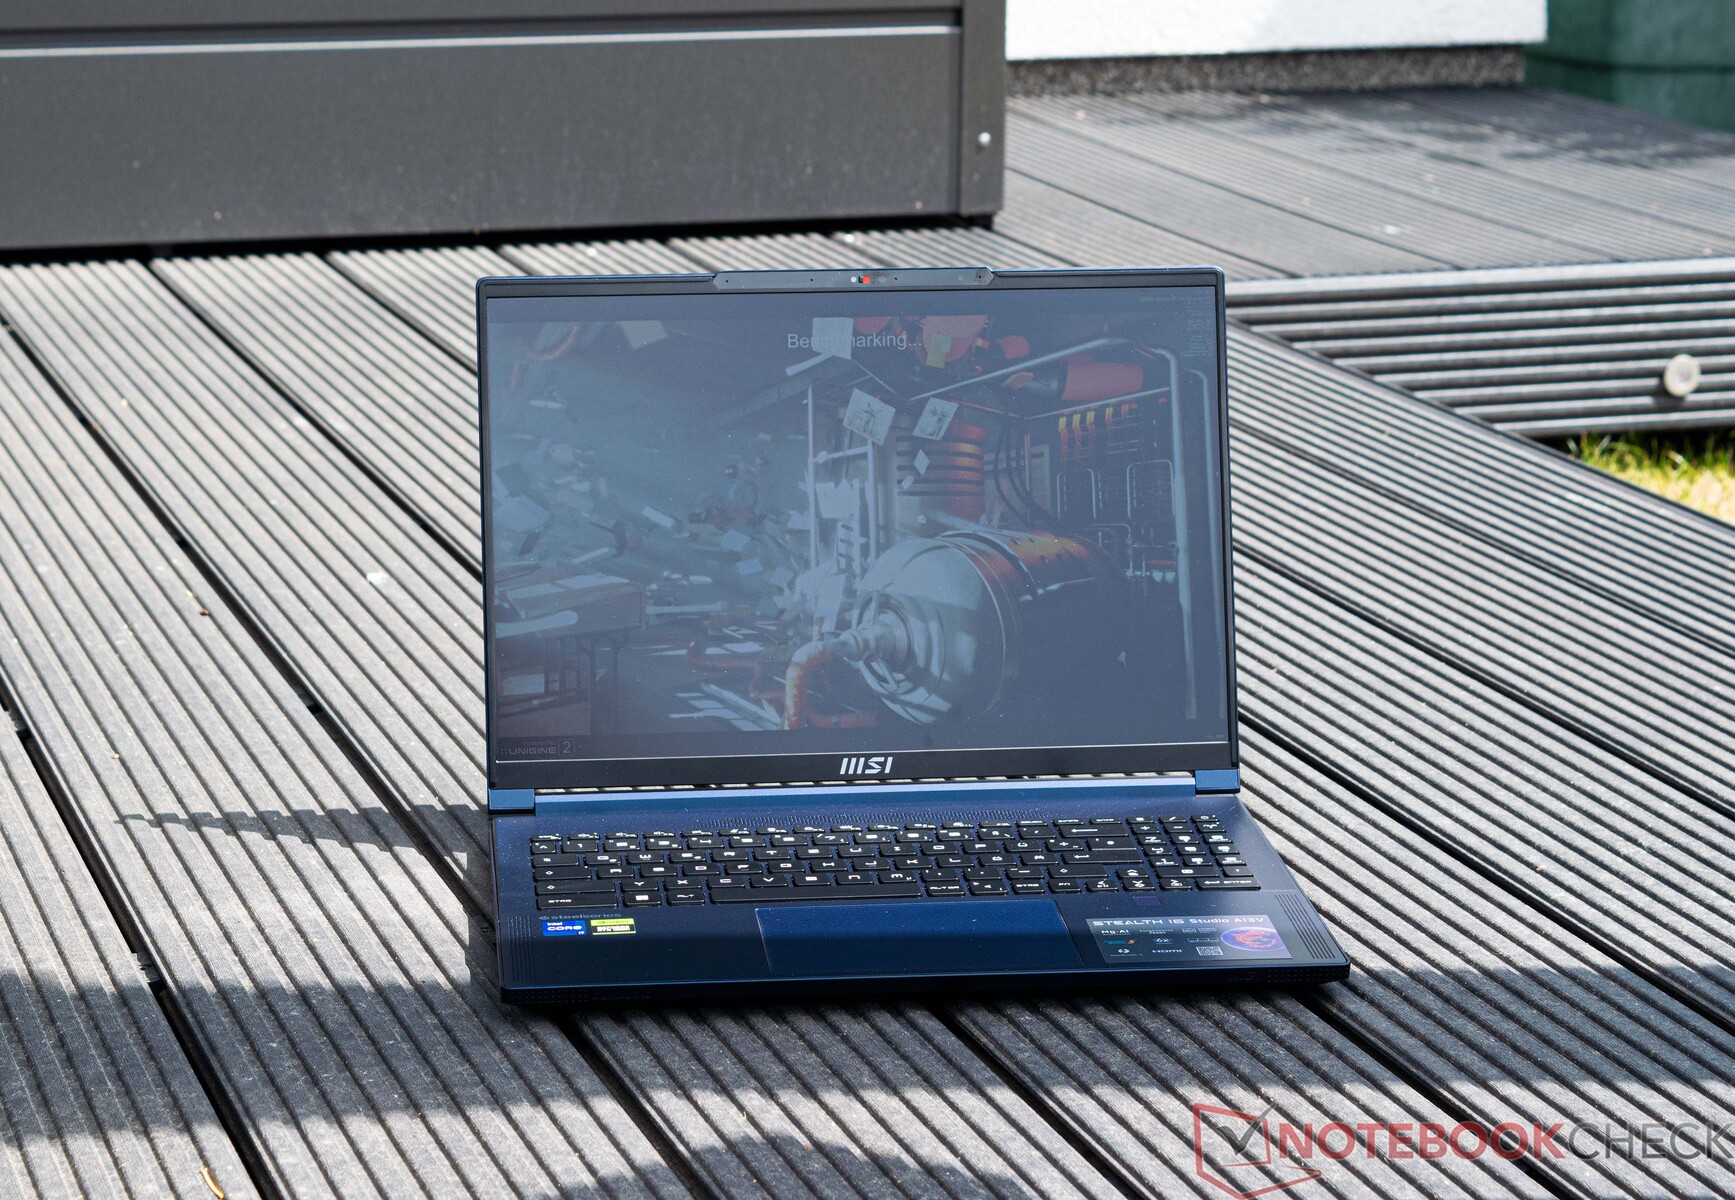
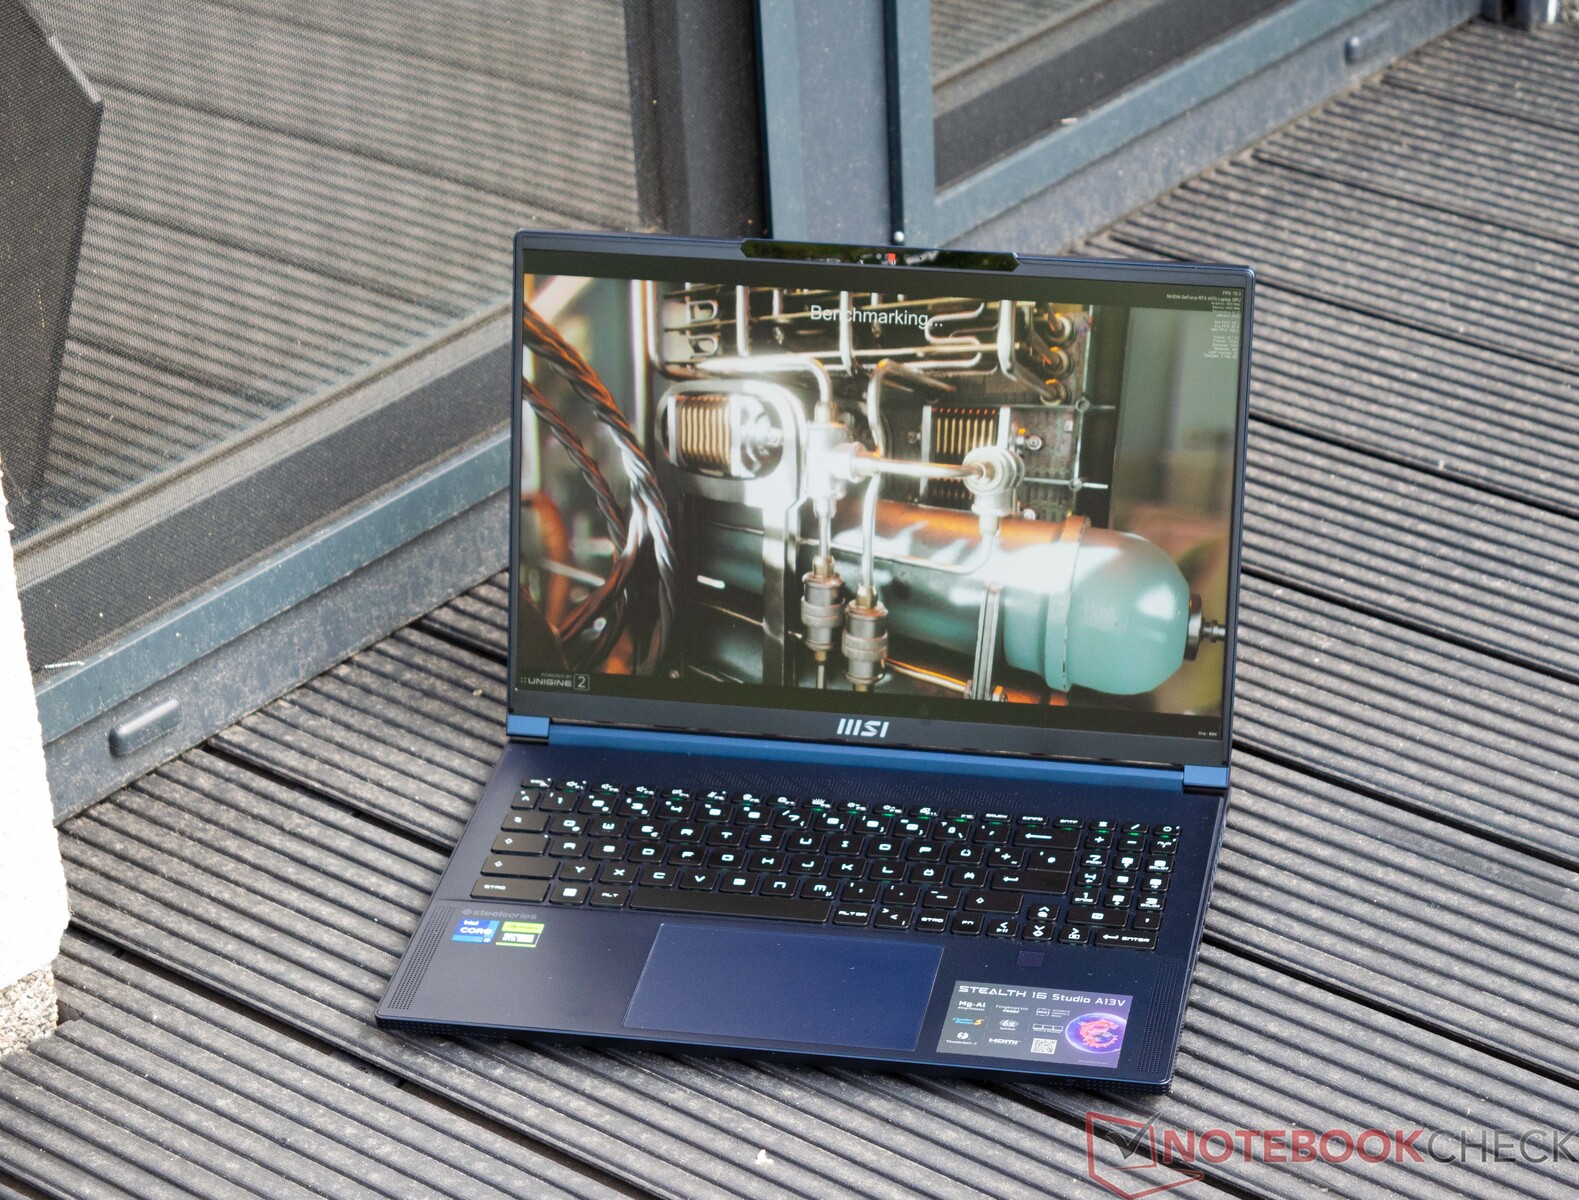
Carcasa - El aluminio y el magnesio proporcionan robustez
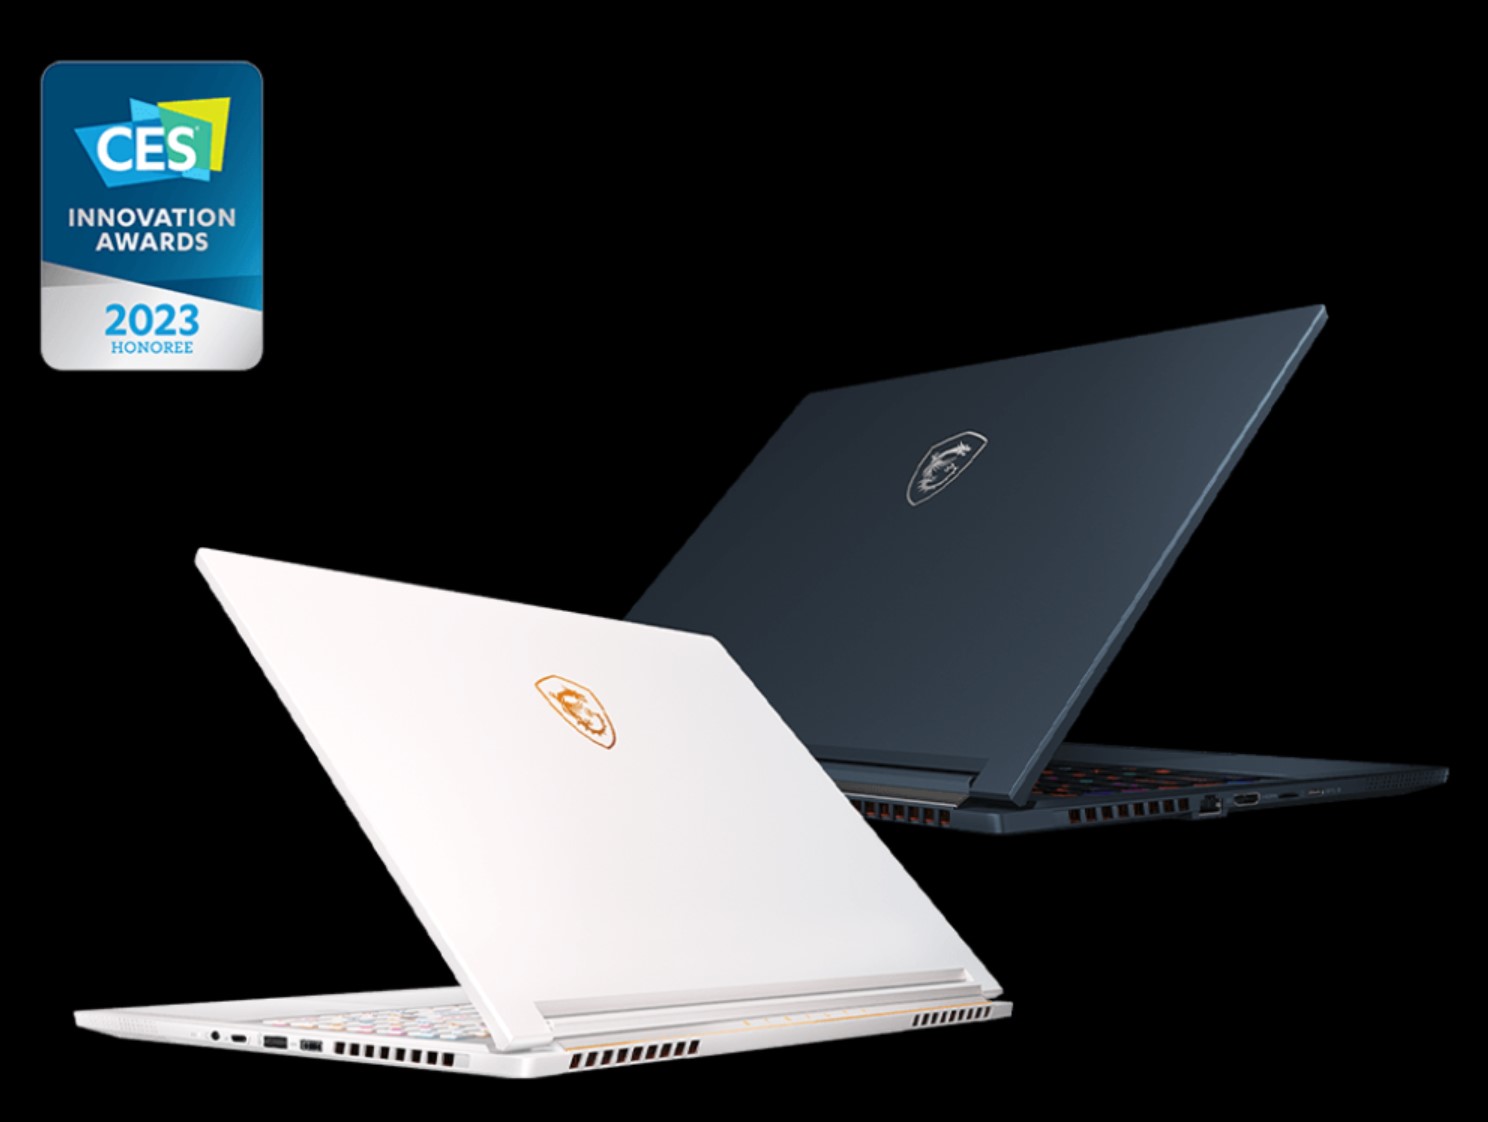
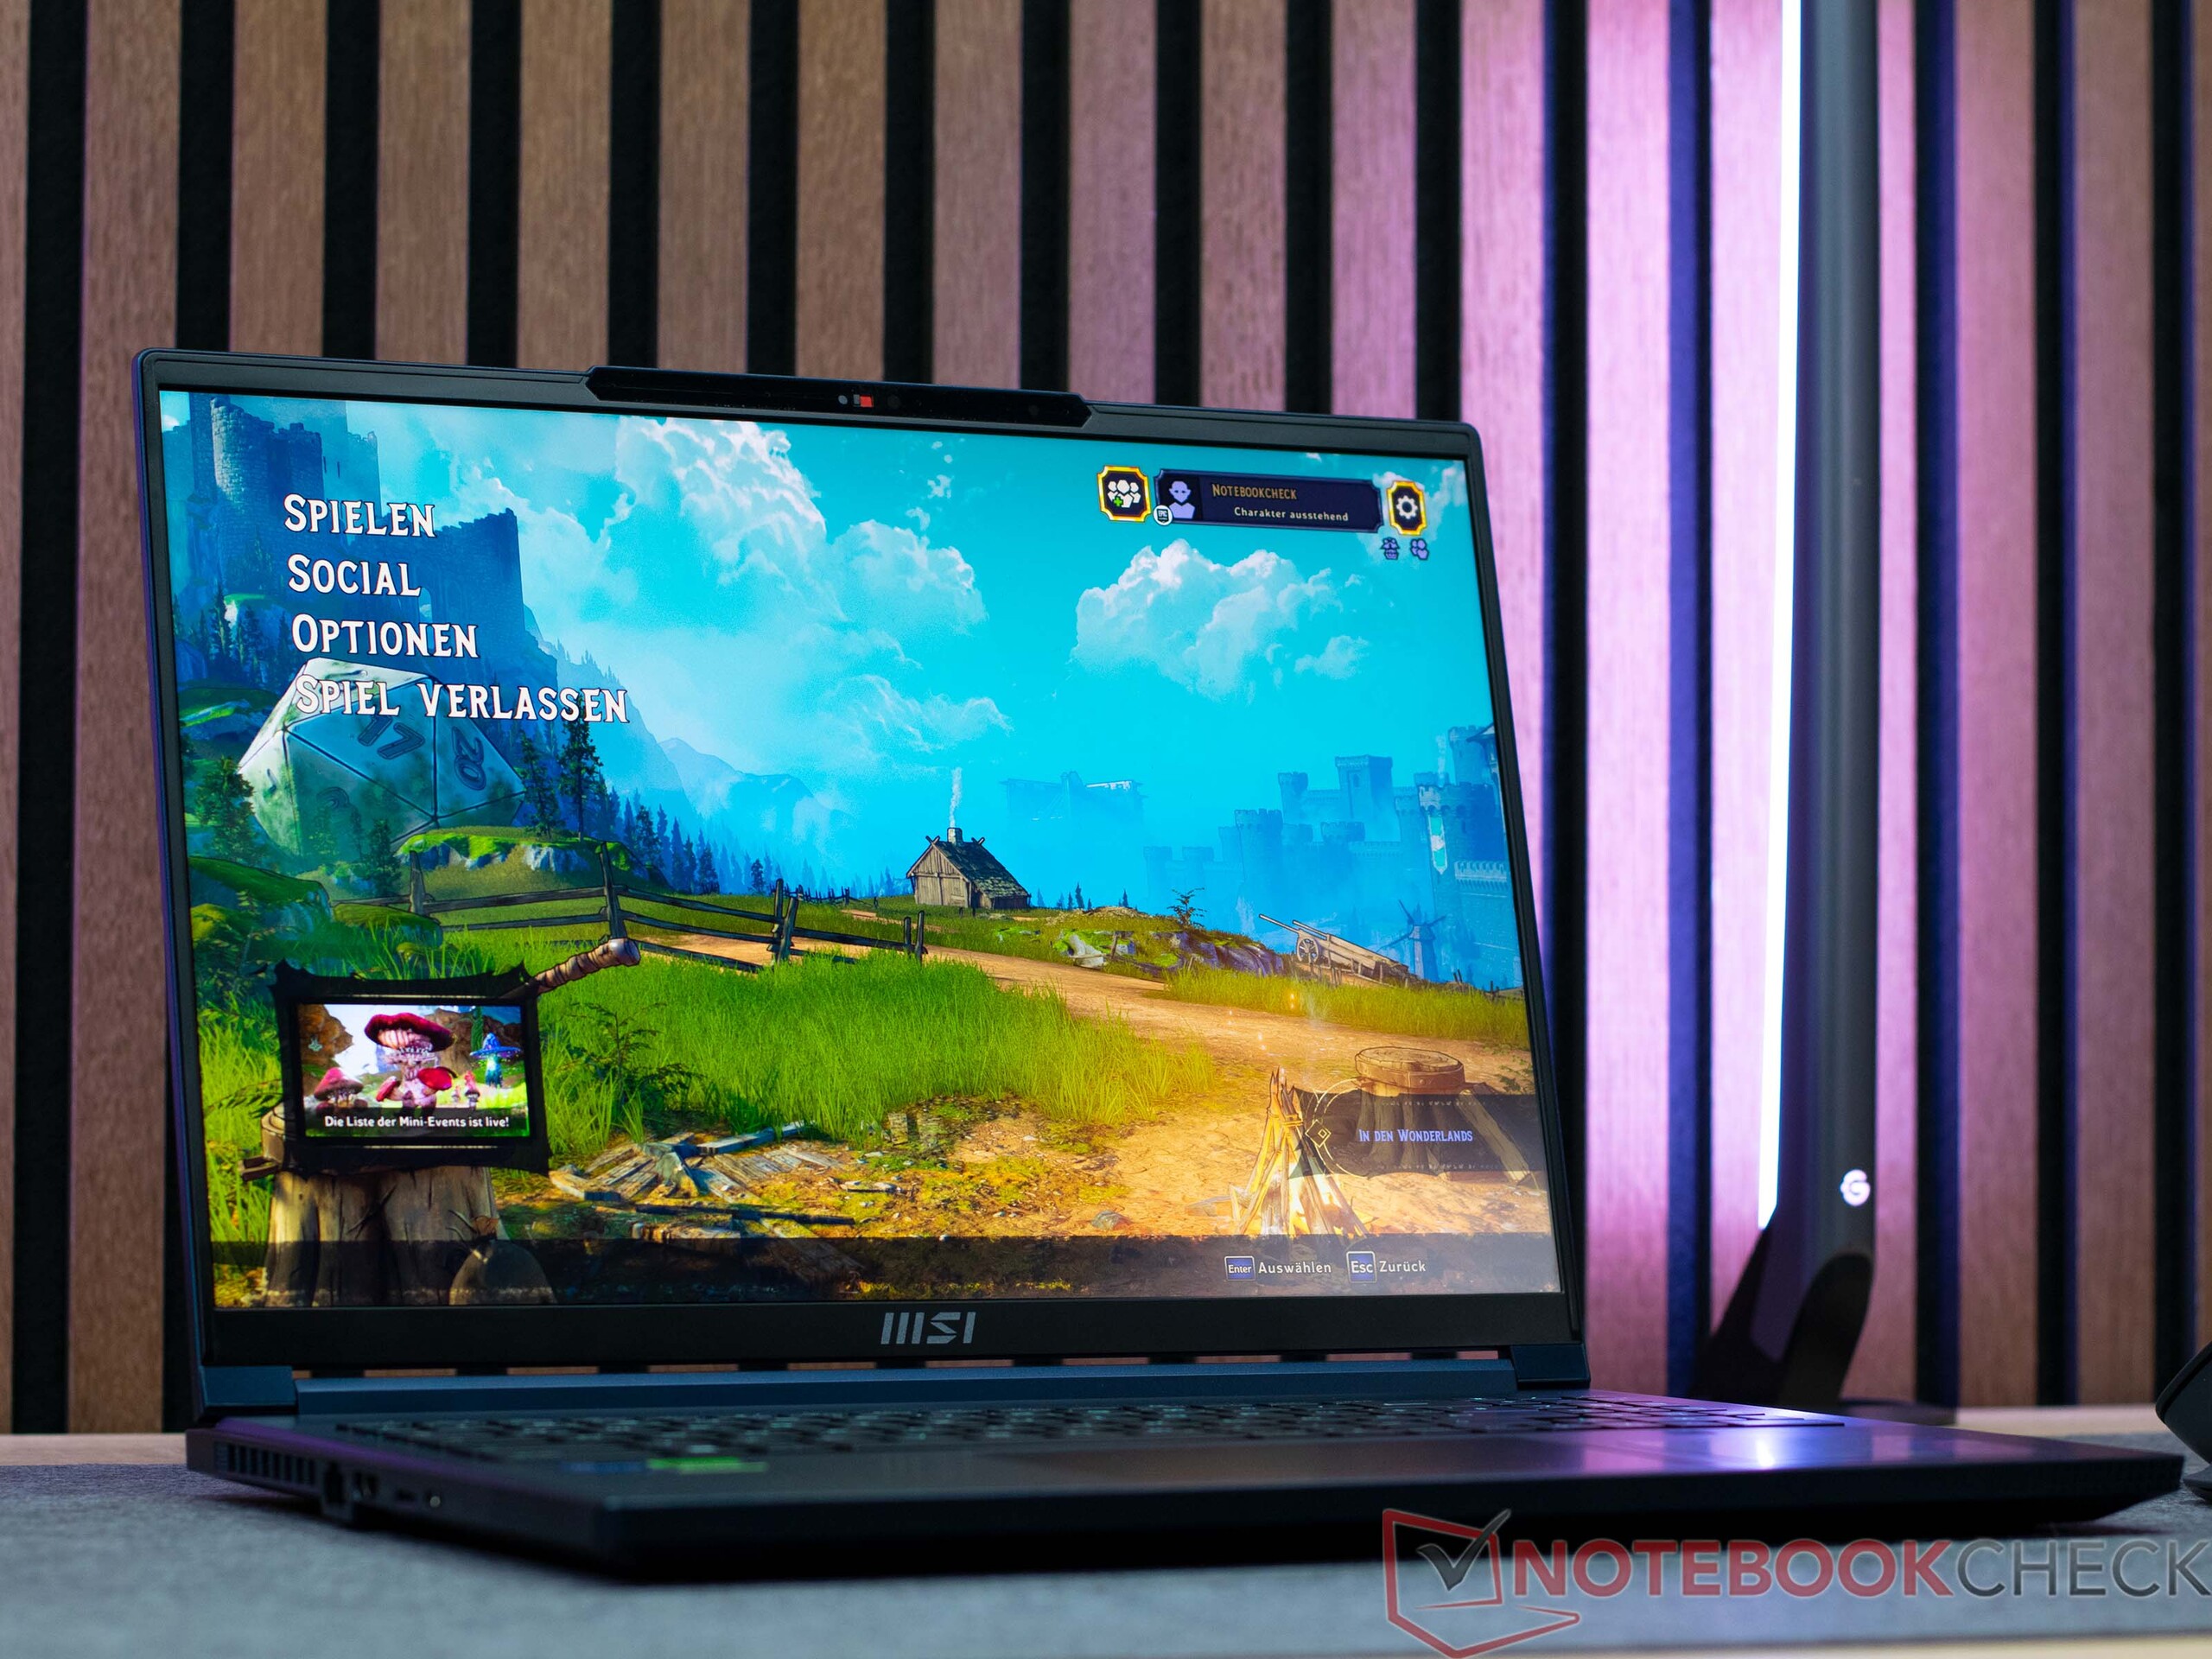
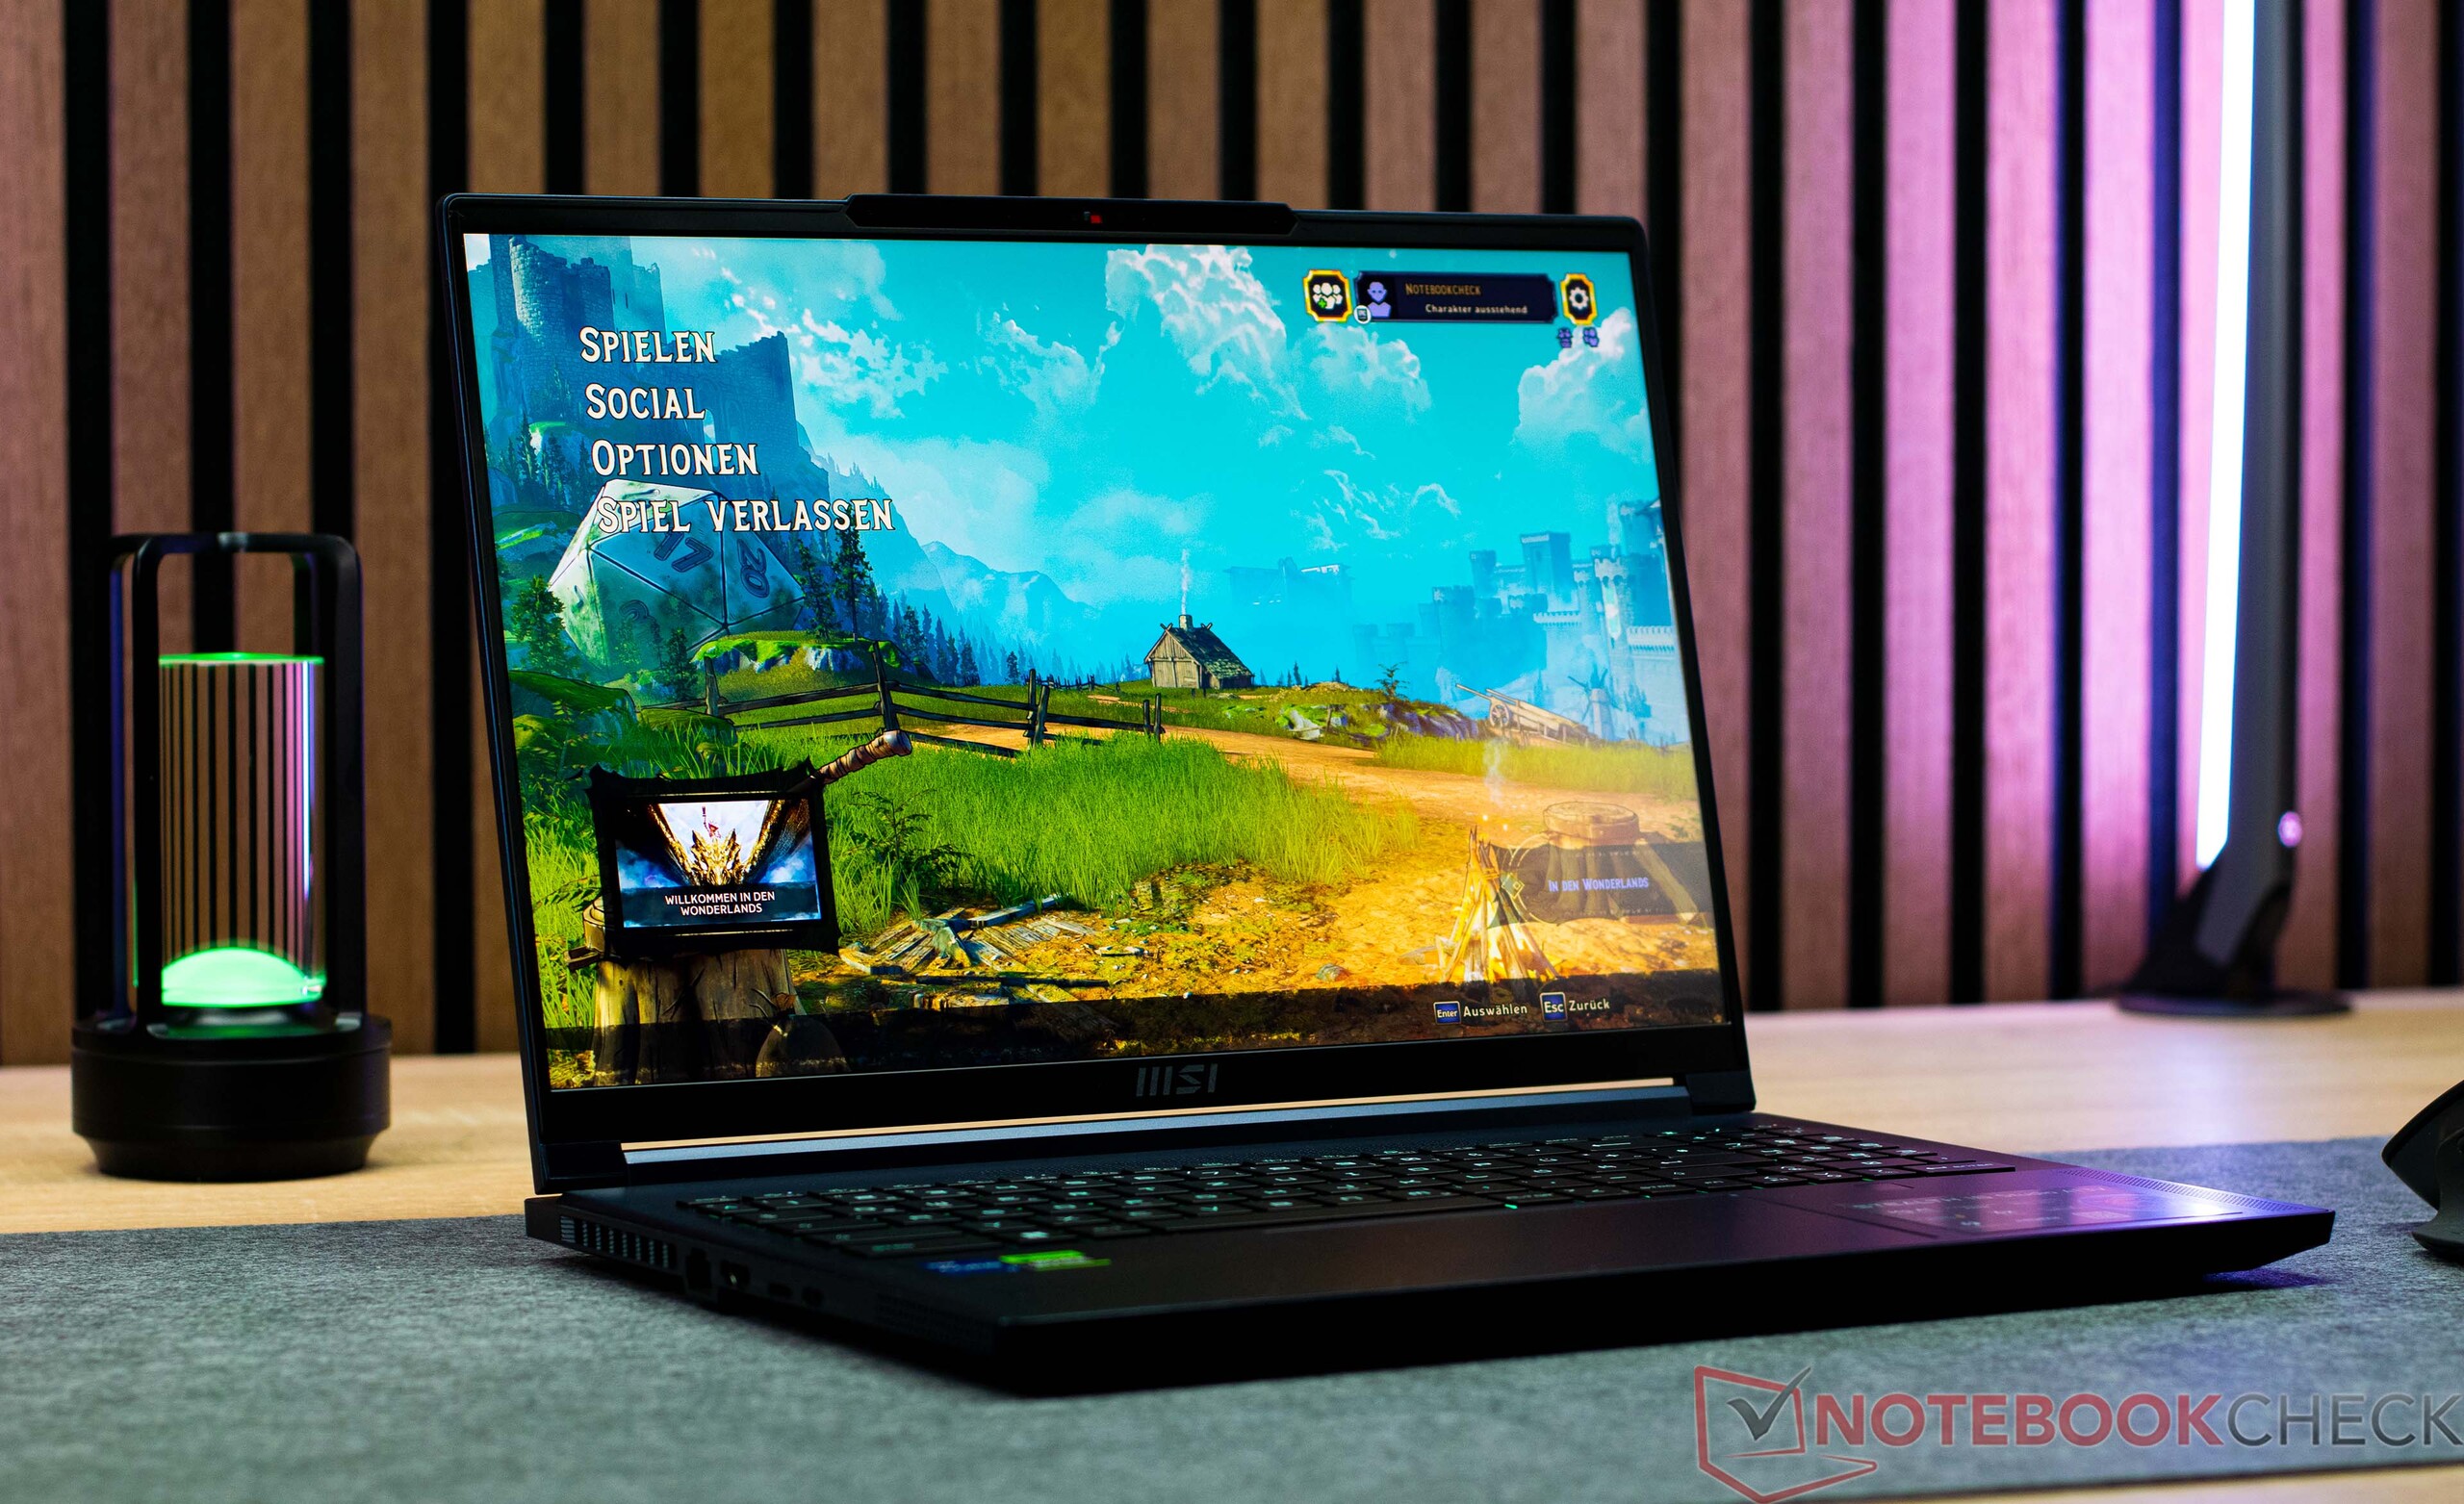
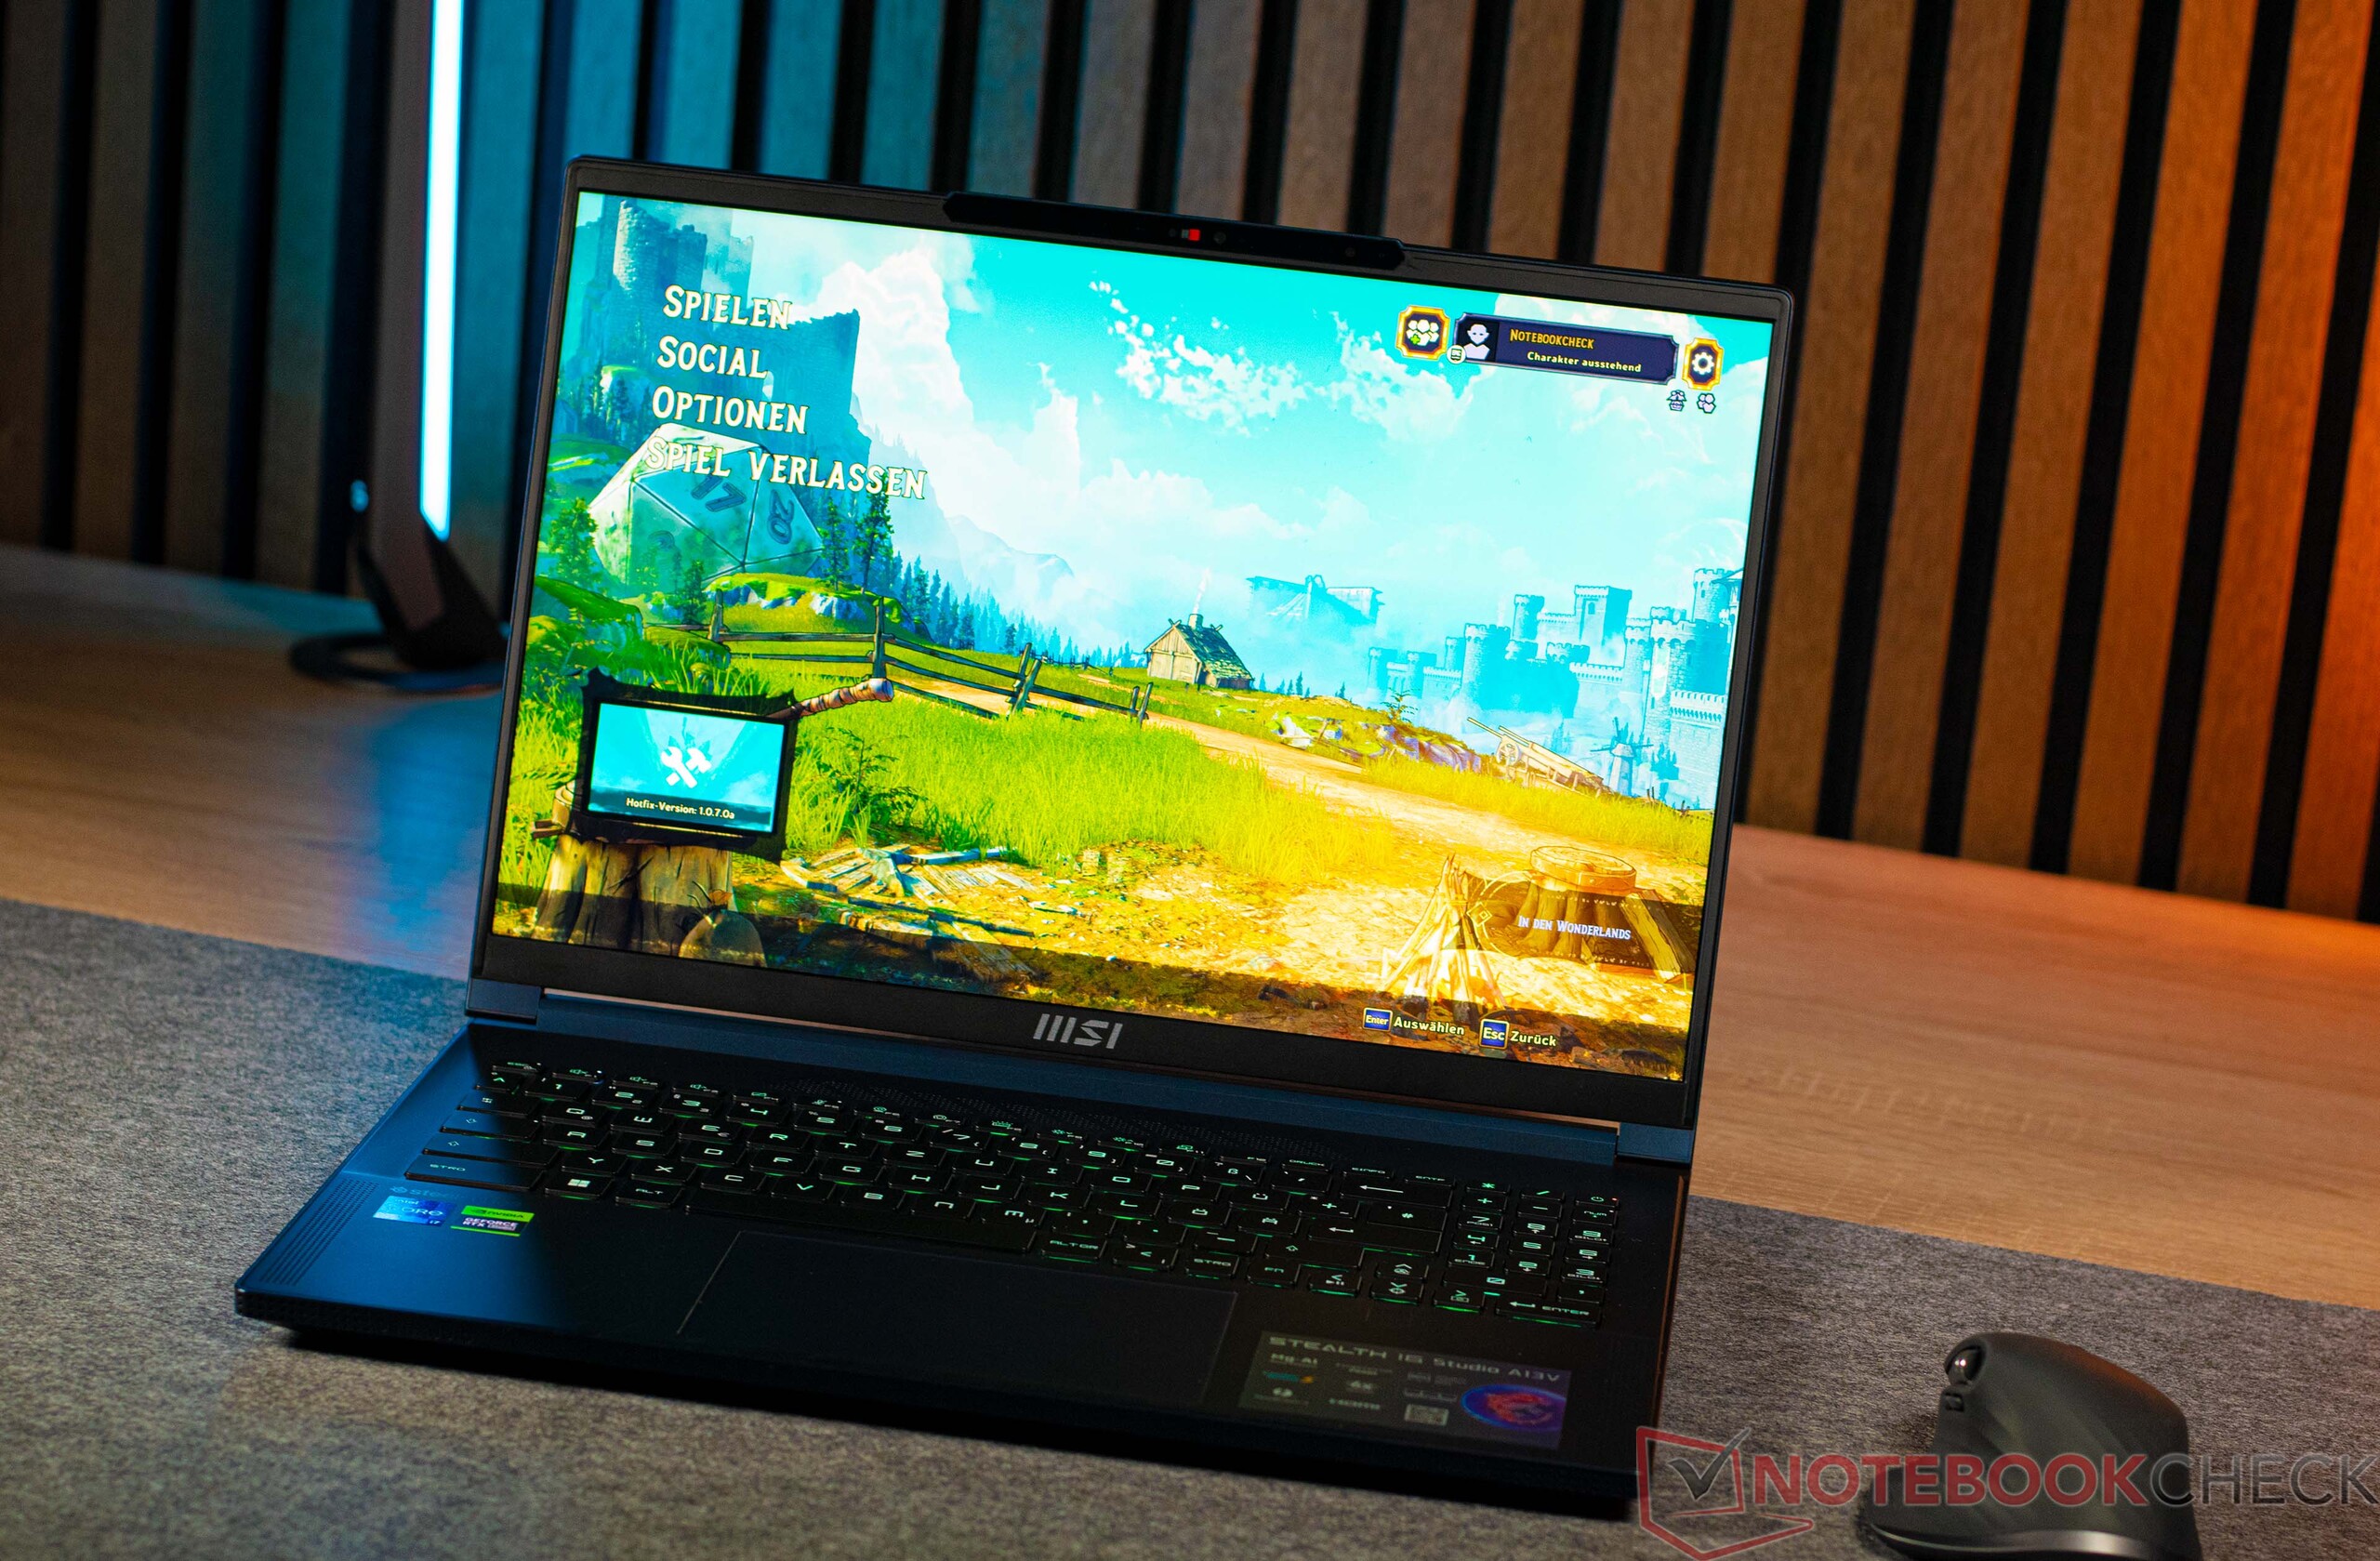
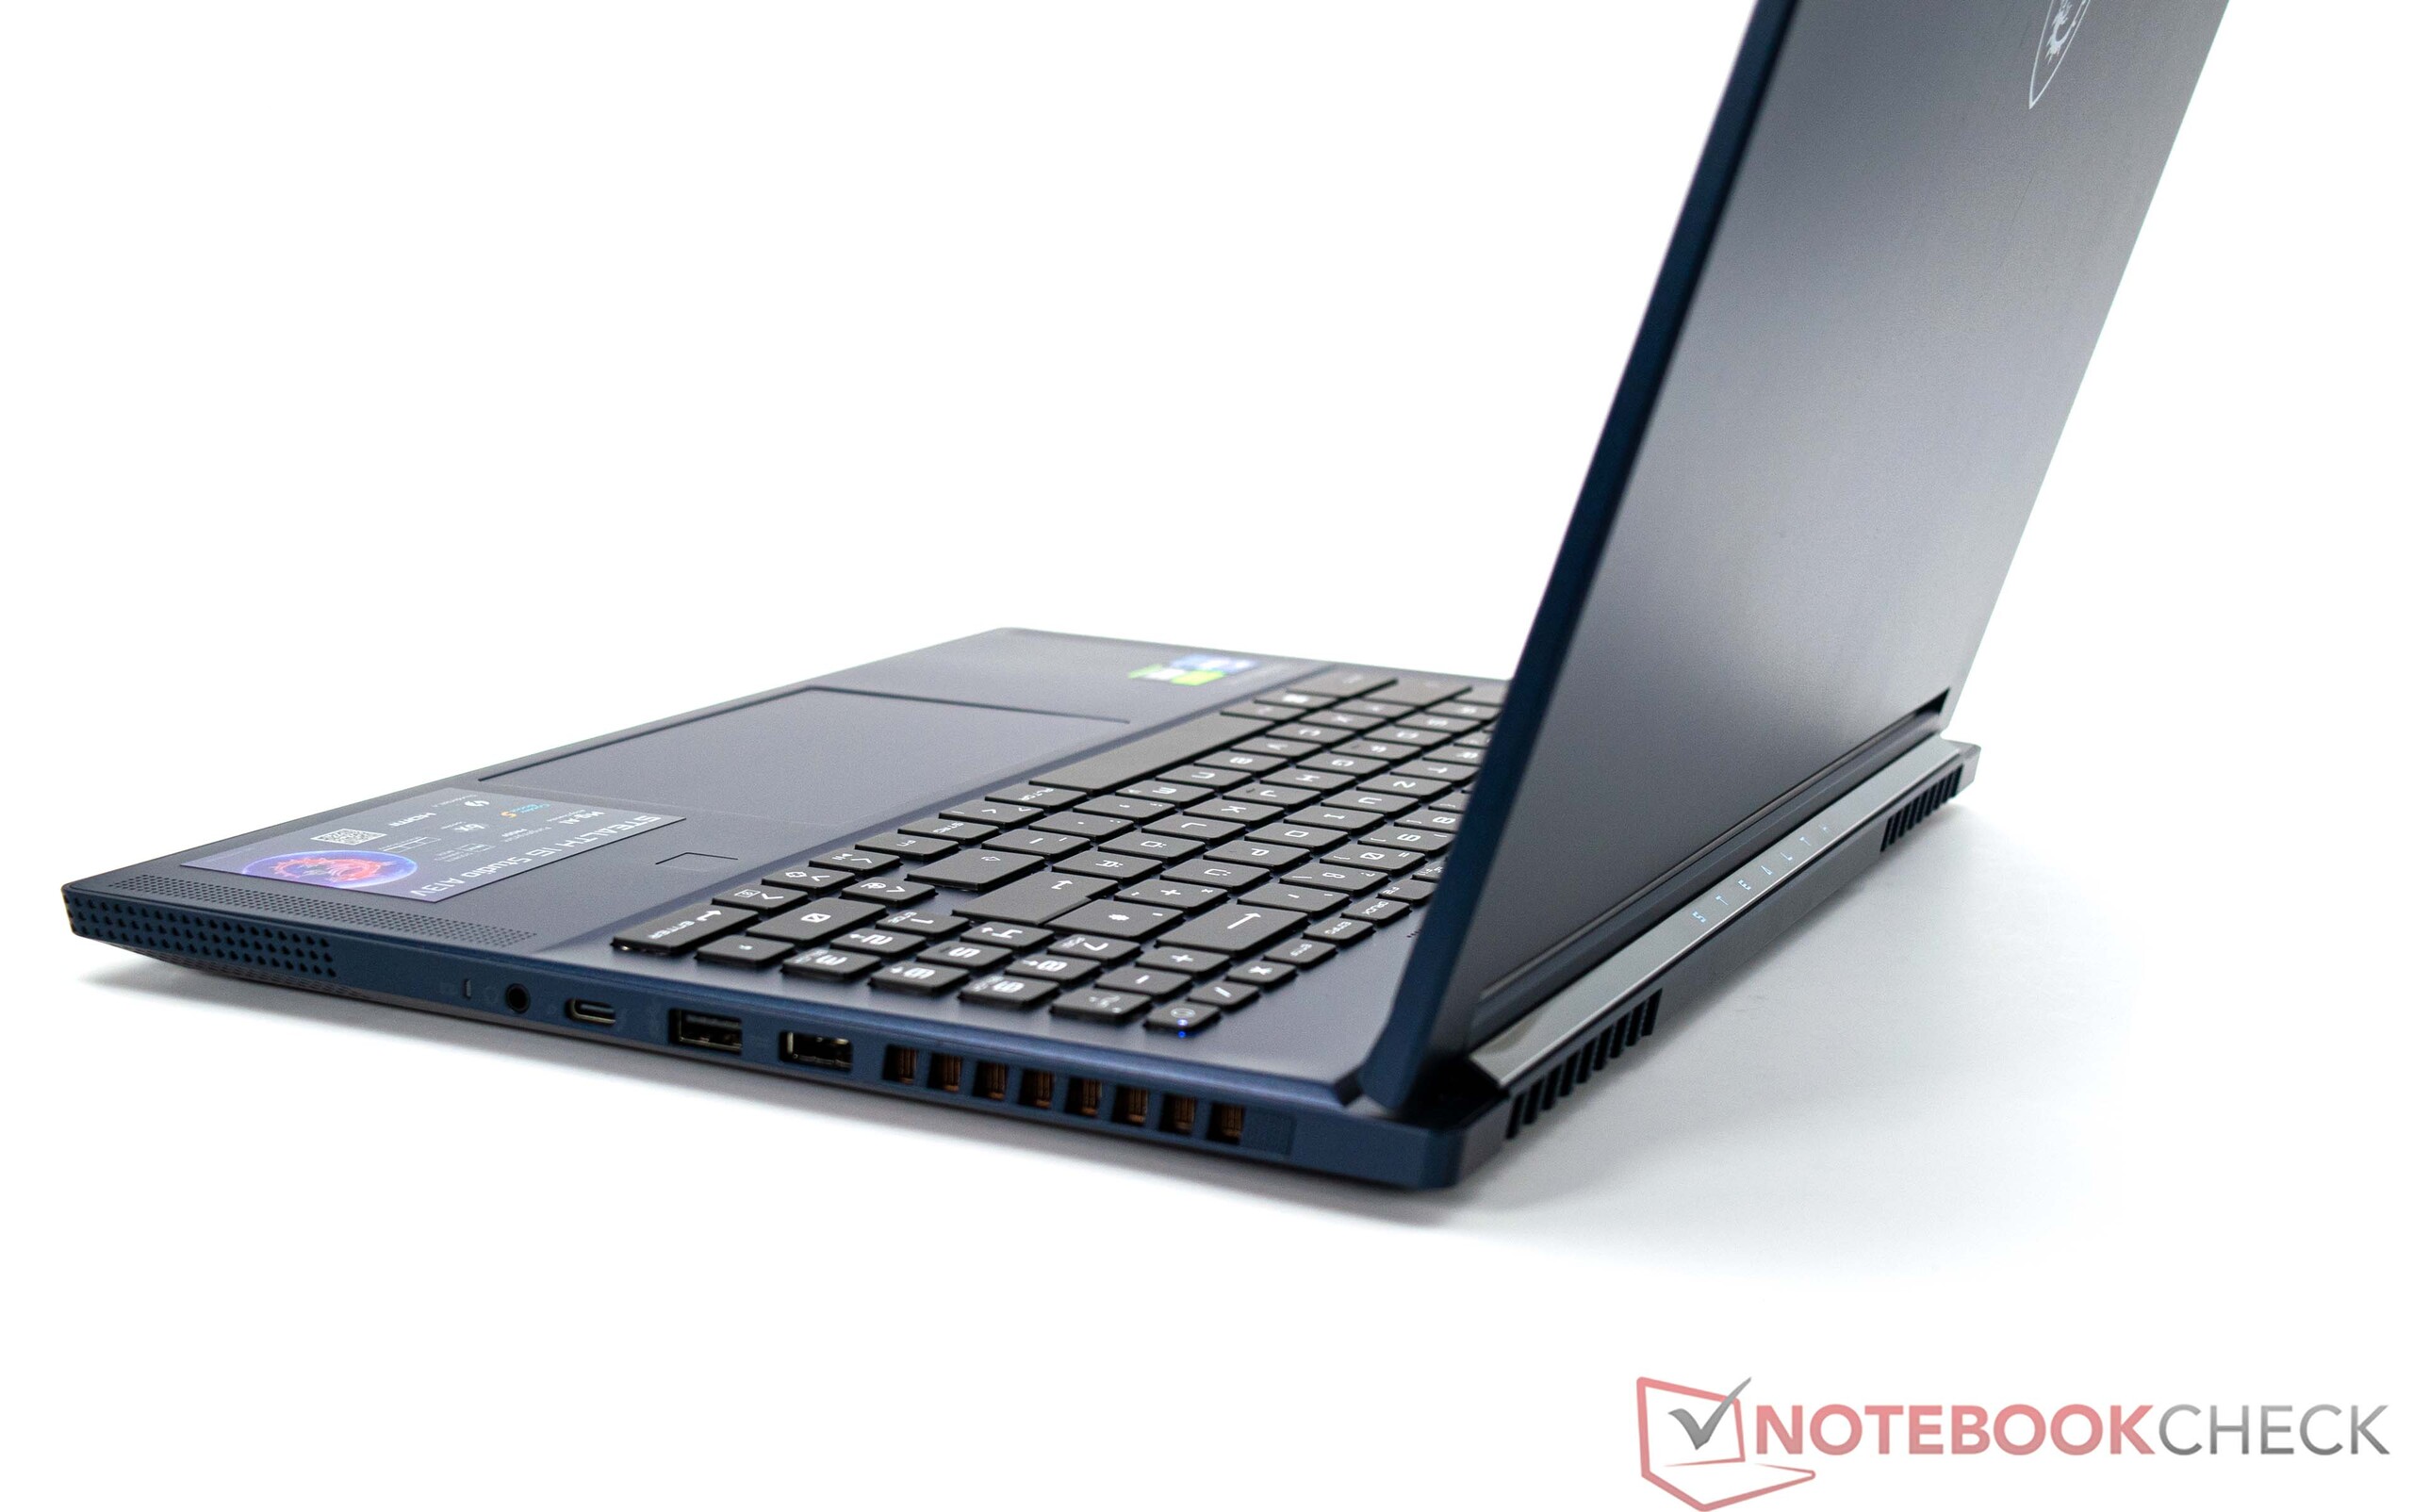
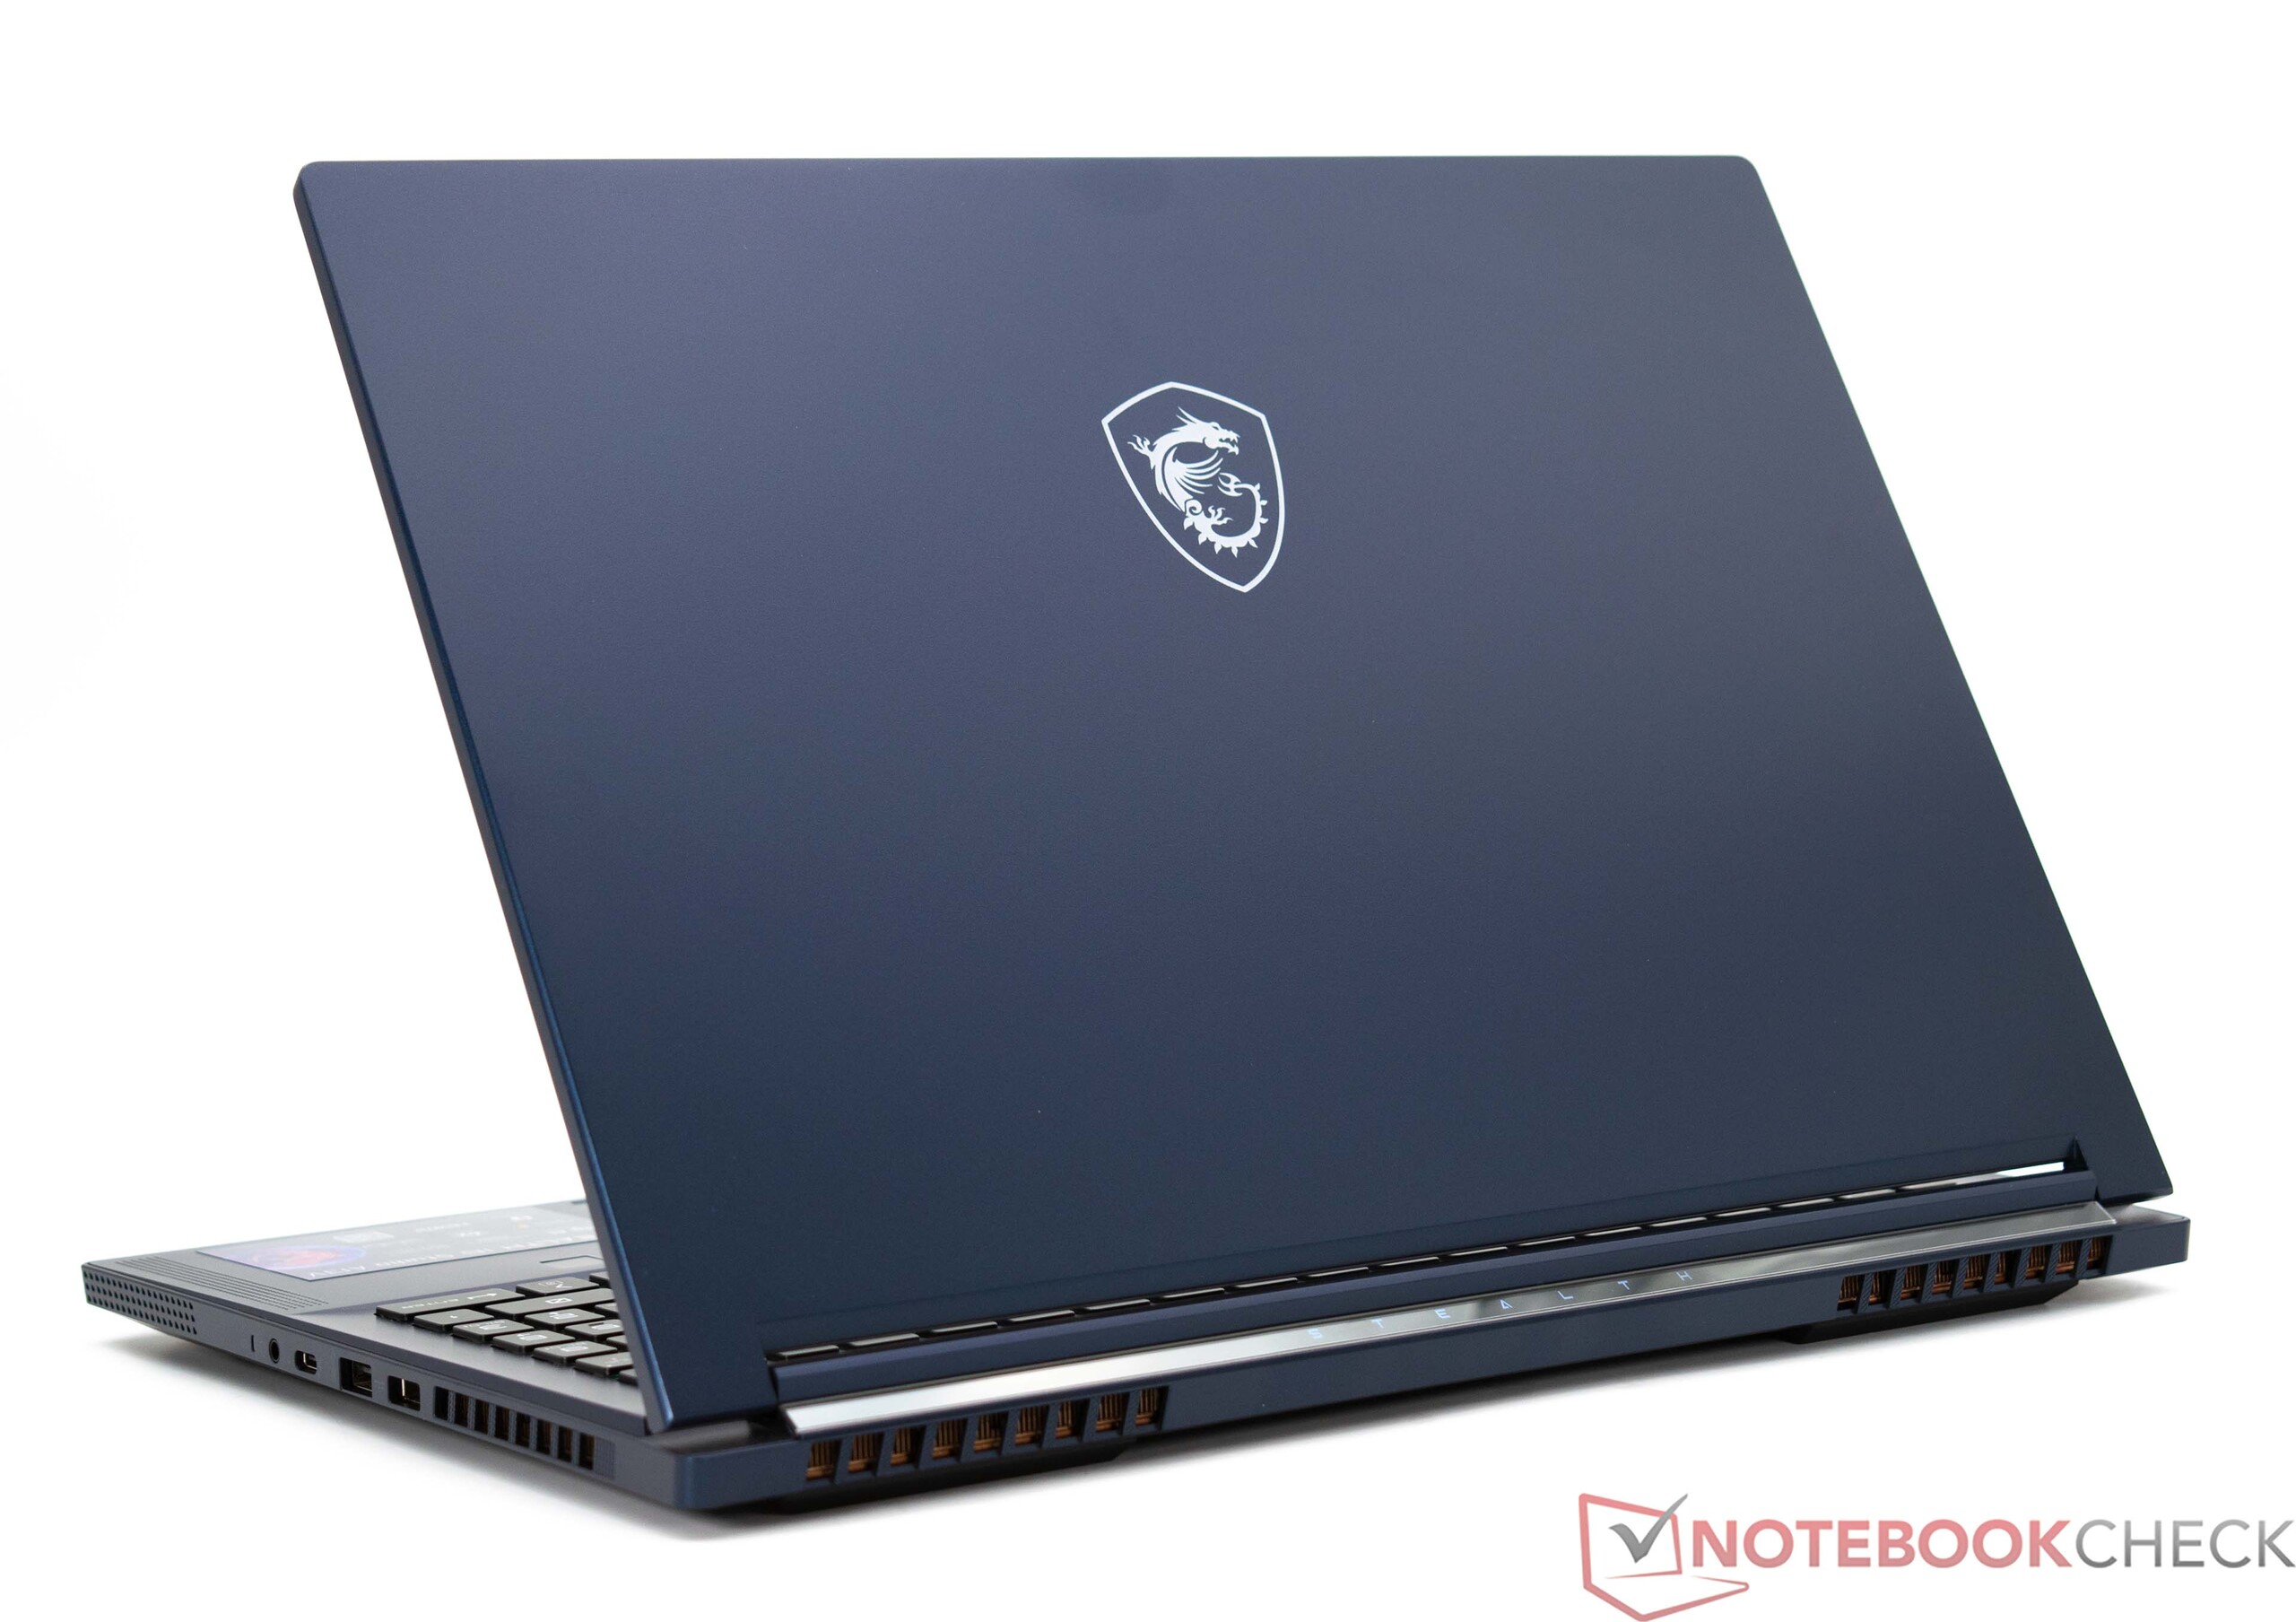
En el MSI Stealth 16 Studio A13VG se utilizan principalmente materiales de alta calidad. La mezcla de aluminio y magnesio confiere al dispositivo no sólo un aire de finura y buena estabilidad, sino que al mismo tiempo reduce su peso. La aplicación de presión selectiva sólo resulta en una flexión mínima de la base, pero sólo si se aplica una presión modesta. Por otro lado, la tapa de la carcasa puede torcerse ligeramente, aunque esto no parece ser un aspecto extremadamente negativo en el MSI Stealth 16 Studio A13VG. Las bisagras hacen un buen trabajo y ayudan a prevenir que la tapa se tambalee de un lado a otro. No obstante, el dispositivo se puede abrir con una sola mano. Desde el punto de vista del diseño, el portátil es discreto y prescinde de mucha iluminación RGB. En la parte trasera, sólo las letras "Stealth" están sutilmente iluminadas. Nuestro dispositivo de análisis es azul pero, alternativamente, el MSI Stealth 16 Studio también viene completamente en blanco.
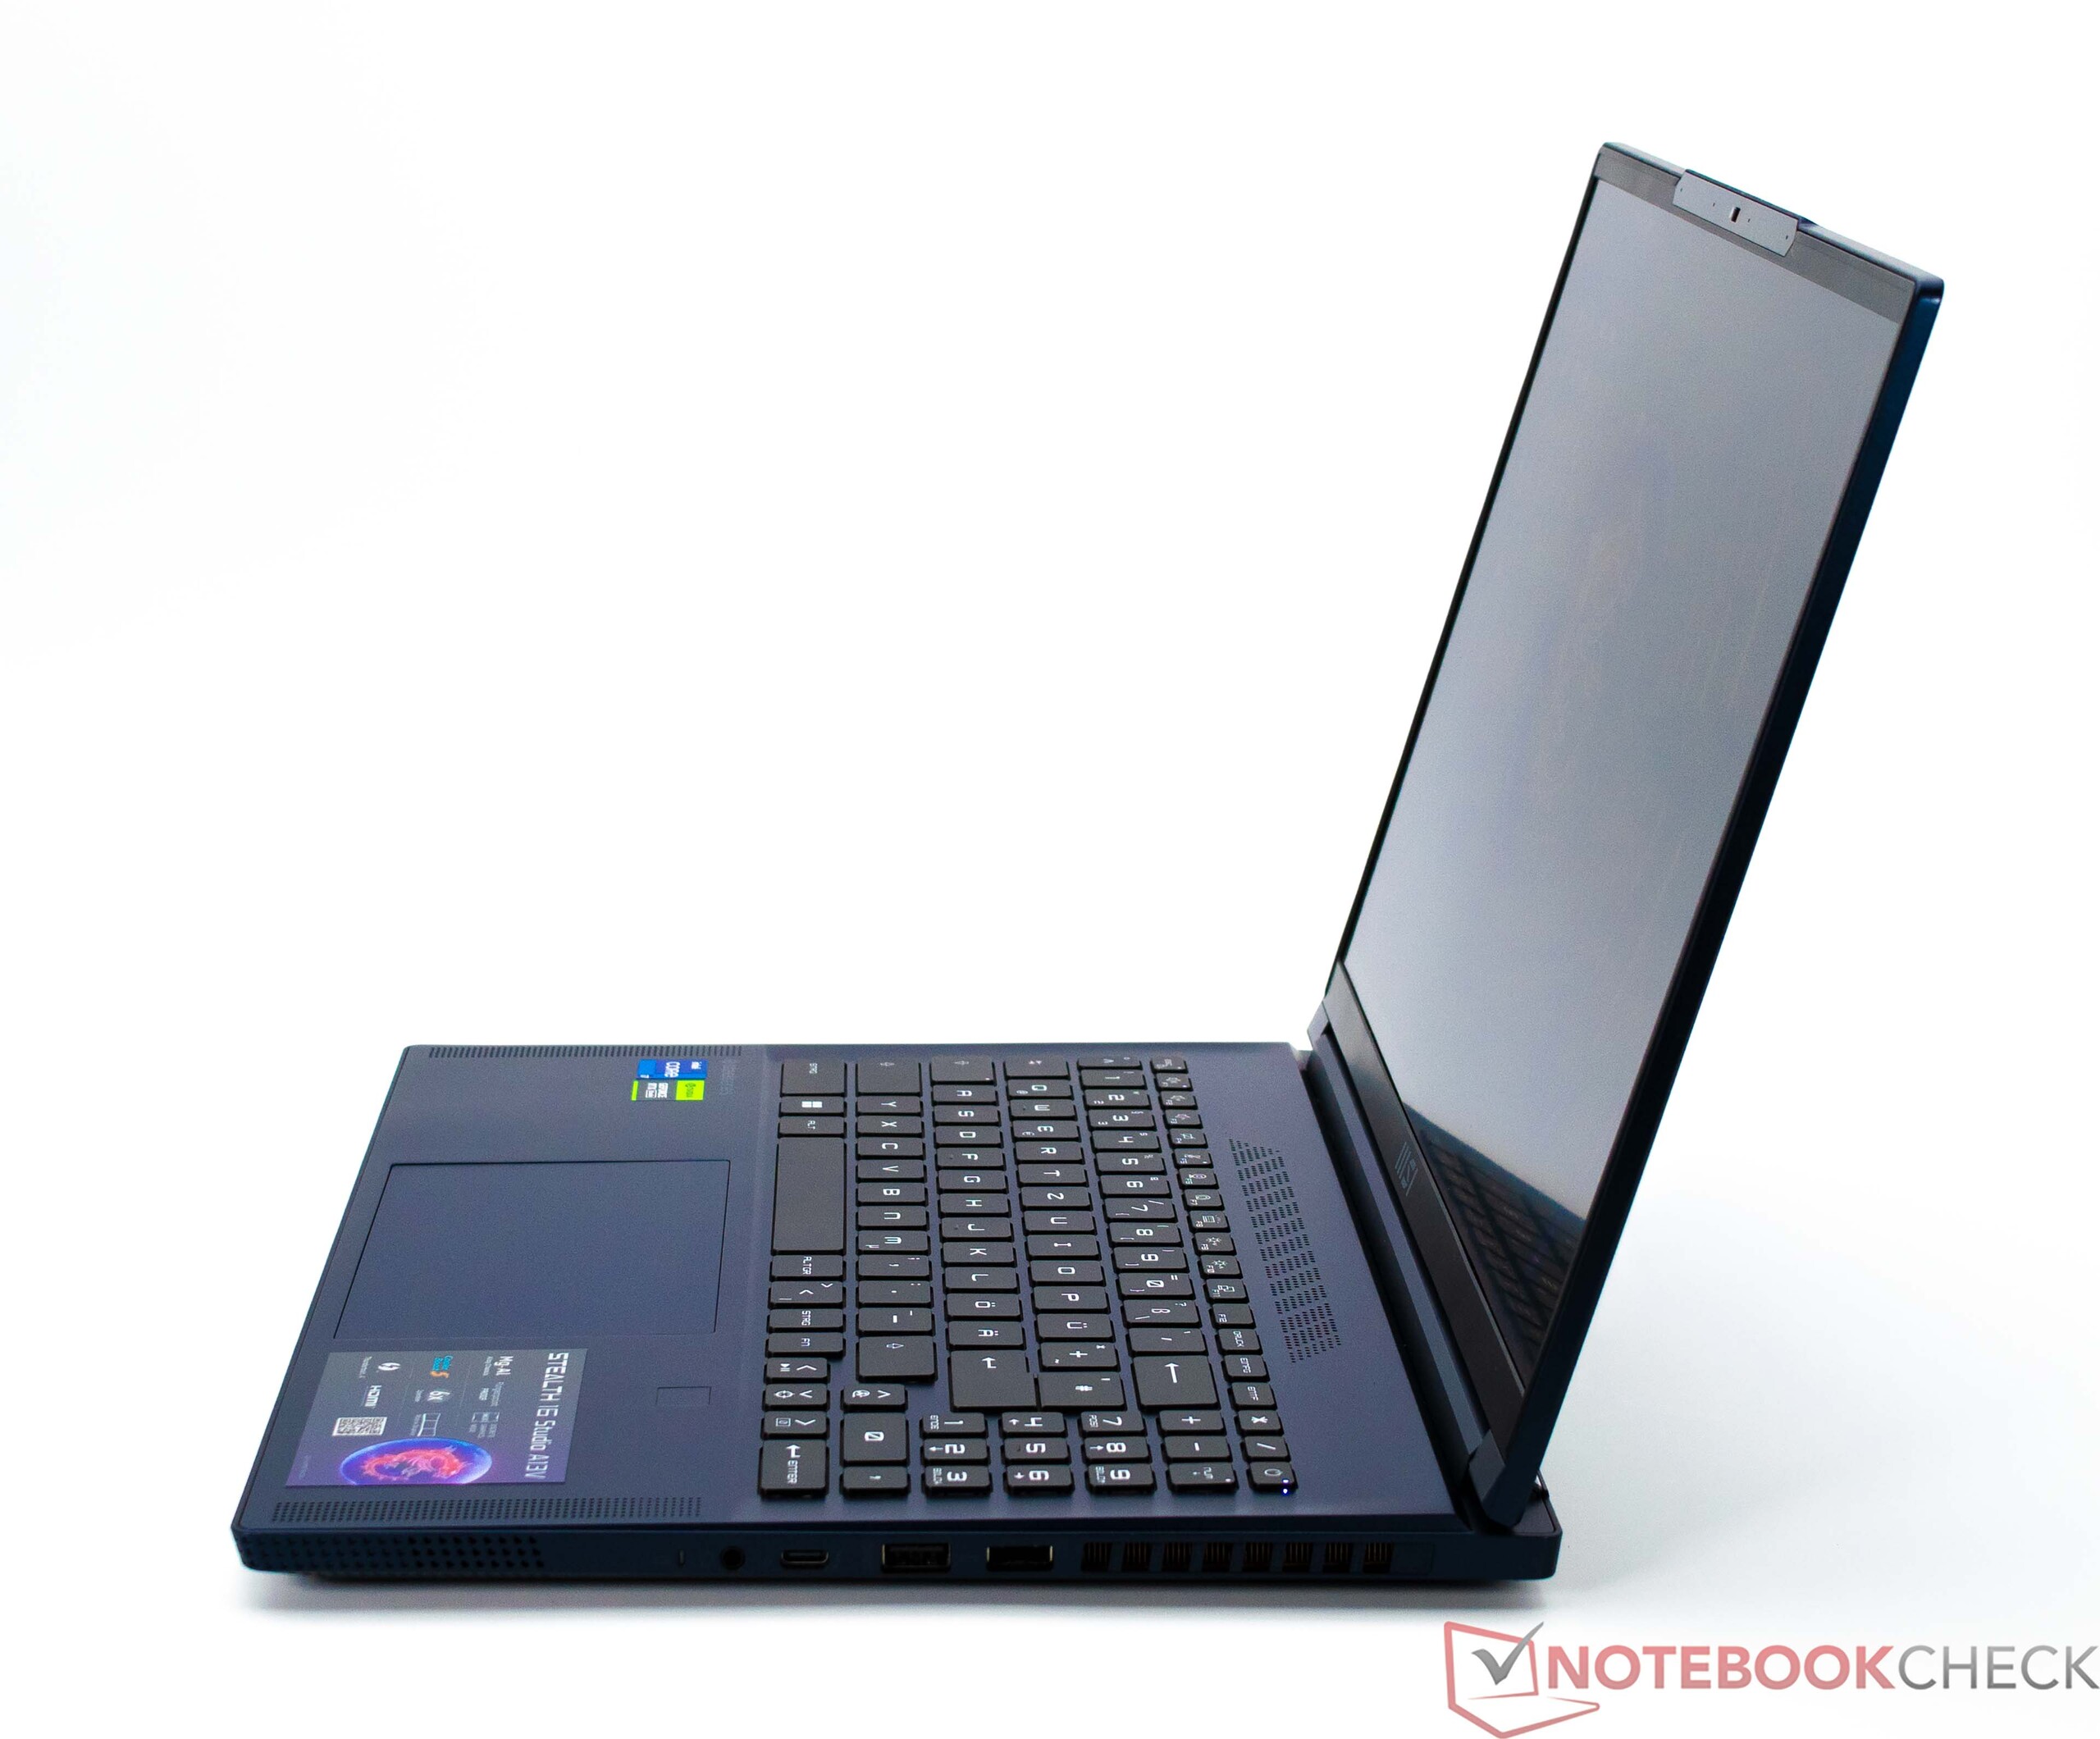
En lo que respecta al tamaño del portátil, todos los dispositivos ocupan más o menos el mismo espacio. Por el contrario, en términos de peso, el MSI Stealth 16 Studio A13VG es uno de los candidatos más ligeros de nuestra comparativa, con un peso de poco más de 2 kilogramos. La fuente de alimentación pesa 576 gramos.
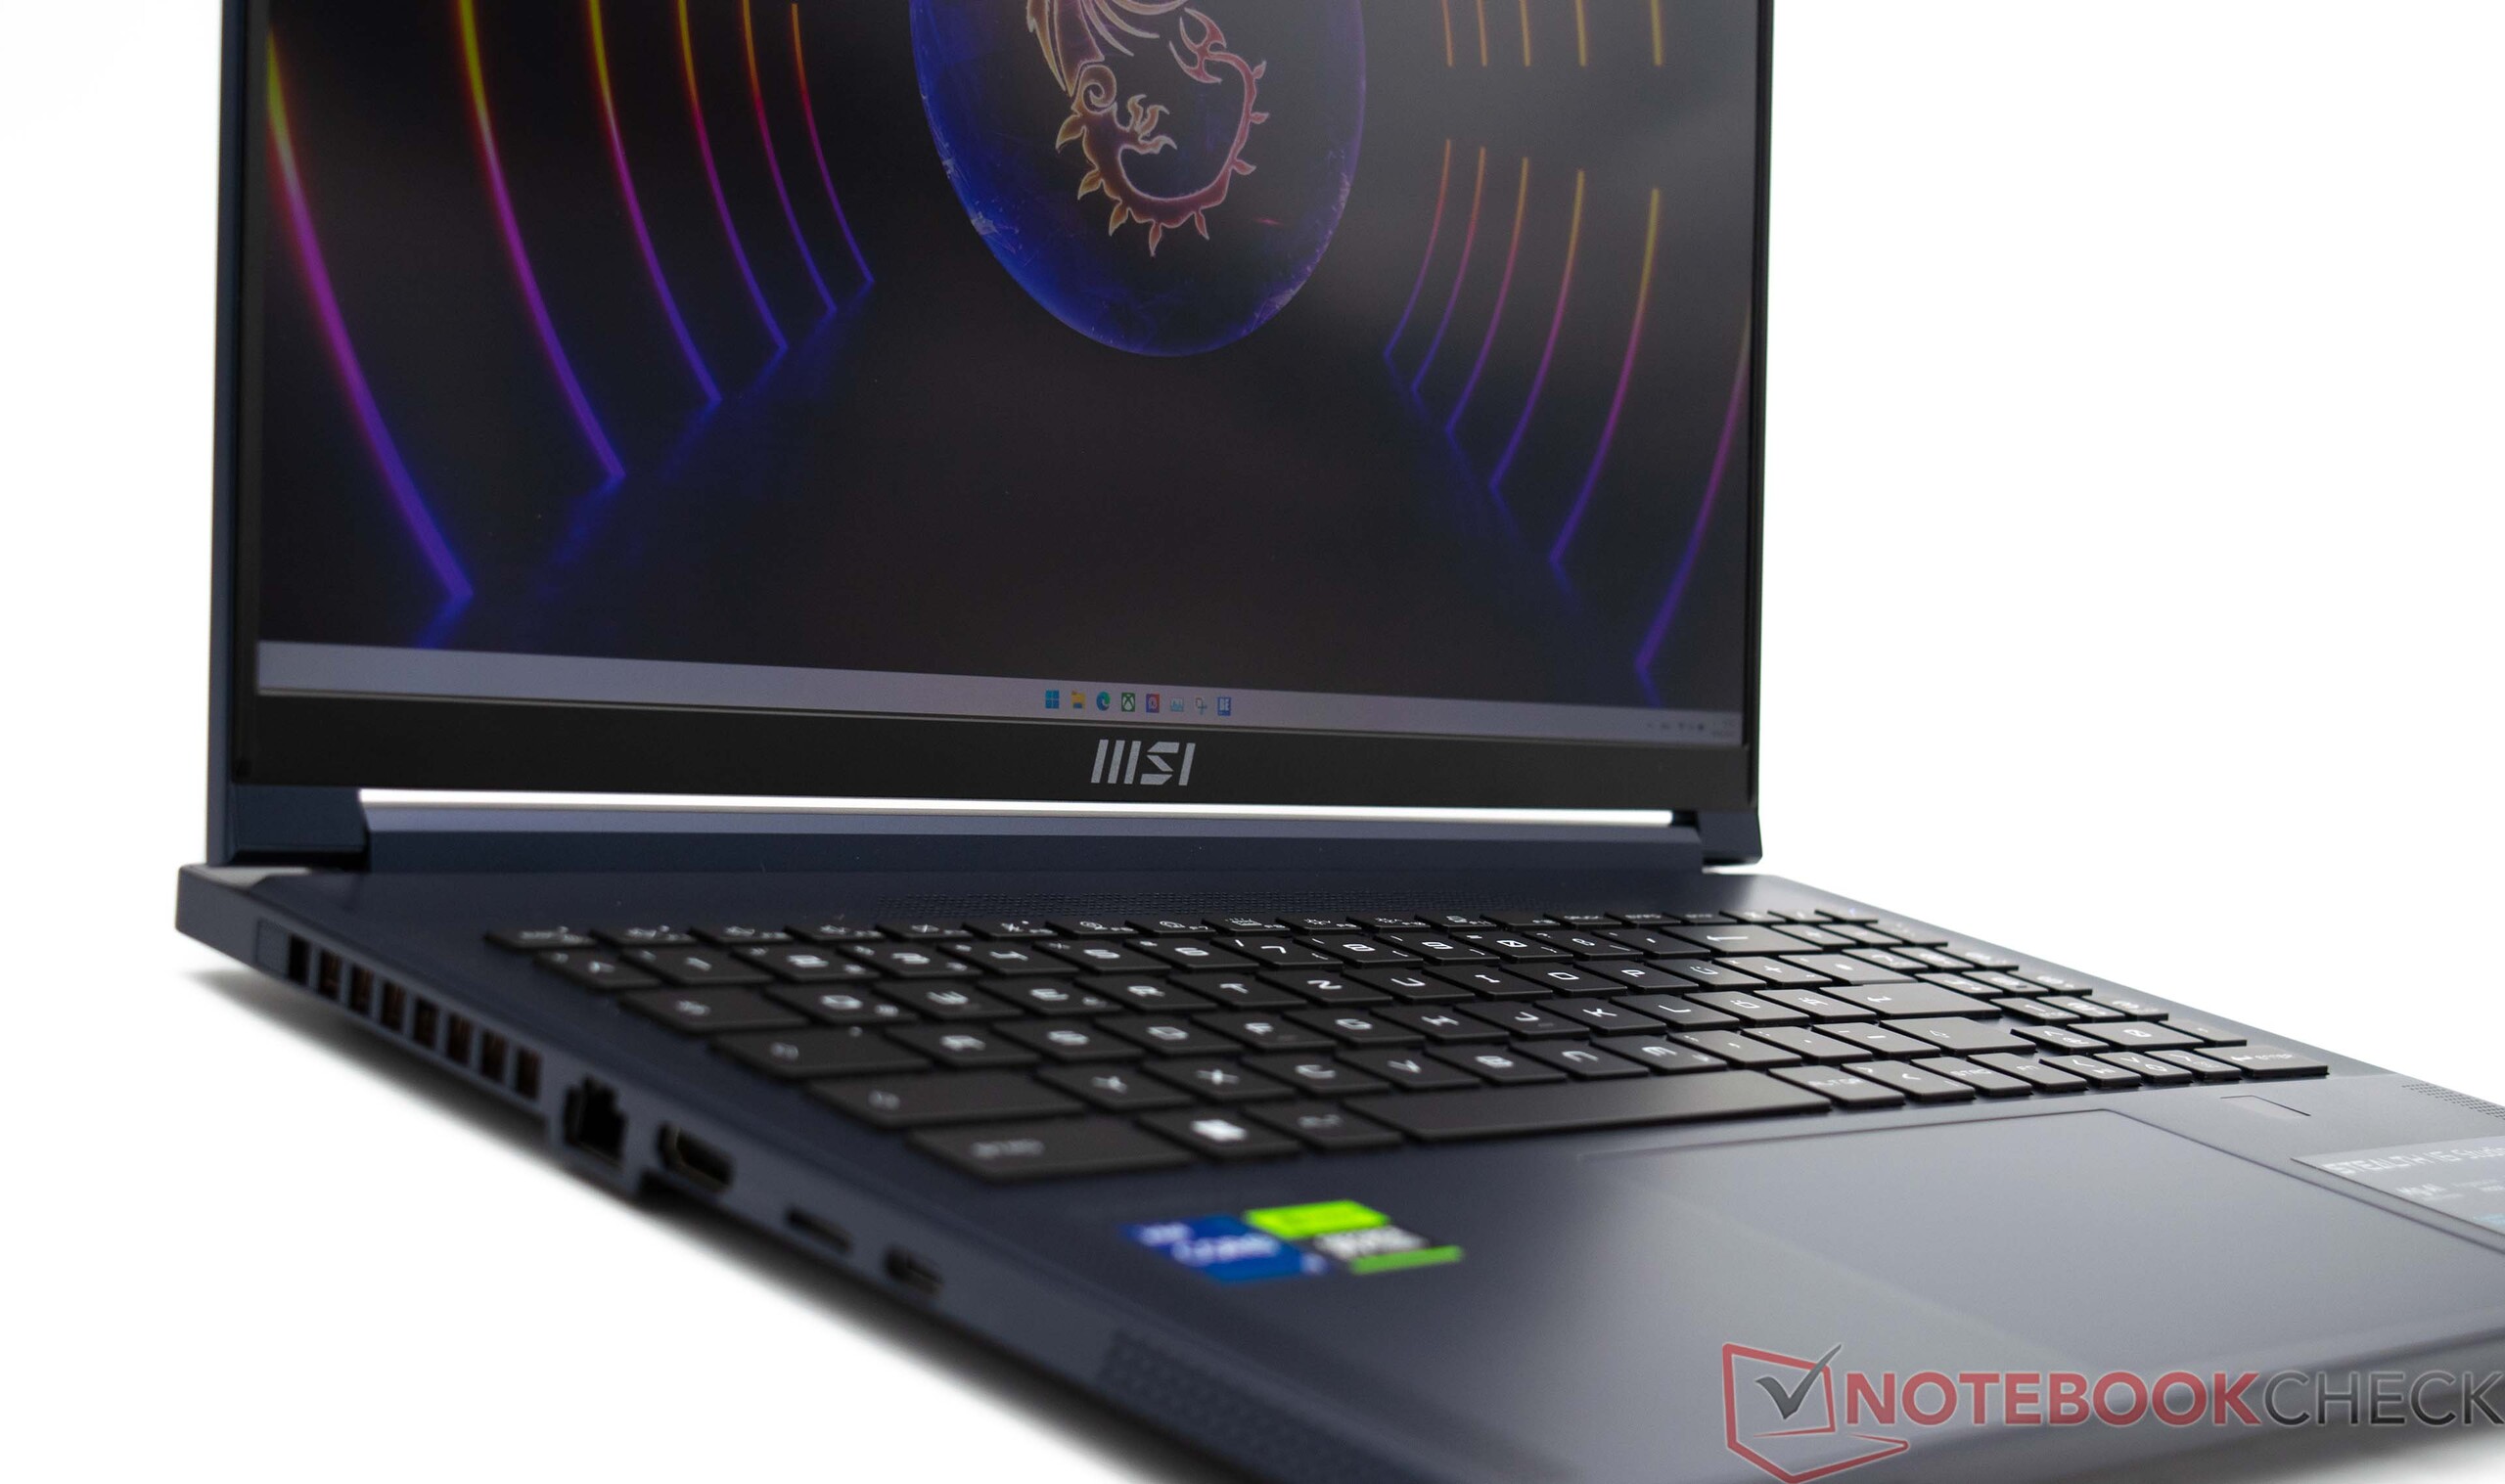
Características: despejado y con Thunderbolt 4
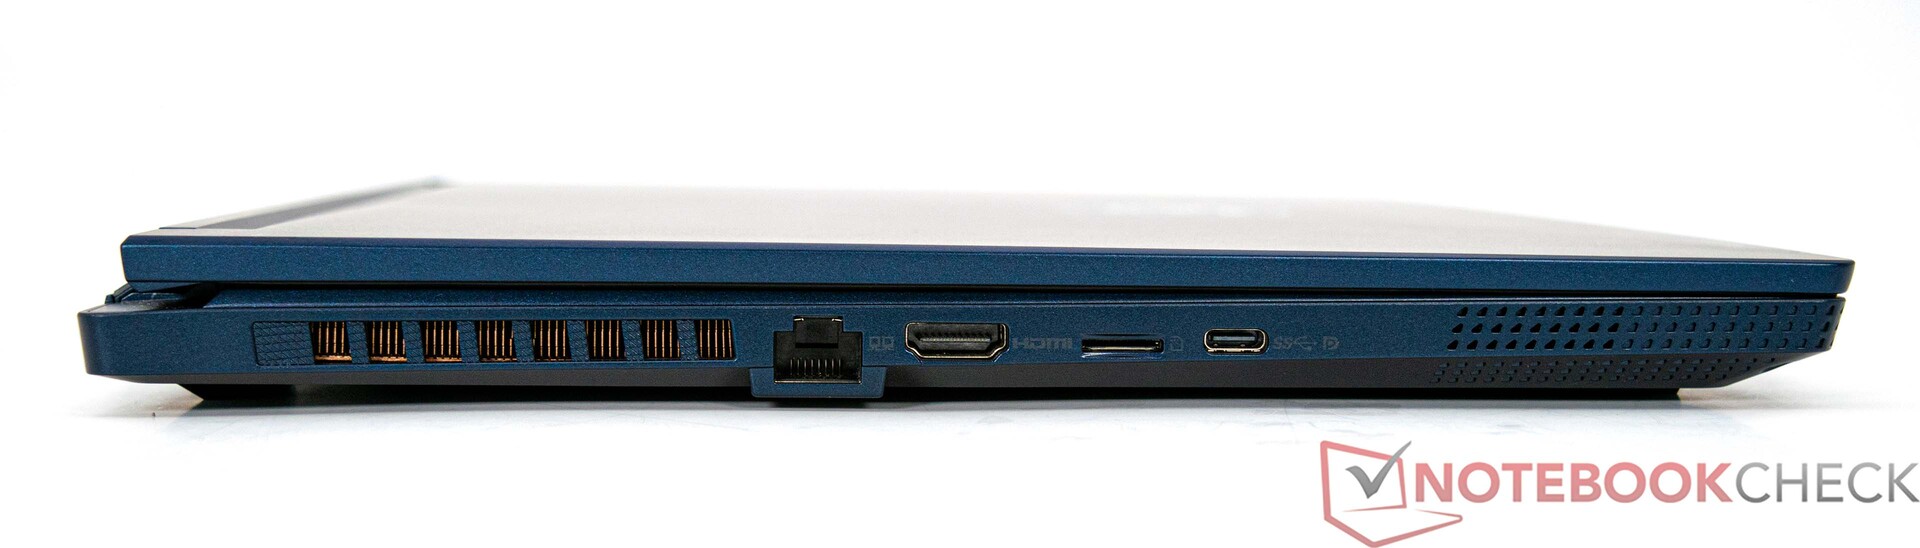
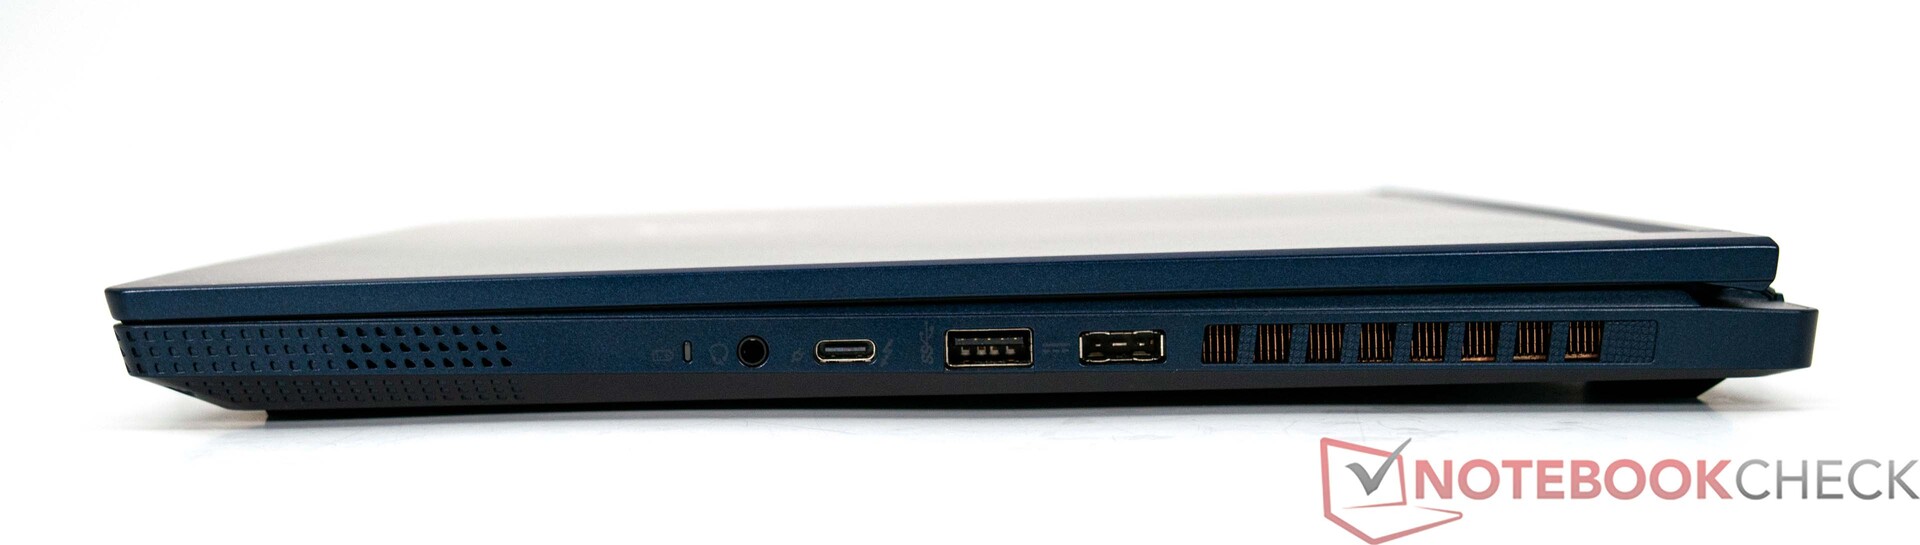
Desafortunadamente, el MSI Stealth 16 Studio A13VG no viene con una cantidad particularmente generosa de puertos. Sin embargo, las interfaces proporcionadas deberían ser suficientes para la mayoría de usuarios en situaciones cotidianas. Al menos se incluye un moderno puerto Thunderbolt 4 con Power Delivery (PD). Pero los usuarios están limitados a un único puerto USB-A. Los monitores externos pueden conectarse al portátil por HDMI o USB-C, lo que significa que pueden usarse hasta tres pantallas simultáneamente.
Lector de tarjetas SD
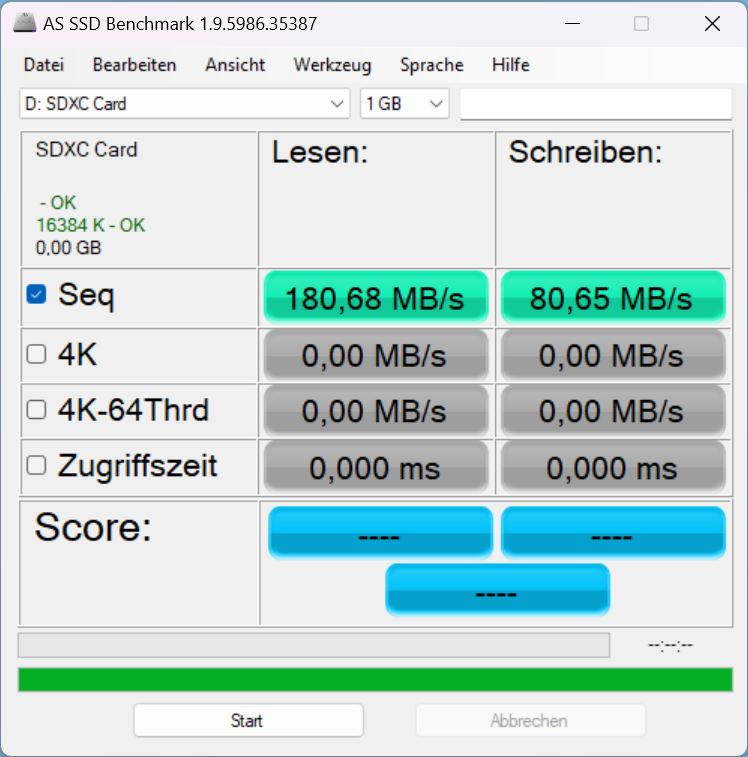
El MSI Stealth 16 Studio A13VG está equipado con un lector de tarjetas que admite tarjetas de memoria microSD. El lector de tarjetas es compatible con el rápido estándar UHS-II. En nuestras pruebas, registramos excelentes resultados utilizando nuestra tarjeta de referencia, la AV PRO microSD 128 GB V60. Sin embargo, la competencia de Asus y Gigabyte también son impresionantes y puntúan incluso mejor en el área de datos secuenciales.
| SD Card Reader | |
| average JPG Copy Test (av. of 3 runs) | |
| Gigabyte AERO 16 OLED BSF | |
| MSI Stealth 16 Studio A13VG | |
| Media de la clase Gaming (20.9 - 210, n=54, últimos 2 años) | |
| Asus ROG Flow X16 GV601V | |
| Corsair Voyager a1600 (AV Pro SD microSD 128 GB V60) | |
| Acer Nitro 16 AN16-41 (AV Pro SD microSD 128 GB V60) | |
| Medion Erazer Major X20 (AV PRO microSD 128 GB V60) | |
| maximum AS SSD Seq Read Test (1GB) | |
| Asus ROG Flow X16 GV601V | |
| Gigabyte AERO 16 OLED BSF | |
| MSI Stealth 16 Studio A13VG | |
| Media de la clase Gaming (25.5 - 261, n=51, últimos 2 años) | |
| Corsair Voyager a1600 (AV Pro SD microSD 128 GB V60) | |
| Medion Erazer Major X20 (AV PRO microSD 128 GB V60) | |
| Acer Nitro 16 AN16-41 (AV Pro SD microSD 128 GB V60) | |
Comunicación
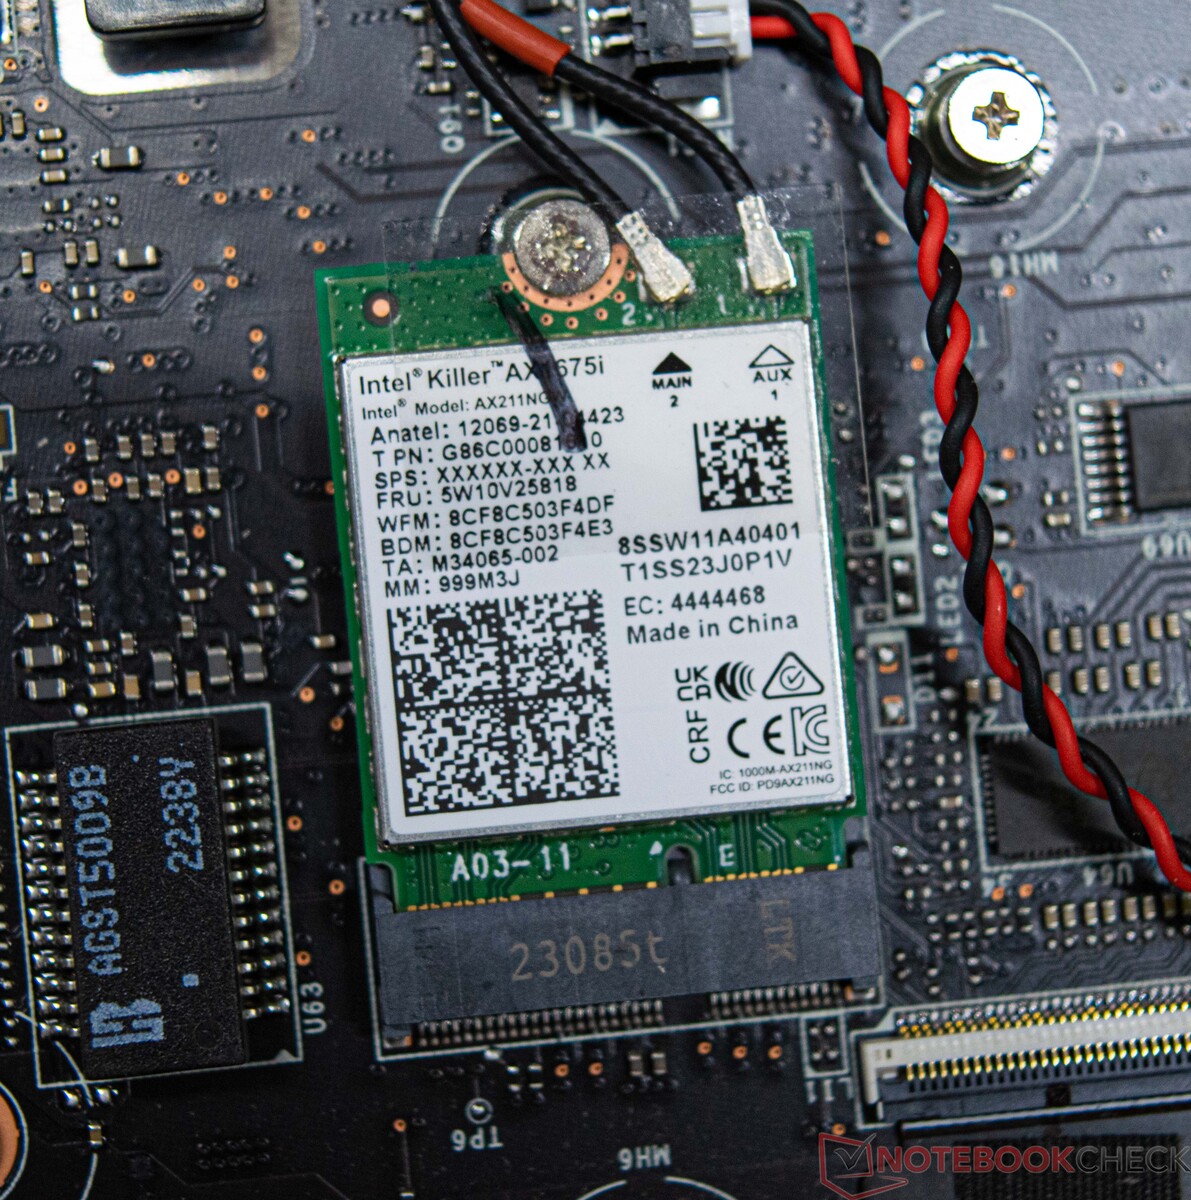
Esencialmente, el módulo Wi-Fi instalado rinde decentemente. Comparado con sus competidores, el MSI Stealth 16 Studio A13VG no puede imponerse del todo, aunque nuestro dispositivo de pruebas no tiene nada que ocultar en términos del rendimiento que demostró aquí. Para ello, utilizamos nuestro router de pruebas Asus ROG Rapture GT-AXE11000. Alternativamente, el MSI Stealth 16 Studio A13VG también ofrece un puerto ethernet. Velocidades de transferencia de hasta 2.5 GBit/s son posibles.
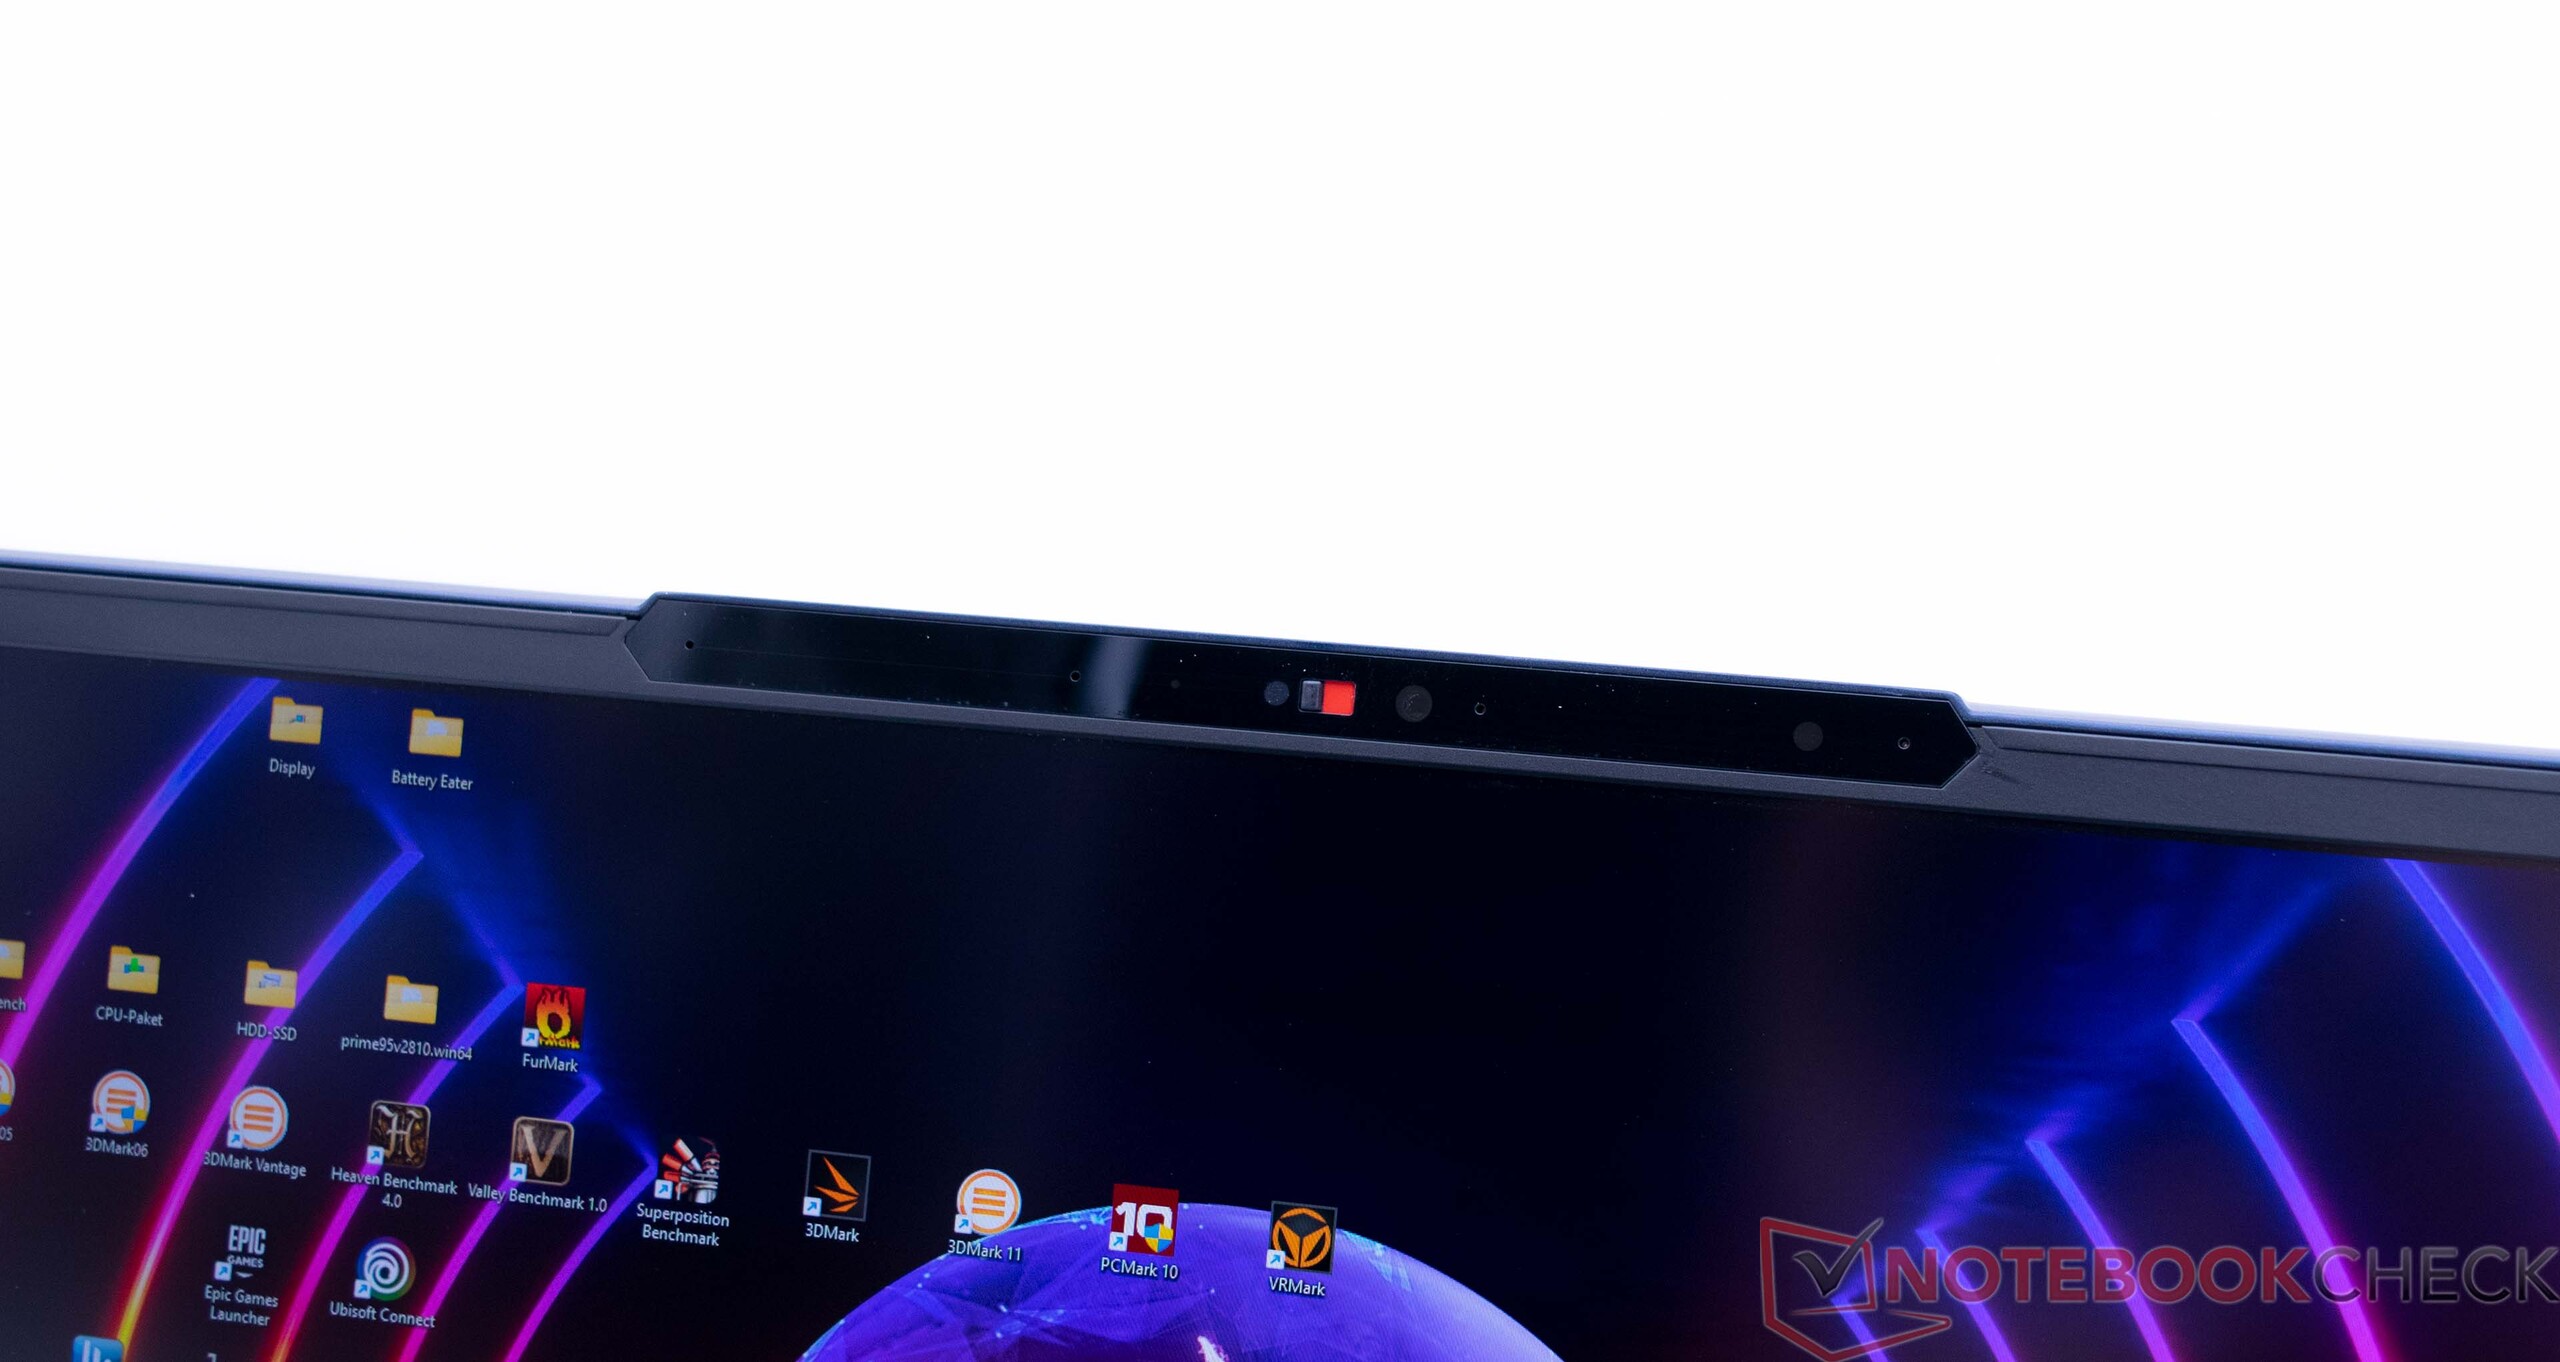
Cámara web
El MSI Stealth 16 Studio A13VG viene con una webcam FHD que es adecuada para videollamadas sencillas. Se restan algunos puntos debido a la baja precisión del color.


Seguridad
El sensor de huellas dactilares integrado del MSI Stealth 16 Studio A13VG hace un buen trabajo y asegura una autenticación del sistema sin complicaciones.
Accesorios
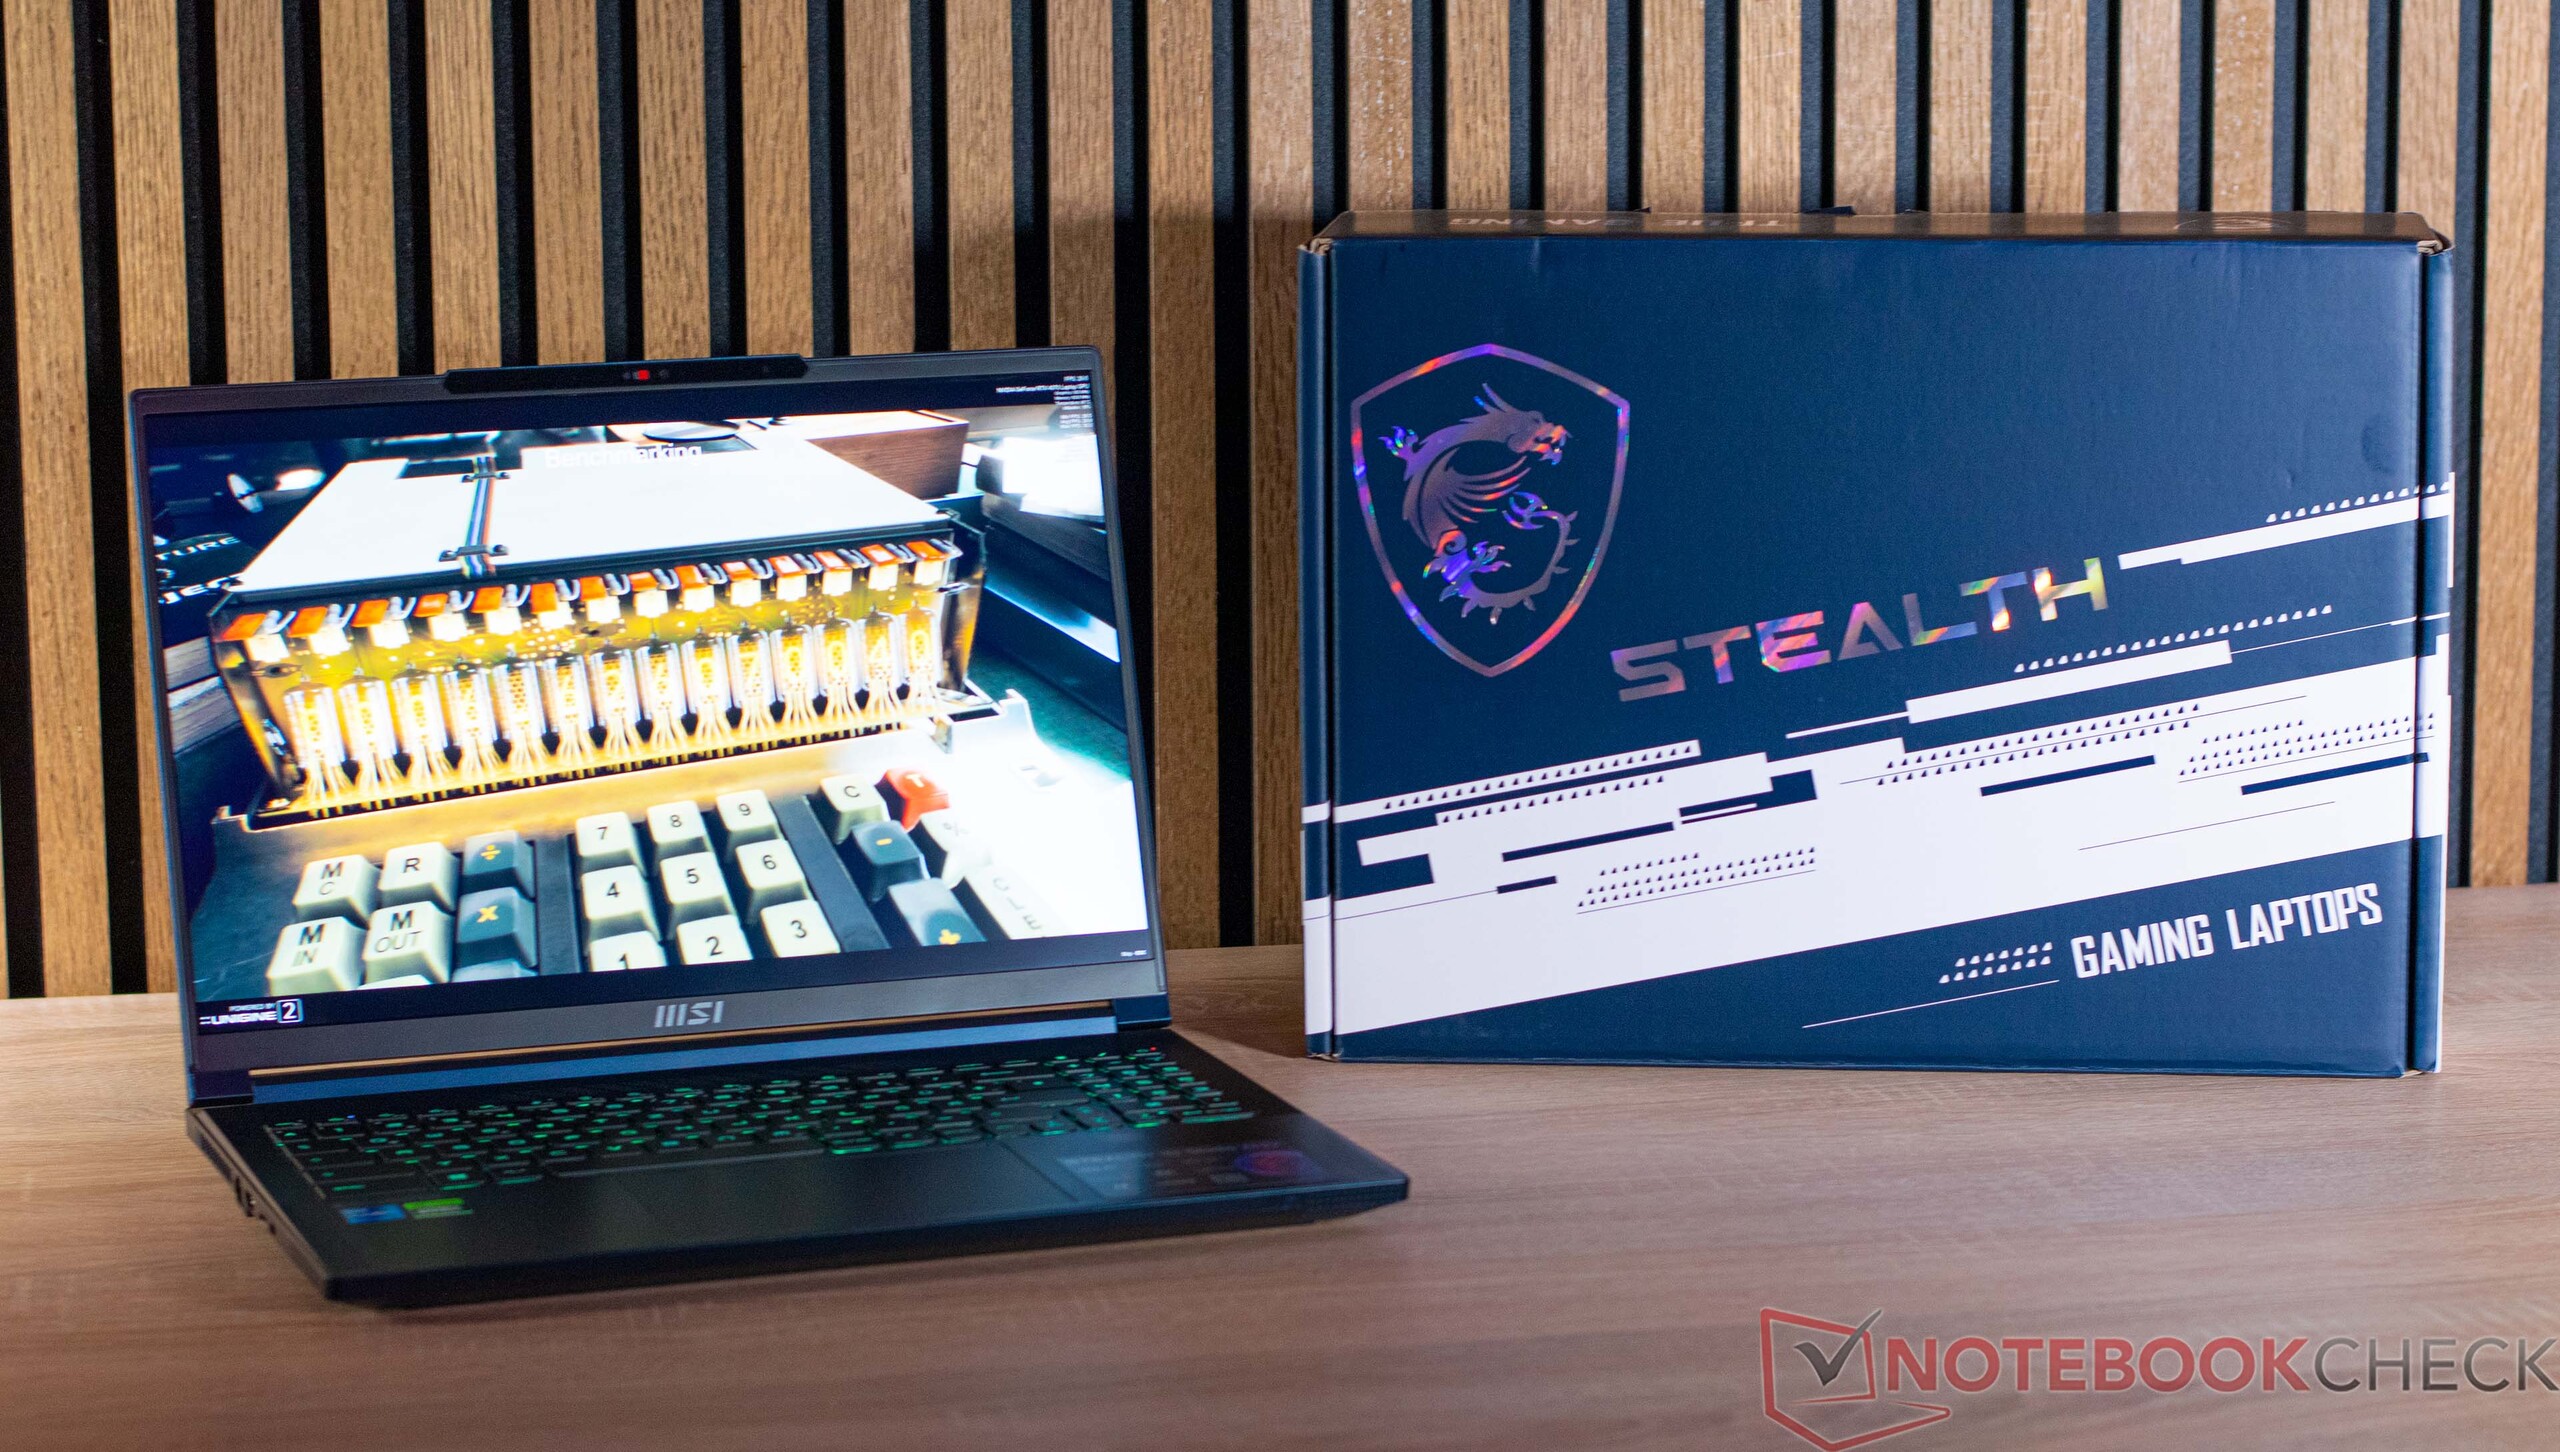
En la caja se incluye, además del propio dispositivo, una fuente de alimentación de 240 vatios y la documentación obligatoria.
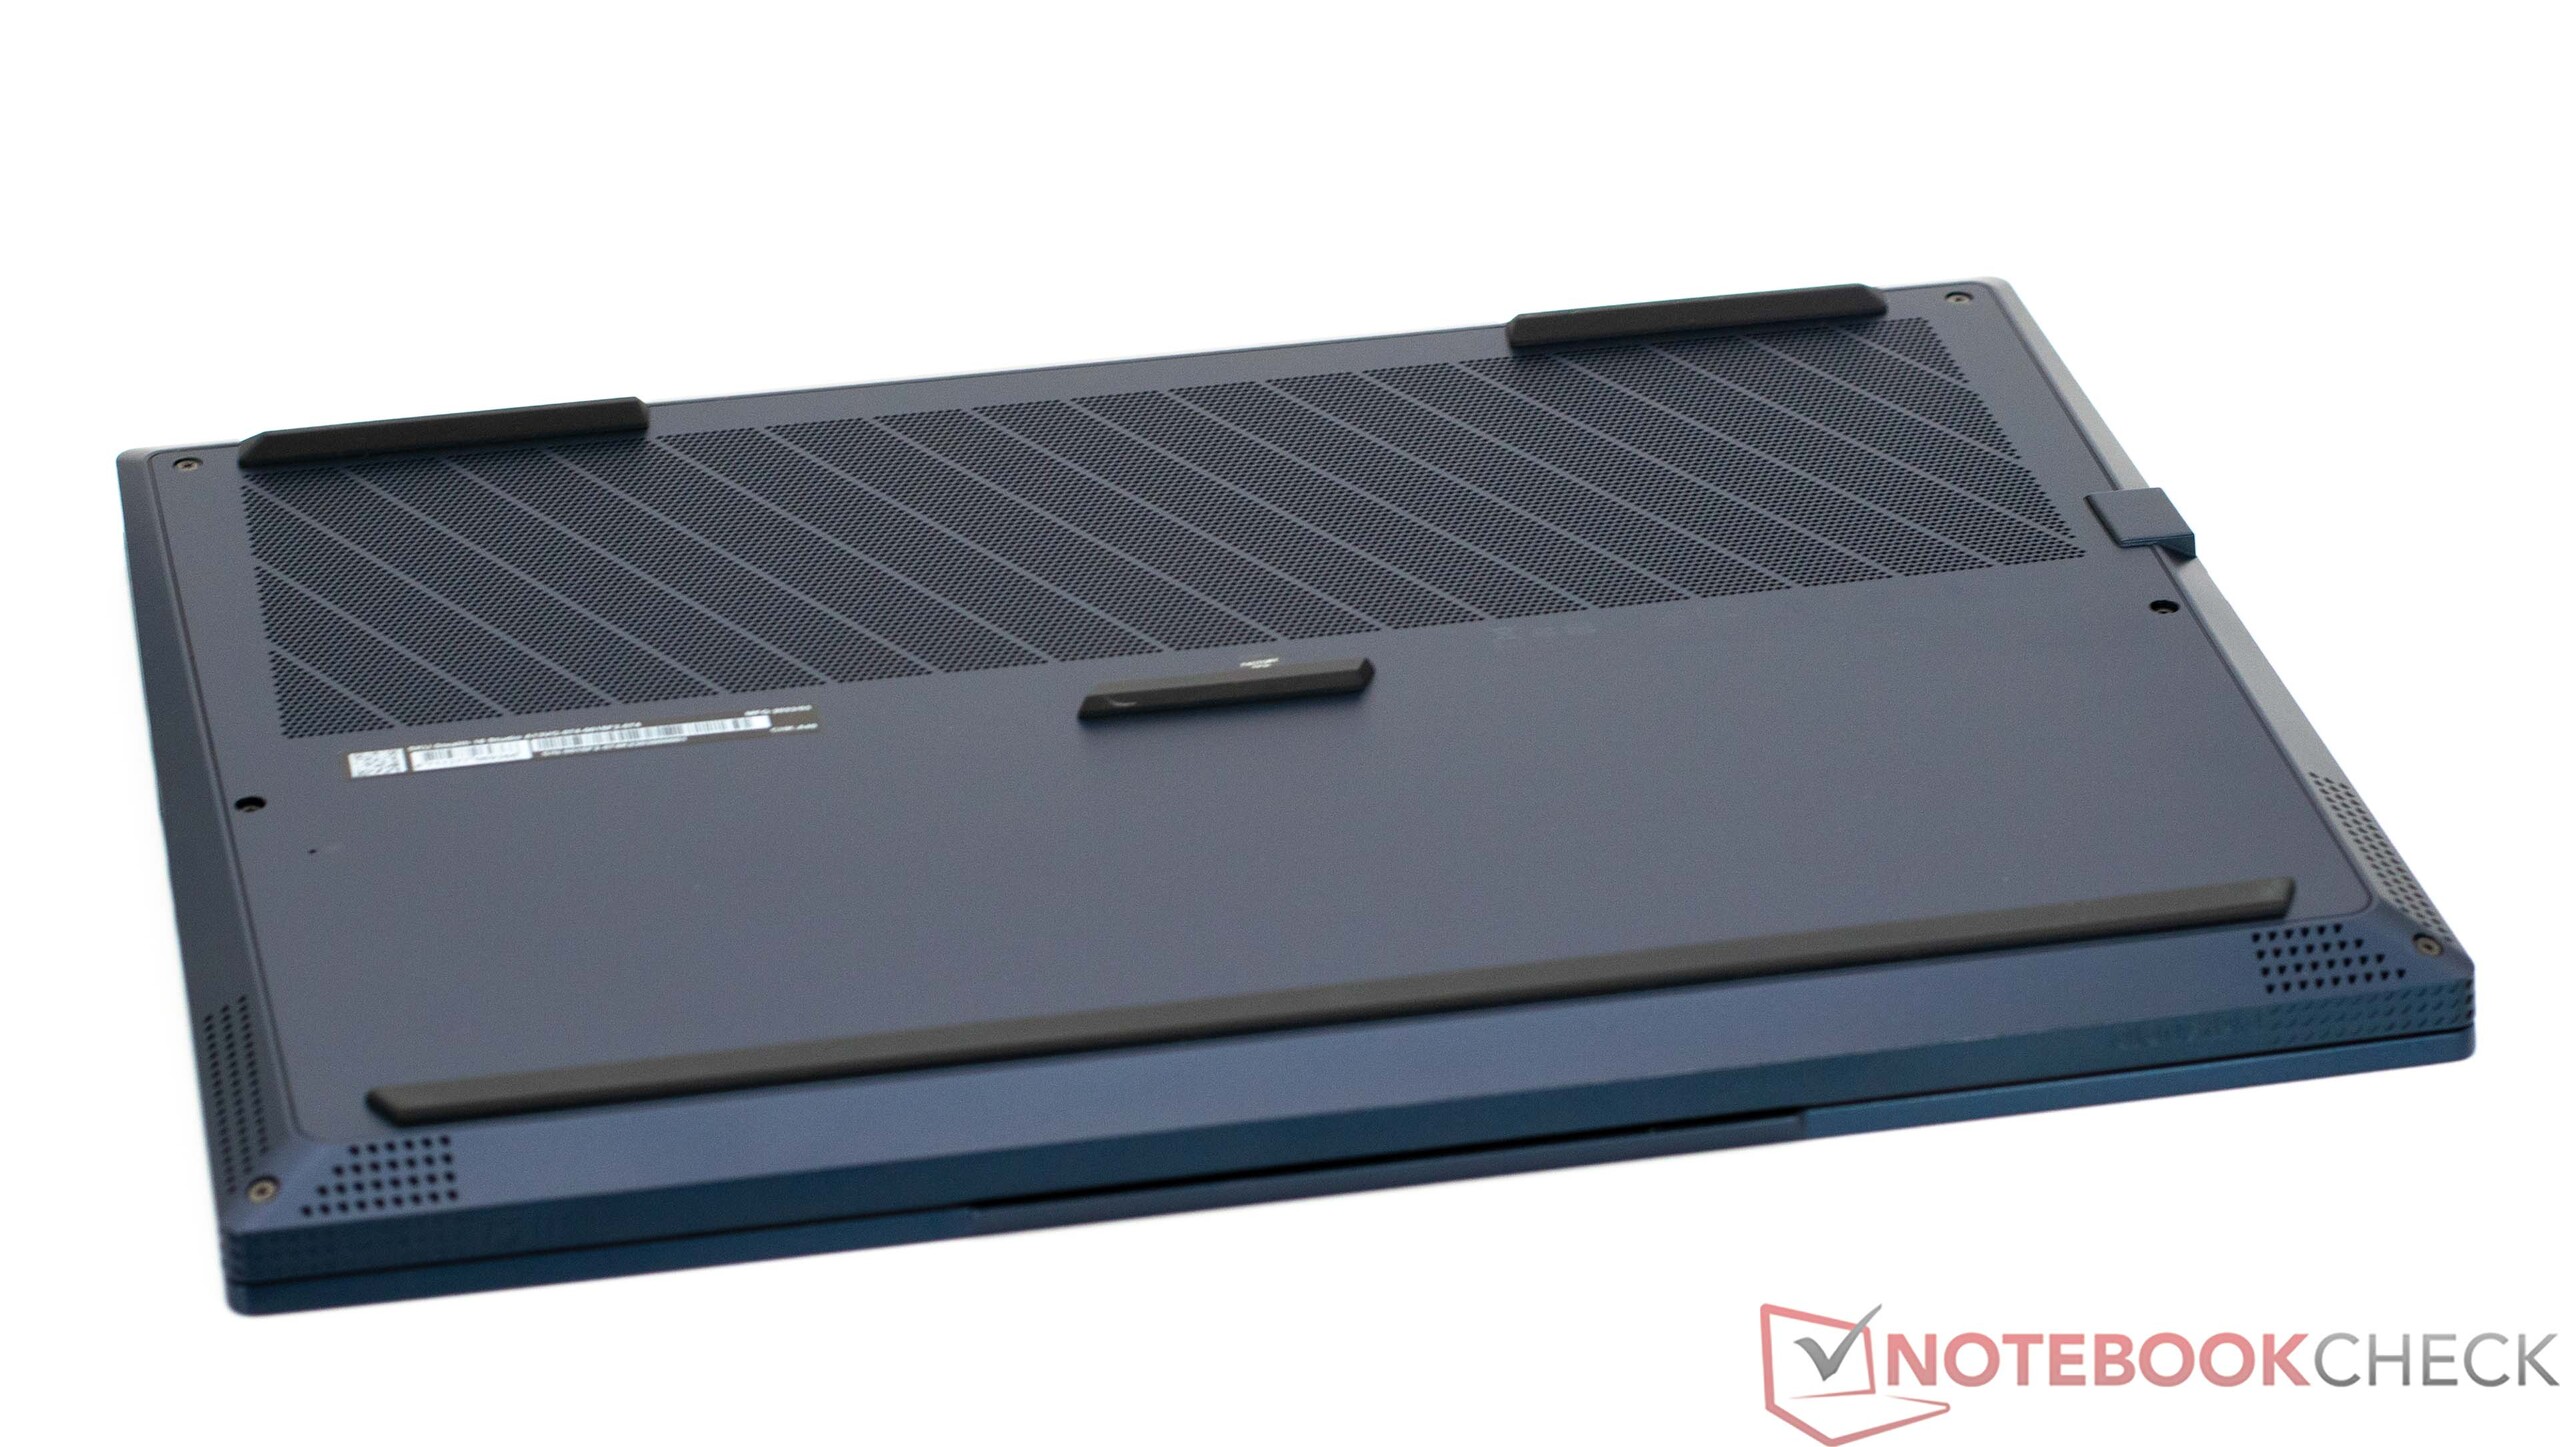
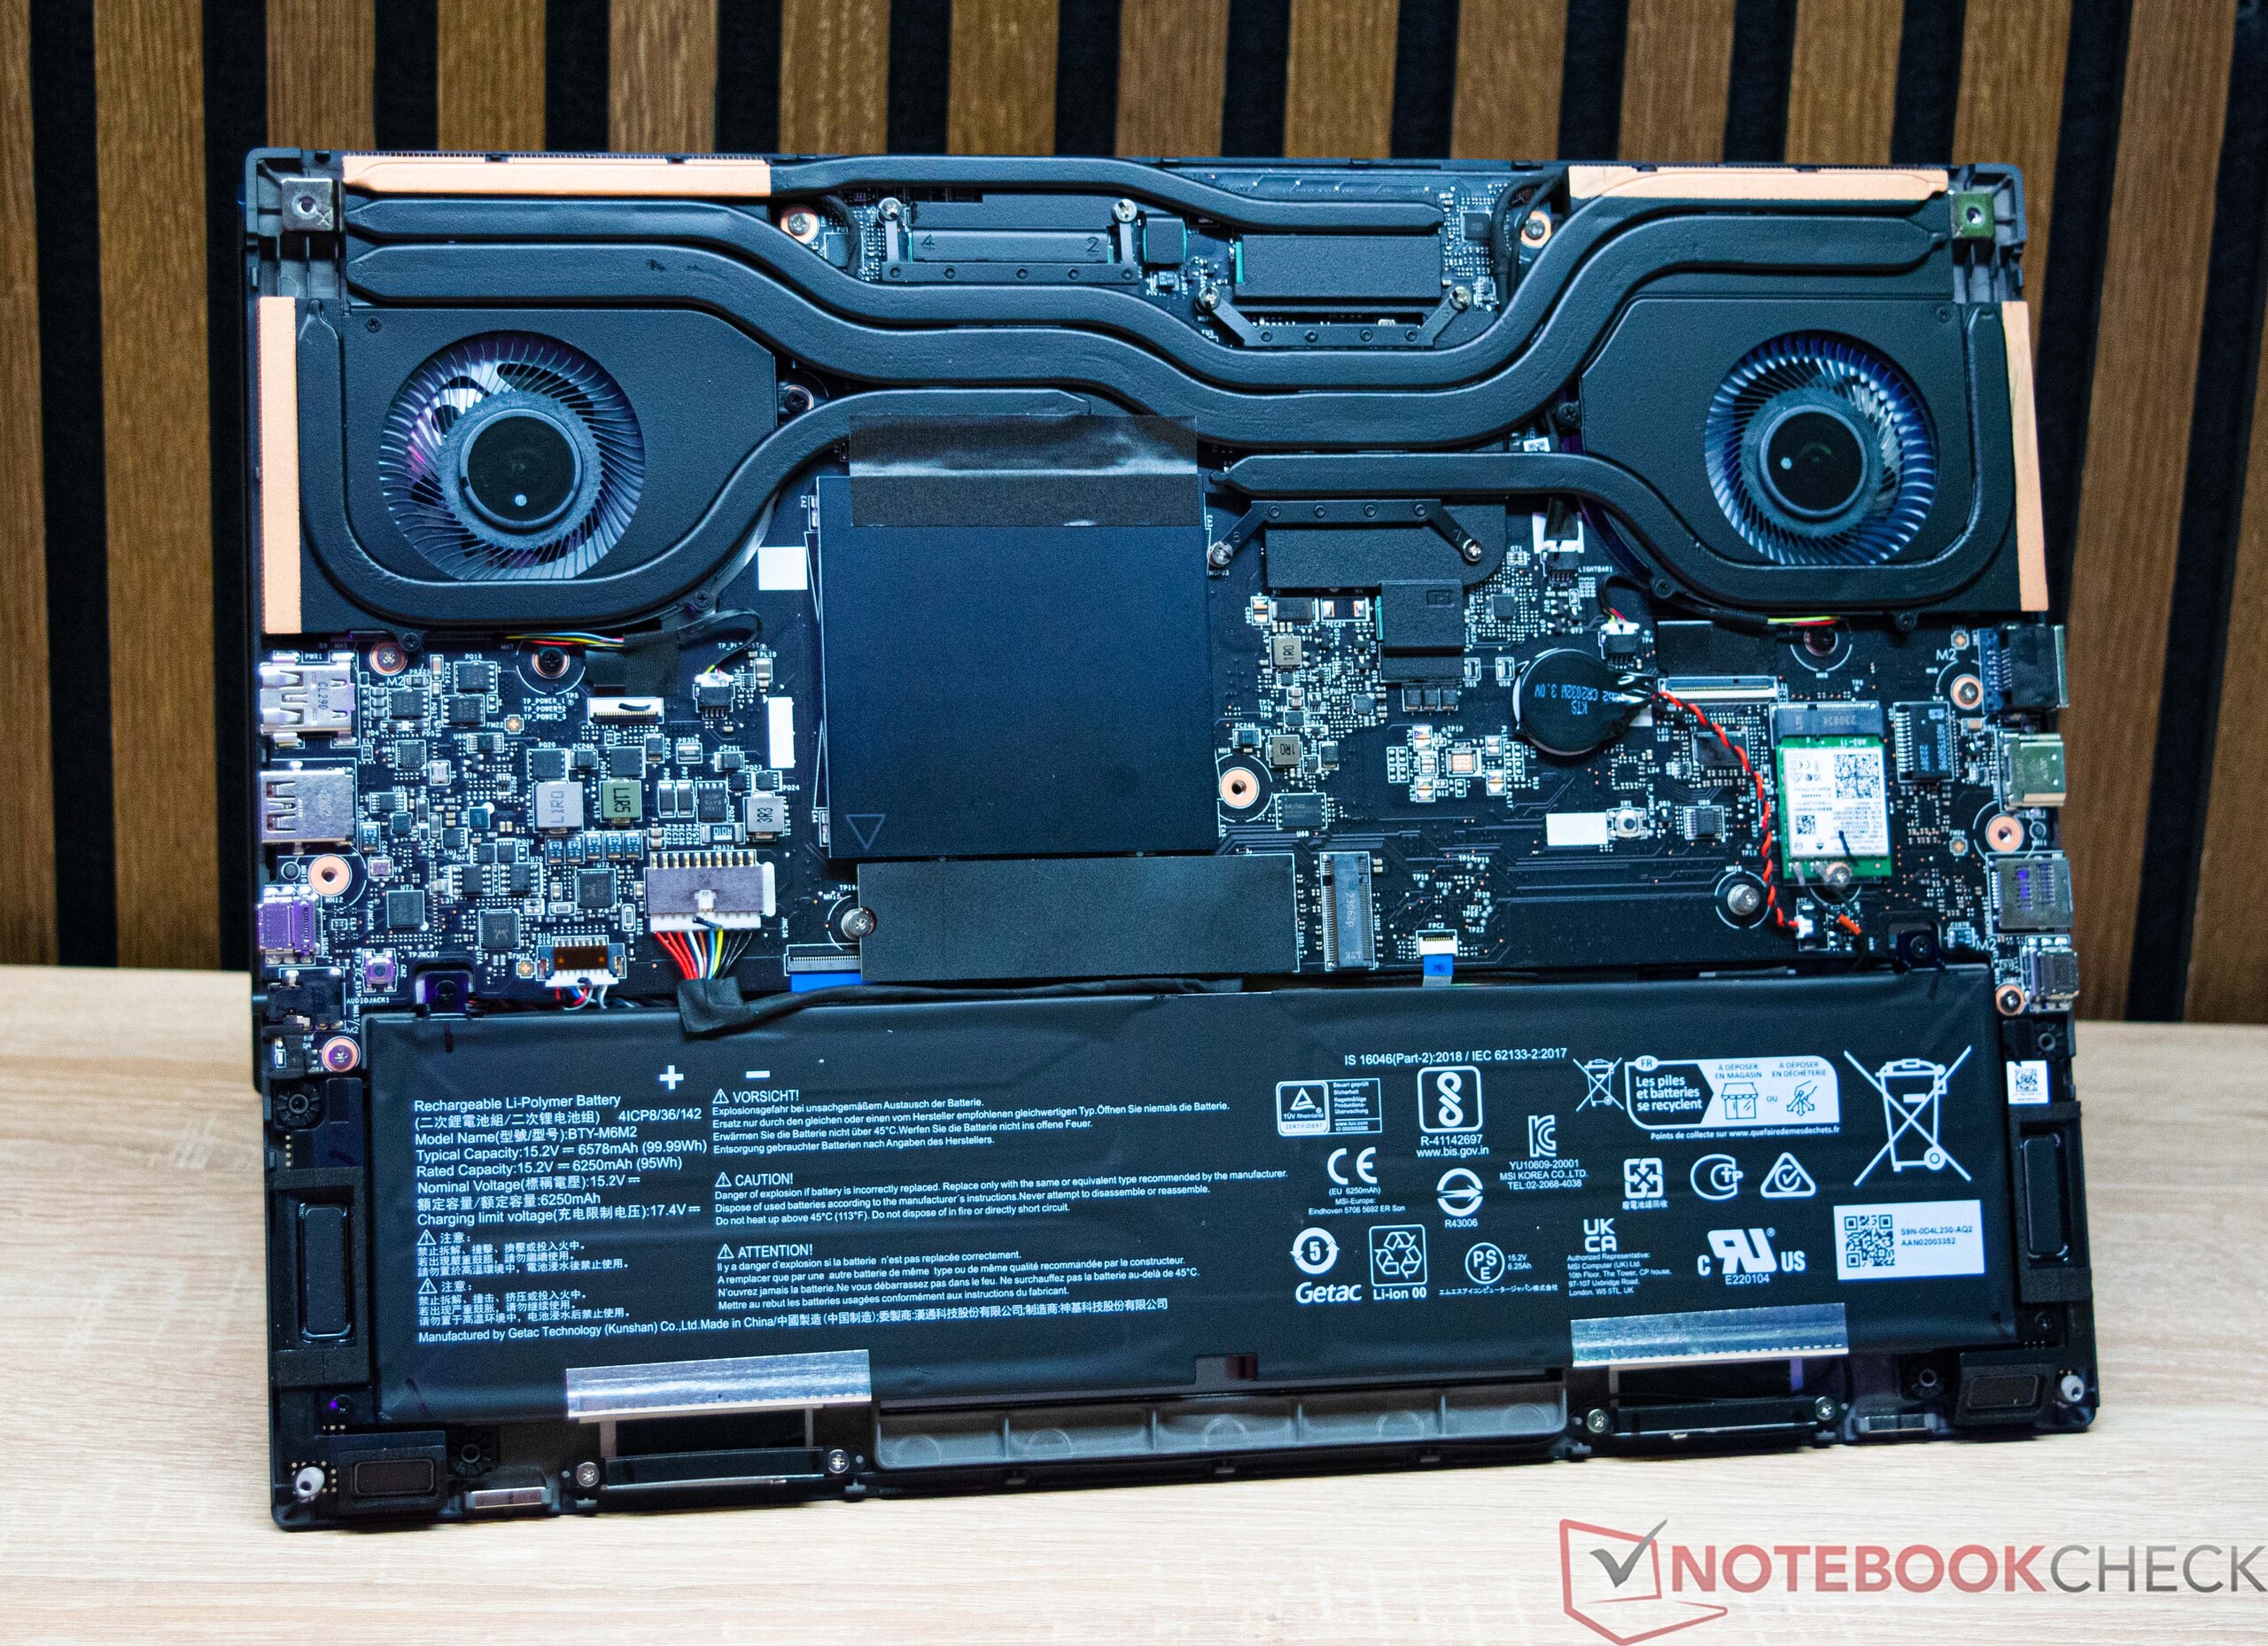
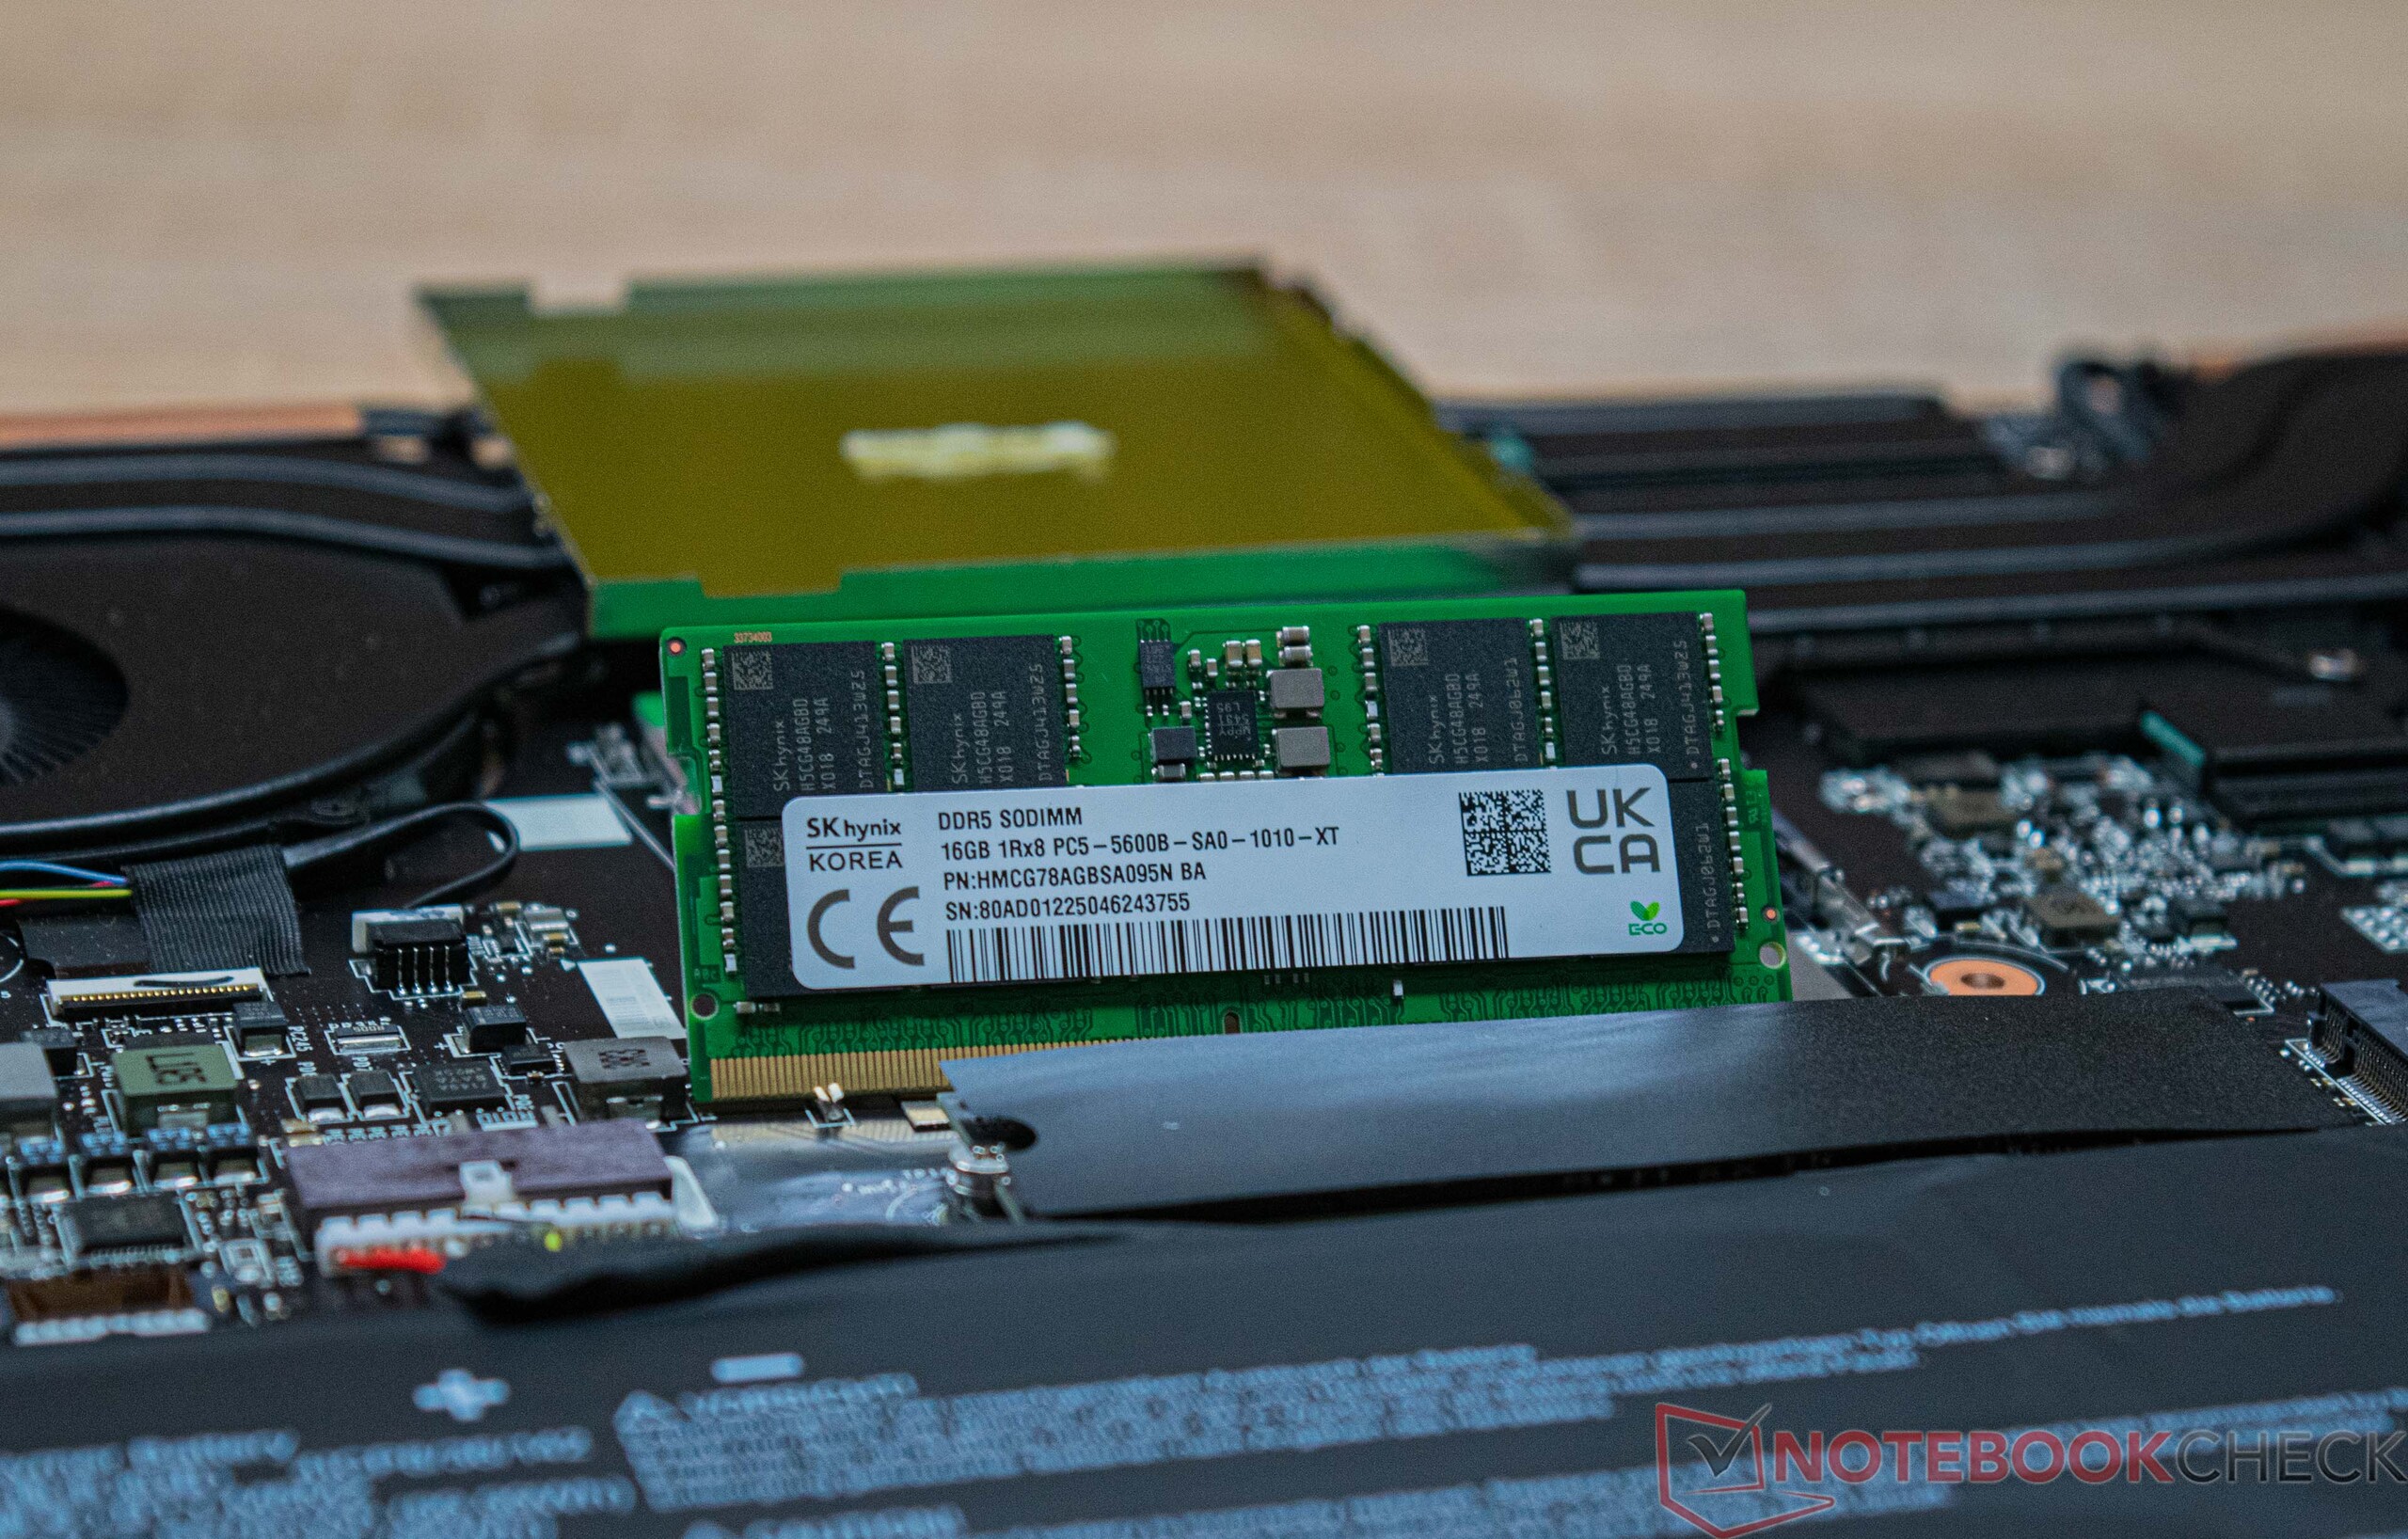
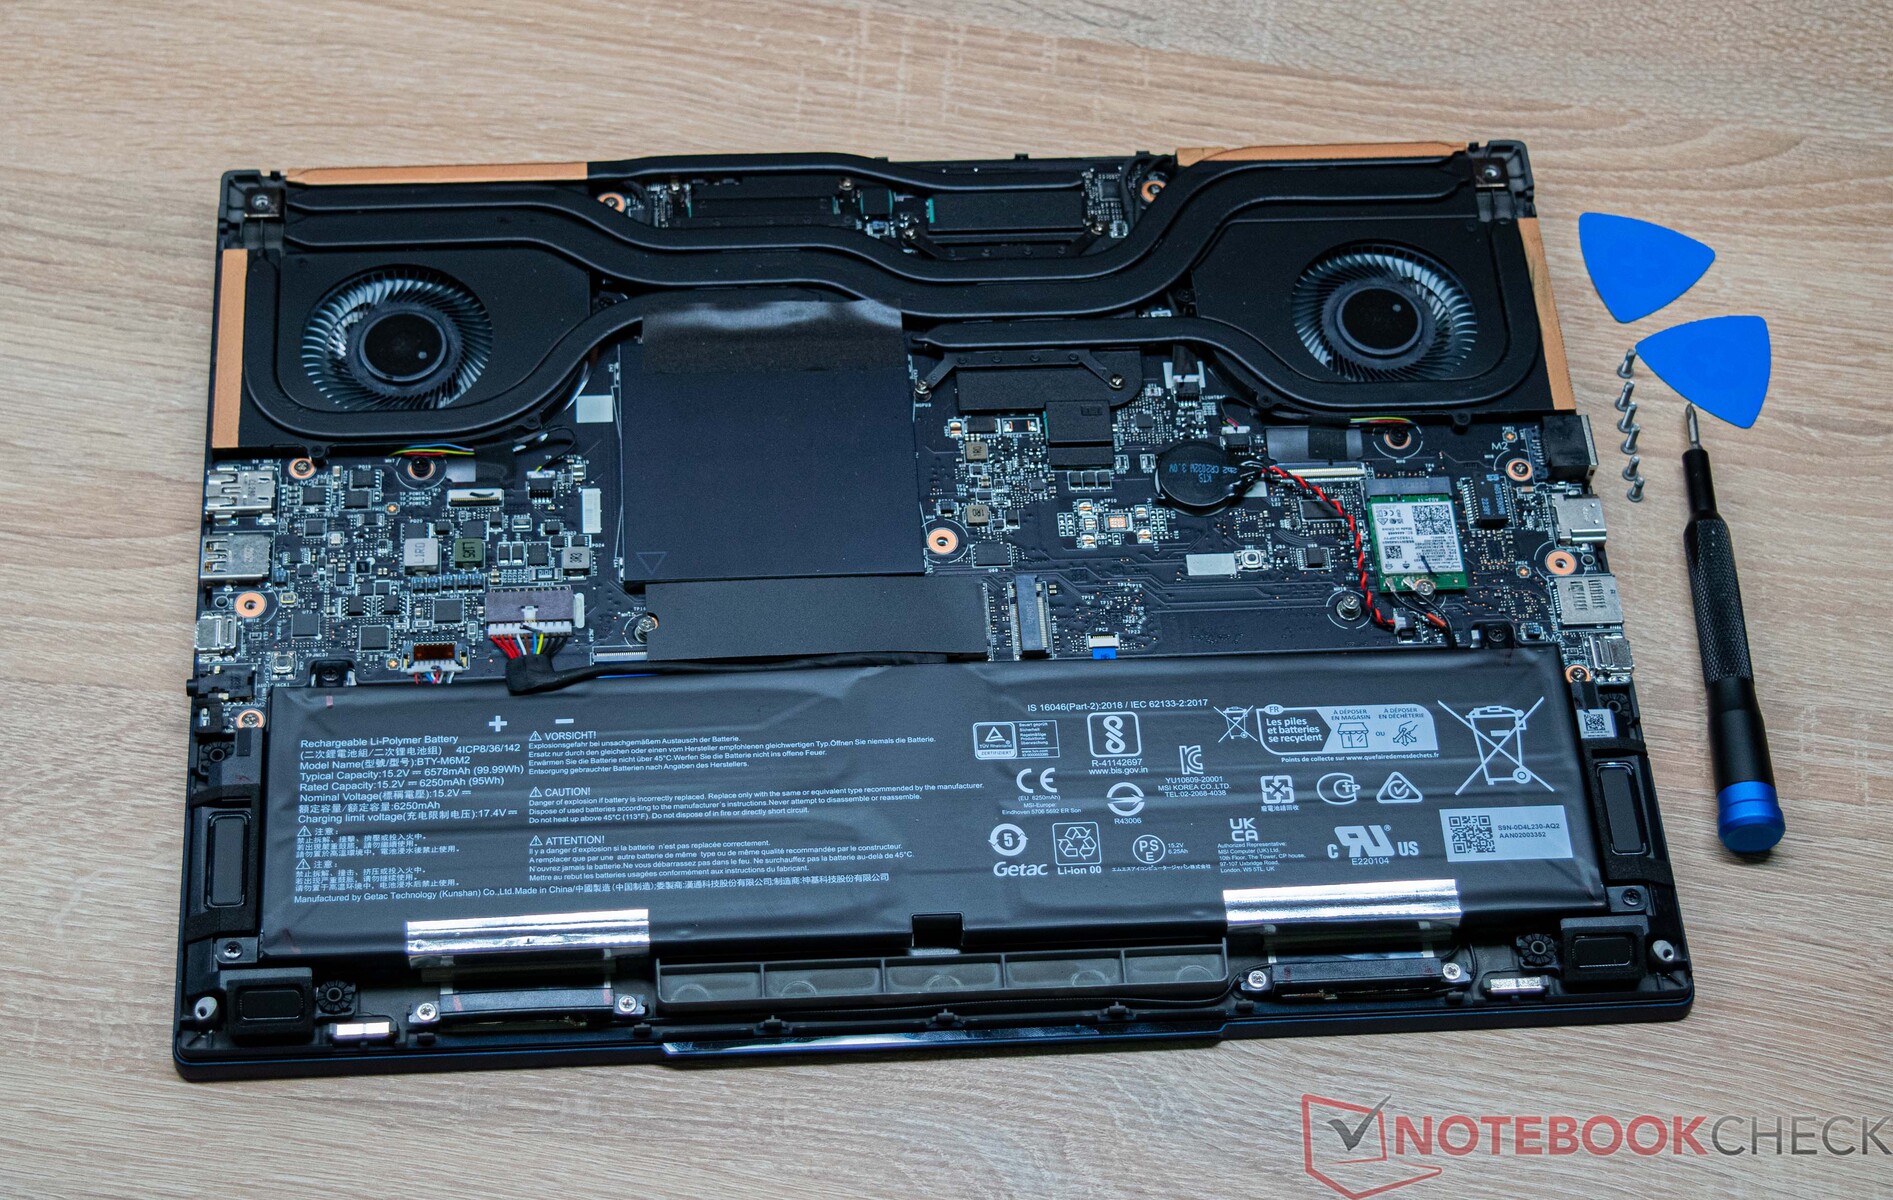
Mantenimiento
Es posible realizar tareas de mantenimiento en el MSI Stealth 16 Studio A13VG. Sin embargo, para ello es necesario desmontar la placa base, que está sujeta por una serie de tornillos. Después de quitar los tornillos, la placa base permanece firmemente unida a la base. Sin embargo, con las herramientas adecuadas, pudimos retirar la placa base. No obstante, se recomienda precaución para evitar daños. En principio, se pueden intercambiar o ampliar componentes como la RAM o el dispositivo de almacenamiento masivo, ya que hay disponible una ranura M.2 2280 adicional. Del mismo modo, el Wi-Fi no es fijo y también se puede cambiar o sustituir.
Garantía
El MSI Stealth 16 Studio A13VG viene con una garantía de 24 meses que incluye servicio de recogida y devolución.
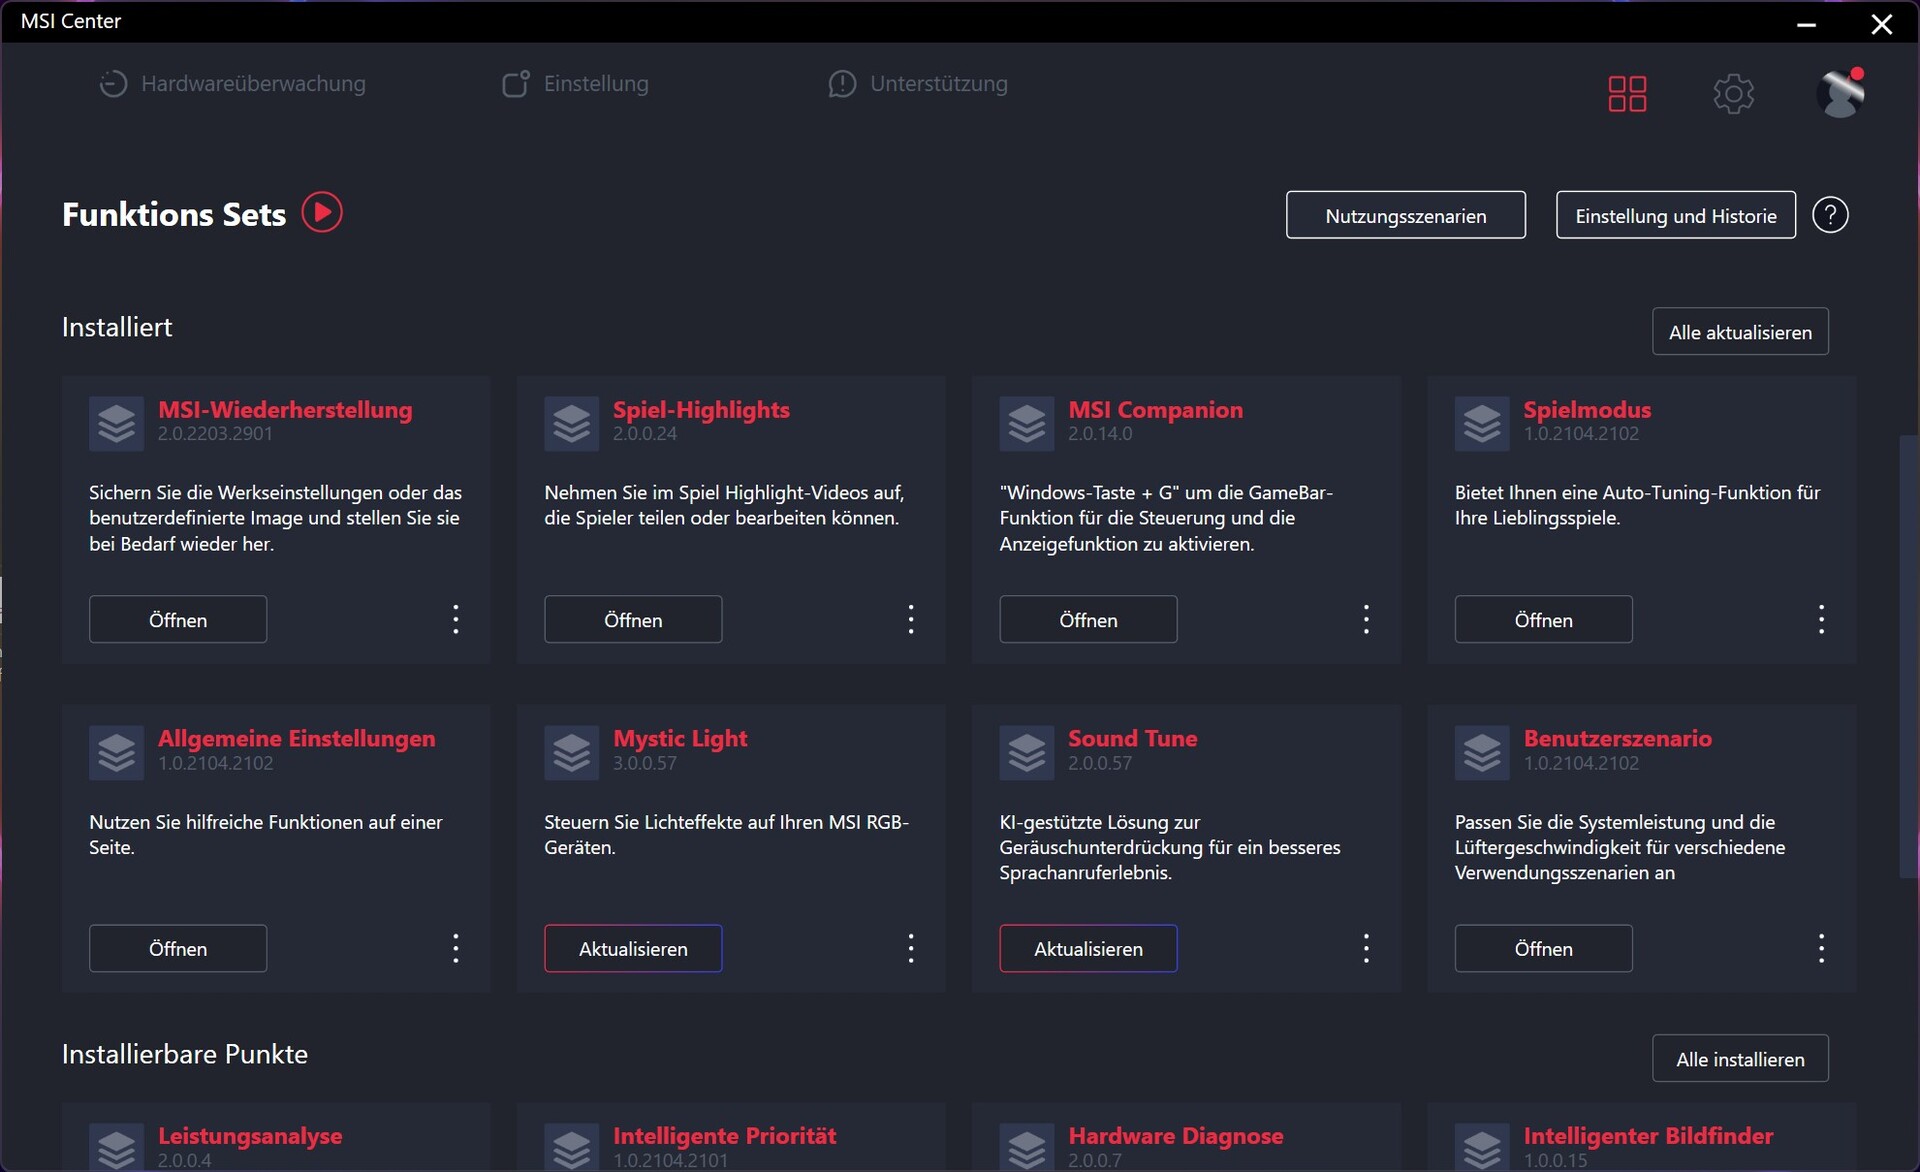
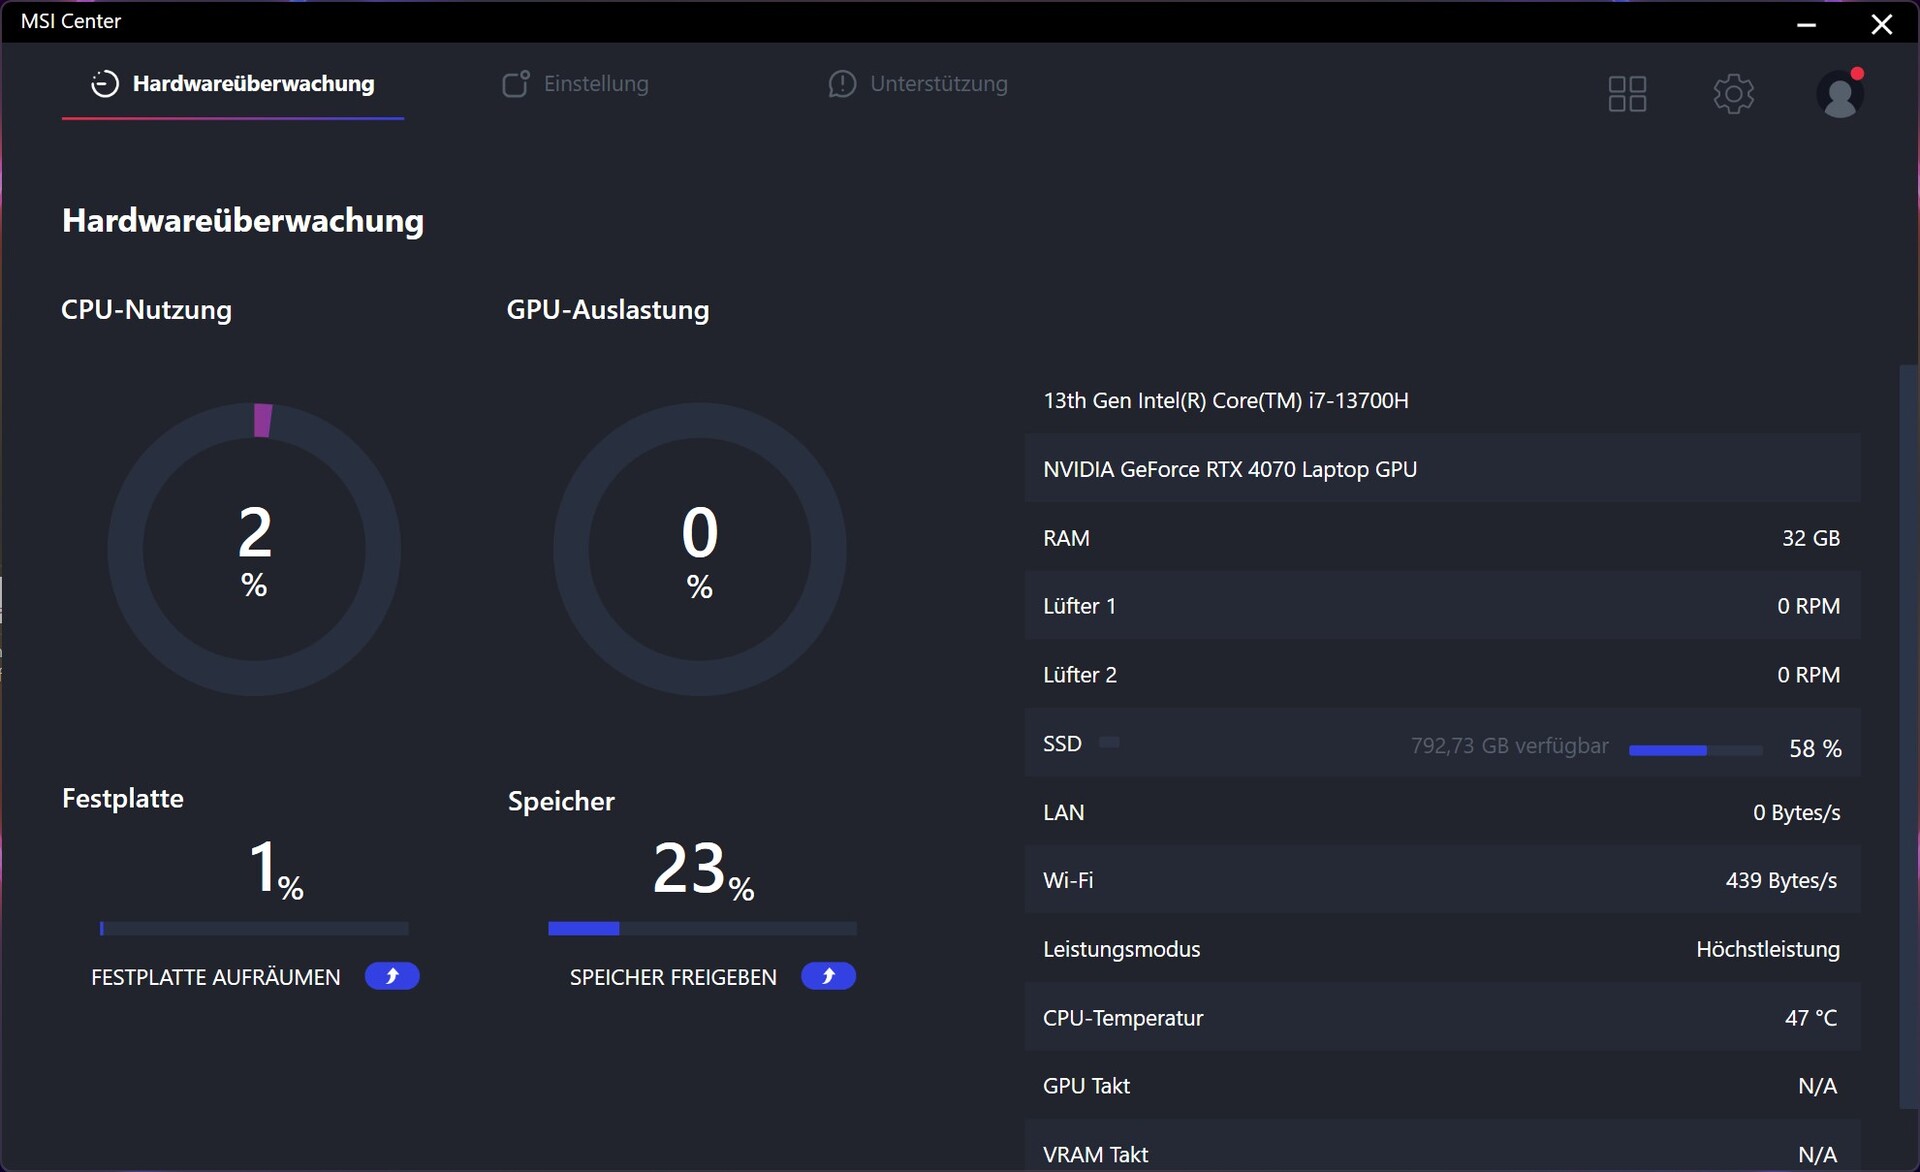
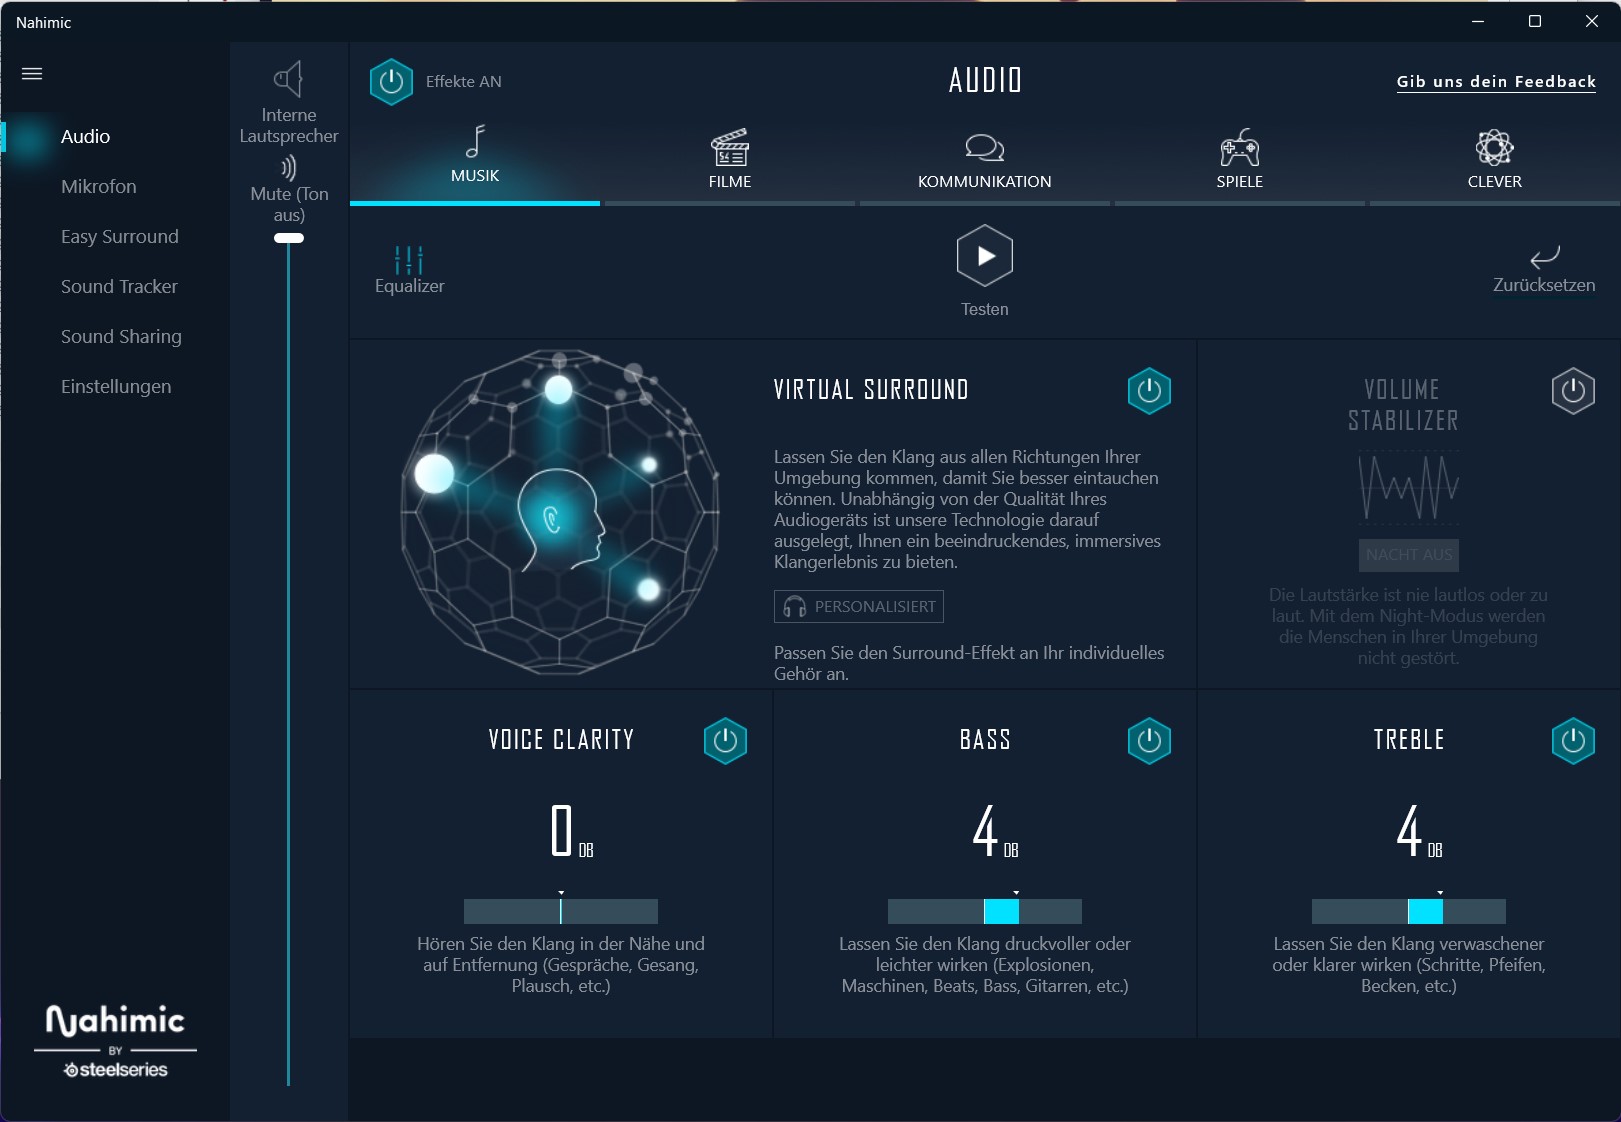
Software - MSI Center es su oficina central
Con MSI Center, el fabricante tiene una herramienta adecuada para controlar y monitorizar el MSI Stealth 16 Studio A13VG. En las pruebas, no encontramos ningún problema usando MSI Center. Su uso permite al usuario regular el rendimiento del portatil que, entre otras cosas, influye mucho en la cantidad de ruido de fondo. Tambien hay claras diferencias, tambien desde el punto de vista del rendimiento, debido a los diferentes limites de potencia en los distintos modos.
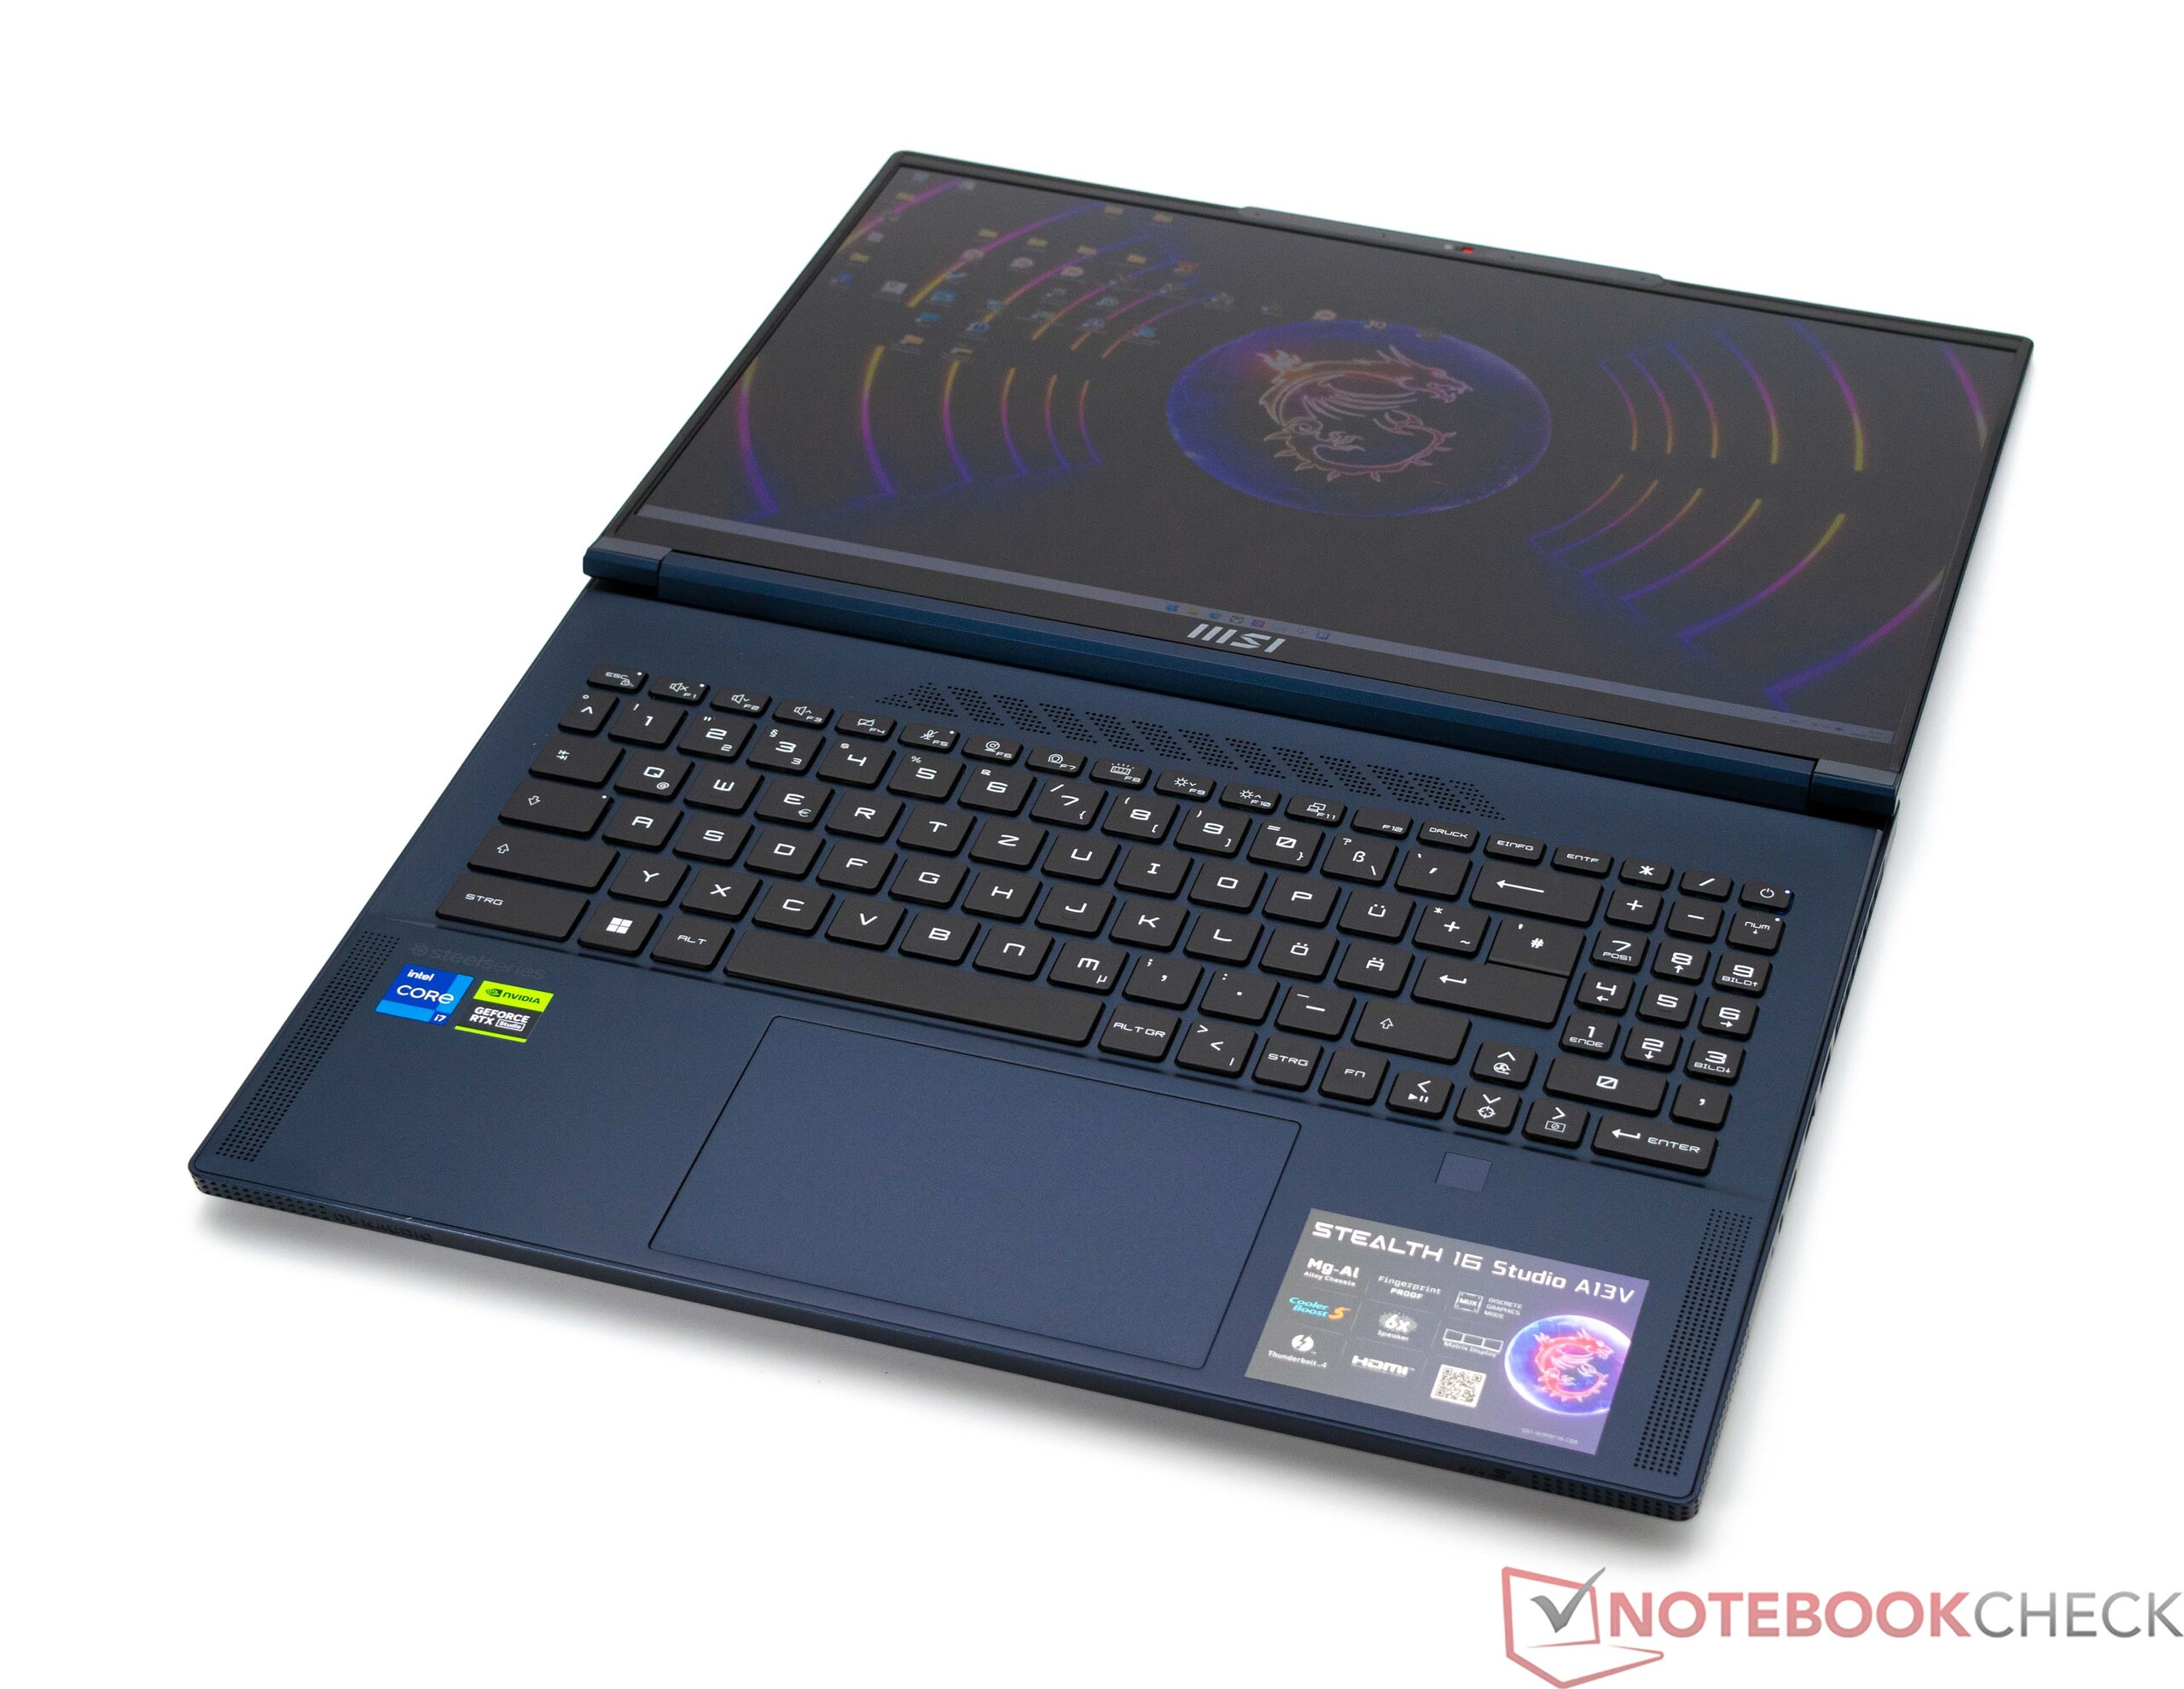
Dispositivos de entrada: diseño familiar y uso cotidiano agradable
Teclado
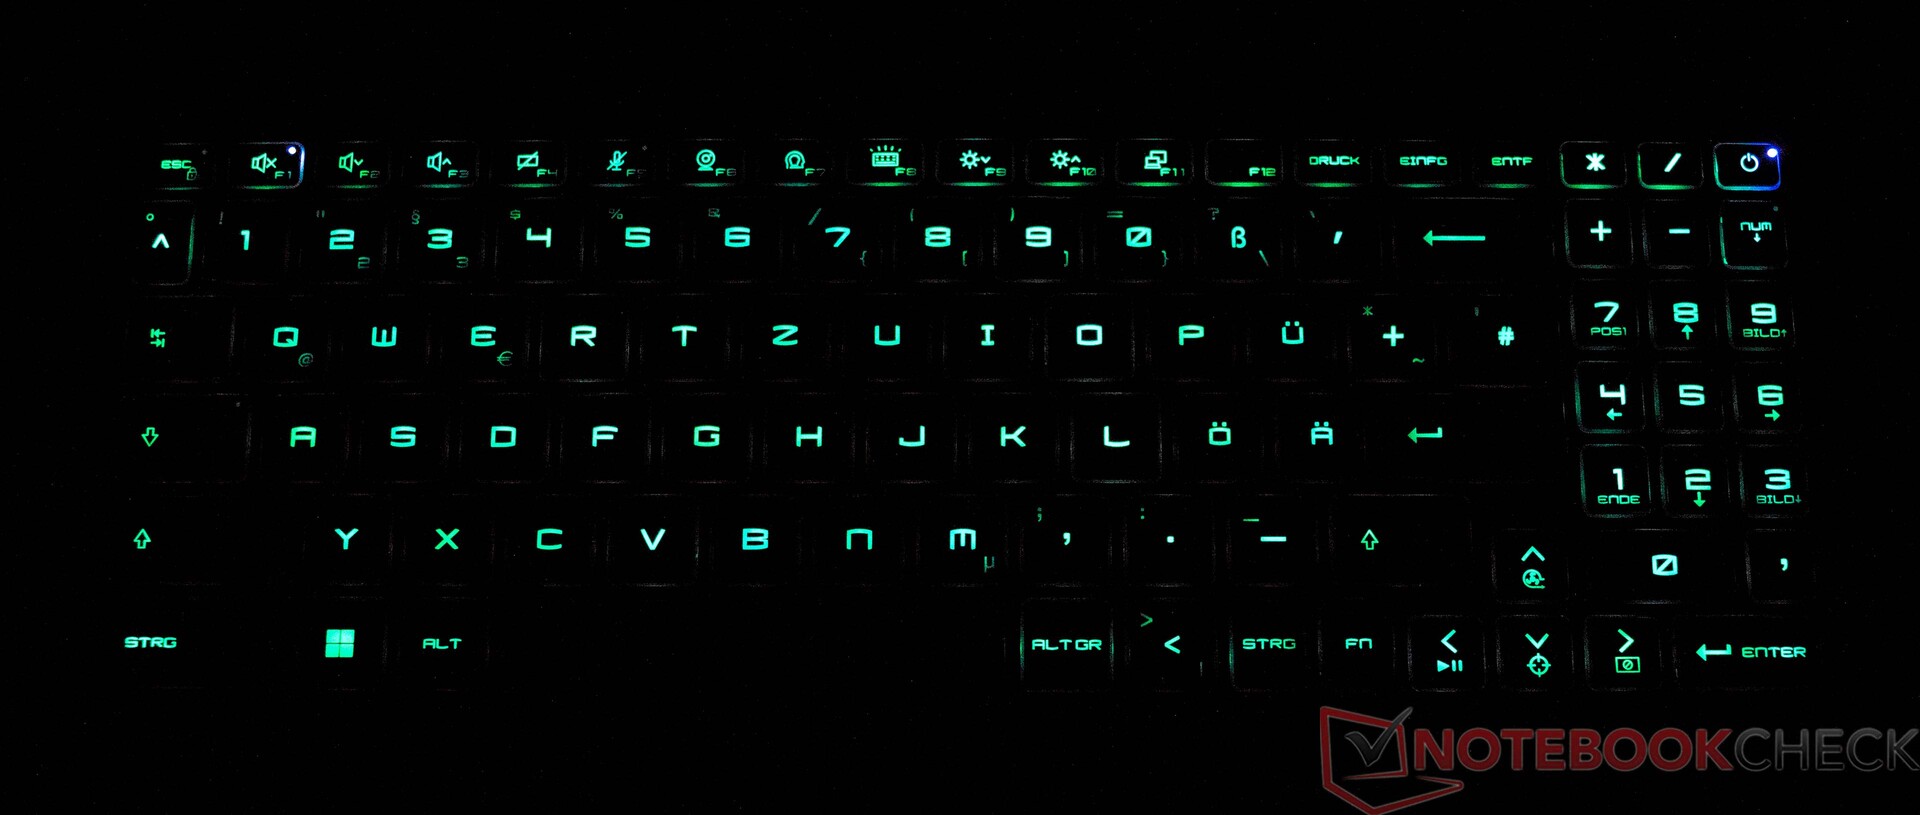
En cooperación con SteelSeries, el MSI Stealth 16 Studio A13VG ha sido equipado con un teclado chiclet de 6 líneas incluyendo un teclado numérico. Las letras son típicas de MSI, aunque las teclas lisas proporcionan un golpe significativamente apagado. El recorrido de las teclas es muy corto y el punto de presión está claramente definido. Por tanto, no deberías esperar recibir miradas de enfado al teclear rápidamente en la oficina ya que el ruido de fondo es muy tenue. La retroiluminación puede cambiarse a uno de tres niveles de brillo diferentes empleando una combinación de teclas. Lo que llama la atención es que MSI ha decidido no poner la tecla Fn en el lado izquierdo. Sin embargo, usando el Centro MSI, es posible cambiar la asignación de la tecla Windows por la tecla Fn en el lado derecho. De este modo, el usuario puede elegir su configuración óptima.
Panel táctil
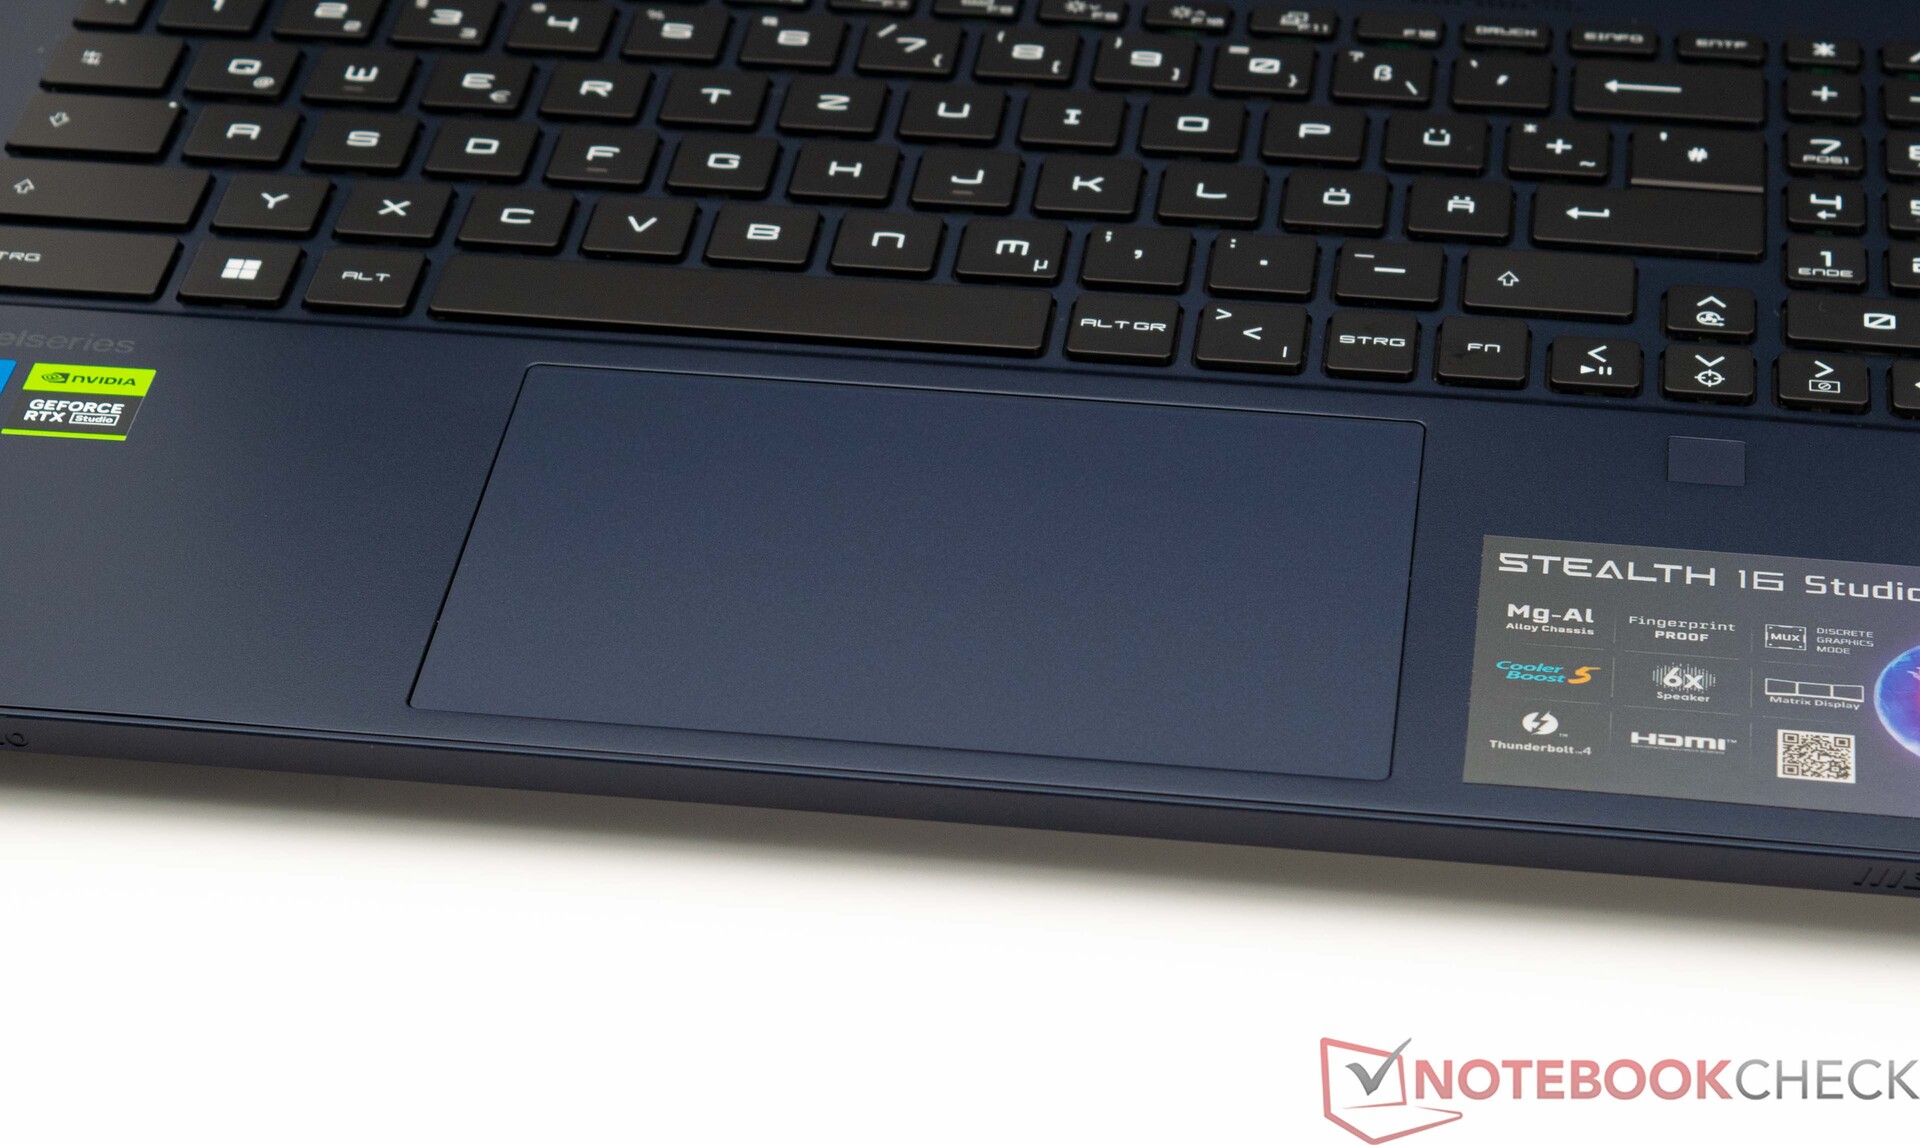
Una alternativa al ratón es el touchpad multitáctil. Con un tamaño de 13,1 x 8,2 cm, es una maravilla. En cuanto al diseño, el touchpad encaja perfectamente con la superficie superior de la base. Esta superficie tiene un tacto notablemente más suave que el reposamanos. El resultado es un deslizamiento óptimo. El touchpad es sensible y muy preciso, incluso hacia los bordes. La almohadilla ofrece un recorrido corto para las entradas y ayuda a proporcionar al usuario un punto de presión claro y una respuesta nítida.
Pantalla - 240 Hz en una relación de aspecto 16:10 fácil de usar
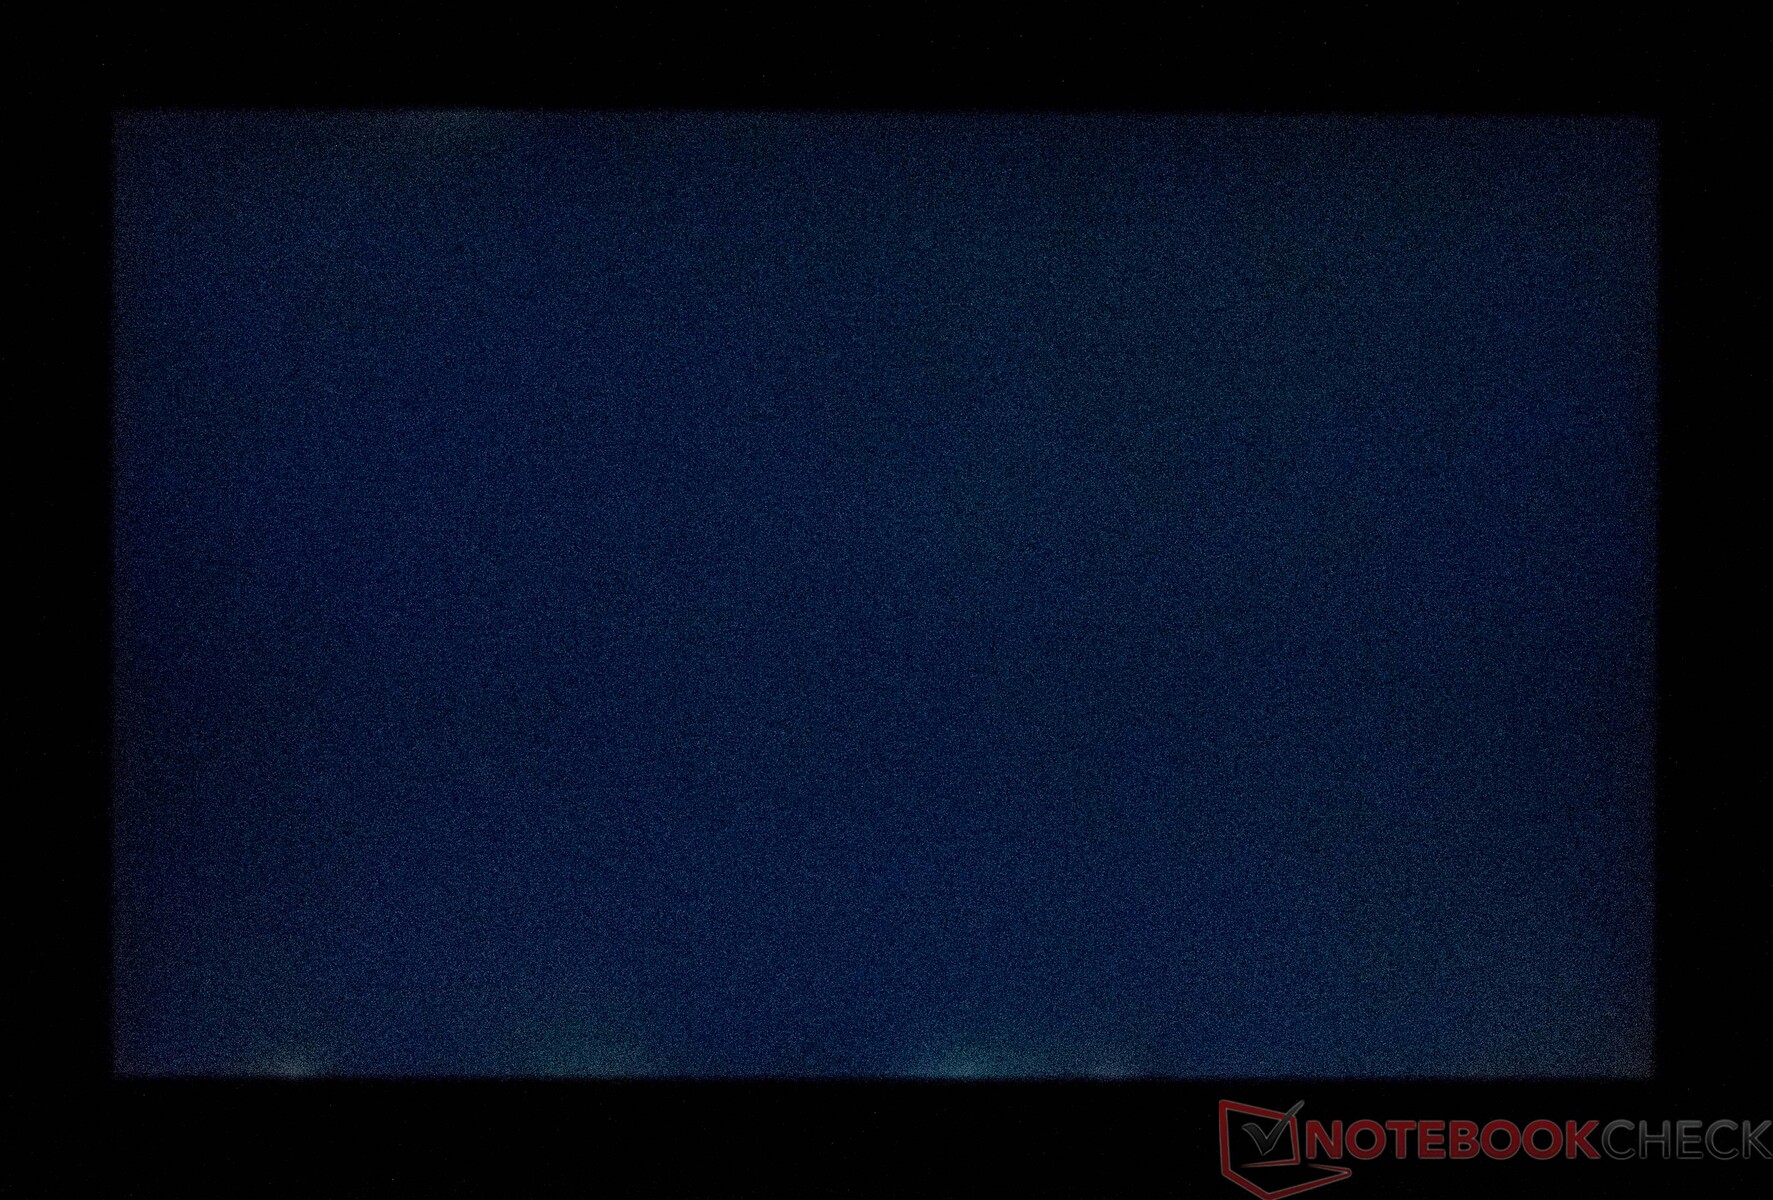
El MSI Stealth 16 Studio A13VG viene con un buen panel QHD+ de 16 pulgadas y su tasa de refresco de 240 Hz debería satisfacer los deseos de la mayoría de jugadores. Medimos un brillo medio de pantalla de 424 cd/m². Esto significa que la pantalla es relativamente brillante e incluso consigue ser mejor que gran parte de la competencia. Sólo el Acer Nitro 16 y el Asus ROG Flow X16 ofrecen pantallas más brillantes. Nuestro dispositivo de pruebas tuvo que luchar con un ligero sangrado de pantalla y es algo que tuvimos que tener en cuenta a la hora de puntuar el display. Por contra, no se detectó PWM, lo que puede evitar signos de fatiga durante un uso prolongado.
Opciones de pantalla alternativas como un panel 4K no están previstas para el MSI Stealth 16 Studio A13VG.
| |||||||||||||||||||||||||
iluminación: 88 %
Brillo con batería: 428 cd/m²
Contraste: 1146:1 (Negro: 0.37 cd/m²)
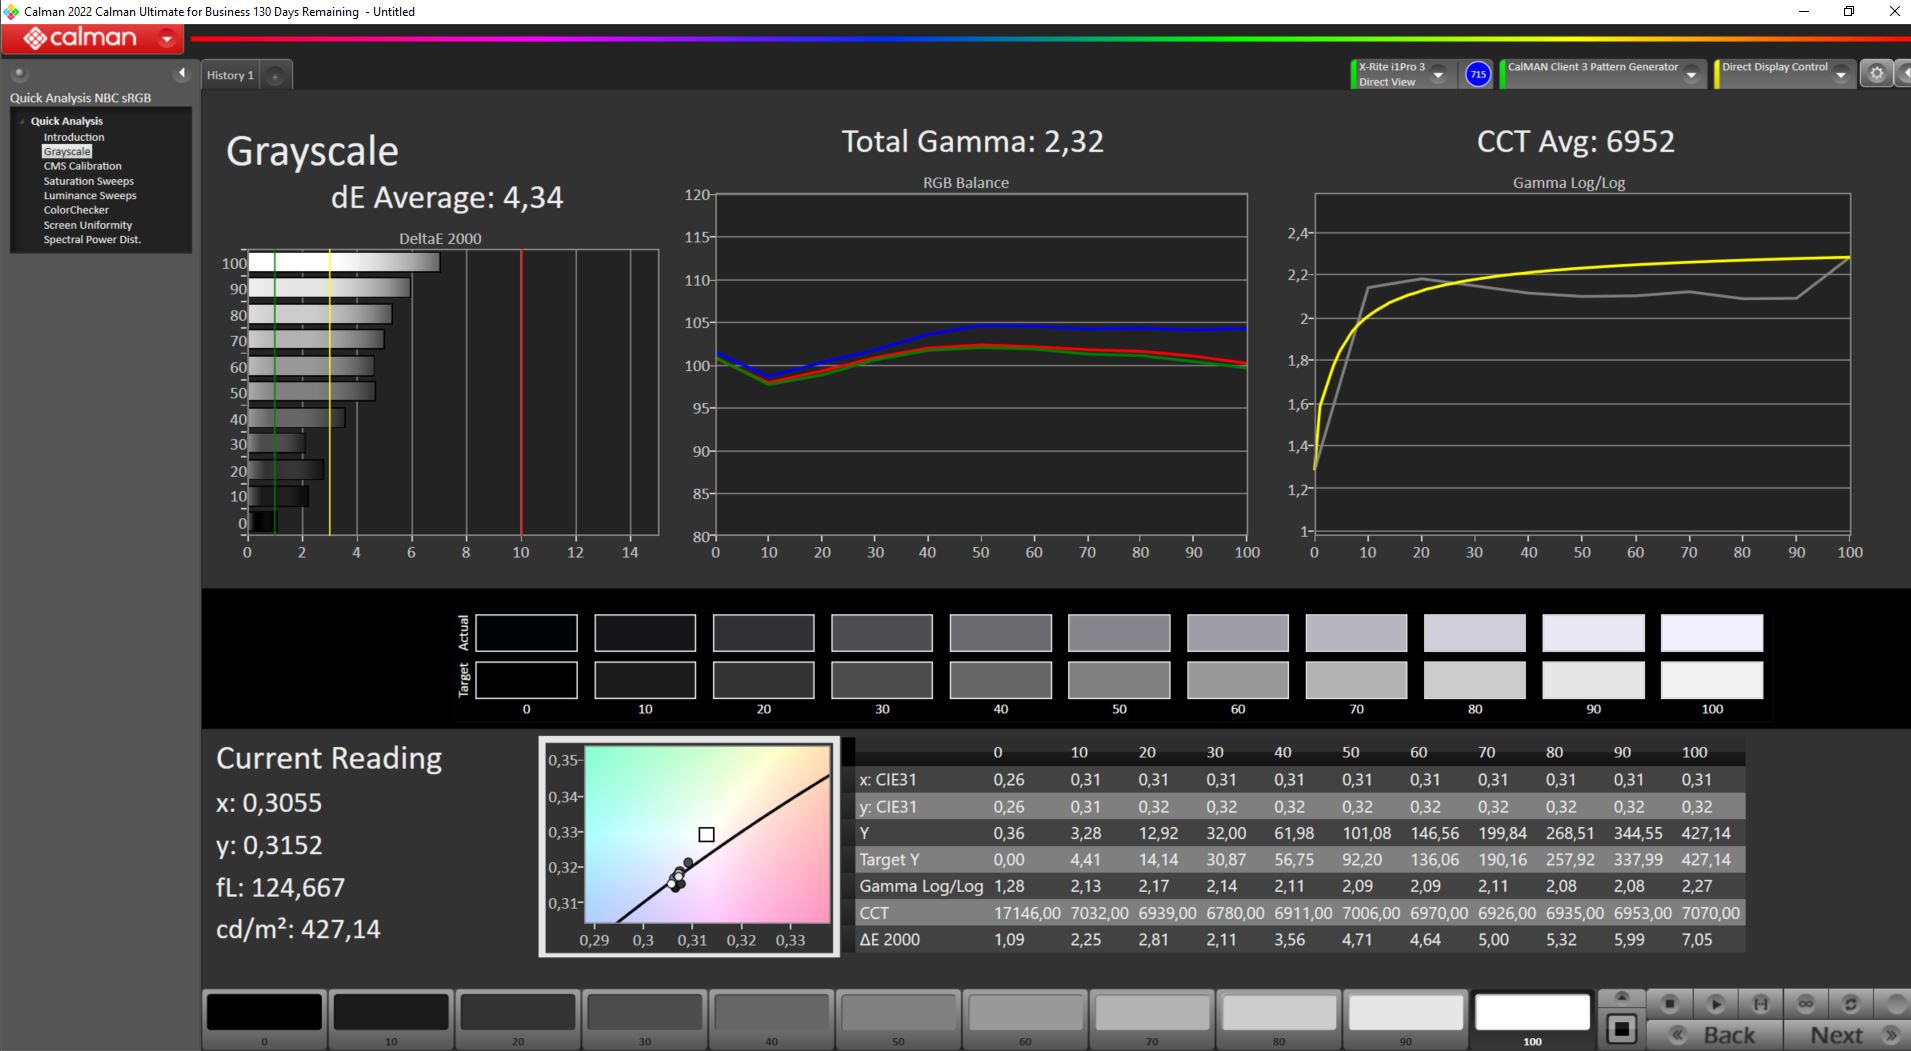
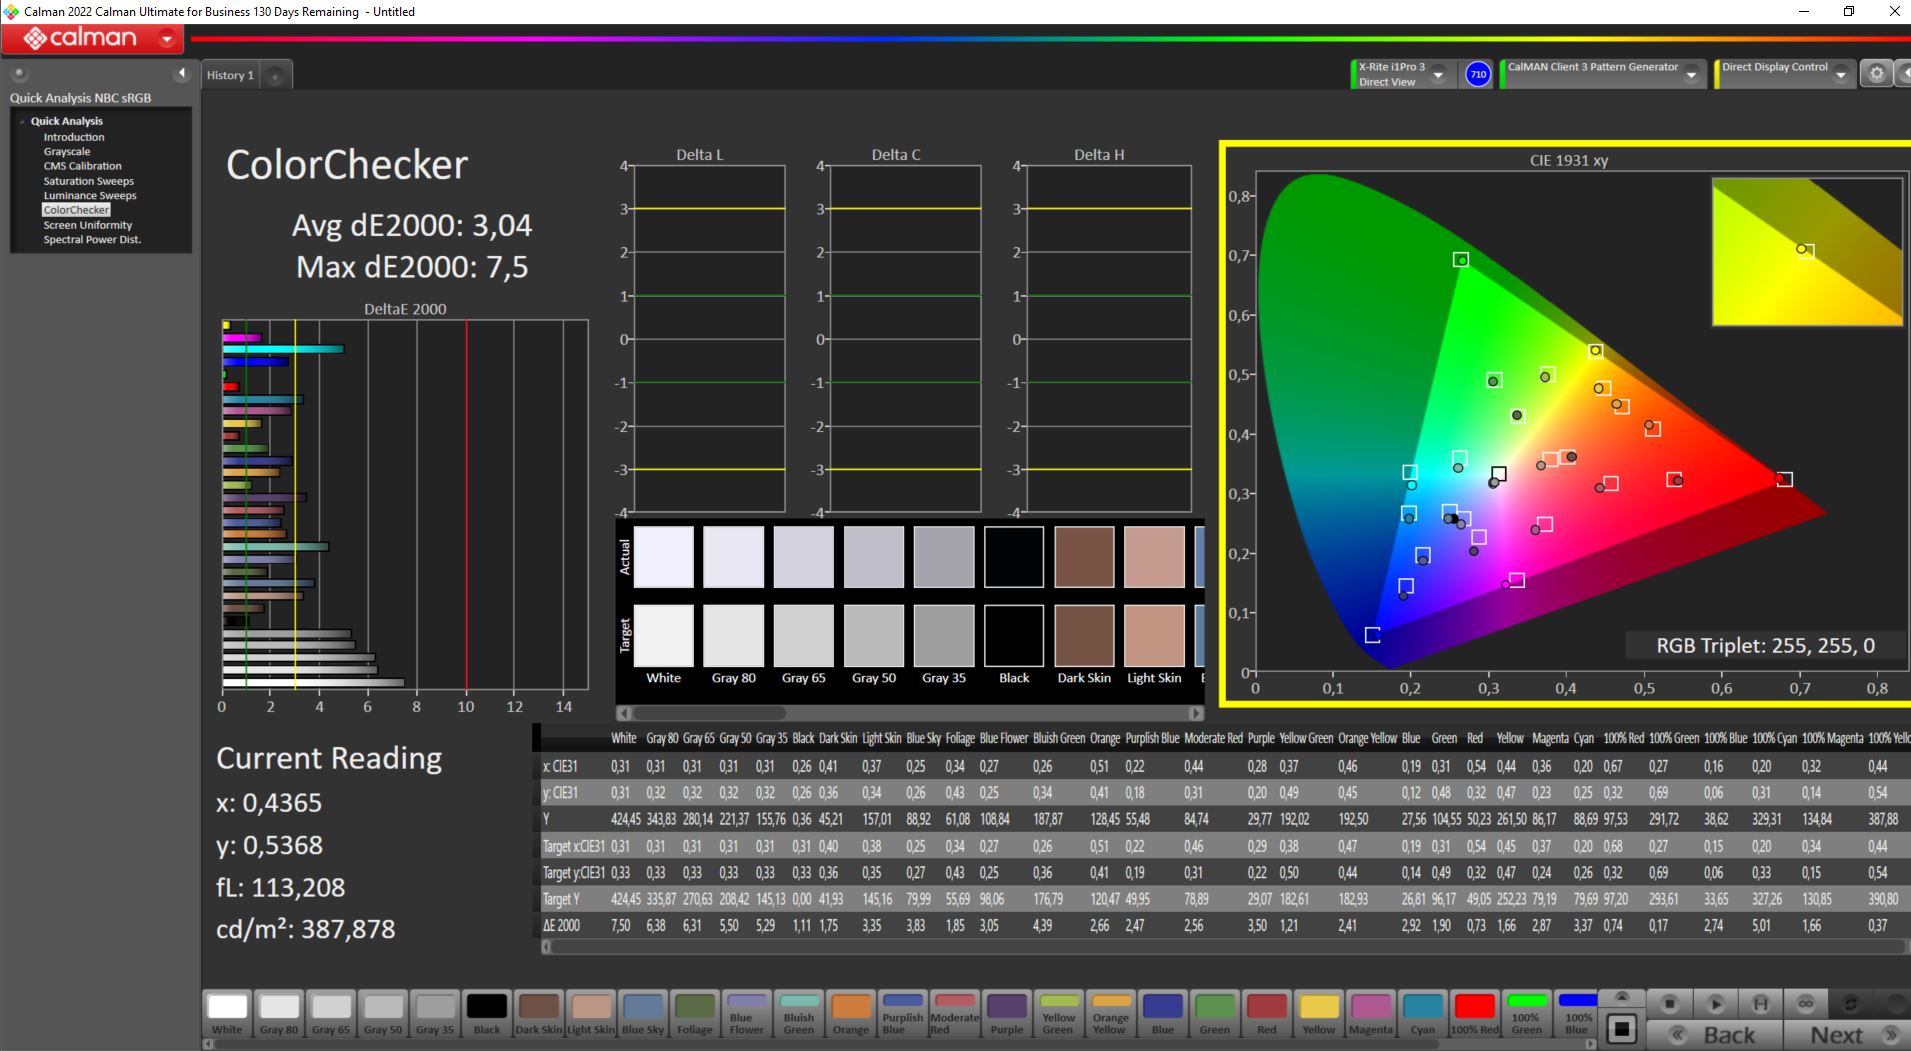
ΔE ColorChecker Calman: 3.04 | ∀{0.5-29.43 Ø4.71}
calibrated: 3.04
ΔE Greyscale Calman: 4.34 | ∀{0.09-98 Ø4.96}
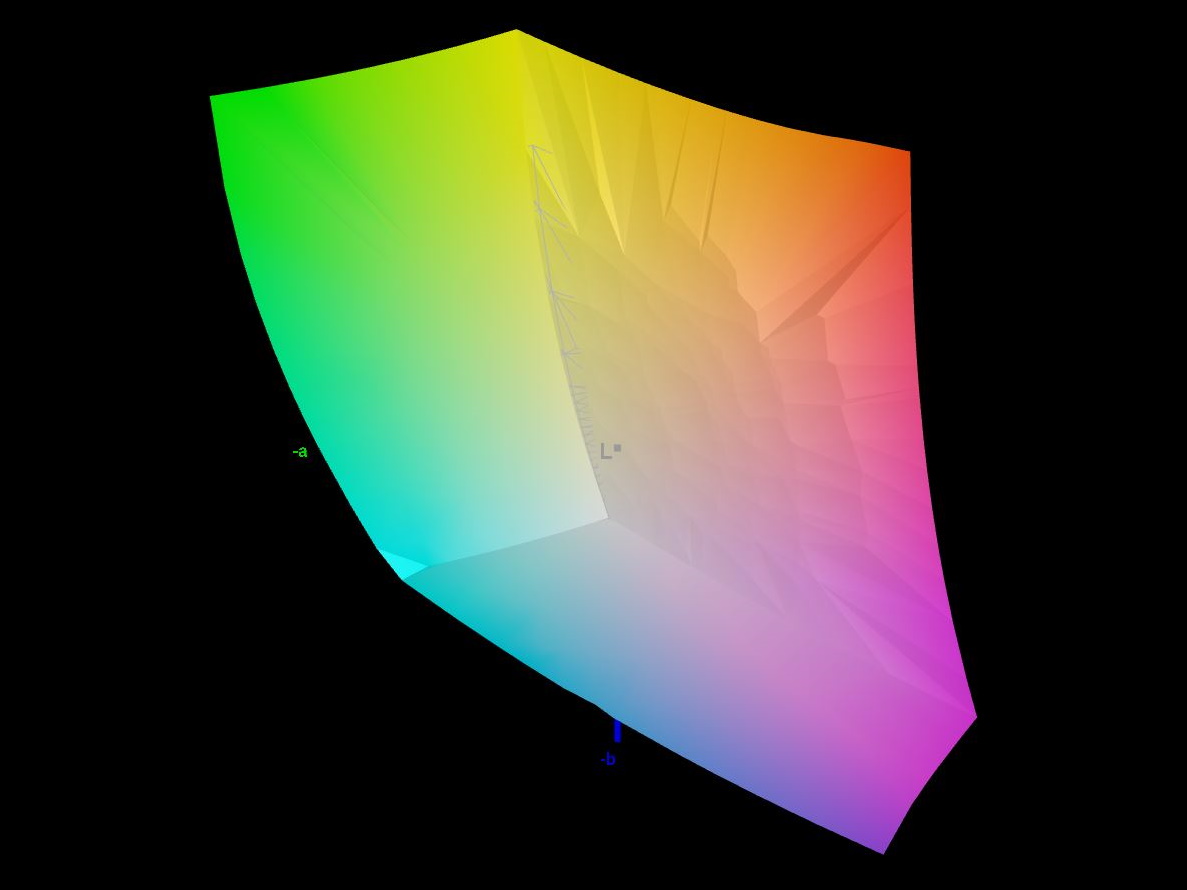
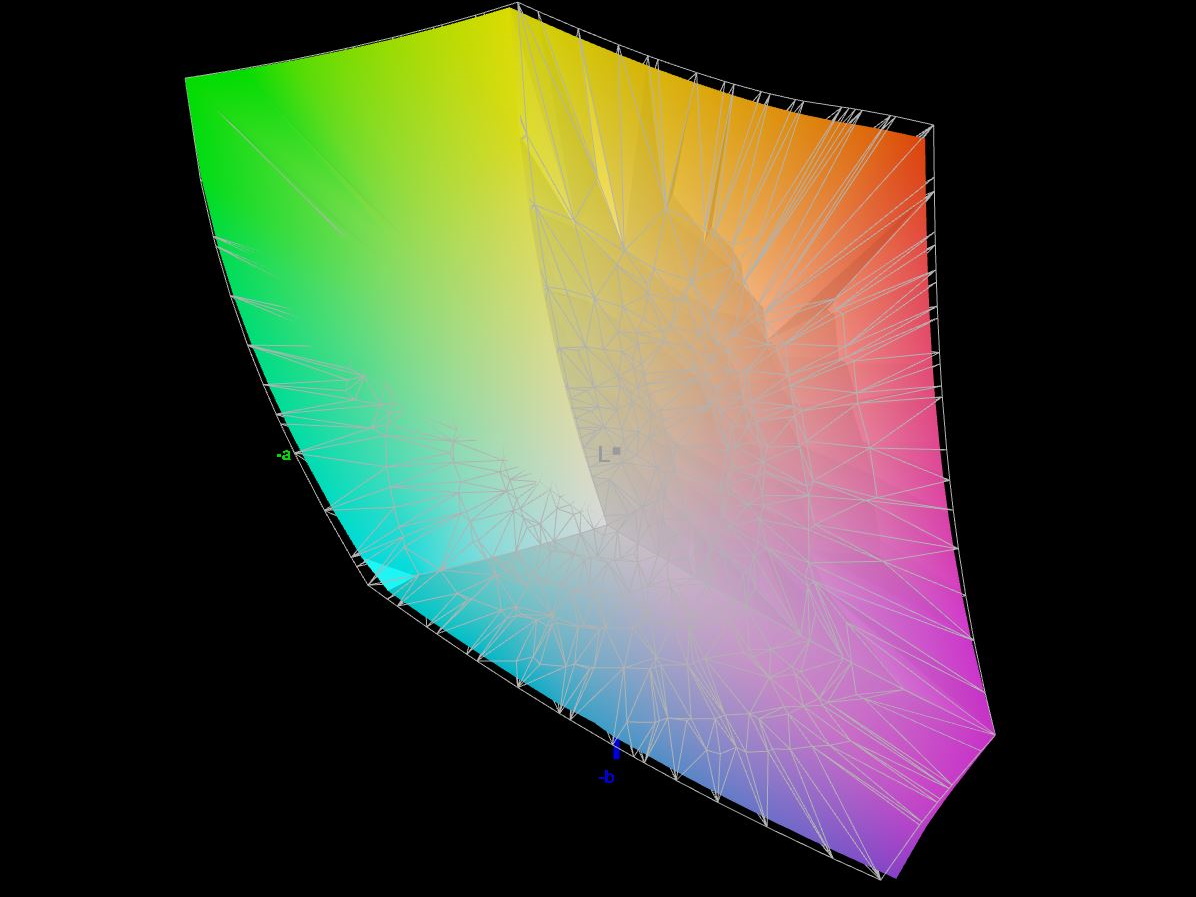
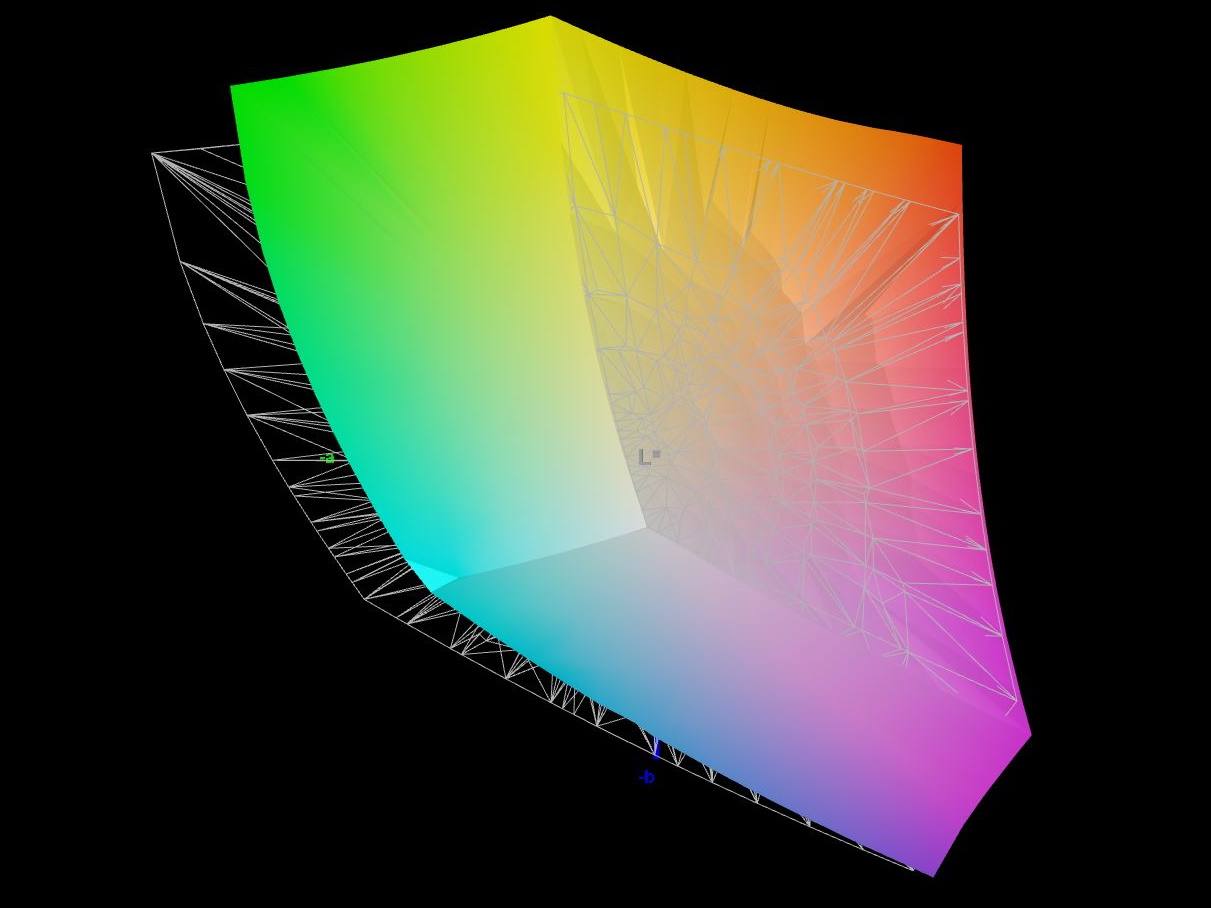
84.8% AdobeRGB 1998 (Argyll 3D)
99.7% sRGB (Argyll 3D)
96.4% Display P3 (Argyll 3D)
Gamma: 2.32
CCT: 6952 K
| MSI Stealth 16 Studio A13VG AUO26A9, IPS, 2560x1600, 16" | Asus ROG Flow X16 GV601V TMX1603 (TL160ADMP03-0), IPS, 2560x1600, 16" | Medion Erazer Major X20 BOE CQ NE160QDM-NZ1, IPS, 2560x1600, 16" | Acer Nitro 16 AN16-41 BOE CQ NE16QDM-NY1, IPS, 2560x1600, 16" | Corsair Voyager a1600 BOE0A3B, IPS, 2560x1600, 16" | Gigabyte AERO 16 OLED BSF Samsung SDC4191 (ATNA60YV09-0, OLED, 3840x2400, 16" | |
|---|---|---|---|---|---|---|
| Display | 0% | -15% | -16% | -16% | 6% | |
| Display P3 Coverage (%) | 96.4 | 96.61 0% | 69.4 -28% | 67.9 -30% | 68.7 -29% | 99.9 4% |
| sRGB Coverage (%) | 99.7 | 99.92 0% | 98 -2% | 99.1 -1% | 98.2 -2% | 100 0% |
| AdobeRGB 1998 Coverage (%) | 84.8 | 84.63 0% | 70.9 -16% | 69.9 -18% | 70.1 -17% | 96.4 14% |
| Response Times | -11% | -114% | -70% | -137% | 60% | |
| Response Time Grey 50% / Grey 80% * (ms) | 4.4 ? | 3.8 ? 14% | 13.1 ? -198% | 11 ? -150% | 13 ? -195% | 2 ? 55% |
| Response Time Black / White * (ms) | 5.6 ? | 7.6 ? -36% | 7.3 ? -30% | 5 ? 11% | 10 ? -79% | 1.98 ? 65% |
| PWM Frequency (Hz) | 60 | |||||
| Screen | 21% | 16% | 25% | 6% | 144% | |
| Brightness middle (cd/m²) | 424 | 486 15% | 374 -12% | 520 23% | 355 -16% | 389.97 -8% |
| Brightness (cd/m²) | 411 | 469 14% | 357 -13% | 494 20% | 340 -17% | 395 -4% |
| Brightness Distribution (%) | 88 | 91 3% | 92 5% | 91 3% | 91 3% | 97 10% |
| Black Level * (cd/m²) | 0.37 | 0.39 -5% | 0.33 11% | 0.39 -5% | 0.53 -43% | 0.03 92% |
| Contrast (:1) | 1146 | 1246 9% | 1133 -1% | 1333 16% | 670 -42% | 12999 1034% |
| Colorchecker dE 2000 * | 3.04 | 2.27 25% | 2.43 20% | 1.94 36% | 2.43 20% | 2 34% |
| Colorchecker dE 2000 max. * | 7.5 | 5.73 24% | 3.97 47% | 5.62 25% | 4.31 43% | 4.1 45% |
| Colorchecker dE 2000 calibrated * | 3.04 | 0.6 80% | 1.4 54% | 0.74 76% | 1.14 63% | 1.68 45% |
| Greyscale dE 2000 * | 4.34 | 3.36 23% | 3.1 29% | 2.94 32% | 2.62 40% | 2.23 49% |
| Gamma | 2.32 95% | 2.46 89% | 2.191 100% | 2.37 93% | 2.28 96% | 2.41 91% |
| CCT | 6952 93% | 6625 98% | 6194 105% | 6443 101% | 6909 94% | 6323 103% |
| Media total (Programa/Opciones) | 3% /
12% | -38% /
-10% | -20% /
3% | -49% /
-19% | 70% /
103% |
* ... más pequeño es mejor
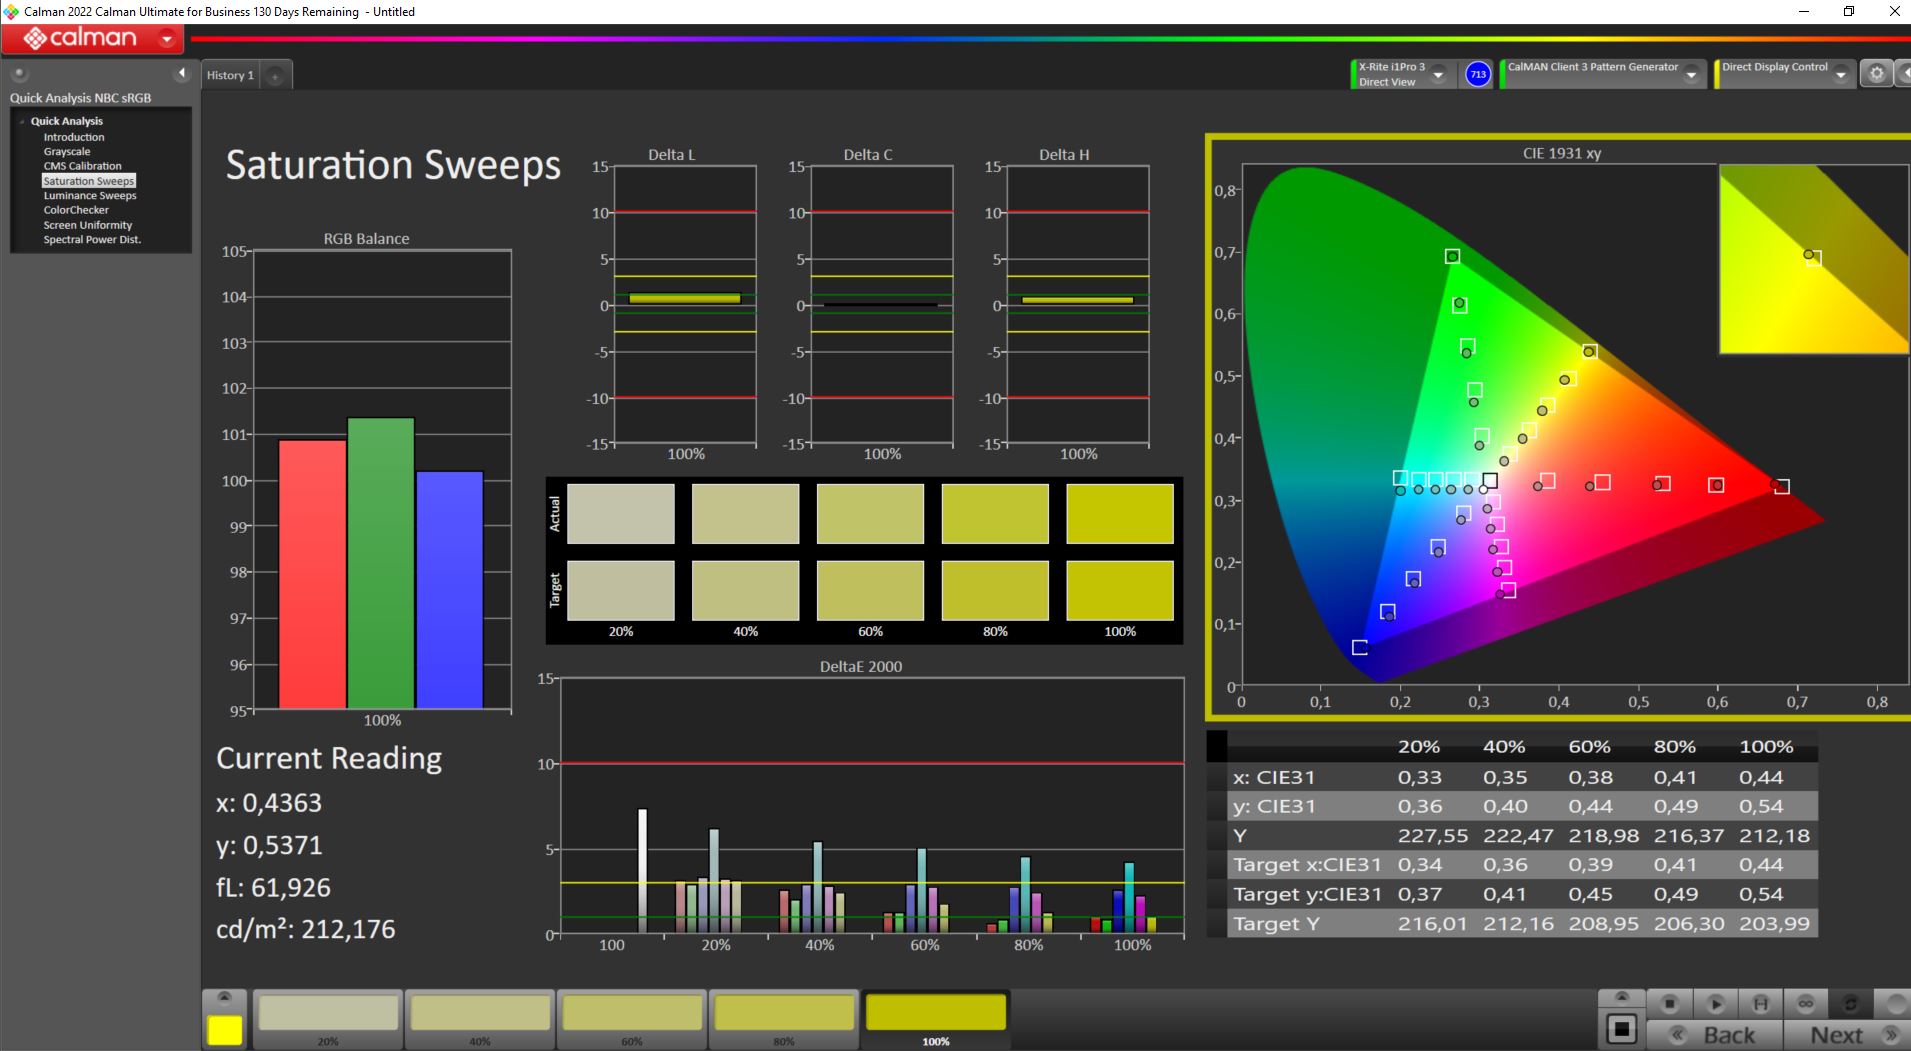
Nuestras mediciones revelaron una buena cobertura del espacio de color sRGB, que alcanza casi el 100%. También, en términos del espacio de color P3, vimos un maravilloso resultado de más del 96 por ciento aunque el espacio de color AdobeRGB extendido sólo puede ser reproducido al 84,8 por ciento. Con estas cifras, el IPS obtiene una buena puntuación y sólo pierde frente alGigabyte AERO 16del Gigabyte AERO 16. No obstante, es evidente que este portátil puede utilizarse para la edición semiprofesional de imágenes o vídeo.
Subjetivamente, la calidad de imagen de la pantalla integrada es excelente. La superficie mate evita los reflejos y no se aprecia ningún tipo de veteado. En resumen, nada más sacarlo de la caja, los valores de color DeltaE-2000 medidos están relativamente cerca del valor objetivo de <3. Sin embargo, la competencia demuestra que es posible mejorar. Típico para IPS, observamos un ligero pero no muy pronunciado tinte azul en el MSI Stealth 16 Studio A13VG.
Nuestra calibración manual no condujo a ninguna mejora. También tenemos la intención de proporcionar el perfil ICC para esta pantalla.
Tiempos de respuesta del display
| ↔ Tiempo de respuesta de Negro a Blanco | ||
|---|---|---|
| 5.6 ms ... subida ↗ y bajada ↘ combinada | ↗ 2.2 ms subida | 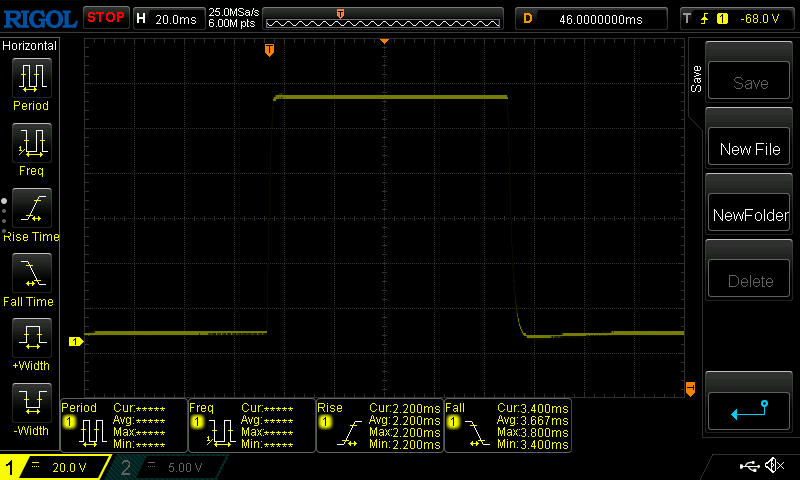 |
| ↘ 3.4 ms bajada | ||
| La pantalla mostró tiempos de respuesta muy rápidos en nuestros tests y debería ser adecuada para juegos frenéticos. En comparación, todos los dispositivos de prueba van de ##min### (mínimo) a 240 (máximo) ms. » 18 % de todos los dispositivos son mejores. Esto quiere decir que el tiempo de respuesta medido es mejor que la media (19.8 ms) de todos los dispositivos testados. | ||
| ↔ Tiempo de respuesta 50% Gris a 80% Gris | ||
| 4.4 ms ... subida ↗ y bajada ↘ combinada | ↗ 2.2 ms subida | 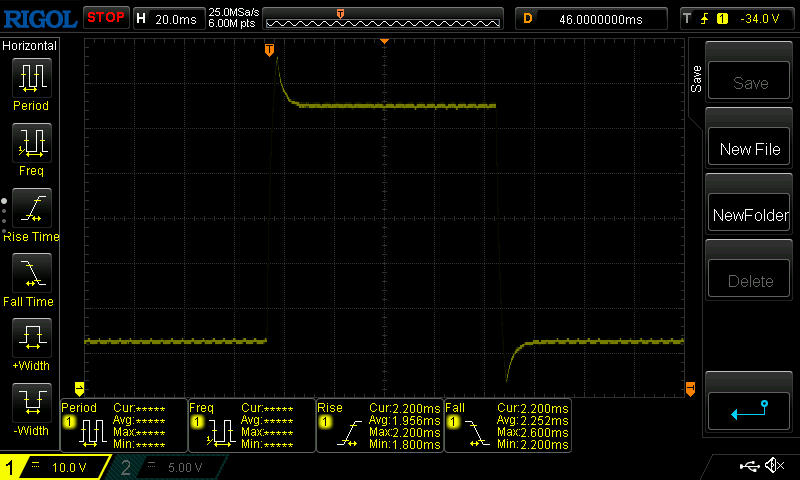 |
| ↘ 2.2 ms bajada | ||
| La pantalla mostró tiempos de respuesta muy rápidos en nuestros tests y debería ser adecuada para juegos frenéticos. En comparación, todos los dispositivos de prueba van de ##min### (mínimo) a 636 (máximo) ms. » 16 % de todos los dispositivos son mejores. Esto quiere decir que el tiempo de respuesta medido es mejor que la media (31 ms) de todos los dispositivos testados. | ||
Parpadeo de Pantalla / PWM (Pulse-Width Modulation)
| Parpadeo de Pantalla / PWM no detectado | 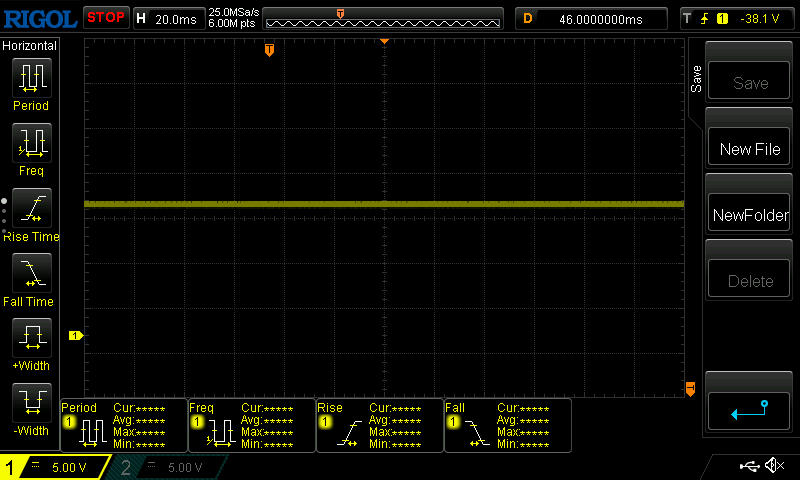 | ||
Comparación: 52 % de todos los dispositivos testados no usaron PWM para atenuar el display. Si se usó, medimos una media de 7754 (mínimo: 5 - máxmo: 343500) Hz. | |||
El brillo comparativamente bueno de la pantalla es suficiente para su uso en exteriores. Sin embargo, los usuarios deberían preferir un lugar a la sombra. No hay reflejos molestos gracias a la superficie mate de la pantalla.
En condiciones normales de uso, el panel IPS integrado es una pantalla maravillosa. Como se aprecia en las imágenes de las cuatro esquinas, los cambios de color sólo son visibles cuando se mira tanto desde un ángulo amplio como desde uno pronunciado.

Rendimiento: la potencia de 14 núcleos - Intel Core i7-13700H
El MSI Stealth 16 Studio A13VG, que está basado en elIntel Core i7-13700H y laGPU para portátiles Nvidia GeForce RTX 4070ofrece un nivel de potencia que lo convierte en un potente portátil para juegos. Sin embargo, el juego no es la única habilidad principal del dispositivo, ya que la maravillosa pantalla y su aspecto elegante también lo convierten en una perspectiva atractiva para los creadores. Una alternativa a nuestro modelo de análisis es el MSI Stealth 16 Studio A13V, que también viene con una pantallaGPU Nvidia GeForce RTX 4060 para portátiles.
Condiciones de la prueba
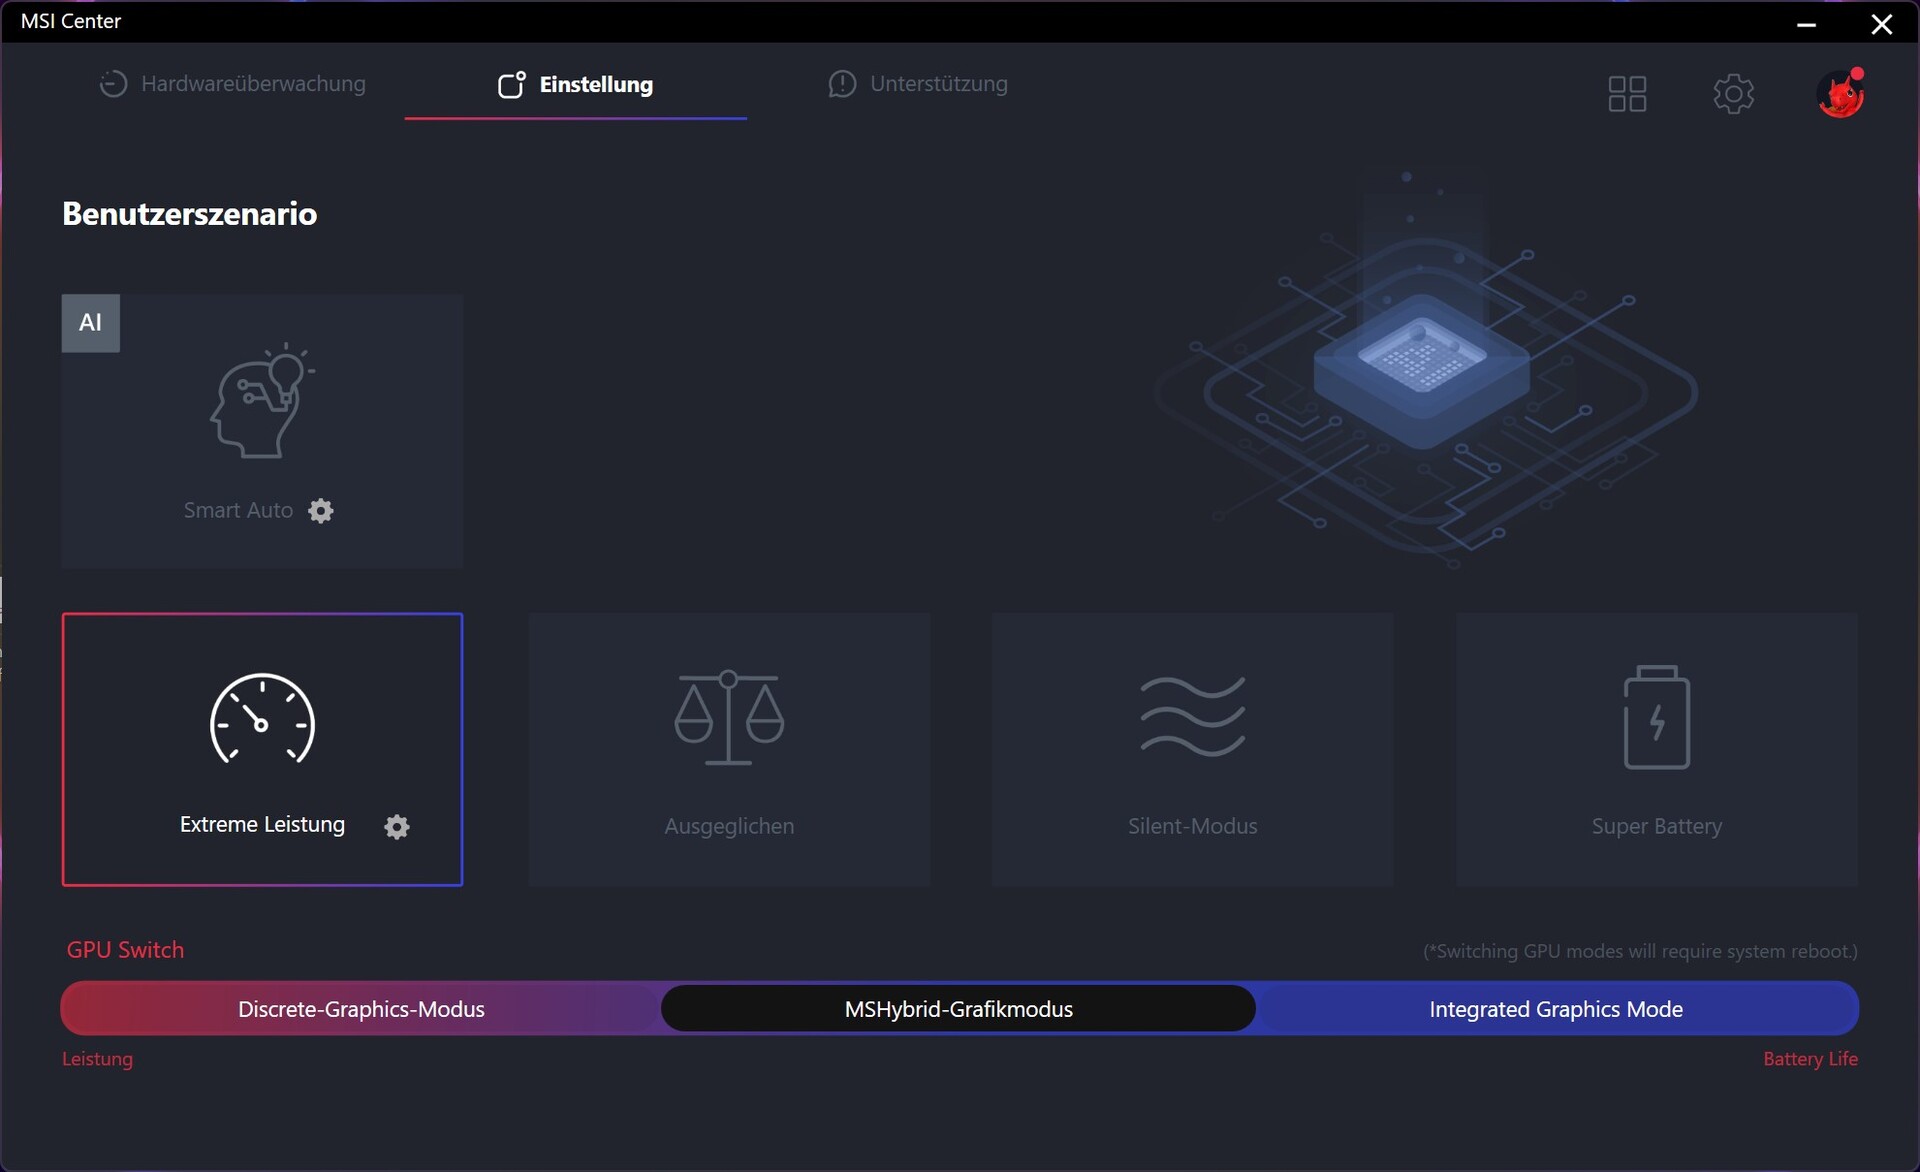
Se pueden seleccionar varios perfiles de rendimiento que afectan a la CPU y la GPU utilizando el Centro MSI. A menos que se indique lo contrario, las pruebas de rendimiento se realizaron usando el perfil Rendimiento Extremo
. Además, hicimos las desviaciones de medición de energía y volumen de acuerdo con nuestros criterios de prueba.
| Modo | Potencia CPU PL1 | Potencia CPU PL2 | Potencia GPU |
|---|---|---|---|
| Super batería | 15 W | 15 W | 80 W |
| Modo silencioso | 25 W | 45 W | 80 W |
| Equilibrado | 45 W | 45 W | 80 W |
| Rendimiento extremo | 115 W | 160 W | 105 W |
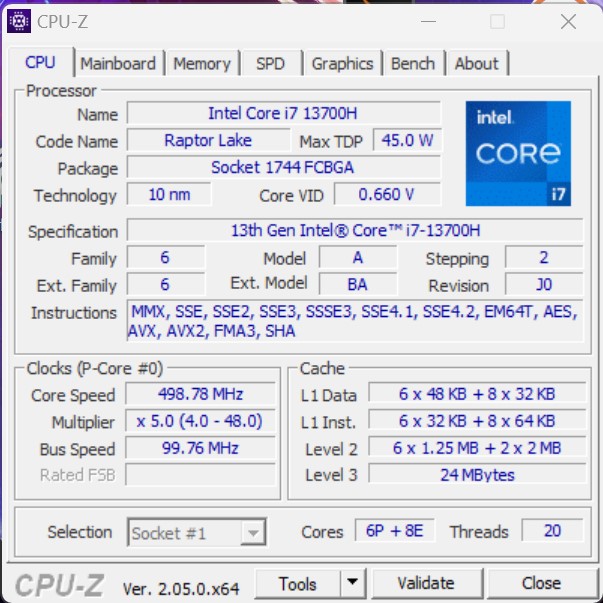
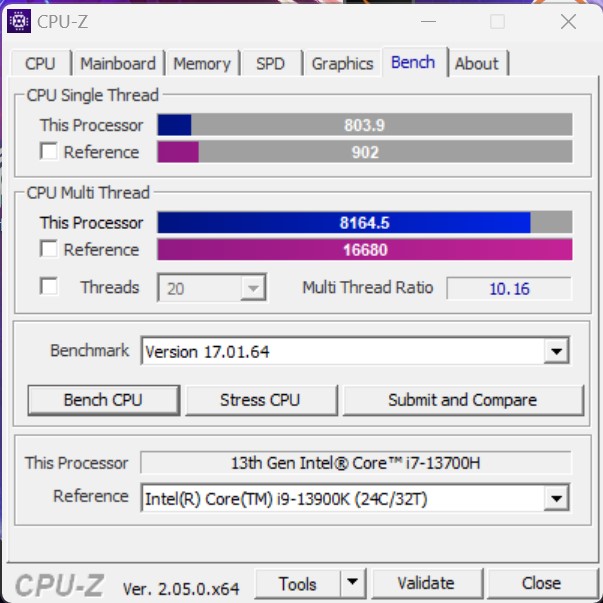
Procesador
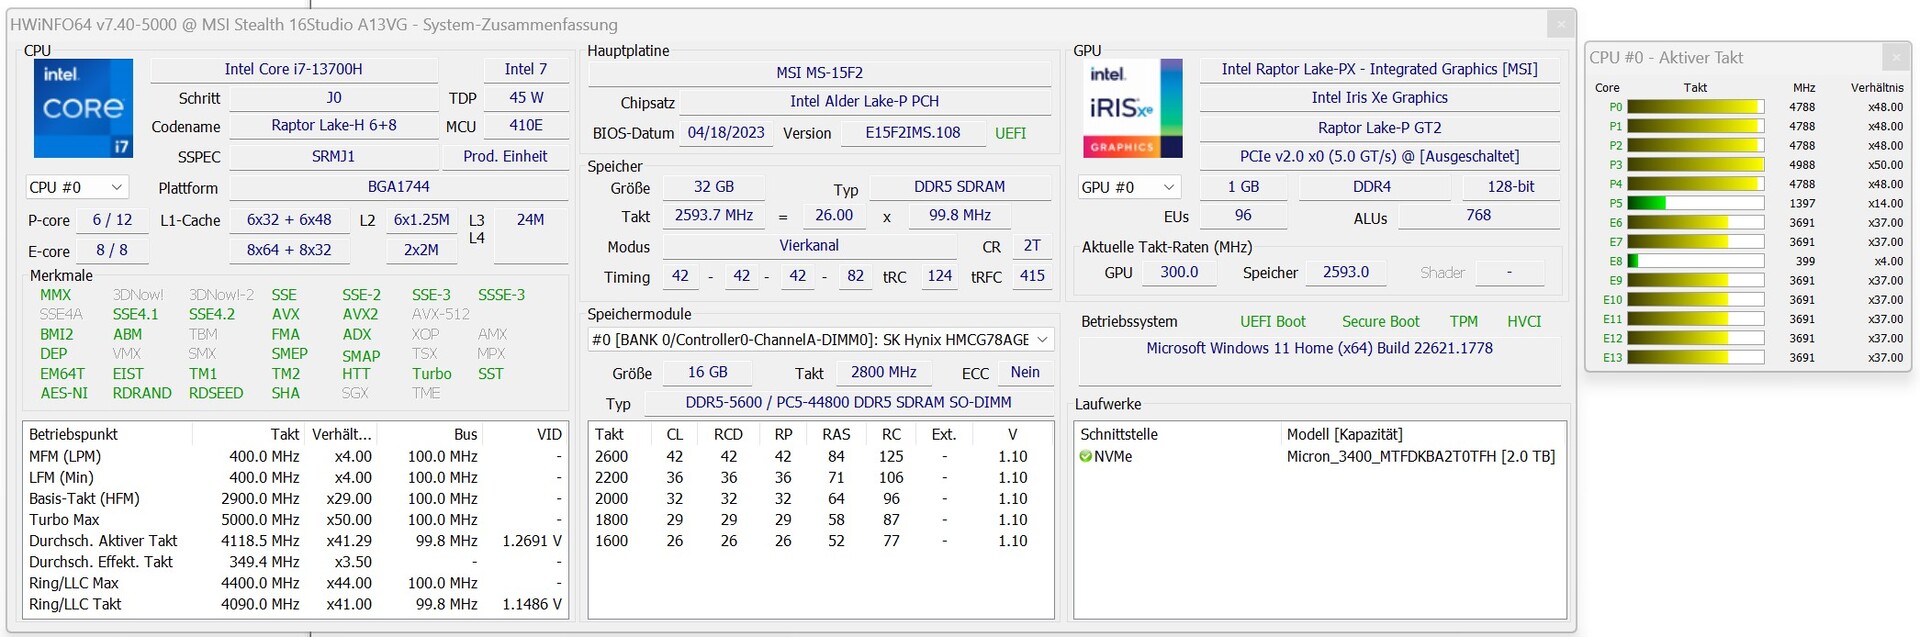
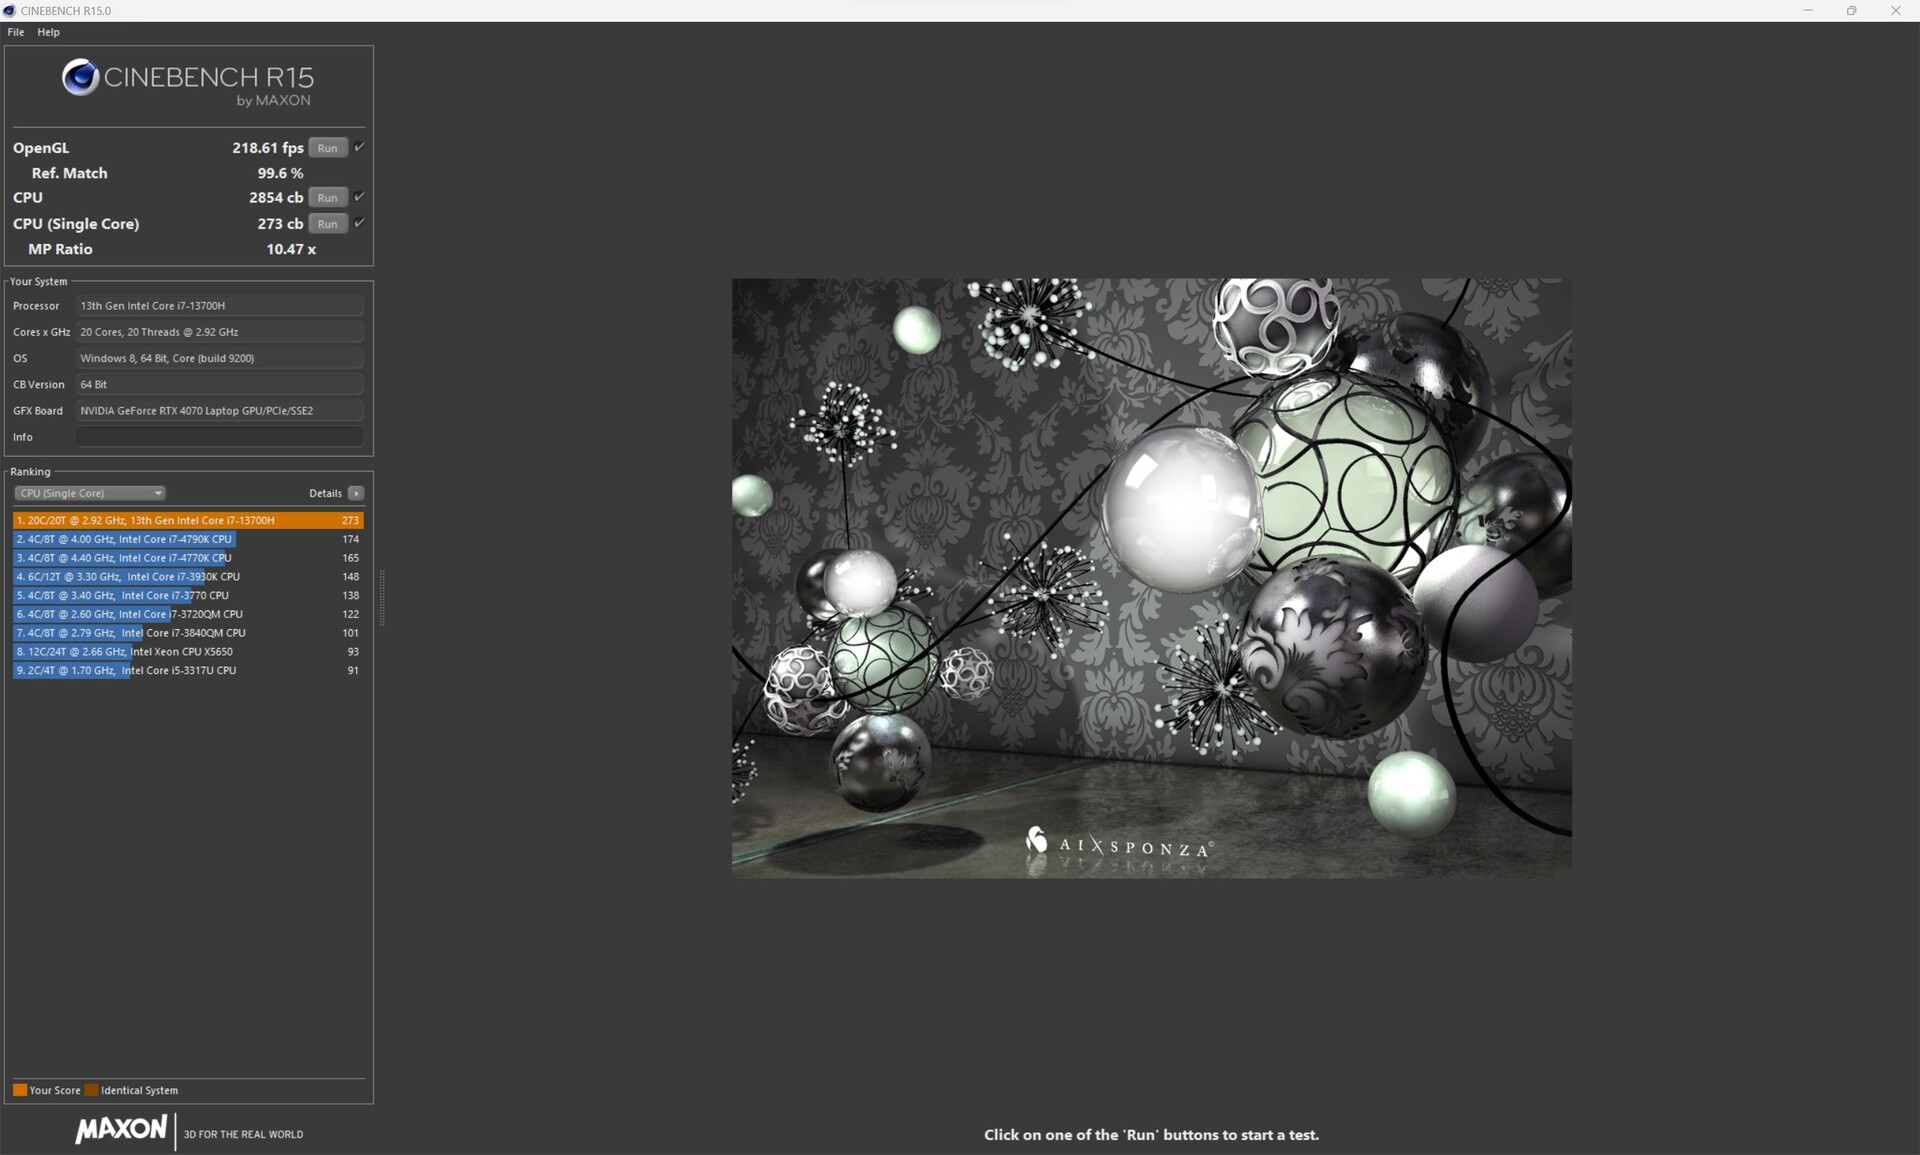
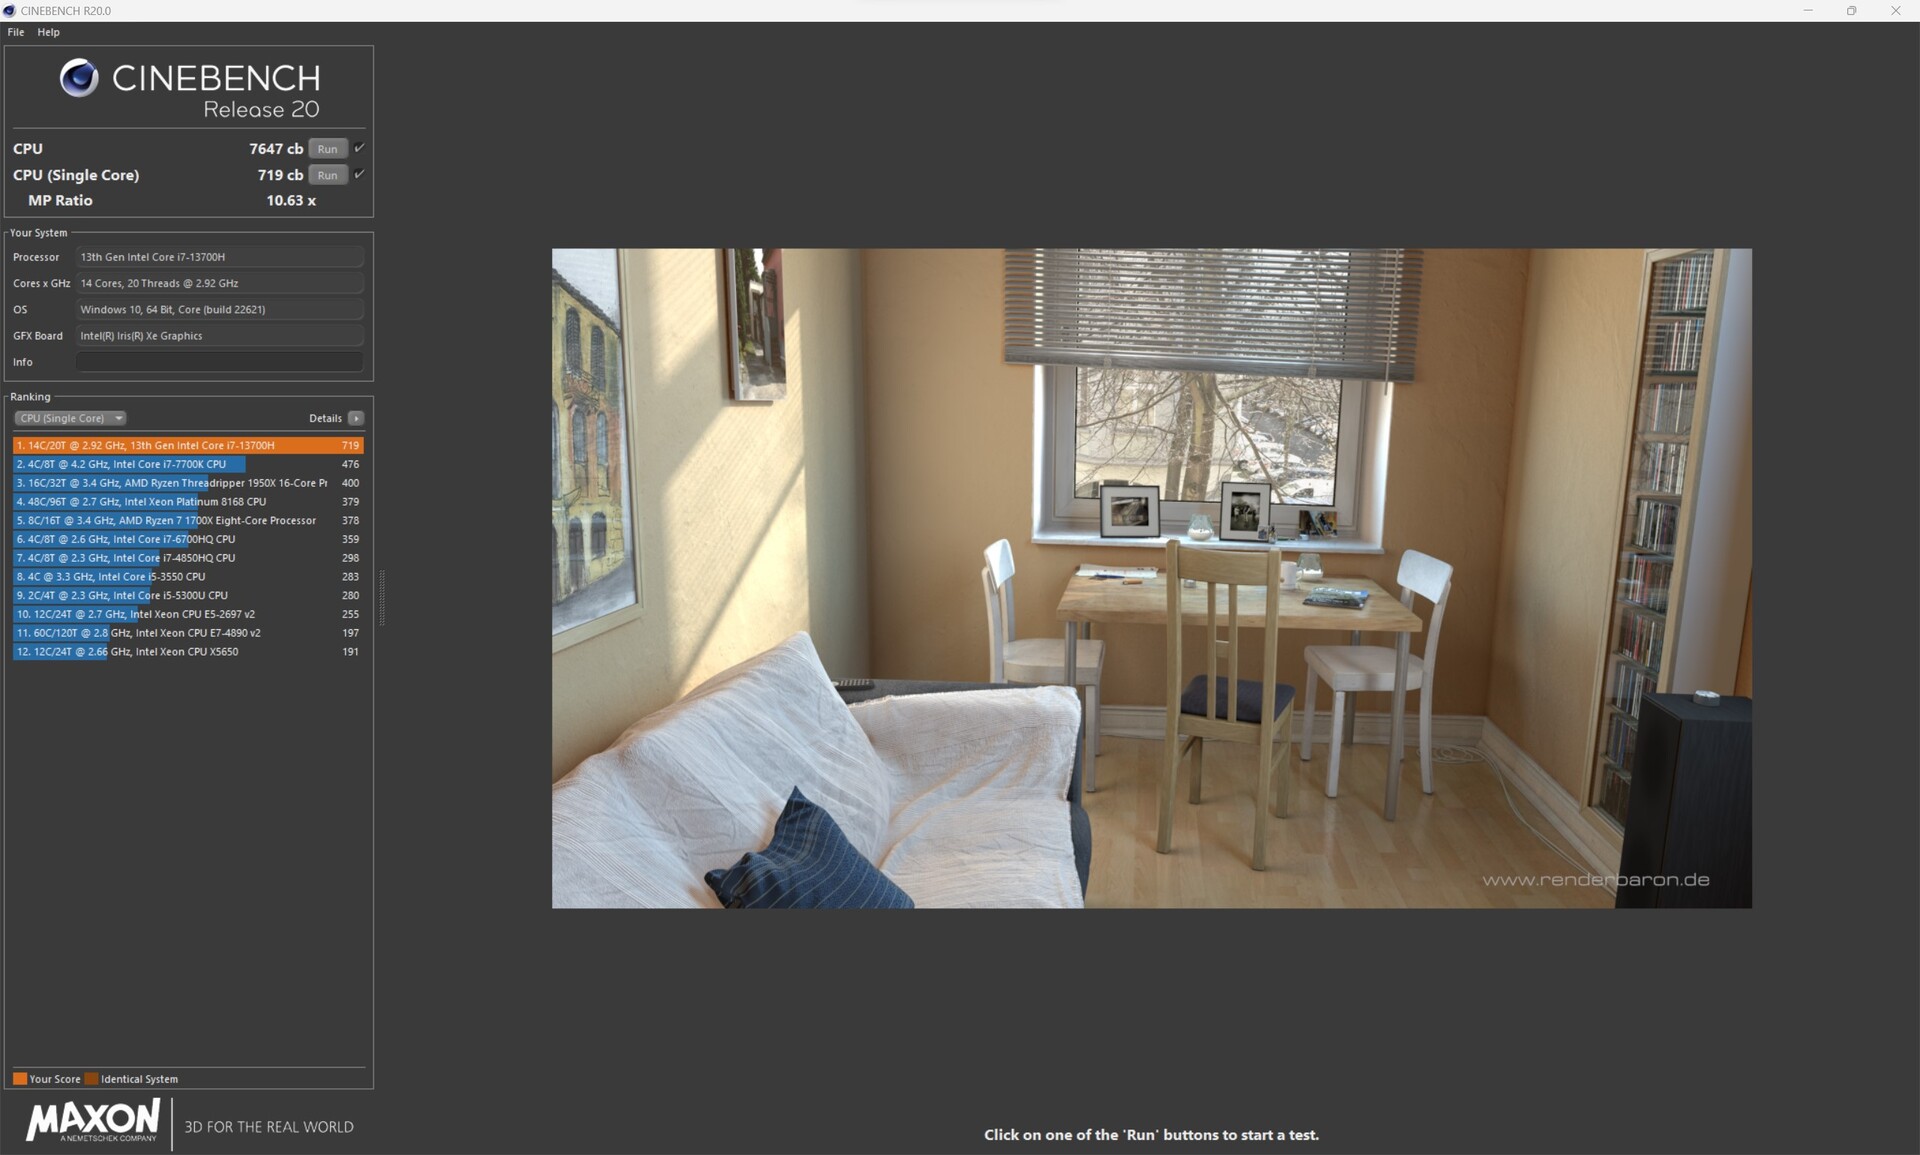
El procesador Intel Core-i7-13700H (Raptor Lake) consta de ocho núcleos de eficiencia (sin hyper-threading, de 1,8 a 3,7 GHz) y seis núcleos de rendimiento (hyper-threading, de 2,4 a 5,0 GHz). En total, esto da como resultado 20 núcleos lógicos de CPU. Basado en el Core i7-13700H, el MSI Stealth 16 Studio A13VG logra un buen rendimiento que está por delante de nuestro rendimiento previamente documentado con el Intel Core i7-13700H. Incluso el Gigabyte AERO 16, que está equipado con un Intel Core i9-13900H, tiene que dejar paso a nuestro modelo de pruebas. El Medion Erazer Major X20 es el líder indiscutible de la manada. Pero, comparado con el Intel Core i9-13900HX, el MSI Stealth 16 Studio A13VG tiene alrededor de un 30 por ciento menos de rendimiento.
La prueba de bucle Cinebench R15 muestra que al principio, el impulso de la CPU se mantuvo relativamente bien, pero, después de la 11ª ejecución, el SoC es incapaz de ofrecer toda su potencia. Registramos una pérdida de rendimiento de alrededor del 15% en comparación con la primera ejecución.
Cinebench R15 Multi Continuous Test
Cinebench R23: Multi Core | Single Core
Cinebench R20: CPU (Multi Core) | CPU (Single Core)
Cinebench R15: CPU Multi 64Bit | CPU Single 64Bit
Blender: v2.79 BMW27 CPU
7-Zip 18.03: 7z b 4 | 7z b 4 -mmt1
Geekbench 5.5: Multi-Core | Single-Core
HWBOT x265 Benchmark v2.2: 4k Preset
LibreOffice : 20 Documents To PDF
R Benchmark 2.5: Overall mean
| CPU Performance rating | |
| Medion Erazer Major X20 | |
| Media de la clase Gaming | |
| Asus ROG Flow X16 GV601V | |
| MSI Stealth 16 Studio A13VG | |
| Gigabyte AERO 16 OLED BSF | |
| Medio Intel Core i7-13700H | |
| Acer Nitro 16 AN16-41 | |
| Corsair Voyager a1600 | |
| Cinebench R23 / Multi Core | |
| Medion Erazer Major X20 | |
| Media de la clase Gaming (10488 - 42661, n=107, últimos 2 años) | |
| MSI Stealth 16 Studio A13VG | |
| Asus ROG Flow X16 GV601V | |
| Gigabyte AERO 16 OLED BSF | |
| Medio Intel Core i7-13700H (5890 - 20034, n=29) | |
| Acer Nitro 16 AN16-41 | |
| Corsair Voyager a1600 | |
| Cinebench R23 / Single Core | |
| Medion Erazer Major X20 | |
| Asus ROG Flow X16 GV601V | |
| Media de la clase Gaming (1166 - 2415, n=107, últimos 2 años) | |
| MSI Stealth 16 Studio A13VG | |
| Medio Intel Core i7-13700H (1323 - 1914, n=29) | |
| Gigabyte AERO 16 OLED BSF | |
| Corsair Voyager a1600 | |
| Acer Nitro 16 AN16-41 | |
| Cinebench R20 / CPU (Multi Core) | |
| Medion Erazer Major X20 | |
| Media de la clase Gaming (4029 - 16433, n=106, últimos 2 años) | |
| MSI Stealth 16 Studio A13VG | |
| Asus ROG Flow X16 GV601V | |
| Gigabyte AERO 16 OLED BSF | |
| Medio Intel Core i7-13700H (2322 - 7674, n=29) | |
| Acer Nitro 16 AN16-41 | |
| Corsair Voyager a1600 | |
| Cinebench R20 / CPU (Single Core) | |
| Media de la clase Gaming (442 - 913, n=106, últimos 2 años) | |
| Medion Erazer Major X20 | |
| Asus ROG Flow X16 GV601V | |
| MSI Stealth 16 Studio A13VG | |
| Medio Intel Core i7-13700H (508 - 741, n=29) | |
| Gigabyte AERO 16 OLED BSF | |
| Acer Nitro 16 AN16-41 | |
| Corsair Voyager a1600 | |
| Cinebench R15 / CPU Multi 64Bit | |
| Medion Erazer Major X20 | |
| Media de la clase Gaming (1578 - 6330, n=105, últimos 2 años) | |
| Asus ROG Flow X16 GV601V | |
| Gigabyte AERO 16 OLED BSF | |
| MSI Stealth 16 Studio A13VG | |
| Medio Intel Core i7-13700H (905 - 2982, n=29) | |
| Acer Nitro 16 AN16-41 | |
| Corsair Voyager a1600 | |
| Cinebench R15 / CPU Single 64Bit | |
| Medion Erazer Major X20 | |
| Media de la clase Gaming (188.8 - 350, n=106, últimos 2 años) | |
| Asus ROG Flow X16 GV601V | |
| MSI Stealth 16 Studio A13VG | |
| Medio Intel Core i7-13700H (213 - 278, n=29) | |
| Acer Nitro 16 AN16-41 | |
| Corsair Voyager a1600 | |
| Gigabyte AERO 16 OLED BSF | |
| Blender / v2.79 BMW27 CPU | |
| Medio Intel Core i7-13700H (169 - 555, n=29) | |
| Corsair Voyager a1600 | |
| Acer Nitro 16 AN16-41 | |
| Asus ROG Flow X16 GV601V | |
| Gigabyte AERO 16 OLED BSF | |
| MSI Stealth 16 Studio A13VG | |
| Media de la clase Gaming (79 - 330, n=104, últimos 2 años) | |
| Medion Erazer Major X20 | |
| 7-Zip 18.03 / 7z b 4 | |
| Medion Erazer Major X20 | |
| Media de la clase Gaming (33491 - 148086, n=105, últimos 2 años) | |
| MSI Stealth 16 Studio A13VG | |
| Gigabyte AERO 16 OLED BSF | |
| Asus ROG Flow X16 GV601V | |
| Corsair Voyager a1600 | |
| Acer Nitro 16 AN16-41 | |
| Medio Intel Core i7-13700H (27322 - 76344, n=29) | |
| 7-Zip 18.03 / 7z b 4 -mmt1 | |
| Medion Erazer Major X20 | |
| Media de la clase Gaming (4199 - 7436, n=105, últimos 2 años) | |
| Asus ROG Flow X16 GV601V | |
| MSI Stealth 16 Studio A13VG | |
| Medio Intel Core i7-13700H (4825 - 6238, n=29) | |
| Corsair Voyager a1600 | |
| Acer Nitro 16 AN16-41 | |
| Gigabyte AERO 16 OLED BSF | |
| Geekbench 5.5 / Multi-Core | |
| Medion Erazer Major X20 | |
| Media de la clase Gaming (6460 - 28263, n=105, últimos 2 años) | |
| Asus ROG Flow X16 GV601V | |
| Gigabyte AERO 16 OLED BSF | |
| MSI Stealth 16 Studio A13VG | |
| Medio Intel Core i7-13700H (6165 - 14215, n=29) | |
| Corsair Voyager a1600 | |
| Acer Nitro 16 AN16-41 | |
| Geekbench 5.5 / Single-Core | |
| Media de la clase Gaming (986 - 2474, n=105, últimos 2 años) | |
| Medion Erazer Major X20 | |
| Asus ROG Flow X16 GV601V | |
| MSI Stealth 16 Studio A13VG | |
| Medio Intel Core i7-13700H (1362 - 1919, n=29) | |
| Gigabyte AERO 16 OLED BSF | |
| Acer Nitro 16 AN16-41 | |
| Corsair Voyager a1600 | |
| HWBOT x265 Benchmark v2.2 / 4k Preset | |
| Medion Erazer Major X20 | |
| Media de la clase Gaming (11.5 - 44.4, n=105, últimos 2 años) | |
| Asus ROG Flow X16 GV601V | |
| Gigabyte AERO 16 OLED BSF | |
| MSI Stealth 16 Studio A13VG | |
| Acer Nitro 16 AN16-41 | |
| Corsair Voyager a1600 | |
| Medio Intel Core i7-13700H (6.72 - 21.2, n=29) | |
| LibreOffice / 20 Documents To PDF | |
| Gigabyte AERO 16 OLED BSF | |
| Corsair Voyager a1600 | |
| MSI Stealth 16 Studio A13VG | |
| Acer Nitro 16 AN16-41 | |
| Media de la clase Gaming (33.2 - 88.8, n=105, últimos 2 años) | |
| Medio Intel Core i7-13700H (31.3 - 62.4, n=29) | |
| Medion Erazer Major X20 | |
| Asus ROG Flow X16 GV601V | |
| R Benchmark 2.5 / Overall mean | |
| Acer Nitro 16 AN16-41 | |
| Gigabyte AERO 16 OLED BSF | |
| Corsair Voyager a1600 | |
| Medio Intel Core i7-13700H (0.4308 - 0.607, n=29) | |
| MSI Stealth 16 Studio A13VG | |
| Media de la clase Gaming (0.3439 - 0.759, n=106, últimos 2 años) | |
| Asus ROG Flow X16 GV601V | |
| Medion Erazer Major X20 | |
* ... más pequeño es mejor
AIDA64: FP32 Ray-Trace | FPU Julia | CPU SHA3 | CPU Queen | FPU SinJulia | FPU Mandel | CPU AES | CPU ZLib | FP64 Ray-Trace | CPU PhotoWorxx
| Performance rating | |
| Media de la clase Gaming | |
| Medion Erazer Major X20 | |
| Gigabyte AERO 16 OLED BSF | |
| Corsair Voyager a1600 | |
| MSI Stealth 16 Studio A13VG | |
| Asus ROG Flow X16 GV601V | |
| Acer Nitro 16 AN16-41 | |
| Medio Intel Core i7-13700H | |
| AIDA64 / FP32 Ray-Trace | |
| Media de la clase Gaming (10227 - 85542, n=105, últimos 2 años) | |
| Medion Erazer Major X20 | |
| Gigabyte AERO 16 OLED BSF | |
| MSI Stealth 16 Studio A13VG | |
| Acer Nitro 16 AN16-41 | |
| Corsair Voyager a1600 | |
| Medio Intel Core i7-13700H (4986 - 18908, n=29) | |
| Asus ROG Flow X16 GV601V | |
| AIDA64 / FPU Julia | |
| Media de la clase Gaming (51376 - 238426, n=105, últimos 2 años) | |
| Medion Erazer Major X20 | |
| Acer Nitro 16 AN16-41 | |
| Corsair Voyager a1600 | |
| Gigabyte AERO 16 OLED BSF | |
| Asus ROG Flow X16 GV601V | |
| MSI Stealth 16 Studio A13VG | |
| Medio Intel Core i7-13700H (25360 - 92359, n=29) | |
| AIDA64 / CPU SHA3 | |
| Media de la clase Gaming (2180 - 10115, n=105, últimos 2 años) | |
| Medion Erazer Major X20 | |
| Asus ROG Flow X16 GV601V | |
| Gigabyte AERO 16 OLED BSF | |
| MSI Stealth 16 Studio A13VG | |
| Acer Nitro 16 AN16-41 | |
| Corsair Voyager a1600 | |
| Medio Intel Core i7-13700H (1339 - 4224, n=29) | |
| AIDA64 / CPU Queen | |
| Medion Erazer Major X20 | |
| Media de la clase Gaming (49785 - 173351, n=90, últimos 2 años) | |
| Asus ROG Flow X16 GV601V | |
| Acer Nitro 16 AN16-41 | |
| MSI Stealth 16 Studio A13VG | |
| Corsair Voyager a1600 | |
| Medio Intel Core i7-13700H (59324 - 107159, n=29) | |
| Gigabyte AERO 16 OLED BSF | |
| AIDA64 / FPU SinJulia | |
| Medion Erazer Major X20 | |
| Media de la clase Gaming (4424 - 33636, n=105, últimos 2 años) | |
| Acer Nitro 16 AN16-41 | |
| Corsair Voyager a1600 | |
| Asus ROG Flow X16 GV601V | |
| MSI Stealth 16 Studio A13VG | |
| Gigabyte AERO 16 OLED BSF | |
| Medio Intel Core i7-13700H (4800 - 11050, n=29) | |
| AIDA64 / FPU Mandel | |
| Media de la clase Gaming (25115 - 128721, n=105, últimos 2 años) | |
| Medion Erazer Major X20 | |
| Acer Nitro 16 AN16-41 | |
| Corsair Voyager a1600 | |
| Gigabyte AERO 16 OLED BSF | |
| MSI Stealth 16 Studio A13VG | |
| Asus ROG Flow X16 GV601V | |
| Medio Intel Core i7-13700H (12321 - 45118, n=29) | |
| AIDA64 / CPU AES | |
| Gigabyte AERO 16 OLED BSF | |
| Corsair Voyager a1600 | |
| Medion Erazer Major X20 | |
| Media de la clase Gaming (39258 - 247074, n=105, últimos 2 años) | |
| Asus ROG Flow X16 GV601V | |
| MSI Stealth 16 Studio A13VG | |
| Medio Intel Core i7-13700H (28769 - 151254, n=29) | |
| Acer Nitro 16 AN16-41 | |
| AIDA64 / CPU ZLib | |
| Medion Erazer Major X20 | |
| Media de la clase Gaming (574 - 2531, n=105, últimos 2 años) | |
| Asus ROG Flow X16 GV601V | |
| Gigabyte AERO 16 OLED BSF | |
| MSI Stealth 16 Studio A13VG | |
| Medio Intel Core i7-13700H (389 - 1215, n=29) | |
| Acer Nitro 16 AN16-41 | |
| Corsair Voyager a1600 | |
| AIDA64 / FP64 Ray-Trace | |
| Media de la clase Gaming (5509 - 45446, n=105, últimos 2 años) | |
| Medion Erazer Major X20 | |
| Gigabyte AERO 16 OLED BSF | |
| Asus ROG Flow X16 GV601V | |
| MSI Stealth 16 Studio A13VG | |
| Acer Nitro 16 AN16-41 | |
| Corsair Voyager a1600 | |
| Medio Intel Core i7-13700H (2540 - 10135, n=29) | |
| AIDA64 / CPU PhotoWorxx | |
| MSI Stealth 16 Studio A13VG | |
| Media de la clase Gaming (12271 - 89891, n=105, últimos 2 años) | |
| Gigabyte AERO 16 OLED BSF | |
| Medion Erazer Major X20 | |
| Medio Intel Core i7-13700H (12872 - 52727, n=29) | |
| Asus ROG Flow X16 GV601V | |
| Corsair Voyager a1600 | |
| Acer Nitro 16 AN16-41 | |
Rendimiento del sistema
en términos de rendimiento del sistema, el MSI Stealth 16 Studio A13VG se aseguró un lugar en la mitad de la tabla en nuestras pruebas de benchmark. Con un seis y un nueve por ciento, respectivamente, la diferencia con el primer puesto es relativamente pequeña. Sin embargo, el rendimiento del sistema es excelente y está por encima de la media de los portátiles para juegos lanzados en los últimos dos años. Cuando se trata de las pruebas AIDA64, el MSI Stealth 16 Studio A13VG ofrece unos resultados consistentemente impecables gracias a su rápida RAM DDR5, con nuestro dispositivo de pruebas incluso consiguiendo el primer puesto.
CrossMark: Overall | Productivity | Creativity | Responsiveness
| PCMark 10 / Score | |
| Media de la clase Gaming (5828 - 12414, n=93, últimos 2 años) | |
| Gigabyte AERO 16 OLED BSF | |
| Asus ROG Flow X16 GV601V | |
| Medion Erazer Major X20 | |
| Medio Intel Core i7-13700H, NVIDIA GeForce RTX 4070 Laptop GPU (7158 - 7956, n=8) | |
| MSI Stealth 16 Studio A13VG | |
| Acer Nitro 16 AN16-41 | |
| Corsair Voyager a1600 | |
| PCMark 10 / Essentials | |
| Medion Erazer Major X20 | |
| Asus ROG Flow X16 GV601V | |
| Gigabyte AERO 16 OLED BSF | |
| Medio Intel Core i7-13700H, NVIDIA GeForce RTX 4070 Laptop GPU (10252 - 11449, n=8) | |
| Media de la clase Gaming (8810 - 11935, n=97, últimos 2 años) | |
| Acer Nitro 16 AN16-41 | |
| MSI Stealth 16 Studio A13VG | |
| Corsair Voyager a1600 | |
| PCMark 10 / Productivity | |
| Media de la clase Gaming (6845 - 25323, n=95, últimos 2 años) | |
| Asus ROG Flow X16 GV601V | |
| Medion Erazer Major X20 | |
| Medio Intel Core i7-13700H, NVIDIA GeForce RTX 4070 Laptop GPU (8501 - 10769, n=8) | |
| MSI Stealth 16 Studio A13VG | |
| Gigabyte AERO 16 OLED BSF | |
| Acer Nitro 16 AN16-41 | |
| Corsair Voyager a1600 | |
| PCMark 10 / Digital Content Creation | |
| Media de la clase Gaming (7602 - 19954, n=95, últimos 2 años) | |
| Gigabyte AERO 16 OLED BSF | |
| Corsair Voyager a1600 | |
| Asus ROG Flow X16 GV601V | |
| Medio Intel Core i7-13700H, NVIDIA GeForce RTX 4070 Laptop GPU (10358 - 12908, n=8) | |
| MSI Stealth 16 Studio A13VG | |
| Acer Nitro 16 AN16-41 | |
| Medion Erazer Major X20 | |
| CrossMark / Overall | |
| Media de la clase Gaming (1366 - 2409, n=94, últimos 2 años) | |
| Asus ROG Flow X16 GV601V | |
| Medio Intel Core i7-13700H, NVIDIA GeForce RTX 4070 Laptop GPU (1768 - 2073, n=6) | |
| Gigabyte AERO 16 OLED BSF | |
| Medion Erazer Major X20 | |
| MSI Stealth 16 Studio A13VG | |
| Acer Nitro 16 AN16-41 | |
| Corsair Voyager a1600 | |
| CrossMark / Productivity | |
| Asus ROG Flow X16 GV601V | |
| Media de la clase Gaming (1386 - 2254, n=94, últimos 2 años) | |
| Medio Intel Core i7-13700H, NVIDIA GeForce RTX 4070 Laptop GPU (1645 - 2006, n=6) | |
| Gigabyte AERO 16 OLED BSF | |
| MSI Stealth 16 Studio A13VG | |
| Medion Erazer Major X20 | |
| Acer Nitro 16 AN16-41 | |
| Corsair Voyager a1600 | |
| CrossMark / Creativity | |
| Media de la clase Gaming (1343 - 2786, n=94, últimos 2 años) | |
| Asus ROG Flow X16 GV601V | |
| Medion Erazer Major X20 | |
| Medio Intel Core i7-13700H, NVIDIA GeForce RTX 4070 Laptop GPU (1936 - 2137, n=6) | |
| Gigabyte AERO 16 OLED BSF | |
| MSI Stealth 16 Studio A13VG | |
| Acer Nitro 16 AN16-41 | |
| Corsair Voyager a1600 | |
| CrossMark / Responsiveness | |
| Gigabyte AERO 16 OLED BSF | |
| Medio Intel Core i7-13700H, NVIDIA GeForce RTX 4070 Laptop GPU (1451 - 2202, n=6) | |
| Media de la clase Gaming (1226 - 2334, n=94, últimos 2 años) | |
| Asus ROG Flow X16 GV601V | |
| MSI Stealth 16 Studio A13VG | |
| Medion Erazer Major X20 | |
| Acer Nitro 16 AN16-41 | |
| Corsair Voyager a1600 | |
| PCMark 10 Score | 7329 puntos | |
ayuda | ||
| AIDA64 / Memory Copy | |
| Media de la clase Gaming (21750 - 129946, n=105, últimos 2 años) | |
| MSI Stealth 16 Studio A13VG | |
| Medion Erazer Major X20 | |
| Gigabyte AERO 16 OLED BSF | |
| Medio Intel Core i7-13700H (24334 - 78081, n=29) | |
| Asus ROG Flow X16 GV601V | |
| Corsair Voyager a1600 | |
| Acer Nitro 16 AN16-41 | |
| AIDA64 / Memory Read | |
| Media de la clase Gaming (22956 - 118858, n=105, últimos 2 años) | |
| Medion Erazer Major X20 | |
| MSI Stealth 16 Studio A13VG | |
| Gigabyte AERO 16 OLED BSF | |
| Asus ROG Flow X16 GV601V | |
| Medio Intel Core i7-13700H (23681 - 79656, n=29) | |
| Corsair Voyager a1600 | |
| Acer Nitro 16 AN16-41 | |
| AIDA64 / Memory Write | |
| Media de la clase Gaming (22297 - 135096, n=105, últimos 2 años) | |
| MSI Stealth 16 Studio A13VG | |
| Gigabyte AERO 16 OLED BSF | |
| Medio Intel Core i7-13700H (22986 - 99898, n=29) | |
| Medion Erazer Major X20 | |
| Asus ROG Flow X16 GV601V | |
| Corsair Voyager a1600 | |
| Acer Nitro 16 AN16-41 | |
| AIDA64 / Memory Latency | |
| Media de la clase Gaming (75.3 - 259, n=105, últimos 2 años) | |
| Corsair Voyager a1600 | |
| Gigabyte AERO 16 OLED BSF | |
| Medio Intel Core i7-13700H (82.4 - 136.8, n=29) | |
| Acer Nitro 16 AN16-41 | |
| Asus ROG Flow X16 GV601V | |
| Medion Erazer Major X20 | |
| MSI Stealth 16 Studio A13VG | |
* ... más pequeño es mejor
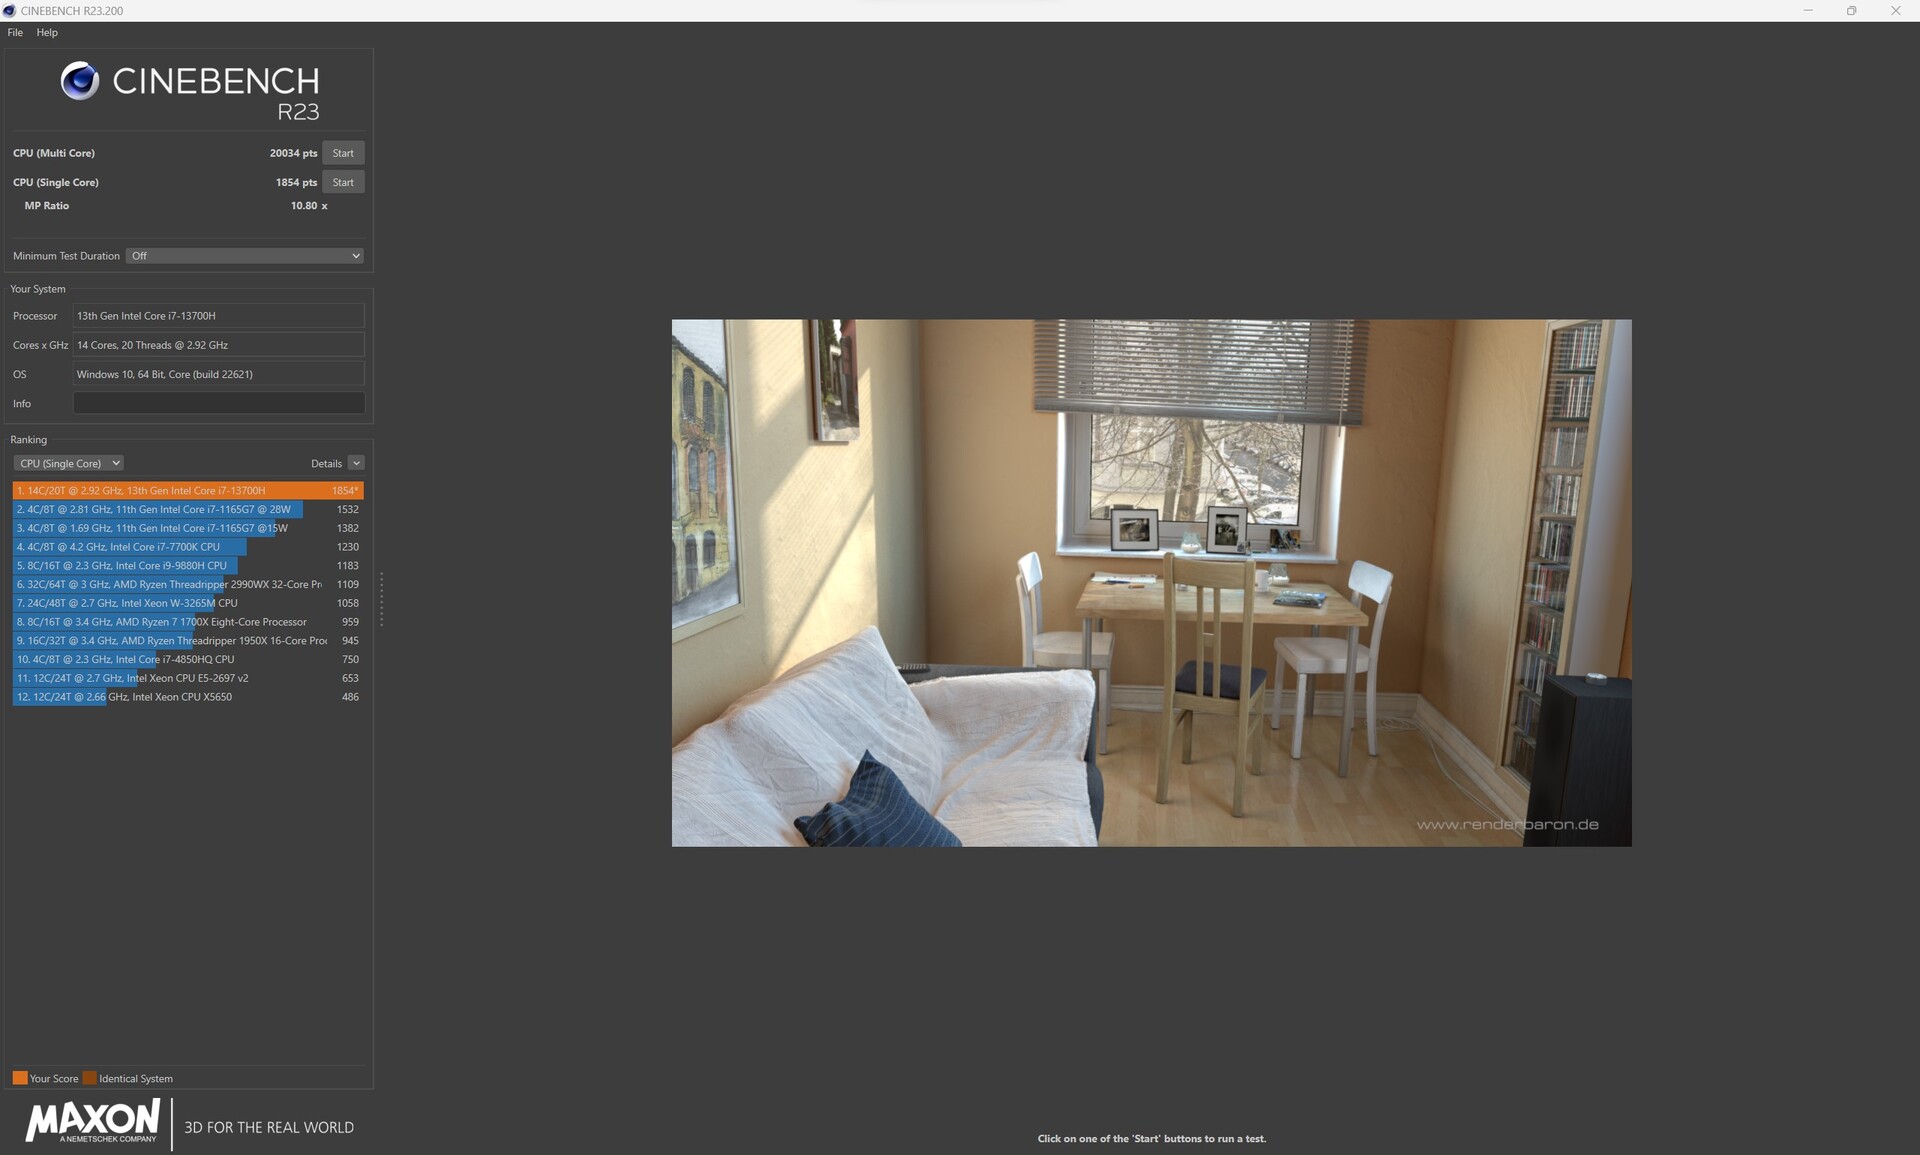
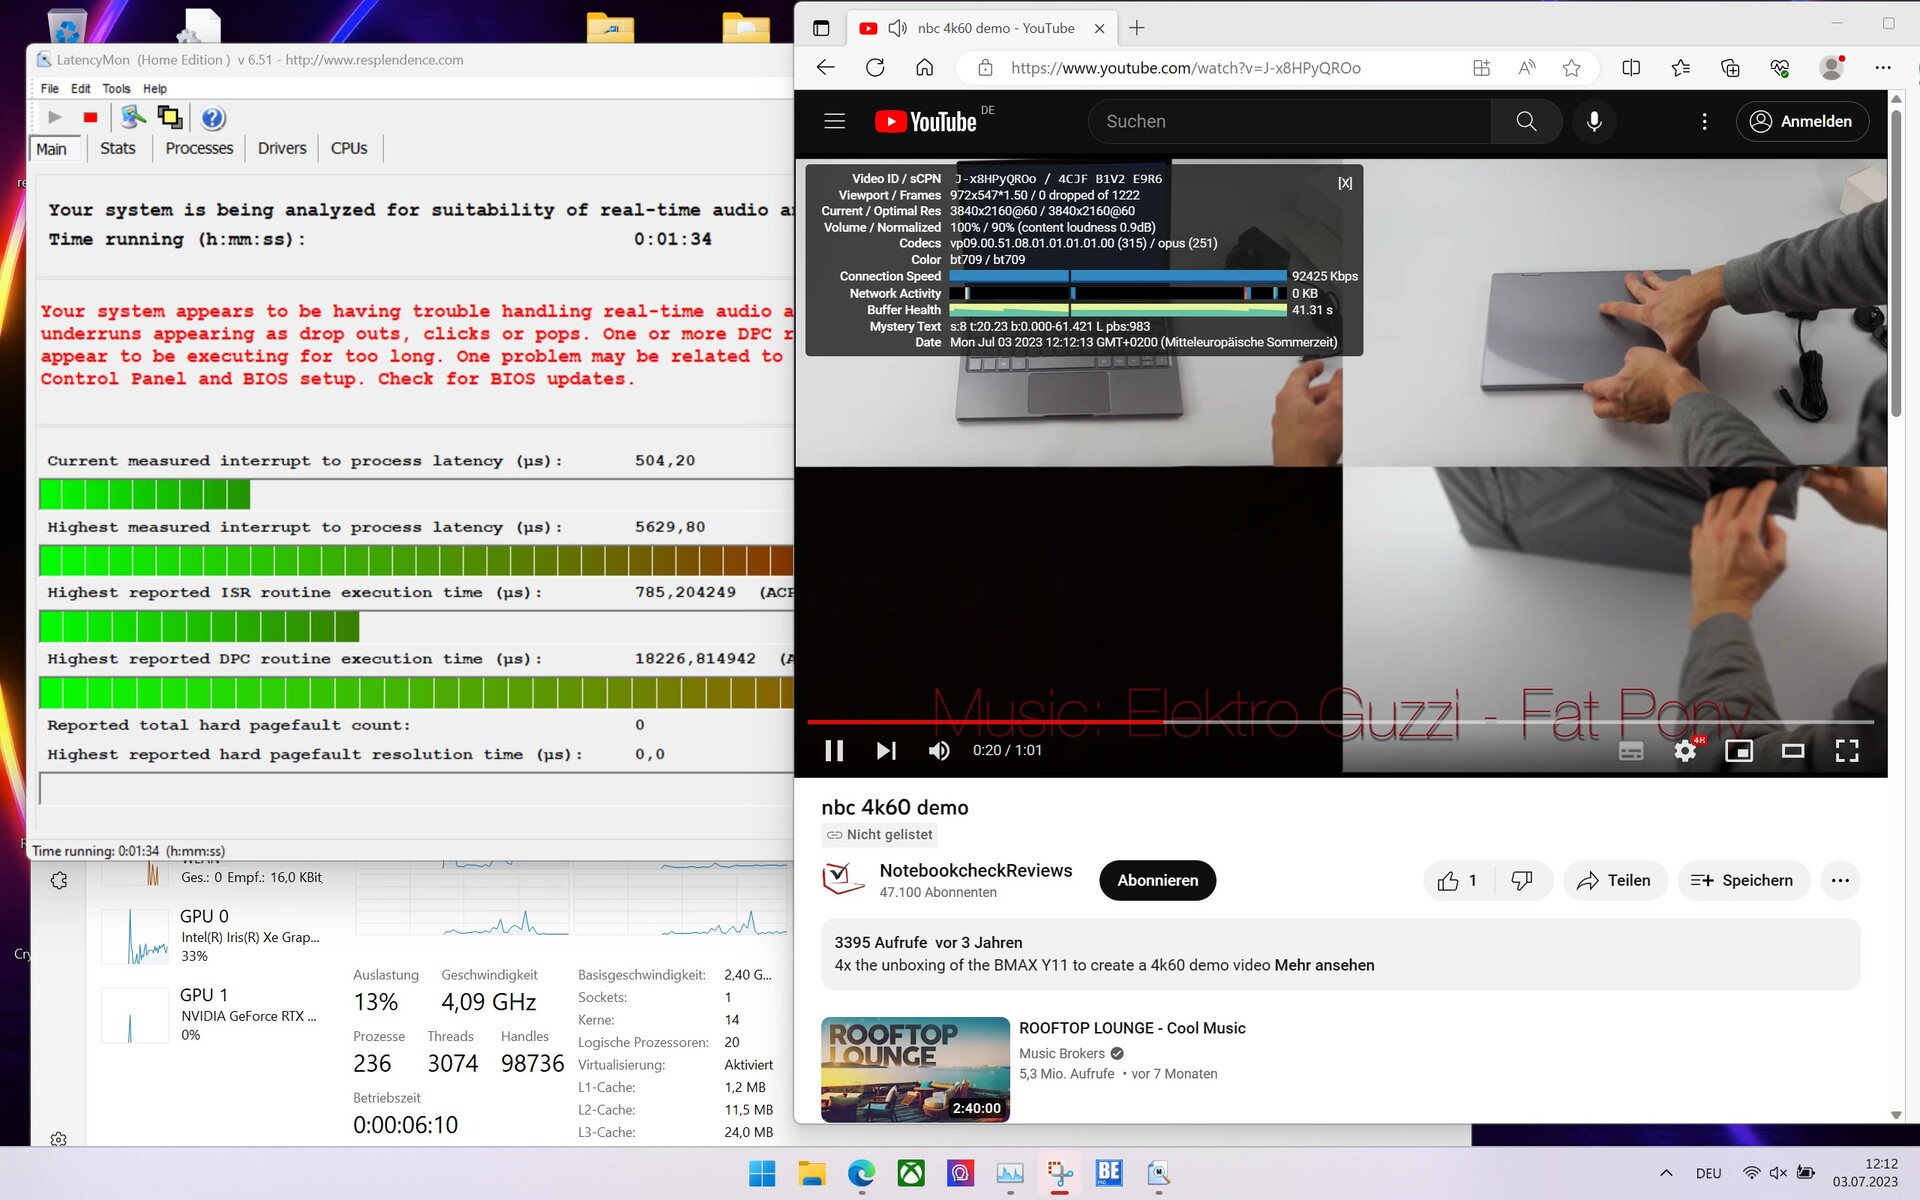
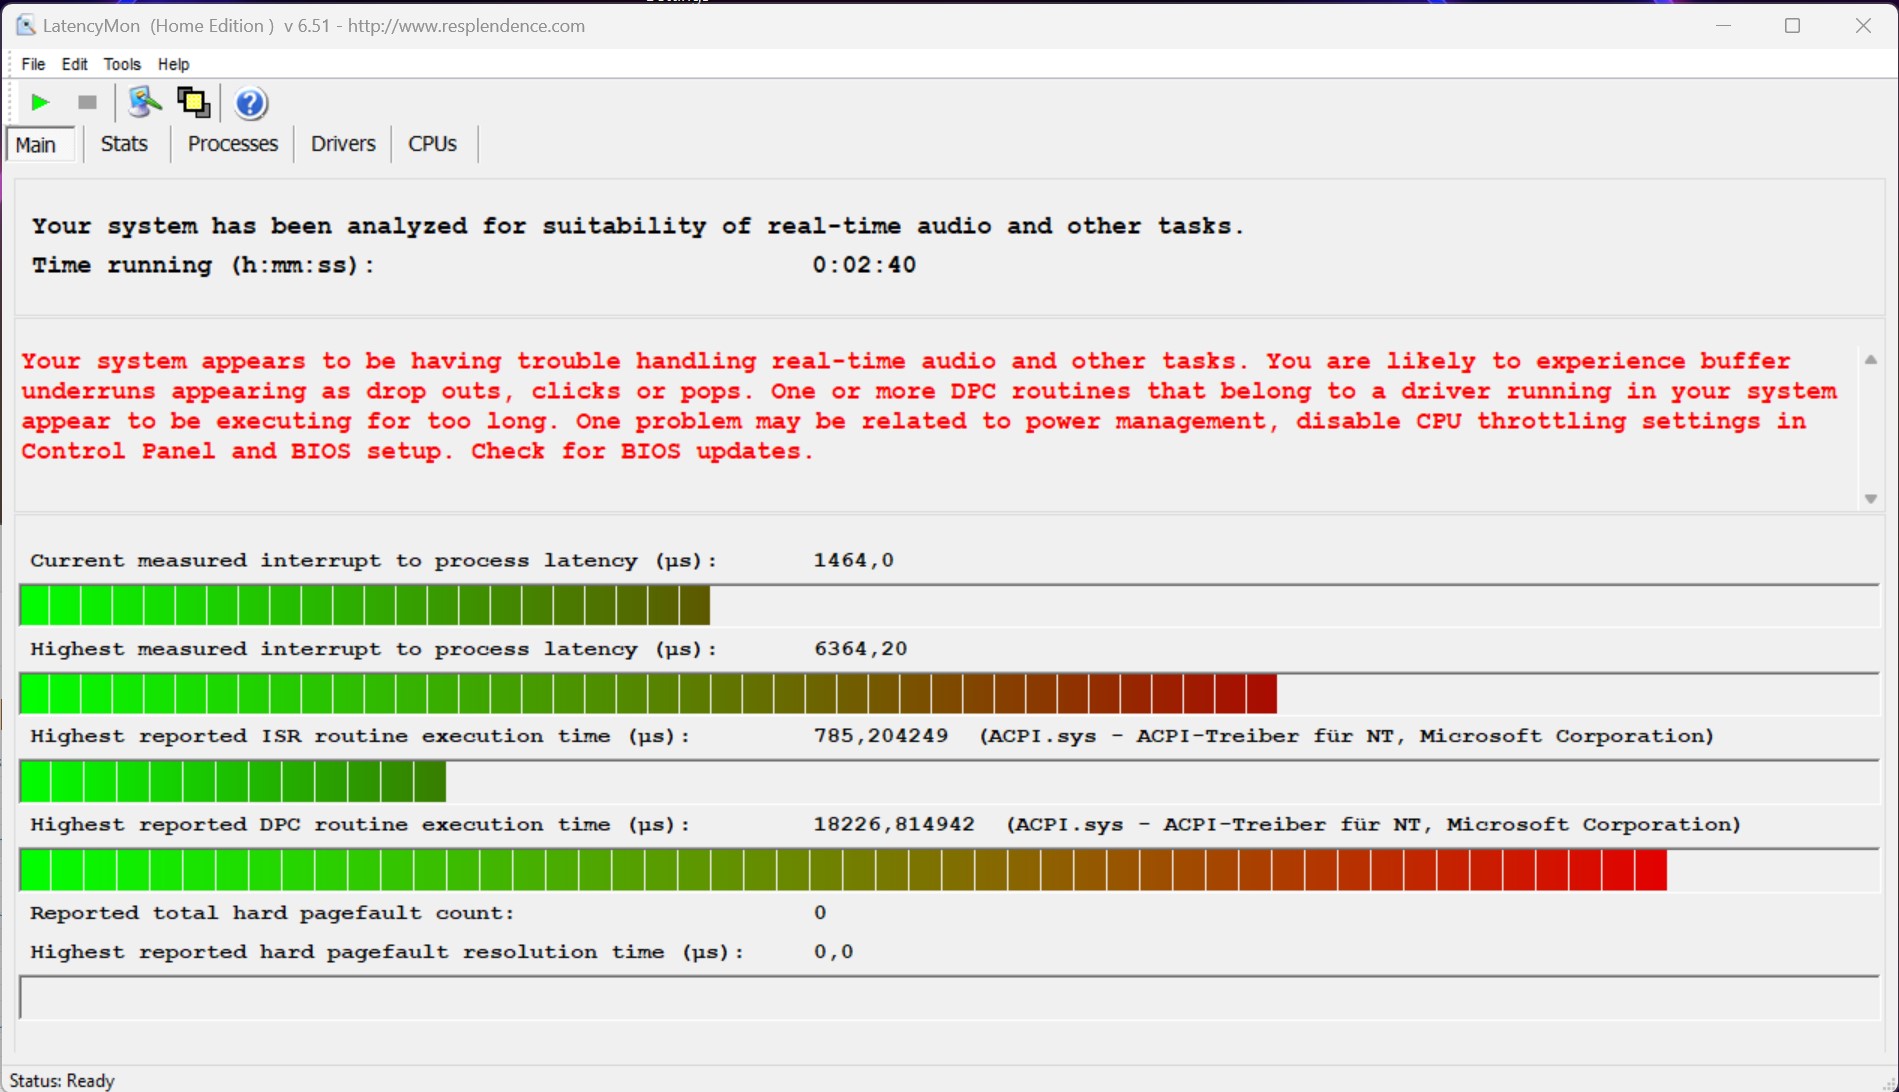
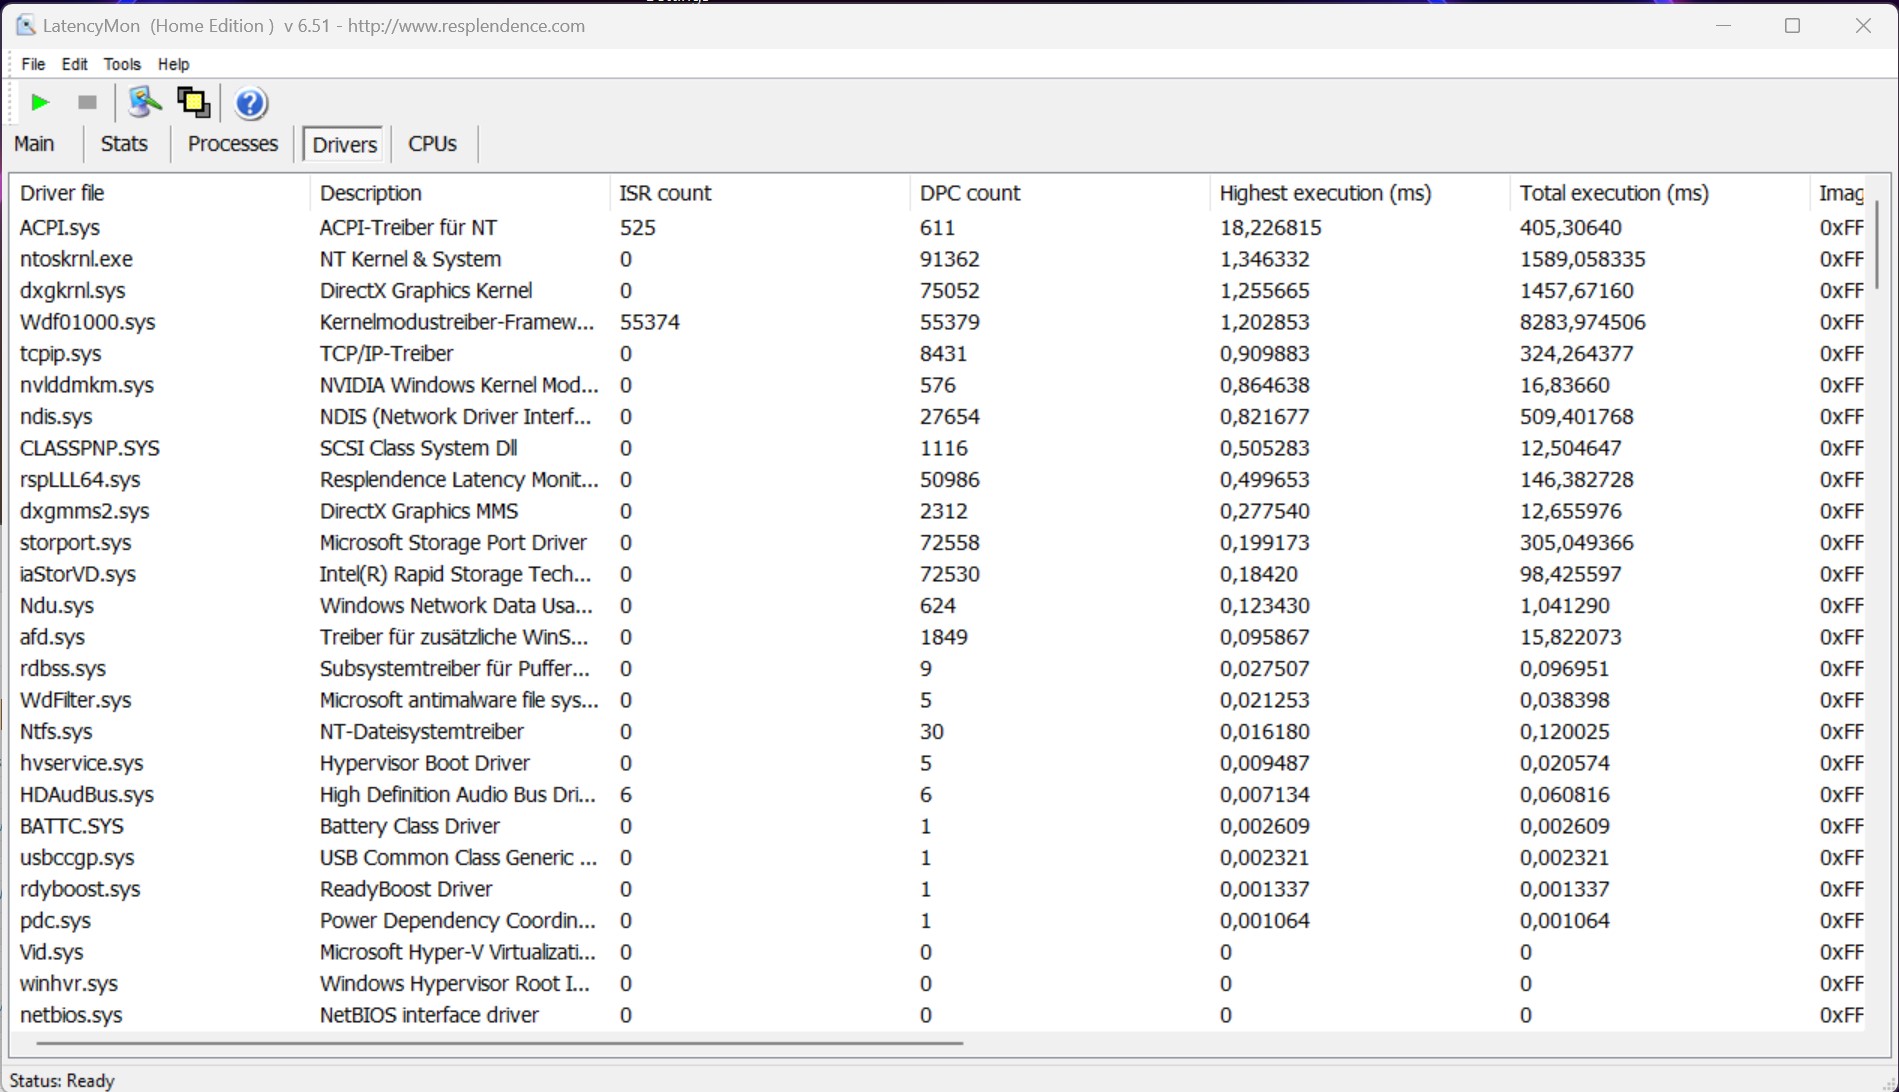
Latencias del CPD
El test estandarizado Latency Monitor del MSI Stealth 16 Studio A13VG (navegar por internet, reproducción de video 4K, Prime95 alta carga) devolvió valores extremos. Las futuras actualizaciones de software deberían asegurar mejoras para que el sistema pueda considerarse completamente adecuado para el procesado de vídeo y audio en tiempo real. Sin embargo, merece la pena mencionar que no se detectaron fotogramas saltados durante la reproducción de vídeo 4K.
| DPC Latencies / LatencyMon - interrupt to process latency (max), Web, Youtube, Prime95 | |
| MSI Stealth 16 Studio A13VG | |
| Medion Erazer Major X20 | |
| Acer Nitro 16 AN16-41 | |
| Asus ROG Flow X16 GV601V | |
| Gigabyte AERO 16 OLED BSF | |
| Corsair Voyager a1600 | |
* ... más pequeño es mejor
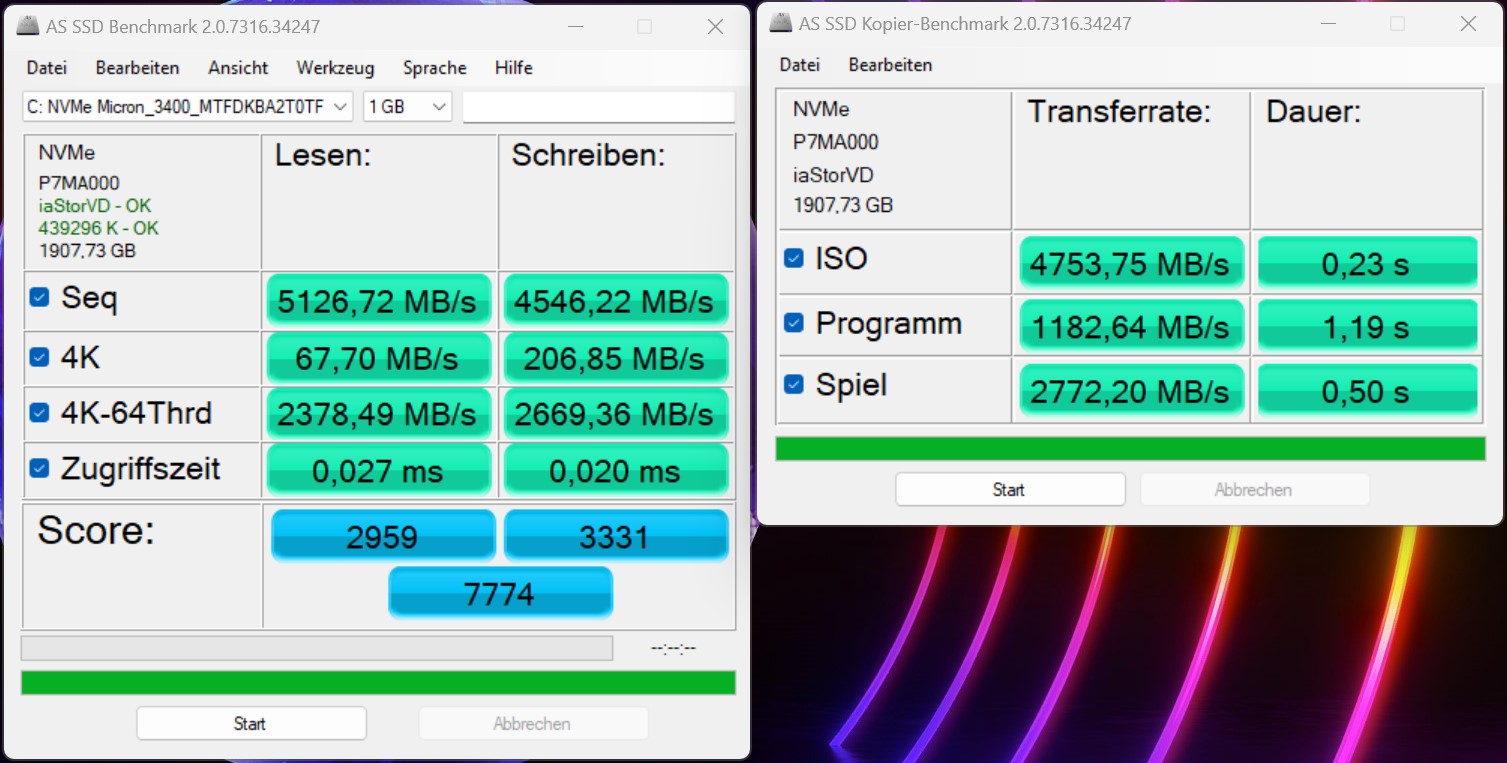
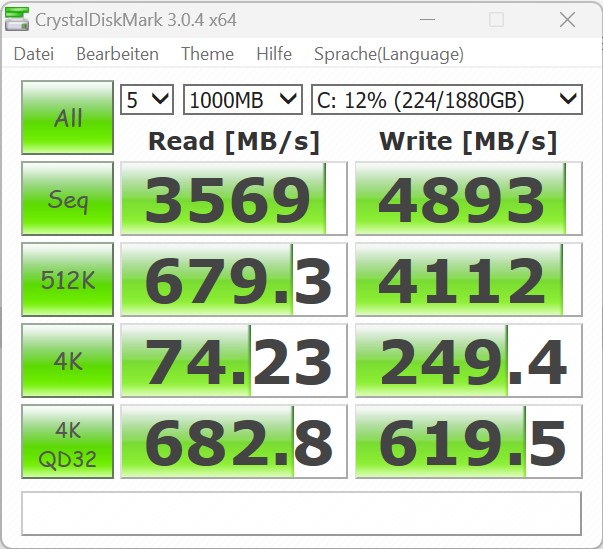
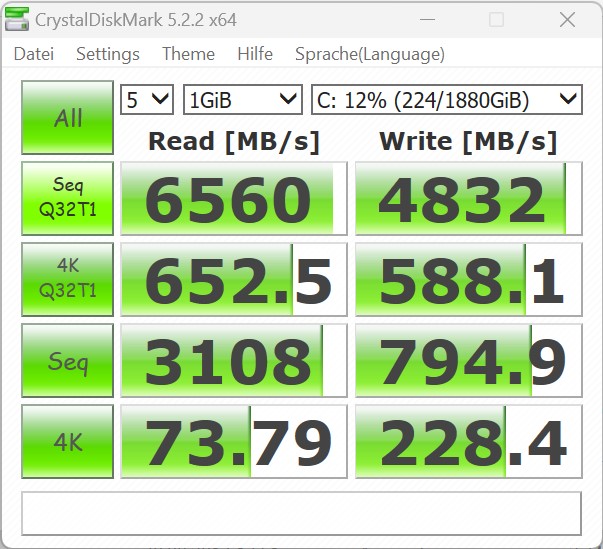
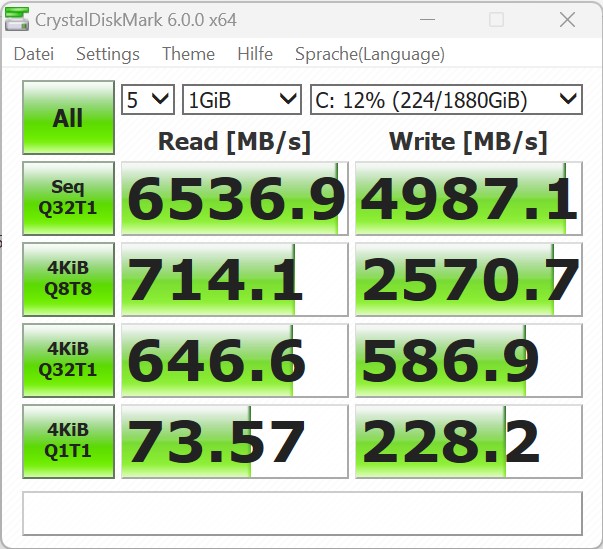
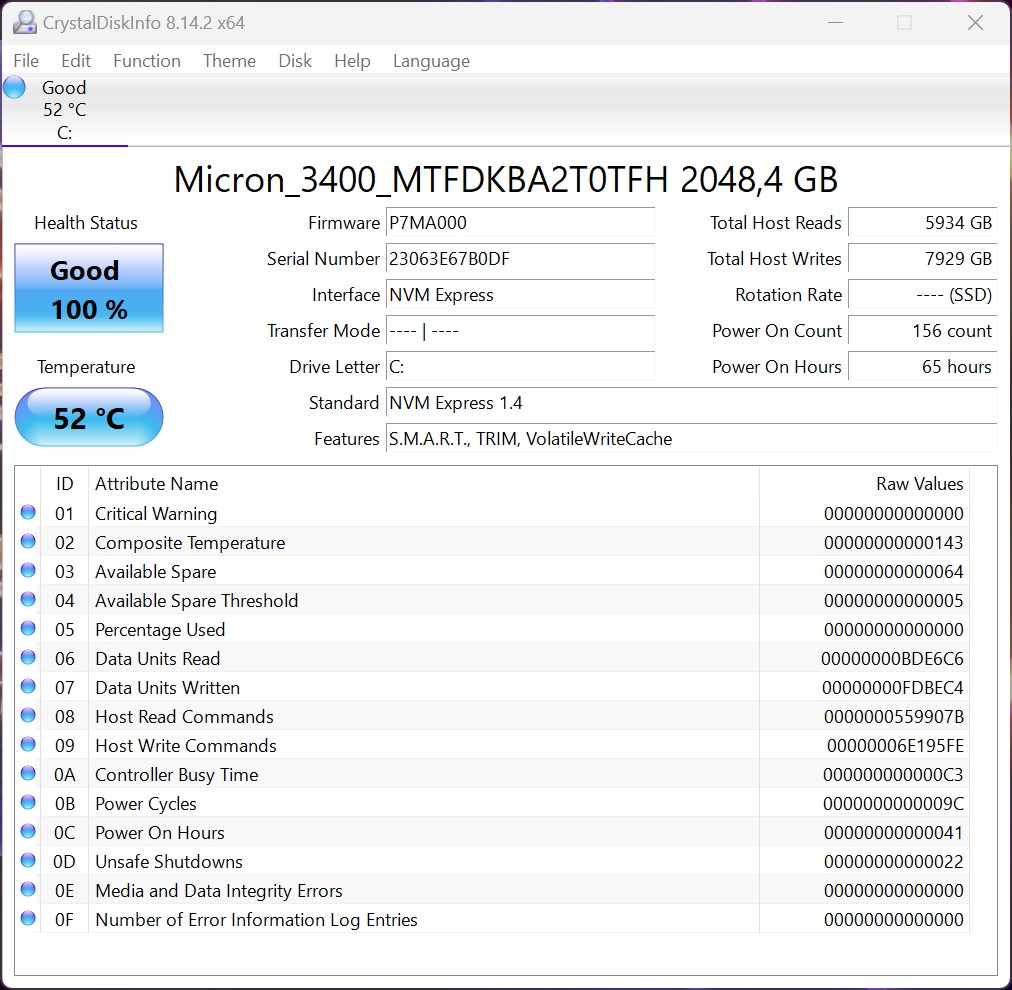
Almacenamiento masivo
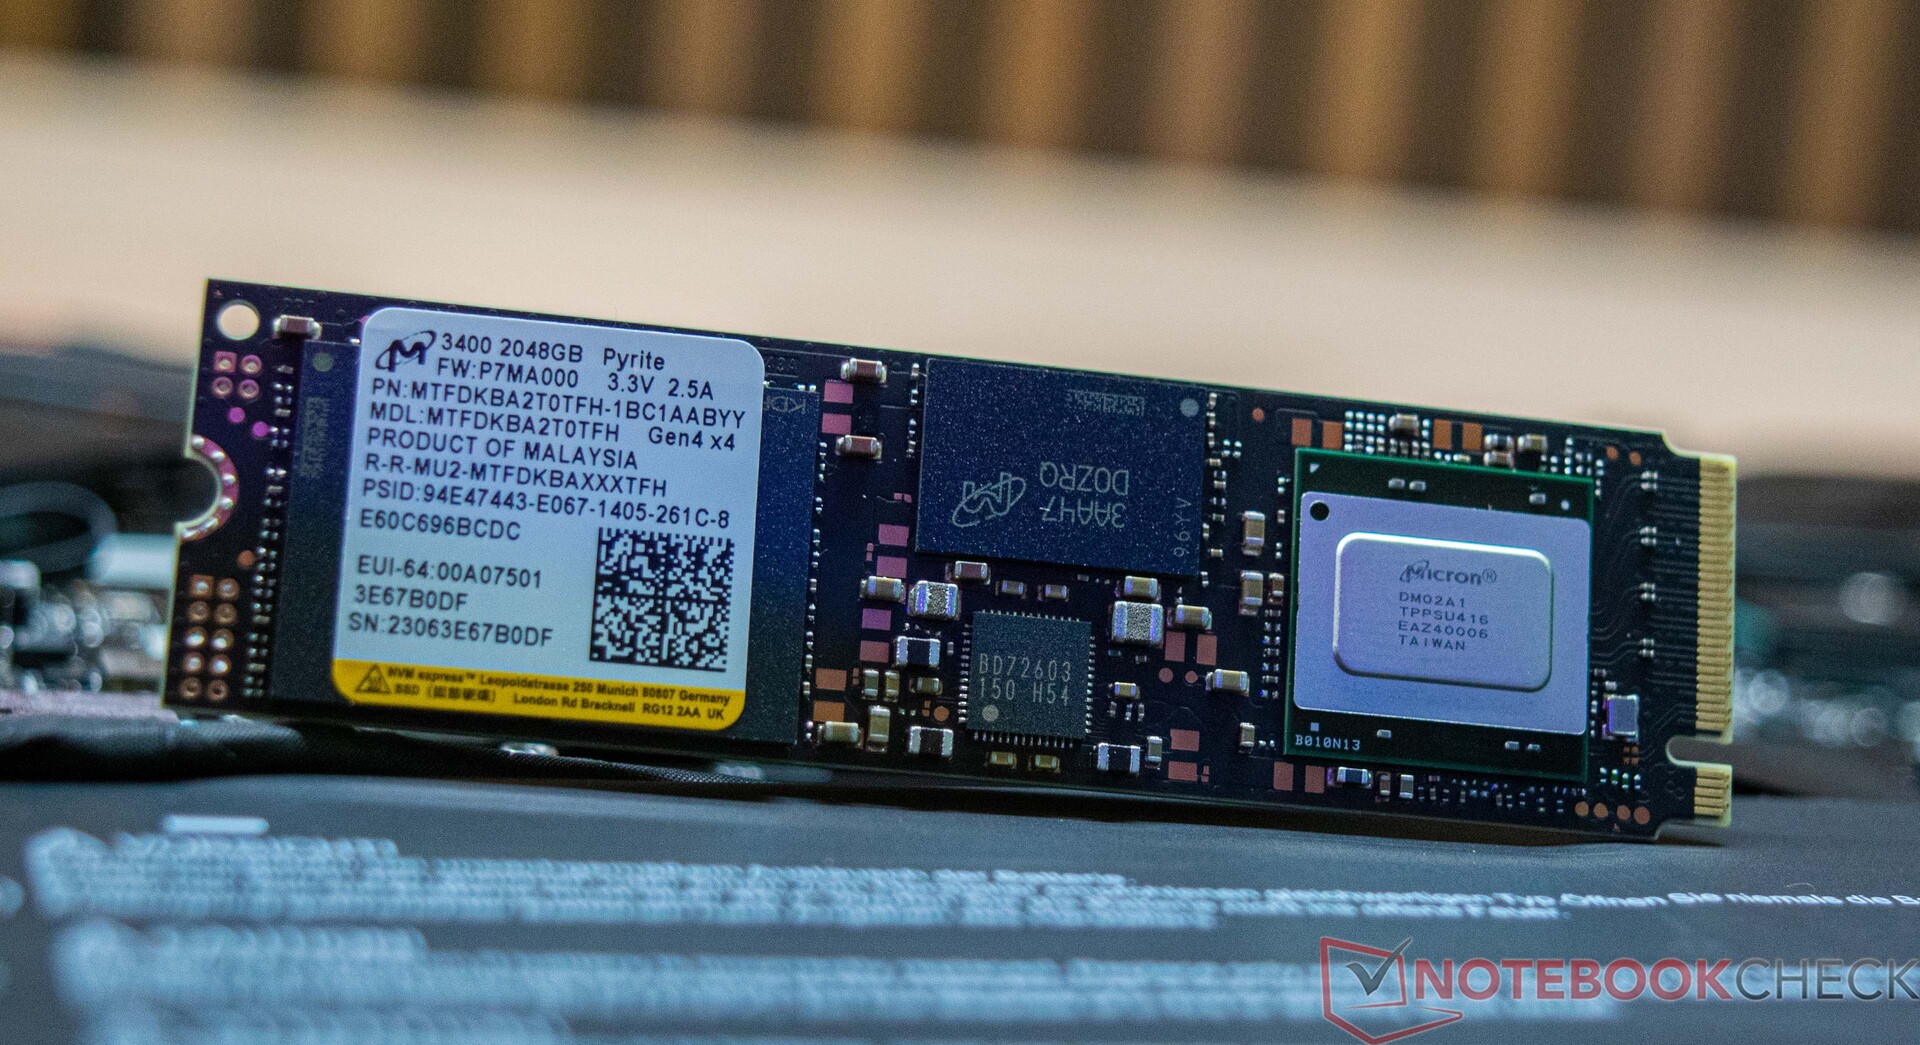
El almacenamiento masivo del MSI Stealth 16 Studio A13VG viene en forma de SSD de Micron. Con 2 TB, el modelo instalado ofrece mucho espacio de almacenamiento, respaldando así su uso previsto. En las pruebas, el SSD ofreció excelentes valores gracias a su conexión PCIe. Una vez más, esto ayudó a nuestro dispositivo de pruebas a asegurarse el primer puesto. Sin embargo, el MSI Stealth 16 Studio A13VG tuvo problemas permanentes de lectura y escritura hacia y desde el SSD con el rendimiento de lectura cayendo significativamente tras un corto periodo de carga continua. ElAcer Nitro 16fue el único otro dispositivo donde vimos una caída similar en el rendimiento. El MSI Stealth 16 Studio A13VG puede alojar un total de dos SSDs.
Para más comparaciones y benchmarks, echa un vistazo a nuestra tabla comparativa

* ... más pequeño es mejor
Continuous Performance Read: DiskSpd Read Loop, Queue Depth 8
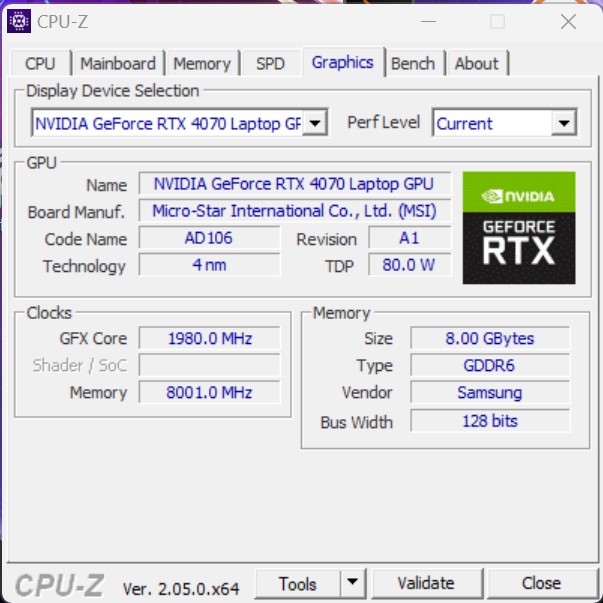
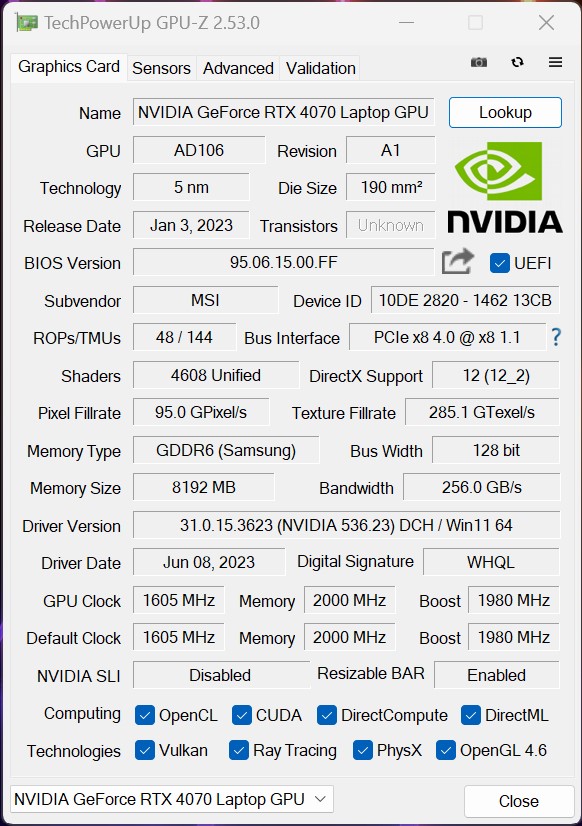
Tarjeta gráfica
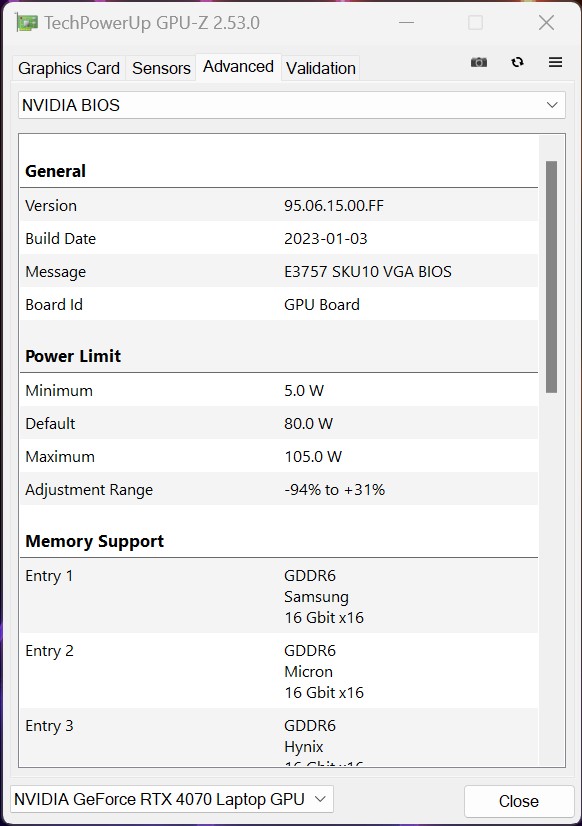
Das MSI Stealth 16 Studio A13VG se basa en unaGPU para portátiles Nvidia GeForce RTX 4070que tiene un TGP disponible de hasta 105 vatios. Esto quiere decir que la gráfica no alcanza el máximo TGP posible de hasta 115w. Sin embargo, en nuestra comparación, vimos que nuestro modelo de pruebas ofrecía un buen rendimiento 3D en pruebas sintéticas y su puntuación de rendimiento 3DMark fue casi suficiente para asegurarse el primer puesto.
Encontrará más pruebas comparativas de la GPU Nvidia GeForce RTX 4070 para portátiles aquí.
| 3DMark 05 Standard | 53254 puntos | |
| 3DMark 06 Standard Score | 63808 puntos | |
| 3DMark Vantage P Result | 94245 puntos | |
| 3DMark 11 Performance | 34960 puntos | |
| 3DMark Ice Storm Standard Score | 94921 puntos | |
| 3DMark Cloud Gate Standard Score | 63781 puntos | |
| 3DMark Fire Strike Score | 26244 puntos | |
| 3DMark Fire Strike Extreme Score | 13736 puntos | |
| 3DMark Time Spy Score | 11980 puntos | |
ayuda | ||
* ... más pequeño es mejor
Rendimiento de juego
La GPU para portátiles Nvidia GeForce RTX 4070empleada aquí es lo suficientemente rápida como para poder reproducir numerosos juegos con fluidez y mostrarlos a revolución nativa. Nuestras pruebas muestran que el Medion Erazer Major X20 ofrece un mejor rendimiento gráfico con el mismo adaptador gráfico. Comparado con el Gigabyte AERO 16, el MSI Stealth 16 Studio A13VG mostró un nivel de rendimiento casi idéntico. Además, también observamos que el AcerNitro 16de Acer, que también está equipado con unaGPU para portátiles Nvidia GeForce RTX 4070es claramente inferior. Sin embargo, no querríamos privarnos de los beneficios de la arquitectura Ada Lovelace que también está en las GPUs móviles. Esto significa que puedes usar funciones como DLSS 3 y Frame Generation, siempre que los propios juegos sean compatibles con esta tecnología. En ocasiones, esto puede suponer un aumento significativo de la velocidad de fotogramas.
| Performance rating - Percent | |
| Media de la clase Gaming | |
| Medion Erazer Major X20 | |
| Gigabyte AERO 16 OLED BSF | |
| MSI Stealth 16 Studio A13VG | |
| Asus ROG Flow X16 GV601V | |
| Acer Nitro 16 AN16-41 | |
| Corsair Voyager a1600 | |
| The Witcher 3 - 1920x1080 Ultra Graphics & Postprocessing (HBAO+) | |
| Media de la clase Gaming (104.7 - 240, n=7, últimos 2 años) | |
| Medion Erazer Major X20 | |
| MSI Stealth 16 Studio A13VG | |
| Gigabyte AERO 16 OLED BSF | |
| Acer Nitro 16 AN16-41 | |
| Corsair Voyager a1600 | |
| Asus ROG Flow X16 GV601V | |
| GTA V - 1920x1080 Highest AA:4xMSAA + FX AF:16x | |
| Media de la clase Gaming (48.3 - 186.9, n=94, últimos 2 años) | |
| Medion Erazer Major X20 | |
| Gigabyte AERO 16 OLED BSF | |
| MSI Stealth 16 Studio A13VG | |
| Asus ROG Flow X16 GV601V | |
| Acer Nitro 16 AN16-41 | |
| Corsair Voyager a1600 | |
| Final Fantasy XV Benchmark - 1920x1080 High Quality | |
| Media de la clase Gaming (41 - 215, n=95, últimos 2 años) | |
| Medion Erazer Major X20 | |
| Gigabyte AERO 16 OLED BSF | |
| MSI Stealth 16 Studio A13VG | |
| Acer Nitro 16 AN16-41 | |
| Asus ROG Flow X16 GV601V | |
| Corsair Voyager a1600 | |
| Strange Brigade - 1920x1080 ultra AA:ultra AF:16 | |
| Media de la clase Gaming (76.3 - 458, n=87, últimos 2 años) | |
| Medion Erazer Major X20 | |
| Corsair Voyager a1600 | |
| Gigabyte AERO 16 OLED BSF | |
| MSI Stealth 16 Studio A13VG | |
| Acer Nitro 16 AN16-41 | |
| Asus ROG Flow X16 GV601V | |
| Dota 2 Reborn - 1920x1080 ultra (3/3) best looking | |
| Medion Erazer Major X20 | |
| MSI Stealth 16 Studio A13VG | |
| Media de la clase Gaming (84.8 - 248, n=107, últimos 2 años) | |
| Asus ROG Flow X16 GV601V | |
| Gigabyte AERO 16 OLED BSF | |
| Corsair Voyager a1600 | |
| Acer Nitro 16 AN16-41 | |
Para comprobar la estabilidad de las frecuencias de cuadro durante largos periodos de tiempo, ejecutamos el juego The Witcher 3 durante unos 60 minutos a resolución Full HD y con los ajustes preestablecidos al máximo. Durante el proceso, el personaje del juego no se movió. El diagrama muestra un rendimiento de la frecuencia de imagen relativamente constante.
Witcher 3 FPS diagram
| bajo | medio | alto | ultra | QHD | |
|---|---|---|---|---|---|
| GTA V (2015) | 187 | 184.7 | 180.3 | 119.7 | 92.8 |
| The Witcher 3 (2015) | 452.3 | 390.5 | 226.7 | 119 | |
| Dota 2 Reborn (2015) | 189.6 | 169 | 160.5 | 154.7 | |
| Final Fantasy XV Benchmark (2018) | 202 | 154.2 | 115 | 83.8 | |
| X-Plane 11.11 (2018) | 158.5 | 142.4 | 110.2 | ||
| Far Cry 5 (2018) | 190 | 157 | 150 | 143 | 113 |
| Strange Brigade (2018) | 470 | 286 | 230 | 200 | 132 |
| Shadow of the Tomb Raider (2018) | 206 | 163.4 | 158.1 | 145.9 | 104 |
| Far Cry New Dawn (2019) | 165 | 140 | 135 | 120 | 105 |
| Metro Exodus (2019) | 221 | 141.3 | 109.8 | 87.2 | 69.1 |
| Borderlands 3 (2019) | 175.9 | 145.9 | 119.7 | 98.6 | 71.5 |
| F1 2020 (2020) | 331 | 276 | 235 | 183 | 142.6 |
| F1 2021 (2021) | 378 | 300 | 238 | 139.5 | 108.5 |
| Far Cry 6 (2021) | 168.8 | 143 | 126.5 | 114.5 | 86.7 |
| God of War (2022) | 143.1 | 119.5 | 95.6 | 68.8 | 58.5 |
| GRID Legends (2022) | 182.9 | 164.1 | 150.1 | 131.7 | 112.1 |
| Tiny Tina's Wonderlands (2022) | 230 | 190.1 | 130.3 | 101.7 | 70.5 |
| F1 22 (2022) | 256 | 246 | 183.4 | 76.7 | 49.7 |
| Uncharted Legacy of Thieves Collection (2022) | 94 | 92.4 | 86.2 | 82.7 | 61.2 |
| High On Life (2023) | 220 | 178.7 | 134.1 | 110.6 | 66.9 |
| Dead Space Remake (2023) | 102.8 | 98.2 | 86.7 | 86.5 | 56.5 |
| Returnal (2023) | 115 | 111 | 102 | 88 | 63 |
| Company of Heroes 3 (2023) | 211.8 | 191.4 | 156.5 | 153.9 | 114.8 |
| Resident Evil 4 Remake (2023) | 160.1 | 123.4 | 113.1 | 82.4 | 61.3 |
| The Last of Us (2023) | 114.4 | 96.5 | 85.5 | 75 | 43.9 |
| Star Wars Jedi Survivor (2023) | 92.1 | 80.6 | 75.6 | 71.1 | 47 |
| Diablo 4 (2023) | 255 | 233 | 208 | 177.8 | 105.4 |
| F1 23 (2023) | 230 | 232 | 189 | 71 | 45 |
Emisiones - Buena duración de la batería pero altas temperaturas
Emisiones sonoras
Cuando está en ralentí y en el uso diario de oficina trabajando con Office y realizando tareas basadas en internet, el MSI Stealth 16 Studio A13VG es silencioso. Sólo medimos un poco menos de 35 dB(A) bajo carga media donde se podía oír un silencioso pero audible zumbido. Bajo carga, puede volverse muy ruidoso con valores máximos de test de estrés de 51.5 dB(A). Con 62 dB(A), el Acer Nitro 16 AN16-41 demuestra que es posible llegar a ser significativamente más ruidoso.
Básicamente, el MSI Stealth 16 Studio A13VG también permite un funcionamiento casi silencioso. Para conseguirlo, debes seleccionar los perfiles de energía de modo "Silencioso" o "Super Batería", ambos seleccionables en el MSI Center.
También puedes tomar el control del ventilador a través del MSI Center. Además de los perfiles predefinidos, puedes crear tus propias curvas de ventilador.
Ruido
| Ocioso |
| 24 / 24 / 24 dB(A) |
| Carga |
| 34.81 / 51.57 dB(A) |
 | ||
30 dB silencioso 40 dB(A) audible 50 dB(A) ruidosamente alto |
||
min: | ||
| MSI Stealth 16 Studio A13VG GeForce RTX 4070 Laptop GPU, i7-13700H, Micron 3400 2TB MTFDKBA2T0TFH | Asus ROG Flow X16 GV601V GeForce RTX 4060 Laptop GPU, i9-13900H, WD PC SN560 SDDPNQE-1T00 | Medion Erazer Major X20 GeForce RTX 4070 Laptop GPU, i9-13900HX, Phison E18-1TB-PHISON-SSD-B47R | Acer Nitro 16 AN16-41 GeForce RTX 4070 Laptop GPU, R7 7735HS, Samsung PM9A1 MZVL21T0HCLR | Corsair Voyager a1600 Radeon RX 6800M, R9 6900HS, Samsung PM9A1 MZVL22T0HBLB | Gigabyte AERO 16 OLED BSF GeForce RTX 4070 Laptop GPU, i9-13900H, Gigabyte AG470S1TB-SI B10 | |
|---|---|---|---|---|---|---|
| Noise | -3% | -18% | -8% | -23% | -15% | |
| apagado / medio ambiente * (dB) | 24 | 24 -0% | 24 -0% | 25.7 -7% | 29.9 -25% | 23 4% |
| Idle Minimum * (dB) | 24 | 24 -0% | 25 -4% | 25.7 -7% | 30.5 -27% | 23 4% |
| Idle Average * (dB) | 24 | 24 -0% | 29 -21% | 25.7 -7% | 30.6 -28% | 23 4% |
| Idle Maximum * (dB) | 24 | 24 -0% | 31 -29% | 26.3 -10% | 30.7 -28% | 33.64 -40% |
| Load Average * (dB) | 34.81 | 36.71 -5% | 50 -44% | 33.9 3% | 44.5 -28% | 51.49 -48% |
| Witcher 3 ultra * (dB) | 44.05 | 50.92 -16% | 53 -20% | 55.27 -25% | ||
| Load Maximum * (dB) | 51.57 | 50.92 1% | 57 -11% | 62 -20% | 51.1 1% | 55.24 -7% |
* ... más pequeño es mejor
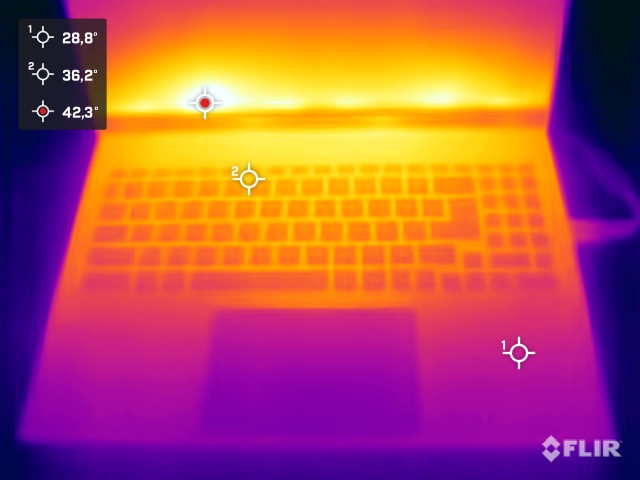
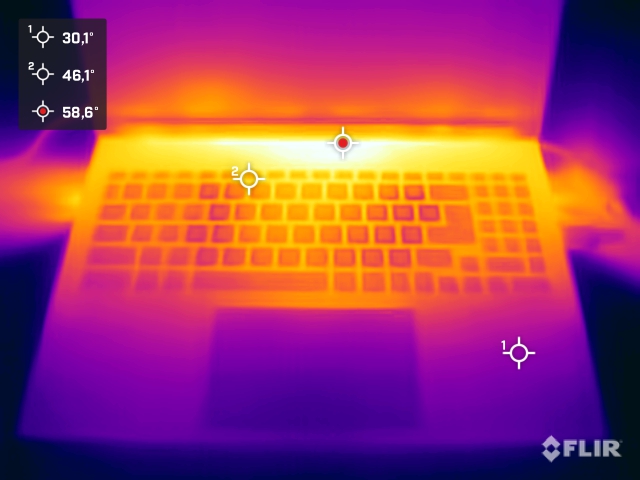
Temperatura
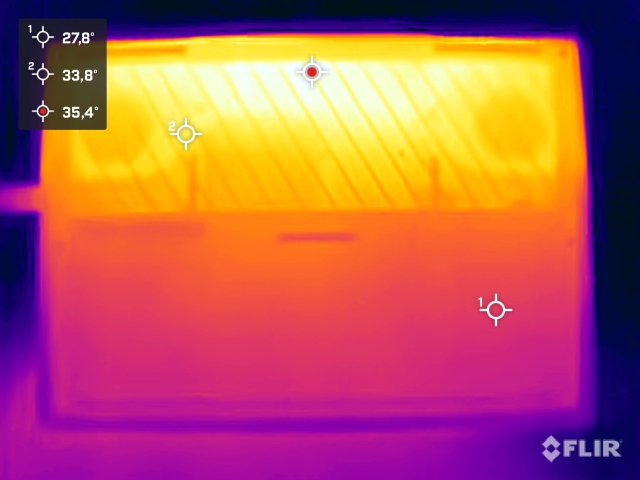
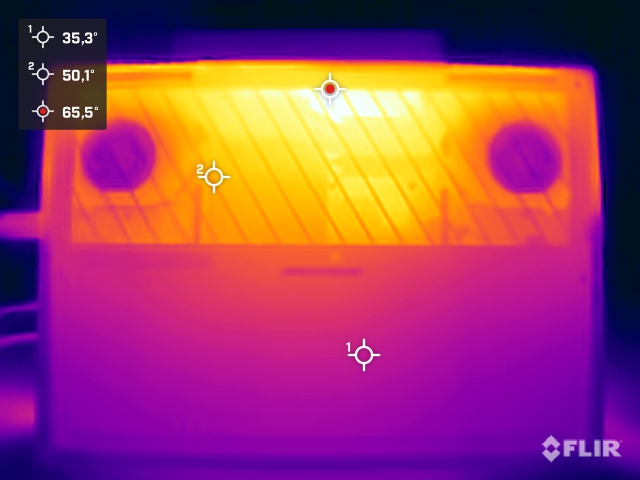
En la prueba de estrés, registramos altas temperaturas de la carcasa bajo carga y también al jugar. Con más de 60 °C, las temperaturas son más altas en los lados superior e inferior del portátil que en sus compañeros. Como resultado, puede resultar incómodo usar el dispositivo sobre el regazo bajo carga.
(-) La temperatura máxima en la parte superior es de 60 °C / 140 F, frente a la media de 40.4 °C / 105 F, que oscila entre 21.2 y 68.8 °C para la clase Gaming.
(-) El fondo se calienta hasta un máximo de 61 °C / 142 F, frente a la media de 43.2 °C / 110 F
(±) En reposo, la temperatura media de la parte superior es de 33.2 °C / 92# F, frente a la media del dispositivo de 33.9 °C / 93 F.
(-) Jugando a The Witcher 3, la temperatura media de la parte superior es de 44.7 °C / 112 F, frente a la media del dispositivo de 33.9 °C / 93 F.
(±) El reposamanos y el touchpad pueden calentarse mucho al tacto con un máximo de 36 °C / 96.8 F.
(-) La temperatura media de la zona del reposamanos de dispositivos similares fue de 28.8 °C / 83.8 F (-7.2 °C / -13 F).
| MSI Stealth 16 Studio A13VG Intel Core i7-13700H, NVIDIA GeForce RTX 4070 Laptop GPU | Asus ROG Flow X16 GV601V Intel Core i9-13900H, NVIDIA GeForce RTX 4060 Laptop GPU | Medion Erazer Major X20 Intel Core i9-13900HX, NVIDIA GeForce RTX 4070 Laptop GPU | Acer Nitro 16 AN16-41 AMD Ryzen 7 7735HS, NVIDIA GeForce RTX 4070 Laptop GPU | Corsair Voyager a1600 AMD Ryzen 9 6900HS, AMD Radeon RX 6800M | Gigabyte AERO 16 OLED BSF Intel Core i9-13900H, NVIDIA GeForce RTX 4070 Laptop GPU | |
|---|---|---|---|---|---|---|
| Heat | 19% | 11% | 18% | 11% | 34% | |
| Maximum Upper Side * (°C) | 60 | 46 23% | 46 23% | 41.5 31% | 50.7 15% | 41 32% |
| Maximum Bottom * (°C) | 61 | 41 33% | 49 20% | 51.8 15% | 54.2 11% | 47 23% |
| Idle Upper Side * (°C) | 38.2 | 36 6% | 37 3% | 31.6 17% | 35.8 6% | 23 40% |
| Idle Bottom * (°C) | 37.7 | 33 12% | 38 -1% | 34.5 8% | 33 12% | 23 39% |
* ... más pequeño es mejor
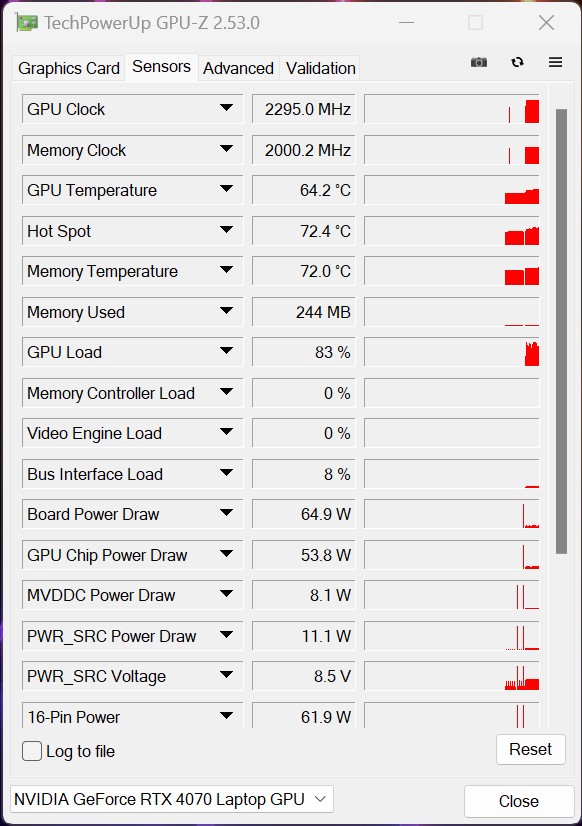
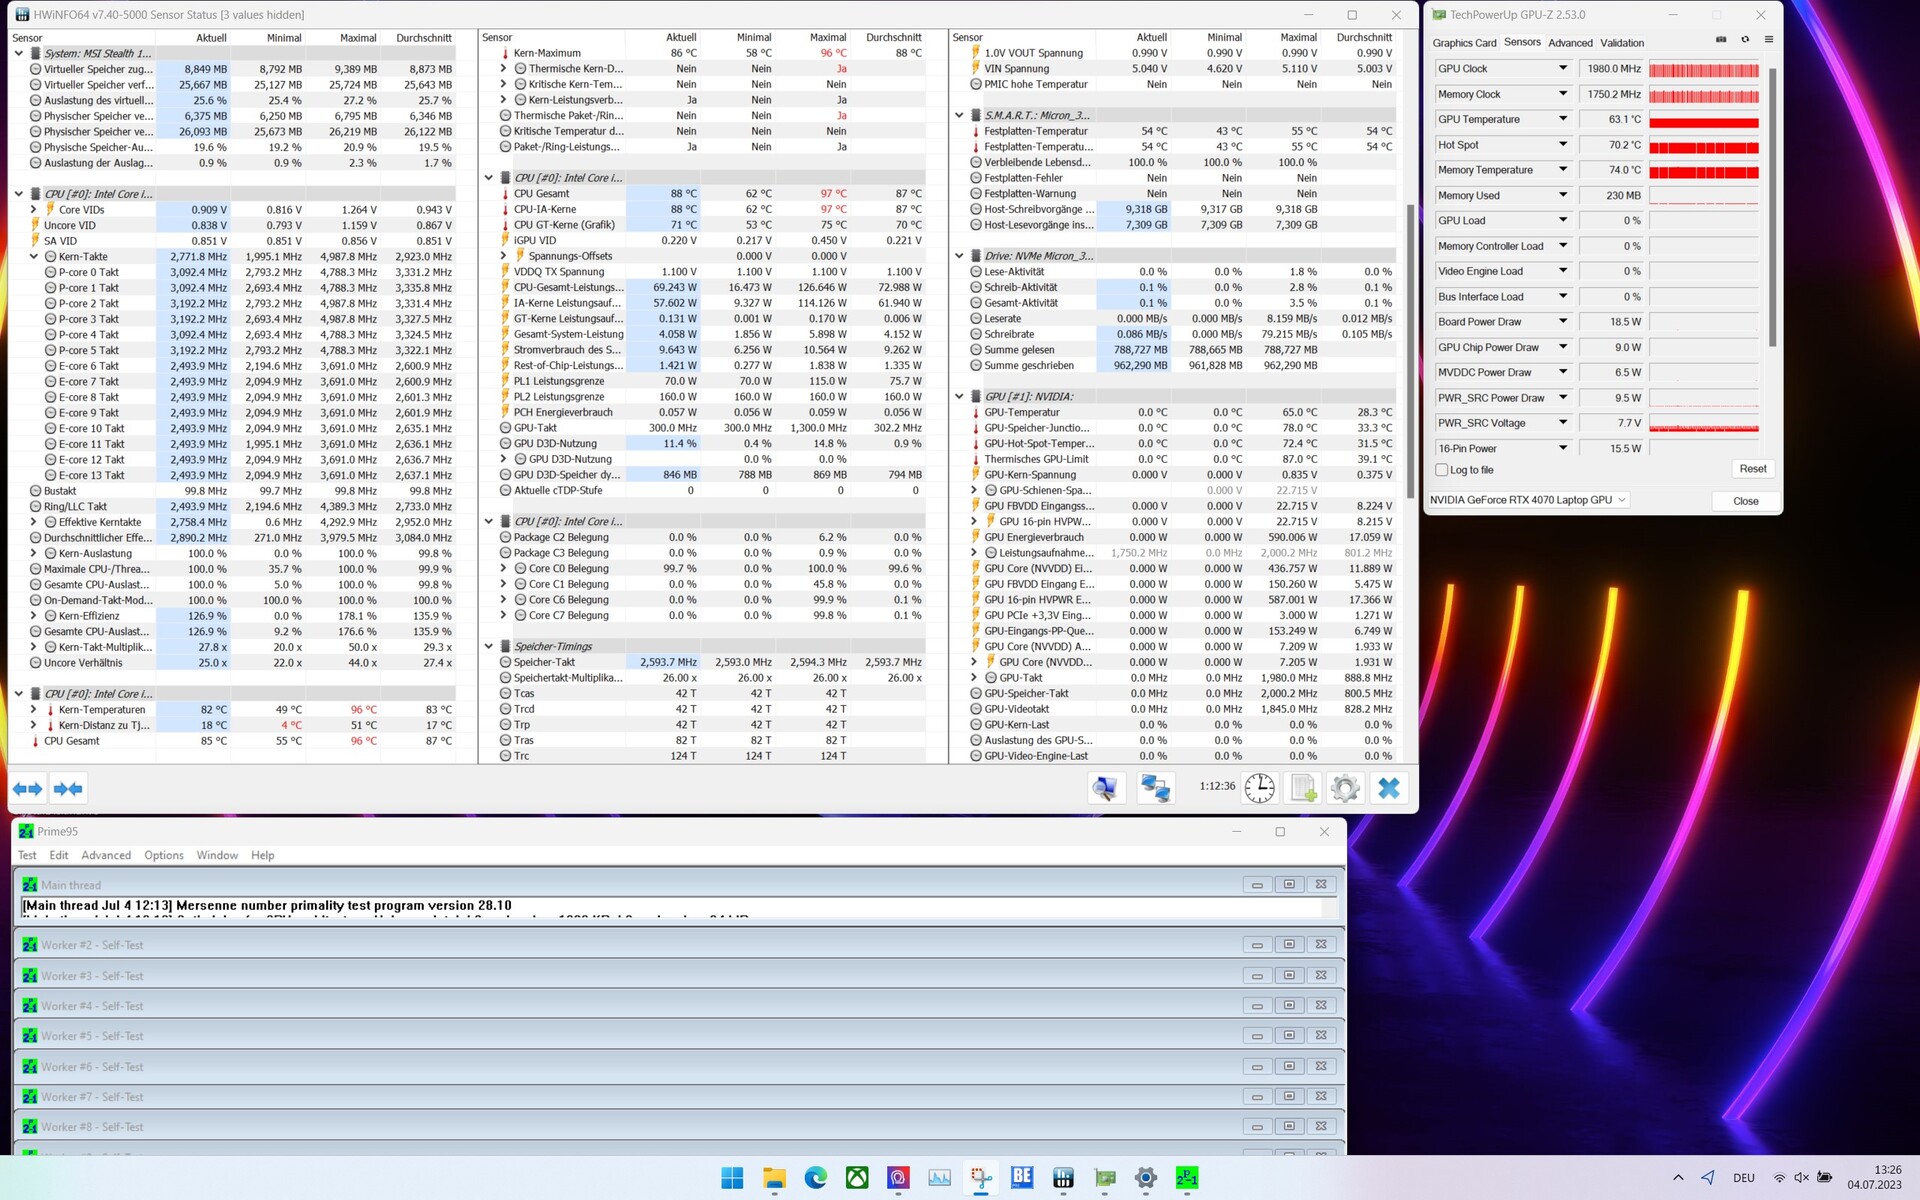
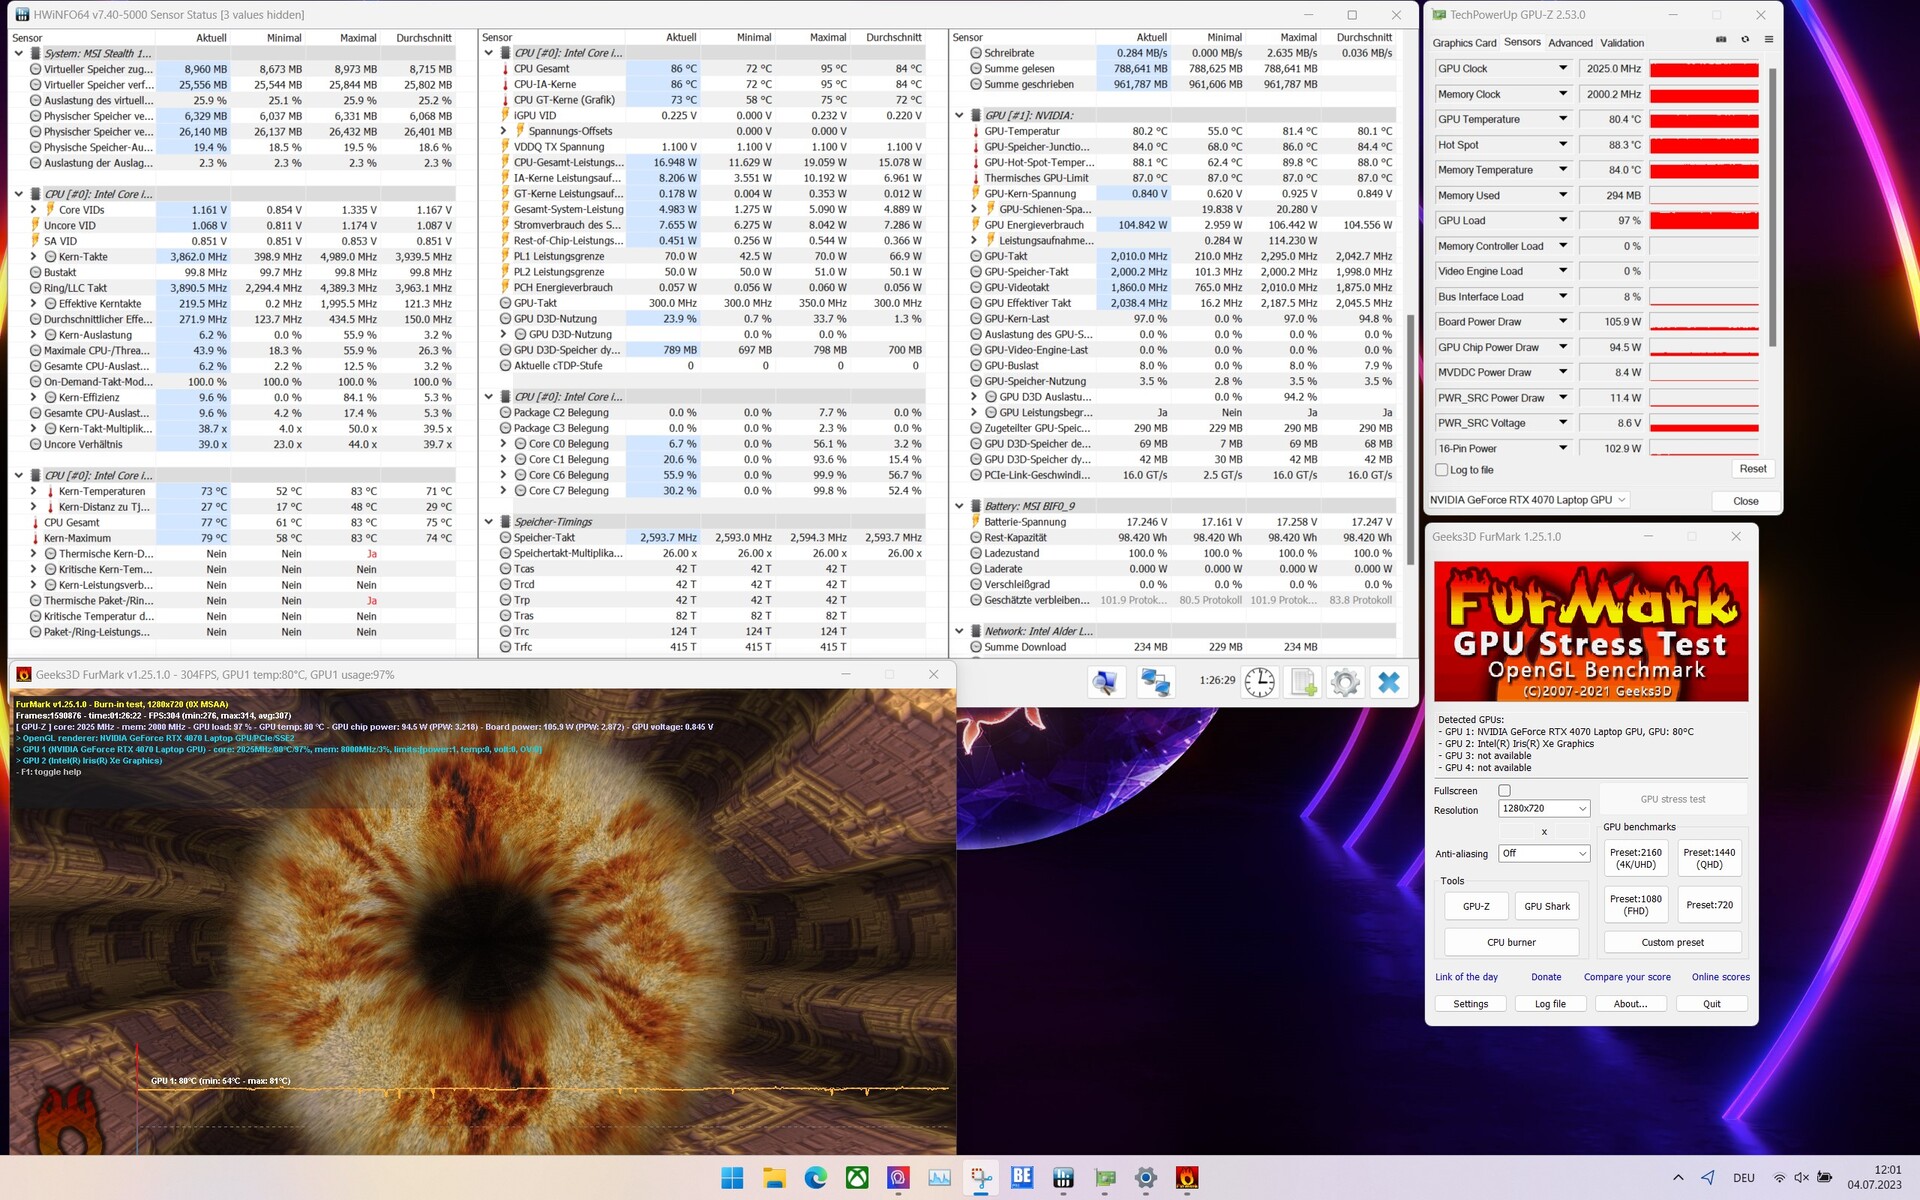
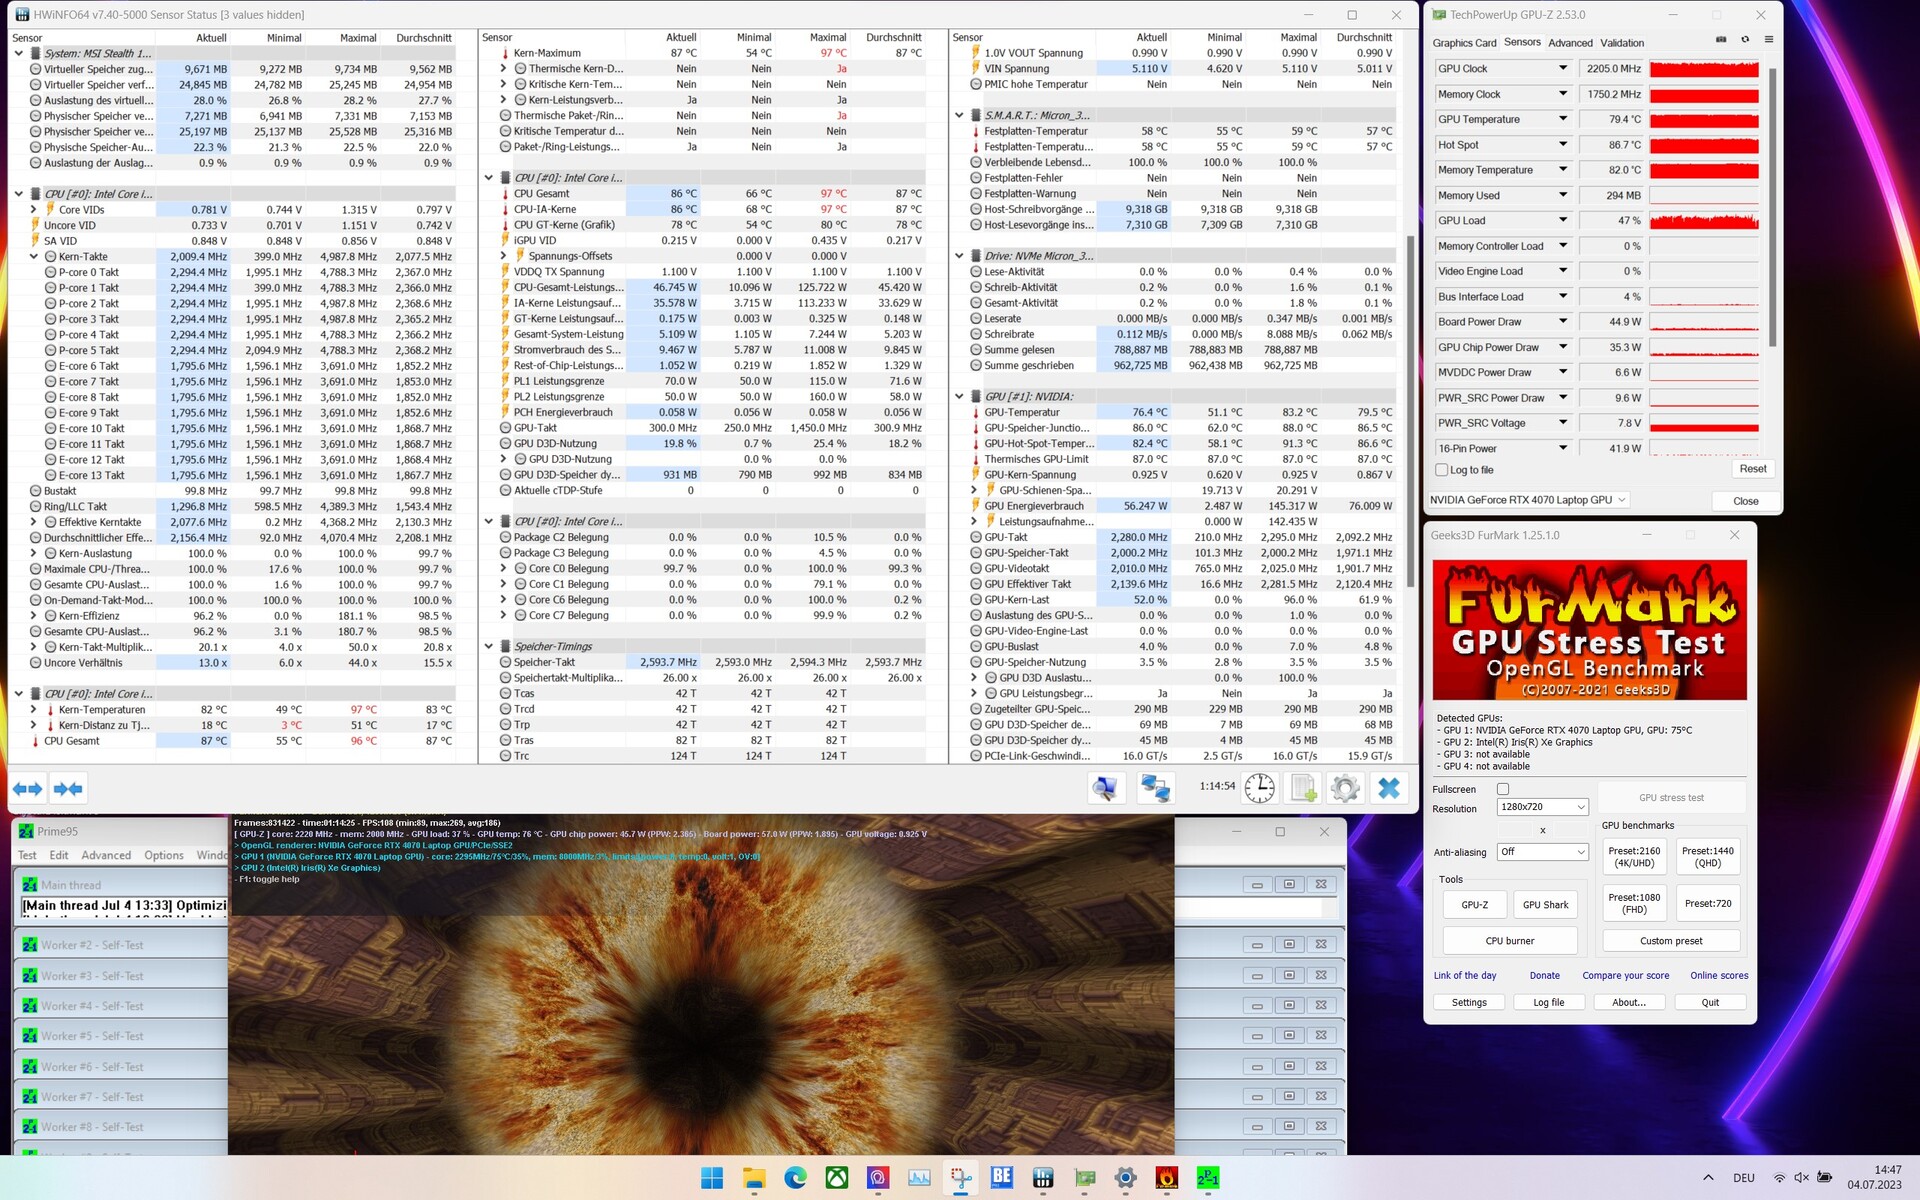
Prueba de esfuerzo
Utilizamos Prime95 y FurMark en funcionamiento continuo para simular la prueba de estrés. Representa un escenario extremo y sirve para comprobar la estabilidad del sistema a plena carga. En cuanto al procesador, el valor más alto que observamos fue de 97 °C, que se alcanzó nada más empezar. Durante un periodo de tiempo más largo, la temperatura de la CPU se estabilizó en torno a los 87 °C. En cuanto al adaptador gráfico, registramos un valor de punto caliente máximo de 91 °C. Con una media de unos 80 °C, vimos temperaturas considerablemente más bajas bajo carga. Esto significa que no se alcanzó el límite térmico de la tarjeta gráfica de (87 °C).
Altavoces
El sistema de sonido del MSI Stealth 16 Studio A13VG se basa en seis altavoces que producen una buena experiencia de audio. La reproducción hasta el volumen máximo es clara y sin interferencias, pero no puede sustituir a un sistema externo.
MSI Stealth 16 Studio A13VG análisis de audio
(+) | los altavoces pueden reproducir a un volumen relativamente alto (#85.48 dB)
Graves 100 - 315 Hz
(±) | lubina reducida - en promedio 9% inferior a la mediana
(±) | la linealidad de los graves es media (8.7% delta a frecuencia anterior)
Medios 400 - 2000 Hz
(+) | medios equilibrados - a sólo 4.6% de la mediana
(+) | los medios son lineales (5.4% delta a la frecuencia anterior)
Altos 2 - 16 kHz
(+) | máximos equilibrados - a sólo 2.7% de la mediana
(+) | los máximos son lineales (5.1% delta a la frecuencia anterior)
Total 100 - 16.000 Hz
(+) | el sonido global es lineal (9.3% de diferencia con la mediana)
En comparación con la misma clase
» 3% de todos los dispositivos probados de esta clase eran mejores, 2% similares, 95% peores
» El mejor tuvo un delta de 6%, la media fue 18%, el peor fue ###max##%
En comparación con todos los dispositivos probados
» 3% de todos los dispositivos probados eran mejores, 1% similares, 96% peores
» El mejor tuvo un delta de 4%, la media fue 23%, el peor fue ###max##%
Asus ROG Flow X16 GV601V análisis de audio
(±) | la sonoridad del altavoz es media pero buena (77.38 dB)
Graves 100 - 315 Hz
(±) | lubina reducida - en promedio 9.6% inferior a la mediana
(±) | la linealidad de los graves es media (9.2% delta a frecuencia anterior)
Medios 400 - 2000 Hz
(+) | medios equilibrados - a sólo 4.7% de la mediana
(±) | la linealidad de los medios es media (7.5% delta respecto a la frecuencia anterior)
Altos 2 - 16 kHz
(+) | máximos equilibrados - a sólo 2.2% de la mediana
(+) | los máximos son lineales (6.1% delta a la frecuencia anterior)
Total 100 - 16.000 Hz
(+) | el sonido global es lineal (12% de diferencia con la mediana)
En comparación con la misma clase
» 12% de todos los dispositivos probados de esta clase eran mejores, 4% similares, 84% peores
» El mejor tuvo un delta de 6%, la media fue 18%, el peor fue ###max##%
En comparación con todos los dispositivos probados
» 9% de todos los dispositivos probados eran mejores, 2% similares, 88% peores
» El mejor tuvo un delta de 4%, la media fue 23%, el peor fue ###max##%
Gestión de la energía: una batería más grande y necesidades de energía moderadas
Consumo de energía
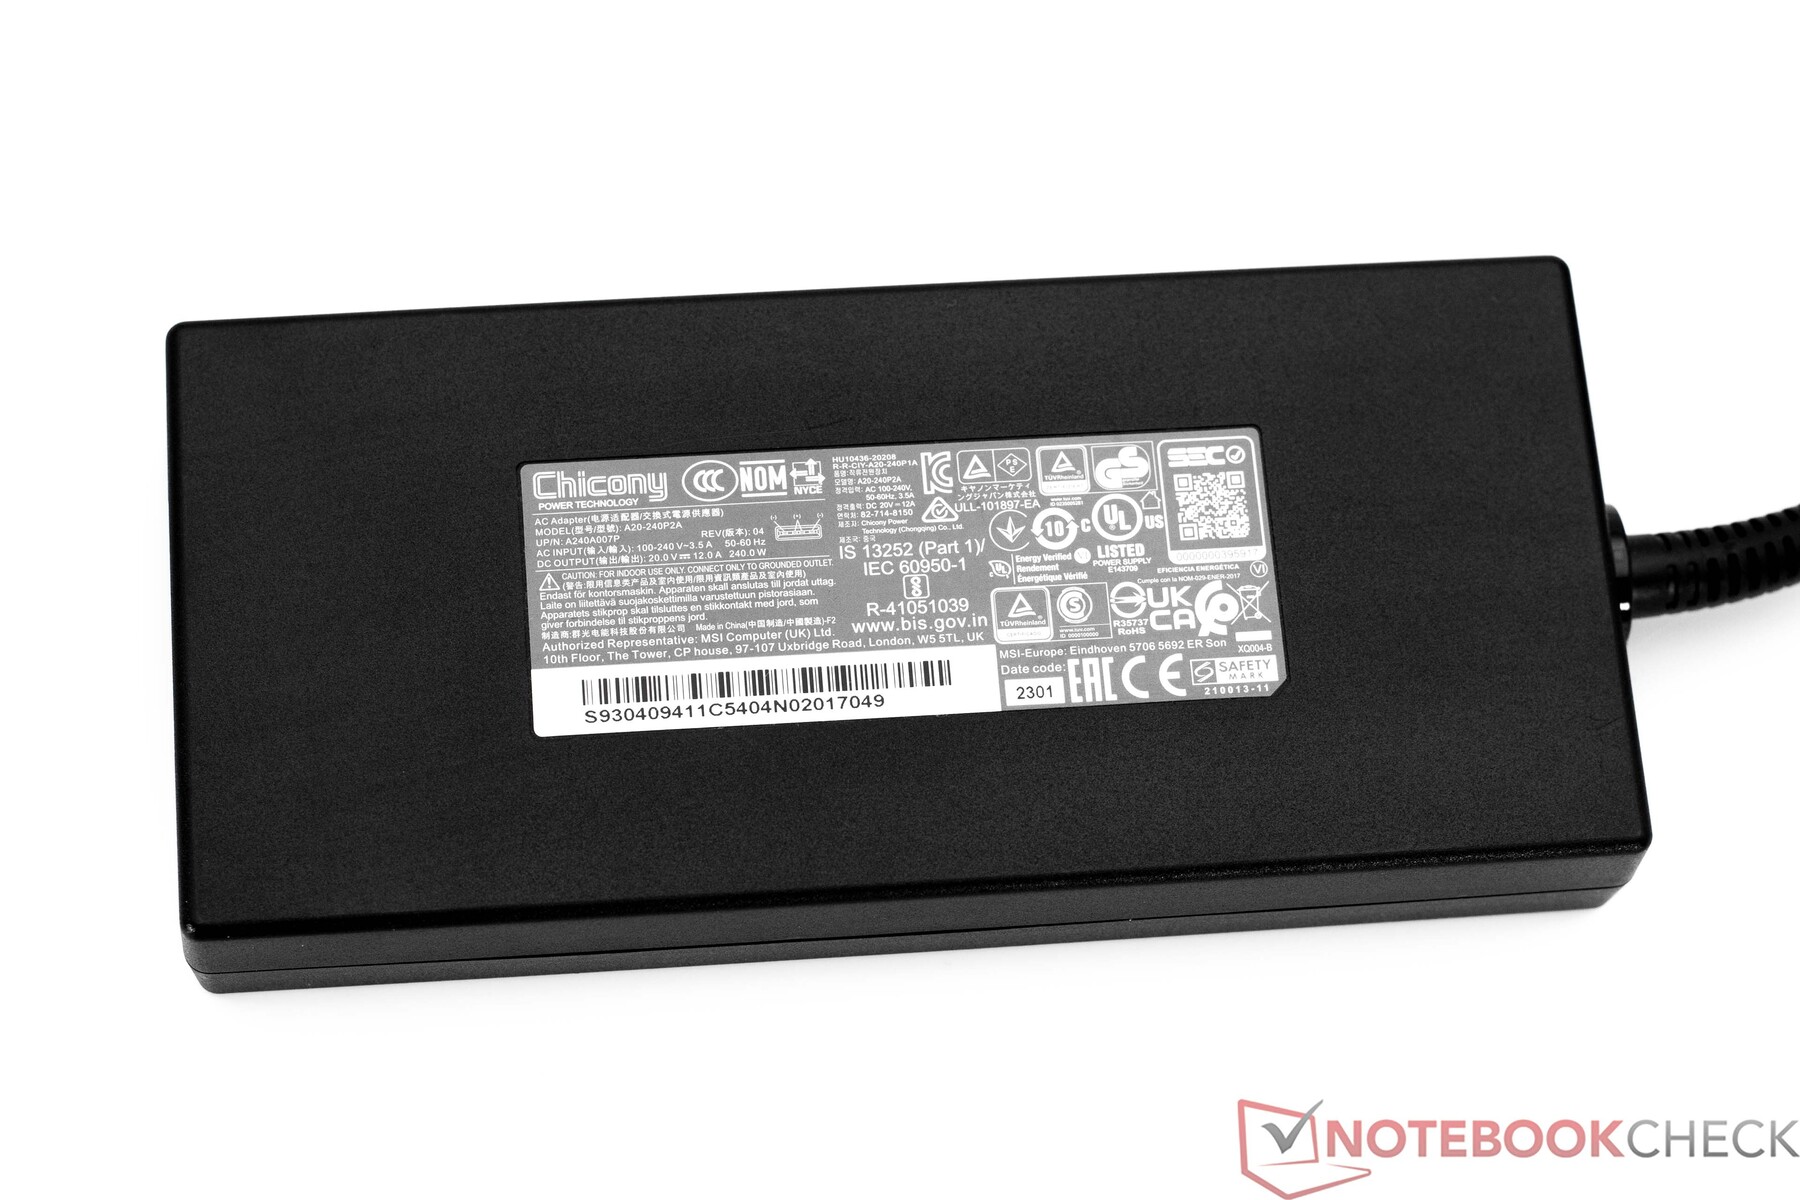
El MSI Stealth 16 Studio A13VG no mostró ninguna anormalidad en términos de consumo de energía. Los valores registrados en uso inactivo son realmente muy buenos aunque la competencia a veces consigue ofrecer mejores resultados. Sin embargo, el consumo de energía mínimamente superior es muy bajo. Bajo carga, observamos valores normales que asociaríamos a este hardware básico. Con 240 vatios, la fuente de alimentación está bien dimensionada y no se ve abrumada con un máximo de 228 vatios.
| Off / Standby | |
| Ocioso | |
| Carga |
|
Clave:
min: | |
| MSI Stealth 16 Studio A13VG i7-13700H, GeForce RTX 4070 Laptop GPU, Micron 3400 2TB MTFDKBA2T0TFH, IPS, 2560x1600, 16" | Asus ROG Flow X16 GV601V i9-13900H, GeForce RTX 4060 Laptop GPU, WD PC SN560 SDDPNQE-1T00, IPS, 2560x1600, 16" | Medion Erazer Major X20 i9-13900HX, GeForce RTX 4070 Laptop GPU, Phison E18-1TB-PHISON-SSD-B47R, IPS, 2560x1600, 16" | Acer Nitro 16 AN16-41 R7 7735HS, GeForce RTX 4070 Laptop GPU, Samsung PM9A1 MZVL21T0HCLR, IPS, 2560x1600, 16" | Corsair Voyager a1600 R9 6900HS, Radeon RX 6800M, Samsung PM9A1 MZVL22T0HBLB, IPS, 2560x1600, 16" | Gigabyte AERO 16 OLED BSF i9-13900H, GeForce RTX 4070 Laptop GPU, Gigabyte AG470S1TB-SI B10, OLED, 3840x2400, 16" | Medio NVIDIA GeForce RTX 4070 Laptop GPU | Media de la clase Gaming | |
|---|---|---|---|---|---|---|---|---|
| Power Consumption | 3% | -25% | -10% | -38% | -0% | -11% | -18% | |
| Idle Minimum * (Watt) | 11 | 9.6 13% | 12 -9% | 11.6 -5% | 16.9 -54% | 11.8 -7% | 13.2 ? -20% | 13 ? -18% |
| Idle Average * (Watt) | 18 | 16 11% | 16 11% | 15.6 13% | 20.3 -13% | 16.1 11% | 18.2 ? -1% | 19 ? -6% |
| Idle Maximum * (Watt) | 19 | 16.9 11% | 26 -37% | 16.5 13% | 22.2 -17% | 17 11% | 24.6 ? -29% | 24.6 ? -29% |
| Load Average * (Watt) | 91 | 104 -14% | 115 -26% | 155 -70% | 133.4 -47% | 100.6 -11% | 97 ? -7% | 110.7 ? -22% |
| Witcher 3 ultra * (Watt) | 130 | 142 -9% | 191.6 -47% | 154.8 -19% | 206 -58% | 158 -22% | ||
| Load Maximum * (Watt) | 228 | 214 6% | 319 -40% | 205 10% | 192 16% | 221 ? 3% | 259 ? -14% |
* ... más pequeño es mejor
Power consumption Witcher 3 / stress test
Power consumption with an external monitor
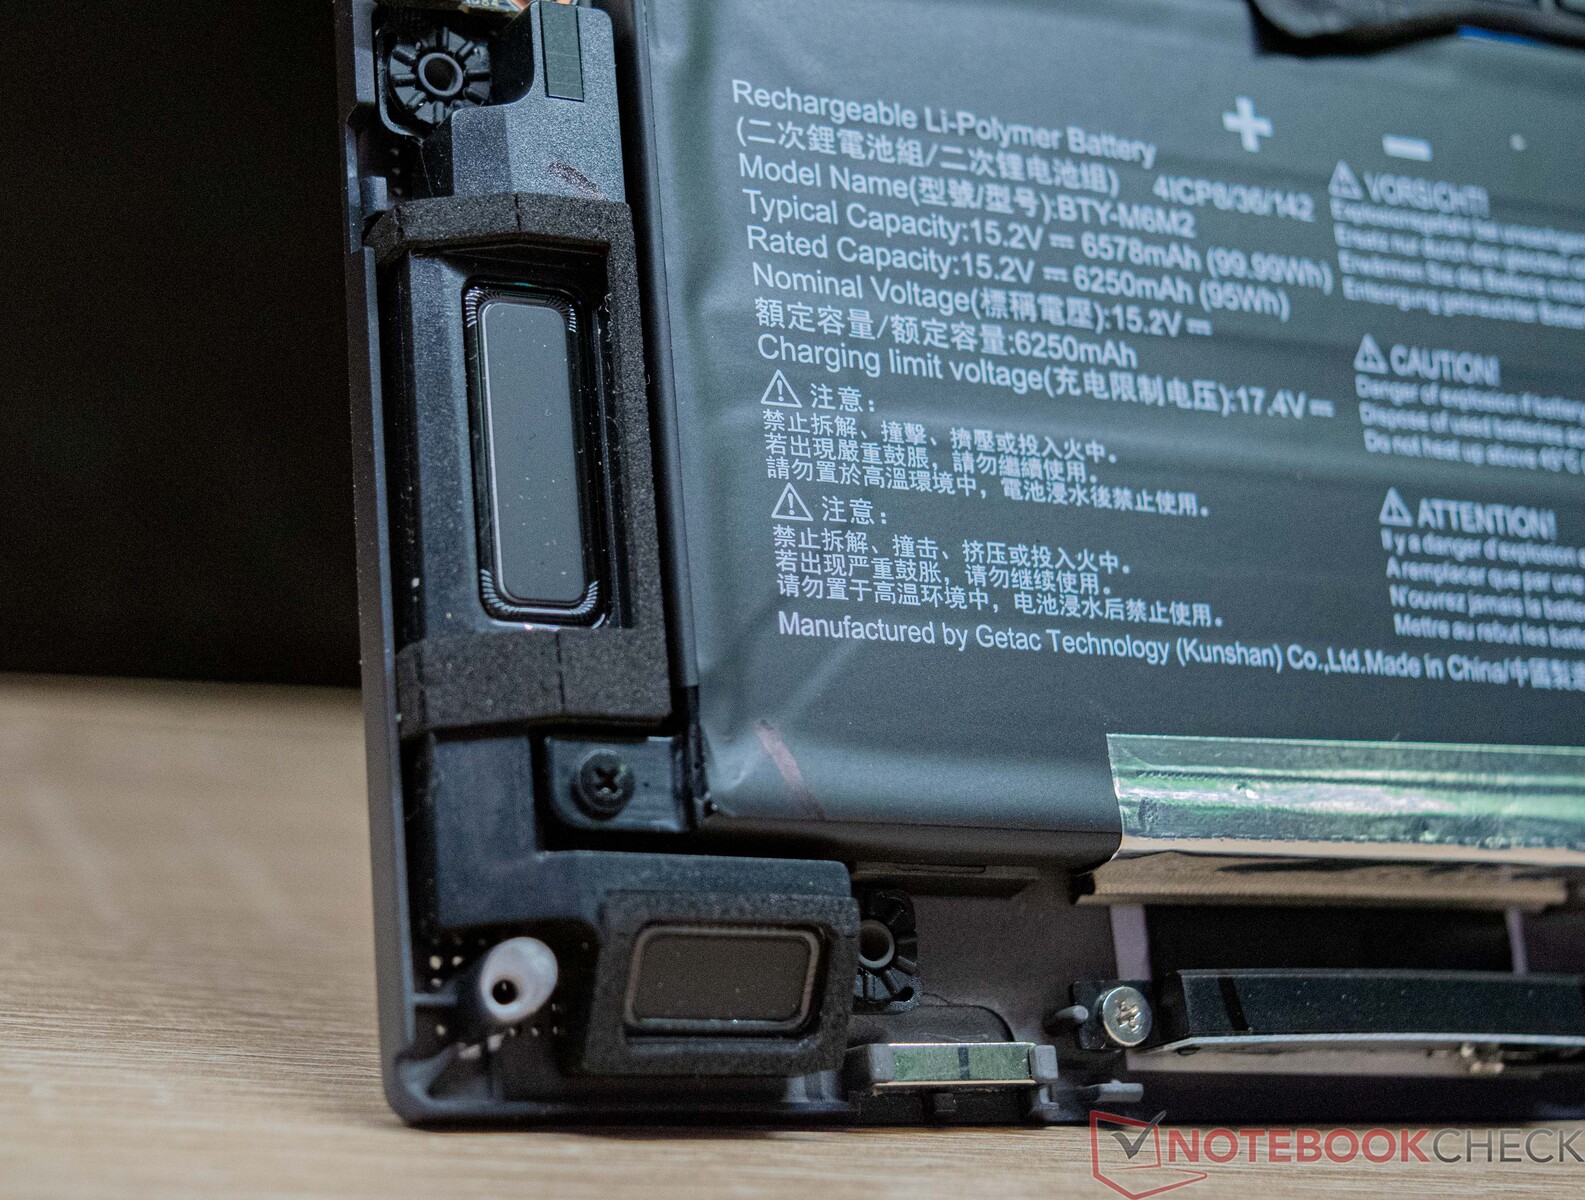
Duración de la batería
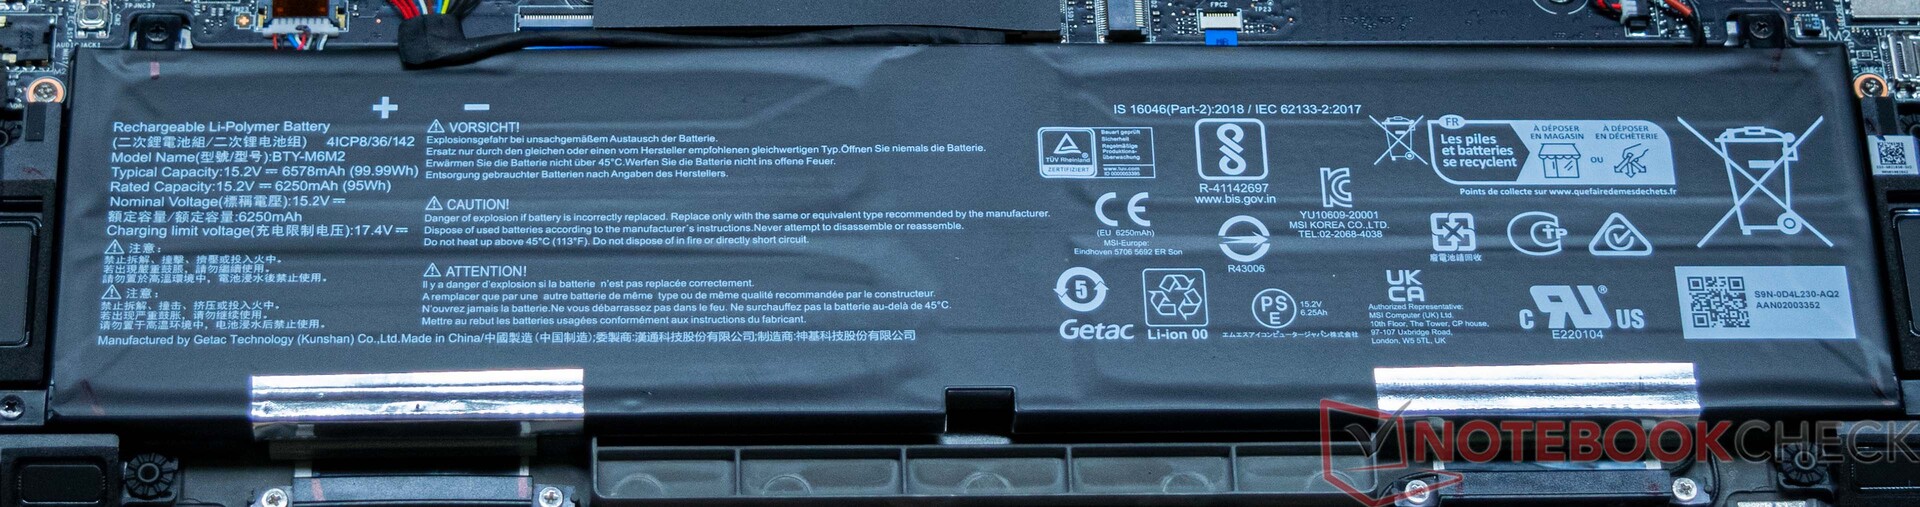
Das MSI Stealth 16 Studio A13VG tiene una batería de 99 Wh que es el tamaño máximo que puede soportar un portátil. Gracias a su capacidad, nuestro modelo de pruebas logró 7 horas 46 minutos y 7 horas 42 minutos, respectivamente, en nuestro bucle de pruebas Wi-Fi (usando un script para cargar una web) y en la prueba de vídeo del corto Big Buck Bunny (codificación H.264, FHD). Eso significa que el MSI Stealth 16 Studio A13VG logra una excelente duración de batería para un portátil de juegos. Durante ambas pruebas, el brillo de la pantalla se ajustó a 150 cd/m². En nuestro caso, esto significó reducir el brillo al 37%.
Una carga completa tarda casi exactamente tres horas. Sin embargo, después de aproximadamente la mitad de ese tiempo, la batería está cargada al 70 por ciento.

| MSI Stealth 16 Studio A13VG i7-13700H, GeForce RTX 4070 Laptop GPU, 99.9 Wh | Asus ROG Flow X16 GV601V i9-13900H, GeForce RTX 4060 Laptop GPU, 90 Wh | Medion Erazer Major X20 i9-13900HX, GeForce RTX 4070 Laptop GPU, 62.3 Wh | Acer Nitro 16 AN16-41 R7 7735HS, GeForce RTX 4070 Laptop GPU, 90 Wh | Corsair Voyager a1600 R9 6900HS, Radeon RX 6800M, 99 Wh | Gigabyte AERO 16 OLED BSF i9-13900H, GeForce RTX 4070 Laptop GPU, 88 Wh | Media de la clase Gaming | |
|---|---|---|---|---|---|---|---|
| Duración de Batería | -7% | -44% | 8% | -24% | -7% | -16% | |
| Reader / Idle (h) | 11 | 5.8 -47% | 12.2 11% | 7 -36% | 8.27 ? -25% | ||
| H.264 (h) | 7.7 | 8.9 16% | 4.2 -45% | 10.2 32% | 6 -22% | 7.4 -4% | 8.32 ? 8% |
| WiFi v1.3 (h) | 7.8 | 7.9 1% | 3.9 -50% | 9 15% | 5.8 -26% | 7.5 -4% | 7.11 ? -9% |
| Load (h) | 2.4 | 1.5 -37% | 1.6 -33% | 1.8 -25% | 2.1 -12% | 2.1 -12% | 1.502 ? -37% |
Pro
Contra
Veredicto: un portátil premium para creadores
En términos de su CPU y GPU integradas, el MSI Stealth 16 Studio A13VG es un portátil para juegos hasta la médula. Desde un punto de vista puramente visual, el MSI Stealth 16 Studio A13VG se presenta como un portátil de negocios de buen gusto con ambiciones de juego. Al hacerlo, el dispositivo cubre una amplia gama de necesidades, con el fin de atraer a muchos usuarios. El portátil está dirigido a creadores que confían en un rendimiento de sistema de alto nivel. El rendimiento del Intel Core i7-13700H combinado con la GPU Nvidia-GeForce RTX 4070 del portátil es bueno en todo momento. La pantalla también tiene que cumplir los requisitos necesarios y es algo que logra con su alta cobertura del espacio de color.
También nos impresionó el resto de especificaciones: 32 GB de RAM DDR5 y un total de 2 TB de almacenamiento SSD es una base excelente que asegura que el portátil no necesitará actualizarse pronto. La pantalla de 16 pulgadas ofrece una resolución QHD+, una relación de aspecto 16:10 y una frecuencia de actualización de 240 Hz que demuestra sus credenciales para los juegos.
El MSI Stealth 16 Studio A13VG es a la vez un portátil muy potente y muy ligero para creadores de contenidos y jugadores.
Por otro lado, las limitaciones de sonido vienen en la forma del volumen que, sin embargo, es típico para un portátil de juegos. También vemos la selección de puertos de forma bastante crítica, ya que sólo un puerto USB-A no es suficiente para esta clase de dispositivo. No obstante, hay un moderno puerto Thunderbolt 4 que permite ampliar el portátil de forma útil. La implementación del lector de tarjetas es buena y en cuanto a rendimiento no tiene por qué esconderse.
Cuando se trata de movilidad, el MSI Stealth 16 Studio A13VG corta una buena figura ya que tanto el bajo peso como la buena duración de batería están por encima del promedio. Se pueden realizar muchos ajustes a través del MSI Center, y con los correctos el dispositivo incluso funciona casi en silencio.
Sin embargo, en términos de precio, el MSI Stealth 16 Studio A13VG lo tiene difícil con un precio actual de alrededor de $2549. Para una alternativa más barata, valdría la pena echar un vistazo al Medion Erazer Major X20que está equipado con unaGPU de portátil Nvidia GeForce RTX 4070y también ofrece un rendimiento excelente.
Precio y disponibilidad
El MSI Stealth 16 Studio A13VG con un SSD de 1 TB y 64 GB de RAM está disponible actualmente en BestBuy por 2.549,99 dólares.
MSI Stealth 16 Studio A13VG
- 11/28/2023 v7 (old)
Sebastian Bade
Transparencia
La selección de los dispositivos que se van a reseñar corre a cargo de nuestro equipo editorial. La muestra de prueba fue proporcionada al autor en calidad de préstamo por el fabricante o el minorista a los efectos de esta reseña. El prestamista no tuvo ninguna influencia en esta reseña, ni el fabricante recibió una copia de la misma antes de su publicación. No había ninguna obligación de publicar esta reseña. Como empresa de medios independiente, Notebookcheck no está sujeta a la autoridad de fabricantes, minoristas o editores.
Así es como prueba Notebookcheck
Cada año, Notebookcheck revisa de forma independiente cientos de portátiles y smartphones utilizando procedimientos estandarizados para asegurar que todos los resultados son comparables. Hemos desarrollado continuamente nuestros métodos de prueba durante unos 20 años y hemos establecido los estándares de la industria en el proceso. En nuestros laboratorios de pruebas, técnicos y editores experimentados utilizan equipos de medición de alta calidad. Estas pruebas implican un proceso de validación en varias fases. Nuestro complejo sistema de clasificación se basa en cientos de mediciones y puntos de referencia bien fundamentados, lo que mantiene la objetividad.Price comparison

