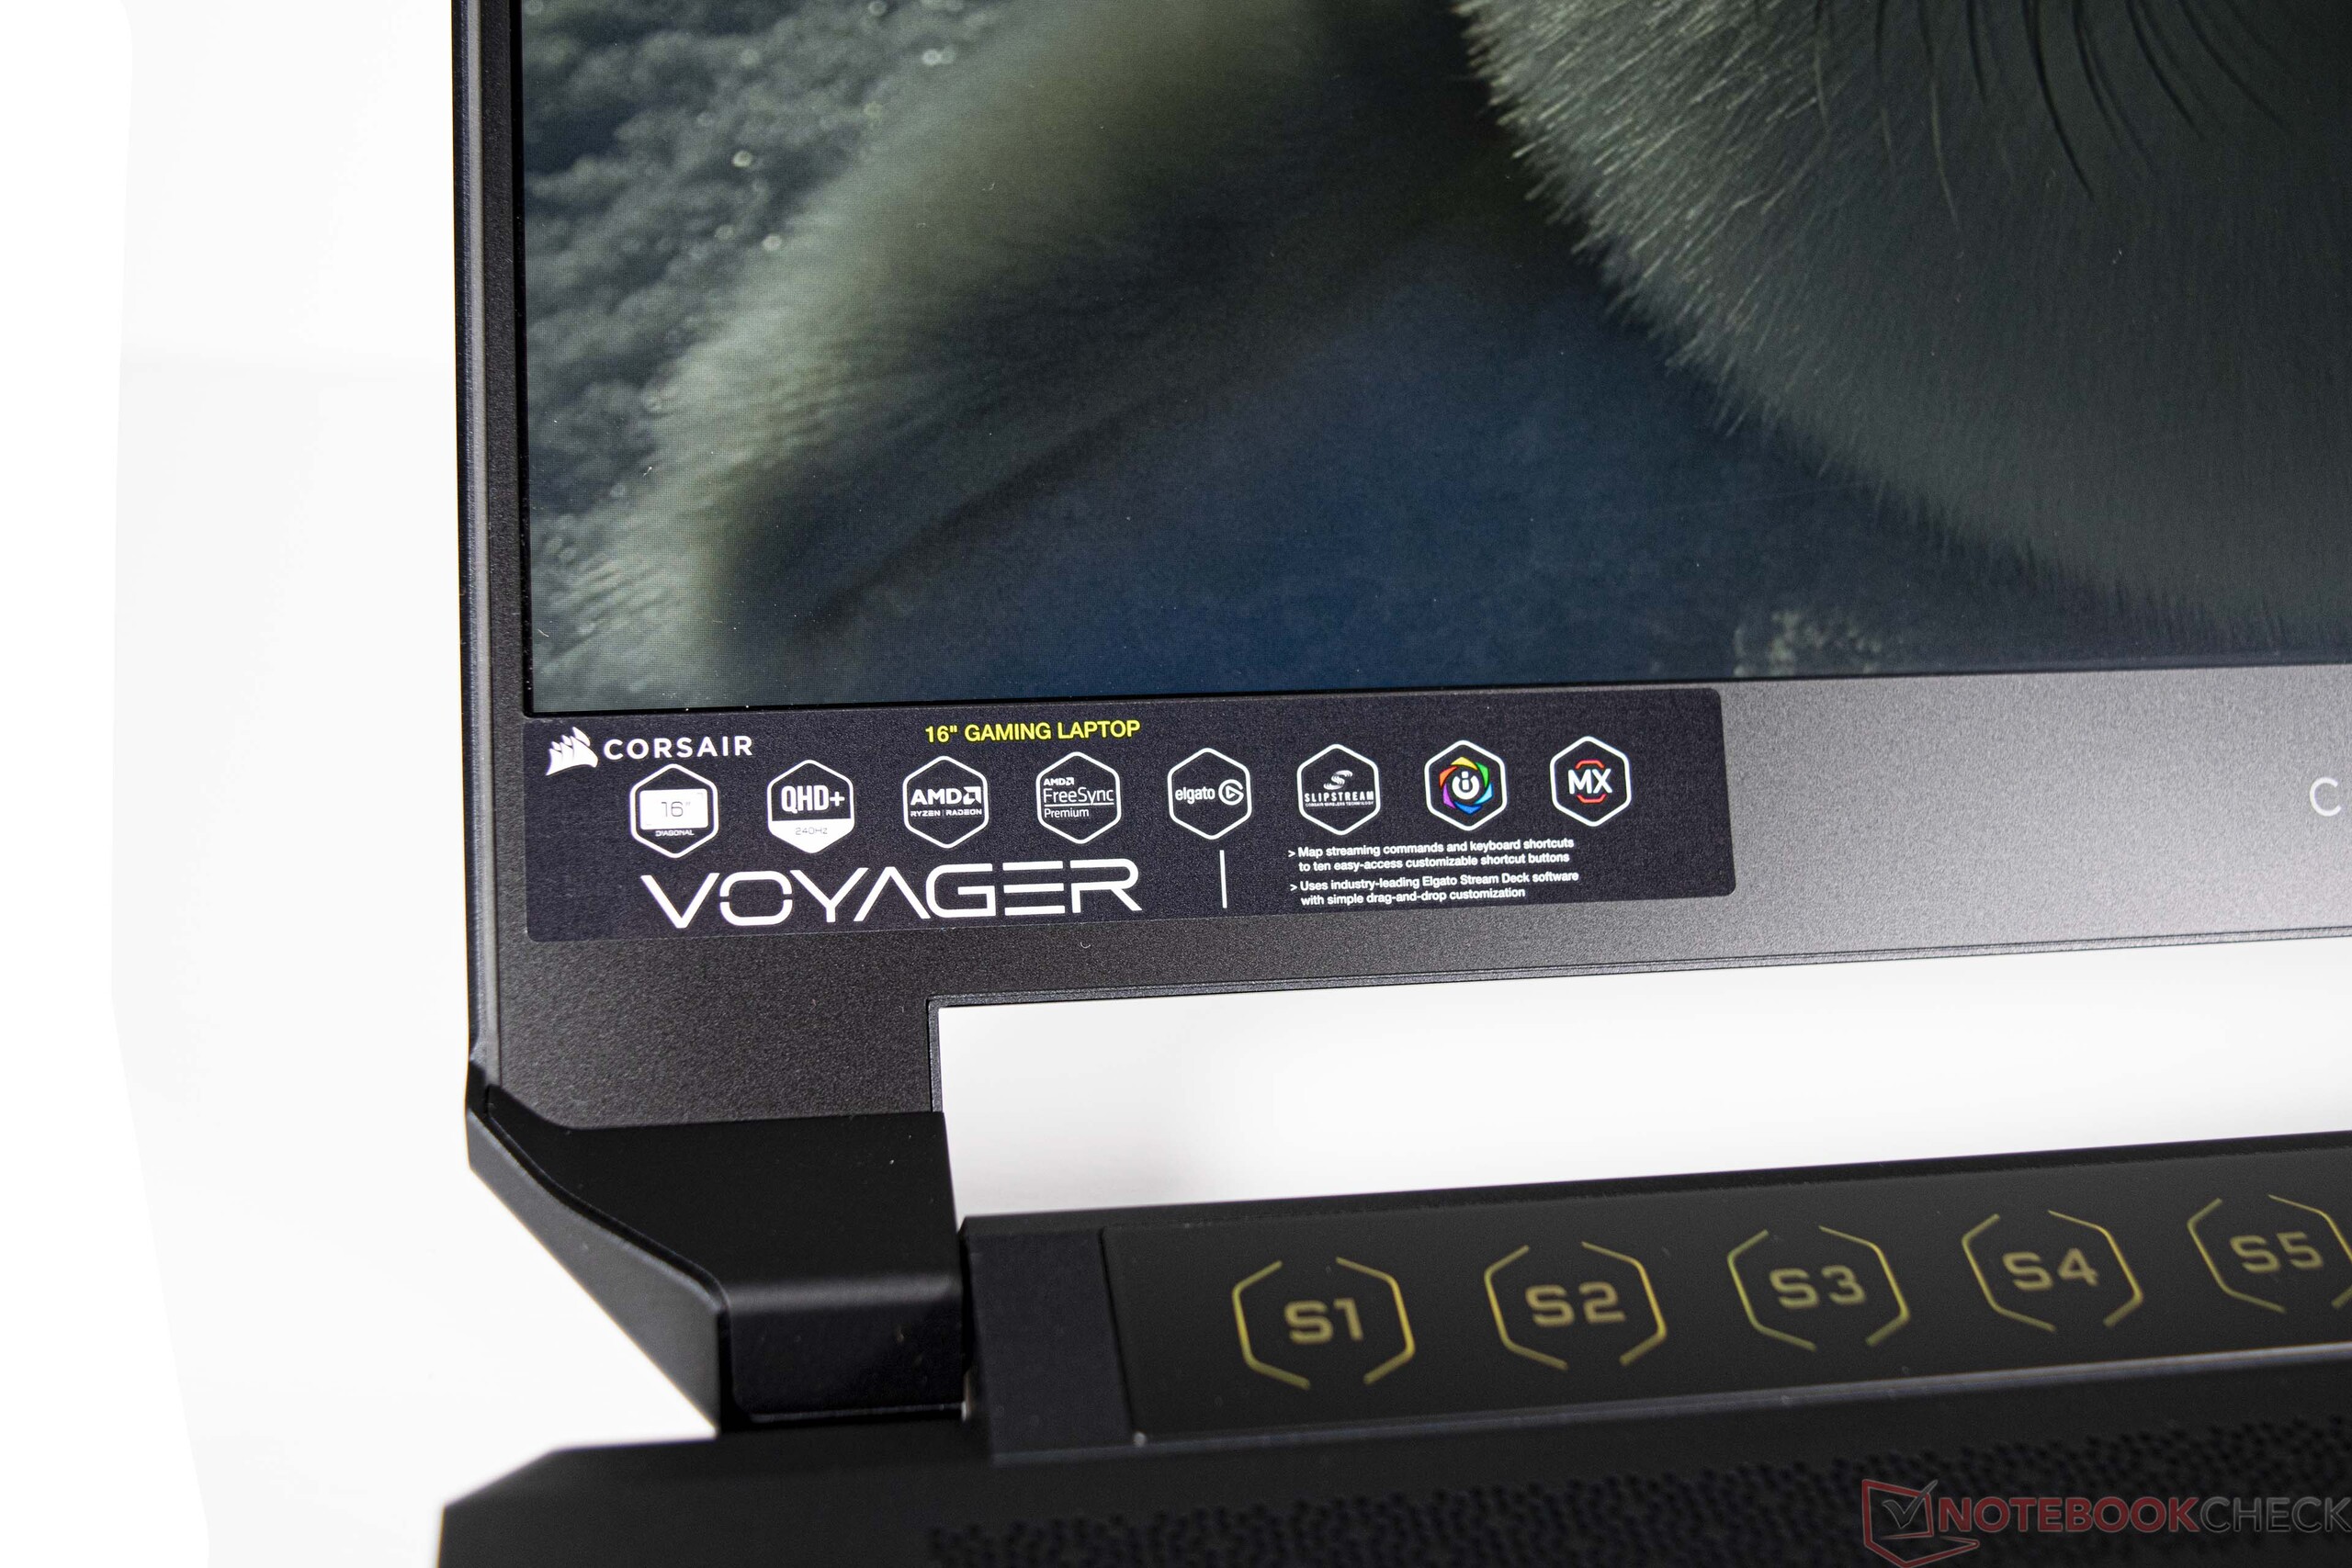
Análisis del portátil Corsair Voyager a1600: Máxima potencia AMD para jugadores, streamers y creadores

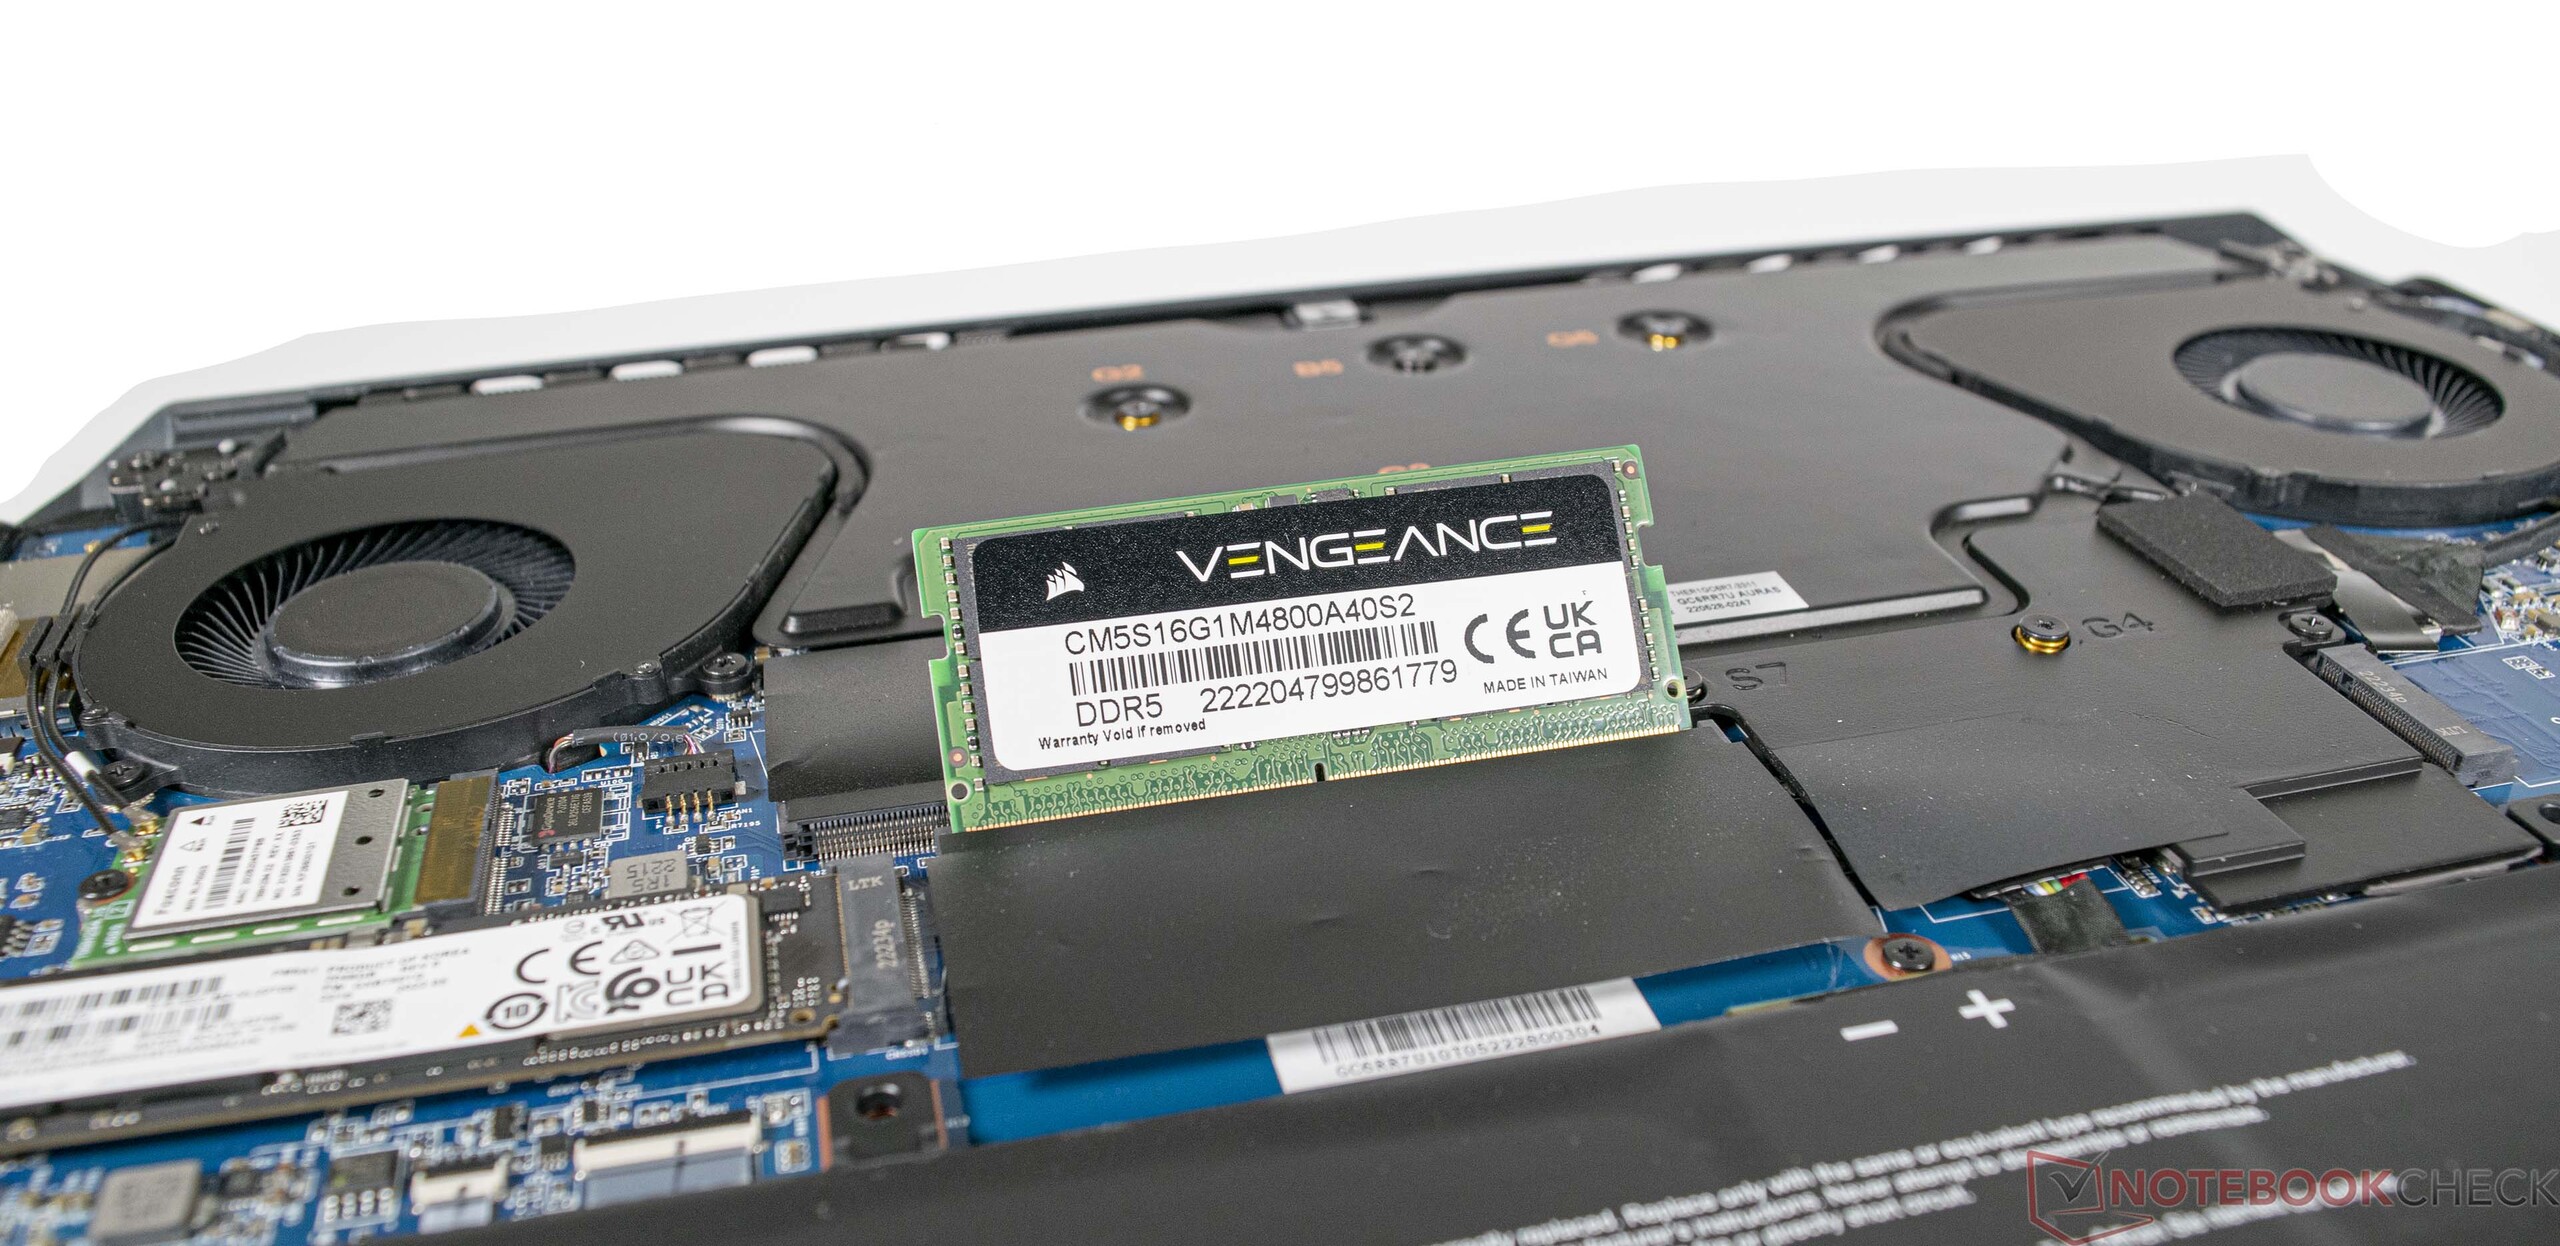
Corsair es un nombre bien conocido cuando se trata de accesorios en el sector del PC: periféricos, fuentes de alimentación, SSD, carcasas, monitores y también sistemas de sobremesa preconstruidos, algunos de los cuales ya hemos probado, forman parte de la gama actual del fabricante. Con la serie Voyager, Corsair entra ahora también en el segmento de los portátiles y quiere participar en el sector de los juegos con el Voyager a1600. La posición de partida no está nada mal, ya que con el AMD Ryzen 9 6900HS y una AMD Radeon RX 6800M hay una base prometedora. También puedes esperar 32 GB de RAM DDR5 y un SSD con 2 TB de espacio de almacenamiento en la configuración superior. El panel QHD de 240 Hz, por otro lado, siempre es imprescindible. Sin embargo, el precio de 3.550 euros está en la liga superior.
Puede resultar más barato si se opta por un AMD Ryzen 7 6800HScon 16 GB de RAM y un SSD de 1 TB. En este caso, el precio actual es de 2.600 euros. En la prueba, el Corsair Voyager a1600 compite contra rivales fuertes del campo de los portátiles para juegos actuales. Más detalles en la siguiente tabla.
Posibles contendientes en la comparación
Valoración | Fecha | Modelo | Peso | Altura | Tamaño | Resolución | Precio |
|---|---|---|---|---|---|---|---|
| 86.6 % v7 (old) | 12/2022 | Corsair Voyager a1600 R9 6900HS, Radeon RX 6800M | 2.4 kg | 19.9 mm | 16.00" | 2560x1600 | |
| 89.5 % v7 (old) | 08/2022 | Asus ROG Flow X16 GV601RW-M5082W R9 6900HS, GeForce RTX 3070 Ti Laptop GPU | 2.1 kg | 19.4 mm | 16.10" | 2560x1600 | |
| 90.8 % v7 (old) | 09/2022 | Lenovo Legion 7 16ARHA7 R9 6900HX, Radeon RX 6850M XT | 2.6 kg | 19.4 mm | 16.00" | 2560x1600 | |
| 87.2 % v7 (old) | 06/2022 | Acer Predator Triton 500 SE PT516-52s-70KX i7-12700H, GeForce RTX 3080 Ti Laptop GPU | 2.3 kg | 19.9 mm | 16.00" | 2560x1600 | |
| 85.5 % v7 (old) | 05/2022 | HP Omen 16-b1090ng i7-12700H, GeForce RTX 3070 Ti Laptop GPU | 2.3 kg | 23 mm | 16.10" | 2560x1440 | |
| 88.9 % v7 (old) | 09/2022 | Lenovo Legion 7 16IAX7-82TD004SGE i9-12900HX, GeForce RTX 3080 Ti Laptop GPU | 2.6 kg | 20 mm | 16.00" | 2560x1600 |
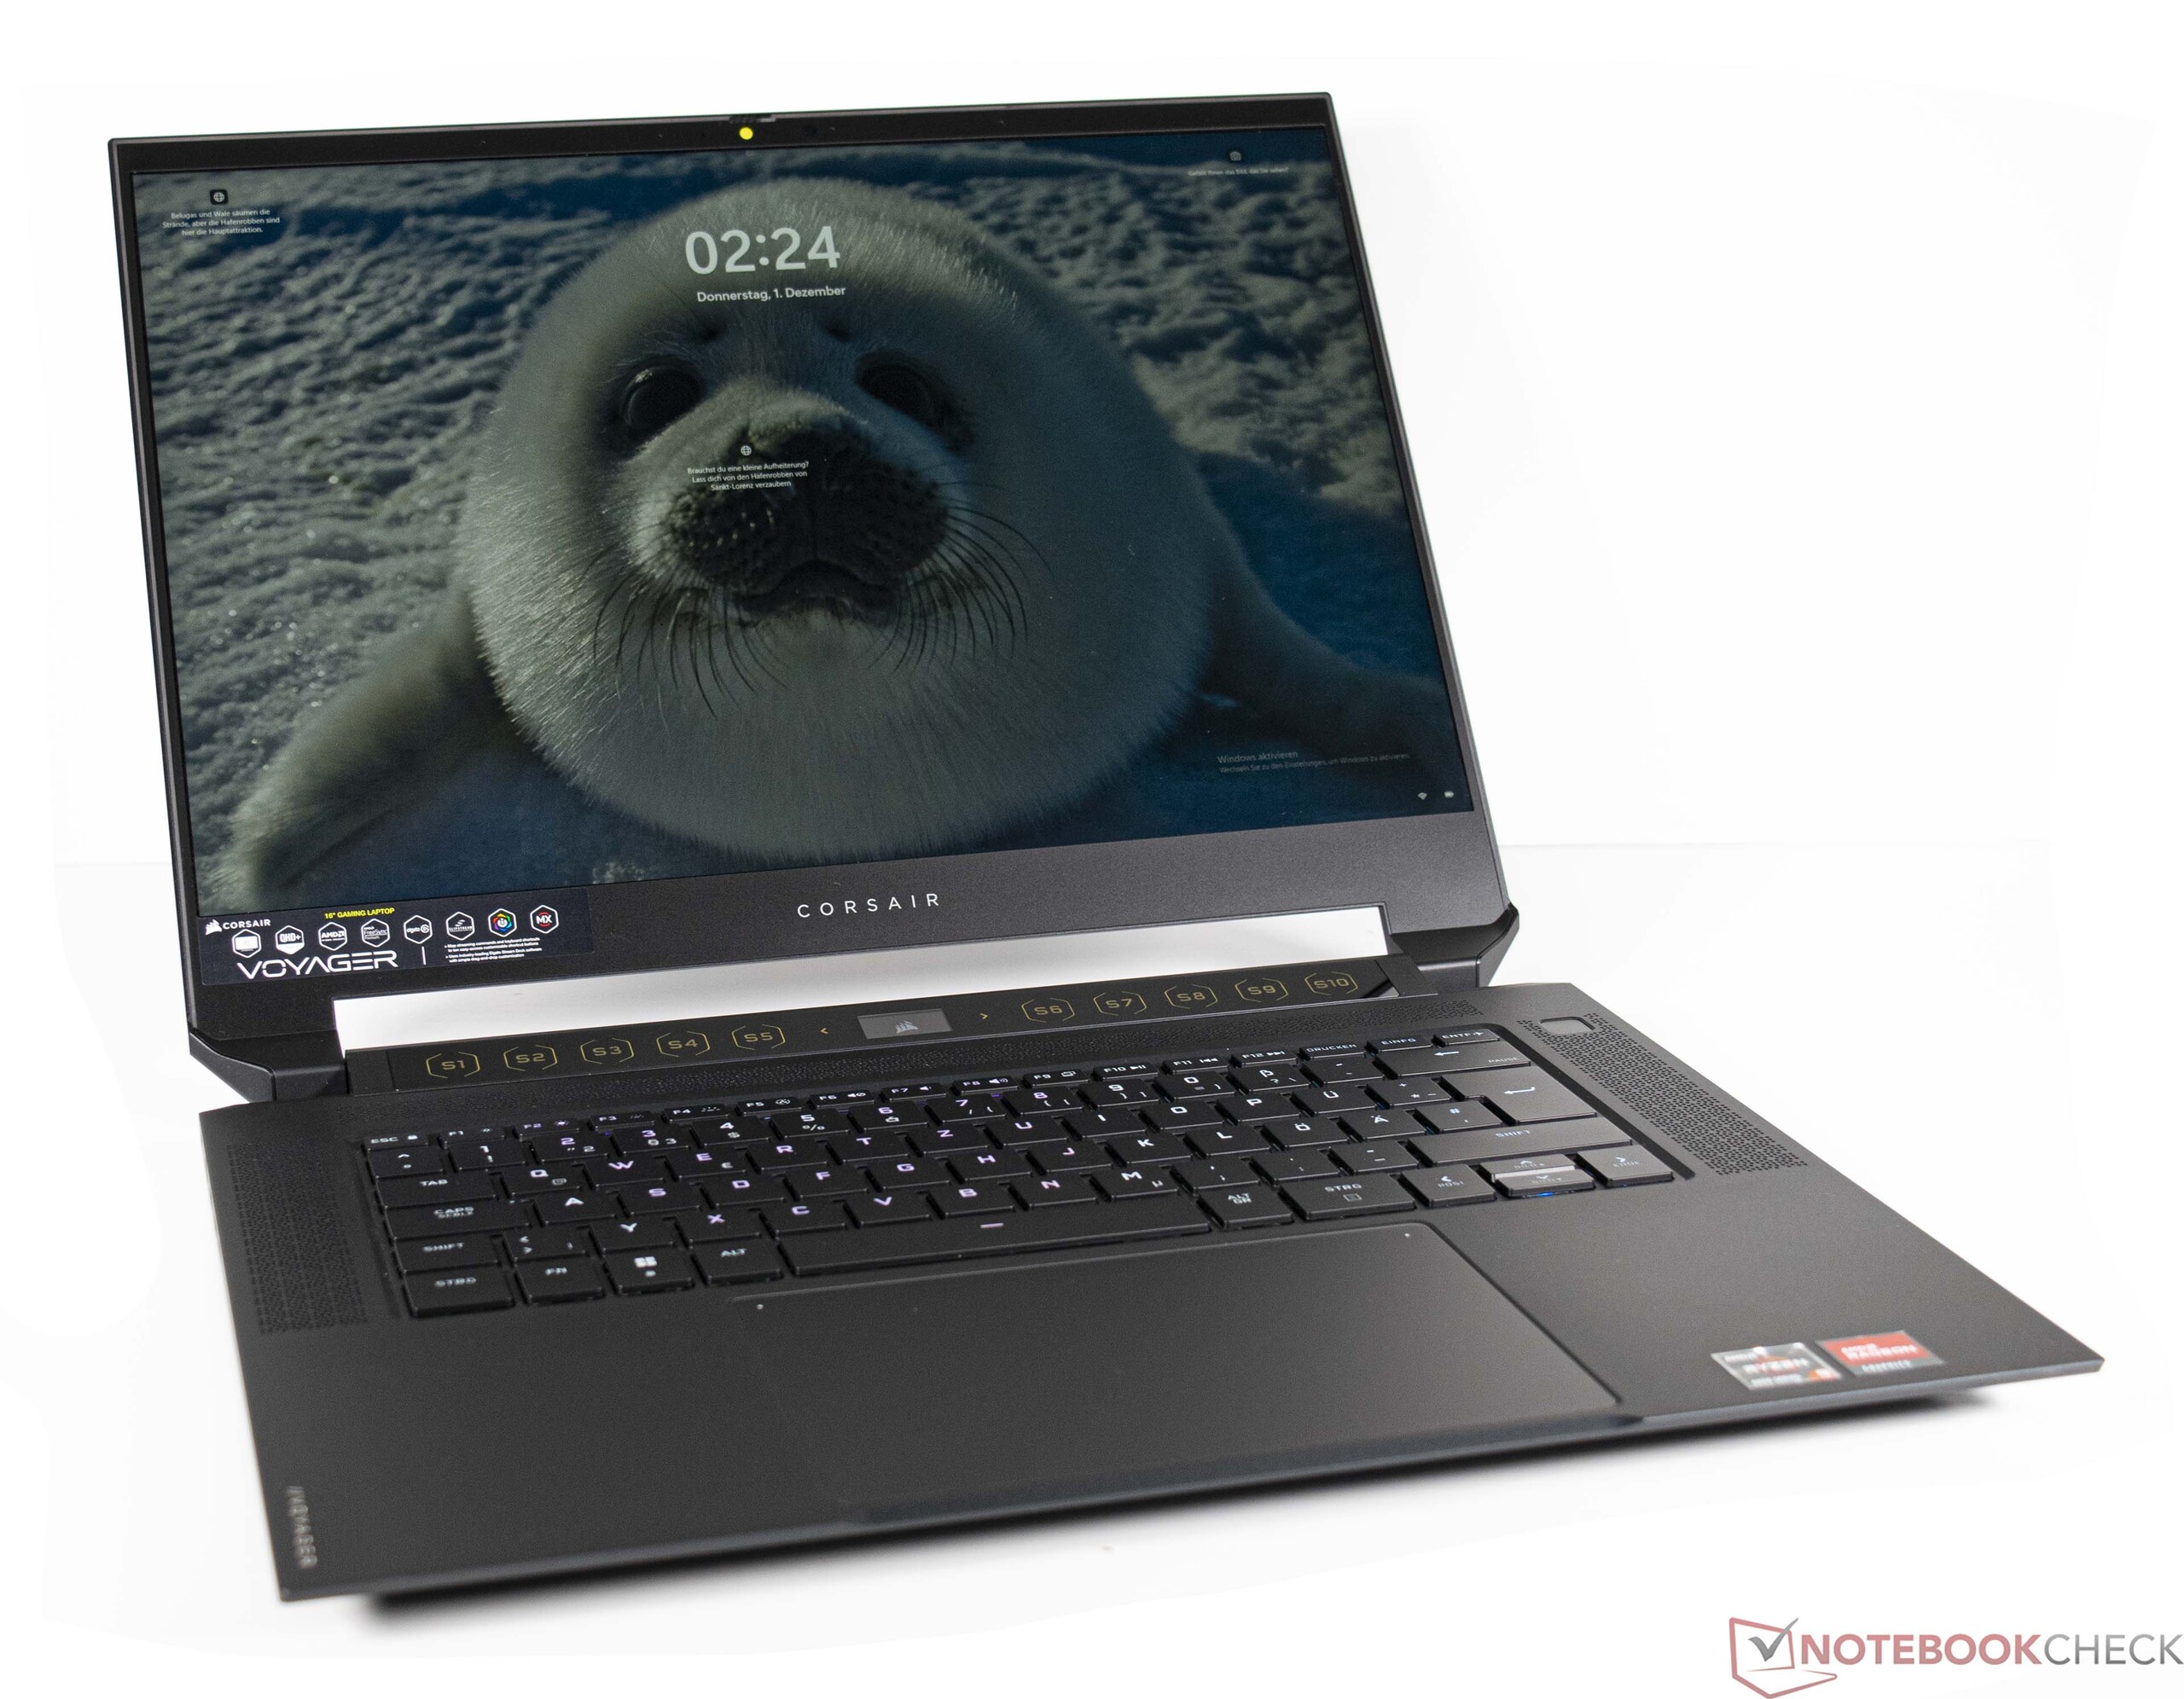
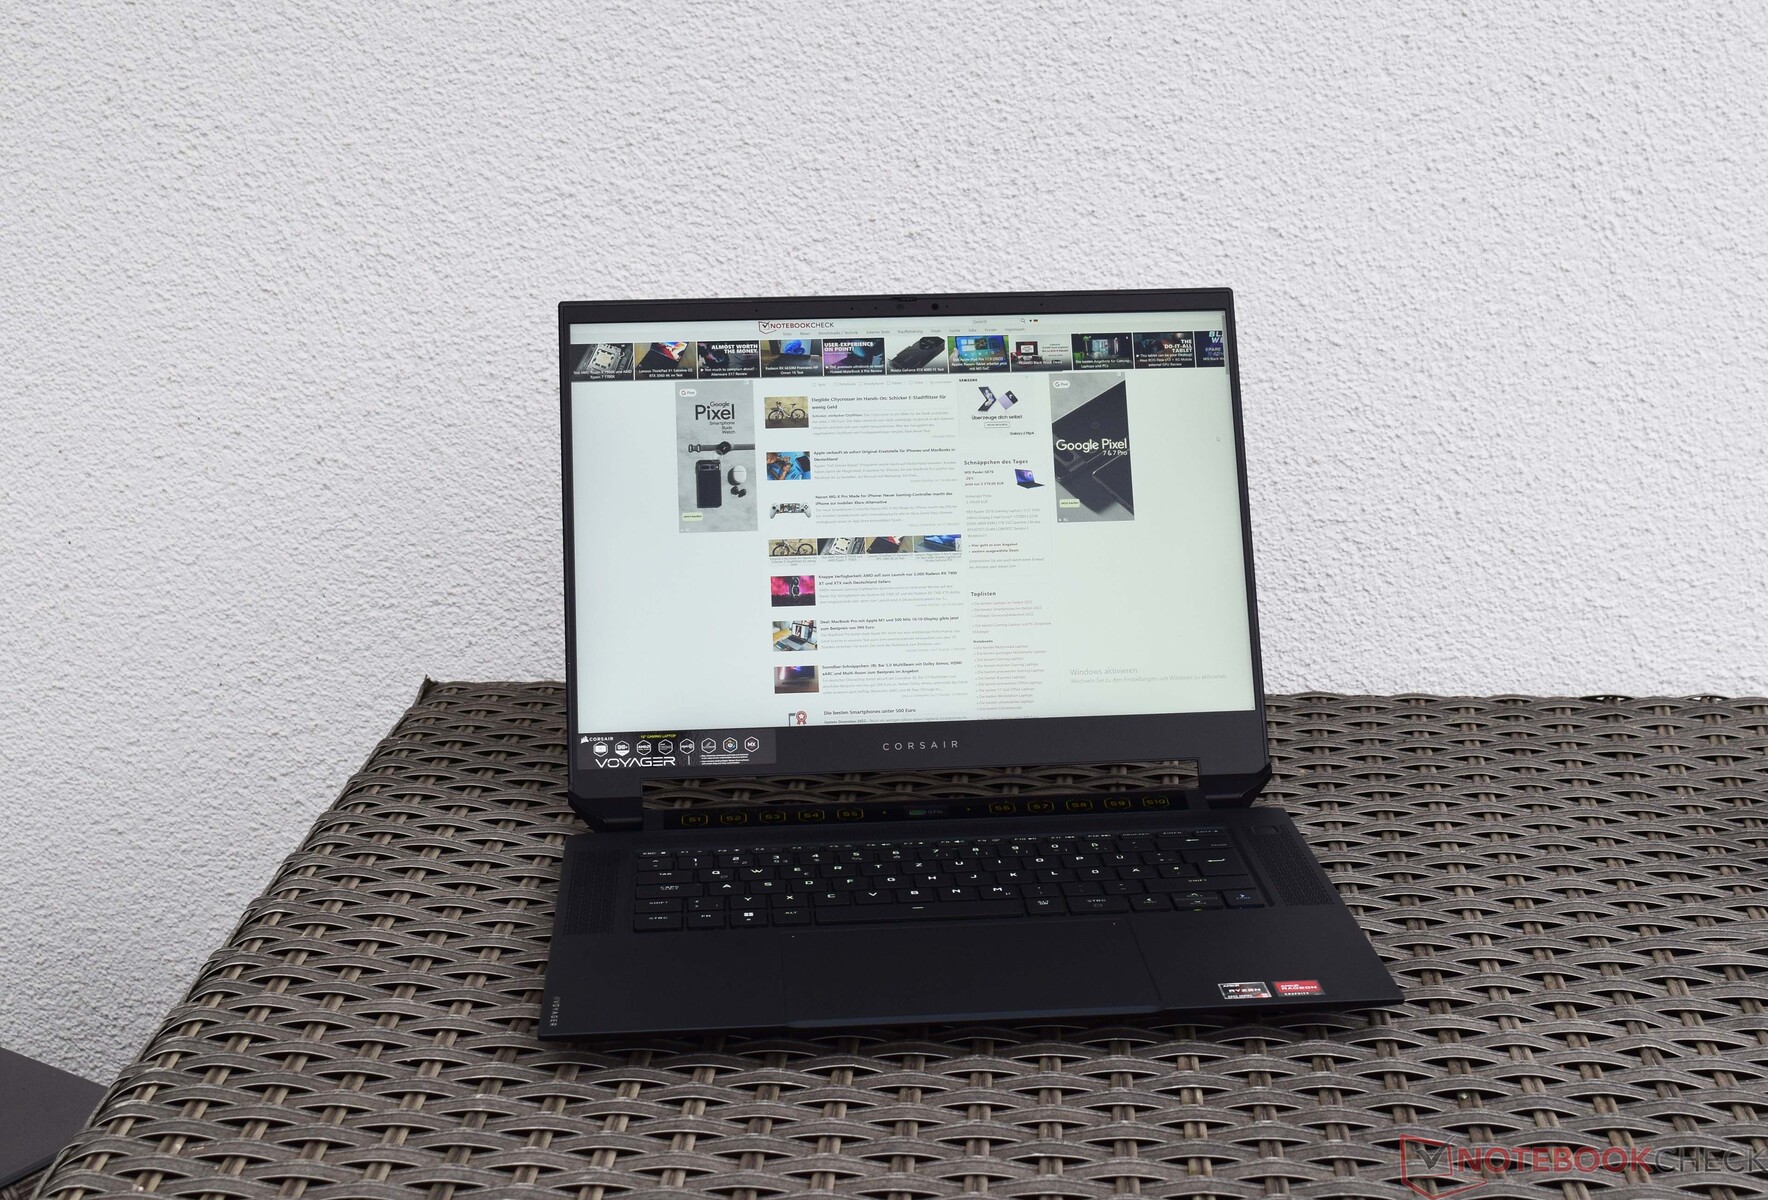
Funda y características - Fina pero robusta
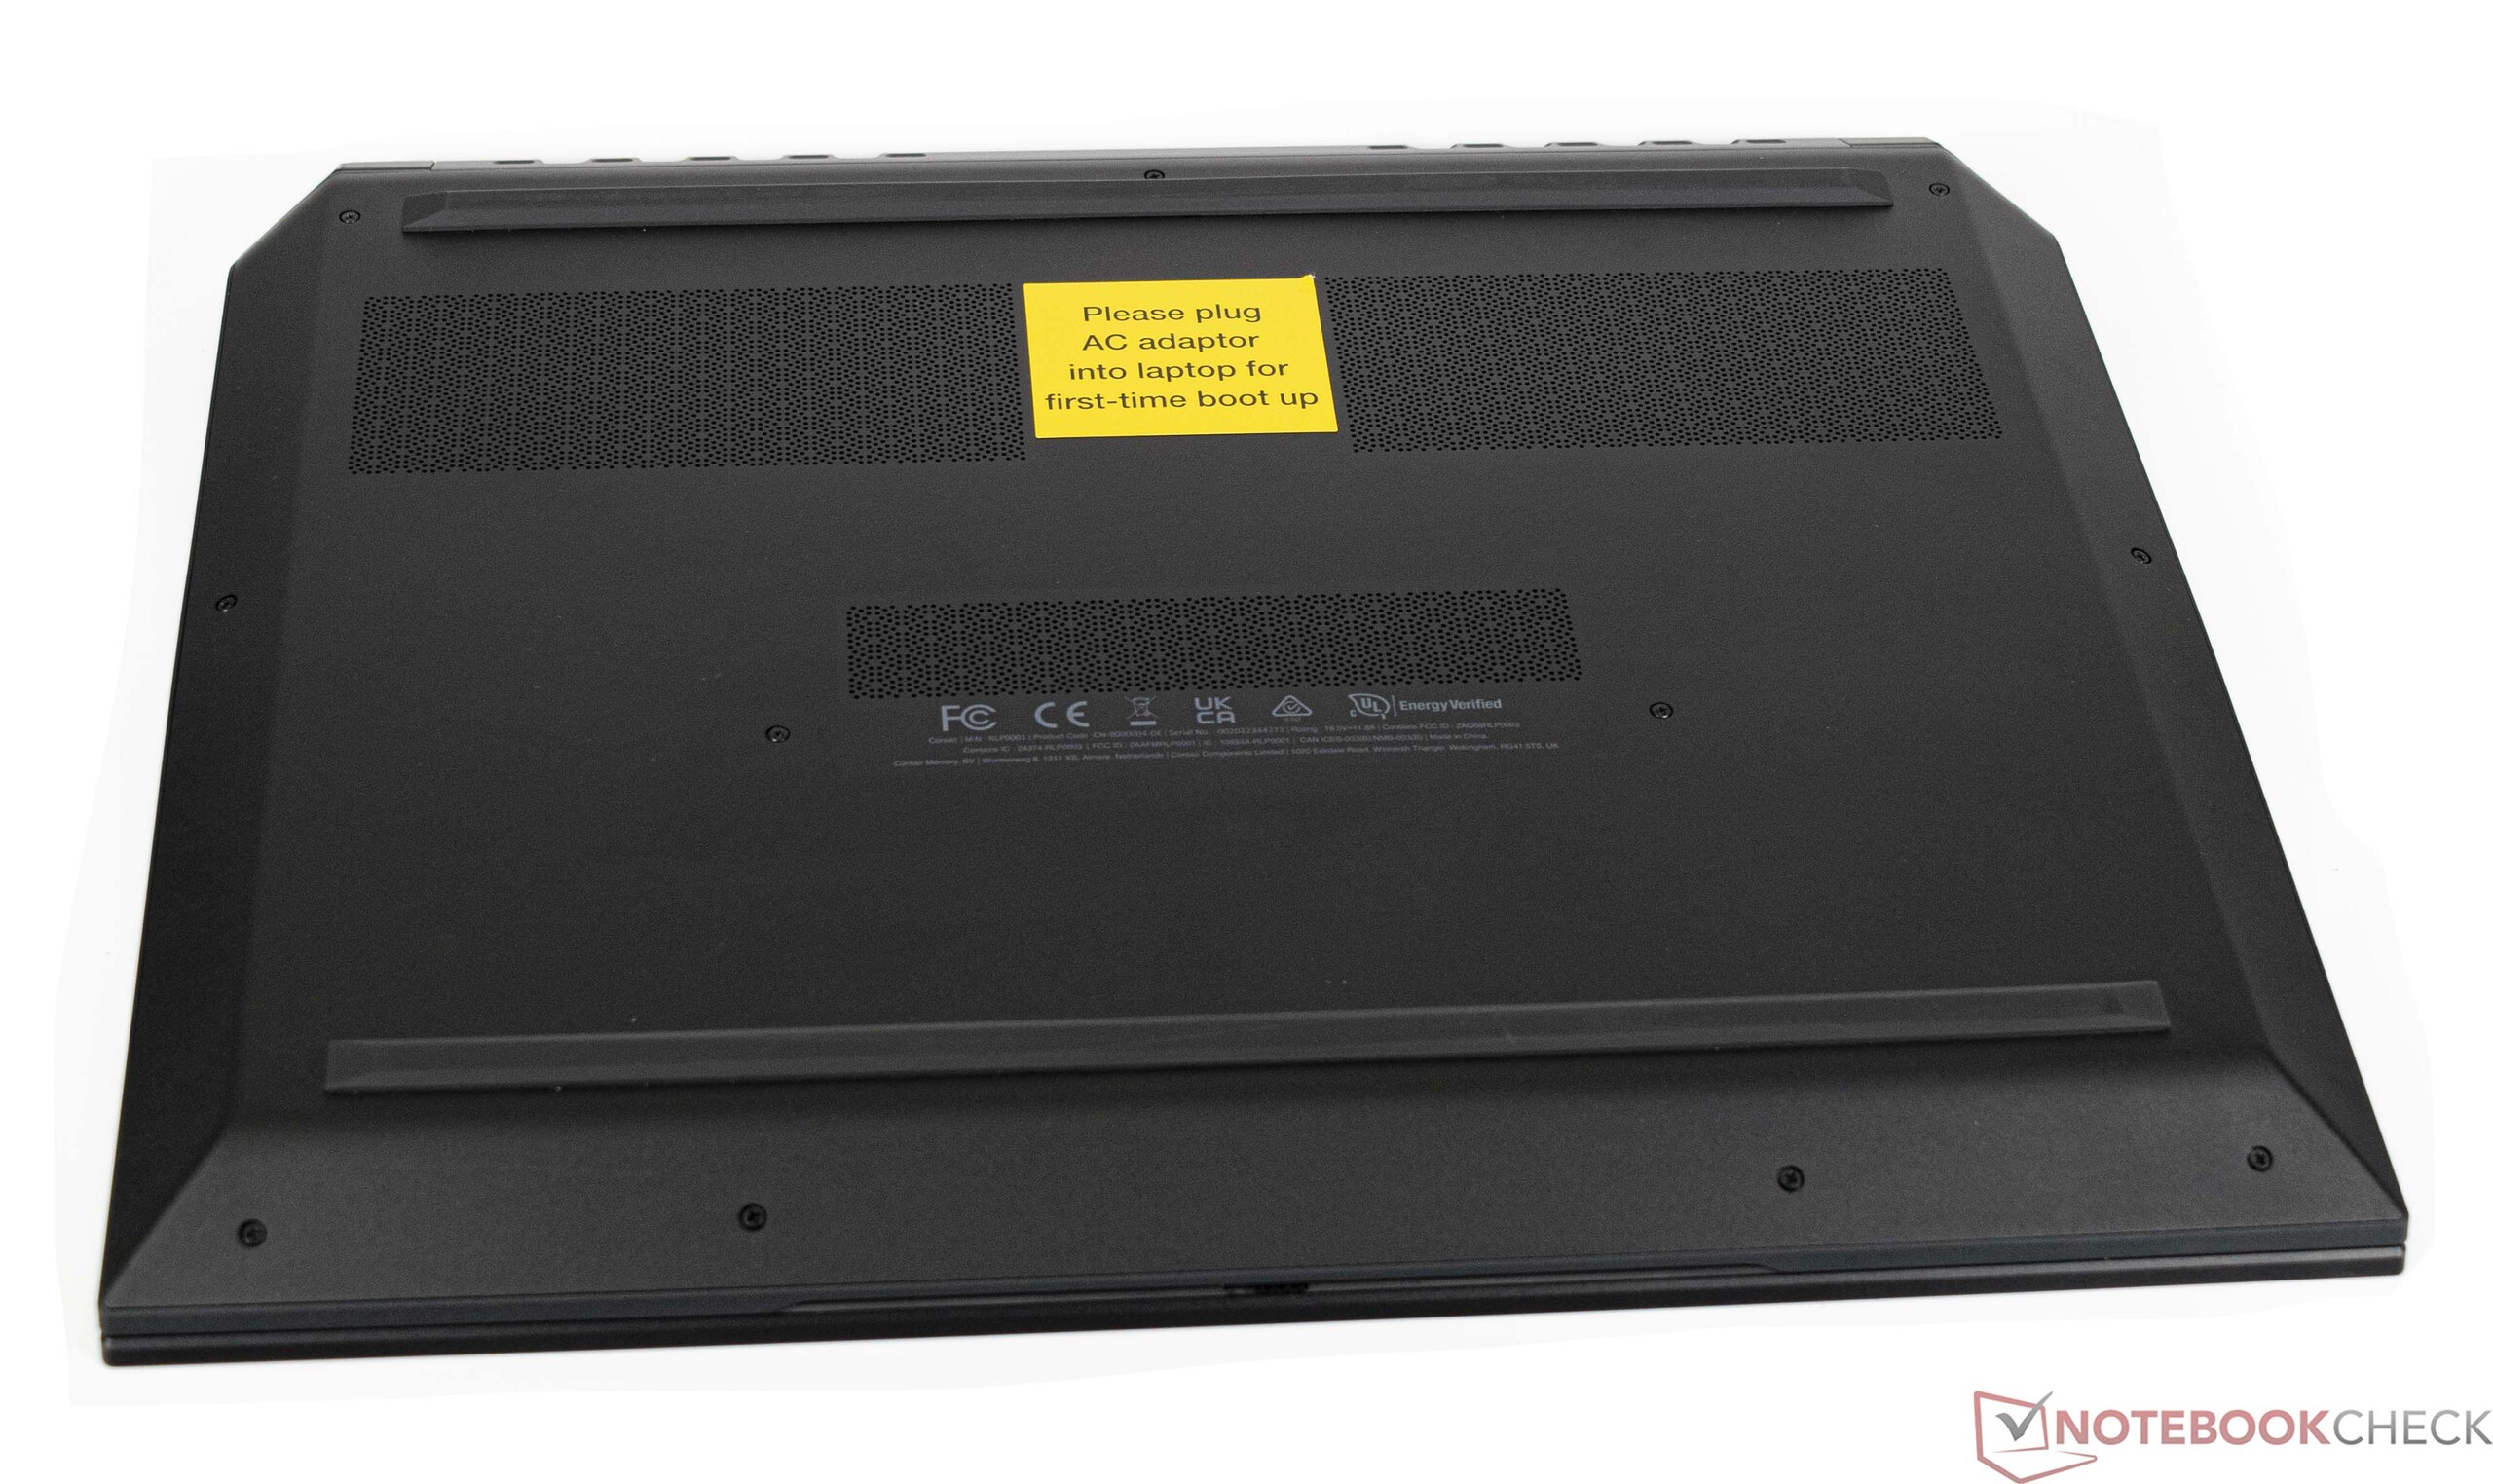
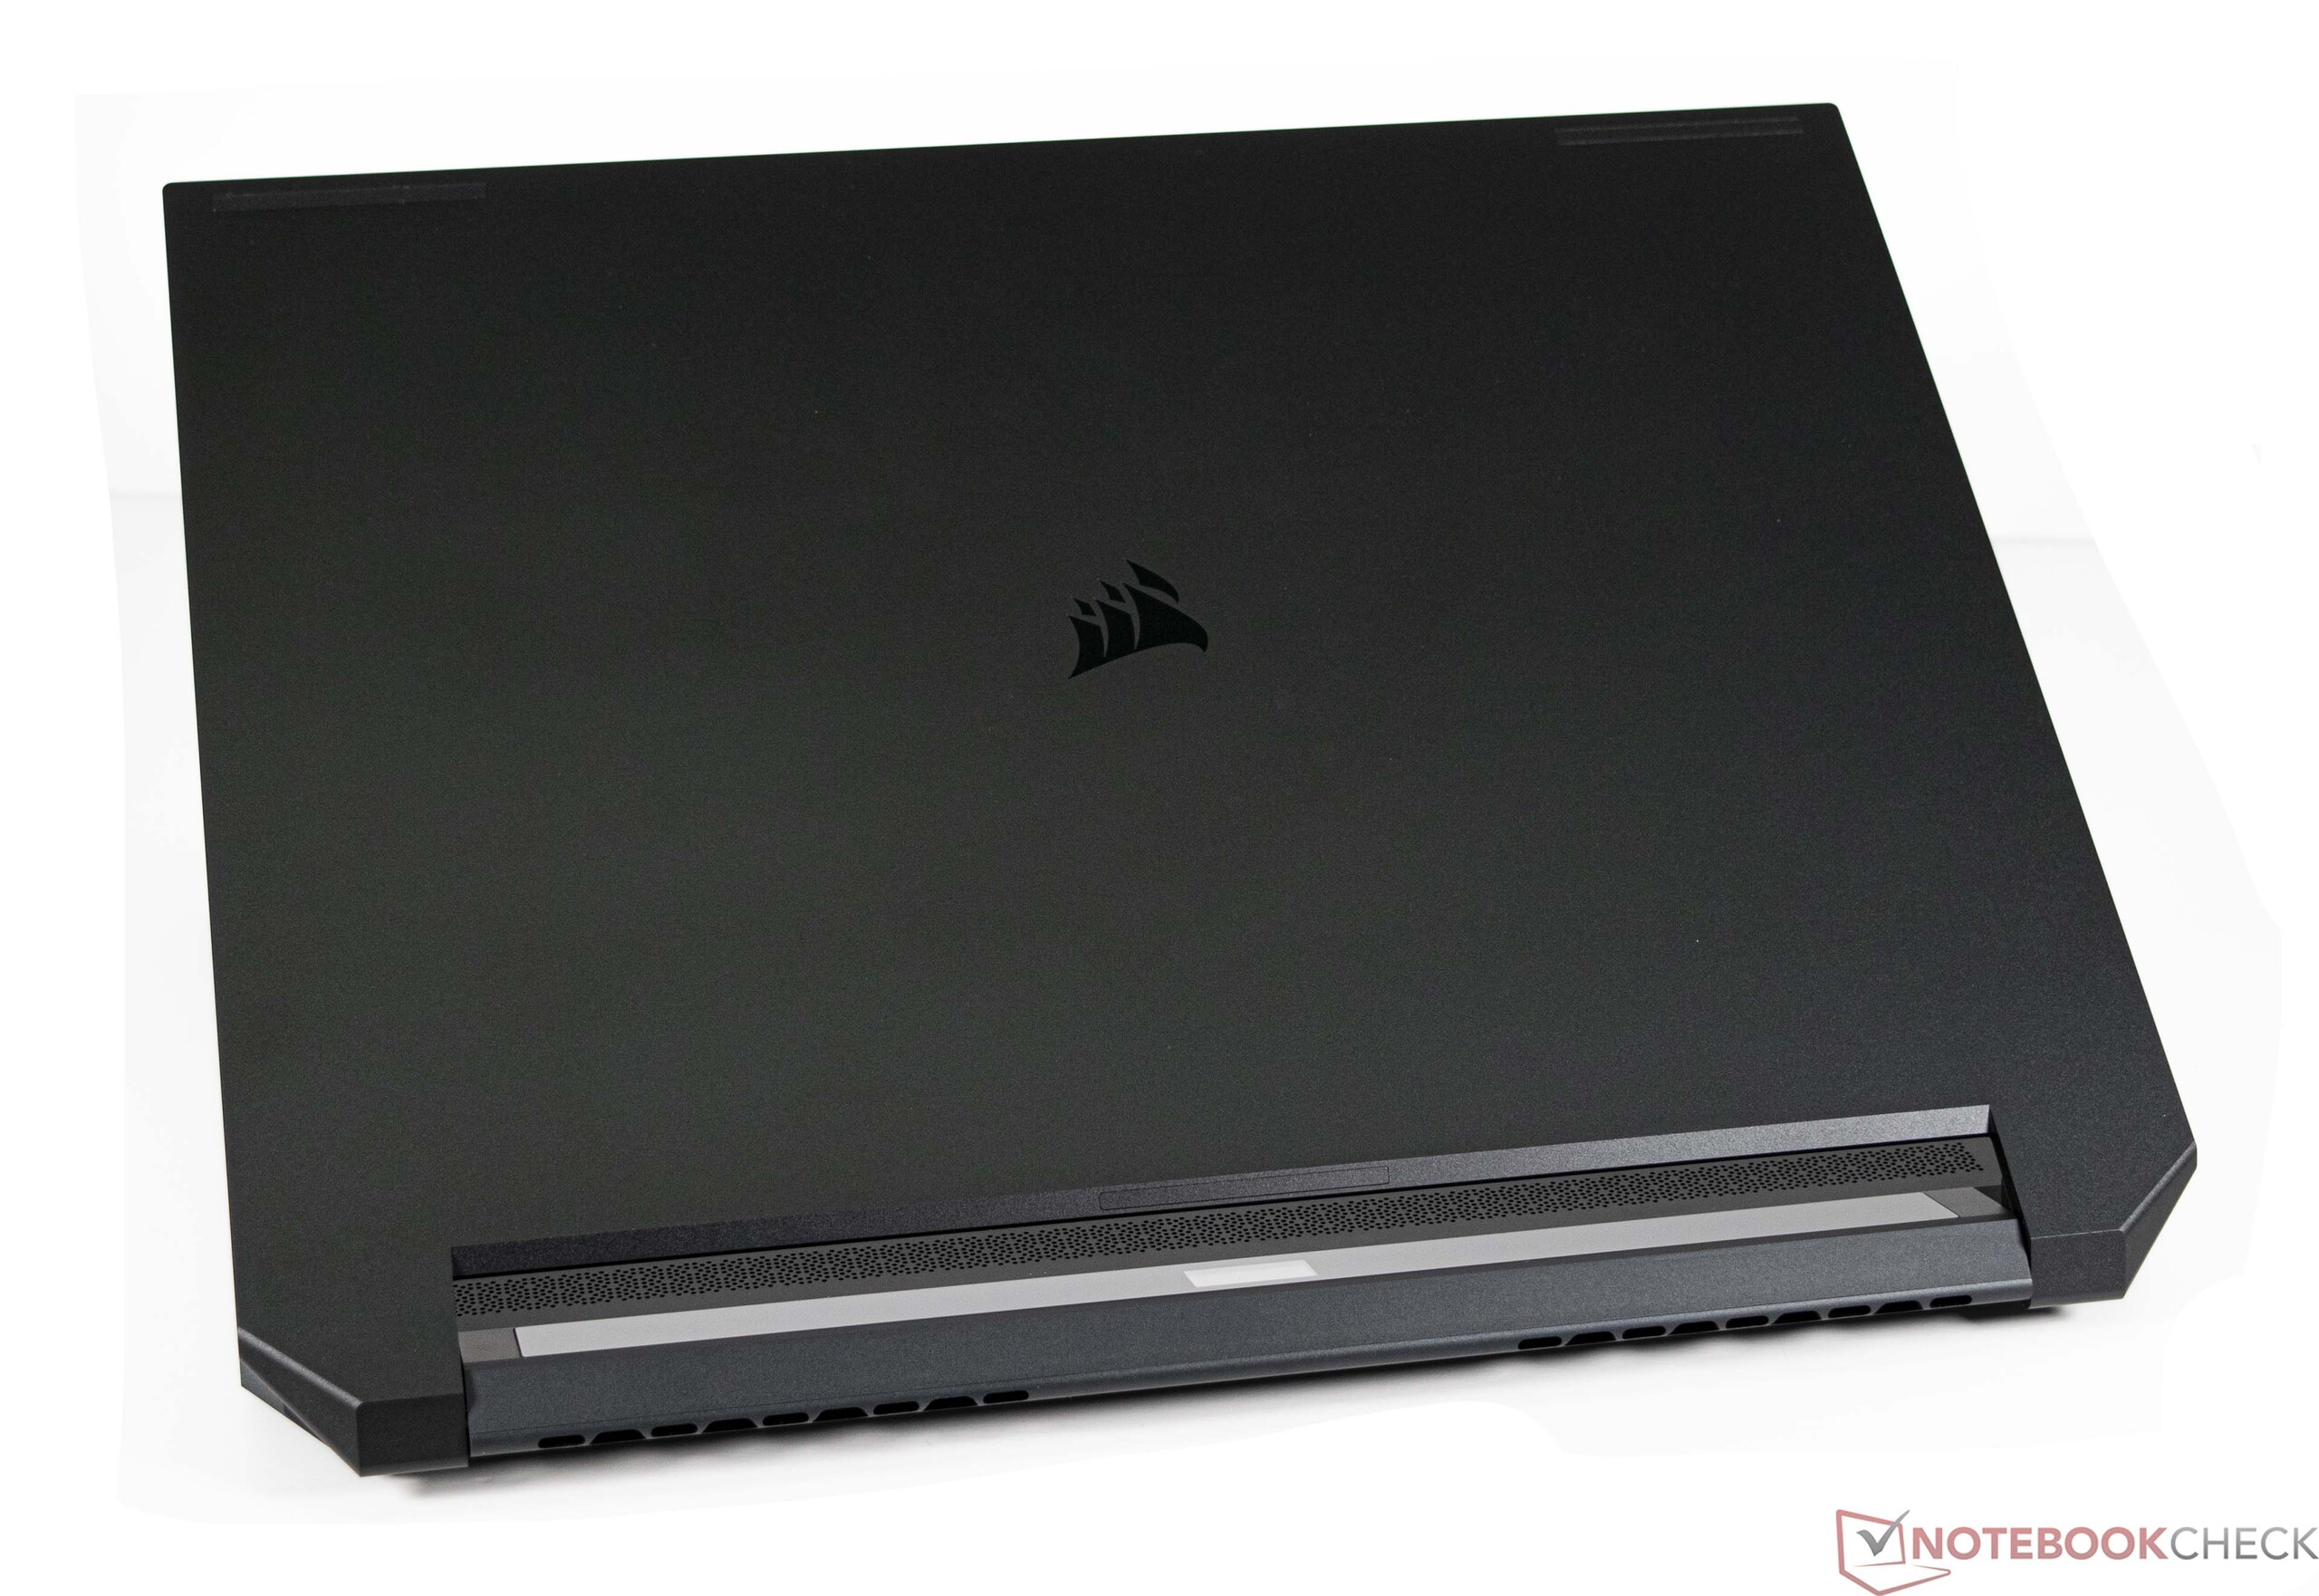
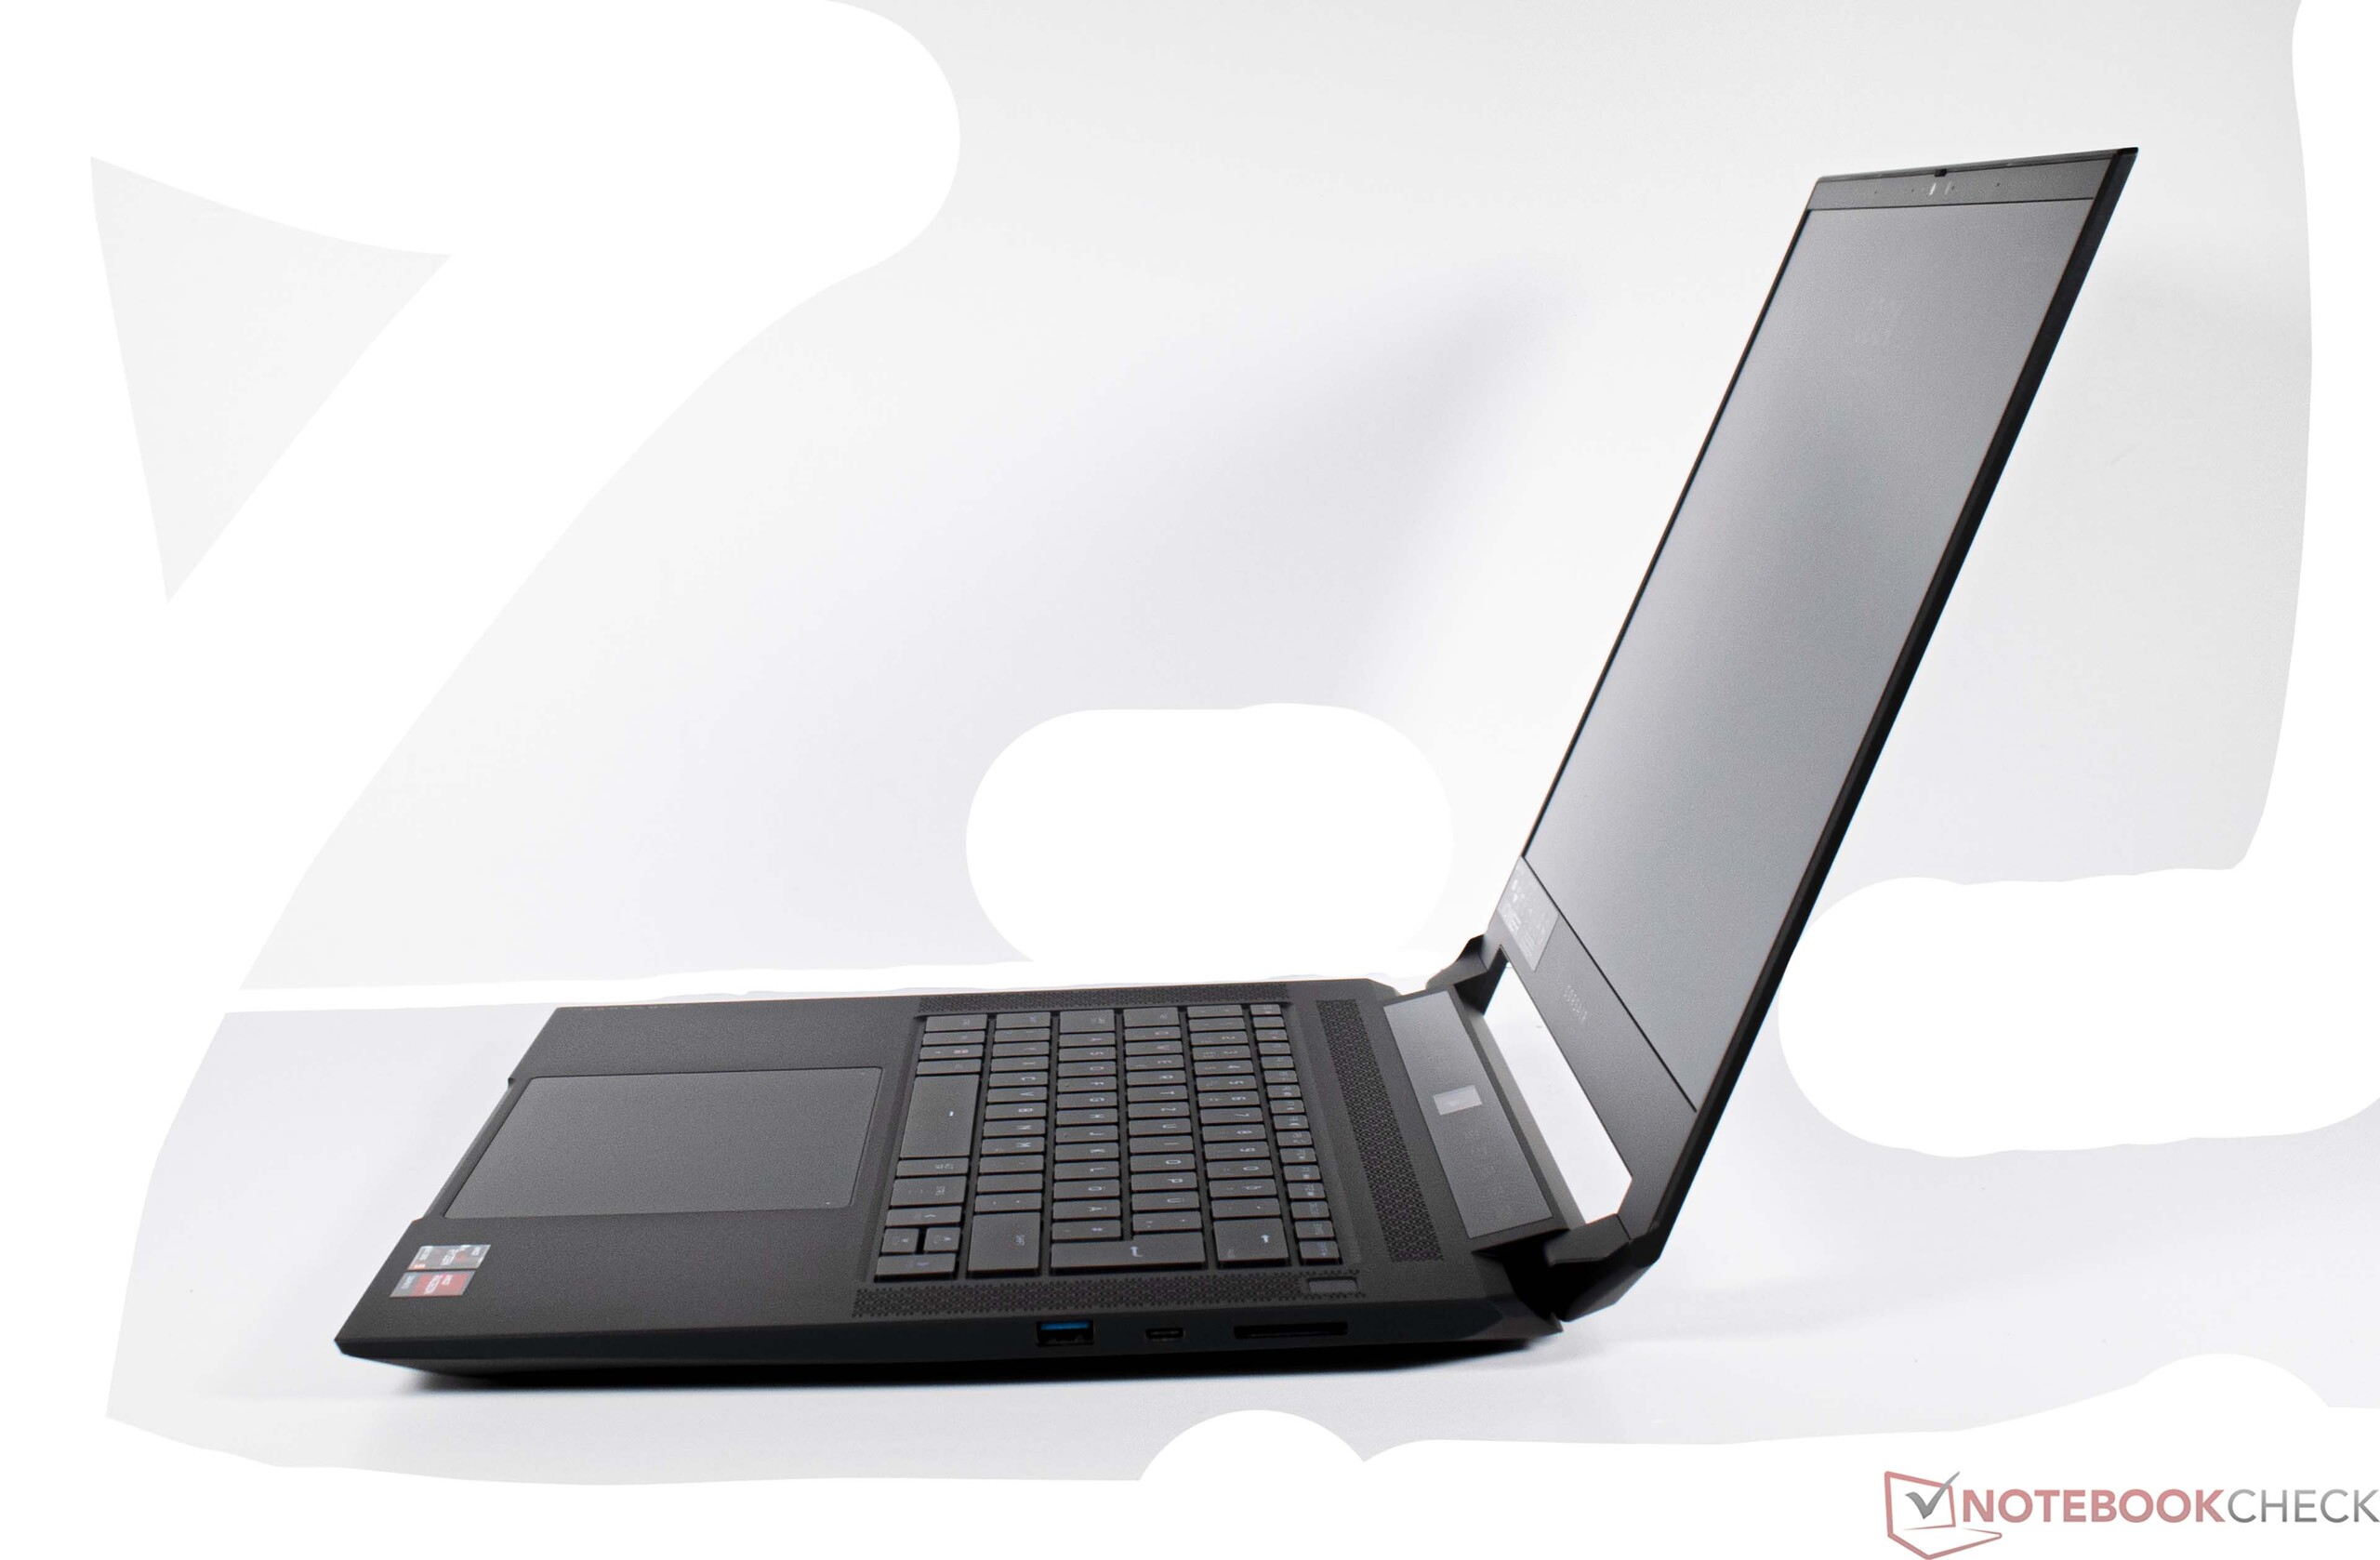
La carcasa del Corsair Voyager a1600 está hecha de aluminio y por lo tanto le da al dispositivo muy buena estabilidad. Sólo la tapa de la pantalla se torció ligeramente durante nuestras pruebas de torsión. Por lo demás, el portátil para juegos tiene una apariencia relativamente modesta y prescinde de iluminación RGB, lo que está bastante bien. La pantalla está sujeta por dos pequeñas bisagras, que no pueden evitar completamente el rebote.
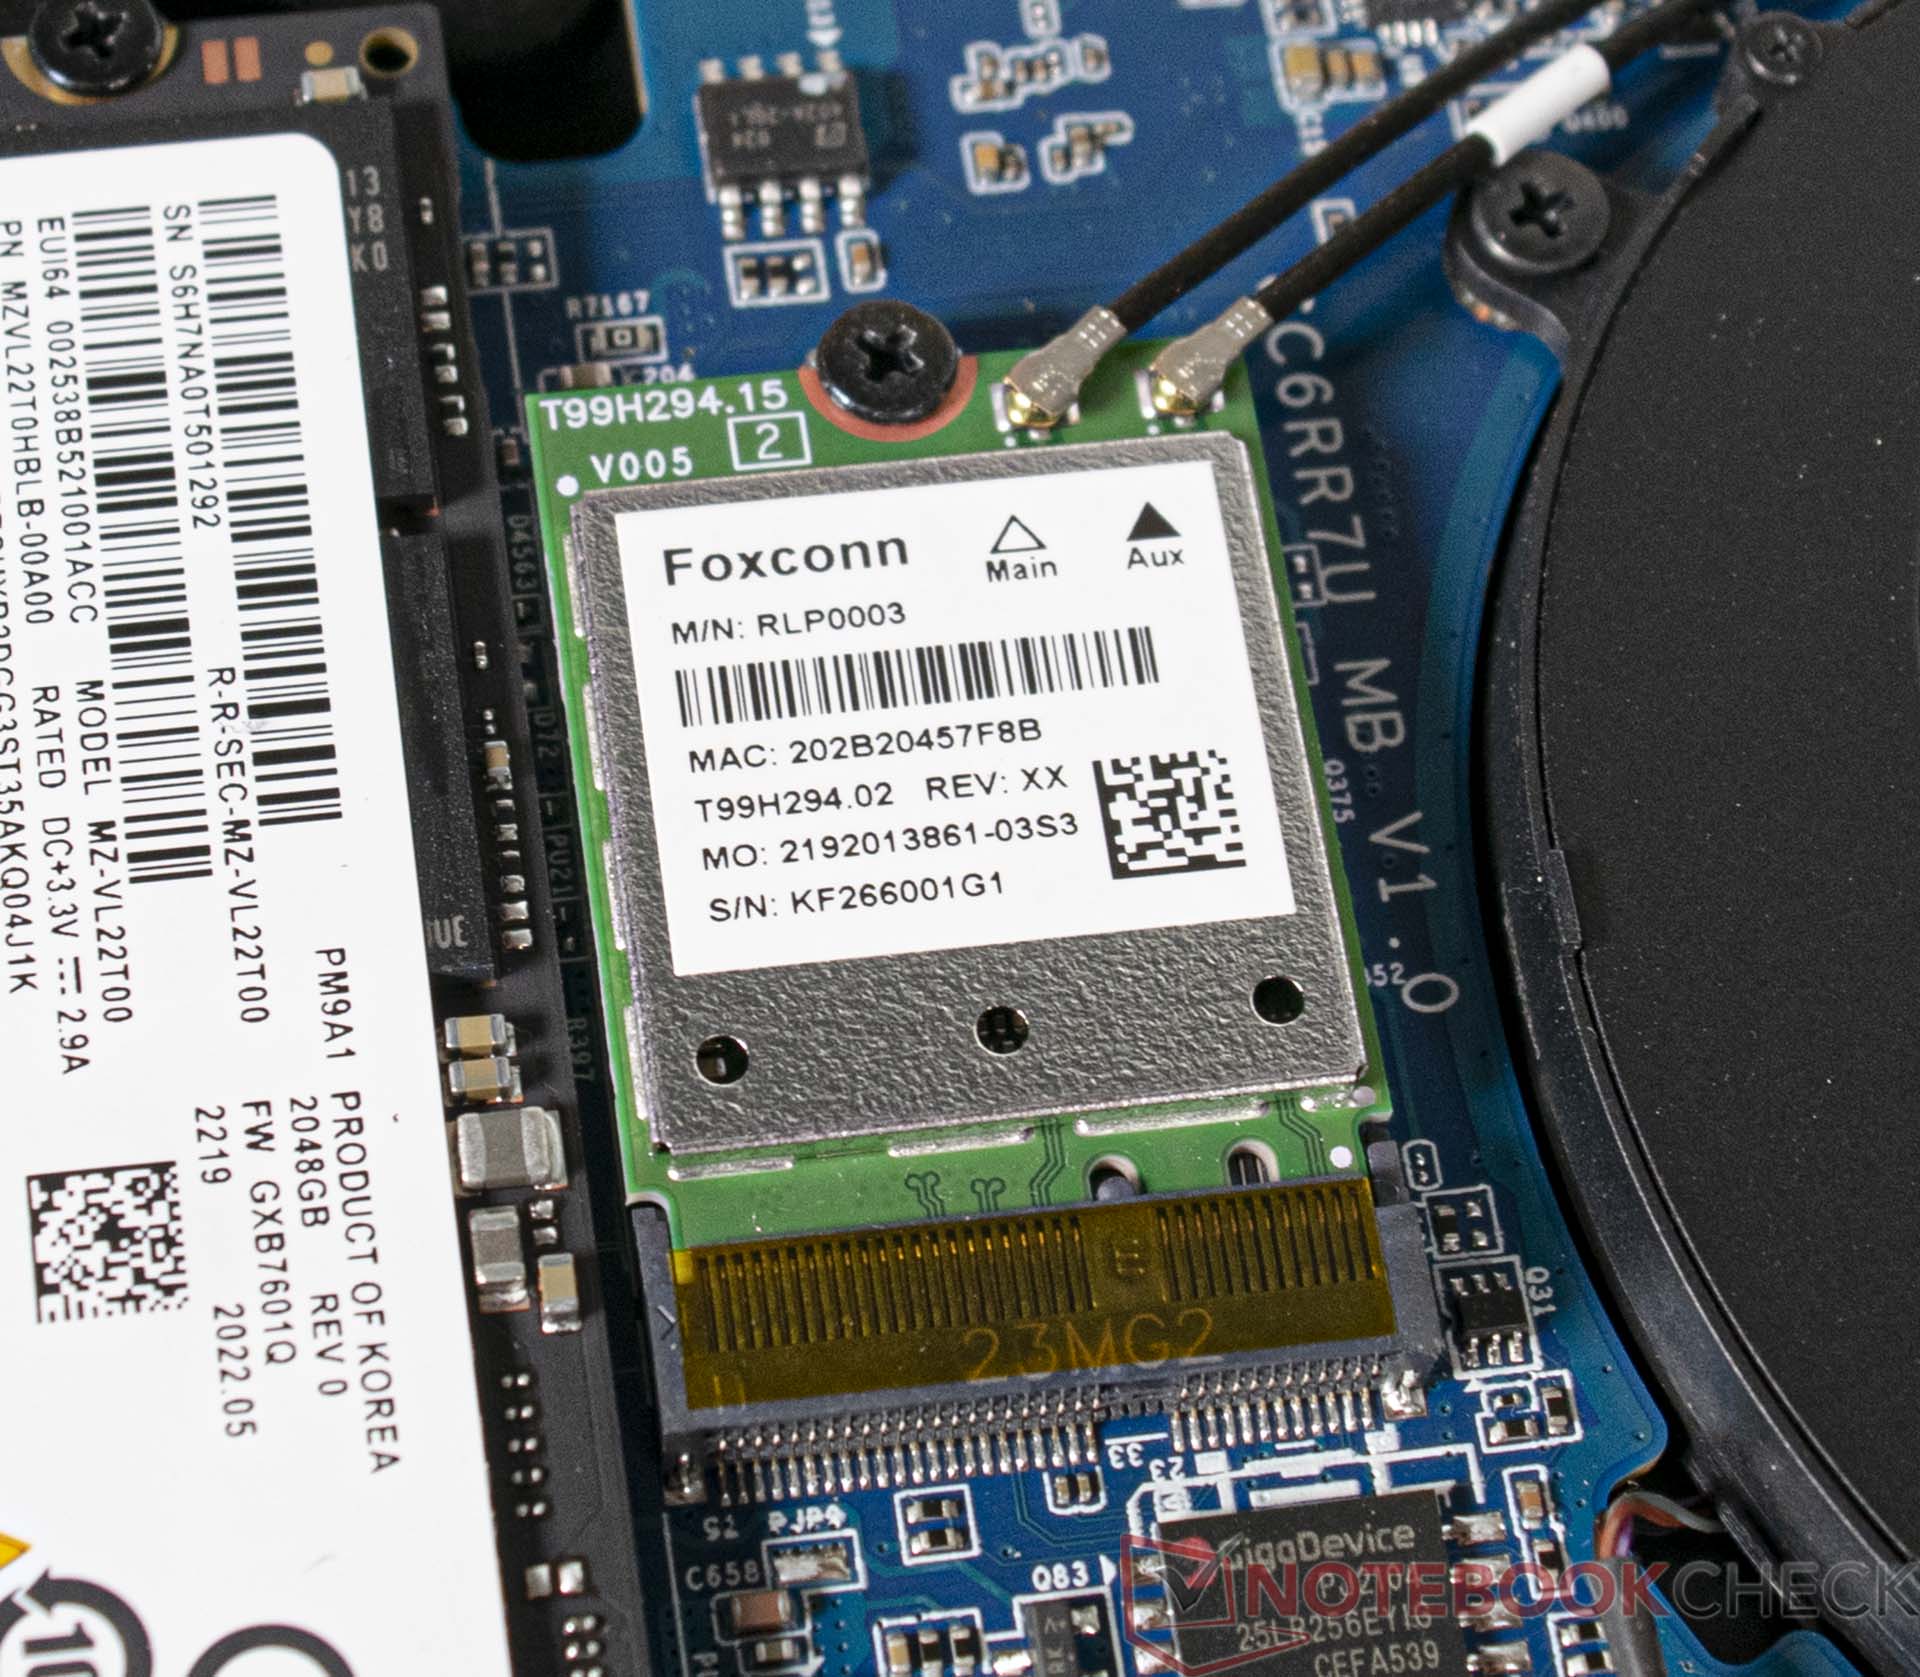
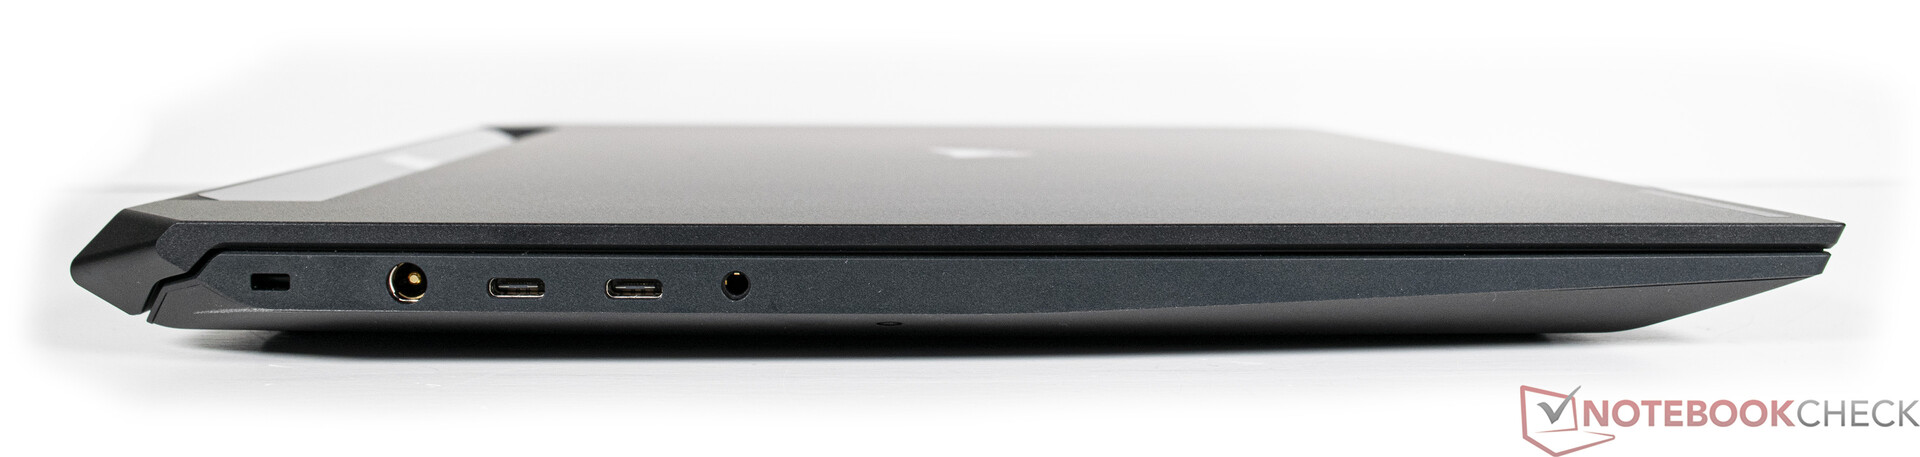
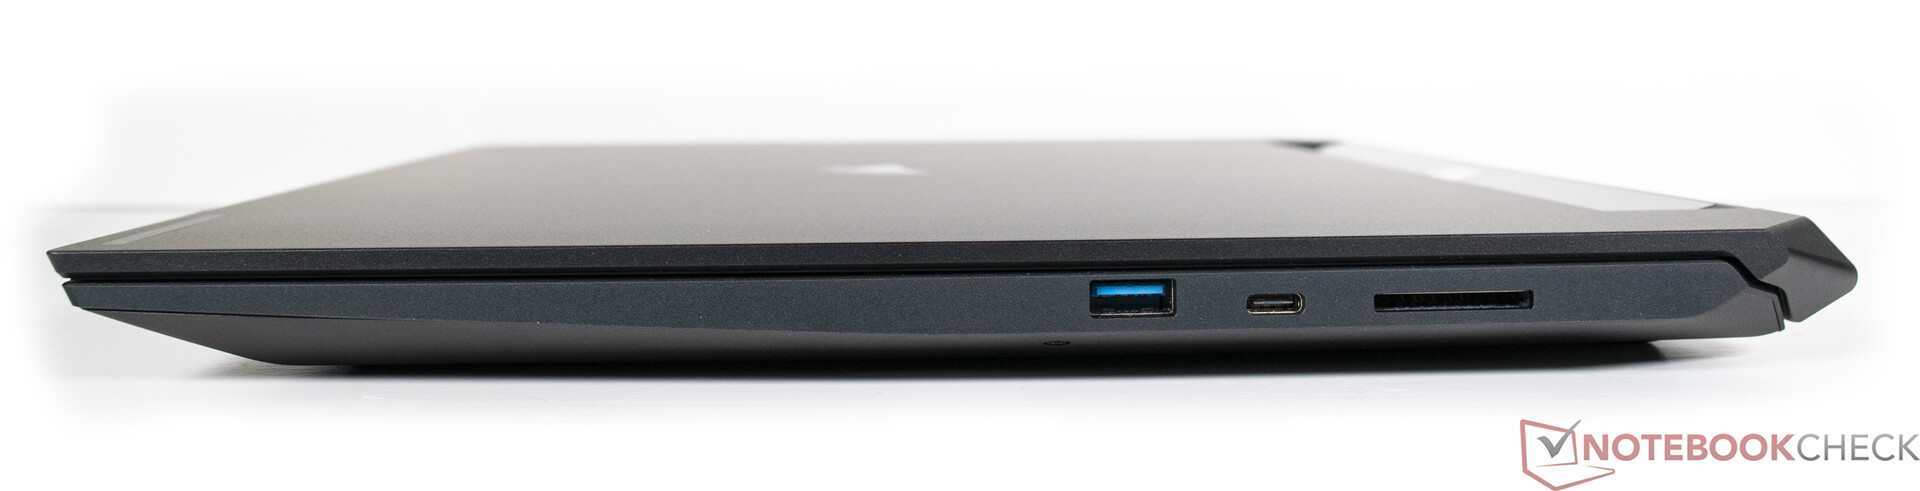
En términos de conectividad, Corsair ofrece interfaces modernas, aunque el número es muy manejable. Es una pena tener sólo un USB Type-A, pero hay tres puertos USB-C con soporte Thunderbolt. Así, el portátil está bien preparado para el futuro. El número de interfaces es probablemente tan escaso debido a la característica Slipstream, ya que varios accesorios pueden conectarse directamente al portátil a través de esta tecnología inalámbrica sin un dongle adicional. La propia Corsair ofrece sus propios ratones, teclados y auriculares para ello. El módulo Wi-Fi viene de Foxconn y ofrece el estándar Wi-Fi 6E actual.
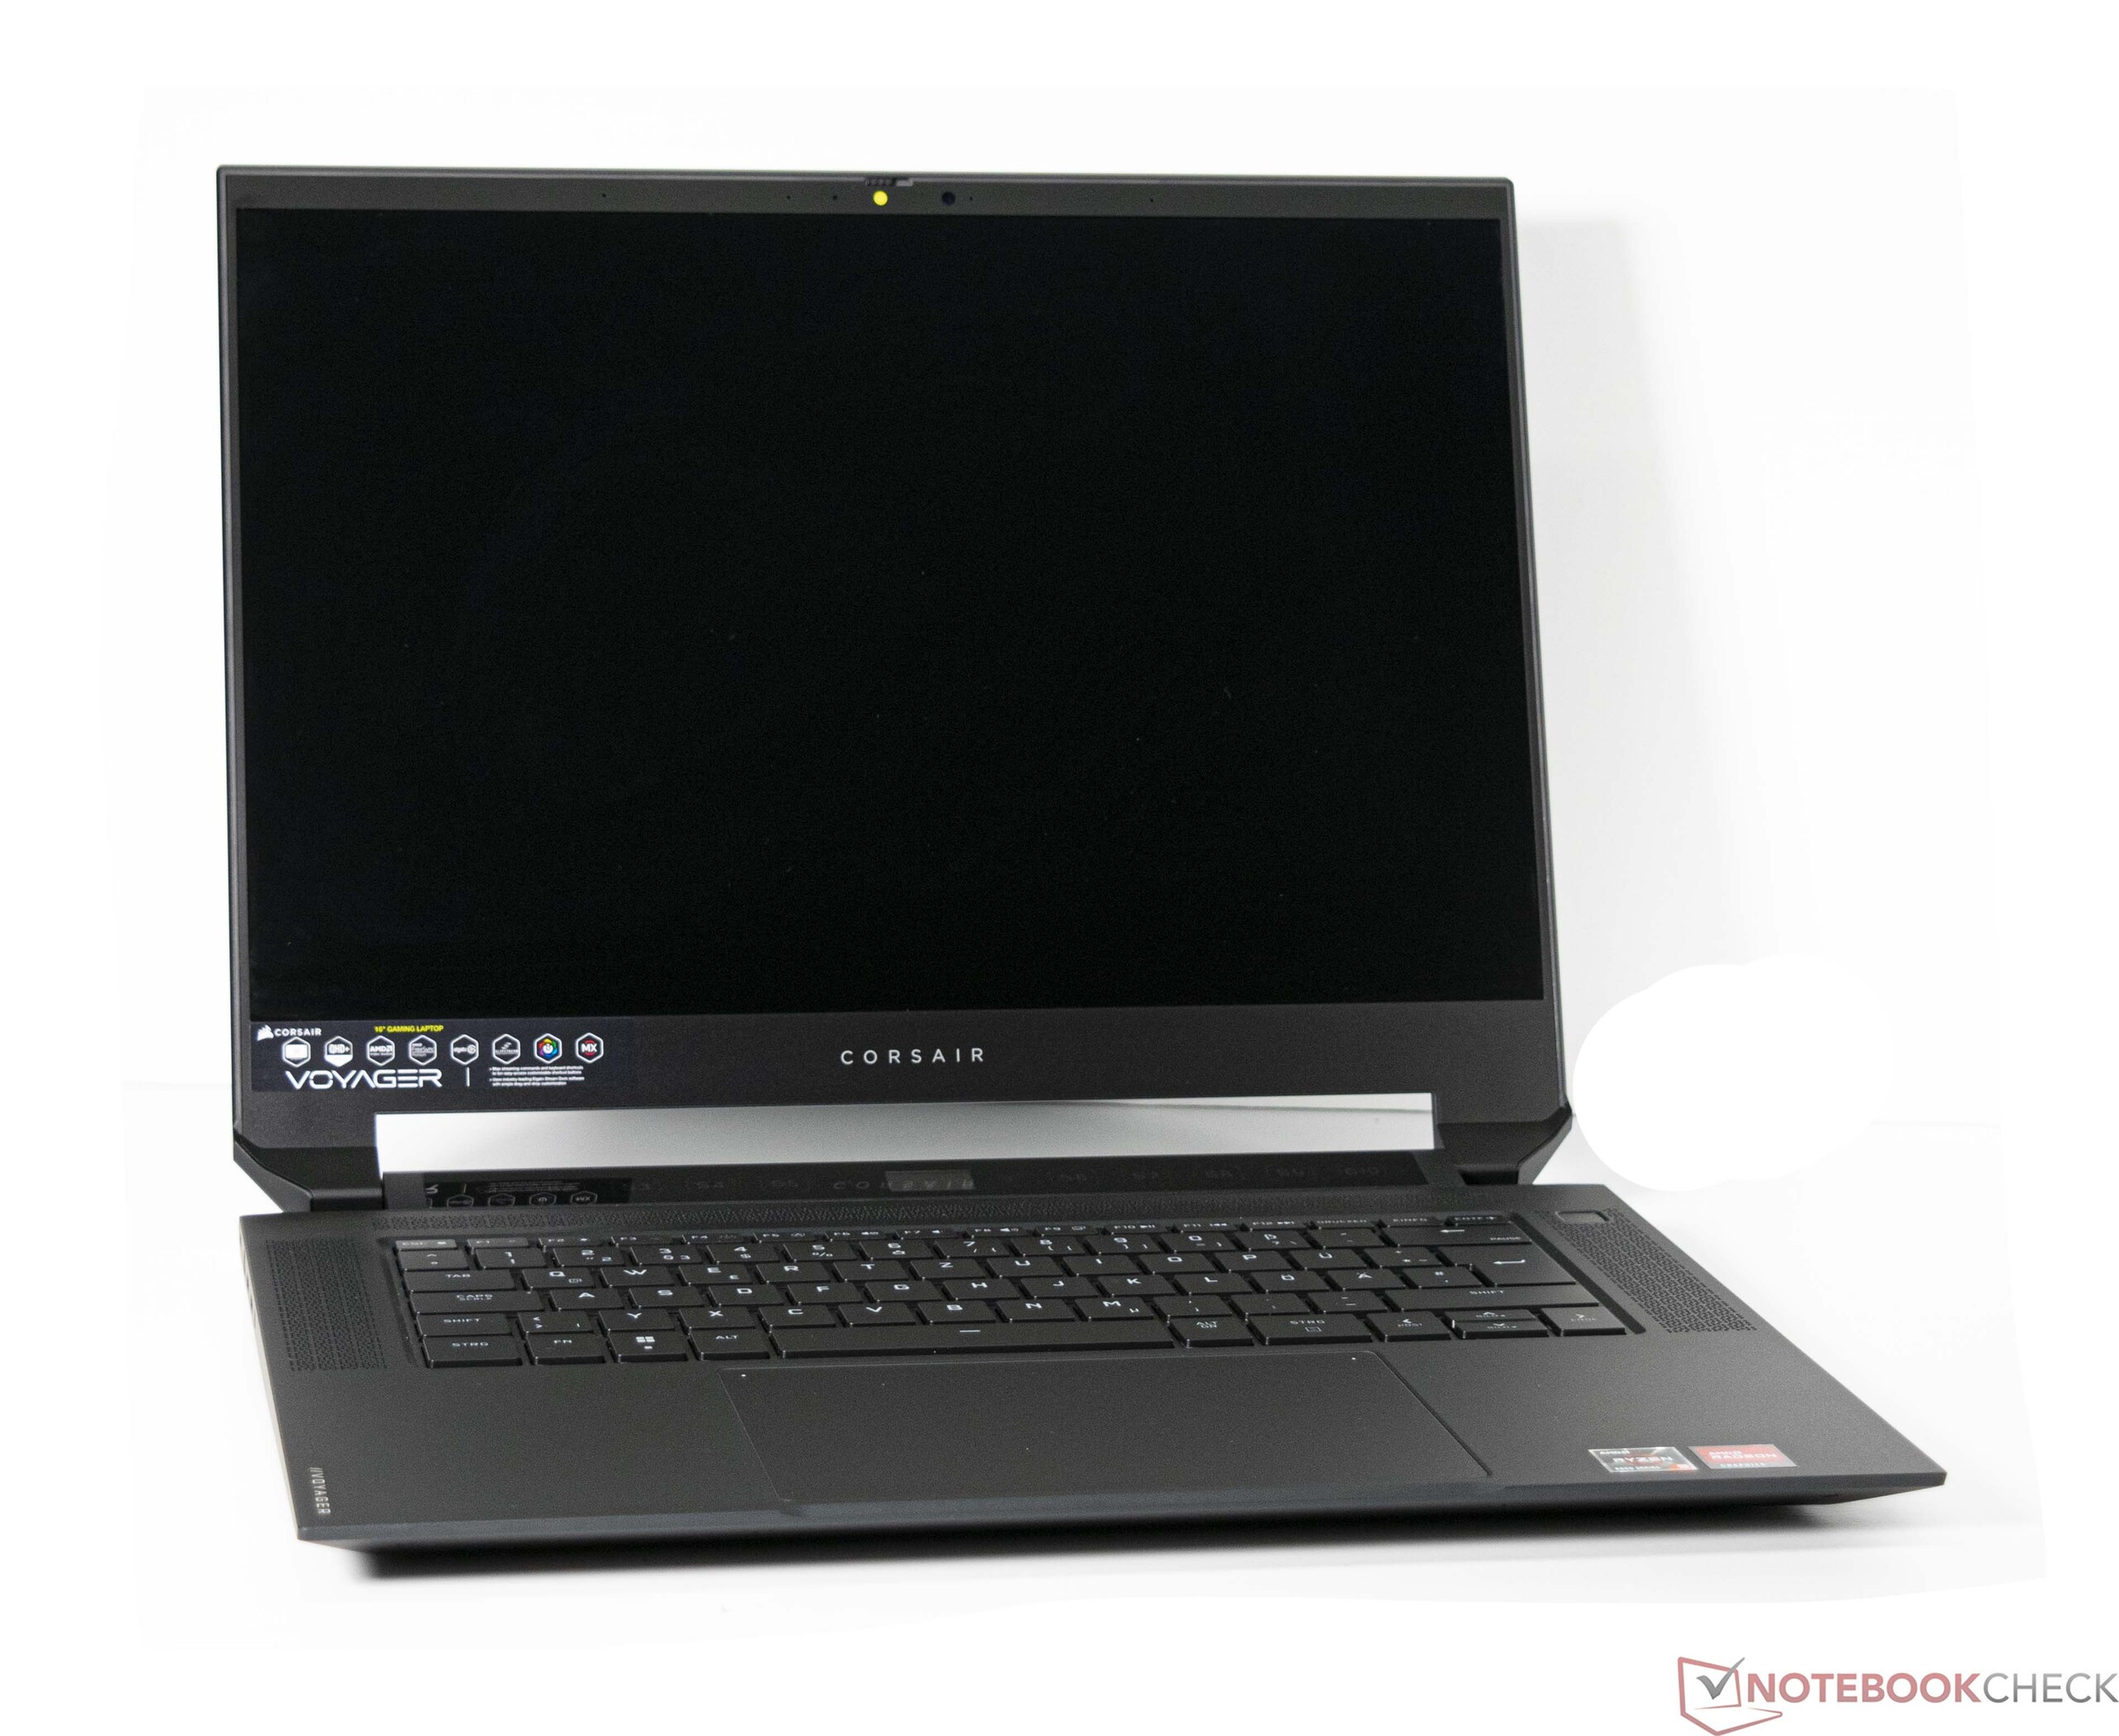
El uso previsto como portátil de streaming requiere una buena webcam. La prueba muestra que la cámara 1080p integrada rinde mejor que la competencia. No obstante, recomendamos usar una cámara externa para uso estacionario. Para el uso móvil, puedes recurrir con confianza a la integrada.
| SD Card Reader | |
| average JPG Copy Test (av. of 3 runs) | |
| Asus ROG Flow X16 GV601RW-M5082W (AV Pro SD microSD 128 GB V60) | |
| Media de la clase Gaming (20.9 - 210, n=54, últimos 2 años) | |
| Corsair Voyager a1600 (AV Pro SD microSD 128 GB V60) | |
| Acer Predator Triton 500 SE PT516-52s-70KX (AV PRO microSD 128 GB V60) | |
| HP Omen 16-b1090ng (AV PRO microSD 128 GB V60) | |
| maximum AS SSD Seq Read Test (1GB) | |
| Asus ROG Flow X16 GV601RW-M5082W (AV Pro SD microSD 128 GB V60) | |
| Media de la clase Gaming (25.5 - 261, n=51, últimos 2 años) | |
| Corsair Voyager a1600 (AV Pro SD microSD 128 GB V60) | |
| Acer Predator Triton 500 SE PT516-52s-70KX (AV PRO microSD 128 GB V60) | |


Dispositivos de entrada
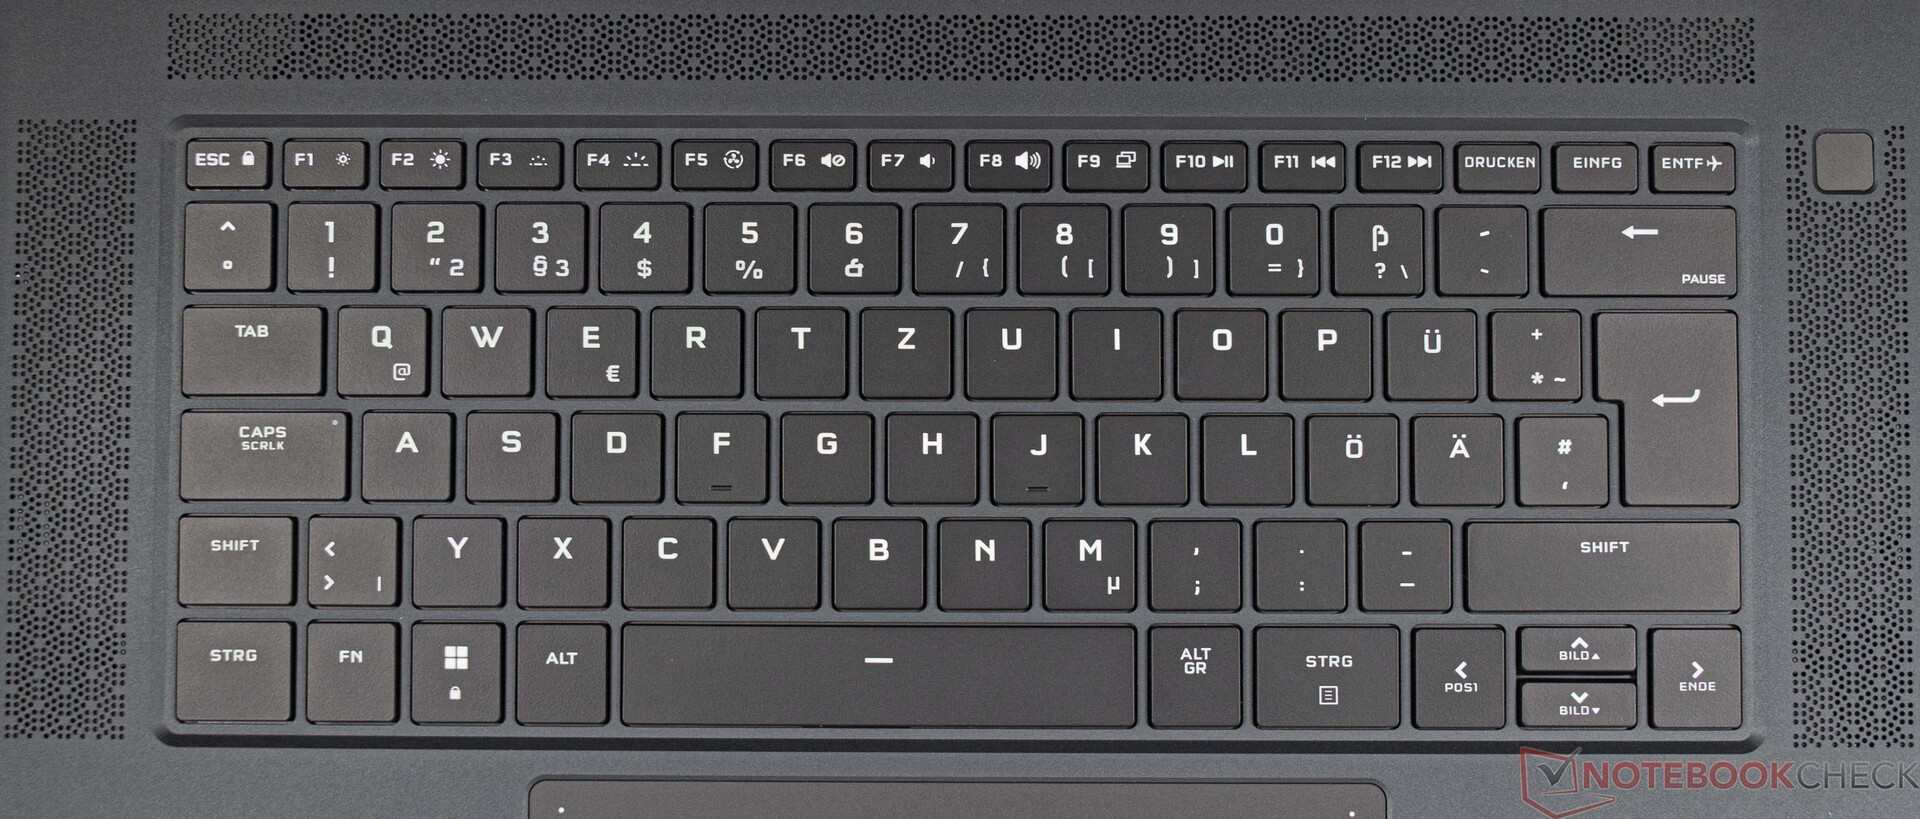
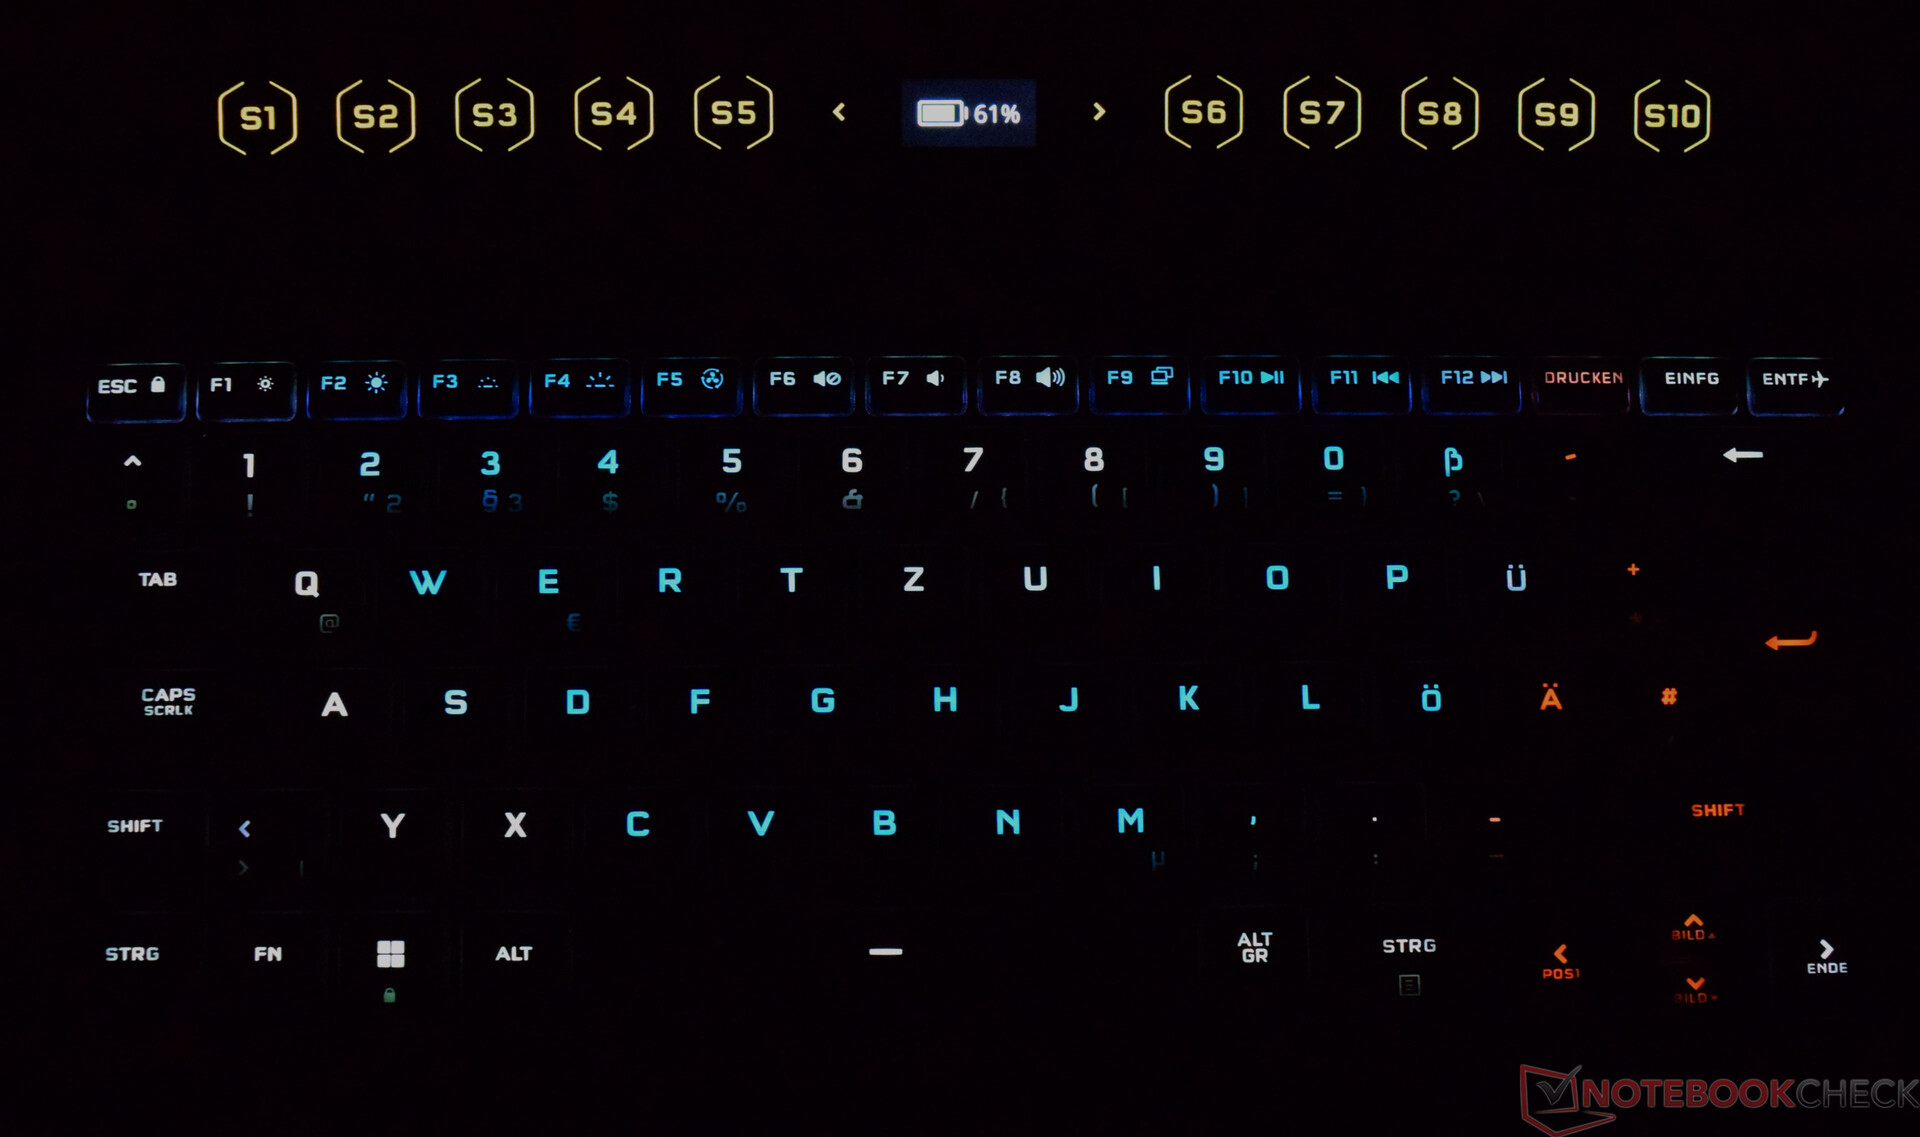
Corsair dota al Voyager a1600 de un teclado mecánico basado en interruptores Cherry MX. Estos son muy robustos y están diseñados para una longevidad extrema. El recorrido muy corto y el punto de presión claramente perceptible proporcionan al usuario una buena respuesta táctil. Además, el recorrido no está amortiguado, lo que evita una sensación de entrada esponjosa.
La iluminación del teclado puede configurarse a voluntad mediante el software iCUE. El usuario tiene a su disposición diferentes efectos y una completa paleta de colores. Además, todas las teclas se pueden configurar individualmente.
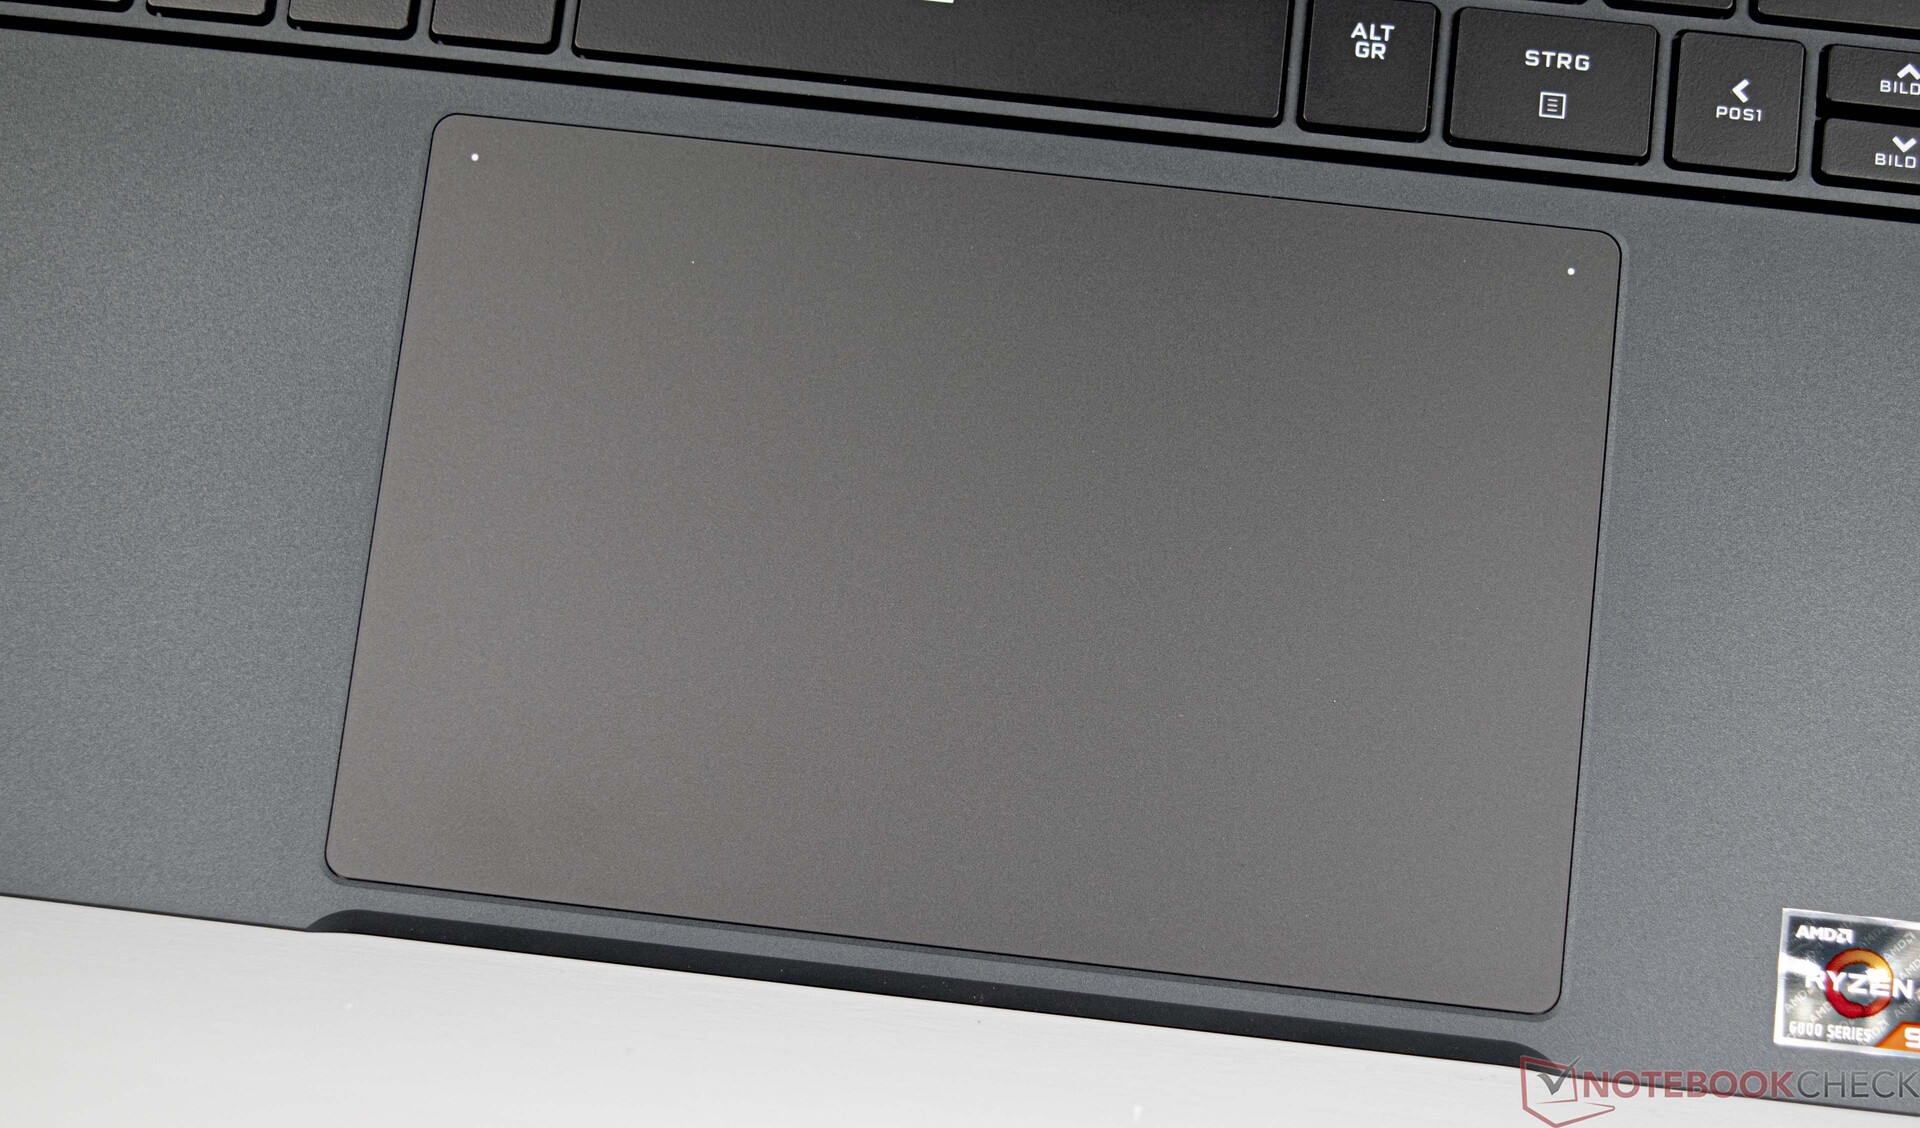
El touchpad mide 15,5 centímetros de ancho y 10 centímetros de profundidad. Por tanto, el ClickPad es muy grande y, en la práctica, resulta más adecuado como sustituto del ratón. Si el área de entrada activa te parece demasiado grande, puedes desactivar la parte derecha pulsando dos veces sobre el punto blanco de la esquina superior izquierda. Sin embargo, esta función no tiene indicación óptica ni táctil. La superficie de cristal tiene un sutil acabado satinado, que resulta cómodo de manejar incluso con los dedos algo sudorosos. Las dos teclas de entrada de la zona inferior funcionan bien y son bastante silenciosas al pulsarlas.
Pantalla - Panel rápido 16:10
La pantalla del Corsair Voyager a1600 es un panel IPS de 16 pulgadas con 240 Hz. El formato 16:10, que tiene una resolución de 2.560 x 1.600 pixels, ofrece una generosa superficie de trabajo. No hay variantes de pantalla alternativas para el Voyager a1600 hasta ahora.
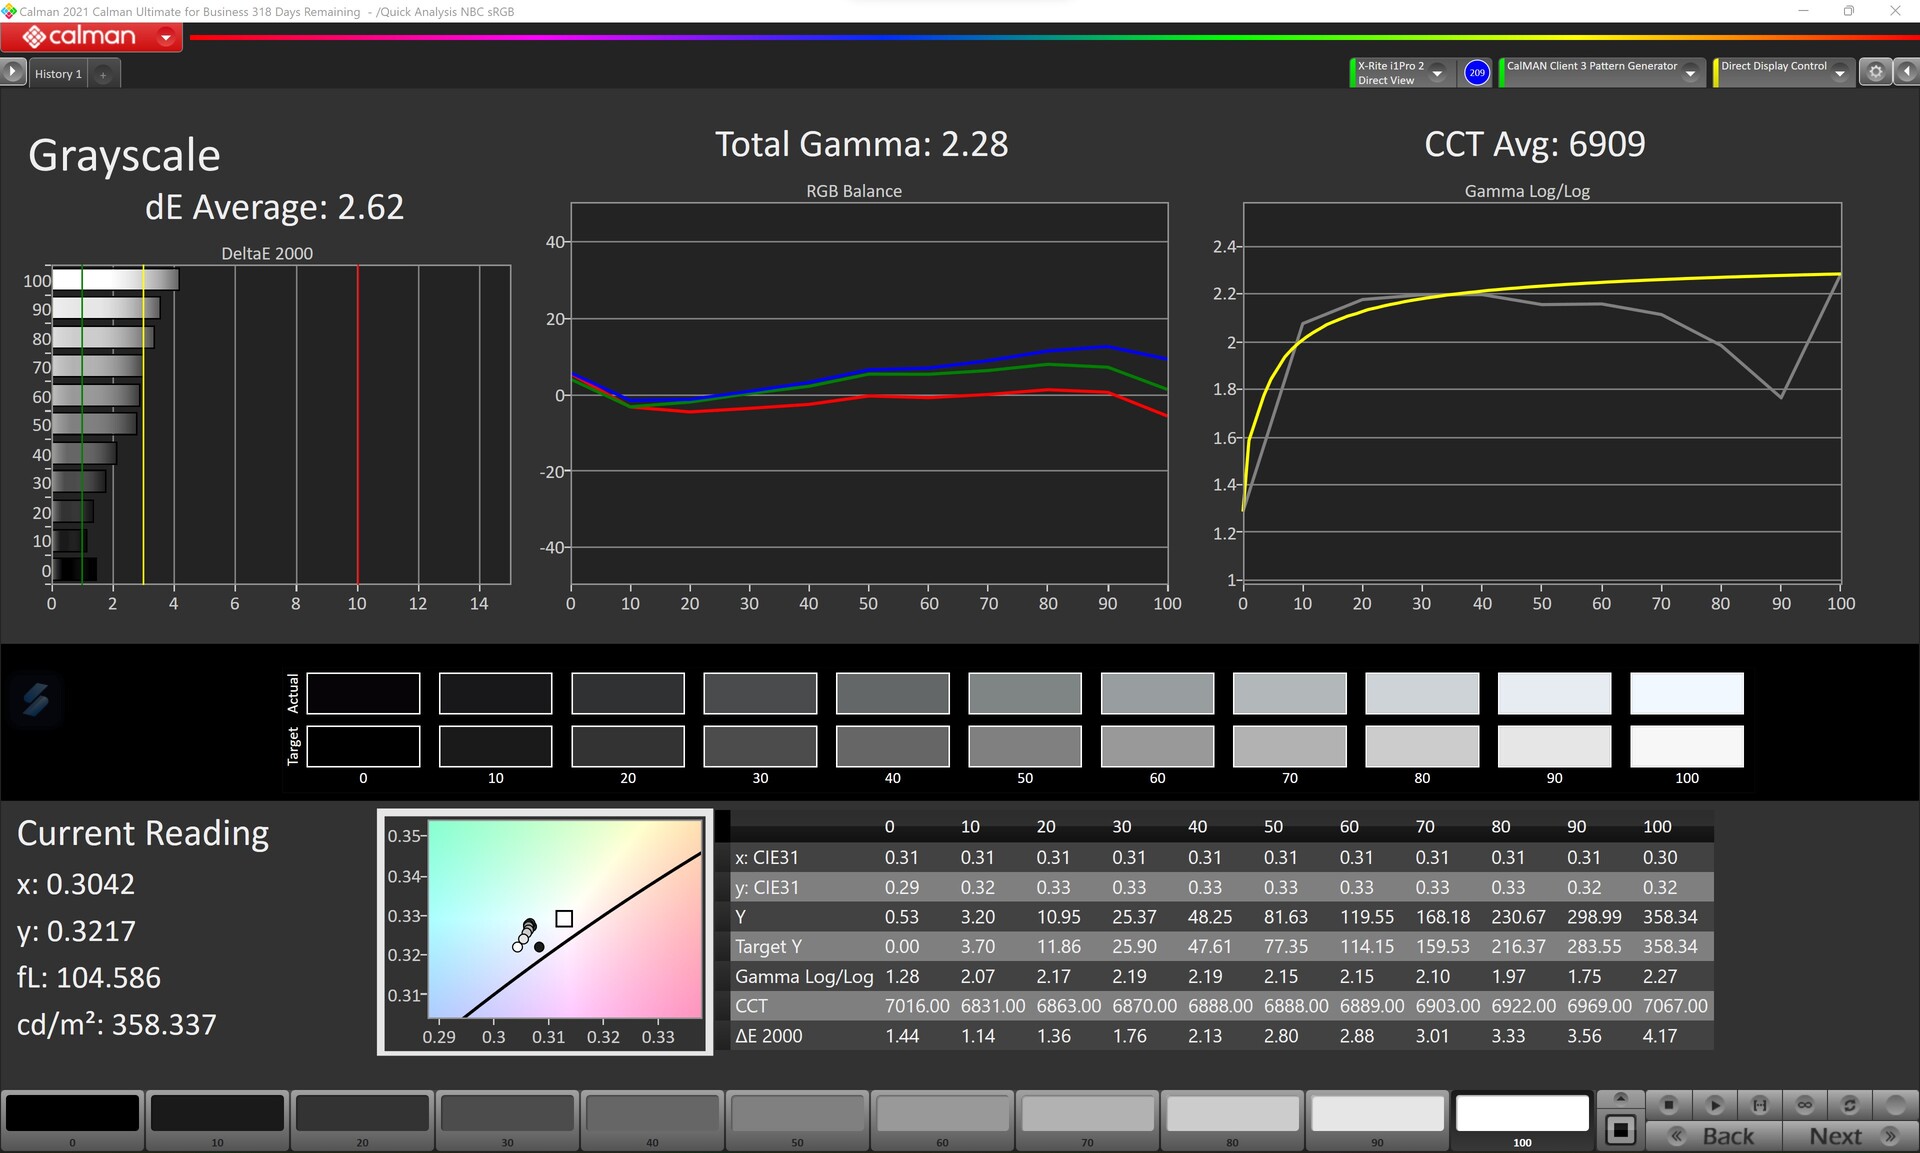
En nuestras pruebas, el panel instalado alcanza un buen brillo de 340 cd/m². Sin embargo, los contendientes ofrecen claramente pantallas más brillantes en comparación. Debido al valor de negro relativamente alto, la relación de contraste sufre considerablemente. Así, el Voyager a1600 sólo alcanza un contraste de 670:1 en nuestra prueba.
La fatiga ocular debida al PWM no debería ser un problema con el Corsair Voyager a1600. El sangrado de retroiluminación no fue un problema con nuestro dispositivo.
| |||||||||||||||||||||||||
iluminación: 91 %
Brillo con batería: 328 cd/m²
Contraste: 670:1 (Negro: 0.53 cd/m²)
ΔE ColorChecker Calman: 2.43 | ∀{0.5-29.43 Ø4.71}
calibrated: 1.14
ΔE Greyscale Calman: 2.62 | ∀{0.09-98 Ø4.96}
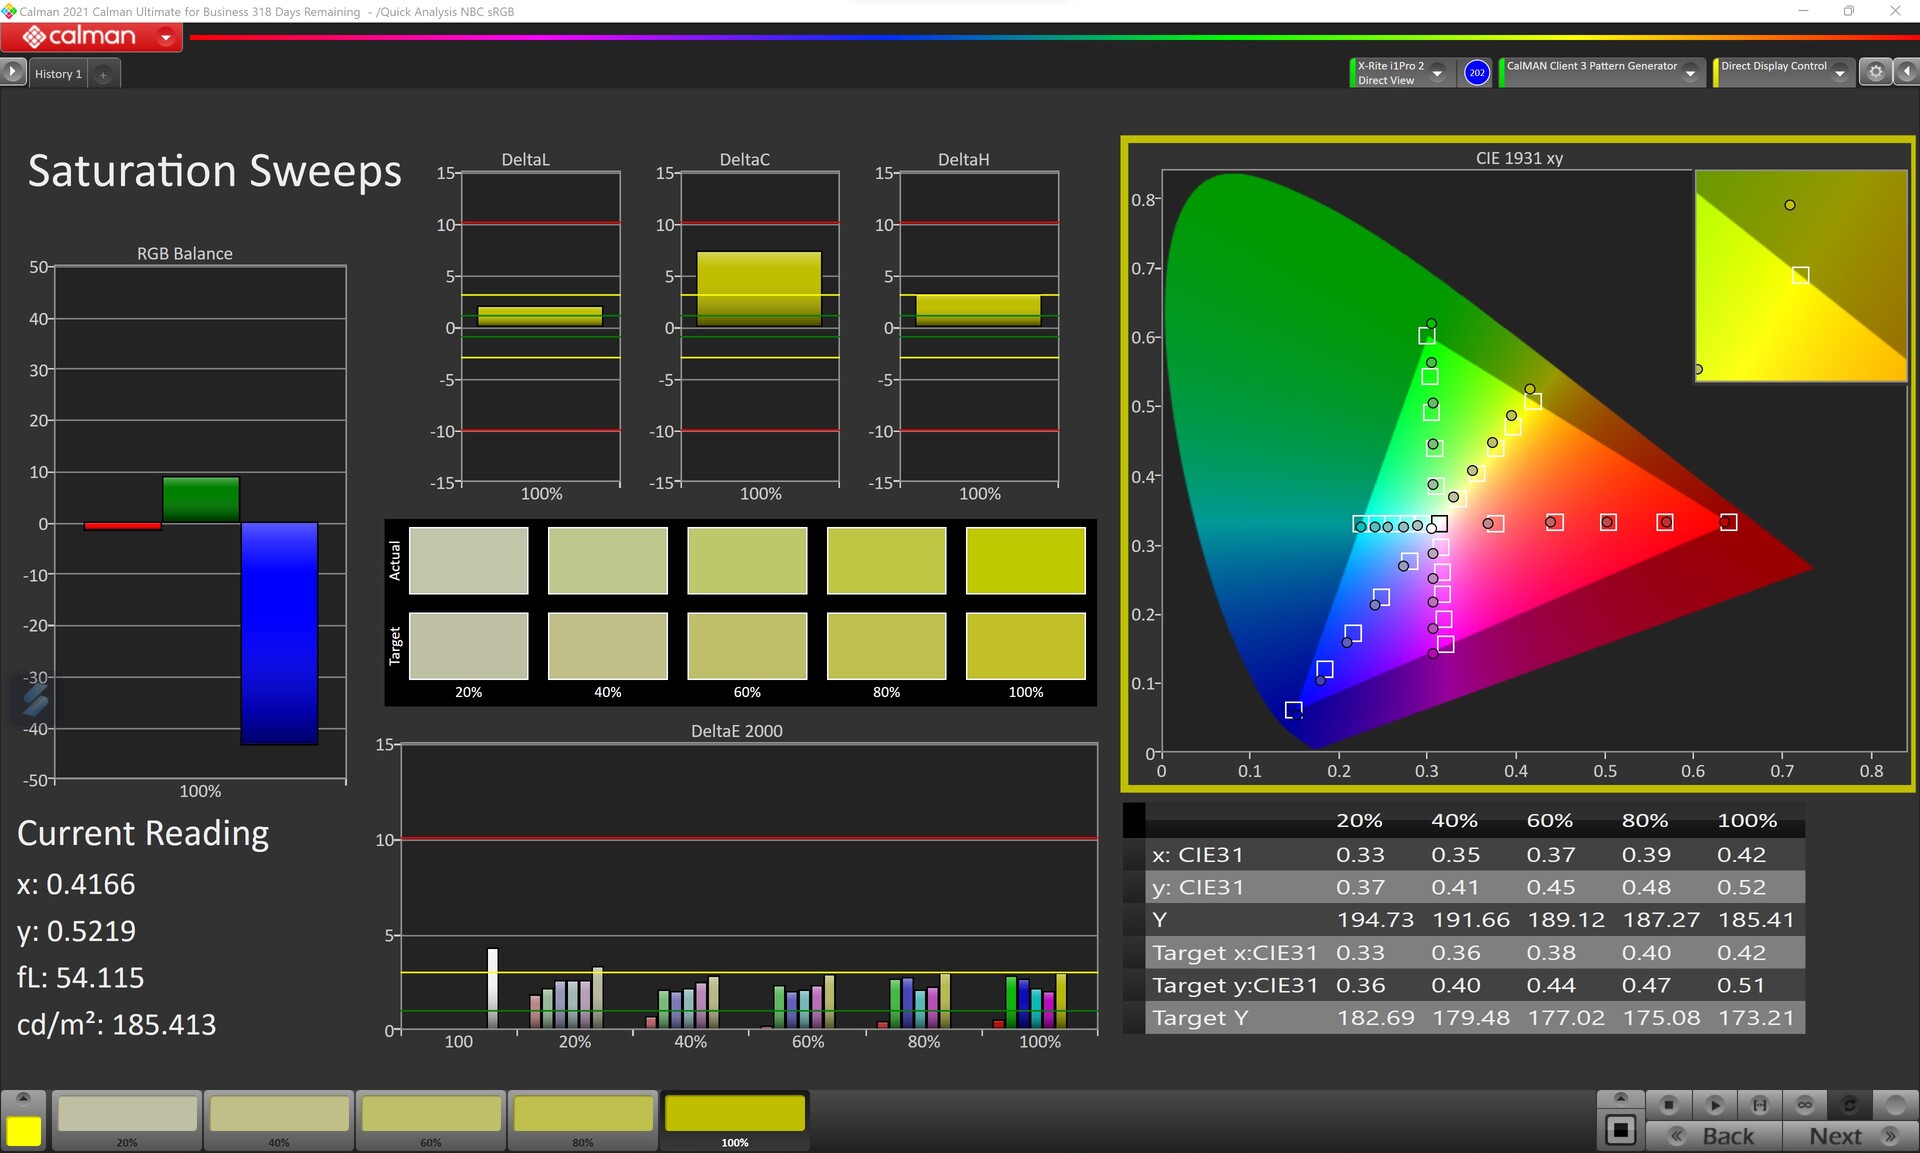
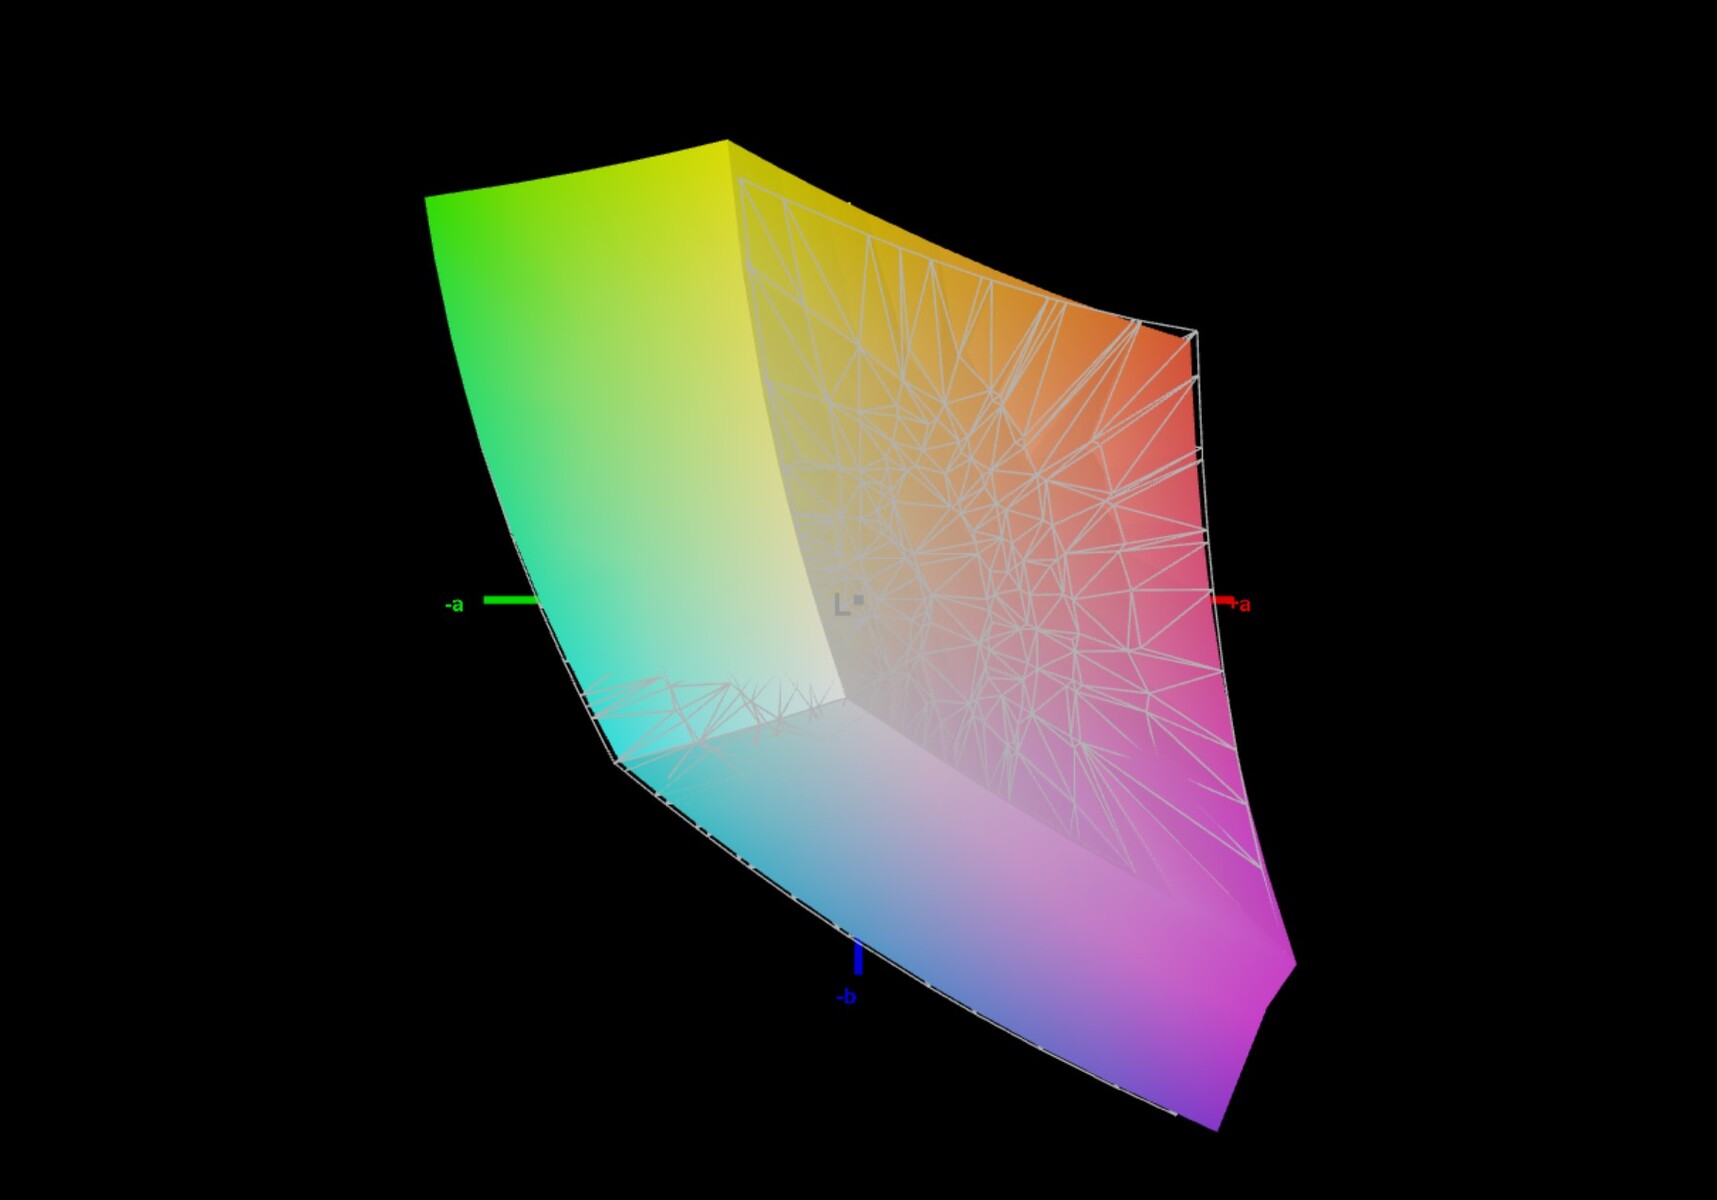
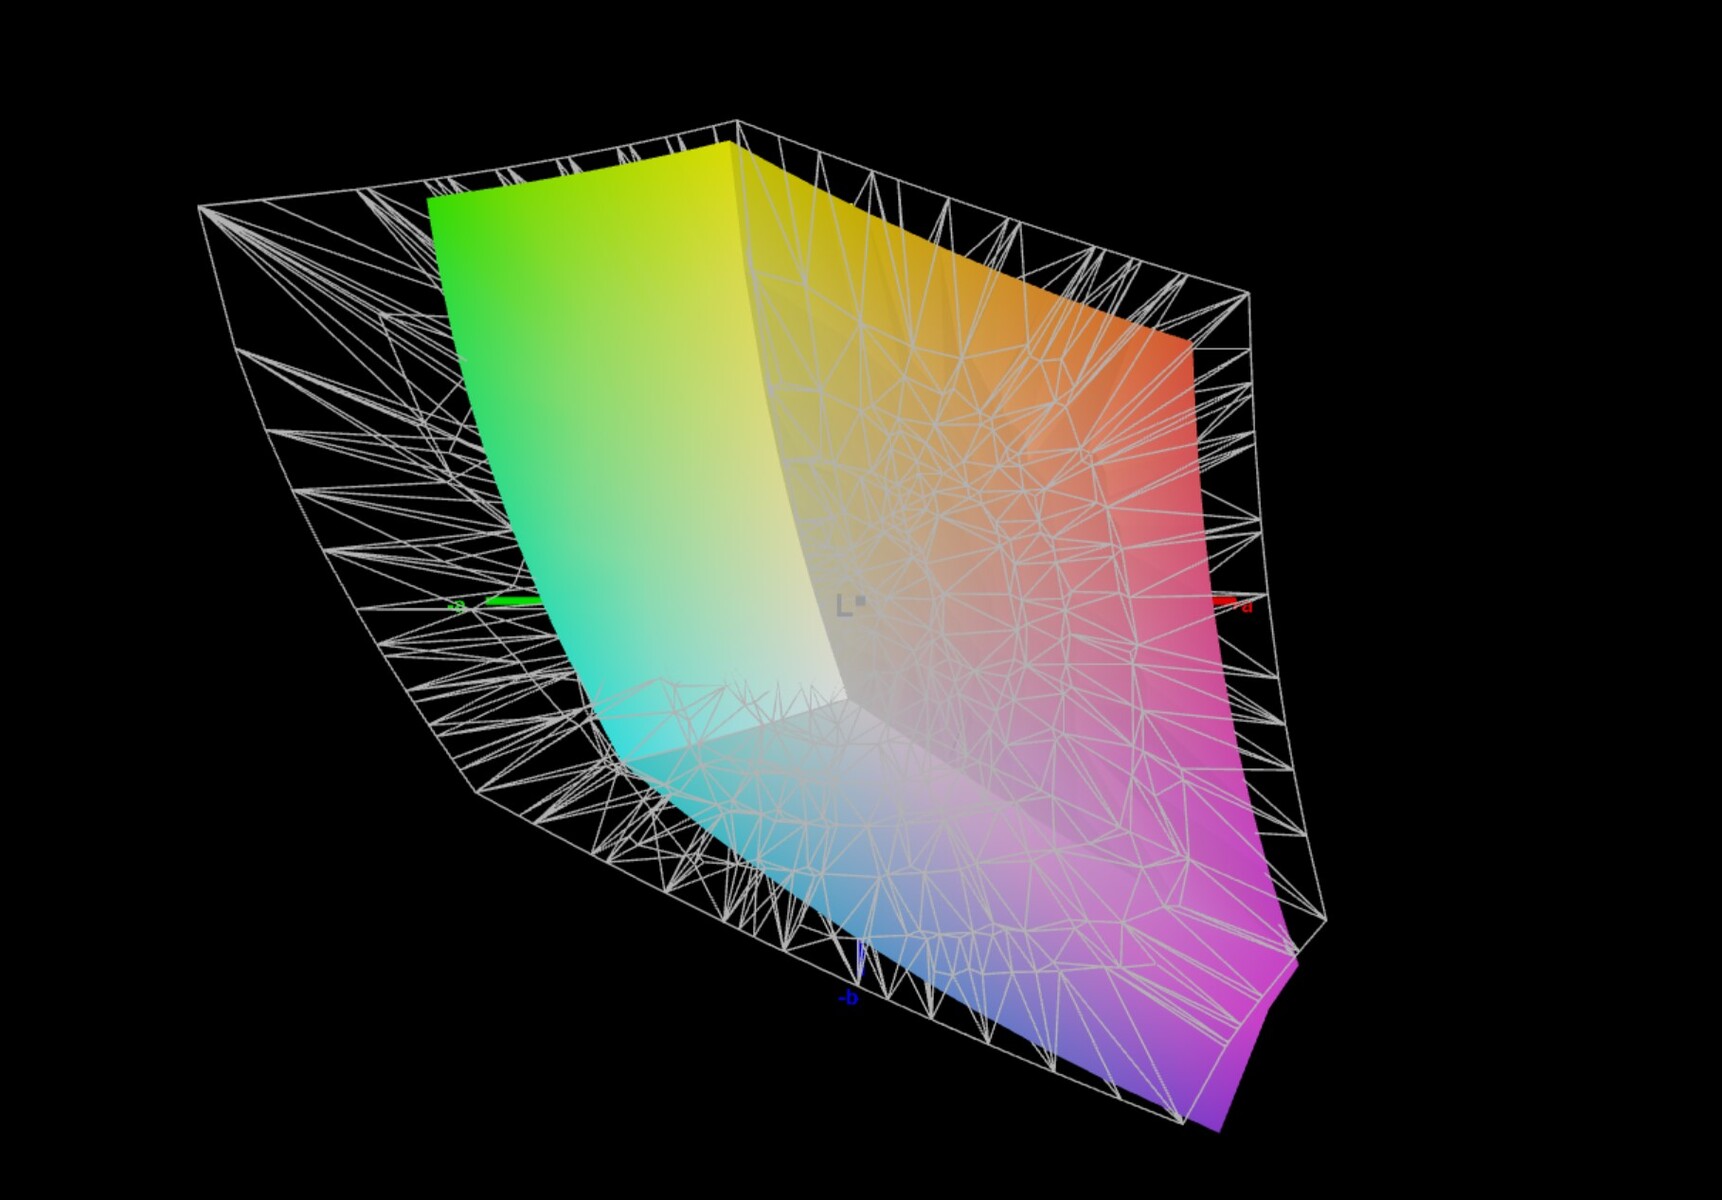
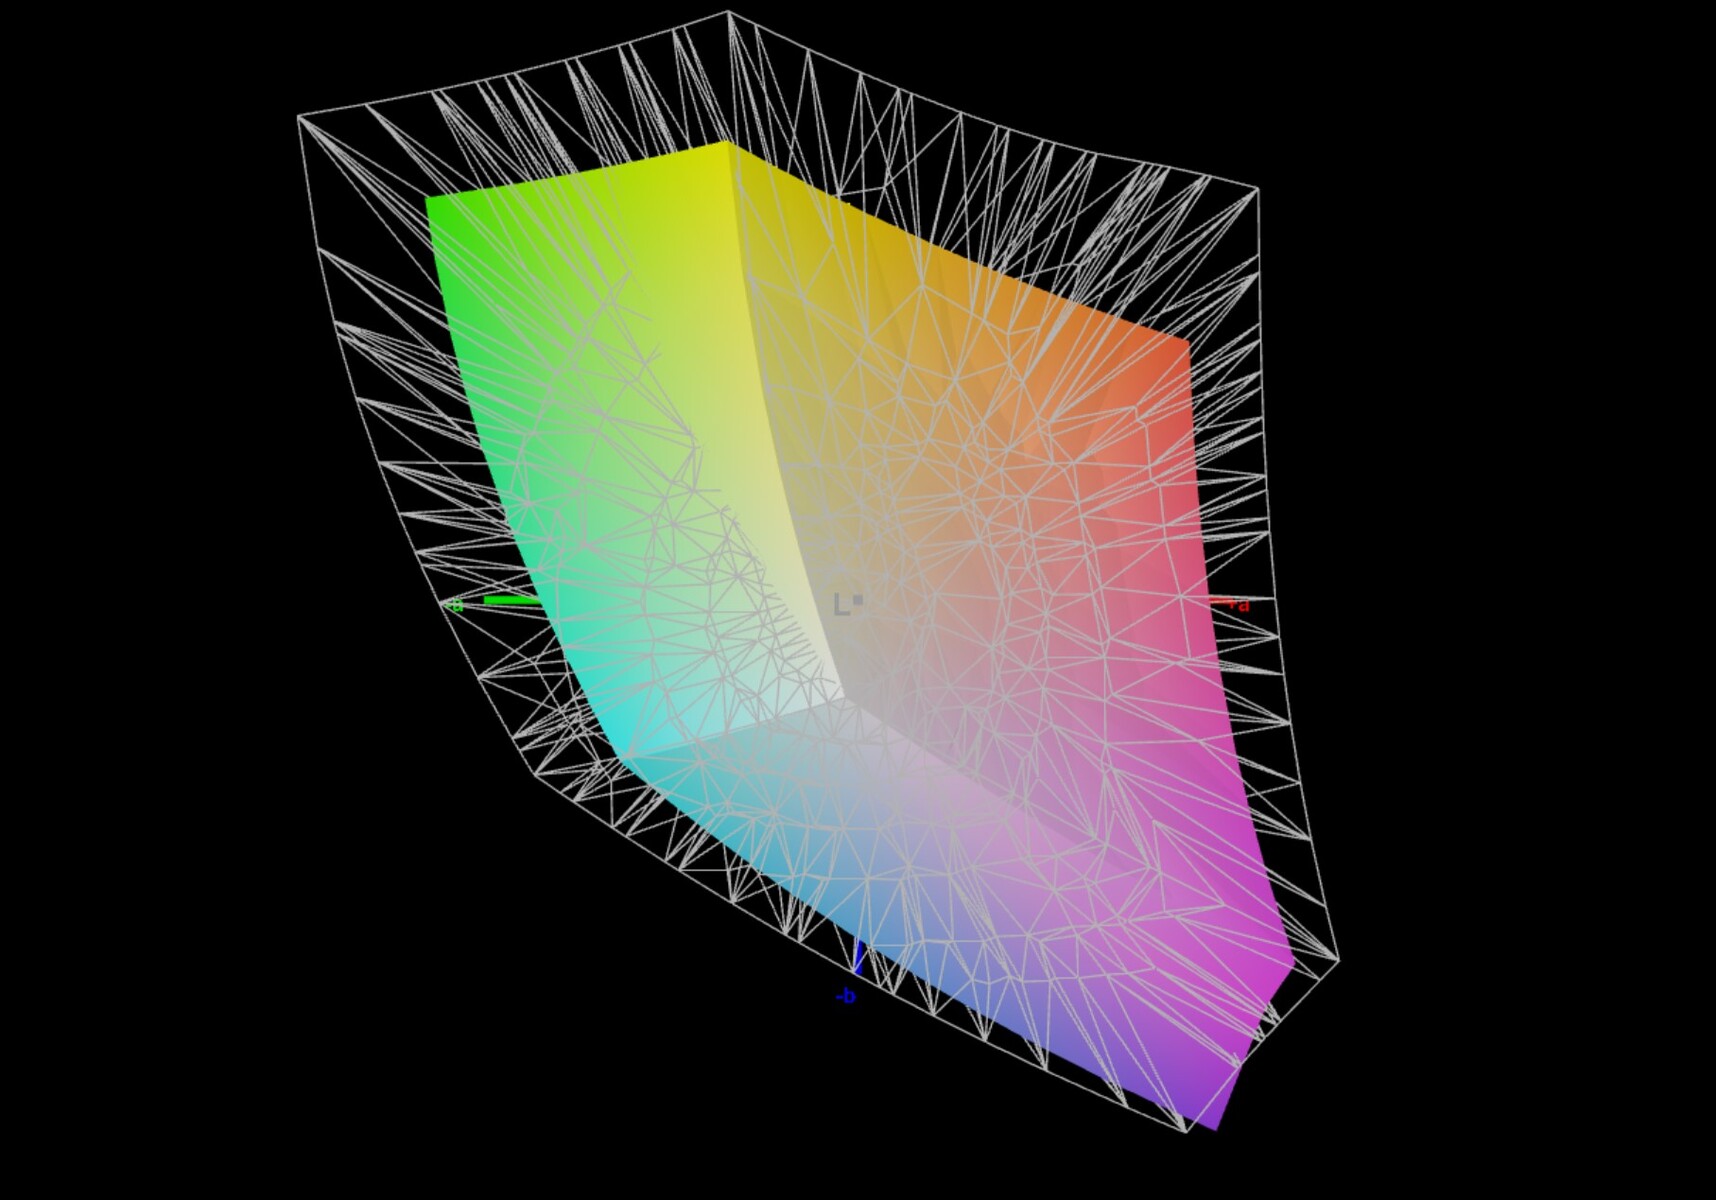
70.1% AdobeRGB 1998 (Argyll 3D)
98.2% sRGB (Argyll 3D)
68.7% Display P3 (Argyll 3D)
Gamma: 2.28
CCT: 6909 K
| Corsair Voyager a1600 BOE0A3B, IPS, 2560x1600, 16" | Asus ROG Flow X16 GV601RW-M5082W AUO B160QAN02.S, Mini LED, 2560x1600, 16.1" | Lenovo Legion 7 16ARHA7 BOE CQ NE160QDM-NY1, IPS, 2560x1600, 16" | Acer Predator Triton 500 SE PT516-52s-70KX NE160QDM-NZ2, IPS LED, 2560x1600, 16" | HP Omen 16-b1090ng BOE09E5, IPS, 2560x1440, 16.1" | Lenovo Legion 7 16IAX7-82TD004SGE NE160QDM-NY1, IPS, 2560x1600, 16" | |
|---|---|---|---|---|---|---|
| Display | 25% | -5% | 22% | 3% | 1% | |
| Display P3 Coverage (%) | 68.7 | 99.82 45% | 63.7 -7% | 97.3 42% | 71 3% | 69.3 1% |
| sRGB Coverage (%) | 98.2 | 99.99 2% | 95.3 -3% | 100 2% | 97.9 0% | 98.2 0% |
| AdobeRGB 1998 Coverage (%) | 70.1 | 90.21 29% | 65.7 -6% | 84.9 21% | 73.3 5% | 70.8 1% |
| Response Times | 3% | 17% | 15% | -3% | 24% | |
| Response Time Grey 50% / Grey 80% * (ms) | 13 ? | 11 ? 15% | 9.2 ? 29% | 13.8 ? -6% | 14.5 ? -12% | 12.6 ? 3% |
| Response Time Black / White * (ms) | 10 ? | 11 ? -10% | 9.6 ? 4% | 6.4 ? 36% | 9.4 ? 6% | 5.6 ? 44% |
| PWM Frequency (Hz) | 7400 ? | |||||
| Screen | 71% | 12% | 29% | -30% | 18% | |
| Brightness middle (cd/m²) | 355 | 498 40% | 478.8 35% | 498 40% | 335 -6% | 547 54% |
| Brightness (cd/m²) | 340 | 502 48% | 477 40% | 468 38% | 319 -6% | 523 54% |
| Brightness Distribution (%) | 91 | 94 3% | 90 -1% | 80 -12% | 90 -1% | 88 -3% |
| Black Level * (cd/m²) | 0.53 | 0.11 79% | 0.43 19% | 0.36 32% | 0.28 47% | 0.44 17% |
| Contrast (:1) | 670 | 4527 576% | 1113 66% | 1383 106% | 1196 79% | 1243 86% |
| Colorchecker dE 2000 * | 2.43 | 1.87 23% | 2.24 8% | 1.77 27% | 4.38 -80% | 2.1 14% |
| Colorchecker dE 2000 max. * | 4.31 | 6.15 -43% | 4.49 -4% | 5.24 -22% | 9.48 -120% | 7 -62% |
| Colorchecker dE 2000 calibrated * | 1.14 | 1.94 -70% | 1.89 -66% | 0.63 45% | 1.33 -17% | 0.9 21% |
| Greyscale dE 2000 * | 2.62 | 3.15 -20% | 2.3 12% | 2.4 8% | 7 -167% | 3.2 -22% |
| Gamma | 2.28 96% | 330.95 1% | 2.25 98% | 2.14 103% | 2.103 105% | 2.23 99% |
| CCT | 6909 94% | 7294 89% | 6955 93% | 7046 92% | 6244 104% | 6979 93% |
| Media total (Programa/Opciones) | 33% /
51% | 8% /
9% | 22% /
26% | -10% /
-19% | 14% /
15% |
* ... más pequeño es mejor
La calidad de la pantalla es buena, y la cobertura del espacio de color también es impresionante. Sin embargo, la competencia también suele ofrecer mejores valores en esta comparación. Nuestro modelo de pruebas sólo puede vencer al Legion 7 de Lenovo en esta disciplina. Debido a los buenos valores Delta E-2000 de la escala de grises y los colores comparados con el espacio de color sRGB, suponemos que Corsair envía el dispositivo con un display calibrado. Un calibrado manual vuelve a mejorar ligeramente los valores Delta E-2000. No obstante, el brillo máximo del display sufre. Recomendamos dejar el display en su estado de entrega. La cobertura del espacio de color es suficiente para la edición semiprofesional de fotos y vídeos.
Tiempos de respuesta del display
| ↔ Tiempo de respuesta de Negro a Blanco | ||
|---|---|---|
| 10 ms ... subida ↗ y bajada ↘ combinada | ↗ 5 ms subida | 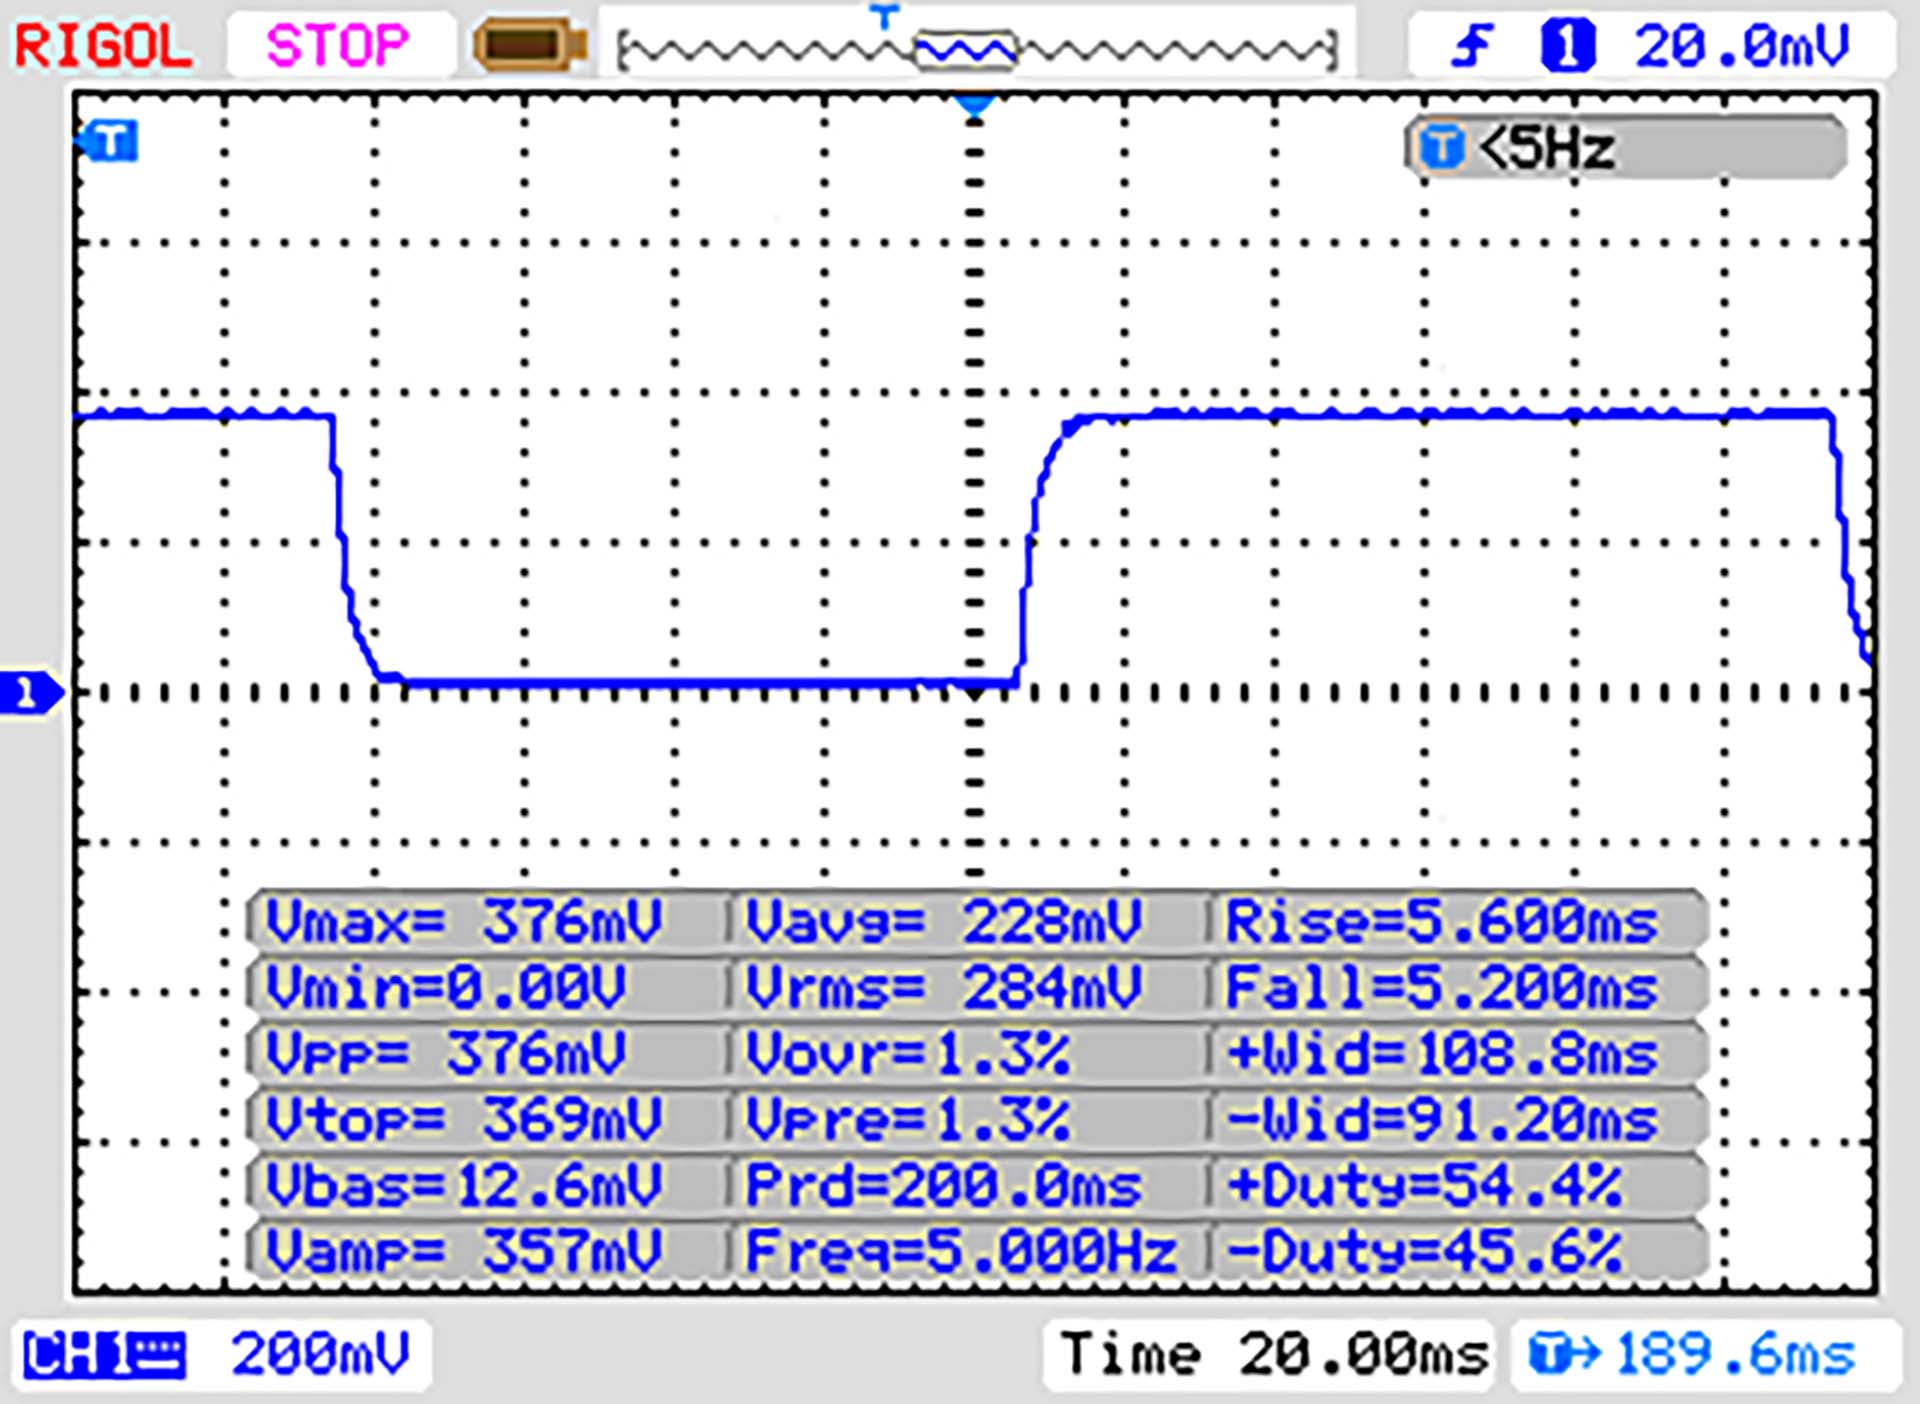 |
| ↘ 5 ms bajada | ||
| La pantalla mostró buenos tiempos de respuesta en nuestros tests pero podría ser demasiado lenta para los jugones competitivos. En comparación, todos los dispositivos de prueba van de ##min### (mínimo) a 240 (máximo) ms. » 27 % de todos los dispositivos son mejores. Esto quiere decir que el tiempo de respuesta medido es mejor que la media (19.8 ms) de todos los dispositivos testados. | ||
| ↔ Tiempo de respuesta 50% Gris a 80% Gris | ||
| 13 ms ... subida ↗ y bajada ↘ combinada | ↗ 7 ms subida | 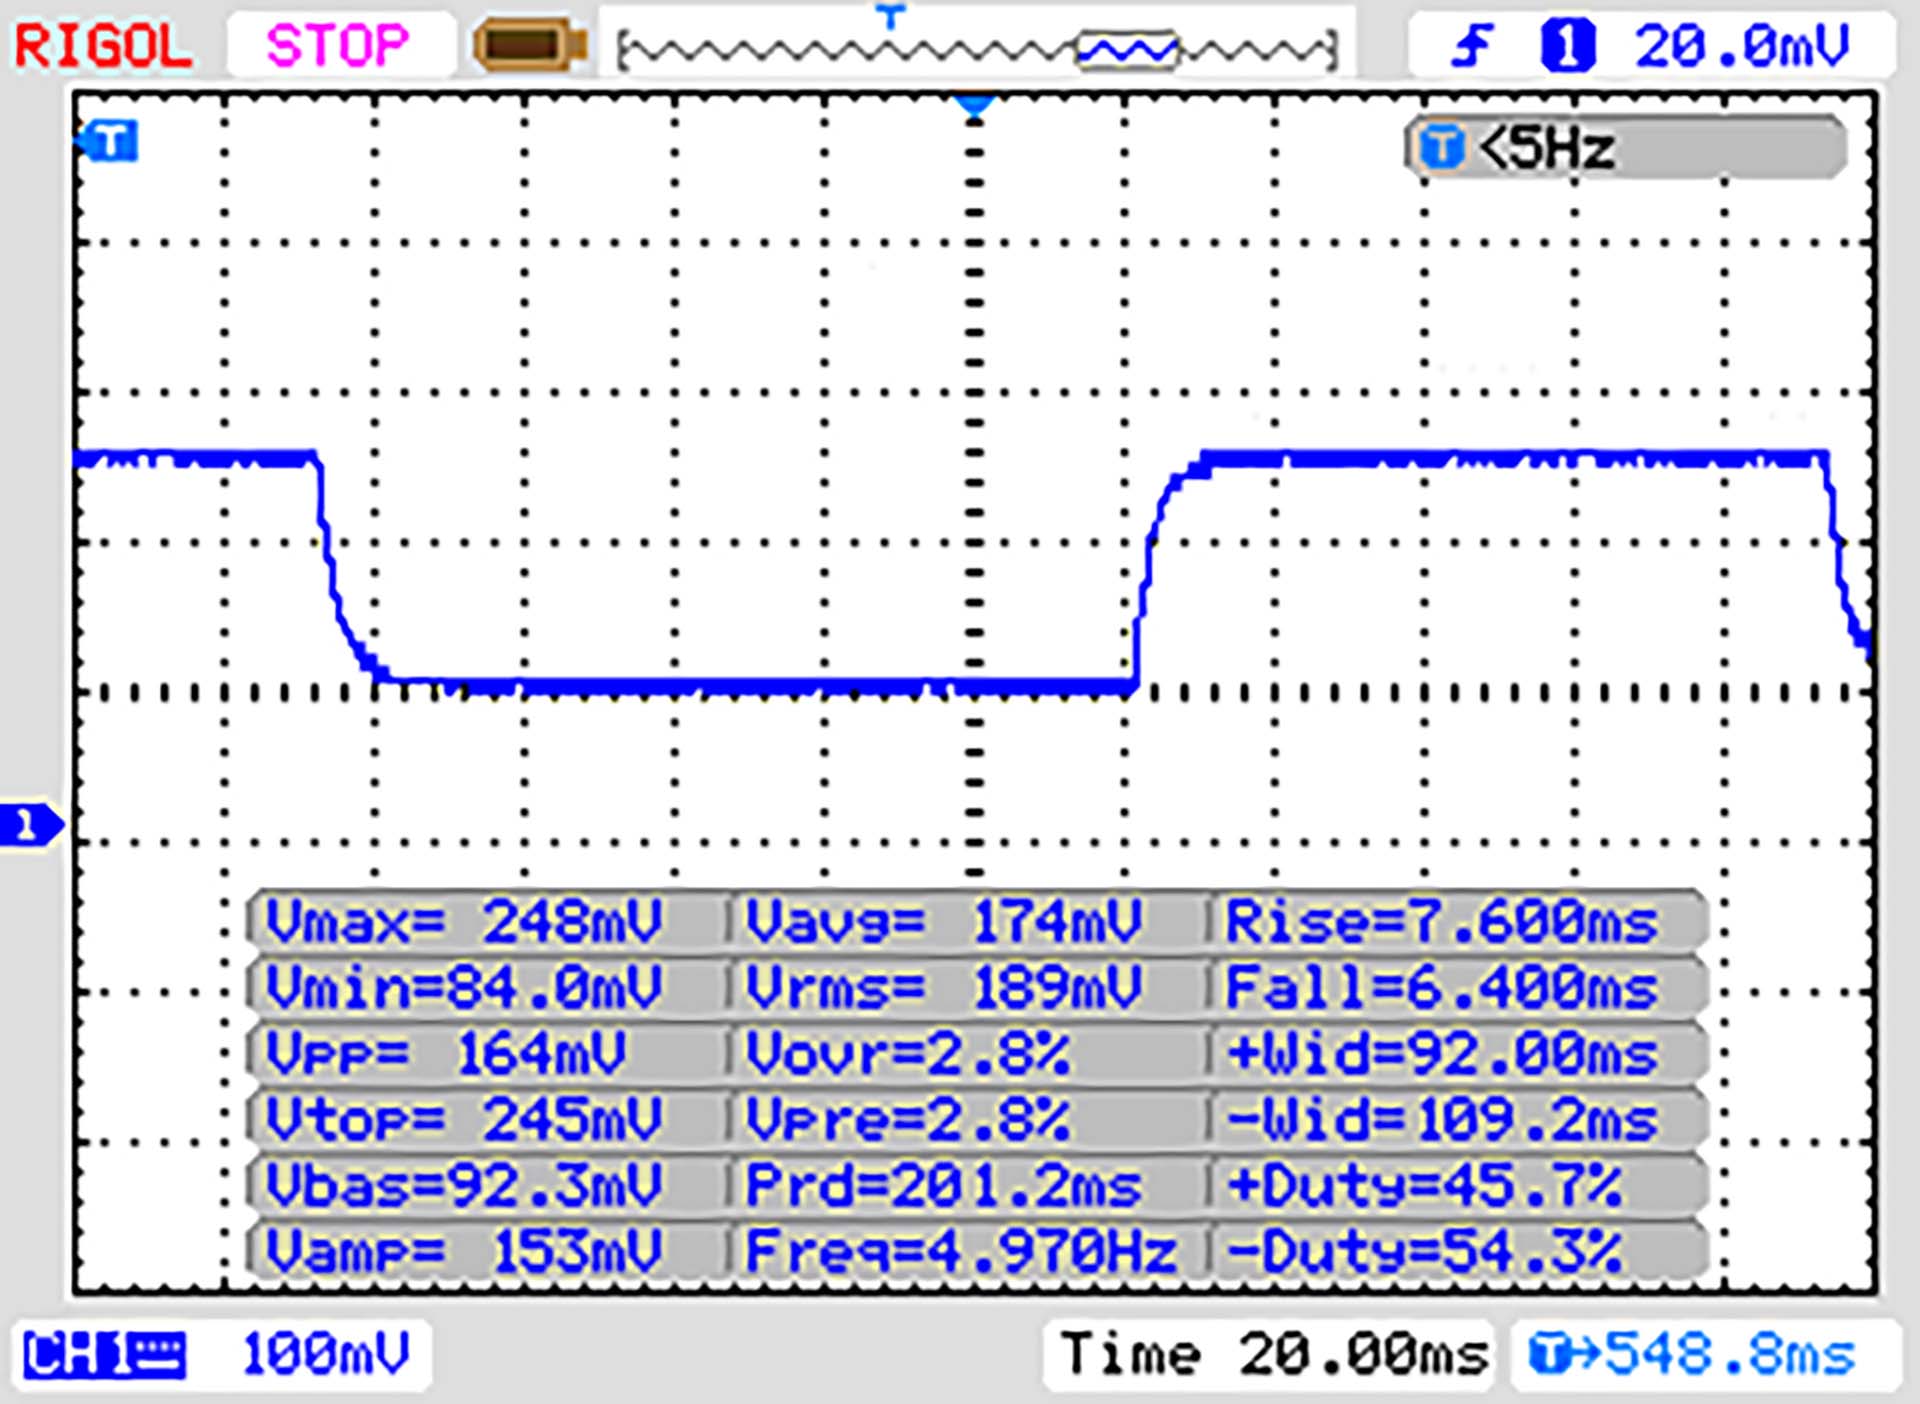 |
| ↘ 6 ms bajada | ||
| La pantalla mostró buenos tiempos de respuesta en nuestros tests pero podría ser demasiado lenta para los jugones competitivos. En comparación, todos los dispositivos de prueba van de ##min### (mínimo) a 636 (máximo) ms. » 27 % de todos los dispositivos son mejores. Esto quiere decir que el tiempo de respuesta medido es mejor que la media (31 ms) de todos los dispositivos testados. | ||
Parpadeo de Pantalla / PWM (Pulse-Width Modulation)
| Parpadeo de Pantalla / PWM no detectado |  | ||
Comparación: 52 % de todos los dispositivos testados no usaron PWM para atenuar el display. Si se usó, medimos una media de 7757 (mínimo: 5 - máxmo: 343500) Hz. | |||
En principio, la superficie mate de la pantalla es adecuada para su uso en exteriores. Sin embargo, el brillo comparativamente bajo de la pantalla habla en su contra.
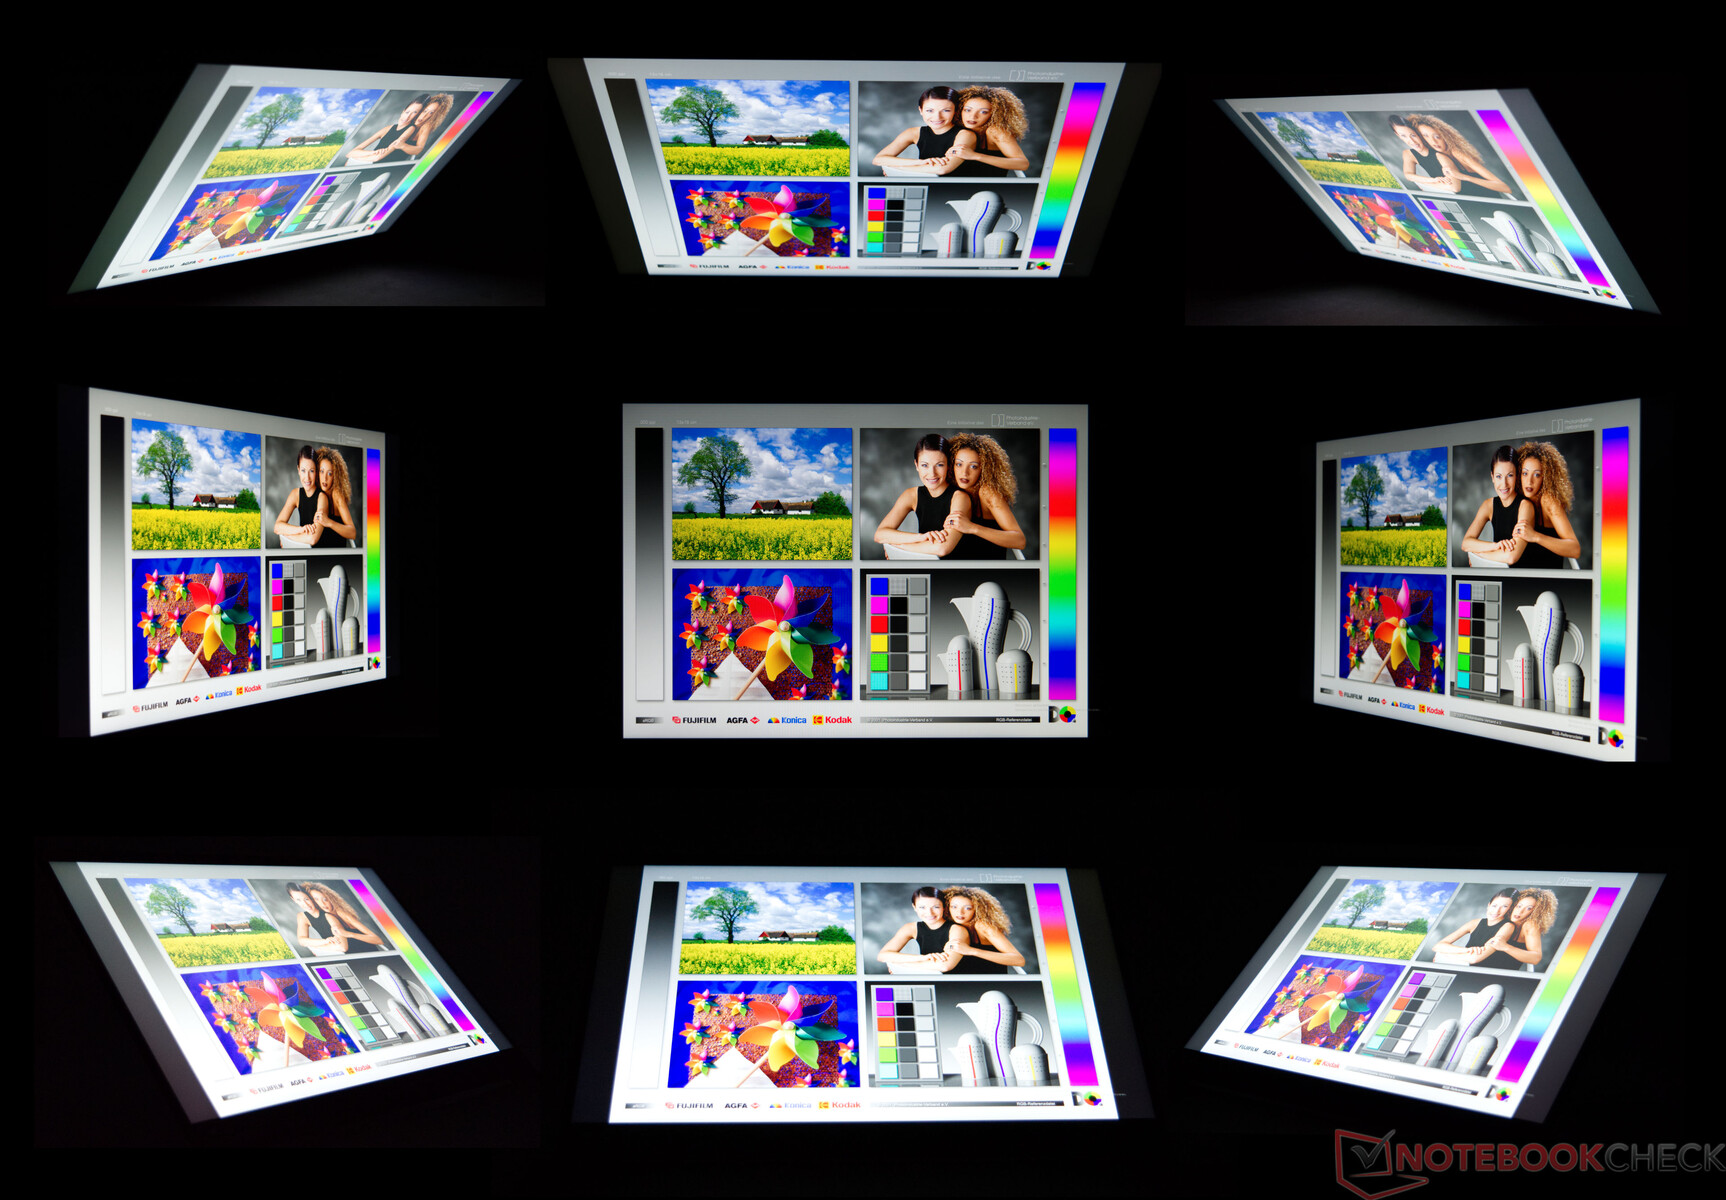
La prueba de ángulo de visión muestra el resultado de un panel IPS típico. Se aprecian ligeros cambios de color en las imágenes de las cuatro esquinas, que no conllevan restricciones en el uso normal.
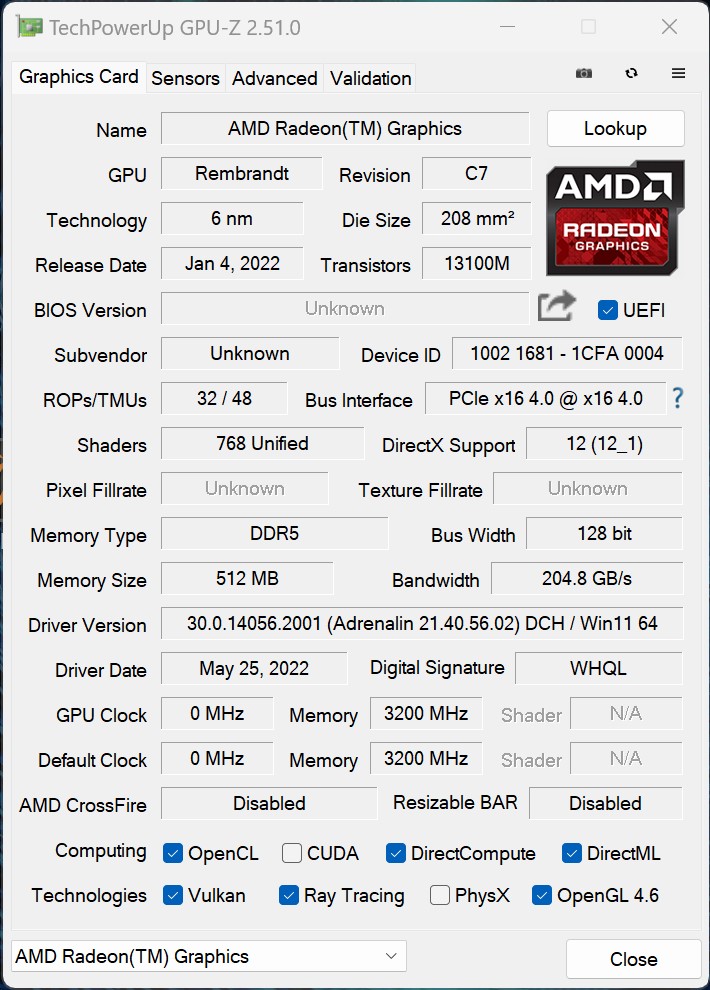
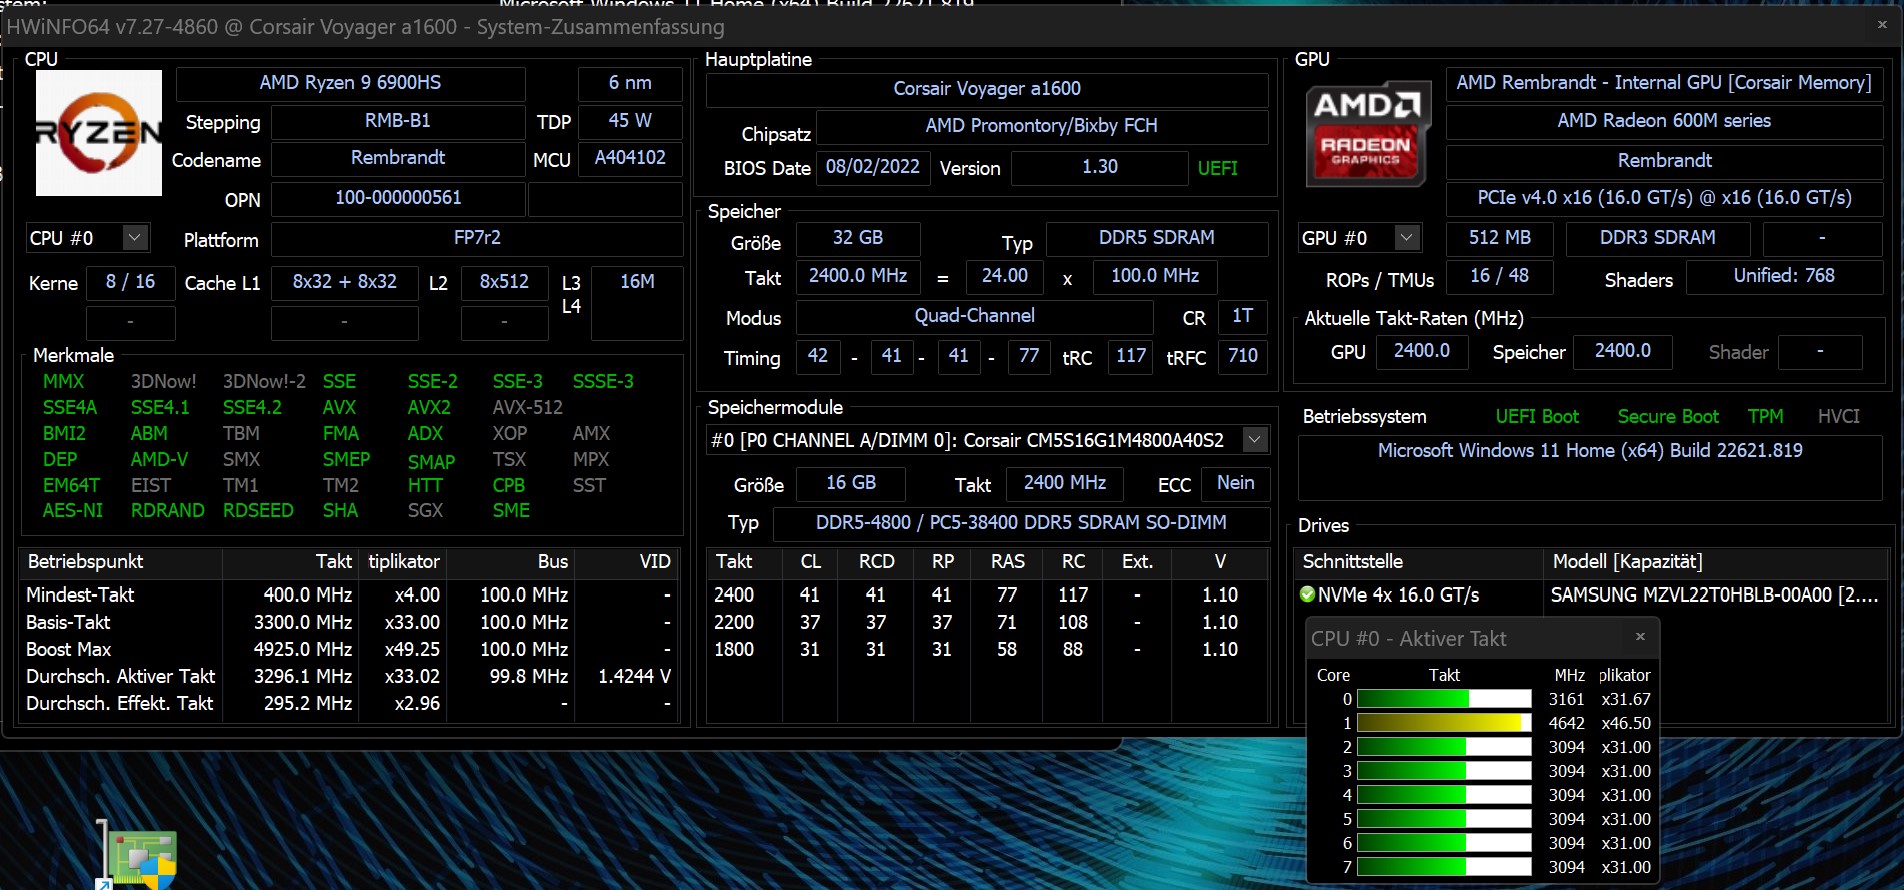
Rendimiento - Base Rembrandt con mucha RAM y espacio de almacenamiento
El Corsair Voyager a1600 con la combinación deAMD Ryzen 9 6900HSy la AMD Radeon RX 6800Mofrece una base muy buena para jugar a juegos actuales con el máximo detalle en un portátil. En conexión con la memoria de trabajo de 32 GB y un SSD de 2 TB, el usuario también obtiene un rendimiento decente aquí.
Condiciones de la prueba
Corsair ofrece la posibilidad de usar el dispositivo en tres modos diferentes, que pueden conmutarse a través del software iCUE. Las opciones son Quiet
, Balanced
y Extreme.
Las diferencias radican en el rendimiento máximo disponible para la CPU y la GPU, incluso en combinación con la tecnología Smart Shift. Todas las pruebas de rendimiento se realizaron con el perfil Extreme
.
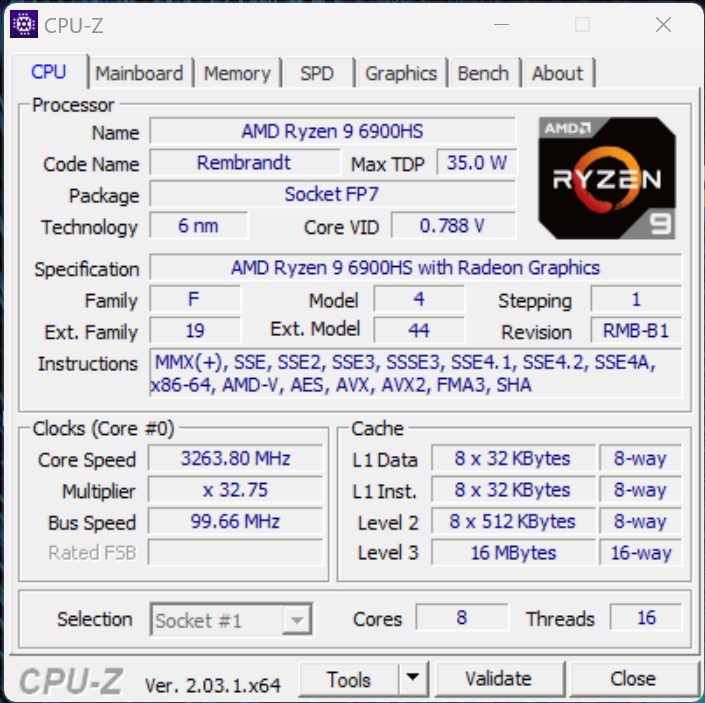
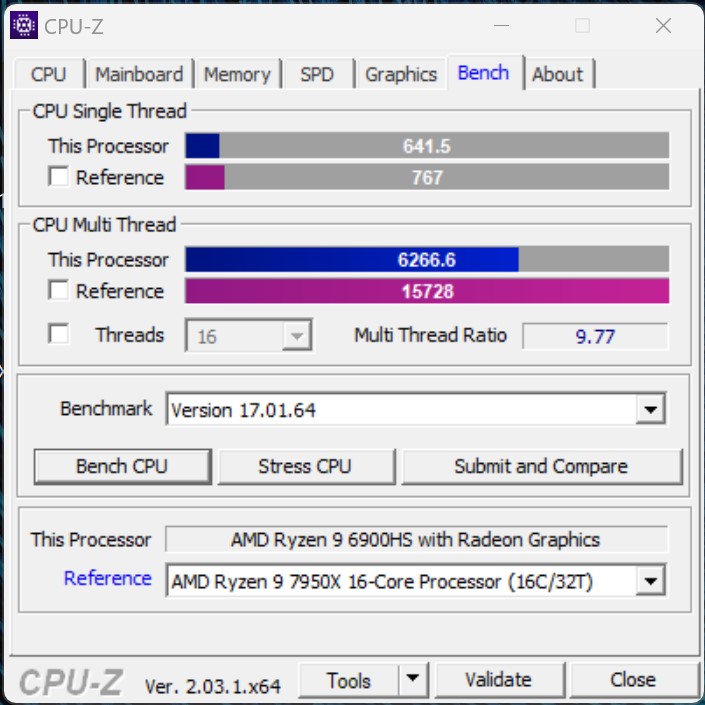
Procesador
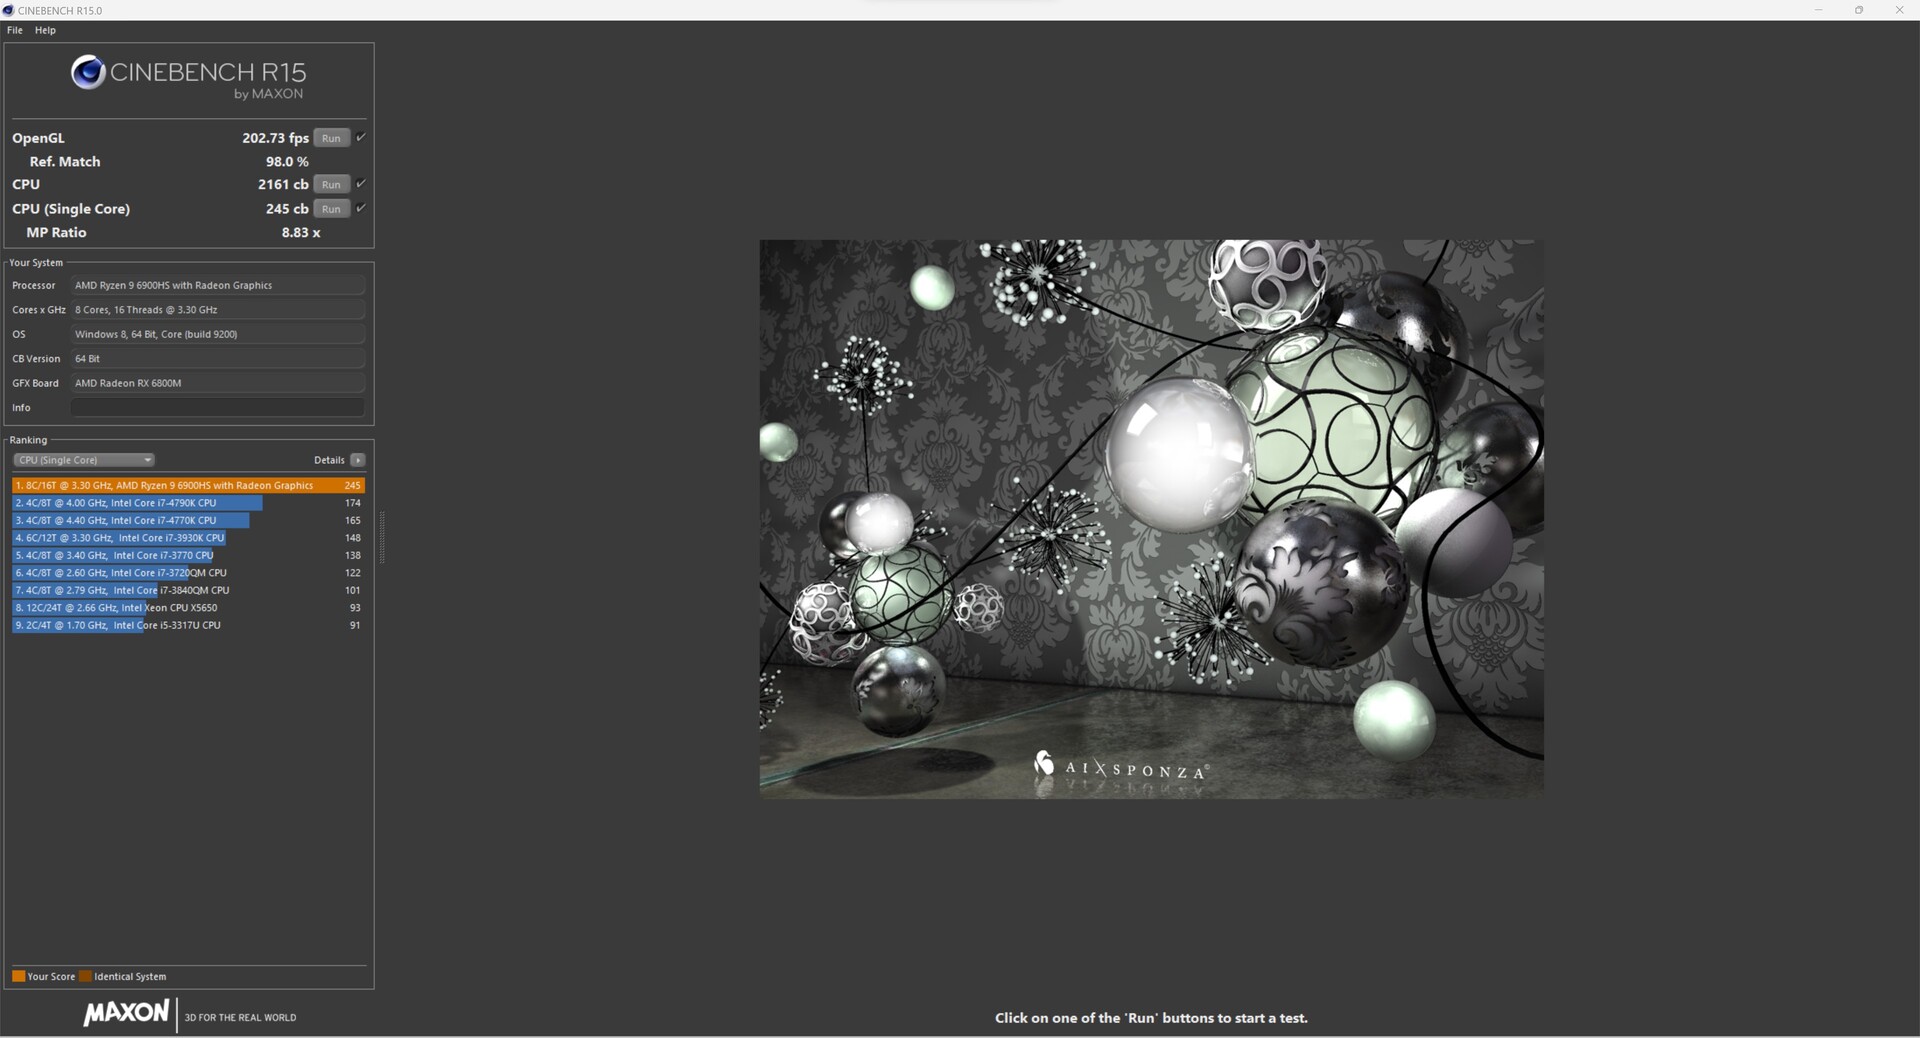
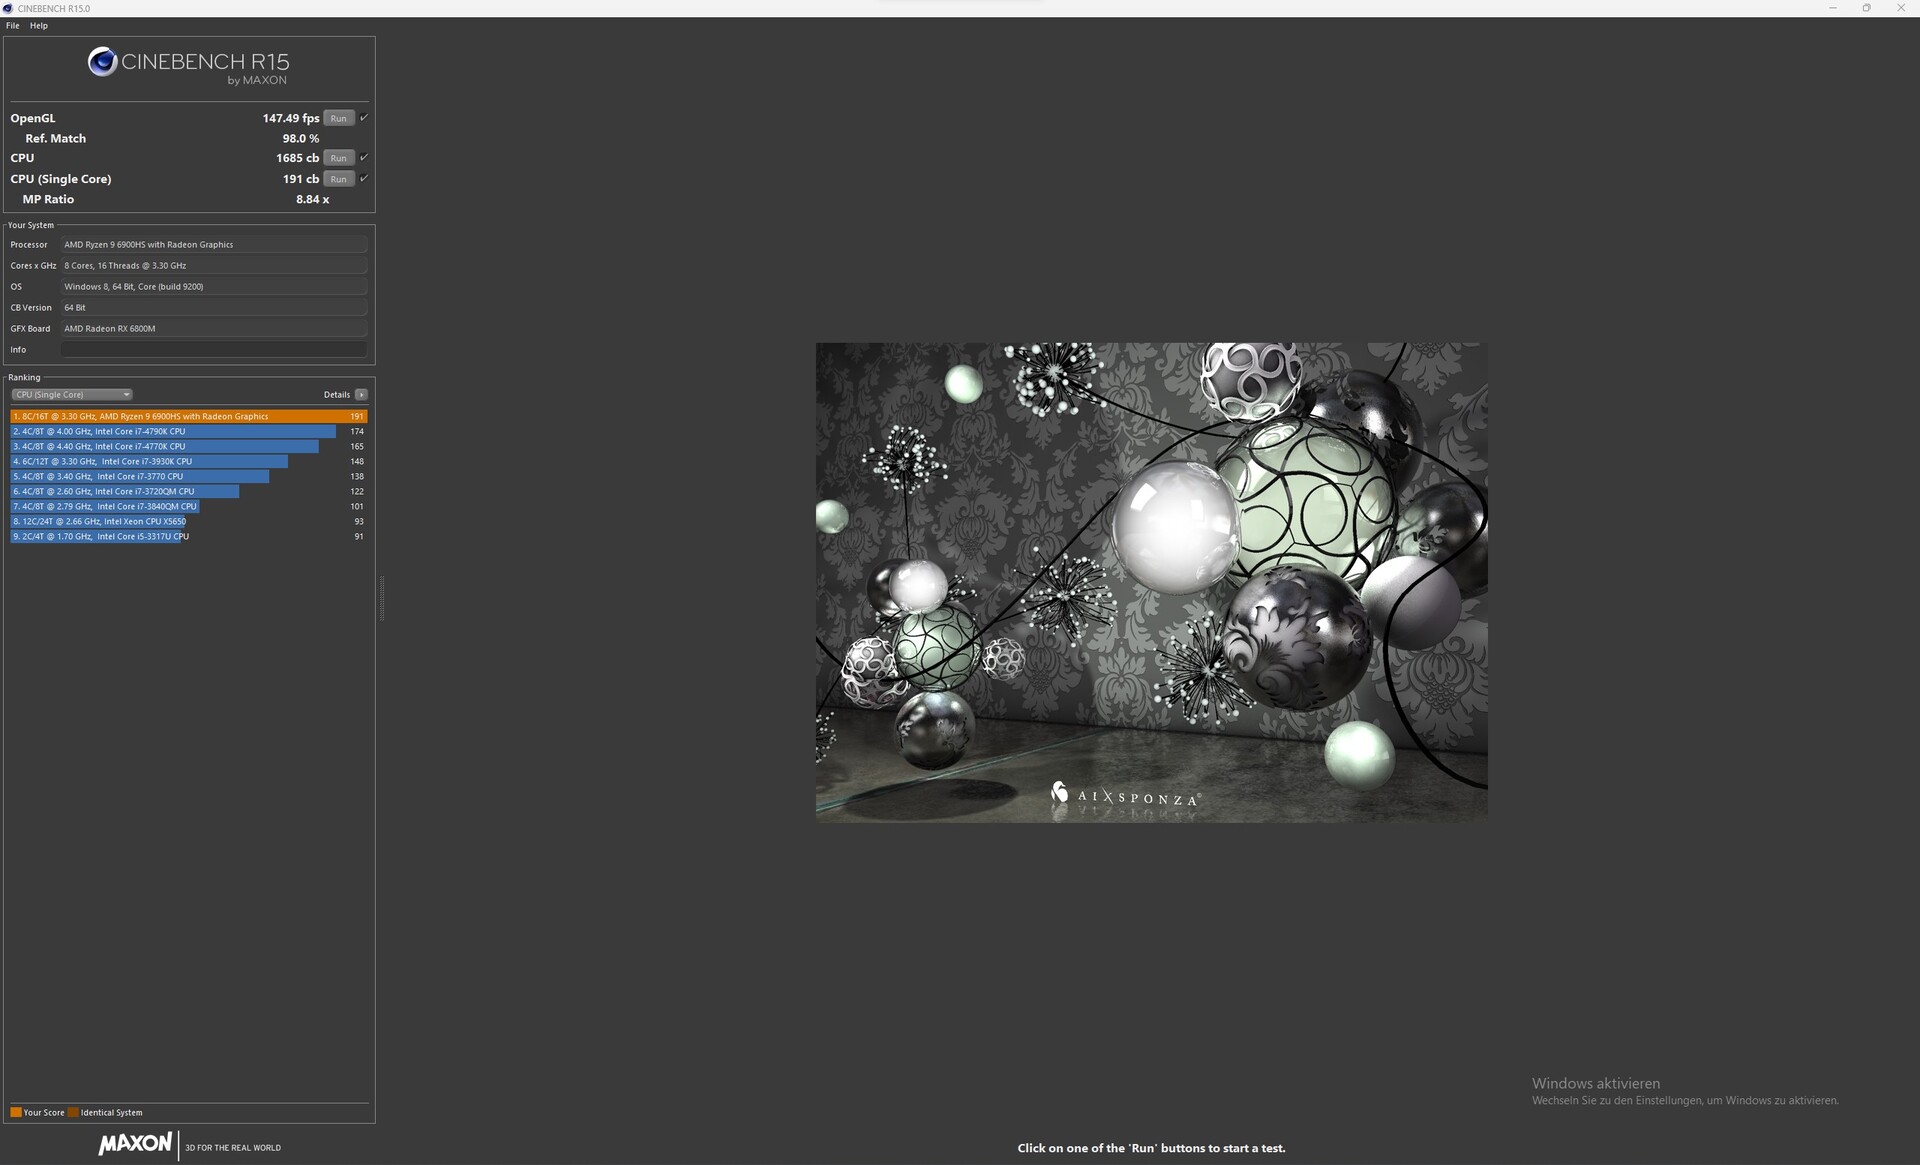
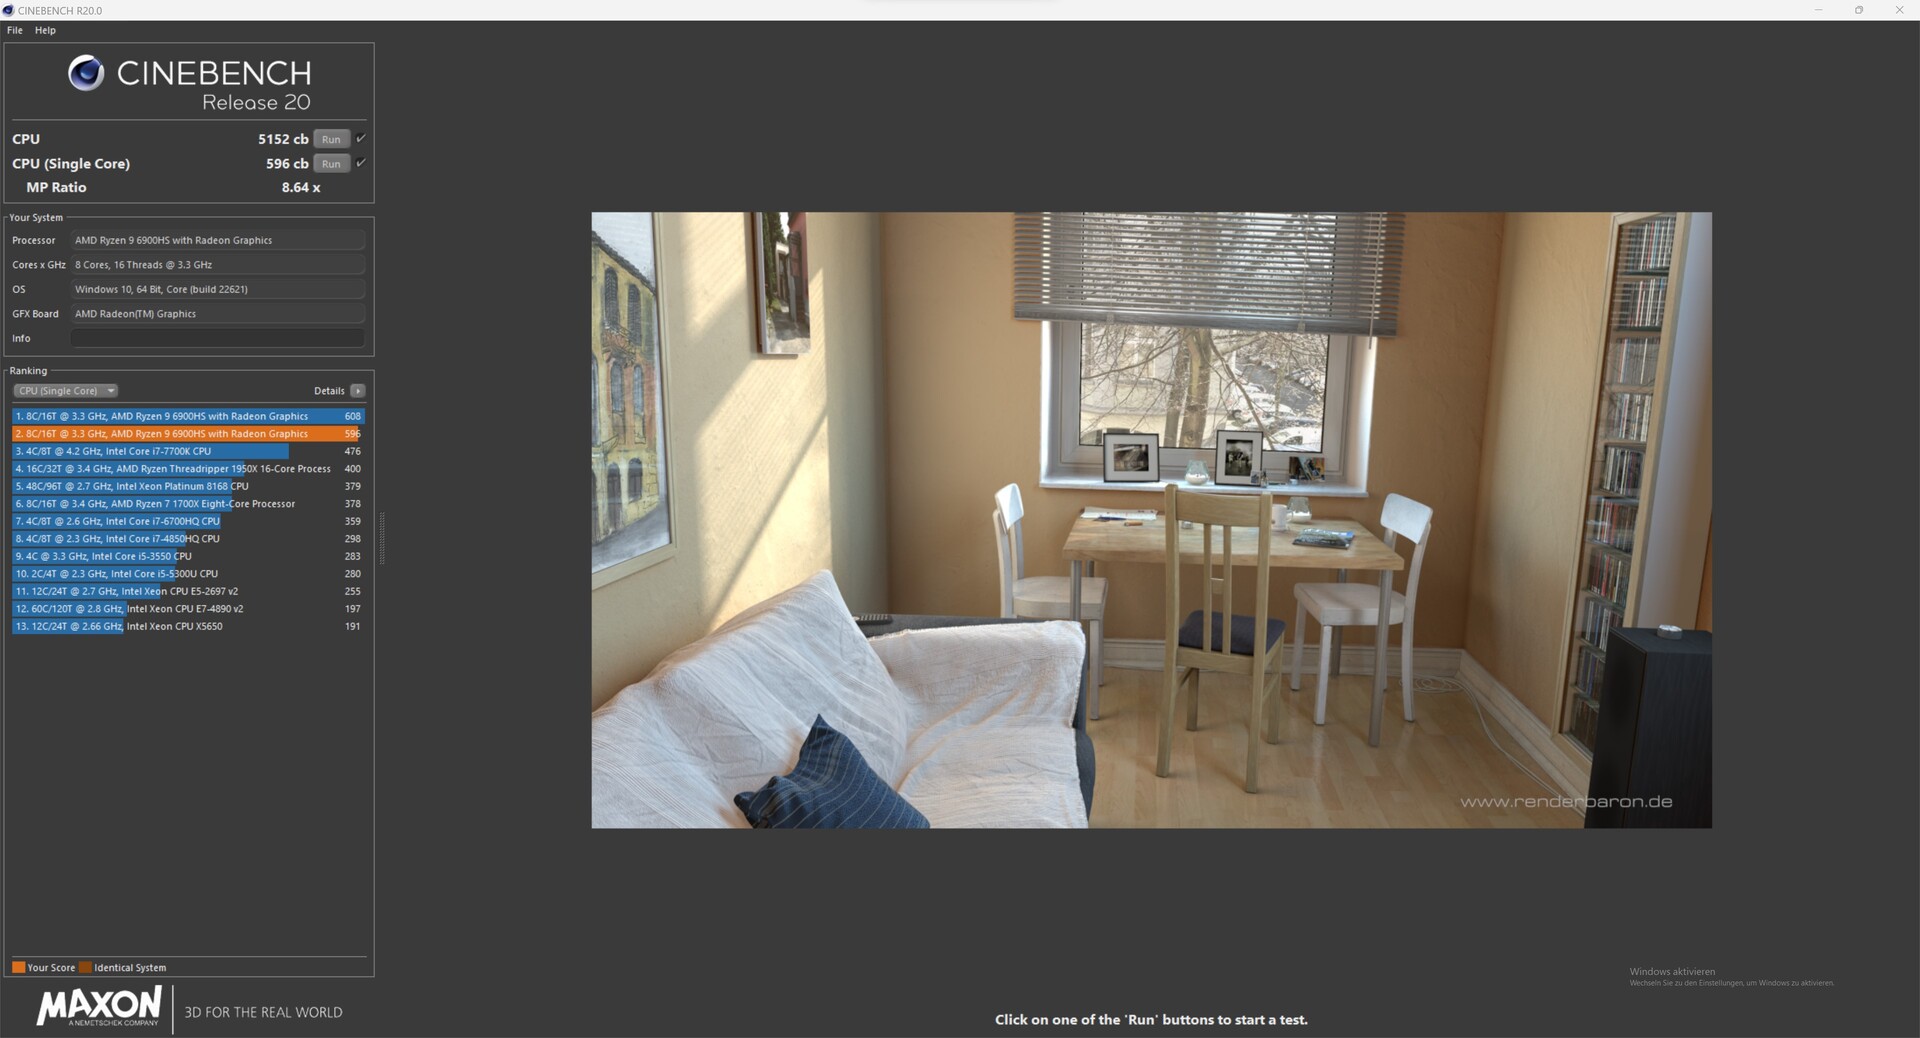
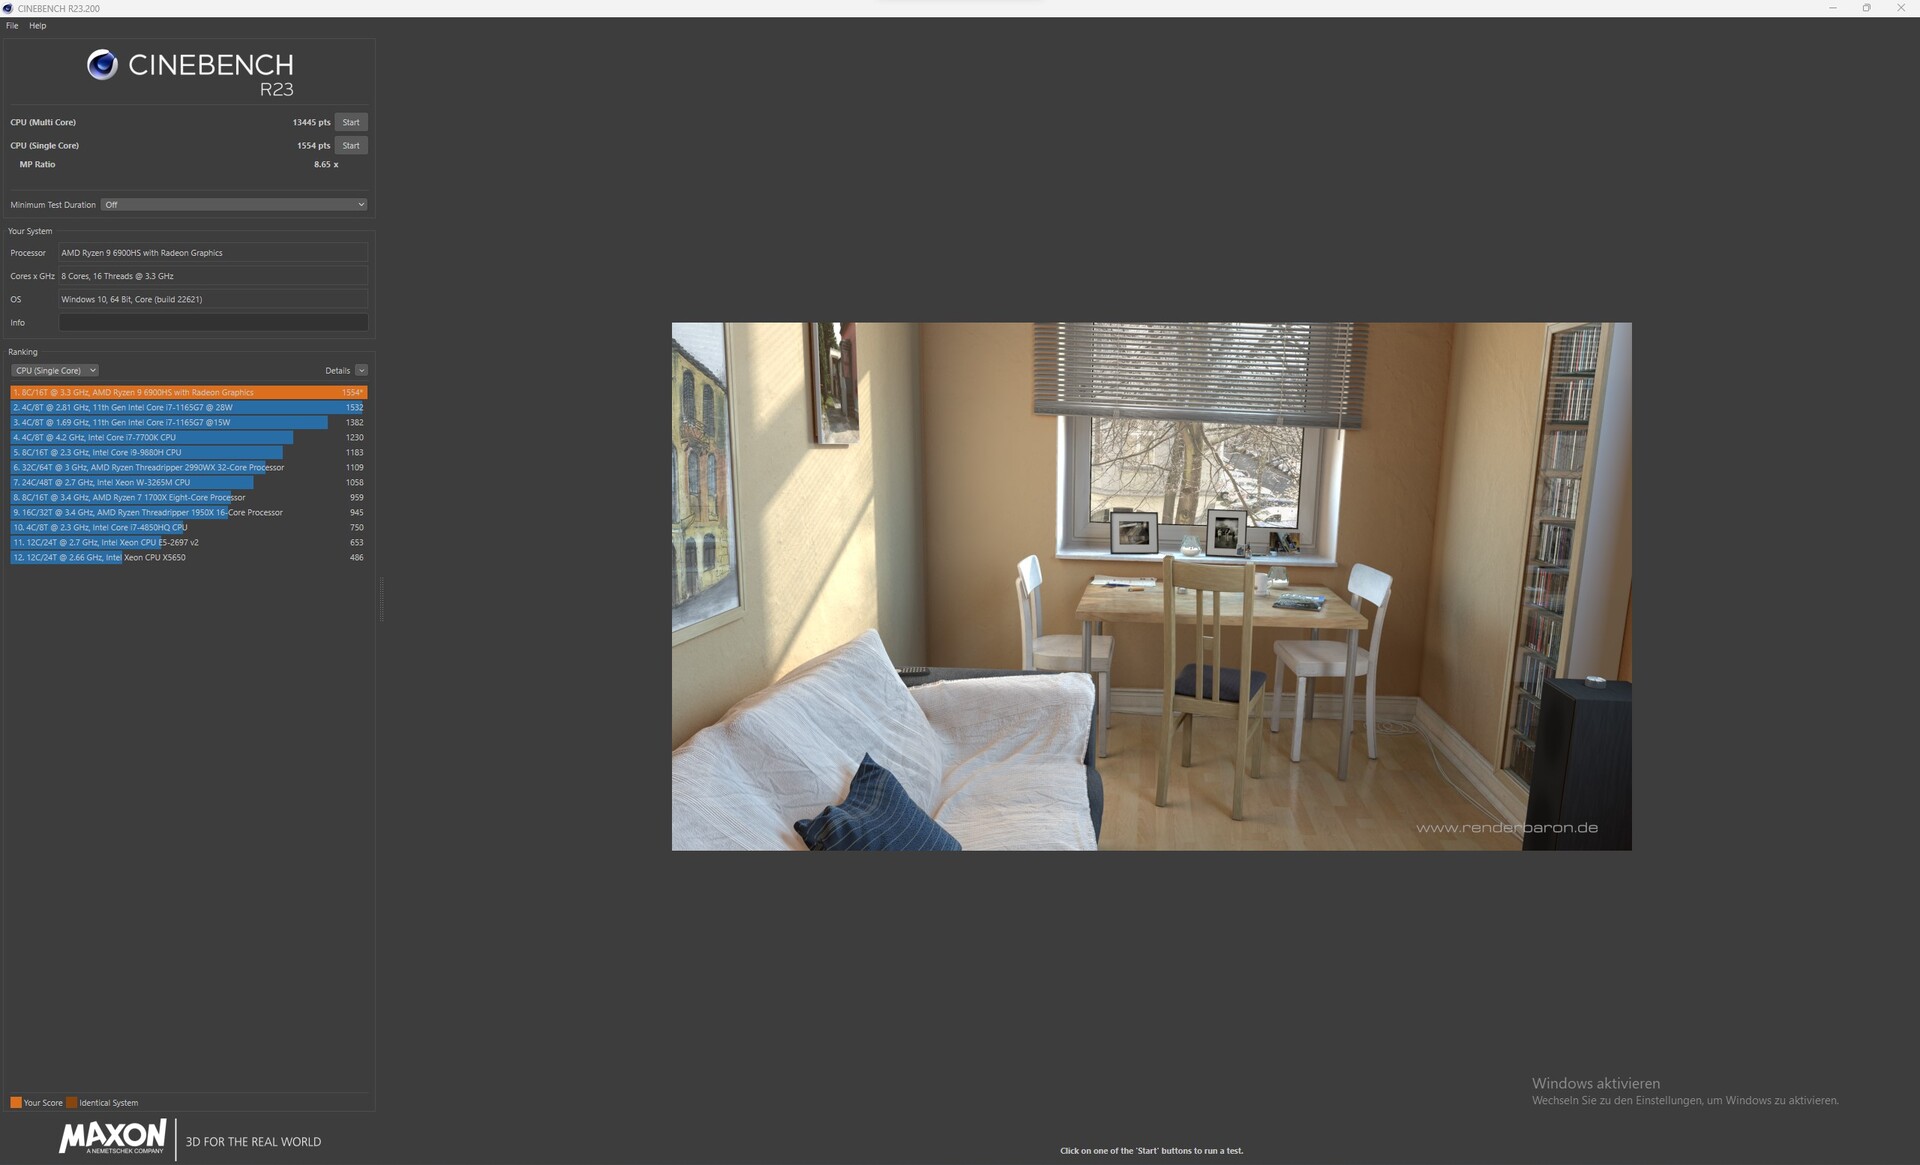
ElAMD Ryzen 9 6900HS es un procesador de ocho núcleos y está basado en la actual arquitectura Rembrandt. El SoC alcanza una frecuencia de 3.3-4.9 GHz en Boost y soporta SMT, lo que ofrece al usuario un total de 16 hilos. En comparación directa con la competencia basada en Intel, al AMD Ryzen 9 6900HS le cuesta mantener el tipo. Sin embargo, domina un poco mejor las pruebas AIDA64 y se hace con el tercer puesto de la clasificación.
Para más pruebas, te remitimos a nuestraTabla comparativa de CPUs.
Cinebench R15 Multi loop
Cinebench R23: Multi Core | Single Core
Cinebench R20: CPU (Multi Core) | CPU (Single Core)
Cinebench R15: CPU Multi 64Bit | CPU Single 64Bit
Blender: v2.79 BMW27 CPU
7-Zip 18.03: 7z b 4 | 7z b 4 -mmt1
Geekbench 5.5: Multi-Core | Single-Core
HWBOT x265 Benchmark v2.2: 4k Preset
LibreOffice : 20 Documents To PDF
R Benchmark 2.5: Overall mean
| CPU Performance rating | |
| Media de la clase Gaming | |
| Lenovo Legion 7 16IAX7-82TD004SGE | |
| HP Omen 16-b1090ng | |
| Acer Predator Triton 500 SE PT516-52s-70KX | |
| Lenovo Legion 7 16ARHA7 | |
| Asus ROG Flow X16 GV601RW-M5082W | |
| Medio AMD Ryzen 9 6900HS | |
| Corsair Voyager a1600 | |
| Cinebench R23 / Multi Core | |
| Media de la clase Gaming (10488 - 42661, n=107, últimos 2 años) | |
| Lenovo Legion 7 16IAX7-82TD004SGE | |
| Acer Predator Triton 500 SE PT516-52s-70KX | |
| HP Omen 16-b1090ng | |
| Lenovo Legion 7 16ARHA7 | |
| Asus ROG Flow X16 GV601RW-M5082W | |
| Corsair Voyager a1600 | |
| Medio AMD Ryzen 9 6900HS (12606 - 14403, n=5) | |
| Cinebench R23 / Single Core | |
| Media de la clase Gaming (1166 - 2415, n=107, últimos 2 años) | |
| Lenovo Legion 7 16IAX7-82TD004SGE | |
| HP Omen 16-b1090ng | |
| Acer Predator Triton 500 SE PT516-52s-70KX | |
| Lenovo Legion 7 16ARHA7 | |
| Corsair Voyager a1600 | |
| Medio AMD Ryzen 9 6900HS (1526 - 1570, n=5) | |
| Asus ROG Flow X16 GV601RW-M5082W | |
| Cinebench R20 / CPU (Multi Core) | |
| Media de la clase Gaming (4029 - 16433, n=106, últimos 2 años) | |
| Lenovo Legion 7 16IAX7-82TD004SGE | |
| Acer Predator Triton 500 SE PT516-52s-70KX | |
| HP Omen 16-b1090ng | |
| Lenovo Legion 7 16ARHA7 | |
| Asus ROG Flow X16 GV601RW-M5082W | |
| Medio AMD Ryzen 9 6900HS (4829 - 5552, n=5) | |
| Corsair Voyager a1600 | |
| Cinebench R20 / CPU (Single Core) | |
| Media de la clase Gaming (442 - 913, n=106, últimos 2 años) | |
| Lenovo Legion 7 16IAX7-82TD004SGE | |
| HP Omen 16-b1090ng | |
| Acer Predator Triton 500 SE PT516-52s-70KX | |
| Lenovo Legion 7 16ARHA7 | |
| Medio AMD Ryzen 9 6900HS (596 - 620, n=5) | |
| Asus ROG Flow X16 GV601RW-M5082W | |
| Corsair Voyager a1600 | |
| Cinebench R15 / CPU Multi 64Bit | |
| Media de la clase Gaming (1578 - 6330, n=105, últimos 2 años) | |
| Lenovo Legion 7 16IAX7-82TD004SGE | |
| HP Omen 16-b1090ng | |
| Acer Predator Triton 500 SE PT516-52s-70KX | |
| Lenovo Legion 7 16ARHA7 | |
| Asus ROG Flow X16 GV601RW-M5082W | |
| Medio AMD Ryzen 9 6900HS (2054 - 2342, n=5) | |
| Corsair Voyager a1600 | |
| Cinebench R15 / CPU Single 64Bit | |
| Media de la clase Gaming (188.8 - 350, n=106, últimos 2 años) | |
| Lenovo Legion 7 16IAX7-82TD004SGE | |
| HP Omen 16-b1090ng | |
| Lenovo Legion 7 16ARHA7 | |
| Corsair Voyager a1600 | |
| Medio AMD Ryzen 9 6900HS (218 - 254, n=5) | |
| Asus ROG Flow X16 GV601RW-M5082W | |
| Acer Predator Triton 500 SE PT516-52s-70KX | |
| Blender / v2.79 BMW27 CPU | |
| Medio AMD Ryzen 9 6900HS (220 - 277, n=5) | |
| Corsair Voyager a1600 | |
| Asus ROG Flow X16 GV601RW-M5082W | |
| Lenovo Legion 7 16ARHA7 | |
| Acer Predator Triton 500 SE PT516-52s-70KX | |
| HP Omen 16-b1090ng | |
| Media de la clase Gaming (79 - 330, n=104, últimos 2 años) | |
| Lenovo Legion 7 16IAX7-82TD004SGE | |
| 7-Zip 18.03 / 7z b 4 | |
| Media de la clase Gaming (33491 - 148086, n=105, últimos 2 años) | |
| Lenovo Legion 7 16IAX7-82TD004SGE | |
| HP Omen 16-b1090ng | |
| Acer Predator Triton 500 SE PT516-52s-70KX | |
| Lenovo Legion 7 16ARHA7 | |
| Corsair Voyager a1600 | |
| Asus ROG Flow X16 GV601RW-M5082W | |
| Medio AMD Ryzen 9 6900HS (52948 - 63591, n=5) | |
| 7-Zip 18.03 / 7z b 4 -mmt1 | |
| Media de la clase Gaming (4199 - 7436, n=105, últimos 2 años) | |
| Lenovo Legion 7 16IAX7-82TD004SGE | |
| HP Omen 16-b1090ng | |
| Corsair Voyager a1600 | |
| Medio AMD Ryzen 9 6900HS (5538 - 5958, n=5) | |
| Asus ROG Flow X16 GV601RW-M5082W | |
| Lenovo Legion 7 16ARHA7 | |
| Acer Predator Triton 500 SE PT516-52s-70KX | |
| Geekbench 5.5 / Multi-Core | |
| Media de la clase Gaming (6460 - 28263, n=105, últimos 2 años) | |
| Lenovo Legion 7 16IAX7-82TD004SGE | |
| HP Omen 16-b1090ng | |
| Acer Predator Triton 500 SE PT516-52s-70KX | |
| Corsair Voyager a1600 | |
| Lenovo Legion 7 16ARHA7 | |
| Medio AMD Ryzen 9 6900HS (8381 - 10040, n=5) | |
| Asus ROG Flow X16 GV601RW-M5082W | |
| Geekbench 5.5 / Single-Core | |
| Media de la clase Gaming (986 - 2474, n=105, últimos 2 años) | |
| Lenovo Legion 7 16IAX7-82TD004SGE | |
| HP Omen 16-b1090ng | |
| Acer Predator Triton 500 SE PT516-52s-70KX | |
| Lenovo Legion 7 16ARHA7 | |
| Medio AMD Ryzen 9 6900HS (1480 - 1614, n=5) | |
| Asus ROG Flow X16 GV601RW-M5082W | |
| Corsair Voyager a1600 | |
| HWBOT x265 Benchmark v2.2 / 4k Preset | |
| Media de la clase Gaming (11.5 - 44.4, n=105, últimos 2 años) | |
| Lenovo Legion 7 16IAX7-82TD004SGE | |
| HP Omen 16-b1090ng | |
| Acer Predator Triton 500 SE PT516-52s-70KX | |
| Lenovo Legion 7 16ARHA7 | |
| Corsair Voyager a1600 | |
| Asus ROG Flow X16 GV601RW-M5082W | |
| Medio AMD Ryzen 9 6900HS (14.2 - 17.9, n=5) | |
| LibreOffice / 20 Documents To PDF | |
| Corsair Voyager a1600 | |
| Asus ROG Flow X16 GV601RW-M5082W | |
| Lenovo Legion 7 16ARHA7 | |
| Medio AMD Ryzen 9 6900HS (47.6 - 57.2, n=5) | |
| Media de la clase Gaming (33.2 - 88.8, n=105, últimos 2 años) | |
| Acer Predator Triton 500 SE PT516-52s-70KX | |
| HP Omen 16-b1090ng | |
| Lenovo Legion 7 16IAX7-82TD004SGE | |
| R Benchmark 2.5 / Overall mean | |
| Asus ROG Flow X16 GV601RW-M5082W | |
| Lenovo Legion 7 16ARHA7 | |
| Corsair Voyager a1600 | |
| Medio AMD Ryzen 9 6900HS (0.4672 - 0.502, n=5) | |
| Acer Predator Triton 500 SE PT516-52s-70KX | |
| HP Omen 16-b1090ng | |
| Media de la clase Gaming (0.3439 - 0.759, n=106, últimos 2 años) | |
| Lenovo Legion 7 16IAX7-82TD004SGE | |
* ... más pequeño es mejor
AIDA64: FP32 Ray-Trace | FPU Julia | CPU SHA3 | CPU Queen | FPU SinJulia | FPU Mandel | CPU AES | CPU ZLib | FP64 Ray-Trace | CPU PhotoWorxx
| Performance rating | |
| Media de la clase Gaming | |
| Lenovo Legion 7 16ARHA7 | |
| Asus ROG Flow X16 GV601RW-M5082W | |
| Corsair Voyager a1600 | |
| Lenovo Legion 7 16IAX7-82TD004SGE | |
| Medio AMD Ryzen 9 6900HS | |
| Acer Predator Triton 500 SE PT516-52s-70KX | |
| HP Omen 16-b1090ng | |
| AIDA64 / FP32 Ray-Trace | |
| Media de la clase Gaming (10227 - 85542, n=105, últimos 2 años) | |
| Lenovo Legion 7 16ARHA7 | |
| Asus ROG Flow X16 GV601RW-M5082W | |
| Corsair Voyager a1600 | |
| Medio AMD Ryzen 9 6900HS (14212 - 16072, n=5) | |
| Lenovo Legion 7 16IAX7-82TD004SGE | |
| Acer Predator Triton 500 SE PT516-52s-70KX | |
| HP Omen 16-b1090ng | |
| AIDA64 / FPU Julia | |
| Media de la clase Gaming (51376 - 238426, n=105, últimos 2 años) | |
| Lenovo Legion 7 16ARHA7 | |
| Asus ROG Flow X16 GV601RW-M5082W | |
| Corsair Voyager a1600 | |
| Medio AMD Ryzen 9 6900HS (90523 - 102881, n=5) | |
| Lenovo Legion 7 16IAX7-82TD004SGE | |
| Acer Predator Triton 500 SE PT516-52s-70KX | |
| HP Omen 16-b1090ng | |
| AIDA64 / CPU SHA3 | |
| Media de la clase Gaming (2180 - 10115, n=105, últimos 2 años) | |
| Lenovo Legion 7 16IAX7-82TD004SGE | |
| Lenovo Legion 7 16ARHA7 | |
| Asus ROG Flow X16 GV601RW-M5082W | |
| Corsair Voyager a1600 | |
| Acer Predator Triton 500 SE PT516-52s-70KX | |
| Medio AMD Ryzen 9 6900HS (3035 - 3614, n=5) | |
| HP Omen 16-b1090ng | |
| AIDA64 / CPU Queen | |
| Media de la clase Gaming (49785 - 173351, n=90, últimos 2 años) | |
| Lenovo Legion 7 16ARHA7 | |
| Corsair Voyager a1600 | |
| Asus ROG Flow X16 GV601RW-M5082W | |
| Medio AMD Ryzen 9 6900HS (97461 - 105203, n=5) | |
| Lenovo Legion 7 16IAX7-82TD004SGE | |
| HP Omen 16-b1090ng | |
| Acer Predator Triton 500 SE PT516-52s-70KX | |
| AIDA64 / FPU SinJulia | |
| Media de la clase Gaming (4424 - 33636, n=105, últimos 2 años) | |
| Lenovo Legion 7 16IAX7-82TD004SGE | |
| Corsair Voyager a1600 | |
| Lenovo Legion 7 16ARHA7 | |
| Asus ROG Flow X16 GV601RW-M5082W | |
| Medio AMD Ryzen 9 6900HS (12548 - 13039, n=5) | |
| Acer Predator Triton 500 SE PT516-52s-70KX | |
| HP Omen 16-b1090ng | |
| AIDA64 / FPU Mandel | |
| Media de la clase Gaming (25115 - 128721, n=105, últimos 2 años) | |
| Lenovo Legion 7 16ARHA7 | |
| Asus ROG Flow X16 GV601RW-M5082W | |
| Corsair Voyager a1600 | |
| Medio AMD Ryzen 9 6900HS (49657 - 56486, n=5) | |
| Lenovo Legion 7 16IAX7-82TD004SGE | |
| Acer Predator Triton 500 SE PT516-52s-70KX | |
| HP Omen 16-b1090ng | |
| AIDA64 / CPU AES | |
| Asus ROG Flow X16 GV601RW-M5082W | |
| Lenovo Legion 7 16ARHA7 | |
| Corsair Voyager a1600 | |
| Lenovo Legion 7 16IAX7-82TD004SGE | |
| Medio AMD Ryzen 9 6900HS (51791 - 142686, n=5) | |
| Media de la clase Gaming (39258 - 247074, n=105, últimos 2 años) | |
| Acer Predator Triton 500 SE PT516-52s-70KX | |
| HP Omen 16-b1090ng | |
| AIDA64 / CPU ZLib | |
| Media de la clase Gaming (574 - 2531, n=105, últimos 2 años) | |
| Lenovo Legion 7 16IAX7-82TD004SGE | |
| Acer Predator Triton 500 SE PT516-52s-70KX | |
| HP Omen 16-b1090ng | |
| Lenovo Legion 7 16ARHA7 | |
| Asus ROG Flow X16 GV601RW-M5082W | |
| Corsair Voyager a1600 | |
| Medio AMD Ryzen 9 6900HS (737 - 888, n=5) | |
| AIDA64 / FP64 Ray-Trace | |
| Media de la clase Gaming (5509 - 45446, n=105, últimos 2 años) | |
| Lenovo Legion 7 16ARHA7 | |
| Asus ROG Flow X16 GV601RW-M5082W | |
| Corsair Voyager a1600 | |
| Medio AMD Ryzen 9 6900HS (7530 - 8981, n=5) | |
| Lenovo Legion 7 16IAX7-82TD004SGE | |
| Acer Predator Triton 500 SE PT516-52s-70KX | |
| HP Omen 16-b1090ng | |
| AIDA64 / CPU PhotoWorxx | |
| Media de la clase Gaming (12271 - 89891, n=105, últimos 2 años) | |
| HP Omen 16-b1090ng | |
| Lenovo Legion 7 16IAX7-82TD004SGE | |
| Acer Predator Triton 500 SE PT516-52s-70KX | |
| Lenovo Legion 7 16ARHA7 | |
| Corsair Voyager a1600 | |
| Asus ROG Flow X16 GV601RW-M5082W | |
| Medio AMD Ryzen 9 6900HS (25757 - 30291, n=5) | |
Rendimiento del sistema
Los resultados del benchmark muestran un buen rendimiento del sistema, aunque se nota de nuevo una clara diferencia con los portátiles basados en Intel. Subjetivamente, sin embargo, el Corsair Voyager a1600 ofrece un rendimiento de sistema muy bueno sin latencias notables en el uso diario.
CrossMark: Overall | Productivity | Creativity | Responsiveness
| PCMark 10 / Score | |
| Lenovo Legion 7 16IAX7-82TD004SGE | |
| Media de la clase Gaming (5828 - 12414, n=93, últimos 2 años) | |
| Acer Predator Triton 500 SE PT516-52s-70KX | |
| Lenovo Legion 7 16ARHA7 | |
| HP Omen 16-b1090ng | |
| Corsair Voyager a1600 | |
| Medio AMD Ryzen 9 6900HS, AMD Radeon RX 6800M (n=1) | |
| Asus ROG Flow X16 GV601RW-M5082W | |
| PCMark 10 / Essentials | |
| Lenovo Legion 7 16IAX7-82TD004SGE | |
| Acer Predator Triton 500 SE PT516-52s-70KX | |
| Media de la clase Gaming (8810 - 11935, n=97, últimos 2 años) | |
| Lenovo Legion 7 16ARHA7 | |
| HP Omen 16-b1090ng | |
| Corsair Voyager a1600 | |
| Medio AMD Ryzen 9 6900HS, AMD Radeon RX 6800M (n=1) | |
| Asus ROG Flow X16 GV601RW-M5082W | |
| PCMark 10 / Productivity | |
| Media de la clase Gaming (6845 - 25323, n=95, últimos 2 años) | |
| Lenovo Legion 7 16IAX7-82TD004SGE | |
| Asus ROG Flow X16 GV601RW-M5082W | |
| Acer Predator Triton 500 SE PT516-52s-70KX | |
| HP Omen 16-b1090ng | |
| Lenovo Legion 7 16ARHA7 | |
| Corsair Voyager a1600 | |
| Medio AMD Ryzen 9 6900HS, AMD Radeon RX 6800M (n=1) | |
| PCMark 10 / Digital Content Creation | |
| Lenovo Legion 7 16IAX7-82TD004SGE | |
| Media de la clase Gaming (7602 - 19954, n=95, últimos 2 años) | |
| Lenovo Legion 7 16ARHA7 | |
| Corsair Voyager a1600 | |
| Medio AMD Ryzen 9 6900HS, AMD Radeon RX 6800M (n=1) | |
| Acer Predator Triton 500 SE PT516-52s-70KX | |
| HP Omen 16-b1090ng | |
| Asus ROG Flow X16 GV601RW-M5082W | |
| CrossMark / Overall | |
| Lenovo Legion 7 16IAX7-82TD004SGE | |
| Media de la clase Gaming (1366 - 2409, n=94, últimos 2 años) | |
| Acer Predator Triton 500 SE PT516-52s-70KX | |
| Asus ROG Flow X16 GV601RW-M5082W | |
| Lenovo Legion 7 16ARHA7 | |
| Corsair Voyager a1600 | |
| Medio AMD Ryzen 9 6900HS, AMD Radeon RX 6800M (n=1) | |
| CrossMark / Productivity | |
| Lenovo Legion 7 16IAX7-82TD004SGE | |
| Media de la clase Gaming (1386 - 2254, n=94, últimos 2 años) | |
| Acer Predator Triton 500 SE PT516-52s-70KX | |
| Asus ROG Flow X16 GV601RW-M5082W | |
| Lenovo Legion 7 16ARHA7 | |
| Corsair Voyager a1600 | |
| Medio AMD Ryzen 9 6900HS, AMD Radeon RX 6800M (n=1) | |
| CrossMark / Creativity | |
| Lenovo Legion 7 16IAX7-82TD004SGE | |
| Media de la clase Gaming (1343 - 2786, n=94, últimos 2 años) | |
| Acer Predator Triton 500 SE PT516-52s-70KX | |
| Asus ROG Flow X16 GV601RW-M5082W | |
| Lenovo Legion 7 16ARHA7 | |
| Corsair Voyager a1600 | |
| Medio AMD Ryzen 9 6900HS, AMD Radeon RX 6800M (n=1) | |
| CrossMark / Responsiveness | |
| Lenovo Legion 7 16IAX7-82TD004SGE | |
| Acer Predator Triton 500 SE PT516-52s-70KX | |
| Media de la clase Gaming (1226 - 2334, n=94, últimos 2 años) | |
| Asus ROG Flow X16 GV601RW-M5082W | |
| Lenovo Legion 7 16ARHA7 | |
| Corsair Voyager a1600 | |
| Medio AMD Ryzen 9 6900HS, AMD Radeon RX 6800M (n=1) | |
| PCMark 10 Score | 7208 puntos | |
ayuda | ||
| AIDA64 / Memory Copy | |
| Media de la clase Gaming (21750 - 129946, n=105, últimos 2 años) | |
| Lenovo Legion 7 16IAX7-82TD004SGE | |
| HP Omen 16-b1090ng | |
| Acer Predator Triton 500 SE PT516-52s-70KX | |
| Lenovo Legion 7 16ARHA7 | |
| Medio AMD Ryzen 9 6900HS (49150 - 51517, n=5) | |
| Corsair Voyager a1600 | |
| Asus ROG Flow X16 GV601RW-M5082W | |
| AIDA64 / Memory Read | |
| Media de la clase Gaming (22956 - 118858, n=105, últimos 2 años) | |
| Lenovo Legion 7 16IAX7-82TD004SGE | |
| Acer Predator Triton 500 SE PT516-52s-70KX | |
| HP Omen 16-b1090ng | |
| Lenovo Legion 7 16ARHA7 | |
| Corsair Voyager a1600 | |
| Asus ROG Flow X16 GV601RW-M5082W | |
| Medio AMD Ryzen 9 6900HS (43646 - 51838, n=5) | |
| AIDA64 / Memory Write | |
| Media de la clase Gaming (22297 - 135096, n=105, últimos 2 años) | |
| HP Omen 16-b1090ng | |
| Lenovo Legion 7 16IAX7-82TD004SGE | |
| Lenovo Legion 7 16ARHA7 | |
| Corsair Voyager a1600 | |
| Asus ROG Flow X16 GV601RW-M5082W | |
| Acer Predator Triton 500 SE PT516-52s-70KX | |
| Medio AMD Ryzen 9 6900HS (15975 - 55235, n=5) | |
| AIDA64 / Memory Latency | |
| Acer Predator Triton 500 SE PT516-52s-70KX | |
| Media de la clase Gaming (75.3 - 259, n=105, últimos 2 años) | |
| Corsair Voyager a1600 | |
| Asus ROG Flow X16 GV601RW-M5082W | |
| Medio AMD Ryzen 9 6900HS (79.2 - 110.9, n=5) | |
| HP Omen 16-b1090ng | |
| Lenovo Legion 7 16IAX7-82TD004SGE | |
| Lenovo Legion 7 16ARHA7 | |
* ... más pequeño es mejor
Latencias del CPD
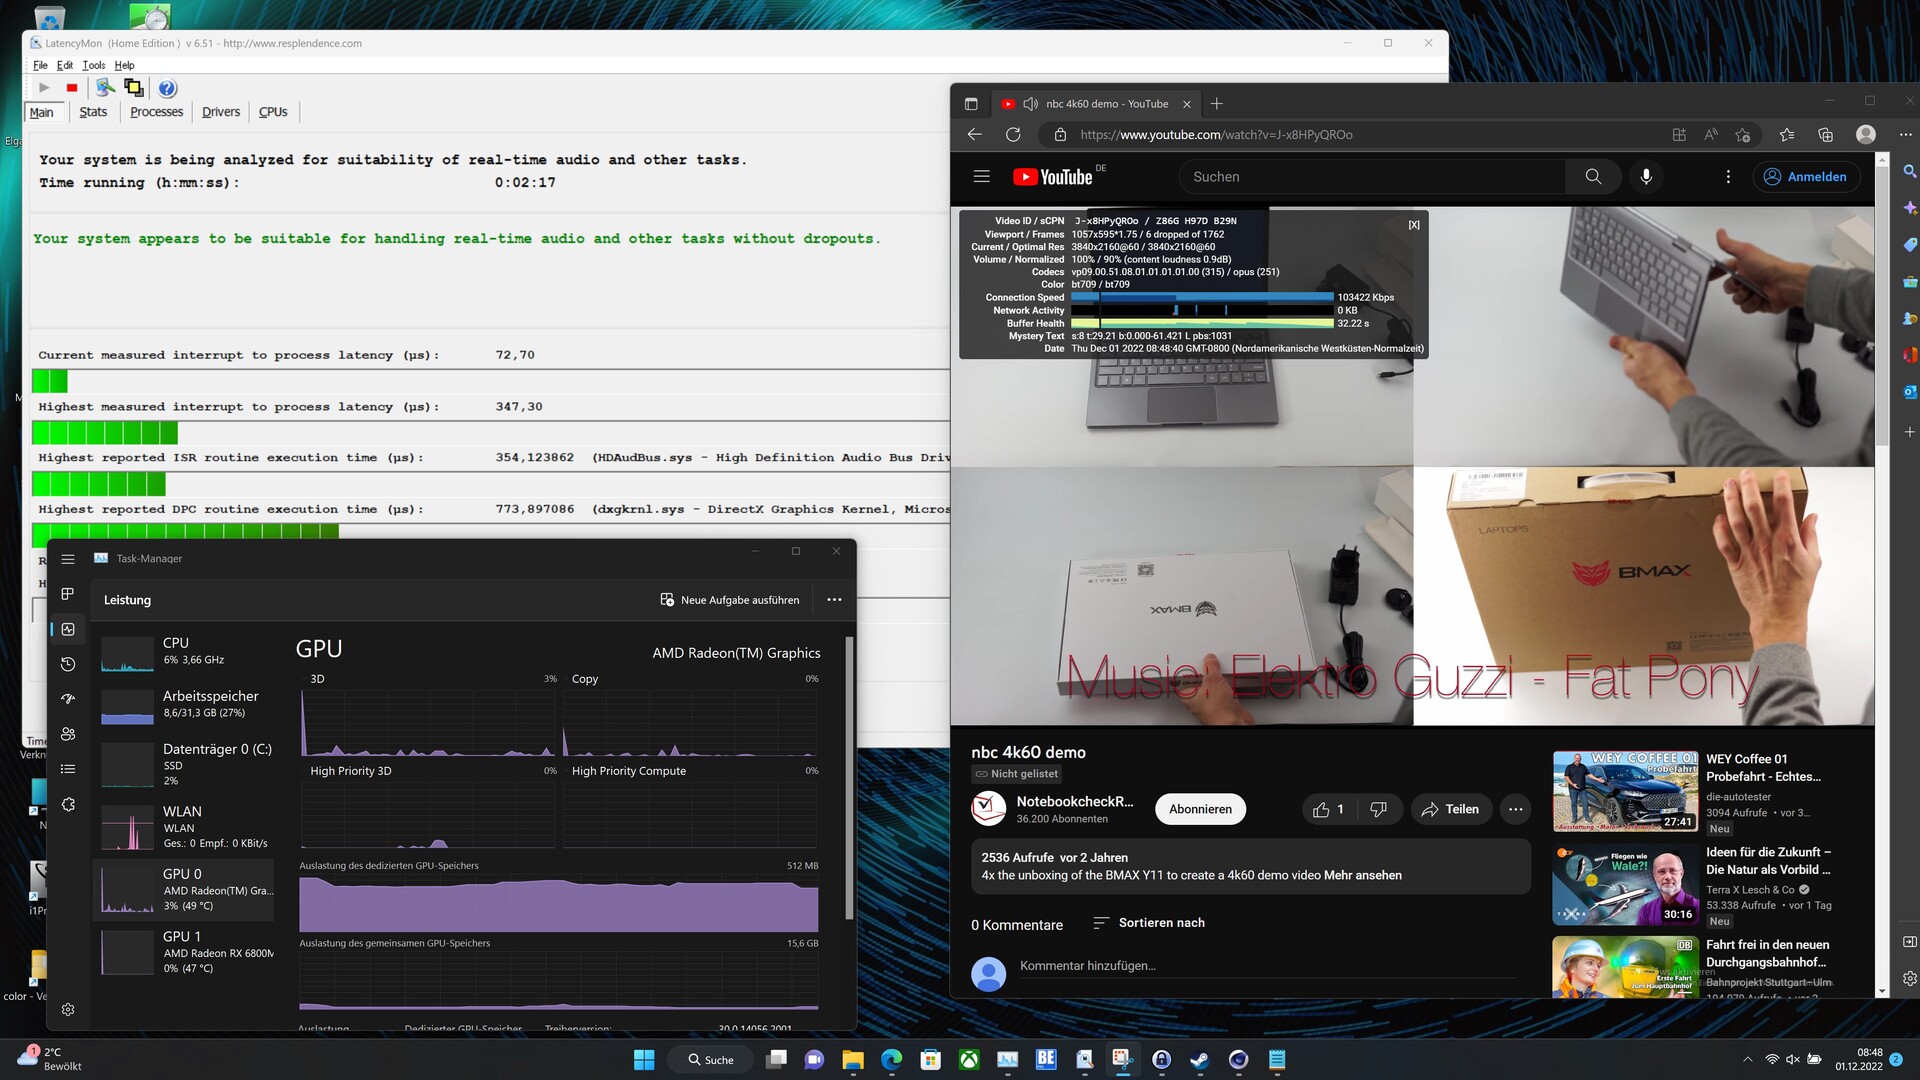
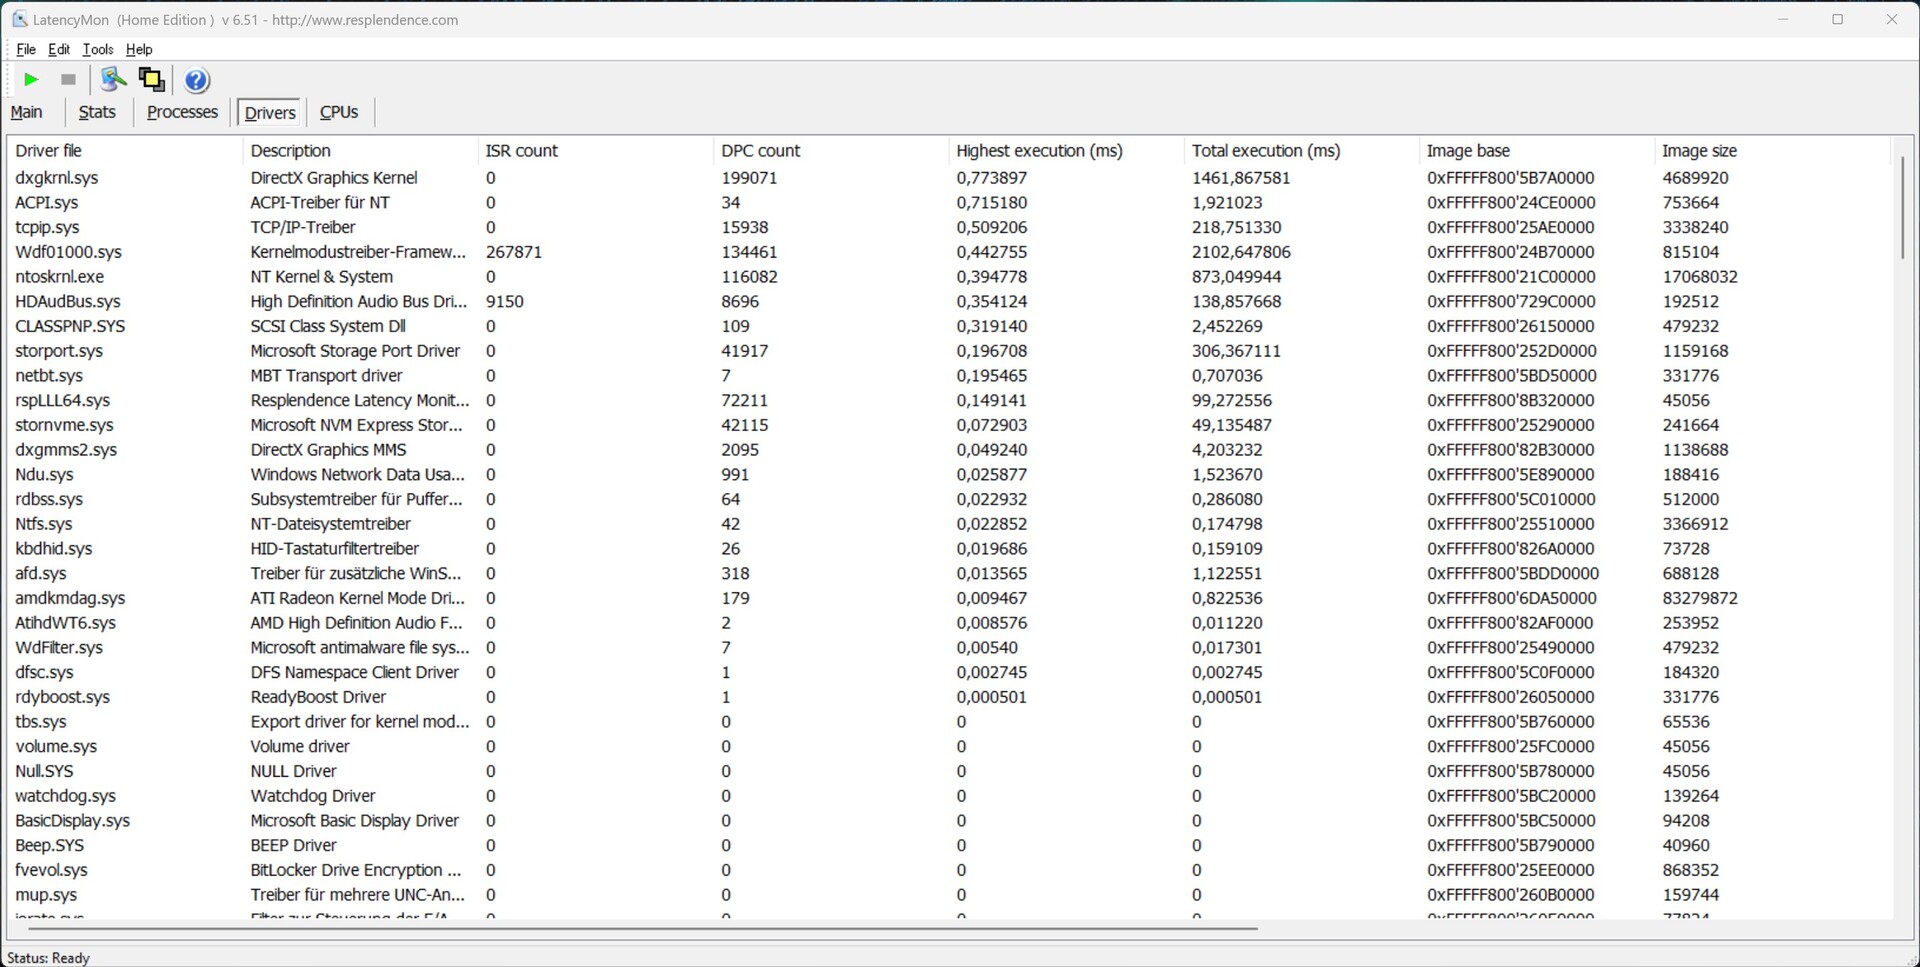
Las latencias documentadas no aumentan al abrir varias pestañas del navegador en Edge. La Voyager a1600 también domina la reproducción del vídeo 4K de YouTube sin problemas. Sólo vemos un ligero aumento de las latencias tras iniciar Prime95.
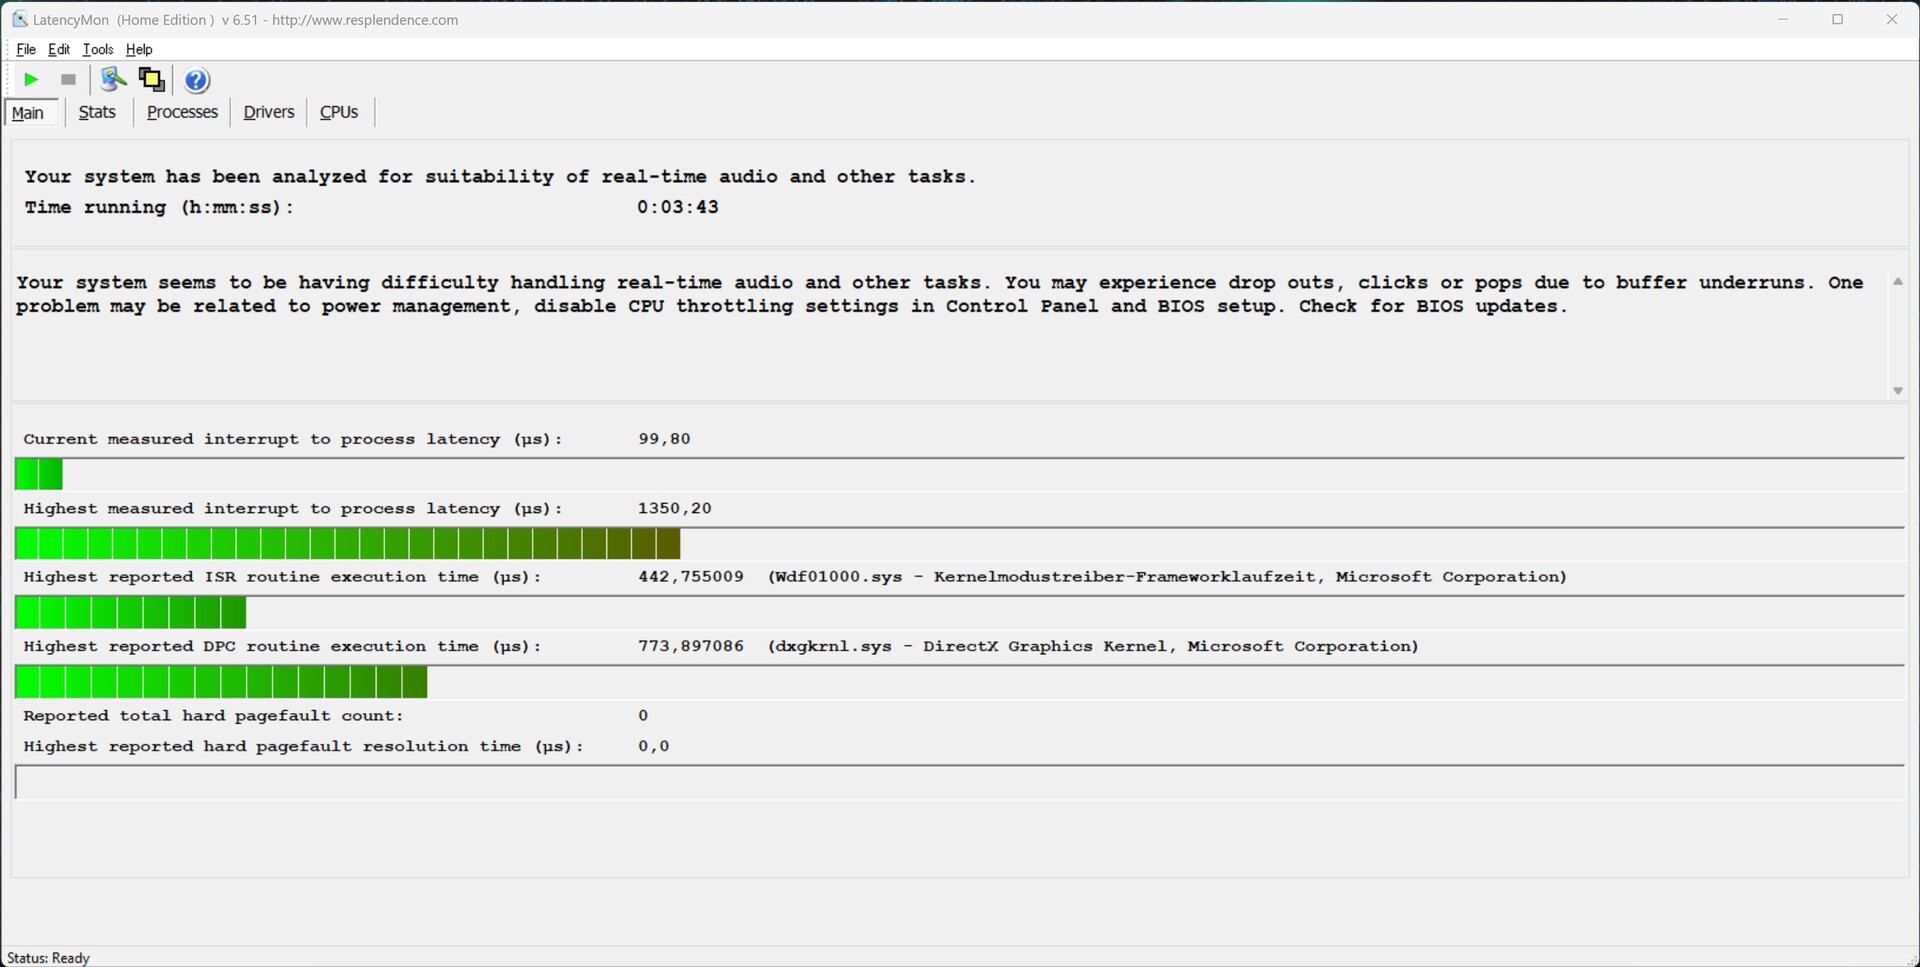
| DPC Latencies / LatencyMon - interrupt to process latency (max), Web, Youtube, Prime95 | |
| Acer Predator Triton 500 SE PT516-52s-70KX | |
| Lenovo Legion 7 16ARHA7 | |
| Asus ROG Flow X16 GV601RW-M5082W | |
| Lenovo Legion 7 16IAX7-82TD004SGE | |
| Corsair Voyager a1600 | |
| HP Omen 16-b1090ng | |
* ... más pequeño es mejor
Almacenamiento masivo
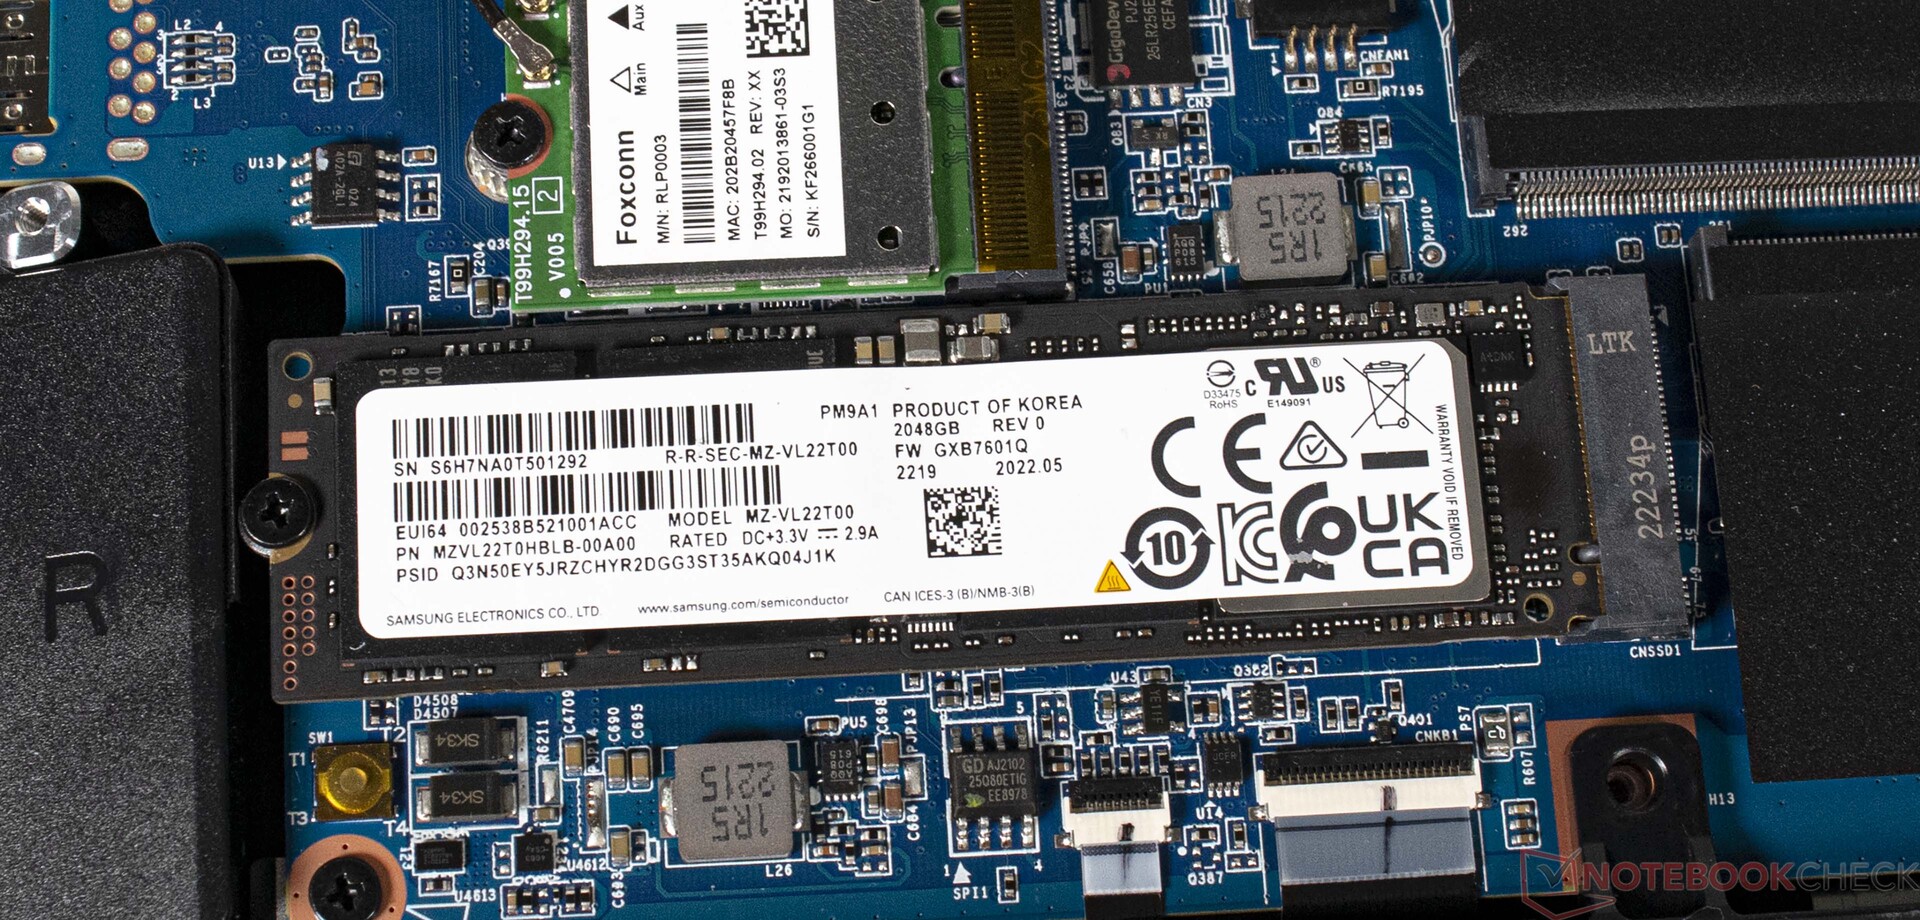
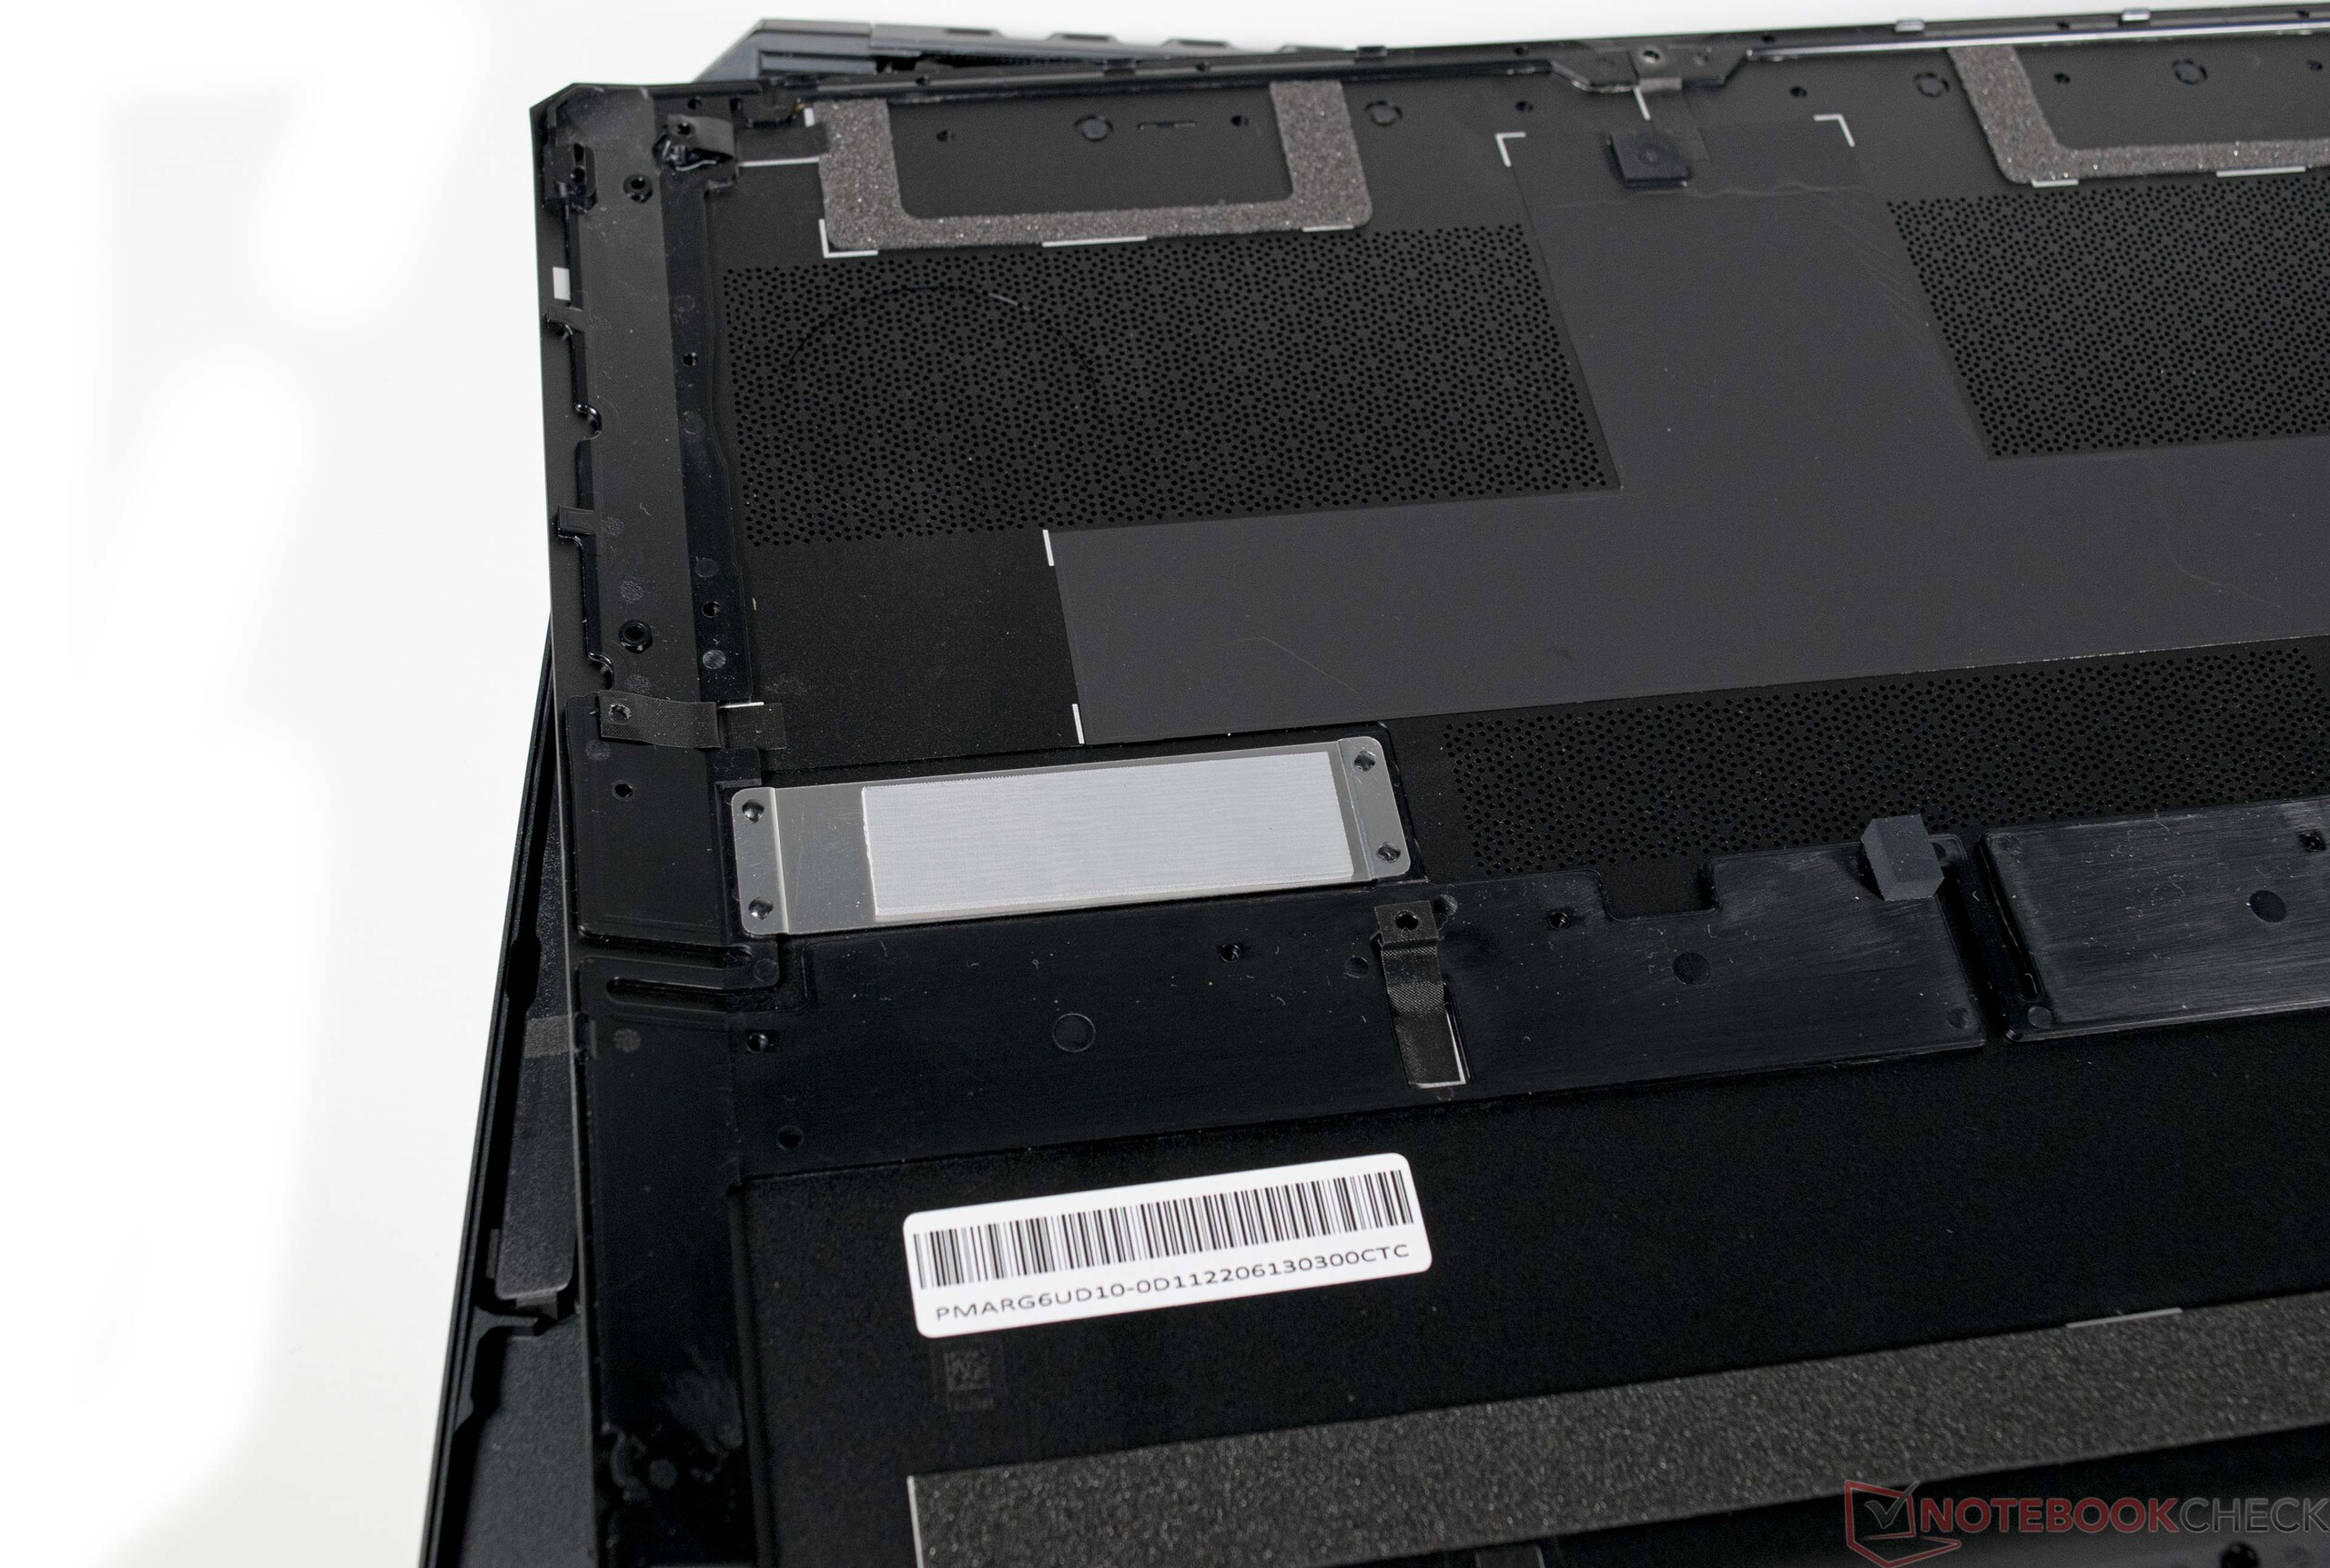
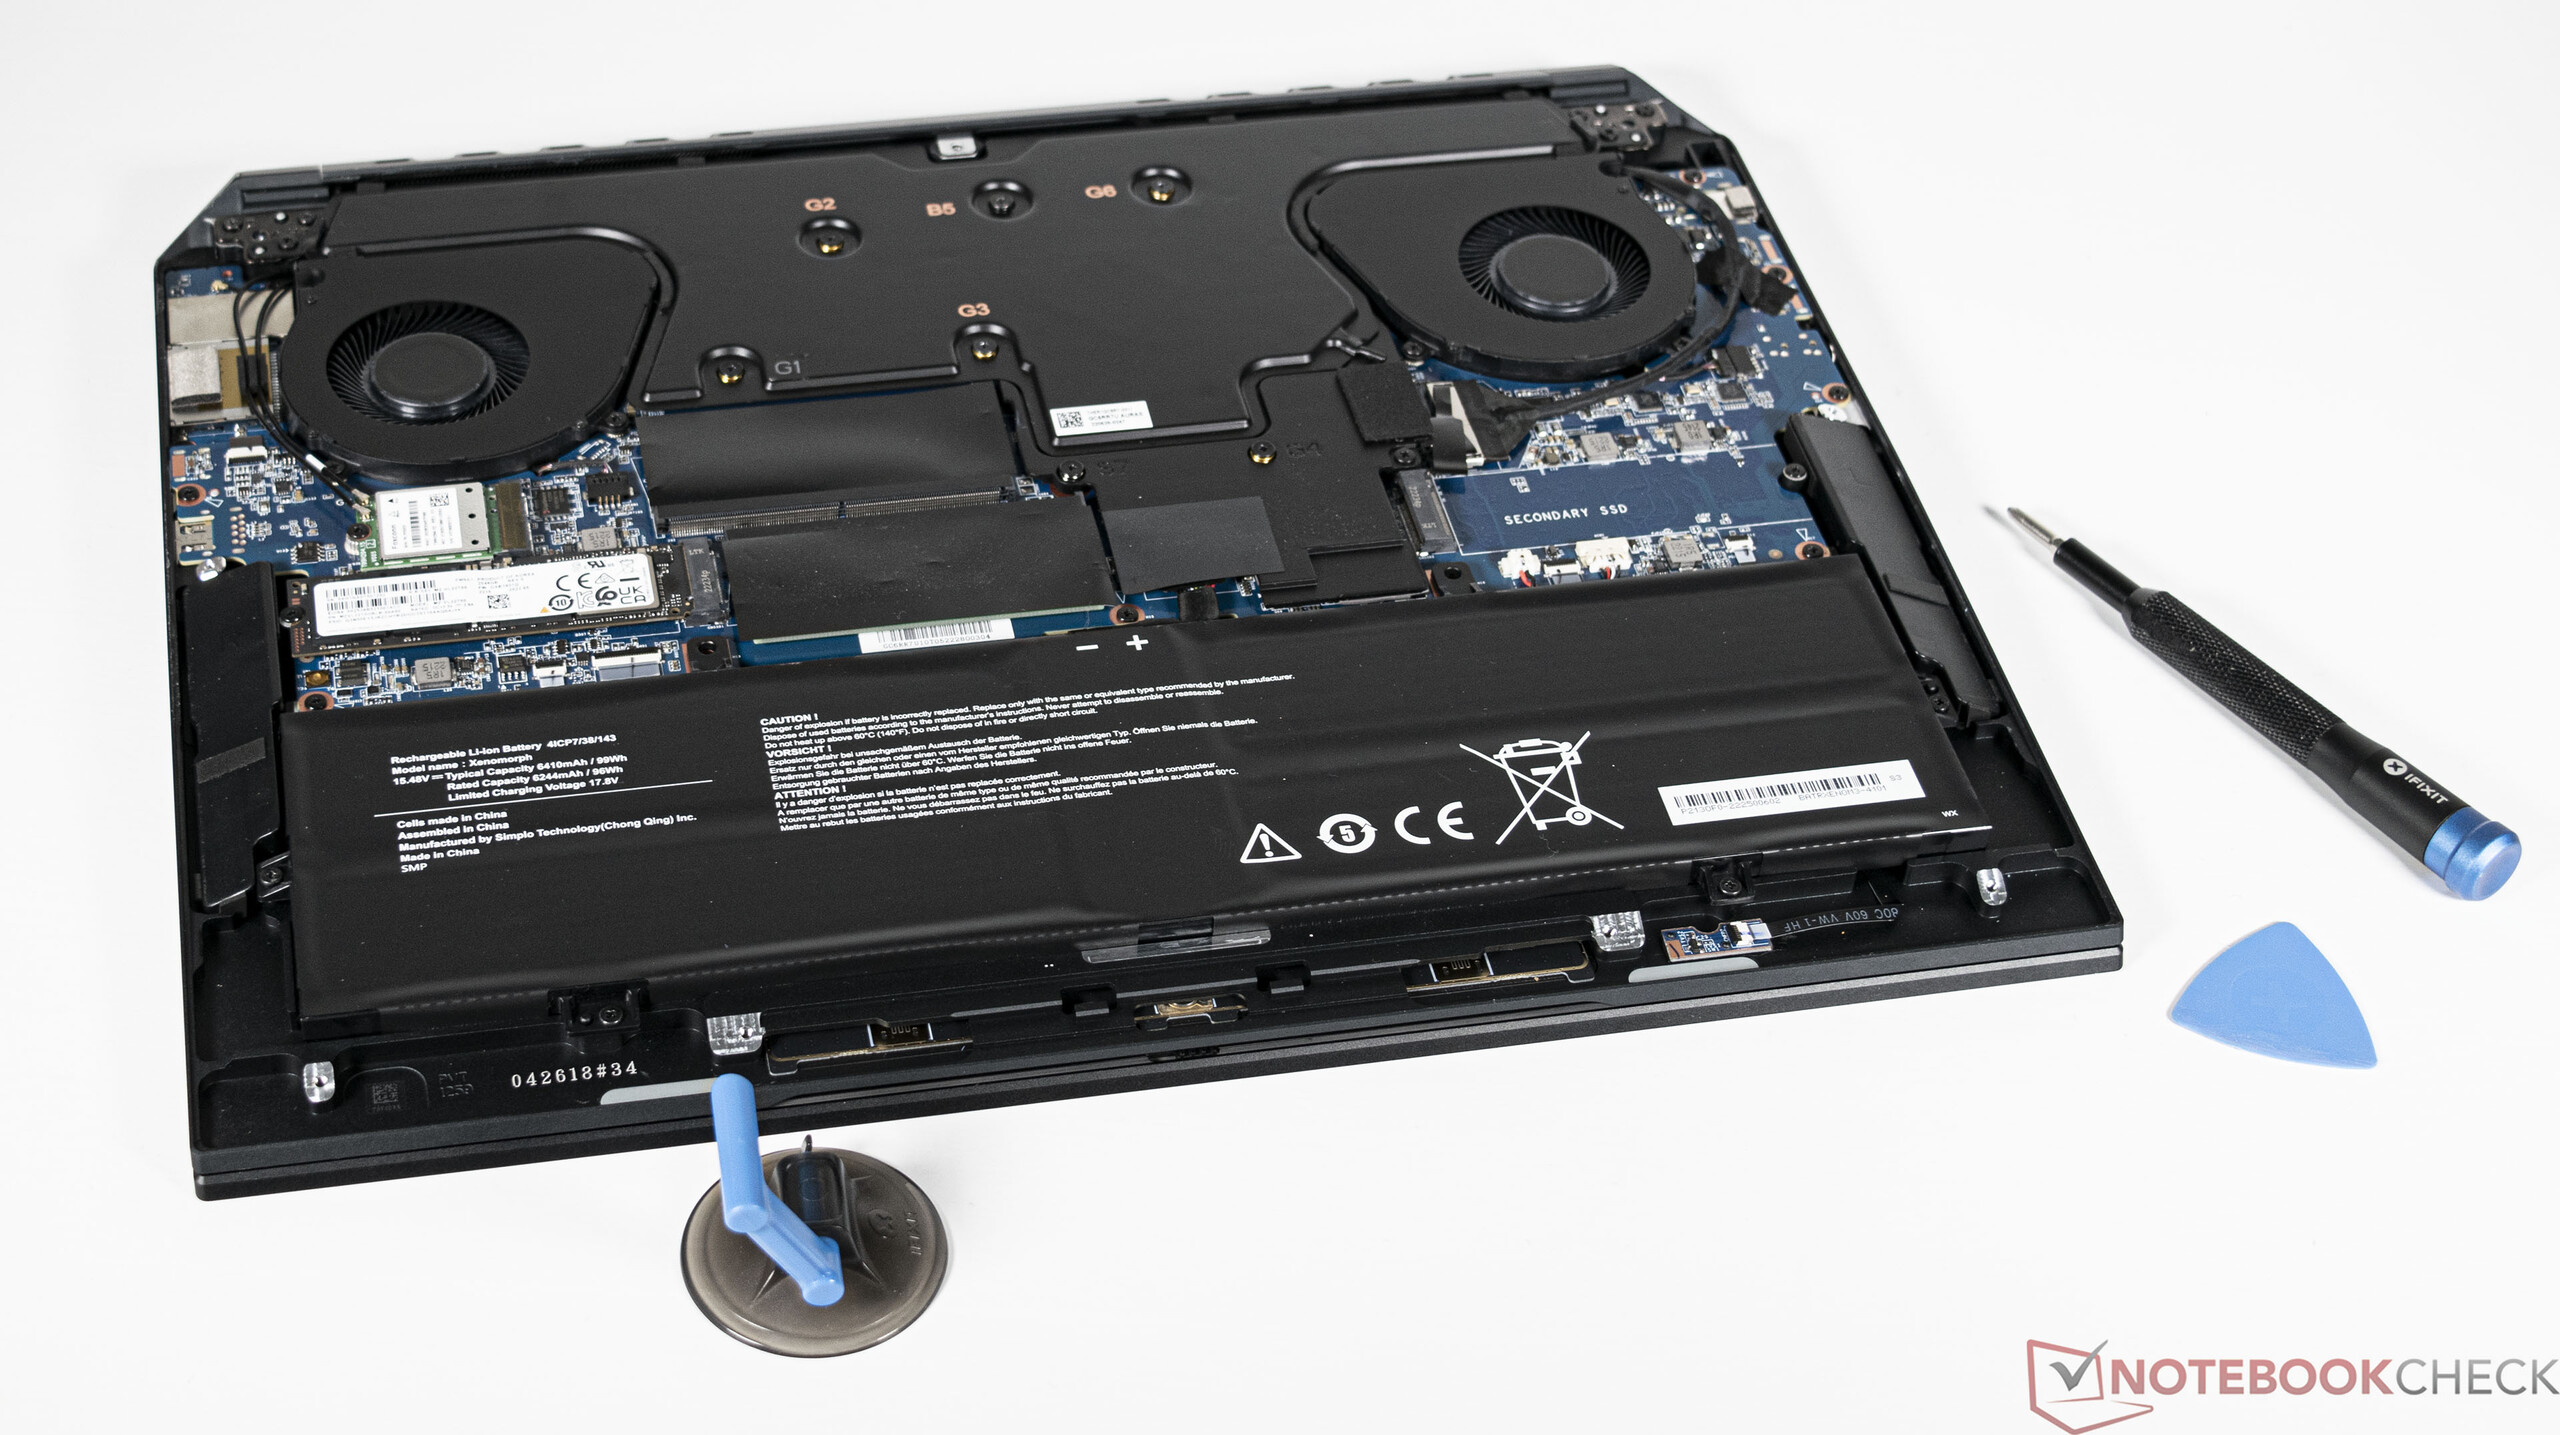
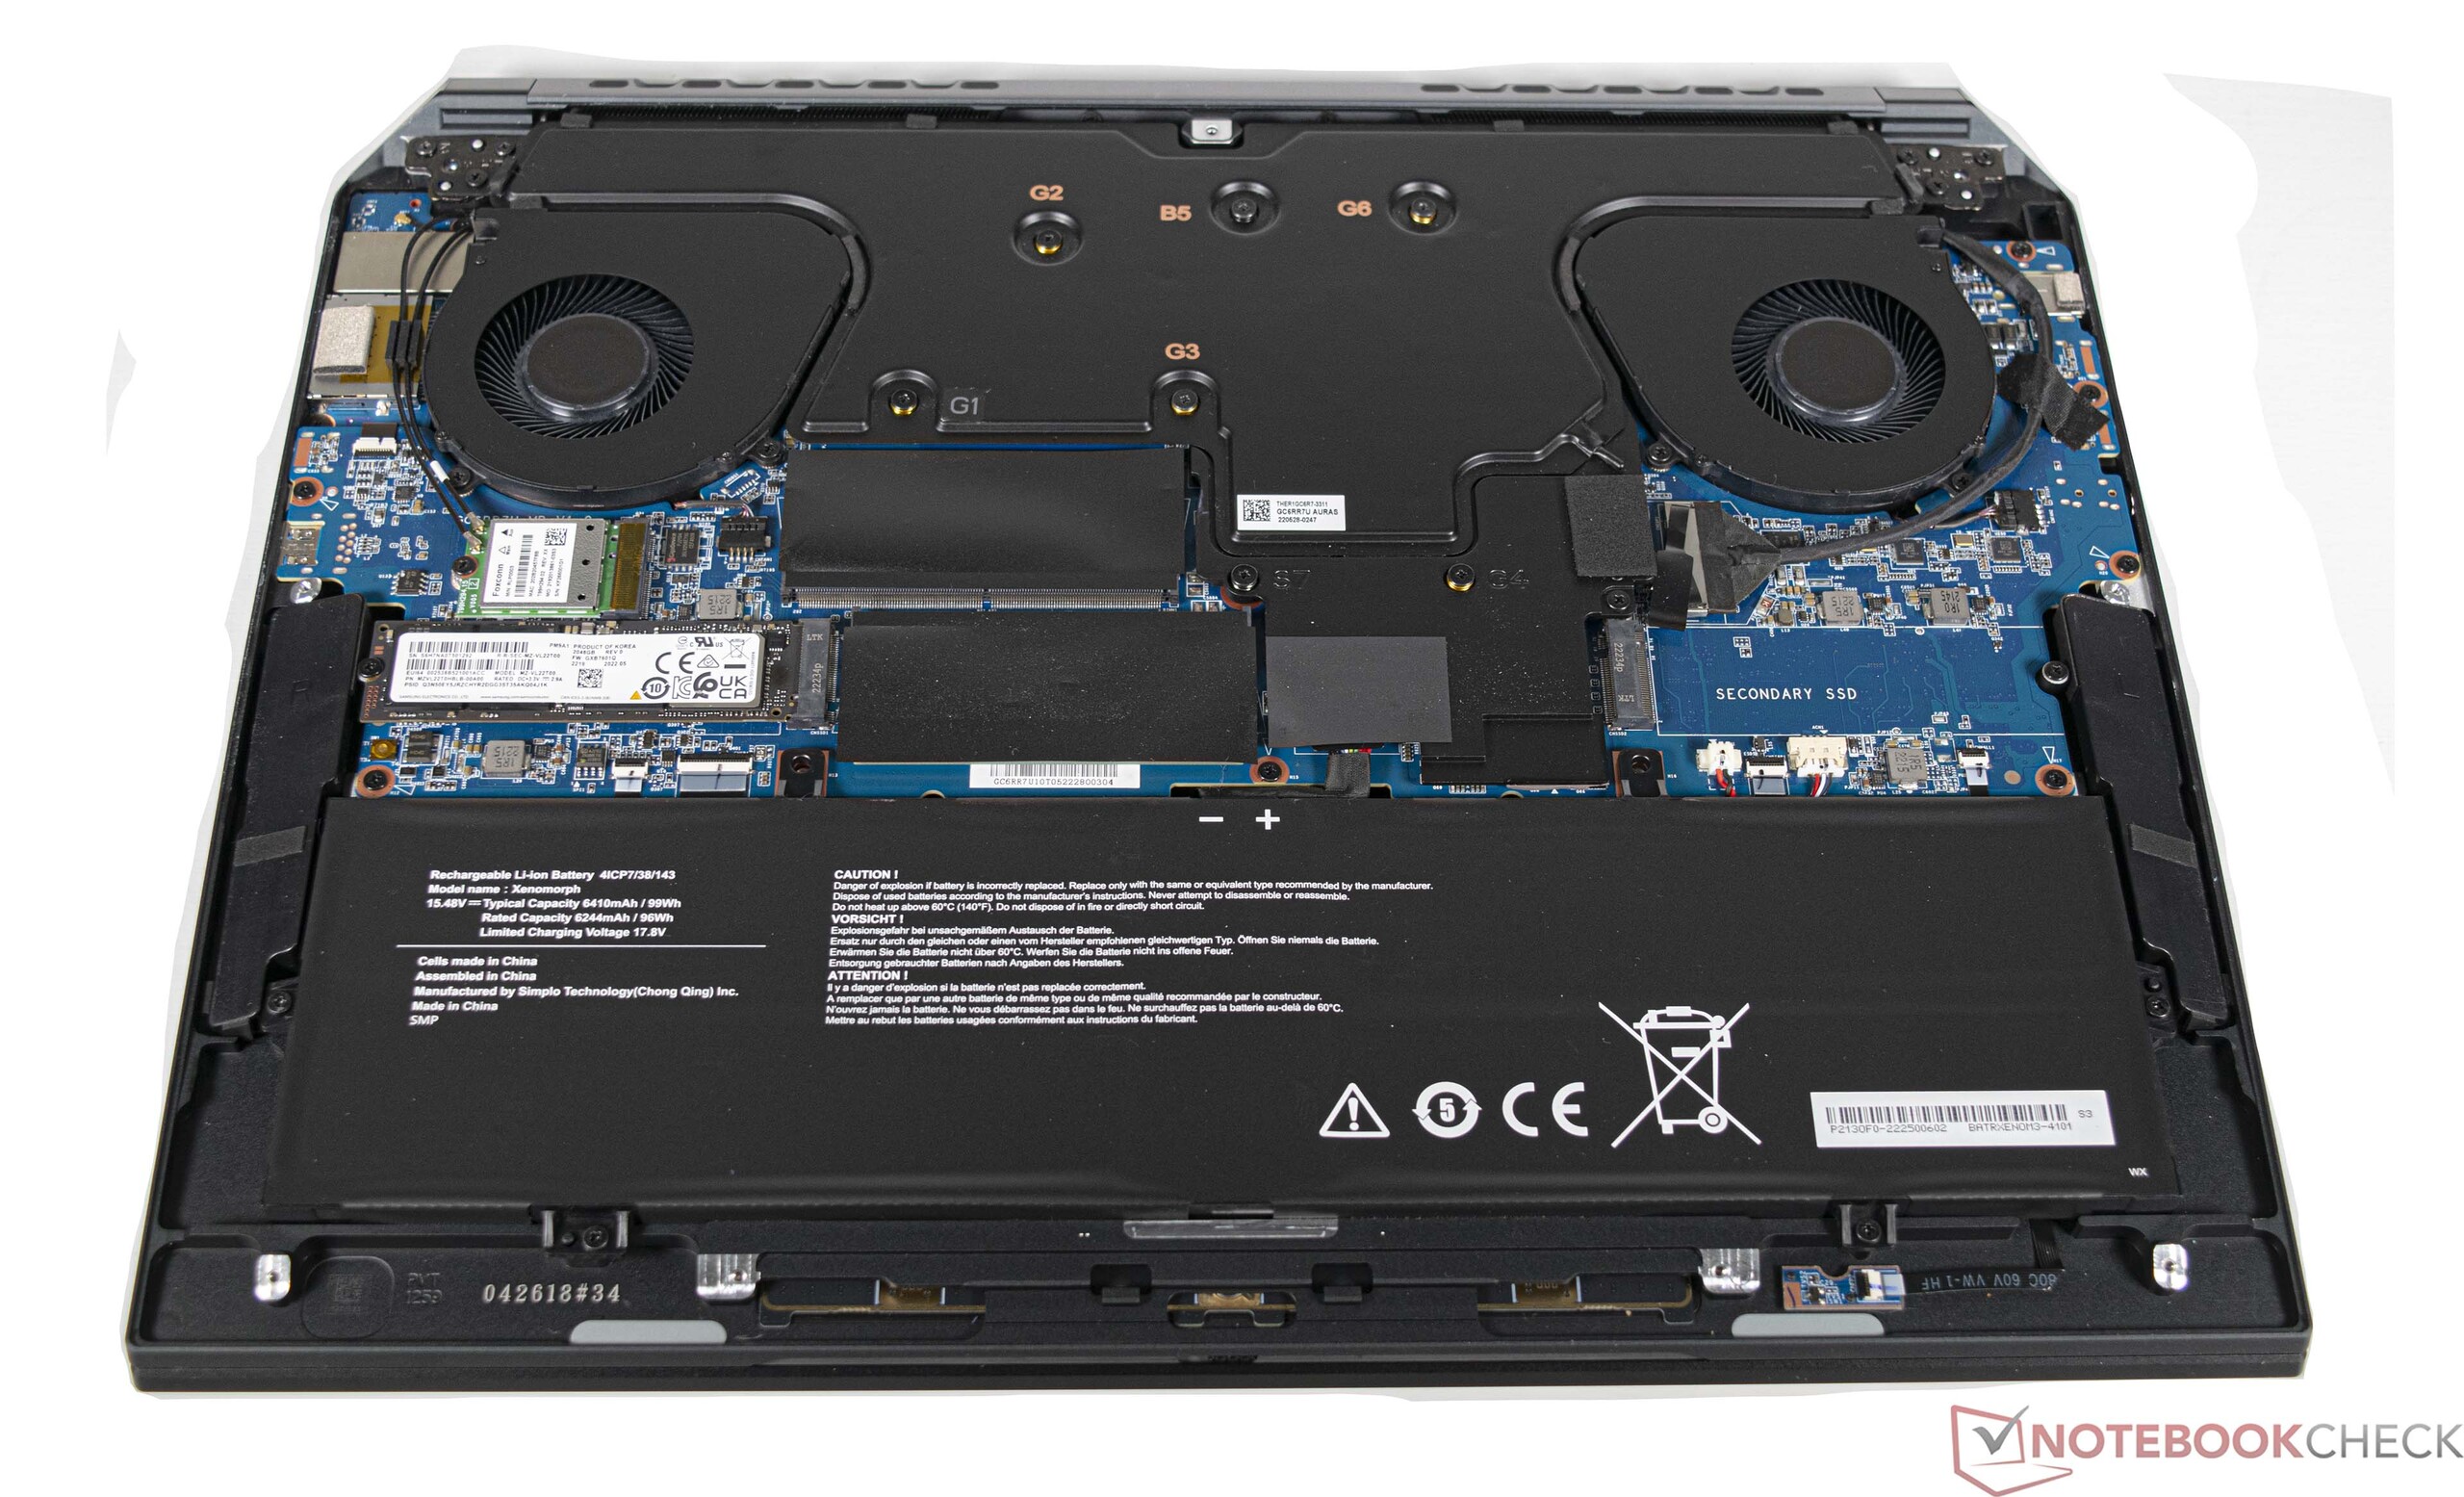
Con un SSD de 2 TB, el Corsair Voyager a1600 ofrece mucho espacio de almacenamiento, lo que es definitivamente necesario debido a su uso previsto. El modelo instalado no puede seguirle el ritmo a la competencia en las pruebas. Sin embargo, las tasas de transferencia son más que suficientes para la mayoría de los usuarios. En la prueba de carga, el rendimiento del SSD es consistente sin restricciones. Por cierto, la placa base del portátil sirve para disipar el calor. Se pueden instalar un total de dos dispositivos de almacenamiento masivo en formato M.2-2280.
Para más comparaciones y benchmarks, consulta nuestra tabla comparativa SSD/HDD de SSD/HDD.

* ... más pequeño es mejor
Continuous Read: DiskSpd Read Loop, Queue Depth 8
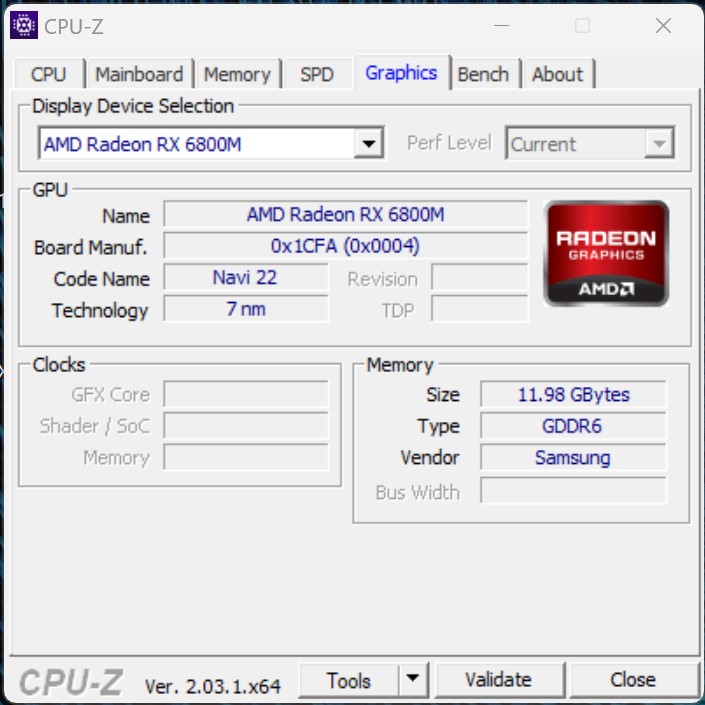
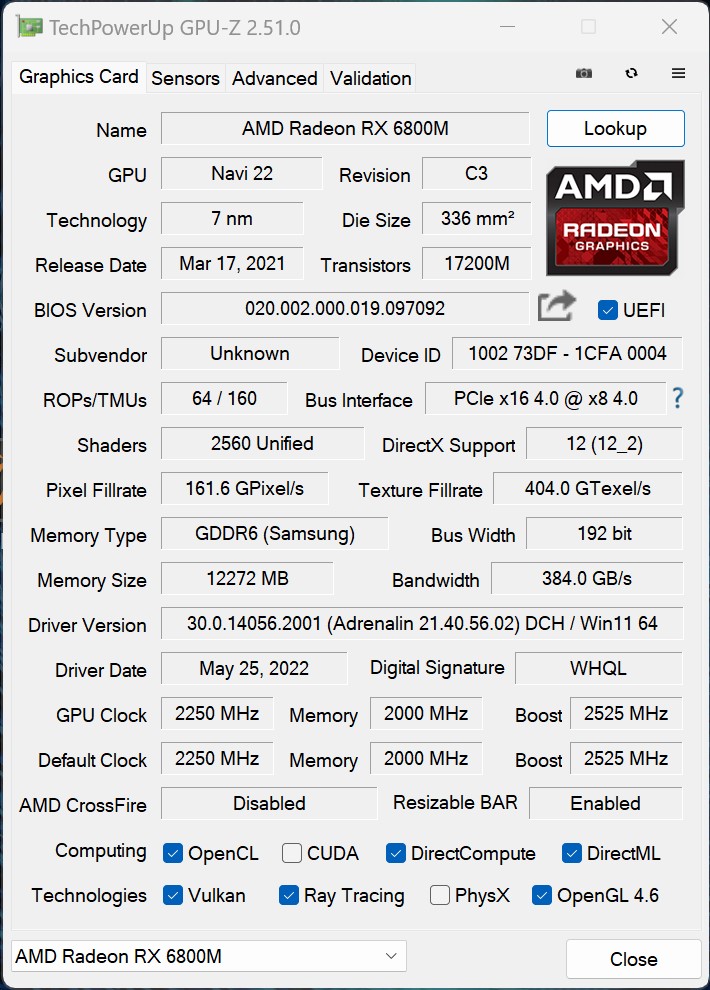
Tarjeta gráfica
La AMD Radeon RX 6800M es una veloz tarjeta gráfica dedicada equipada con 12 GB de VRAM. La actual serie 6000 de AMD para portátiles también ofrece núcleos RT independientes para cálculos de trazado de rayos gracias a RDNA2. En la prueba, la Corsair Voyager a1600 puede ofrecer un buen rendimiento 3D. La diferencia con los competidores con chip gráfico GeForce RTX 3080 Ti es en parte pequeña. Básicamente, el Corsair Voyager a1600 proporciona suficiente rendimiento, que actualmente es suficiente para llevar muchos juegos modernos sin problemas a la pantalla. La CPU siempre obtiene el rendimiento óptimo de la GPU a través de la tecnología Smart Shift de AMD.
En modo 2D, la iGPU del AMD Ryzen 9 6900HS hace el trabajo y así ahorra energía.
Para más comparaciones y pruebas comparativas, consulta nuestroGTabla comparativa de iGPU.
| 3DMark 05 Standard | 57639 puntos | |
| 3DMark 06 Standard Score | 46732 puntos | |
| 3DMark Vantage P Result | 77244 puntos | |
| 3DMark 11 Performance | 30013 puntos | |
| 3DMark Ice Storm Standard Score | 209564 puntos | |
| 3DMark Cloud Gate Standard Score | 59585 puntos | |
| 3DMark Fire Strike Score | 25639 puntos | |
| 3DMark Fire Strike Extreme Score | 13599 puntos | |
| 3DMark Time Spy Score | 10391 puntos | |
ayuda | ||
* ... más pequeño es mejor
| The Witcher 3 | |
| 1920x1080 High Graphics & Postprocessing (Nvidia HairWorks Off) | |
| Media de la clase Gaming (341 - 404, n=2, últimos 2 años) | |
| Lenovo Legion 7 16IAX7-82TD004SGE | |
| Lenovo Legion 7 16ARHA7 | |
| Asus ROG Flow X16 GV601RW-M5082W | |
| Medio AMD Radeon RX 6800M (177.8 - 199, n=2) | |
| HP Omen 16-b1090ng | |
| Acer Predator Triton 500 SE PT516-52s-70KX | |
| Corsair Voyager a1600 | |
| 1920x1080 Ultra Graphics & Postprocessing (HBAO+) | |
| Media de la clase Gaming (104.7 - 240, n=7, últimos 2 años) | |
| Lenovo Legion 7 16ARHA7 | |
| Lenovo Legion 7 16IAX7-82TD004SGE | |
| Medio AMD Radeon RX 6800M (108 - 110, n=2) | |
| Corsair Voyager a1600 | |
| Acer Predator Triton 500 SE PT516-52s-70KX | |
| Asus ROG Flow X16 GV601RW-M5082W | |
| HP Omen 16-b1090ng | |
| F1 2021 | |
| 1920x1080 High Preset AA:T AF:16x | |
| Lenovo Legion 7 16ARHA7 | |
| Acer Predator Triton 500 SE PT516-52s-70KX | |
| Corsair Voyager a1600 | |
| Medio AMD Radeon RX 6800M (187 - 231, n=2) | |
| Lenovo Legion 7 16IAX7-82TD004SGE | |
| 1920x1080 Ultra High Preset + Raytracing AA:T AF:16x | |
| Lenovo Legion 7 16ARHA7 | |
| Corsair Voyager a1600 | |
| Acer Predator Triton 500 SE PT516-52s-70KX | |
| Medio AMD Radeon RX 6800M (114 - 124.1, n=2) | |
| Lenovo Legion 7 16IAX7-82TD004SGE | |
Witcher 3 FPS diagram
| bajo | medio | alto | ultra | QHD | 4K | |
|---|---|---|---|---|---|---|
| GTA V (2015) | 177.1 | 172 | 156.2 | 92.8 | 84 | 85.4 |
| The Witcher 3 (2015) | 309 | 236 | 177.8 | 108 | 59.5 | |
| Dota 2 Reborn (2015) | 146.1 | 126.2 | 125.5 | 114.8 | 95.2 | |
| Final Fantasy XV Benchmark (2018) | 160.8 | 125.6 | 97.5 | 71 | 41.3 | |
| X-Plane 11.11 (2018) | 60 | 50.7 | 45.3 | 28.8 | ||
| Far Cry 5 (2018) | 129 | 113 | 109 | 101 | 100 | 61 |
| Strange Brigade (2018) | 394 | 258 | 229 | 206 | 145 | 77.2 |
| Shadow of the Tomb Raider (2018) | 143.9 | 119.7 | 112.8 | 106.1 | 80.5 | 43.2 |
| Far Cry New Dawn (2019) | 111 | 97 | 94 | 86 | 82 | 62 |
| Metro Exodus (2019) | 205 | 137.4 | 99.8 | 78.7 | 61.4 | 37.1 |
| Borderlands 3 (2019) | 116.1 | 100.1 | 89.2 | 77.6 | 57 | 30.3 |
| F1 2020 (2020) | 305 | 247 | 228 | 172.4 | 127.4 | 70.2 |
| Dirt 5 (2020) | 242 | 154 | 121 | 95 | 76 | 47 |
| F1 2021 (2021) | 342 | 277 | 231 | 124.1 | 88.2 | 47.6 |
| New World (2021) | 122.5 | 103 | 83.7 | 66.2 | 34.1 | |
| Forza Horizon 5 (2021) | 213 | 165 | 159 | 97 | 79 | 50 |
| God of War (2022) | 88.6 | 88.3 | 85.4 | 68.4 | 53 | 33.8 |
| GRID Legends (2022) | 233 | 205 | 171.2 | 144.1 | 115.8 | 72.8 |
| Cyberpunk 2077 1.6 (2022) | 122.5 | 95.5 | 82 | 76.9 | 48.1 | 22.1 |
| Tiny Tina's Wonderlands (2022) | 196.7 | 161.5 | 104.6 | 80.5 | 54.9 | 28.2 |
| F1 22 (2022) | 226 | 226 | 192.3 | 49.7 | 29.9 | 13.8 |
| A Plague Tale Requiem (2022) | 104.9 | 82.5 | 61.4 | 46 | 32.8 | 17.9 |
| Uncharted Legacy of Thieves Collection (2022) | 93.4 | 87.9 | 80.7 | 76.3 | 59.2 | 33.7 |
| Spider-Man Miles Morales (2022) | 90.8 | 94.2 | 88.6 | 82.5 | 63.2 | 38.1 |
Emisiones y energía: no hay que olvidarlas
Emisiones sonoras
Las emisiones de ruido medidas casi muestran un resultado típico para un portátil de juegos. No obstante, los 51.1 dB(A) medidos son altos y subjetivamente se perciben como bastante más altos. La razón es el ruido de alta frecuencia del ventilador. El único remedio es seleccionar el perfil Equilibrado
o Silencioso
. El nivel de ruido baja a 46 y 36 dB(A) respectivamente en el test de estrés.
Ruido
| Ocioso |
| 30.5 / 30.6 / 30.7 dB(A) |
| Carga |
| 44.5 / 51.1 dB(A) |
 | ||
30 dB silencioso 40 dB(A) audible 50 dB(A) ruidosamente alto |
||
min: | ||
| Corsair Voyager a1600 Radeon RX 6800M, R9 6900HS, Samsung PM9A1 MZVL22T0HBLB | Asus ROG Flow X16 GV601RW-M5082W GeForce RTX 3070 Ti Laptop GPU, R9 6900HS, Micron 3400 1TB MTFDKBA1T0TFH | Lenovo Legion 7 16ARHA7 Radeon RX 6850M XT, R9 6900HX, Samsung PM9A1 MZVL22T0HBLB | Acer Predator Triton 500 SE PT516-52s-70KX GeForce RTX 3080 Ti Laptop GPU, i7-12700H, Micron 3400 1TB MTFDKBA1T0TFH | HP Omen 16-b1090ng GeForce RTX 3070 Ti Laptop GPU, i7-12700H, WDC PC SN810 1TB | Lenovo Legion 7 16IAX7-82TD004SGE GeForce RTX 3080 Ti Laptop GPU, i9-12900HX, Micron 3400 1TB MTFDKBA1T0TFH | |
|---|---|---|---|---|---|---|
| Noise | 7% | 22% | 0% | -3% | 5% | |
| apagado / medio ambiente * (dB) | 29.9 | 25.5 15% | 22.8 24% | 26 13% | 26 13% | 24.5 18% |
| Idle Minimum * (dB) | 30.5 | 25.5 16% | 23 25% | 26 15% | 30 2% | 24.5 20% |
| Idle Average * (dB) | 30.6 | 25.5 17% | 23 25% | 29 5% | 31 -1% | 30 2% |
| Idle Maximum * (dB) | 30.7 | 27.4 11% | 23 25% | 34 -11% | 33 -7% | 32.5 -6% |
| Load Average * (dB) | 44.5 | 49.9 -12% | 26.8 40% | 50 -12% | 49 -10% | 43.9 1% |
| Load Maximum * (dB) | 51.1 | 55 -8% | 54.2 -6% | 56 -10% | 57 -12% | 54.2 -6% |
| Witcher 3 ultra * (dB) | 54.3 | 53 | 53 | 48.8 |
* ... más pequeño es mejor
Temperatura
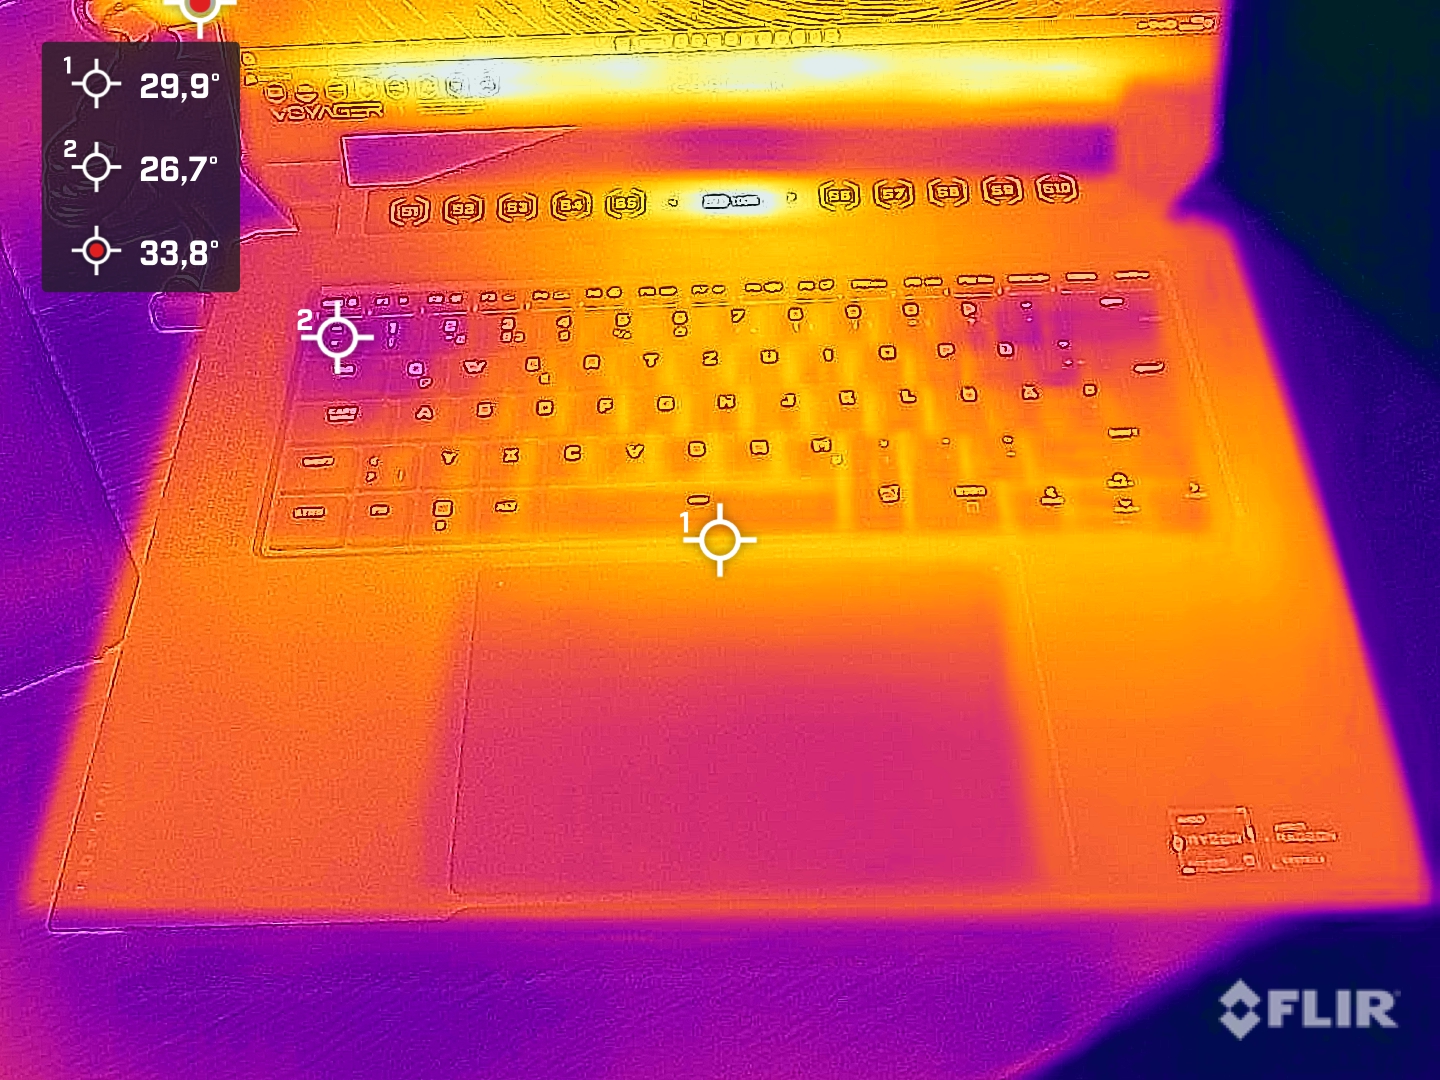
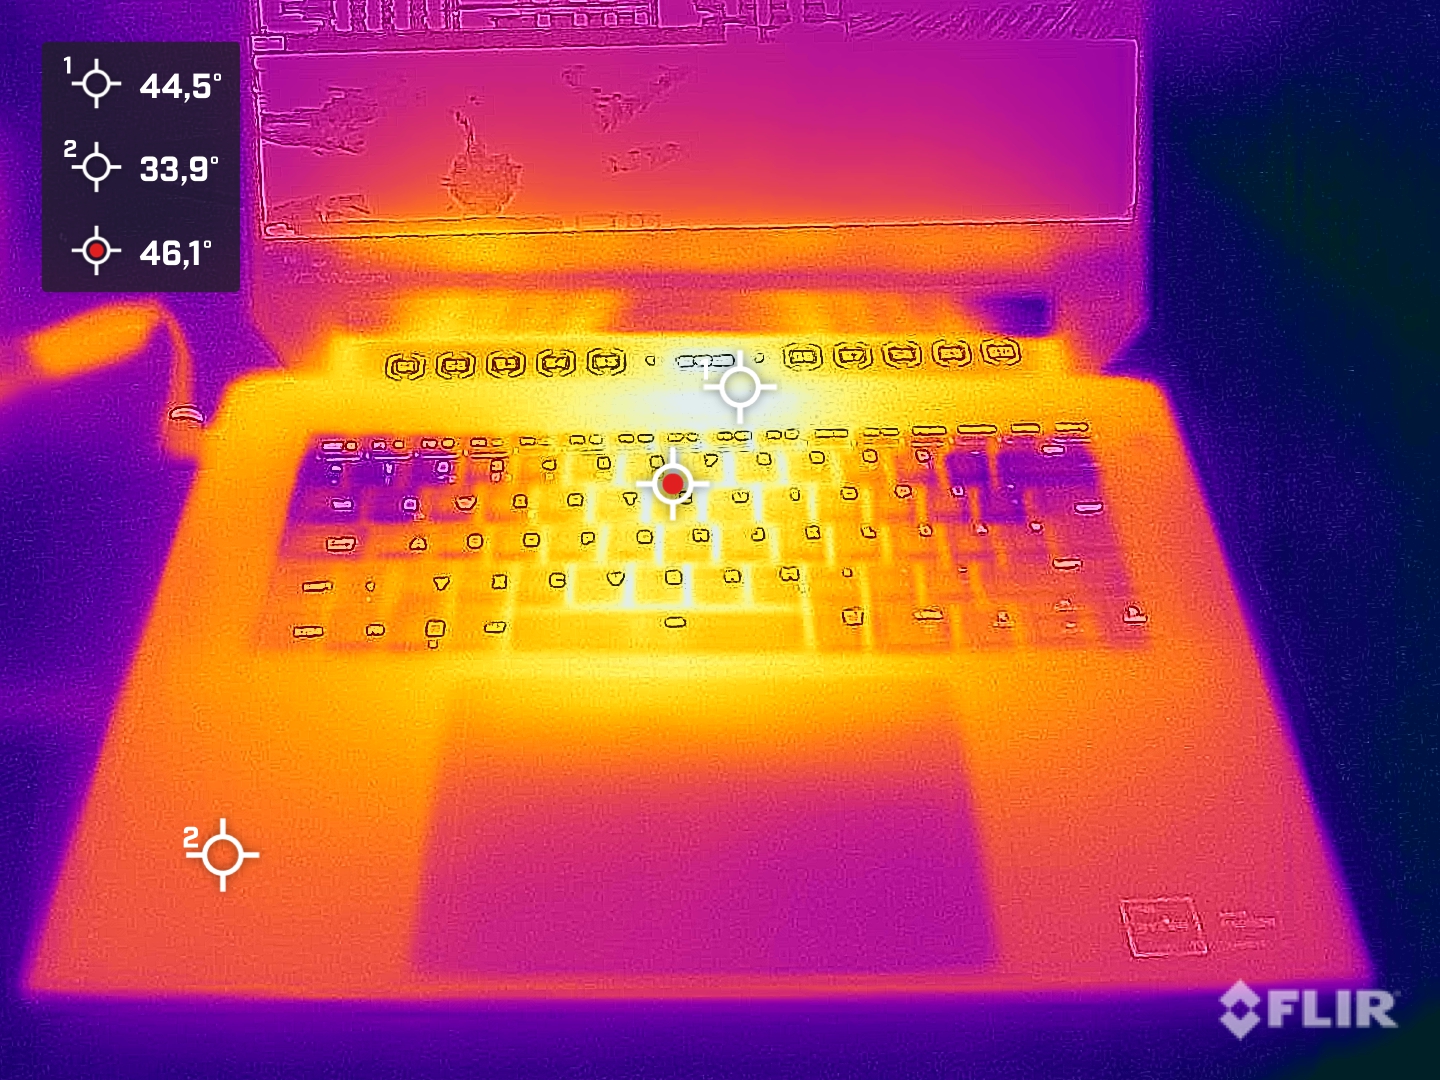
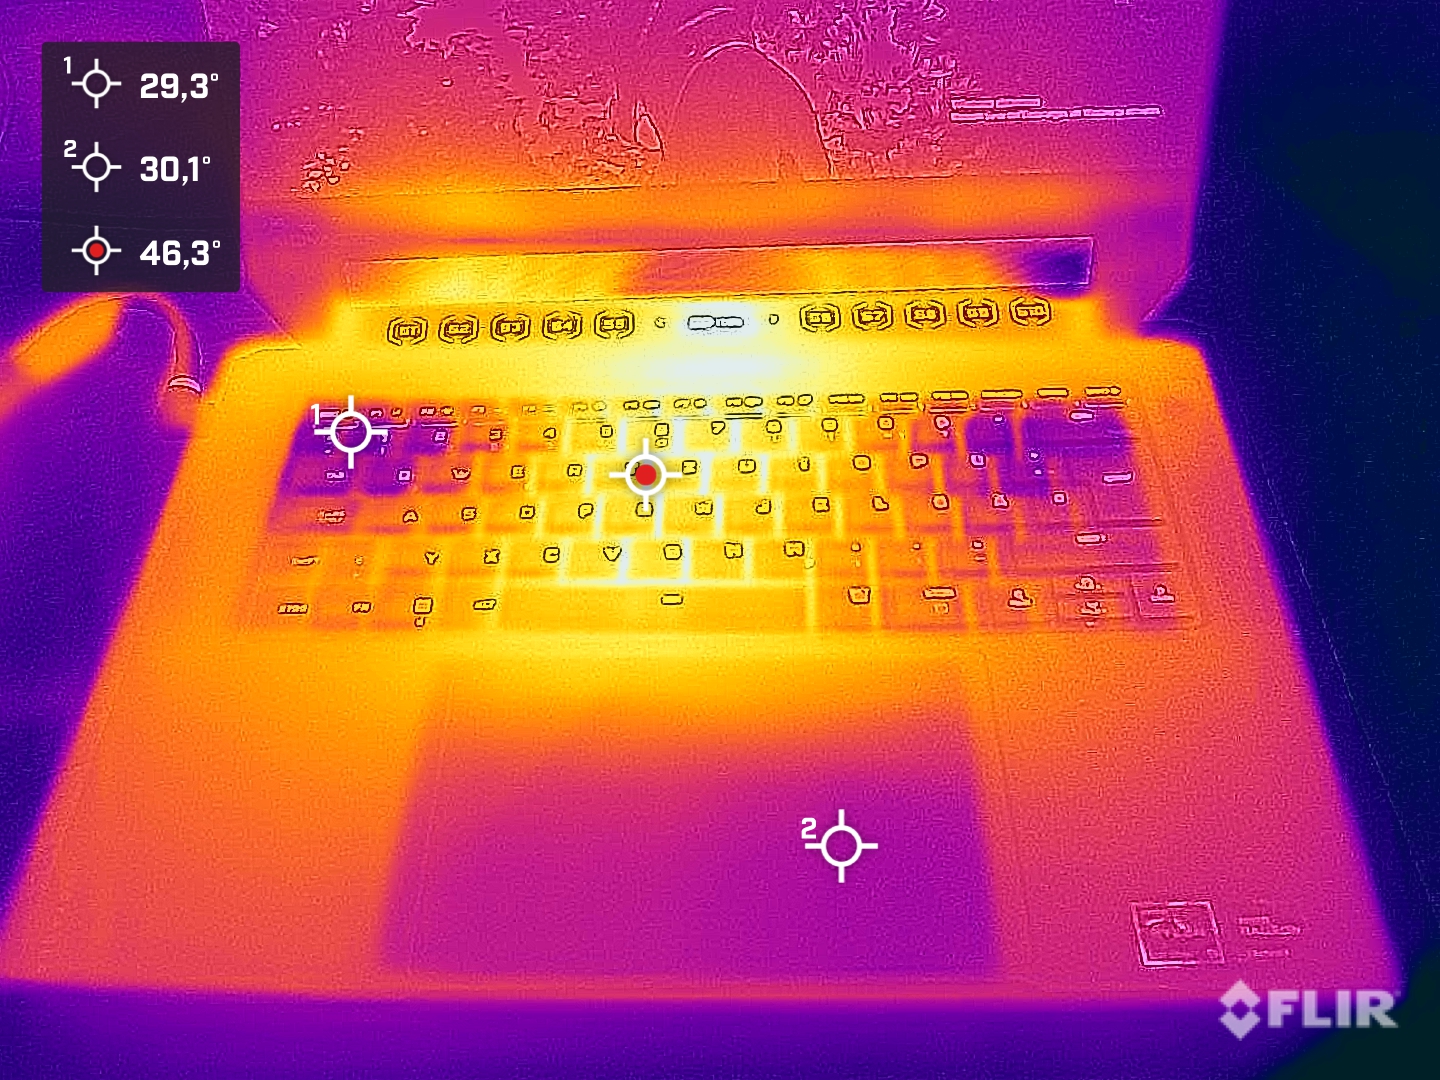
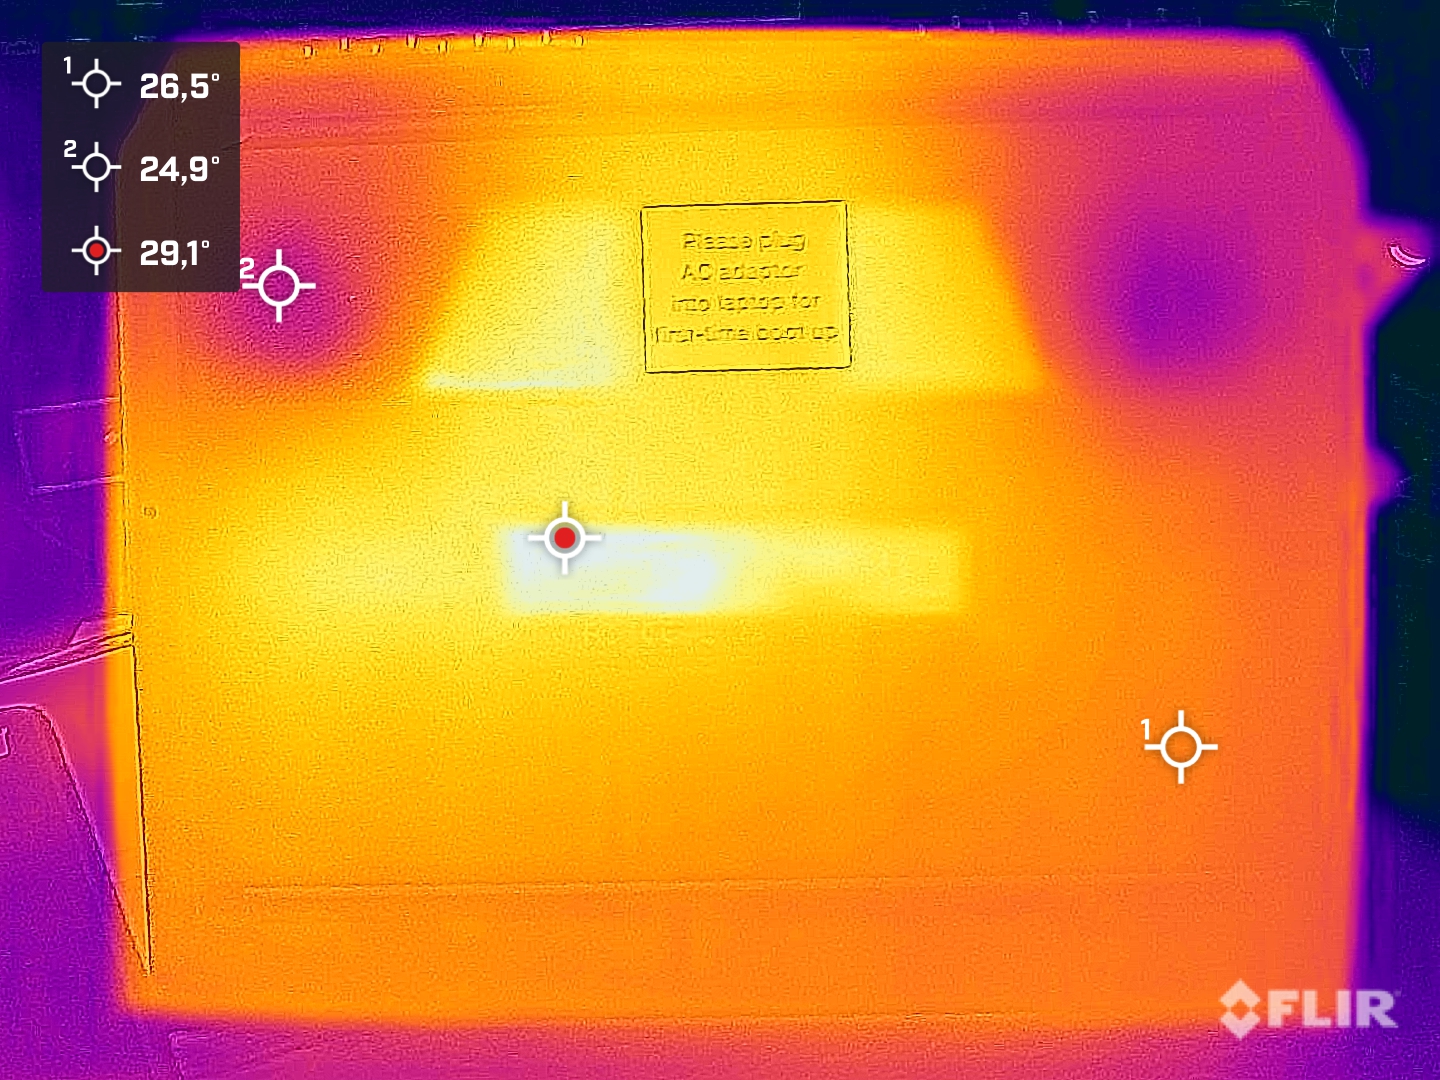
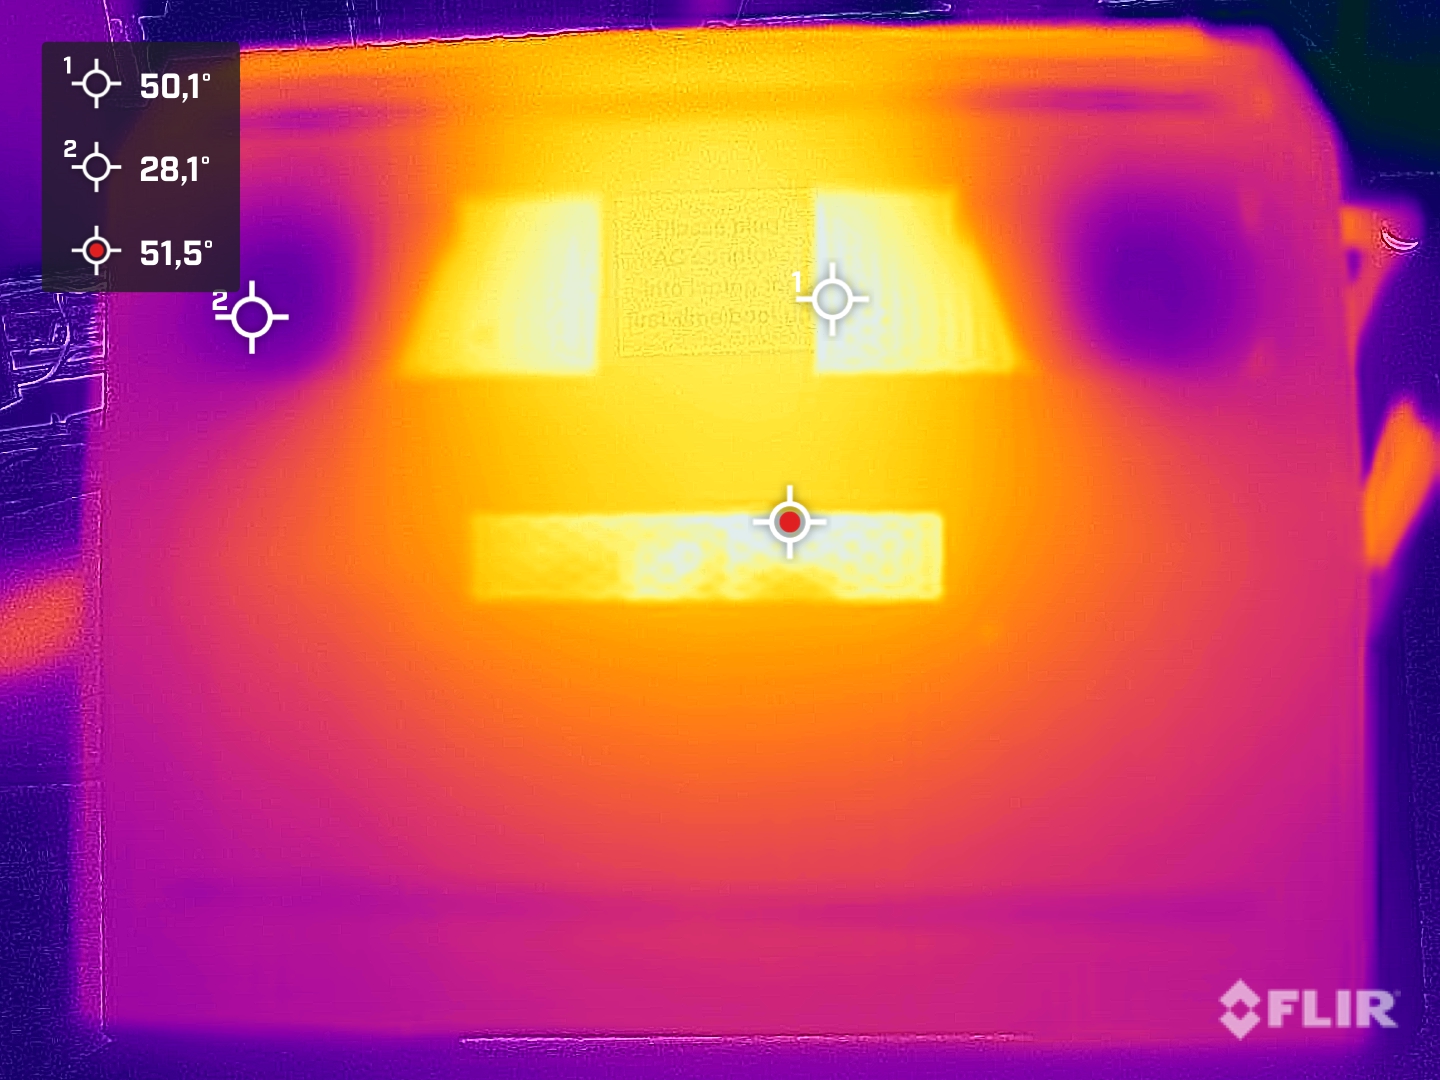
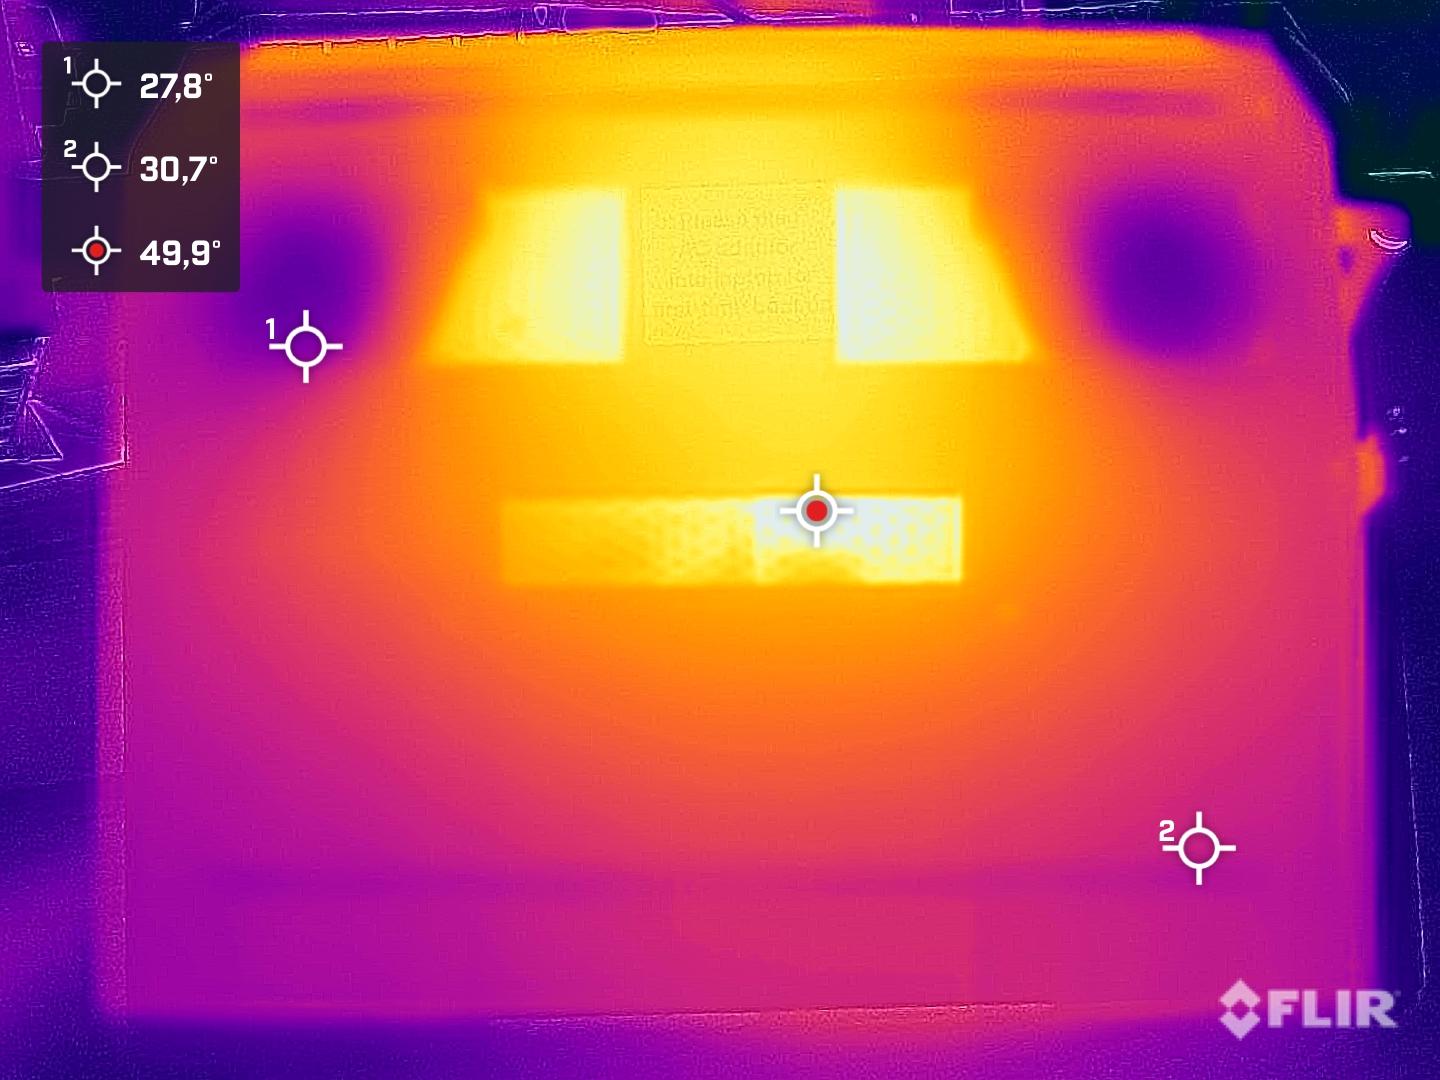
Medimos el punto más caliente en la parte inferior de la carcasa con hasta 54 °C en el test de estrés. Sin embargo, la carcasa también se calienta bastante en la parte superior con algo más de 50 °C. La temperatura de la carcasa sólo cae ligeramente de 1 a 2 °C durante los juegos.
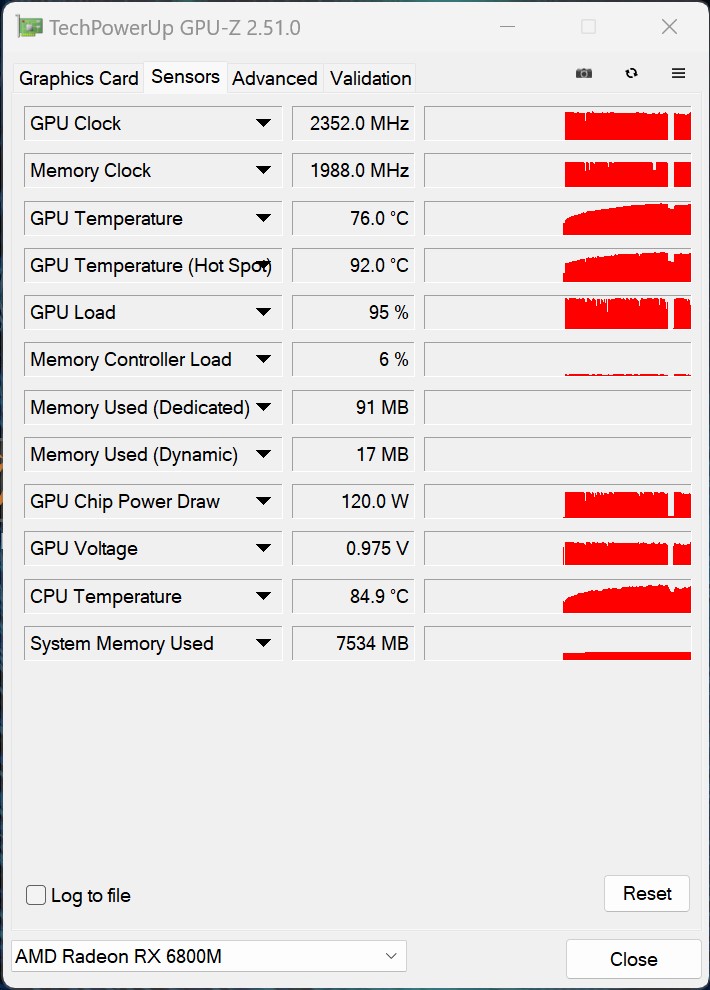
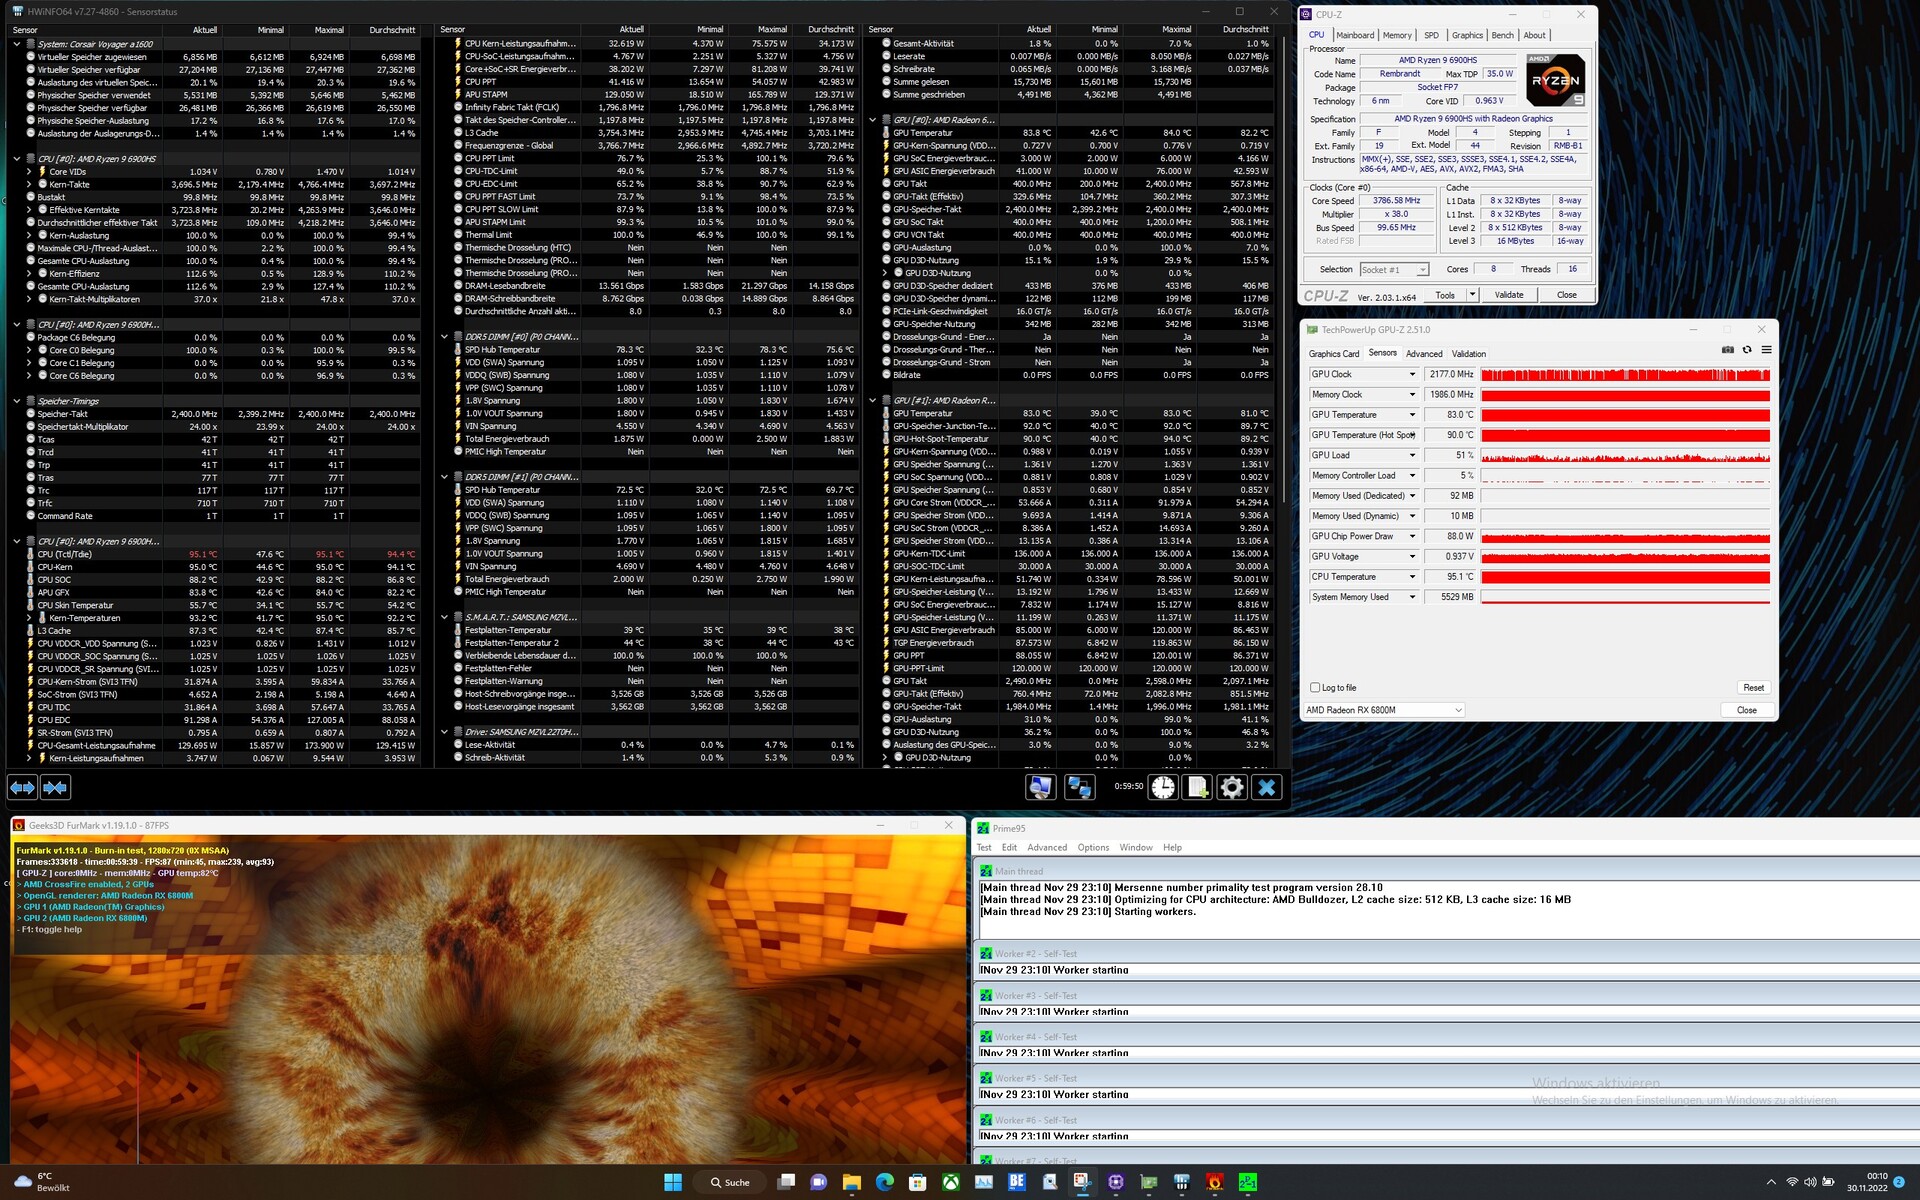
Durante el test de estrés, las temperaturas de CPU y GPU suben a 95 y 83 °C, respectivamente. Sin embargo, el SoC sigue funcionando a 3.7 GHz de media. La GPU AMD también alcanza frecuencias altas con algo menos de 2.2 GHz. Corsair usa un gran sistema de ventilación con una cámara de vapor y dos ventiladores.
(-) La temperatura máxima en la parte superior es de 50.7 °C / 123 F, frente a la media de 40.4 °C / 105 F, que oscila entre 21.2 y 68.8 °C para la clase Gaming.
(-) El fondo se calienta hasta un máximo de 54.2 °C / 130 F, frente a la media de 43.2 °C / 110 F
(+) En reposo, la temperatura media de la parte superior es de 31.5 °C / 89# F, frente a la media del dispositivo de 33.9 °C / 93 F.
(±) Jugando a The Witcher 3, la temperatura media de la parte superior es de 36.6 °C / 98 F, frente a la media del dispositivo de 33.9 °C / 93 F.
(+) Los reposamanos y el panel táctil alcanzan como máximo la temperatura de la piel (34 °C / 93.2 F) y, por tanto, no están calientes.
(-) La temperatura media de la zona del reposamanos de dispositivos similares fue de 28.8 °C / 83.8 F (-5.2 °C / -9.4 F).
| Corsair Voyager a1600 AMD Ryzen 9 6900HS, AMD Radeon RX 6800M | Asus ROG Flow X16 GV601RW-M5082W AMD Ryzen 9 6900HS, NVIDIA GeForce RTX 3070 Ti Laptop GPU | Lenovo Legion 7 16ARHA7 AMD Ryzen 9 6900HX, AMD Radeon RX 6850M XT | Acer Predator Triton 500 SE PT516-52s-70KX Intel Core i7-12700H, NVIDIA GeForce RTX 3080 Ti Laptop GPU | HP Omen 16-b1090ng Intel Core i7-12700H, NVIDIA GeForce RTX 3070 Ti Laptop GPU | Lenovo Legion 7 16IAX7-82TD004SGE Intel Core i9-12900HX, NVIDIA GeForce RTX 3080 Ti Laptop GPU | |
|---|---|---|---|---|---|---|
| Heat | -3% | 14% | 8% | 14% | -3% | |
| Maximum Upper Side * (°C) | 50.7 | 55.1 -9% | 37.2 27% | 47 7% | 41 19% | 44.4 12% |
| Maximum Bottom * (°C) | 54.2 | 50.3 7% | 43 21% | 49 10% | 62 -14% | 60.8 -12% |
| Idle Upper Side * (°C) | 35.8 | 35.5 1% | 34 5% | 31 13% | 25 30% | 33.8 6% |
| Idle Bottom * (°C) | 33 | 36.1 -9% | 32.8 1% | 32 3% | 26 21% | 38.8 -18% |
* ... más pequeño es mejor
Altavoz
Los dos altavoces están situados bajo los reposamuñecas. Sin embargo, el sonido se dirige hacia arriba por las rejillas de los altavoces situadas junto al teclado. Como suele ocurrir, los dos altavoces carecen de graves, por lo que predominan claramente los medios y agudos. No obstante, recomendamos utilizar unos auriculares para jugar. Estos pueden conectarse al portátil por USB mediante la toma de 3,5 mm o a través de Slipstream.
Corsair Voyager a1600 análisis de audio
(-) | altavoces no muy altos (#69 dB)
Graves 100 - 315 Hz
(±) | lubina reducida - en promedio 10.2% inferior a la mediana
(±) | la linealidad de los graves es media (13.7% delta a frecuencia anterior)
Medios 400 - 2000 Hz
(±) | medias más altas - de media 7.8% más altas que la mediana
(±) | la linealidad de los medios es media (7% delta respecto a la frecuencia anterior)
Altos 2 - 16 kHz
(+) | máximos equilibrados - a sólo 1.8% de la mediana
(±) | la linealidad de los máximos es media (11.4% delta a frecuencia anterior)
Total 100 - 16.000 Hz
(±) | la linealidad del sonido global es media (25.5% de diferencia con la mediana)
En comparación con la misma clase
» 91% de todos los dispositivos probados de esta clase eran mejores, 2% similares, 7% peores
» El mejor tuvo un delta de 6%, la media fue 18%, el peor fue ###max##%
En comparación con todos los dispositivos probados
» 78% de todos los dispositivos probados eran mejores, 4% similares, 17% peores
» El mejor tuvo un delta de 4%, la media fue 23%, el peor fue ###max##%
Asus ROG Flow X16 GV601RW-M5082W análisis de audio
(±) | la sonoridad del altavoz es media pero buena (80.7 dB)
Graves 100 - 315 Hz
(±) | lubina reducida - en promedio 12.7% inferior a la mediana
(±) | la linealidad de los graves es media (13.8% delta a frecuencia anterior)
Medios 400 - 2000 Hz
(+) | medios equilibrados - a sólo 1.3% de la mediana
(+) | los medios son lineales (4.7% delta a la frecuencia anterior)
Altos 2 - 16 kHz
(±) | máximos más altos - de media 6.4% más altos que la mediana
(+) | los máximos son lineales (6.8% delta a la frecuencia anterior)
Total 100 - 16.000 Hz
(+) | el sonido global es lineal (12.9% de diferencia con la mediana)
En comparación con la misma clase
» 17% de todos los dispositivos probados de esta clase eran mejores, 4% similares, 79% peores
» El mejor tuvo un delta de 6%, la media fue 18%, el peor fue ###max##%
En comparación con todos los dispositivos probados
» 12% de todos los dispositivos probados eran mejores, 3% similares, 85% peores
» El mejor tuvo un delta de 4%, la media fue 23%, el peor fue ###max##%
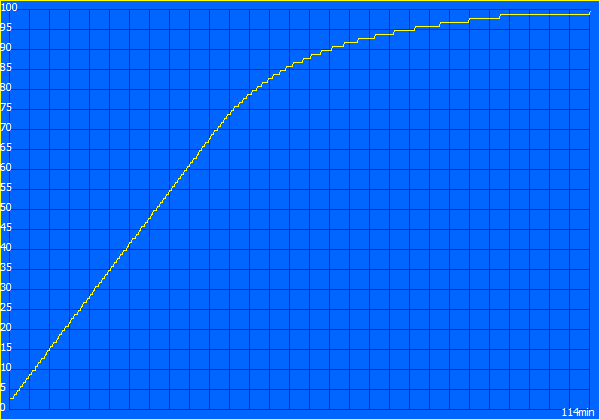
Consumo de energía
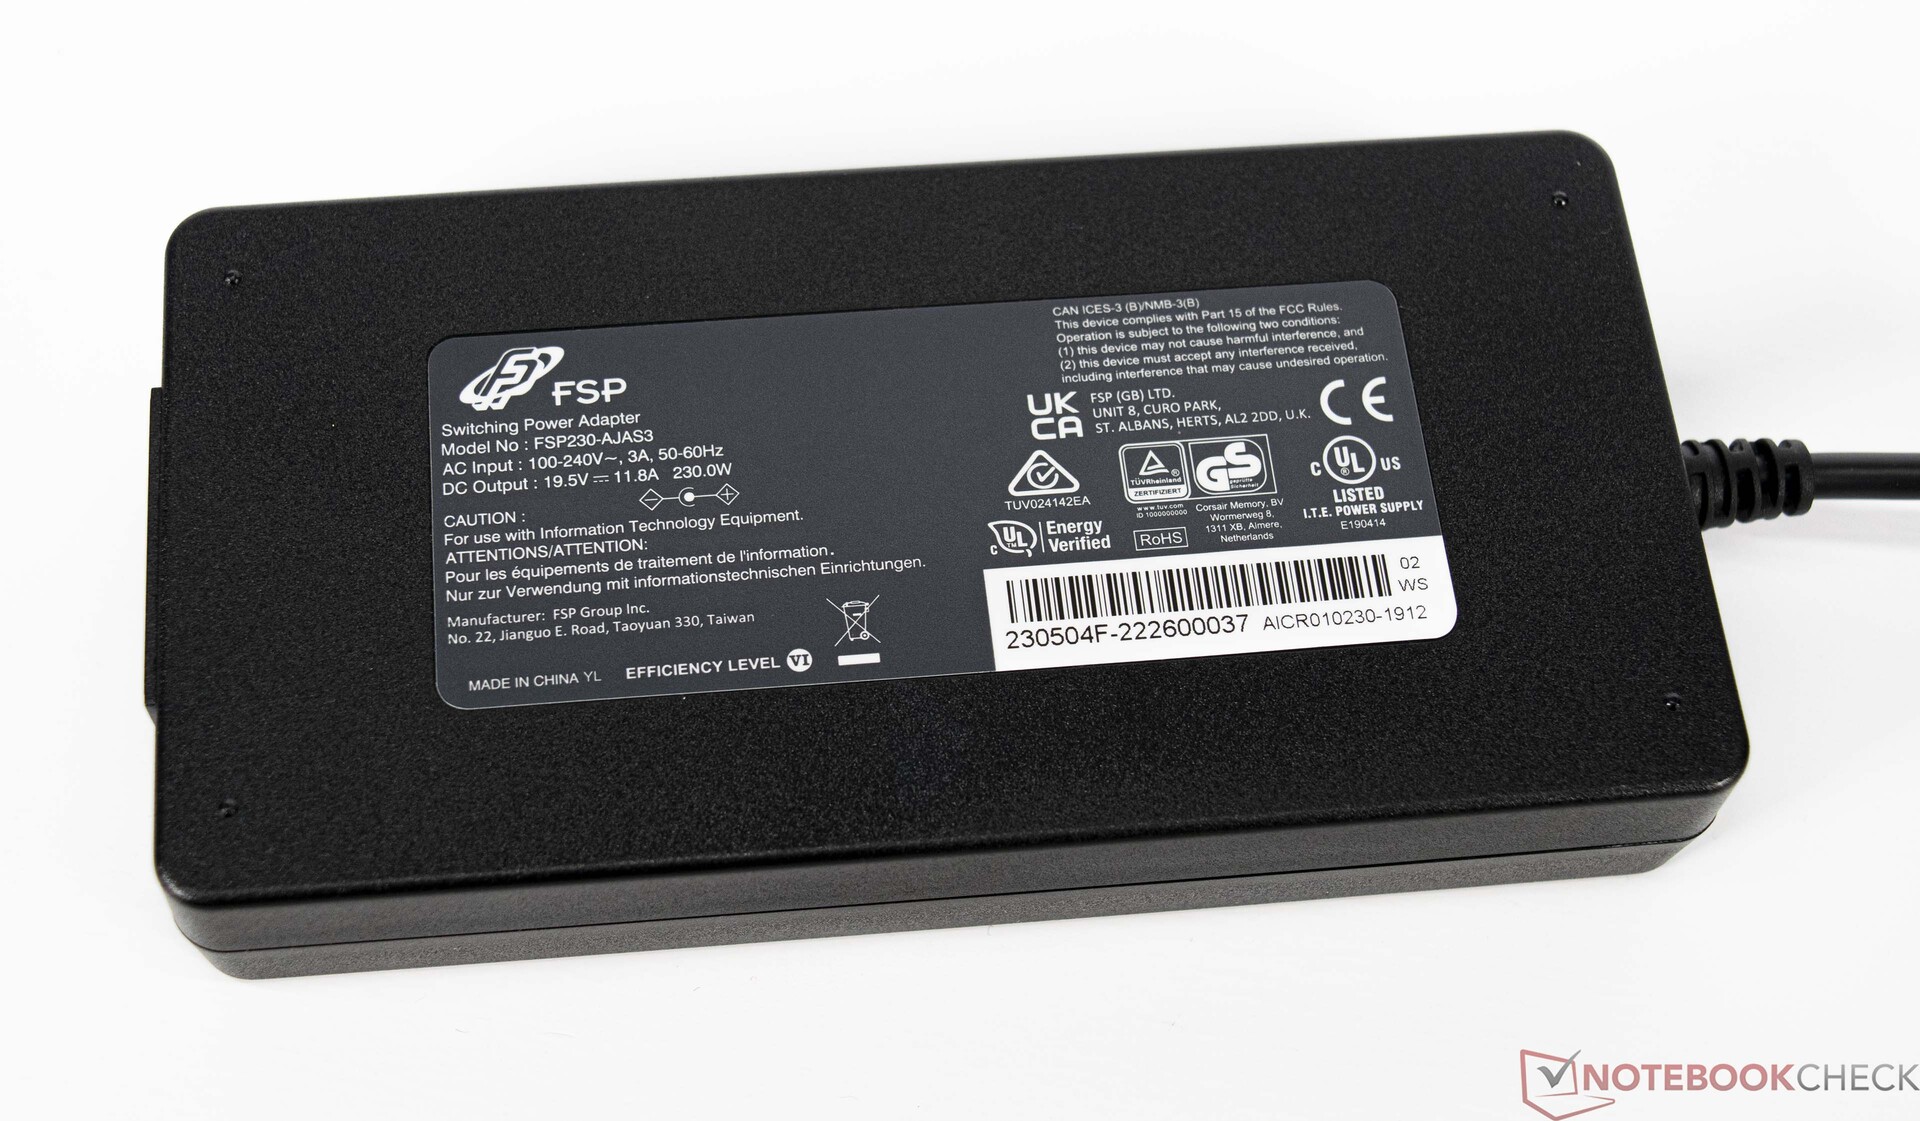
En cuanto al consumo de energía, medimos entre 16 y 22 vatios en reposo. Bajo carga media, registramos unos 133 vatios, aunque se alcanzan picos de hasta 258 vatios. Según las especificaciones, la fuente de alimentación puede proporcionar 230 vatios. Sin embargo, los picos de carga más altos no dieron problemas en la prueba. La batería no se descargó adicionalmente durante la prueba de estrés.
| Off / Standby | |
| Ocioso | |
| Carga |
|
Clave:
min: | |
Energy consumption Witcher 3 / stress test
Energy consumption with an external monitor
Duración de la batería
Con 99 Wh, Corsair agota el máximo en términos de capacidad de batería. Debido al relativamente alto consumo de energía en inactivo, el dispositivo queda por detrás de la competencia en inactivo. Sin embargo, el Legion 7 de Lenovo puntúa incluso peor. Dicho esto, el Voyager a1600 logra una autonomía pasable de algo menos de 6 horas en la prueba WLAN. El brillo de la pantalla fue del 52 por ciento en esta prueba, lo que corresponde a las condiciones generales de 150 cd/m². Corsair también reduce notablemente el rendimiento de la CPU y la GPU en modo batería.
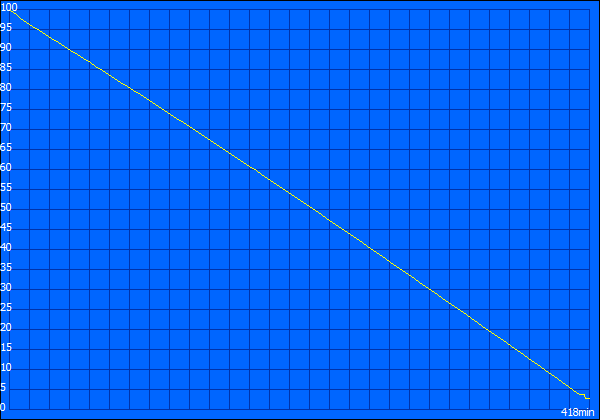
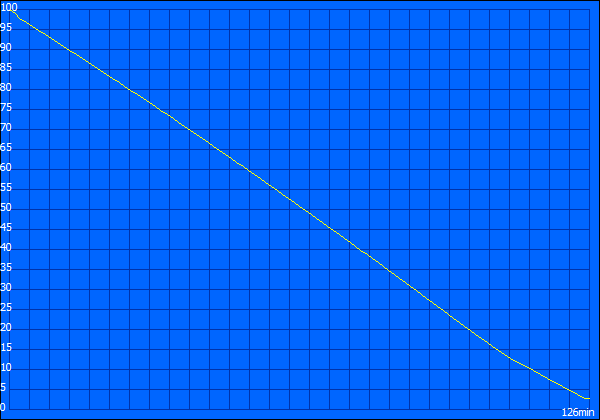
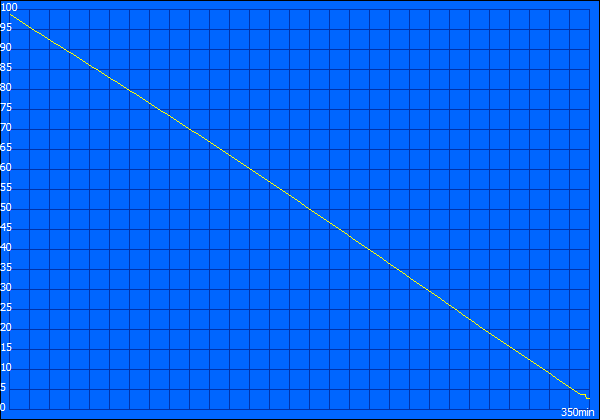

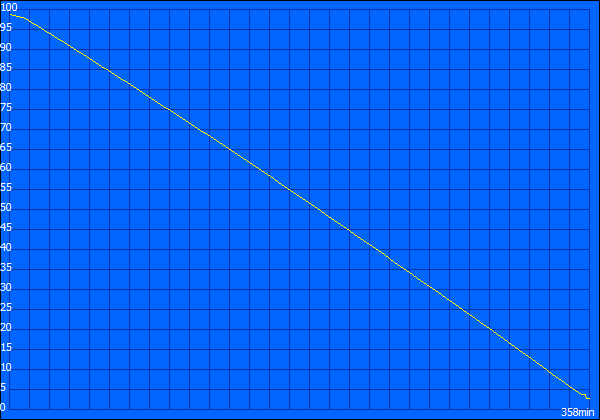
| Corsair Voyager a1600 R9 6900HS, Radeon RX 6800M, 99 Wh | Asus ROG Flow X16 GV601RW-M5082W R9 6900HS, GeForce RTX 3070 Ti Laptop GPU, 90 Wh | Lenovo Legion 7 16ARHA7 R9 6900HX, Radeon RX 6850M XT, 99 Wh | Acer Predator Triton 500 SE PT516-52s-70KX i7-12700H, GeForce RTX 3080 Ti Laptop GPU, 99.98 Wh | HP Omen 16-b1090ng i7-12700H, GeForce RTX 3070 Ti Laptop GPU, 83 Wh | Lenovo Legion 7 16IAX7-82TD004SGE i9-12900HX, GeForce RTX 3080 Ti Laptop GPU, 99 Wh | Media de la clase Gaming | |
|---|---|---|---|---|---|---|---|
| Duración de Batería | -30% | -6% | 13% | 10% | -35% | 13% | |
| Reader / Idle (h) | 7 | 4.9 -30% | 10.1 44% | 8.27 ? 18% | |||
| H.264 (h) | 6 | 8.2 37% | 5.1 -15% | 8.32 ? 39% | |||
| WiFi v1.3 (h) | 5.8 | 5.7 -2% | 7.3 26% | 5.7 -2% | 5.6 -3% | 4.5 -22% | 7.11 ? 23% |
| Load (h) | 2.1 | 0.9 -57% | 1.8 -14% | 2.2 5% | 1.9 -10% | 0.7 -67% | 1.502 ? -28% |
| Witcher 3 ultra (h) | 0.9 | 0.9 |
Pro
Contra
Veredicto - Un portátil versátil para jugar y hacer streaming
Corsair ha creado un dispositivo realmente genial con el Voyager a1600. La combinación de SoC AMD y GPU AMD es buena y resulta bastante convincente en la prueba. A menudo tiene que admitir la derrota en el duelo directo con el SoC actual de Intel. Sin embargo, las diferencias de rendimiento no son realmente notables. El Voyager a1600 parece particularmente de gama alta debido a la selección de materiales, que también da al dispositivo muy buena estabilidad. El dispositivo no parece tosco en absoluto
La conectividad resulta un poco espartana a primera vista. Sin embargo, aquellos que confían en la tecnología Slipstream para conectar periféricos apenas echarán de menos la ausencia de puertos USB Tipo-A.
El rendimiento del AMD Ryzen 9 6900HS es bueno y constante, sin grandes pérdidas de rendimiento bajo carga. Lo mismo podemos decir de la Radeon RX 6800M de AMD. Nos gustó la pantalla de formato 16:10. Los únicos inconvenientes son el brillo algo bajo y la cobertura del espacio de color no del todo perfecta en los espacios de color AdobeRGB y P3, que descartan el uso profesional para la edición de vídeo o fotos. Como portátil para juegos, sin embargo, el Corsair Voyager a1600 puede prescindir fácilmente de ellos.
El Corsair Voyager a1600 es más que un portátil de juego puro, ya que sus grandes características lo convierten en el dispositivo perfecto para streamers y creadores de contenidos.
Sin embargo, con las características únicas de streaming, el Voyager a1600 será recordado. Los botones de inicio rápido, que se pueden asignar como se desee, convienen a los streamers y se puede prescindir de una pletina de streaming adicional. Dicho esto, debido al uso previsto, habríamos deseado una cámara de mayor calidad que no sólo sirviera como solución móvil de emergencia. El mayor inconveniente de la Corsair Voyager a1600 es la unidad de refrigeración integrada. Las temperaturas se mantienen dentro de los límites bajo carga, sin duda, pero aún así, el nivel de ruido medido es demasiado alto a máximo rendimiento. Los que renuncien al modo Extreme se verán recompensados con bajas emisiones, pero también cederán algo de rendimiento al mismo tiempo.
Precio y disponibilidad
El Corsair Voyager a1600 está disponible directamente en la tienda de Corsair https://www.corsair.com/de/de/Kategorien/Produkte/Gaming-Laptops/CORSAIR-VOYAGER-Gaming-Notebook/p/CN-9000006-DE#tab-overview donde hay que pagar 3.550 euros por la configuración probada. Alternativamente, Amazon vende el mismo modelo por actualmente 3,540 Euros. La configuración más barata con un Ryzen 7 6800HS y 16 GB de RAM también está disponible en Amazon por 2,725 Euros.
Corsair Voyager a1600
- 12/05/2022 v7 (old)
Sebastian Bade
Price comparison
