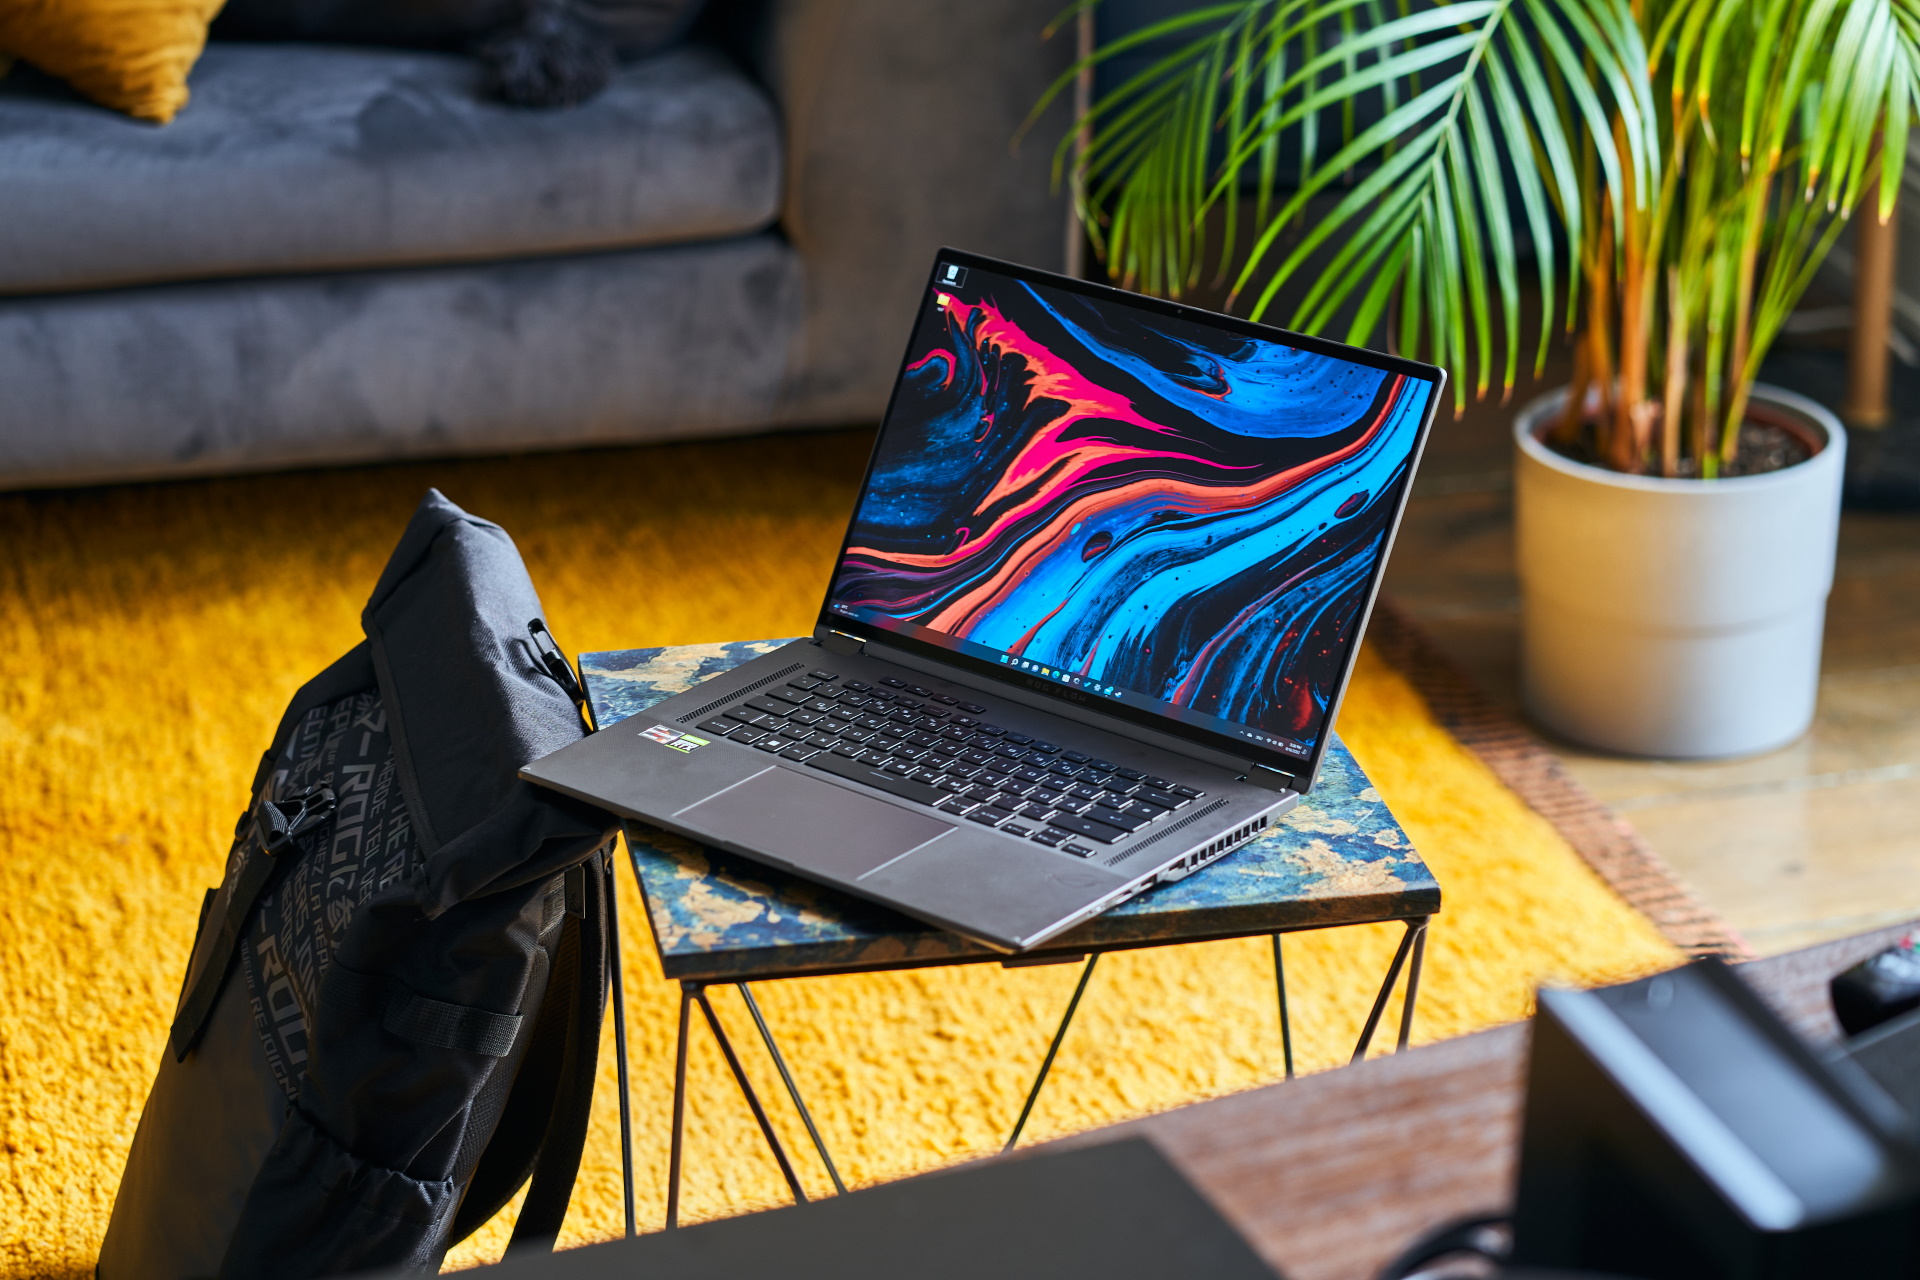
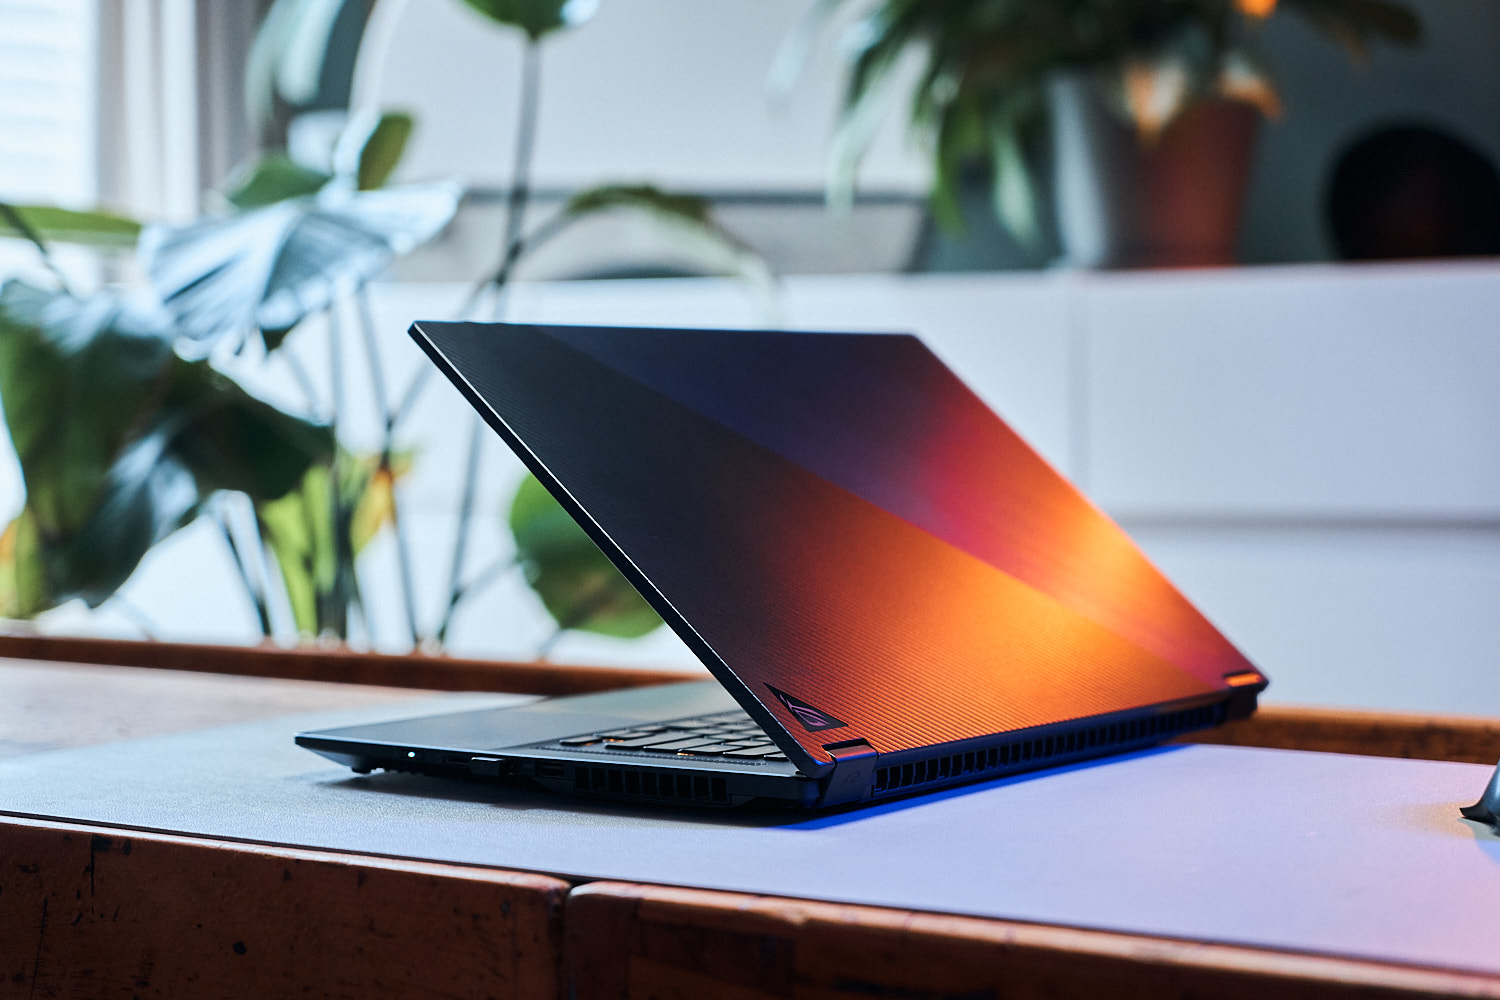
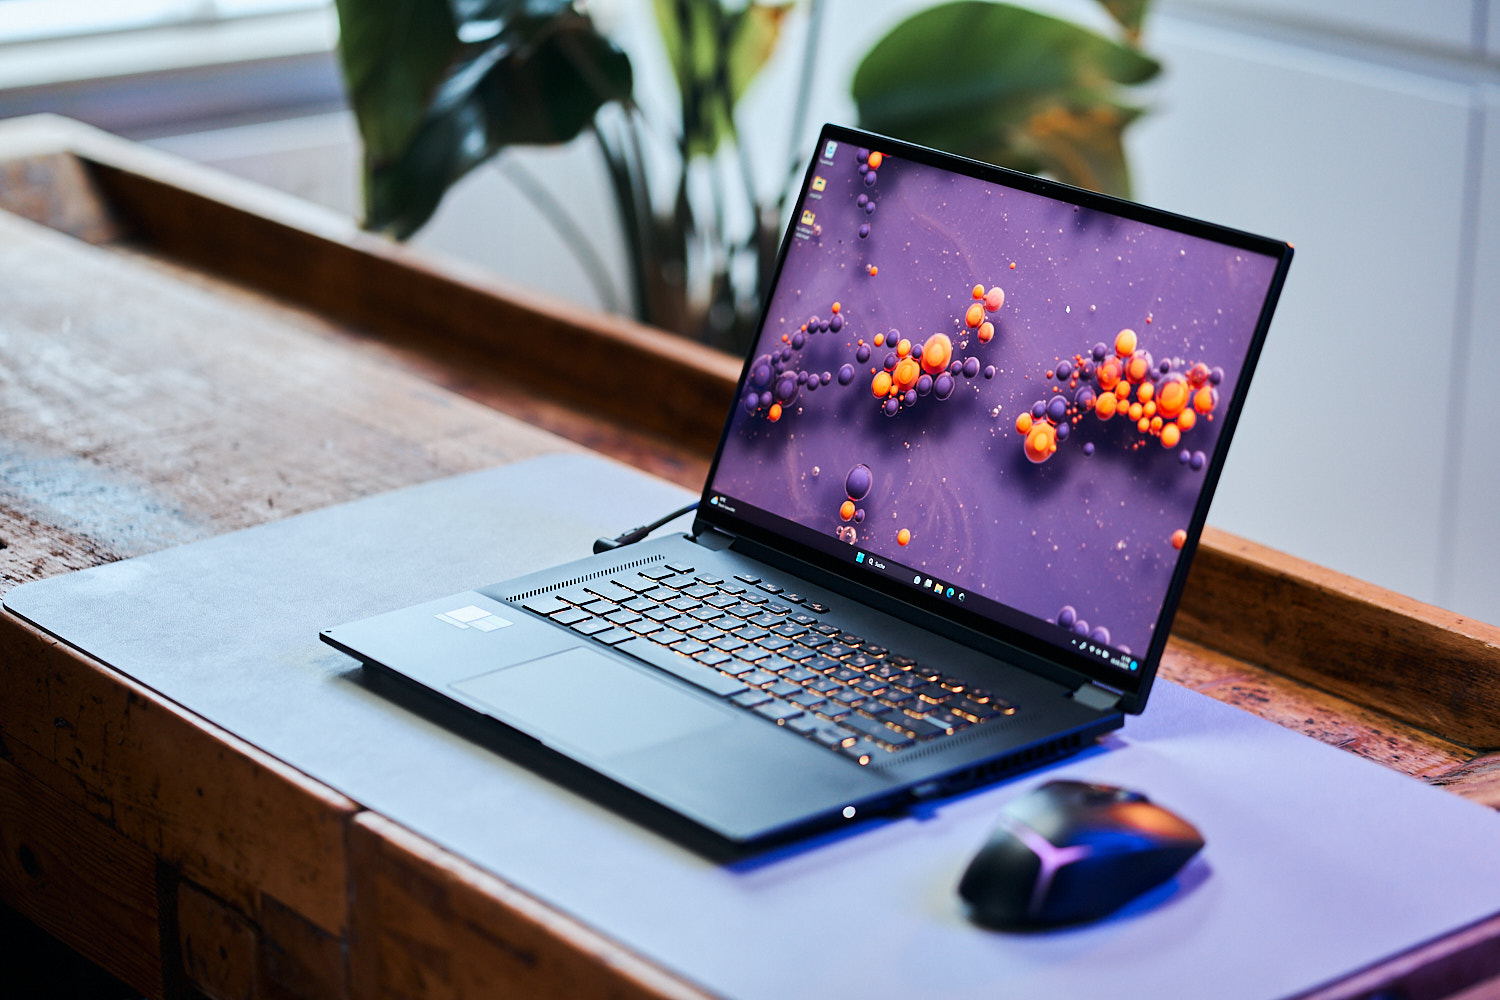
Análisis del delgado portátil Asus ROG Flow X16: Una potente estación de trabajo 2 en 1 de 16 pulgadas para juegos con pantalla táctil

El año pasado, el ROG Flow X16 fue nuestro primer portátil para juegos equipado con una pantalla mini-LED. En ese momento, el portátil estaba adelantado a su tiempo y, por esta razón, Asus parece no haber tenido motivos para darle a este modelo una revisión completa. Sin embargo, la versión que analizamos aquí viene sin pantalla mini-LED. No obstante, muchas características siguen siendo las mismas, como la carcasa y los puertos, y Asus sólo cambia la generación de CPU/GPU.
De igual modo, Asus también va por delante en la realización de nuevos conceptos, como demuestra el nuevo Asus ROG Ally así como elAsus ROG Flow Z13para juegos. El X16 no es exactamente un dispositivo al uso: Lo que tenemos aquí es un portátil de juegos ultra delgado que es al mismo tiempo un 2 en 1. La pantalla puede girar 360 grados, lo que permite utilizar el portátil como una tableta. La pantalla se puede girar 360 grados, lo que permite utilizar el portátil como una tableta a través de la pantalla táctil. La competencia directa es difícil de encontrar, por eso lo comparamos con máquinas de juego normales. Al igual que su predecesor, también estamos utilizando elSamsung Galaxy Book3 Ultra 16y elLenovo Legion Pro 5elLenovo Yoga Pro 7 14 G8y elMSI Katana 17 B13V para comparar.
Dado que varias características encontradas en el modelo del año pasado siguen siendo las mismas, no vamos a prestar especial atención a la carcasa, los accesorios, el mantenimiento y los dispositivos de entrada, sino que preferimos dirigirte a nuestro análisis del modelo del año pasado Asus ROG Flow X16 GV601RWdel año pasado.
Posibles contendientes en la comparación
Valoración | Fecha | Modelo | Peso | Altura | Tamaño | Resolución | Precio |
|---|---|---|---|---|---|---|---|
| 89.7 % v7 (old) | 06/2023 | Asus ROG Flow X16 GV601V i9-13900H, GeForce RTX 4060 Laptop GPU | 2.1 kg | 19.4 mm | 16.00" | 2560x1600 | |
| 89.5 % v7 (old) | 08/2022 | Asus ROG Flow X16 GV601RW-M5082W R9 6900HS, GeForce RTX 3070 Ti Laptop GPU | 2.1 kg | 19.4 mm | 16.10" | 2560x1600 | |
| 88.8 % v7 (old) | 05/2023 | Samsung Galaxy Book3 Ultra 16, i9-13900H RTX 4070 i9-13900H, GeForce RTX 4070 Laptop GPU | 1.8 kg | 16.8 mm | 16.00" | 2880x1800 | |
| 87.9 % v7 (old) | 05/2023 | Lenovo Legion Pro 5 16IRX8 i7-13700HX, GeForce RTX 4060 Laptop GPU | 2.5 kg | 26.8 mm | 16.00" | 2560x1600 | |
| 90.2 % v7 (old) | 05/2023 | Lenovo Yoga Pro 7 14IRH G8 i7-13700H, GeForce RTX 4050 Laptop GPU | 1.5 kg | 15.6 mm | 14.50" | 3072x1920 | |
| 82.1 % v7 (old) | 02/2023 | MSI Katana 17 B13VFK i7-13620H, GeForce RTX 4060 Laptop GPU | 2.8 kg | 25.2 mm | 17.30" | 1920x1080 |
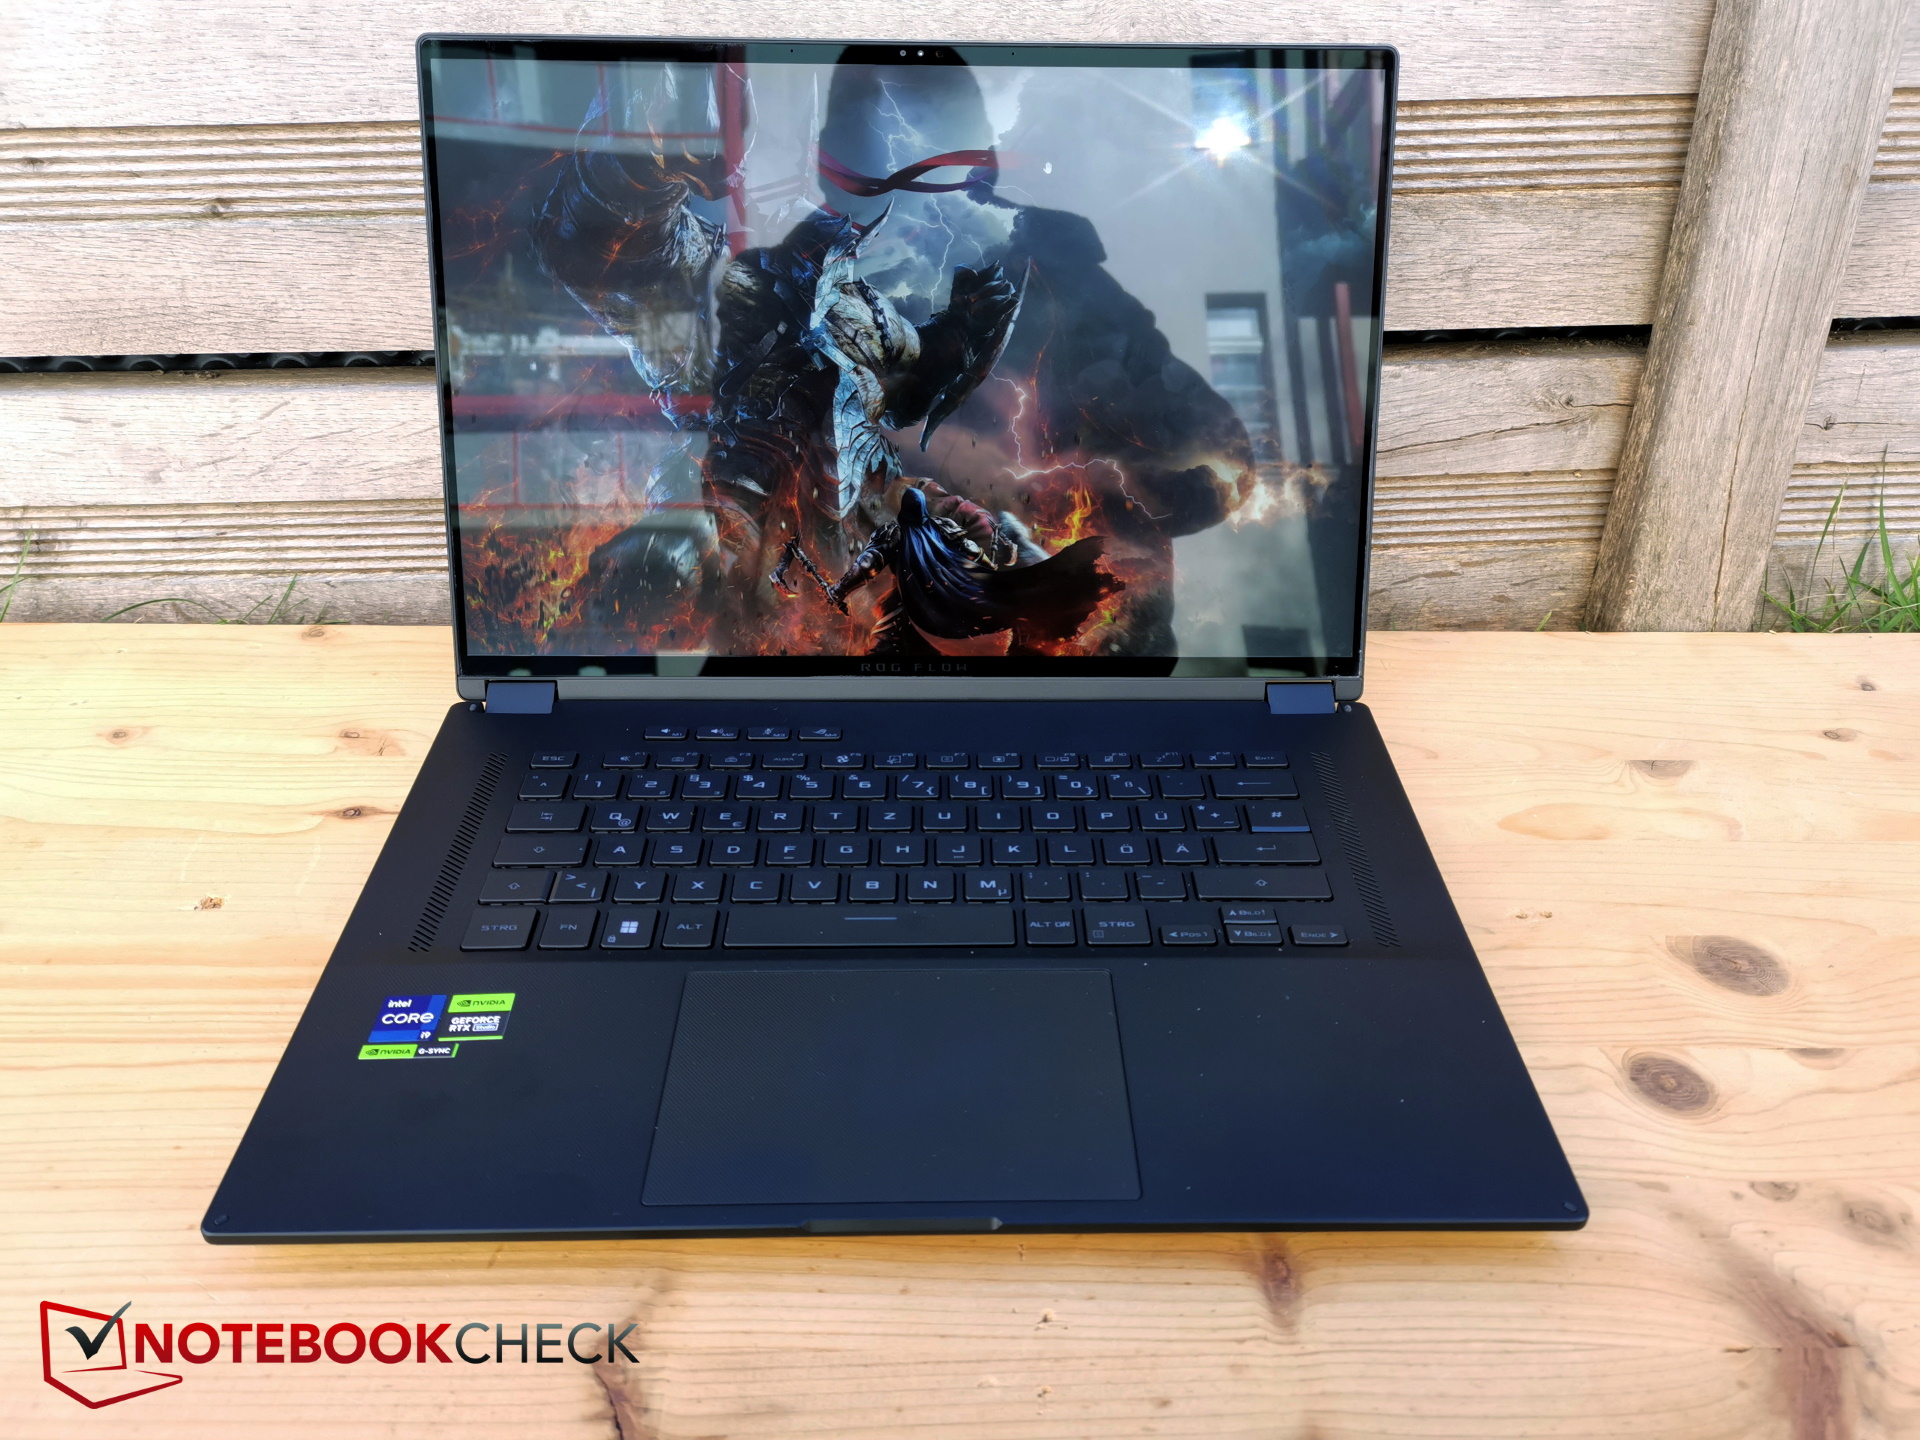
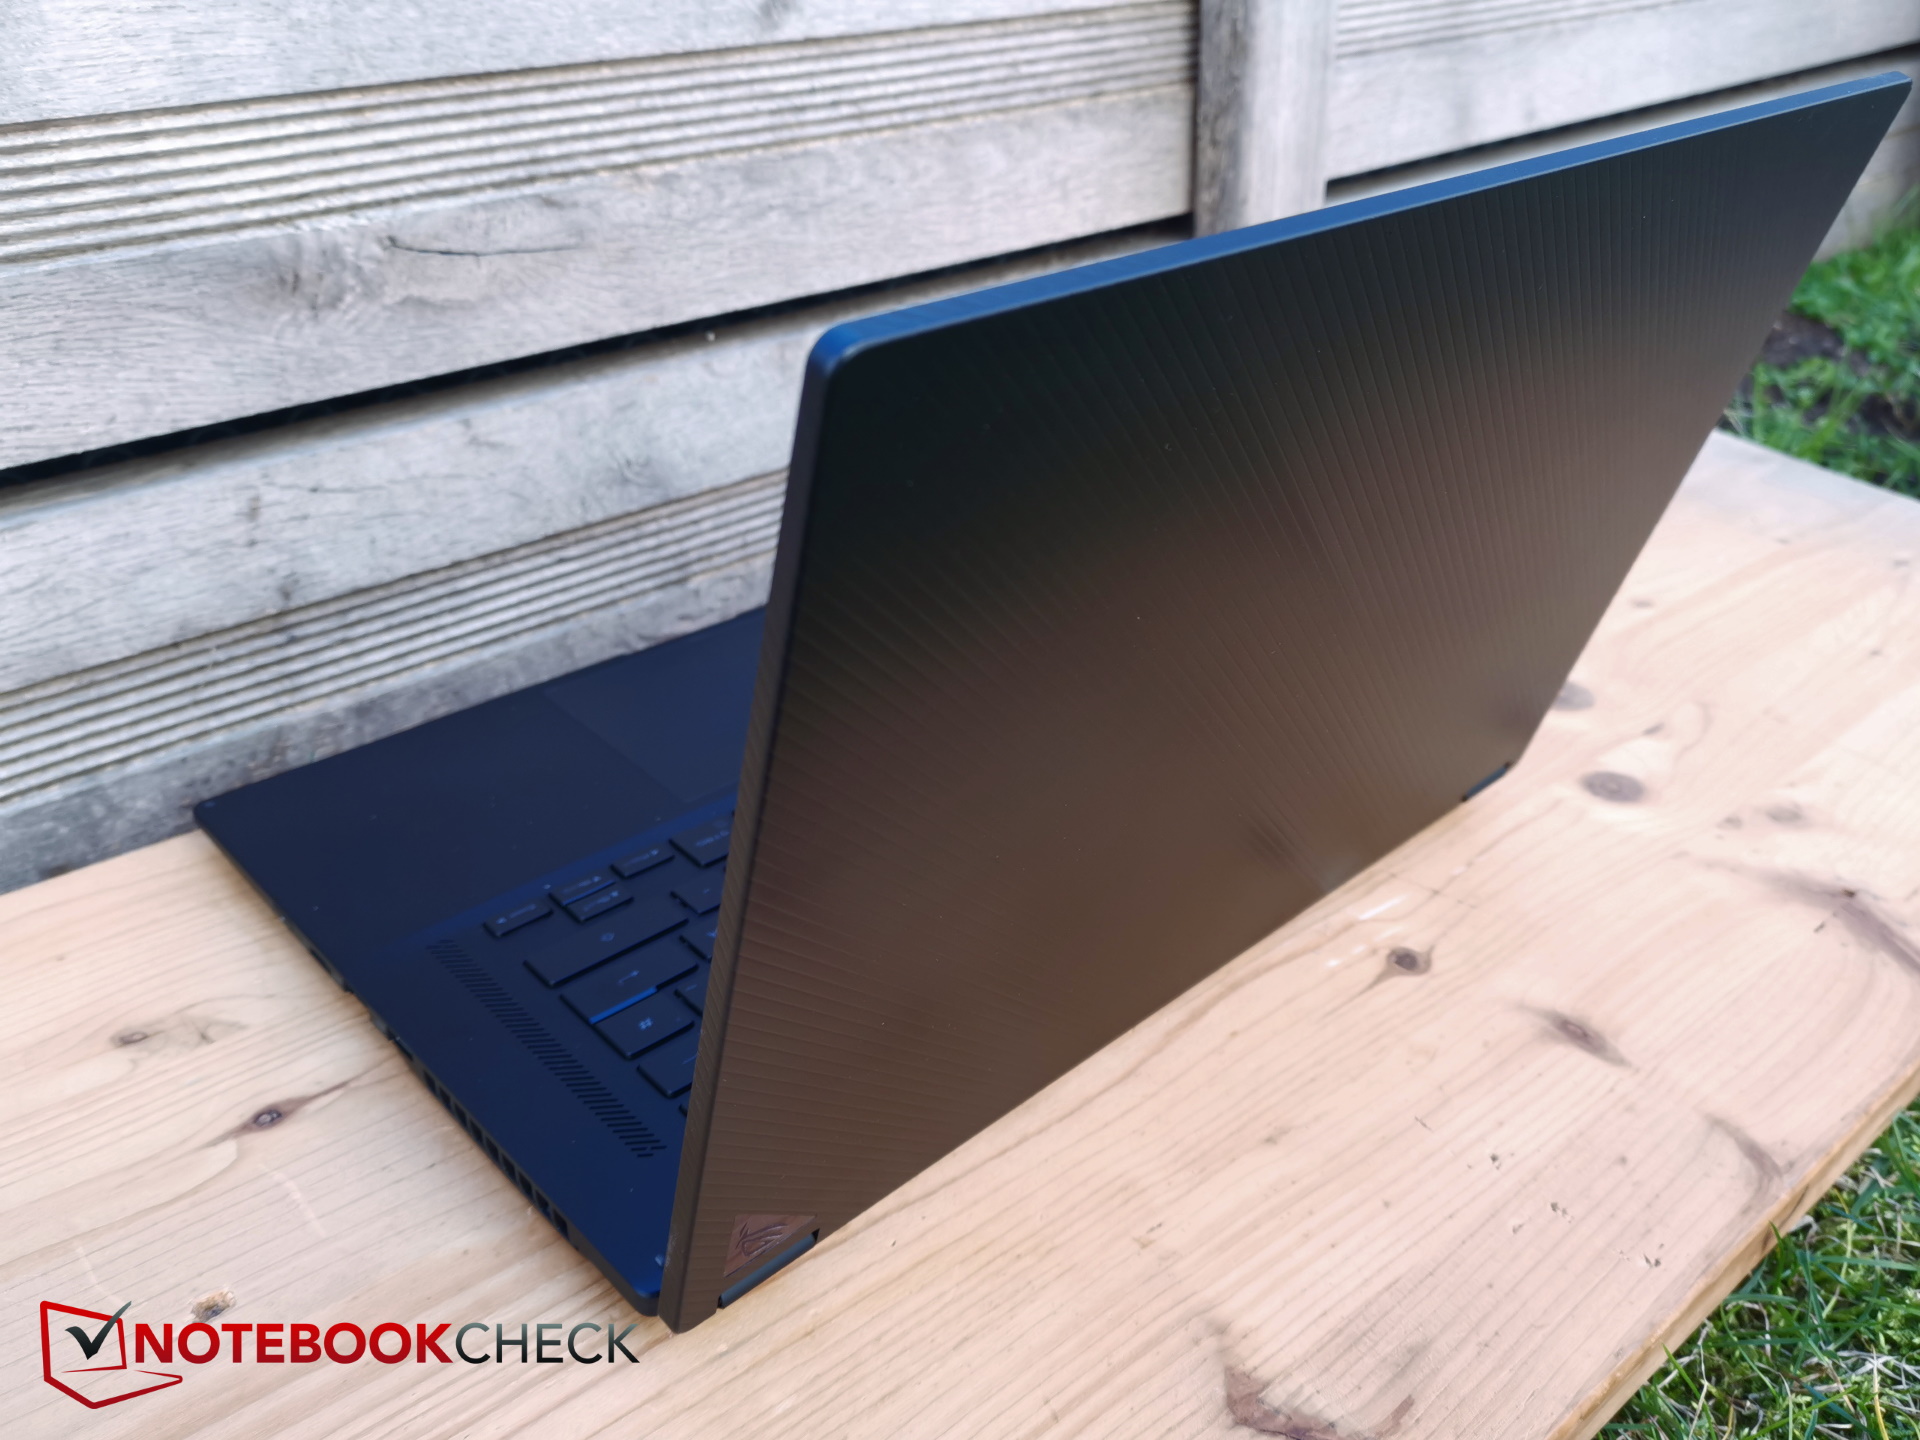
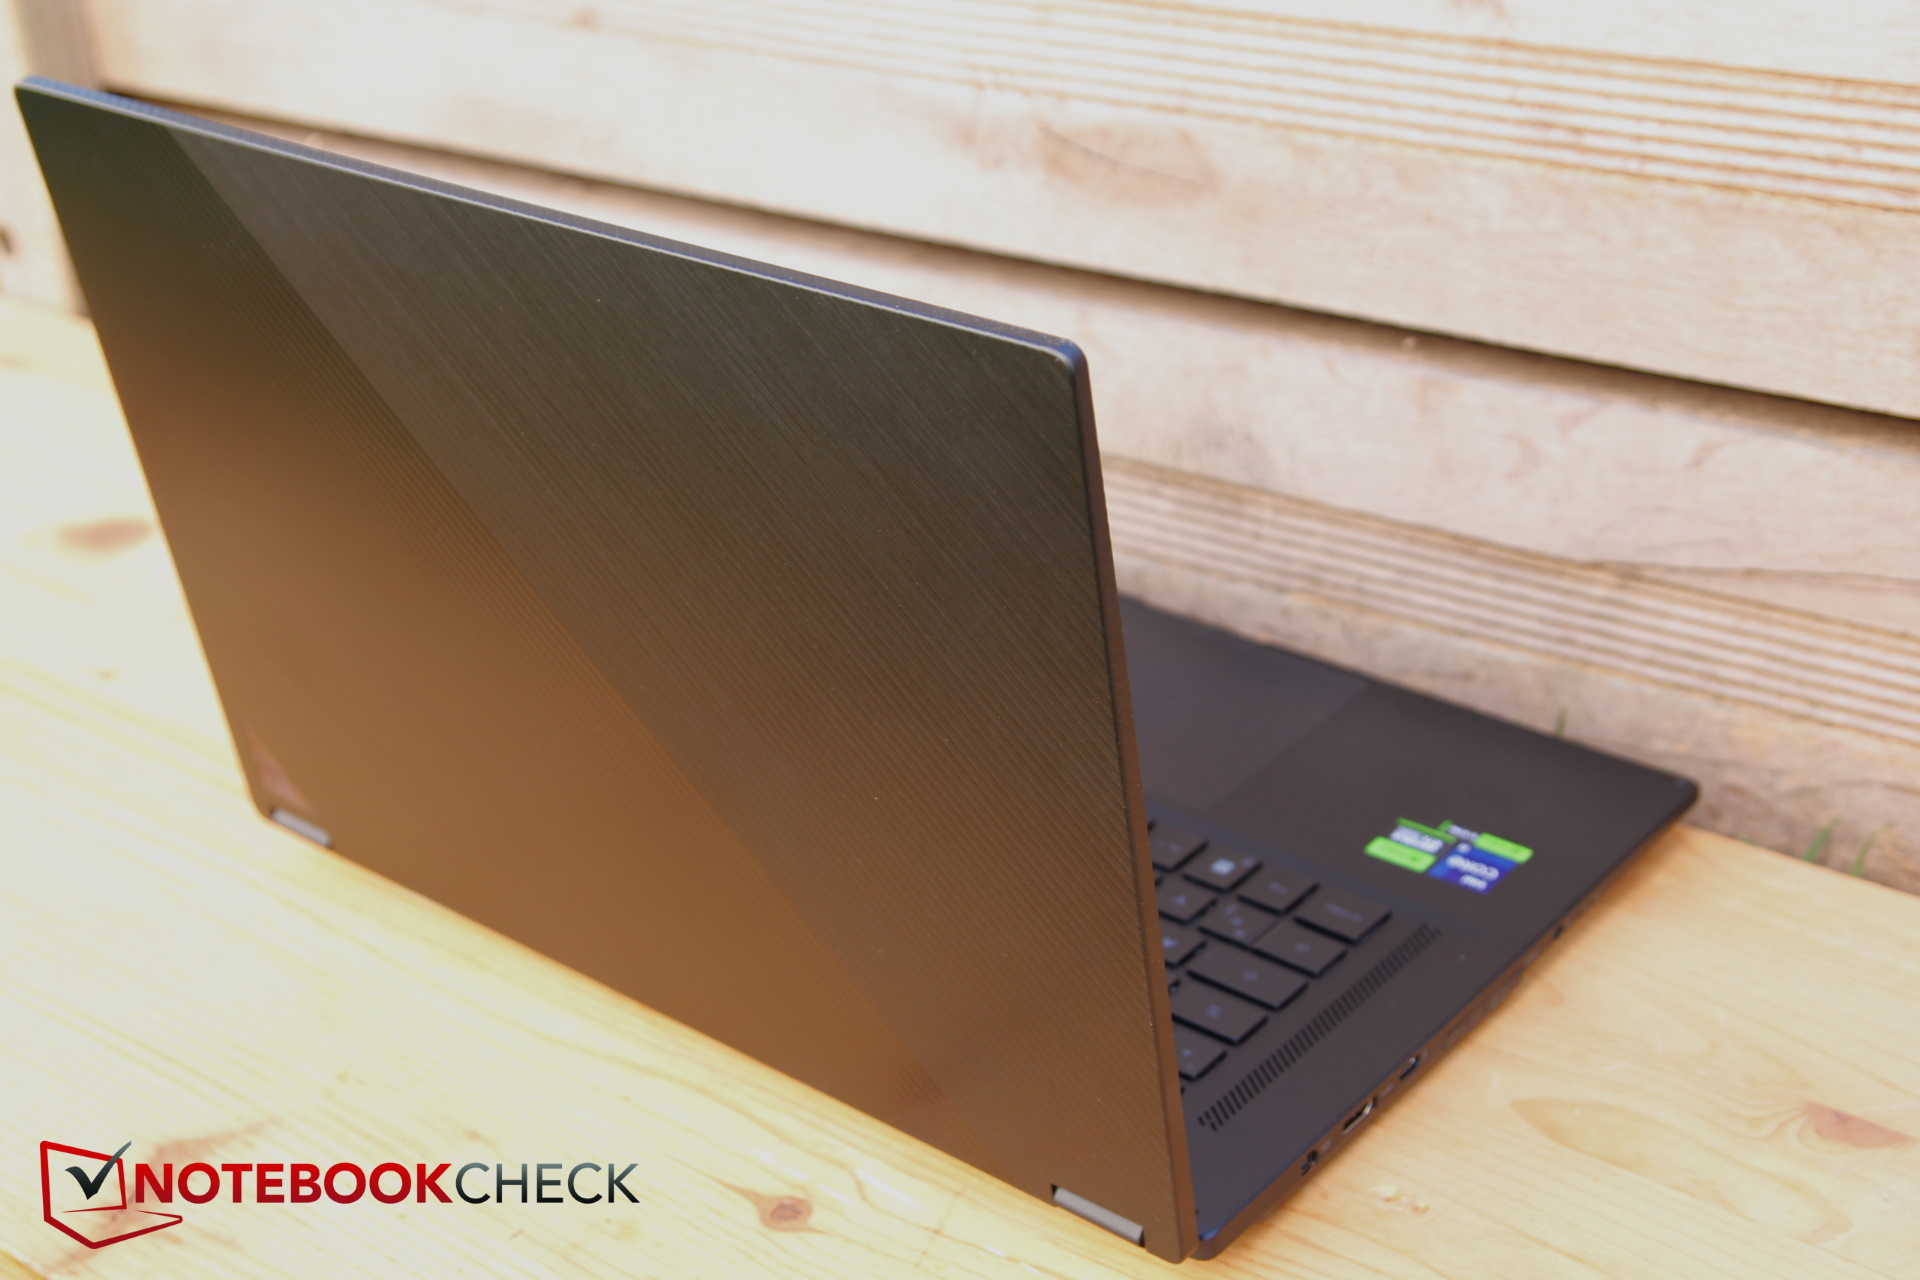
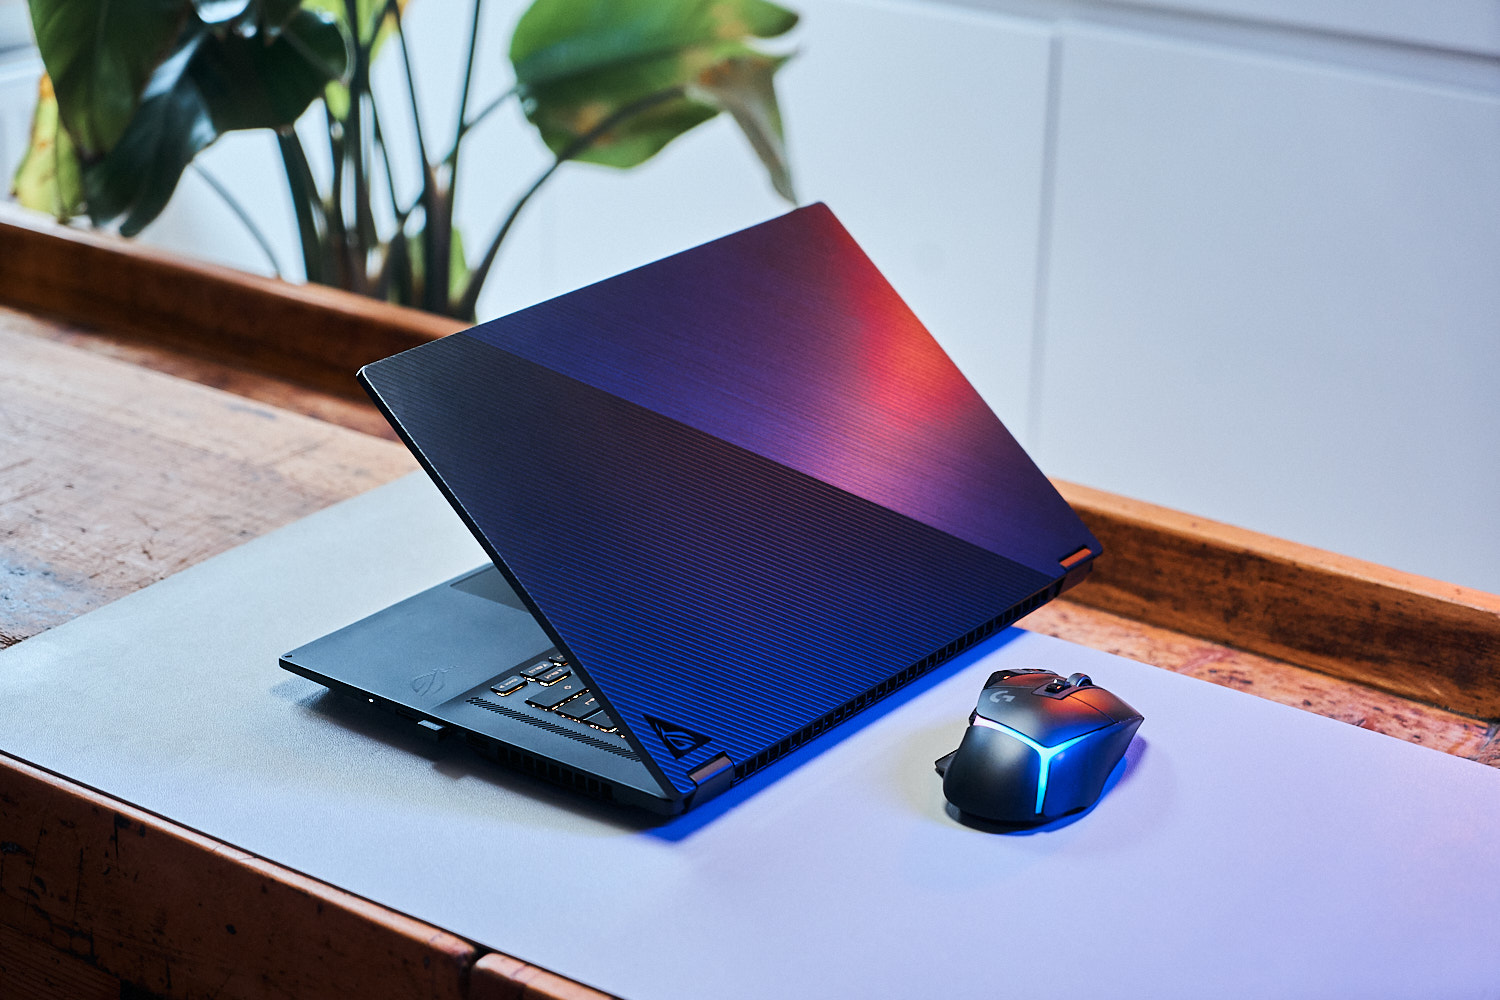
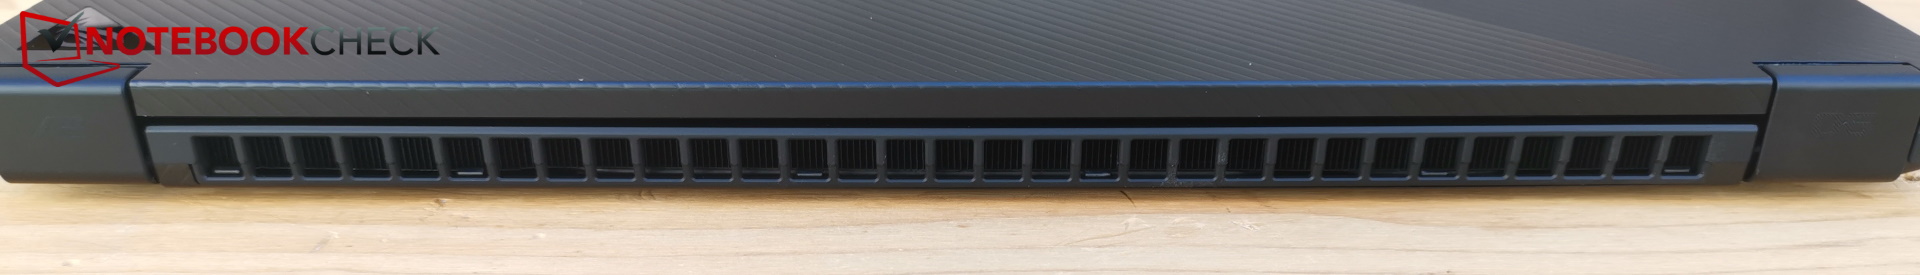
Case - Tan delgado y bueno como el año pasado
El logotipo de la tapa de la caja es ligeramente diferente pero, aparte de eso, todo se mantiene prácticamente igual.

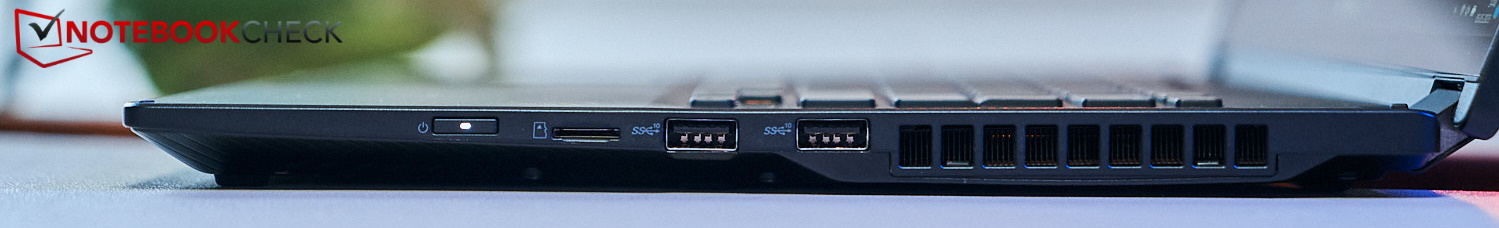
Características - Interfaz móvil TB4 y XG
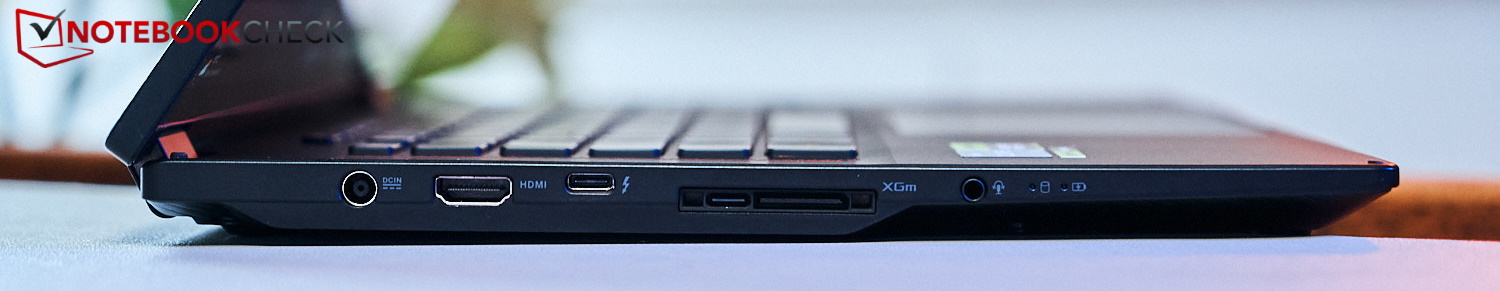
Lector de tarjetas SD
| SD Card Reader | |
| average JPG Copy Test (av. of 3 runs) | |
| Asus ROG Flow X16 GV601RW-M5082W (AV Pro SD microSD 128 GB V60) | |
| Media de la clase Gaming (20.9 - 210, n=54, últimos 2 años) | |
| Asus ROG Flow X16 GV601V | |
| Samsung Galaxy Book3 Ultra 16, i9-13900H RTX 4070 (AV Pro SD microSD 128 GB V60) | |
| maximum AS SSD Seq Read Test (1GB) | |
| Asus ROG Flow X16 GV601V | |
| Asus ROG Flow X16 GV601RW-M5082W (AV Pro SD microSD 128 GB V60) | |
| Media de la clase Gaming (25.5 - 261, n=51, últimos 2 años) | |
| Samsung Galaxy Book3 Ultra 16, i9-13900H RTX 4070 (AV Pro SD microSD 128 GB V60) | |
Comunicación
Las velocidades de transferencia con el AX211 de Intel en una red de 6 GHz son muy altas y estables (aproximadamente 1,6 MBit/s) y en una red de 5 GHz, sólo es posible alcanzar velocidades de transferencia bajas, de alrededor de 1 MBit/s.
Cámara web
En este campo, Asus ha mejorado la cámara de 720p del modelo del año pasado a una Full HD. Las imágenes son decentes, pero la desviación del color es algo elevada.


Seguridad
TPM está disponible gracias al chip Intel, sin embargo, un sensor de huellas dactilares e incluso un bloqueo Kensington faltan en acción. La cámara es compatible con Windows Hello.
Accesorios
Por desgracia, este año no se incluye el lápiz óptico y, en teoría, recibes un portátil sin ningún accesorio adicional. Sin embargo, dependiendo del paquete, se incluye una mochila para portátil de la marca ROG, los auriculares ROG Fusion II 300, así como el ratón ROG Gladius III.
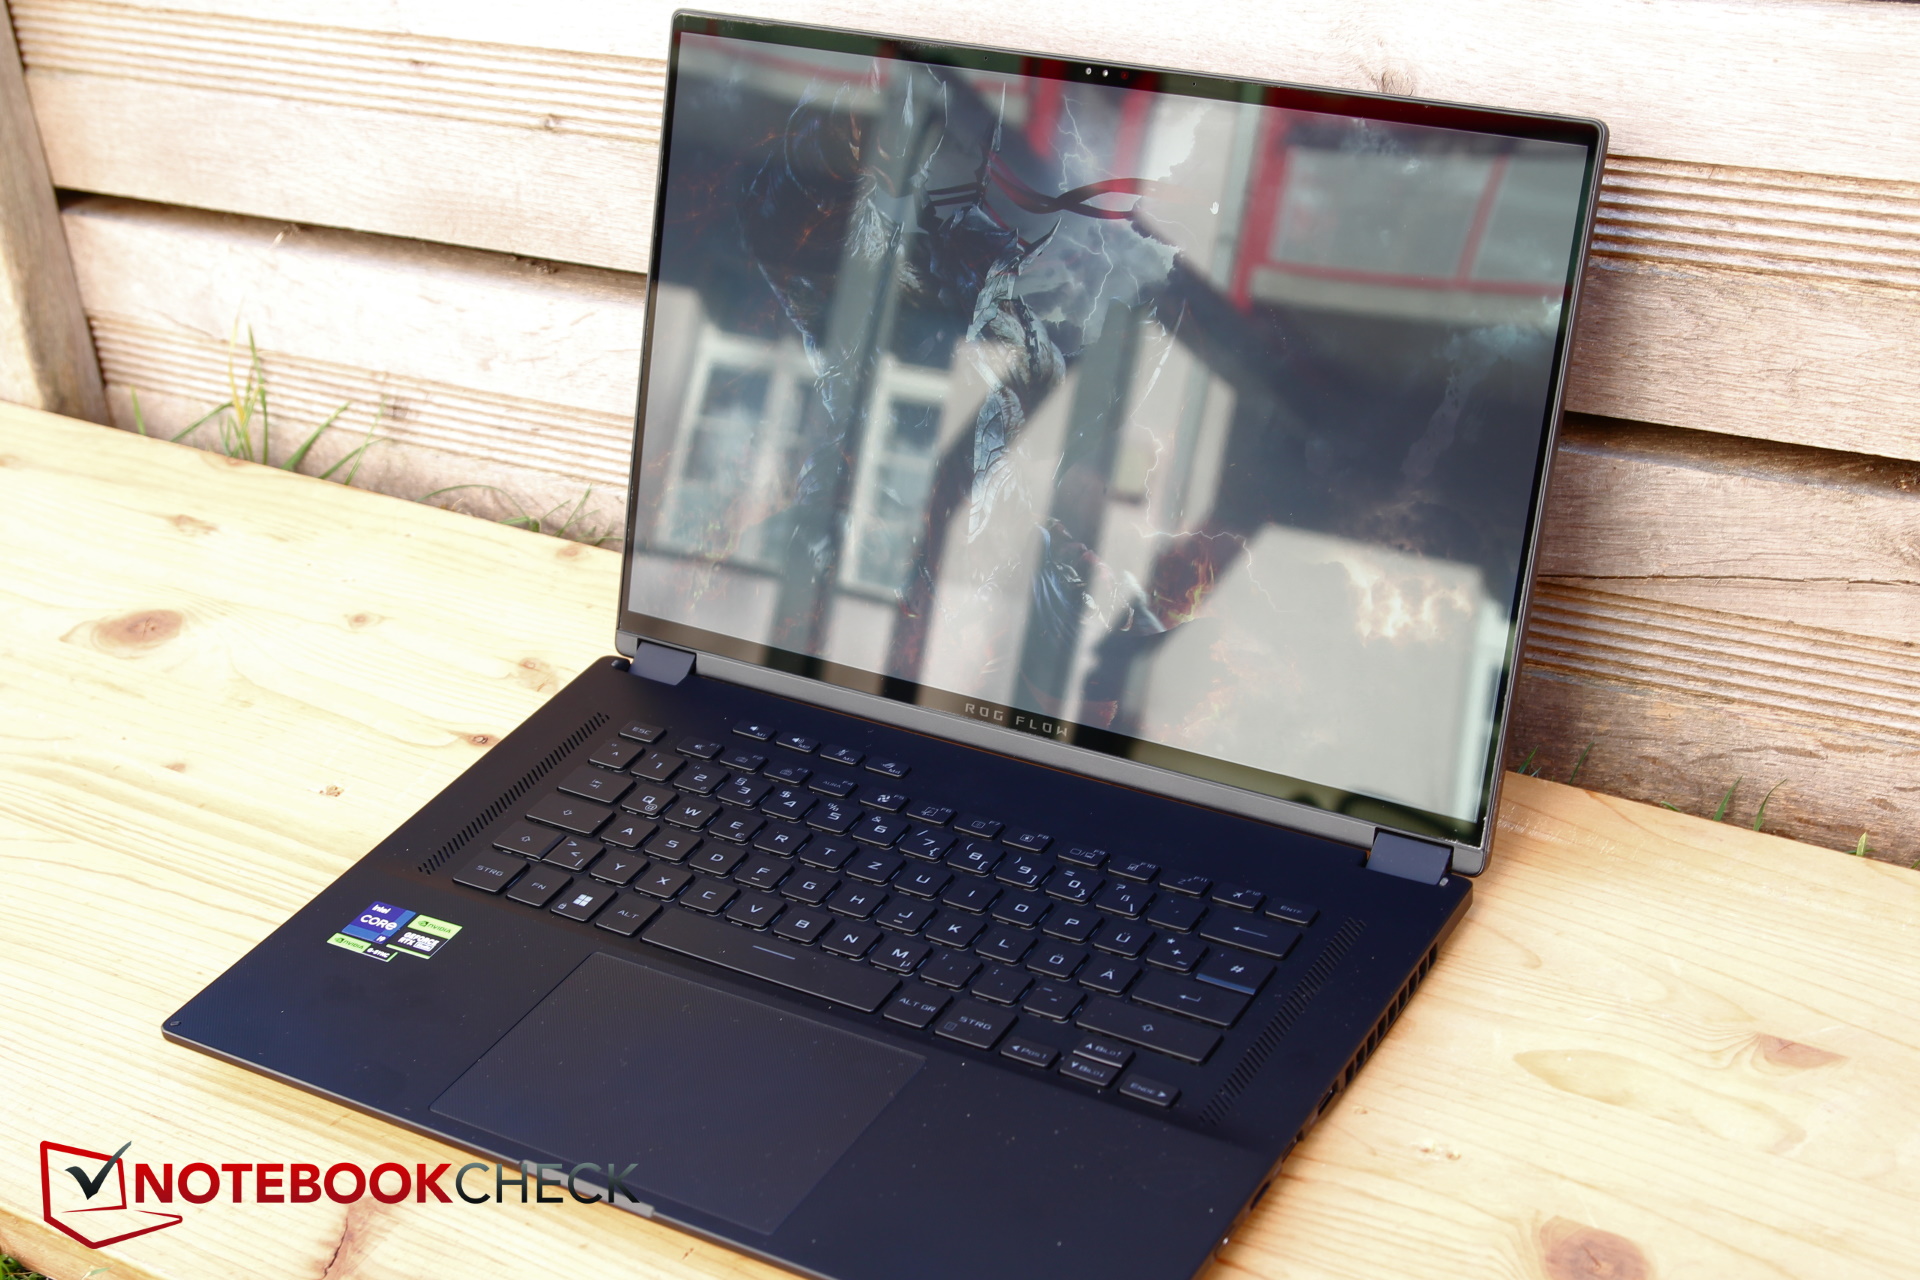
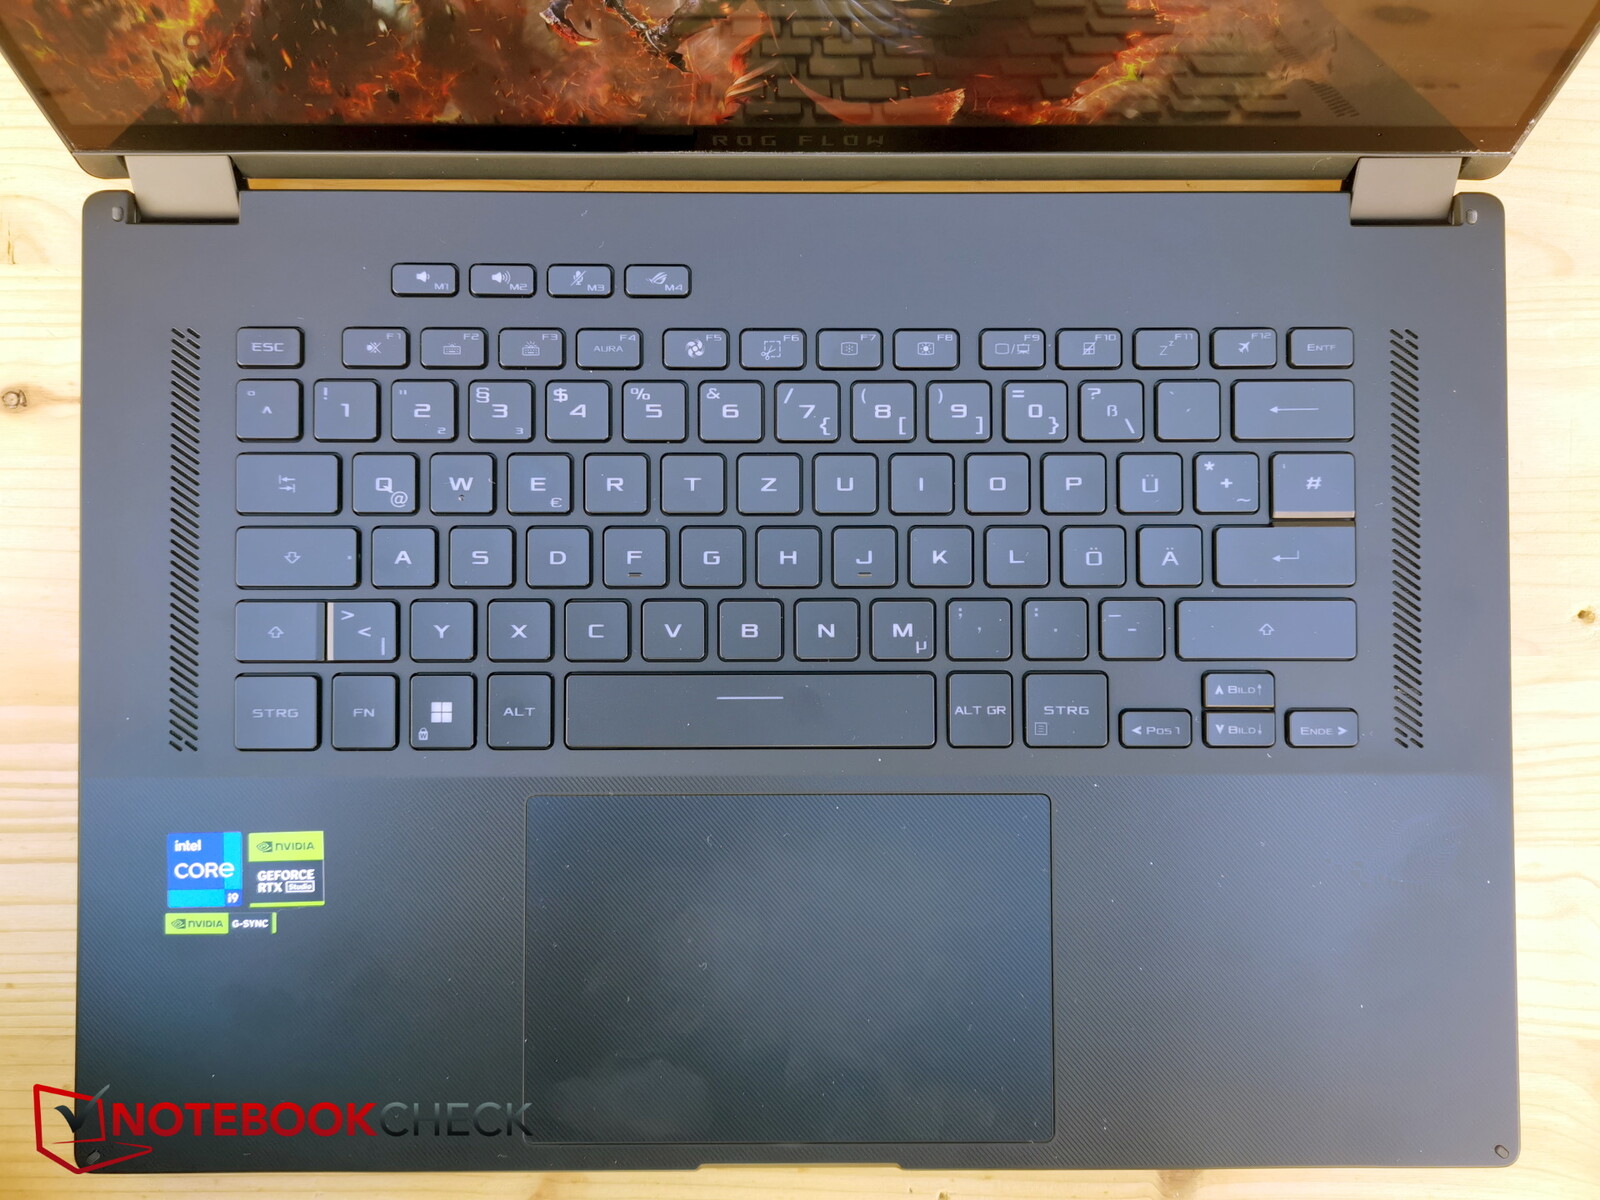
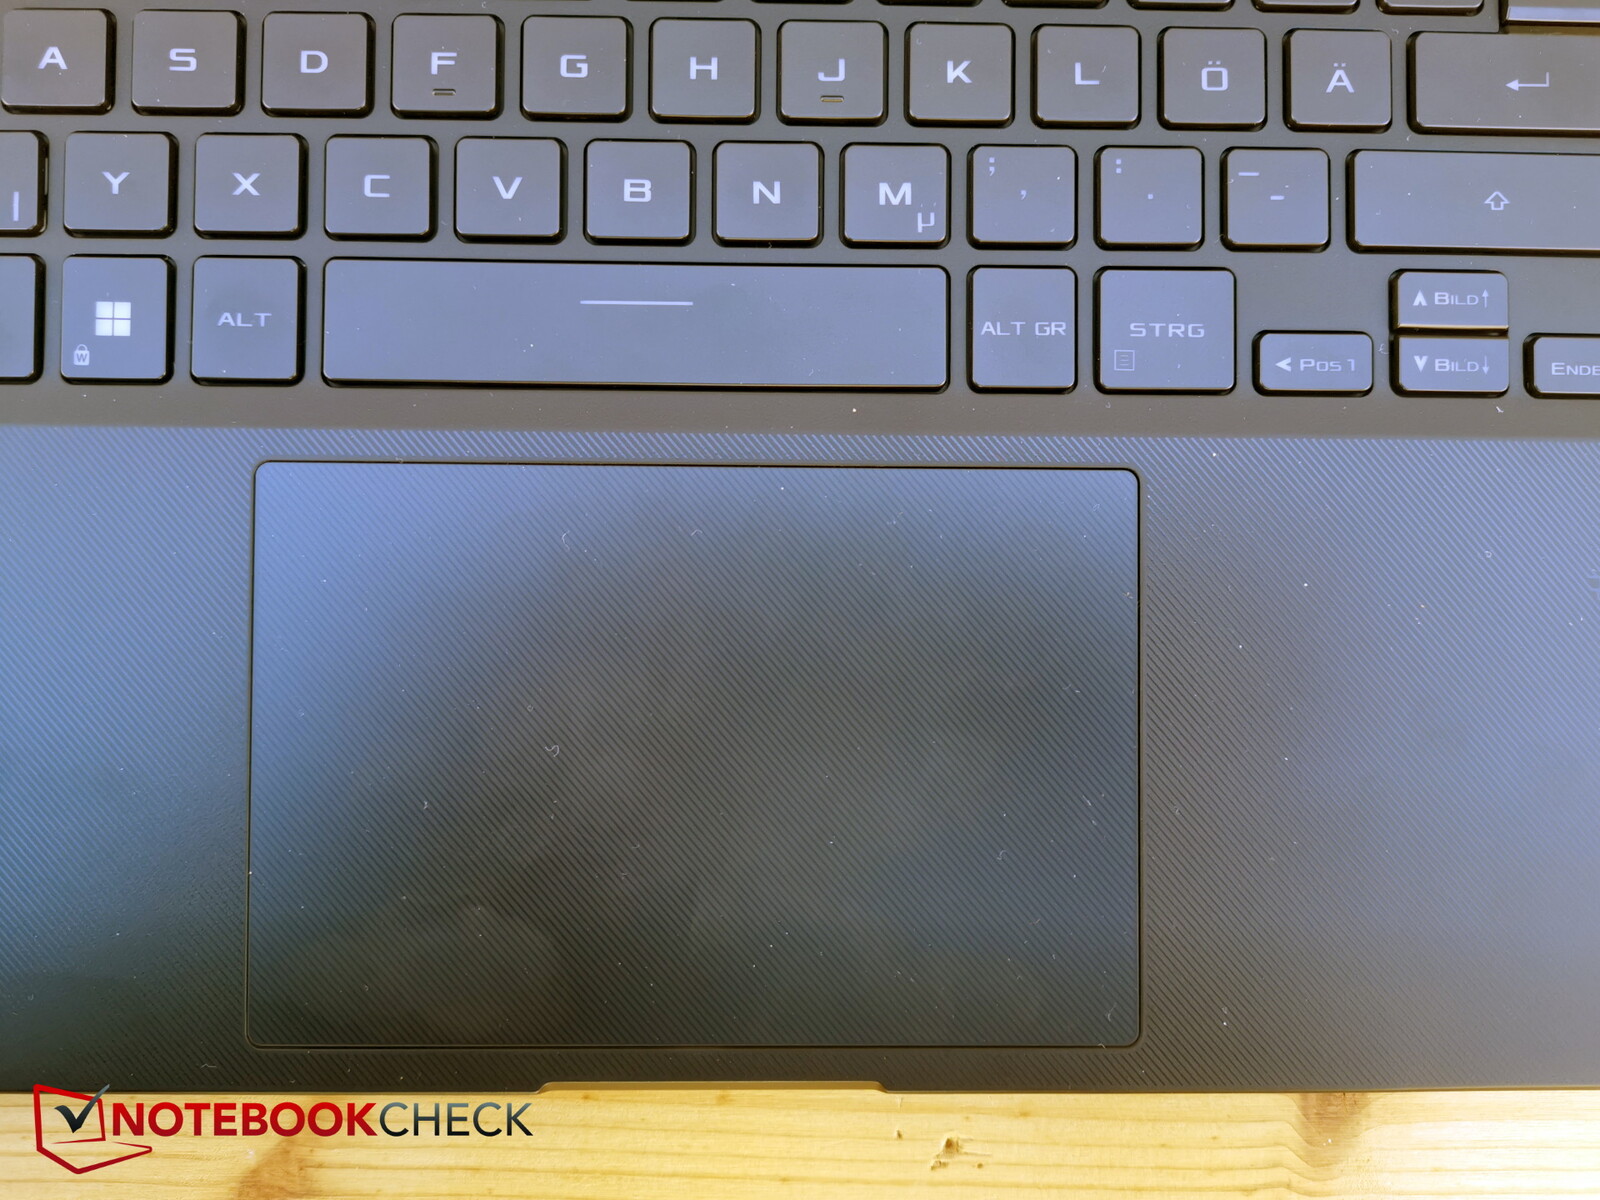
Dispositivos de entrada - El X16 tiene un gran touchpad

Pantalla - ¿Con o sin mini-LED?
El X16 alberga el panel IPS de 16 pulgadas Asus TMX1603 o TL160ADMP03-0 con funcionalidad de pantalla táctil pero sin mini-LED. El mismo panel, aunque en la variante no táctil, también se puede encontrar en el Asus ROG Strix G16. Se trata de una pantalla de formato 16:10 de 2560 x 1600 píxeles que admite la entrada con lápiz óptico. Por desgracia, a diferencia del año pasado, cuando el lápiz estaba incluido, este año hay que comprarlo por separado.
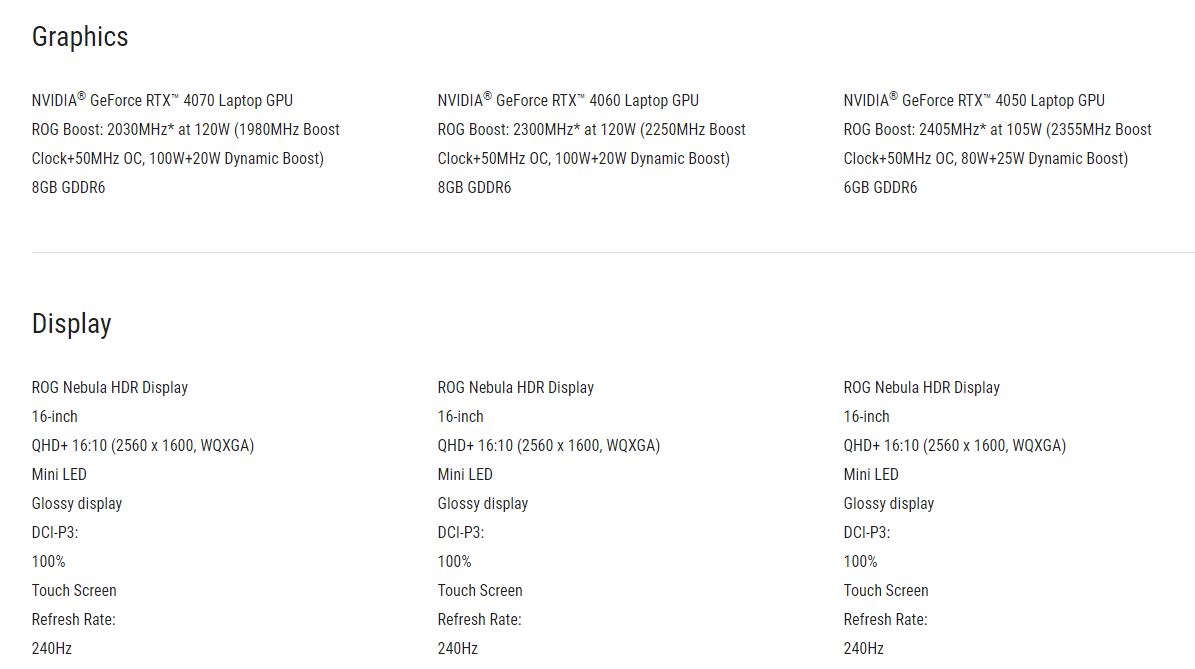
También, al igual que el año pasado, existe la opción de optar por un panel con retroiluminación mini-LED que se ha mejorado una vez más: El número de zonas de atenuación se ha duplicado hasta 1.024, la frecuencia de actualización ha pasado de 165 a 240 Hz y el brillo máximo ha aumentado ligeramente hasta los 1.100 nits (HDR). Por desgracia, el panel mini-LED (reseñado aquí) sólo está disponible a partir de RTX 4070o modelos con especificaciones superiores, por lo que no está presente en nuestro modelo de análisis.
Sin embargo, el sitio web de Asus da la impresión de que todos los modelos vienen con pantalla mini-LED, incluso los que tienen RTX 4050 y RTX 4060. Así que presta atención al comprarlo
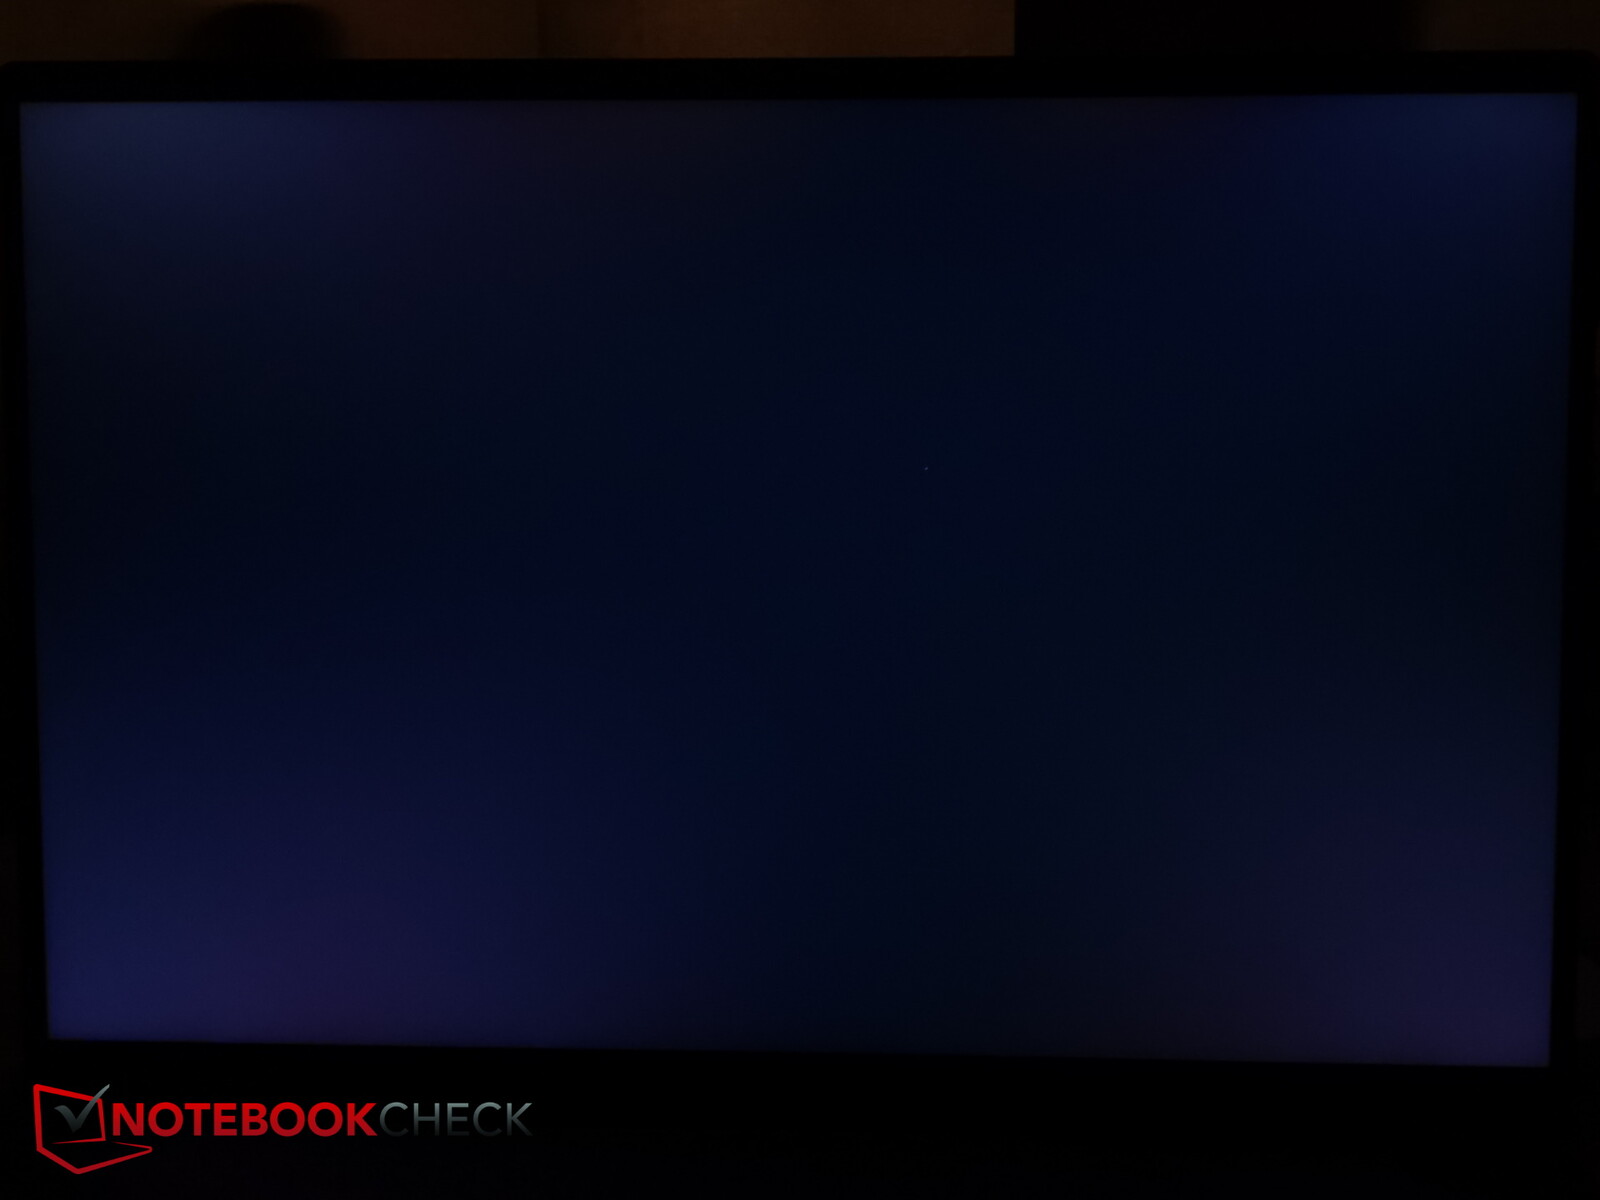
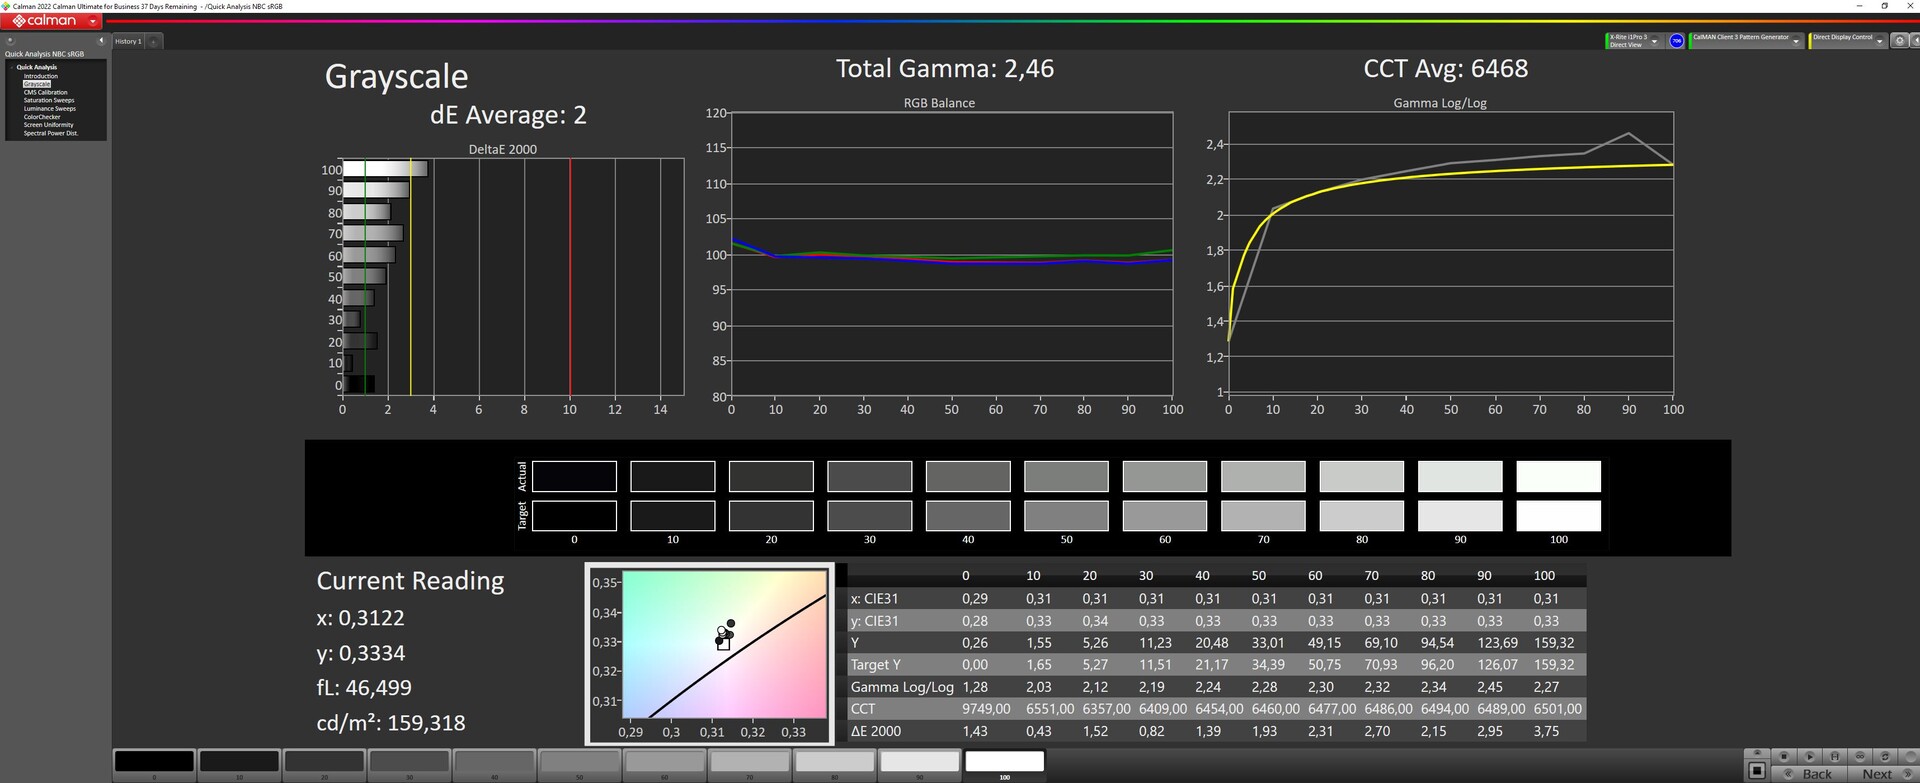
Pero, incluso sin mini-LED, nuestro modelo estándar midió un brillo medio de unos 469 nits, con una iluminación muy buena del 91%. Los niveles de negro son de un aceptable 0,39, lo que da como resultado una relación de contraste de 1.246:1.
Los tiempos de respuesta son muy rápidos, no hay que preocuparse por el PWM y el sangrado de la retroiluminación es mínimo, sólo visible en el borde superior.
| |||||||||||||||||||||||||
iluminación: 91 %
Brillo con batería: 487 cd/m²
Contraste: 1246:1 (Negro: 0.39 cd/m²)
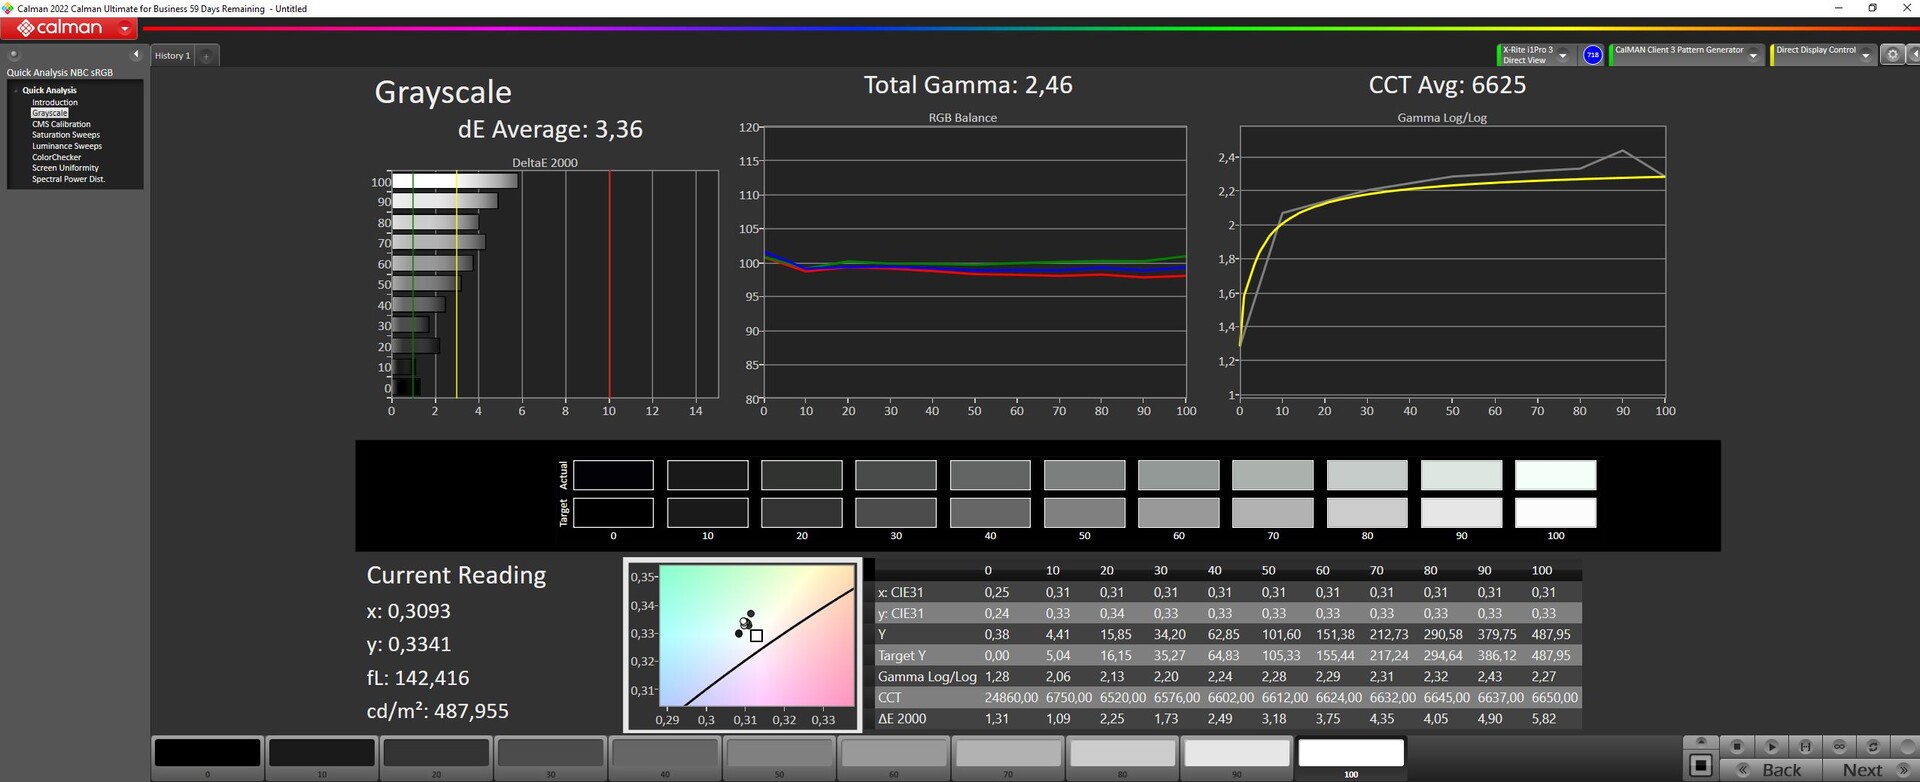
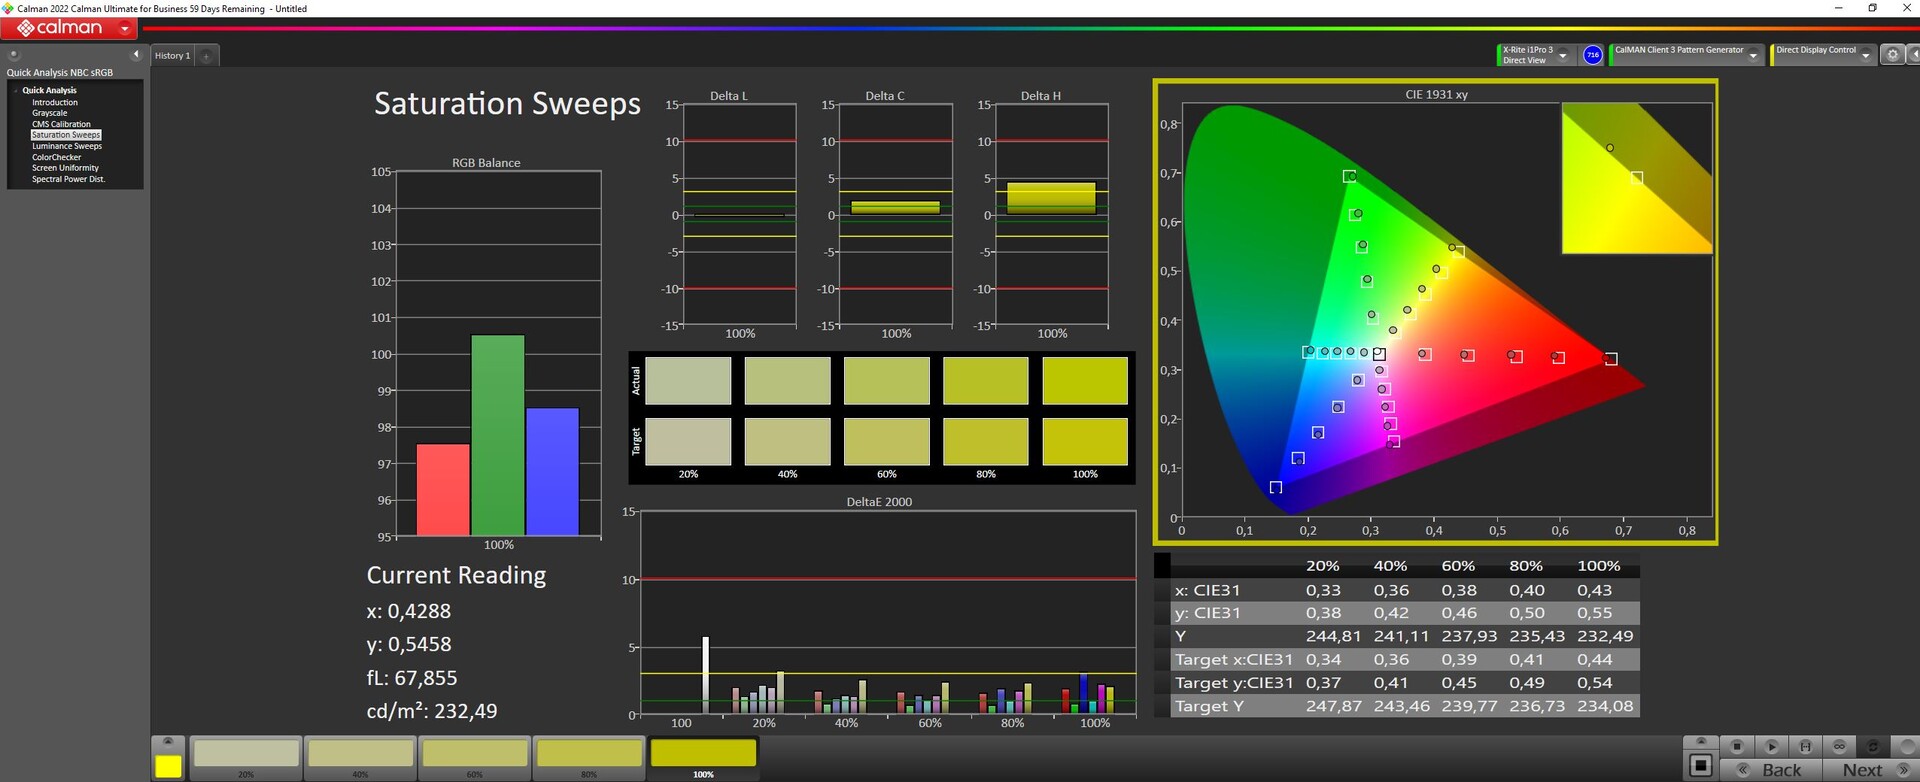
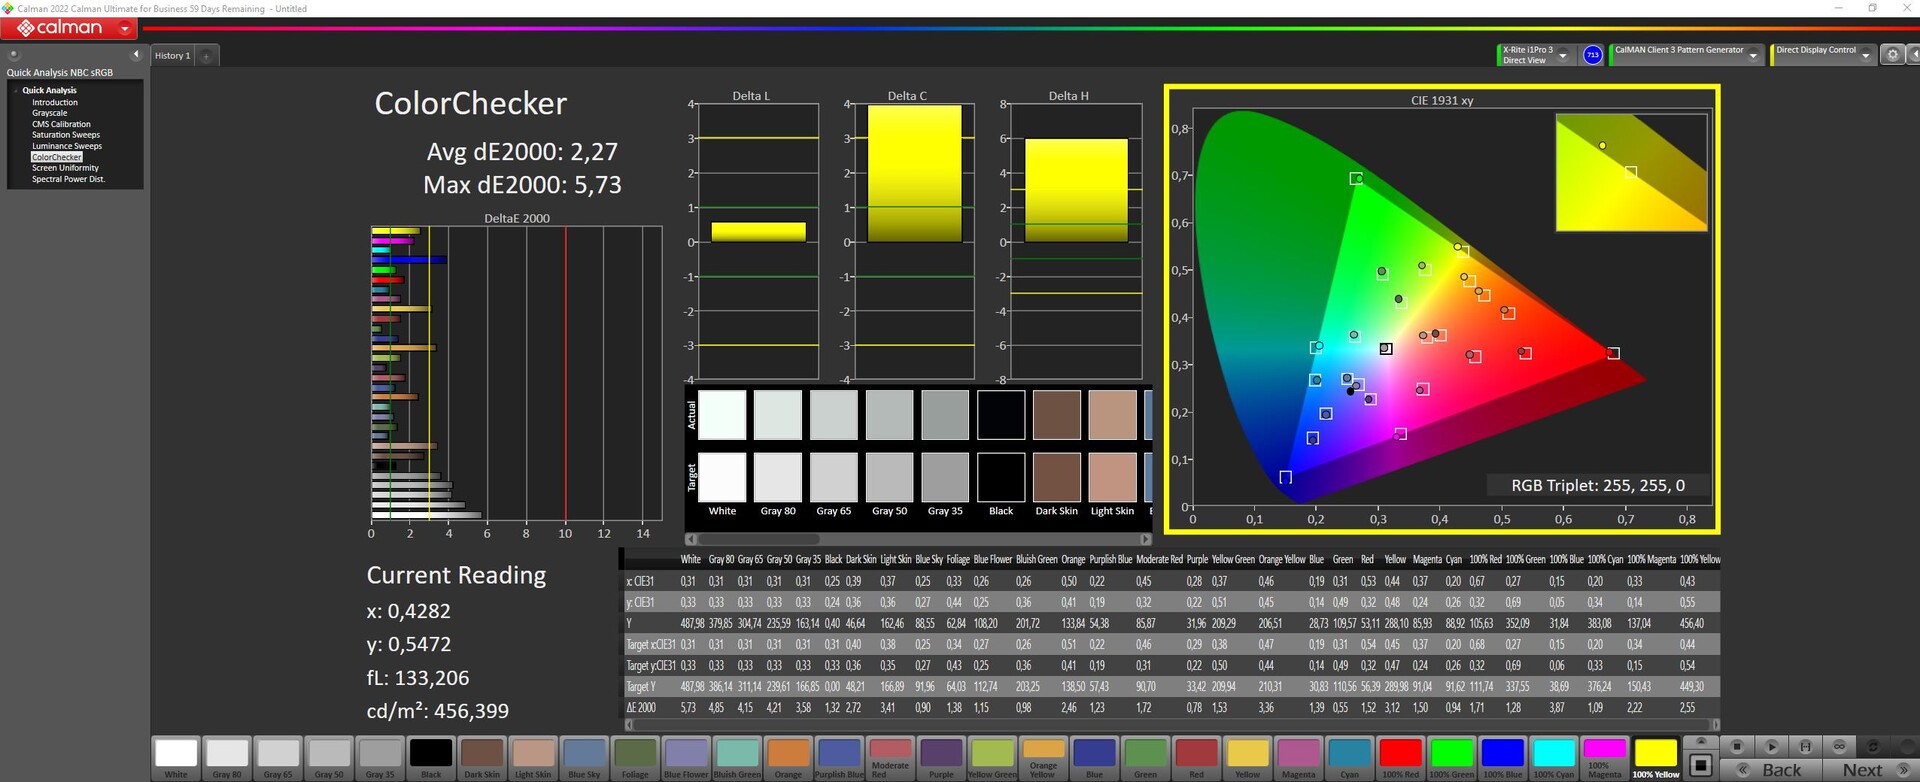
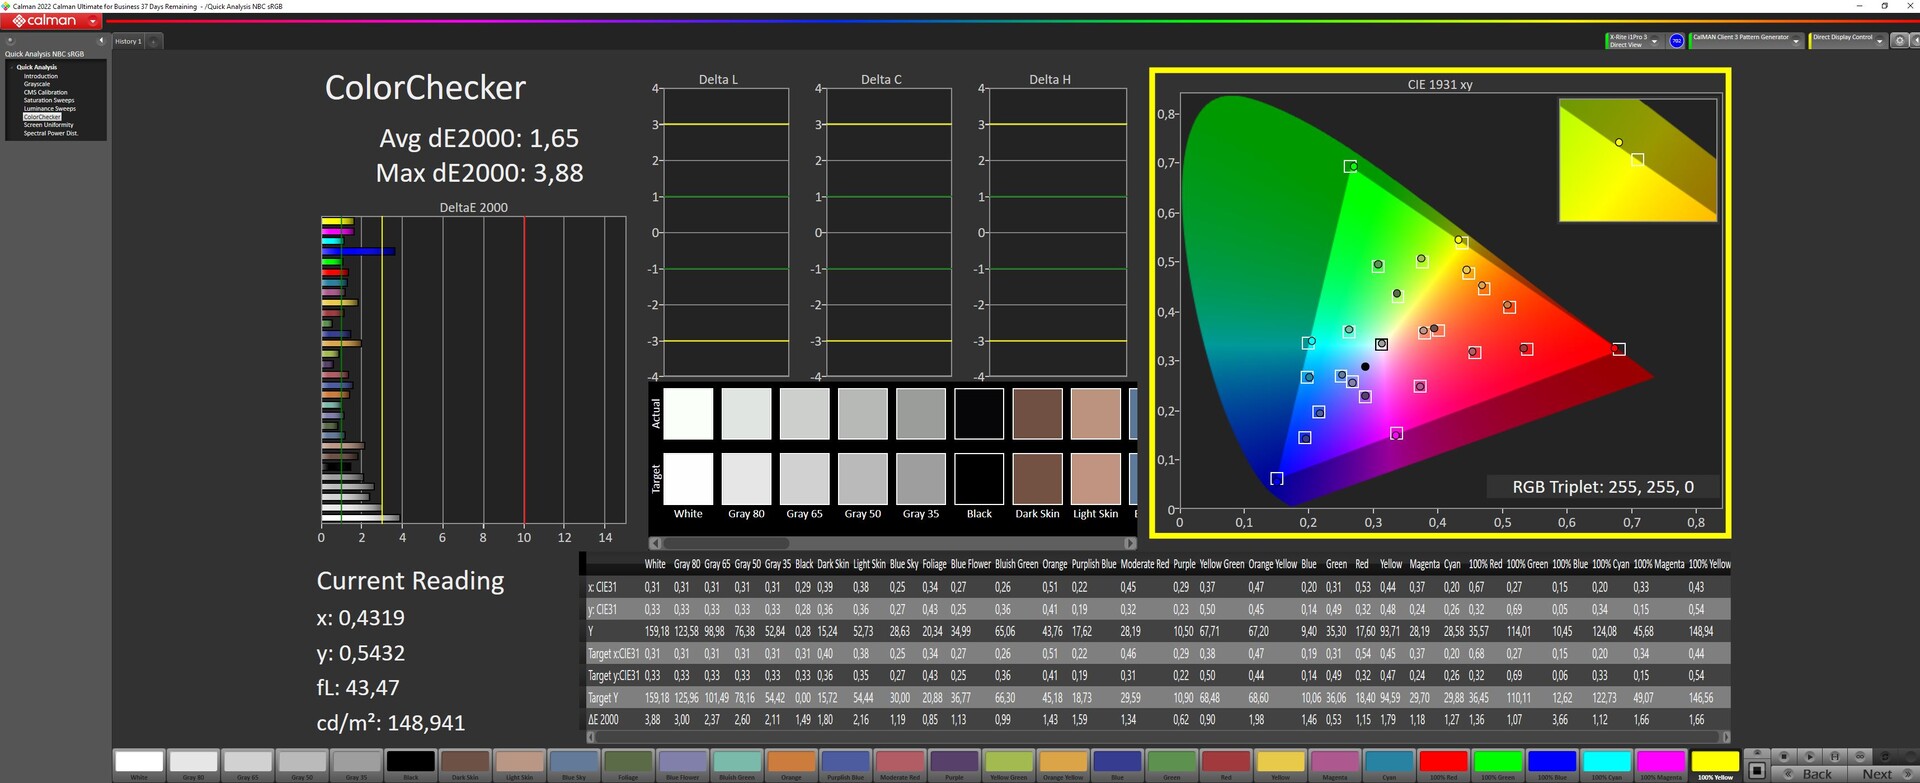
ΔE ColorChecker Calman: 2.27 | ∀{0.5-29.43 Ø4.71}
calibrated: 0.6
ΔE Greyscale Calman: 3.36 | ∀{0.09-98 Ø4.96}
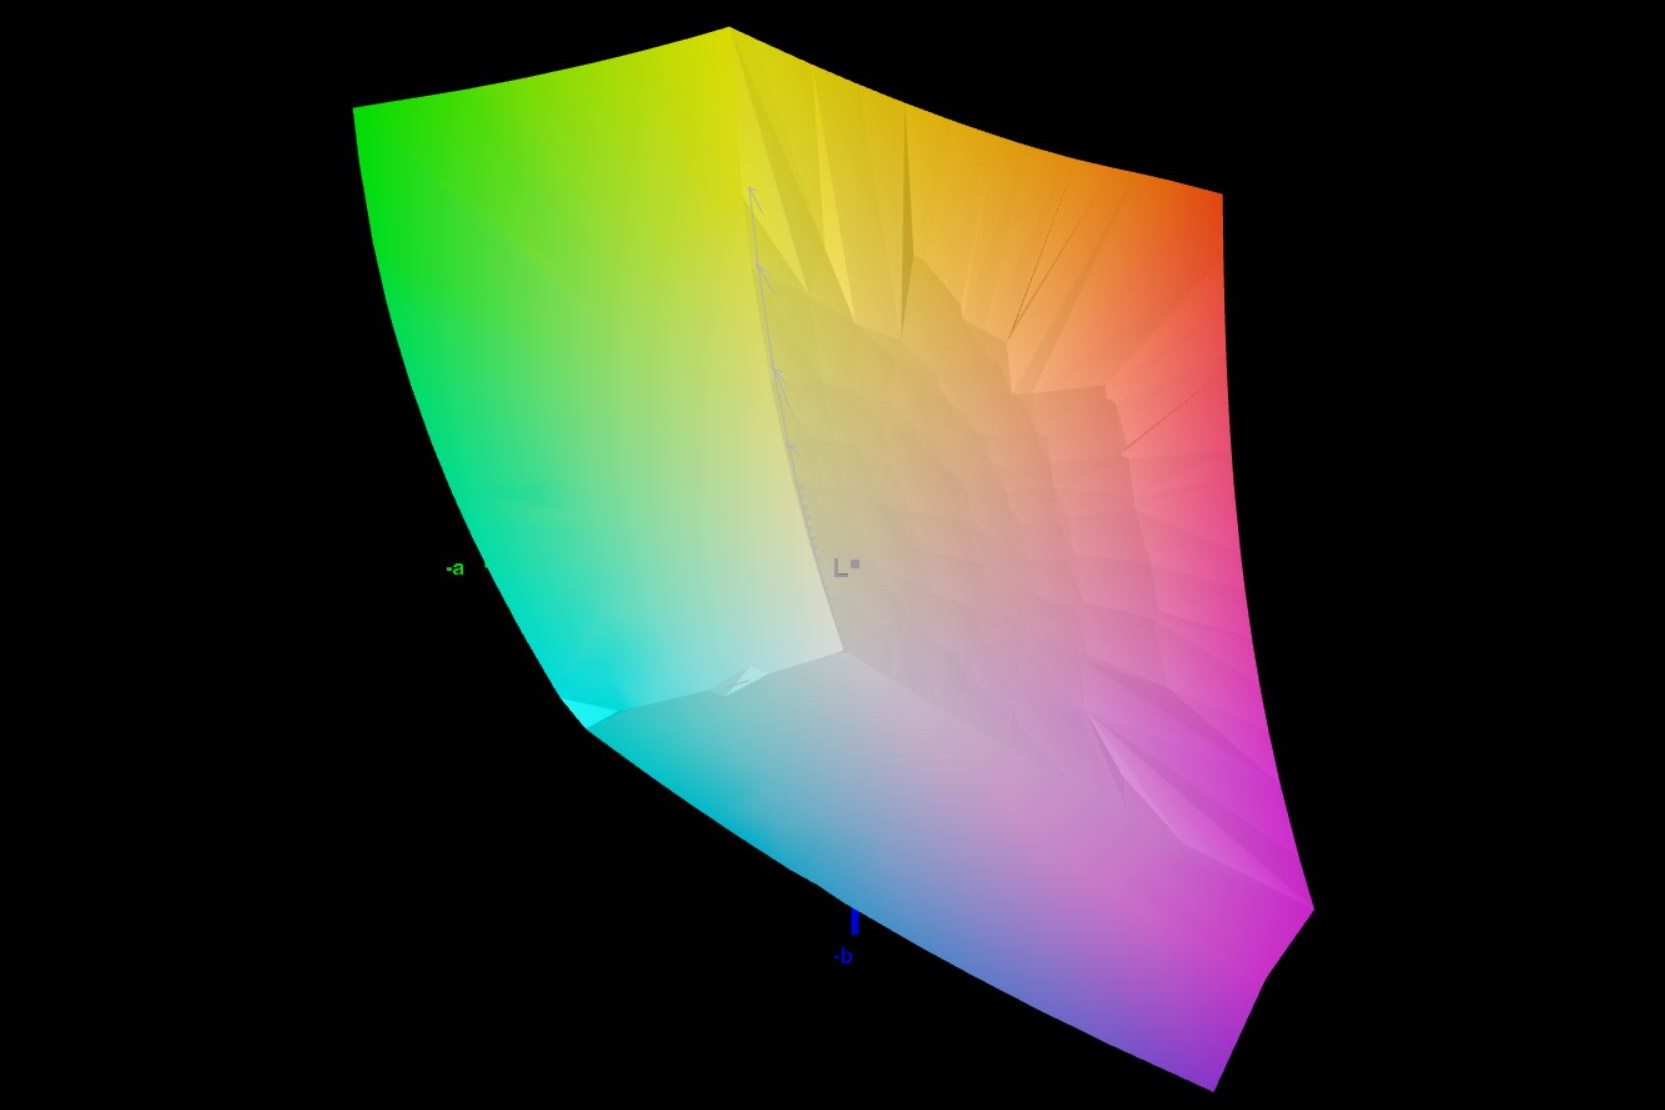
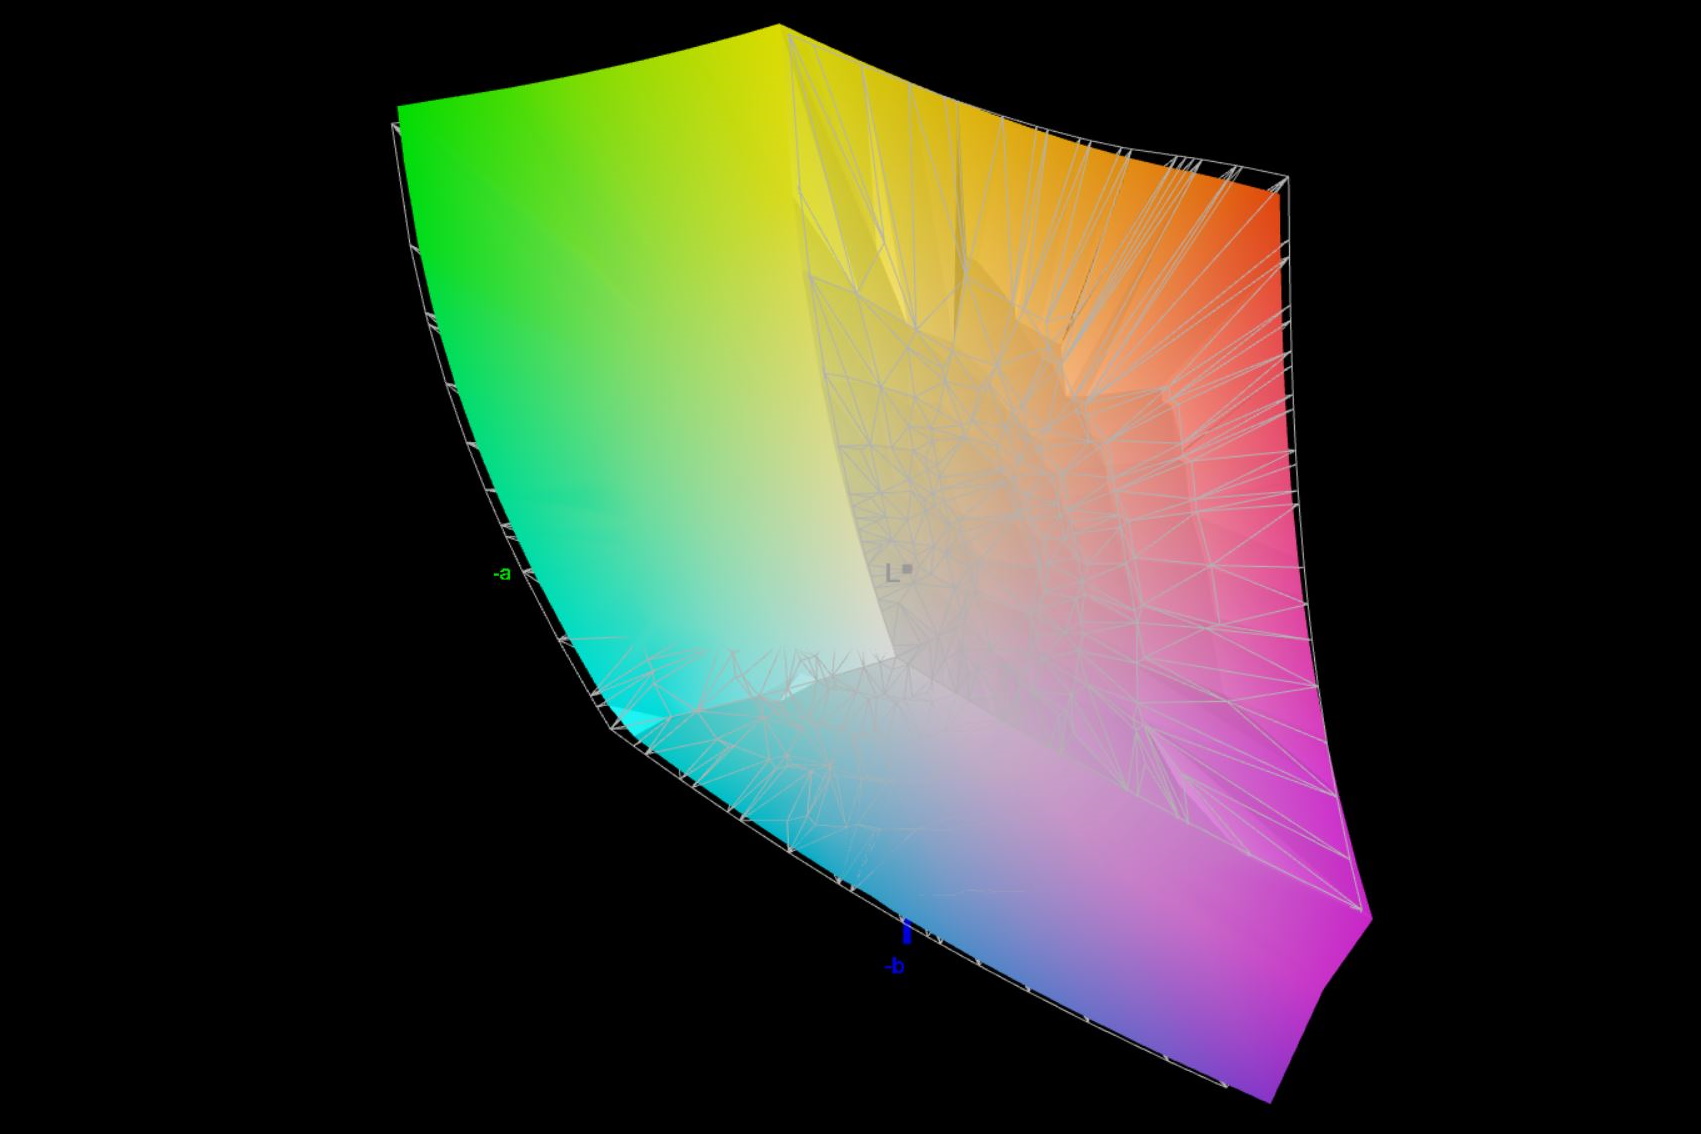
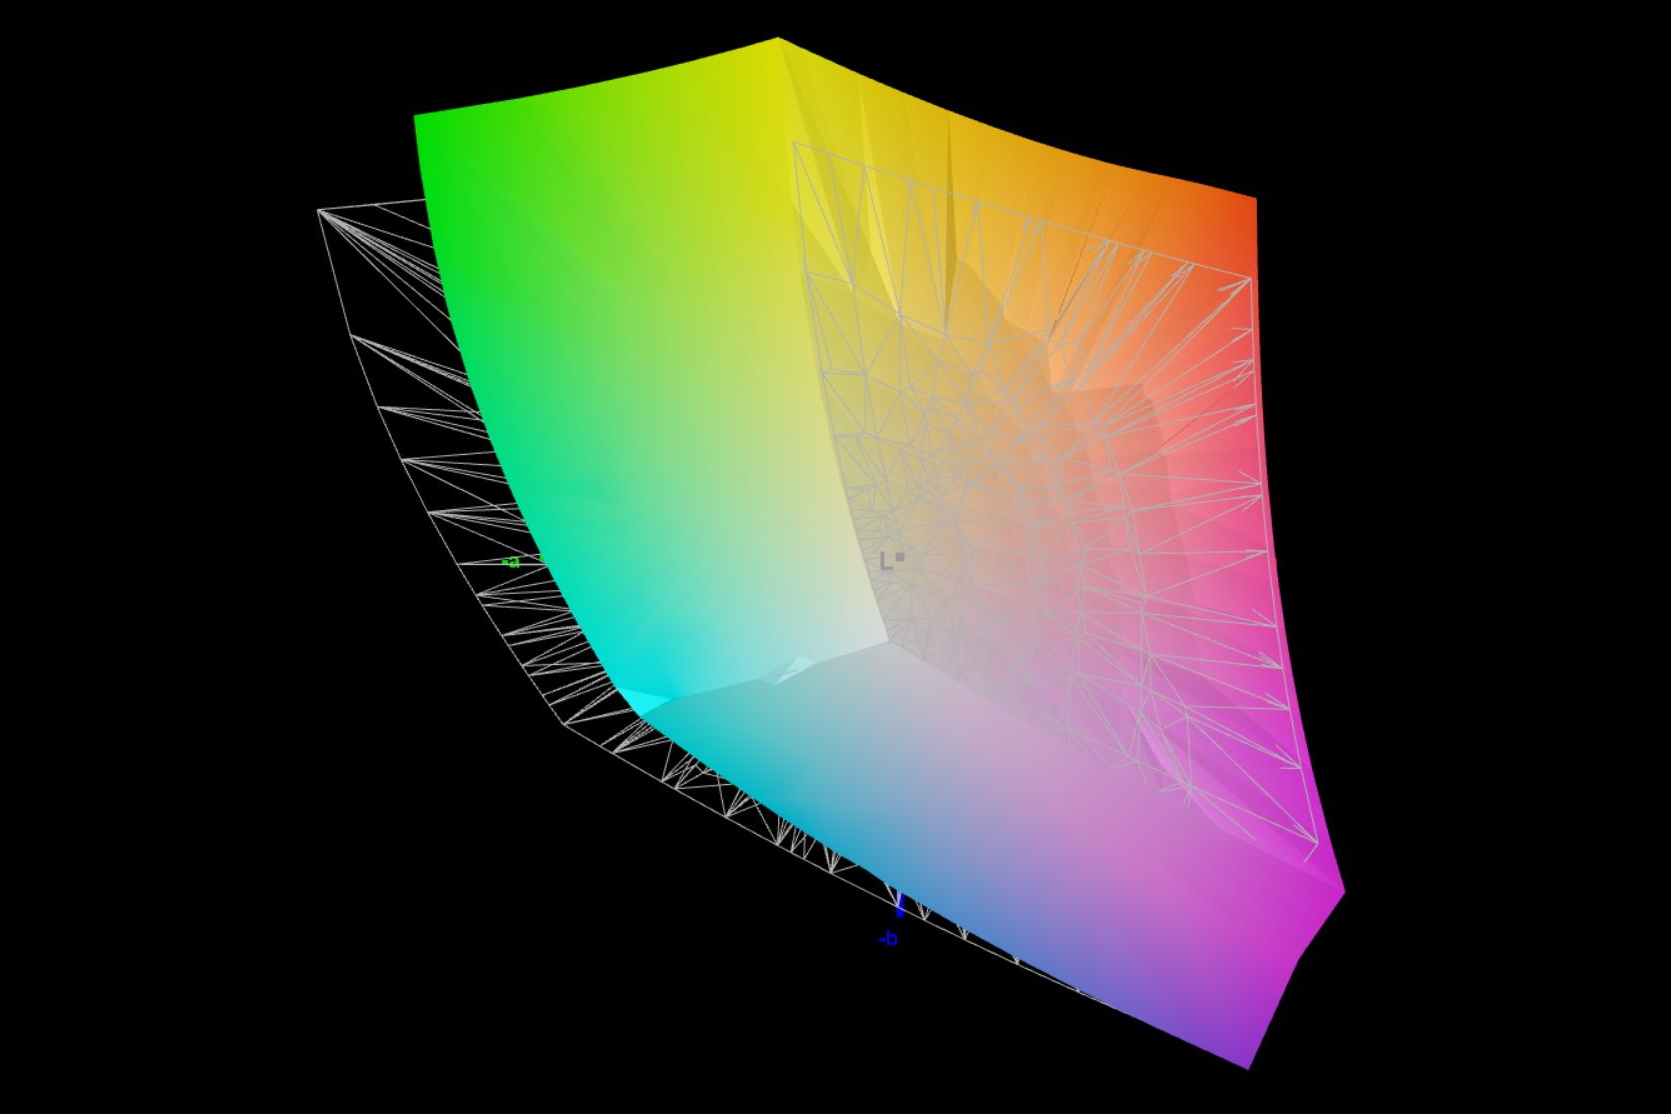
84.63% AdobeRGB 1998 (Argyll 3D)
99.92% sRGB (Argyll 3D)
96.61% Display P3 (Argyll 3D)
Gamma: 2.46
CCT: 6625 K
| Asus ROG Flow X16 GV601V TMX1603 (TL160ADMP03-0), IPS, 2560x1600, 16" | Asus ROG Flow X16 GV601RW-M5082W AUO B160QAN02.S, Mini LED, 2560x1600, 16.1" | Samsung Galaxy Book3 Ultra 16, i9-13900H RTX 4070 Samsung SDC4185 ATNA60CL03-0, OLED / AMOLED, 2880x1800, 16" | Lenovo Legion Pro 5 16IRX8 AU Optronics B160QAN03.1, IPS, 2560x1600, 16" | Lenovo Yoga Pro 7 14IRH G8 LEN145-3K, IPS, 3072x1920, 14.5" | MSI Katana 17 B13VFK B173HAN04.9, IPS LED, 1920x1080, 17.3" | |
|---|---|---|---|---|---|---|
| Display | 3% | 4% | -13% | 2% | -49% | |
| Display P3 Coverage (%) | 96.61 | 99.82 3% | 95.3 -1% | 71.2 -26% | 98.7 2% | 40.8 -58% |
| sRGB Coverage (%) | 99.92 | 99.99 0% | 99.1 -1% | 98.8 -1% | 100 0% | 61 -39% |
| AdobeRGB 1998 Coverage (%) | 84.63 | 90.21 7% | 97.4 15% | 73.3 -13% | 87.6 4% | 42.2 -50% |
| Response Times | -117% | 61% | -160% | -419% | -505% | |
| Response Time Grey 50% / Grey 80% * (ms) | 3.8 ? | 11 ? -189% | 2 ? 47% | 14.5 ? -282% | 31.5 ? -729% | 33 ? -768% |
| Response Time Black / White * (ms) | 7.6 ? | 11 ? -45% | 2 ? 74% | 10.4 ? -37% | 15.8 ? -108% | 26 ? -242% |
| PWM Frequency (Hz) | 7400 ? | 250 ? | ||||
| Screen | 16% | 2% | 8% | 26% | -111% | |
| Brightness middle (cd/m²) | 486 | 498 2% | 403 -17% | 405.7 -17% | 441 -9% | 267 -45% |
| Brightness (cd/m²) | 469 | 502 7% | 408 -13% | 368 -22% | 453 -3% | 256 -45% |
| Brightness Distribution (%) | 91 | 94 3% | 98 8% | 87 -4% | 92 1% | 93 2% |
| Black Level * (cd/m²) | 0.39 | 0.11 72% | 0.38 3% | 0.34 13% | 0.21 46% | |
| Contrast (:1) | 1246 | 4527 263% | 1068 -14% | 1297 4% | 1271 2% | |
| Colorchecker dE 2000 * | 2.27 | 1.87 18% | 2.63 -16% | 1.65 27% | 0.6 74% | 4.7 -107% |
| Colorchecker dE 2000 max. * | 5.73 | 6.15 -7% | 4.07 29% | 4.2 27% | 1.3 77% | 20.4 -256% |
| Colorchecker dE 2000 calibrated * | 0.6 | 1.94 -223% | 0.53 12% | 0.6 -0% | 4.5 -650% | |
| Greyscale dE 2000 * | 3.36 | 3.15 6% | 2.69 20% | 1.2 64% | 0.8 76% | 1.5 55% |
| Gamma | 2.46 89% | 330.95 1% | 2.48 89% | 2.3 96% | 2.2 100% | 2.12 104% |
| CCT | 6625 98% | 7294 89% | 6907 94% | 6453 101% | 6597 99% | 6552 99% |
| Media total (Programa/Opciones) | -33% /
-6% | 22% /
13% | -55% /
-20% | -130% /
-43% | -222% /
-154% |
* ... más pequeño es mejor
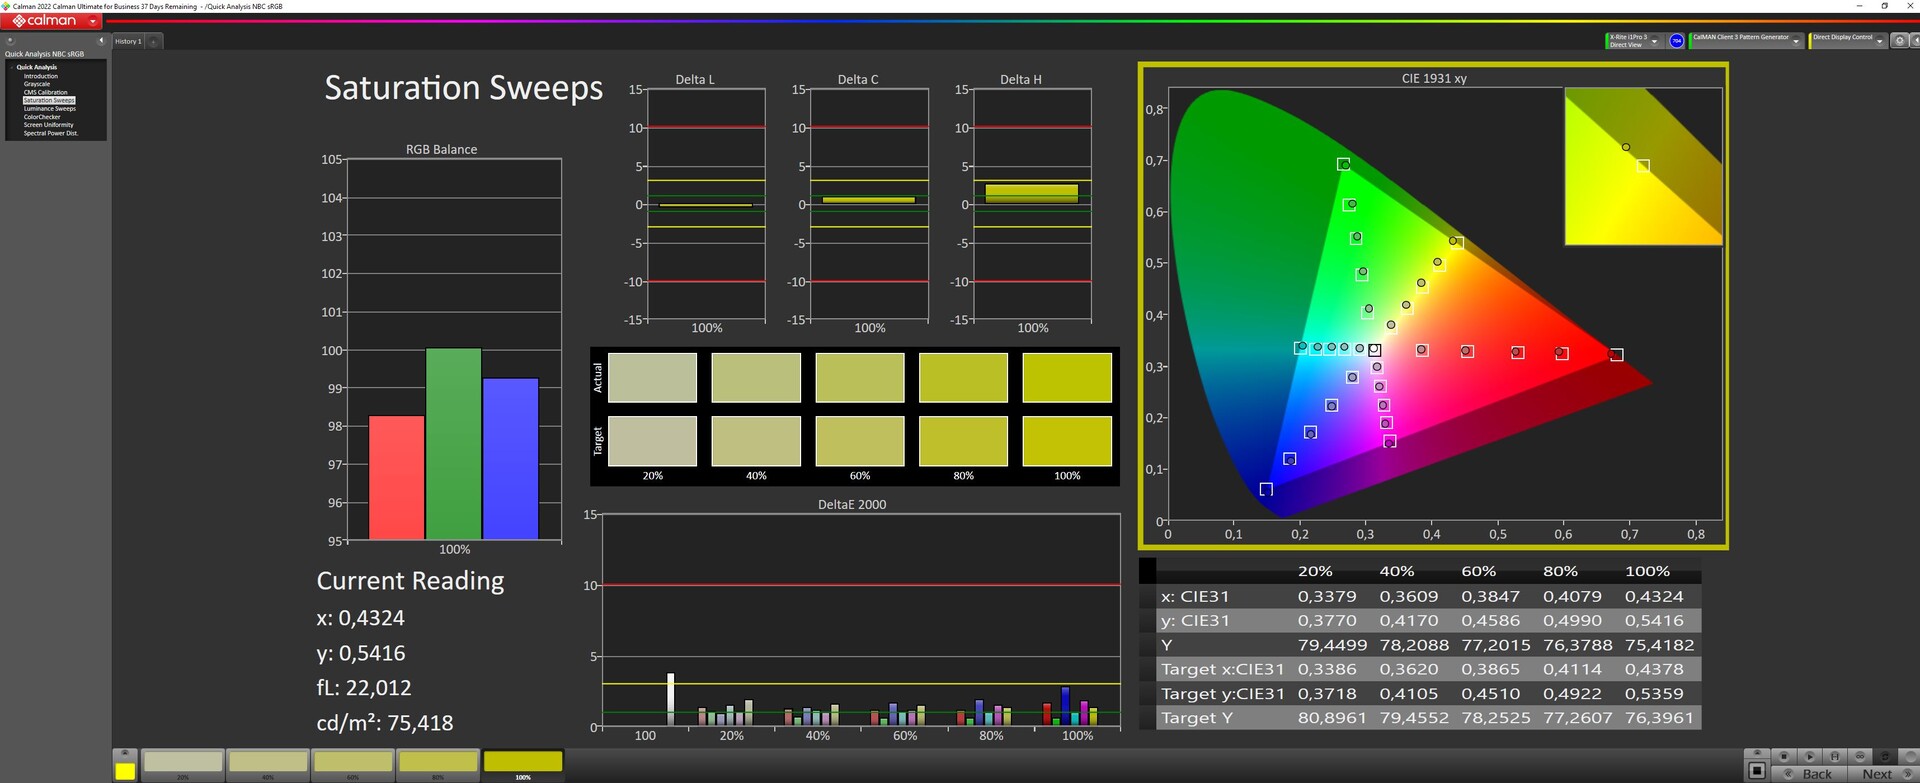
Asus anuncia el dispositivo con 100 por ciento DCI P3 y medimos alrededor de 97 por ciento. AdobeRGB está cubierto hasta aproximadamente el 85 por ciento y sRGB por completo.
Para mejorar la precisión del color, ayuda reducir el brillo del X16 a aproximadamente el 50 por ciento. Posteriormente, el DeltaE de la escala de grises mejora de 3.36 a sólo 2. Además, el DeltaE de ColorChecker cae aún más. Una nueva calibración con i1Profiler no tiene mucho sentido.
Tiempos de respuesta del display
| ↔ Tiempo de respuesta de Negro a Blanco | ||
|---|---|---|
| 7.6 ms ... subida ↗ y bajada ↘ combinada | ↗ 4 ms subida | 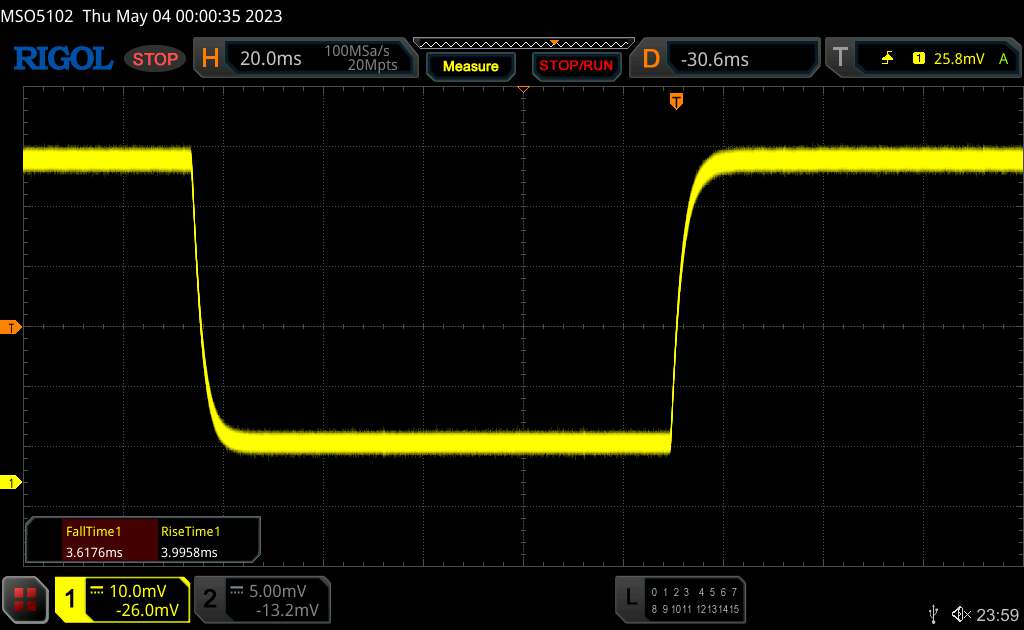 |
| ↘ 3.6 ms bajada | ||
| La pantalla mostró tiempos de respuesta muy rápidos en nuestros tests y debería ser adecuada para juegos frenéticos. En comparación, todos los dispositivos de prueba van de ##min### (mínimo) a 240 (máximo) ms. » 22 % de todos los dispositivos son mejores. Esto quiere decir que el tiempo de respuesta medido es mejor que la media (19.8 ms) de todos los dispositivos testados. | ||
| ↔ Tiempo de respuesta 50% Gris a 80% Gris | ||
| 3.8 ms ... subida ↗ y bajada ↘ combinada | ↗ 1.8 ms subida | 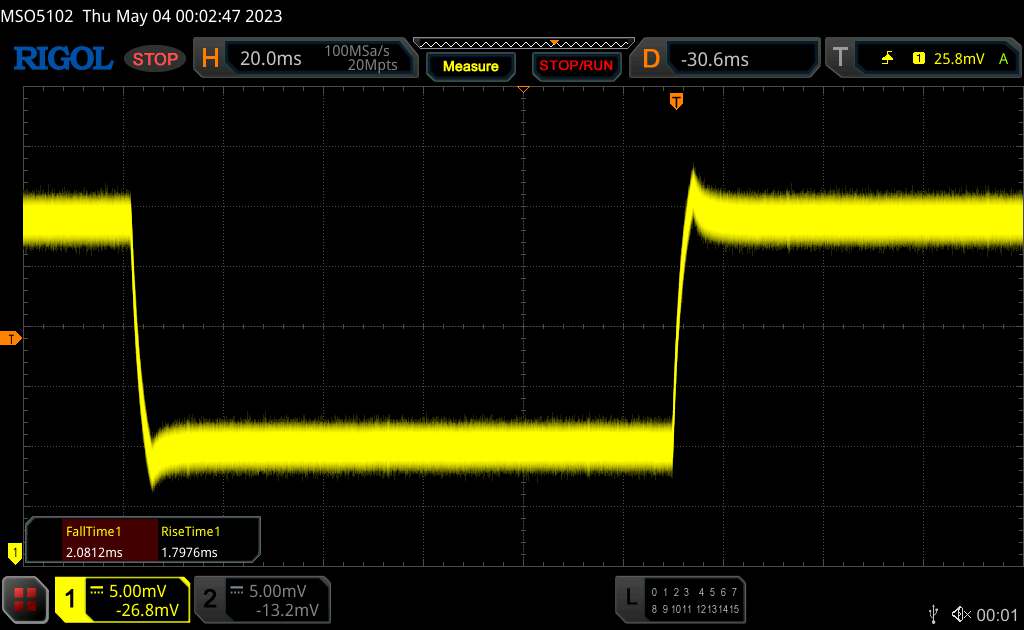 |
| ↘ 2 ms bajada | ||
| La pantalla mostró tiempos de respuesta muy rápidos en nuestros tests y debería ser adecuada para juegos frenéticos. En comparación, todos los dispositivos de prueba van de ##min### (mínimo) a 636 (máximo) ms. » 15 % de todos los dispositivos son mejores. Esto quiere decir que el tiempo de respuesta medido es mejor que la media (31 ms) de todos los dispositivos testados. | ||
Parpadeo de Pantalla / PWM (Pulse-Width Modulation)
| Parpadeo de Pantalla / PWM no detectado | 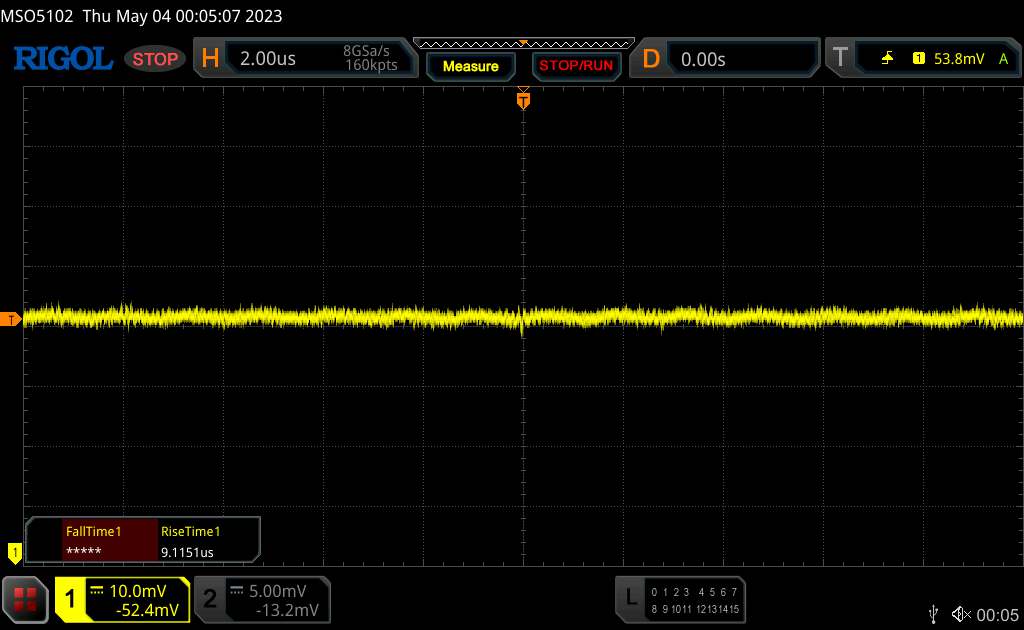 | ||
Comparación: 52 % de todos los dispositivos testados no usaron PWM para atenuar el display. Si se usó, medimos una media de 7754 (mínimo: 5 - máxmo: 343500) Hz. | |||
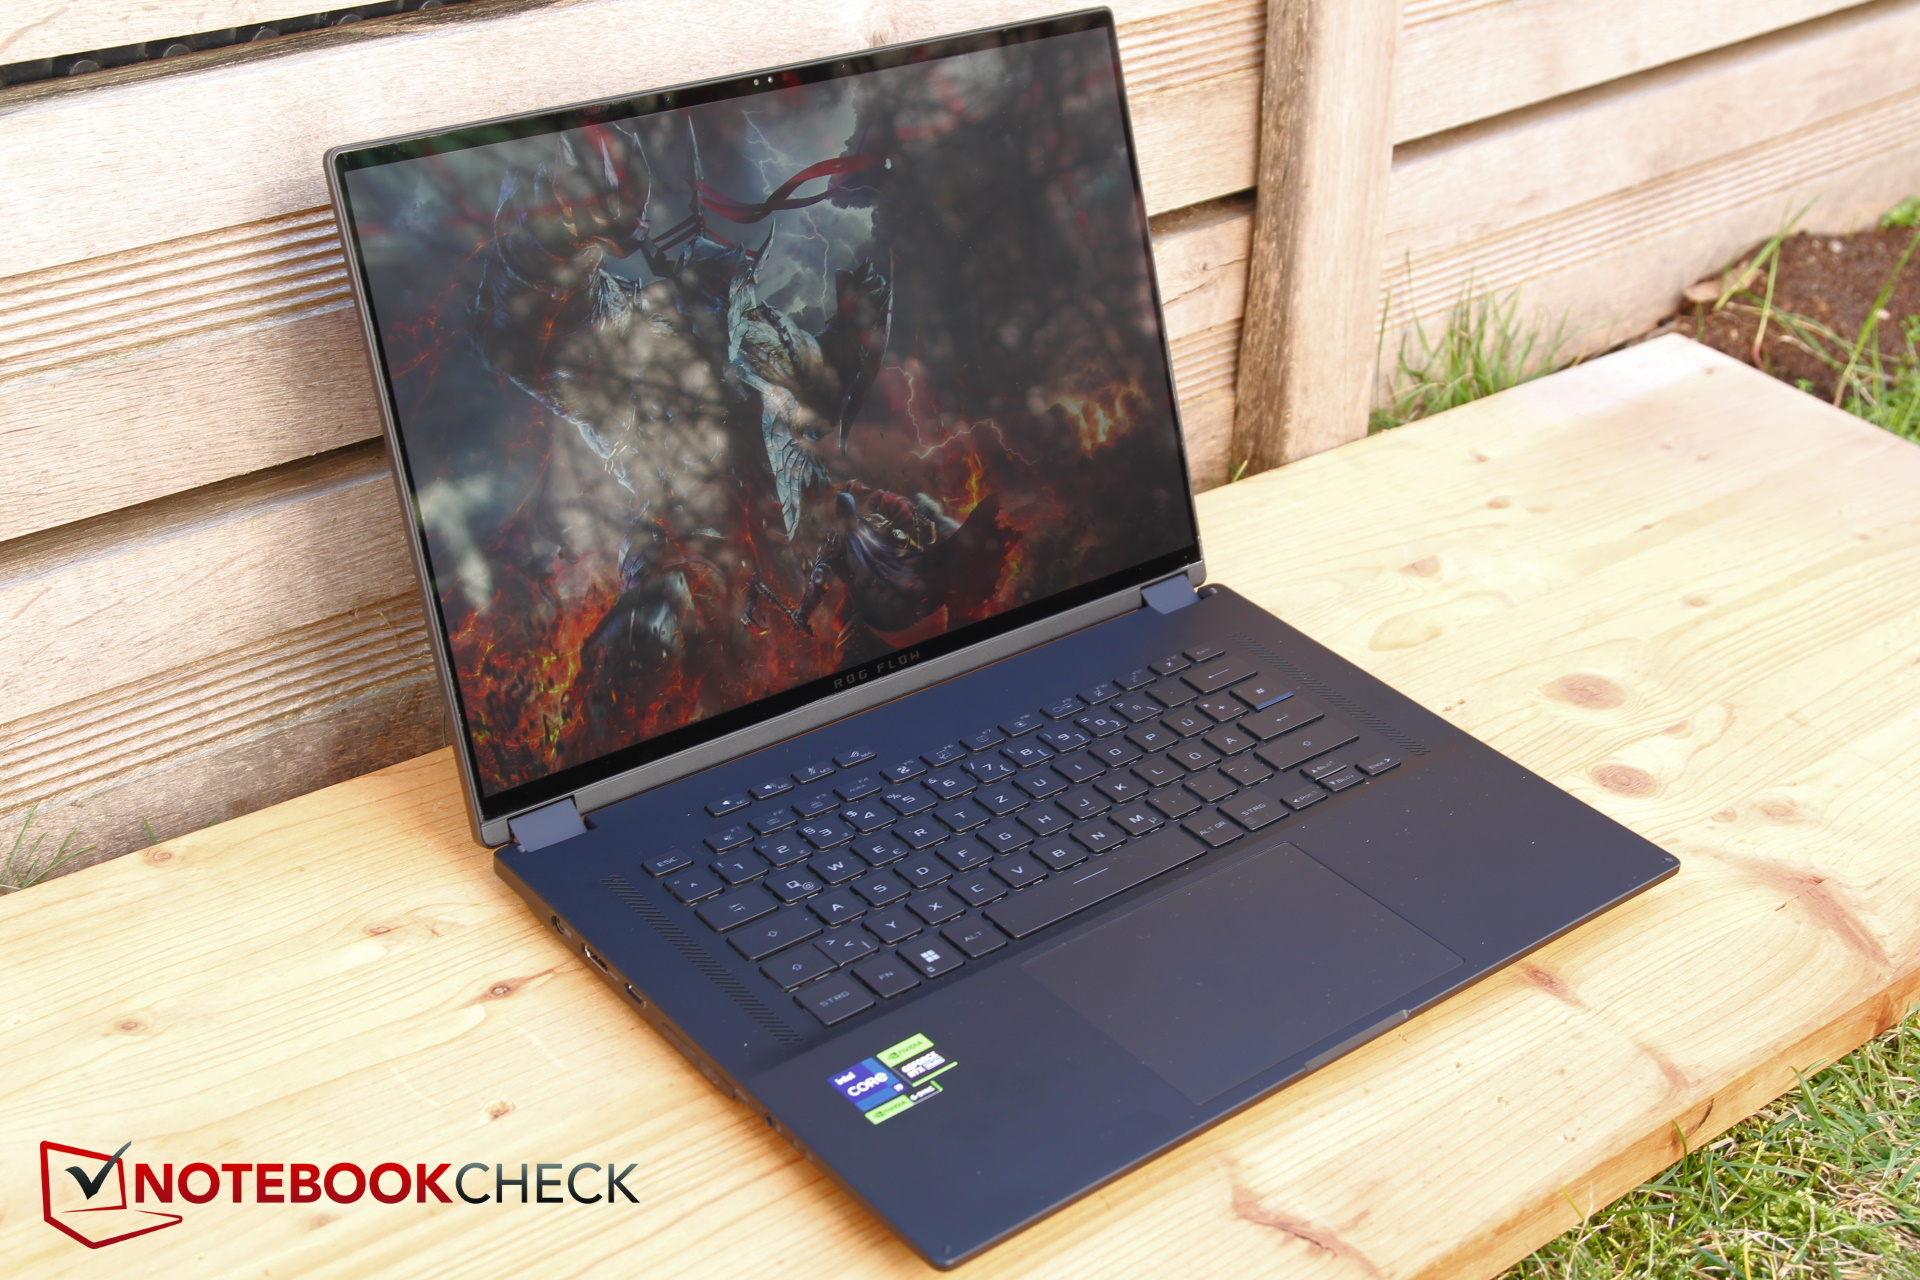
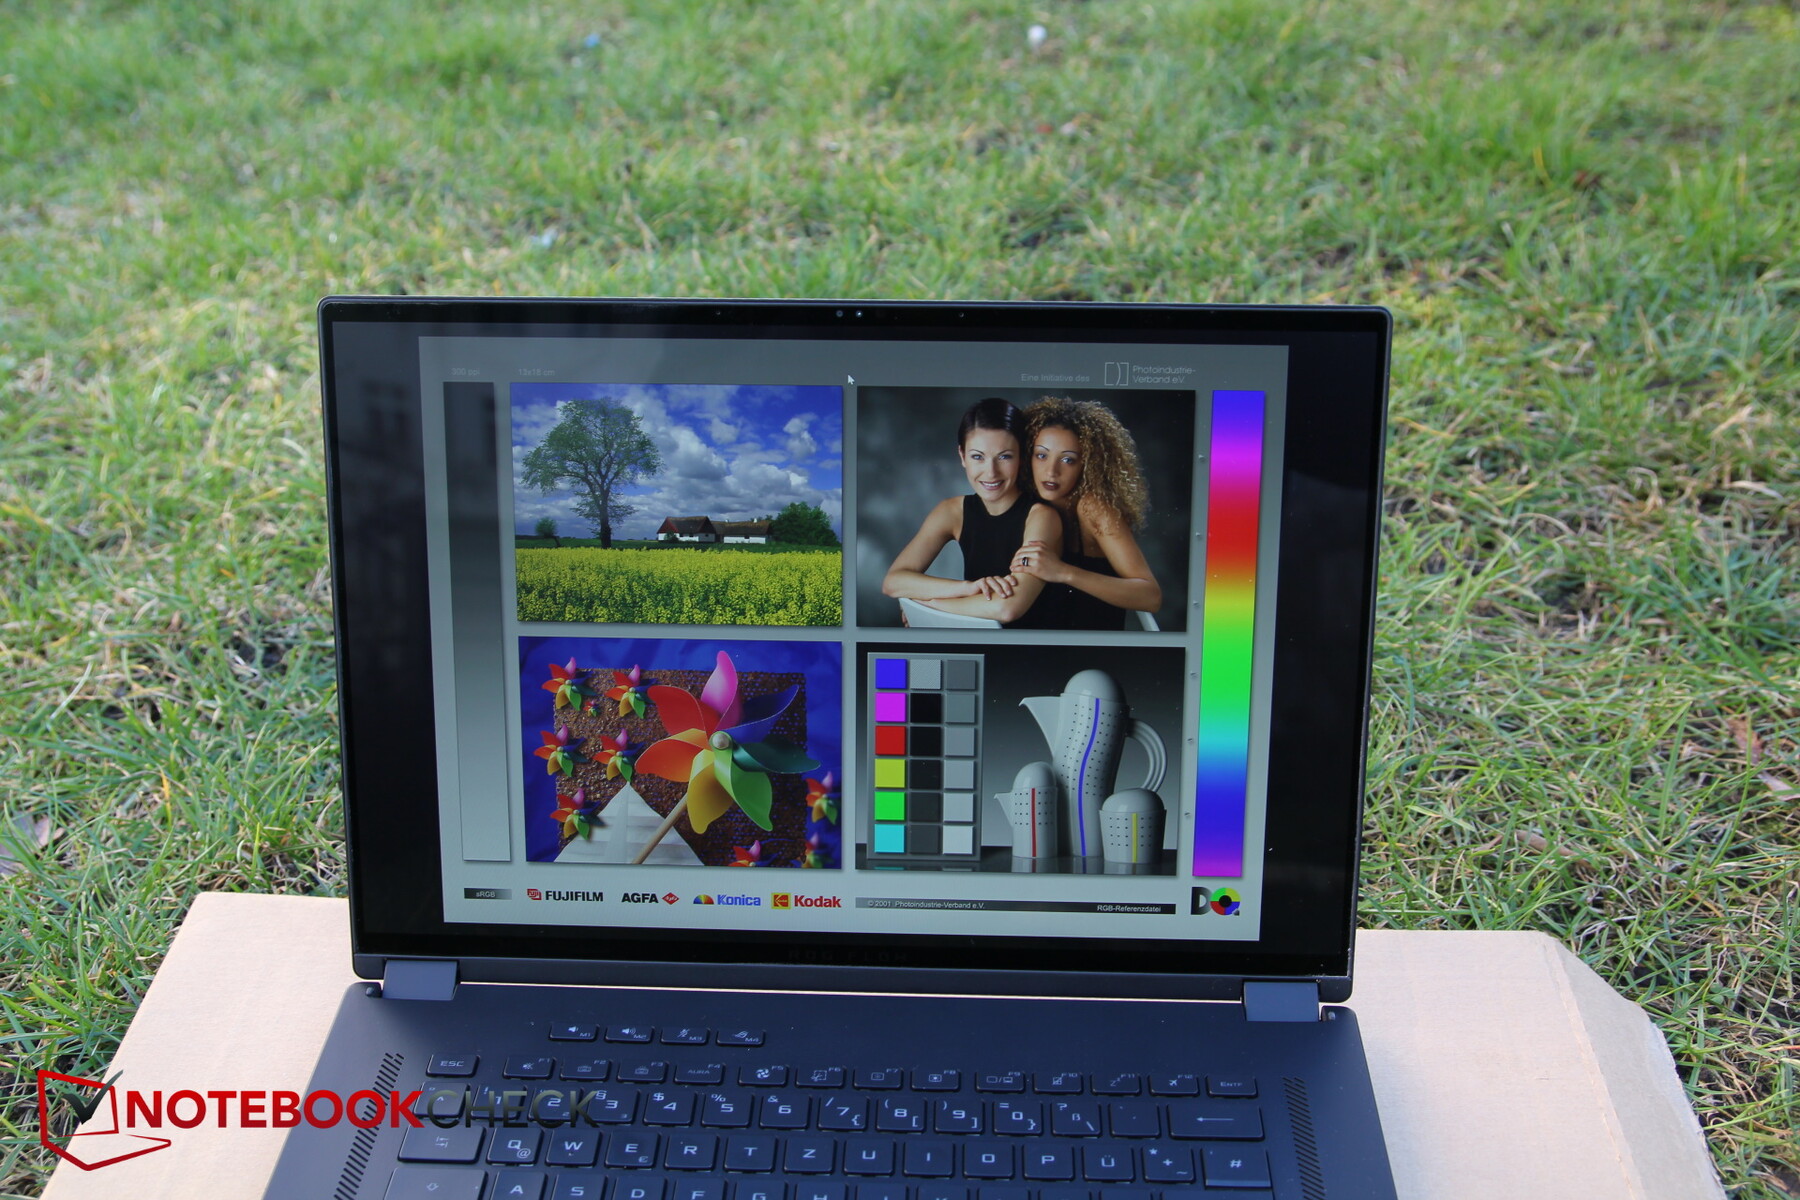
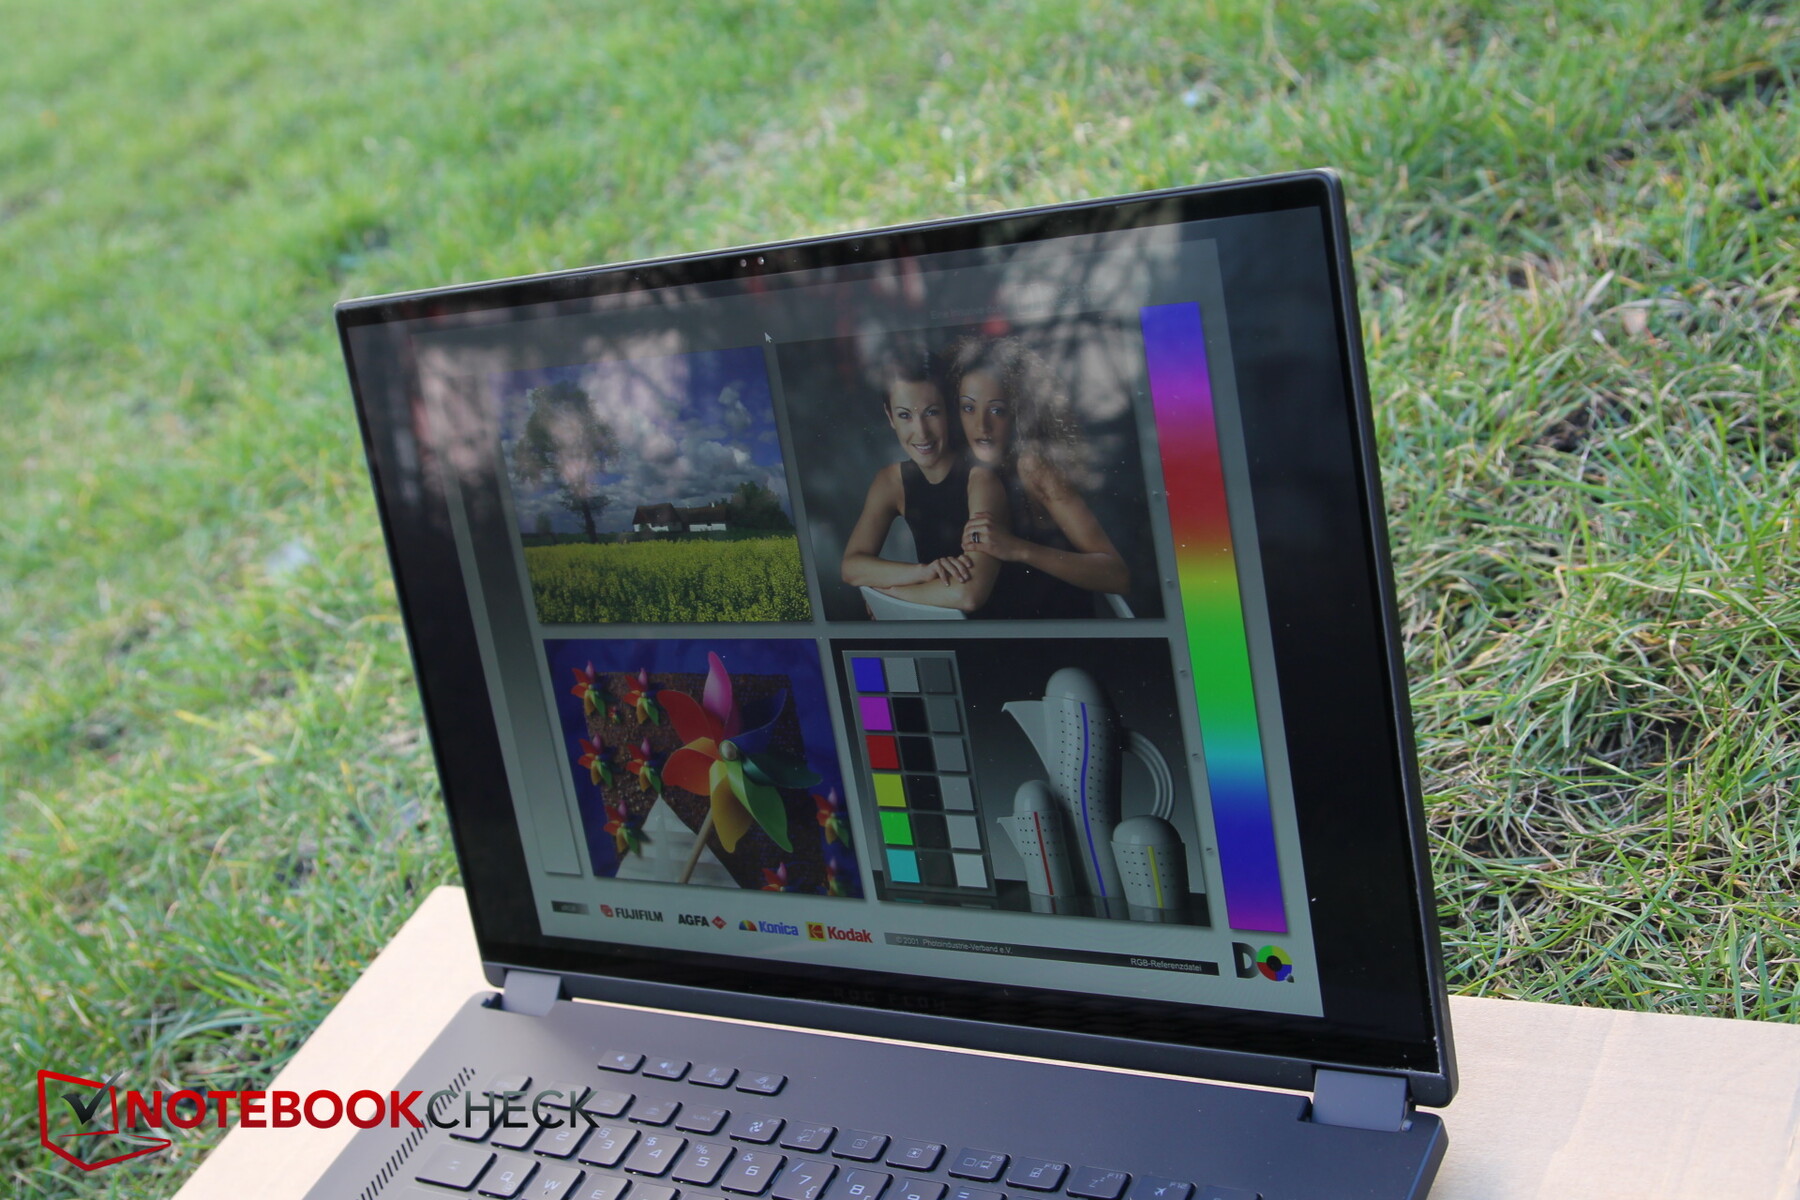
En exteriores, el altísimo brillo ayuda tanto a la luz directa del sol como a la sombra. Vista desde ángulos amplios, la pantalla táctil brillante dificulta la experiencia visual.

Rendimiento - Una potente pizarra Asus
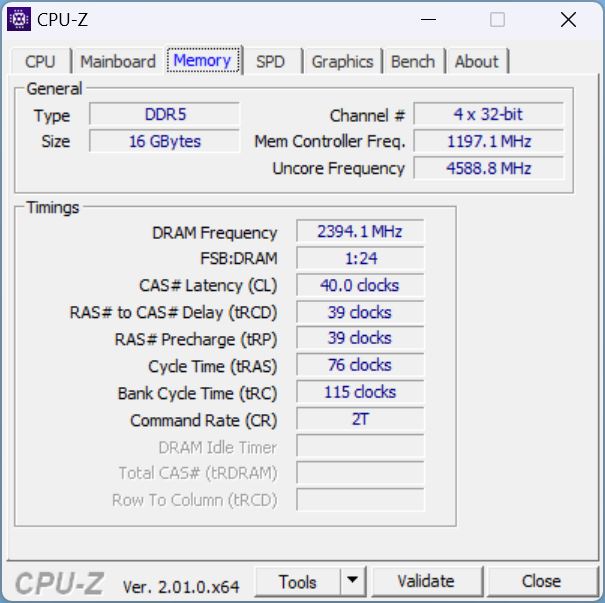
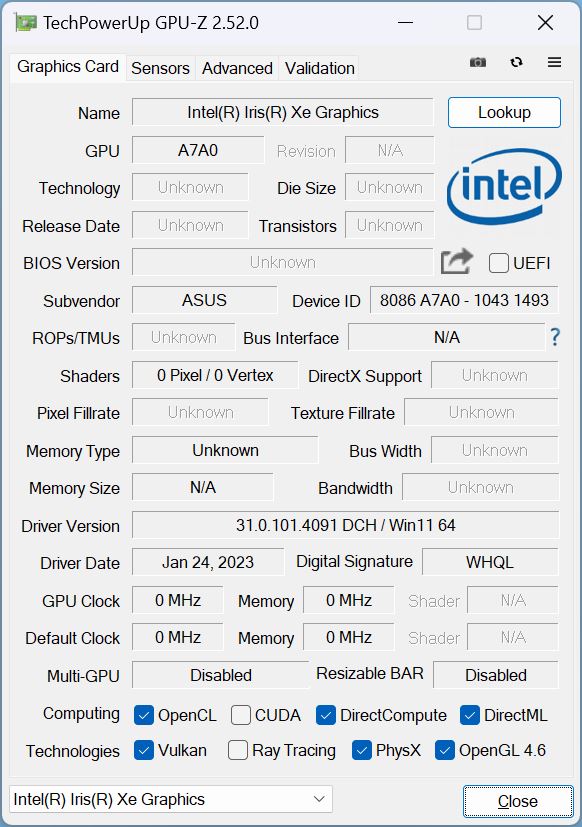
Todas las configuraciones tienen en común el Core i9-13900H. Este se combina opcionalmente con unaRTX 4050, RTX 4060 o RTX 4070. Según el sitio web, las SKU con las dos tarjetas gráficas más débiles solo están equipadas con 8 GB de RAM, mientras que la configuración RTX 4070 viene con 16 GB. Sin embargo, nuestra unidad de análisis está equipada con una RTX 4060 y 16 GB de RAM. Parece que Asus ha mejorado nuestro modelo de pruebas. Aparte de eso, el dispositivo puede equiparse con hasta 64 GB de RAM.
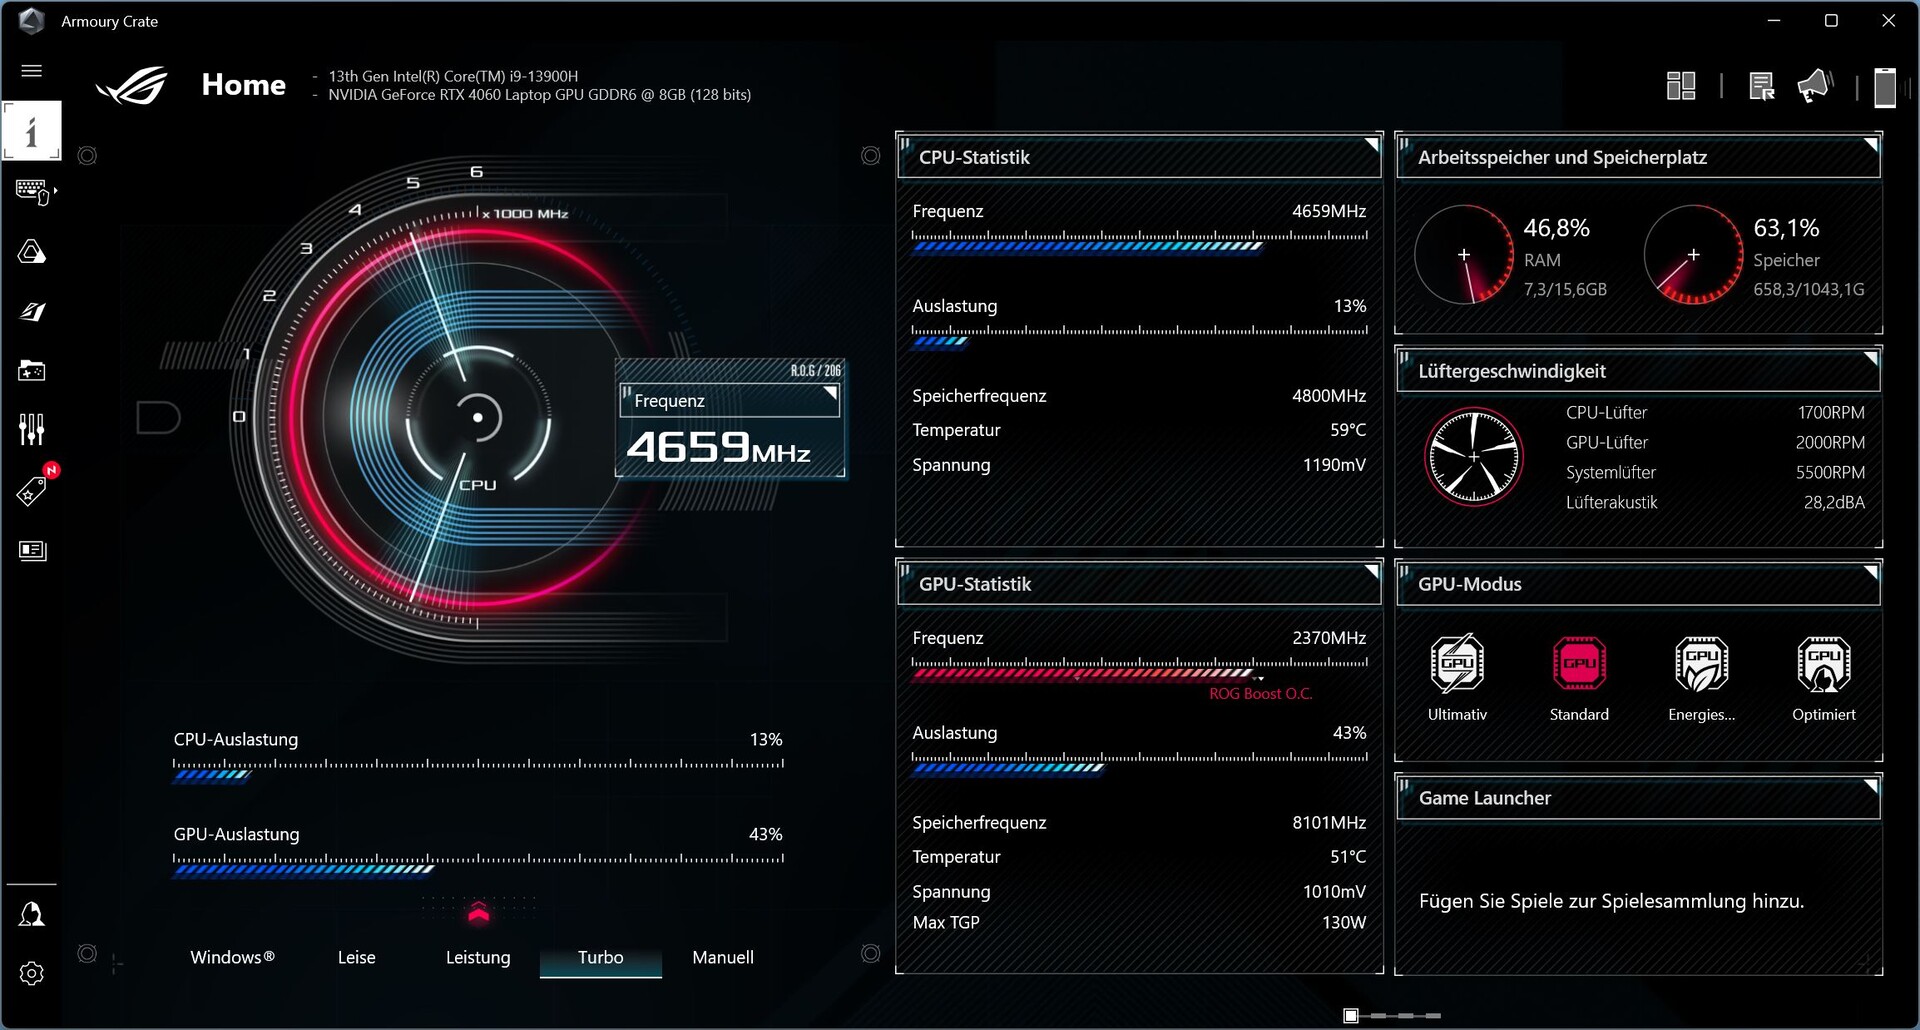
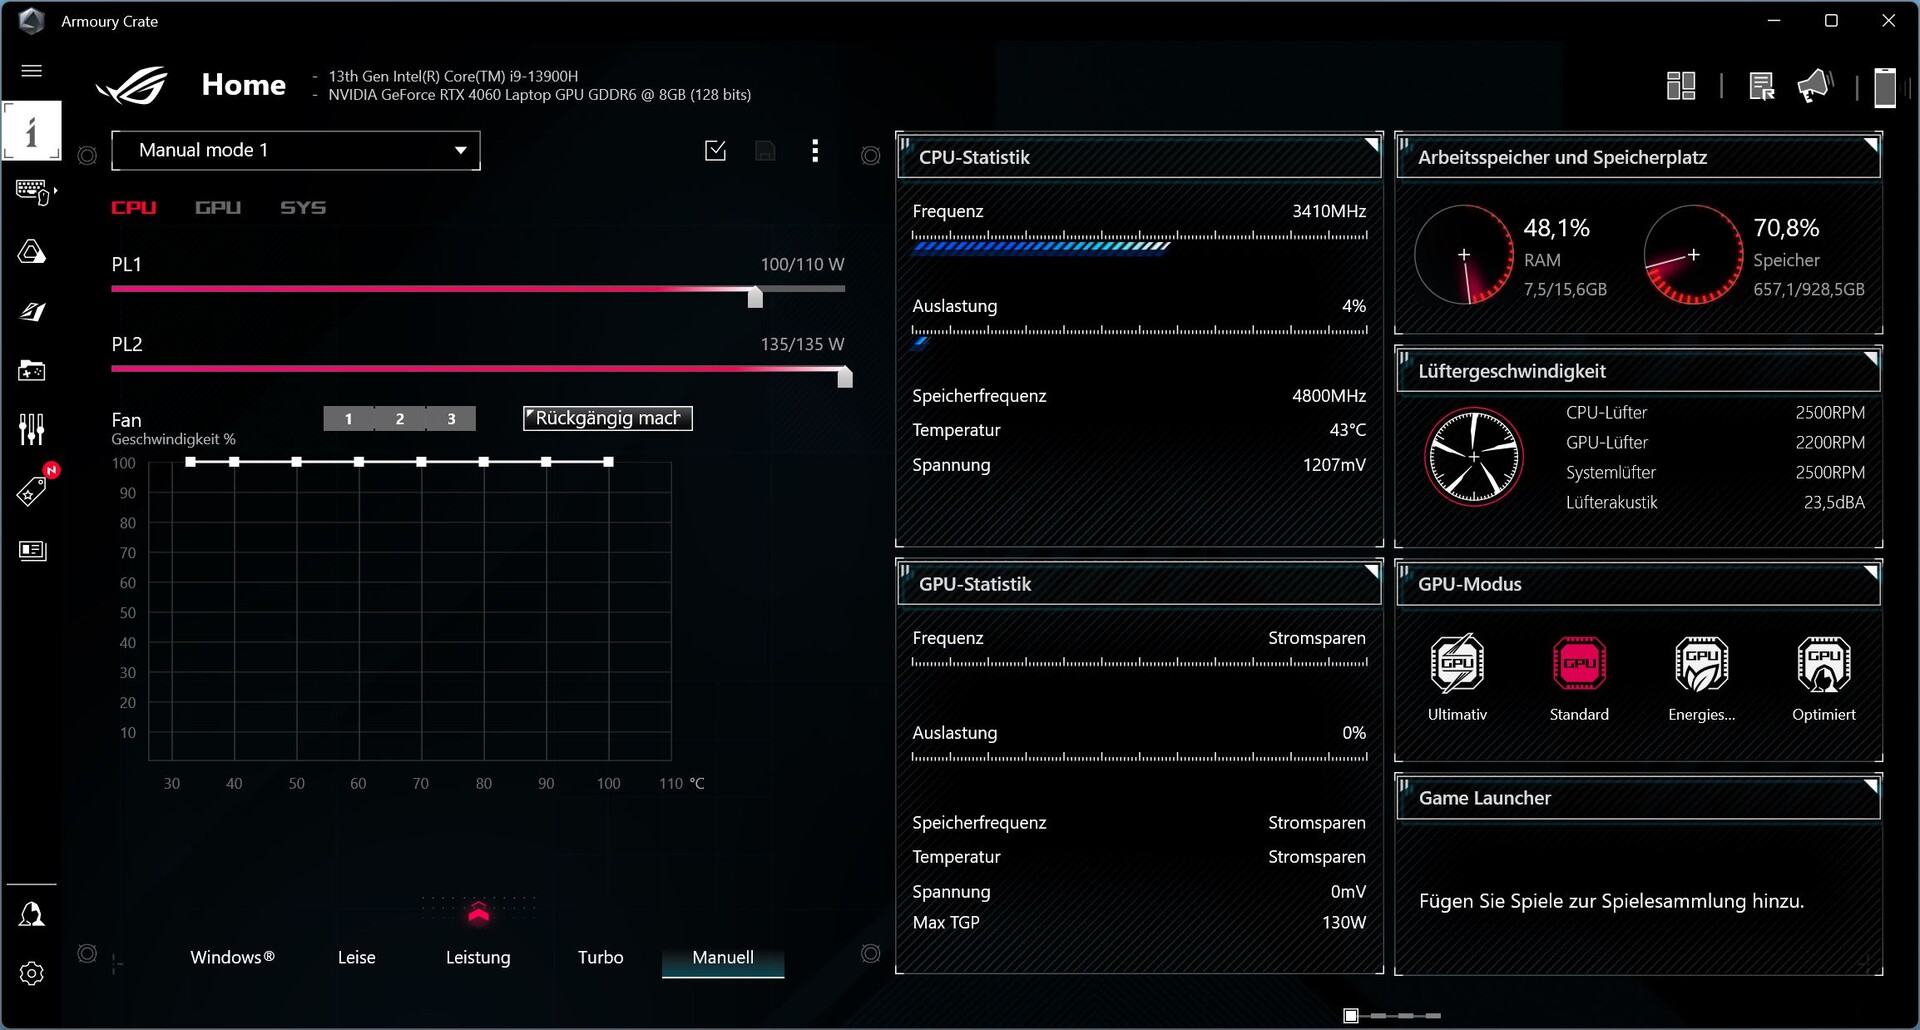
Condiciones de la prueba
Los portátiles de juego Asus siempre tienen dos apps preinstaladas del fabricante que casi recuerdan al bloatware. MyAsus es responsable de las preguntas de soporte mientras que Armory Crate actúa como centro de control y, como por desgracia es habitual estos días, recopila datos. La aplicación aún no está especialmente madura, sobre todo en lo que respecta a la traducción. Continuamente hay partes que faltan o están cortadas. Además, la aplicación a veces se actualiza de forma voluntaria al arrancar, lo que significa que el usuario tiene que esperar mucho tiempo antes de tener acceso a cosas como los modos de rendimiento, ¡algo molesto!
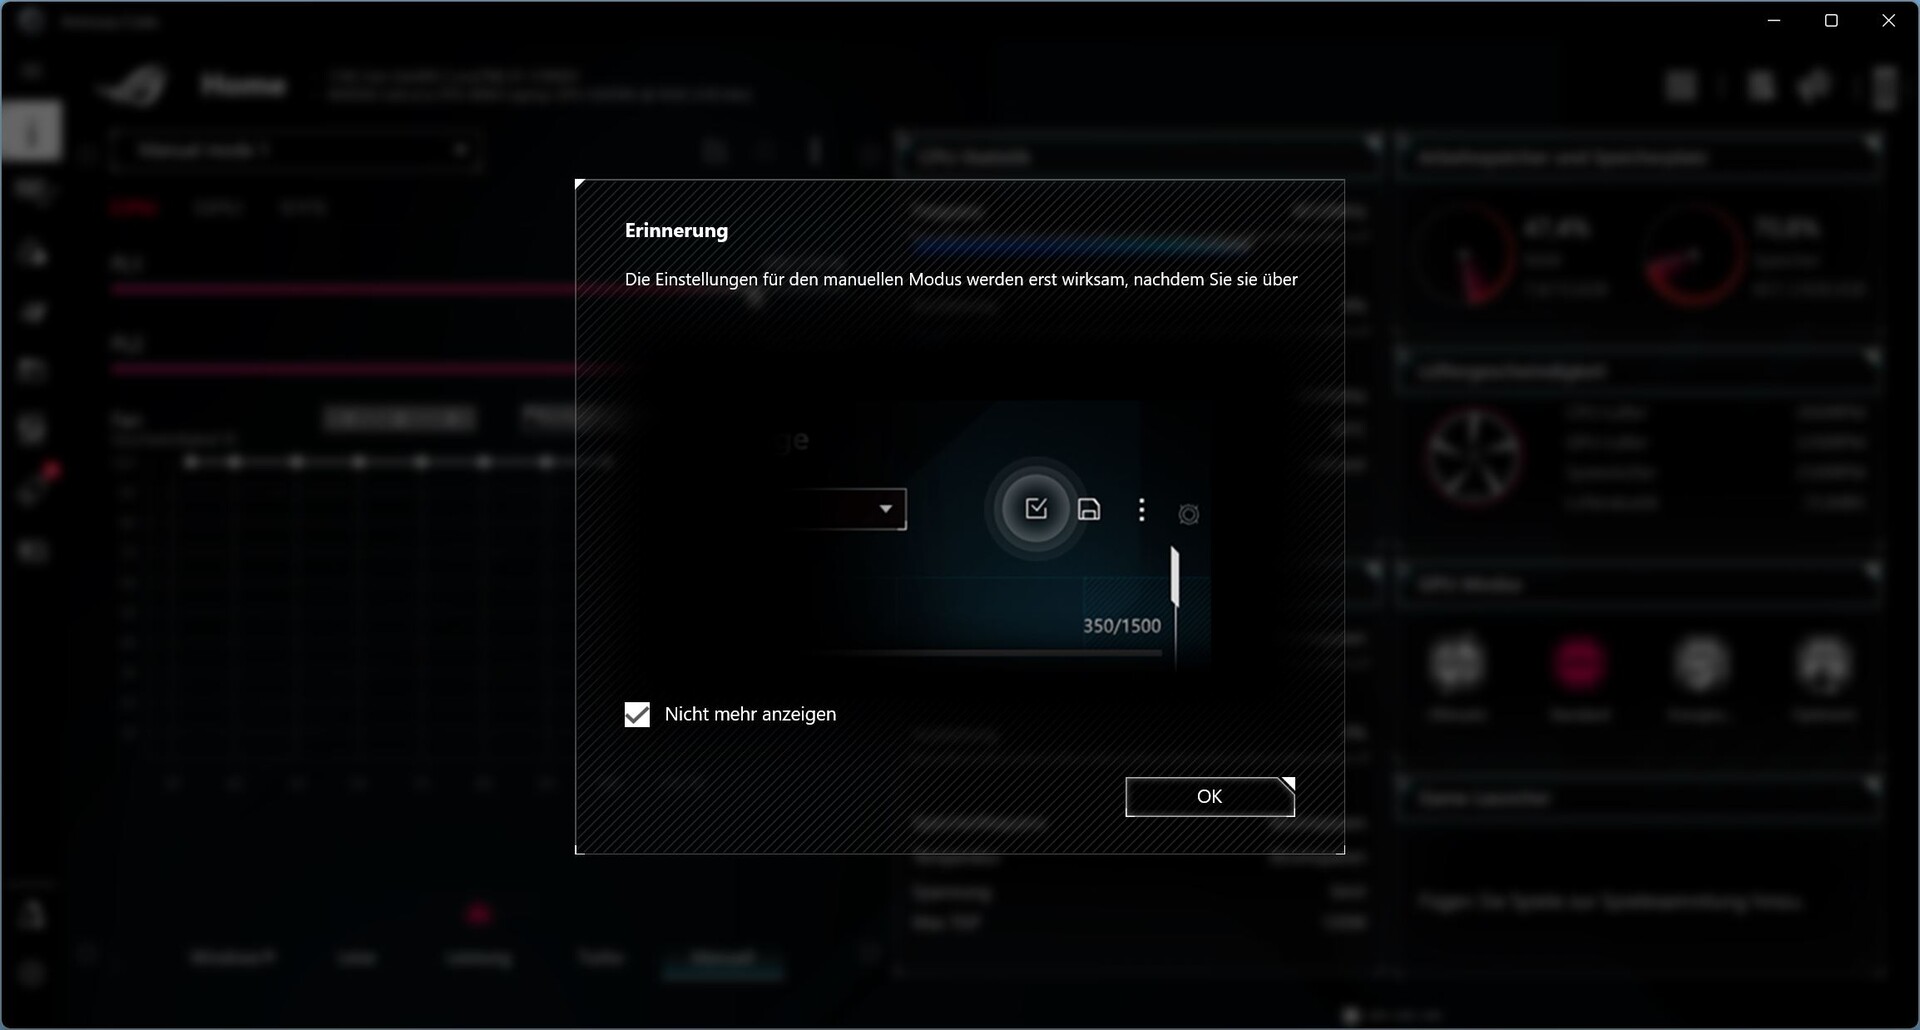
Hay un total de cuatro modos de rendimiento (Windows, Silencio, Rendimiento, Turbo, Manual). Para obtener los mejores resultados en los benchmarks, optamos por el modo turbo. Sin embargo, seguimos presentando todos los resultados obtenidos utilizando los otros modos. También puedes encontrar aquí el interruptor MUX, es decir, la conmutación entre la iGPU y la dGPU.
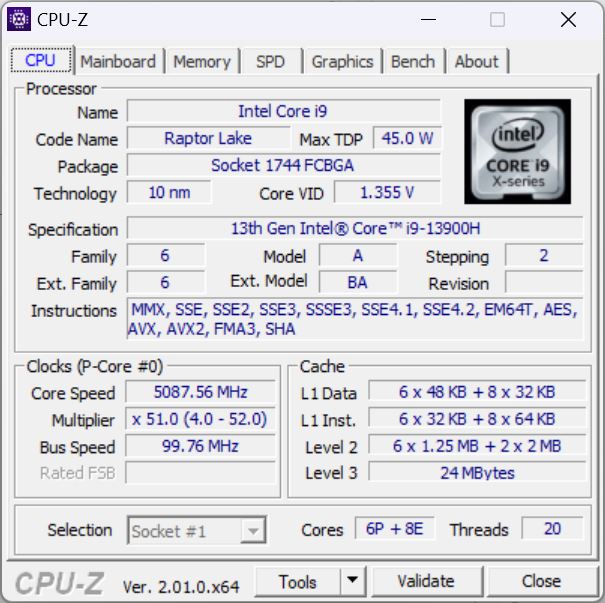
Procesador
A pesar de la delgada carcasa, el X16 alberga un Intel Core i9-13900Huna CPU Raptor Lake de gama alta con 6 núcleos P y 8 núcleos E que puede funcionar desde 1,9 GHz (velocidad de reloj base del núcleo E) hasta 5,4 GHz (turbo de un solo núcleo).
Dado que la nueva serie H apenas tiene cambios respecto a la serie Alder Lake, no sorprende que el X16 sea incapaz de despegarse de la competencia del año pasado. El Lenovo Legion Pro 7con su CPU HX, está en otra liga. Sin embargo, es impresionante que la puntuación esté un 10 por ciento por encima de la media de nuestra base de datos i9-13900H, a pesar del delgado factor de forma.
Tras las dos o tres primeras ejecuciones, el valor bajó un poco. Abajo, puedes encontrar el TDP de la CPU dependiendo del modo de rendimiento seleccionado, aunque estos valores son más teóricos (HWinfo). Como resultado, la CPU apenas consume más de 100 vatios, incluso usando el modo turbo en CinebenchR15 y durante una ejecución en modo silencioso el TDP cayó por debajo de 60 vatios.
En modo batería, el modo silencioso se selecciona automáticamente. El turbo está bloqueado pero teóricamente puedes seguir encendiéndolo.
| Leistungsmodus/TDP der CPU | PL1 | PL2 | Puntuación |
|---|---|---|---|
| Turbo | 110 | 135 | 3.100 |
| Leistung | 100 | 120 | 2.882 |
| Rendimiento | 80 | 100 | 2.342 |
| Akku Leistung | 38 | 60 | 2.199 |
| Dirección | 30 | 30 | 1.604 |
Cinebench R15 Multi Continuous Test
Cinebench R23: Multi Core | Single Core
Cinebench R20: CPU (Multi Core) | CPU (Single Core)
Cinebench R15: CPU Multi 64Bit | CPU Single 64Bit
Blender: v2.79 BMW27 CPU
7-Zip 18.03: 7z b 4 | 7z b 4 -mmt1
Geekbench 5.5: Multi-Core | Single-Core
HWBOT x265 Benchmark v2.2: 4k Preset
LibreOffice : 20 Documents To PDF
R Benchmark 2.5: Overall mean
| CPU Performance rating | |
| Lenovo Legion Pro 7 16IRX8H | |
| Media de la clase Gaming | |
| Asus ROG Flow X16 GV601V | |
| Asus ROG Zephyrus M16 GU604VY-NM042X | |
| Apple MacBook Pro 16 2023 M2 Max -6! | |
| MSI Creator Z16P B12UHST | |
| Medio Intel Core i9-13900H | |
| Lenovo Legion Slim 7-16IAH 82TF004YGE | |
| MSI Katana 17 B13VFK | |
| Razer Blade 15 OLED (Early 2022) | |
| Lenovo Legion S7 16ARHA7 | |
| Asus ROG Flow X16 GV601RW-M5082W | |
| Corsair Voyager a1600 | |
| Cinebench R20 / CPU (Single Core) | |
| Lenovo Legion Pro 7 16IRX8H | |
| Media de la clase Gaming (442 - 913, n=106, últimos 2 años) | |
| Asus ROG Flow X16 GV601V | |
| Asus ROG Zephyrus M16 GU604VY-NM042X | |
| MSI Creator Z16P B12UHST | |
| Medio Intel Core i9-13900H (428 - 792, n=25) | |
| MSI Katana 17 B13VFK | |
| Lenovo Legion Slim 7-16IAH 82TF004YGE | |
| Razer Blade 15 OLED (Early 2022) | |
| Lenovo Legion S7 16ARHA7 | |
| Asus ROG Flow X16 GV601RW-M5082W | |
| Corsair Voyager a1600 | |
| Apple MacBook Pro 16 2023 M2 Max | |
| Blender / v2.79 BMW27 CPU | |
| Corsair Voyager a1600 | |
| Asus ROG Flow X16 GV601RW-M5082W | |
| Razer Blade 15 OLED (Early 2022) | |
| MSI Katana 17 B13VFK | |
| Lenovo Legion S7 16ARHA7 | |
| Medio Intel Core i9-13900H (166 - 268, n=24) | |
| MSI Creator Z16P B12UHST | |
| Lenovo Legion Slim 7-16IAH 82TF004YGE | |
| Asus ROG Flow X16 GV601V | |
| Asus ROG Zephyrus M16 GU604VY-NM042X | |
| Media de la clase Gaming (79 - 330, n=104, últimos 2 años) | |
| Lenovo Legion Pro 7 16IRX8H | |
| 7-Zip 18.03 / 7z b 4 -mmt1 | |
| Lenovo Legion Pro 7 16IRX8H | |
| Media de la clase Gaming (4199 - 7436, n=105, últimos 2 años) | |
| Asus ROG Flow X16 GV601V | |
| Asus ROG Zephyrus M16 GU604VY-NM042X | |
| MSI Creator Z16P B12UHST | |
| Lenovo Legion S7 16ARHA7 | |
| Medio Intel Core i9-13900H (3665 - 6600, n=25) | |
| Corsair Voyager a1600 | |
| MSI Katana 17 B13VFK | |
| Asus ROG Flow X16 GV601RW-M5082W | |
| Lenovo Legion Slim 7-16IAH 82TF004YGE | |
| Razer Blade 15 OLED (Early 2022) | |
| HWBOT x265 Benchmark v2.2 / 4k Preset | |
| Lenovo Legion Pro 7 16IRX8H | |
| Media de la clase Gaming (11.5 - 44.4, n=105, últimos 2 años) | |
| Asus ROG Zephyrus M16 GU604VY-NM042X | |
| Asus ROG Flow X16 GV601V | |
| MSI Creator Z16P B12UHST | |
| Lenovo Legion Slim 7-16IAH 82TF004YGE | |
| Medio Intel Core i9-13900H (14.1 - 22.3, n=25) | |
| Lenovo Legion S7 16ARHA7 | |
| Razer Blade 15 OLED (Early 2022) | |
| MSI Katana 17 B13VFK | |
| Corsair Voyager a1600 | |
| Asus ROG Flow X16 GV601RW-M5082W | |
| LibreOffice / 20 Documents To PDF | |
| Corsair Voyager a1600 | |
| MSI Katana 17 B13VFK | |
| Asus ROG Flow X16 GV601RW-M5082W | |
| Razer Blade 15 OLED (Early 2022) | |
| Asus ROG Zephyrus M16 GU604VY-NM042X | |
| Media de la clase Gaming (33.2 - 88.8, n=105, últimos 2 años) | |
| Lenovo Legion S7 16ARHA7 | |
| Medio Intel Core i9-13900H (34.4 - 82.8, n=25) | |
| Lenovo Legion Pro 7 16IRX8H | |
| Lenovo Legion Slim 7-16IAH 82TF004YGE | |
| MSI Creator Z16P B12UHST | |
| Asus ROG Flow X16 GV601V | |
| R Benchmark 2.5 / Overall mean | |
| Razer Blade 15 OLED (Early 2022) | |
| Asus ROG Flow X16 GV601RW-M5082W | |
| Corsair Voyager a1600 | |
| Lenovo Legion Slim 7-16IAH 82TF004YGE | |
| Lenovo Legion S7 16ARHA7 | |
| Medio Intel Core i9-13900H (0.4052 - 0.723, n=25) | |
| MSI Katana 17 B13VFK | |
| MSI Creator Z16P B12UHST | |
| Media de la clase Gaming (0.3439 - 0.759, n=106, últimos 2 años) | |
| Asus ROG Flow X16 GV601V | |
| Asus ROG Zephyrus M16 GU604VY-NM042X | |
| Lenovo Legion Pro 7 16IRX8H | |
* ... más pequeño es mejor
AIDA64: FP32 Ray-Trace | FPU Julia | CPU SHA3 | CPU Queen | FPU SinJulia | FPU Mandel | CPU AES | CPU ZLib | FP64 Ray-Trace | CPU PhotoWorxx
| Performance rating | |
| Media de la clase Gaming | |
| Asus ROG Flow X16 GV601RW-M5082W | |
| Lenovo Legion S7 16ARHA7 | |
| Corsair Voyager a1600 | |
| Asus ROG Flow X16 GV601V | |
| Lenovo Legion Slim 7-16IAH 82TF004YGE | |
| Medio Intel Core i9-13900H | |
| Razer Blade 15 OLED (Early 2022) | |
| MSI Creator Z16P B12UHST | |
| MSI Katana 17 B13VFK | |
| AIDA64 / FP32 Ray-Trace | |
| Media de la clase Gaming (10227 - 85542, n=105, últimos 2 años) | |
| Lenovo Legion Slim 7-16IAH 82TF004YGE | |
| Asus ROG Flow X16 GV601RW-M5082W | |
| Lenovo Legion S7 16ARHA7 | |
| Corsair Voyager a1600 | |
| Medio Intel Core i9-13900H (6788 - 19557, n=25) | |
| MSI Katana 17 B13VFK | |
| Razer Blade 15 OLED (Early 2022) | |
| Asus ROG Flow X16 GV601V | |
| MSI Creator Z16P B12UHST | |
| AIDA64 / FPU Julia | |
| Media de la clase Gaming (51376 - 238426, n=105, últimos 2 años) | |
| Lenovo Legion S7 16ARHA7 | |
| Asus ROG Flow X16 GV601RW-M5082W | |
| Corsair Voyager a1600 | |
| Asus ROG Flow X16 GV601V | |
| Lenovo Legion Slim 7-16IAH 82TF004YGE | |
| Medio Intel Core i9-13900H (22551 - 95579, n=25) | |
| Razer Blade 15 OLED (Early 2022) | |
| MSI Katana 17 B13VFK | |
| MSI Creator Z16P B12UHST | |
| AIDA64 / CPU SHA3 | |
| Media de la clase Gaming (2180 - 10115, n=105, últimos 2 años) | |
| Asus ROG Flow X16 GV601V | |
| Lenovo Legion Slim 7-16IAH 82TF004YGE | |
| Asus ROG Flow X16 GV601RW-M5082W | |
| Lenovo Legion S7 16ARHA7 | |
| Medio Intel Core i9-13900H (2491 - 4270, n=25) | |
| Corsair Voyager a1600 | |
| Razer Blade 15 OLED (Early 2022) | |
| MSI Creator Z16P B12UHST | |
| MSI Katana 17 B13VFK | |
| AIDA64 / CPU Queen | |
| Media de la clase Gaming (49785 - 173351, n=90, últimos 2 años) | |
| Asus ROG Flow X16 GV601V | |
| Lenovo Legion S7 16ARHA7 | |
| MSI Creator Z16P B12UHST | |
| Razer Blade 15 OLED (Early 2022) | |
| Corsair Voyager a1600 | |
| Medio Intel Core i9-13900H (65121 - 120936, n=25) | |
| Asus ROG Flow X16 GV601RW-M5082W | |
| Lenovo Legion Slim 7-16IAH 82TF004YGE | |
| MSI Katana 17 B13VFK | |
| AIDA64 / FPU SinJulia | |
| Media de la clase Gaming (4424 - 33636, n=105, últimos 2 años) | |
| Corsair Voyager a1600 | |
| Lenovo Legion S7 16ARHA7 | |
| Asus ROG Flow X16 GV601RW-M5082W | |
| Asus ROG Flow X16 GV601V | |
| MSI Creator Z16P B12UHST | |
| Lenovo Legion Slim 7-16IAH 82TF004YGE | |
| Razer Blade 15 OLED (Early 2022) | |
| Medio Intel Core i9-13900H (6108 - 11631, n=25) | |
| MSI Katana 17 B13VFK | |
| AIDA64 / FPU Mandel | |
| Media de la clase Gaming (25115 - 128721, n=105, últimos 2 años) | |
| Lenovo Legion S7 16ARHA7 | |
| Asus ROG Flow X16 GV601RW-M5082W | |
| Corsair Voyager a1600 | |
| Asus ROG Flow X16 GV601V | |
| Lenovo Legion Slim 7-16IAH 82TF004YGE | |
| Medio Intel Core i9-13900H (11283 - 48474, n=25) | |
| Razer Blade 15 OLED (Early 2022) | |
| MSI Katana 17 B13VFK | |
| MSI Creator Z16P B12UHST | |
| AIDA64 / CPU AES | |
| Asus ROG Flow X16 GV601RW-M5082W | |
| Lenovo Legion Slim 7-16IAH 82TF004YGE | |
| Lenovo Legion S7 16ARHA7 | |
| Corsair Voyager a1600 | |
| Media de la clase Gaming (39258 - 247074, n=105, últimos 2 años) | |
| MSI Creator Z16P B12UHST | |
| Razer Blade 15 OLED (Early 2022) | |
| Medio Intel Core i9-13900H (3691 - 149377, n=25) | |
| Asus ROG Flow X16 GV601V | |
| MSI Katana 17 B13VFK | |
| AIDA64 / CPU ZLib | |
| Media de la clase Gaming (574 - 2531, n=105, últimos 2 años) | |
| Asus ROG Flow X16 GV601V | |
| MSI Creator Z16P B12UHST | |
| Razer Blade 15 OLED (Early 2022) | |
| Medio Intel Core i9-13900H (789 - 1254, n=25) | |
| Lenovo Legion Slim 7-16IAH 82TF004YGE | |
| Asus ROG Flow X16 GV601RW-M5082W | |
| Lenovo Legion S7 16ARHA7 | |
| Corsair Voyager a1600 | |
| MSI Katana 17 B13VFK | |
| AIDA64 / FP64 Ray-Trace | |
| Media de la clase Gaming (5509 - 45446, n=105, últimos 2 años) | |
| Asus ROG Flow X16 GV601V | |
| Asus ROG Flow X16 GV601RW-M5082W | |
| Lenovo Legion S7 16ARHA7 | |
| Lenovo Legion Slim 7-16IAH 82TF004YGE | |
| Corsair Voyager a1600 | |
| Medio Intel Core i9-13900H (3655 - 10716, n=25) | |
| MSI Katana 17 B13VFK | |
| Razer Blade 15 OLED (Early 2022) | |
| MSI Creator Z16P B12UHST | |
| AIDA64 / CPU PhotoWorxx | |
| Media de la clase Gaming (12271 - 89891, n=105, últimos 2 años) | |
| MSI Creator Z16P B12UHST | |
| Medio Intel Core i9-13900H (10871 - 50488, n=25) | |
| Asus ROG Flow X16 GV601V | |
| Lenovo Legion Slim 7-16IAH 82TF004YGE | |
| Razer Blade 15 OLED (Early 2022) | |
| Razer Blade 15 OLED (Early 2022) | |
| MSI Katana 17 B13VFK | |
| Corsair Voyager a1600 | |
| Asus ROG Flow X16 GV601RW-M5082W | |
| Lenovo Legion S7 16ARHA7 | |
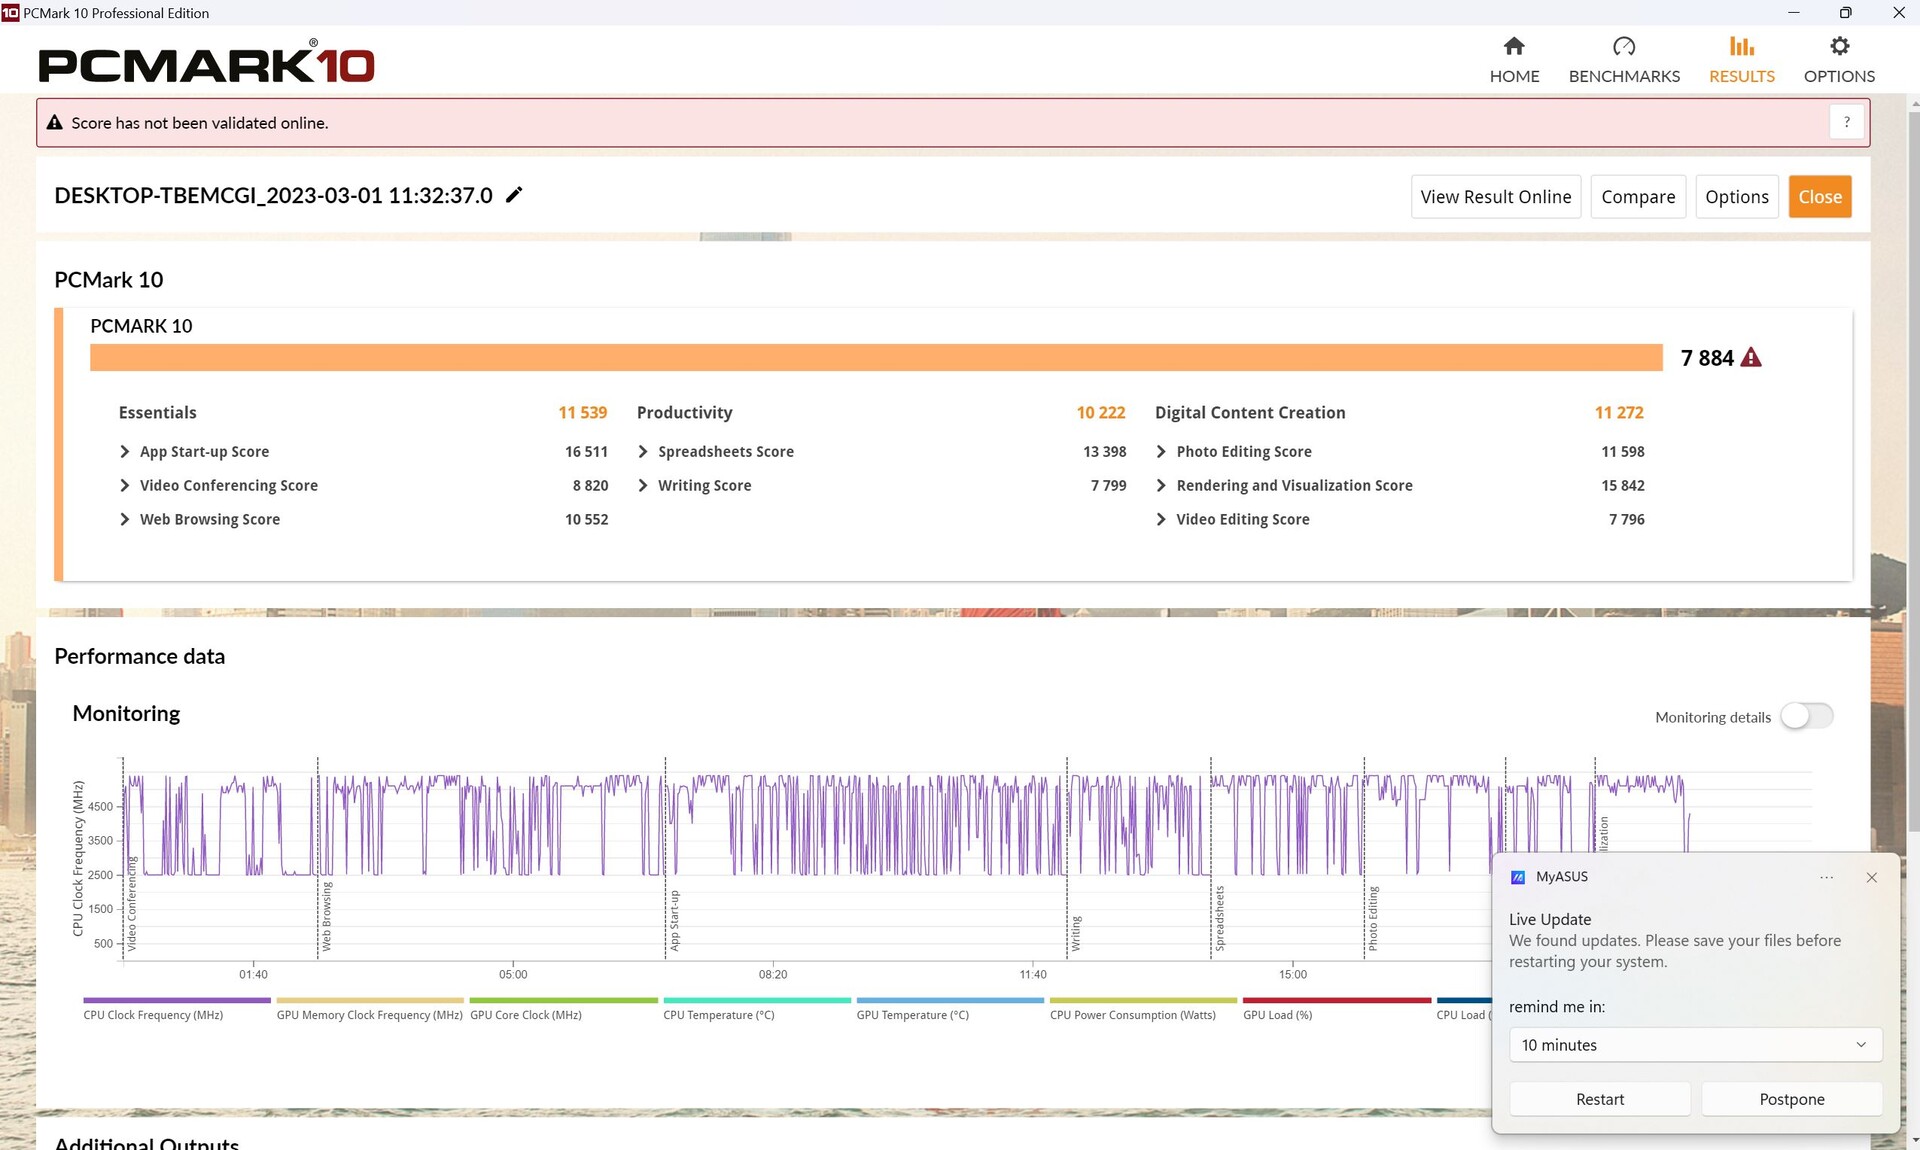
Rendimiento del sistema
En las pruebas PCMark10, el X16 rindió como, si no un poco mejor de lo esperado. No hubo valores atípicos ni caídas en ninguna de nuestras subpruebas.
CrossMark: Overall | Productivity | Creativity | Responsiveness
| PCMark 10 / Score | |
| Media de la clase Gaming (5828 - 12414, n=93, últimos 2 años) | |
| Asus ROG Zephyrus M16 GU604VY-NM042X | |
| MSI Creator Z16P B12UHST | |
| Asus ROG Flow X16 GV601V | |
| Lenovo Legion Pro 7 16IRX8H | |
| Medio Intel Core i9-13900H, NVIDIA GeForce RTX 4060 Laptop GPU (7578 - 7884, n=3) | |
| Lenovo Legion S7 16ARHA7 | |
| Lenovo Legion Slim 7-16IAH 82TF004YGE | |
| Razer Blade 15 OLED (Early 2022) | |
| Corsair Voyager a1600 | |
| MSI Katana 17 B13VFK | |
| Asus ROG Flow X16 GV601RW-M5082W | |
| PCMark 10 / Essentials | |
| Lenovo Legion Pro 7 16IRX8H | |
| Asus ROG Zephyrus M16 GU604VY-NM042X | |
| Asus ROG Flow X16 GV601V | |
| Medio Intel Core i9-13900H, NVIDIA GeForce RTX 4060 Laptop GPU (11235 - 11539, n=3) | |
| MSI Creator Z16P B12UHST | |
| Lenovo Legion Slim 7-16IAH 82TF004YGE | |
| MSI Katana 17 B13VFK | |
| Lenovo Legion S7 16ARHA7 | |
| Media de la clase Gaming (8810 - 11935, n=97, últimos 2 años) | |
| Razer Blade 15 OLED (Early 2022) | |
| Corsair Voyager a1600 | |
| Asus ROG Flow X16 GV601RW-M5082W | |
| PCMark 10 / Productivity | |
| Media de la clase Gaming (6845 - 25323, n=95, últimos 2 años) | |
| MSI Creator Z16P B12UHST | |
| Asus ROG Zephyrus M16 GU604VY-NM042X | |
| Lenovo Legion Pro 7 16IRX8H | |
| Asus ROG Flow X16 GV601V | |
| Medio Intel Core i9-13900H, NVIDIA GeForce RTX 4060 Laptop GPU (9888 - 10222, n=3) | |
| Razer Blade 15 OLED (Early 2022) | |
| Lenovo Legion S7 16ARHA7 | |
| Asus ROG Flow X16 GV601RW-M5082W | |
| Lenovo Legion Slim 7-16IAH 82TF004YGE | |
| MSI Katana 17 B13VFK | |
| Corsair Voyager a1600 | |
| PCMark 10 / Digital Content Creation | |
| Media de la clase Gaming (7602 - 19954, n=95, últimos 2 años) | |
| Asus ROG Zephyrus M16 GU604VY-NM042X | |
| MSI Creator Z16P B12UHST | |
| Lenovo Legion S7 16ARHA7 | |
| Corsair Voyager a1600 | |
| Asus ROG Flow X16 GV601V | |
| Medio Intel Core i9-13900H, NVIDIA GeForce RTX 4060 Laptop GPU (10418 - 11272, n=3) | |
| Lenovo Legion Slim 7-16IAH 82TF004YGE | |
| Razer Blade 15 OLED (Early 2022) | |
| Lenovo Legion Pro 7 16IRX8H | |
| MSI Katana 17 B13VFK | |
| Asus ROG Flow X16 GV601RW-M5082W | |
| CrossMark / Overall | |
| Media de la clase Gaming (1366 - 2409, n=94, últimos 2 años) | |
| Asus ROG Zephyrus M16 GU604VY-NM042X | |
| Asus ROG Flow X16 GV601V | |
| Medio Intel Core i9-13900H, NVIDIA GeForce RTX 4060 Laptop GPU (1874 - 1983, n=3) | |
| Apple MacBook Pro 16 2023 M2 Max | |
| Lenovo Legion Slim 7-16IAH 82TF004YGE | |
| MSI Katana 17 B13VFK | |
| Razer Blade 15 OLED (Early 2022) | |
| Lenovo Legion S7 16ARHA7 | |
| Asus ROG Flow X16 GV601RW-M5082W | |
| Corsair Voyager a1600 | |
| CrossMark / Productivity | |
| Asus ROG Flow X16 GV601V | |
| Media de la clase Gaming (1386 - 2254, n=94, últimos 2 años) | |
| Asus ROG Zephyrus M16 GU604VY-NM042X | |
| Medio Intel Core i9-13900H, NVIDIA GeForce RTX 4060 Laptop GPU (1779 - 1889, n=3) | |
| Lenovo Legion Slim 7-16IAH 82TF004YGE | |
| MSI Katana 17 B13VFK | |
| Lenovo Legion S7 16ARHA7 | |
| Razer Blade 15 OLED (Early 2022) | |
| Apple MacBook Pro 16 2023 M2 Max | |
| Asus ROG Flow X16 GV601RW-M5082W | |
| Corsair Voyager a1600 | |
| CrossMark / Creativity | |
| Apple MacBook Pro 16 2023 M2 Max | |
| Media de la clase Gaming (1343 - 2786, n=94, últimos 2 años) | |
| Asus ROG Zephyrus M16 GU604VY-NM042X | |
| Asus ROG Flow X16 GV601V | |
| Medio Intel Core i9-13900H, NVIDIA GeForce RTX 4060 Laptop GPU (2104 - 2195, n=3) | |
| MSI Katana 17 B13VFK | |
| Lenovo Legion Slim 7-16IAH 82TF004YGE | |
| Razer Blade 15 OLED (Early 2022) | |
| Lenovo Legion S7 16ARHA7 | |
| Asus ROG Flow X16 GV601RW-M5082W | |
| Corsair Voyager a1600 | |
| CrossMark / Responsiveness | |
| Lenovo Legion Slim 7-16IAH 82TF004YGE | |
| MSI Katana 17 B13VFK | |
| Media de la clase Gaming (1226 - 2334, n=94, últimos 2 años) | |
| Asus ROG Flow X16 GV601V | |
| Asus ROG Zephyrus M16 GU604VY-NM042X | |
| Medio Intel Core i9-13900H, NVIDIA GeForce RTX 4060 Laptop GPU (1548 - 1698, n=3) | |
| Razer Blade 15 OLED (Early 2022) | |
| Lenovo Legion S7 16ARHA7 | |
| Asus ROG Flow X16 GV601RW-M5082W | |
| Apple MacBook Pro 16 2023 M2 Max | |
| Corsair Voyager a1600 | |
| PCMark 10 Score | 7884 puntos | |
ayuda | ||
| AIDA64 / Memory Copy | |
| Media de la clase Gaming (21750 - 129946, n=105, últimos 2 años) | |
| Samsung Galaxy Book3 Ultra 16, i9-13900H RTX 4070 | |
| Lenovo Yoga Pro 7 14IRH G8 | |
| Medio Intel Core i9-13900H (37448 - 74486, n=25) | |
| Asus ROG Flow X16 GV601V | |
| Lenovo Legion Pro 5 16IRX8 | |
| MSI Katana 17 B13VFK | |
| Asus ROG Flow X16 GV601RW-M5082W | |
| AIDA64 / Memory Read | |
| Media de la clase Gaming (22956 - 118858, n=105, últimos 2 años) | |
| Samsung Galaxy Book3 Ultra 16, i9-13900H RTX 4070 | |
| Lenovo Yoga Pro 7 14IRH G8 | |
| Asus ROG Flow X16 GV601V | |
| Lenovo Legion Pro 5 16IRX8 | |
| Medio Intel Core i9-13900H (41599 - 75433, n=25) | |
| MSI Katana 17 B13VFK | |
| Asus ROG Flow X16 GV601RW-M5082W | |
| AIDA64 / Memory Write | |
| Samsung Galaxy Book3 Ultra 16, i9-13900H RTX 4070 | |
| Media de la clase Gaming (22297 - 135096, n=105, últimos 2 años) | |
| Lenovo Yoga Pro 7 14IRH G8 | |
| Lenovo Legion Pro 5 16IRX8 | |
| Medio Intel Core i9-13900H (36152 - 88505, n=25) | |
| Asus ROG Flow X16 GV601V | |
| Asus ROG Flow X16 GV601RW-M5082W | |
| MSI Katana 17 B13VFK | |
| AIDA64 / Memory Latency | |
| Media de la clase Gaming (75.3 - 259, n=105, últimos 2 años) | |
| Lenovo Yoga Pro 7 14IRH G8 | |
| Samsung Galaxy Book3 Ultra 16, i9-13900H RTX 4070 | |
| MSI Katana 17 B13VFK | |
| Asus ROG Flow X16 GV601RW-M5082W | |
| Asus ROG Flow X16 GV601V | |
| Medio Intel Core i9-13900H (75.8 - 102.3, n=25) | |
| Lenovo Legion Pro 5 16IRX8 | |
* ... más pequeño es mejor
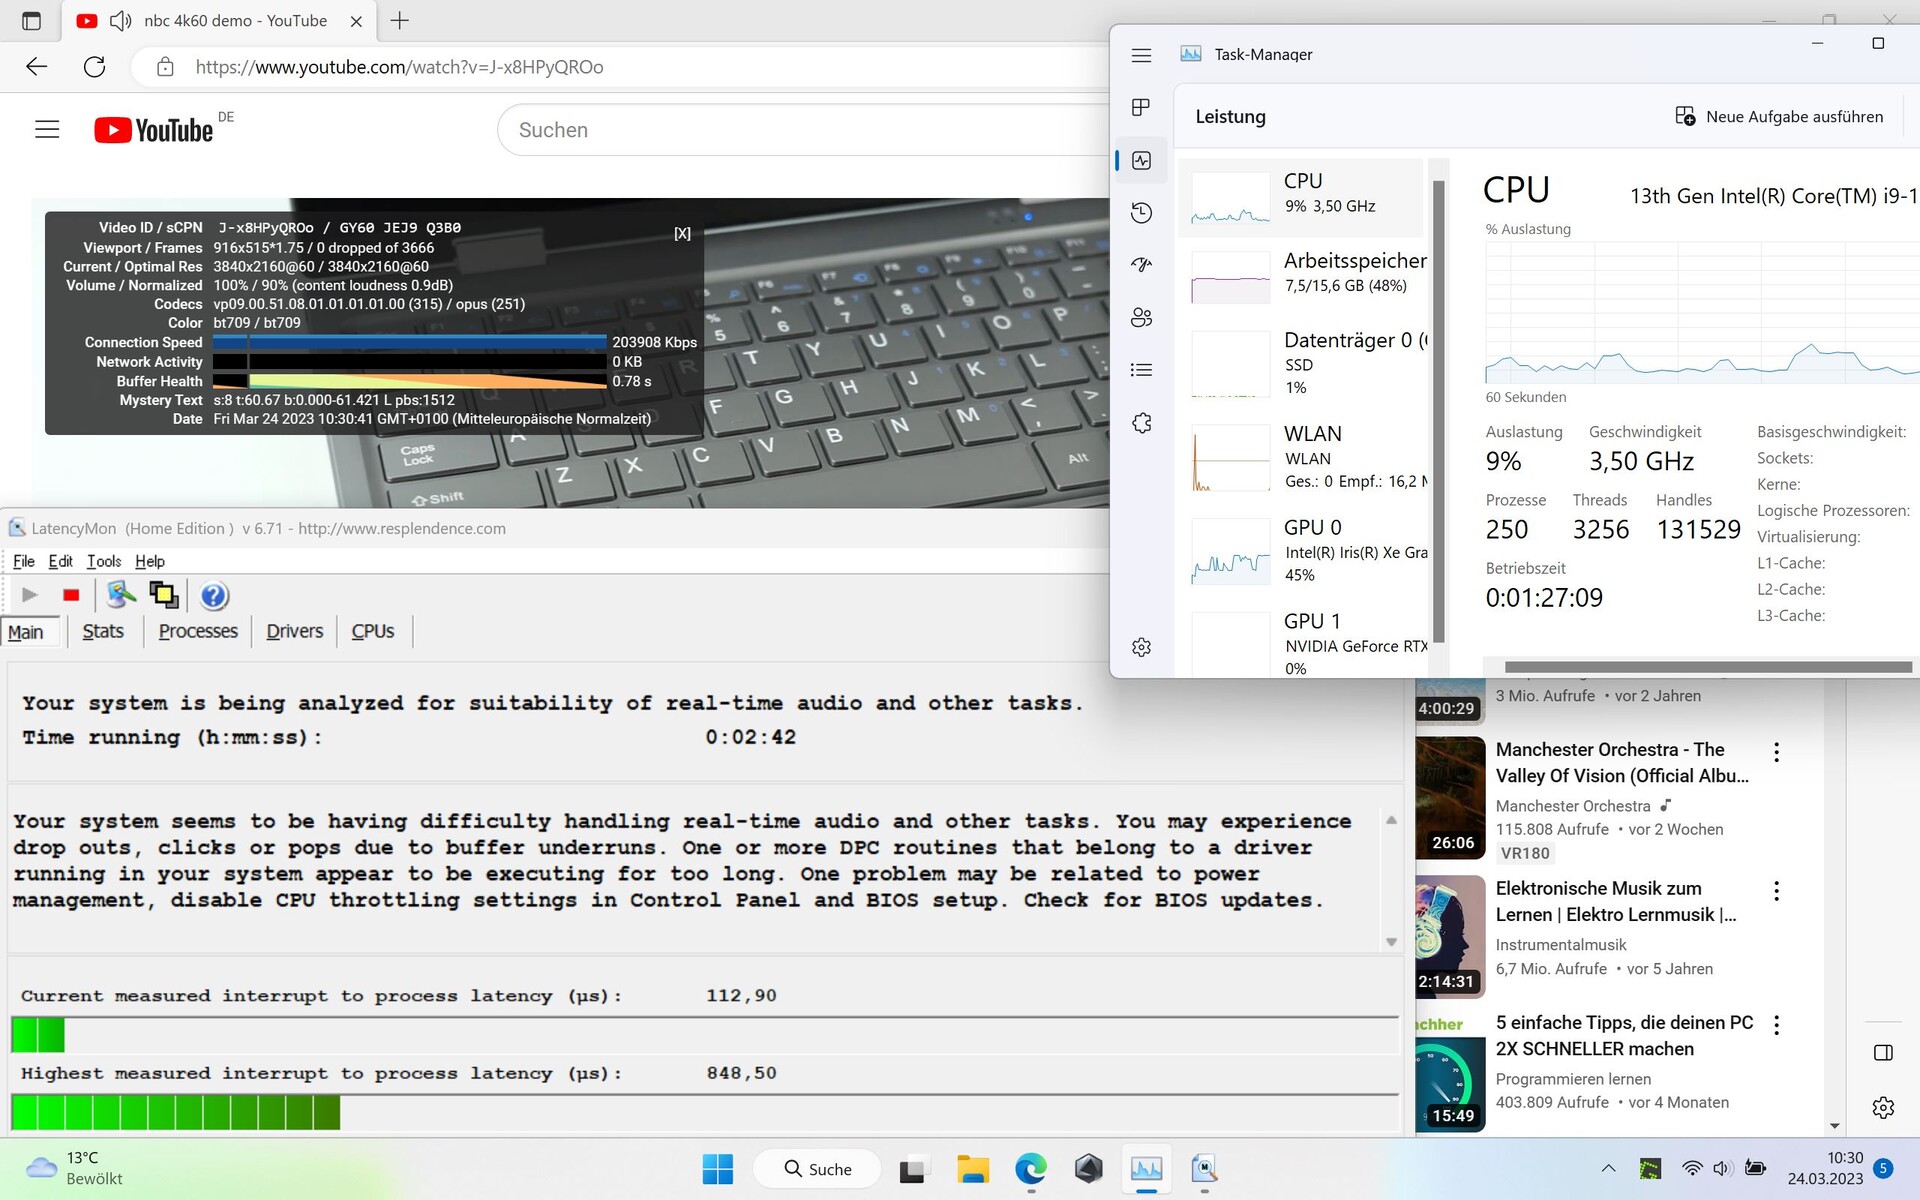
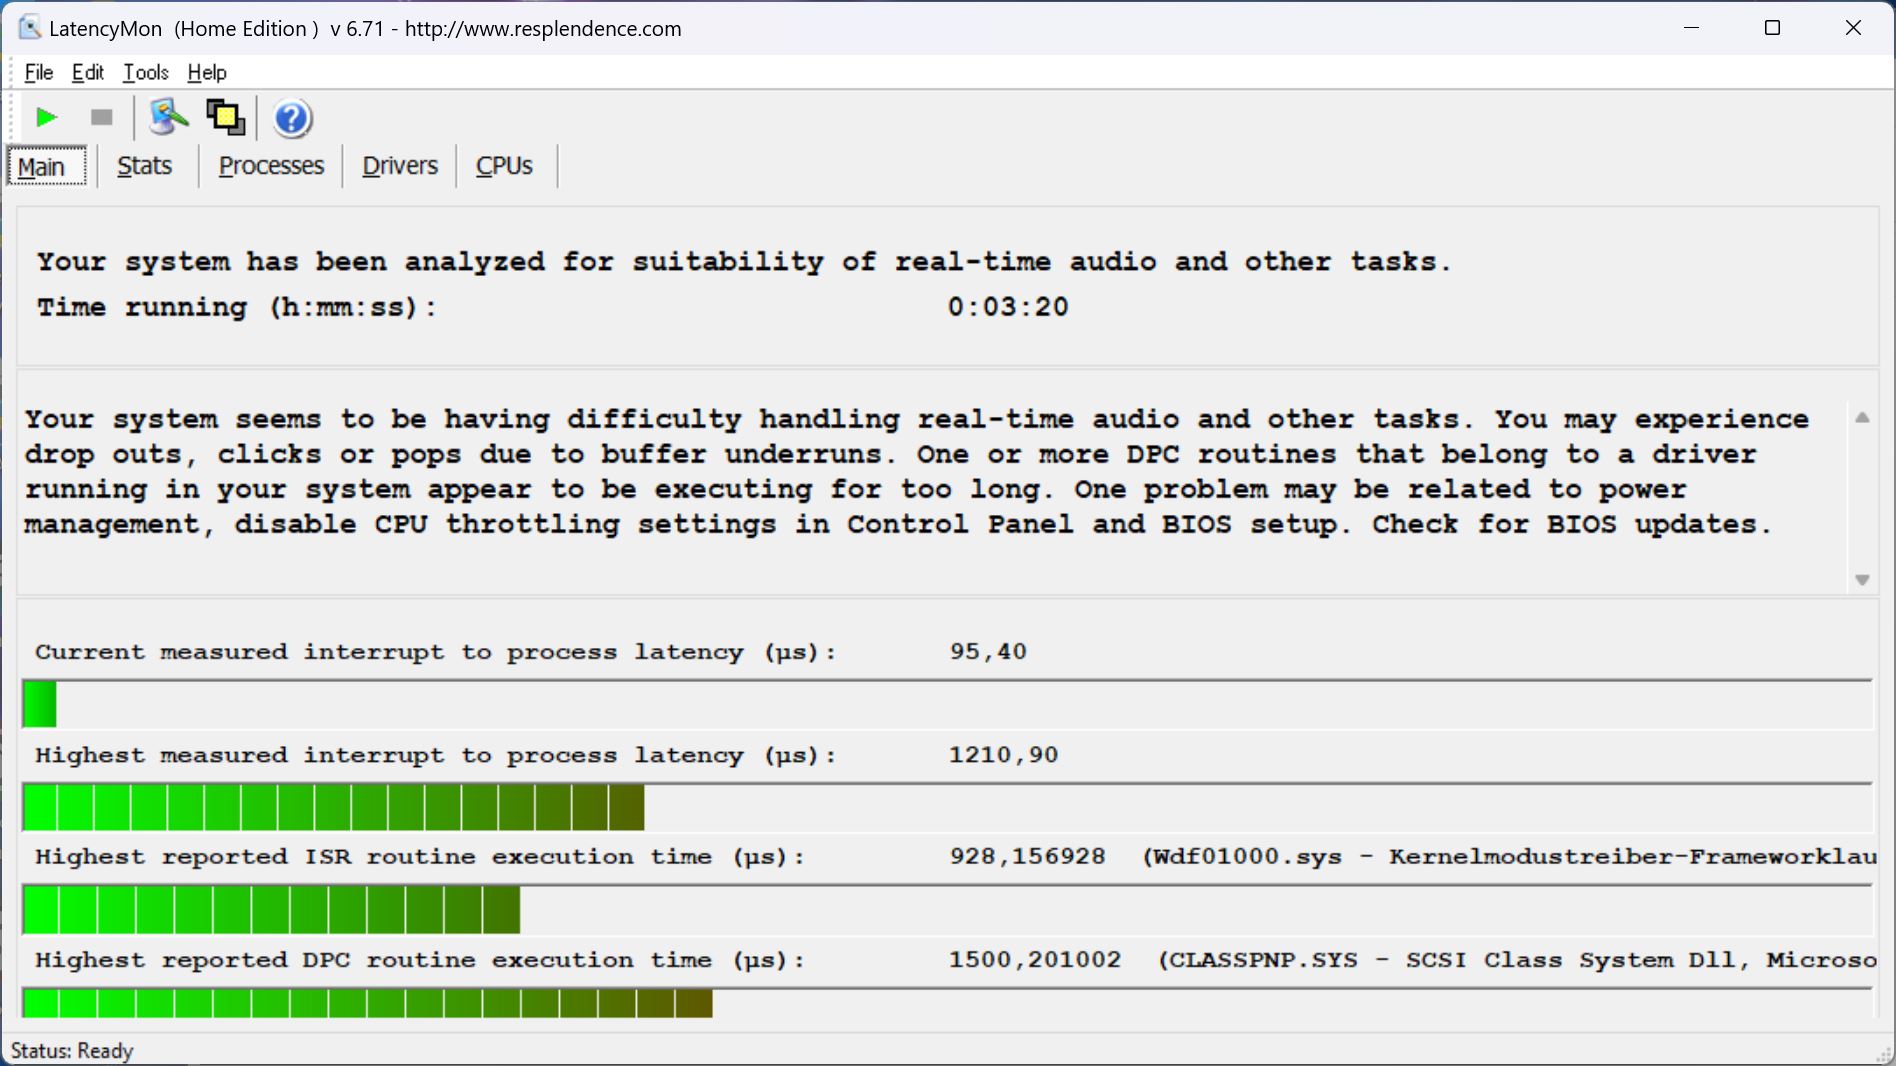
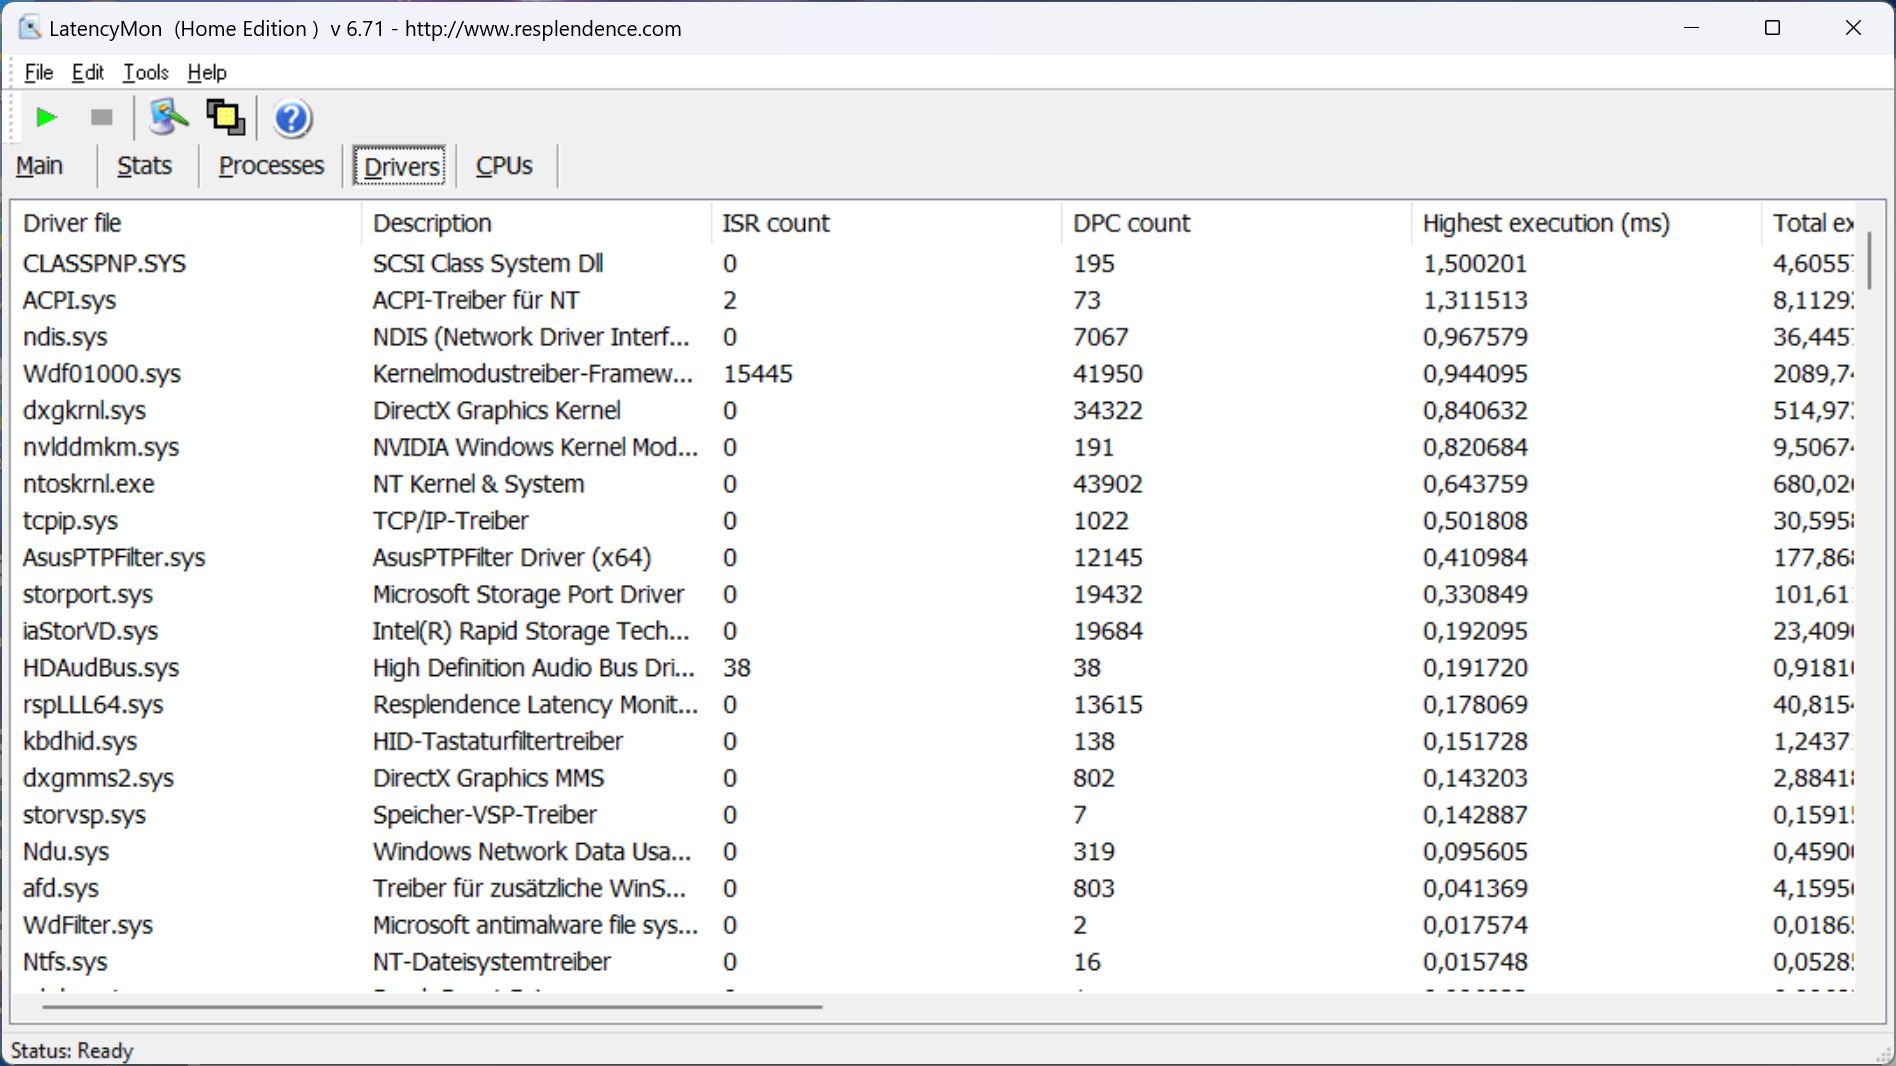
Latencias del CPD
Al abrir varias pestañas del navegador, el software mostró latencias LatencyMon. Sin embargo, nuestro vídeo 4K/60fps de YouTube se ejecutó con fluidez y sin caídas de fotogramas. No obstante, las puntuaciones podrían ser algo más bajas, especialmente para el grupo de creadores de contenidos al que va dirigido.
| DPC Latencies / LatencyMon - interrupt to process latency (max), Web, Youtube, Prime95 | |
| Samsung Galaxy Book3 Ultra 16, i9-13900H RTX 4070 | |
| MSI Katana 17 B13VFK | |
| Asus ROG Flow X16 GV601V | |
| Asus ROG Flow X16 GV601RW-M5082W | |
| Lenovo Yoga Pro 7 14IRH G8 | |
| Lenovo Legion Pro 5 16IRX8 | |
* ... más pequeño es mejor
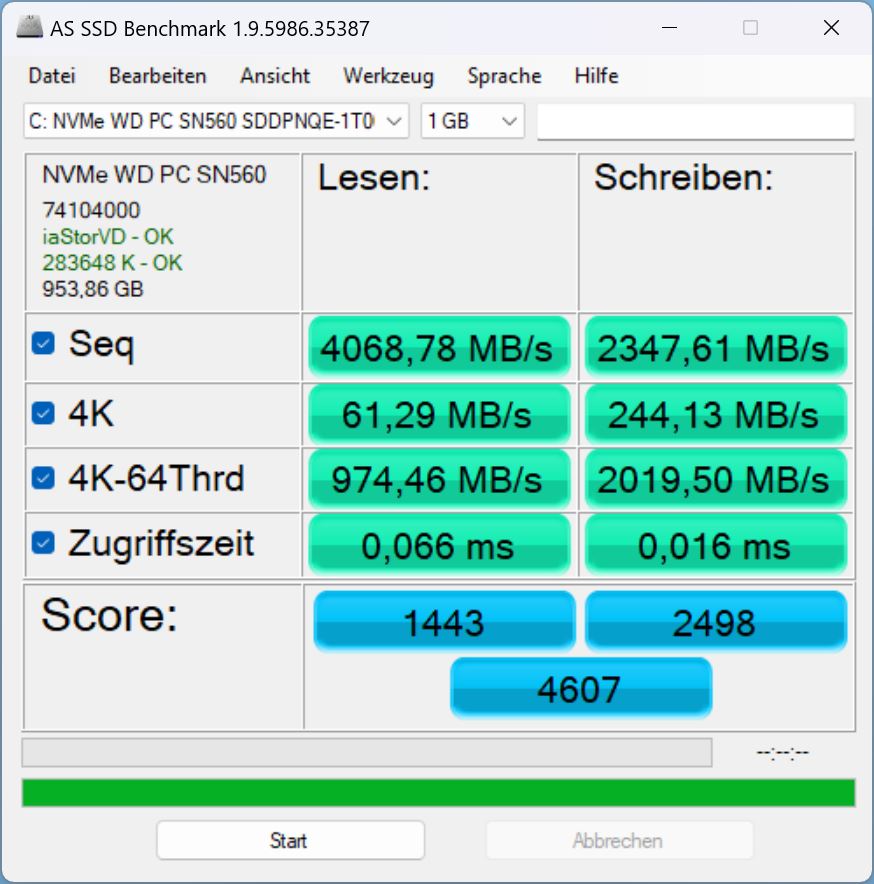
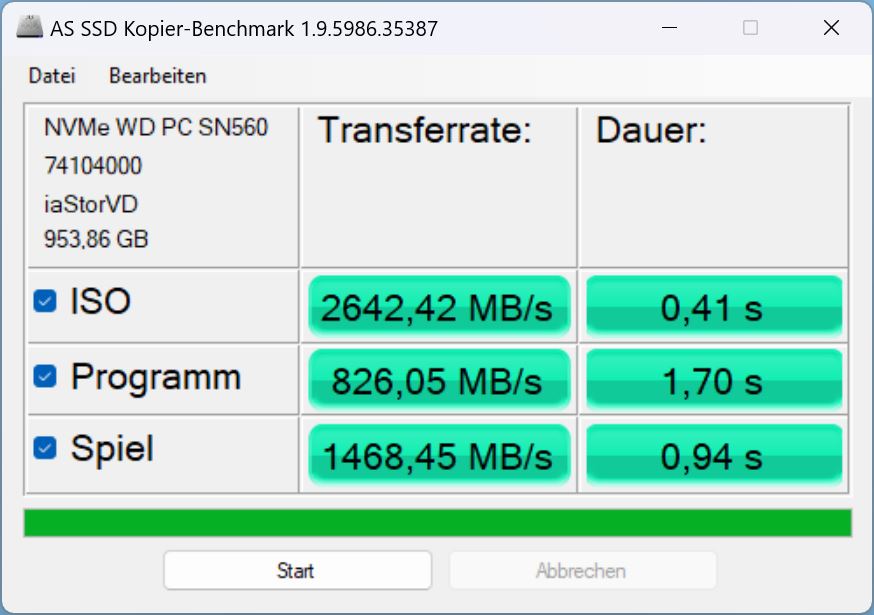
Almacenamiento masivo
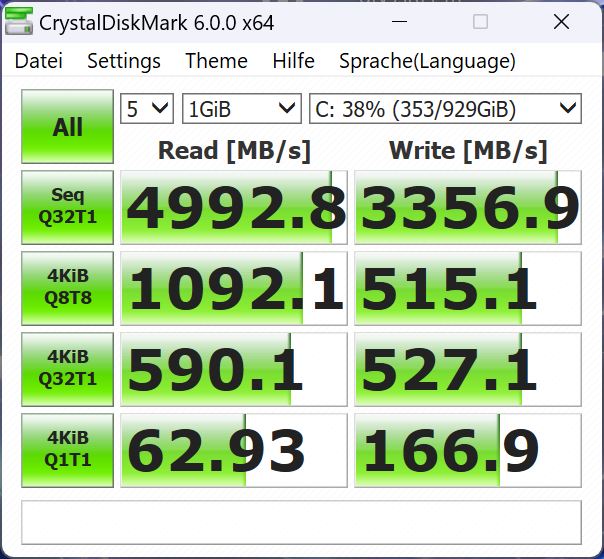
Asus ha instalado un SSD PCIe-4.0-x4-NVMe de 1 TB de Western Digital. Una vez más, la unidad de almacenamiento se encuentra cerca del final de nuestraLista de los mejores SSD. El SSD Micron del modelo anterior era significativamente más rápido, ¡un 42% de media!
Por supuesto, para uso doméstico, el SSD es lo suficientemente rápido, pero para los usuarios profesionales - la categoría a la que está dirigido el X16 - este paso atrás en el rendimiento es algo lamentable.

* ... más pequeño es mejor
Continuous performance Read: DiskSpd Read Loop, Queue Depth 8
Tarjeta gráfica
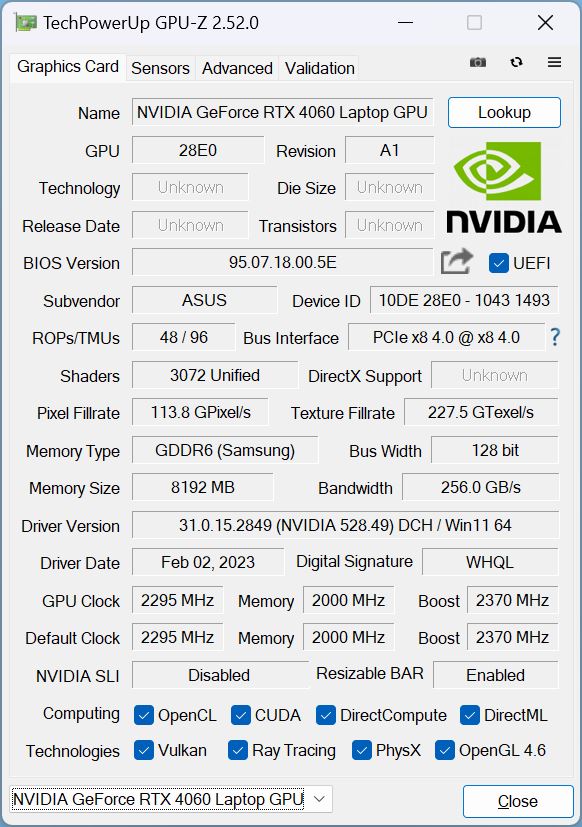
Nuestro modelo de prueba alberga unaNvidia Geforce RTX 4060. UnRTX 4050o unaRTX 4070también están disponibles. La tarjeta puede consumir un máximo de 120 vatios, incluido un aumento dinámico de 20 vatios.
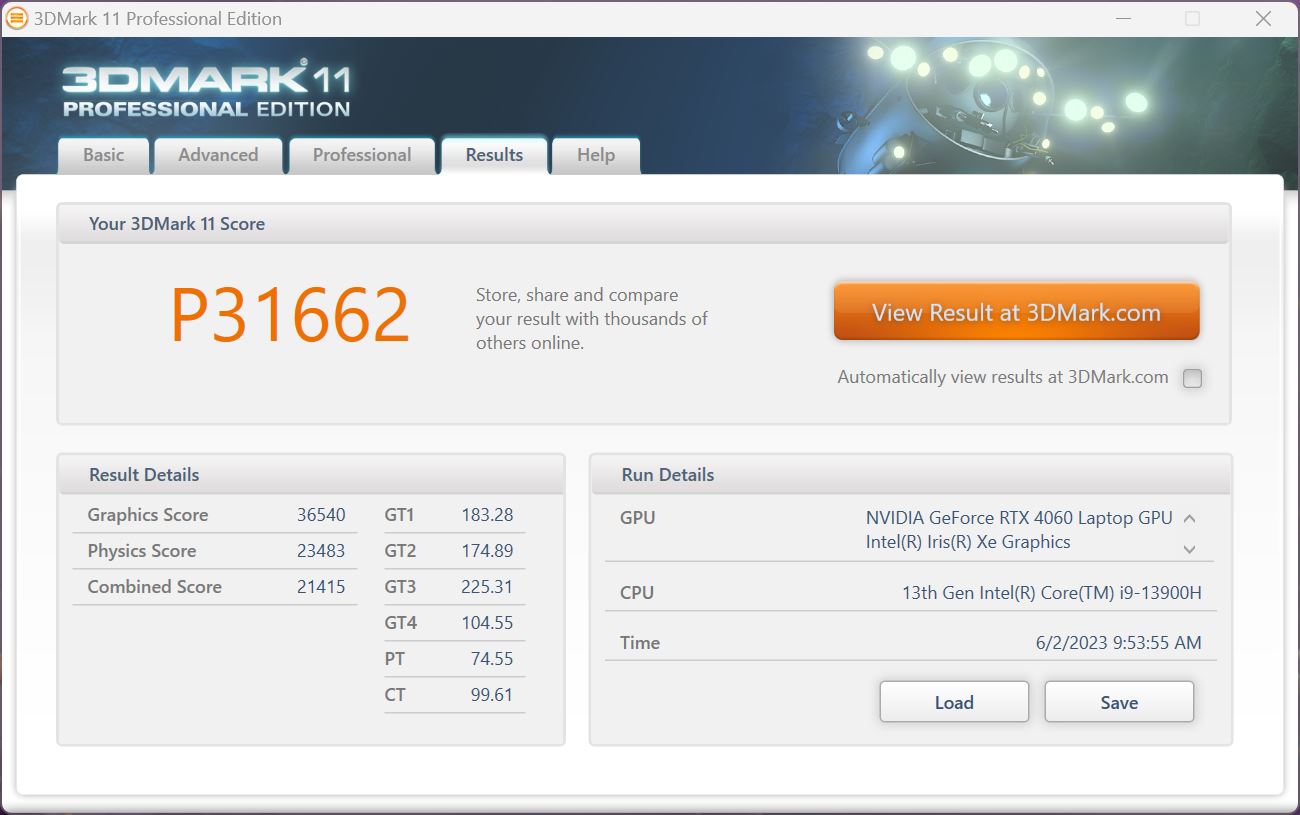
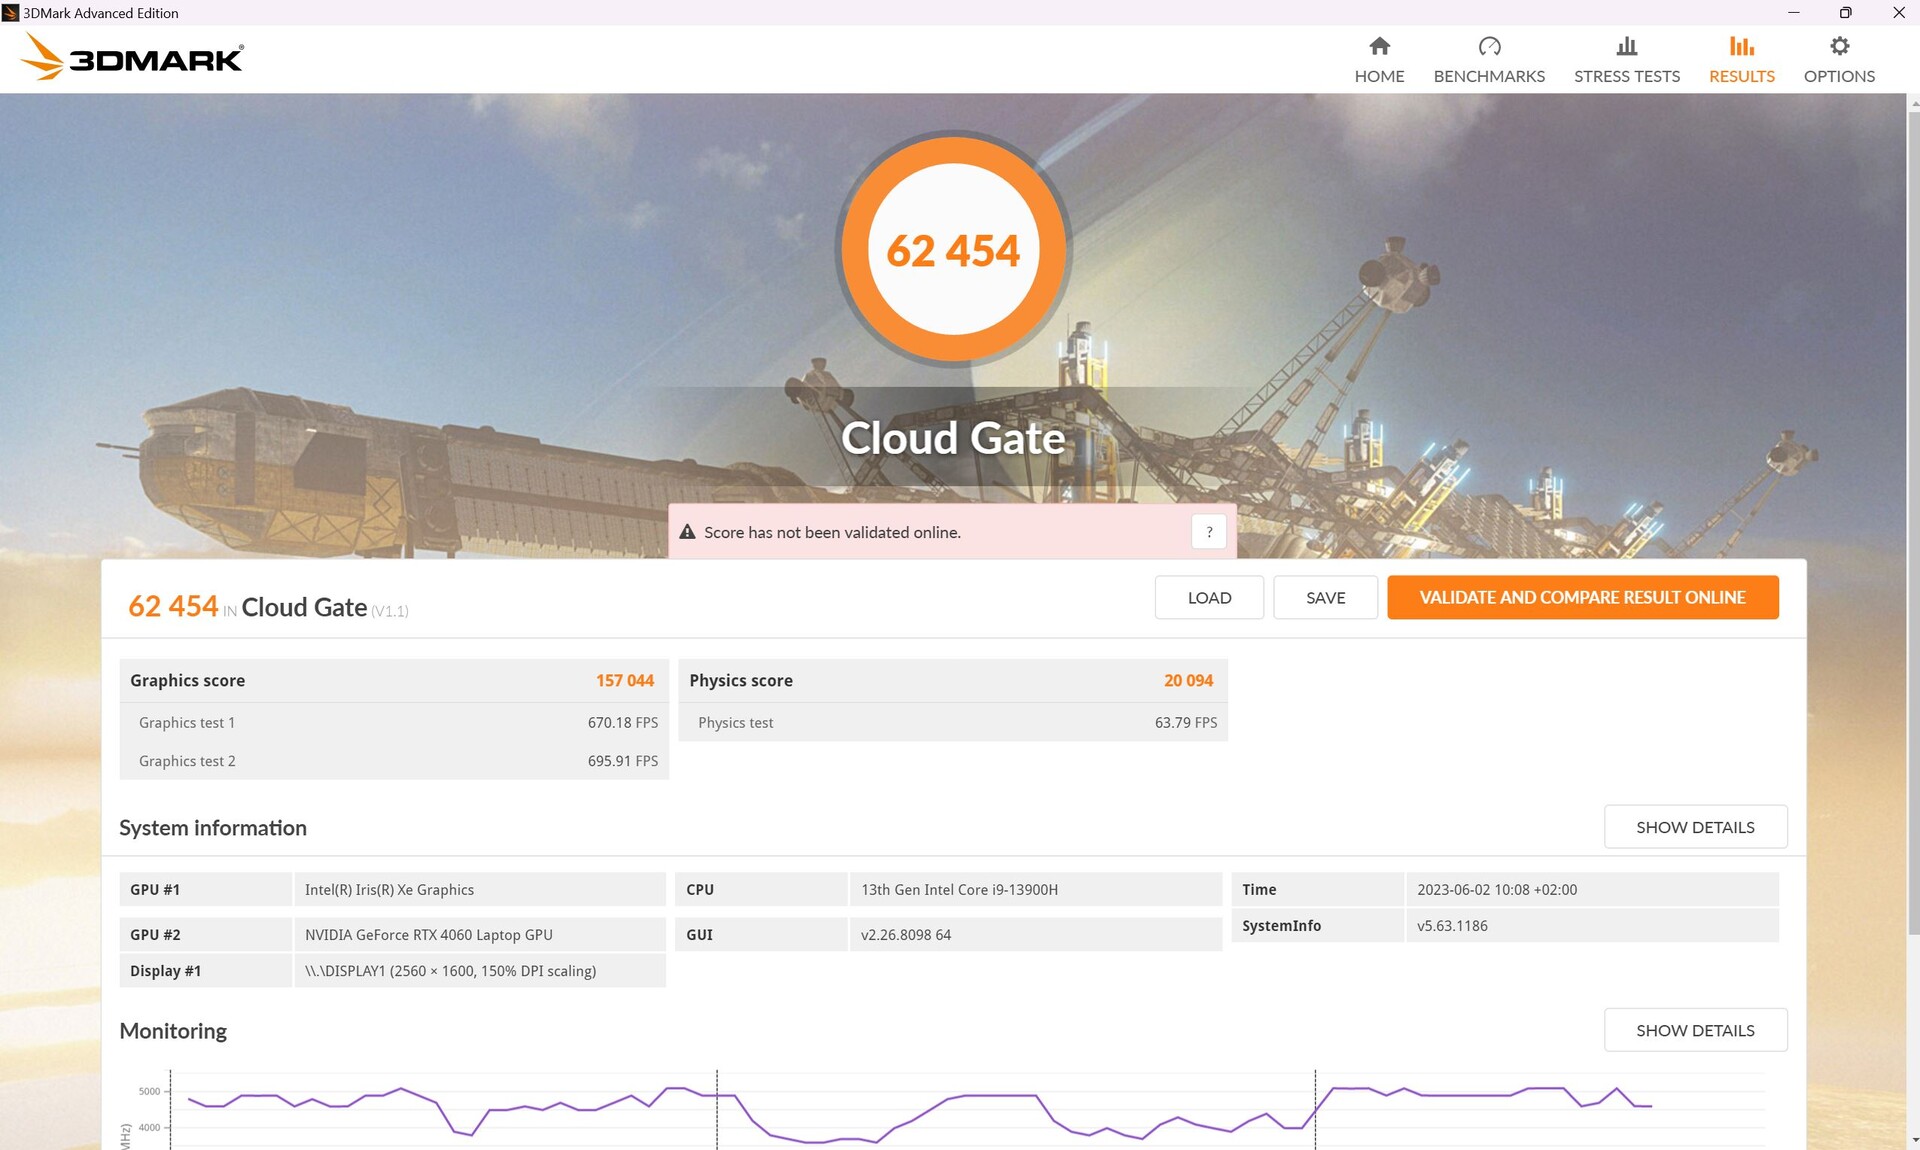
En las pruebas 3DMark, rindió aproximadamente un 10 % mejor (turbo) que la media de portátiles RTX 4060 de nuestra base de datos.
Cuando comparamos los resultados entre los modos turbo y de rendimiento, es especialmente evidente que el rendimiento gráfico aumenta, pero el rendimiento de la CPU y la física tienden a bajar (ver Cloud Gate o Fire Strike).
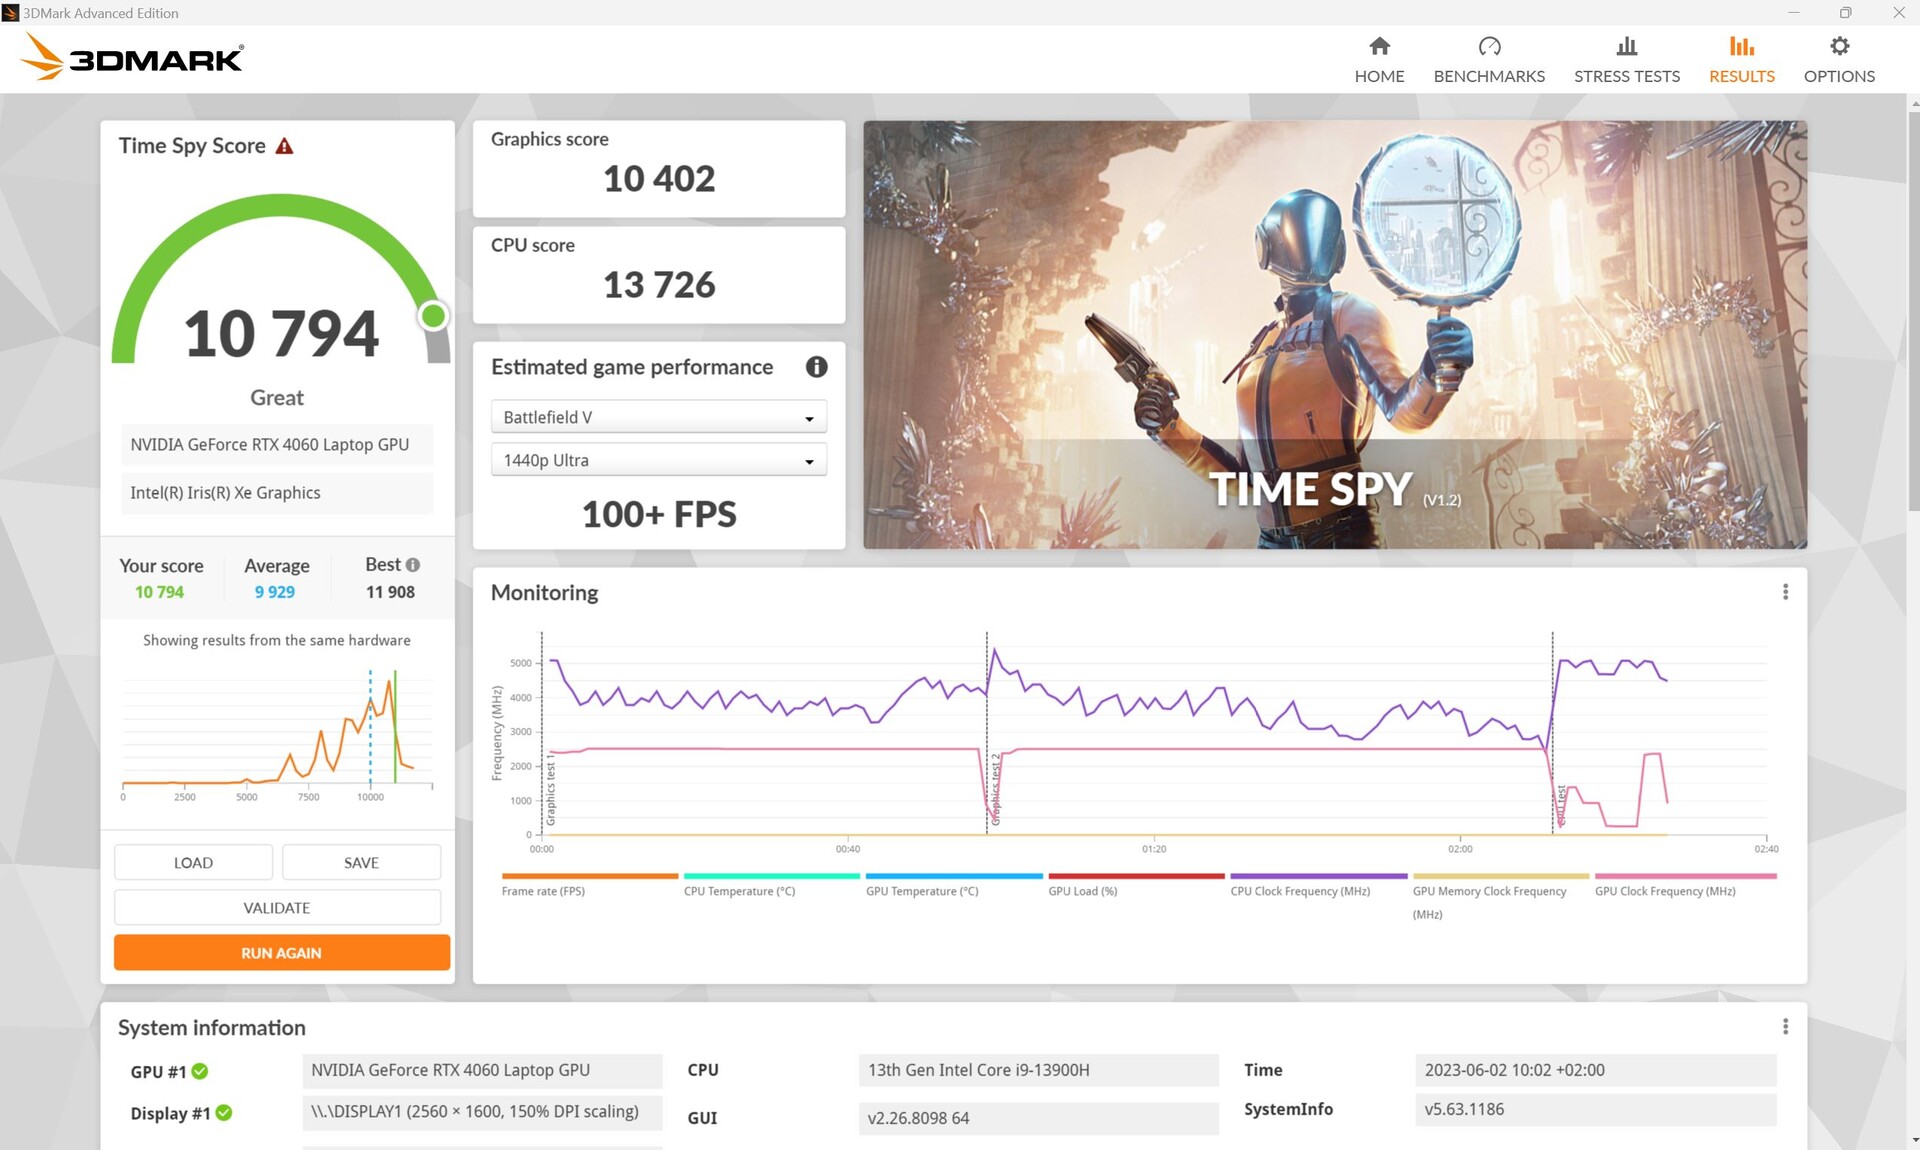

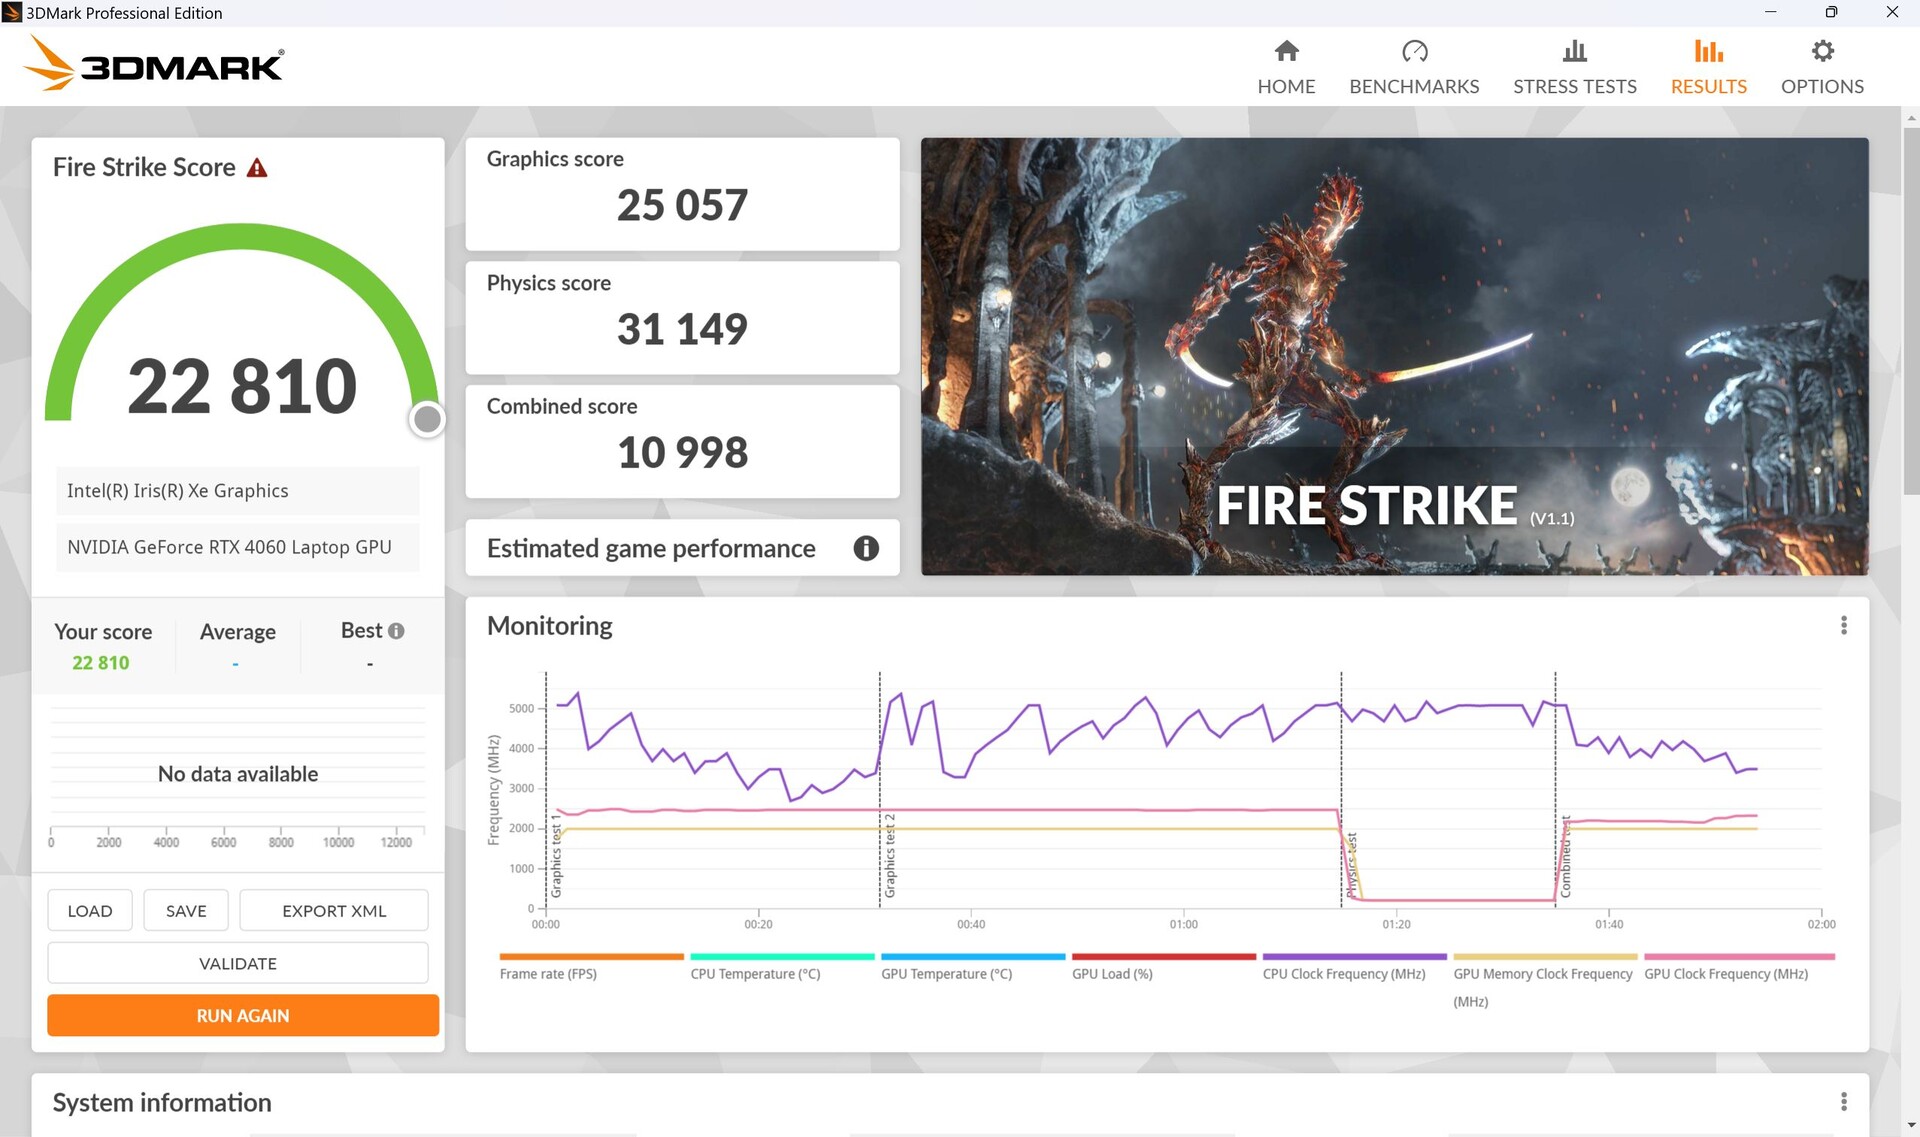
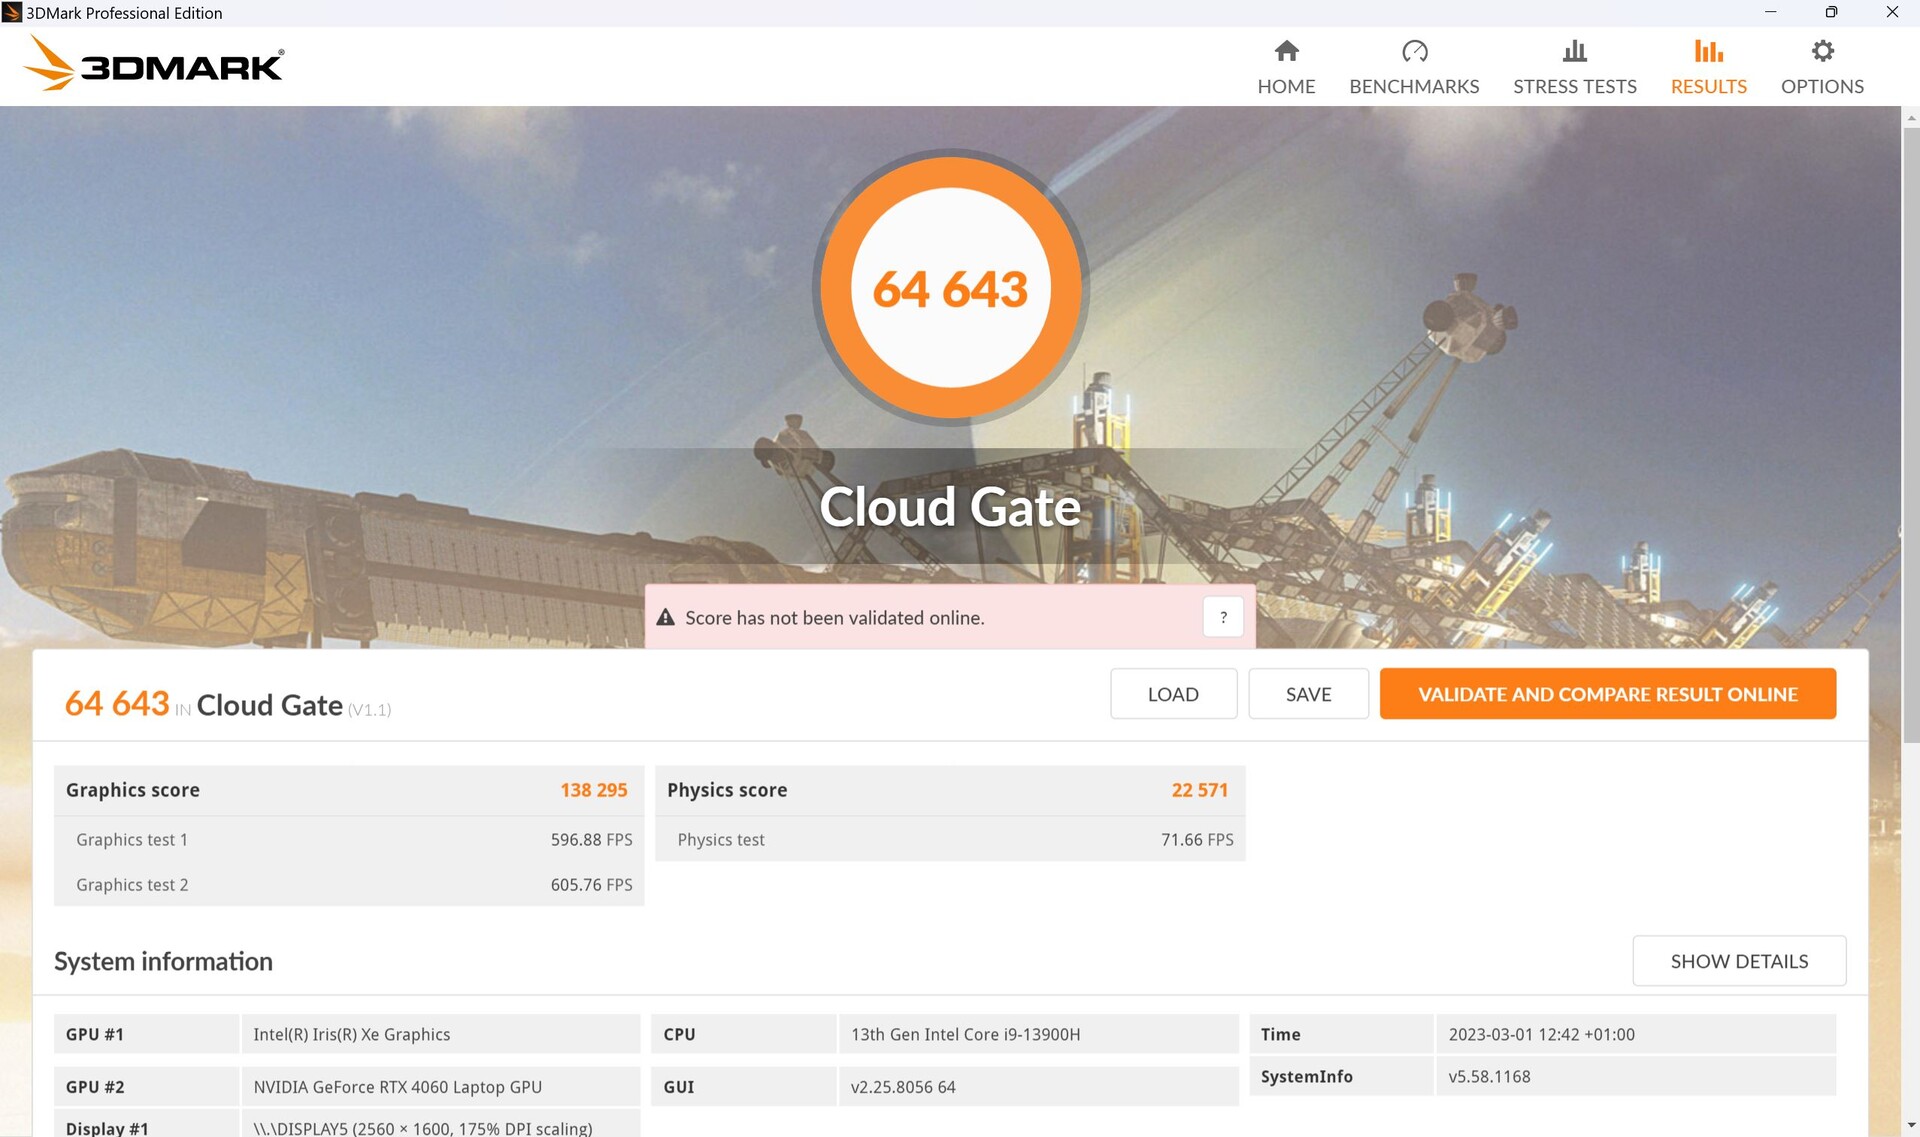
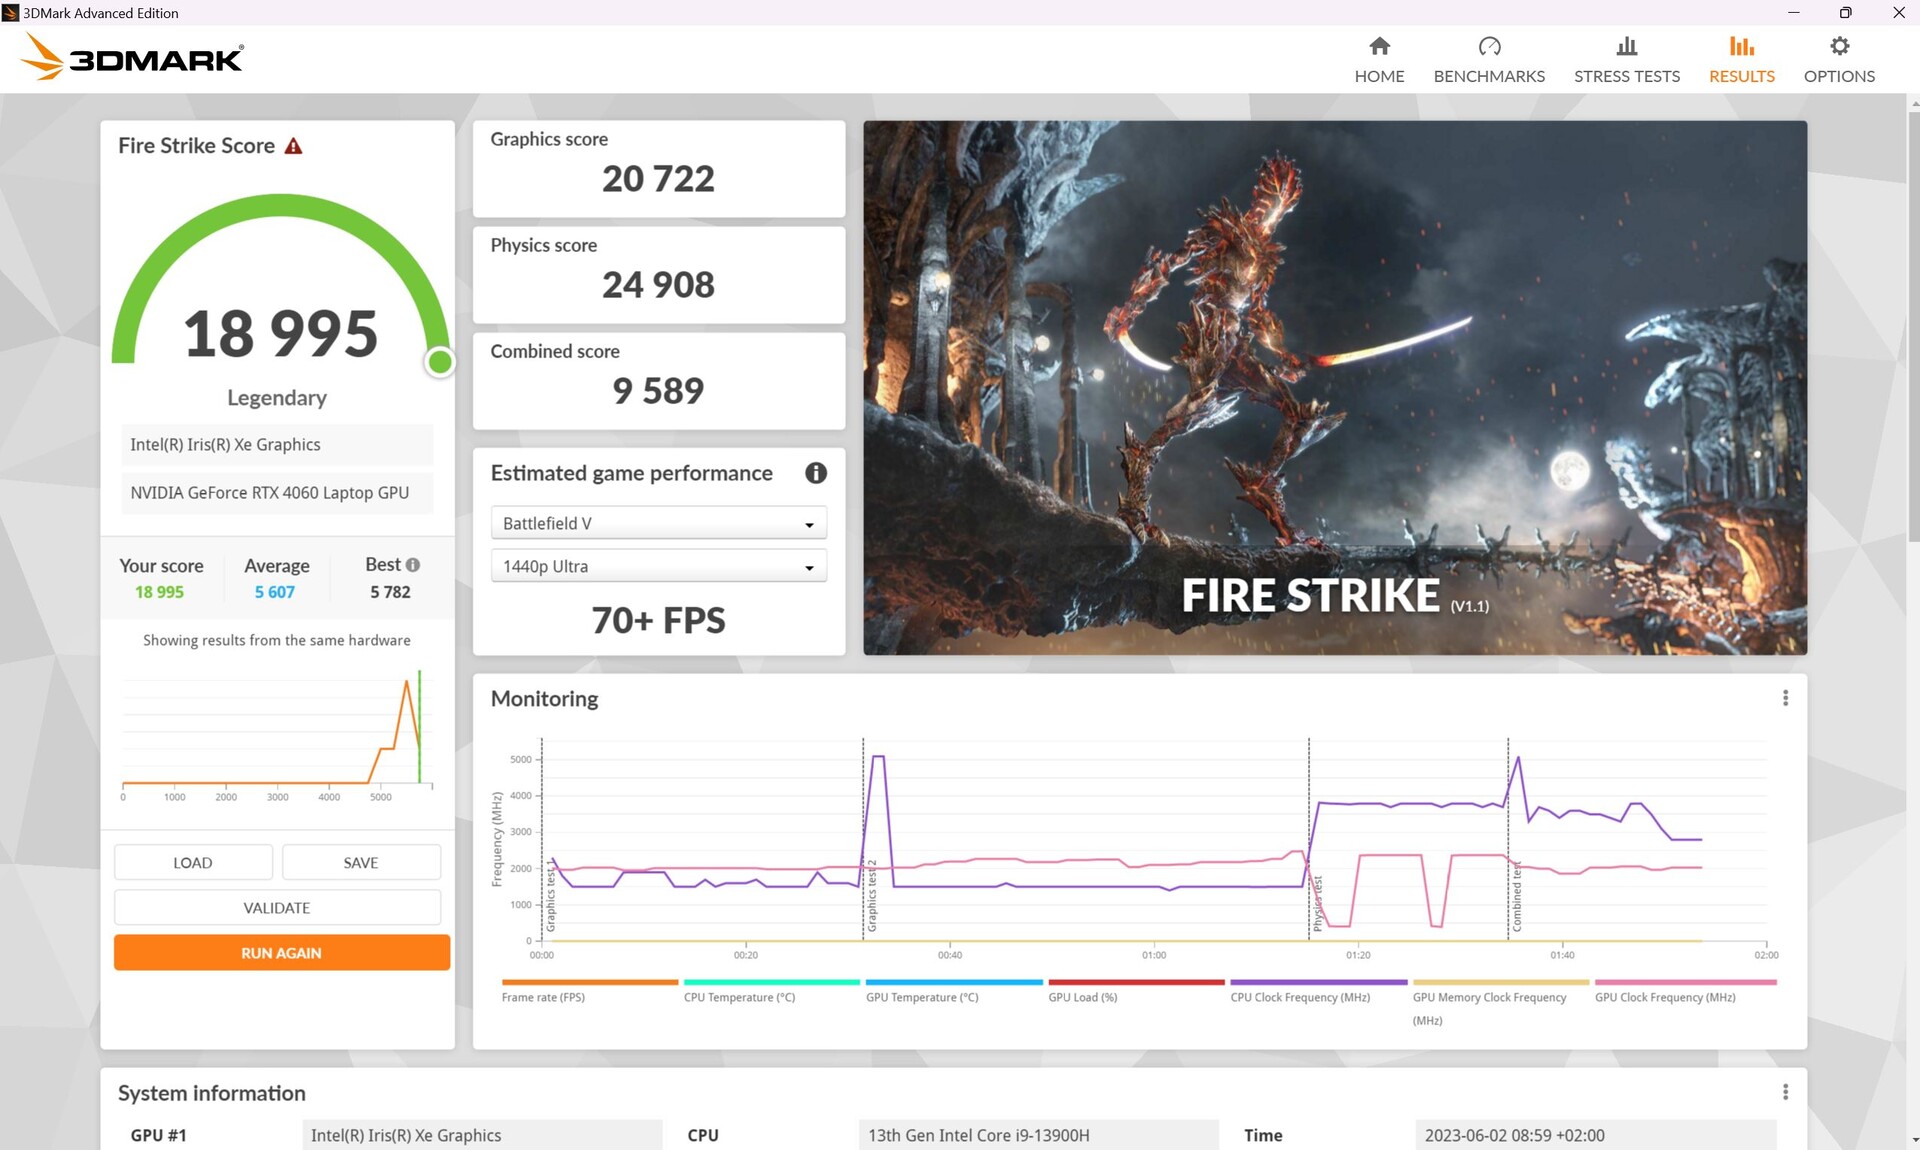
Lejos de la pared, el rendimiento gráfico baja. En el modo de rendimiento, la puntuación gráfica de Fire Strike bajó en torno a un 17% y en el modo silencioso nada menos que un 42%.

| 3DMark 11 Performance | 31662 puntos | |
| 3DMark Cloud Gate Standard Score | 62454 puntos | |
| 3DMark Fire Strike Score | 24131 puntos | |
| 3DMark Time Spy Score | 10794 puntos | |
ayuda | ||
* ... más pequeño es mejor
| Premiere Pro PugetBench - Overall Score 0.9 | |
| MSI Stealth 17 Studio A13VH-014 | |
| Asus ROG Flow X16 GV601V | |
| Asus Zephyrus Duo 16 GX650PY-NM006W | |
| MSI Titan GT77 HX 13VI | |
| Apple MacBook Pro 14 2023 M2 Pro | |
| Asus ROG Zephyrus G14 GA402XY | |
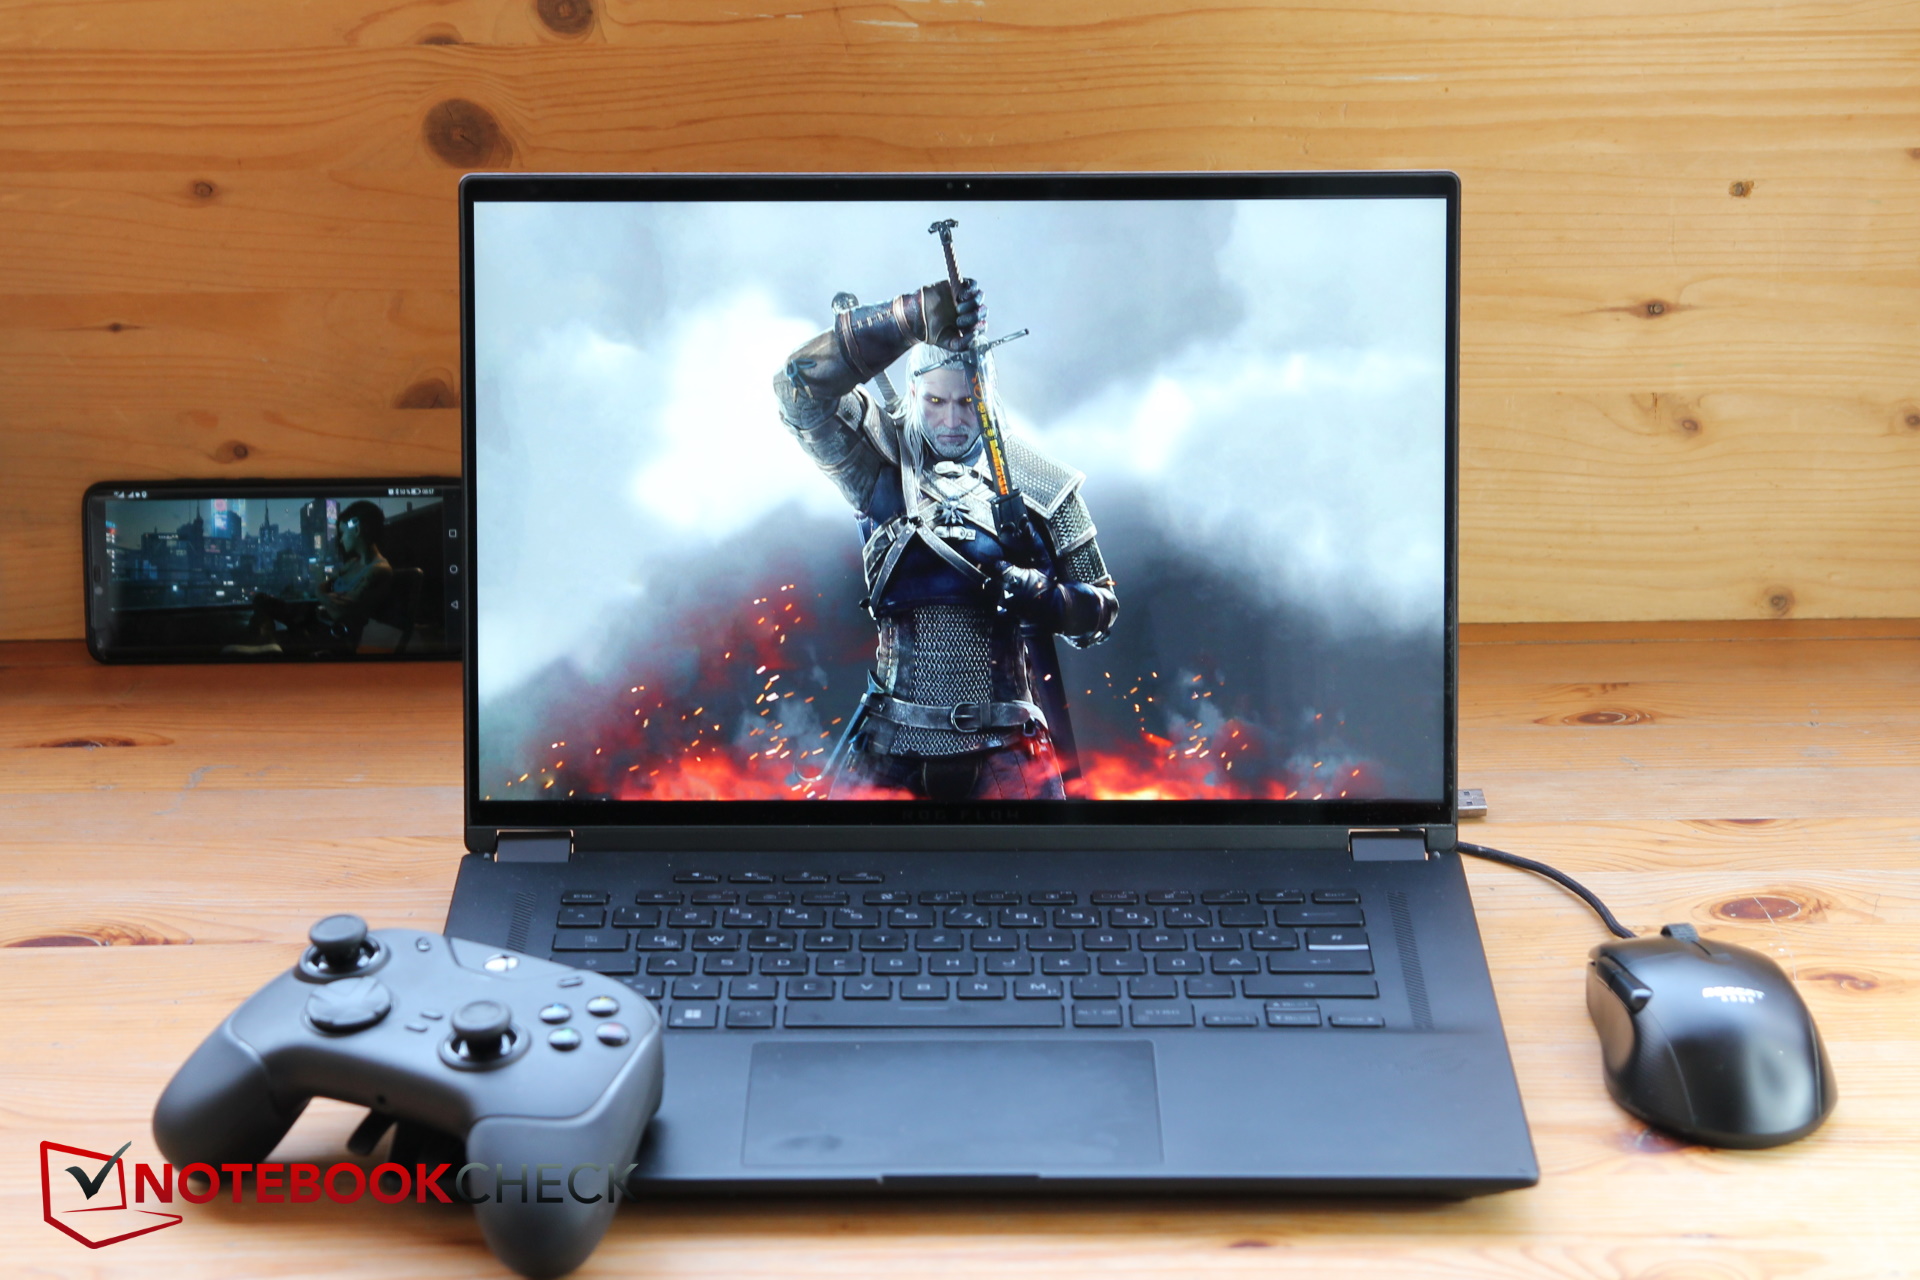
Rendimiento de juego
En Full HD, casi todos los juegos que probamos se ejecutaron sin problemas al máximo de detalles. Incluso hay recursos suficientes a mano para QHD, y sólo títulos muy exigentes como The Last of Us se quedan sin fuelle.
En nuestra comparación, el Flow X16 está al mismo nivel que el Katana 17 cuya RTX 4060 sólo tiene un TGP máximo de 105 vatios. Por otro lado, sólo un 5 por ciento lo separa del Legion 5 cuya RTX 4060 tiene un TGP de 140 vatios. Esto demuestra una vez más que la GPU apenas consigue beneficiarse de TGP más elevados, como ya destacó nuestro colega en su análisis de las nuevas tarjetas Nvidia Geforce RTX 4000. Su predecesora, con su RTX 3070 Ti, la supera en un 21%.
| The Witcher 3 - 1920x1080 Ultra Graphics & Postprocessing (HBAO+) | |
| Media de la clase Gaming (104.7 - 240, n=7, últimos 2 años) | |
| Lenovo Legion Pro 5 16IRX8 | |
| Asus ROG Flow X16 GV601V | |
| MSI Katana 17 B13VFK | |
| Asus ROG Flow X16 GV601RW-M5082W | |
| Samsung Galaxy Book3 Ultra 16, i9-13900H RTX 4070 | |
| Lenovo Yoga Pro 7 14IRH G8 | |
| Strange Brigade - 1920x1080 ultra AA:ultra AF:16 | |
| Media de la clase Gaming (76.3 - 458, n=87, últimos 2 años) | |
| Asus ROG Flow X16 GV601V | |
| MSI Katana 17 B13VFK | |
| Asus ROG Flow X16 GV601RW-M5082W | |
| Samsung Galaxy Book3 Ultra 16, i9-13900H RTX 4070 | |
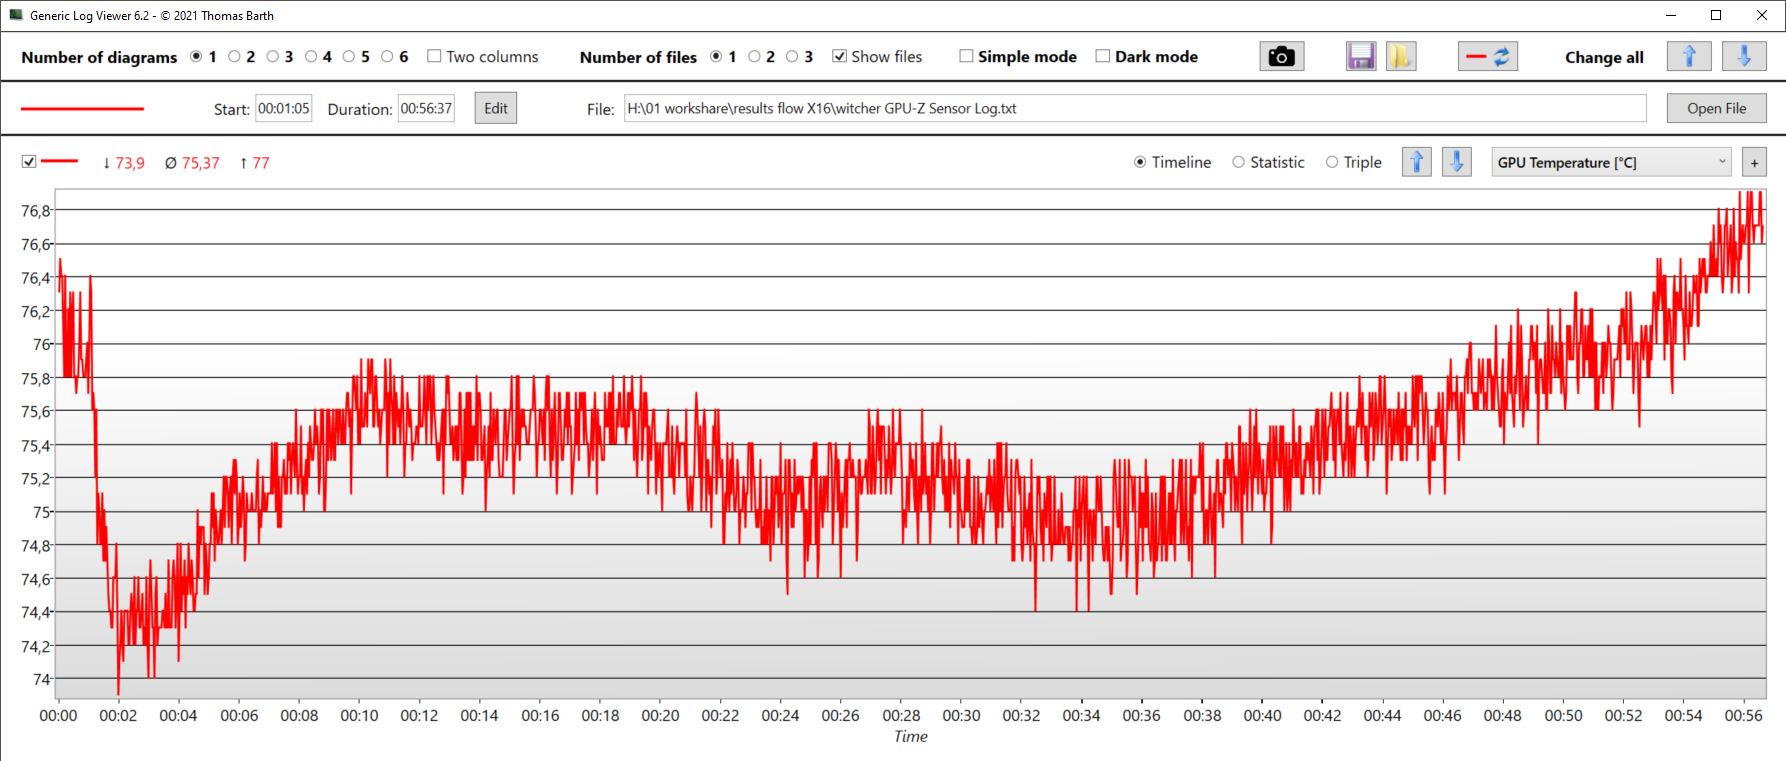
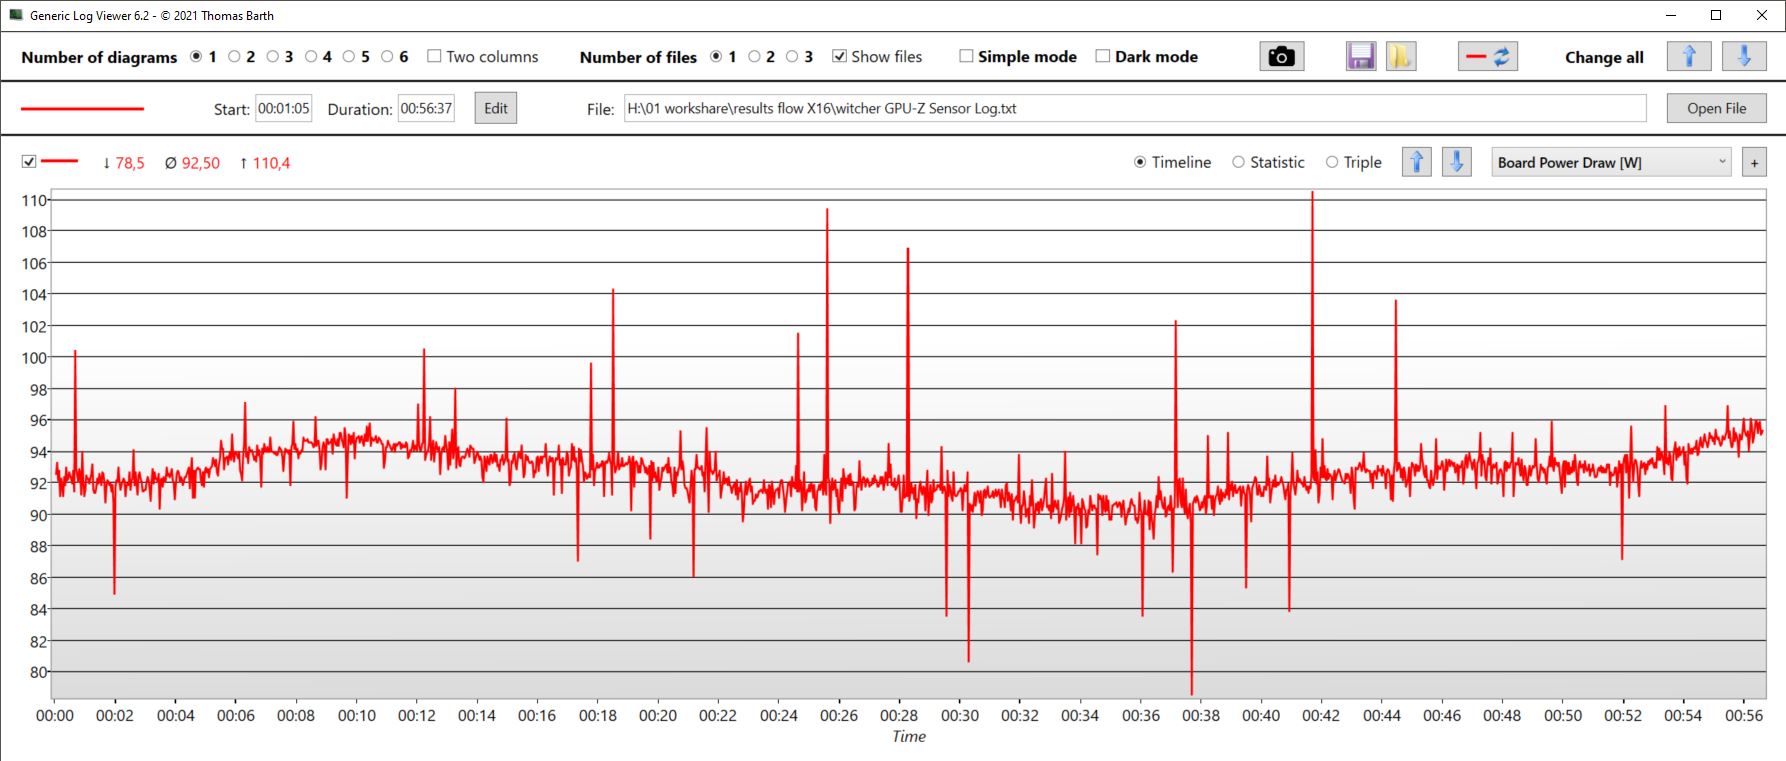
El framerate de Witcher 3 muestra la habitual curva día/noche, pero por lo demás es muy estable. Según el registro de GPU-Z, la velocidad de reloj del núcleo se mantiene casi constante en 2.460 MHz y la velocidad de reloj de la memoria también es estable (2 GHz).
La temperatura de la GPU fluctuó un poco, con una media de unos 75 °C, pero aumentó continuamente hacia el final de la hora, lo que significa que la velocidad de reloj podría reducirse durante largos periodos de funcionamiento.
La tarjeta consumió sólo 92,5 vatios de media y vimos picos extremadamente cortos de 110 vatios, pero nunca se alcanzaron los posibles 120 vatios.
Con suRTX 4070elGalaxy Book3 no tiene ninguna posibilidad contra nuestro X16 que, desde un punto de vista técnico, incluso consigue acercarse al Legion 5.
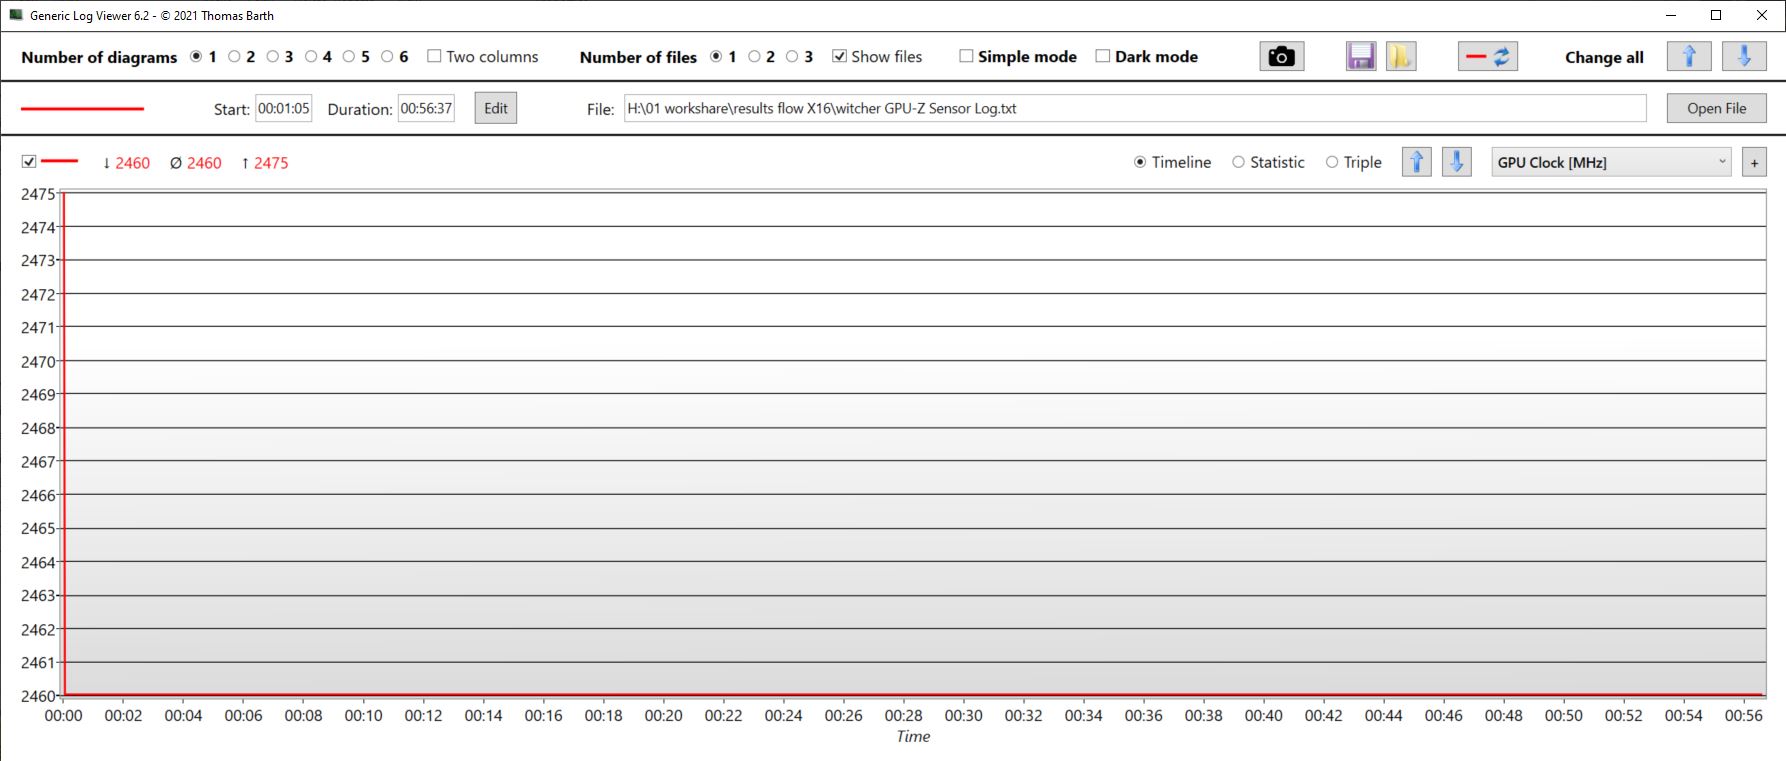
Witcher 3 FPS diagram
| bajo | medio | alto | ultra | QHD | 4K | |
|---|---|---|---|---|---|---|
| GTA V (2015) | 184.4 | 179.8 | 173.9 | 110.3 | 79.4 | |
| The Witcher 3 (2015) | 214.8 | 106.5 | ||||
| Dota 2 Reborn (2015) | 188.3 | 166 | 162.8 | 149.2 | 115.5 | |
| Final Fantasy XV Benchmark (2018) | 100.8 | |||||
| X-Plane 11.11 (2018) | 174 | 145.4 | 116.4 | 105.6 | ||
| Far Cry 5 (2018) | 140 | 130 | 99 | |||
| Strange Brigade (2018) | 419 | 266 | 225 | 192.5 | 129.2 | |
| Shadow of the Tomb Raider (2018) | 150 | 137 | 93 | |||
| Assassin´s Creed Valhalla (2020) | 114 | 98 | 71 | |||
| Far Cry 6 (2021) | 120 | 108 | 79 | |||
| Cyberpunk 2077 1.6 (2022) | 84.25 | 76.64 | 48.71 | |||
| F1 22 (2022) | 257 | 218 | 183.9 | 64.8 | 42.3 | |
| Call of Duty Modern Warfare 2 2022 (2022) | 91 | 86 | 61 | |||
| Hogwarts Legacy (2023) | 106.9 | 91.9 | 42.8 | |||
| The Last of Us (2023) | 71.2 | 53.1 | 32.7 |
Emisiones: el silencio también es posible con el Flow X16
Emisiones sonoras
En ralentí, los ventiladores permanecen casi siempre inmóviles. Bajo carga, el ruido depende claramente del modo de rendimiento seleccionado. Por ejemplo, al jugar en modo turbo, los ventiladores superan los 50 dB, mientras que en modo rendimiento funcionan a unos mucho más tolerables 44 dB. Esta diferencia relativamente grande por sí sola debería hacer más soportable la pequeña caída de rendimiento en modo rendimiento. En modo silencioso, el nivel de decibelios bajó a sólo 37 dB.
En modo turbo, los ventiladores funcionaron durante bastante tiempo después de ejecutar tareas exigentes como juegos, si no a toda velocidad. Sin embargo, aún funcionando en reposo, el X16 permaneció ruidoso por algunos minutos, si una sesión de juegos había tenido lugar previamente.
Por lo tanto, para los creadores de contenido, recomendaríamos utilizar el modo de rendimiento (o incluso silencioso) ya que son mucho más silenciosos con una disminución tolerable de la potencia disponible.
Cuando funciona en reposo, Windows o también los procesos en segundo plano de Asus siguen molestando a los ventiladores silenciosos. Esos ventiladores entran en acción, especialmente en modo turbo.
| Modus/Witcher 3 Ultra | FPS | Lautstärke in dB | Durchschnittsverbrauch in W |
|---|---|---|---|
| Turbo | 102 | 50,92 | 142 |
| Leistung | 92 | 44 | |
| Leise | 80 | 37.53 | 106 |
Ruido
| Ocioso |
| 24 / 24 / 24 dB(A) |
| Carga |
| 36.71 / 50.92 dB(A) |
 | ||
30 dB silencioso 40 dB(A) audible 50 dB(A) ruidosamente alto |
||
min: | ||
| Asus ROG Flow X16 GV601V GeForce RTX 4060 Laptop GPU, i9-13900H, WD PC SN560 SDDPNQE-1T00 | Asus ROG Flow X16 GV601RW-M5082W GeForce RTX 3070 Ti Laptop GPU, R9 6900HS, Micron 3400 1TB MTFDKBA1T0TFH | Samsung Galaxy Book3 Ultra 16, i9-13900H RTX 4070 GeForce RTX 4070 Laptop GPU, i9-13900H, Samsung PM9A1 MZVL21T0HCLR | Lenovo Legion Pro 5 16IRX8 GeForce RTX 4060 Laptop GPU, i7-13700HX, SK hynix PC801 HFS512GEJ9X115N | Lenovo Yoga Pro 7 14IRH G8 GeForce RTX 4050 Laptop GPU, i7-13700H, Samsung PM9A1 MZVL21T0HCLR | MSI Katana 17 B13VFK GeForce RTX 4060 Laptop GPU, i7-13620H, Micron 2400 MTFDKBA1T0QFM | |
|---|---|---|---|---|---|---|
| Noise | -13% | -9% | 1% | -6% | -19% | |
| apagado / medio ambiente * (dB) | 24 | 25.5 -6% | 25.2 -5% | 23 4% | 22.9 5% | 24.5 -2% |
| Idle Minimum * (dB) | 24 | 25.5 -6% | 25.2 -5% | 23.1 4% | 22.9 5% | 24.5 -2% |
| Idle Average * (dB) | 24 | 25.5 -6% | 25.2 -5% | 23.1 4% | 22.9 5% | 24.5 -2% |
| Idle Maximum * (dB) | 24 | 27.4 -14% | 31.3 -30% | 26.6 -11% | 36.8 -53% | 40 -67% |
| Load Average * (dB) | 36.71 | 49.9 -36% | 38.8 -6% | 34.7 5% | 43.7 -19% | 48.3 -32% |
| Witcher 3 ultra * (dB) | 50.92 | 47.6 7% | 46.2 9% | 56 -10% | ||
| Load Maximum * (dB) | 50.92 | 55 -8% | 51.2 -1% | 54.8 -8% | 46.2 9% | 59.1 -16% |
* ... más pequeño es mejor
Temperatura
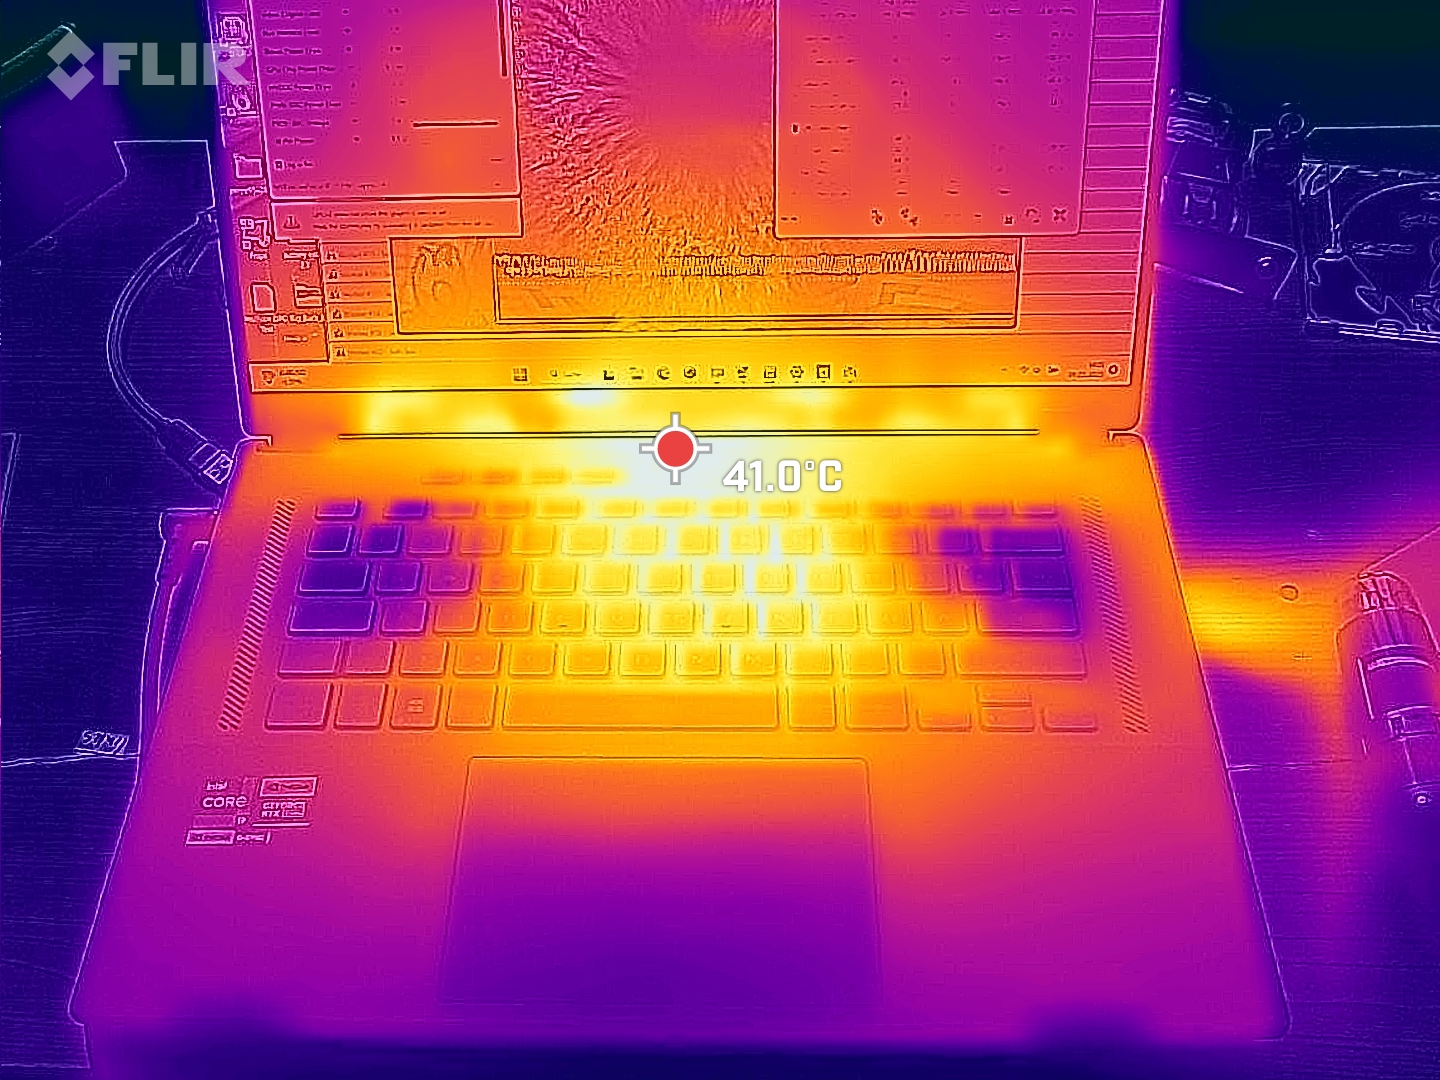
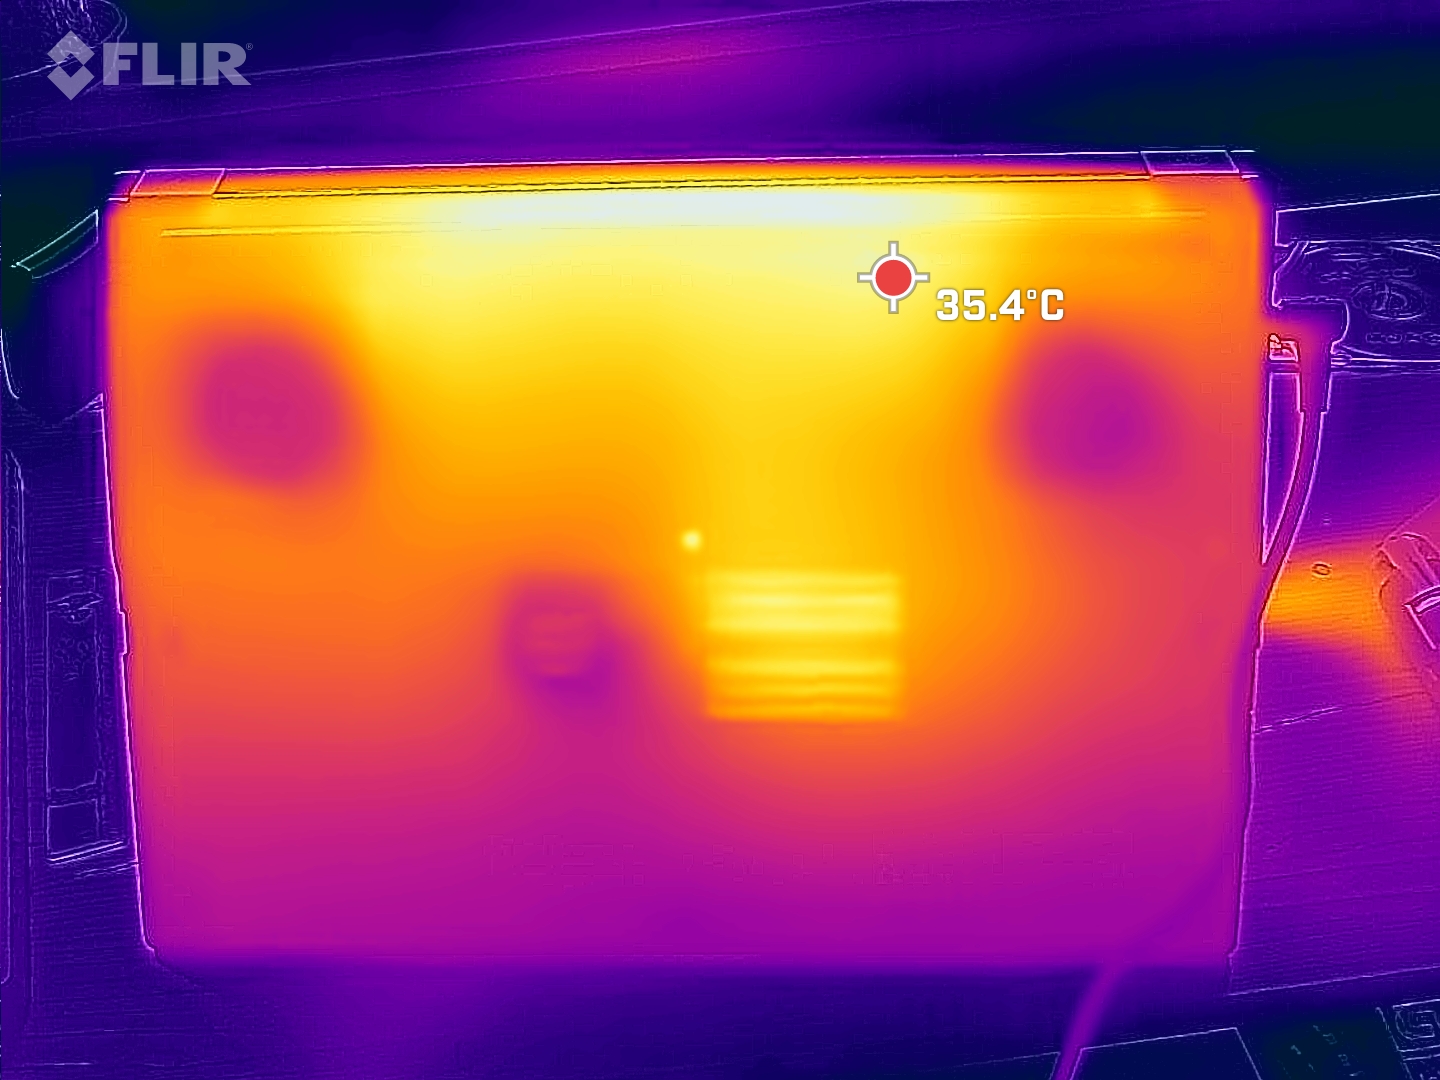
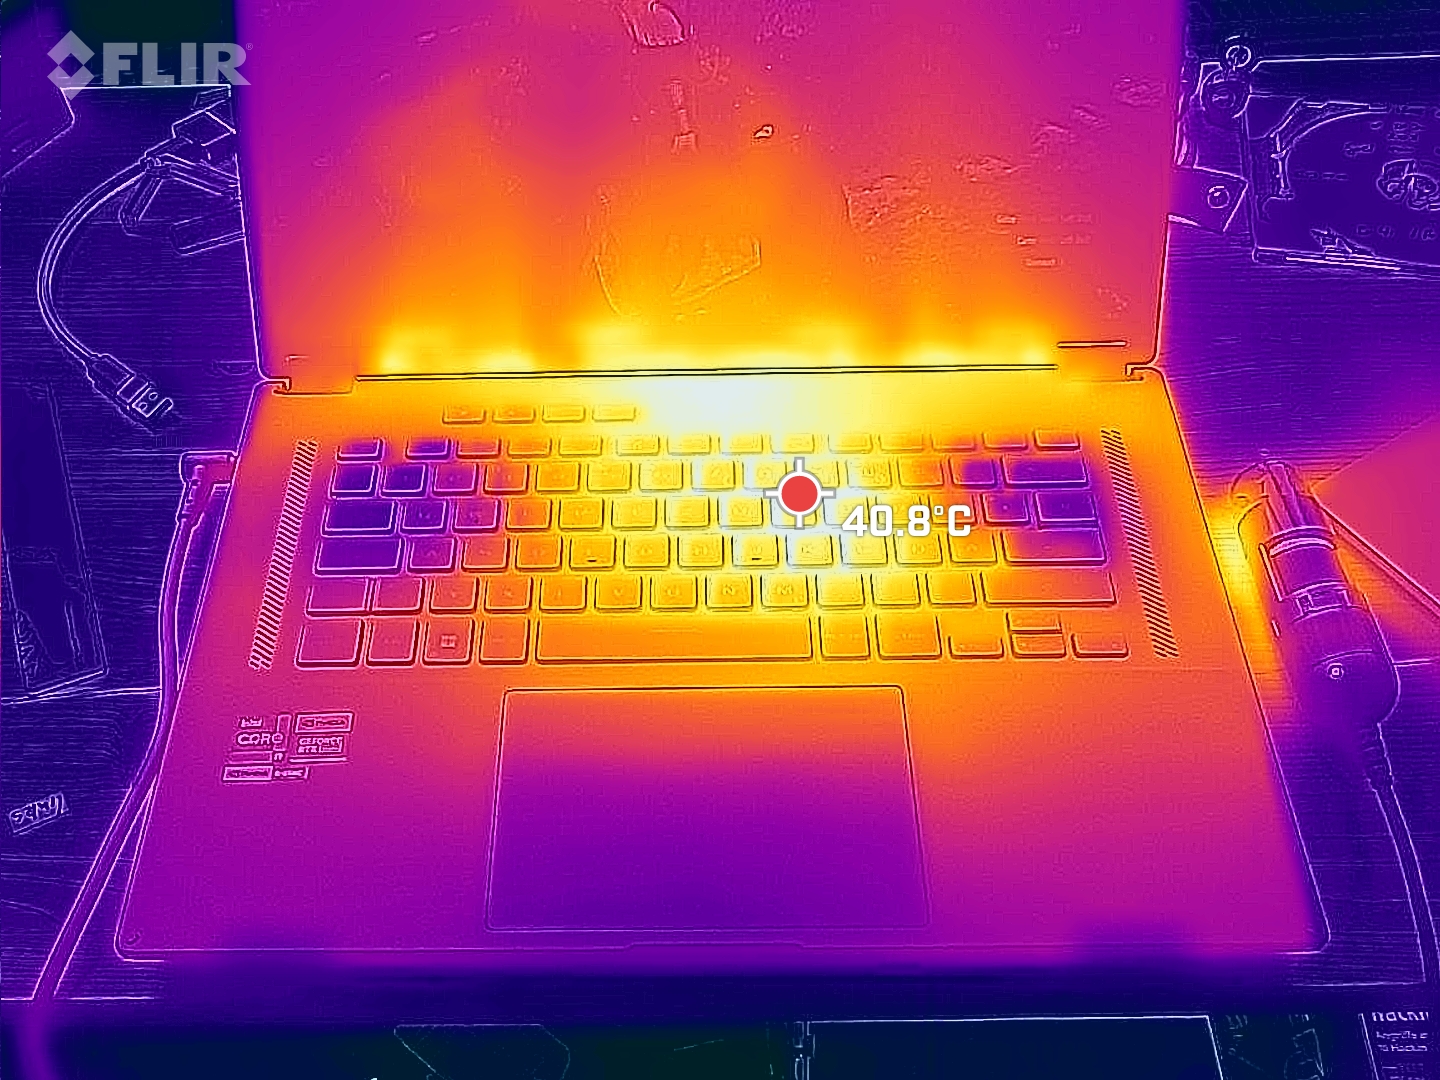
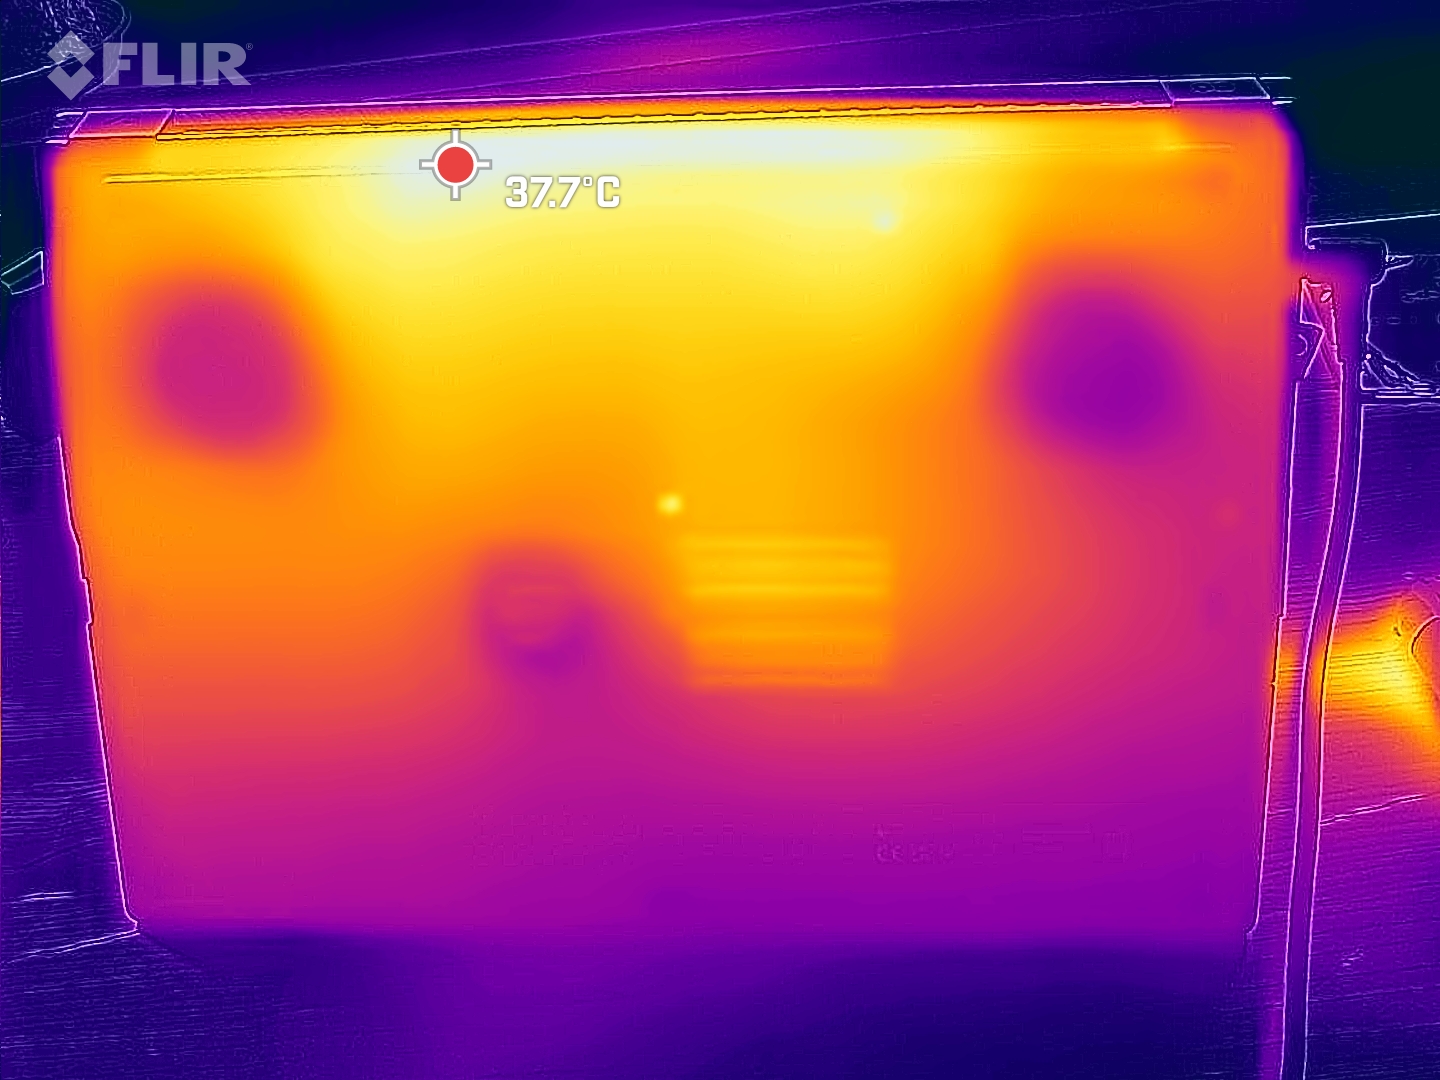
Durante el juego, hay puntos calientes de alrededor de 50 °C que se pueden encontrar en la parte media, superior del dispositivo y hacia la parte trasera con el reposamanos y las teclas WASD permaneciendo comparativamente frescos. La parte inferior del portátil no se calienta demasiado.
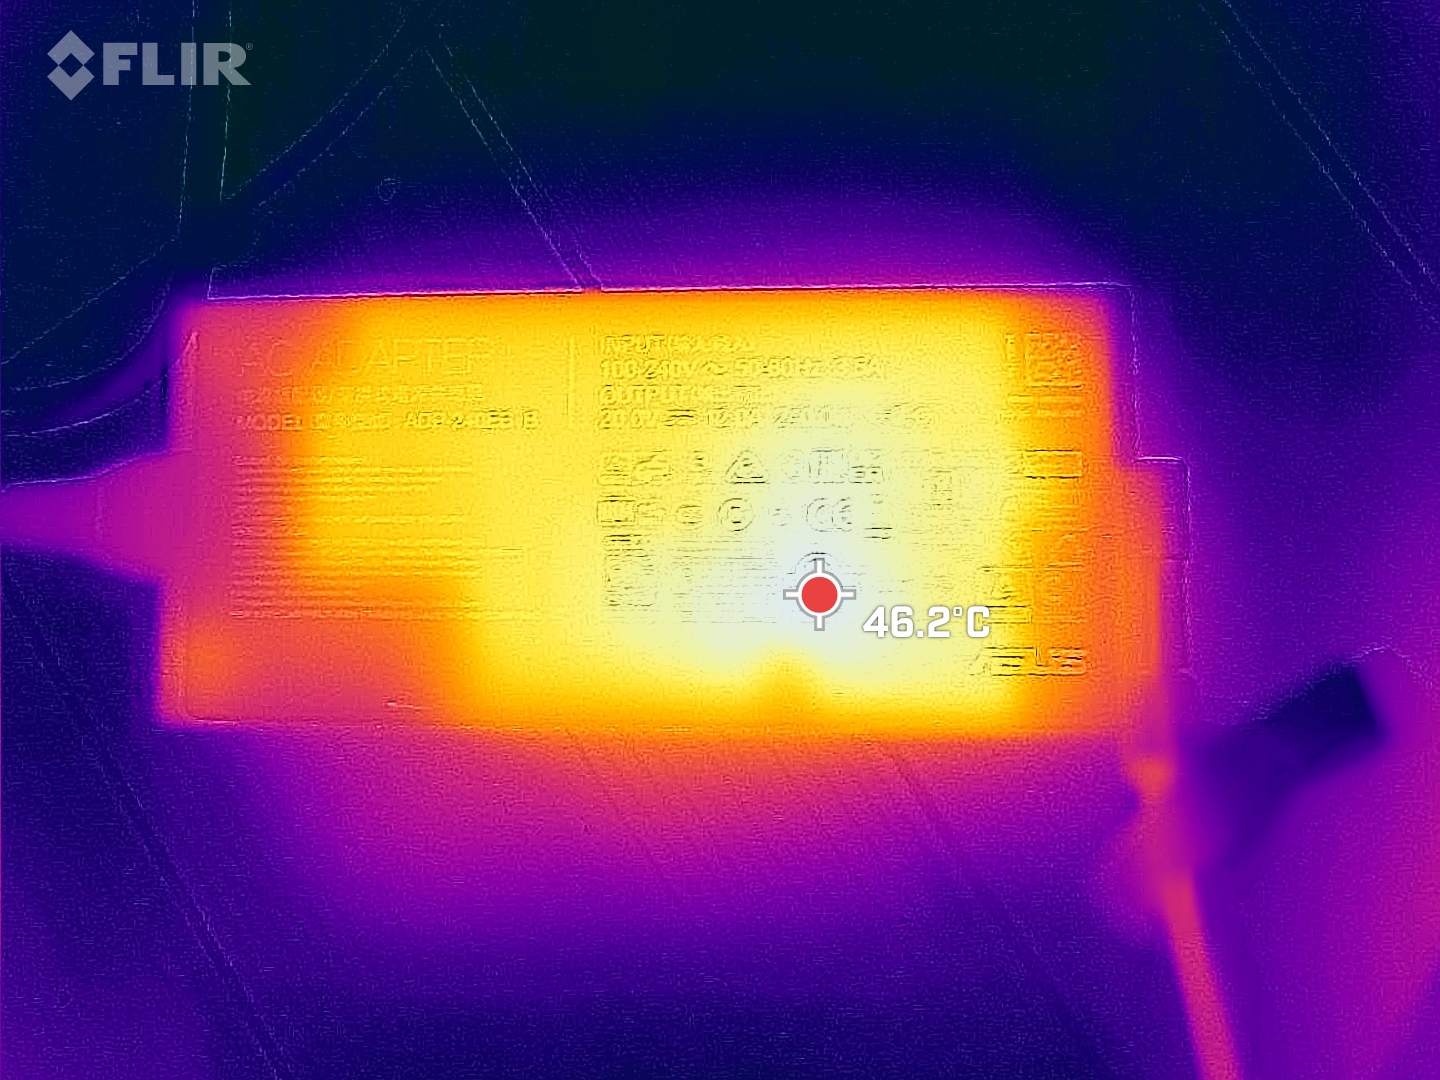
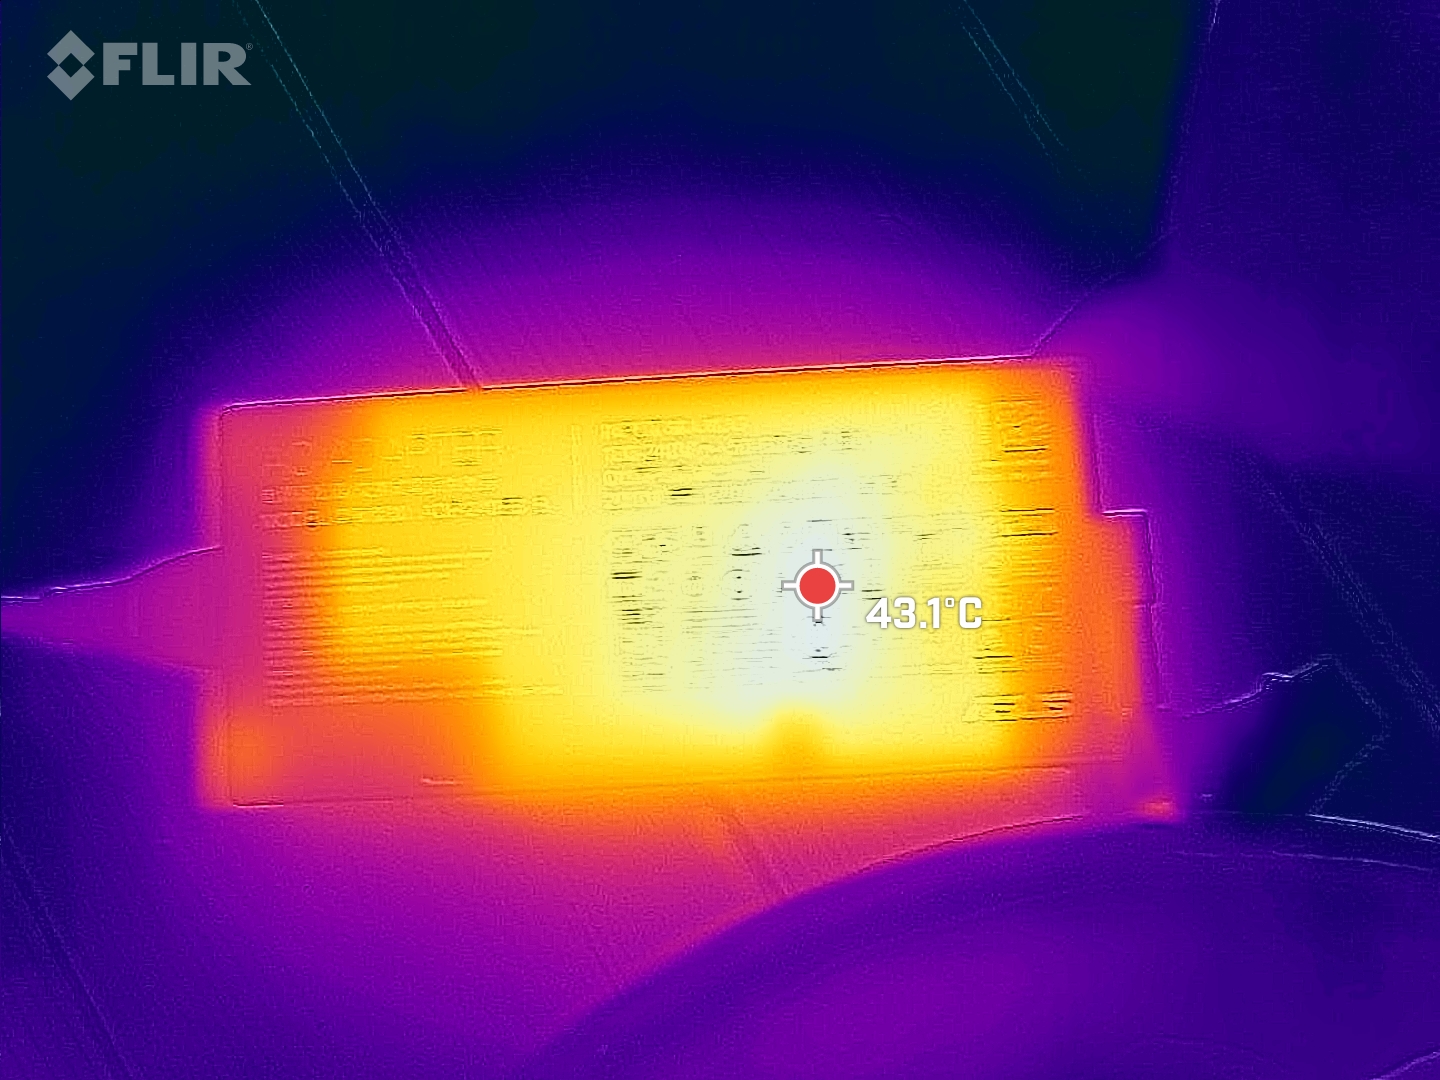
Sin embargo, incluso en reposo, el adaptador de corriente puede calentarse mucho. Bastan unos pocos procesos en segundo plano en reposo para que la delgada fuente de alimentación alcance una temperatura de 45 °C
(-) La temperatura máxima en la parte superior es de 46 °C / 115 F, frente a la media de 40.4 °C / 105 F, que oscila entre 21.2 y 68.8 °C para la clase Gaming.
(±) El fondo se calienta hasta un máximo de 41 °C / 106 F, frente a la media de 43.2 °C / 110 F
(+) En reposo, la temperatura media de la parte superior es de 31.9 °C / 89# F, frente a la media del dispositivo de 33.9 °C / 93 F.
(±) Jugando a The Witcher 3, la temperatura media de la parte superior es de 37.4 °C / 99 F, frente a la media del dispositivo de 33.9 °C / 93 F.
(+) El reposamanos y el panel táctil están a una temperatura inferior a la de la piel, con un máximo de 31 °C / 87.8 F y, por tanto, son fríos al tacto.
(-) La temperatura media de la zona del reposamanos de dispositivos similares fue de 28.8 °C / 83.8 F (-2.2 °C / -4 F).
| Asus ROG Flow X16 GV601V Intel Core i9-13900H, NVIDIA GeForce RTX 4060 Laptop GPU | Asus ROG Flow X16 GV601RW-M5082W AMD Ryzen 9 6900HS, NVIDIA GeForce RTX 3070 Ti Laptop GPU | Samsung Galaxy Book3 Ultra 16, i9-13900H RTX 4070 Intel Core i9-13900H, NVIDIA GeForce RTX 4070 Laptop GPU | Lenovo Legion Pro 5 16IRX8 Intel Core i7-13700HX, NVIDIA GeForce RTX 4060 Laptop GPU | Lenovo Yoga Pro 7 14IRH G8 Intel Core i7-13700H, NVIDIA GeForce RTX 4050 Laptop GPU | MSI Katana 17 B13VFK Intel Core i7-13620H, NVIDIA GeForce RTX 4060 Laptop GPU | |
|---|---|---|---|---|---|---|
| Heat | -13% | -4% | 0% | 4% | 2% | |
| Maximum Upper Side * (°C) | 46 | 55.1 -20% | 45.9 -0% | 42.8 7% | 41.6 10% | 41.6 10% |
| Maximum Bottom * (°C) | 41 | 50.3 -23% | 50.9 -24% | 50 -22% | 55.7 -36% | 43.1 -5% |
| Idle Upper Side * (°C) | 36 | 35.5 1% | 31.6 12% | 29.6 18% | 25.9 28% | 32 11% |
| Idle Bottom * (°C) | 33 | 36.1 -9% | 34.2 -4% | 34 -3% | 28 15% | 35.8 -8% |
* ... más pequeño es mejor
Prueba de esfuerzo
Al principio, los núcleos alcanzaron casi los 4 GHz y la CPU consumió 85 vatios. Sin embargo, al cabo de un minuto, la temperatura de los núcleos alcanzó los 96 °C y el rendimiento se redujo considerablemente. La velocidad de reloj de los núcleos bajó a 2,4 GHz durante unos minutos y el TDP fue de sólo 35 vatios. Esto provocó un nuevo descenso de la temperatura. Al cabo de unos minutos, la velocidad aumentó y fluctuó bastante, estableciéndose en una media de unos 2,6 GHz. La reducción del TDP a 35 vatios durante minutos seguidos fue un fenómeno que se producía con regularidad, tras lo cual volvía a fluctuar periódicamente. Con la temperatura cayendo con similar rapidez, esta no fue la única razón de este comportamiento.
En menor medida, la GPU era similar. Las fases relativamente estables eran considerablemente más cortas, y los valores globales fluctuaban más. La velocidad de reloj osciló repetidamente de 2,4 GHz a sólo 500 MHz e incluso menos, y la velocidad de reloj de la memoria mostró fluctuaciones igualmente extremas. La temperatura media fue de 65 °C y subió hasta un máximo de 82 °C. El consumo de energía se situó en una media de 46 vatios, pero saltó repetidamente a 90 vatios o más de 100 vatios.
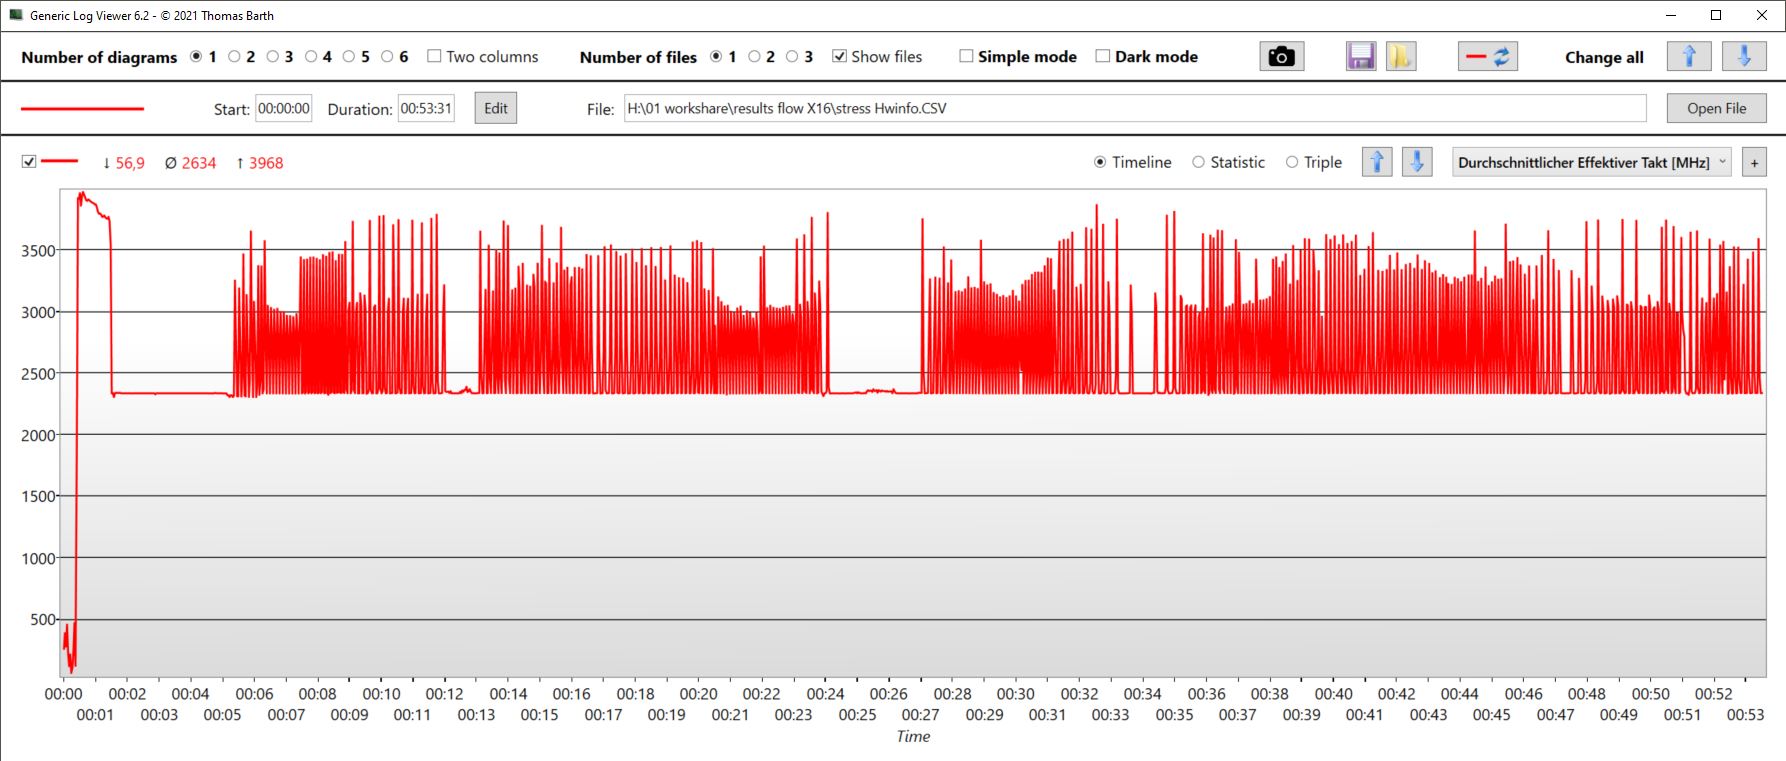
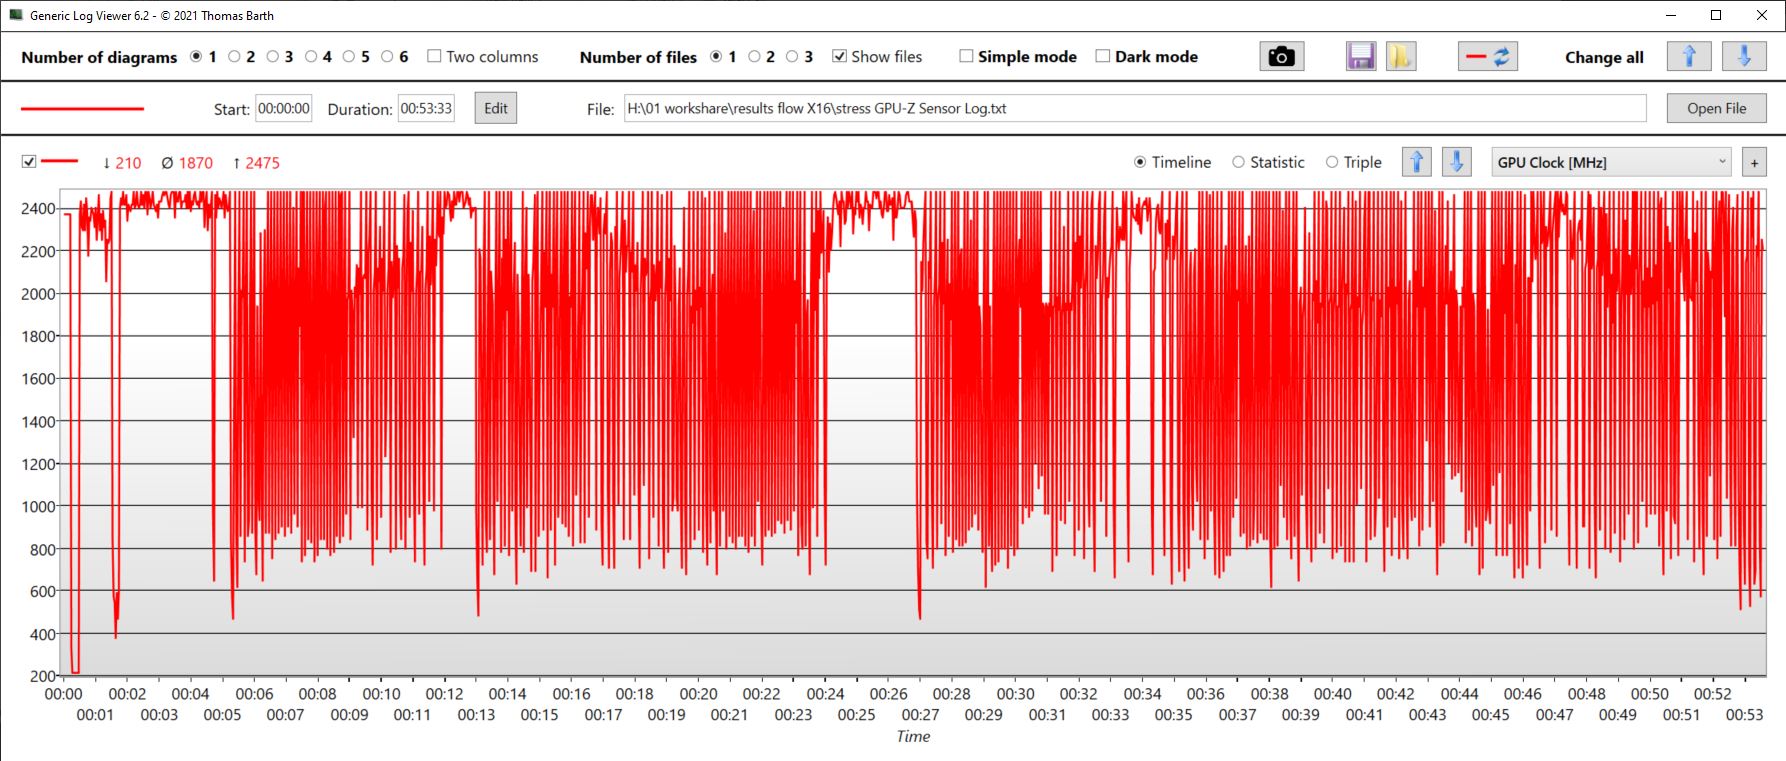
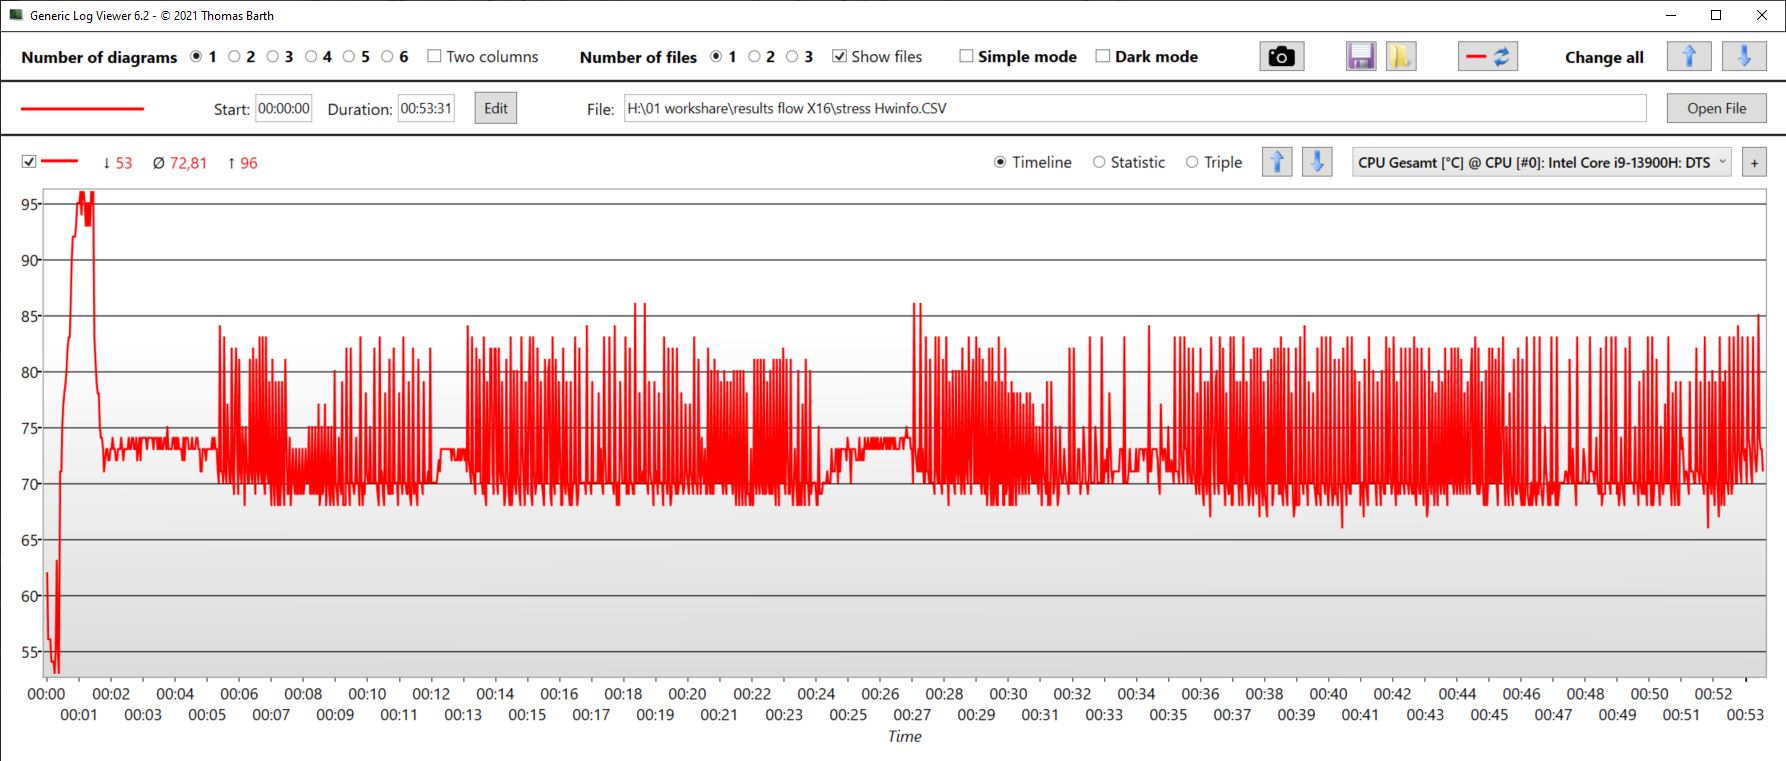
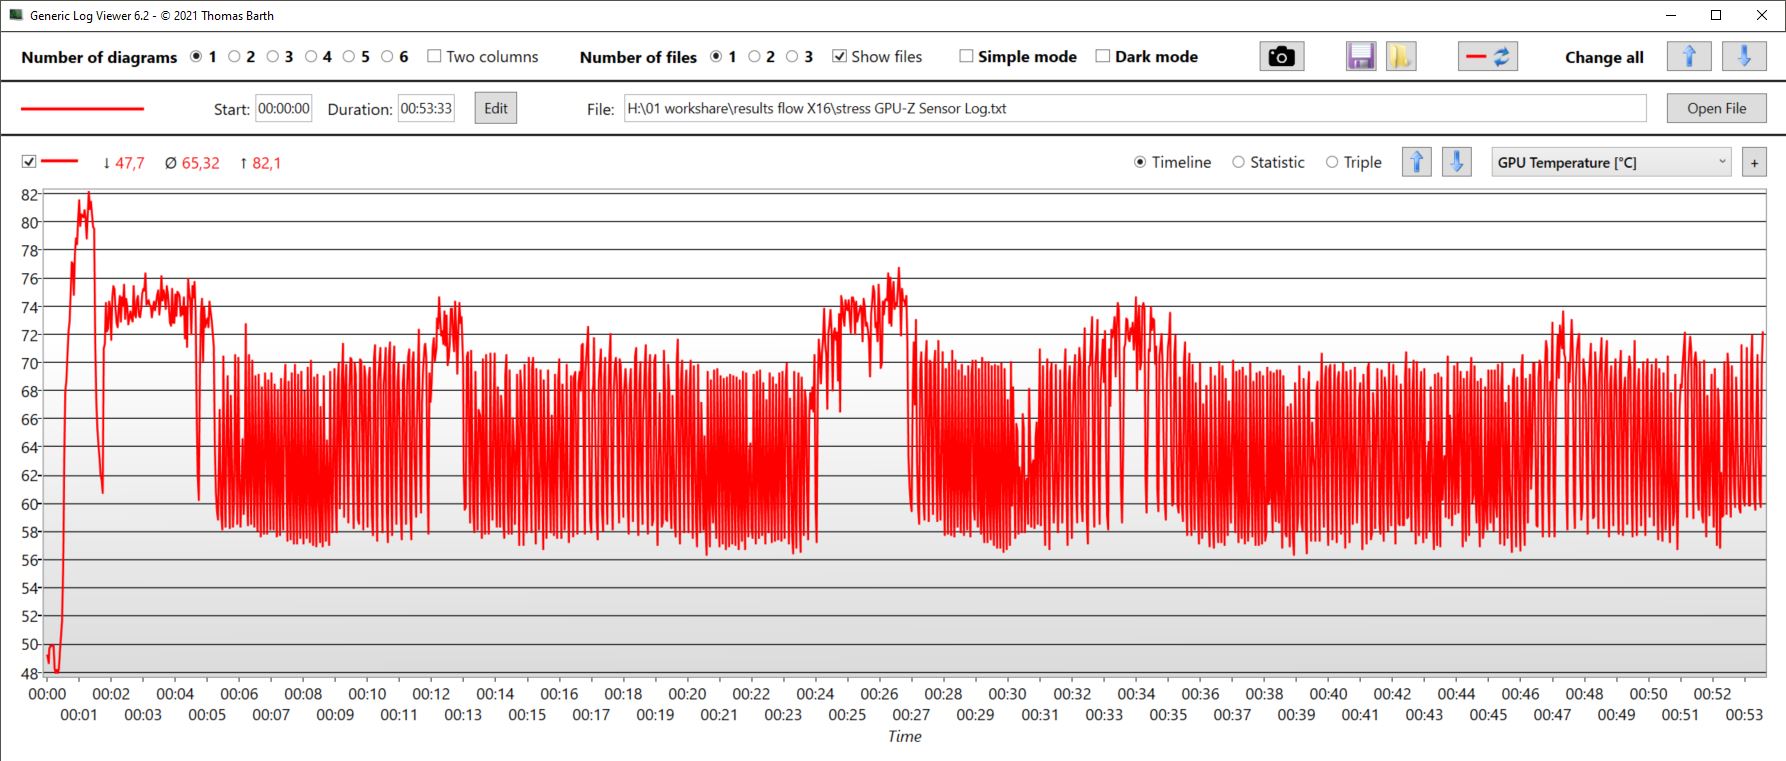
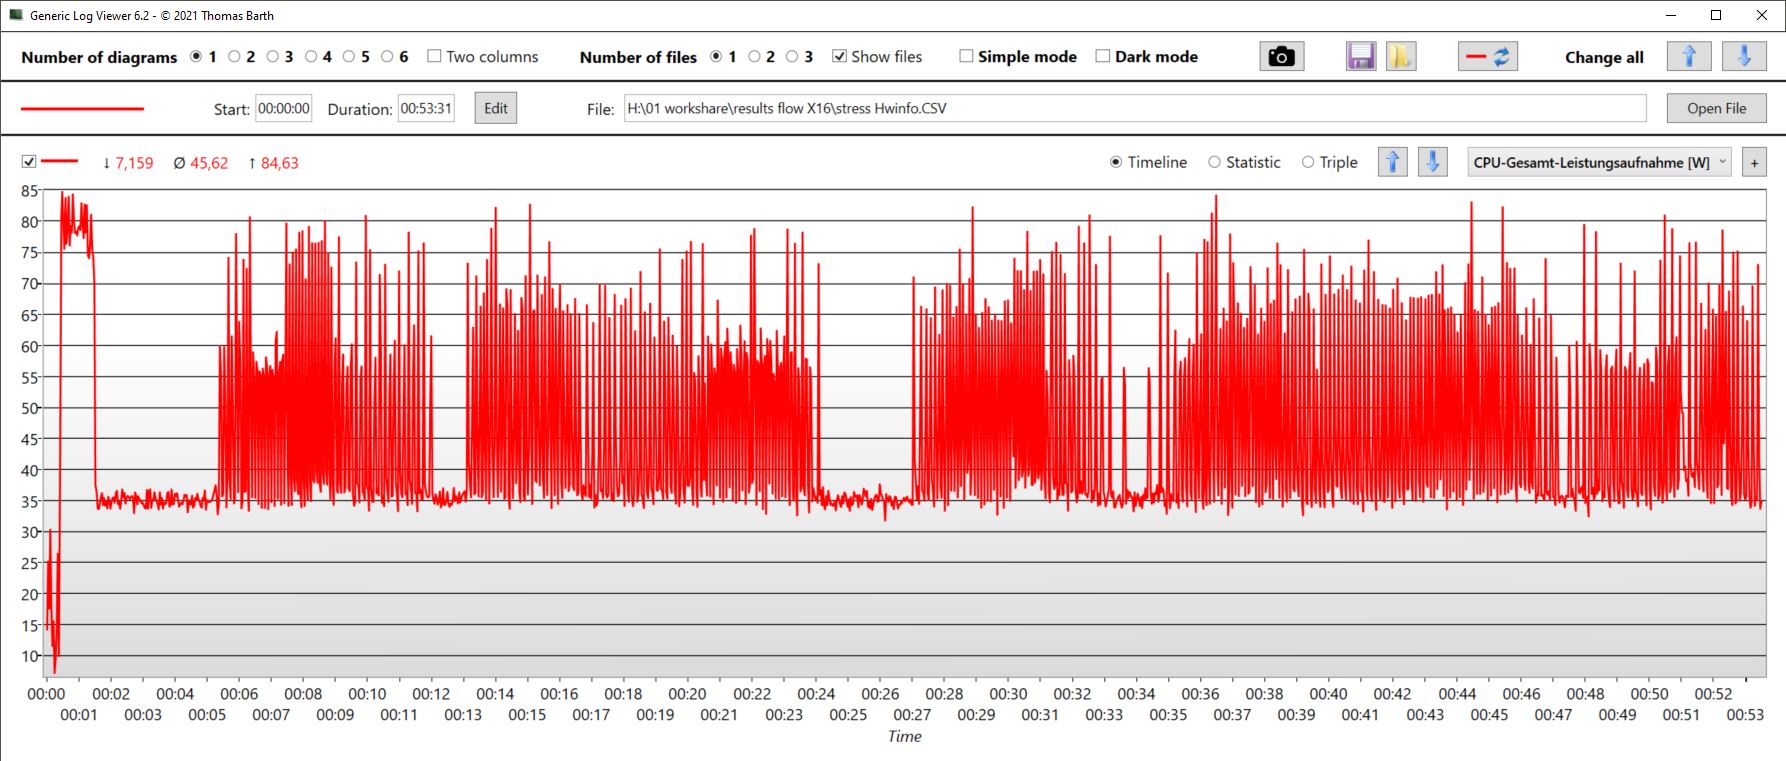
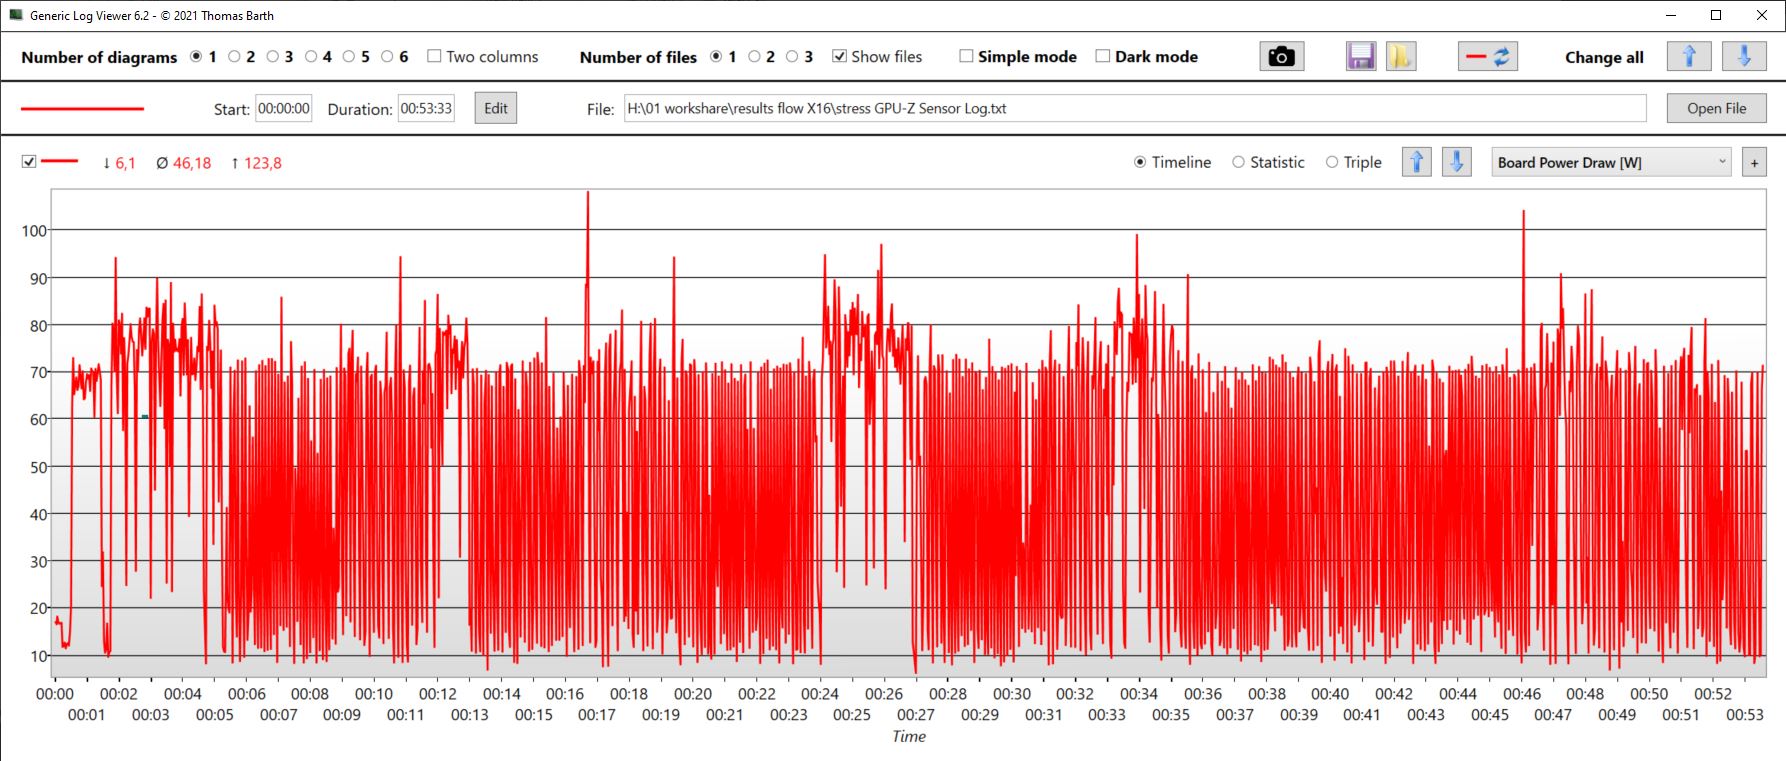
| RelojCPU (GHz) | Reloj GPU (MHz) | Temperatura mediaCPU (°C) | Temperatura media GPU (°C) | |
| Prime95 + FurMark Stress | 2,6 | 1.870 | 73 | 65 |
| Witcher 3 StressAllerdings könnten die Boxen etwas lauter | 505 | 2.460 | 67,6 | 75 |
Altavoces
Los altavoces ofrecen medios y agudos equilibrados y los graves son, por supuesto, más graves, aunque menos que en otros modelos. Con todo, los altavoces podrían sonar un poco más altos.
La toma de auriculares de 3,5 mm permite conectar dispositivos finales analógicos.
Asus ROG Flow X16 GV601V análisis de audio
(±) | la sonoridad del altavoz es media pero buena (77.38 dB)
Graves 100 - 315 Hz
(±) | lubina reducida - en promedio 9.6% inferior a la mediana
(±) | la linealidad de los graves es media (9.2% delta a frecuencia anterior)
Medios 400 - 2000 Hz
(+) | medios equilibrados - a sólo 4.7% de la mediana
(±) | la linealidad de los medios es media (7.5% delta respecto a la frecuencia anterior)
Altos 2 - 16 kHz
(+) | máximos equilibrados - a sólo 2.2% de la mediana
(+) | los máximos son lineales (6.1% delta a la frecuencia anterior)
Total 100 - 16.000 Hz
(+) | el sonido global es lineal (12% de diferencia con la mediana)
En comparación con la misma clase
» 12% de todos los dispositivos probados de esta clase eran mejores, 4% similares, 84% peores
» El mejor tuvo un delta de 6%, la media fue 18%, el peor fue ###max##%
En comparación con todos los dispositivos probados
» 9% de todos los dispositivos probados eran mejores, 2% similares, 88% peores
» El mejor tuvo un delta de 4%, la media fue 23%, el peor fue ###max##%
Lenovo Legion Pro 5 16IRX8 análisis de audio
(±) | la sonoridad del altavoz es media pero buena (72.7 dB)
Graves 100 - 315 Hz
(-) | casi sin bajos - de media 23.7% inferior a la mediana
(±) | la linealidad de los graves es media (10.7% delta a frecuencia anterior)
Medios 400 - 2000 Hz
(+) | medios equilibrados - a sólo 3.8% de la mediana
(±) | la linealidad de los medios es media (7.1% delta respecto a la frecuencia anterior)
Altos 2 - 16 kHz
(+) | máximos equilibrados - a sólo 3.7% de la mediana
(+) | los máximos son lineales (6.7% delta a la frecuencia anterior)
Total 100 - 16.000 Hz
(±) | la linealidad del sonido global es media (21.9% de diferencia con la mediana)
En comparación con la misma clase
» 79% de todos los dispositivos probados de esta clase eran mejores, 6% similares, 16% peores
» El mejor tuvo un delta de 6%, la media fue 18%, el peor fue ###max##%
En comparación con todos los dispositivos probados
» 63% de todos los dispositivos probados eran mejores, 7% similares, 30% peores
» El mejor tuvo un delta de 4%, la media fue 23%, el peor fue ###max##%
Gestión de la energía: buena, pero no excelente
Gestión de la energía
Cuando funciona en reposo, nuestro X16 no es tan económico como el Galaxy Book3, debido también a la brillante pantalla táctil. A pesar de esto, durante el uso en reposo, el dispositivo es un mundo aparte en comparación con el Legion 5. Pero, echando un vistazo al Katana de 17 pulgadas, está claro que el Flow X16 podría ser un poco más eficiente energéticamente en reposo.
En juegos, el consumo es comparable al delKatana 17con un rendimiento ligeramente superior. Al mismo tiempo, elLegion 5consume mucha más energía de la pared. Esto último también se aplica a su predecesorr, pero el nuevo Asus es notablemente más eficiente.
| Off / Standby | |
| Ocioso | |
| Carga |
|
Clave:
min: | |
| Asus ROG Flow X16 GV601V i9-13900H, GeForce RTX 4060 Laptop GPU, WD PC SN560 SDDPNQE-1T00, IPS, 2560x1600, 16" | Asus ROG Flow X16 GV601RW-M5082W R9 6900HS, GeForce RTX 3070 Ti Laptop GPU, Micron 3400 1TB MTFDKBA1T0TFH, Mini LED, 2560x1600, 16.1" | Samsung Galaxy Book3 Ultra 16, i9-13900H RTX 4070 i9-13900H, GeForce RTX 4070 Laptop GPU, Samsung PM9A1 MZVL21T0HCLR, OLED / AMOLED, 2880x1800, 16" | Lenovo Legion Pro 5 16IRX8 i7-13700HX, GeForce RTX 4060 Laptop GPU, SK hynix PC801 HFS512GEJ9X115N, IPS, 2560x1600, 16" | Lenovo Yoga Pro 7 14IRH G8 i7-13700H, GeForce RTX 4050 Laptop GPU, Samsung PM9A1 MZVL21T0HCLR, IPS, 3072x1920, 14.5" | MSI Katana 17 B13VFK i7-13620H, GeForce RTX 4060 Laptop GPU, Micron 2400 MTFDKBA1T0QFM, IPS LED, 1920x1080, 17.3" | Medio NVIDIA GeForce RTX 4060 Laptop GPU | Media de la clase Gaming | |
|---|---|---|---|---|---|---|---|---|
| Power Consumption | -48% | 41% | -63% | 23% | 0% | -5% | -25% | |
| Idle Minimum * (Watt) | 9.6 | 12.2 -27% | 4.3 55% | 24.5 -155% | 7.6 21% | 12.2 -27% | 11.5 ? -20% | 13 ? -35% |
| Idle Average * (Watt) | 16 | 25.5 -59% | 4.6 71% | 29.2 -83% | 13.3 17% | 14.9 7% | 16 ? -0% | 19 ? -19% |
| Idle Maximum * (Watt) | 16.9 | 29.8 -76% | 11.4 33% | 34.3 -103% | 13.7 19% | 15.8 7% | 20.3 ? -20% | 24.6 ? -46% |
| Load Average * (Watt) | 104 | 183 -76% | 97 7% | 98.7 5% | 88.2 15% | 85.22 18% | 92.9 ? 11% | 110.7 ? -6% |
| Witcher 3 ultra * (Watt) | 142 | 183.6 -29% | 100.9 29% | 178.6 -26% | 94.2 34% | 151.1 -6% | ||
| Load Maximum * (Watt) | 214 | 253 -18% | 107 50% | 249.6 -17% | 143 33% | 212.8 1% | 210 ? 2% | 259 ? -21% |
* ... más pequeño es mejor
Power consumption Witcher 3 / Stress test
Power consumption with an external monitor
Duración de la batería
Nuestro modelo de prueba mantiene el mismo tamaño de batería (90 Wh) que su predecesor predecesor. De este modo, la batería de la delgada X16 es mayor que la de las máquinas de juego de tamaño normal de gama media como la Legion 5.
Por lo tanto, se puede esperar una larga duración de la batería. Esto hizo que nuestra prueba Wi-Fi fuera aún más sorprendente. Competidores con baterías más pequeñas como el Galaxy Book3 (76 Wh) o también el Yoga Pro 7 (73 Wh) poseen una resistencia igual de buena. Esta es un área donde el X16 podría mejorar su consumo de energía en reposo.
No obstante, la duración de la batería es buena, pero, considerando el gran tamaño de la batería, se podrían haber esperado mejores tiempos de ejecución - al menos cuando se trata de tareas poco exigentes como navegar por internet. Además, cuando navegues por internet en modo batería, asegúrate de que está seleccionado el modo silencioso y no el de rendimiento.
| Asus ROG Flow X16 GV601V i9-13900H, GeForce RTX 4060 Laptop GPU, 90 Wh | Asus ROG Flow X16 GV601RW-M5082W R9 6900HS, GeForce RTX 3070 Ti Laptop GPU, 90 Wh | Samsung Galaxy Book3 Ultra 16, i9-13900H RTX 4070 i9-13900H, GeForce RTX 4070 Laptop GPU, 76 Wh | Lenovo Legion Pro 5 16IRX8 i7-13700HX, GeForce RTX 4060 Laptop GPU, 80 Wh | Lenovo Yoga Pro 7 14IRH G8 i7-13700H, GeForce RTX 4050 Laptop GPU, 73 Wh | MSI Katana 17 B13VFK i7-13620H, GeForce RTX 4060 Laptop GPU, 53.5 Wh | Media de la clase Gaming | |
|---|---|---|---|---|---|---|---|
| Duración de Batería | -34% | -13% | -55% | 6% | -48% | -6% | |
| H.264 (h) | 8.9 | 9 1% | 12.4 39% | 8.32 ? -7% | |||
| WiFi v1.3 (h) | 7.9 | 5.7 -28% | 8 1% | 3.4 -57% | 9.9 25% | 2.9 -63% | 7.11 ? -10% |
| Load (h) | 1.5 | 0.9 -40% | 0.9 -40% | 0.7 -53% | 0.8 -47% | 1 -33% | 1.502 ? 0% |
| Witcher 3 ultra (h) | 0.9 | ||||||
| Reader / Idle (h) | 6.7 | 8.27 ? |
Pro
Contra
Veredicto - Un dispositivo maravilloso y muy versátil
Por encima de todo, el Asus ROG Flow X16 es una cosa: ¡versátil! Es un dispositivo de trabajo delgado y móvil, es un 2 en 1, una tableta, una potente estación de trabajo e incluso un PC para juegos. Pero algo aún más sorprendente: Hace todas estas cosas realmente bien sin cometer grandes errores. Es cualquier cosa menos un compromiso perezoso.
Porque, a pesar de sus dimensiones compactas y su funcionalidad 2 en 1, el hardware no se ralentiza y ofrece, al menos en modo turbo, un rendimiento superior a la media. Aunque aquí es donde se pone un poco ruidoso, no es más ruidoso que la competencia puramente centrada en los juegos. Sin embargo, incluso después de terminar un periodo de carga pesada, los ventiladores siguen funcionando durante bastante tiempo.
Cambiamos la categoría de producto a "Gaming" ya que la puntuación aquí es aproximadamente 2.4 puntos porcentuales superior a la categoría "Convertible".
El Asus ROG Flow X16 es una estación de trabajo 2-en-1 para juegos extremadamente versátil y potente con una buena pantalla táctil.
Hasta ahora, las alternativas de este tipo son escasas. Actualmente, la propia Asus parece muy dispuesta a experimentar. Los compradores potenciales podrían echar un vistazo a un dispositivo que mencionamos al principio del artículo, la tableta para juegos Asus ROG Flow Z13. ElSamsung Galaxy Book3 Ultra 16(89%) es igual de bueno, pero algo lento a pesar de tener una GPU más potente. El modelo con menos especificacionesLenovo Yoga Pro 7 14 G8(90%) también merece la pena.
Precio y disponibilidad
Actualmente, nuestra configuración del Flow X16 con una RTX 4060 no está disponible en Amazon ni en BestBuy. Sin embargo, en esta última tienda, el modelo RTX 4070 se puede conseguir por 2699,99 $.
Asus ROG Flow X16 GV601V
- 06/08/2023 v7 (old)
Christian Hintze
Transparencia
La selección de los dispositivos que se van a reseñar corre a cargo de nuestro equipo editorial. La muestra de prueba fue proporcionada al autor en calidad de préstamo por el fabricante o el minorista a los efectos de esta reseña. El prestamista no tuvo ninguna influencia en esta reseña, ni el fabricante recibió una copia de la misma antes de su publicación. No había ninguna obligación de publicar esta reseña. Como empresa de medios independiente, Notebookcheck no está sujeta a la autoridad de fabricantes, minoristas o editores.
Así es como prueba Notebookcheck
Cada año, Notebookcheck revisa de forma independiente cientos de portátiles y smartphones utilizando procedimientos estandarizados para asegurar que todos los resultados son comparables. Hemos desarrollado continuamente nuestros métodos de prueba durante unos 20 años y hemos establecido los estándares de la industria en el proceso. En nuestros laboratorios de pruebas, técnicos y editores experimentados utilizan equipos de medición de alta calidad. Estas pruebas implican un proceso de validación en varias fases. Nuestro complejo sistema de clasificación se basa en cientos de mediciones y puntos de referencia bien fundamentados, lo que mantiene la objetividad.Price comparison

