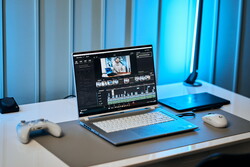
Análisis del portátil Gigabyte AERO 16 OLED: Eficiente RTX 4070 para jugadores y creativos
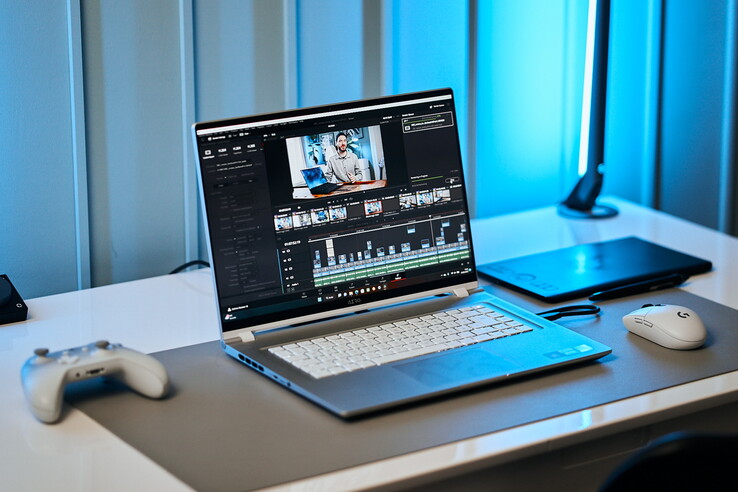
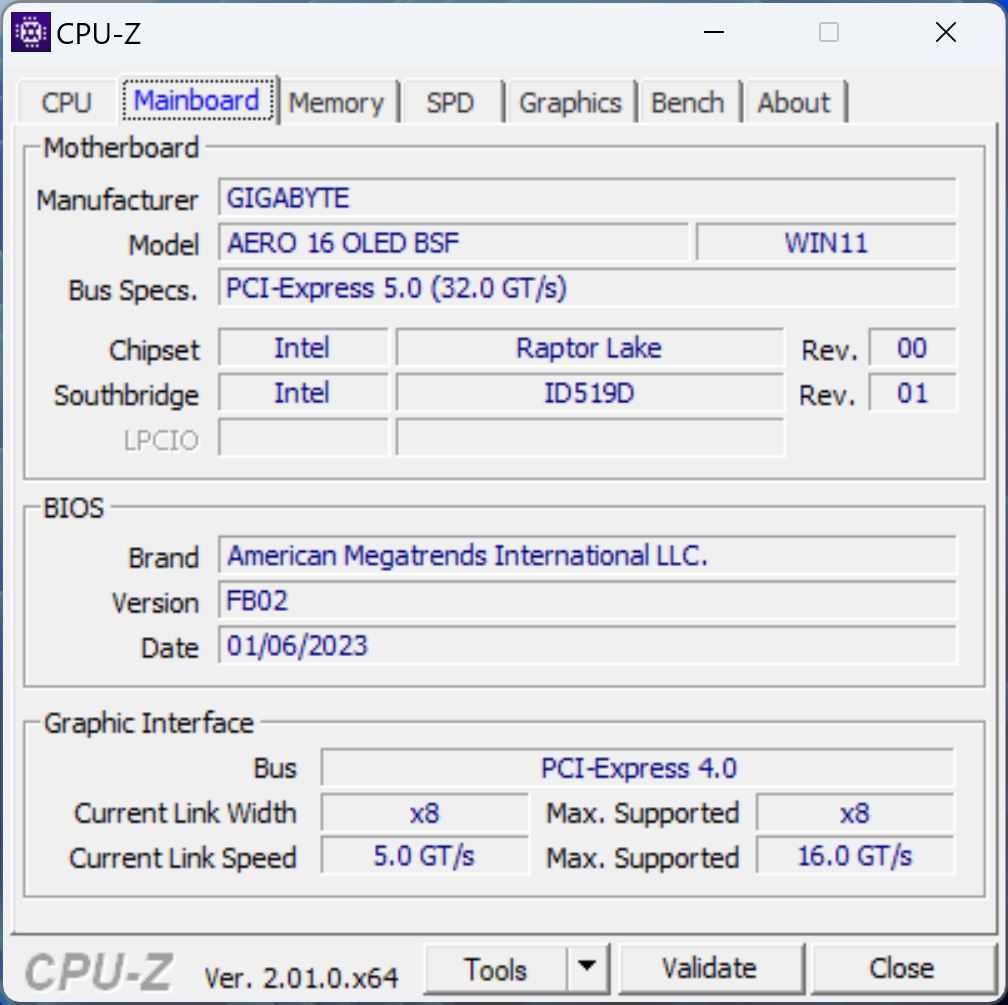
El Aero 16 OLED de Gigabyte es una interesante mezcla de portátil para juegos y estación de trabajo para creativos. Además del cambio de CPU Alder a Raptor Lake y de Nvidia RTX 30x a RTX 40x, también se han hecho otros cambios, como en la carcasa y los puertos.
Ya habíamos analizado el predecesor con la RTX 3080 Ti y nuestra configuración actual tiene una RTX 4070. Hasta ahora solo hemos analizado el nuevo Razer Blade 18con la misma GPU, así que el de 18 pulgadas tendrá que servir de comparación en los benchmarks 3D. Por lo demás, comparamos competidores de 16 pulgadas de la generación anterior, incluyendo el Asus Zenbook Pro 16X OLEDel Asus TUF Gaming A16 y el MSI CreatorPro Z16P con su Nvidia A300.
Posibles contendientes en la comparación
Valoración | Fecha | Modelo | Peso | Altura | Tamaño | Resolución | Precio |
|---|---|---|---|---|---|---|---|
| 86.2 % v7 (old) | 03/2023 | Gigabyte AERO 16 OLED BSF i9-13900H, GeForce RTX 4070 Laptop GPU | 2.1 kg | 18 mm | 16.00" | 3840x2400 | |
| 84.7 % v7 (old) | 03/2022 | Gigabyte Aero 16 YE5 i9-12900HK, GeForce RTX 3080 Ti Laptop GPU | 2.3 kg | 22.4 mm | 16.00" | 3840x2400 | |
| 91.4 % v7 (old) | 02/2023 | Razer Blade 18 RTX 4070 i9-13950HX, GeForce RTX 4070 Laptop GPU | 3 kg | 21.9 mm | 18.00" | 2560x1600 | |
| 88.4 % v7 (old) | 12/2022 | Asus ZenBook Pro 16X OLED UX7602ZM-ME115W i9-12900H, GeForce RTX 3060 Laptop GPU | 2.4 kg | 19.5 mm | 16.00" | 3840x2400 | |
| 86.2 % v7 (old) | 02/2023 | Asus TUF Gaming A16 FA617 R7 7735HS, Radeon RX 7600S | 2.2 kg | 27 mm | 16.00" | 1920x1200 | |
| 84.3 % v7 (old) | 11/2022 | MSI CreatorPro Z16P B12UKST i7-12700H, RTX A3000 Laptop GPU | 2.4 kg | 19 mm | 16.00" | 2560x1600 |
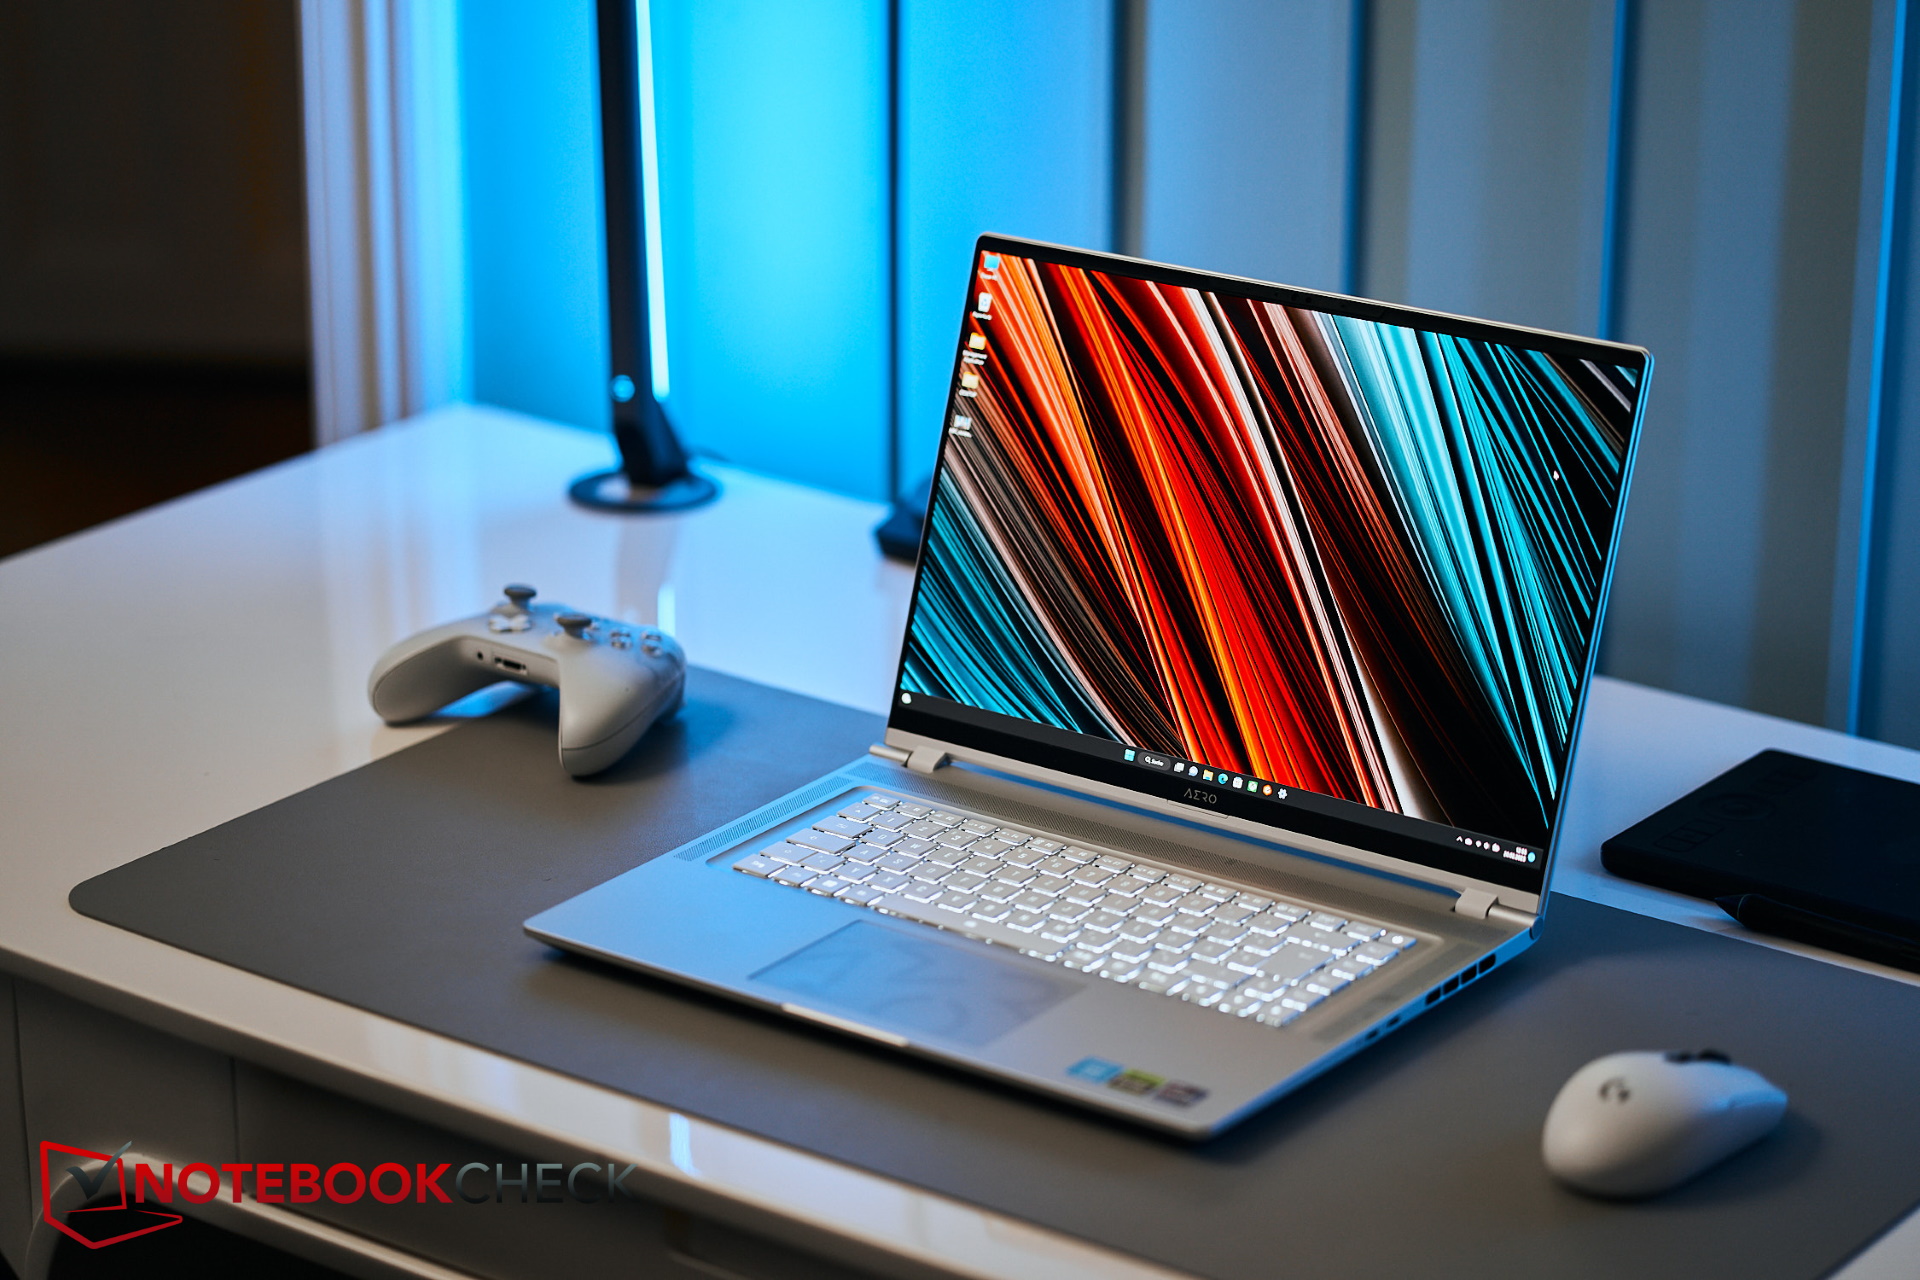
Carcasa - Robusto chasis metálico en color plateado
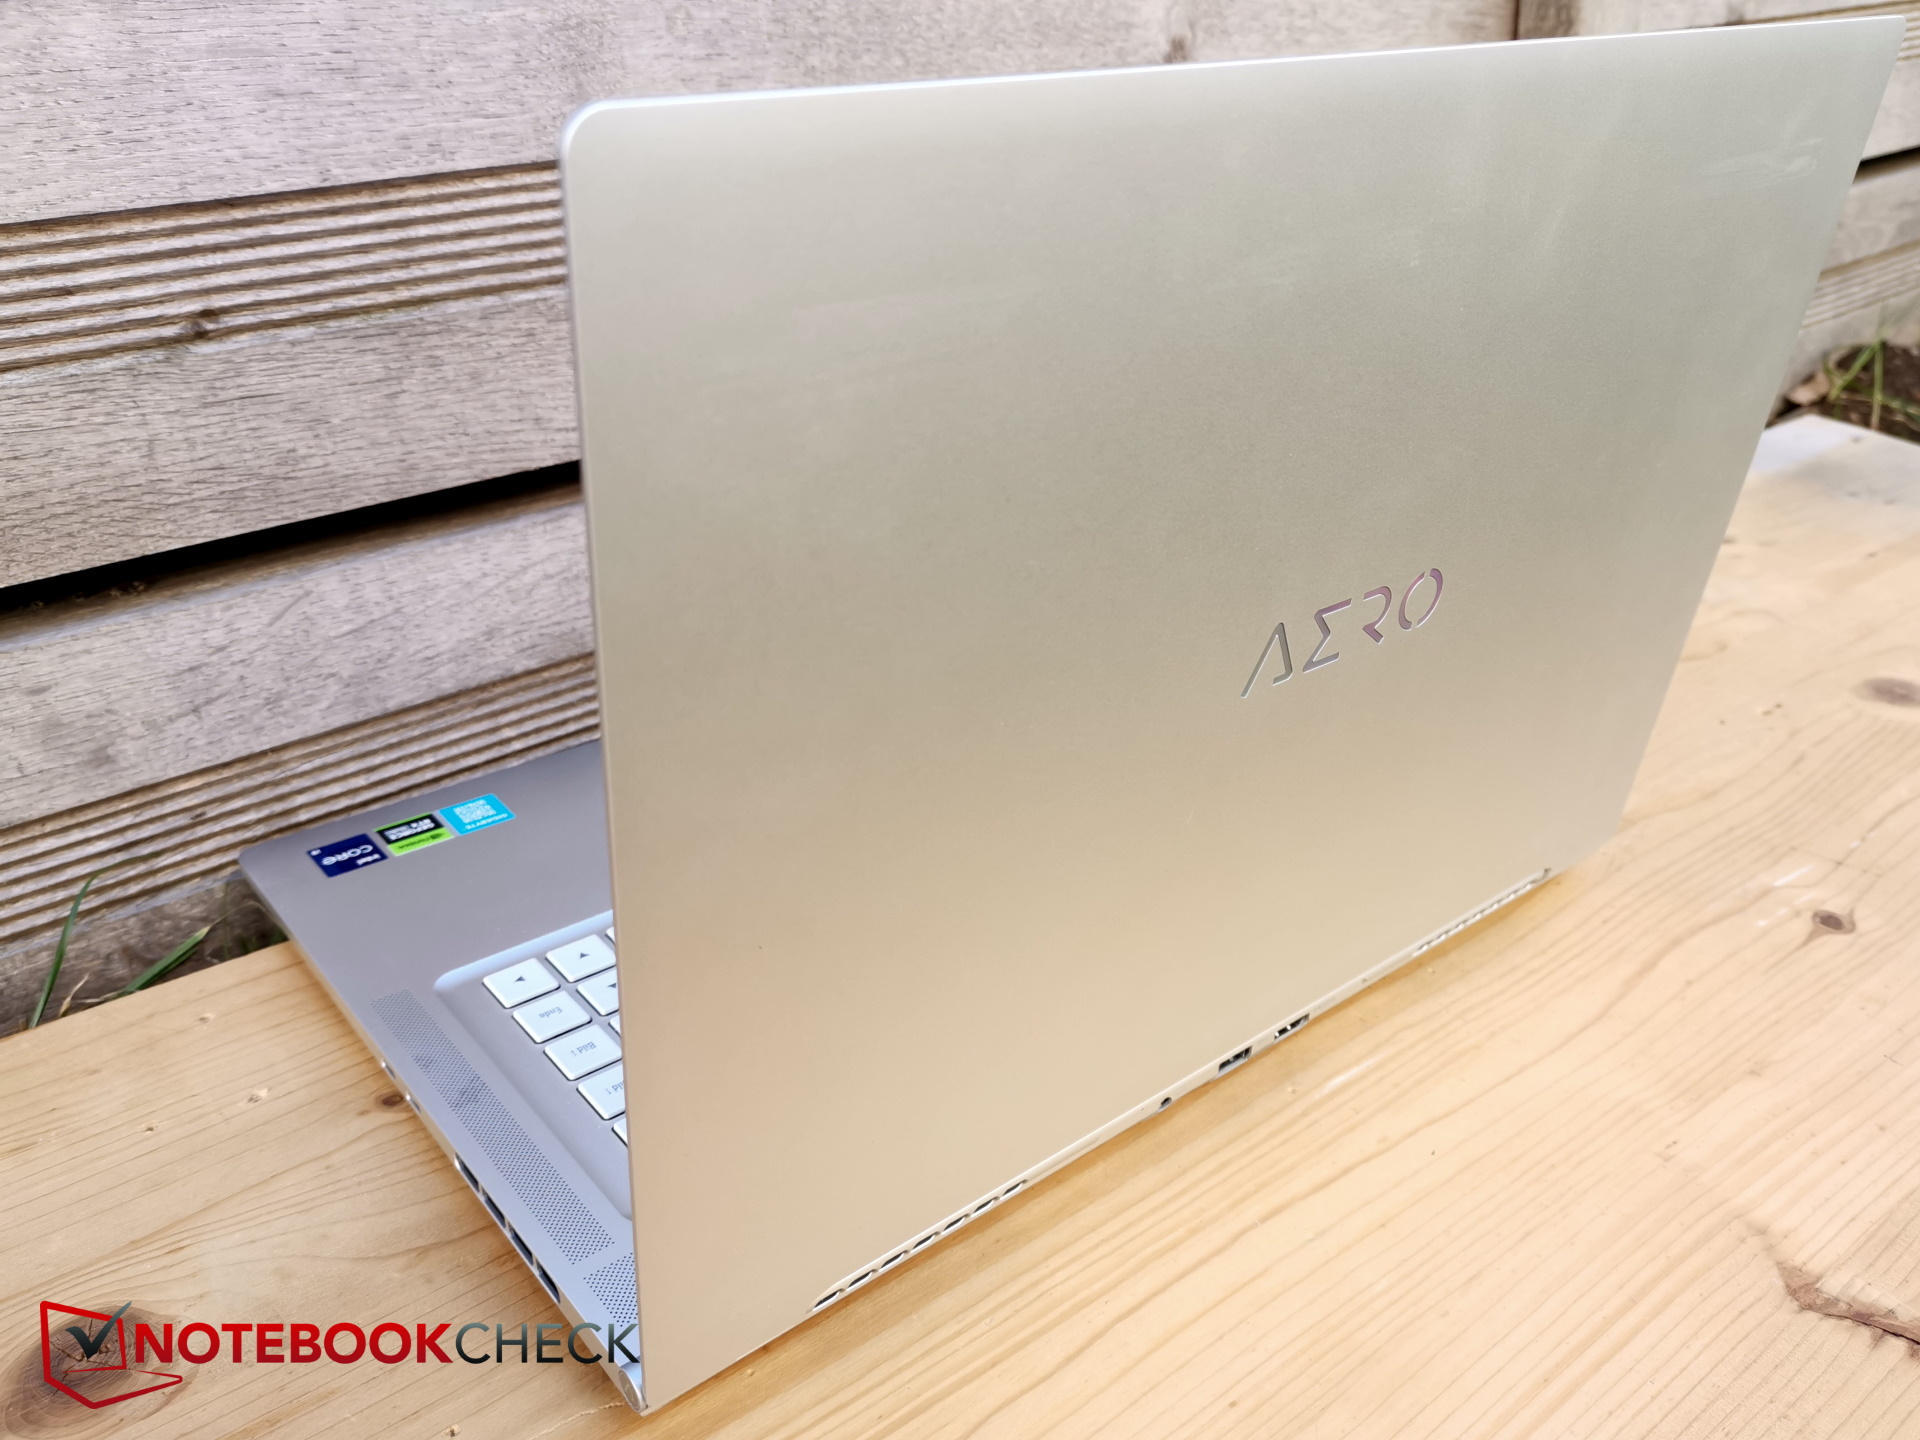
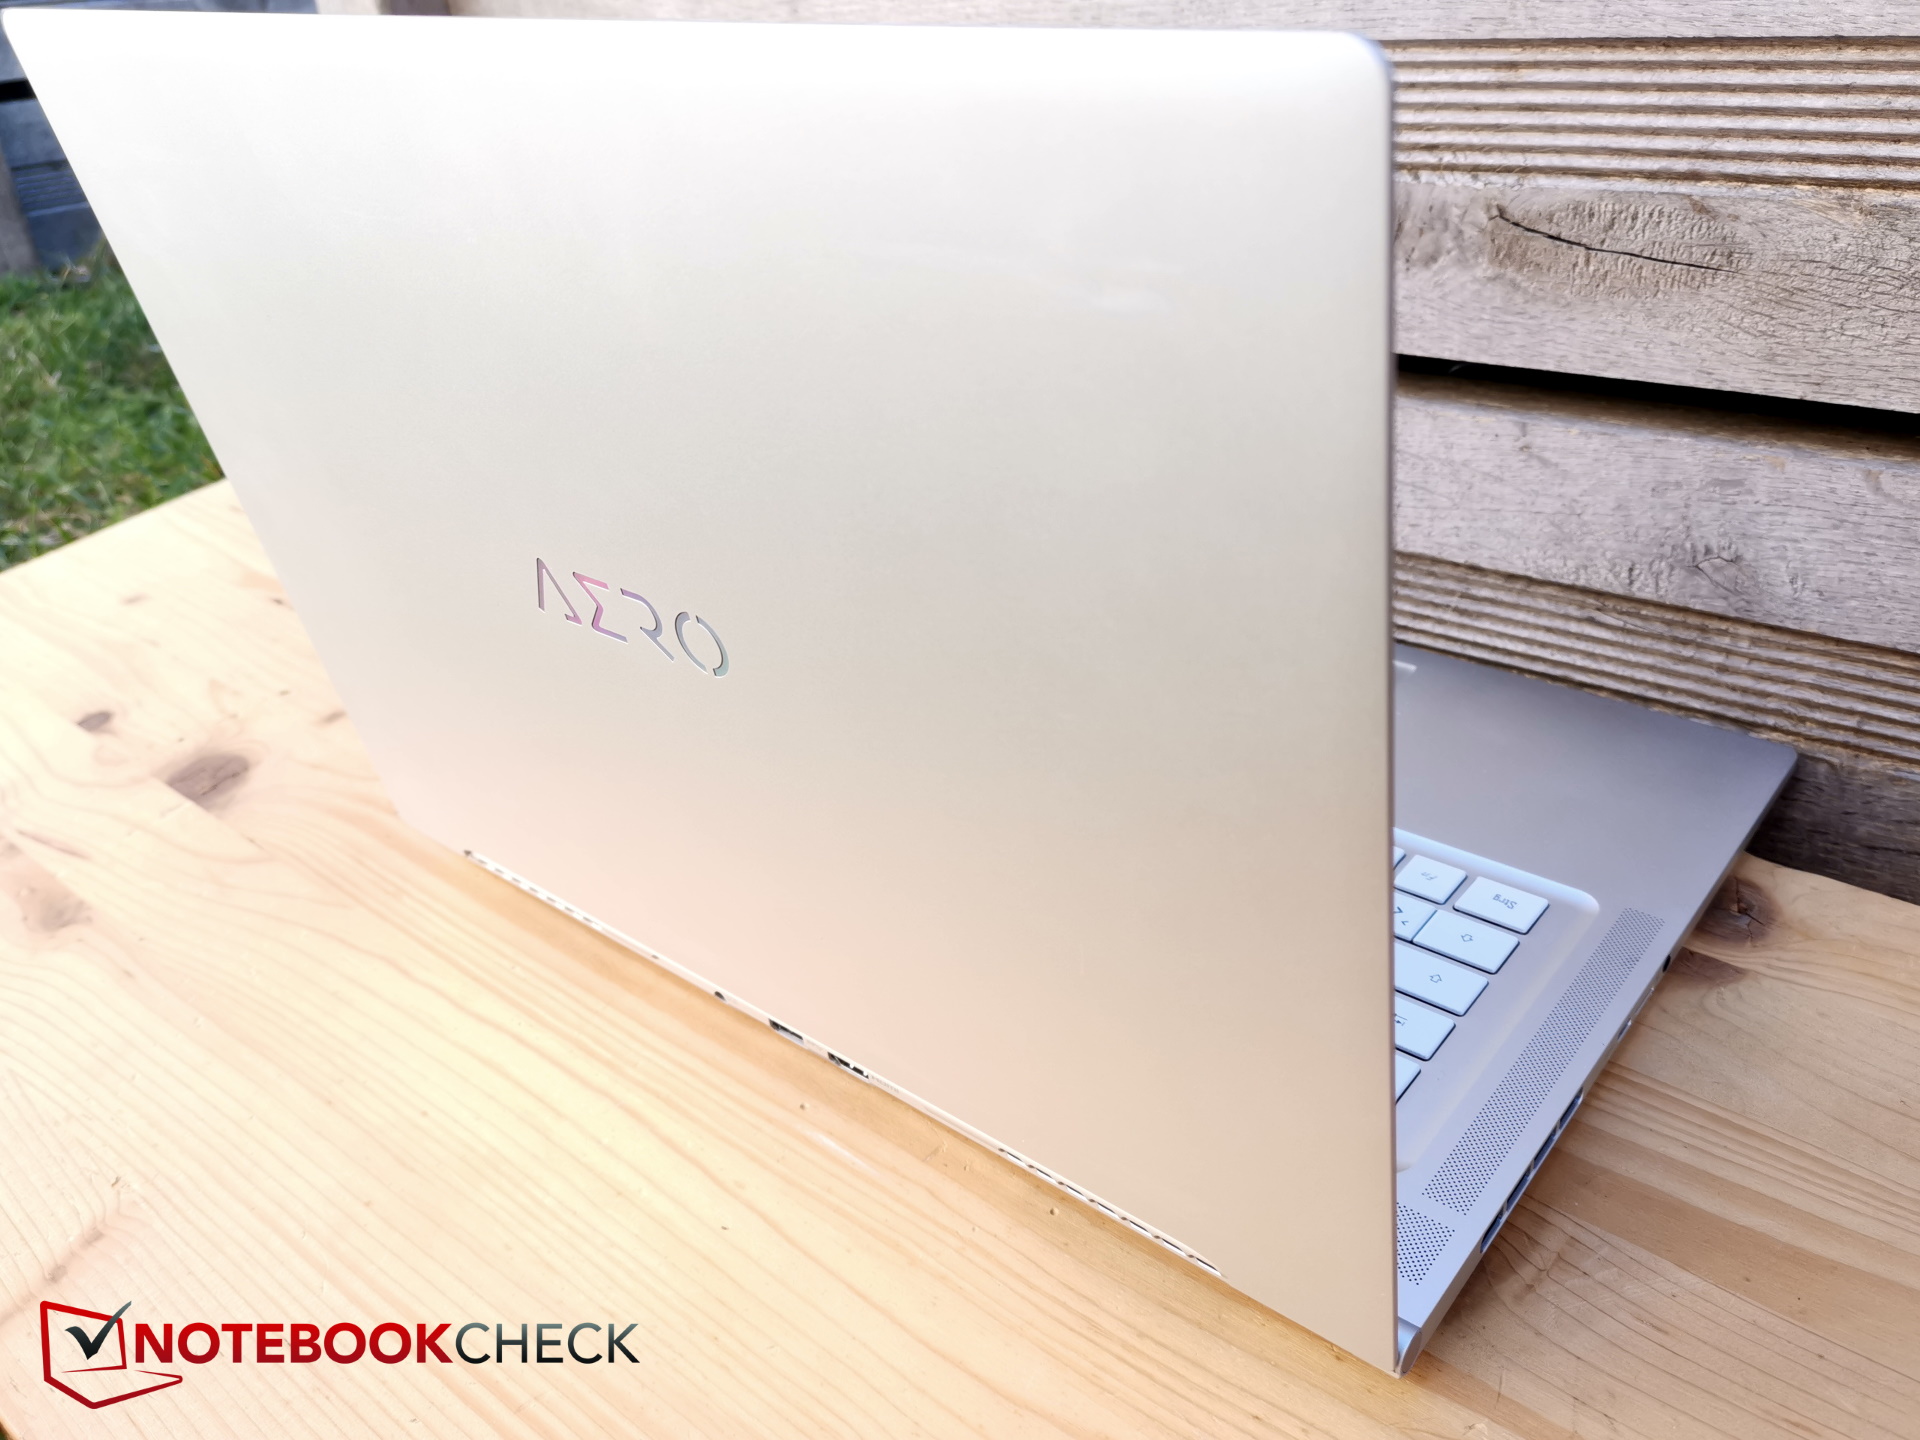
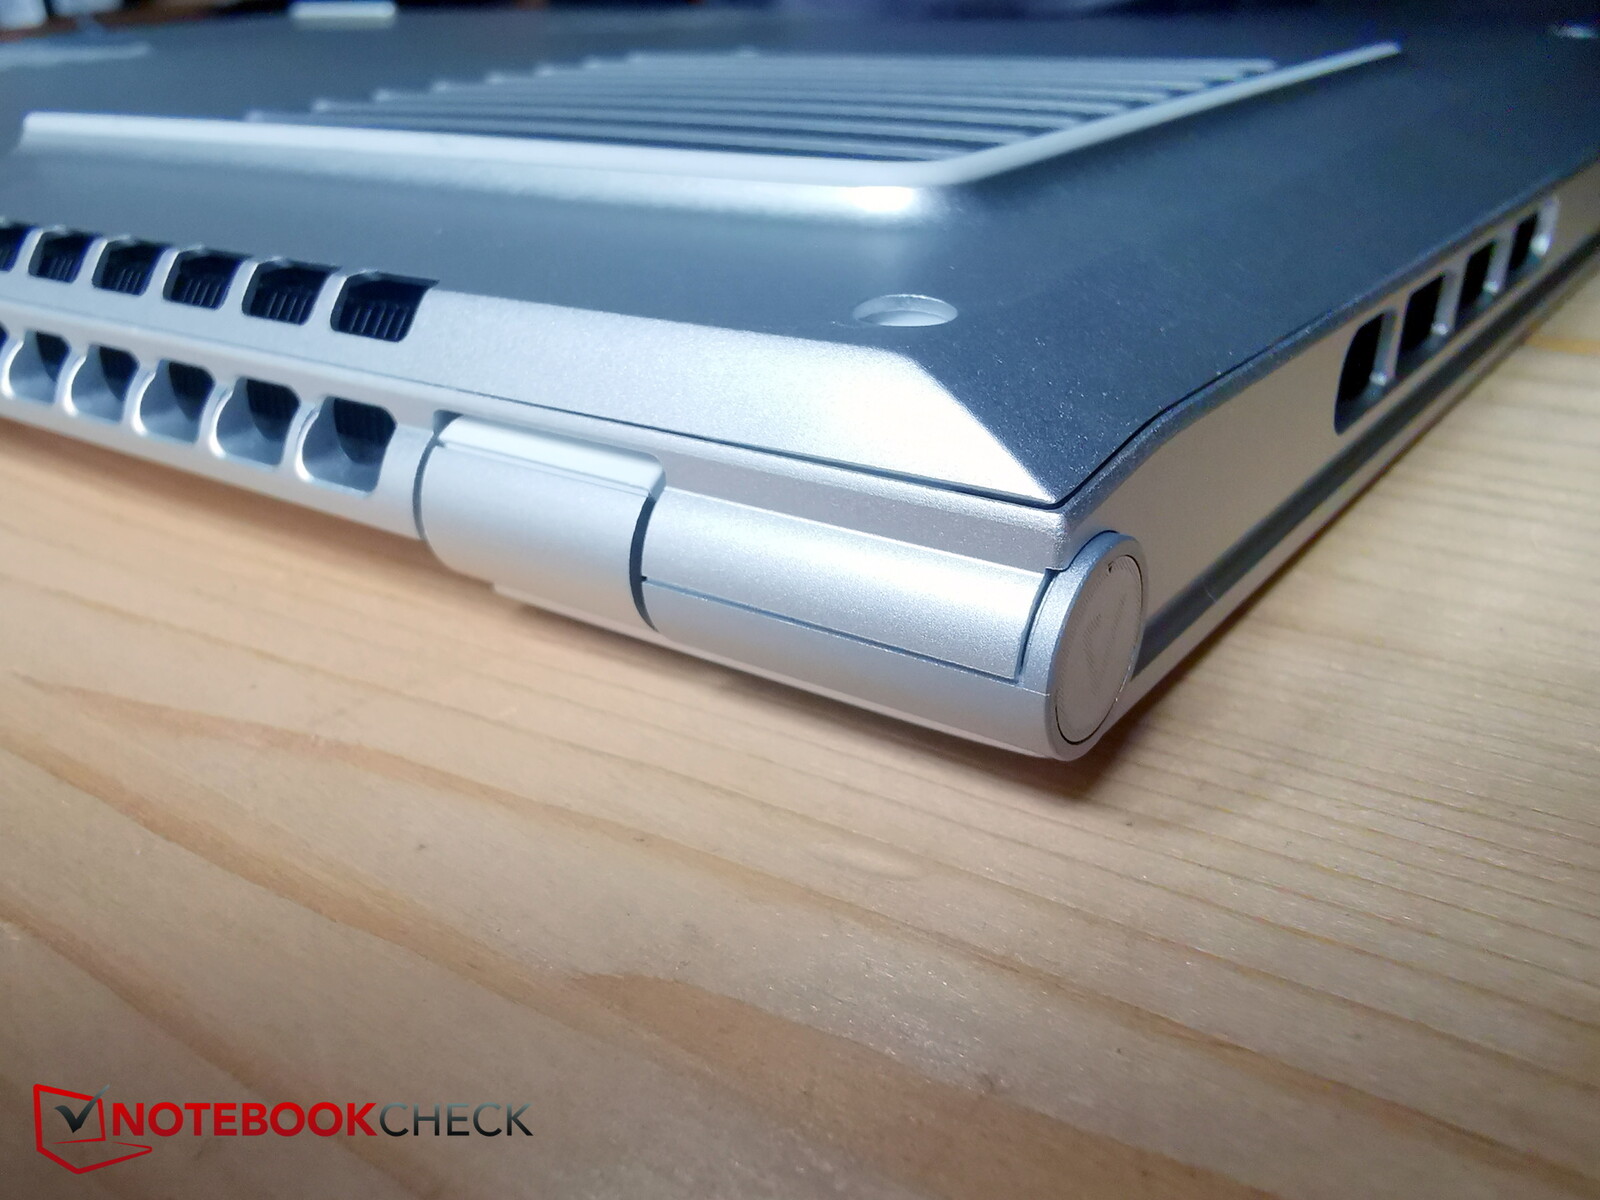
A primera vista, el diseño parece no haber cambiado, pero si se mira más de cerca, se puede ver que el estrecho chasis de metal plateado ha cambiado bastante. Por ejemplo, se ha vuelto aún más delgado y Gigabyte ha desplazado por fin algunos de los puertos a la parte trasera. En general, el diseño del fabricante va más en la dirección de un portátil de negocios y oficina que de un portátil para juegos, lo que sin duda gustará al grupo al que va dirigido. Así, el jugador oculto pasa bastante desapercibido en un entorno de oficina, incluso junto a un MacBook.
El suave unibody metálico sigue siendo estable, especialmente en la base, que apenas puede retorcerse. El teclado se ha rebajado ligeramente.
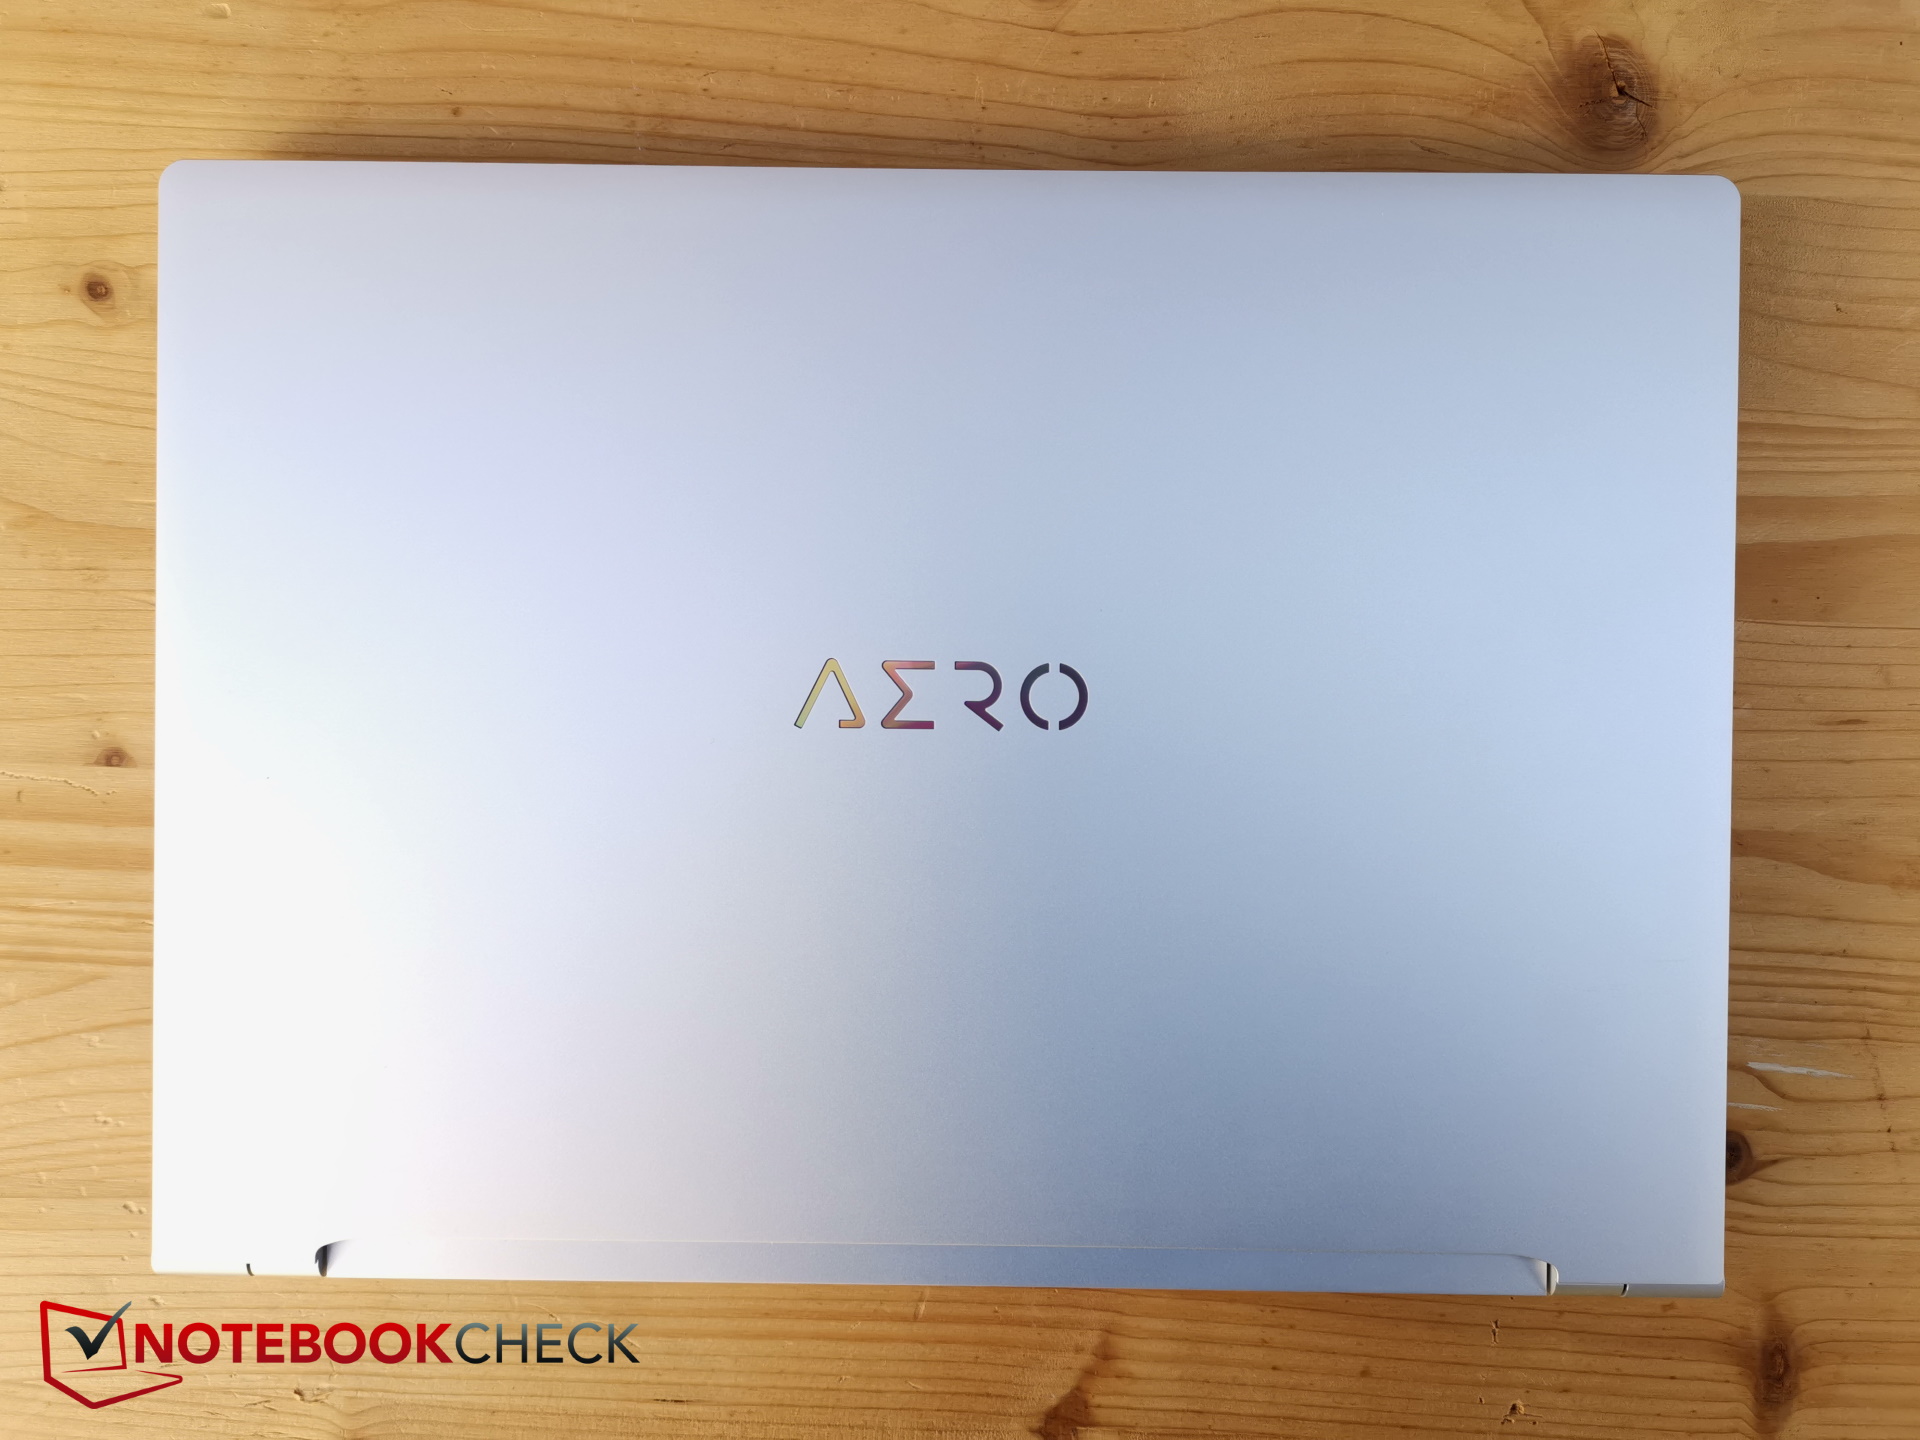
La tapa de la pantalla, en la que aparece el logotipo "Aero" iluminado, es algo menos rígida. Sólo el marco de la pantalla es de plástico.
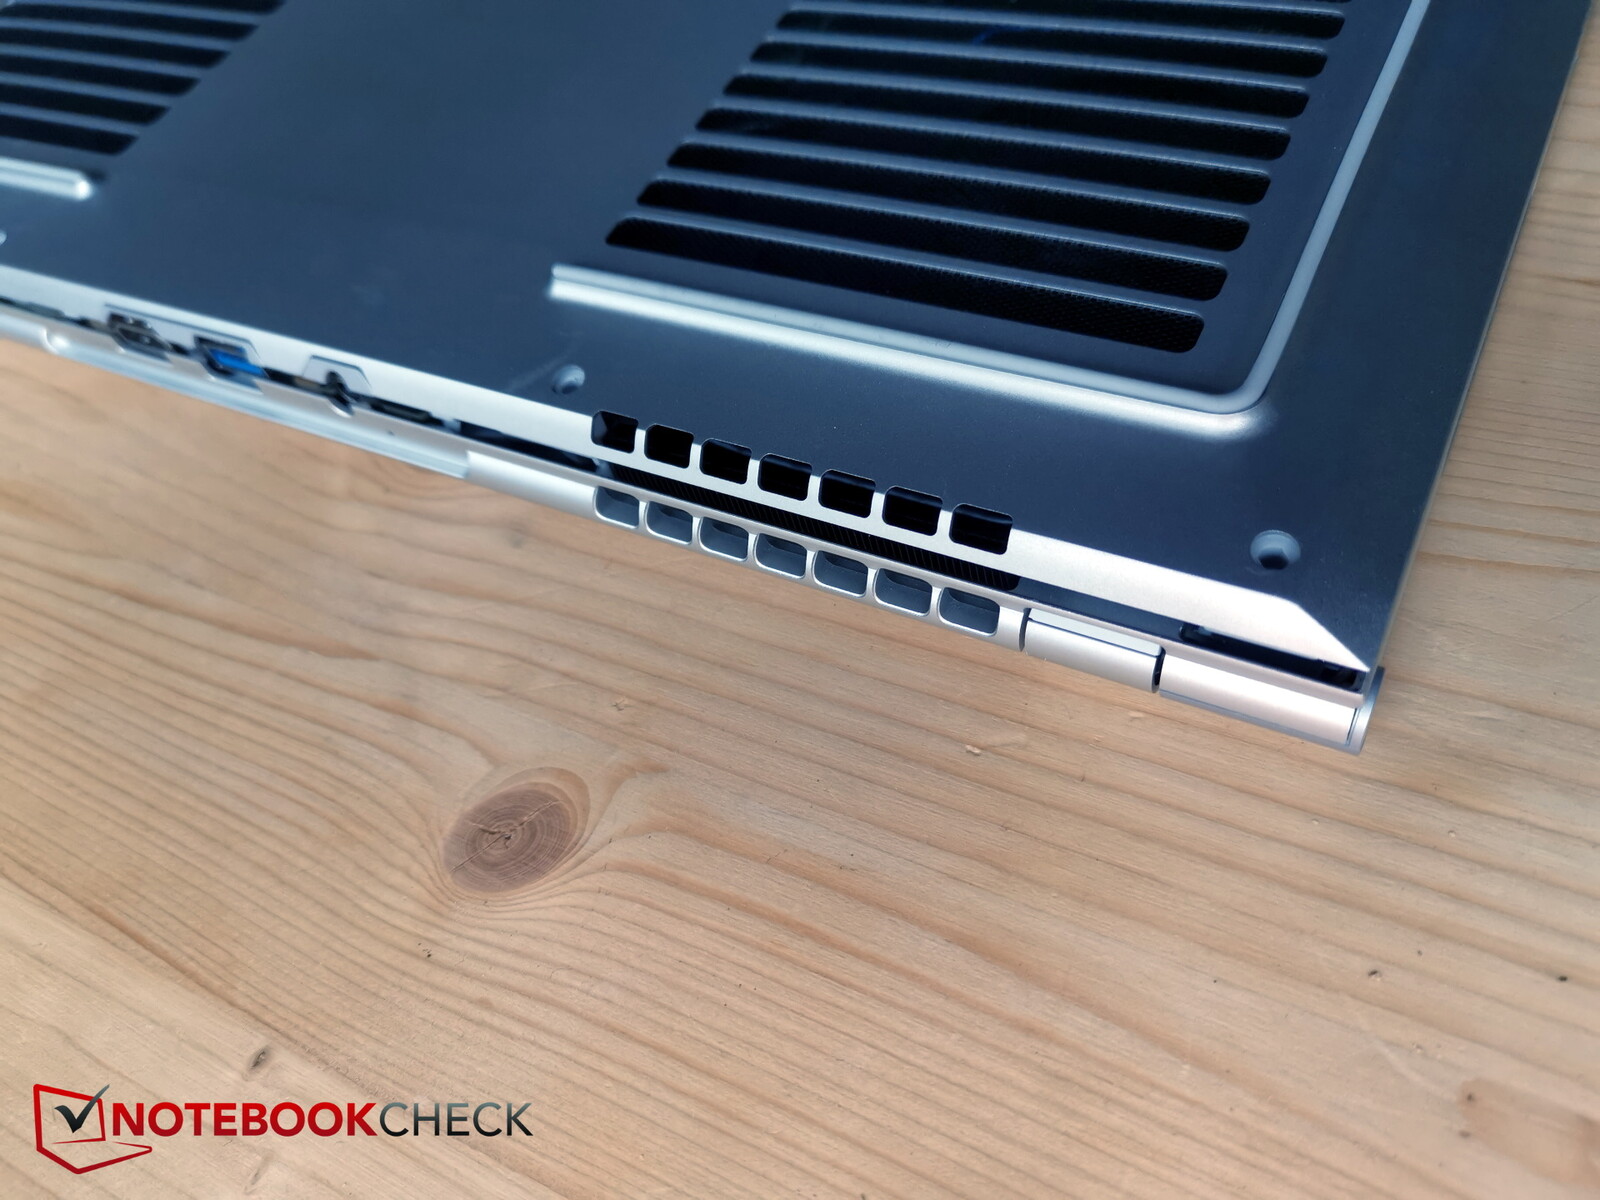
Las rejillas de ventilación están prácticamente por todas partes, es decir, en la parte trasera, en los laterales, debajo y encima. La calidad de construcción parece estar a un buen nivel y no se encontraron lagunas.

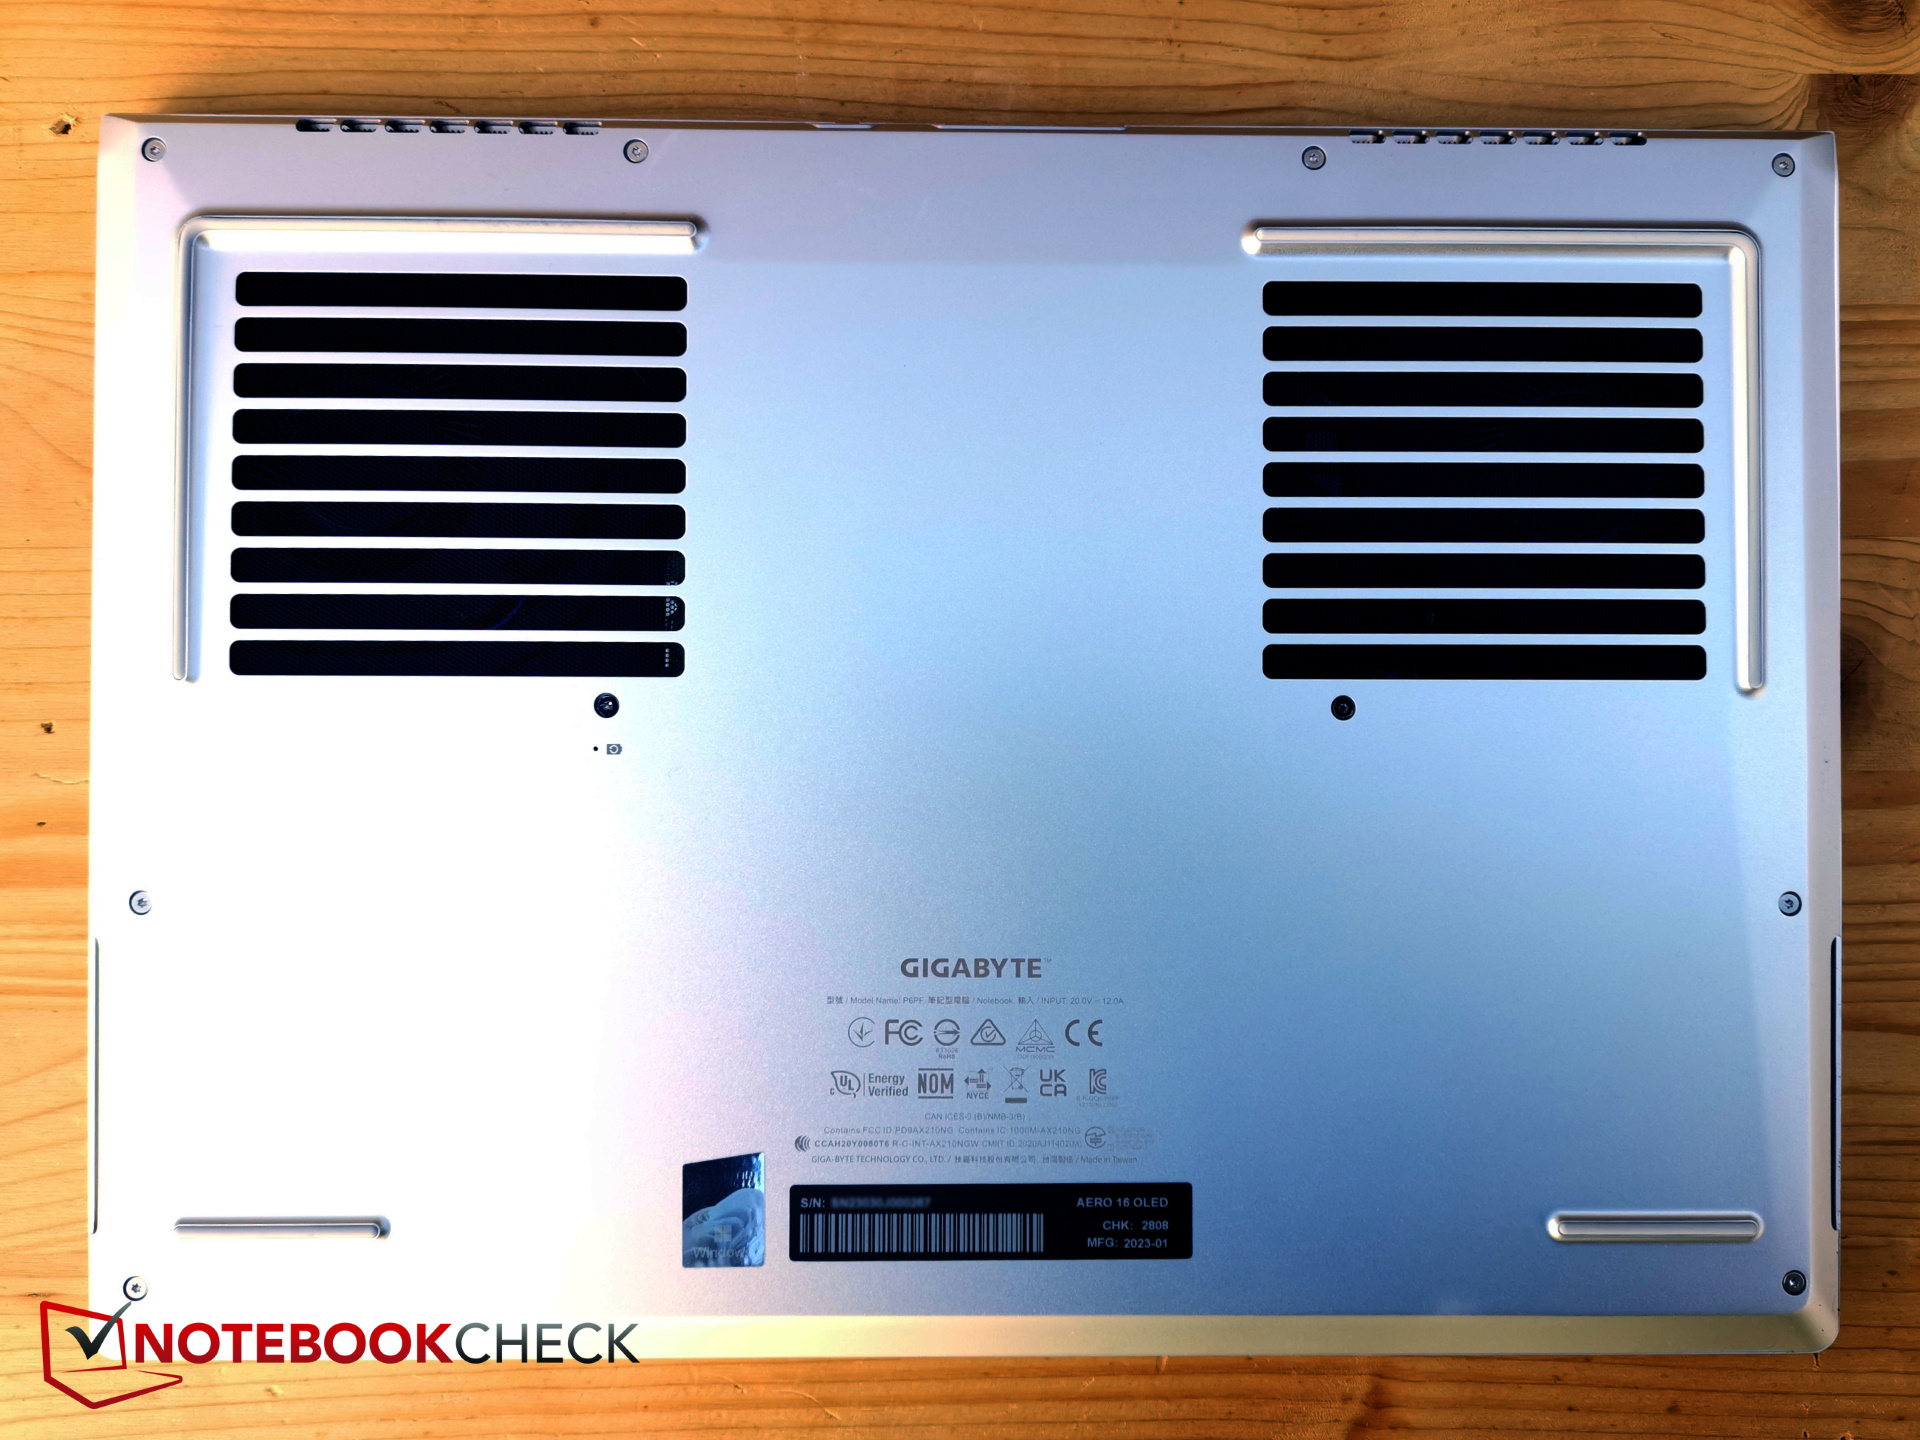
Con sólo 18 mm, el Aero 16 es ligeramente más delgado que elZenBook Pro 16X o el MSI CreatorPro Z16Ptambién es más ligero, ya que su predecesor pesaba 200 g más.
Equipamiento - ¡Por fin Aero 16 con puertos!
Ha cambiado mucho en los puertos, por suerte, porque los escasos tres puertos USB-C del predecesor tuvieron que ampliarse con un Aero Hub para incluir HDMI, USB-A, etc.
Este año, el nuevo Aero alberga casi todos los puertos necesarios. Para ello, aprovecha el espacio de la parte trasera donde está, por ejemplo, la conexión a la red eléctrica. Habríamos preferido un USB-A en lugar de uno de los tres puertos USB-C del lateral, y sigue faltando un puerto LAN, pero al menos ahora hay un puerto HDMI y un lector (microSD). La distribución de puertos es buena, salvo por el USB-A en la trasera en vez de en el lateral.
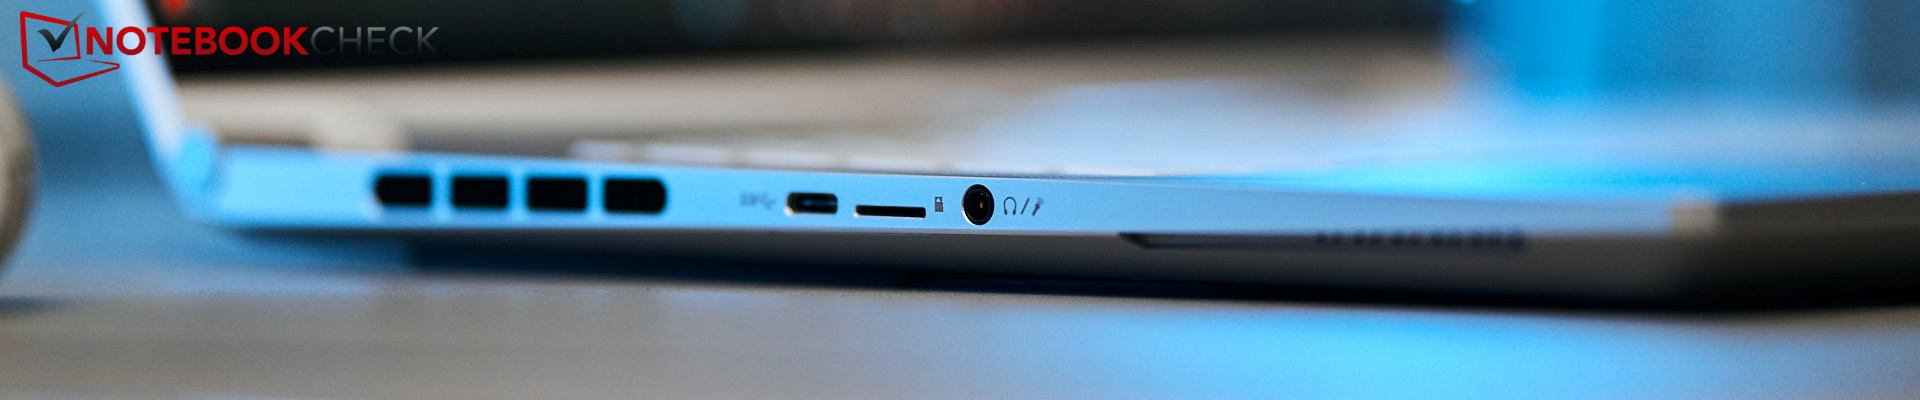


Lector de tarjetas SD
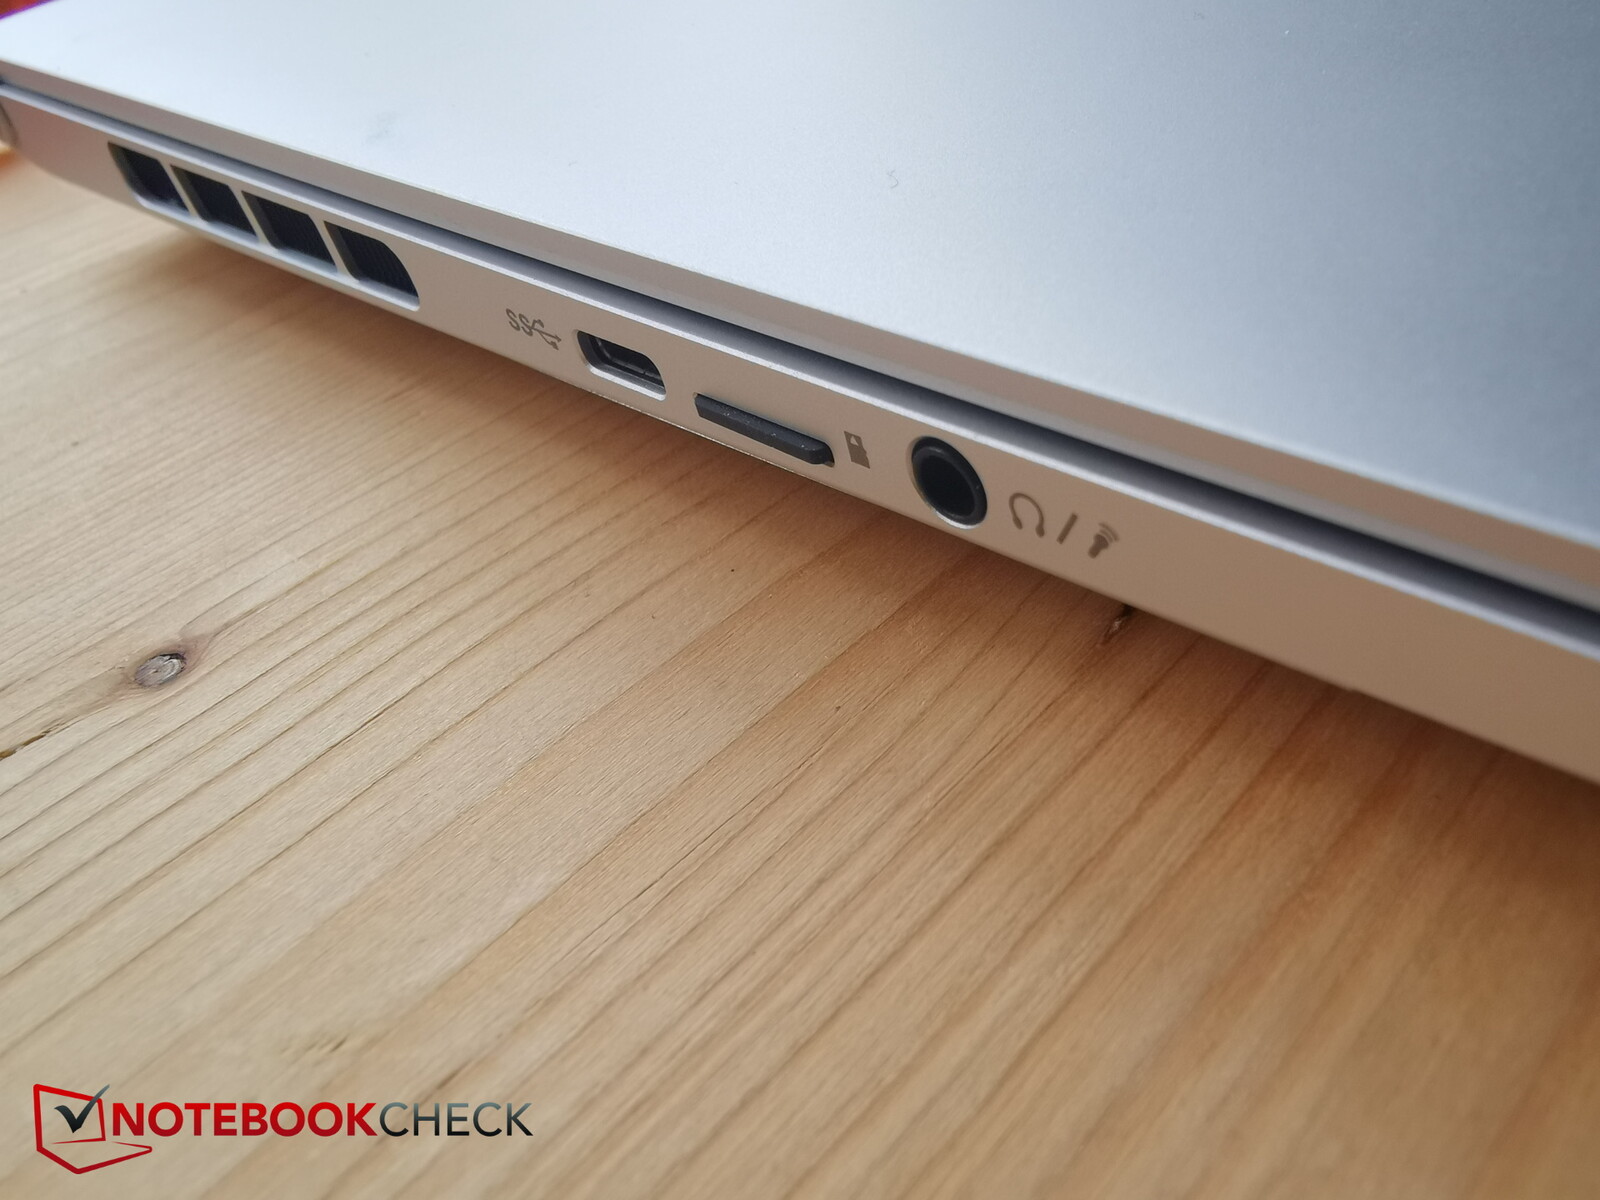
Las tarjetas microSD encajan en su sitio y sólo sobresalen mínimamente (1 - 2 mm).
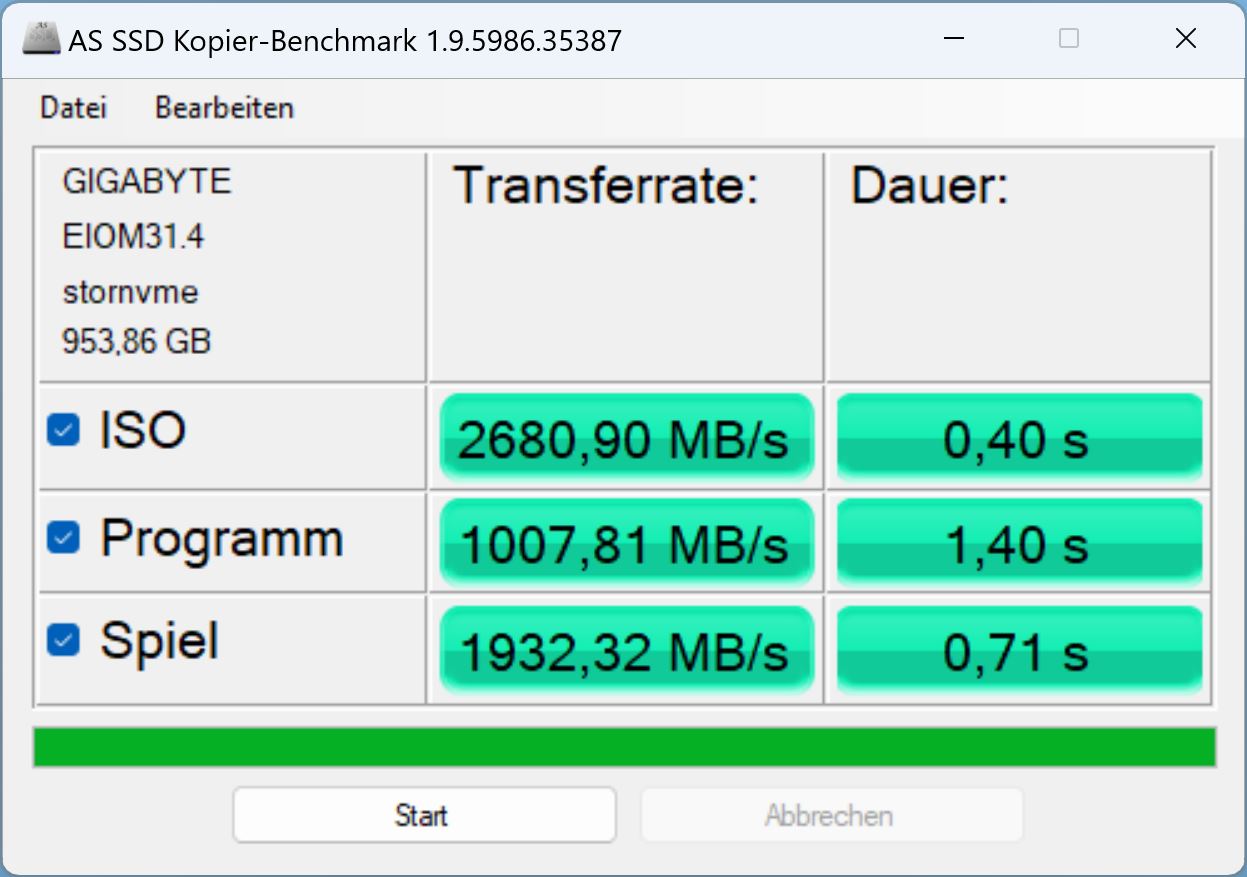
Las velocidades de transferencia son buenas; copiamos 1 GB de material de imagen de nuestra AV PRO microSD 128 GB V60 al escritorio en unos 7 segundos.
Si la competencia tiene lector, es más lenta.
| SD Card Reader | |
| average JPG Copy Test (av. of 3 runs) | |
| Razer Blade 18 RTX 4070 (Angelibird AV Pro V60) | |
| Gigabyte AERO 16 OLED BSF | |
| Media de la clase Gaming (20.9 - 210, n=54, últimos 2 años) | |
| MSI CreatorPro Z16P B12UKST (AV Pro V60) | |
| Asus ZenBook Pro 16X OLED UX7602ZM-ME115W (AV Pro SD microSD 128 GB V60) | |
| maximum AS SSD Seq Read Test (1GB) | |
| Razer Blade 18 RTX 4070 (Angelibird AV Pro V60) | |
| Gigabyte AERO 16 OLED BSF | |
| Media de la clase Gaming (25.5 - 261, n=51, últimos 2 años) | |
| MSI CreatorPro Z16P B12UKST (AV Pro V60) | |
| Asus ZenBook Pro 16X OLED UX7602ZM-ME115W (AV Pro SD microSD 128 GB V60) | |
Comunicación
El chip Intel AX210 también se instaló en el modelo del año pasado y vuelve a garantizar buenas velocidades de transferencia, aunque elMSI CreatorPro es aún más rápido.
El módulo soporta Wifi 6E y, por tanto, el rango de 6 GHz.
Cámara web
Gigabyte por fin ha instalado una cámara Full HD en el portátil creativo, y la imagen resultante es bastante usable, incluso en condiciones de luz subóptimas. Un vistazo al ColorChecker, sin embargo, desgraciadamente muestra que los colores se desvían mucho. El predecesor tenía una cámara de 720p.


Seguridad
El Aero no es realmente para los fanáticos de la seguridad. Incluye TPM, pero no tiene sensor de huellas dactilares ni conexión Kensington.
Accesorios y garantía
No se incluyen accesorios junto con el portátil en el momento de la compra.
En Alemania, el fabricante ofrece una garantía de 24 meses. Esto puede variar en otras regiones, por lo que los compradores interesados deben volver a comprobarlo antes de la compra.
Mantenimiento
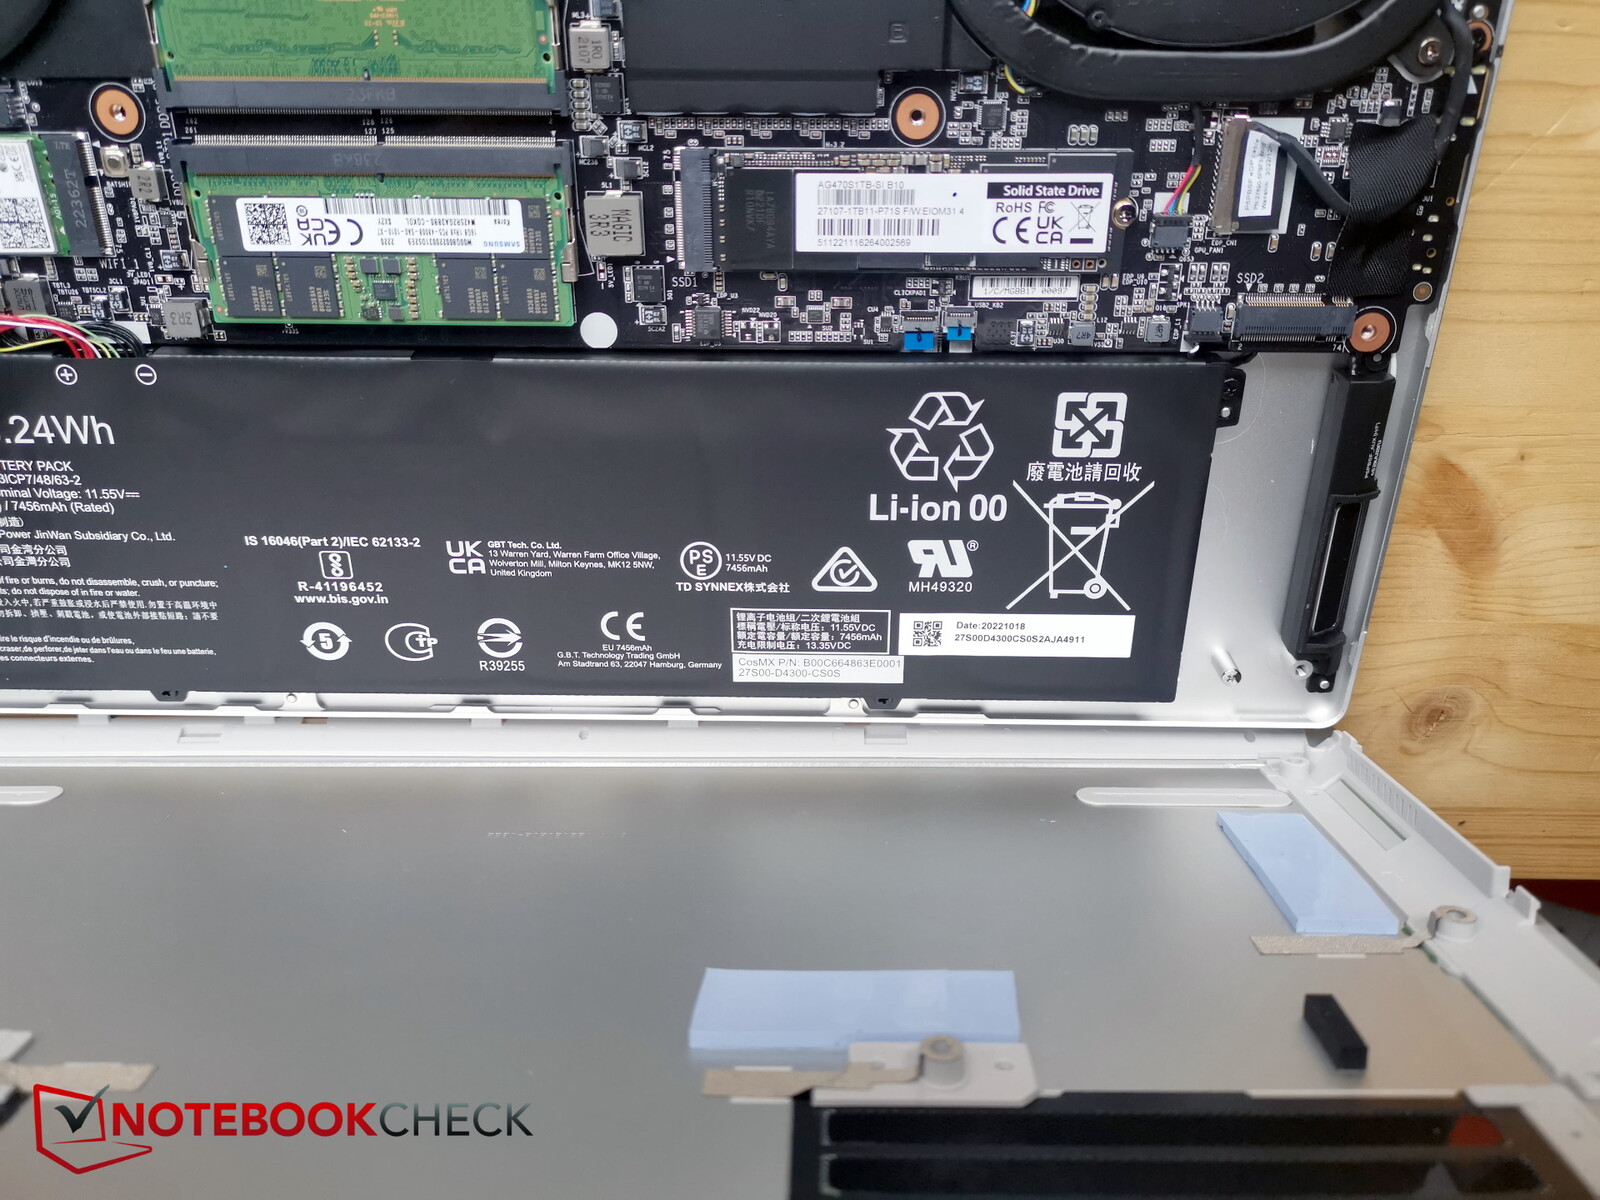
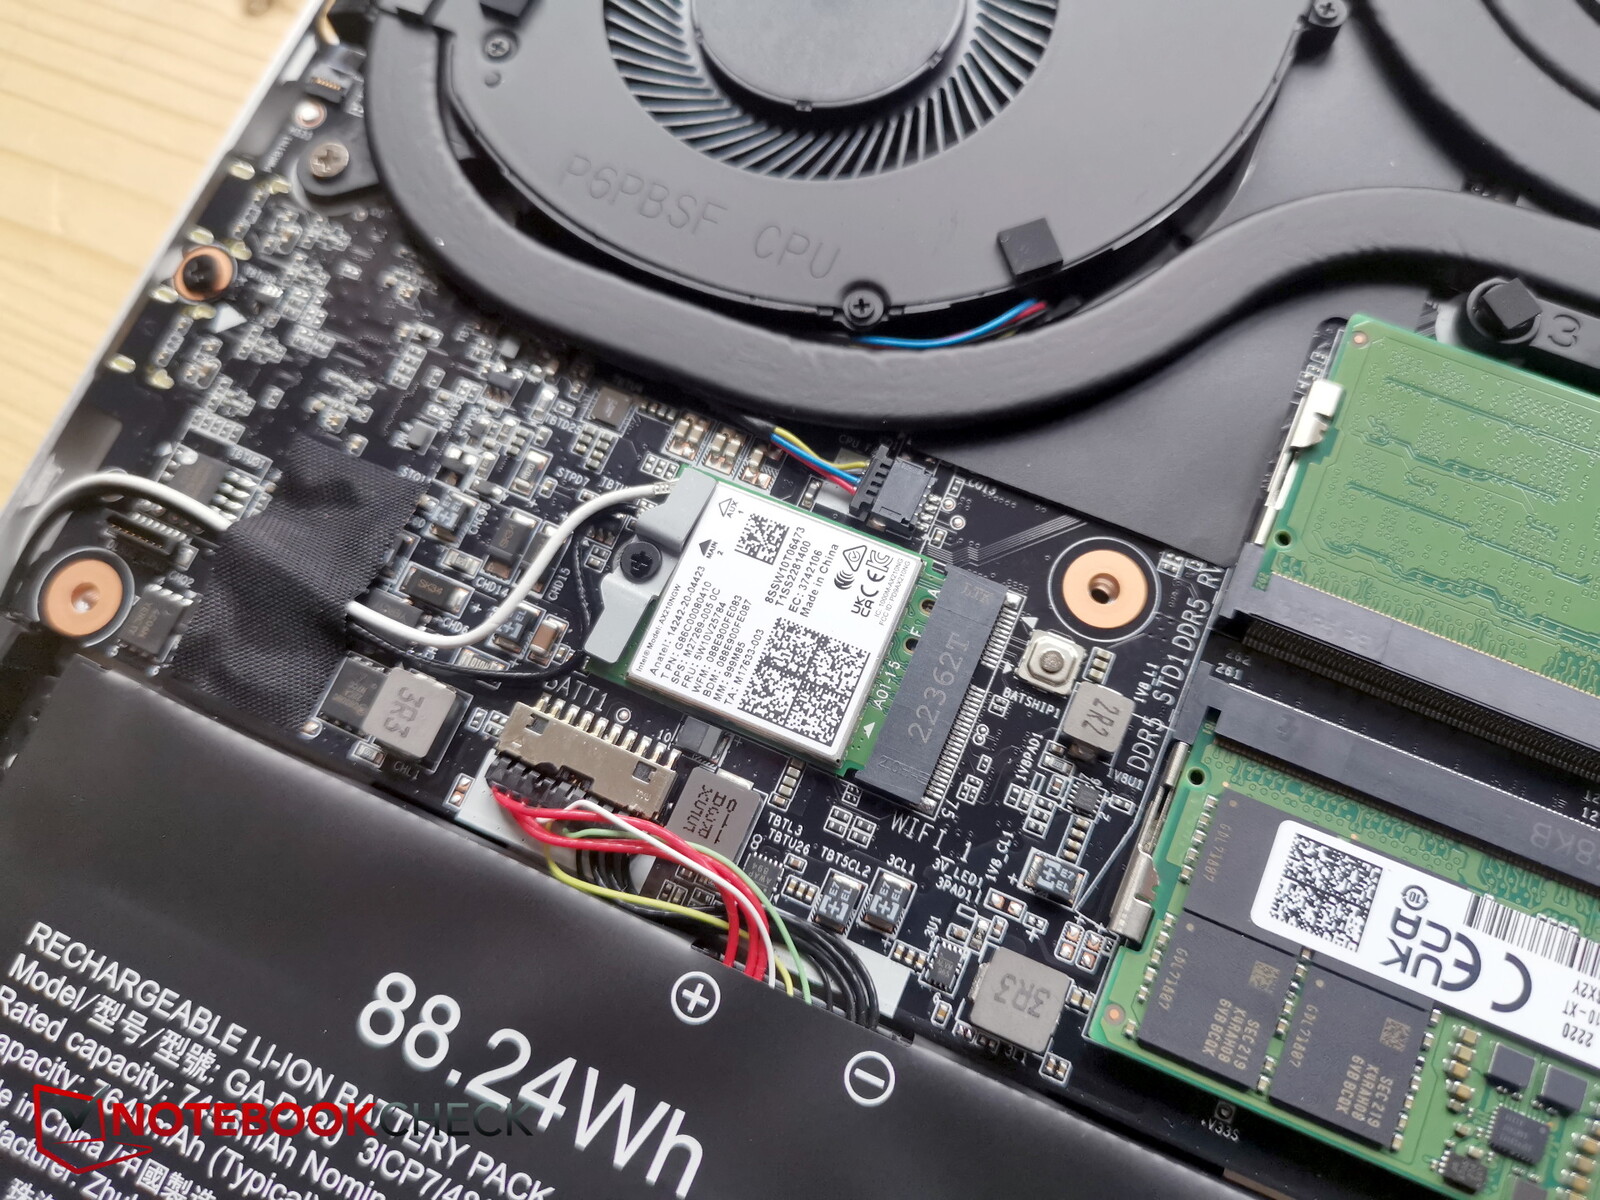
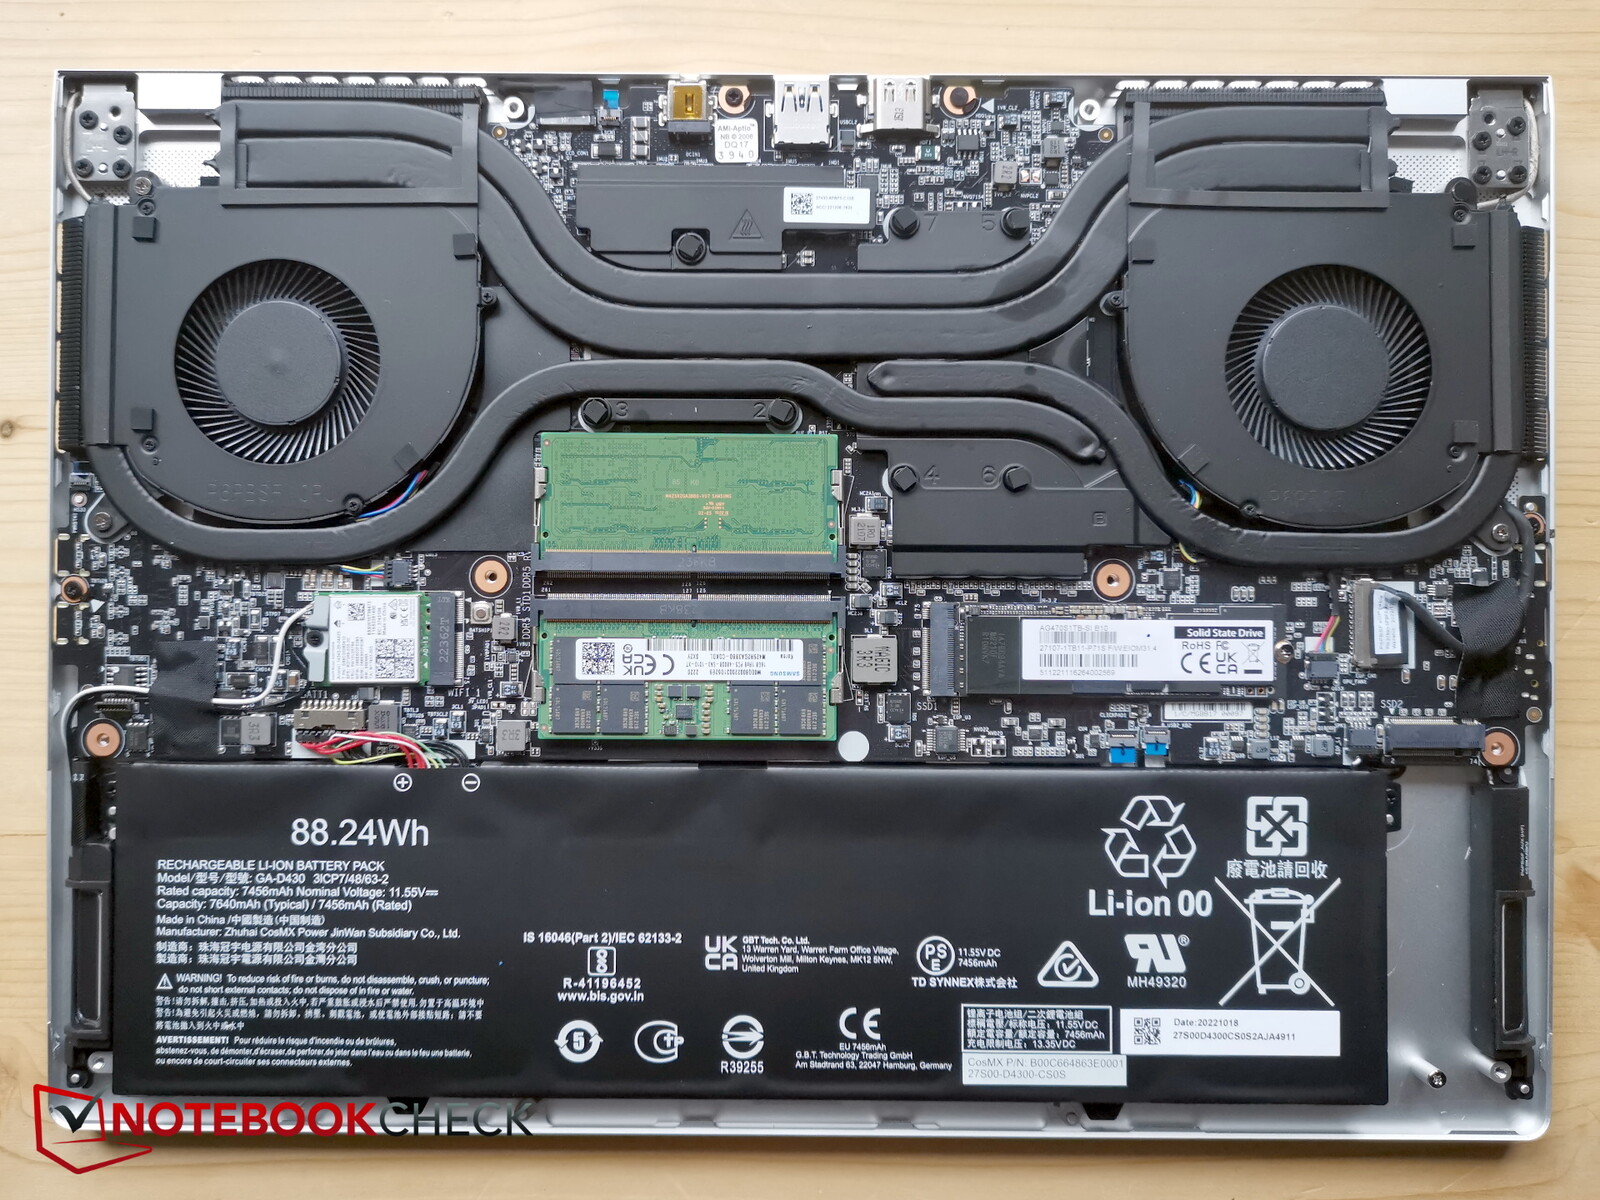
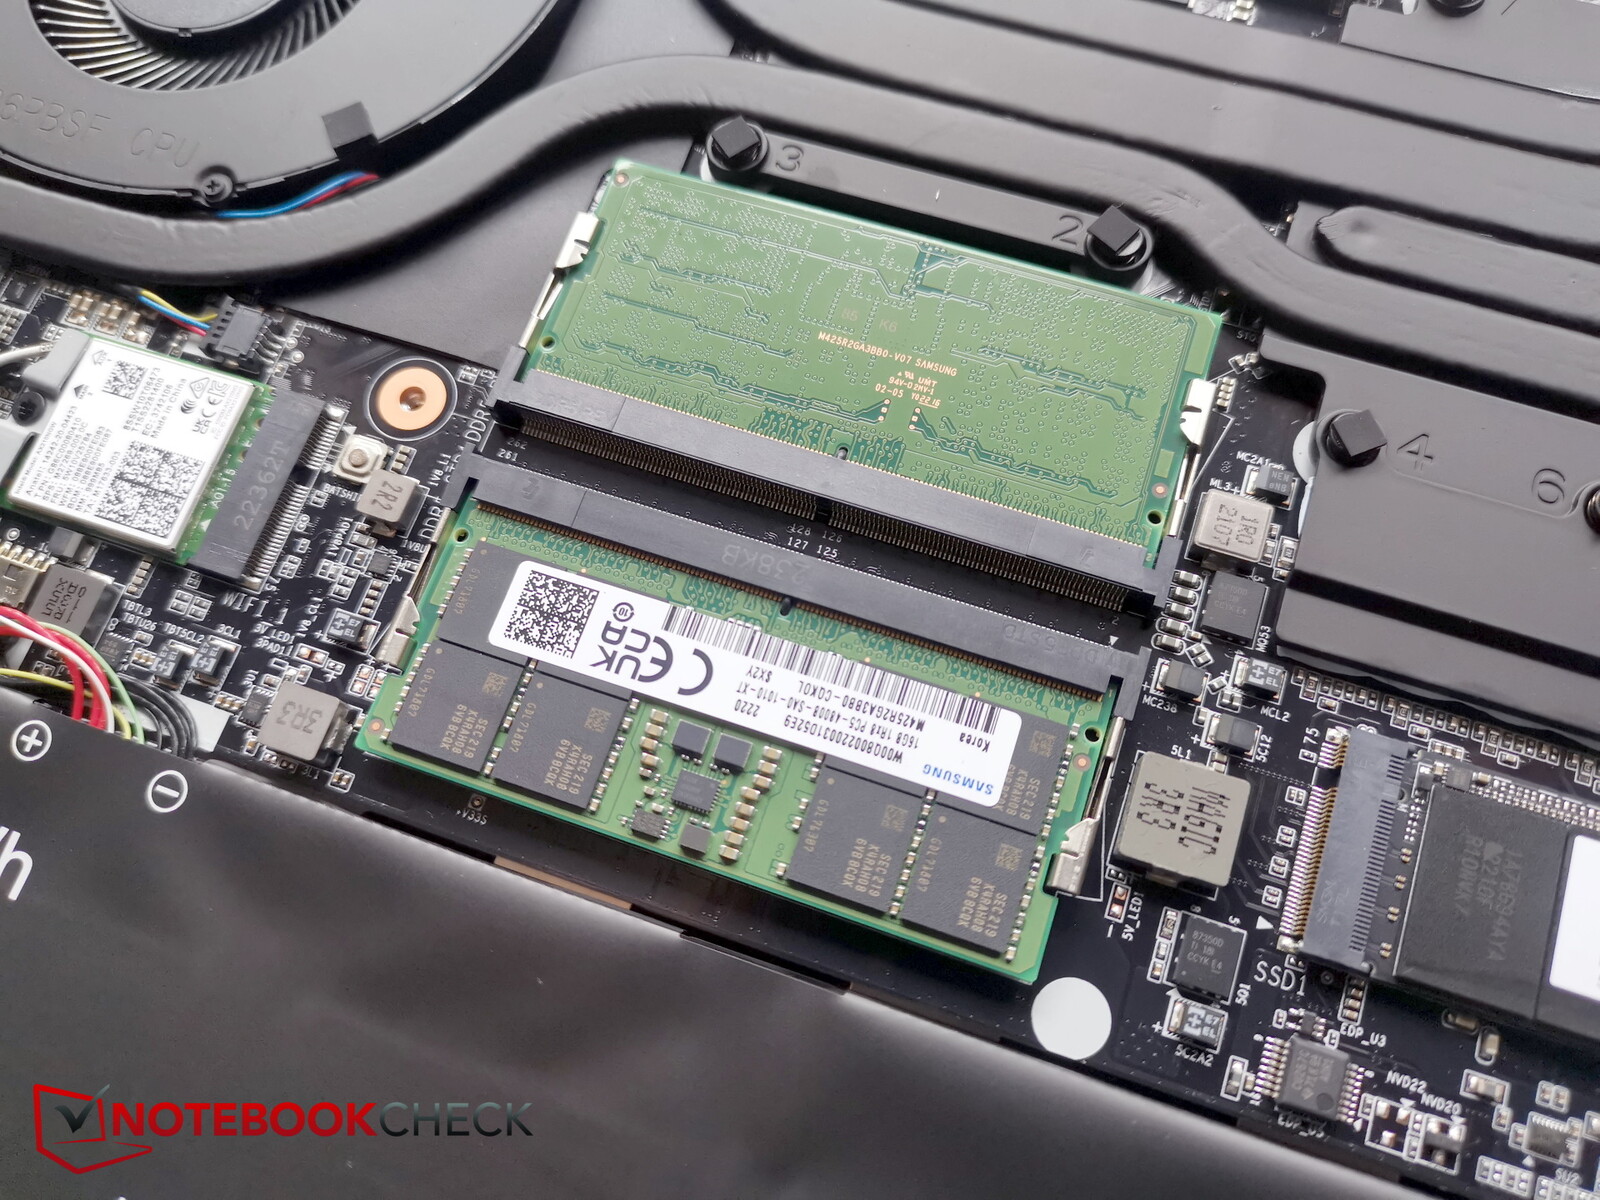
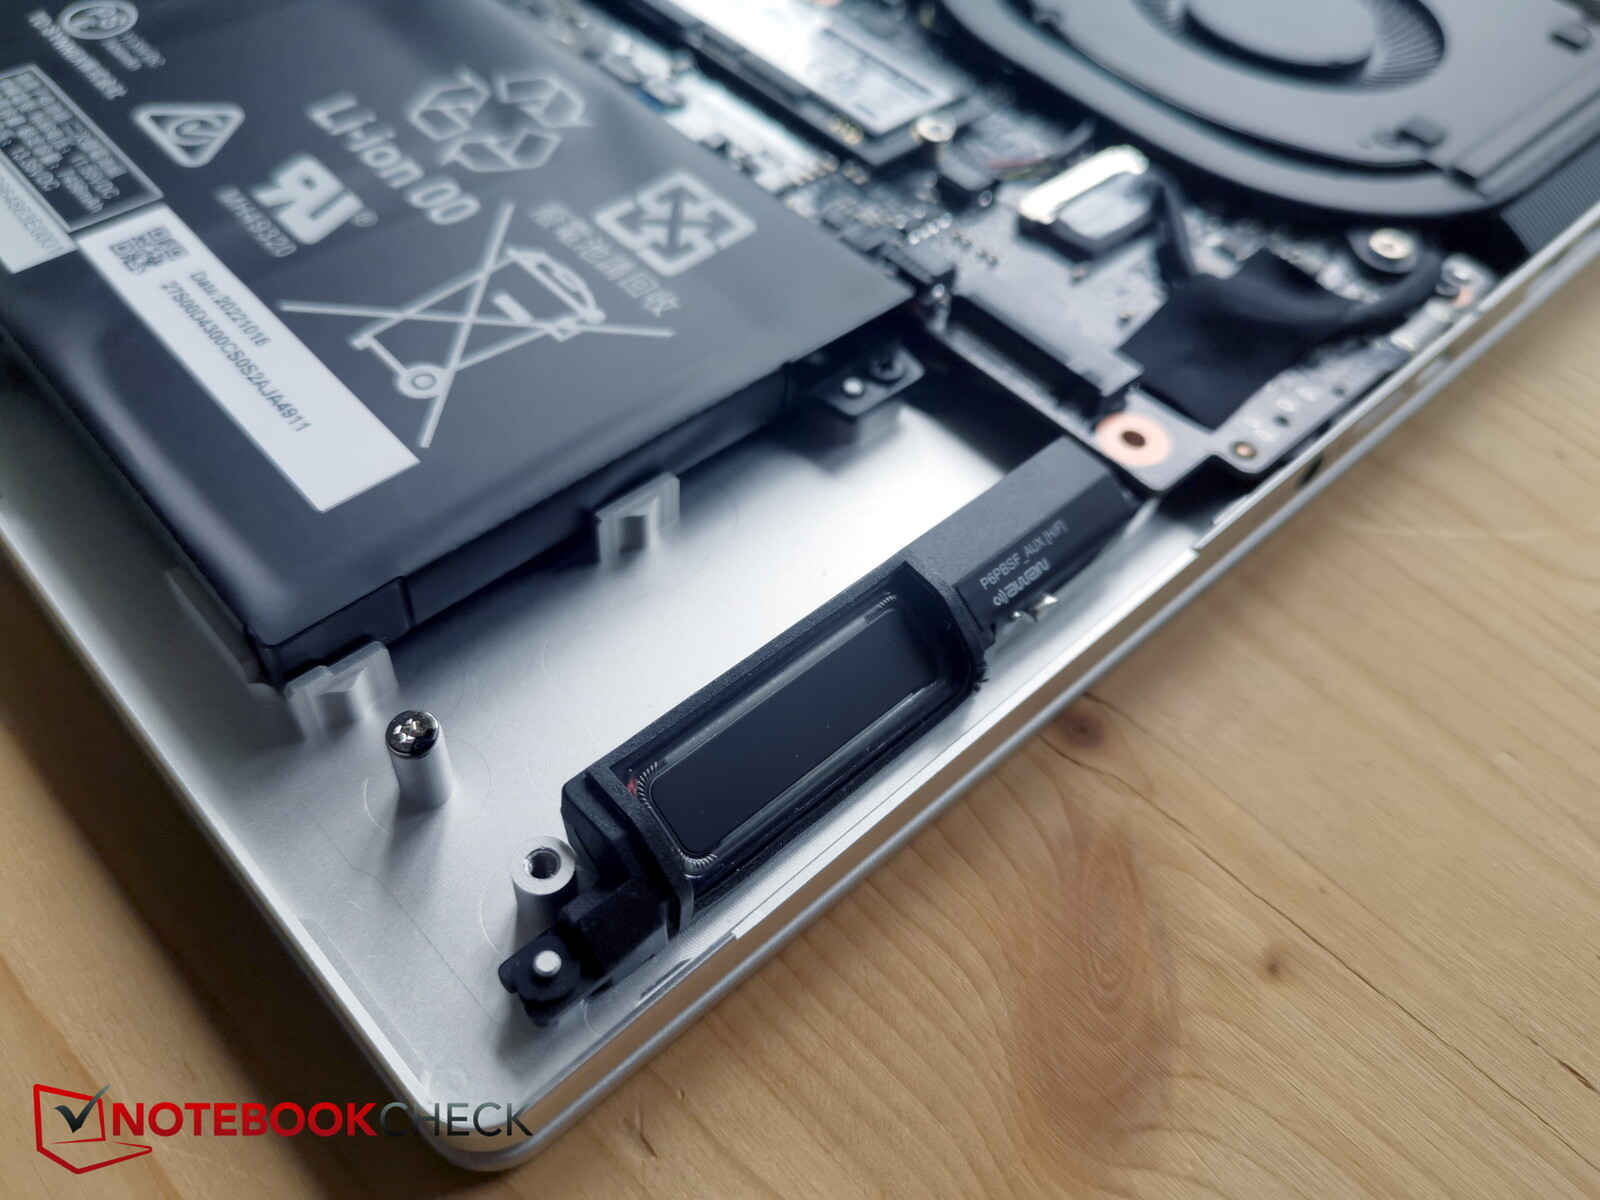
En primer lugar, es necesario retirar 10 tornillos Torx. Después, encontrar un hueco en el apretado chasis para introducir las herramientas de nivelación no es tan fácil. La mejor manera de hacerlo es hacia atrás. Una vez realizado el primer paso, resulta mucho más fácil y la placa base se puede desmontar sin esfuerzo.
Dentro, tienes acceso a los ventiladores, la batería, el módulo WLAN reemplazable, las dos ranuras RAM y las dos ranuras SSD M.2, una de las cuales está ocupada. Hay almohadillas de refrigeración en la placa base para las dos ranuras SSD.
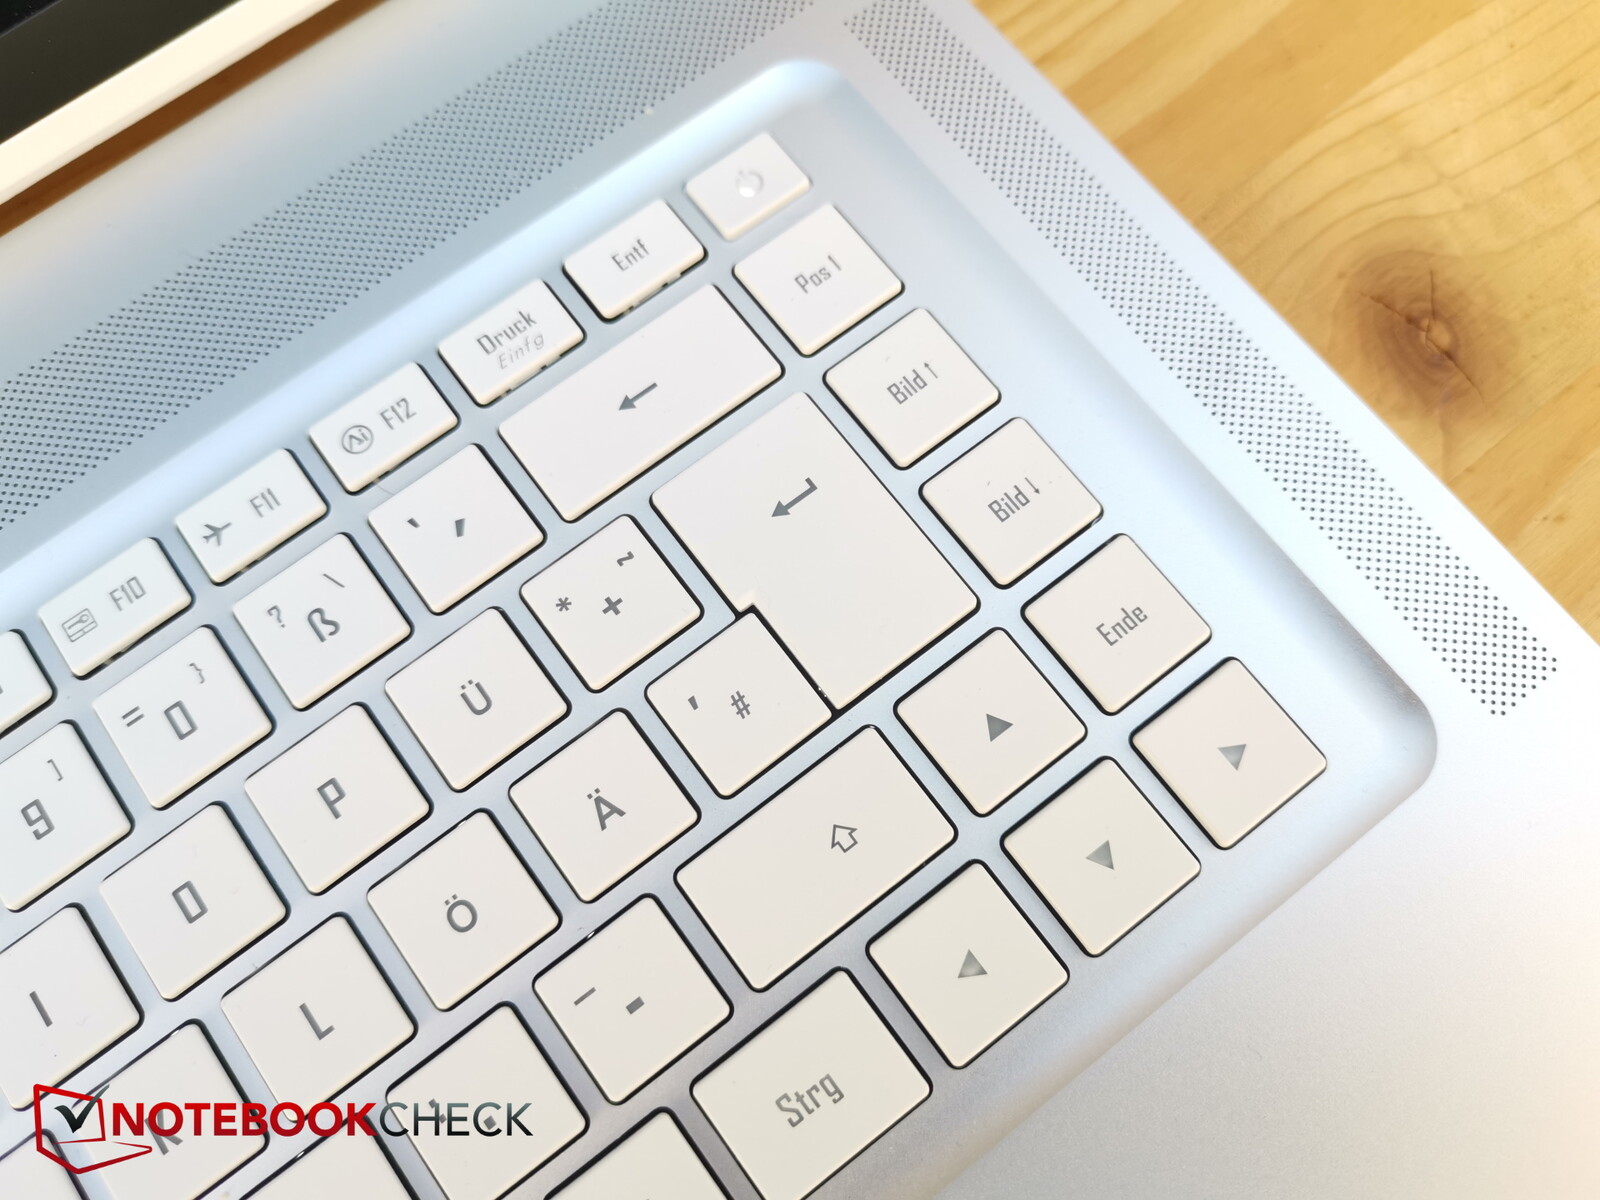
Dispositivos de entrada - Entradas utilizables
Teclado
El teclado tiene ahora teclas blancas en lugar de negras. Resulta más elegante, pero no actives la retroiluminación blanca del teclado con mucha luz, ya que no podrás distinguir las letras... ¿pero quién lo hace?
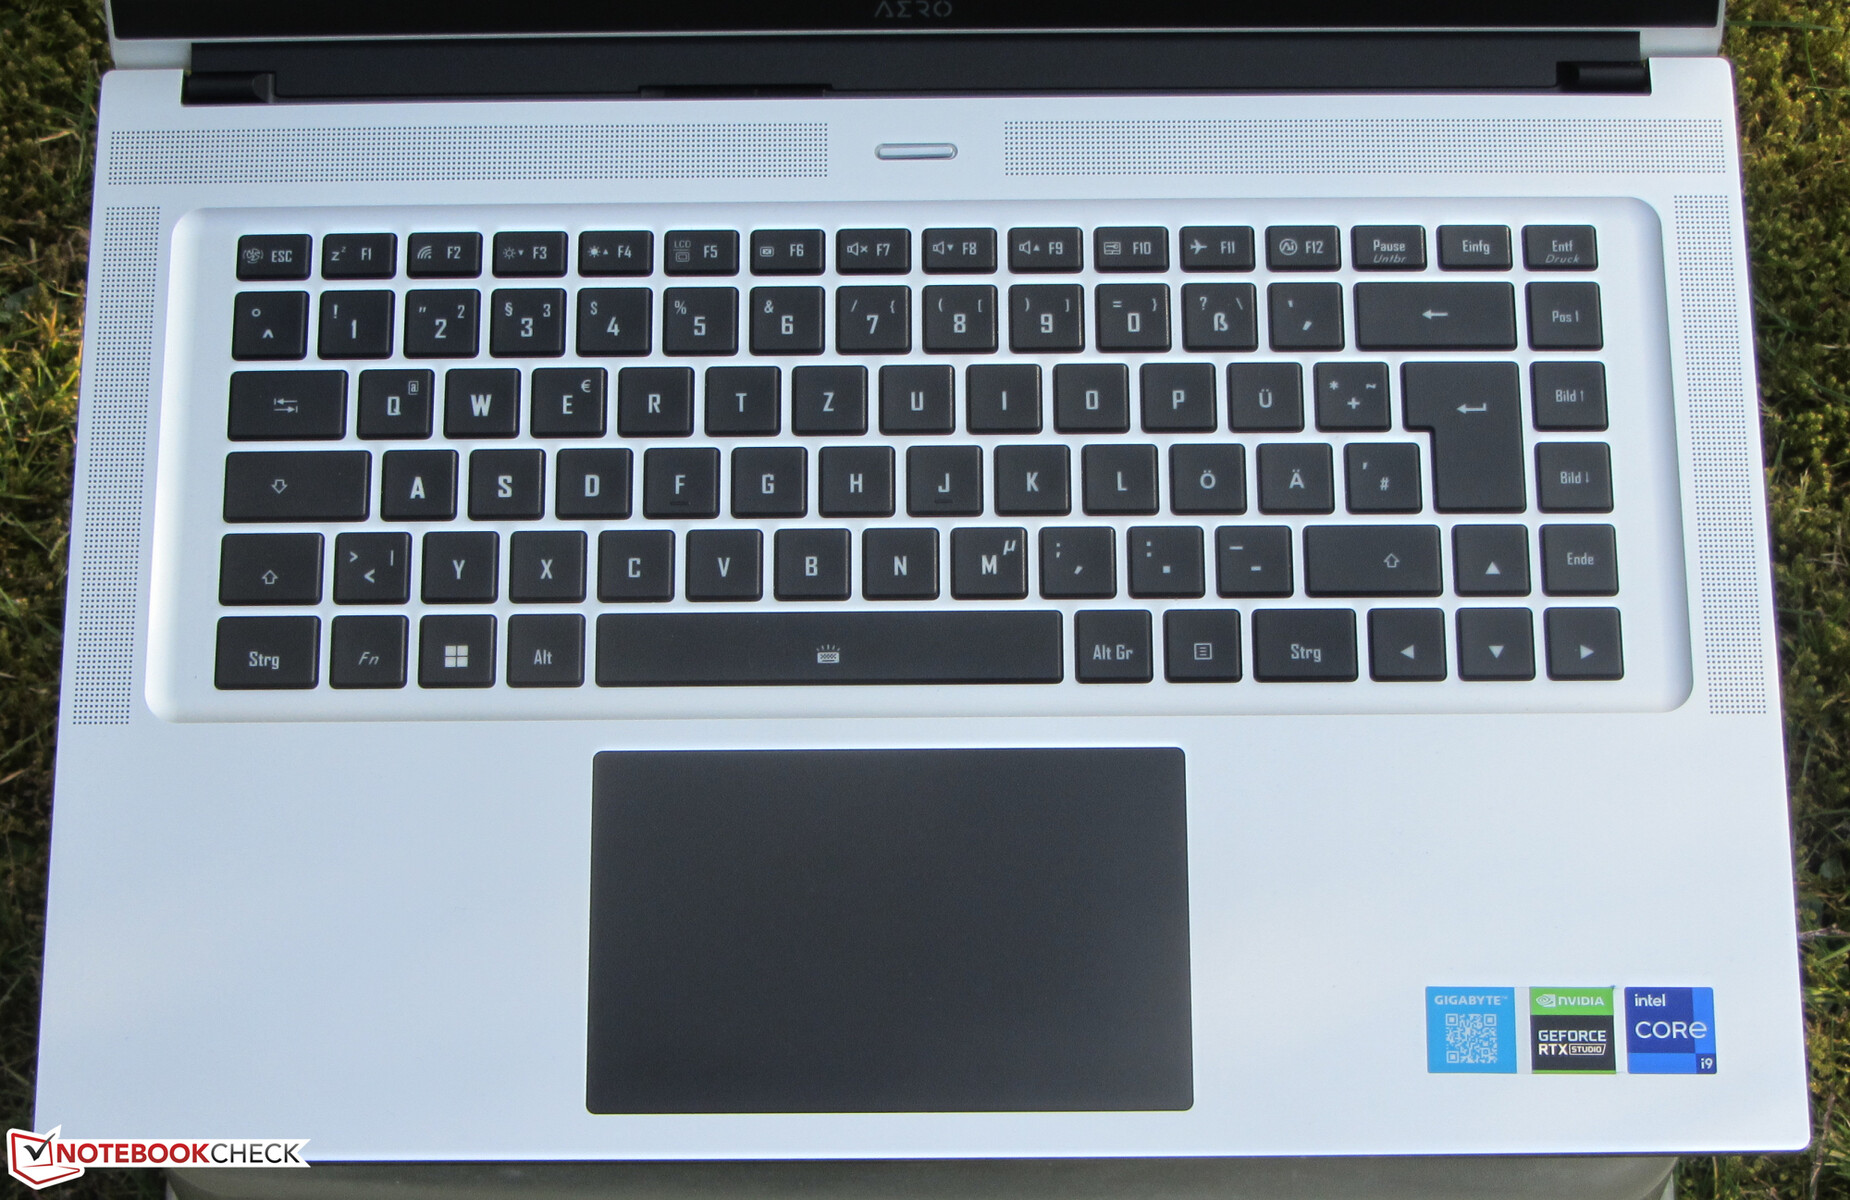
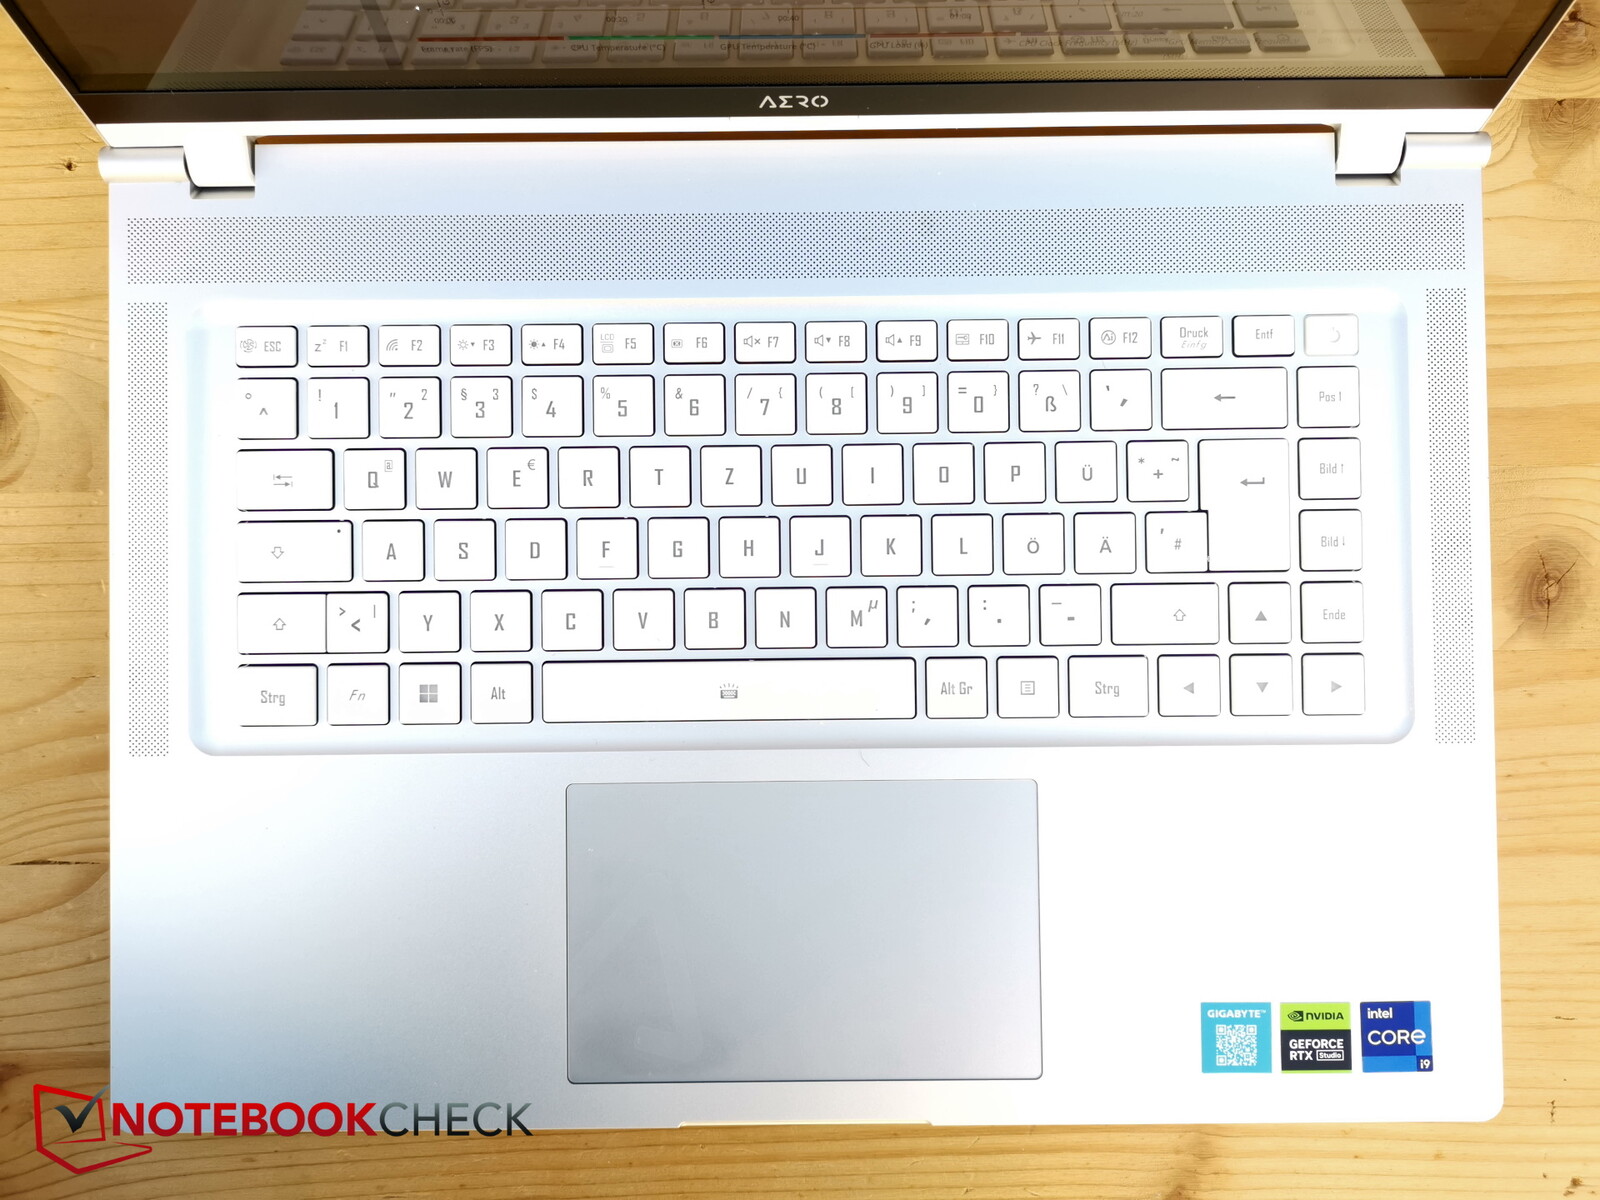
El diseño parece muy ordenado. Ninguna de las teclas parece estar fuera de lugar, e incluso las teclas de flecha son de tamaño normal - muy bien. Las teclas son de tamaño medio y están bien espaciadas.
El recorrido de las teclas es de unos 1,7 mm y la respuesta apenas perceptible. El tecleo es rápido y el ruido moderado, pero la barra espaciadora es un poco más ruidosa.
Aunque el interruptor de encendido/apagado está integrado en la parte superior derecha del teclado, tiene un punto de presión mucho más firme y es un poco más pequeño para que no sea tan fácil pulsarlo accidentalmente. En los portátiles Gigabyte, las teclas especiales para el brillo (más a la izquierda aquí) y el volumen (más a la derecha aquí) suelen estar intercambiadas, lo que cuesta un poco acostumbrarse.
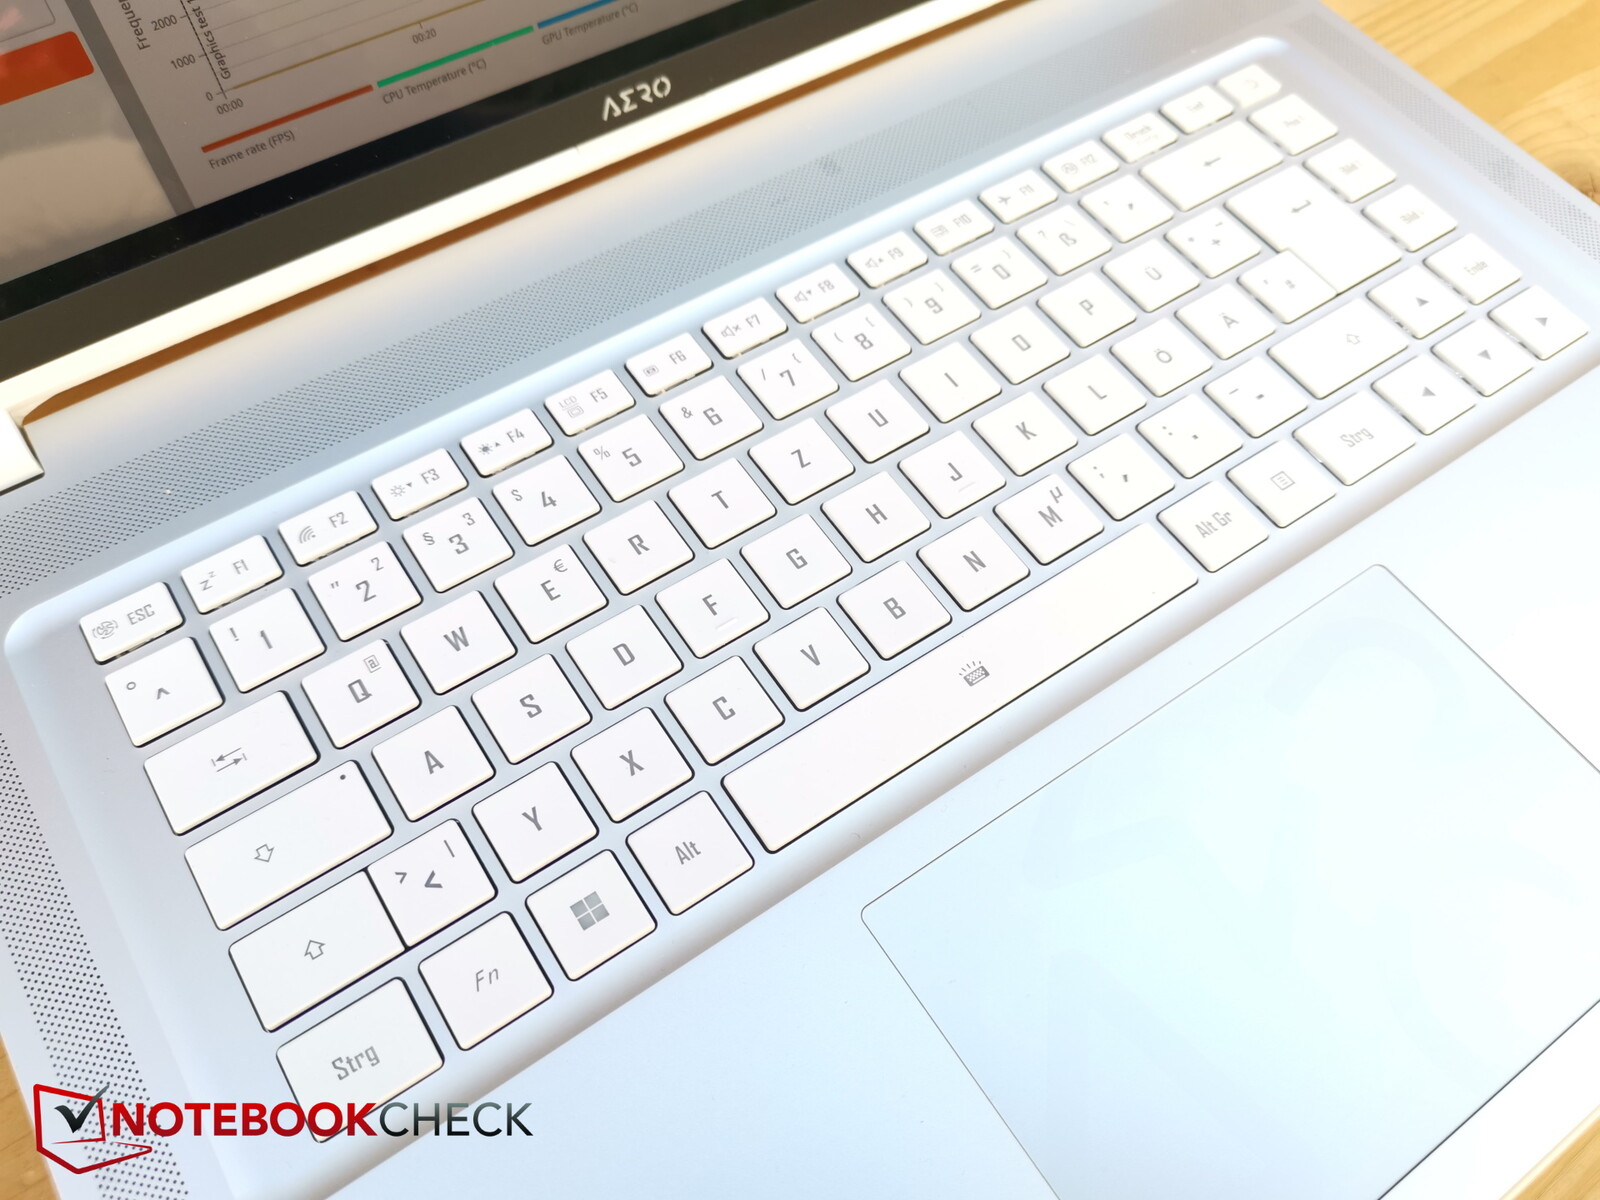
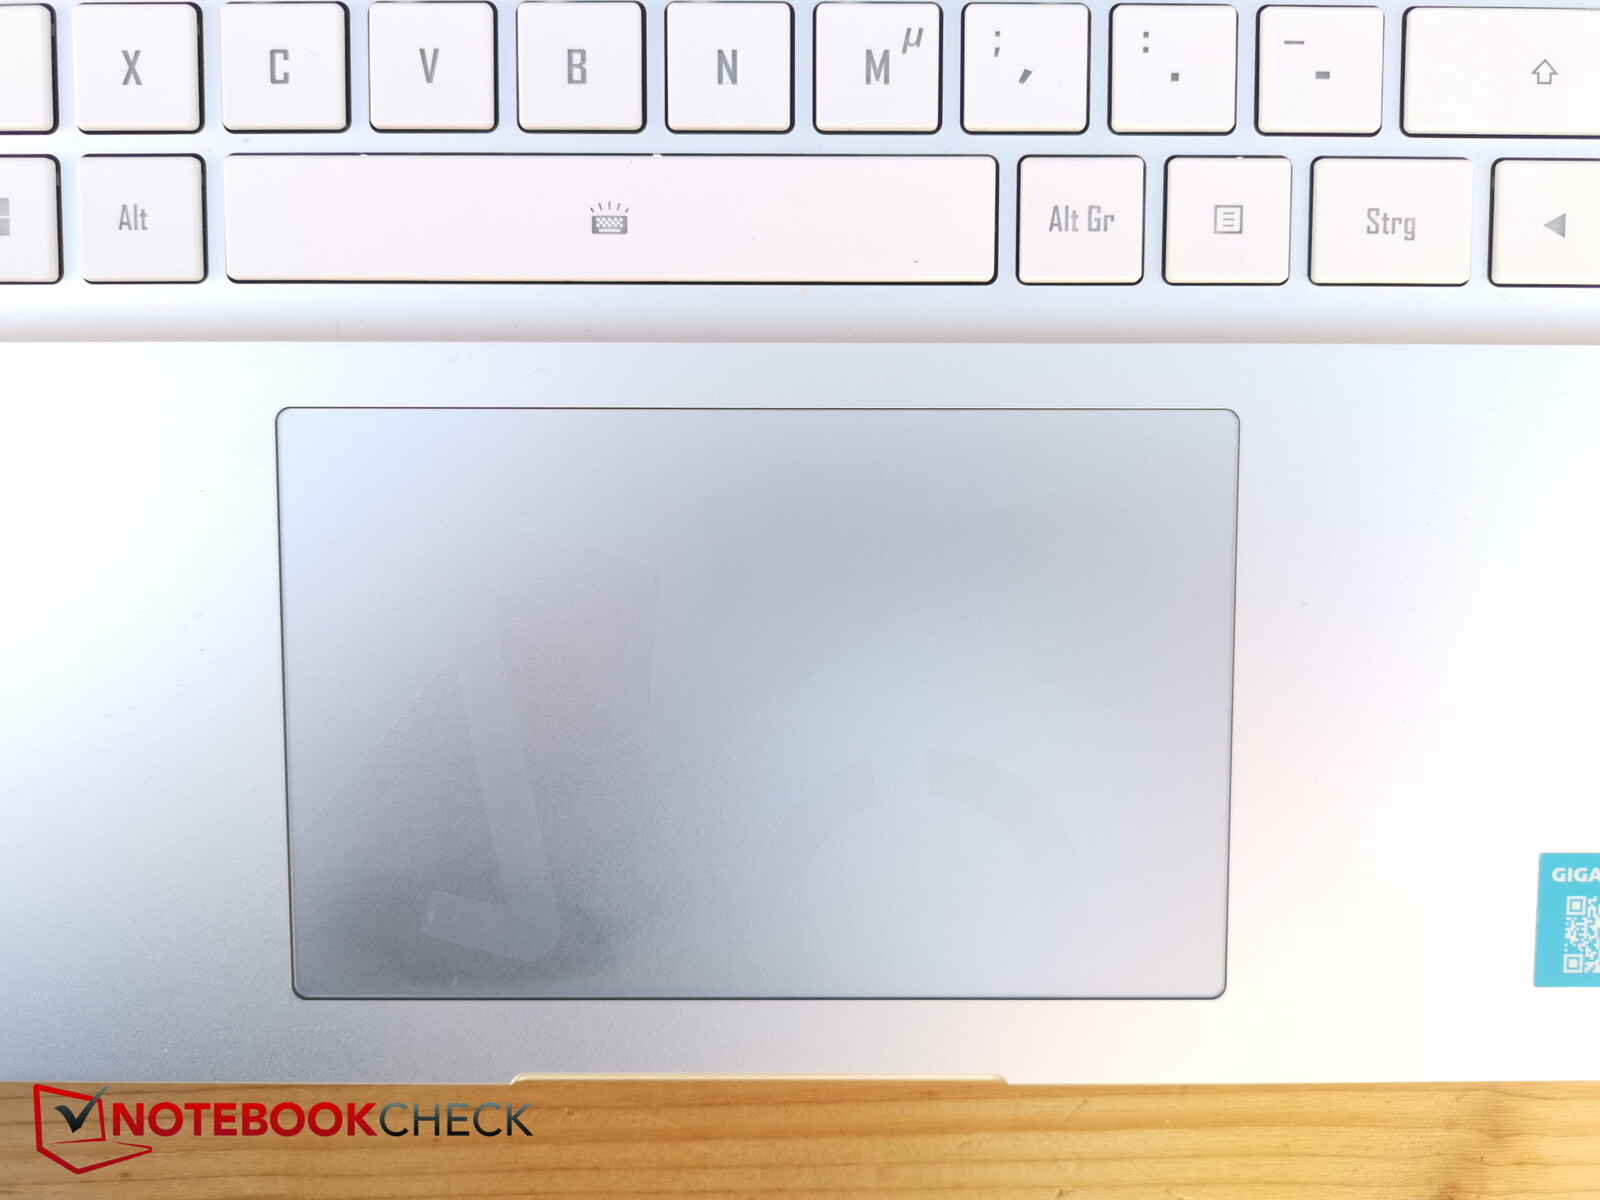
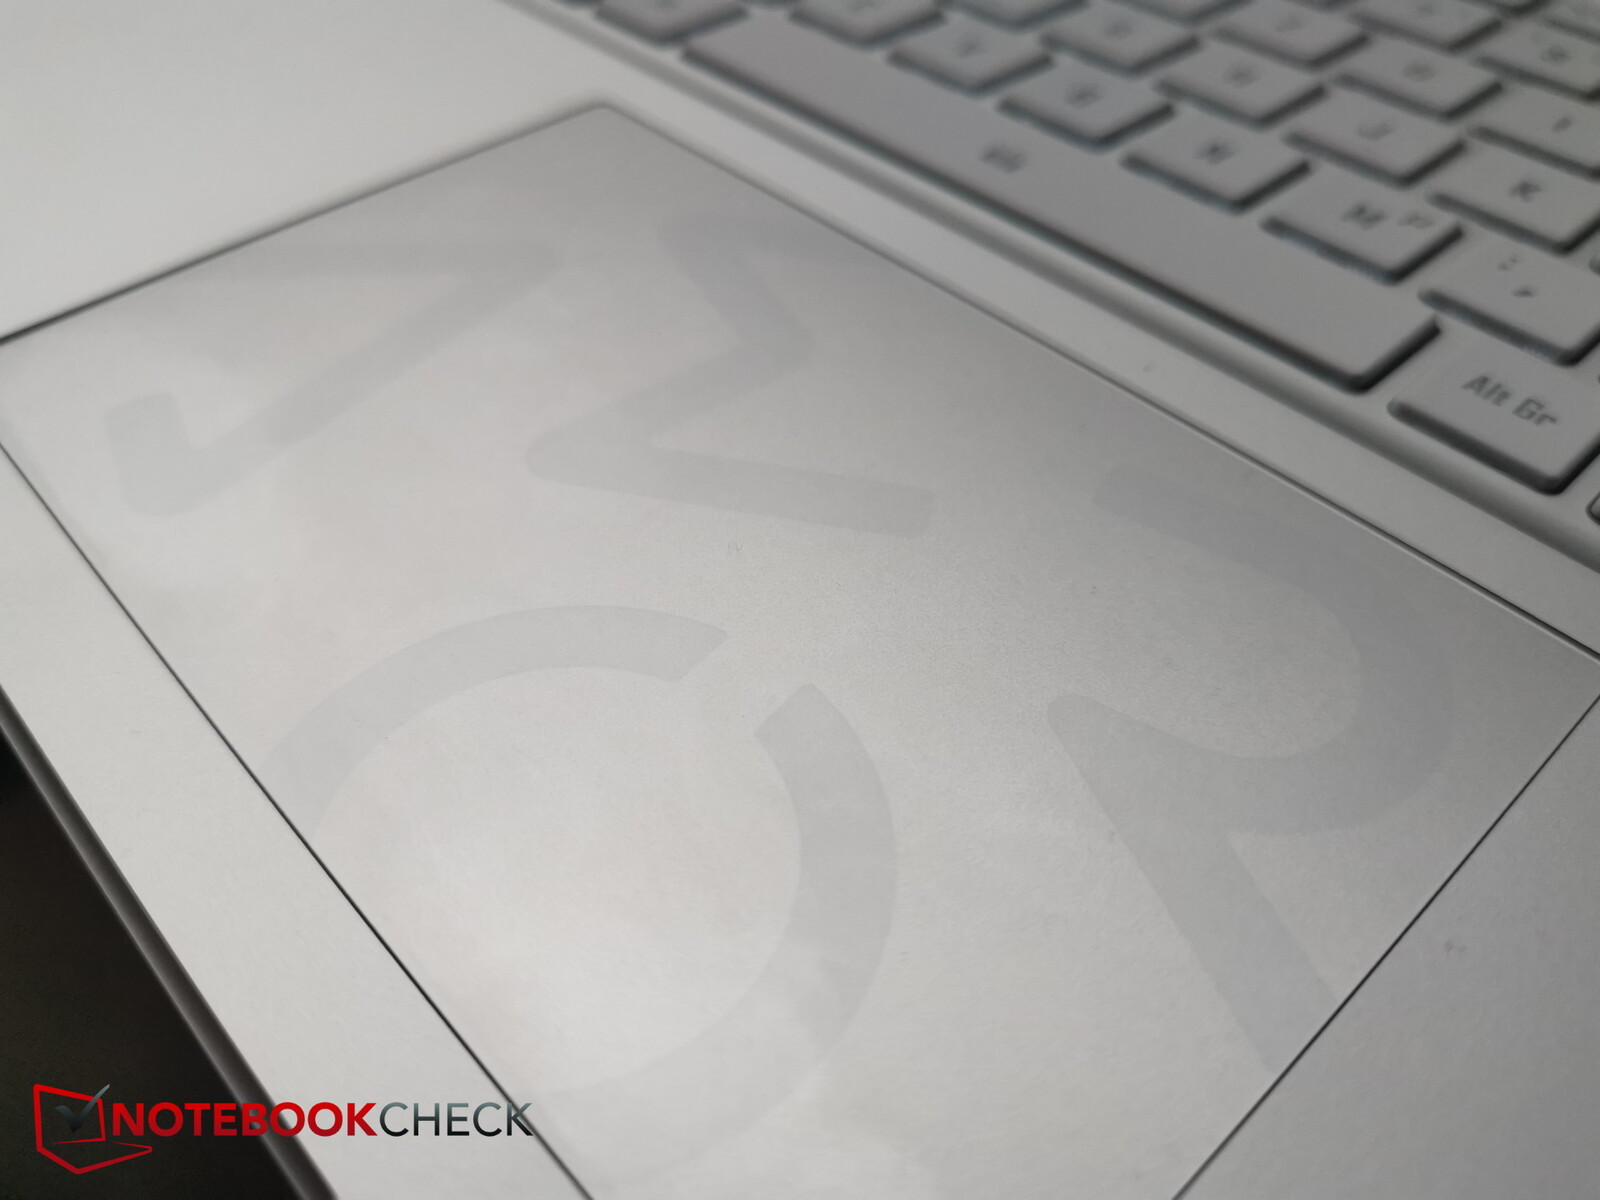
Panel táctil
El touchpad mantiene el mismo tamaño que su predecesor (aprox. 12,1 x 7,6 cm), pero ahora es plateado en lugar de negro y ofrece buenas propiedades de deslizamiento, incluso con movimientos muy lentos.
Las teclas integradas ofrecen una respuesta clara, por lo que son ligeramente más ruidosas que las del teclado, aunque moderadas.
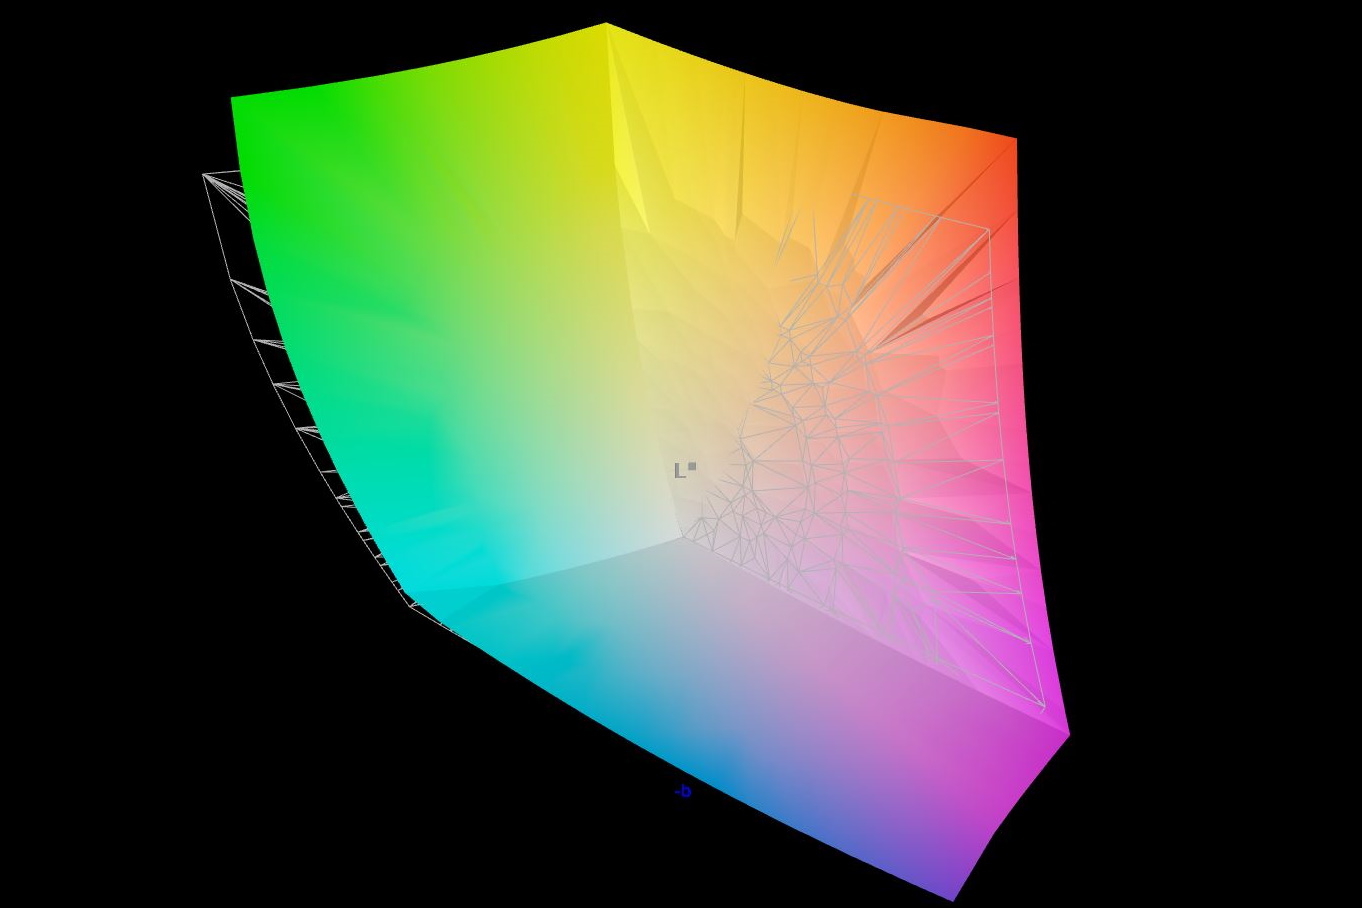
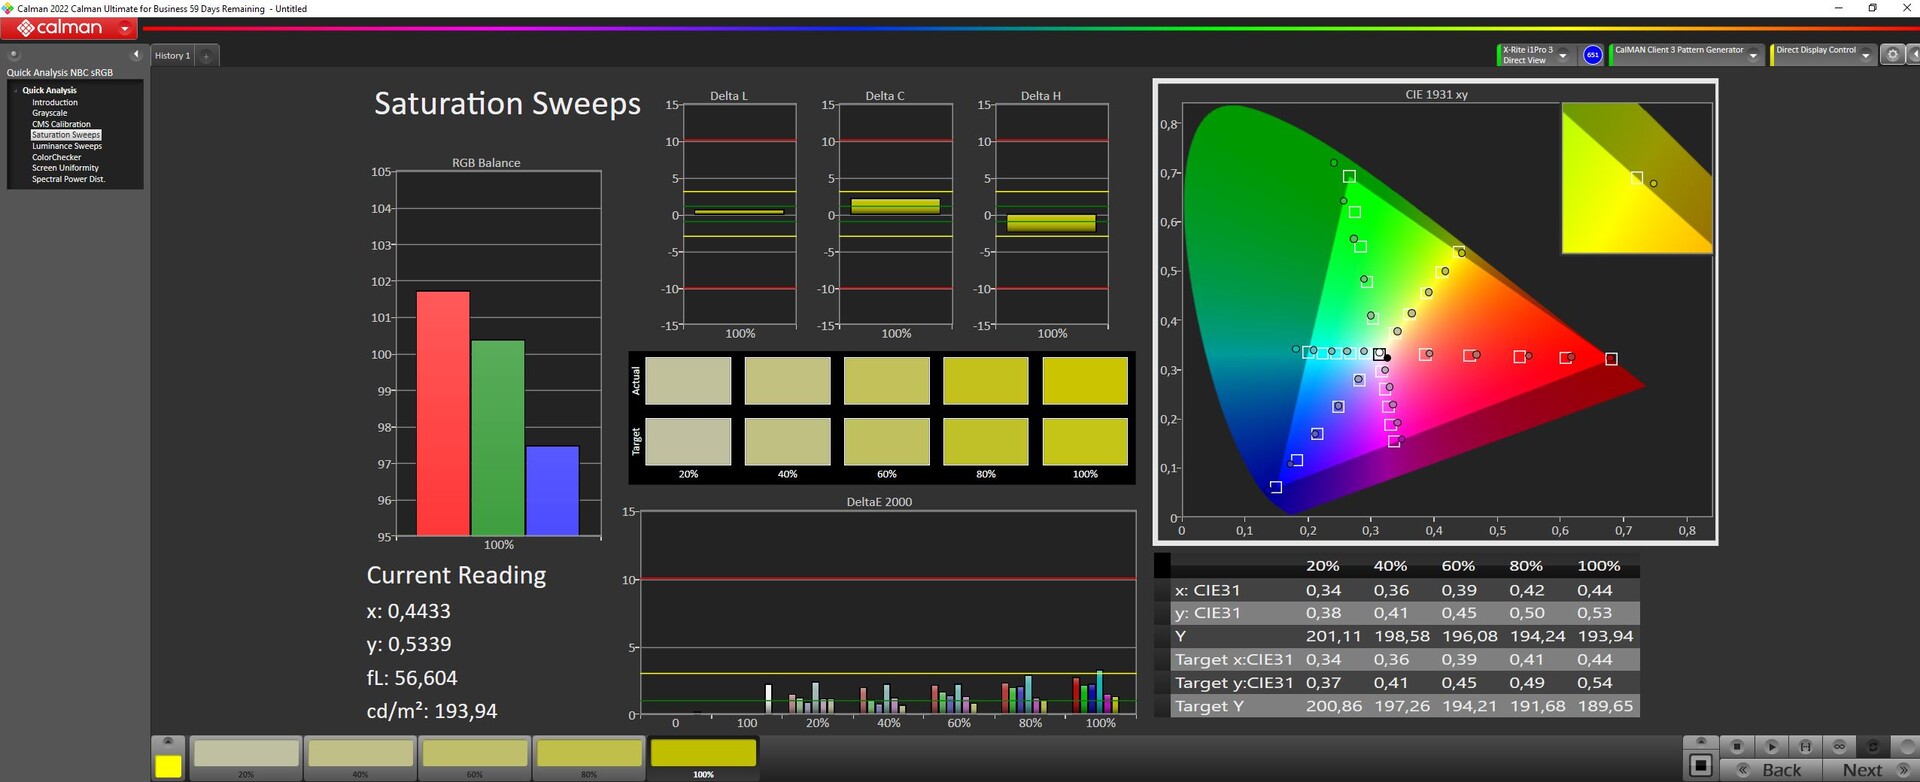
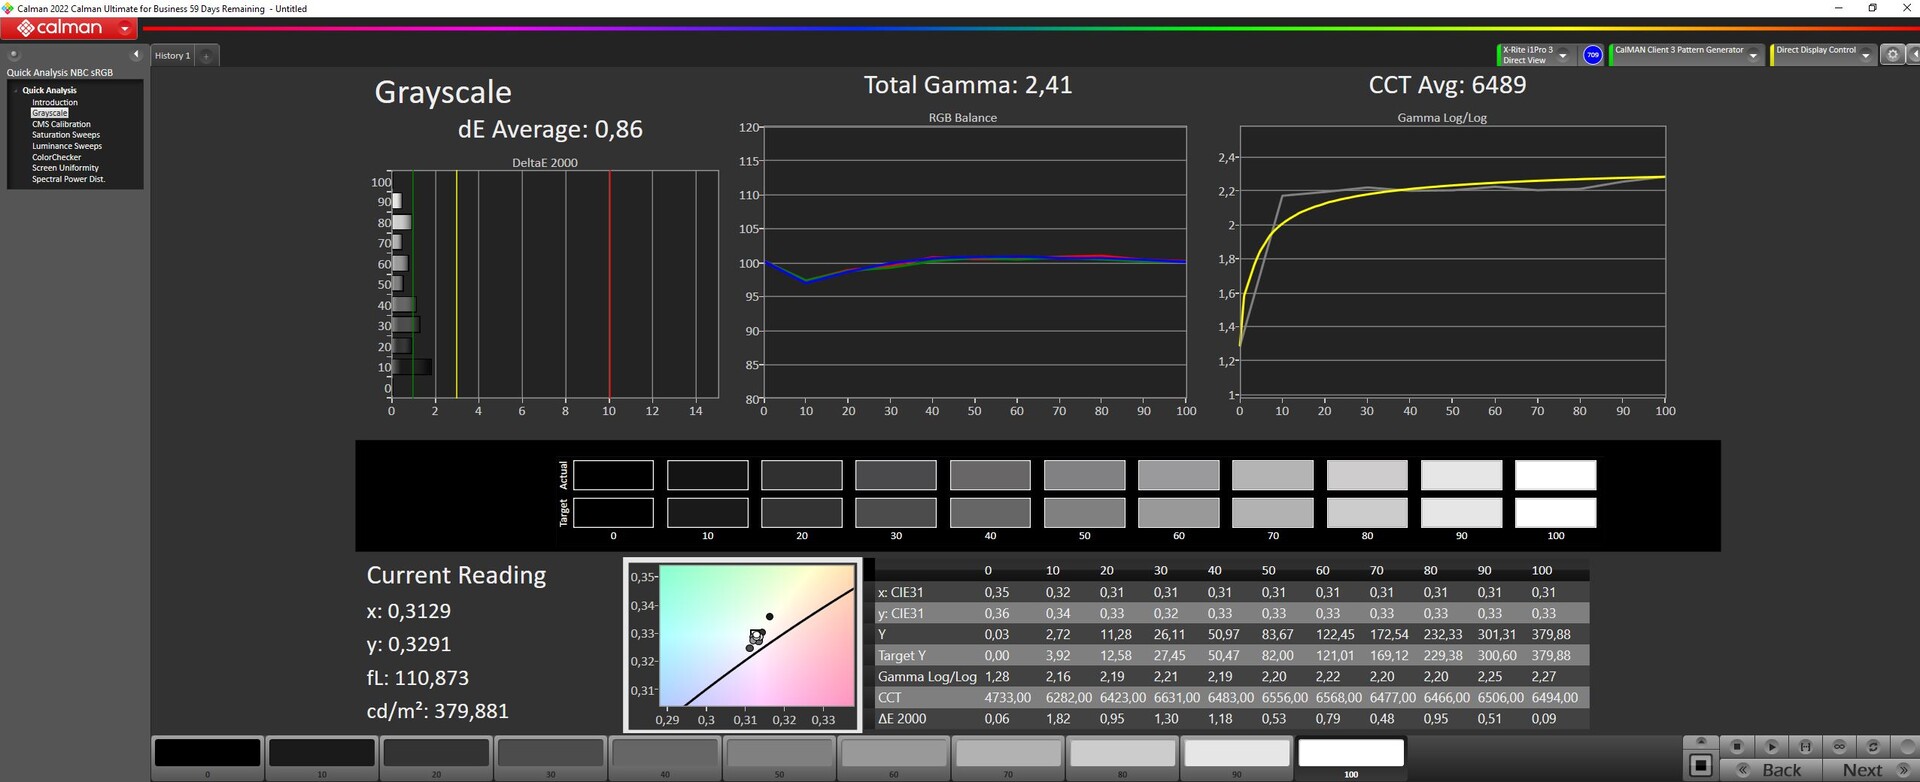
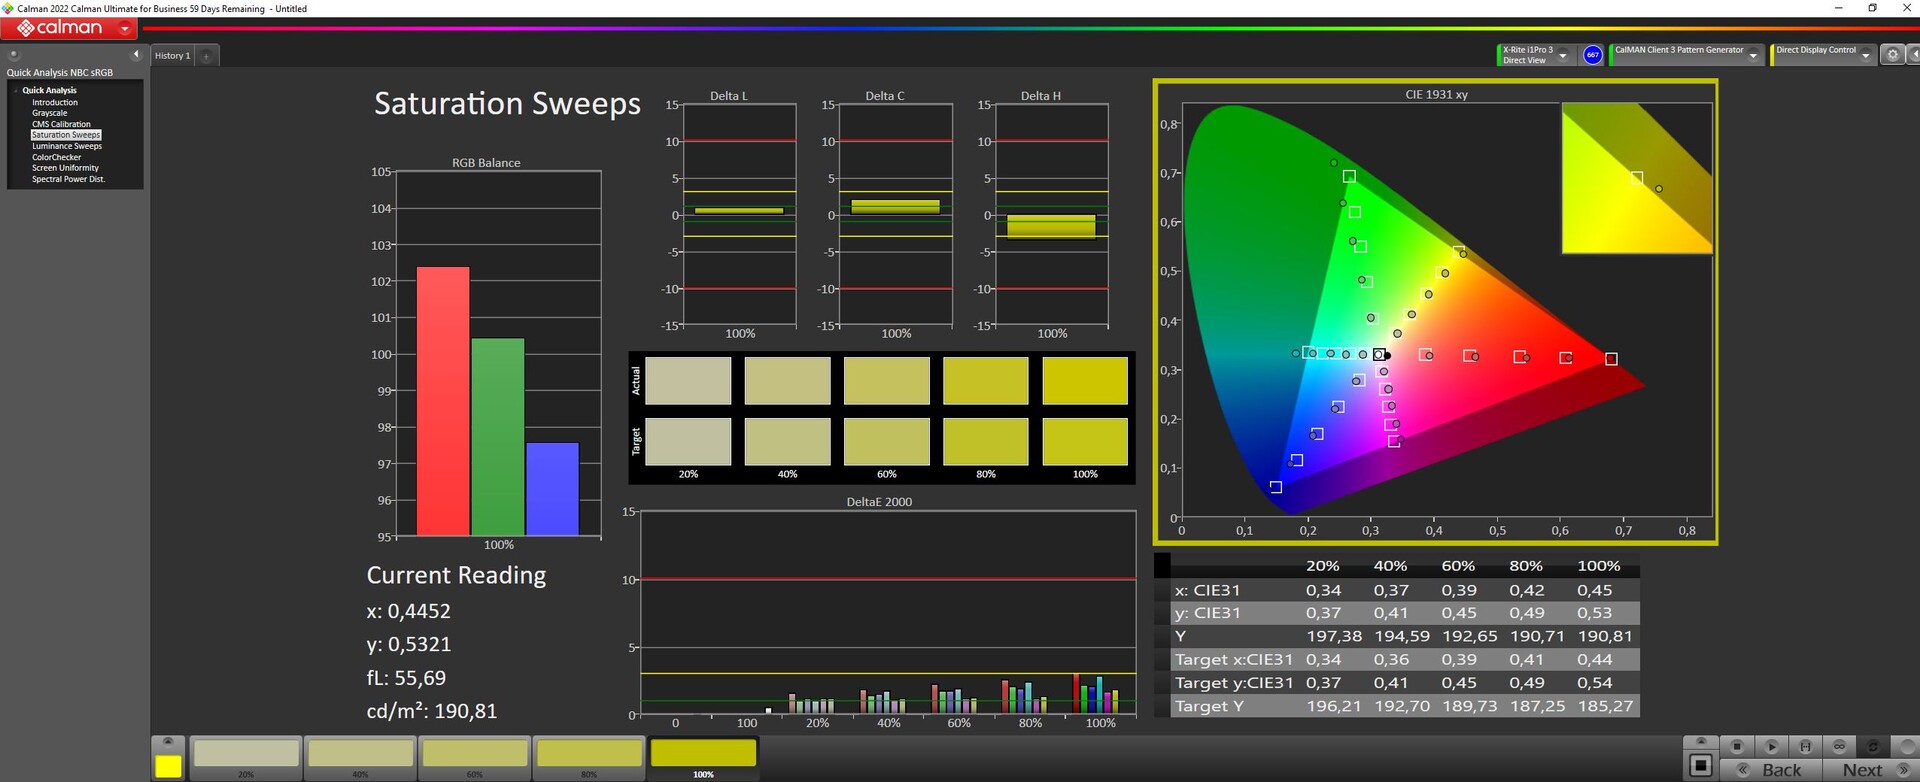
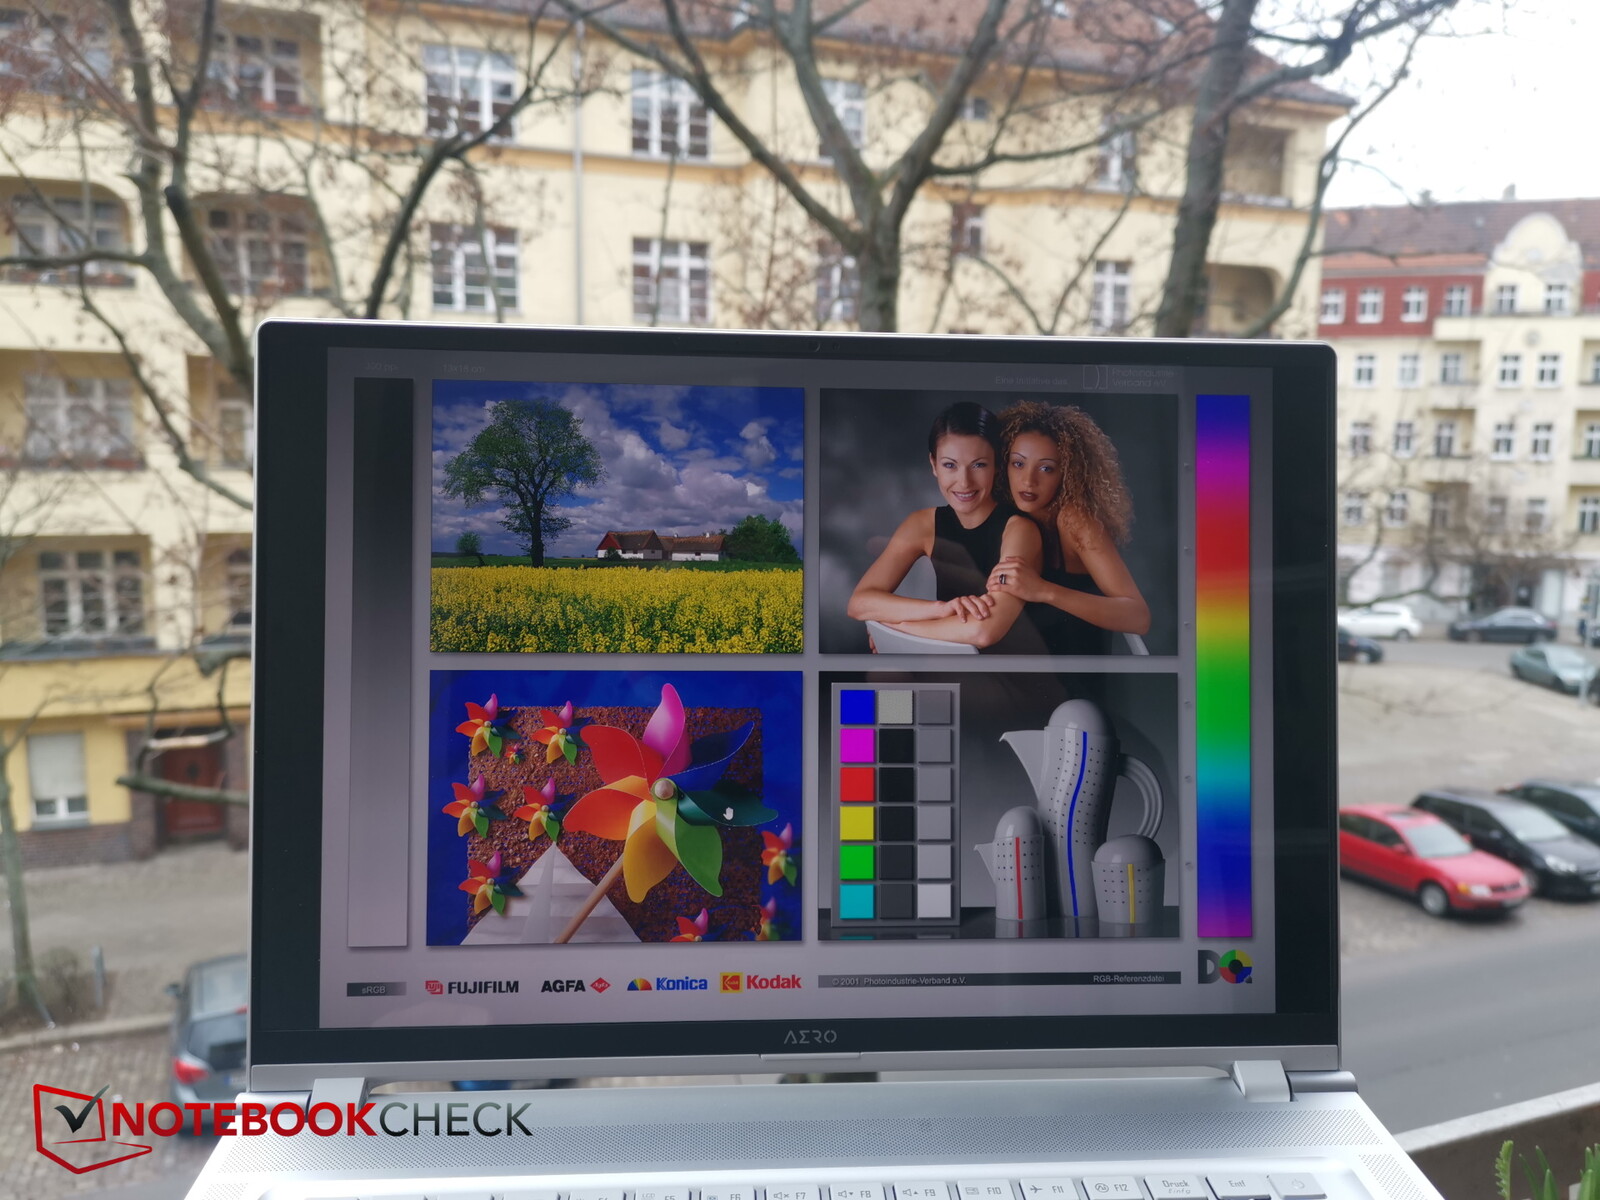
Pantalla - OLED de 16 pulgadas, lo más destacado
Gigabyte vuelve a instalar un panel OLED de 16" de Samsung con un ratio de aspecto 16:10 y una resolución 4K de 3,840 x 2,400. El panel tiene un nuevo número de versión, pero sigue ofreciendo sólo 60 Hz - un inconveniente para los jugones. Por lo demás, el panel OLED presume de un rico contraste, un gran nivel de negro y muy buena iluminación. La competencia IPS ya no puede seguirle el ritmo.
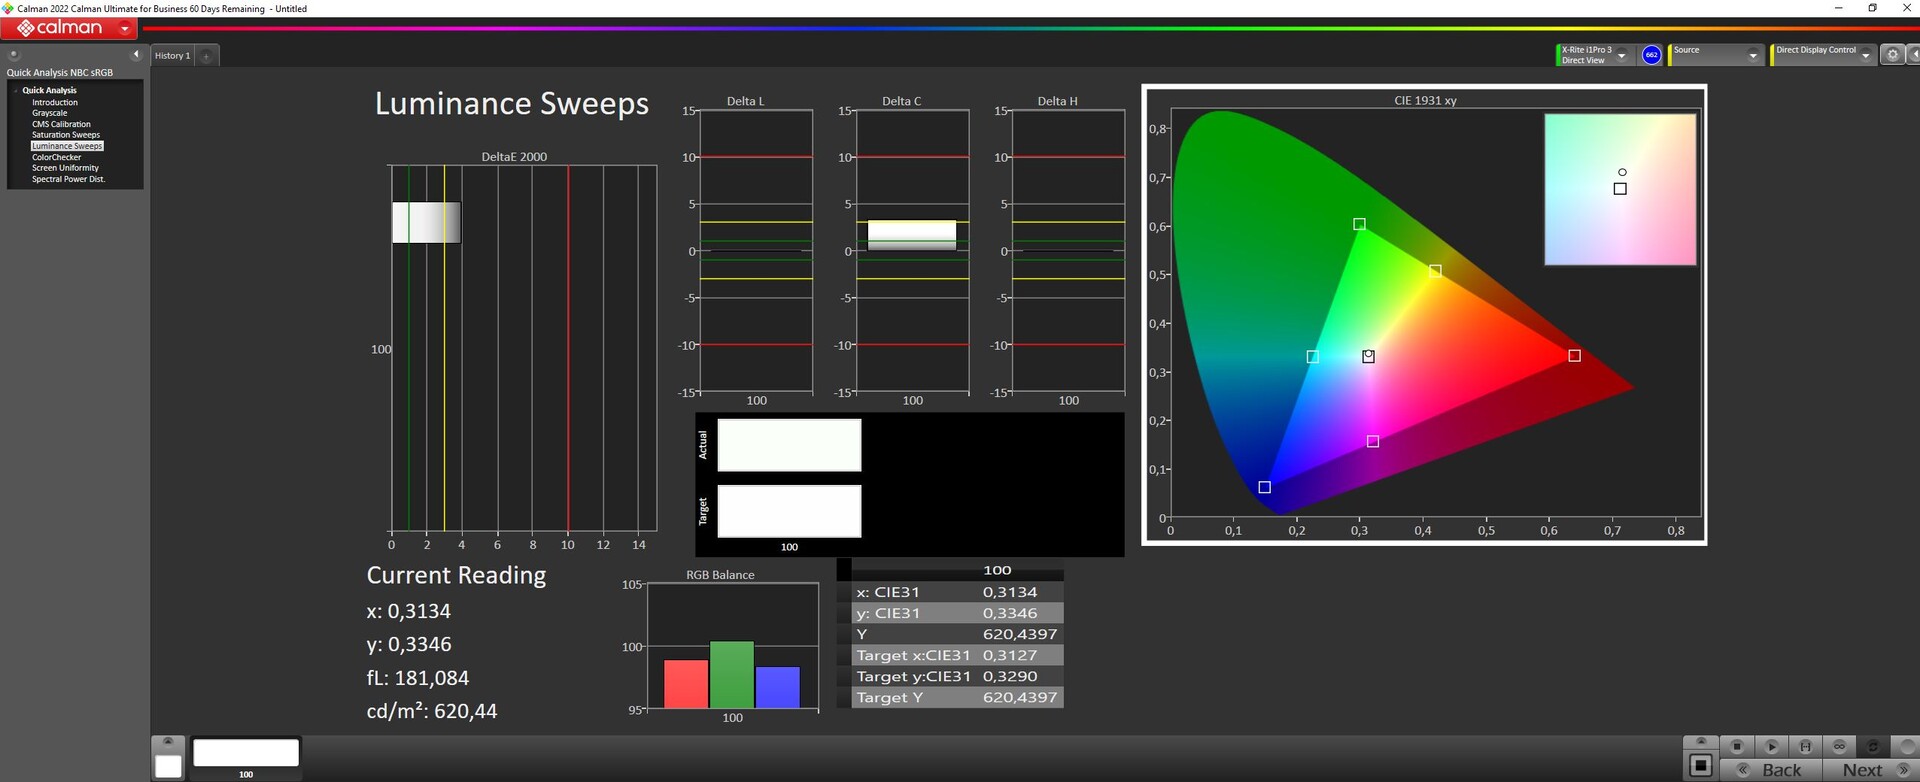
Medimos un brillo de algo menos de 400 nits en modo de pantalla SDR. Pero el panel también cumple el estándar HDR600. Así que medimos en modo HDR y llegamos a un brillo máximo de 620 nits. Esto sólo es posible con un campo de medición pequeño, ya que los OLED se oscurecen rápidamente en áreas grandes y brillantes.
El sangrado de pantalla no es un problema con los OLED. Los tiempos de respuesta también son excelentes.
| |||||||||||||||||||||||||
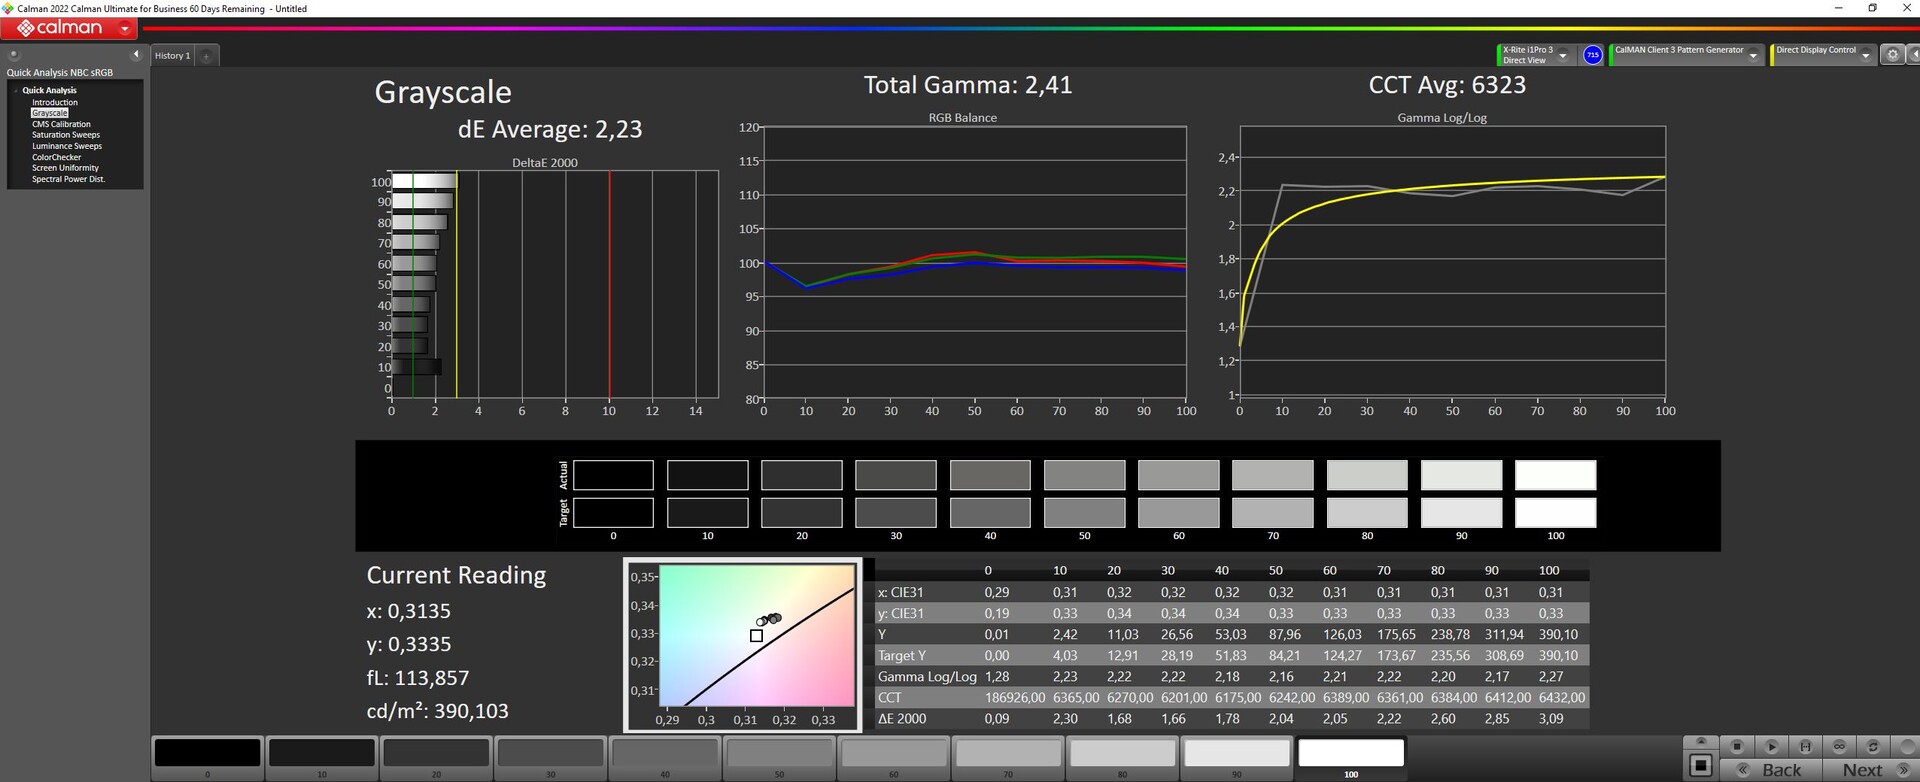
iluminación: 97 %
Brillo con batería: 387.56 cd/m²
Contraste: 12999:1 (Negro: 0.03 cd/m²)
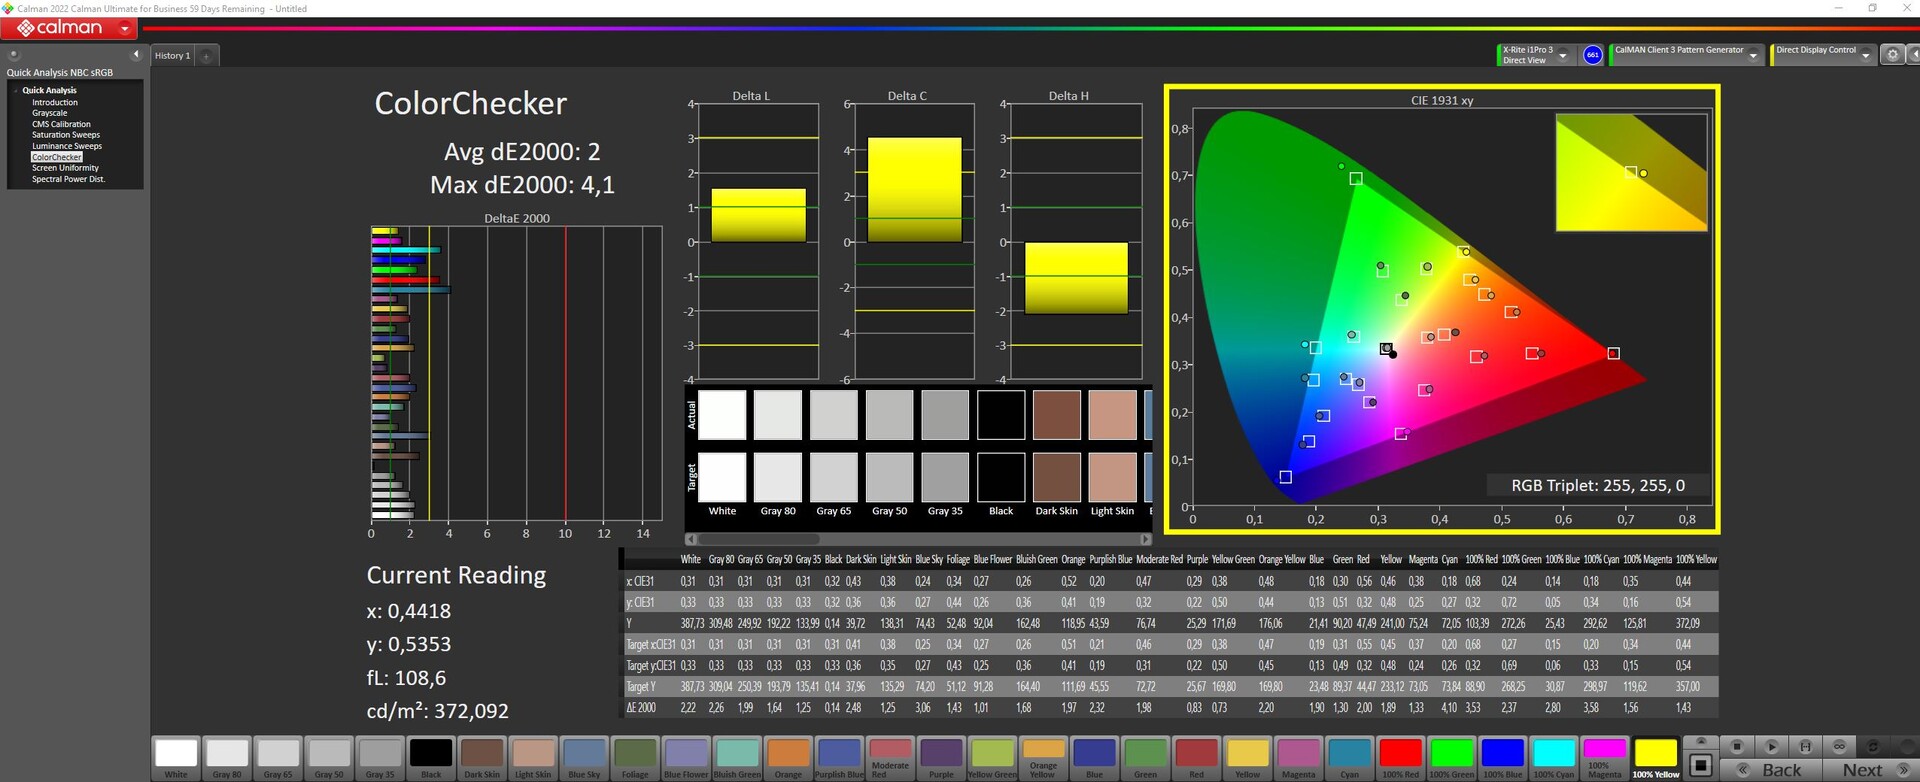
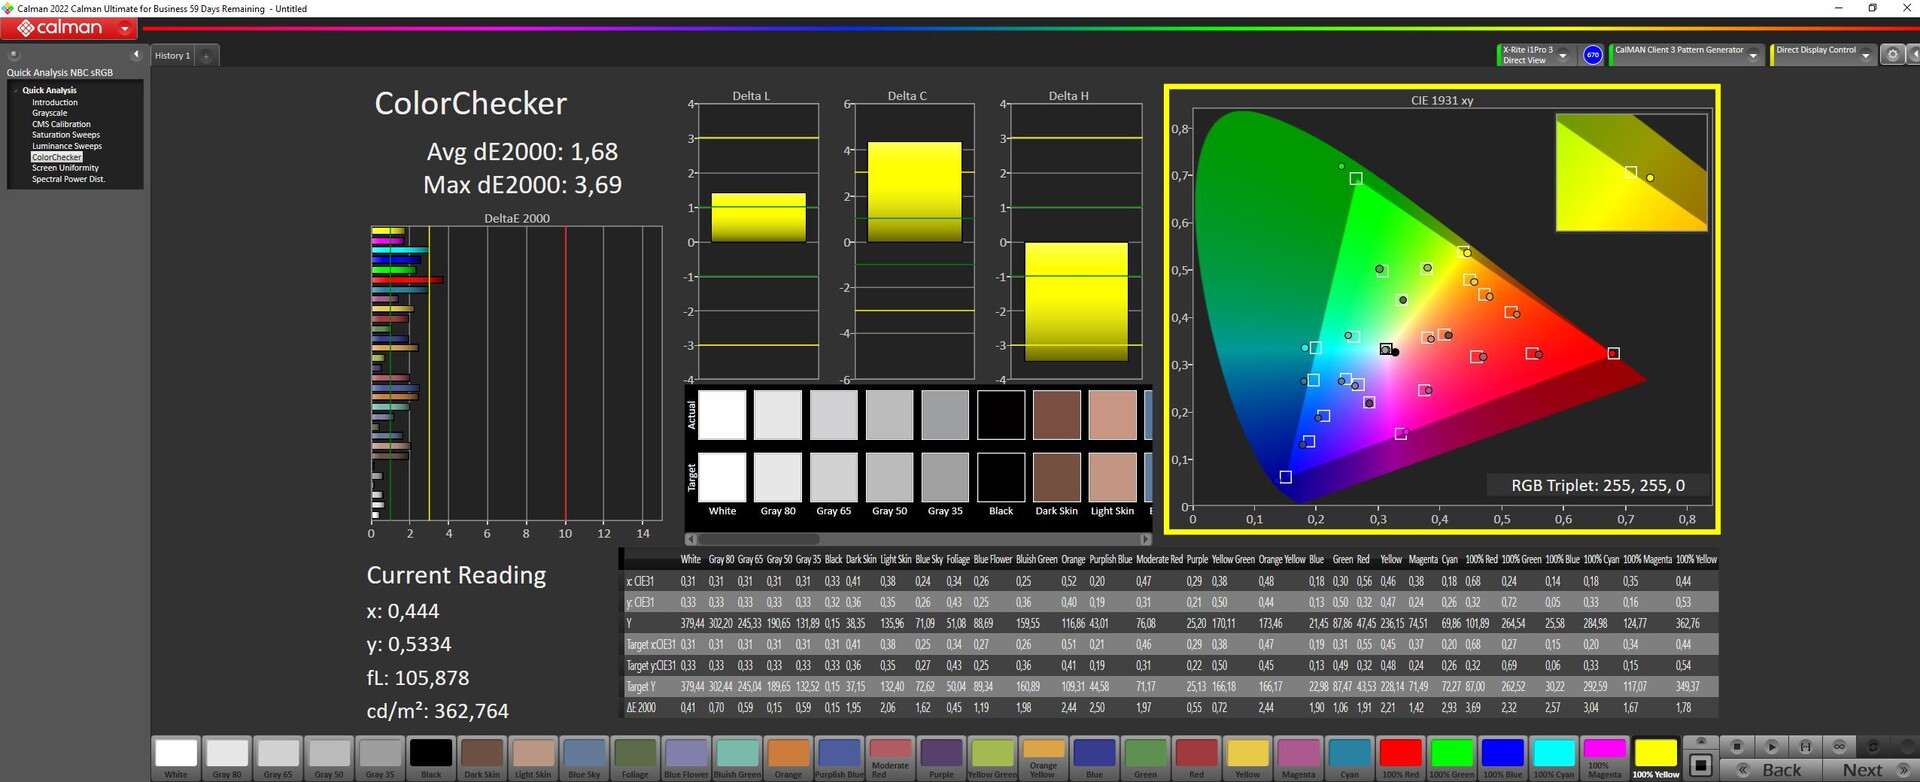
ΔE ColorChecker Calman: 2 | ∀{0.5-29.43 Ø4.71}
calibrated: 1.68
ΔE Greyscale Calman: 2.23 | ∀{0.09-98 Ø4.96}
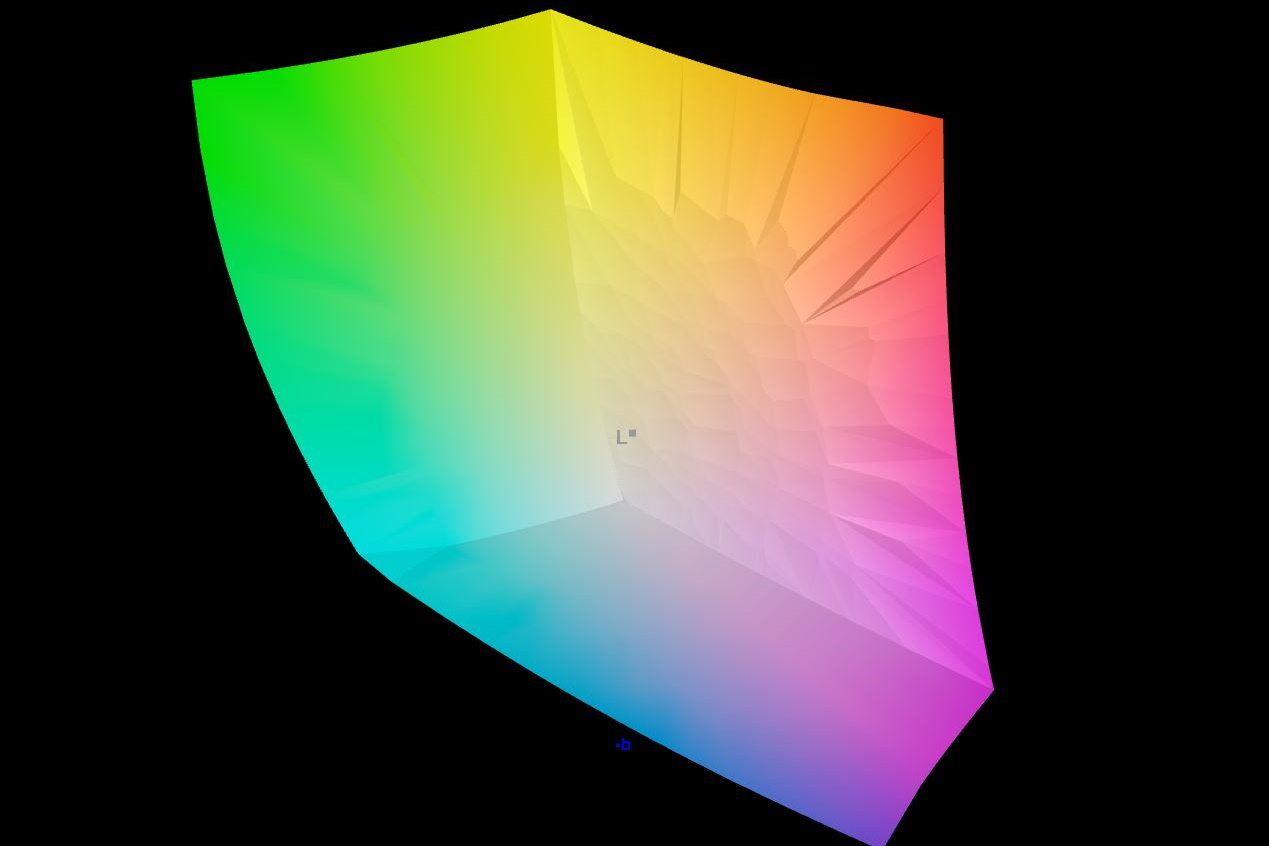
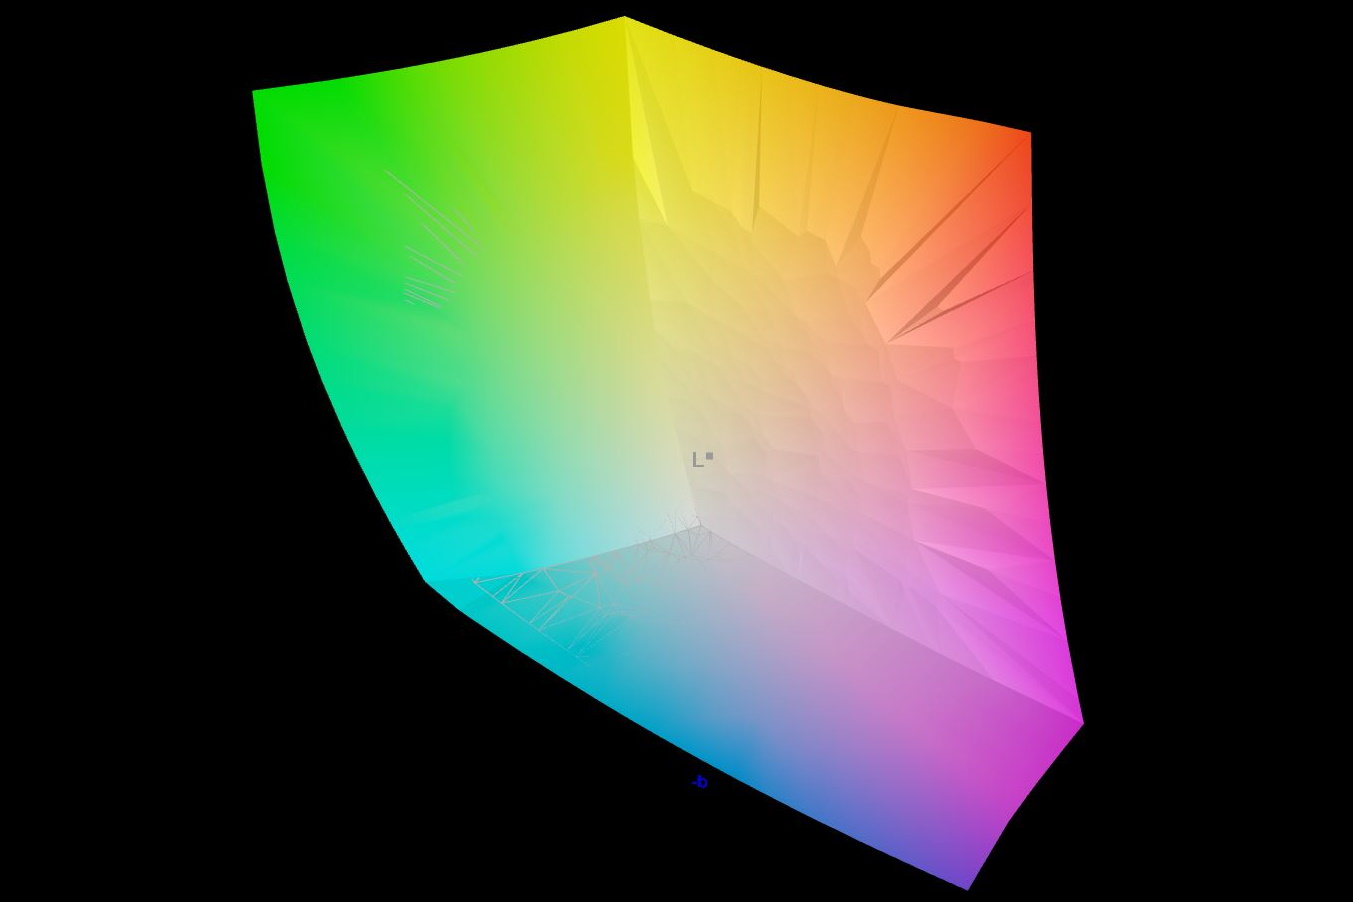
96.4% AdobeRGB 1998 (Argyll 3D)
100% sRGB (Argyll 3D)
99.9% Display P3 (Argyll 3D)
Gamma: 2.41
CCT: 6323 K
| Gigabyte AERO 16 OLED BSF Samsung SDC4191 (ATNA60YV09-0, OLED, 3840x2400, 16" | Gigabyte Aero 16 YE5 Samsung SDC416B, AMOLED, 3840x2400, 16" | Razer Blade 18 RTX 4070 AU Optronics B180QAN01.0, IPS, 2560x1600, 18" | Asus ZenBook Pro 16X OLED UX7602ZM-ME115W Samsung SDC415D, OLED, 3840x2400, 16" | Asus TUF Gaming A16 FA617 NE160WUM-NX2 (BOE0B33), IPS-Level, 1920x1200, 16" | MSI CreatorPro Z16P B12UKST B160QAN02.N, IPS, 2560x1600, 16" | |
|---|---|---|---|---|---|---|
| Display | -5% | -3% | -20% | -4% | ||
| Display P3 Coverage (%) | 99.9 | 96.9 -3% | 99.84 0% | 69.4 -31% | 97.6 -2% | |
| sRGB Coverage (%) | 100 | 99.8 0% | 99.99 0% | 97.8 -2% | 99.9 0% | |
| AdobeRGB 1998 Coverage (%) | 96.4 | 85.3 -12% | 88.9 -8% | 70.9 -26% | 87.4 -9% | |
| Response Times | -11% | -207% | -1% | -580% | -407% | |
| Response Time Grey 50% / Grey 80% * (ms) | 2 ? | 2.4 ? -20% | 4.2 ? -110% | 2 ? -0% | 17 ? -750% | 12.8 ? -540% |
| Response Time Black / White * (ms) | 1.98 ? | 2 ? -1% | 8 ? -304% | 2 ? -1% | 10.1 ? -410% | 7.4 ? -274% |
| PWM Frequency (Hz) | 60 | 60 ? | 59 ? | |||
| Screen | 34% | -208% | -8% | -80% | -118% | |
| Brightness middle (cd/m²) | 389.97 | 368 -6% | 549.6 41% | 346 -11% | 308 -21% | 407 4% |
| Brightness (cd/m²) | 395 | 368 -7% | 524 33% | 354 -10% | 293 -26% | 388 -2% |
| Brightness Distribution (%) | 97 | 93 -4% | 89 -8% | 96 -1% | 90 -7% | 88 -9% |
| Black Level * (cd/m²) | 0.03 | 0.01 67% | 0.53 -1667% | 0.23 -667% | 0.36 -1100% | |
| Contrast (:1) | 12999 | 36800 183% | 1037 -92% | 1339 -90% | 1131 -91% | |
| Colorchecker dE 2000 * | 2 | 2.33 -17% | 3.32 -66% | 2.28 -14% | 1.47 26% | 1.3 35% |
| Colorchecker dE 2000 max. * | 4.1 | 4.34 -6% | 6.63 -62% | 4.94 -20% | 2.98 27% | 2.5 39% |
| Colorchecker dE 2000 calibrated * | 1.68 | 2.7 -61% | 2.16 -29% | 1.02 39% | 0.7 58% | |
| Greyscale dE 2000 * | 2.23 | 0.8 64% | 2 10% | 1.64 26% | 2.2 1% | 2.1 6% |
| Gamma | 2.41 91% | 2.119 104% | 2.29 96% | 2.37 93% | 2.228 99% | 2.26 97% |
| CCT | 6323 103% | 6569 99% | 6319 103% | 6384 102% | 6228 104% | 6437 101% |
| Media total (Programa/Opciones) | 12% /
25% | -140% /
-164% | -4% /
-6% | -227% /
-138% | -176% /
-135% |
* ... más pequeño es mejor
Gigabyte anuncia que Aero 16 ofrece una cobertura DCI-P3 del 100% y nuestras mediciones lo confirman. Incluso AdobeRGB tiene una cobertura del 96,4%. El display OLED es, por tanto, muy adecuado para editar fotos y vídeos.
La pantalla ya está bien calibrada de fábrica; nuestra calibración a través de Portrait Displays Calman Color Calibration rebaja aún más los valores DeltaE. Así que la pantalla sólo tiene desviaciones muy leves de color y escala de grises. Nuestro perfil ICC puede descargarse más arriba.
Tiempos de respuesta del display
| ↔ Tiempo de respuesta de Negro a Blanco | ||
|---|---|---|
| 1.98 ms ... subida ↗ y bajada ↘ combinada | ↗ 0.5 ms subida | 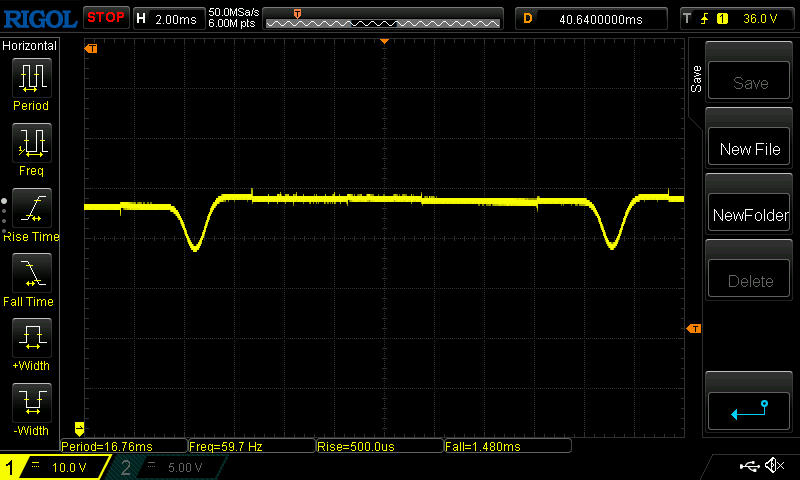 |
| ↘ 1.48 ms bajada | ||
| La pantalla mostró tiempos de respuesta muy rápidos en nuestros tests y debería ser adecuada para juegos frenéticos. En comparación, todos los dispositivos de prueba van de ##min### (mínimo) a 240 (máximo) ms. » 11 % de todos los dispositivos son mejores. Esto quiere decir que el tiempo de respuesta medido es mejor que la media (19.8 ms) de todos los dispositivos testados. | ||
| ↔ Tiempo de respuesta 50% Gris a 80% Gris | ||
| 2 ms ... subida ↗ y bajada ↘ combinada | ↗ 1 ms subida | 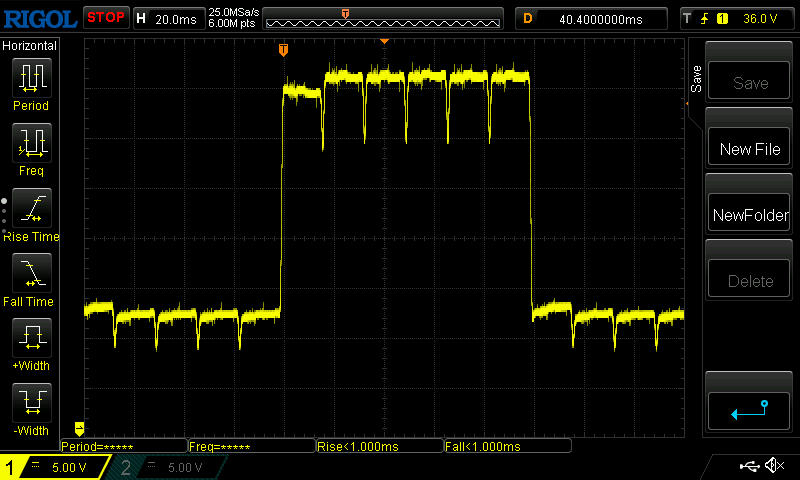 |
| ↘ 1 ms bajada | ||
| La pantalla mostró tiempos de respuesta muy rápidos en nuestros tests y debería ser adecuada para juegos frenéticos. En comparación, todos los dispositivos de prueba van de ##min### (mínimo) a 636 (máximo) ms. » 10 % de todos los dispositivos son mejores. Esto quiere decir que el tiempo de respuesta medido es mejor que la media (31 ms) de todos los dispositivos testados. | ||
Parpadeo de Pantalla / PWM (Pulse-Width Modulation)
| Parpadeo de Pantalla / PWM detectado | 60 Hz | 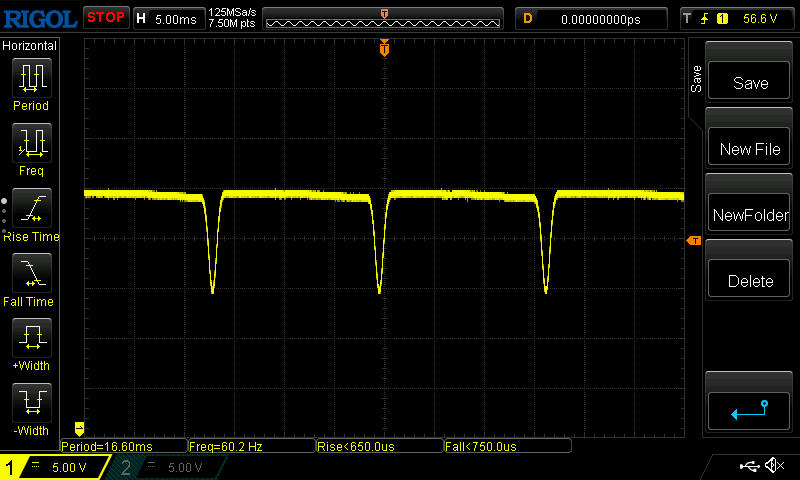 | |
La retroiluminación del display parpadea a 60 Hz (seguramente usa PWM - Pulse-Width Modulation) . La frecuencia de 60 Hz es bajísima, por lo que el parpadeo puede causar fatiga visual y cefaleas cuando se usa mucho tiempo. Comparación: 52 % de todos los dispositivos testados no usaron PWM para atenuar el display. Si se usó, medimos una media de 7757 (mínimo: 5 - máxmo: 343500) Hz. | |||
Como es habitual en los OLED, la pantalla parpadea a 60 Hz a pleno brillo. Alrededor del 50% de brillo y por debajo, la frecuencia cambia, y 238 Hz puede resultar molesto para las personas sensibles.

En exteriores, por supuesto, la superficie reflectante distrae. El brillo SDR más bien medio y los buenos contrastes sólo pueden compensar esta desventaja hasta cierto punto. Se recomienda un lugar a la sombra y un ángulo de visión directo.
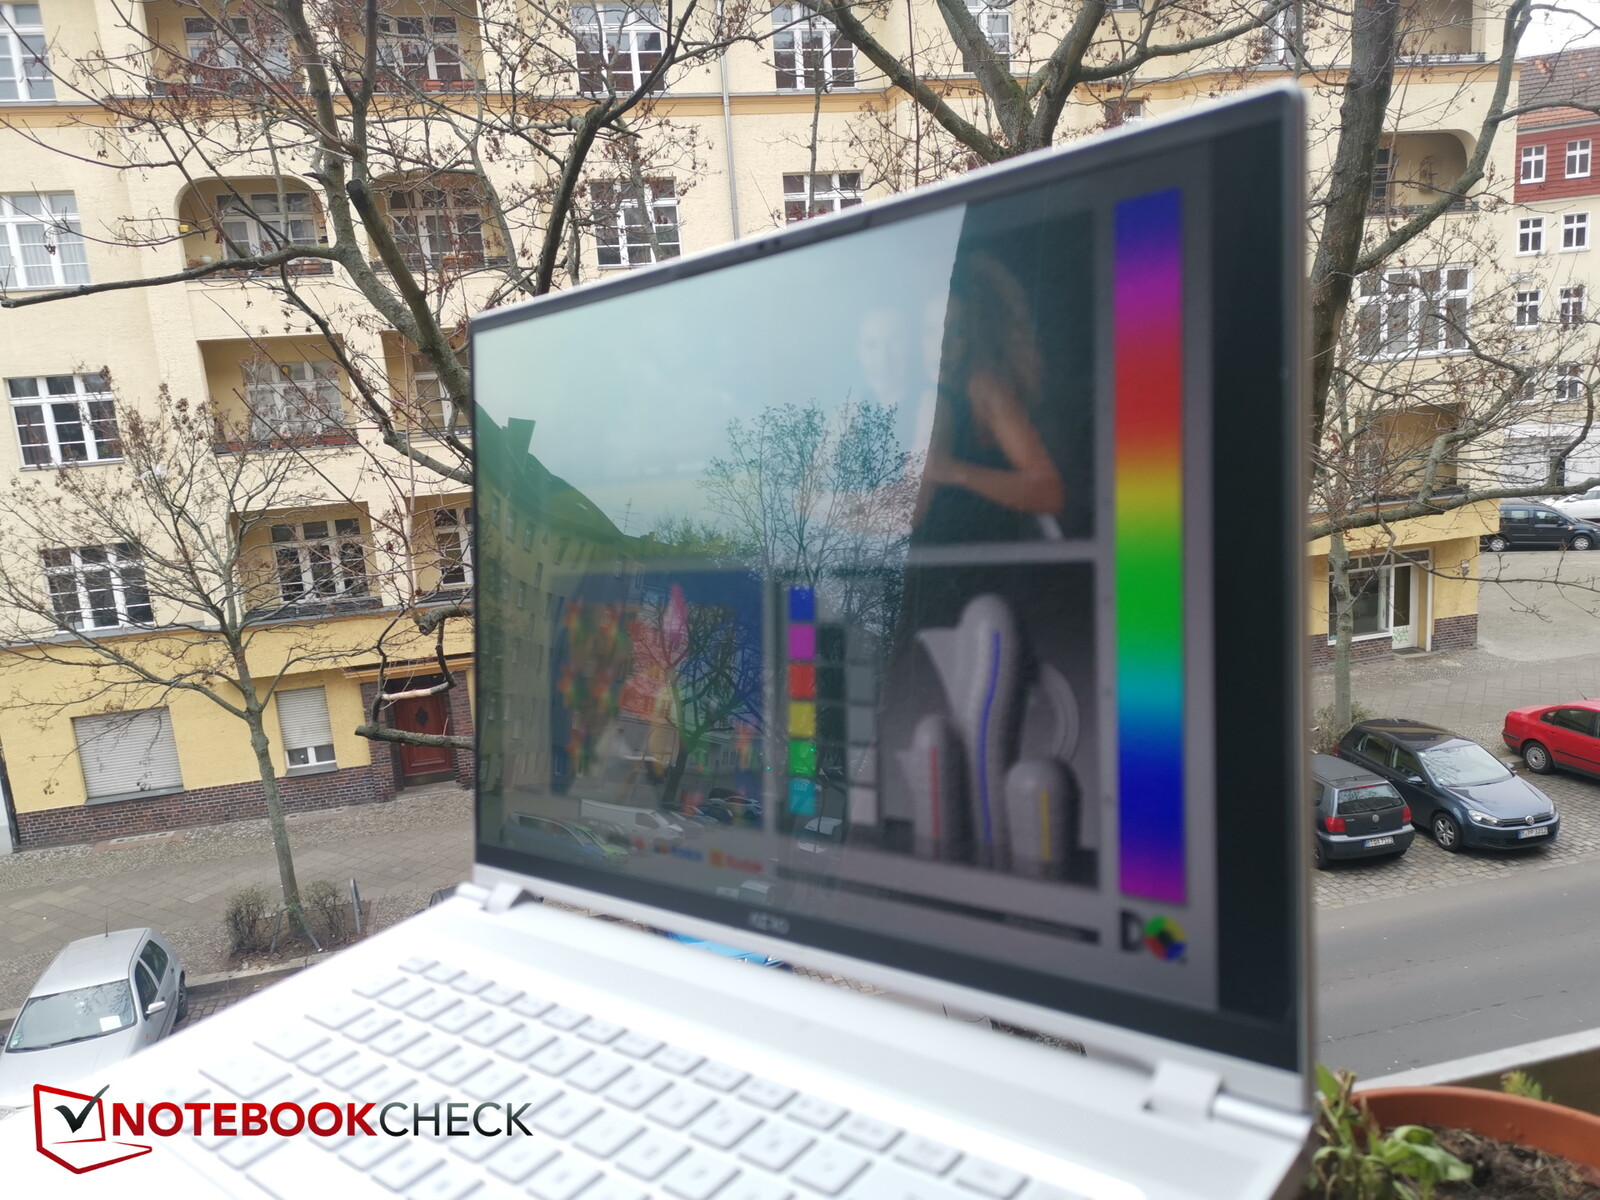
La pérdida de brillo sólo se nota al mirar la pantalla desde ángulos extremos.

Rendimiento - Buen rendimiento 3D a pesar de los 105 W
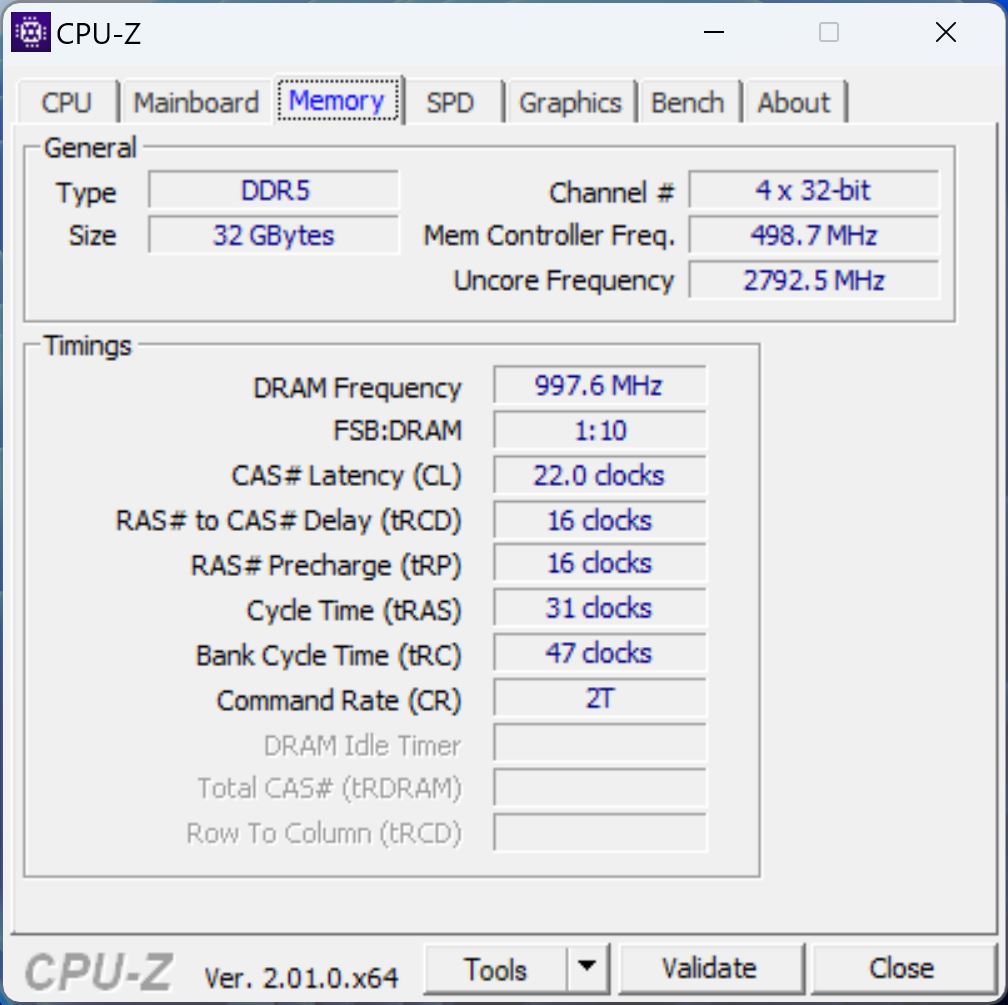
El Aero alberga un hardware totalmente nuevo. La combinación dei9-13900H, RTX 4070y 32 GB DDR5-4800 no debería plantear ningún problema a los usuarios, ya sea jugando o usando aplicaciones creativas.
Sin embargo, todo este hardware está empaquetado en una carcasa delgada, por lo que no funciona a plena potencia, como se verá a continuación. Al fin y al cabo, no se supone que un portátil creativo sea un portátil que ruge a toda potencia, así que los jugadores hardcore tendrán que sufrir un poco aquí.
Condiciones de ensayo
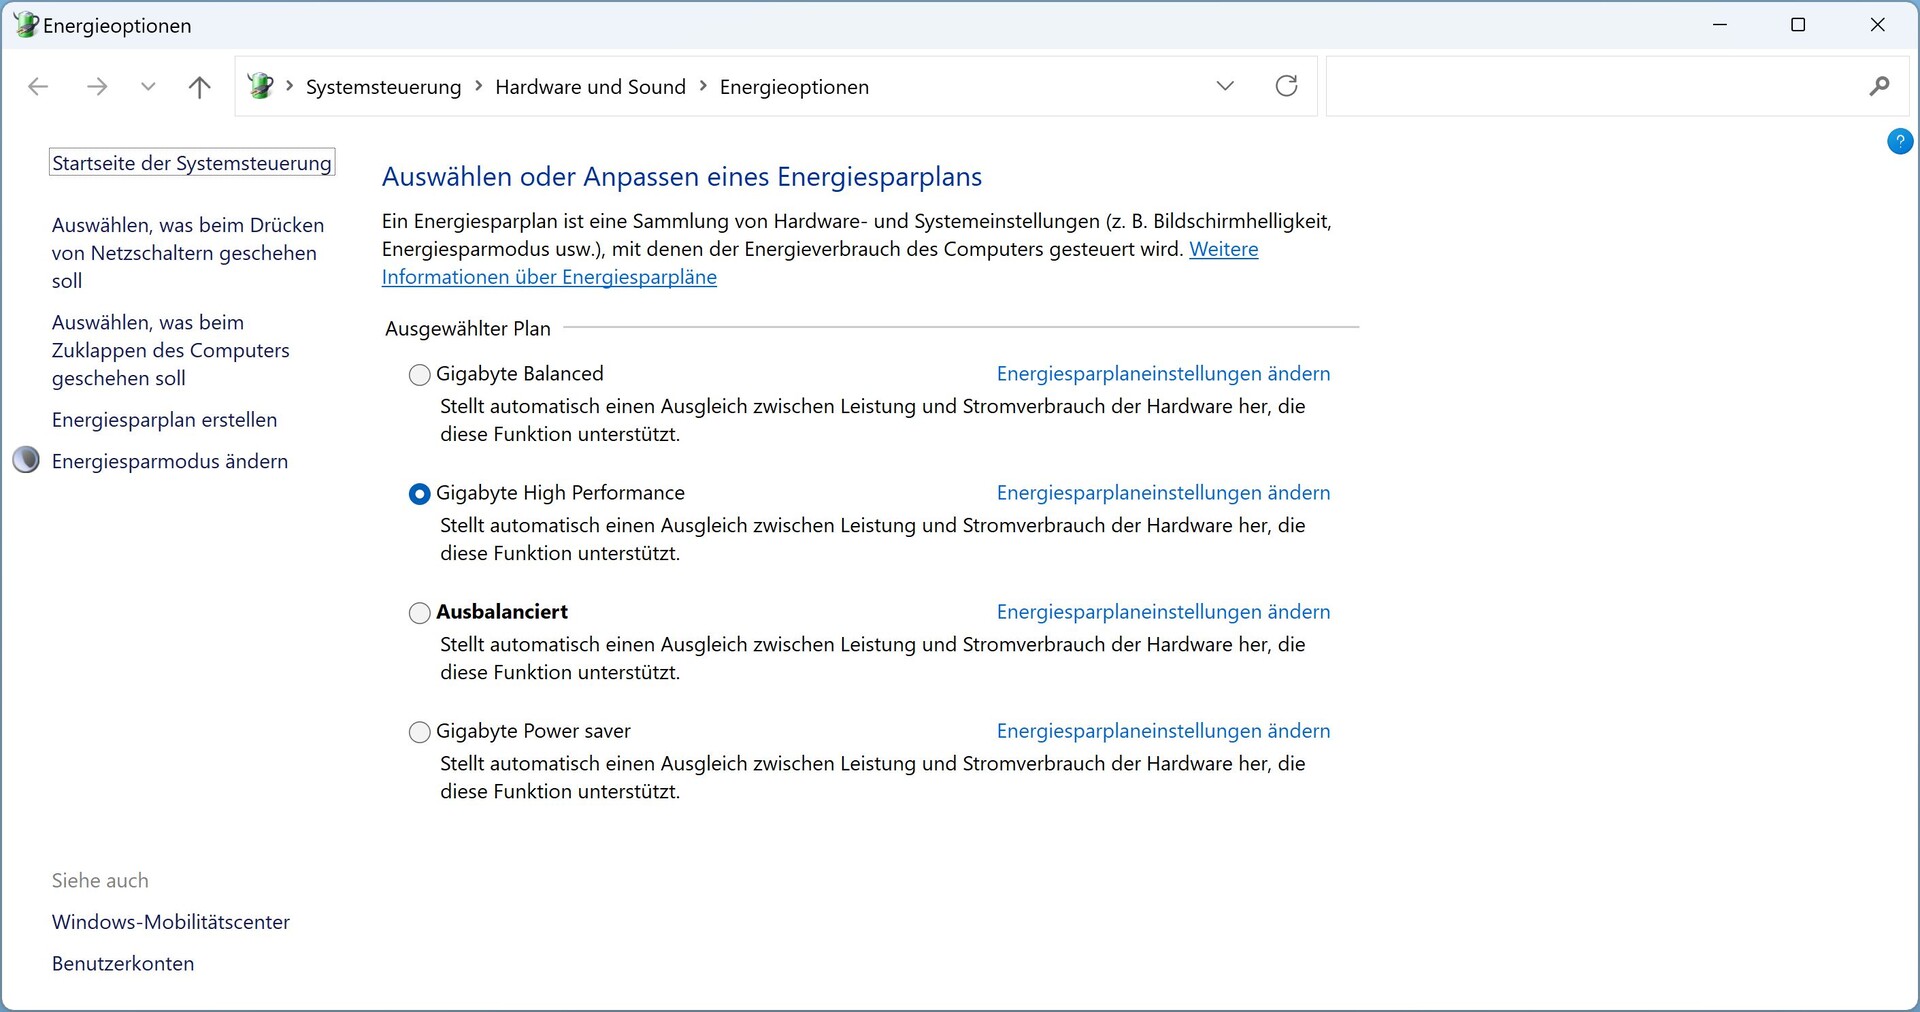
Nuestro dispositivo de pruebas no tenía un Centro de Control preinstalado, por lo que no había modos de rendimiento para empezar. Los modos de energía preinstalados en Windows por Gigabyte prácticamente no influyeron en el rendimiento de la CPU en Cinebench R15.
Por eso, y porque los ventiladores no se paraban al principio, instalamos después el Gigabyte Control Center. Aquí nos enfrentamos a la difícil elección del modo de rendimiento: hay un total de cinco aquí, y nos costó elegir entre Content Creator y Gaming. Así que tuvimos que decidir entre un buen rendimiento pero ventiladores más ruidosos, o un funcionamiento más silencioso con un rendimiento más débil.
Al final, realizamos los benchmarks de CPU sin el Centro de Control, es decir, en estado de entrega. Los benchmarks de GPU los ejecutamos en modo juego.
El software no siempre está totalmente libre de errores. Por ejemplo, sólo mostró una ventana negra durante algunos arranques. También es confuso que, además de los modos, hay otra ventana de selección "Modo de energía" con más opciones para el control de la energía. Estos probablemente representan los modos de energía, porque si se establece en Personalizado, los modos de energía de Windows se pueden seleccionar.
También hay un interruptor "AI" a la izquierda de los modos principales. El "AI" selecciona de forma independiente el mejor modo dependiendo de la situación, por ejemplo, el modo de ahorro de energía cuando desconectamos el enchufe.
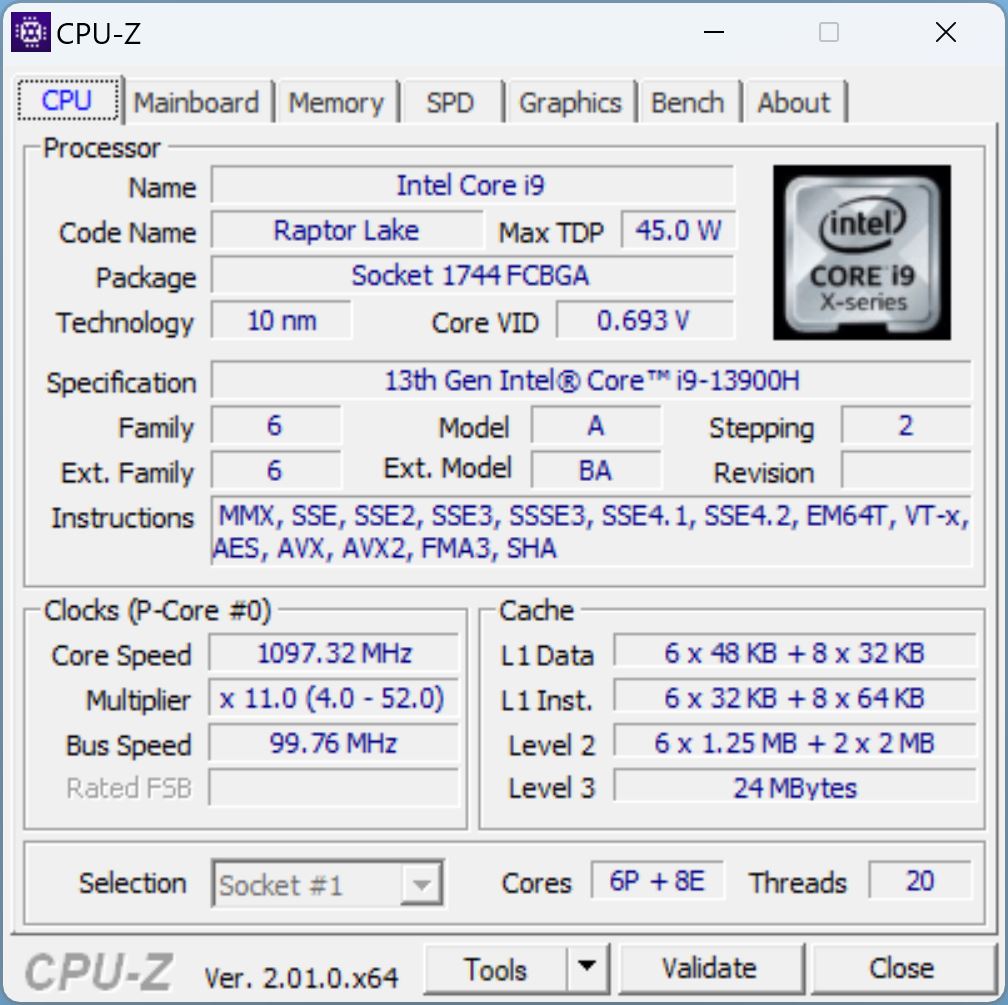
Procesador
En el corazón del Aero se encuentra unIntel Core i9-13900Huno de los buques insignia de la nueva serie Raptor Lake de Intel. Ofrece 6 núcleos de rendimiento y 8 de eficiencia, y el primero alcanza los 5,4 GHz en turbo Como alternativa, el dispositivo también está disponible con un i7-13700H.
En nuestro bucle Cinebench R15, el Aero sale mejor parado, pero la ventaja sobre eli9-12900Hde la serie Alder Lake es marginal y el predecesor apenas es más lento en todas las pruebas de CPU.
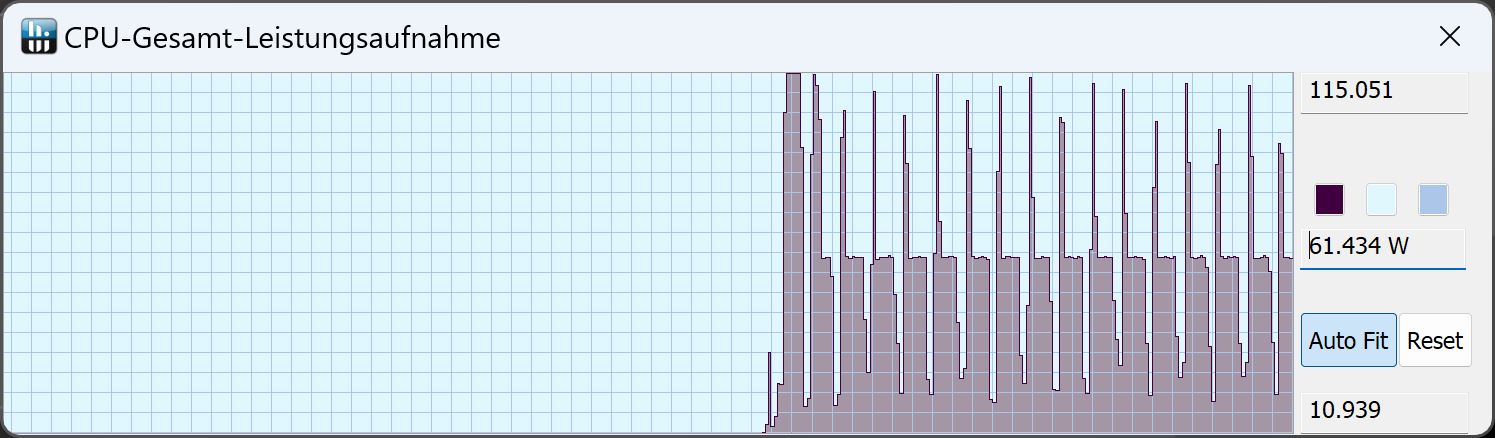
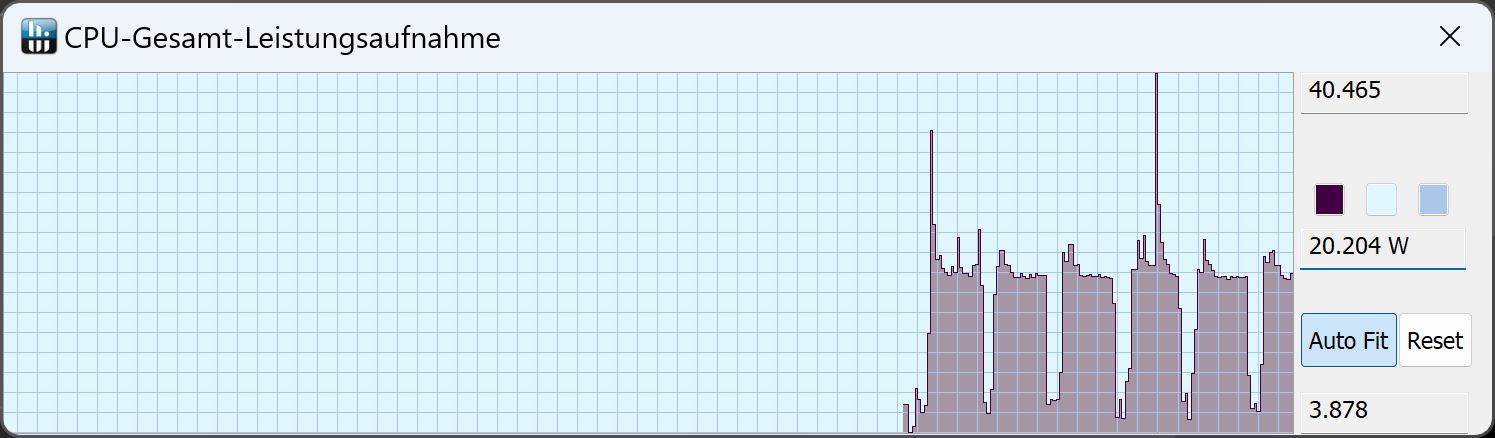
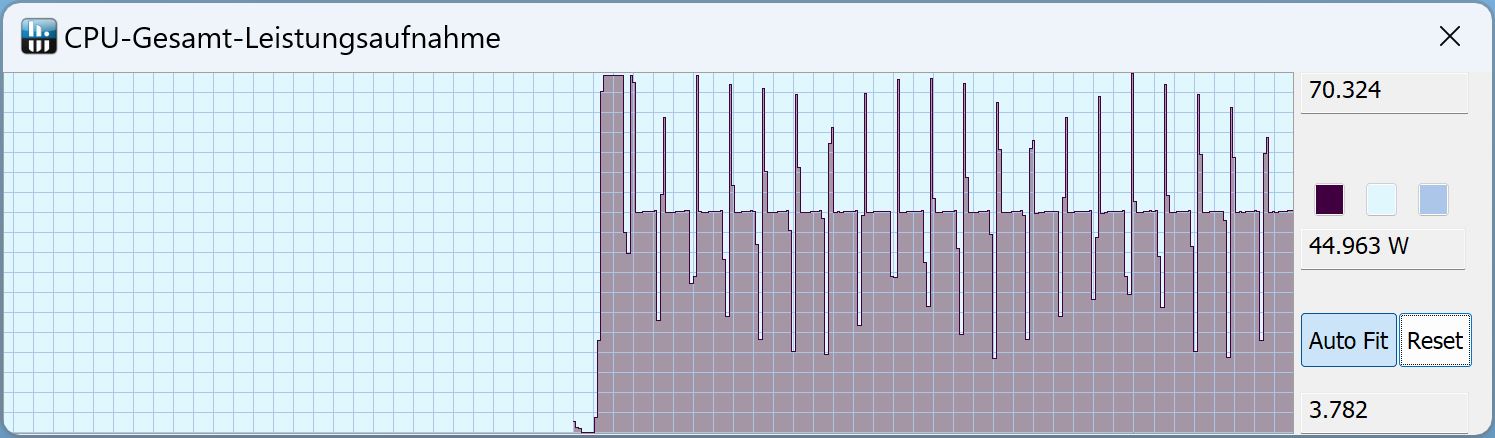
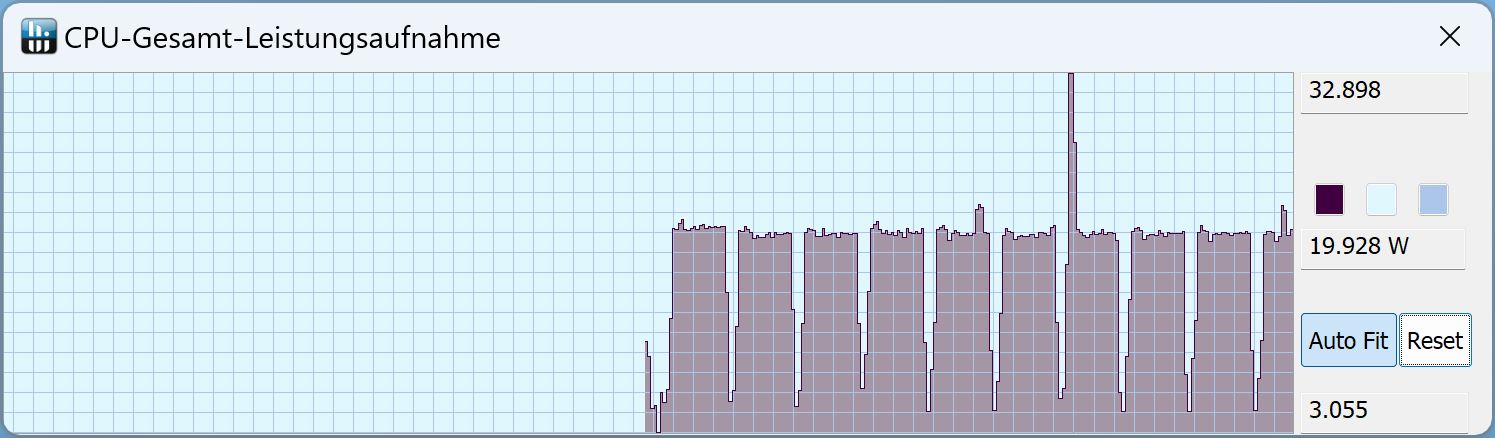
Un vistazo al consumo de energía muestra que definitivamente deberías instalar el Centro de Control. Porque en estado de entrega, la CPU sólo se trata a sí misma a 70 W durante un breve periodo de tiempo antes de caer a 45 W. Por otro lado, si cambias al Modo Juego en el Centro de Control, el TDP a corto plazo aumenta a 115 W, y luego se queda en unos 60 W durante el resto de una ejecución Cinebench. Así que depende mucho de la configuración de energía.
Sin el modo Gaming, el nuevo Aero 16 no es más rápido que su predecesor en todas las pruebas de CPU.
La CPU sólo puede consumir unos 20 W en modo batería y la puntuación de Cinebench es correspondientemente más baja.
Cinebench R15 Multi Sustained Load
Cinebench R23: Multi Core | Single Core
Cinebench R20: CPU (Multi Core) | CPU (Single Core)
Cinebench R15: CPU Multi 64Bit | CPU Single 64Bit
Blender: v2.79 BMW27 CPU
7-Zip 18.03: 7z b 4 | 7z b 4 -mmt1
Geekbench 5.5: Multi-Core | Single-Core
HWBOT x265 Benchmark v2.2: 4k Preset
LibreOffice : 20 Documents To PDF
R Benchmark 2.5: Overall mean
| CPU Performance rating | |
| Razer Blade 18 RTX 4070 | |
| Media de la clase Gaming | |
| Gigabyte Aero 16 YE5 | |
| Asus ZenBook Pro 16X OLED UX7602ZM-ME115W | |
| Medio Intel Core i9-13900H | |
| Gigabyte AERO 16 OLED BSF | |
| MSI CreatorPro Z16P B12UKST | |
| Asus TUF Gaming A16 FA617 | |
| Cinebench R23 / Multi Core | |
| Razer Blade 18 RTX 4070 | |
| Media de la clase Gaming (10488 - 42661, n=107, últimos 2 años) | |
| Gigabyte AERO 16 OLED BSF | |
| Gigabyte Aero 16 YE5 | |
| MSI CreatorPro Z16P B12UKST | |
| Medio Intel Core i9-13900H (11997 - 20385, n=28) | |
| Asus ZenBook Pro 16X OLED UX7602ZM-ME115W | |
| Asus TUF Gaming A16 FA617 | |
| Cinebench R23 / Single Core | |
| Razer Blade 18 RTX 4070 | |
| Media de la clase Gaming (1166 - 2415, n=107, últimos 2 años) | |
| Gigabyte Aero 16 YE5 | |
| Medio Intel Core i9-13900H (1297 - 2054, n=26) | |
| MSI CreatorPro Z16P B12UKST | |
| Asus ZenBook Pro 16X OLED UX7602ZM-ME115W | |
| Gigabyte AERO 16 OLED BSF | |
| Asus TUF Gaming A16 FA617 | |
| Cinebench R20 / CPU (Multi Core) | |
| Razer Blade 18 RTX 4070 | |
| Media de la clase Gaming (4029 - 16433, n=106, últimos 2 años) | |
| Gigabyte AERO 16 OLED BSF | |
| Gigabyte Aero 16 YE5 | |
| MSI CreatorPro Z16P B12UKST | |
| Medio Intel Core i9-13900H (4935 - 7716, n=25) | |
| Asus ZenBook Pro 16X OLED UX7602ZM-ME115W | |
| Asus TUF Gaming A16 FA617 | |
| Cinebench R20 / CPU (Single Core) | |
| Razer Blade 18 RTX 4070 | |
| Media de la clase Gaming (442 - 913, n=106, últimos 2 años) | |
| Medio Intel Core i9-13900H (428 - 792, n=25) | |
| Gigabyte Aero 16 YE5 | |
| Asus ZenBook Pro 16X OLED UX7602ZM-ME115W | |
| MSI CreatorPro Z16P B12UKST | |
| Gigabyte AERO 16 OLED BSF | |
| Asus TUF Gaming A16 FA617 | |
| Cinebench R15 / CPU Multi 64Bit | |
| Razer Blade 18 RTX 4070 | |
| Media de la clase Gaming (1578 - 6330, n=105, últimos 2 años) | |
| Gigabyte AERO 16 OLED BSF | |
| Gigabyte Aero 16 YE5 | |
| Medio Intel Core i9-13900H (2061 - 3100, n=26) | |
| Asus ZenBook Pro 16X OLED UX7602ZM-ME115W | |
| Asus TUF Gaming A16 FA617 | |
| MSI CreatorPro Z16P B12UKST | |
| Cinebench R15 / CPU Single 64Bit | |
| Razer Blade 18 RTX 4070 | |
| Media de la clase Gaming (188.8 - 350, n=106, últimos 2 años) | |
| Gigabyte Aero 16 YE5 | |
| Medio Intel Core i9-13900H (211 - 297, n=26) | |
| Asus ZenBook Pro 16X OLED UX7602ZM-ME115W | |
| Asus ZenBook Pro 16X OLED UX7602ZM-ME115W | |
| Asus TUF Gaming A16 FA617 | |
| Gigabyte AERO 16 OLED BSF | |
| MSI CreatorPro Z16P B12UKST | |
| Blender / v2.79 BMW27 CPU | |
| Asus TUF Gaming A16 FA617 | |
| Medio Intel Core i9-13900H (166 - 268, n=24) | |
| MSI CreatorPro Z16P B12UKST | |
| Gigabyte Aero 16 YE5 | |
| Asus ZenBook Pro 16X OLED UX7602ZM-ME115W | |
| Gigabyte AERO 16 OLED BSF | |
| Media de la clase Gaming (79 - 330, n=104, últimos 2 años) | |
| Razer Blade 18 RTX 4070 | |
| 7-Zip 18.03 / 7z b 4 | |
| Razer Blade 18 RTX 4070 | |
| Media de la clase Gaming (33491 - 148086, n=105, últimos 2 años) | |
| Gigabyte AERO 16 OLED BSF | |
| Asus ZenBook Pro 16X OLED UX7602ZM-ME115W | |
| Gigabyte Aero 16 YE5 | |
| MSI CreatorPro Z16P B12UKST | |
| Medio Intel Core i9-13900H (45045 - 79032, n=25) | |
| Asus TUF Gaming A16 FA617 | |
| 7-Zip 18.03 / 7z b 4 -mmt1 | |
| Razer Blade 18 RTX 4070 | |
| Media de la clase Gaming (4199 - 7436, n=105, últimos 2 años) | |
| Gigabyte Aero 16 YE5 | |
| Medio Intel Core i9-13900H (3665 - 6600, n=25) | |
| Asus ZenBook Pro 16X OLED UX7602ZM-ME115W | |
| Asus TUF Gaming A16 FA617 | |
| MSI CreatorPro Z16P B12UKST | |
| Gigabyte AERO 16 OLED BSF | |
| Geekbench 5.5 / Multi-Core | |
| Razer Blade 18 RTX 4070 | |
| Media de la clase Gaming (6460 - 28263, n=105, últimos 2 años) | |
| Gigabyte Aero 16 YE5 | |
| Gigabyte AERO 16 OLED BSF | |
| Asus ZenBook Pro 16X OLED UX7602ZM-ME115W | |
| Medio Intel Core i9-13900H (9094 - 15410, n=26) | |
| MSI CreatorPro Z16P B12UKST | |
| Asus TUF Gaming A16 FA617 | |
| Geekbench 5.5 / Single-Core | |
| Media de la clase Gaming (986 - 2474, n=105, últimos 2 años) | |
| Razer Blade 18 RTX 4070 | |
| Medio Intel Core i9-13900H (1140 - 2043, n=26) | |
| Gigabyte Aero 16 YE5 | |
| Asus ZenBook Pro 16X OLED UX7602ZM-ME115W | |
| MSI CreatorPro Z16P B12UKST | |
| Gigabyte AERO 16 OLED BSF | |
| Asus TUF Gaming A16 FA617 | |
| HWBOT x265 Benchmark v2.2 / 4k Preset | |
| Razer Blade 18 RTX 4070 | |
| Media de la clase Gaming (11.5 - 44.4, n=105, últimos 2 años) | |
| Gigabyte AERO 16 OLED BSF | |
| MSI CreatorPro Z16P B12UKST | |
| Asus ZenBook Pro 16X OLED UX7602ZM-ME115W | |
| Medio Intel Core i9-13900H (14.1 - 22.3, n=25) | |
| Gigabyte Aero 16 YE5 | |
| Asus TUF Gaming A16 FA617 | |
| LibreOffice / 20 Documents To PDF | |
| Asus TUF Gaming A16 FA617 | |
| Gigabyte AERO 16 OLED BSF | |
| Media de la clase Gaming (33.2 - 88.8, n=105, últimos 2 años) | |
| Medio Intel Core i9-13900H (34.4 - 82.8, n=25) | |
| Razer Blade 18 RTX 4070 | |
| Asus ZenBook Pro 16X OLED UX7602ZM-ME115W | |
| Gigabyte Aero 16 YE5 | |
| MSI CreatorPro Z16P B12UKST | |
| R Benchmark 2.5 / Overall mean | |
| Asus TUF Gaming A16 FA617 | |
| Gigabyte AERO 16 OLED BSF | |
| MSI CreatorPro Z16P B12UKST | |
| Medio Intel Core i9-13900H (0.4052 - 0.723, n=25) | |
| Asus ZenBook Pro 16X OLED UX7602ZM-ME115W | |
| Media de la clase Gaming (0.3439 - 0.759, n=106, últimos 2 años) | |
| Gigabyte Aero 16 YE5 | |
| Razer Blade 18 RTX 4070 | |
* ... más pequeño es mejor
AIDA64: FP32 Ray-Trace | FPU Julia | CPU SHA3 | CPU Queen | FPU SinJulia | FPU Mandel | CPU AES | CPU ZLib | FP64 Ray-Trace | CPU PhotoWorxx
| Performance rating | |
| Razer Blade 18 RTX 4070 | |
| Media de la clase Gaming | |
| Gigabyte AERO 16 OLED BSF | |
| MSI CreatorPro Z16P B12UKST | |
| Asus TUF Gaming A16 FA617 | |
| Asus ZenBook Pro 16X OLED UX7602ZM-ME115W | |
| Medio Intel Core i9-13900H | |
| Gigabyte Aero 16 YE5 | |
| AIDA64 / FP32 Ray-Trace | |
| Media de la clase Gaming (10227 - 85542, n=105, últimos 2 años) | |
| Razer Blade 18 RTX 4070 | |
| Gigabyte AERO 16 OLED BSF | |
| Asus TUF Gaming A16 FA617 | |
| Medio Intel Core i9-13900H (6788 - 19557, n=25) | |
| MSI CreatorPro Z16P B12UKST | |
| Asus ZenBook Pro 16X OLED UX7602ZM-ME115W | |
| Gigabyte Aero 16 YE5 | |
| AIDA64 / FPU Julia | |
| Media de la clase Gaming (51376 - 238426, n=105, últimos 2 años) | |
| Razer Blade 18 RTX 4070 | |
| Asus TUF Gaming A16 FA617 | |
| Gigabyte AERO 16 OLED BSF | |
| Medio Intel Core i9-13900H (22551 - 95579, n=25) | |
| Asus ZenBook Pro 16X OLED UX7602ZM-ME115W | |
| MSI CreatorPro Z16P B12UKST | |
| Gigabyte Aero 16 YE5 | |
| AIDA64 / CPU SHA3 | |
| Media de la clase Gaming (2180 - 10115, n=105, últimos 2 años) | |
| Razer Blade 18 RTX 4070 | |
| Gigabyte AERO 16 OLED BSF | |
| Asus ZenBook Pro 16X OLED UX7602ZM-ME115W | |
| MSI CreatorPro Z16P B12UKST | |
| Medio Intel Core i9-13900H (2491 - 4270, n=25) | |
| Asus TUF Gaming A16 FA617 | |
| Gigabyte Aero 16 YE5 | |
| AIDA64 / CPU Queen | |
| Razer Blade 18 RTX 4070 | |
| Media de la clase Gaming (49785 - 173351, n=90, últimos 2 años) | |
| Asus ZenBook Pro 16X OLED UX7602ZM-ME115W | |
| Gigabyte Aero 16 YE5 | |
| Medio Intel Core i9-13900H (65121 - 120936, n=25) | |
| Asus TUF Gaming A16 FA617 | |
| MSI CreatorPro Z16P B12UKST | |
| Gigabyte AERO 16 OLED BSF | |
| AIDA64 / FPU SinJulia | |
| Razer Blade 18 RTX 4070 | |
| Media de la clase Gaming (4424 - 33636, n=105, últimos 2 años) | |
| Asus TUF Gaming A16 FA617 | |
| Gigabyte AERO 16 OLED BSF | |
| Asus ZenBook Pro 16X OLED UX7602ZM-ME115W | |
| Medio Intel Core i9-13900H (6108 - 11631, n=25) | |
| Gigabyte Aero 16 YE5 | |
| MSI CreatorPro Z16P B12UKST | |
| AIDA64 / FPU Mandel | |
| Media de la clase Gaming (25115 - 128721, n=105, últimos 2 años) | |
| Razer Blade 18 RTX 4070 | |
| Asus TUF Gaming A16 FA617 | |
| Gigabyte AERO 16 OLED BSF | |
| Medio Intel Core i9-13900H (11283 - 48474, n=25) | |
| Asus ZenBook Pro 16X OLED UX7602ZM-ME115W | |
| MSI CreatorPro Z16P B12UKST | |
| Gigabyte Aero 16 YE5 | |
| AIDA64 / CPU AES | |
| Gigabyte AERO 16 OLED BSF | |
| MSI CreatorPro Z16P B12UKST | |
| Razer Blade 18 RTX 4070 | |
| Media de la clase Gaming (39258 - 247074, n=105, últimos 2 años) | |
| Gigabyte Aero 16 YE5 | |
| Medio Intel Core i9-13900H (3691 - 149377, n=25) | |
| Asus ZenBook Pro 16X OLED UX7602ZM-ME115W | |
| Asus TUF Gaming A16 FA617 | |
| AIDA64 / CPU ZLib | |
| Razer Blade 18 RTX 4070 | |
| Media de la clase Gaming (574 - 2531, n=105, últimos 2 años) | |
| Gigabyte AERO 16 OLED BSF | |
| Medio Intel Core i9-13900H (789 - 1254, n=25) | |
| Asus ZenBook Pro 16X OLED UX7602ZM-ME115W | |
| MSI CreatorPro Z16P B12UKST | |
| Gigabyte Aero 16 YE5 | |
| Asus TUF Gaming A16 FA617 | |
| AIDA64 / FP64 Ray-Trace | |
| Media de la clase Gaming (5509 - 45446, n=105, últimos 2 años) | |
| Razer Blade 18 RTX 4070 | |
| Gigabyte AERO 16 OLED BSF | |
| Asus TUF Gaming A16 FA617 | |
| Medio Intel Core i9-13900H (3655 - 10716, n=25) | |
| Asus ZenBook Pro 16X OLED UX7602ZM-ME115W | |
| MSI CreatorPro Z16P B12UKST | |
| Gigabyte Aero 16 YE5 | |
| AIDA64 / CPU PhotoWorxx | |
| Razer Blade 18 RTX 4070 | |
| Asus ZenBook Pro 16X OLED UX7602ZM-ME115W | |
| Media de la clase Gaming (12271 - 89891, n=105, últimos 2 años) | |
| Gigabyte AERO 16 OLED BSF | |
| MSI CreatorPro Z16P B12UKST | |
| Medio Intel Core i9-13900H (10871 - 50488, n=25) | |
| Gigabyte Aero 16 YE5 | |
| Asus TUF Gaming A16 FA617 | |
Rendimiento del sistema
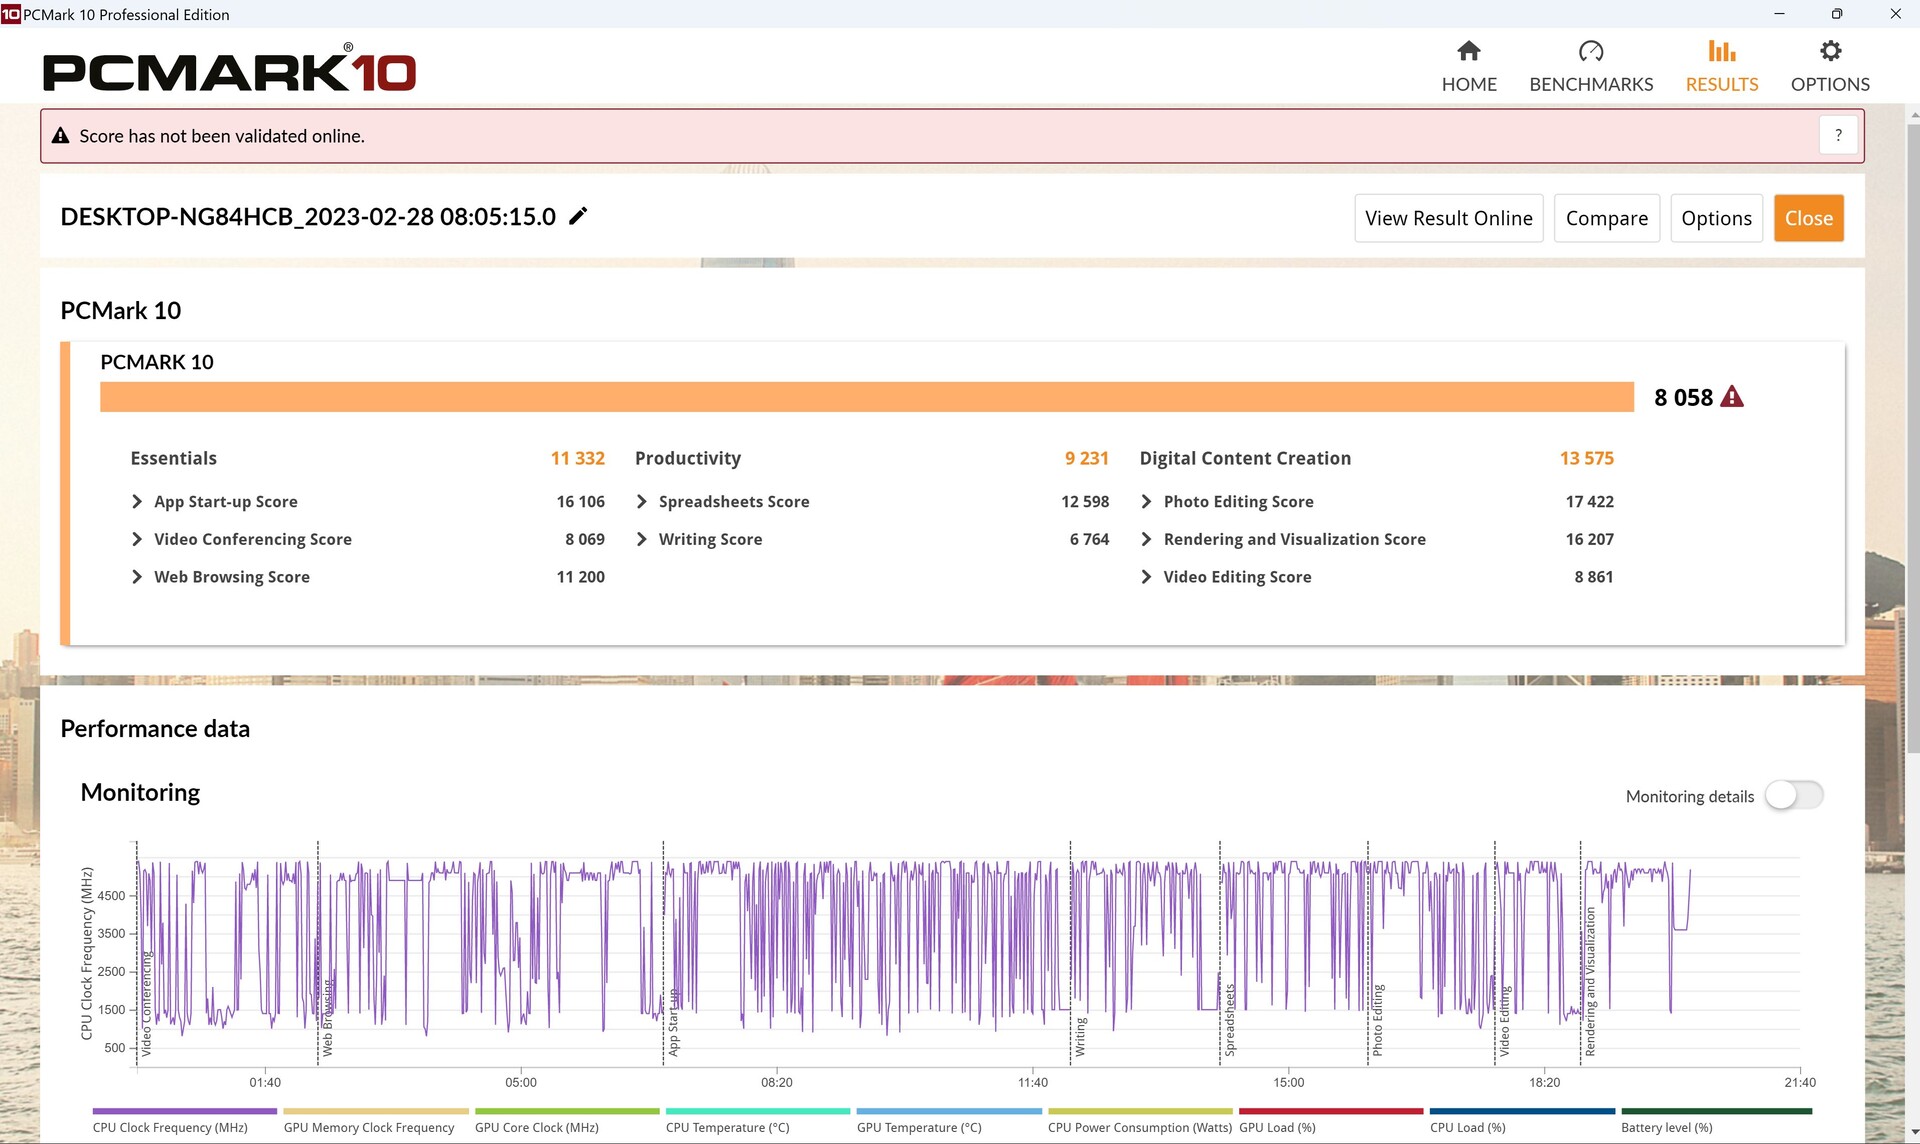
En PCMark 10, nuestro Aero intercambia golpes con elMSI CreatorPro Z16P del año pasadodesafortunadamente, el Aero tiene una puntuación de productividad débil, pero lo hace muy bien en las otras subpruebas.
CrossMark: Overall | Productivity | Creativity | Responsiveness
| PCMark 10 / Score | |
| Media de la clase Gaming (5828 - 12414, n=93, últimos 2 años) | |
| Gigabyte AERO 16 OLED BSF | |
| Gigabyte Aero 16 YE5 | |
| Medio Intel Core i9-13900H, NVIDIA GeForce RTX 4070 Laptop GPU (5855 - 8538, n=8) | |
| Razer Blade 18 RTX 4070 | |
| Asus ZenBook Pro 16X OLED UX7602ZM-ME115W | |
| Asus TUF Gaming A16 FA617 | |
| MSI CreatorPro Z16P B12UKST | |
| PCMark 10 / Essentials | |
| Razer Blade 18 RTX 4070 | |
| Gigabyte AERO 16 OLED BSF | |
| Asus ZenBook Pro 16X OLED UX7602ZM-ME115W | |
| Gigabyte Aero 16 YE5 | |
| Medio Intel Core i9-13900H, NVIDIA GeForce RTX 4070 Laptop GPU (8835 - 11940, n=8) | |
| Media de la clase Gaming (8810 - 11935, n=97, últimos 2 años) | |
| Asus TUF Gaming A16 FA617 | |
| MSI CreatorPro Z16P B12UKST | |
| PCMark 10 / Productivity | |
| Media de la clase Gaming (6845 - 25323, n=95, últimos 2 años) | |
| Asus ZenBook Pro 16X OLED UX7602ZM-ME115W | |
| Gigabyte Aero 16 YE5 | |
| Medio Intel Core i9-13900H, NVIDIA GeForce RTX 4070 Laptop GPU (7967 - 10991, n=8) | |
| Razer Blade 18 RTX 4070 | |
| MSI CreatorPro Z16P B12UKST | |
| Asus TUF Gaming A16 FA617 | |
| Gigabyte AERO 16 OLED BSF | |
| PCMark 10 / Digital Content Creation | |
| Media de la clase Gaming (7602 - 19954, n=95, últimos 2 años) | |
| Gigabyte AERO 16 OLED BSF | |
| Gigabyte Aero 16 YE5 | |
| Medio Intel Core i9-13900H, NVIDIA GeForce RTX 4070 Laptop GPU (7738 - 13575, n=8) | |
| Asus TUF Gaming A16 FA617 | |
| Razer Blade 18 RTX 4070 | |
| Asus ZenBook Pro 16X OLED UX7602ZM-ME115W | |
| MSI CreatorPro Z16P B12UKST | |
| CrossMark / Overall | |
| Razer Blade 18 RTX 4070 | |
| Gigabyte Aero 16 YE5 | |
| Media de la clase Gaming (1366 - 2409, n=94, últimos 2 años) | |
| MSI CreatorPro Z16P B12UKST | |
| Gigabyte AERO 16 OLED BSF | |
| Medio Intel Core i9-13900H, NVIDIA GeForce RTX 4070 Laptop GPU (1104 - 1974, n=7) | |
| Asus ZenBook Pro 16X OLED UX7602ZM-ME115W | |
| CrossMark / Productivity | |
| Gigabyte Aero 16 YE5 | |
| Razer Blade 18 RTX 4070 | |
| Media de la clase Gaming (1386 - 2254, n=94, últimos 2 años) | |
| MSI CreatorPro Z16P B12UKST | |
| Gigabyte AERO 16 OLED BSF | |
| Medio Intel Core i9-13900H, NVIDIA GeForce RTX 4070 Laptop GPU (1058 - 1914, n=7) | |
| Asus ZenBook Pro 16X OLED UX7602ZM-ME115W | |
| CrossMark / Creativity | |
| Razer Blade 18 RTX 4070 | |
| Media de la clase Gaming (1343 - 2786, n=94, últimos 2 años) | |
| Gigabyte Aero 16 YE5 | |
| MSI CreatorPro Z16P B12UKST | |
| Asus ZenBook Pro 16X OLED UX7602ZM-ME115W | |
| Medio Intel Core i9-13900H, NVIDIA GeForce RTX 4070 Laptop GPU (1178 - 2254, n=7) | |
| Gigabyte AERO 16 OLED BSF | |
| CrossMark / Responsiveness | |
| Gigabyte Aero 16 YE5 | |
| Gigabyte AERO 16 OLED BSF | |
| Razer Blade 18 RTX 4070 | |
| MSI CreatorPro Z16P B12UKST | |
| Media de la clase Gaming (1226 - 2334, n=94, últimos 2 años) | |
| Medio Intel Core i9-13900H, NVIDIA GeForce RTX 4070 Laptop GPU (1037 - 1952, n=7) | |
| Asus ZenBook Pro 16X OLED UX7602ZM-ME115W | |
| PCMark 10 Score | 8058 puntos | |
ayuda | ||
| AIDA64 / Memory Copy | |
| Media de la clase Gaming (21750 - 129946, n=105, últimos 2 años) | |
| Asus ZenBook Pro 16X OLED UX7602ZM-ME115W | |
| Gigabyte AERO 16 OLED BSF | |
| MSI CreatorPro Z16P B12UKST | |
| Gigabyte Aero 16 YE5 | |
| Medio Intel Core i9-13900H (37448 - 74486, n=25) | |
| MSI Katana 17 B13VFK | |
| Asus TUF Gaming A16 FA617 | |
| AIDA64 / Memory Read | |
| Media de la clase Gaming (22956 - 118858, n=105, últimos 2 años) | |
| Asus ZenBook Pro 16X OLED UX7602ZM-ME115W | |
| Gigabyte AERO 16 OLED BSF | |
| Gigabyte Aero 16 YE5 | |
| MSI CreatorPro Z16P B12UKST | |
| Medio Intel Core i9-13900H (41599 - 75433, n=25) | |
| MSI Katana 17 B13VFK | |
| Asus TUF Gaming A16 FA617 | |
| AIDA64 / Memory Write | |
| Media de la clase Gaming (22297 - 135096, n=105, últimos 2 años) | |
| Gigabyte AERO 16 OLED BSF | |
| MSI CreatorPro Z16P B12UKST | |
| Medio Intel Core i9-13900H (36152 - 88505, n=25) | |
| Asus ZenBook Pro 16X OLED UX7602ZM-ME115W | |
| Gigabyte Aero 16 YE5 | |
| Asus TUF Gaming A16 FA617 | |
| MSI Katana 17 B13VFK | |
| AIDA64 / Memory Latency | |
| Asus ZenBook Pro 16X OLED UX7602ZM-ME115W | |
| Media de la clase Gaming (75.3 - 259, n=105, últimos 2 años) | |
| MSI Katana 17 B13VFK | |
| MSI CreatorPro Z16P B12UKST | |
| Gigabyte AERO 16 OLED BSF | |
| Gigabyte Aero 16 YE5 | |
| Medio Intel Core i9-13900H (75.8 - 102.3, n=25) | |
| Asus TUF Gaming A16 FA617 | |
* ... más pequeño es mejor
Latencia del CPD
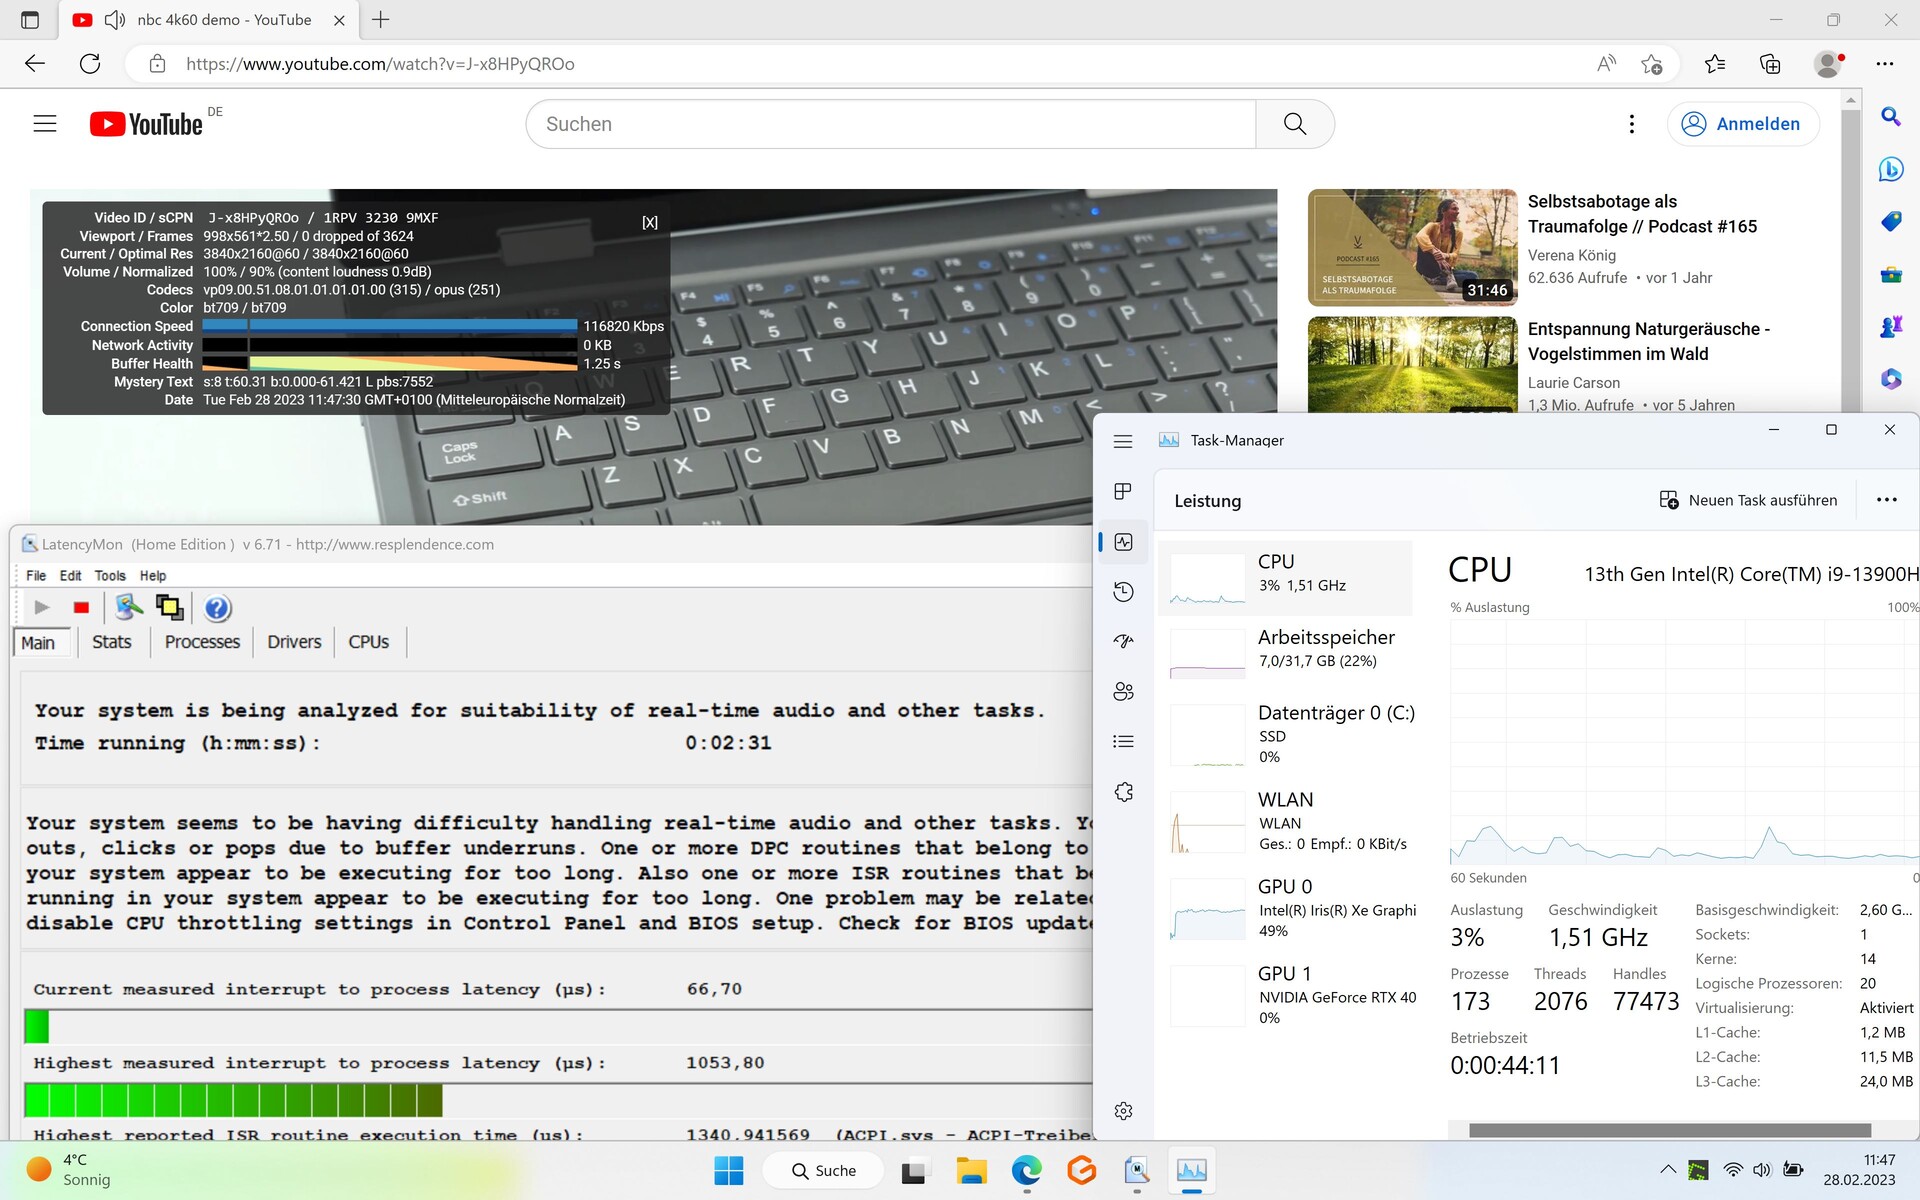
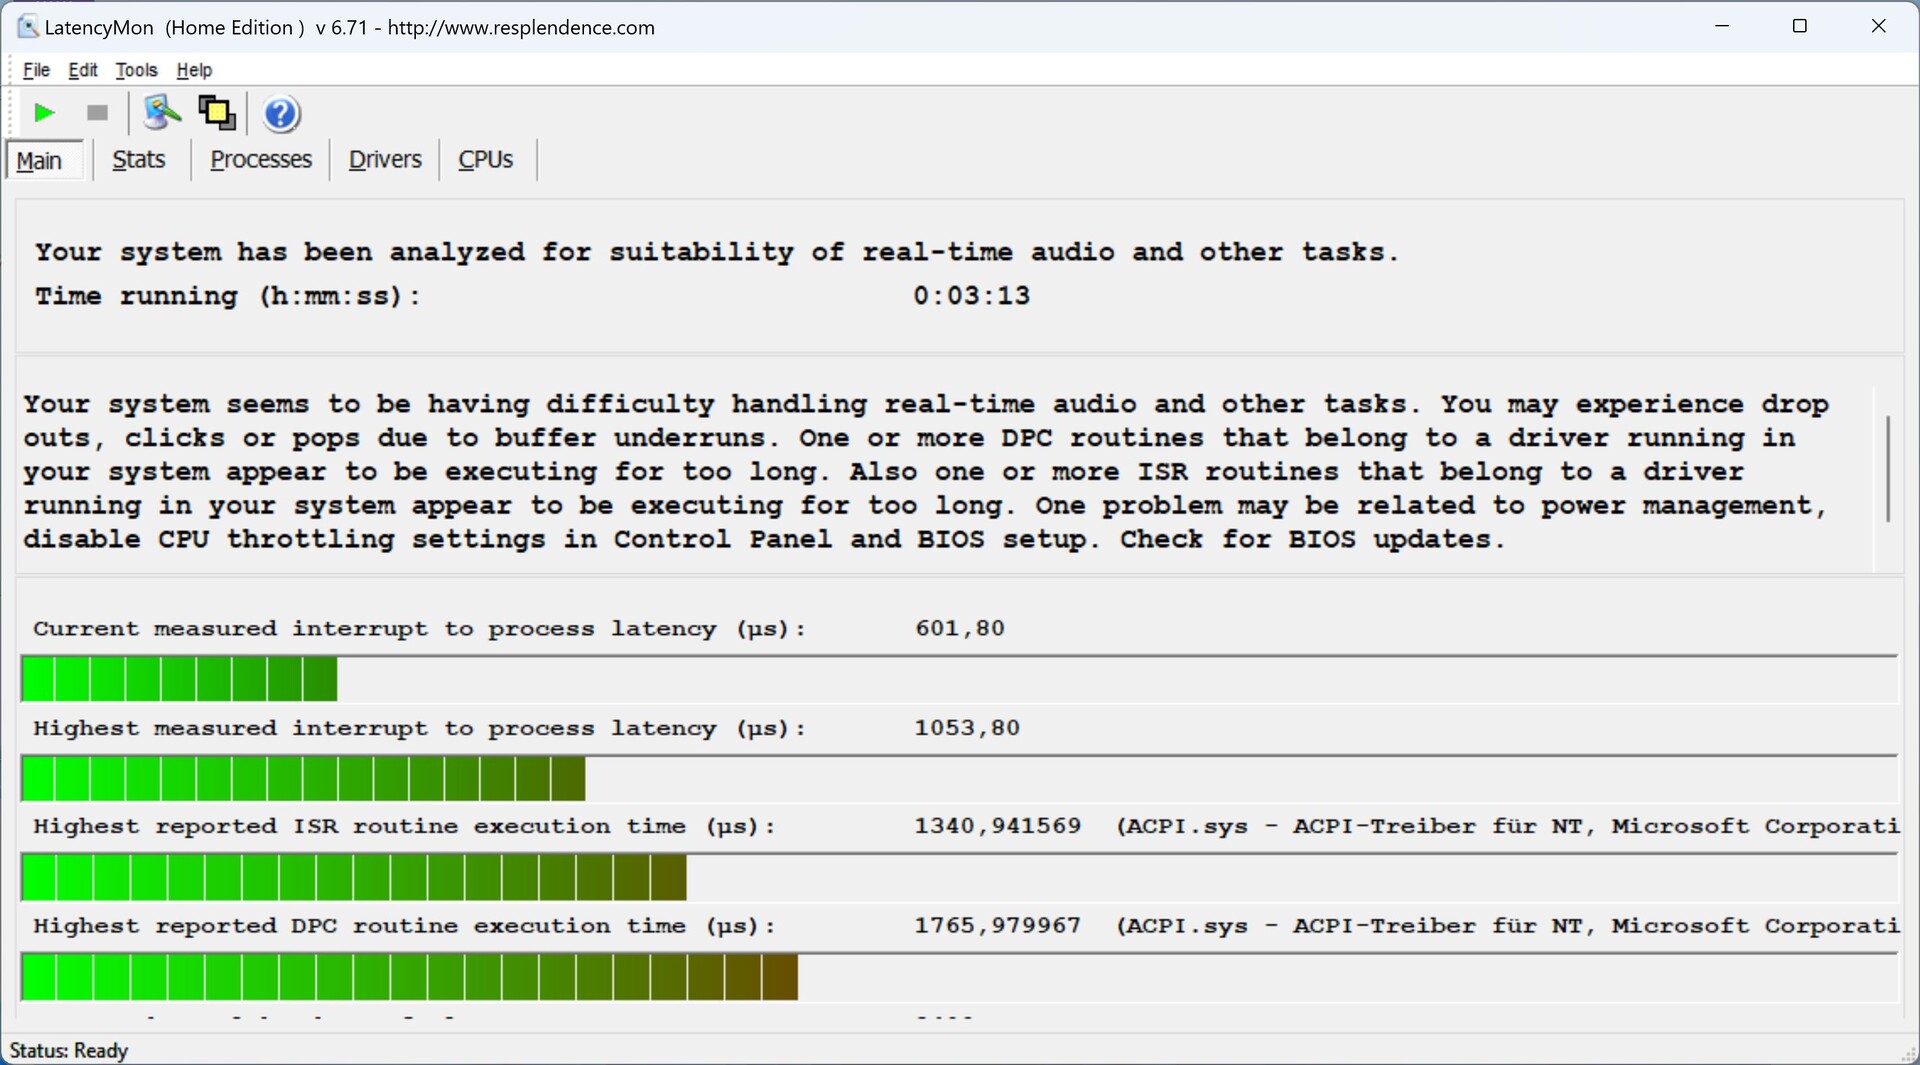
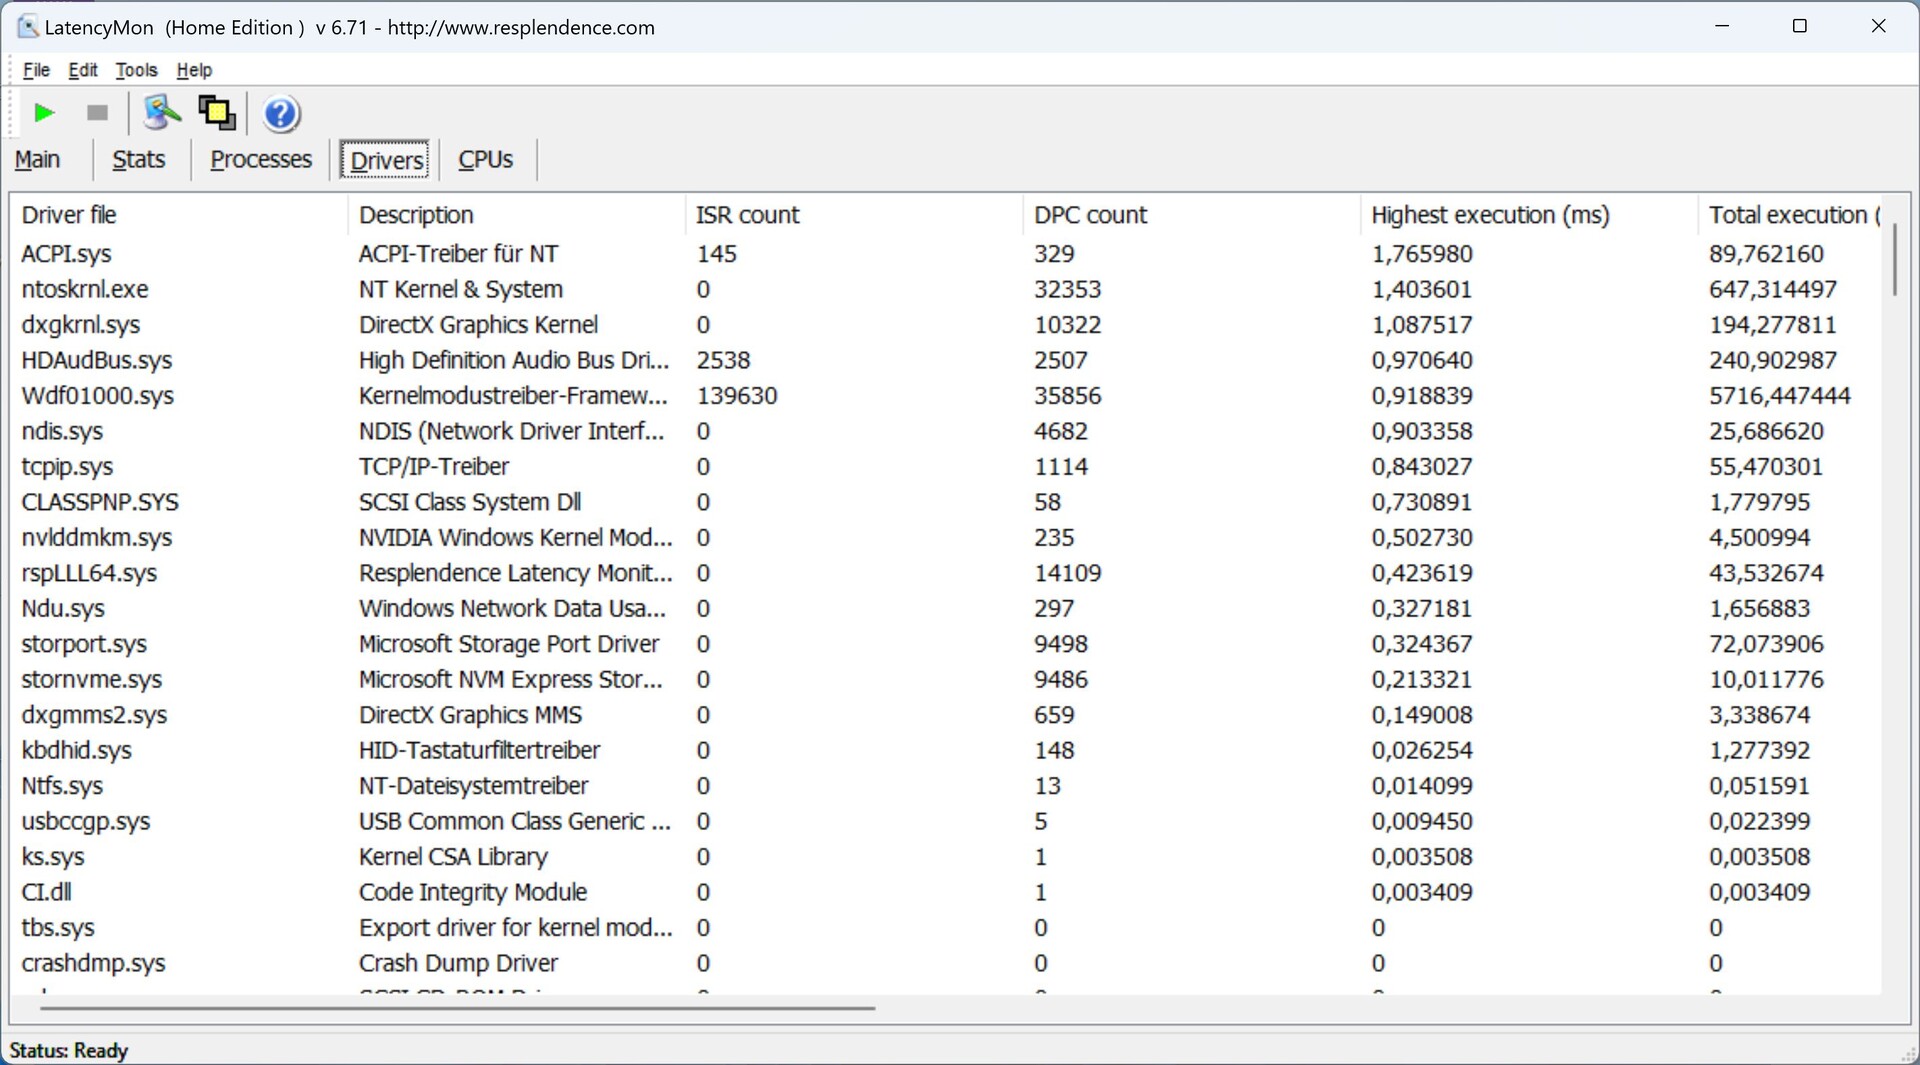
Poco después de iniciar LatencyMon, el software detecta las primeras latencias del CPD. Estas aumentan aún más al iniciar el navegador y abrir varias pestañas. Nuestro vídeo YouTube 4K/60 fps, por otro lado, se renderiza con fluidez y sin saltos de frames.
El Razer Blade 18 tiene valores de latencia aún peores que nuestro Aero
.
| DPC Latencies / LatencyMon - interrupt to process latency (max), Web, Youtube, Prime95 | |
| Razer Blade 18 RTX 4070 | |
| Gigabyte AERO 16 OLED BSF | |
| Gigabyte Aero 16 YE5 | |
| MSI CreatorPro Z16P B12UKST | |
| Asus ZenBook Pro 16X OLED UX7602ZM-ME115W | |
| Asus TUF Gaming A16 FA617 | |
* ... más pequeño es mejor
Dispositivo de almacenamiento
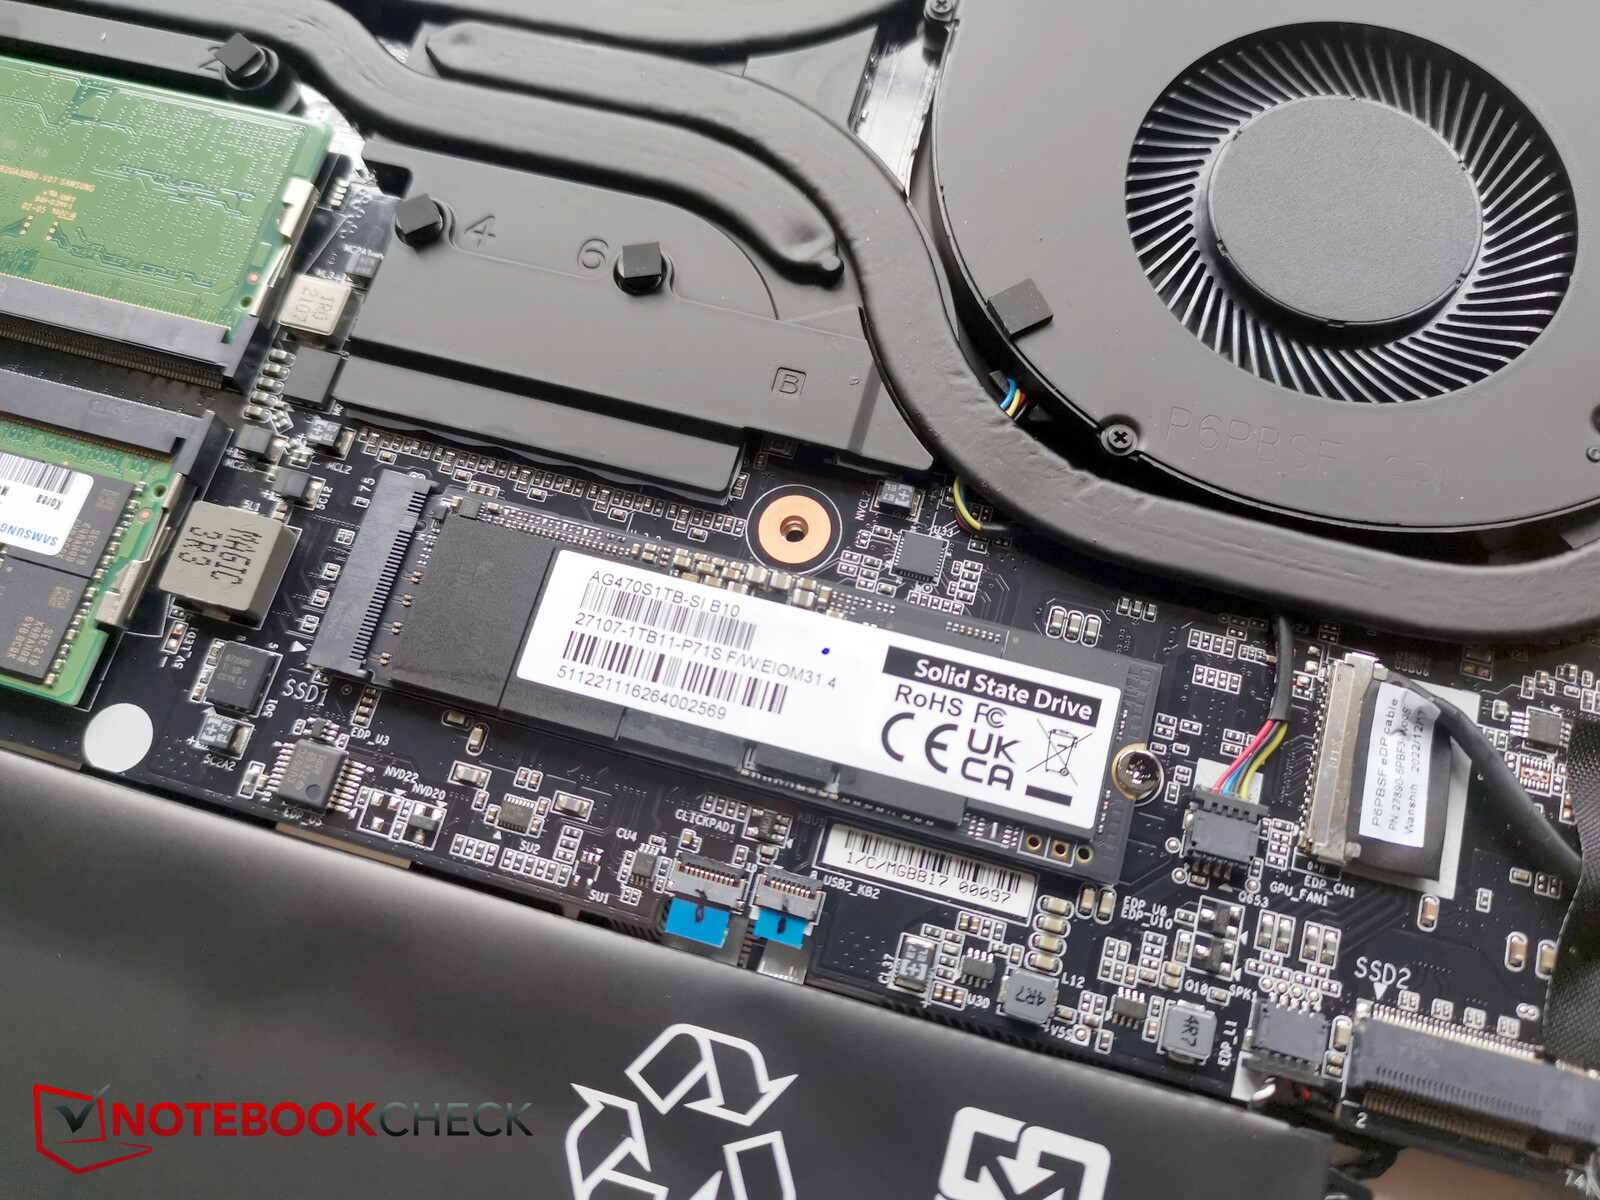
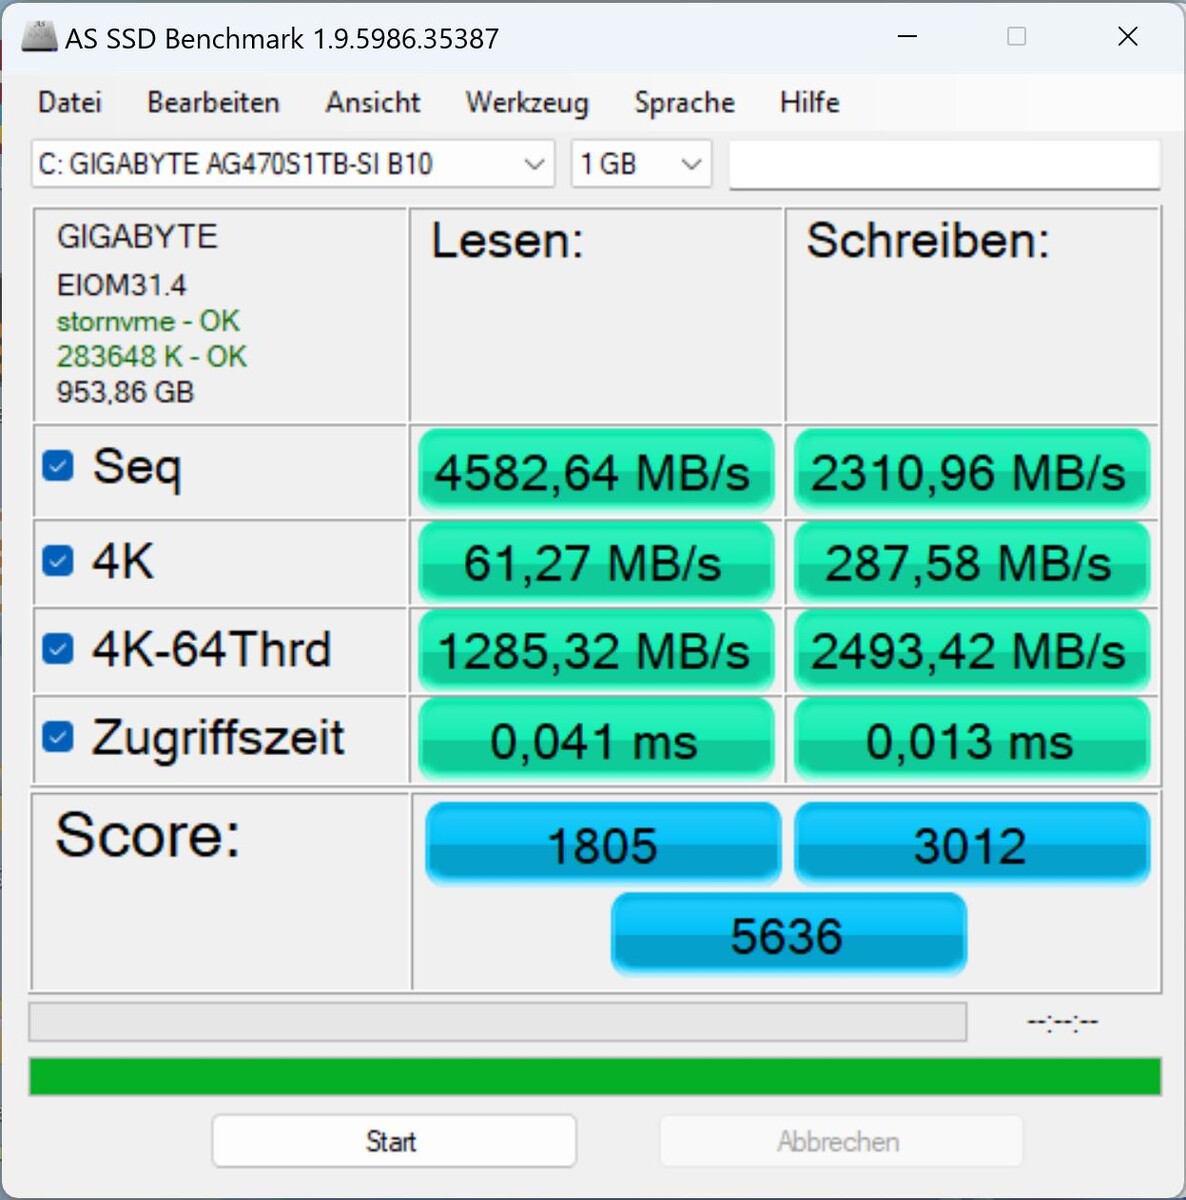
El fabricante utiliza una unidad SSD PCIe Gen4 NVMe muy rápida de su propia empresa. Actualmente ocupa el segundo puesto en nuestra lista de los mejores de Laptop SSD & HDD Benchmarks .
El modelo aquí no alcanza su mejor rendimiento, especialmente dado que la memoria Phison del predecesor (puesto 1) es un poco más rápida.
Al menos el rendimiento es relativamente constante, y es bueno que haya un panel de refrigeración en la placa base.

* ... más pequeño es mejor
Sustained Read Performance: DiskSpd Read Loop, Queue Depth 8
Tarjeta gráfica
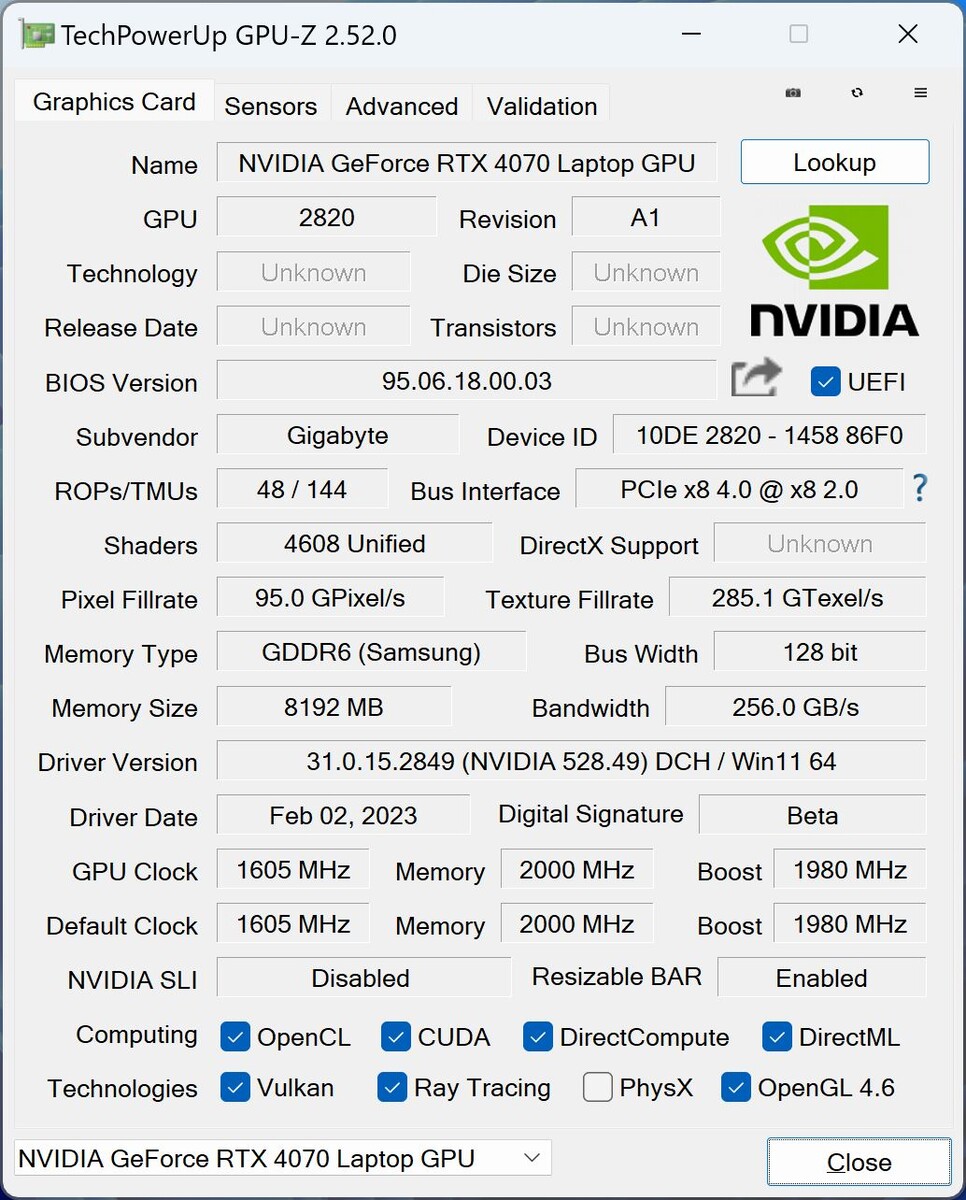
En cuanto a la GPU, puede elegir entre laRTX 4060 y RTX 4070la variante más potente está instalada en nuestra unidad de pruebas. En el Aero delgado, normalmente consume unos 105 W. El máximo es 115 más 25 W de Dynamic Boost, pero nuestro colega Andreas señaló recientemente en su análisis de la tarjeta que apenas se producen aumentos de rendimiento por encima de los 100 W para la RTX 4070.
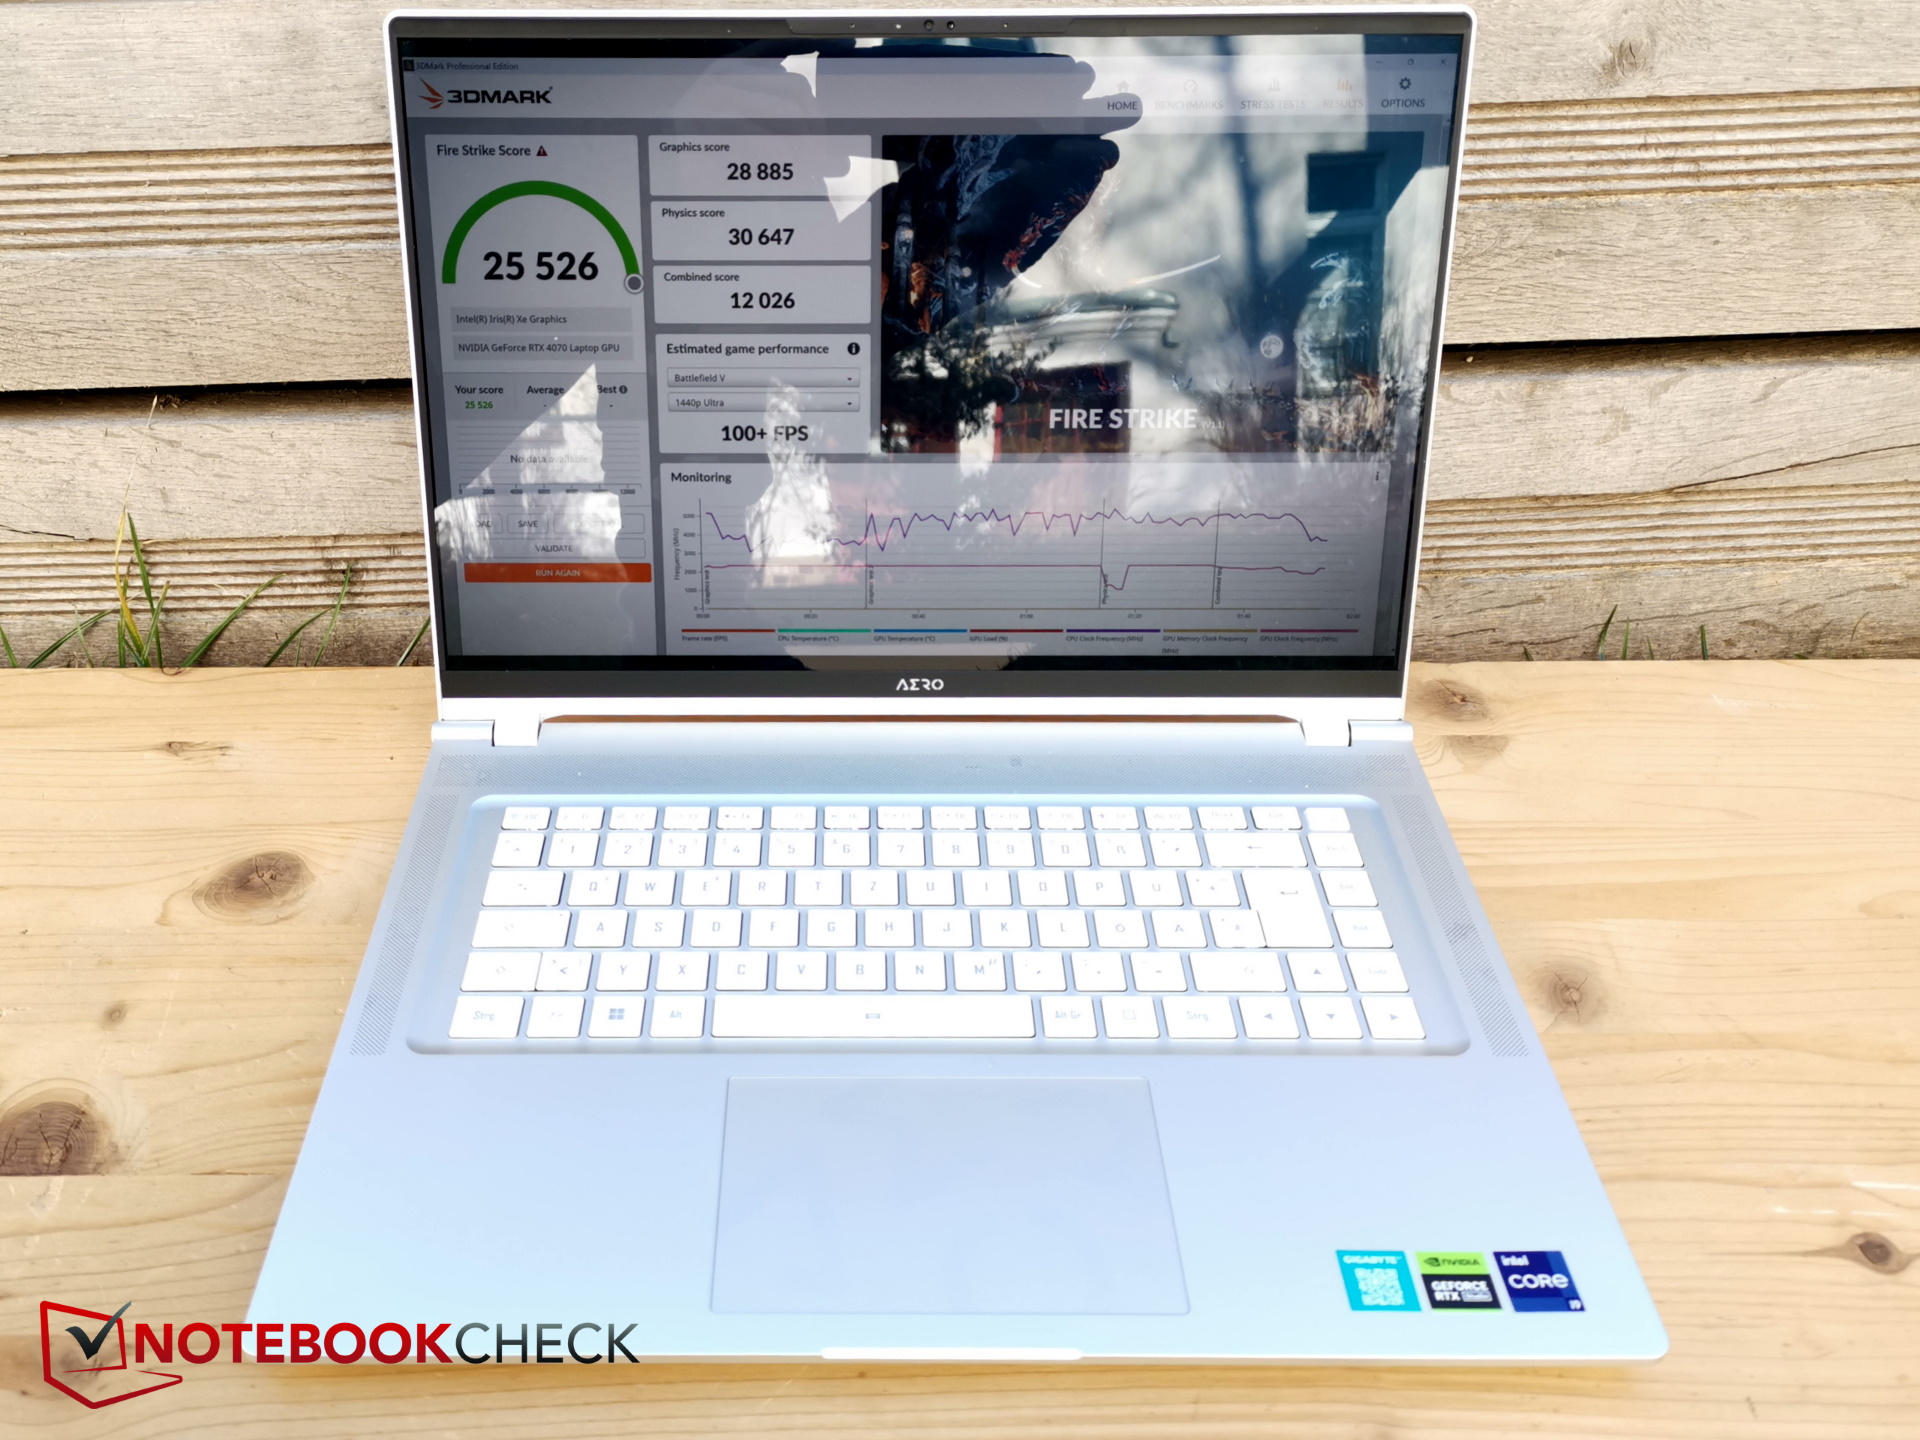
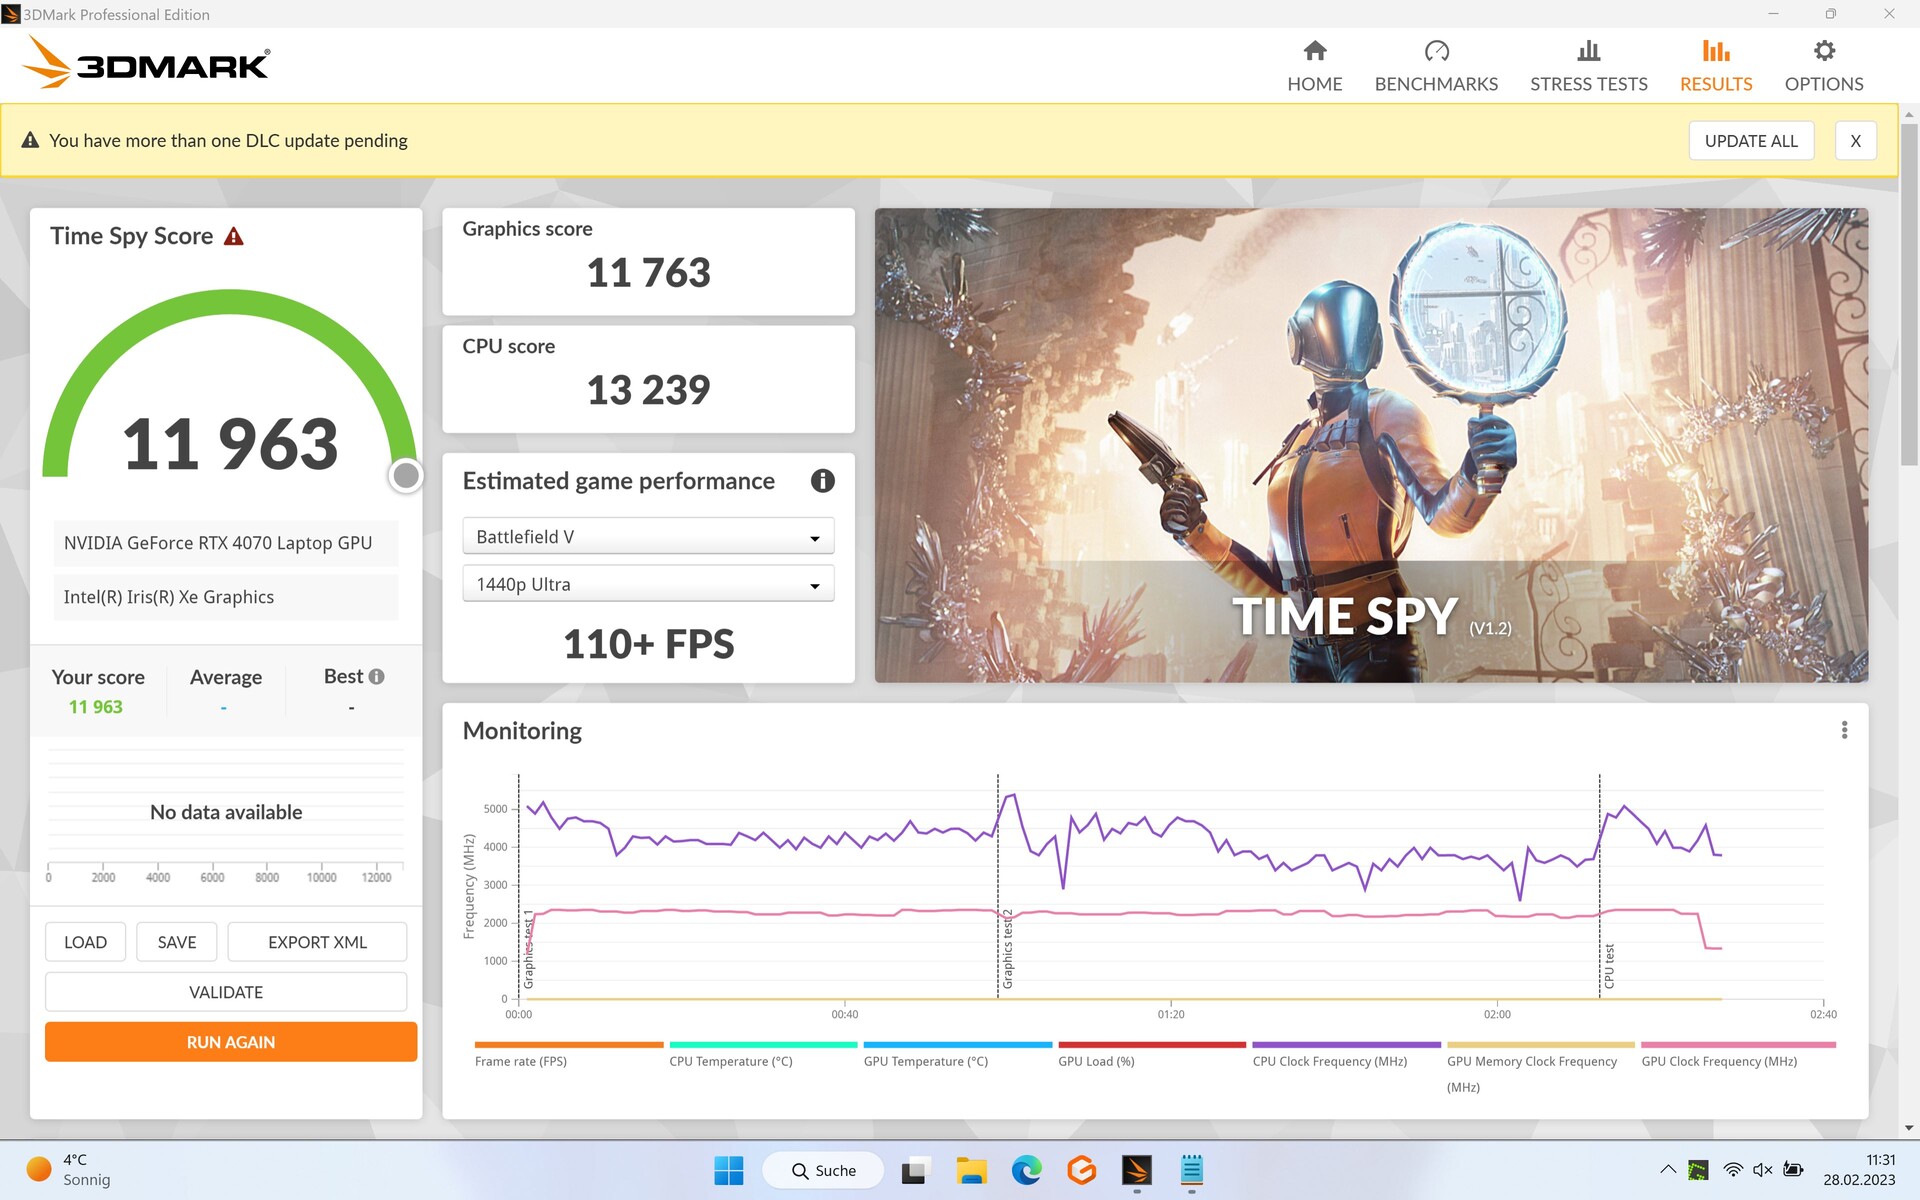
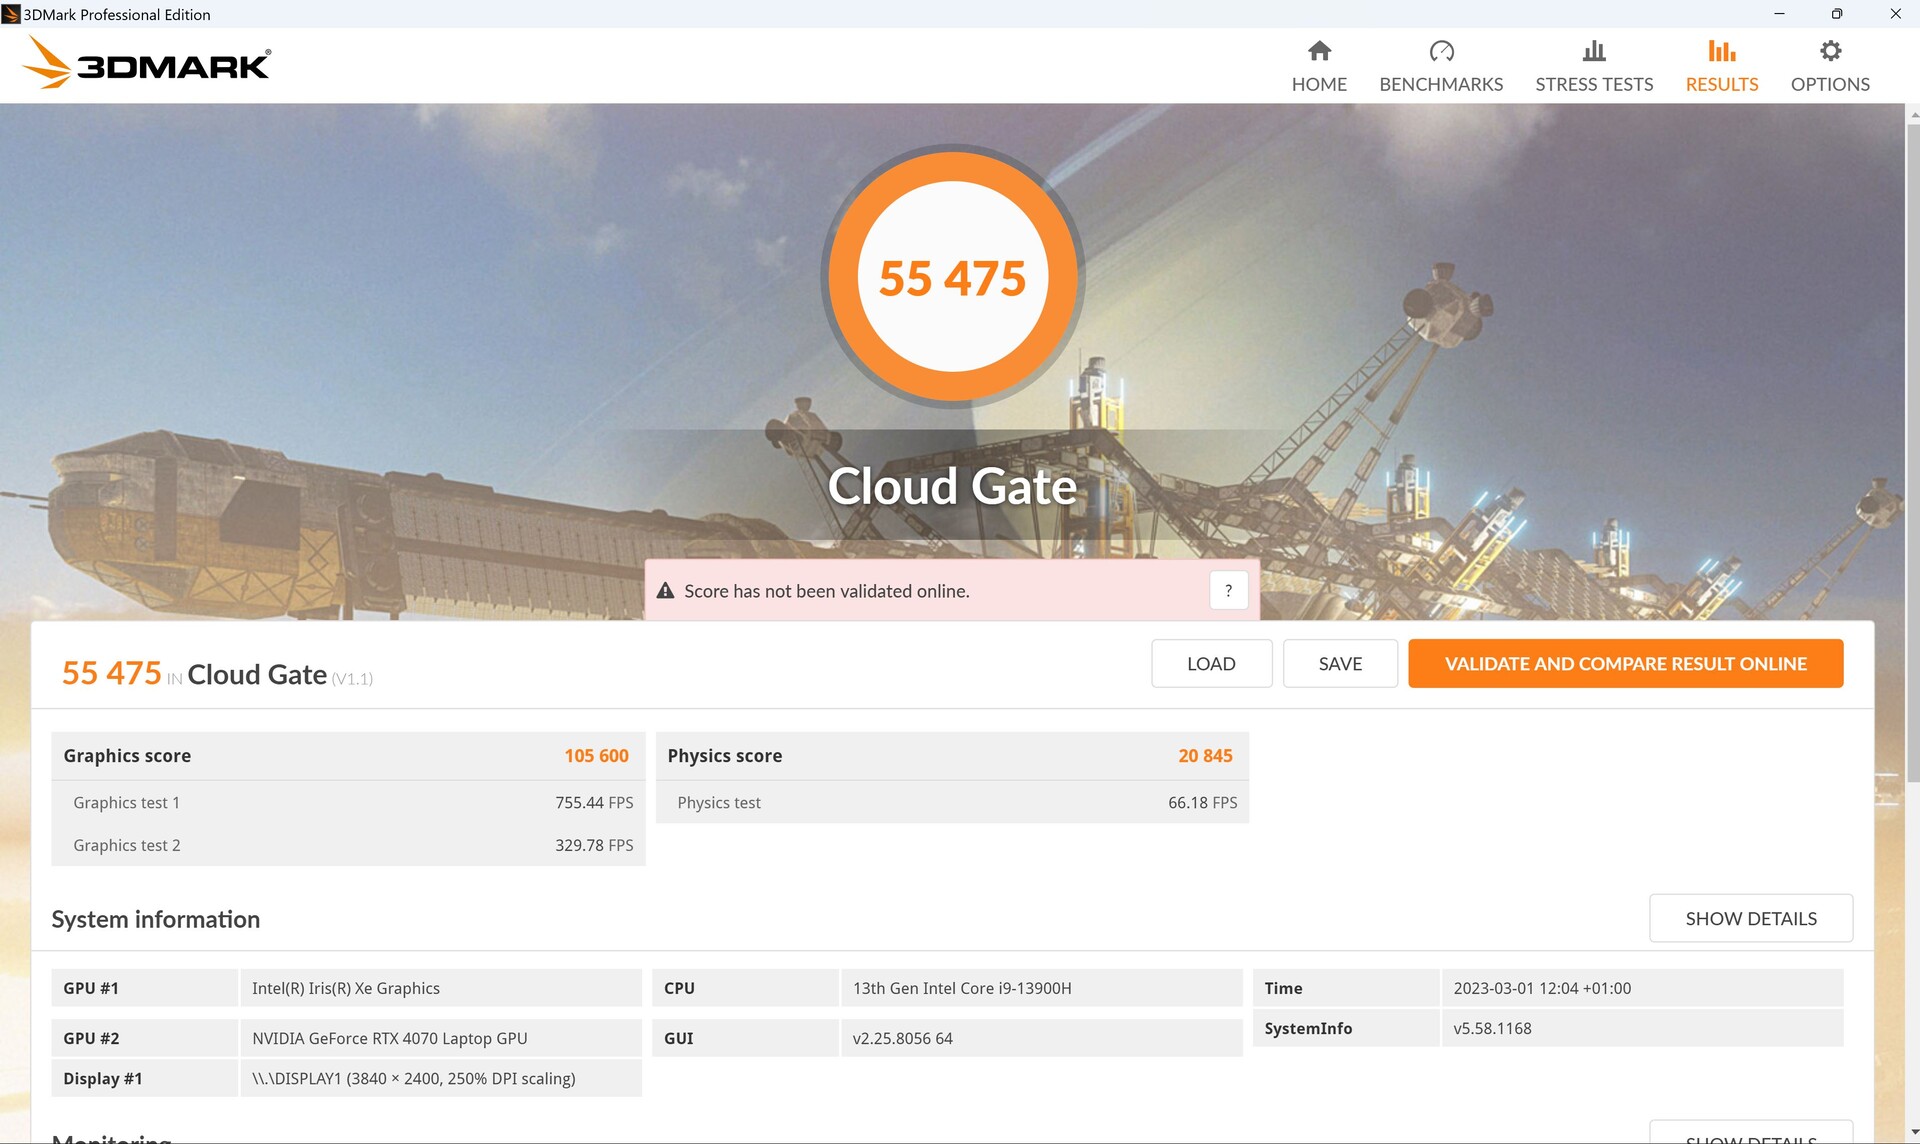
En el 3DMarks sintético, la tarjeta está en el nivel esperado, aunque no tenemos muchas más mediciones en nuestra base de datos. Después de todo, está ocasionalmente por delante de los dispositivos de la competencia con una RTX 3080 Timientras que la predecesor con su RTX 3080 Ti también es superado en casi un 20 por ciento, el CreatorProen un 30%. Incluso el Blade 18 con la misma GPU y una CPU nominalmente más rápida queda ligeramente por detrás. El Alienware x15 R2 con su RTX 3080 Ti, por otro lado, queda ligeramente por delante.
Se pierde mucho rendimiento 3D en Modo Batería, ¡con la puntuación en Fire Strike cayendo casi un 70%!

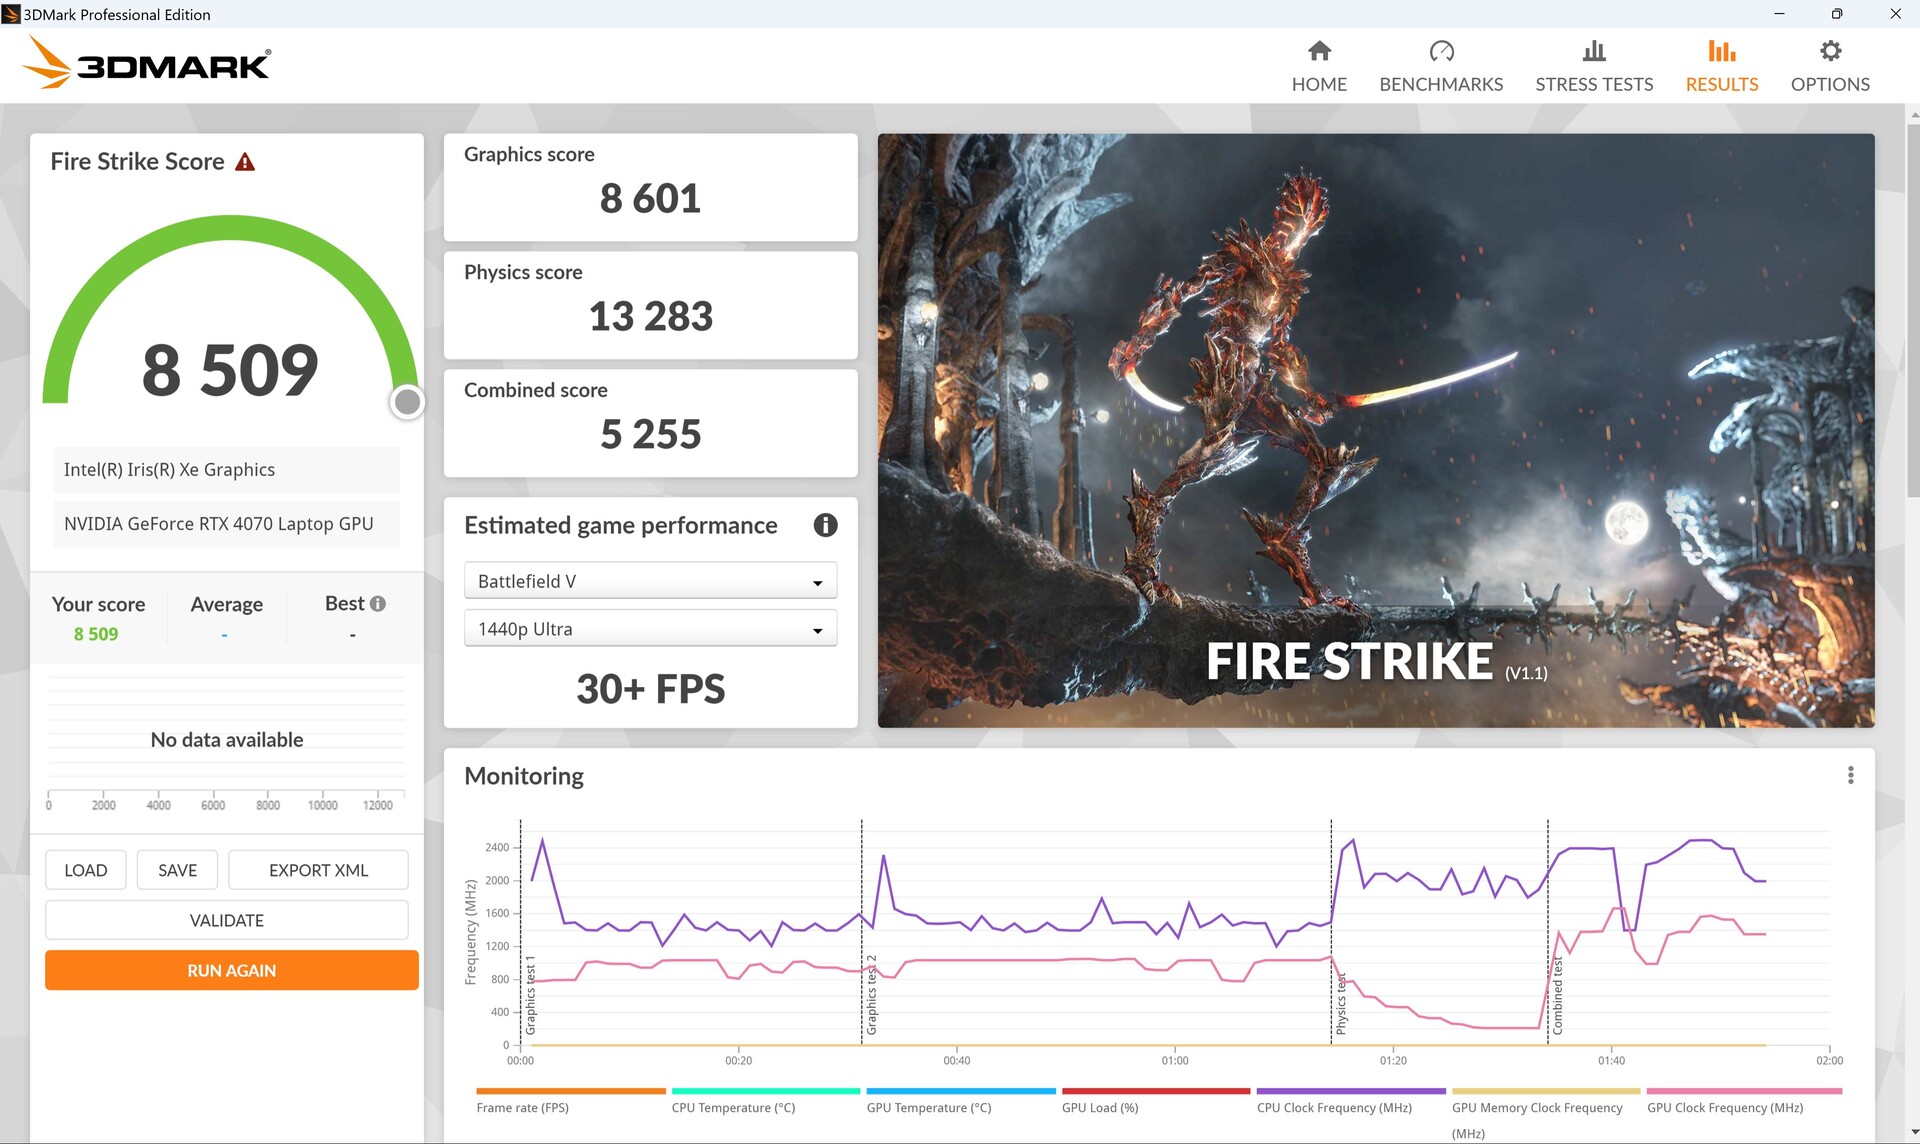
| 3DMark 11 Performance | 33703 puntos | |
| 3DMark Cloud Gate Standard Score | 55475 puntos | |
| 3DMark Fire Strike Score | 25526 puntos | |
| 3DMark Fire Strike Extreme Score | 13175 puntos | |
| 3DMark Time Spy Score | 12029 puntos | |
ayuda | ||
* ... más pequeño es mejor
Rendimiento en juegos
En juegos, el Aero 16 se ve superado por elBlade 18en general, y sólo por los flojos resultados en DOTA 2 Reborn y X-Plane 11.11. El Aero incluso tiene ventaja en los juegos con mucha GPU. Esto es interesante porque la RTX 4070permite 140 W en el Blade, pero sólo 105 W en el Aero, lo que confirma que no tiene mucho sentido usar la tarjeta a más de 100 W por el momento.
En general, puede manejar todos los juegos hasta 2K y a veces incluso por encima, aunque la tarjeta a veces se queda sin vapor en juegos muy exigentes a 4K.
Por otra parte, el rendimiento del trazado de rayos es muy bueno. En Cyberpunkt, sólo baja de 85 a 65 fps con el trazado de rayos activado a 1080p.
| The Witcher 3 - 1920x1080 Ultra Graphics & Postprocessing (HBAO+) | |
| Media de la clase Gaming (104.7 - 240, n=7, últimos 2 años) | |
| Gigabyte AERO 16 OLED BSF | |
| Razer Blade 18 RTX 4070 | |
| Gigabyte Aero 16 YE5 | |
| Asus TUF Gaming A16 FA617 | |
| Asus ZenBook Pro 16X OLED UX7602ZM-ME115W | |
| MSI CreatorPro Z16P B12UKST | |
| Final Fantasy XV Benchmark - 1920x1080 High Quality | |
| Media de la clase Gaming (41 - 215, n=95, últimos 2 años) | |
| Gigabyte AERO 16 OLED BSF | |
| Razer Blade 18 RTX 4070 | |
| Gigabyte Aero 16 YE5 | |
| Asus ZenBook Pro 16X OLED UX7602ZM-ME115W | |
| Asus TUF Gaming A16 FA617 | |
| MSI CreatorPro Z16P B12UKST | |
El Aero 16 no ofrece Advanced Optimus, y lo mismo cabe decir del Modo Susurro de Nvidia. Sin embargo, dispone de un interruptor MUX para que puedas cambiar manualmente entre iGPU y dGPU.
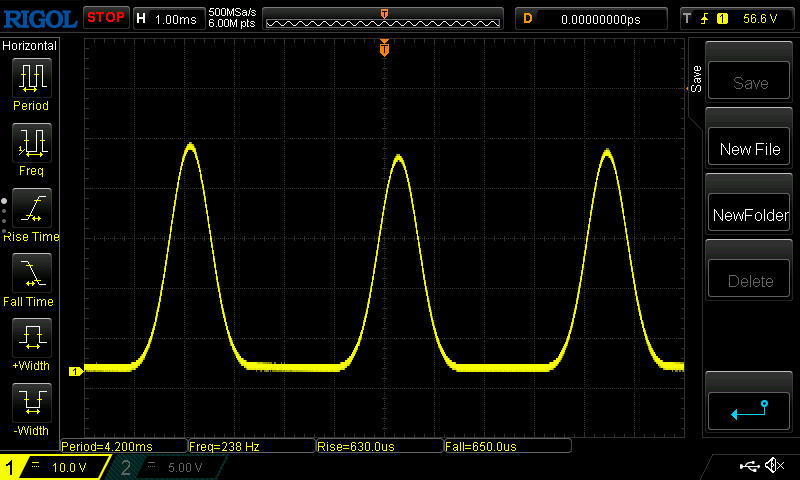
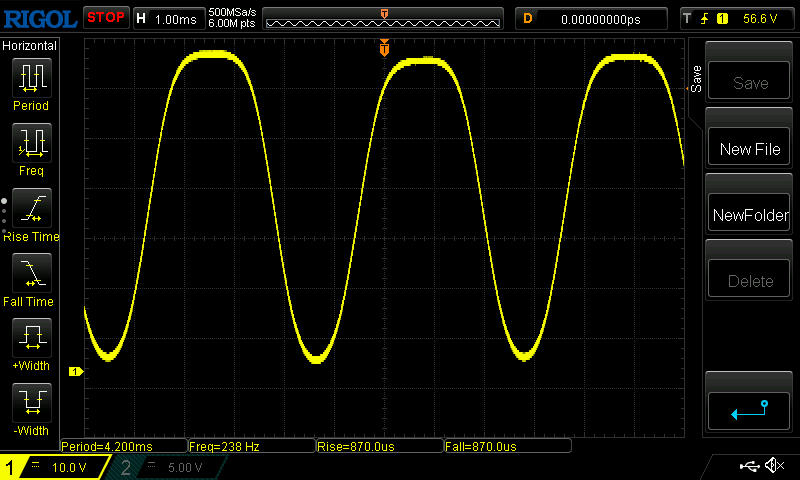
En modo gaming, la tasa de frames en Witcher 3 es bastante constante durante más de una hora y está por encima de la de unRazer Blade 18.
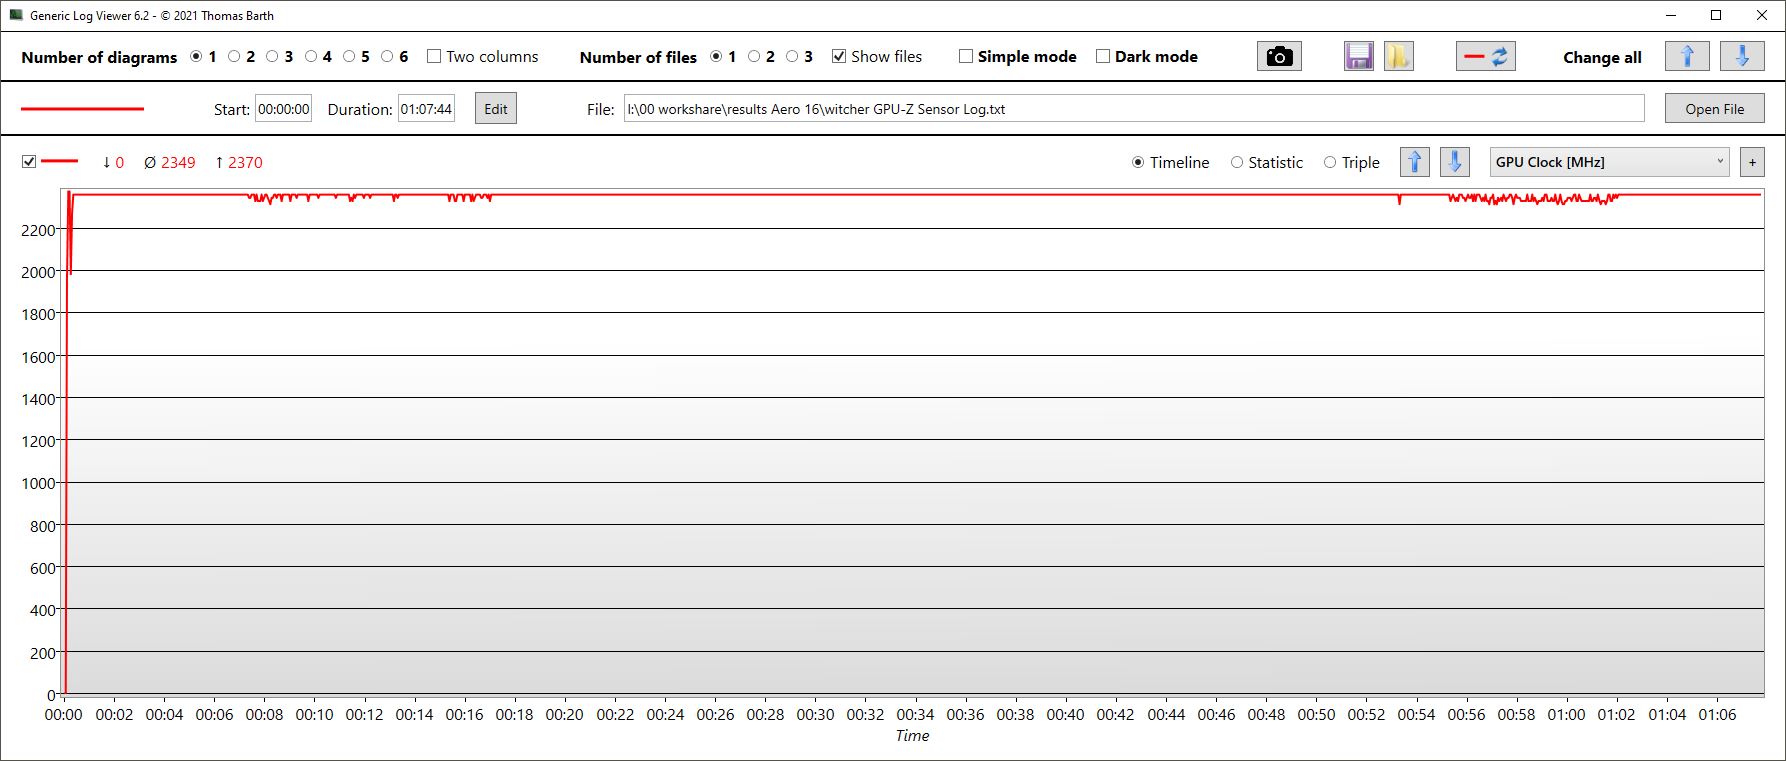
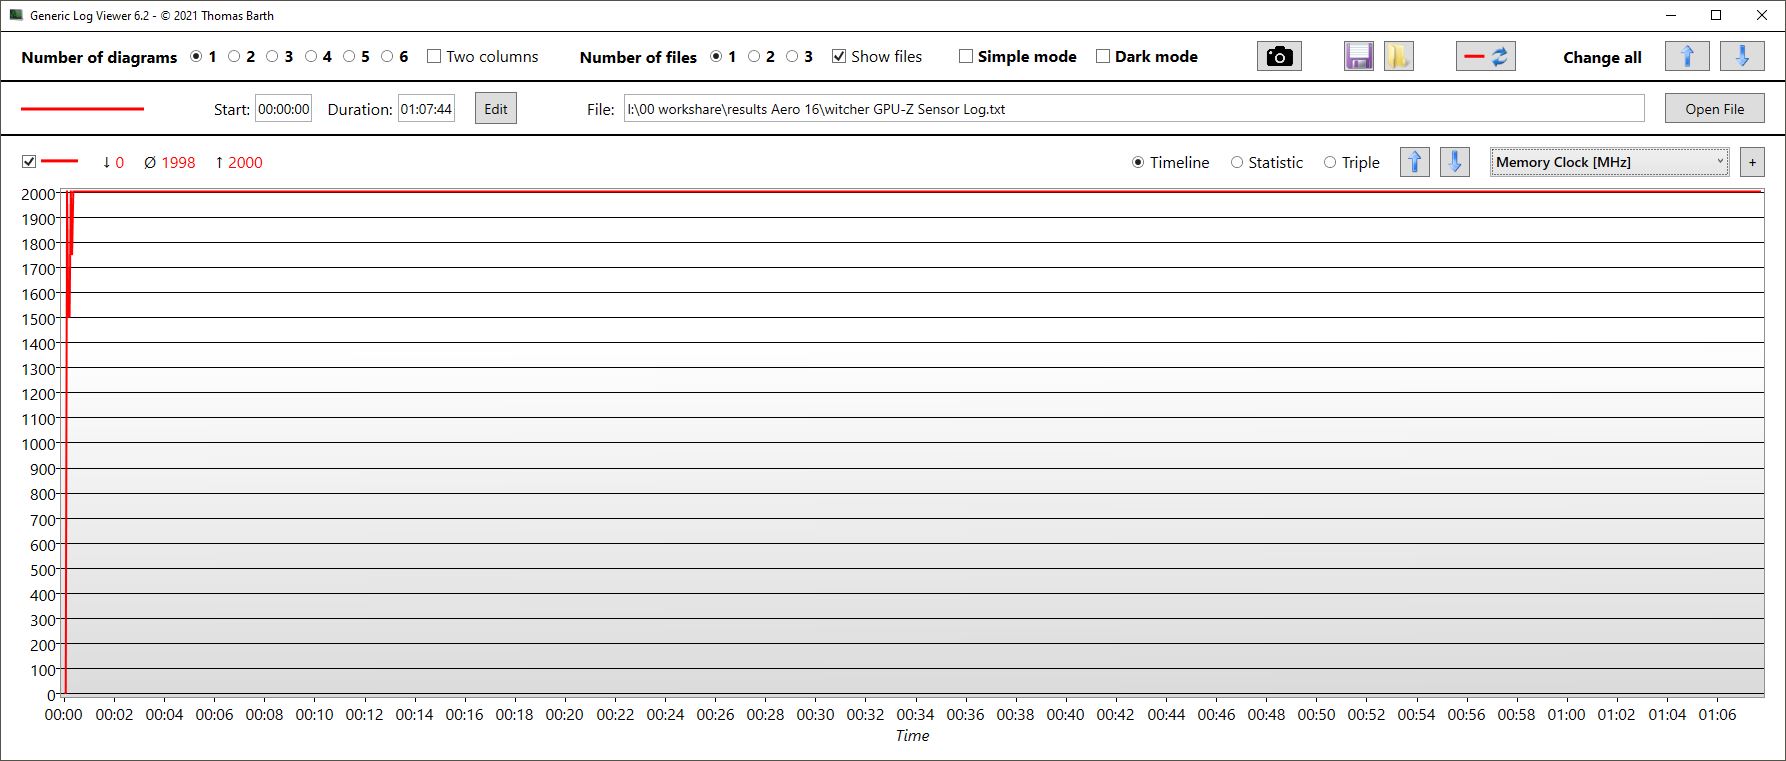
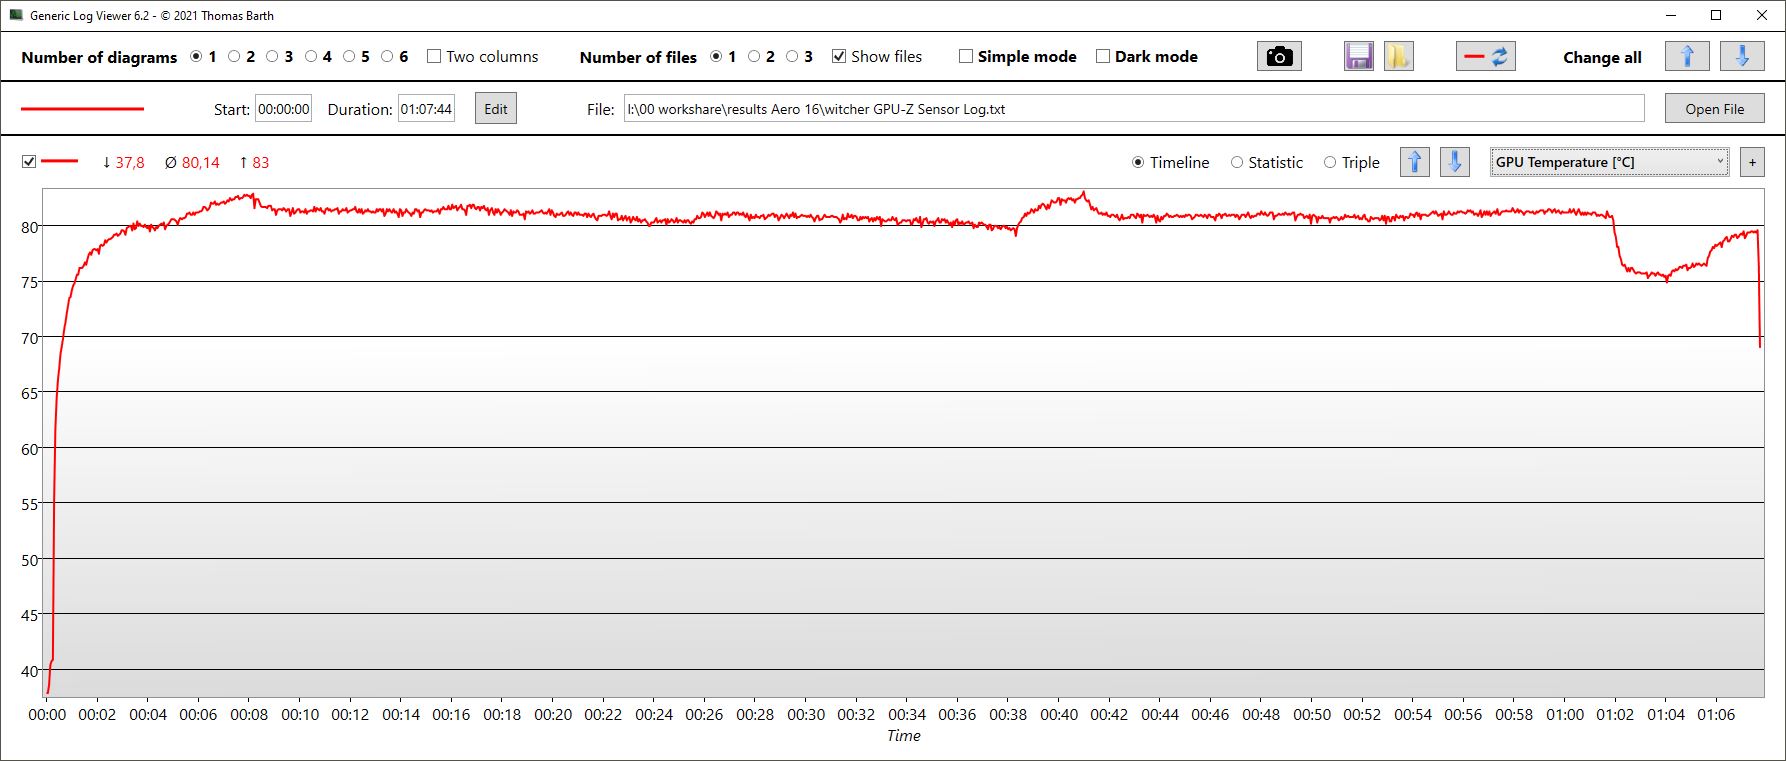
El consumo de energía de la GPU es casi constante, en torno a 105 W, lo que significa que tanto el reloj del núcleo (2.350 MHz) como el de la memoria (2.000 MHz) son también muy constantes. La tarjeta se calienta hasta unos 80 °C.
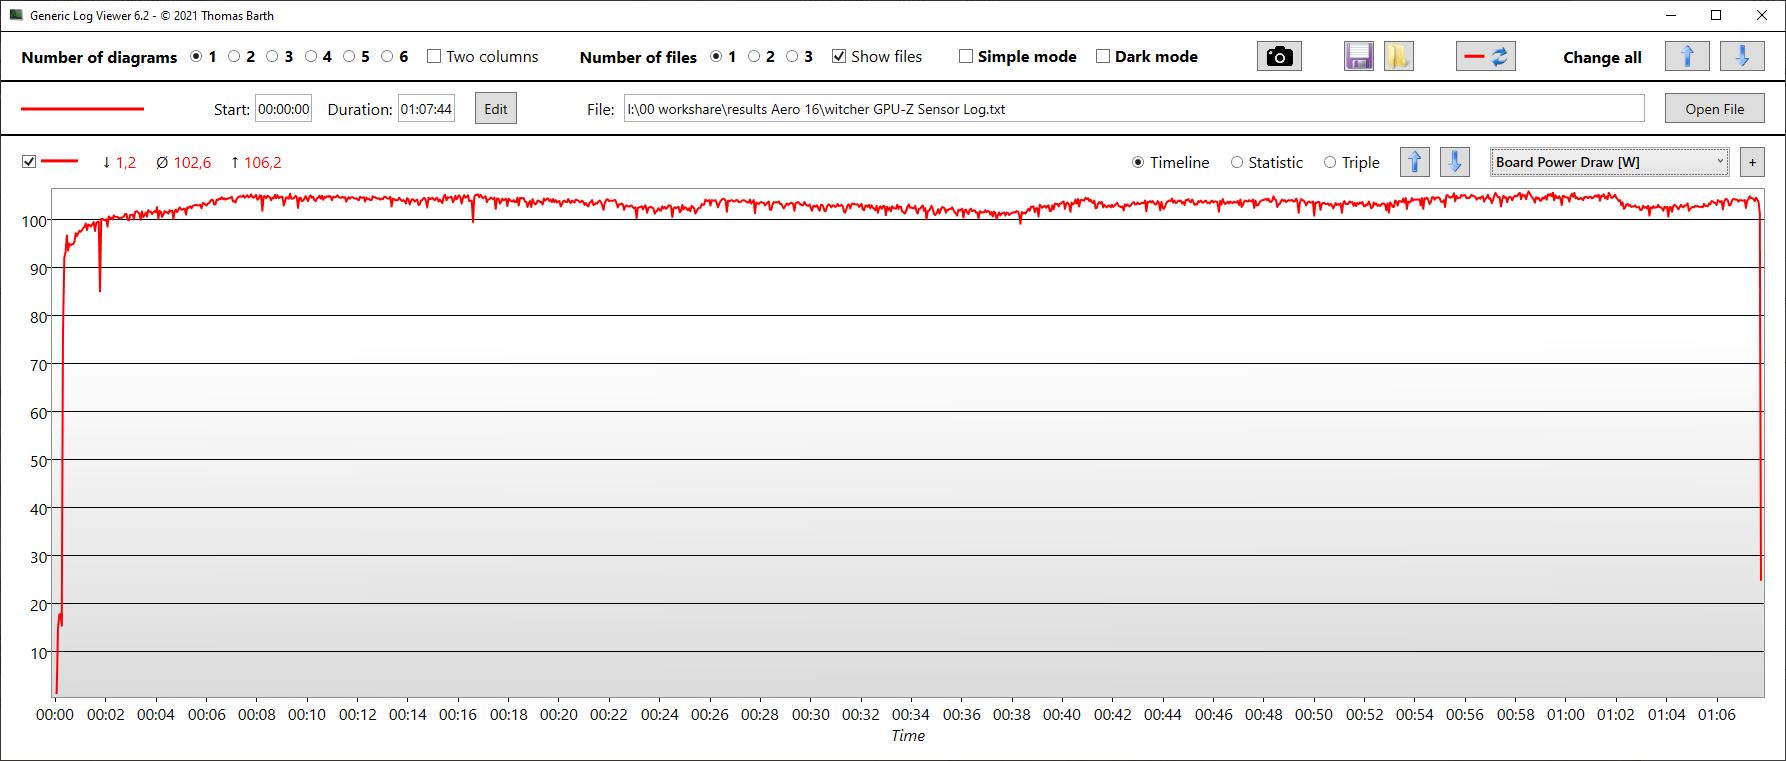
Witcher 3 FPS Chart
| bajo | medio | alto | ultra | QHD | 4K | |
|---|---|---|---|---|---|---|
| GTA V (2015) | 185.3 | 186.4 | 183.1 | 123.2 | 90.6 | 75 |
| The Witcher 3 (2015) | 236 | 116 | ||||
| Dota 2 Reborn (2015) | 164.7 | 157 | 150.9 | 144.5 | 128.3 | |
| Final Fantasy XV Benchmark (2018) | 132.3 | 116.2 | 84.7 | 46.1 | ||
| X-Plane 11.11 (2018) | 169.3 | 148 | 115.3 | 98.5 | ||
| Far Cry 5 (2018) | 202 | 168 | 159 | 149 | 115 | 55 |
| Strange Brigade (2018) | 481 | 300 | 237 | 204 | 138.8 | 67.6 |
| Shadow of the Tomb Raider (2018) | 158 | 129 | 70 | |||
| Assassin´s Creed Valhalla (2020) | 106 | 78 | 41 | |||
| Cyberpunk 2077 1.6 (2022) | 84.75 | 53.28 | 19.59 | |||
| F1 22 (2022) | 220 | 214 | 173.8 | 66.6 | 44.3 | 21.5 |
| Call of Duty Modern Warfare 2 2022 (2022) | 101 | 72 | 39 | |||
| Spider-Man Miles Morales (2022) | 90.5 | 68.9 | 40.5 | |||
| The Callisto Protocol (2022) | 78.86 | 59.07 | 32.96 |
Emisiones - Aero 16 sigue siendo bastante fresco, pero no silencioso
Ruido
El delgado Aero 16 es bastante ruidoso en el modo Gaming cuando se somete a mucho estrés. Gaming o nuestro test de estrés hace que los ventiladores giren hasta los 55 dB, lo que es más ruidoso que la competencia, pero no sorprende dado el delgado factor de forma.
En Modo Creador, el volumen baja de los 55 dB del Modo Juego a unos 50 dB en el test de estrés. Esto acerca al Aero a la competencia, que tiene un nivel de ruido similar. Sólo el Modo Reunión intenta mantener el dispositivo realmente silencioso.
Ruido
| Ocioso |
| 23 / 23 / 33.64 dB(A) |
| Carga |
| 51.49 / 55.24 dB(A) |
 | ||
30 dB silencioso 40 dB(A) audible 50 dB(A) ruidosamente alto |
||
min: | ||
| Gigabyte AERO 16 OLED BSF GeForce RTX 4070 Laptop GPU, i9-13900H, Gigabyte AG470S1TB-SI B10 | Gigabyte Aero 16 YE5 GeForce RTX 3080 Ti Laptop GPU, i9-12900HK, Phison ESR01TBMFCT | Razer Blade 18 RTX 4070 GeForce RTX 4070 Laptop GPU, i9-13950HX, SSSTC CA6-8D1024 | Asus ZenBook Pro 16X OLED UX7602ZM-ME115W GeForce RTX 3060 Laptop GPU, i9-12900H, Samsung PM9A1 MZVL21T0HCLR | Asus TUF Gaming A16 FA617 Radeon RX 7600S, R7 7735HS, Micron 2400 MTFDKBA1T0QFM | MSI CreatorPro Z16P B12UKST RTX A3000 Laptop GPU, i7-12700H, Samsung PM9A1 MZVL21T0HCLR | |
|---|---|---|---|---|---|---|
| Noise | -7% | 8% | -1% | 5% | 4% | |
| apagado / medio ambiente * (dB) | 23 | 25 -9% | 23.5 -2% | 26 -13% | 24 -4% | 24.1 -5% |
| Idle Minimum * (dB) | 23 | 30 -30% | 23.8 -3% | 26 -13% | 24 -4% | 27.1 -18% |
| Idle Average * (dB) | 23 | 32 -39% | 23.8 -3% | 26 -13% | 25 -9% | 27.1 -18% |
| Idle Maximum * (dB) | 33.64 | 33 2% | 26.8 20% | 26 23% | 28 17% | 27.1 19% |
| Load Average * (dB) | 51.49 | 45 13% | 37.3 28% | 48 7% | 42 18% | 42.9 17% |
| Witcher 3 ultra * (dB) | 55.27 | 50 10% | 48 13% | 50 10% | 44 20% | |
| Load Maximum * (dB) | 55.24 | 52 6% | 53.5 3% | 54.6 1% | 50 9% | 47 15% |
* ... más pequeño es mejor
Temperatura
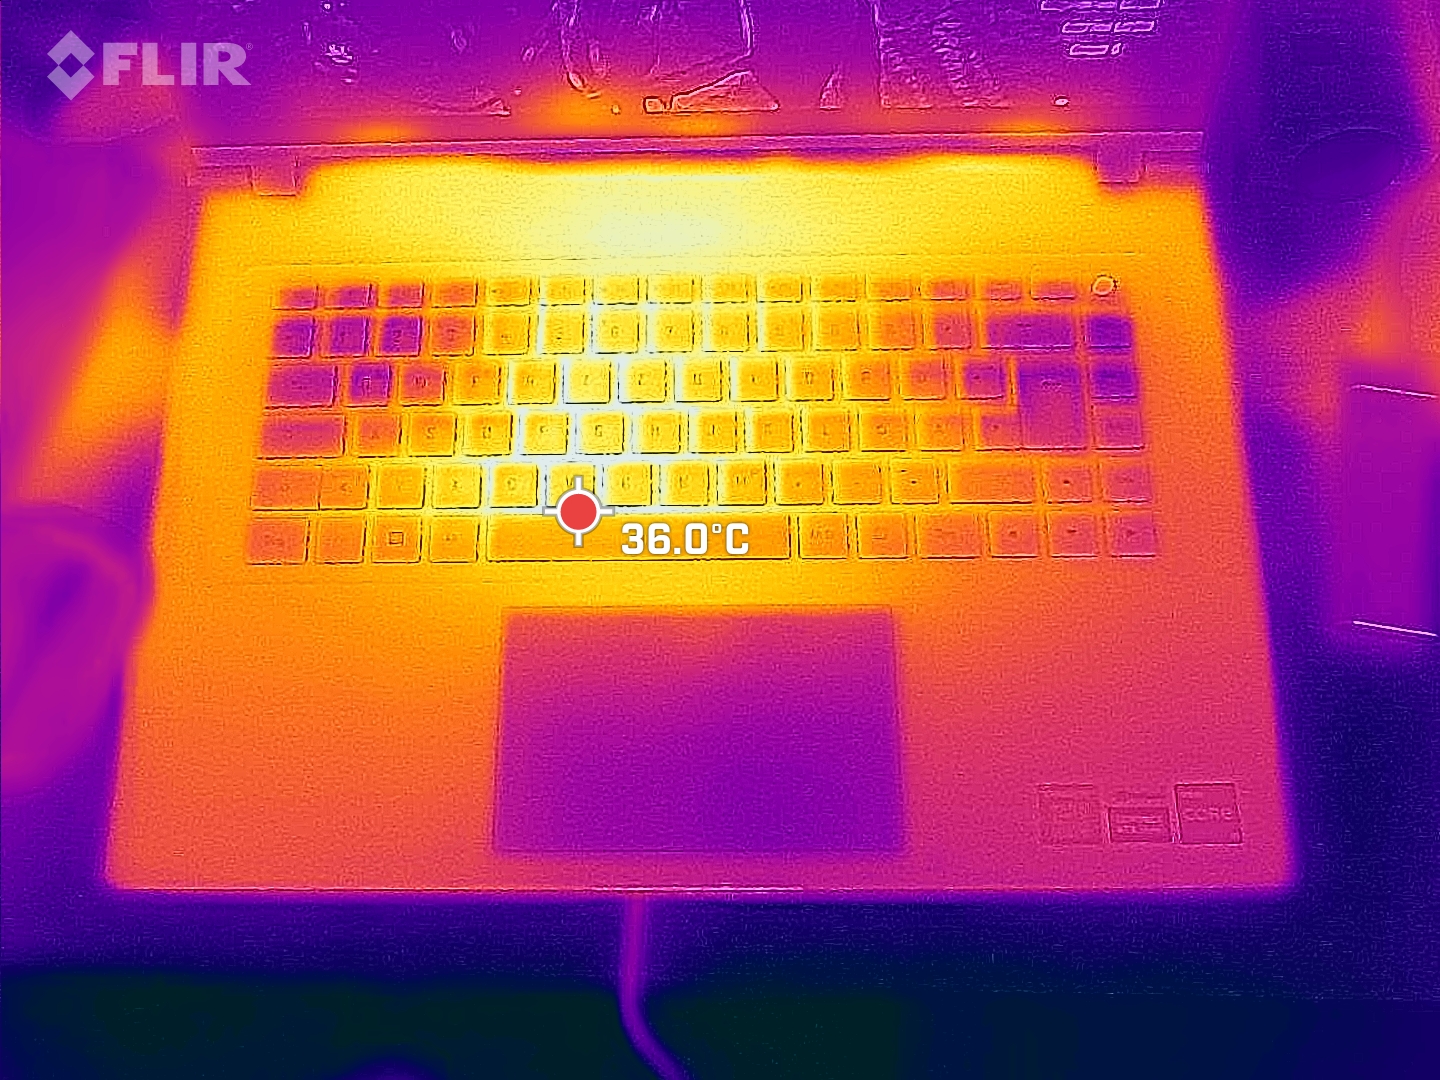
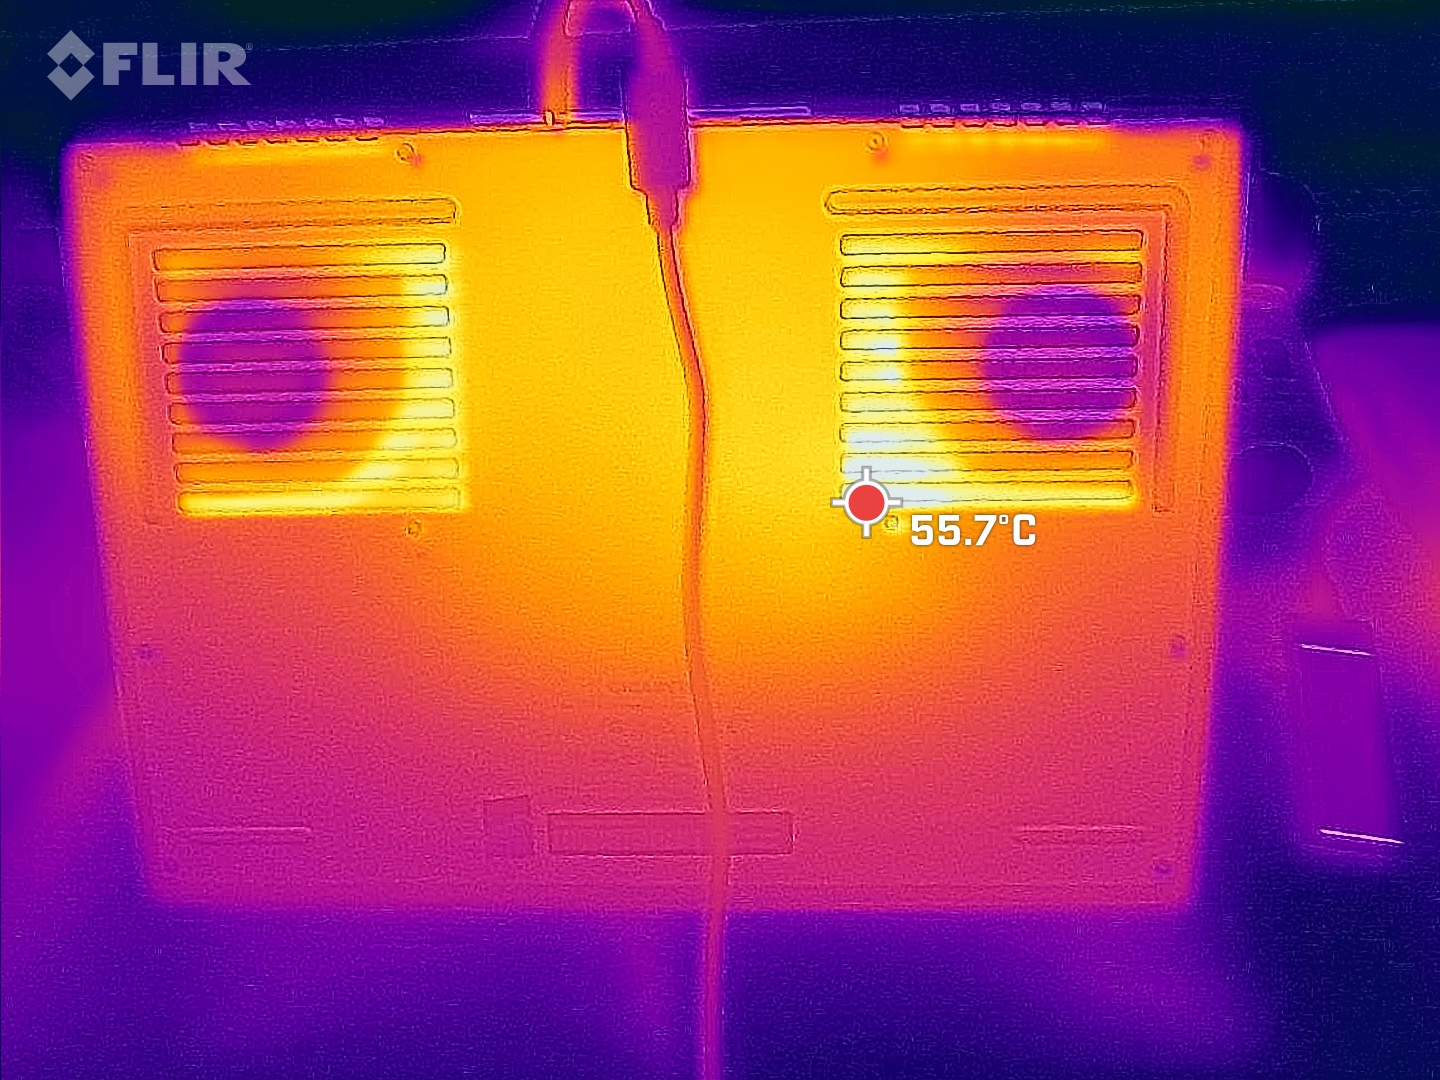
A pesar de su delgada carcasa, el Aero rinde bien en este campo. Los ventiladores relativamente ruidosos y la carcasa metálica disipan bien el calor, de modo que los puntos calientes de la trasera se mantienen muy por debajo de los 50 °C. El predecesor y varios competidores lo hacen peor aquí. Los reposamanos están siempre dentro de un rango cómodo.
(±) La temperatura máxima en la parte superior es de 41 °C / 106 F, frente a la media de 40.4 °C / 105 F, que oscila entre 21.2 y 68.8 °C para la clase Gaming.
(-) El fondo se calienta hasta un máximo de 47 °C / 117 F, frente a la media de 43.2 °C / 110 F
(+) En reposo, la temperatura media de la parte superior es de 21.8 °C / 71# F, frente a la media del dispositivo de 33.9 °C / 93 F.
(±) Jugando a The Witcher 3, la temperatura media de la parte superior es de 36.8 °C / 98 F, frente a la media del dispositivo de 33.9 °C / 93 F.
(+) Los reposamanos y el panel táctil alcanzan como máximo la temperatura de la piel (33 °C / 91.4 F) y, por tanto, no están calientes.
(-) La temperatura media de la zona del reposamanos de dispositivos similares fue de 28.8 °C / 83.8 F (-4.2 °C / -7.6 F).
| Gigabyte AERO 16 OLED BSF Intel Core i9-13900H, NVIDIA GeForce RTX 4070 Laptop GPU | Gigabyte Aero 16 YE5 Intel Core i9-12900HK, NVIDIA GeForce RTX 3080 Ti Laptop GPU | Razer Blade 18 RTX 4070 Intel Core i9-13950HX, NVIDIA GeForce RTX 4070 Laptop GPU | Asus ZenBook Pro 16X OLED UX7602ZM-ME115W Intel Core i9-12900H, NVIDIA GeForce RTX 3060 Laptop GPU | Asus TUF Gaming A16 FA617 AMD Ryzen 7 7735HS, AMD Radeon RX 7600S | MSI CreatorPro Z16P B12UKST Intel Core i7-12700H, NVIDIA RTX A3000 Laptop GPU | |
|---|---|---|---|---|---|---|
| Heat | -31% | -14% | -17% | -45% | -26% | |
| Maximum Upper Side * (°C) | 41 | 49 -20% | 39.2 4% | 32 22% | 54 -32% | 56.3 -37% |
| Maximum Bottom * (°C) | 47 | 55 -17% | 35.6 24% | 41.6 11% | 47 -0% | 68.3 -45% |
| Idle Upper Side * (°C) | 23 | 33 -43% | 31.8 -38% | 32.6 -42% | 40 -74% | 25.2 -10% |
| Idle Bottom * (°C) | 23 | 33 -43% | 33.2 -44% | 36 -57% | 40 -74% | 25.9 -13% |
* ... más pequeño es mejor
Pruebas de resistencia
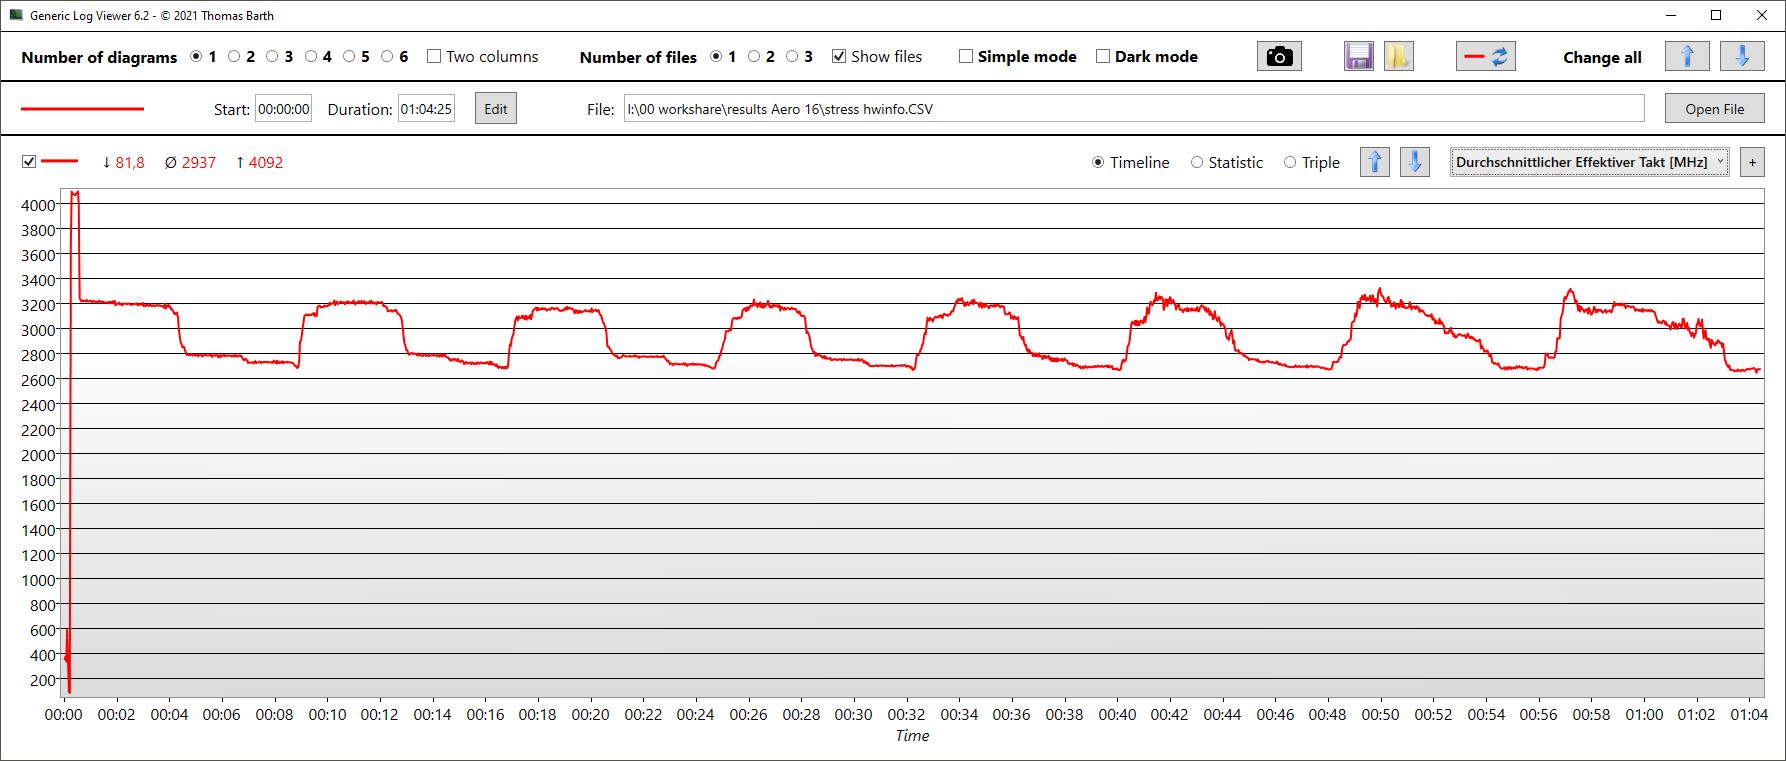
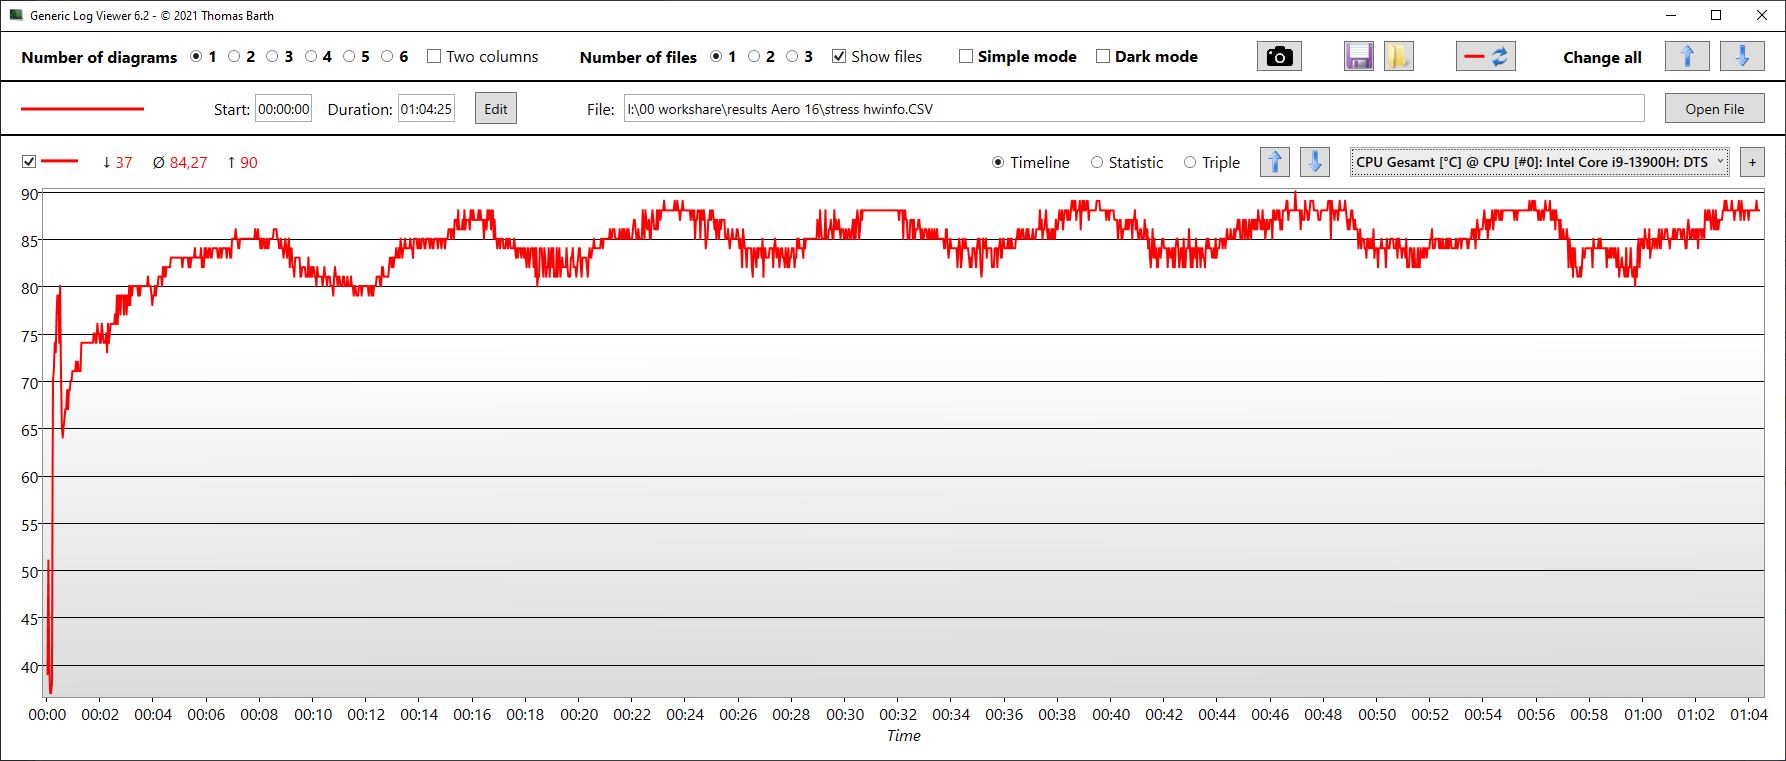
En las pruebas de estrés, la CPU es capaz de consumir 105 W en breves ráfagas antes de caer a 62 W constantes al cabo de unos segundos. Al mismo tiempo, el reloj arranca brevemente a 4,1 GHz antes de caer a unos 2,9 GHz. Sin embargo, esto no se mantiene constante, sino que fluctúa con la temperatura. Cuando las temperaturas del núcleo alcanzan los 90 °C, el reloj se ralentiza ligeramente, tras lo cual las temperaturas vuelven a bajar. A poco más de 80 °C, la frecuencia vuelve a subir ligeramente, etc.
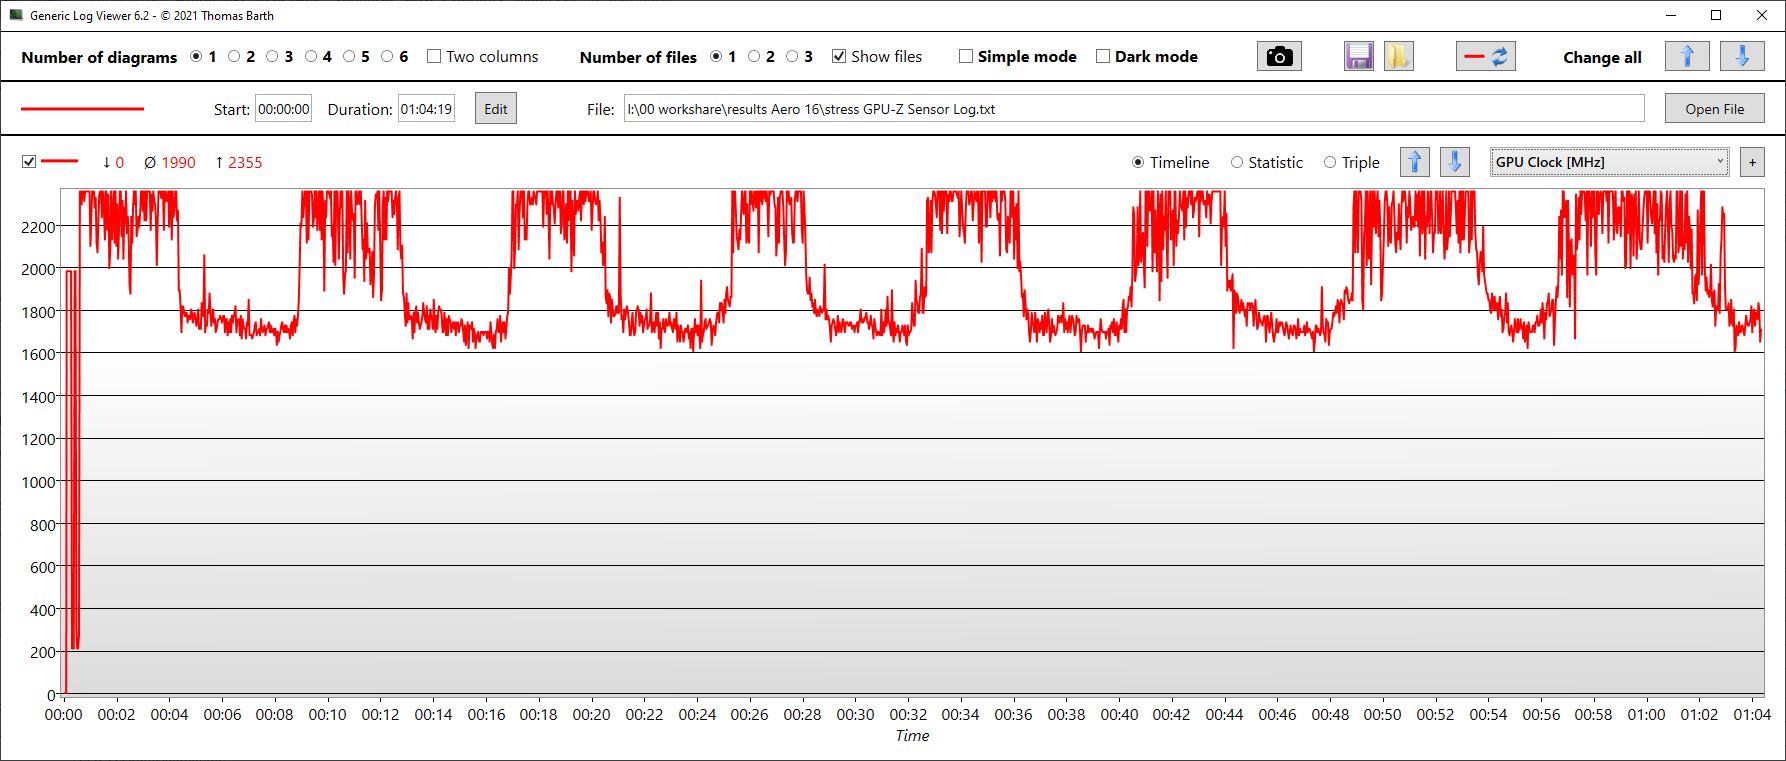
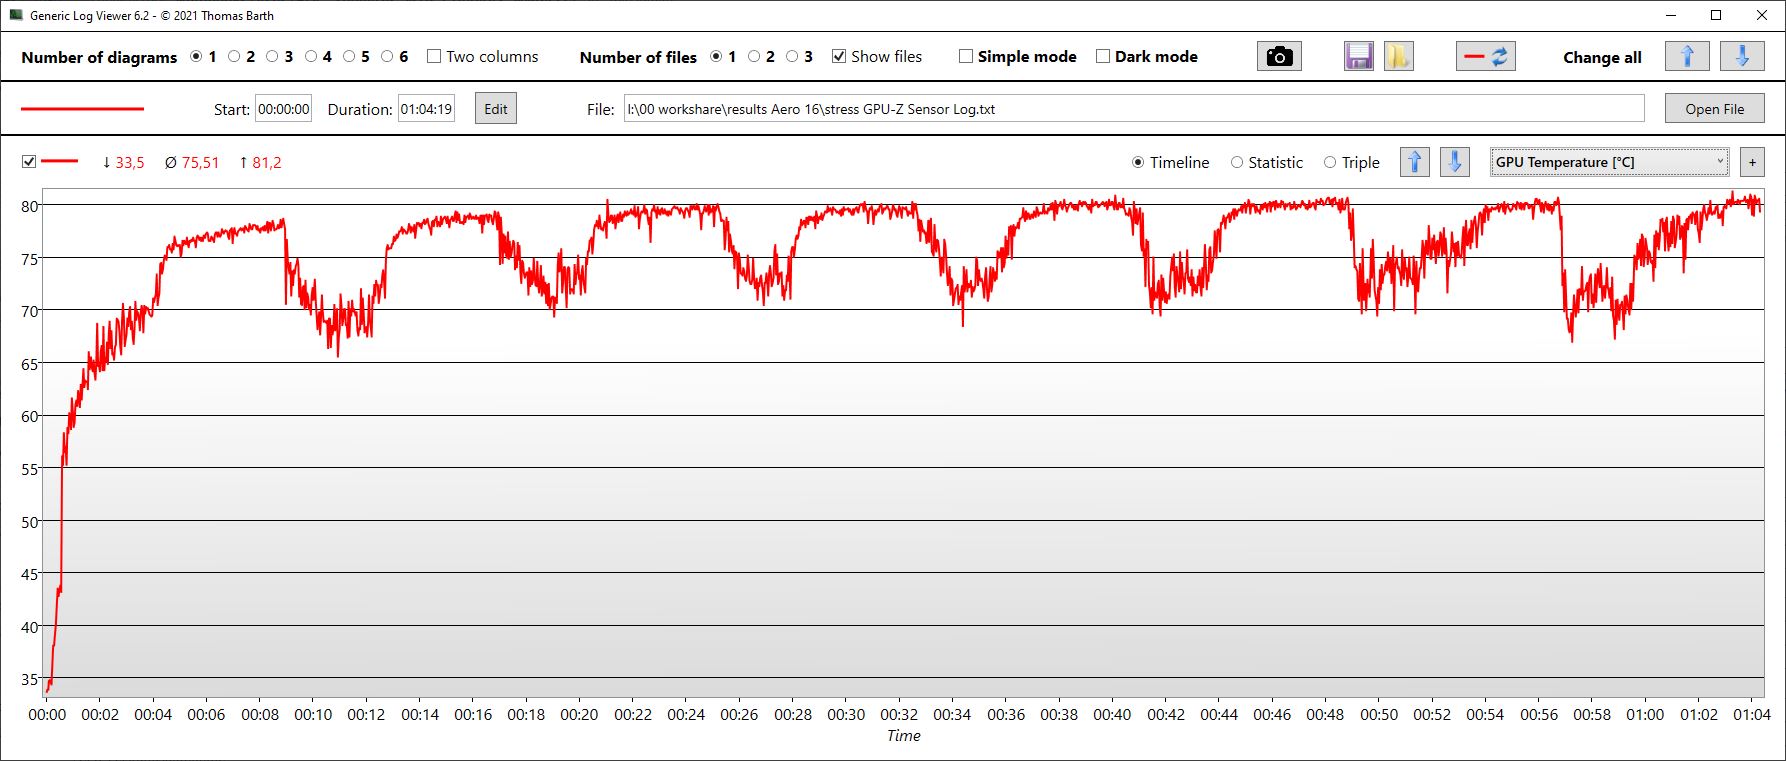
El reloj de la GPU también fluctúa continuamente entre 1,7 y 2,4 GHz. En cambio, el reloj de la memoria sube y baja de 2 GHz a 1,75 GHz. La misma forma de onda se aprecia en la temperatura de la GPU, que fluctúa aproximadamente entre 70 y 80 °C. El consumo de energía nunca alcanza su máximo en la prueba de estrés, sino que ronda los 67 W.
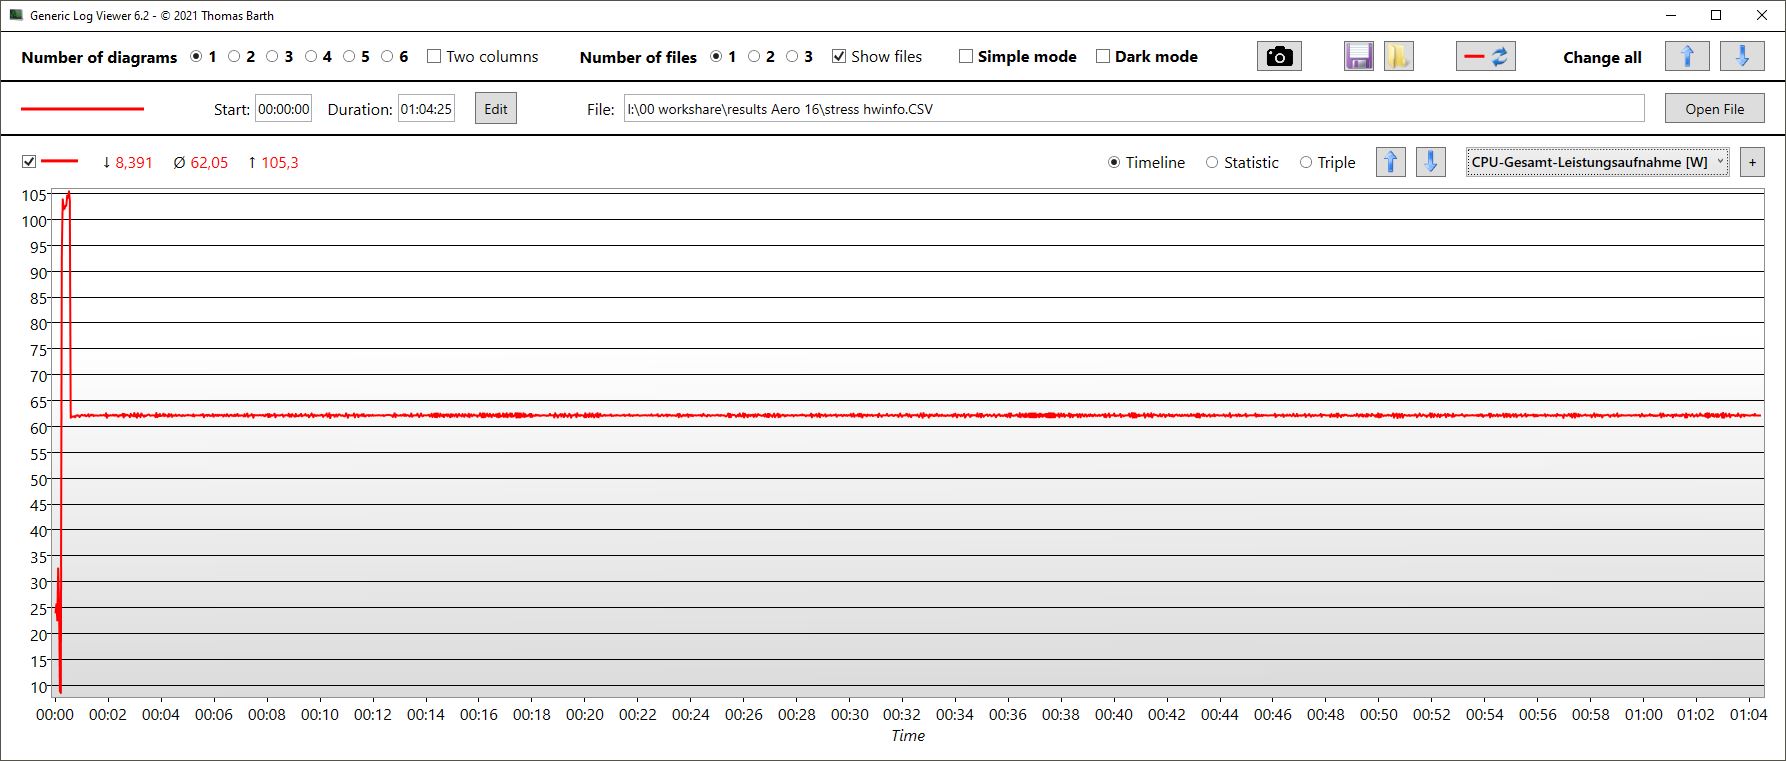
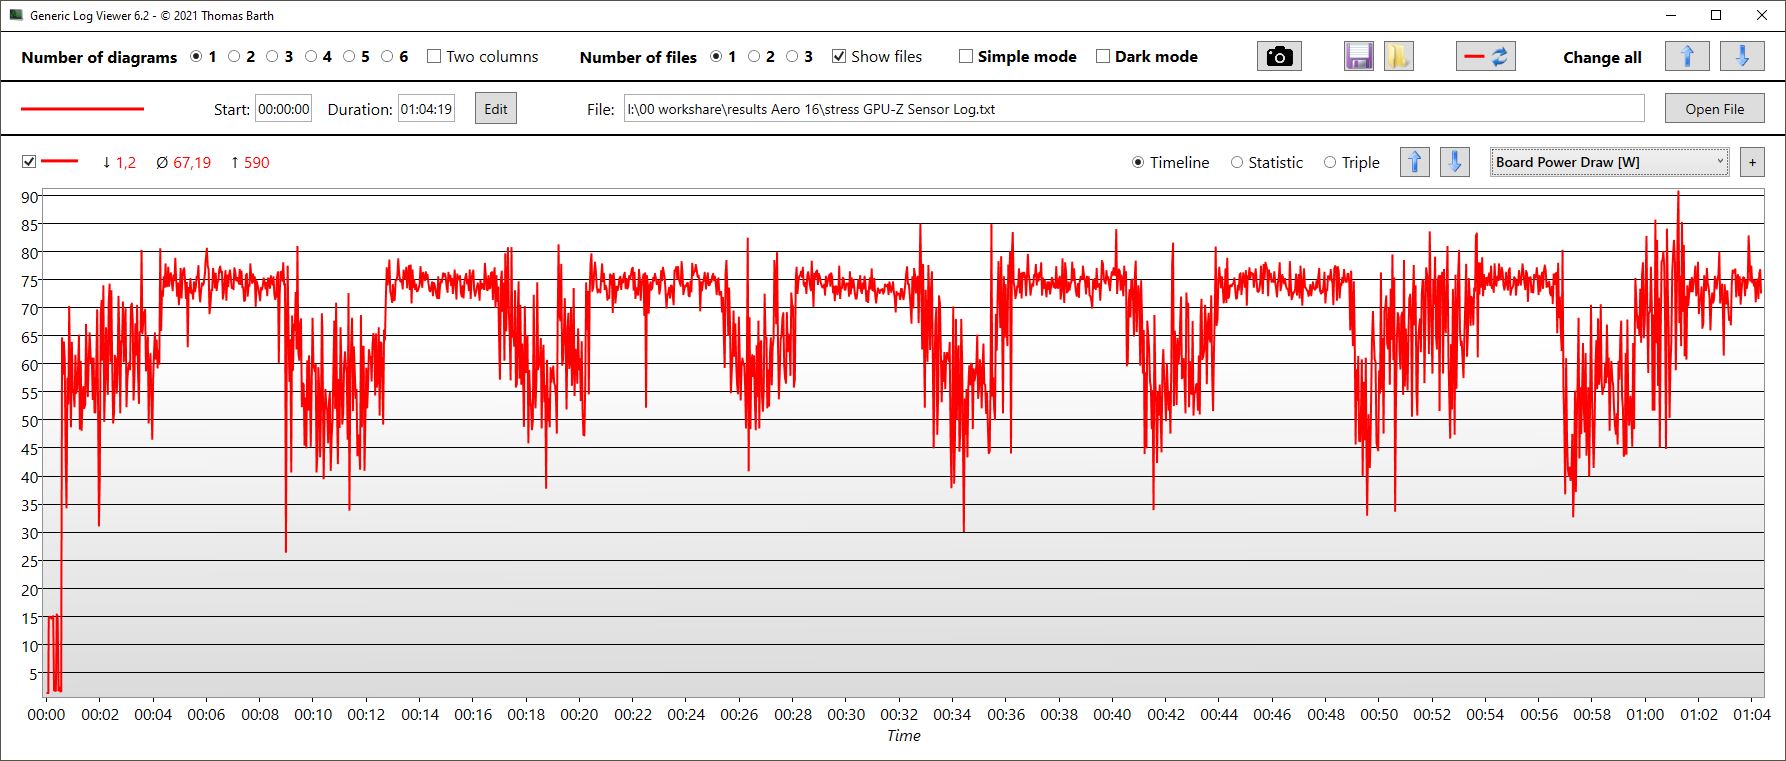
| RelojCPU (GHz) | Reloj GPU (MHz) | Temperatura mediaCPU (°C) | Temperatura media GPU (°C) | |
| Prime95 + FurMark Estrés | 2,9 | 1.990 | 84 | 76 |
| Witcher 3 Estrés | 1,8 | 2.350 | 69 | 80 |
Altavoces
Gigabyte ha instalado dos altavoces estéreo de 2 W cada uno, lo que suele ser habitual. Por desgracia, los altavoces no convencen en ninguna disciplina: tienen un volumen razonable, pero son incapaces de ofrecer medios o agudos bien equilibrados.
Además de las salidas digitales, la ranura para auriculares de 3,5 mm puede utilizarse para dispositivos externos.
Gigabyte AERO 16 OLED BSF análisis de audio
(±) | la sonoridad del altavoz es media pero buena (81.68 dB)
Graves 100 - 315 Hz
(-) | casi sin bajos - de media 15.6% inferior a la mediana
(±) | la linealidad de los graves es media (14.3% delta a frecuencia anterior)
Medios 400 - 2000 Hz
(±) | medias más altas - de media 12.8% más altas que la mediana
(-) | los medios no son lineales (16.8% delta respecto a la frecuencia anterior)
Altos 2 - 16 kHz
(±) | máximos más altos - de media 11% más altos que la mediana
(-) | los máximos no son lineales (16.3% delta a la frecuencia anterior)
Total 100 - 16.000 Hz
(-) | el sonido global no es lineal (48.4% de diferencia con la mediana)
En comparación con la misma clase
» 100% de todos los dispositivos probados de esta clase eran mejores, 0% similares, 0% peores
» El mejor tuvo un delta de 6%, la media fue 18%, el peor fue ###max##%
En comparación con todos los dispositivos probados
» 96% de todos los dispositivos probados eran mejores, 0% similares, 4% peores
» El mejor tuvo un delta de 4%, la media fue 23%, el peor fue ###max##%
Asus ZenBook Pro 16X OLED UX7602ZM-ME115W análisis de audio
(+) | los altavoces pueden reproducir a un volumen relativamente alto (#94.7 dB)
Graves 100 - 315 Hz
(-) | casi sin bajos - de media 16% inferior a la mediana
(±) | la linealidad de los graves es media (7.9% delta a frecuencia anterior)
Medios 400 - 2000 Hz
(+) | medios equilibrados - a sólo 1.8% de la mediana
(+) | los medios son lineales (3.8% delta a la frecuencia anterior)
Altos 2 - 16 kHz
(±) | máximos más altos - de media 6.2% más altos que la mediana
(+) | los máximos son lineales (2.8% delta a la frecuencia anterior)
Total 100 - 16.000 Hz
(+) | el sonido global es lineal (13.3% de diferencia con la mediana)
En comparación con la misma clase
» 28% de todos los dispositivos probados de esta clase eran mejores, 4% similares, 68% peores
» El mejor tuvo un delta de 5%, la media fue 17%, el peor fue ###max##%
En comparación con todos los dispositivos probados
» 14% de todos los dispositivos probados eran mejores, 3% similares, 83% peores
» El mejor tuvo un delta de 4%, la media fue 23%, el peor fue ###max##%
Gestión de energía - RTX 4070 eficiente en Aero 16
Consumo de energía
El consumo de energía es muy bueno, especialmente en comparación con la generación anterior. En el modelo anterior, la RTX 3080 Ti también se limitaba a 105 W. En las pruebas de juego, se puede ver que la antigua tarjeta rinde notablemente peor y consume mucho más. La nueva generación RTX 40x es claramente mucho más eficiente. Más información sobre la eficiencia de la nueva generación RTX 40x aquí.
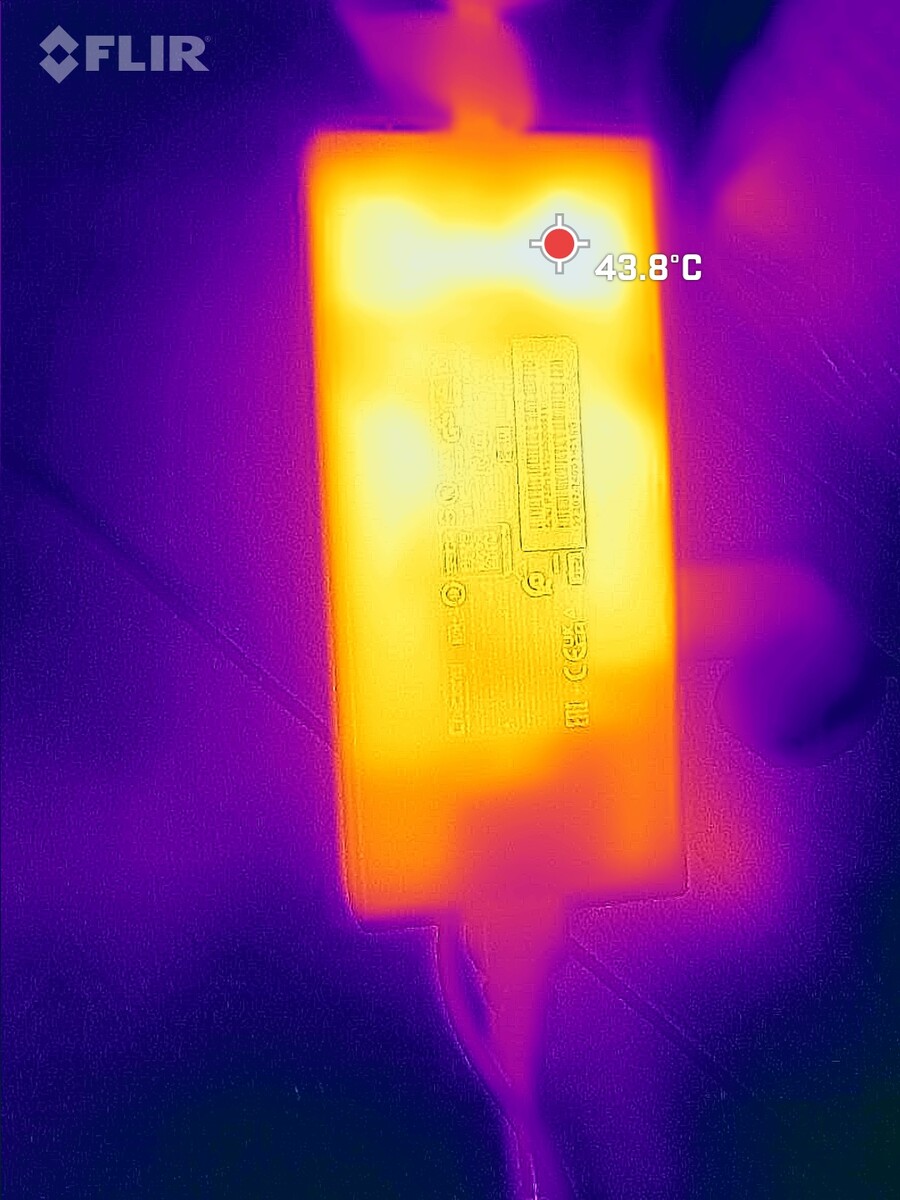
Al jugar con Witcher 3, el consumo medio es de unos 158 W. La fuente de alimentación estándar de tamaño medio de Chicony tiene una potencia nominal de 240 W y soporta bien picos de carga de hasta 192 W en las pruebas de estrés.
| Off / Standby | |
| Ocioso | |
| Carga |
|
Clave:
min: | |
| Gigabyte AERO 16 OLED BSF i9-13900H, GeForce RTX 4070 Laptop GPU, Gigabyte AG470S1TB-SI B10, OLED, 3840x2400, 16" | Gigabyte Aero 16 YE5 i9-12900HK, GeForce RTX 3080 Ti Laptop GPU, Phison ESR01TBMFCT, AMOLED, 3840x2400, 16" | Razer Blade 18 RTX 4070 i9-13950HX, GeForce RTX 4070 Laptop GPU, SSSTC CA6-8D1024, IPS, 2560x1600, 18" | Asus ZenBook Pro 16X OLED UX7602ZM-ME115W i9-12900H, GeForce RTX 3060 Laptop GPU, Samsung PM9A1 MZVL21T0HCLR, OLED, 3840x2400, 16" | Asus TUF Gaming A16 FA617 R7 7735HS, Radeon RX 7600S, Micron 2400 MTFDKBA1T0QFM, IPS-Level, 1920x1200, 16" | MSI CreatorPro Z16P B12UKST i7-12700H, RTX A3000 Laptop GPU, Samsung PM9A1 MZVL21T0HCLR, IPS, 2560x1600, 16" | Medio NVIDIA GeForce RTX 4070 Laptop GPU | Media de la clase Gaming | |
|---|---|---|---|---|---|---|---|---|
| Power Consumption | -64% | -84% | 4% | 14% | 2% | -16% | -24% | |
| Idle Minimum * (Watt) | 11.8 | 26 -120% | 24.5 -108% | 11.1 6% | 8 32% | 10.8 8% | 13.2 ? -12% | 13 ? -10% |
| Idle Average * (Watt) | 16.1 | 30 -86% | 34.1 -112% | 11.4 29% | 11 32% | 16.3 -1% | 18.2 ? -13% | 19 ? -18% |
| Idle Maximum * (Watt) | 17 | 37 -118% | 47.7 -181% | 14.4 15% | 16 6% | 16.9 1% | 24.6 ? -45% | 24.6 ? -45% |
| Load Average * (Watt) | 100.6 | 127 -26% | 140 -39% | 137.4 -37% | 97 4% | 111.7 -11% | 97 ? 4% | 110.7 ? -10% |
| Witcher 3 ultra * (Watt) | 158 | 176 -11% | 202 -28% | 136 14% | 161.5 -2% | 152.1 4% | ||
| Load Maximum * (Watt) | 192 | 236 -23% | 261 -36% | 197 -3% | 168 12% | 177.4 8% | 221 ? -15% | 259 ? -35% |
* ... más pequeño es mejor
Power Consumption Witcher 3 / Stress Test
Power Consumption with an External Monitor
Duración de la batería
La duración de la batería depende mucho del modo seleccionado, y la brillante pantalla OLED también consume bastante. El portátil sigue teniendo una batería de 88 Wh. Debido al menor consumo general, se pueden lograr mayores duraciones con un modo de ahorro de energía bien elegido.
Viendo una película o navegando por internet a brillo reducido, obtenemos algo menos de 7.5 horas cada uno, un buen valor. Gigabyte ha activado automáticamente el modo de ahorro de energía. Con el brillo al máximo, la autonomía baja a 5,5 horas.
| Gigabyte AERO 16 OLED BSF i9-13900H, GeForce RTX 4070 Laptop GPU, 88 Wh | Alienware x15 R2 P111F i9-12900H, GeForce RTX 3080 Ti Laptop GPU, 87 Wh | MSI Creator Z16P B12UHST i9-12900H, GeForce RTX 3080 Ti Laptop GPU, 90 Wh | Asus ROG Zephyrus Duo 16 GX650RX R9 6900HX, GeForce RTX 3080 Ti Laptop GPU, 90 Wh | Acer Predator Triton 500 SE PT516-52s-70KX i7-12700H, GeForce RTX 3080 Ti Laptop GPU, 99.98 Wh | Gigabyte Aero 16 YE5 i9-12900HK, GeForce RTX 3080 Ti Laptop GPU, 99 Wh | Media de la clase Gaming | |
|---|---|---|---|---|---|---|---|
| Duración de Batería | -20% | -35% | -7% | -3% | -13% | -7% | |
| H.264 (h) | 7.4 | 5.8 -22% | 9.3 26% | 8.2 11% | 7.5 1% | 8.32 ? 12% | |
| WiFi v1.3 (h) | 7.5 | 6 -20% | 5.2 -31% | 7.8 4% | 5.7 -24% | 6.4 -15% | 7.11 ? -5% |
| Load (h) | 2.1 | 1 -52% | 1 -52% | 2.2 5% | 1.6 -24% | 1.502 ? -28% | |
| Reader / Idle (h) | 12.5 | 8.9 | 8.27 ? |
Pro
Contra
Veredicto - Un paso más hacia la meta
Hasta ahora, los portátiles de alto rendimiento solían ser grandes, ruidosos y calurosos, lo que los hacía aptos para jugadores o creativos, según el diseño. En el futuro, lo ideal serían portátiles silenciosos, frescos y, si fuera necesario, pequeños y móviles. El Aero es un buen paso en esta dirección, aunque la tecnología actual diste mucho de ser ideal.
El Aero rinde mejor que su grueso predecesor con la RTX 3080 Ti (también de sólo 105 W), pero su eficiente RTX 4070 consume notablemente menos y se mantiene más fresca, aunque no más silenciosa. Si buscas discreción, te vendrán bien los numerosos modos de energía y las opciones de ajuste manual del Centro de Control. Esto te permite adaptar el rendimiento y las emisiones del Aero a cada situación o entorno. Dado que el Aero actual obtiene mejores puntuaciones en la categoría de valoración "Juegos" (88%) que en la categoría "Multimedia" (86%), lo calificamos como portátil para juegos.
A los jugones les puede molestar que la pantalla OLED, por lo demás genial, sólo funcione a 60 Hz. Por lo demás, el resto de críticas, como los altavoces desequilibrados, son relativamente leves.
El Aero 16 OLED no sólo tiene una gran pantalla, sino que también es particularmente delgado y, gracias a la eficiente RTX 4070, también potente y, sin embargo, comparativamente económico y fresco.
La competencia nunca duerme y también está explorando las posibilidades de la nueva generación RTX 40x. Hasta ahora solo hemos analizado unos pocos, así que las alternativas siguen siendo escasas.
Precio y disponibilidad
Los compradores interesados pueden consultar directamente a través de la página oficial de productos de Gigabyte aquídonde se hace clic en Comprar y se selecciona la región y el país correspondientes en la lista desplegable. A continuación, aparecerá una lista de tiendas en línea que pueden ofrecer el portátil en su país.
En EE.UU., por ejemplo, Amazon lista las dos configuraciones del Gigabyte Aero 16 OLED, a saber, una con un i9-13900H y 32 GB de RAM y la otra con un i7-13700H y 16 GB de RAM. Ambas cuestan US$2.299,00 y US$2.099,00respectivamente. Por supuesto, esto no es representativo de la disponibilidad global, que probablemente fluctuará en función de factores regionales y de envío.
Los precios son a fecha de 12.03.2023 y están sujetos a cambios.
Gigabyte AERO 16 OLED BSF
- 03/13/2023 v7 (old)
Christian Hintze
Transparencia
La selección de los dispositivos que se van a reseñar corre a cargo de nuestro equipo editorial. La muestra de prueba fue proporcionada al autor en calidad de préstamo por el fabricante o el minorista a los efectos de esta reseña. El prestamista no tuvo ninguna influencia en esta reseña, ni el fabricante recibió una copia de la misma antes de su publicación. No había ninguna obligación de publicar esta reseña. Como empresa de medios independiente, Notebookcheck no está sujeta a la autoridad de fabricantes, minoristas o editores.
Así es como prueba Notebookcheck
Cada año, Notebookcheck revisa de forma independiente cientos de portátiles y smartphones utilizando procedimientos estandarizados para asegurar que todos los resultados son comparables. Hemos desarrollado continuamente nuestros métodos de prueba durante unos 20 años y hemos establecido los estándares de la industria en el proceso. En nuestros laboratorios de pruebas, técnicos y editores experimentados utilizan equipos de medición de alta calidad. Estas pruebas implican un proceso de validación en varias fases. Nuestro complejo sistema de clasificación se basa en cientos de mediciones y puntos de referencia bien fundamentados, lo que mantiene la objetividad.Price comparison

