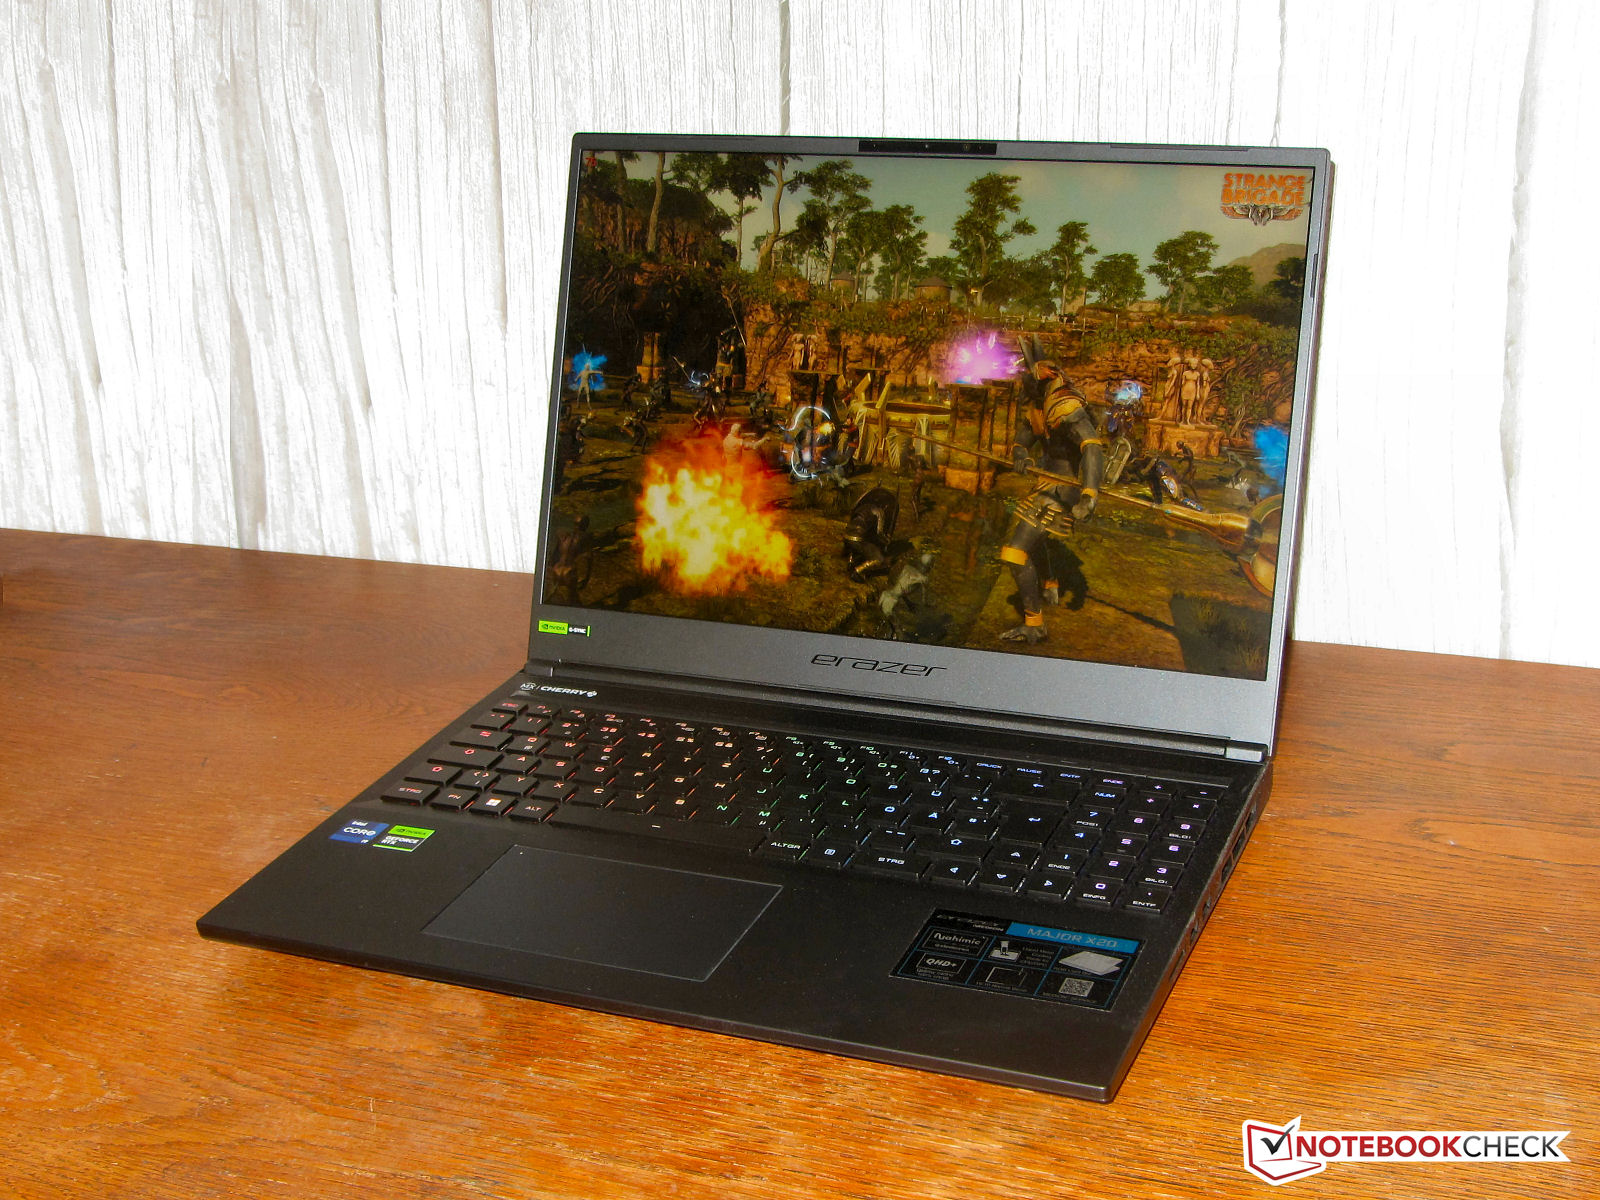
Análisis del Medion Erazer Major X20: Portátil gaming con RTX 4070 y hardware sólido

El Medion Erazer Major X20 es principalmente un portátil para juegos, pero también está hecho para otros escenarios de aplicaciones informáticas intensivas. Comparado con su predecesor https://www.notebookcheck.net/Medion-Erazer-Major-X10-laptop-review-Debut-of-Intel-Arc-A730M.650477.0.htmlel X20 ha recibido algunas actualizaciones útiles: el Arc A730M ha dado paso a un núcleo gráfico mucho más potente, el GeForce RTX 4070. Además, un teclado mecánico sustituye al modelo chiclet, mientras que uno de los dos puertos USB-C (USB 3.2 Gen 2) se ha eliminado y el restante se ha actualizado a un puerto Thunderbolt 4.
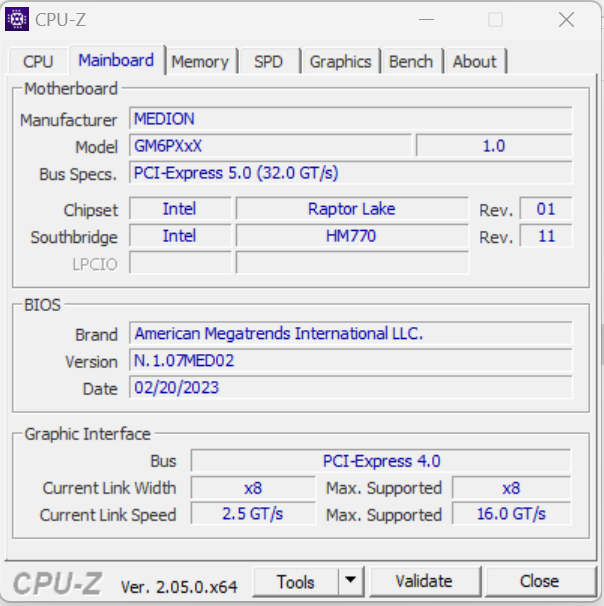
El X20 se basa en un barebone de Tongfang (GM6PX7X), que es en gran medida similar al modelo conocido del XMG Neo 16, pero falta el puerto para la refrigeración por agua. Entre los competidores se encuentran portátiles como el Aorus 15X ASFel Razer Blade 15 OLED (principios del 22) y el Asus ROG Strix G17 G713PI.
Posibles contendientes en la comparación
Valoración | Fecha | Modelo | Peso | Altura | Tamaño | Resolución | Precio |
|---|---|---|---|---|---|---|---|
| 89 % v7 (old) | 04/2023 | Medion Erazer Major X20 i9-13900HX, GeForce RTX 4070 Laptop GPU | 2.4 kg | 29 mm | 16.00" | 2560x1600 | |
| 86.2 % v7 (old) | 04/2023 | Aorus 15X ASF i7-13700HX, GeForce RTX 4070 Laptop GPU | 2.3 kg | 19.7 mm | 15.60" | 2560x1440 | |
| 89.9 % v7 (old) | 03/2023 | Razer Blade 15 OLED (Early 2022) i9-12900H, GeForce RTX 3070 Ti Laptop GPU | 2 kg | 16.99 mm | 15.60" | 2560x1440 | |
| 88.4 % v7 (old) | 04/2023 | Asus ROG Strix G17 G713PI R9 7945HX, GeForce RTX 4070 Laptop GPU | 2.8 kg | 30.7 mm | 17.30" | 2560x1440 |
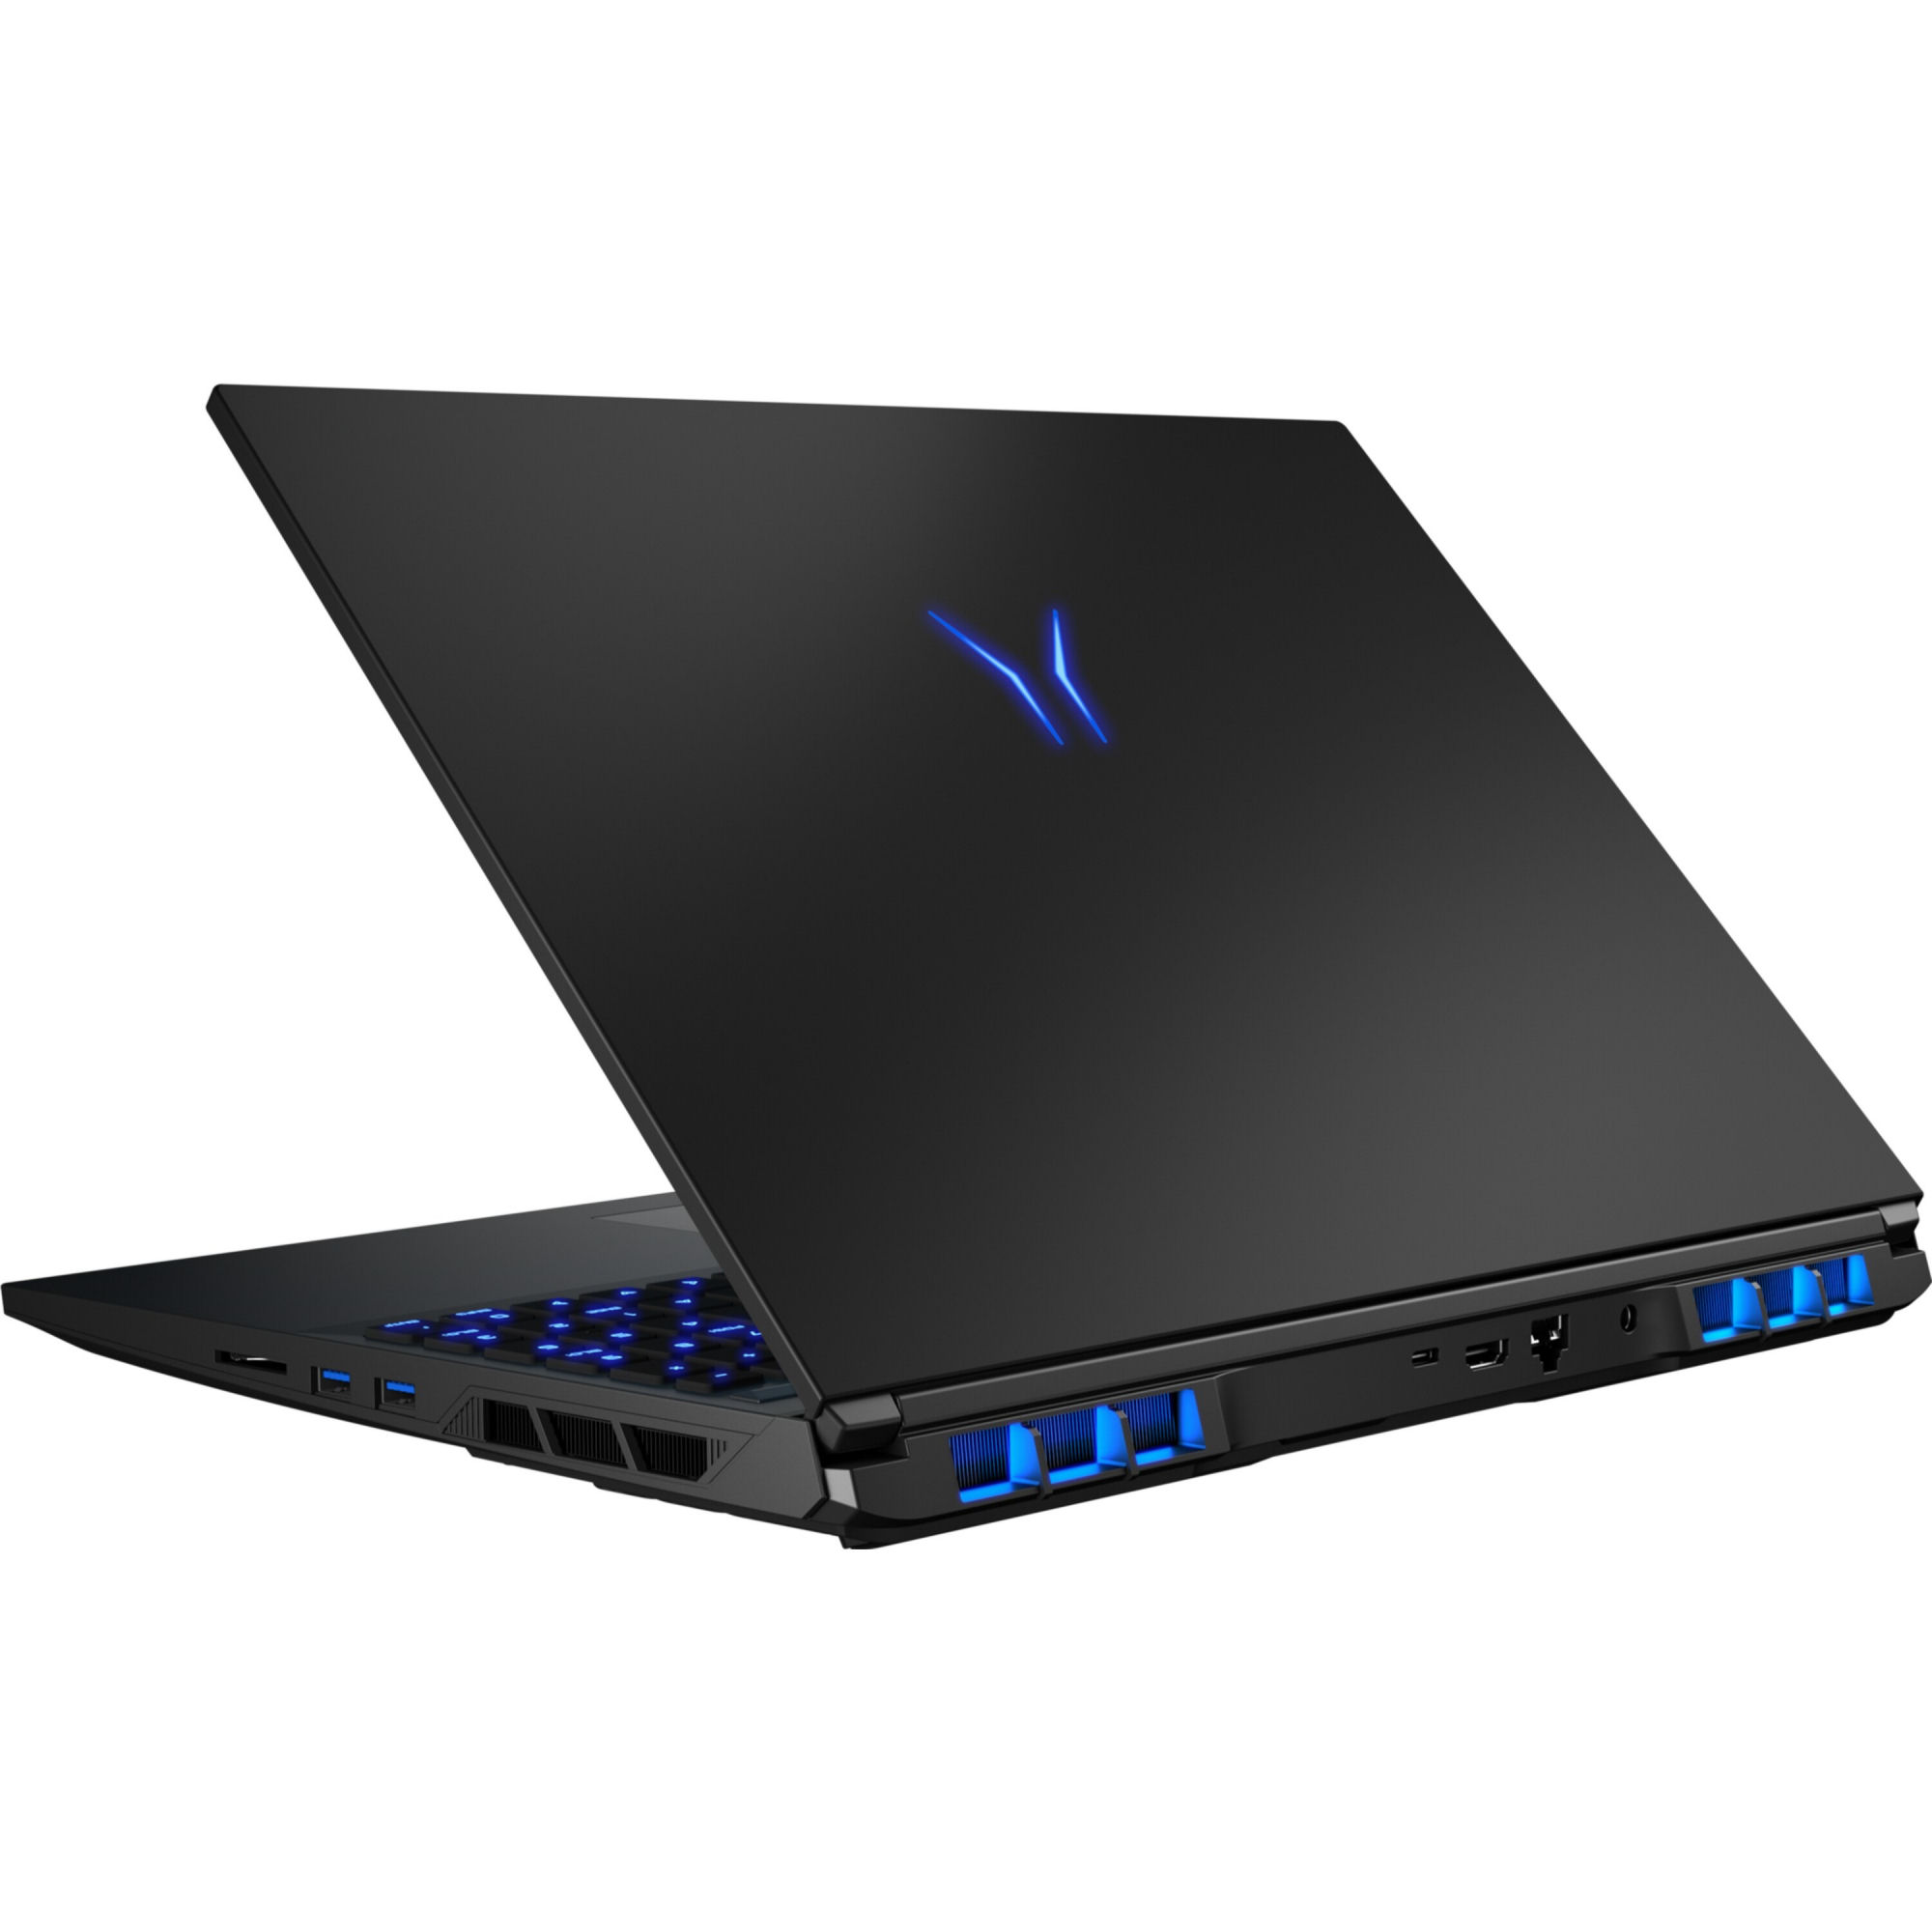
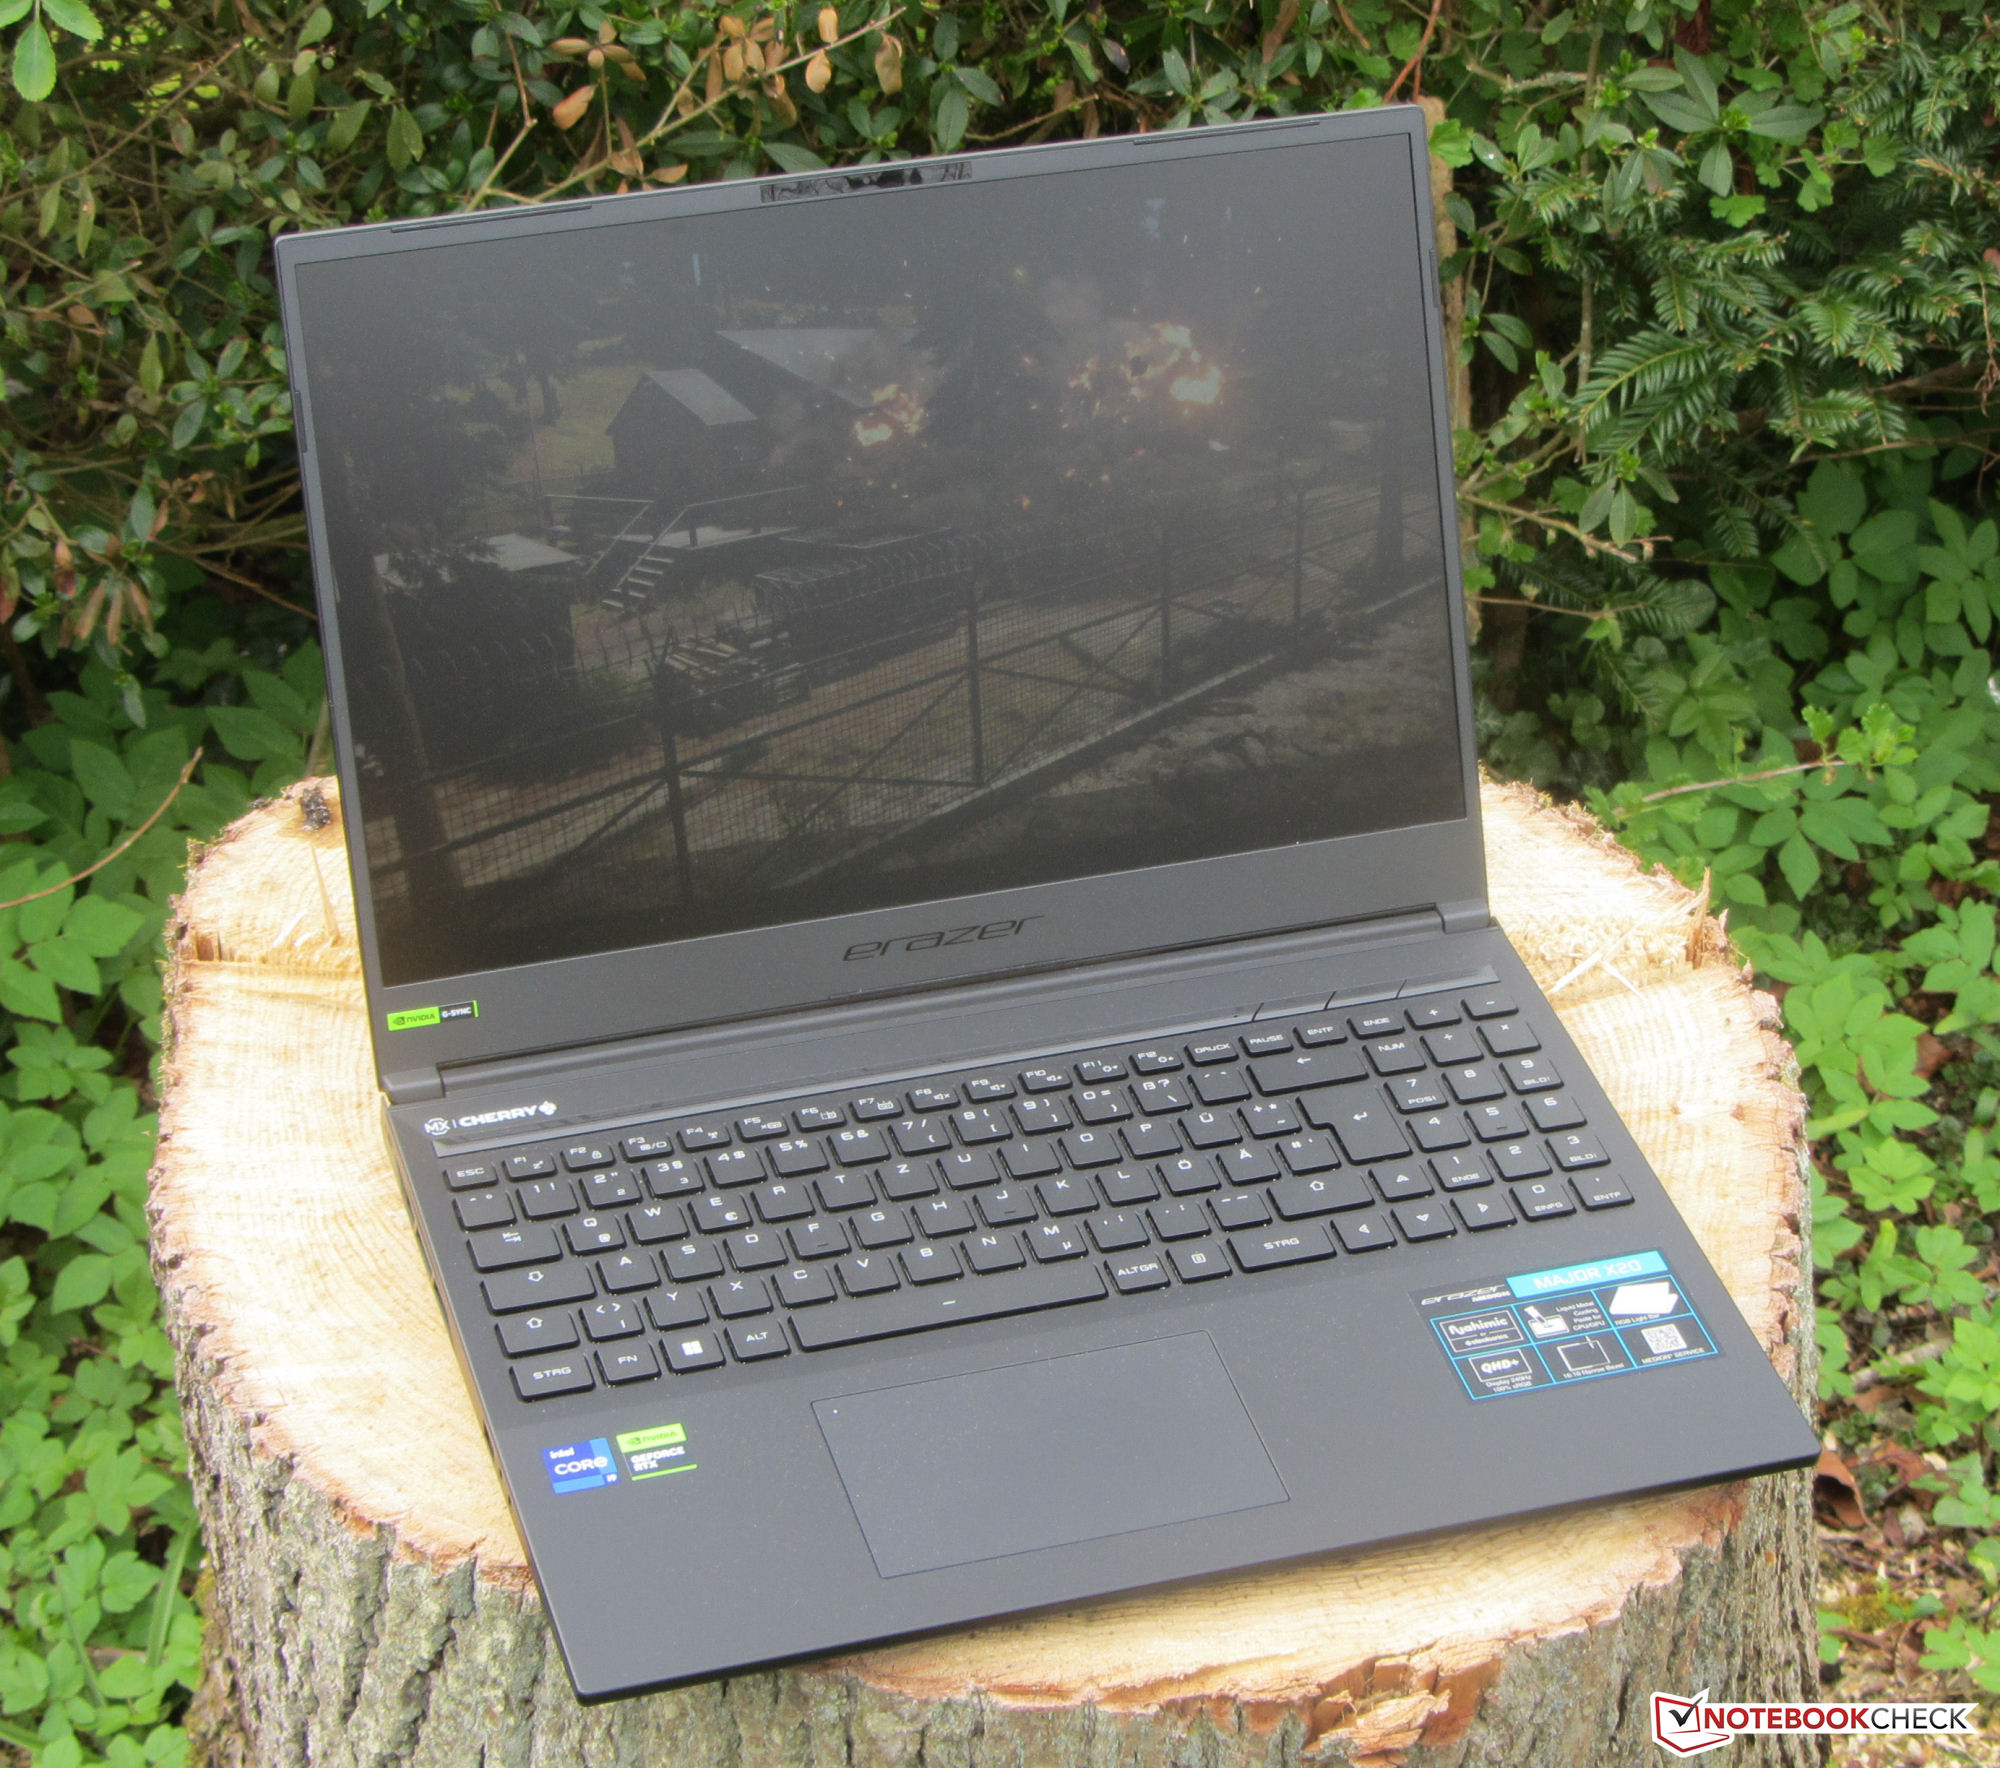
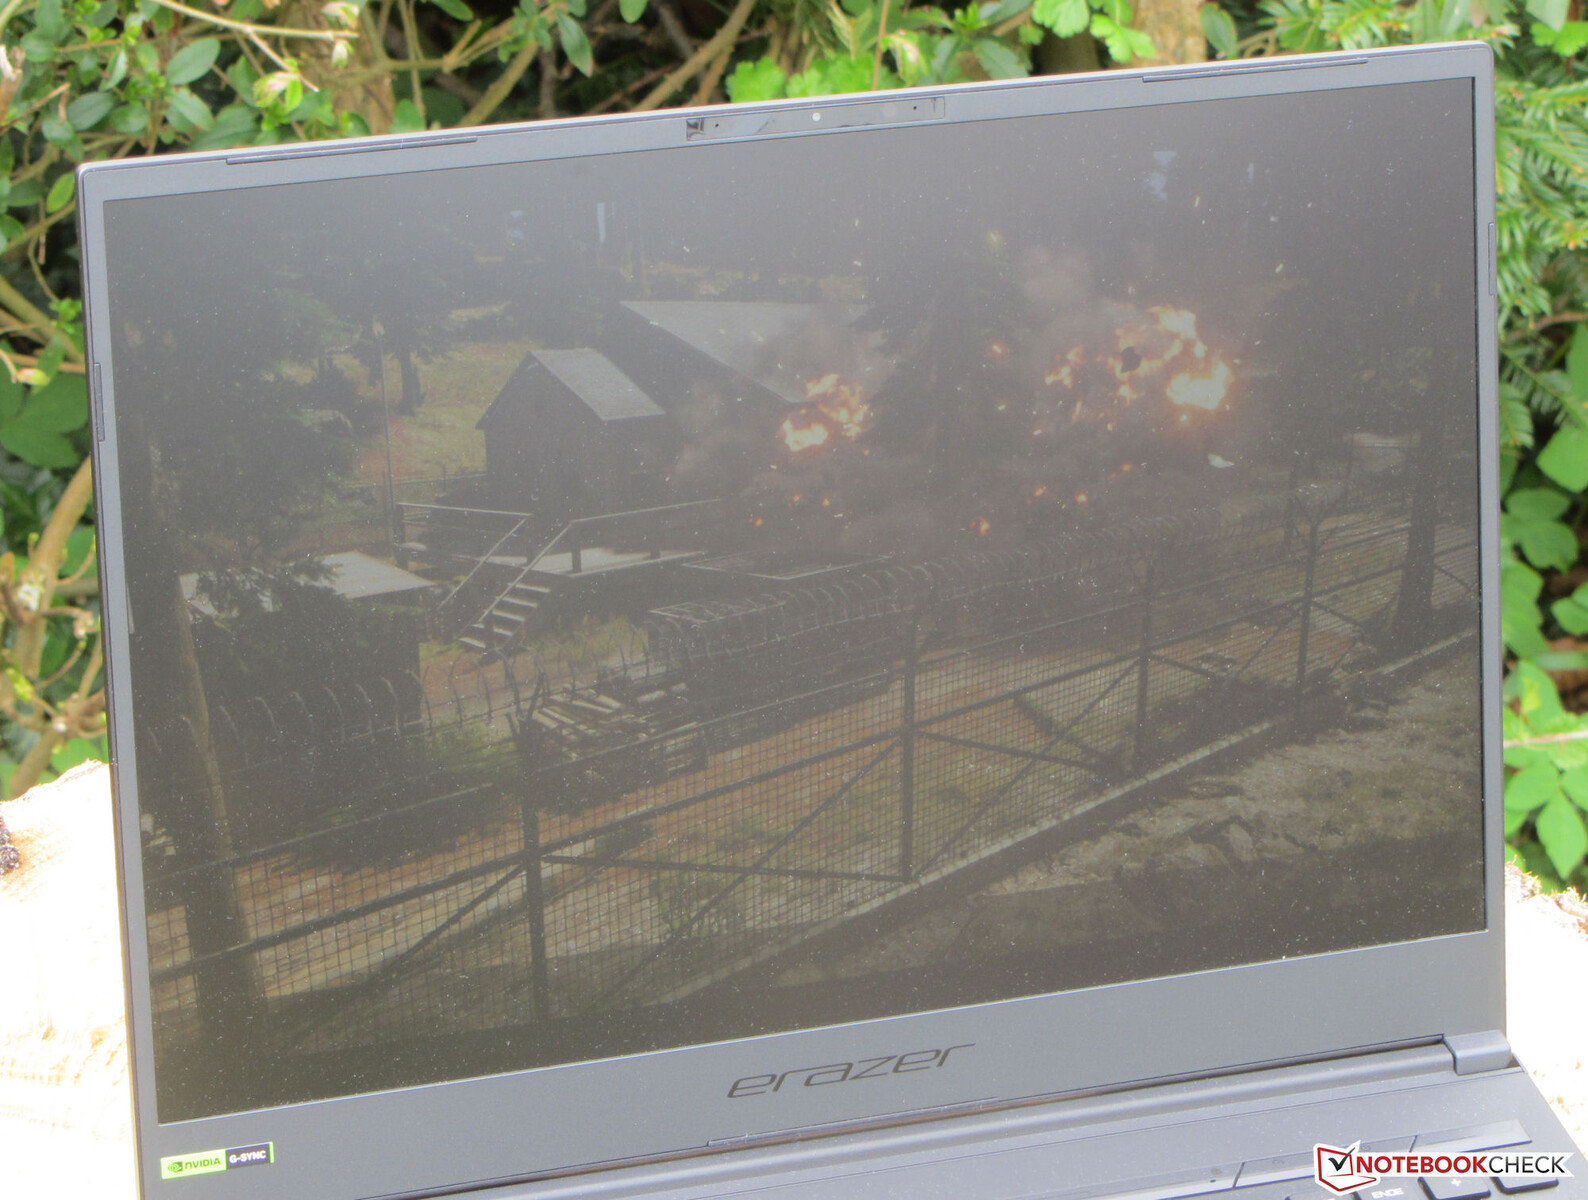
Maletín - Un exterior discreto para el portátil Medion
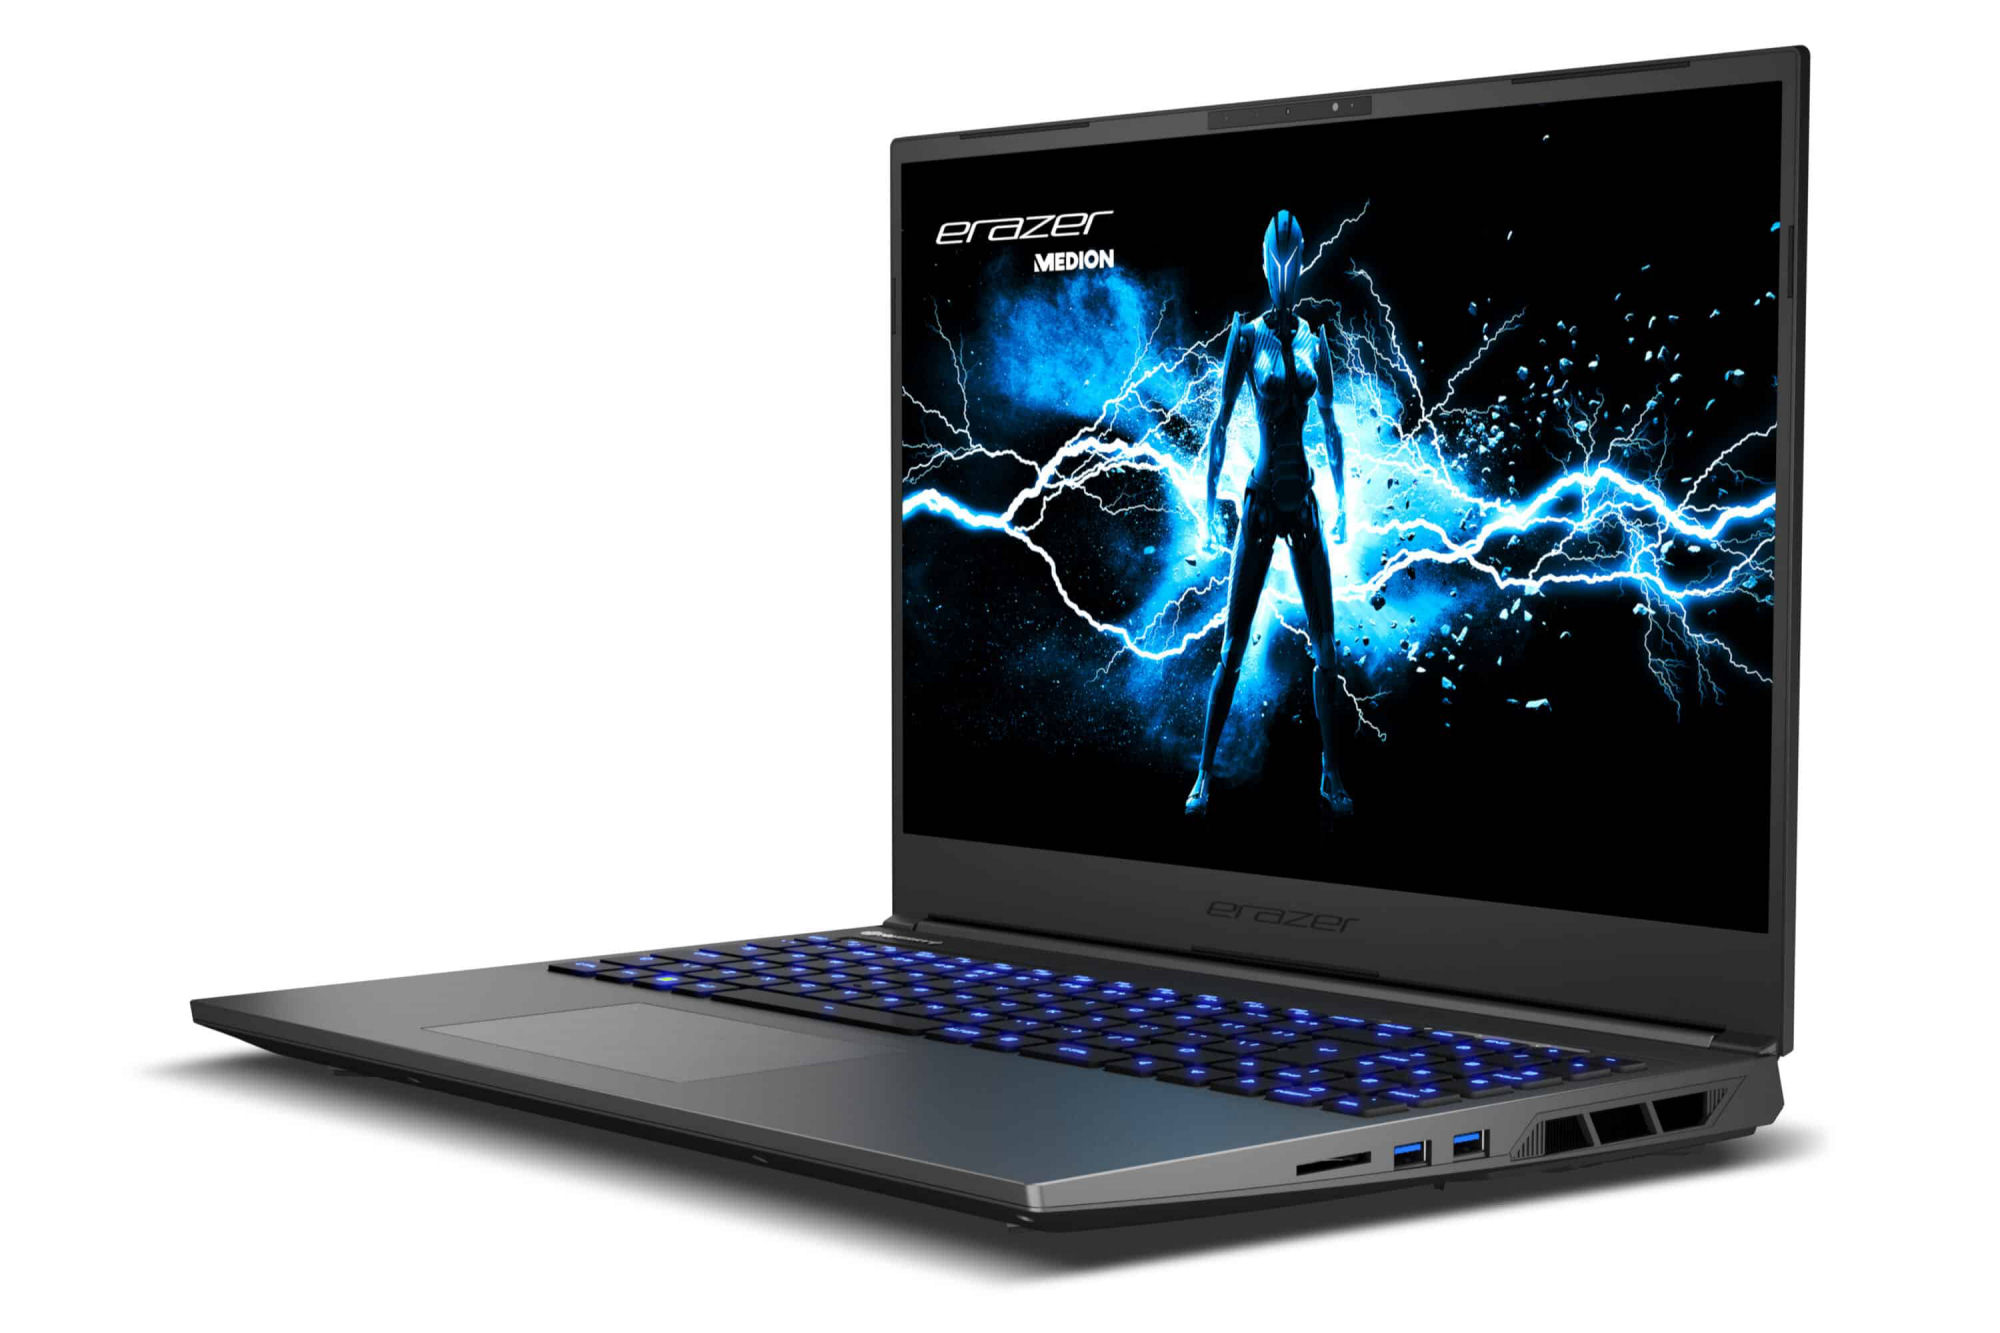
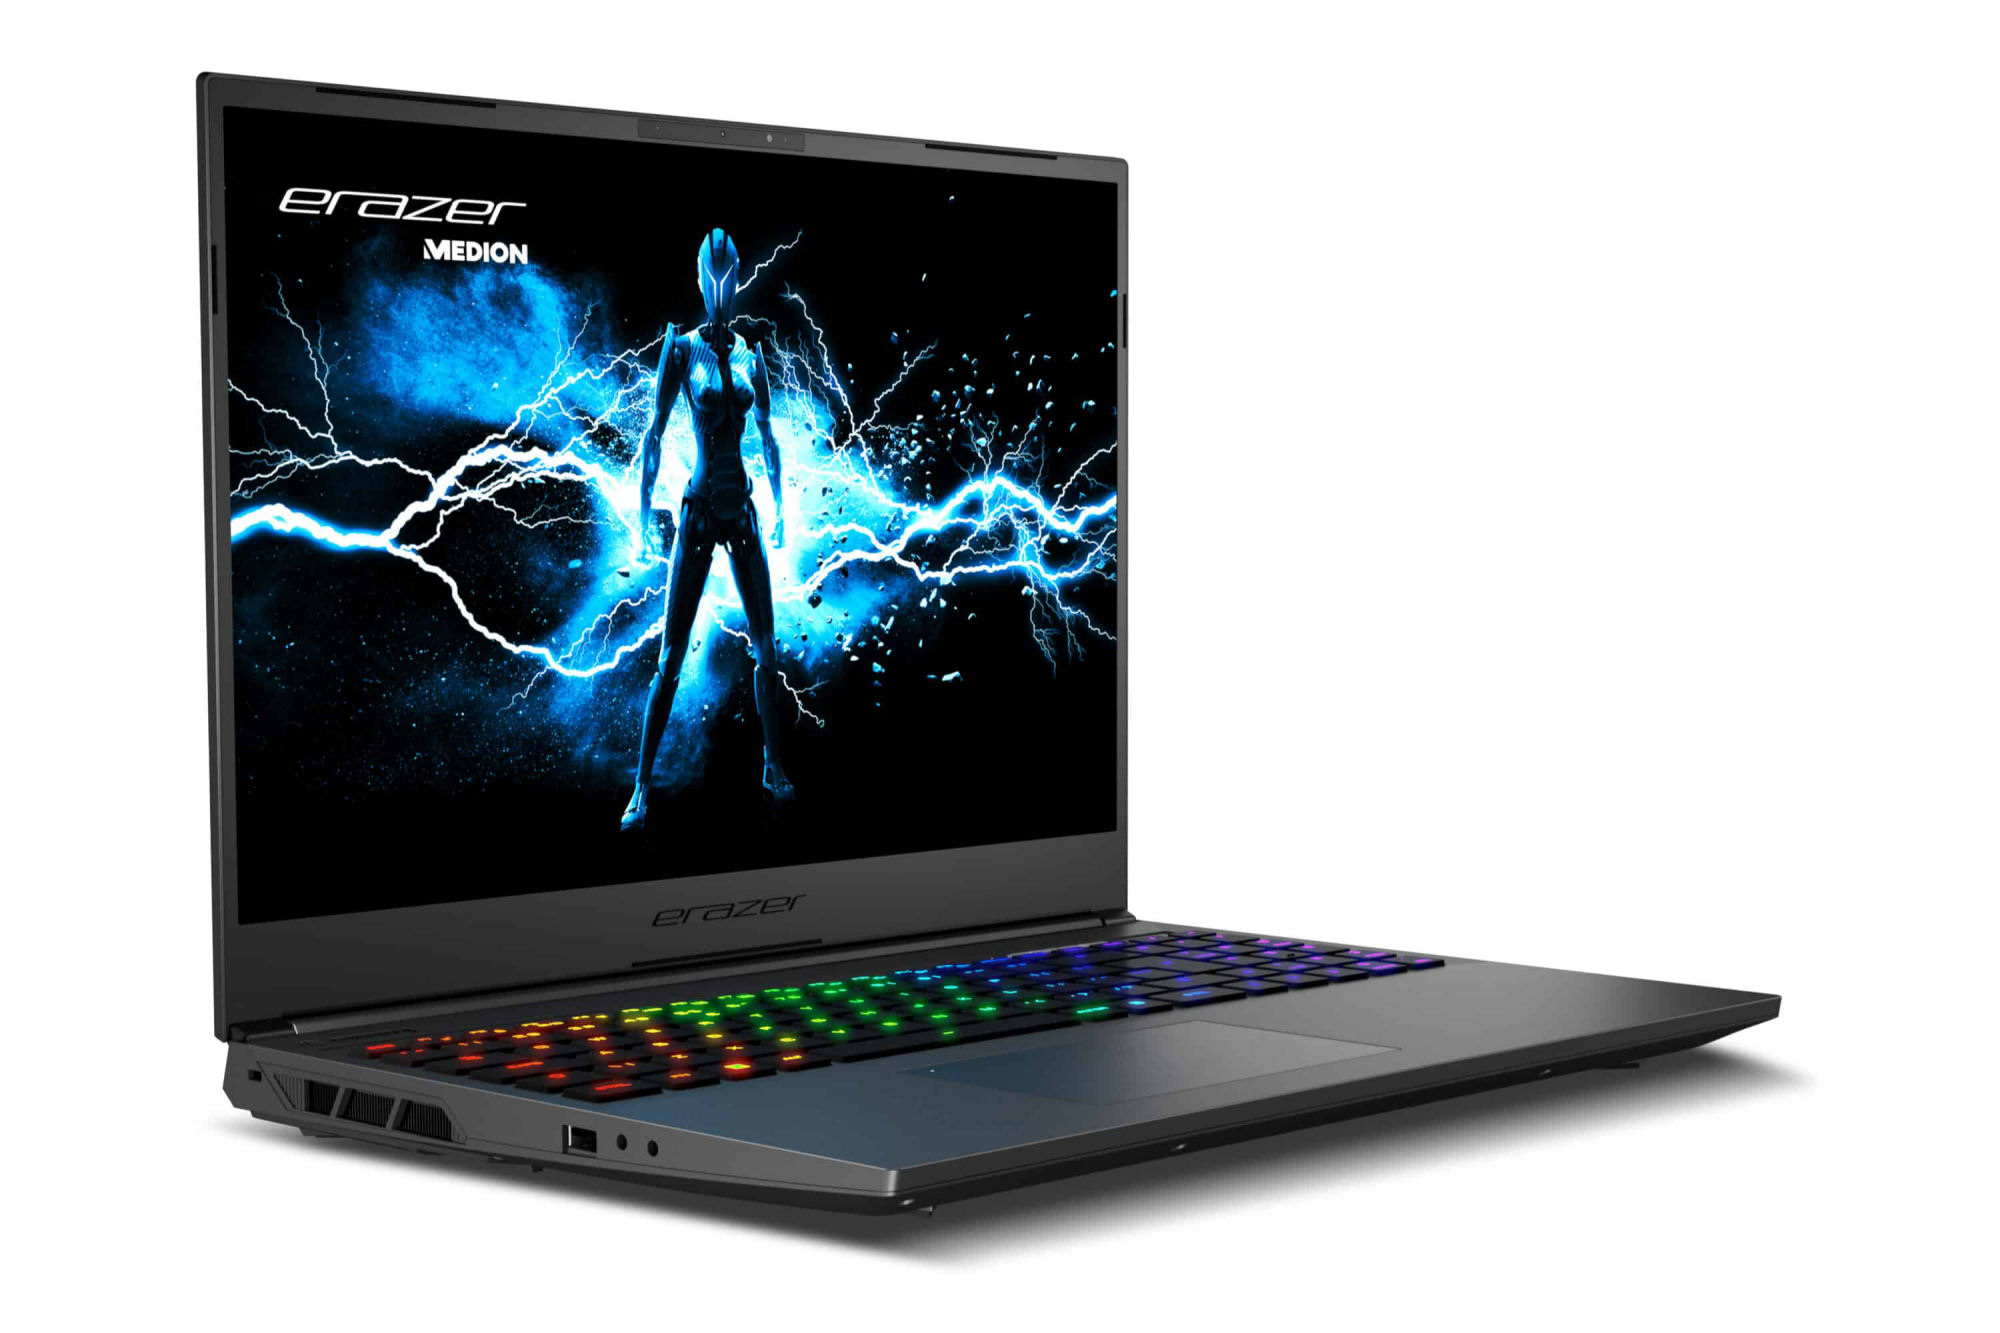
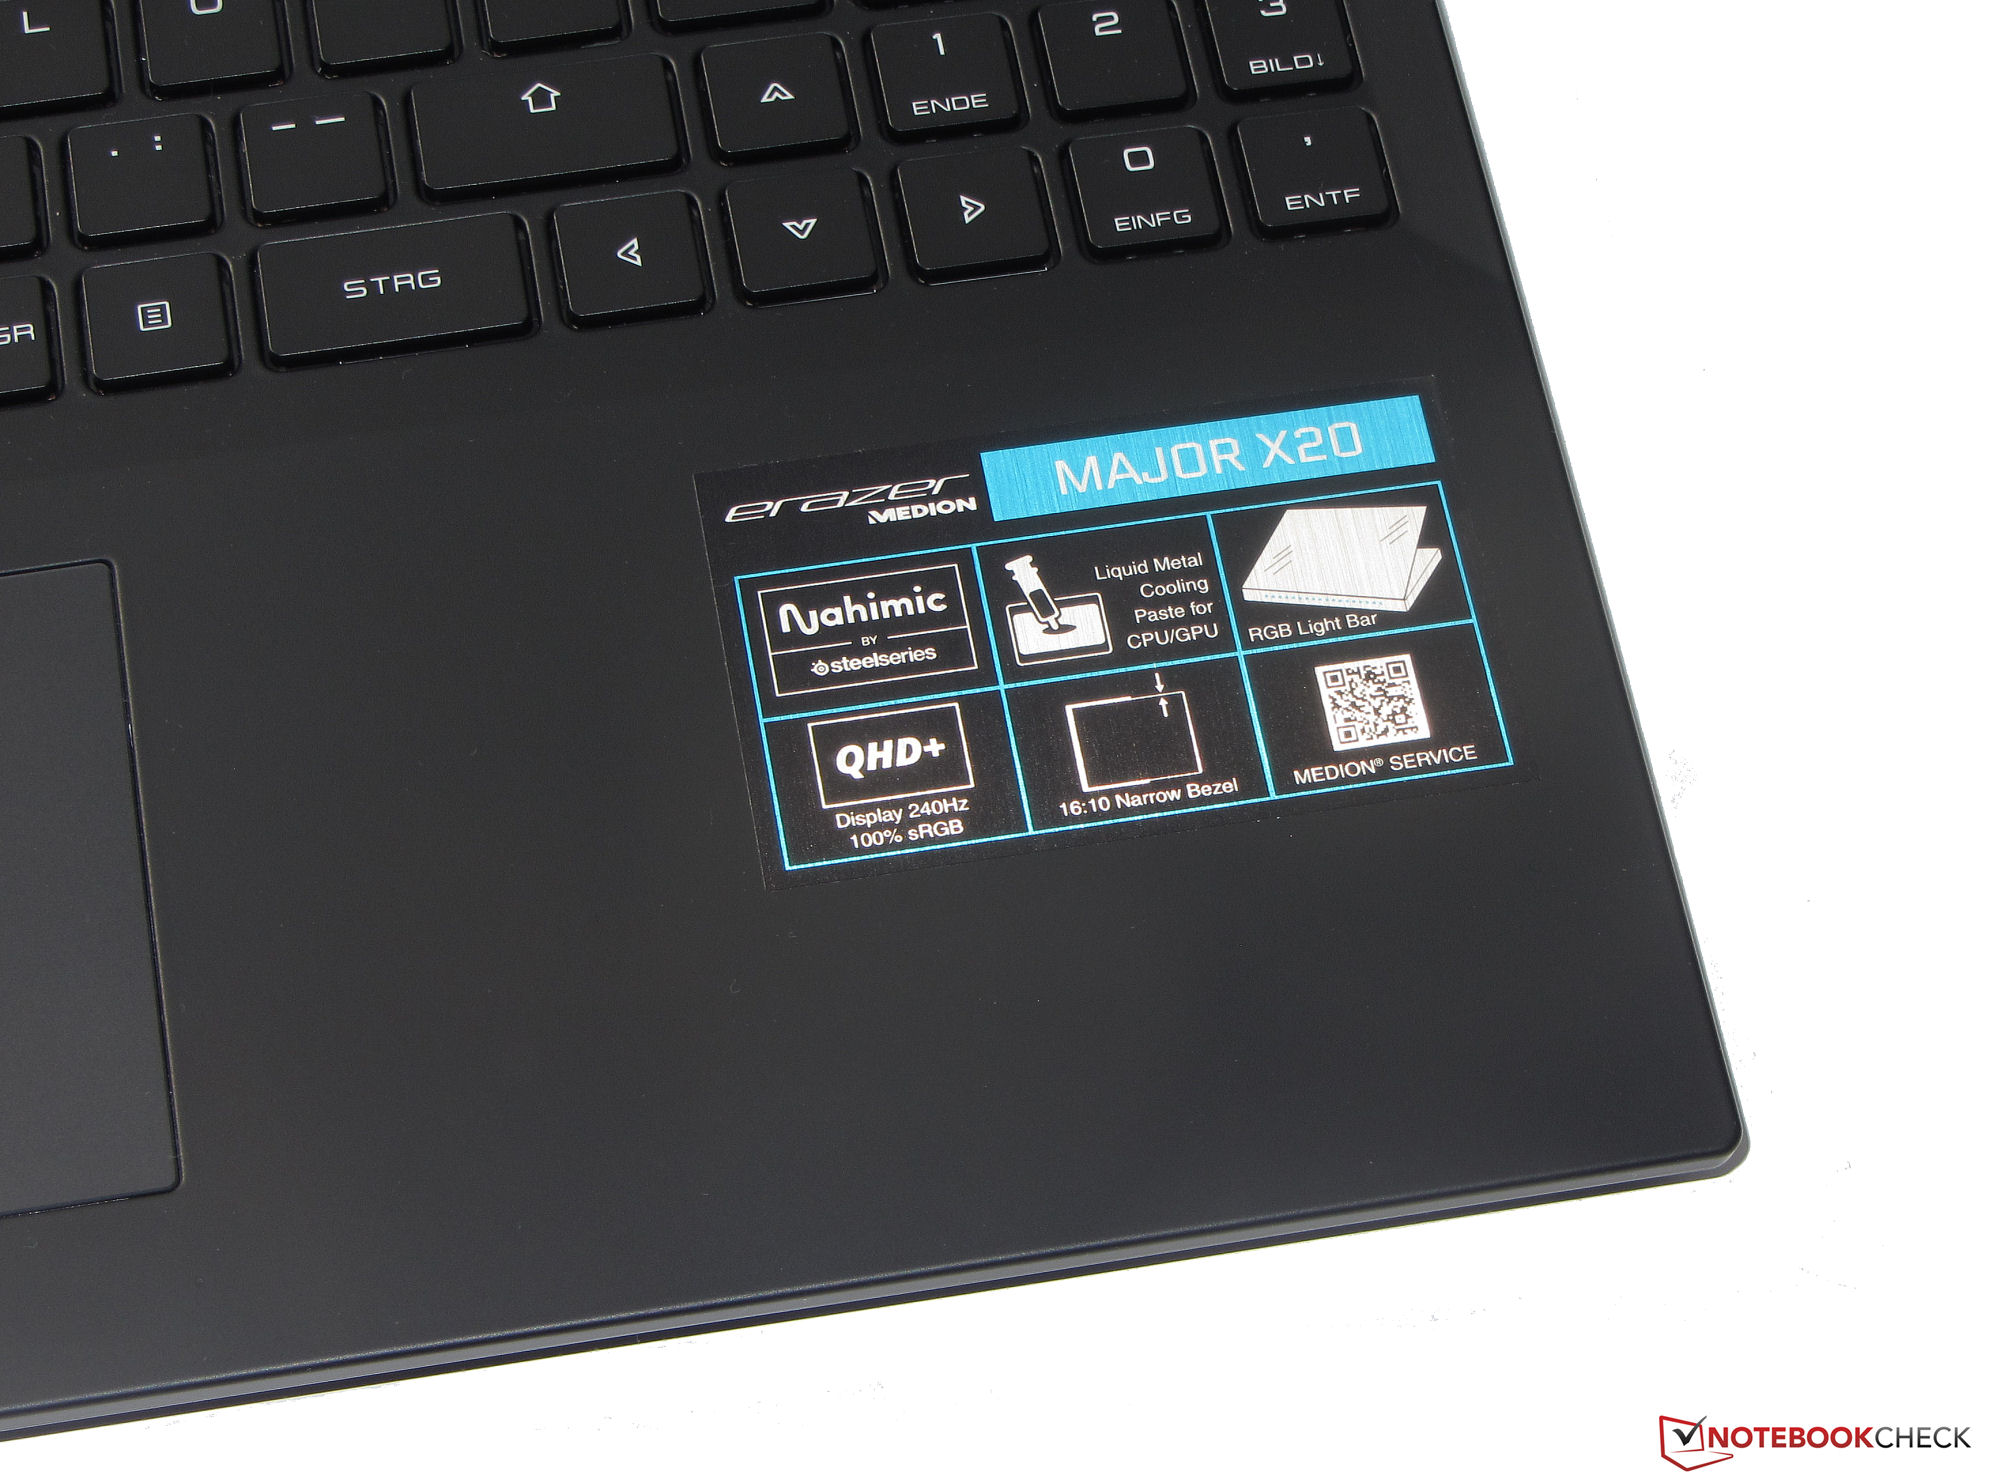
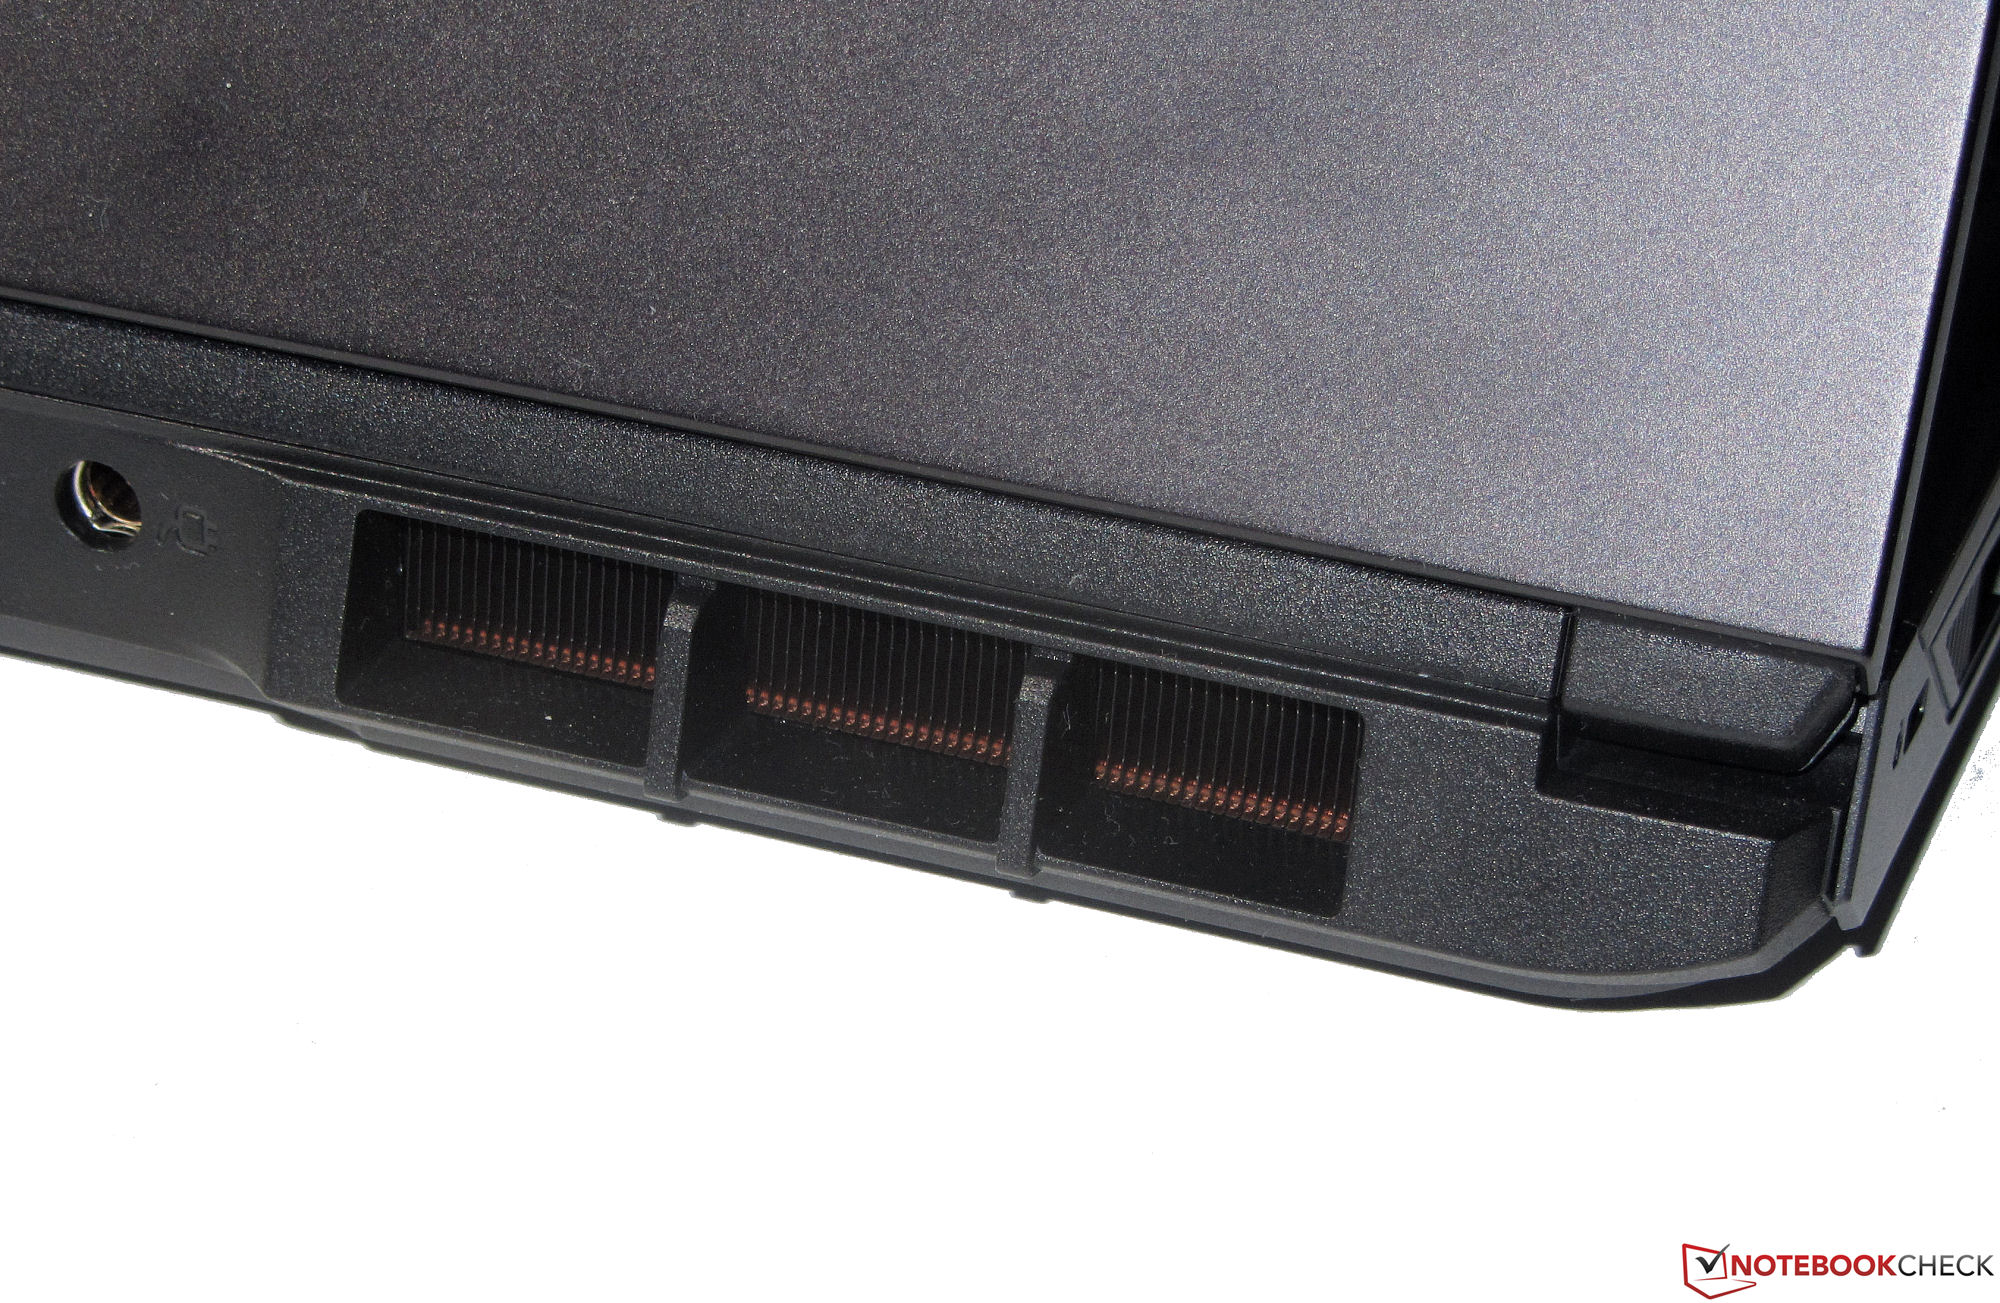
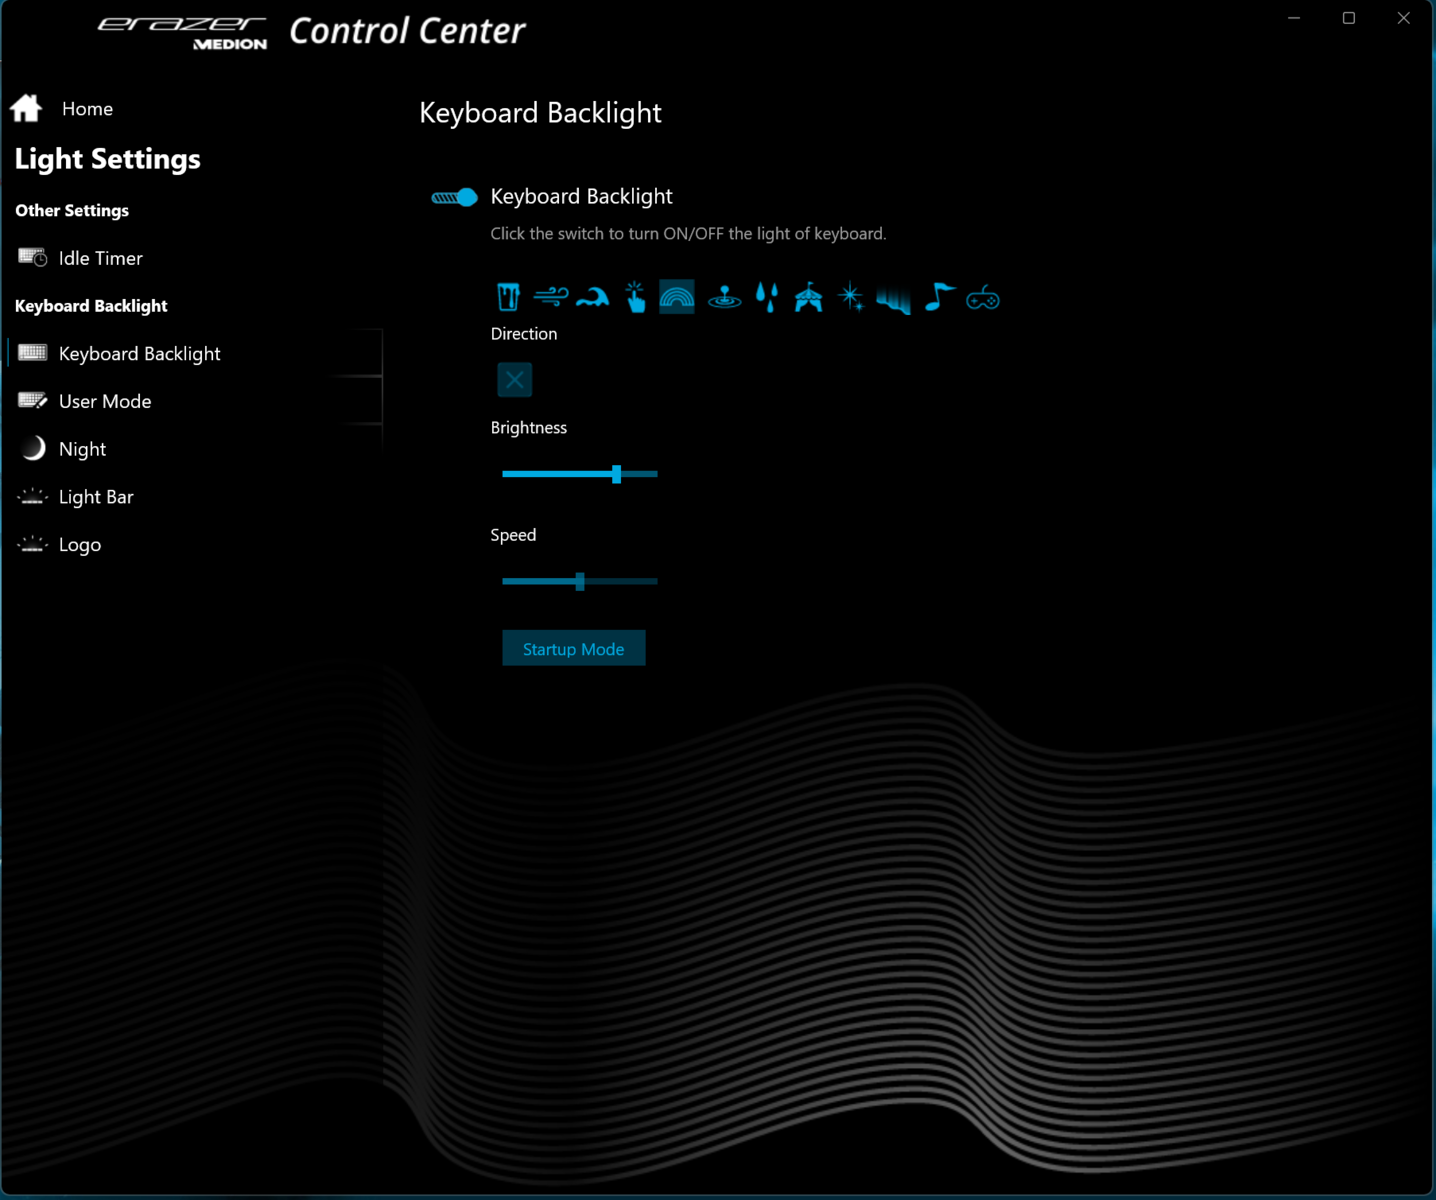
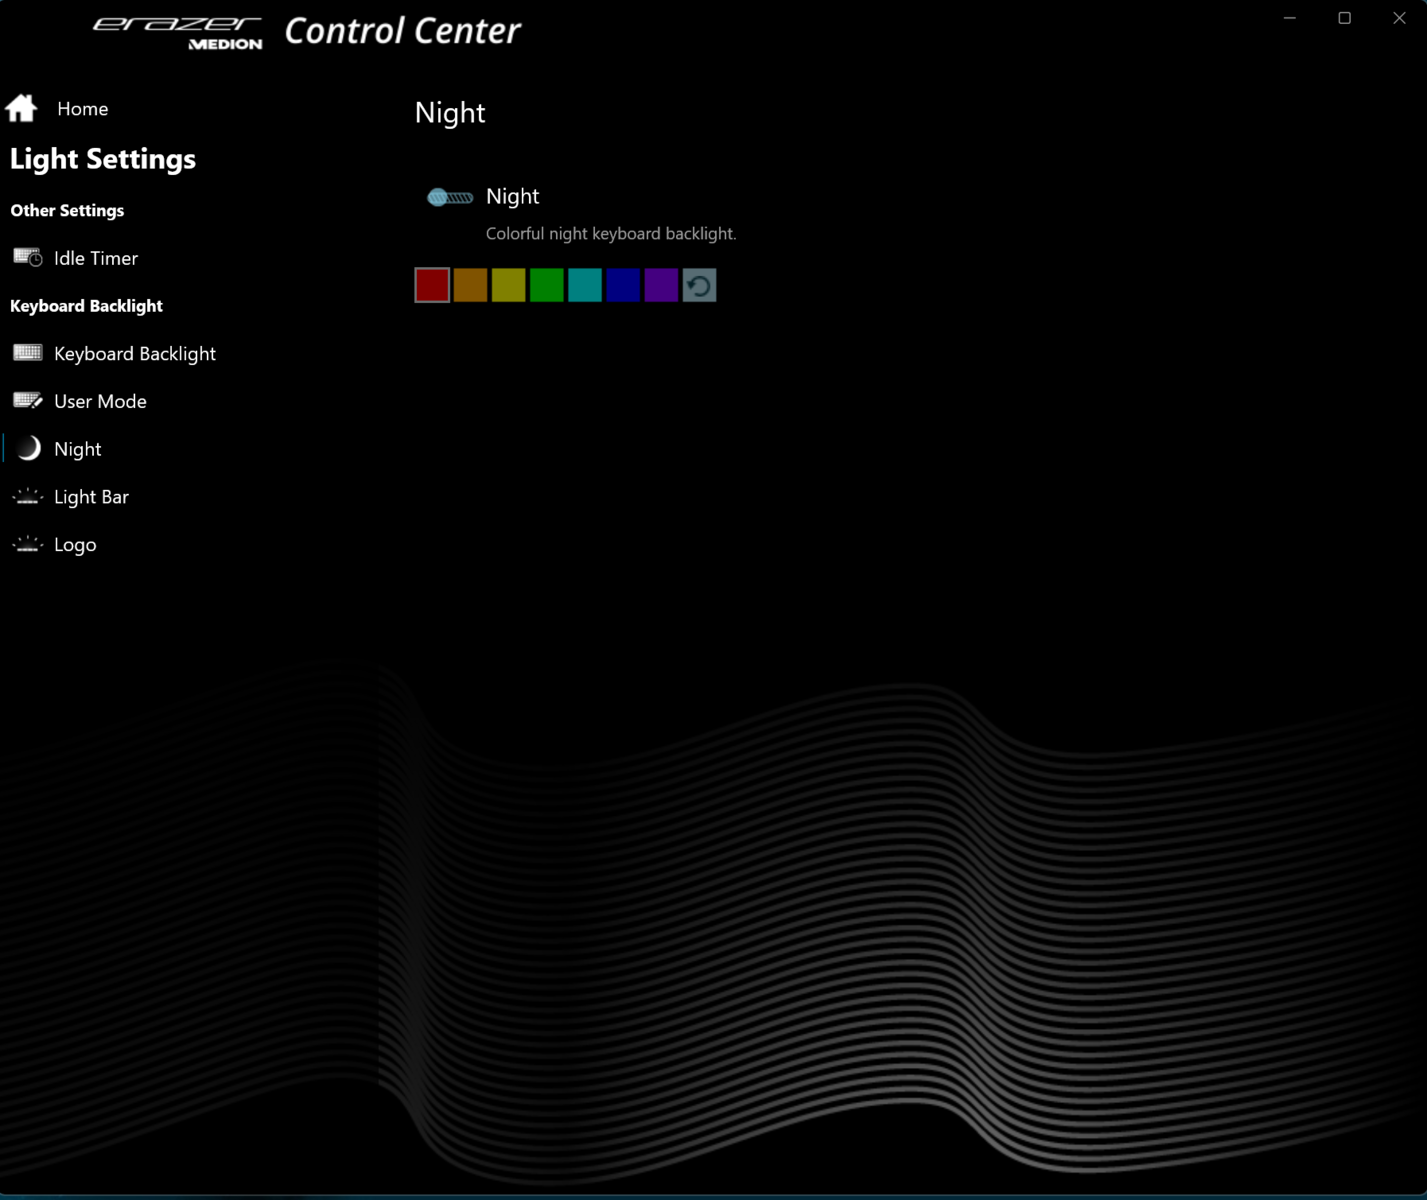
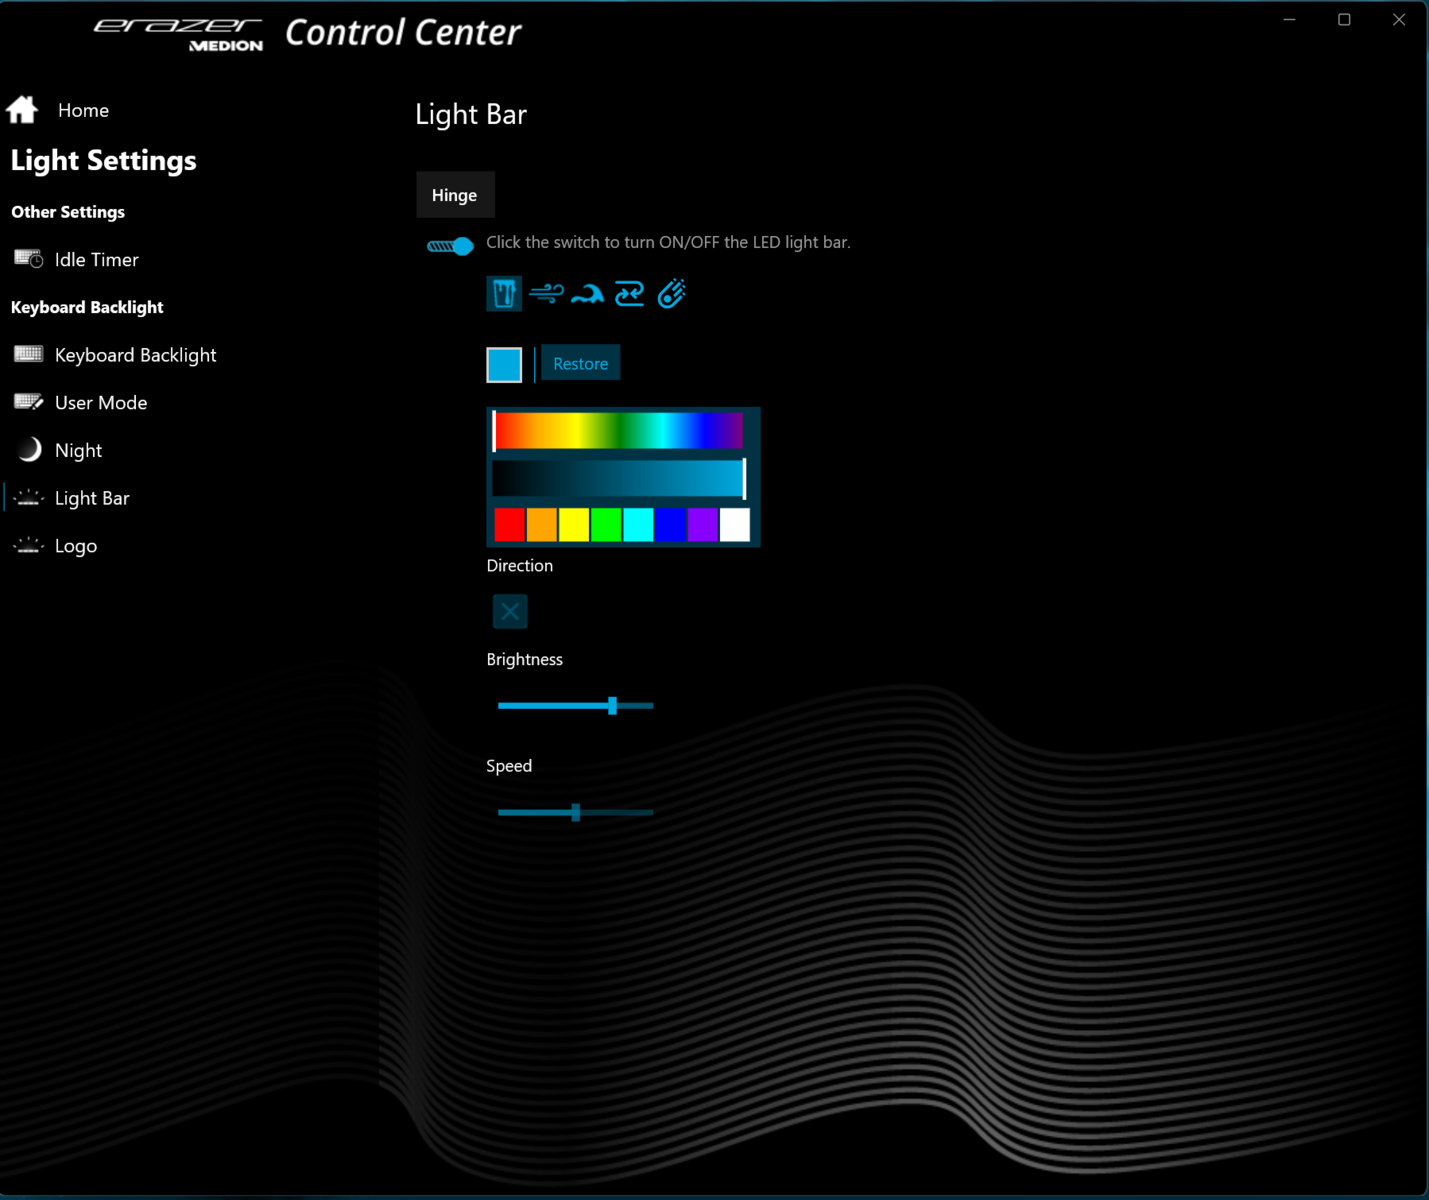
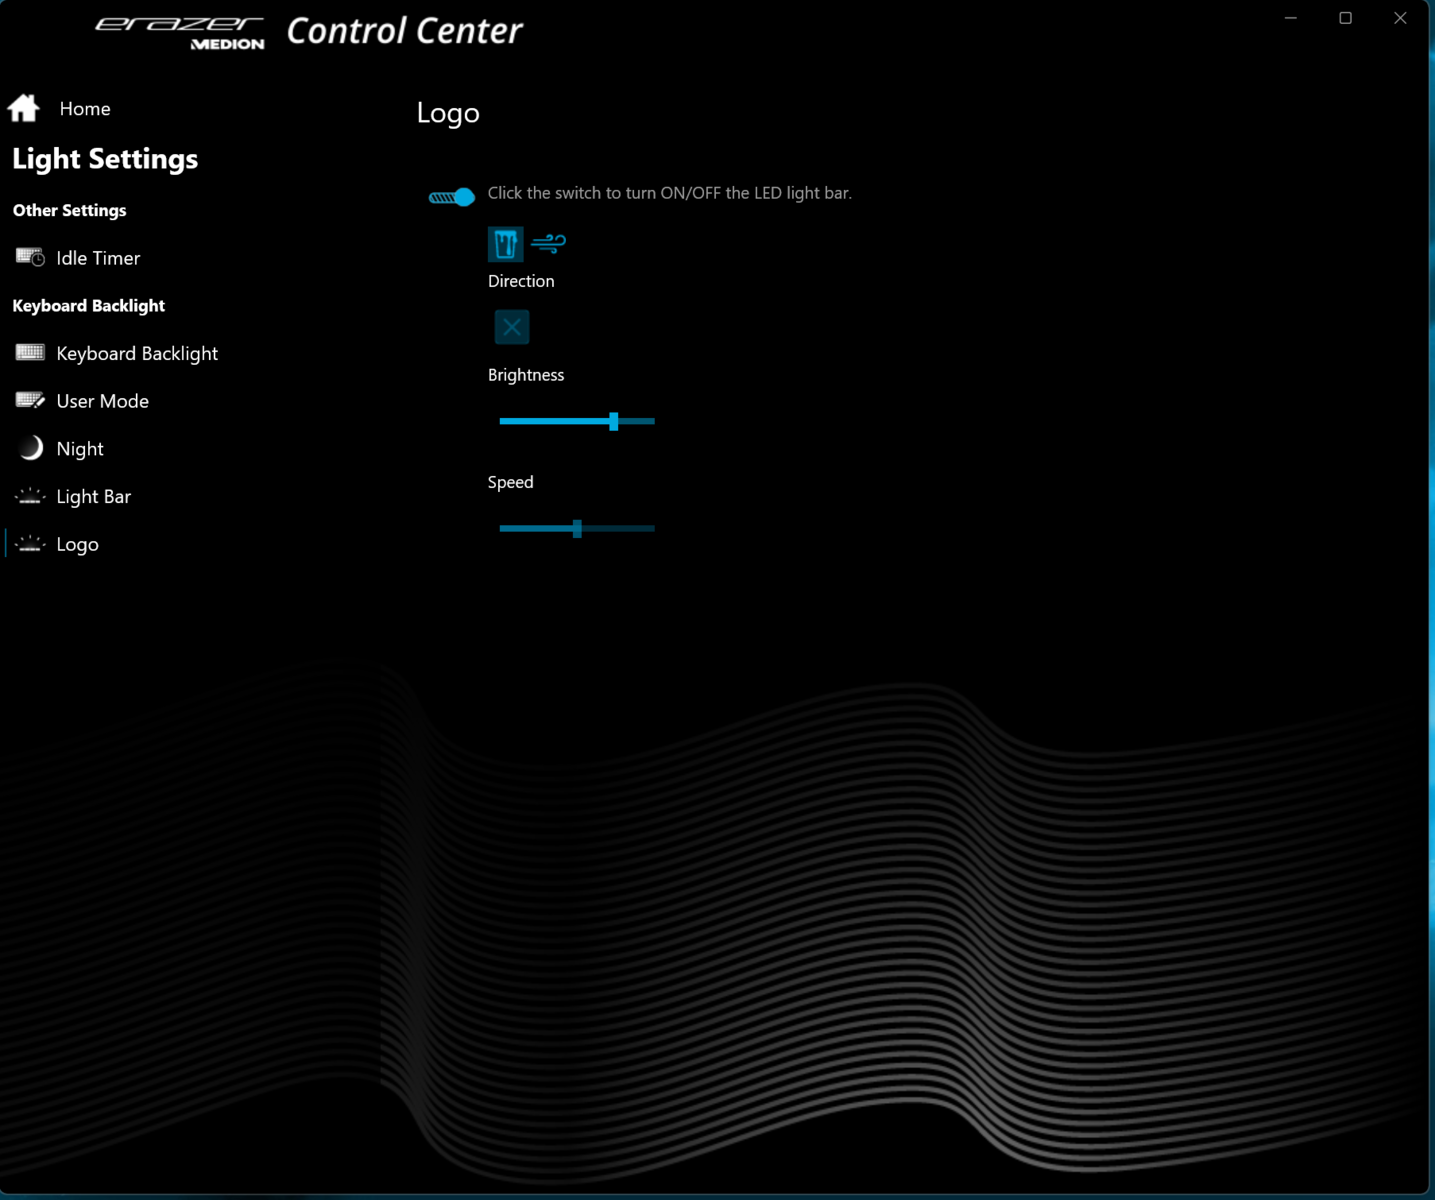
Medion utiliza un chasis elegante y sobrio que no destaca, ni siquiera en un entorno profesional. La parte trasera de la tapa de la carcasa negra mate es de aluminio, la unidad base de plástico. Un revestimiento de goma antideslizante cubre la parte superior de la unidad base. Además de la retroiluminación de las teclas (RGB), dos tiras de LED (RGB) de libre configuración en el interior de las rejillas de ventilación traseras y el logotipo de Erazer iluminado en la tapa dan un toque desenfadado a esta carcasa de aspecto serio
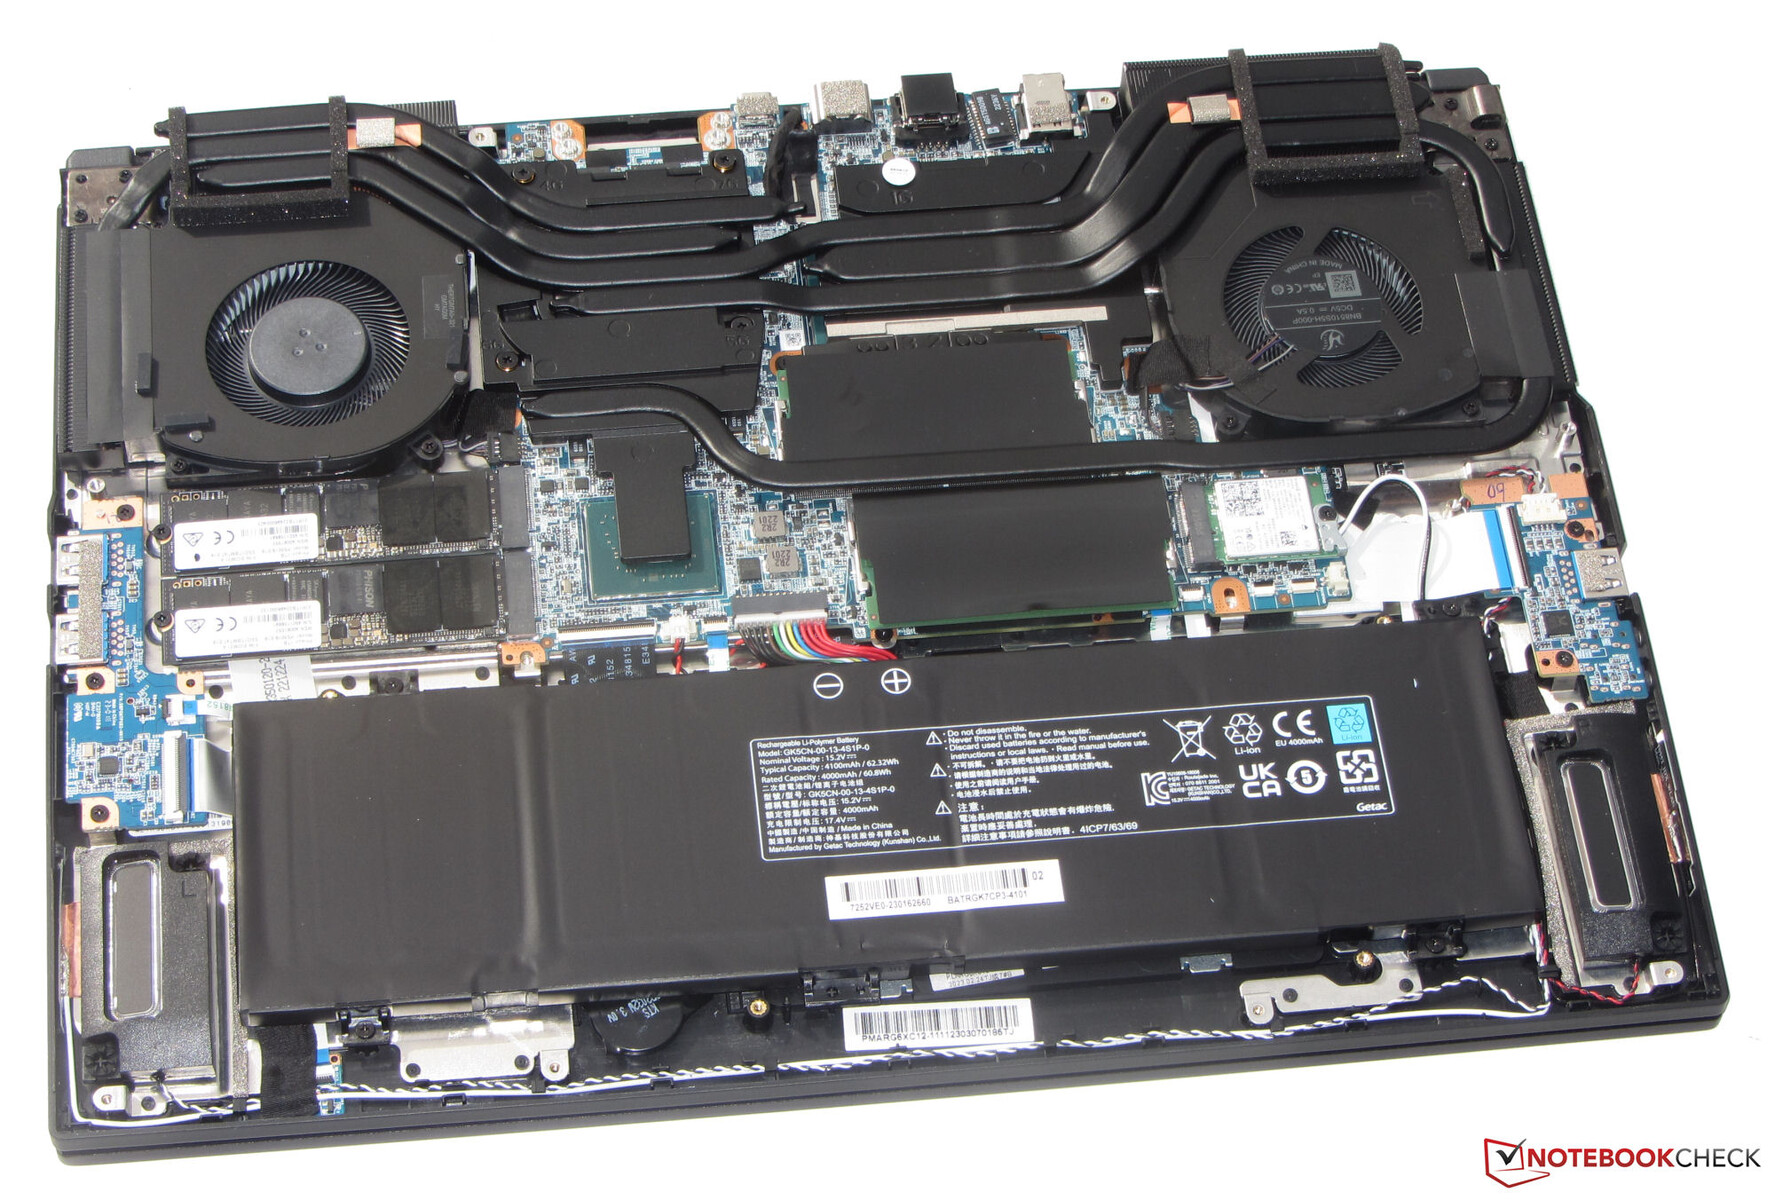
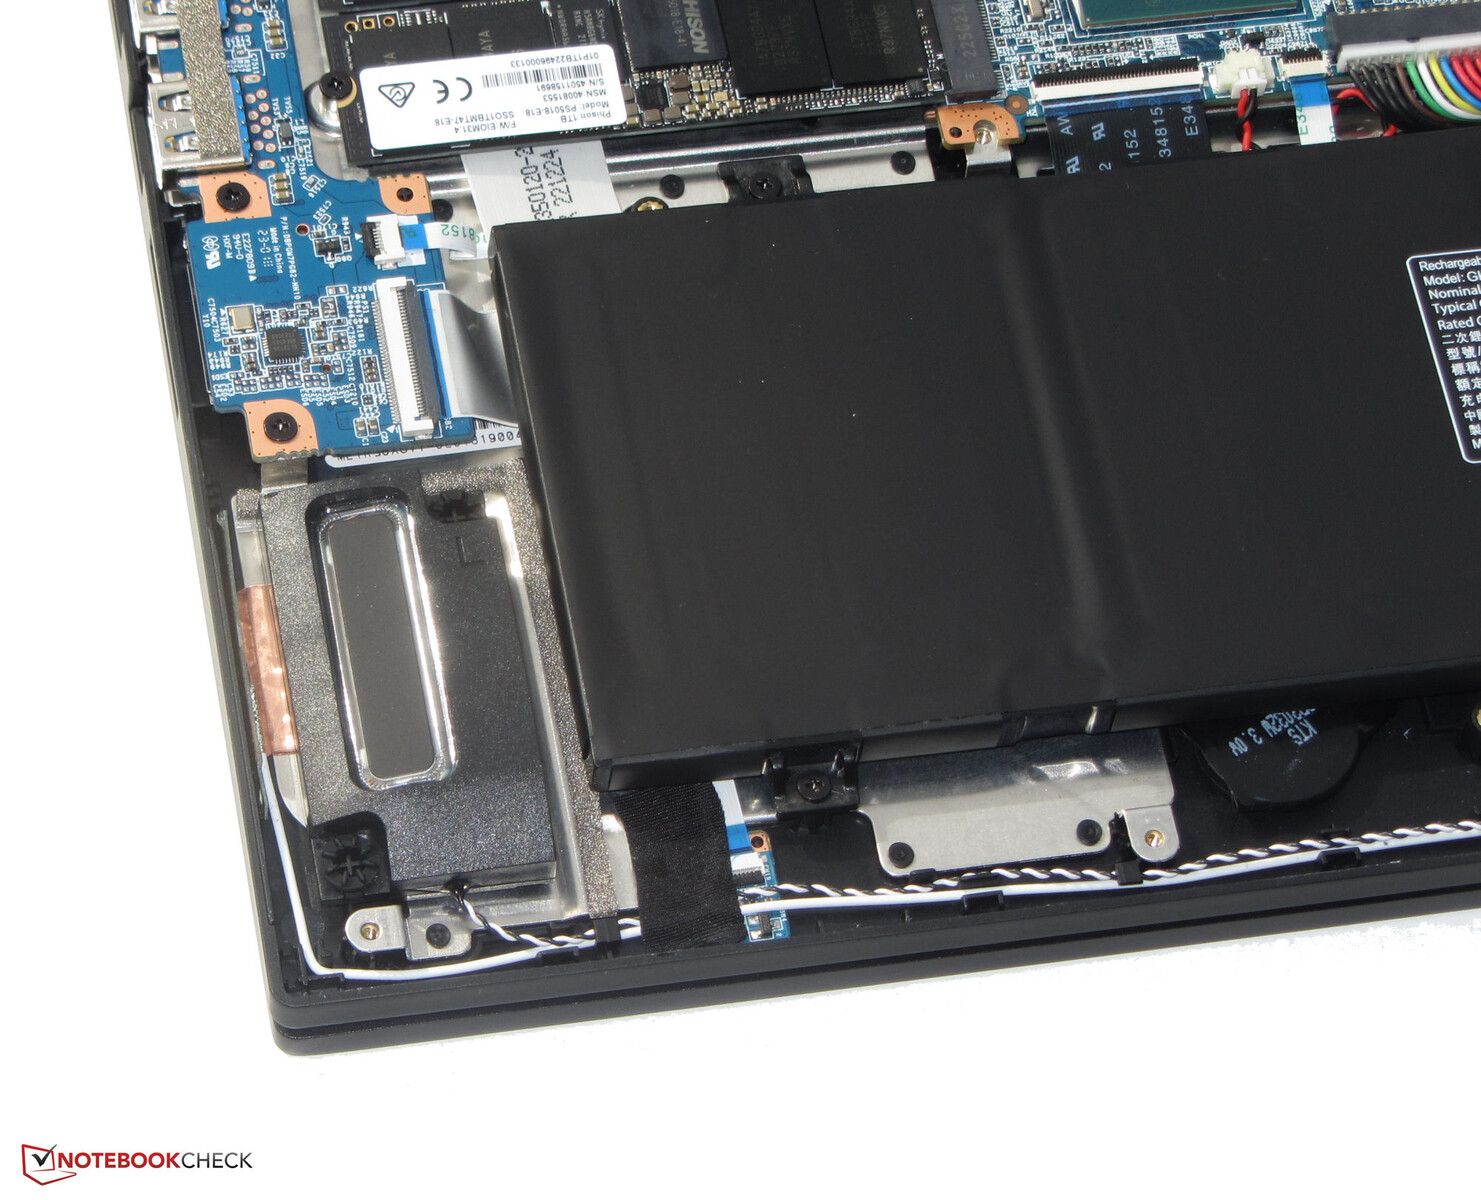
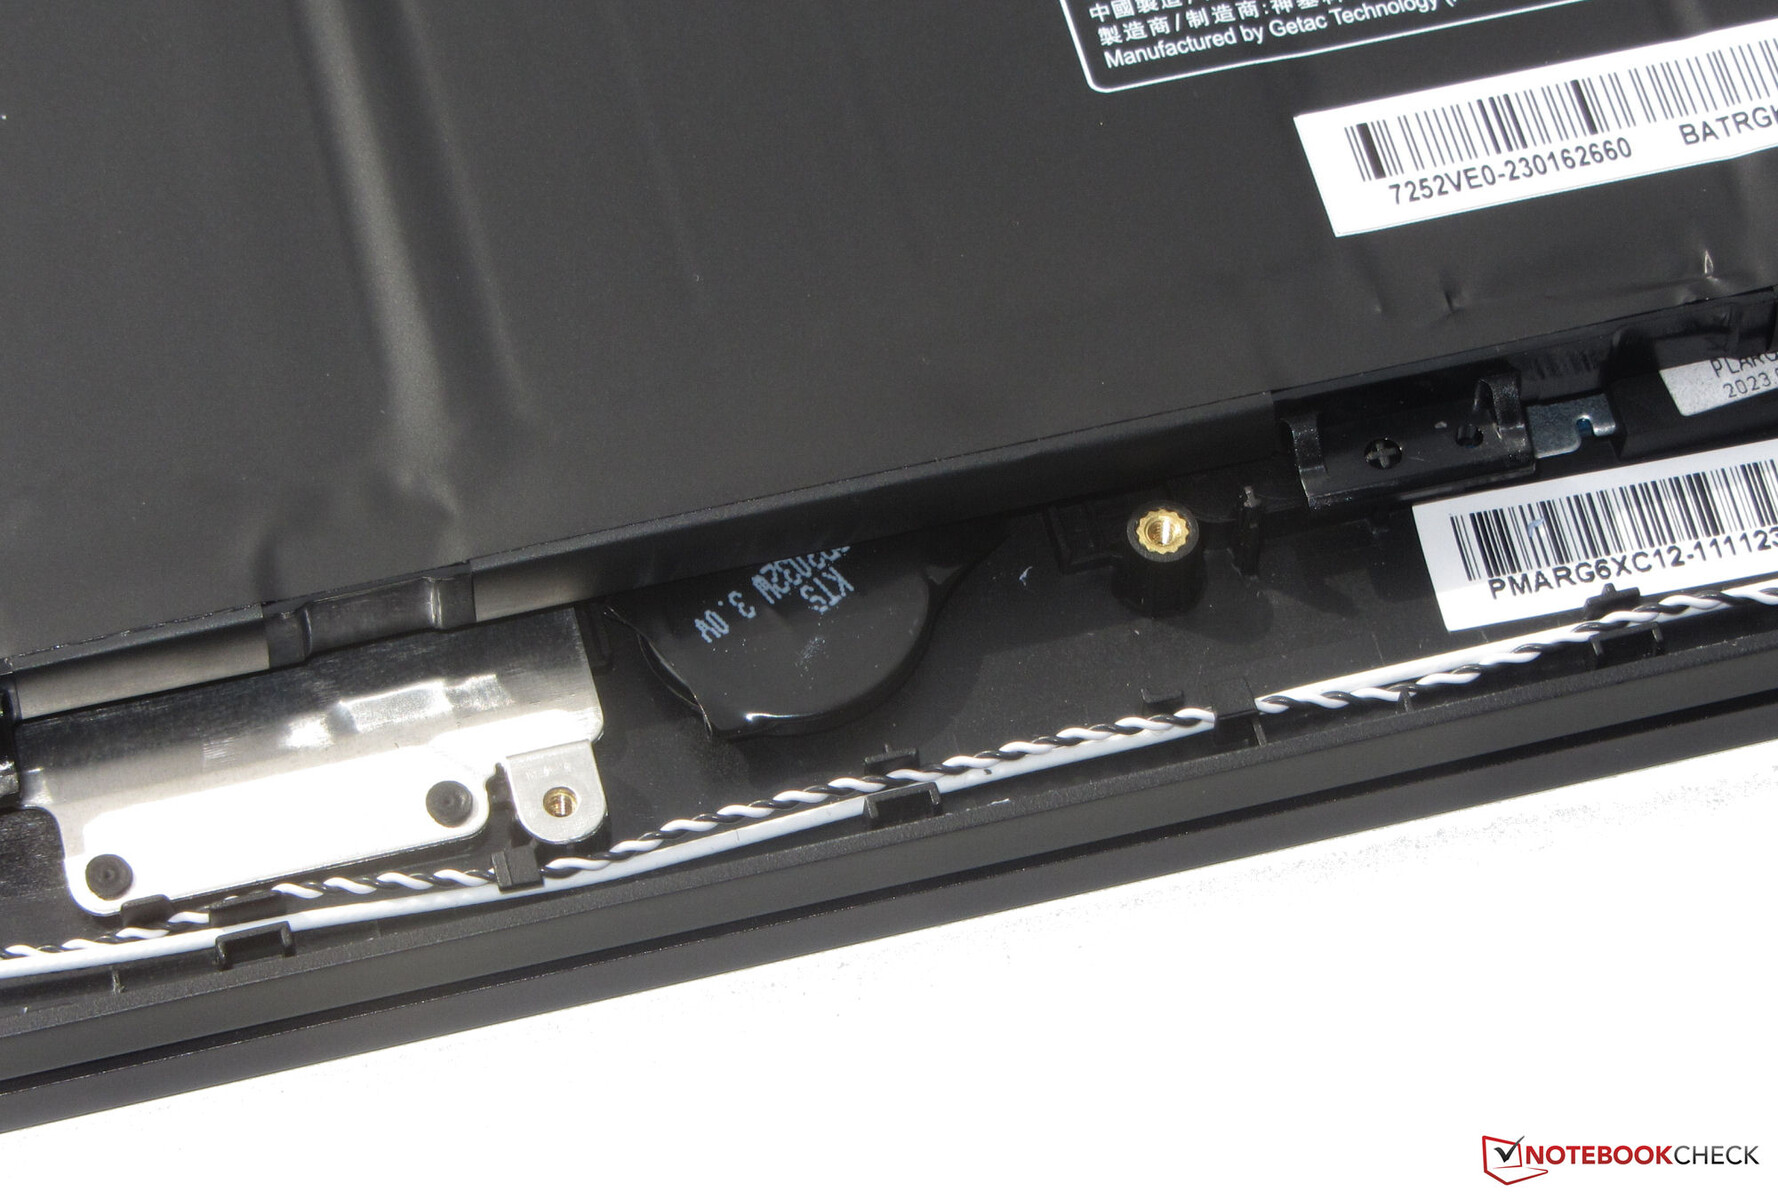
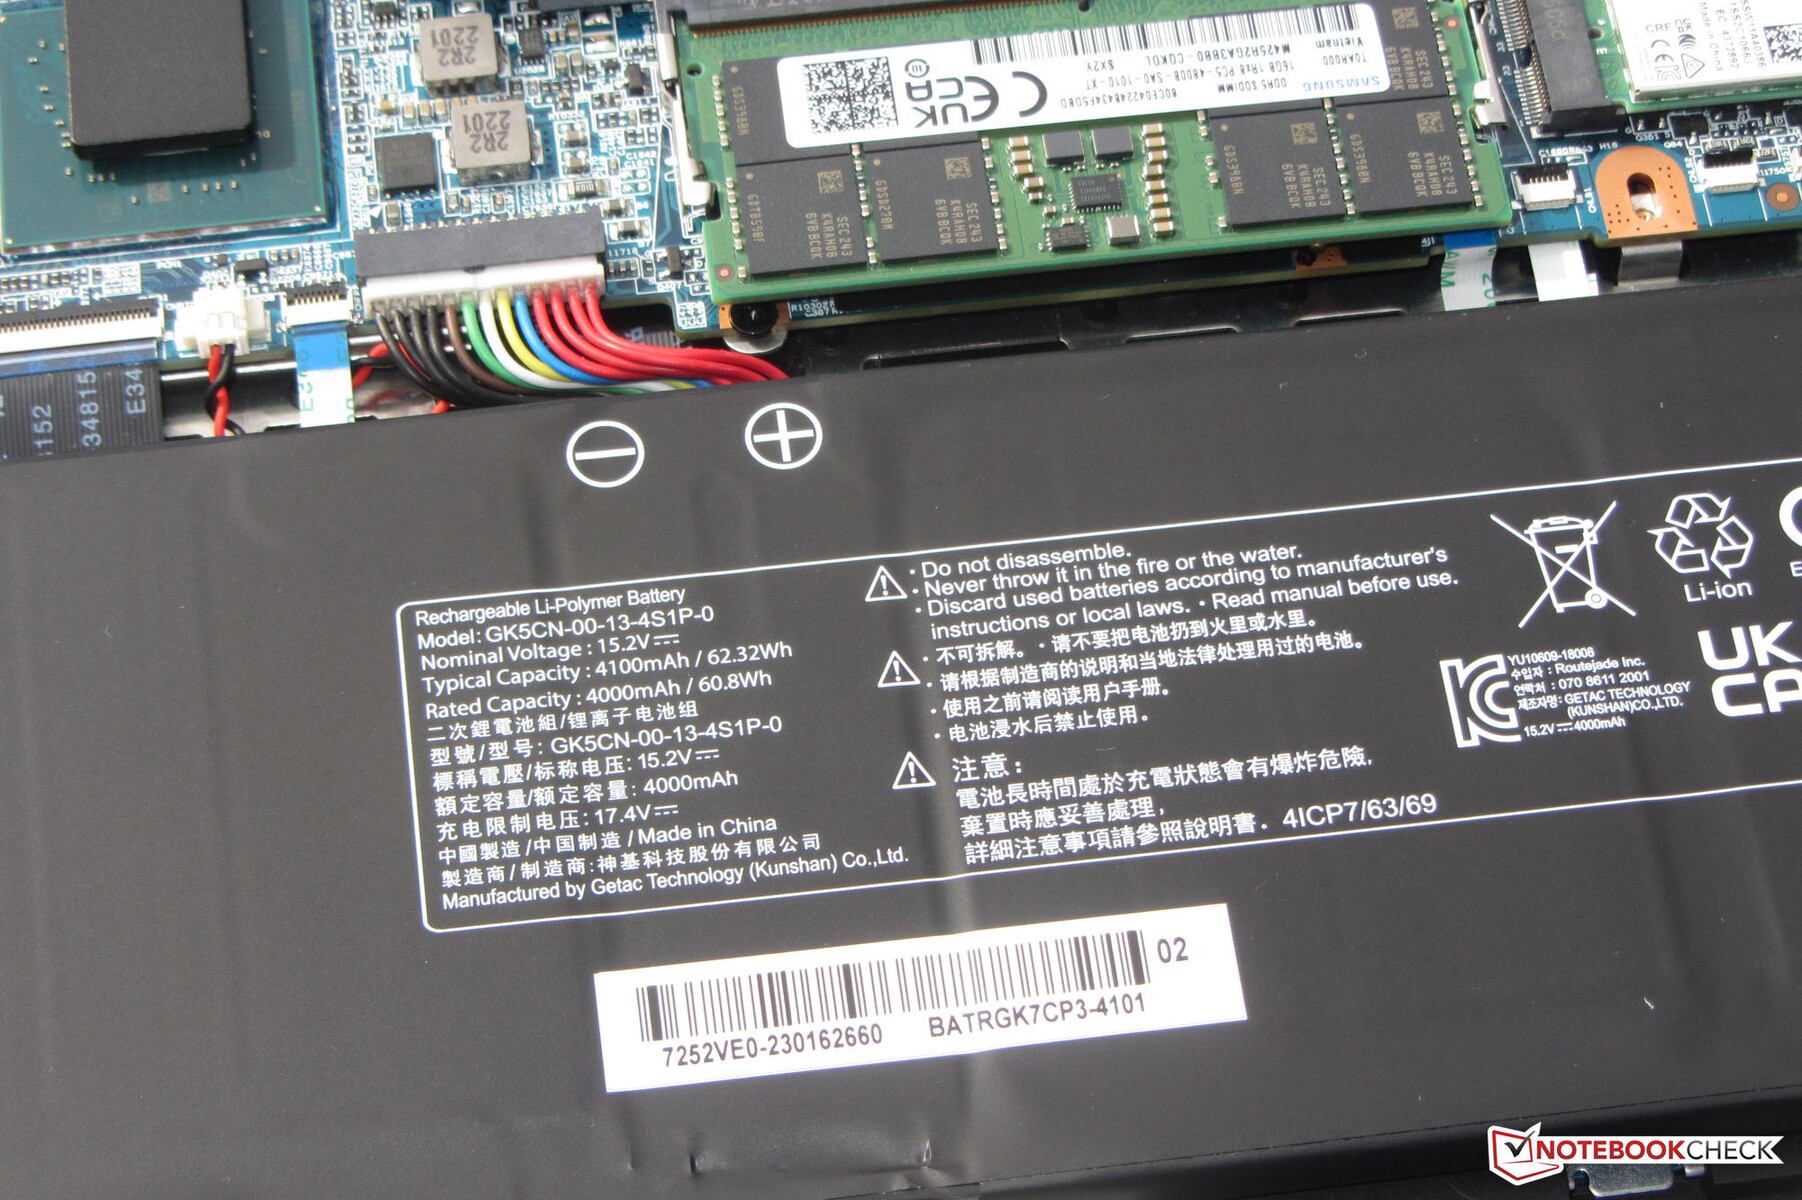
La carcasa de 16 pulgadas no presenta defectos de fabricación. Las dimensiones de los huecos son uniformes y no hay salientes de material. La unidad base sólo puede torcerse ligeramente, la tapa más claramente, pero todo el dispositivo está dentro de unos límites razonables. La batería (atornillada, no pegada) y otros componentes internos son accesibles tras retirar la carcasa inferior. Las bisagras mantienen la tapa firmemente en posición y el ángulo máximo de apertura es de unos 130 grados. Es posible abrir la tapa con una sola mano.
En el campo de la comparación, el portátil Medion es uno de los dispositivos con la estructura más gruesa. En cuanto al peso, se sitúa en el medio.
Equipamiento - Major X20 ofrece Thunderbolt 4
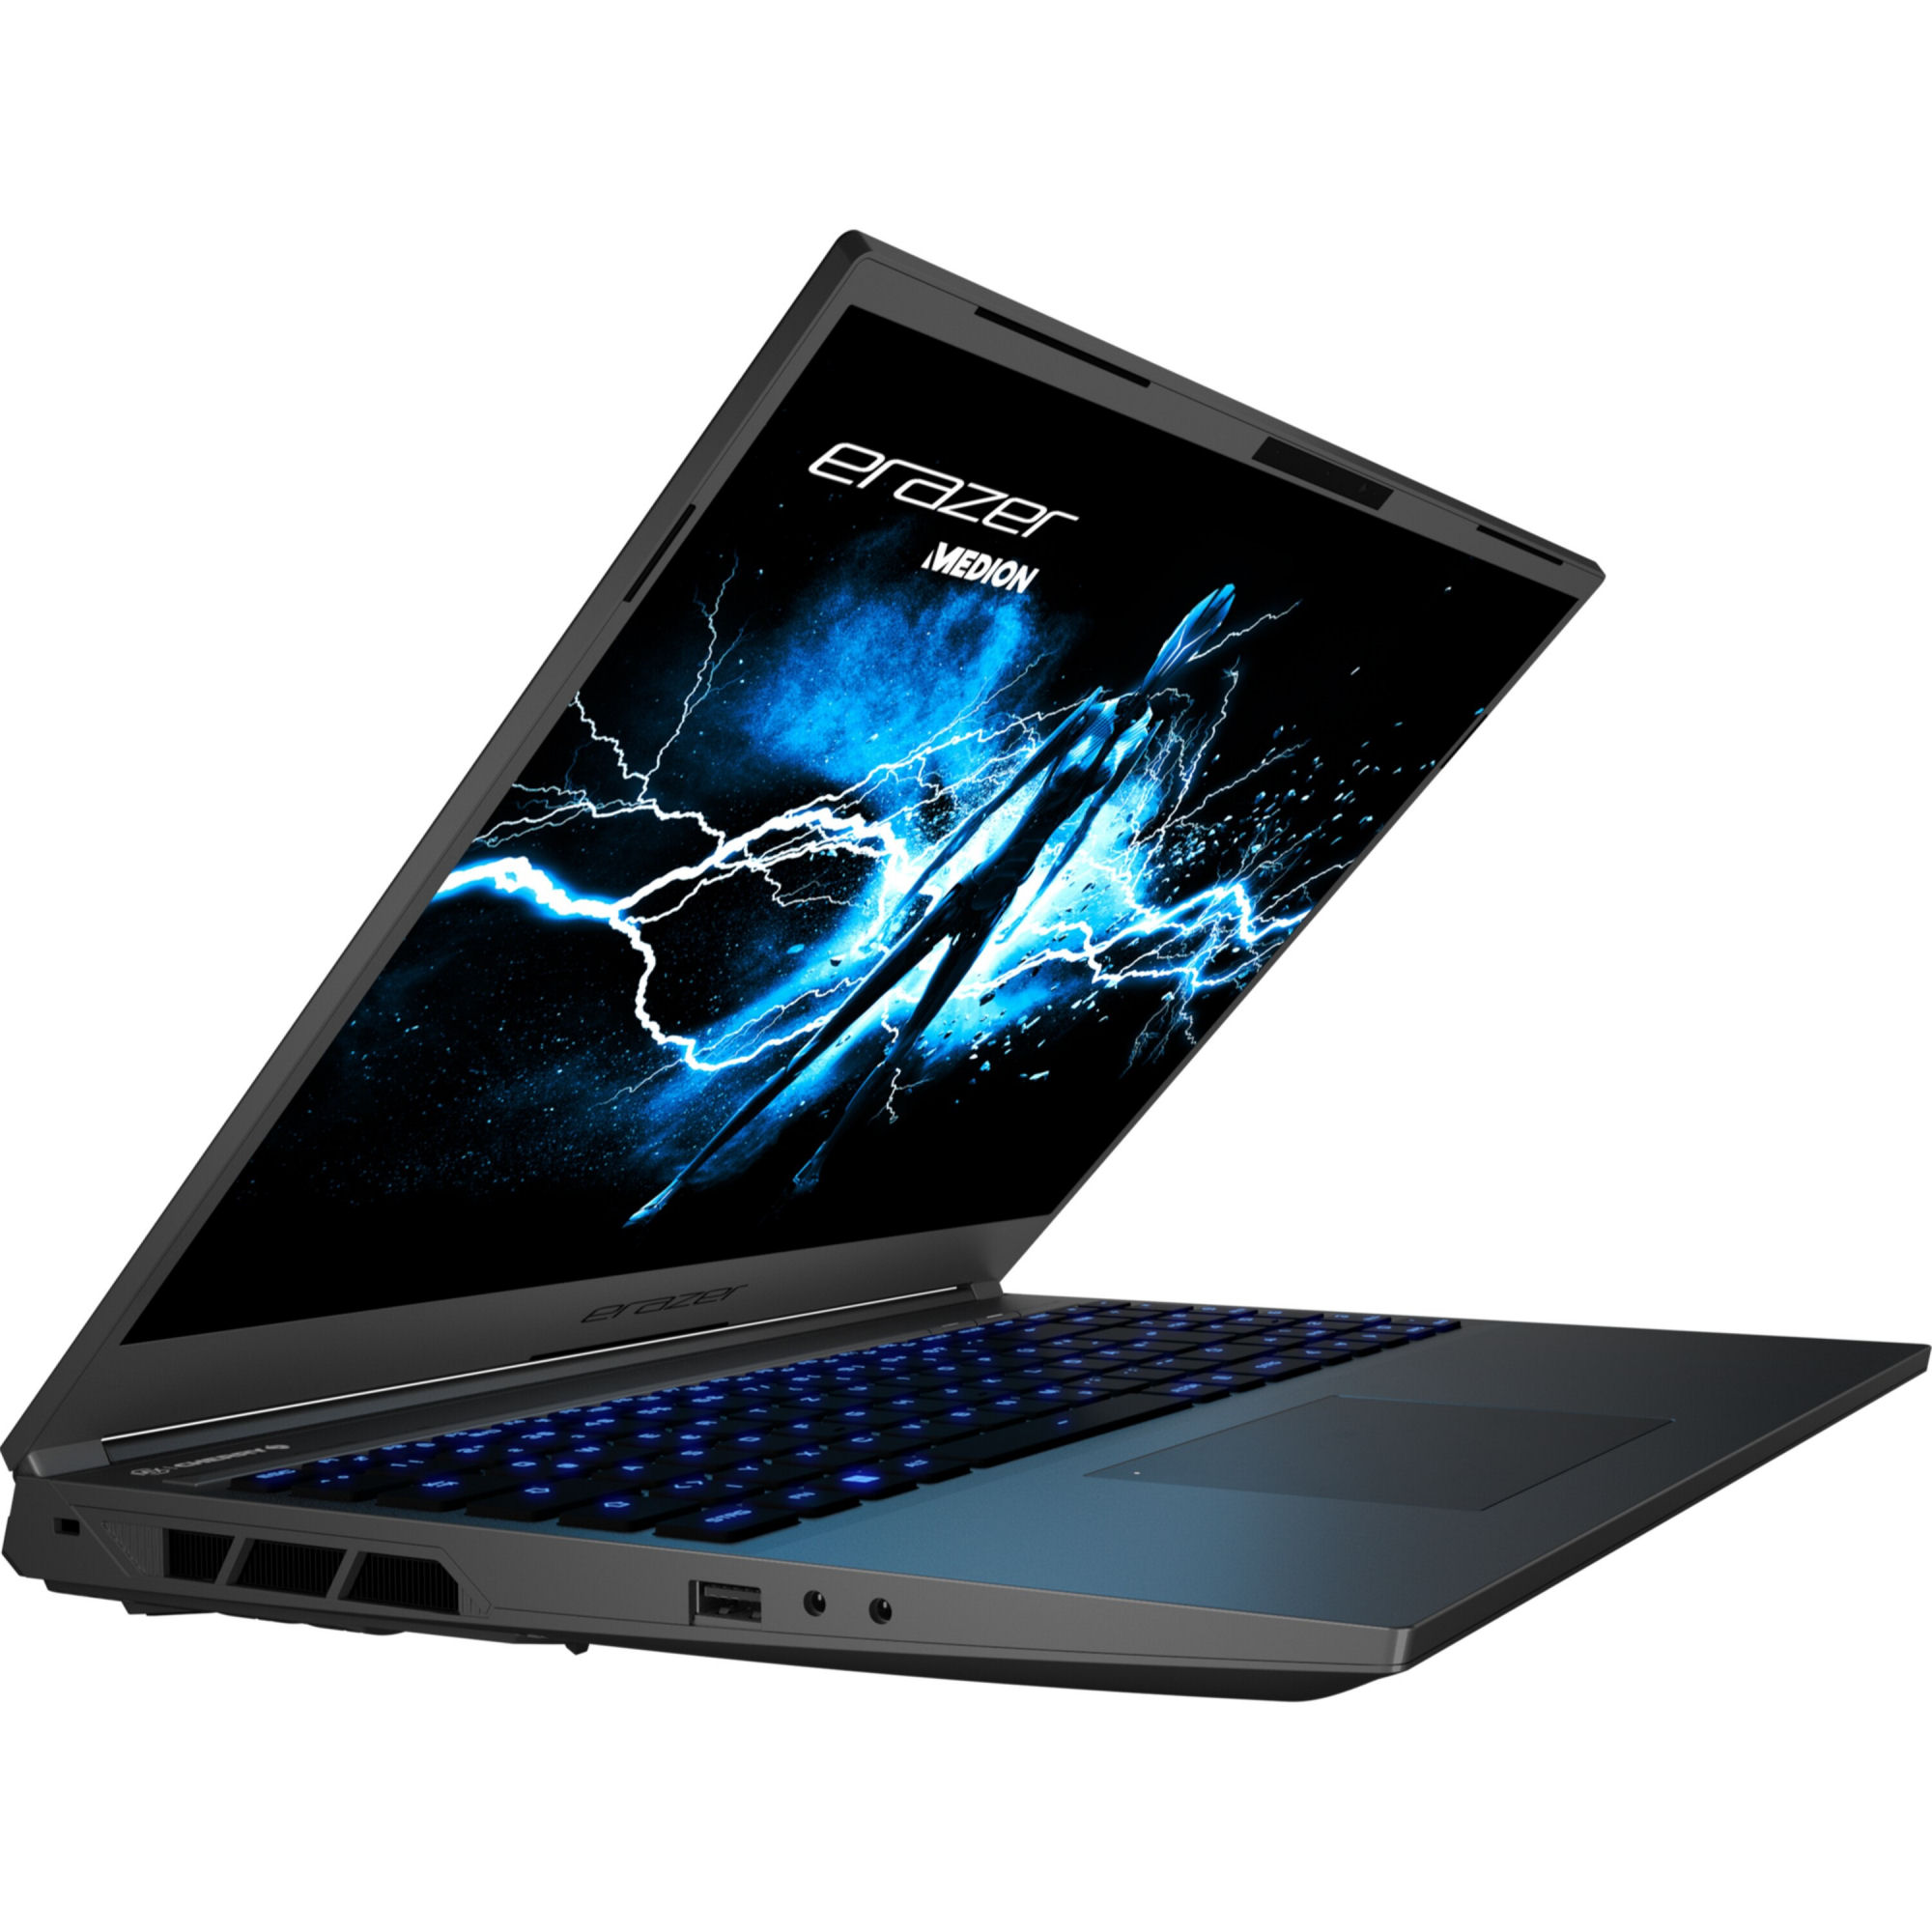
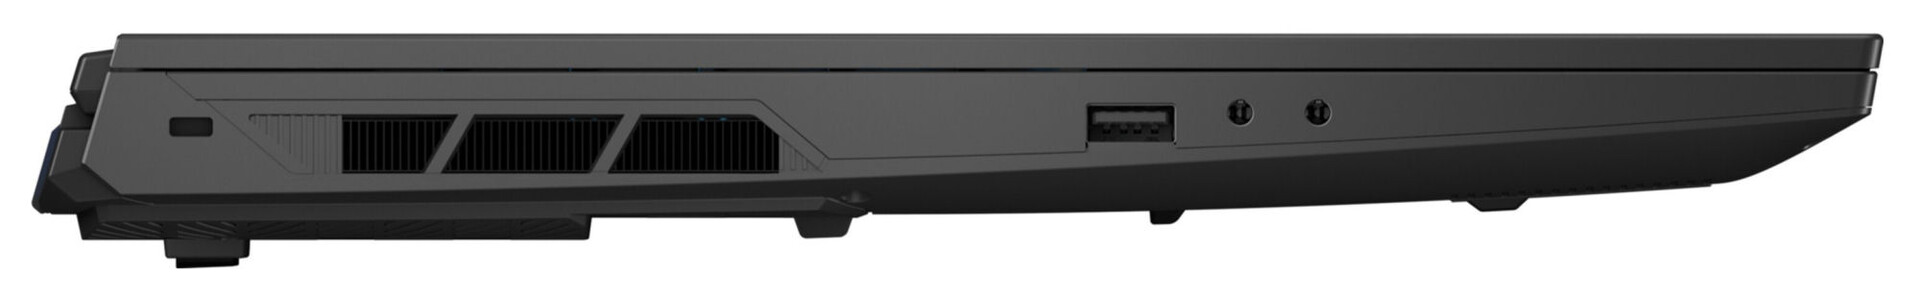
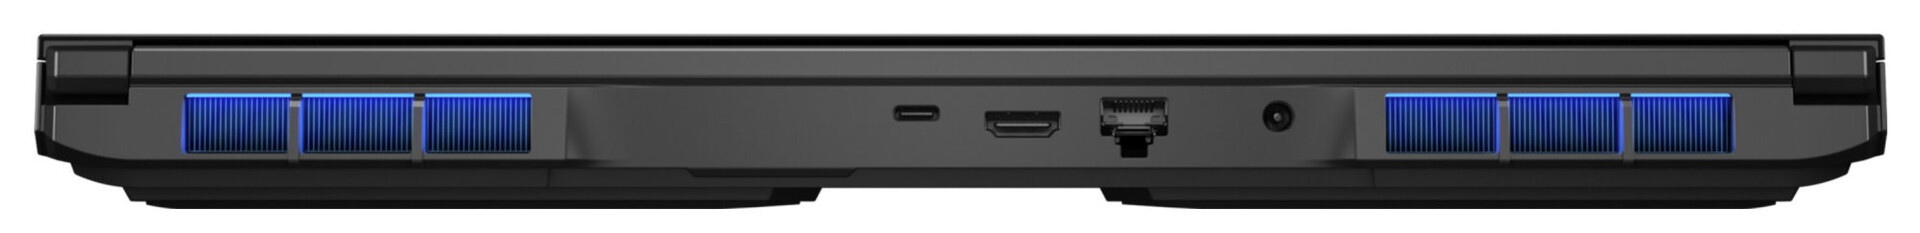
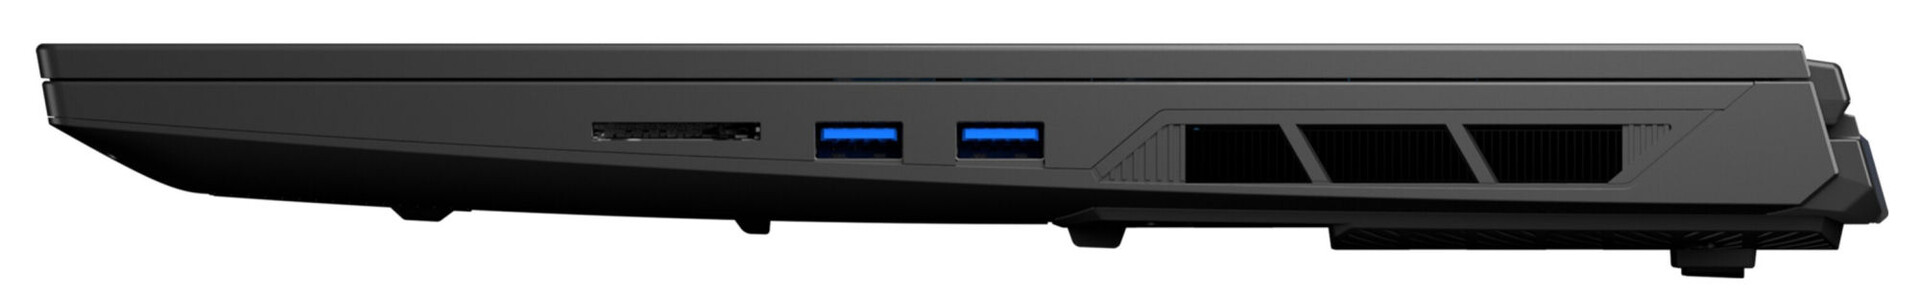
El Erazer tiene tres puertos USB-A (1x USB 3.2 Gen 1, 2x USB 3.2 Gen 2) y un puerto USB-C (Thunderbolt 4). Este último emite una señal DisplayPort, pero no ofrece soporte Power Delivery. El Major X20 también cuenta con un total de dos salidas de vídeo (HDMI 2.1, DP). Otras conexiones incluyen una ranura para un bloqueo de cable, dos tomas de audio y un puerto Gigabit Ethernet (2,5 Gbps)
Las salidas de vídeo, la ranura de alimentación y el puerto de red se encuentran en la parte posterior del dispositivo. Así, los cables correspondientes salen de la parte trasera y no estorban.
Lector de tarjetas SD
El lector de tarjetas de memoria microSD (tarjeta de referencia: AV PRO microSD 128 GB V60) se encuentra entre los modelos medianamente rápidos, con velocidades de transferencia máximas de 78 MB/s (transferencia de 250 archivos de imagen jpg de unos 5 MB cada uno) y 88 MB/s (copia de grandes bloques de datos).
| SD Card Reader | |
| average JPG Copy Test (av. of 3 runs) | |
| Media de la clase Gaming (20.9 - 210, n=54, últimos 2 años) | |
| Razer Blade 15 OLED (Early 2022) (AV Pro SD microSD 128 GB V60) | |
| Medion Erazer Major X20 (AV PRO microSD 128 GB V60) | |
| maximum AS SSD Seq Read Test (1GB) | |
| Media de la clase Gaming (25.5 - 261, n=51, últimos 2 años) | |
| Medion Erazer Major X20 (AV PRO microSD 128 GB V60) | |
| Razer Blade 15 OLED (Early 2022) (AV Pro SD microSD 128 GB V60) | |
Comunicación
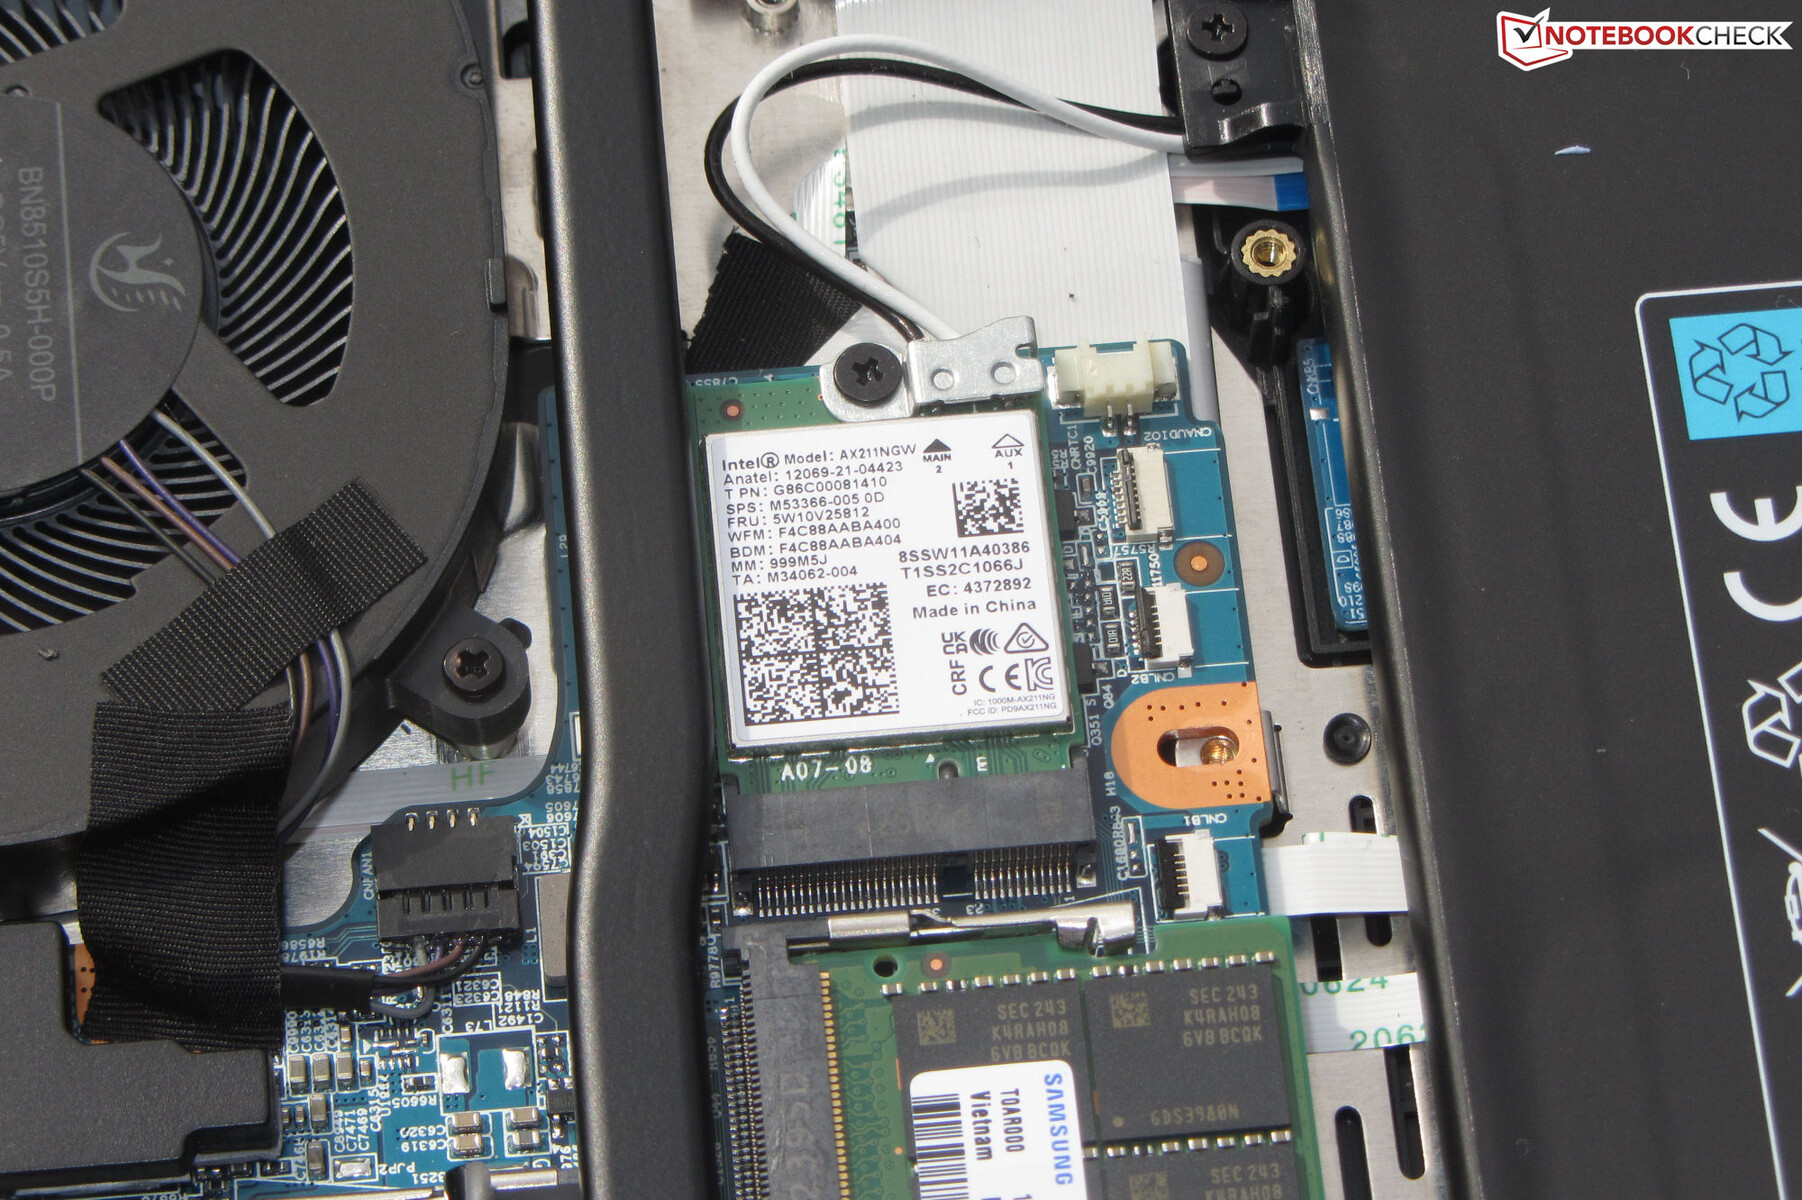
Las velocidades de transmisión de datos WiFi son excelentes en condiciones óptimas (sin dispositivos WLAN en las inmediaciones, poca distancia entre el portátil y el PC servidor). El X20 lleva a bordo un chip WiFi 6E (Intel AX211). De las conexiones por cable se encarga un chip (RTL8125; 2,5 GBit/s) de Realtek.
Cámara web
La webcam (2,1 MP, máx. 1.920 x 1.080) ofrece una calidad estándar. Falta precisión de color: con una desviación de color de unos 11, no se alcanza el objetivo (DeltaE inferior a 3). No lleva obturador mecánico.


Accesorios
Aparte de los documentos habituales (guía de inicio rápido e información sobre la garantía), el portátil no incluye ningún otro accesorio.
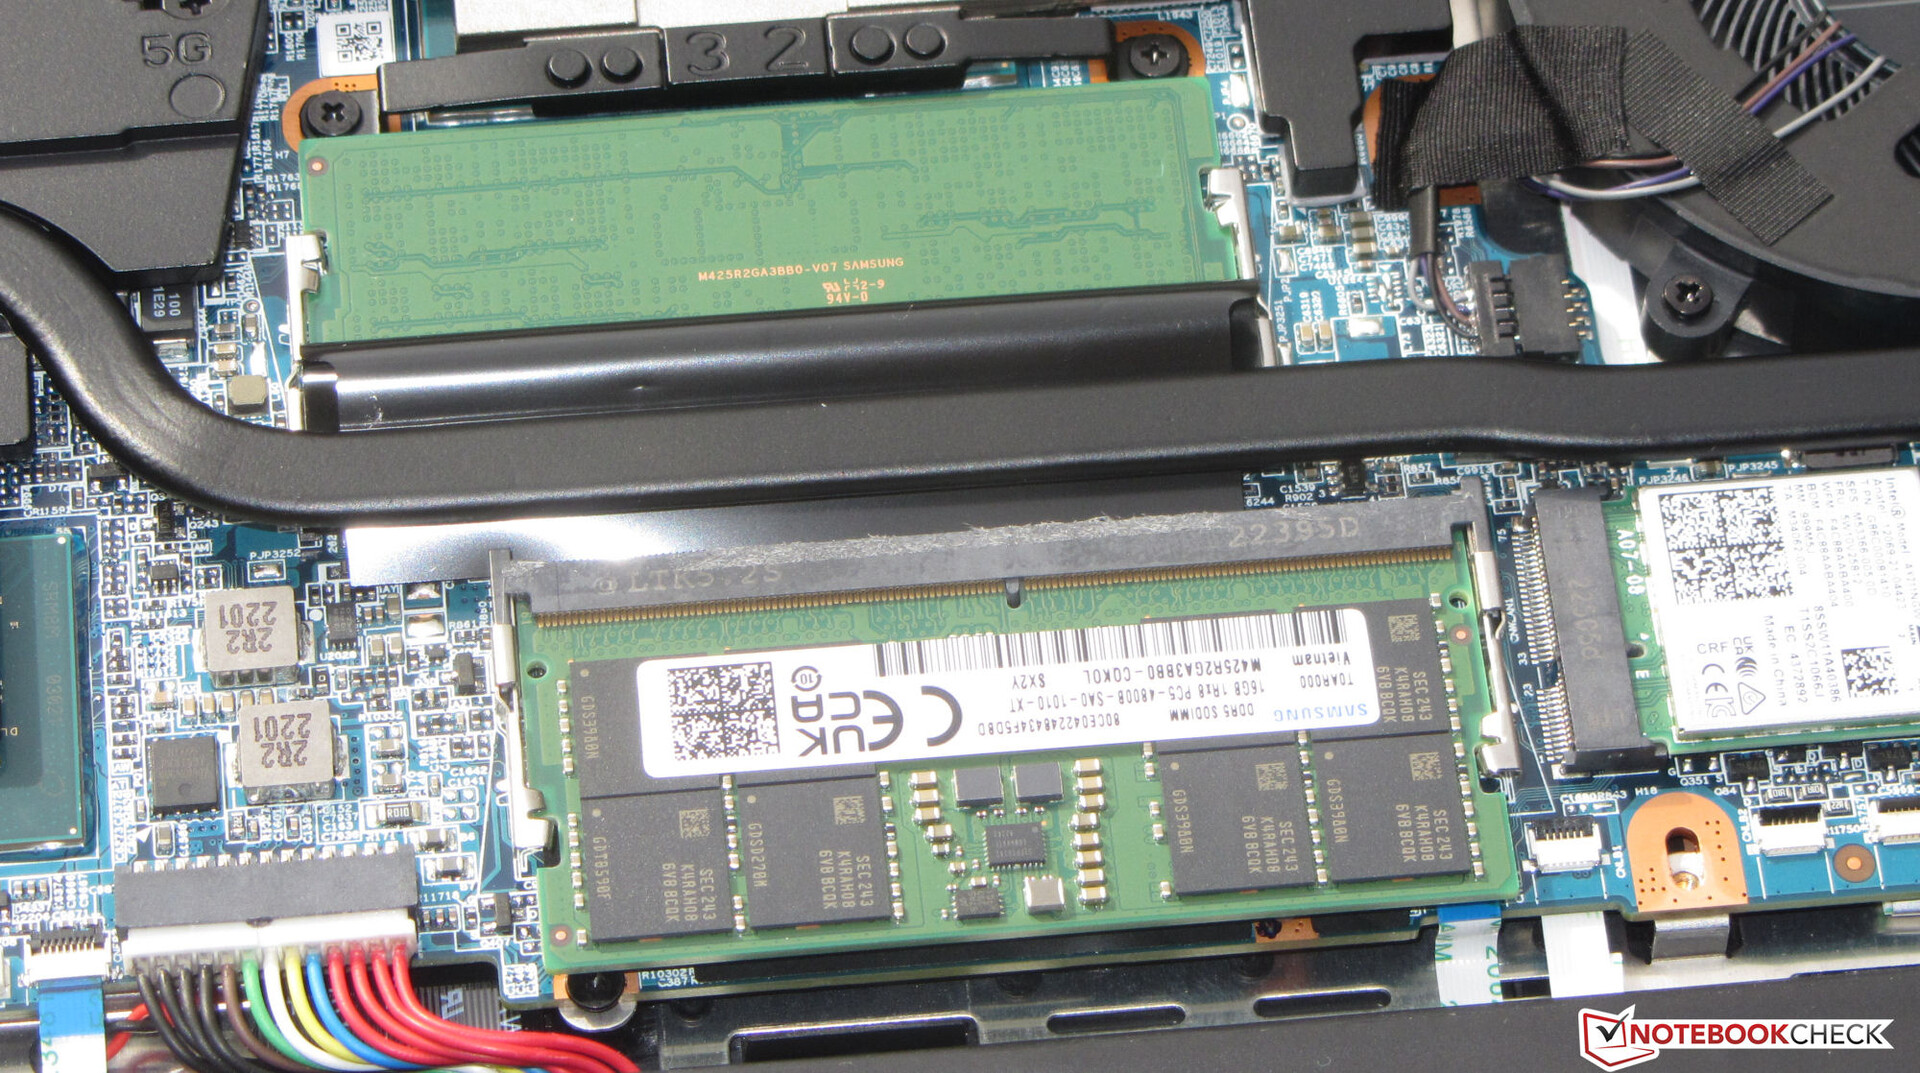
Mantenimiento
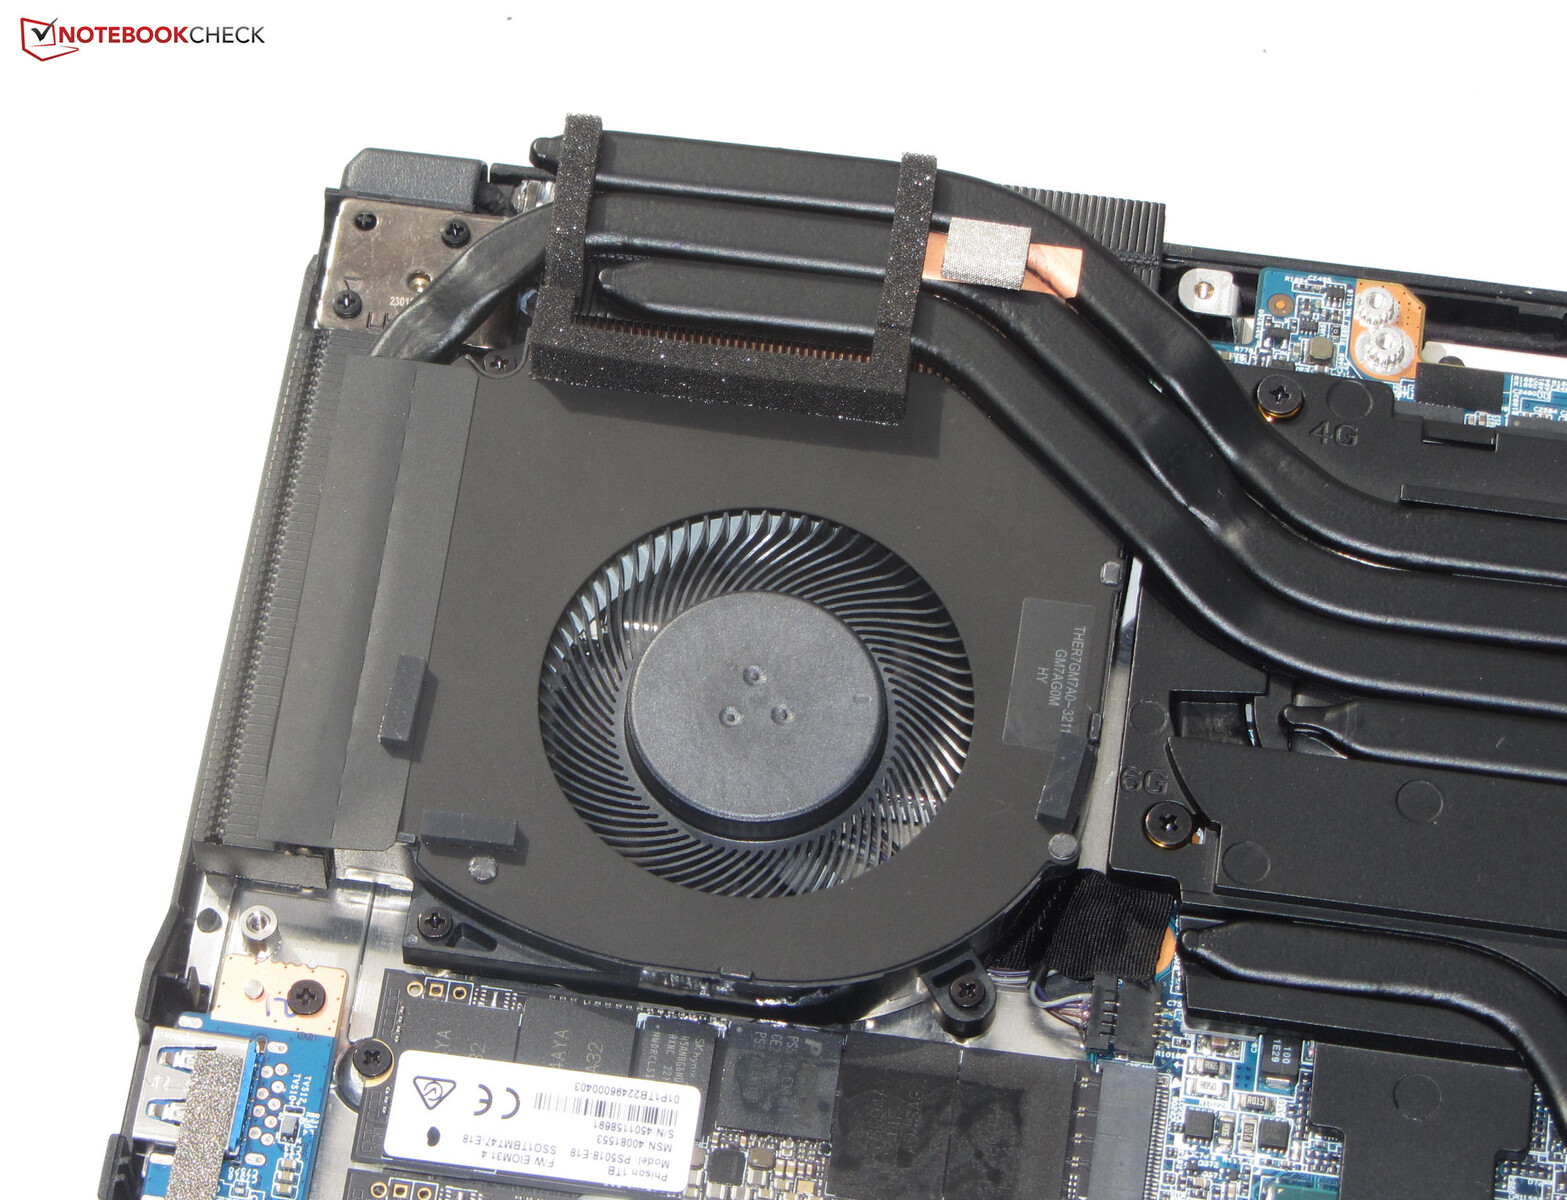
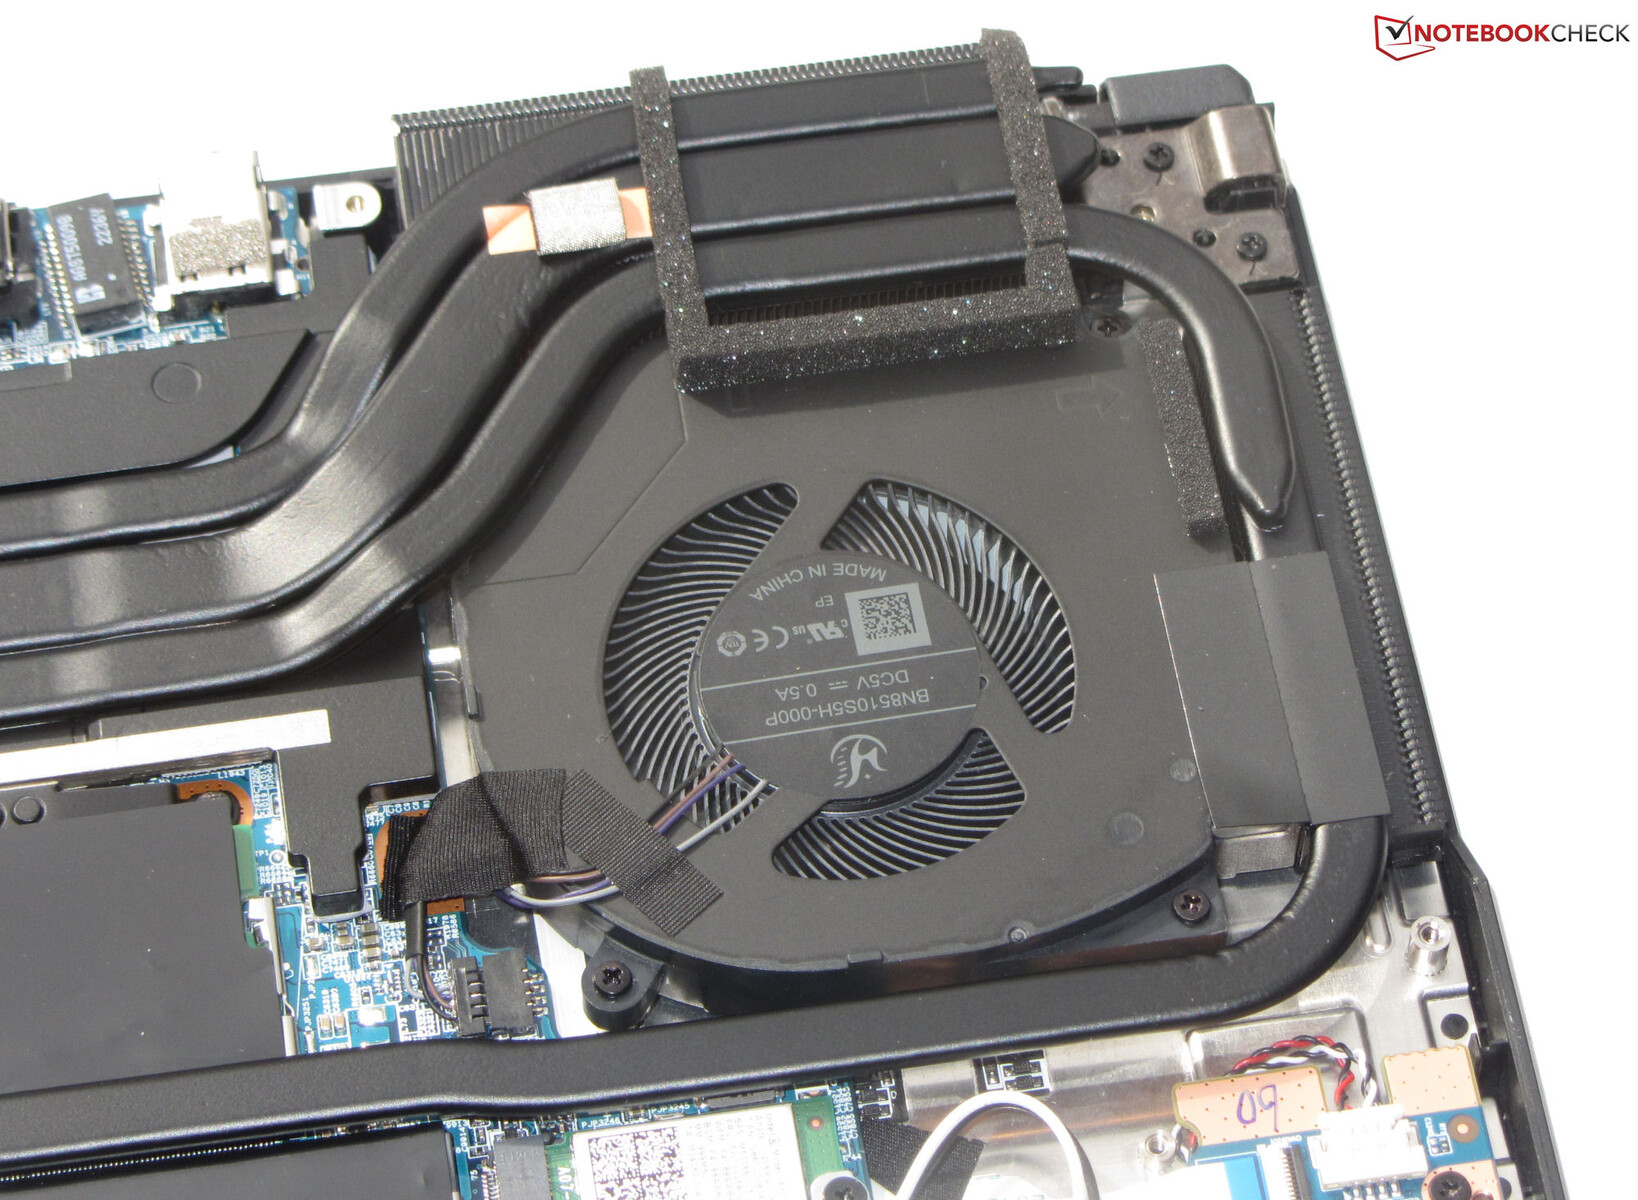
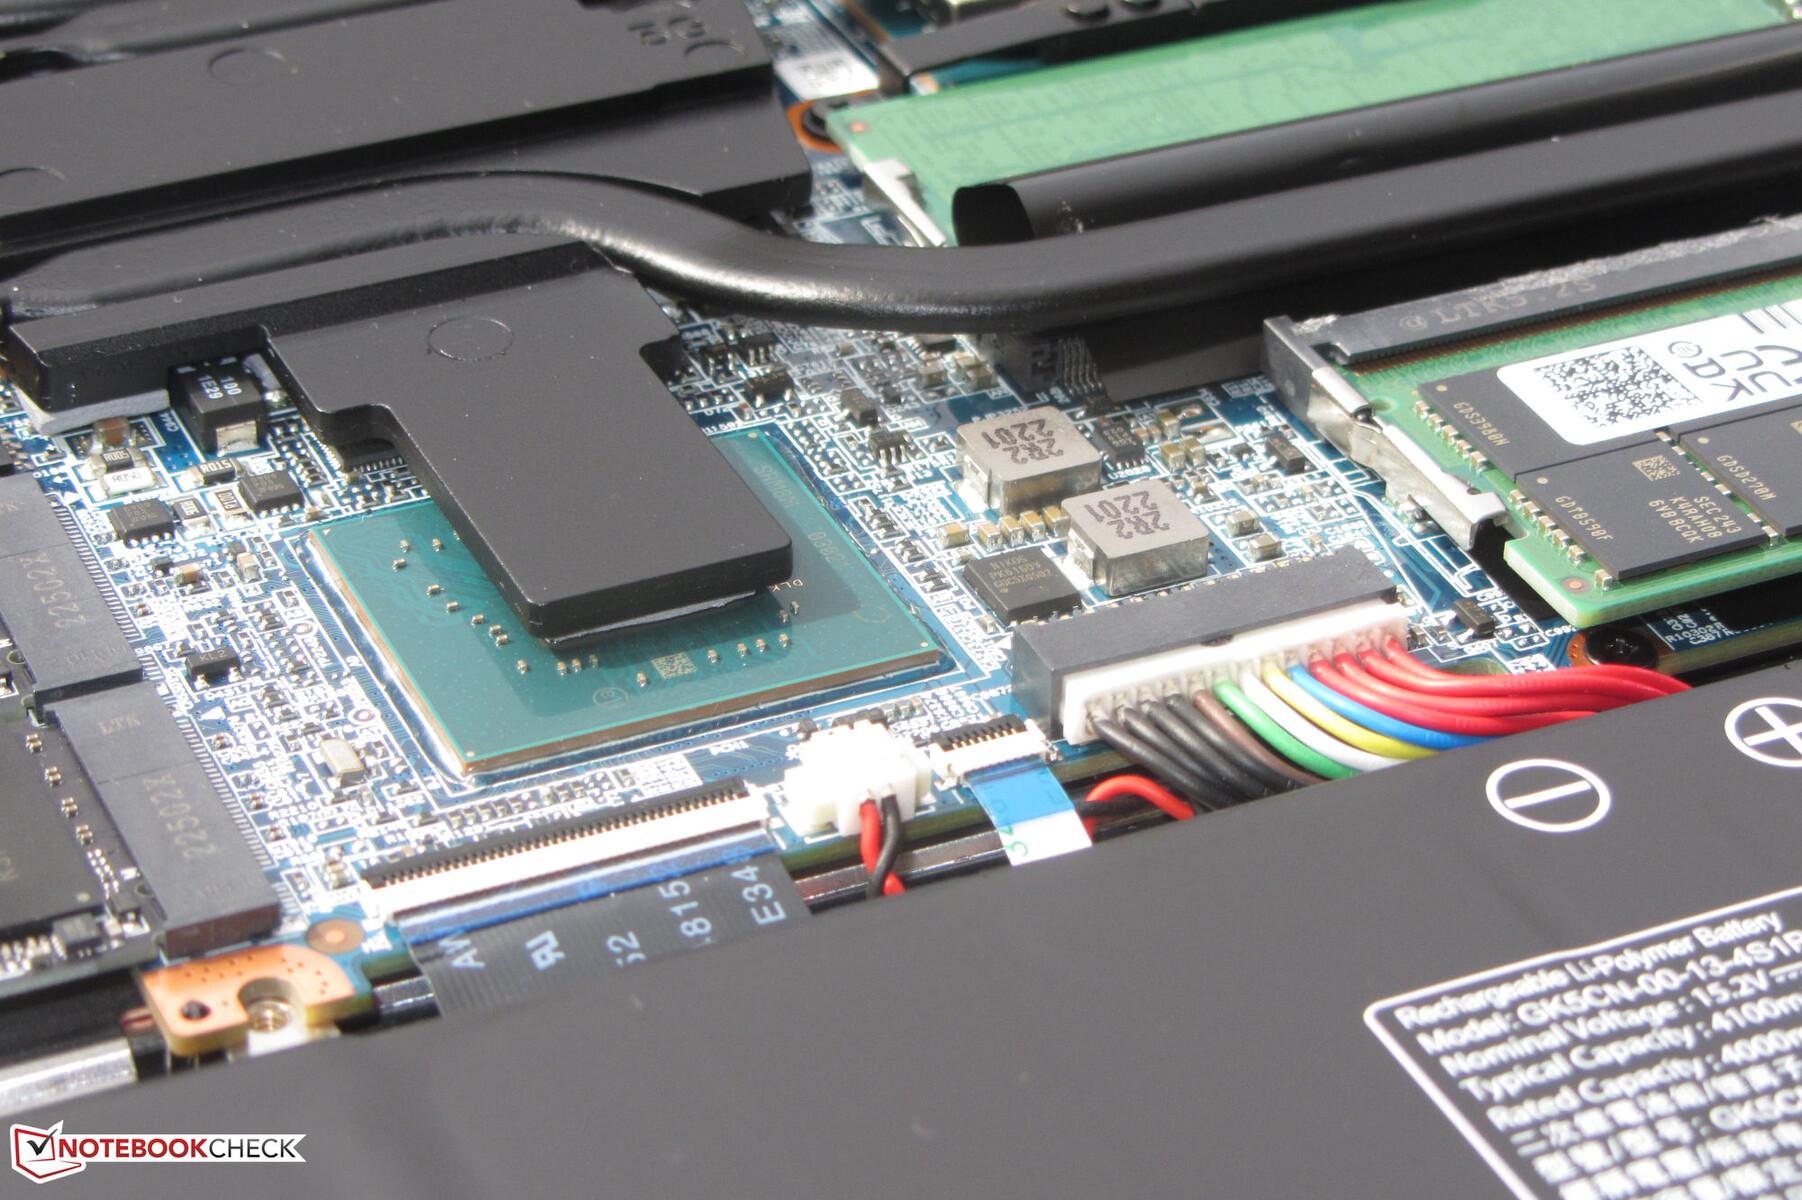
Tras retirar todos los tornillos de la parte inferior del dispositivo, la carcasa inferior se puede separar usando una espátula plana o un alisador de juntas. Entonces tendrás acceso a las dos ranuras de RAM (ambas ocupadas), los dos SSD (PCIe 4, M.2-2280), el módulo WLAN, los ventiladores, la batería de la BIOS y la batería del portátil.

Garantía
Medion ofrece una garantía de dos años para el Erazer en Alemania. Esto puede diferir en otros países, por lo que los compradores deben comprobarlo antes de comprar.
Existen extensiones de garantía, pero deben adquirirse junto con el portátil en la tienda en línea de Medion. No es posible una compra posterior.
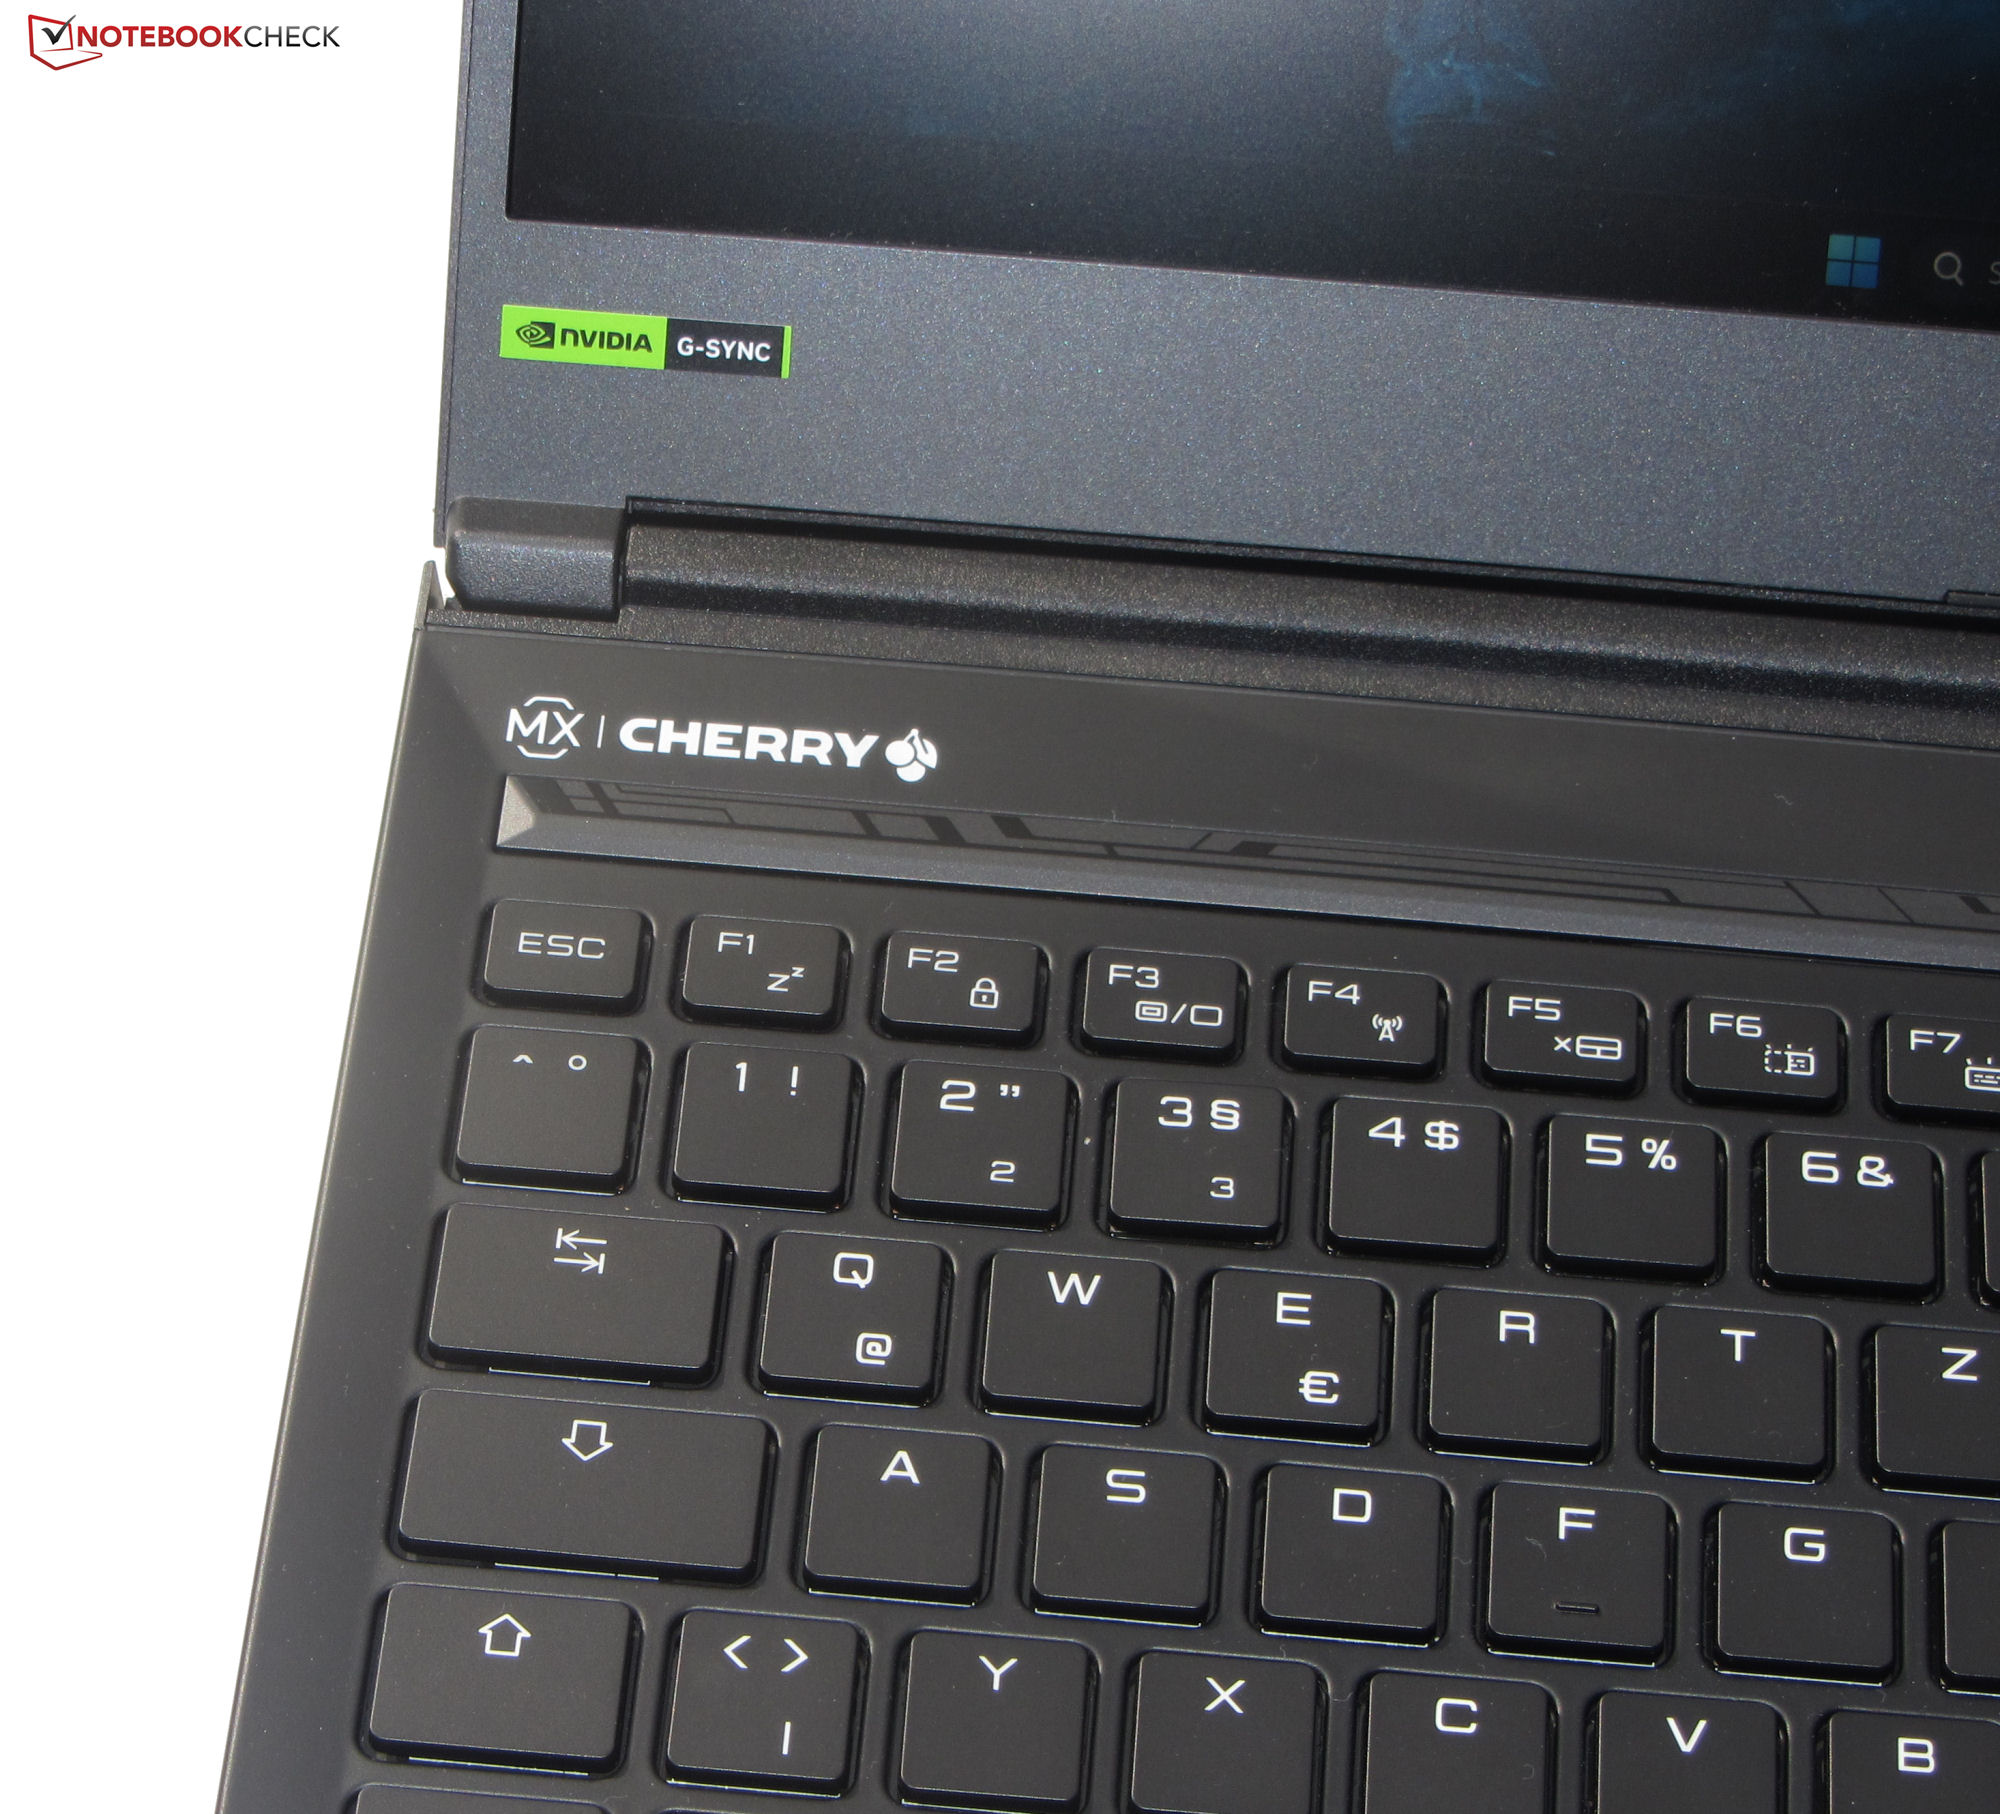
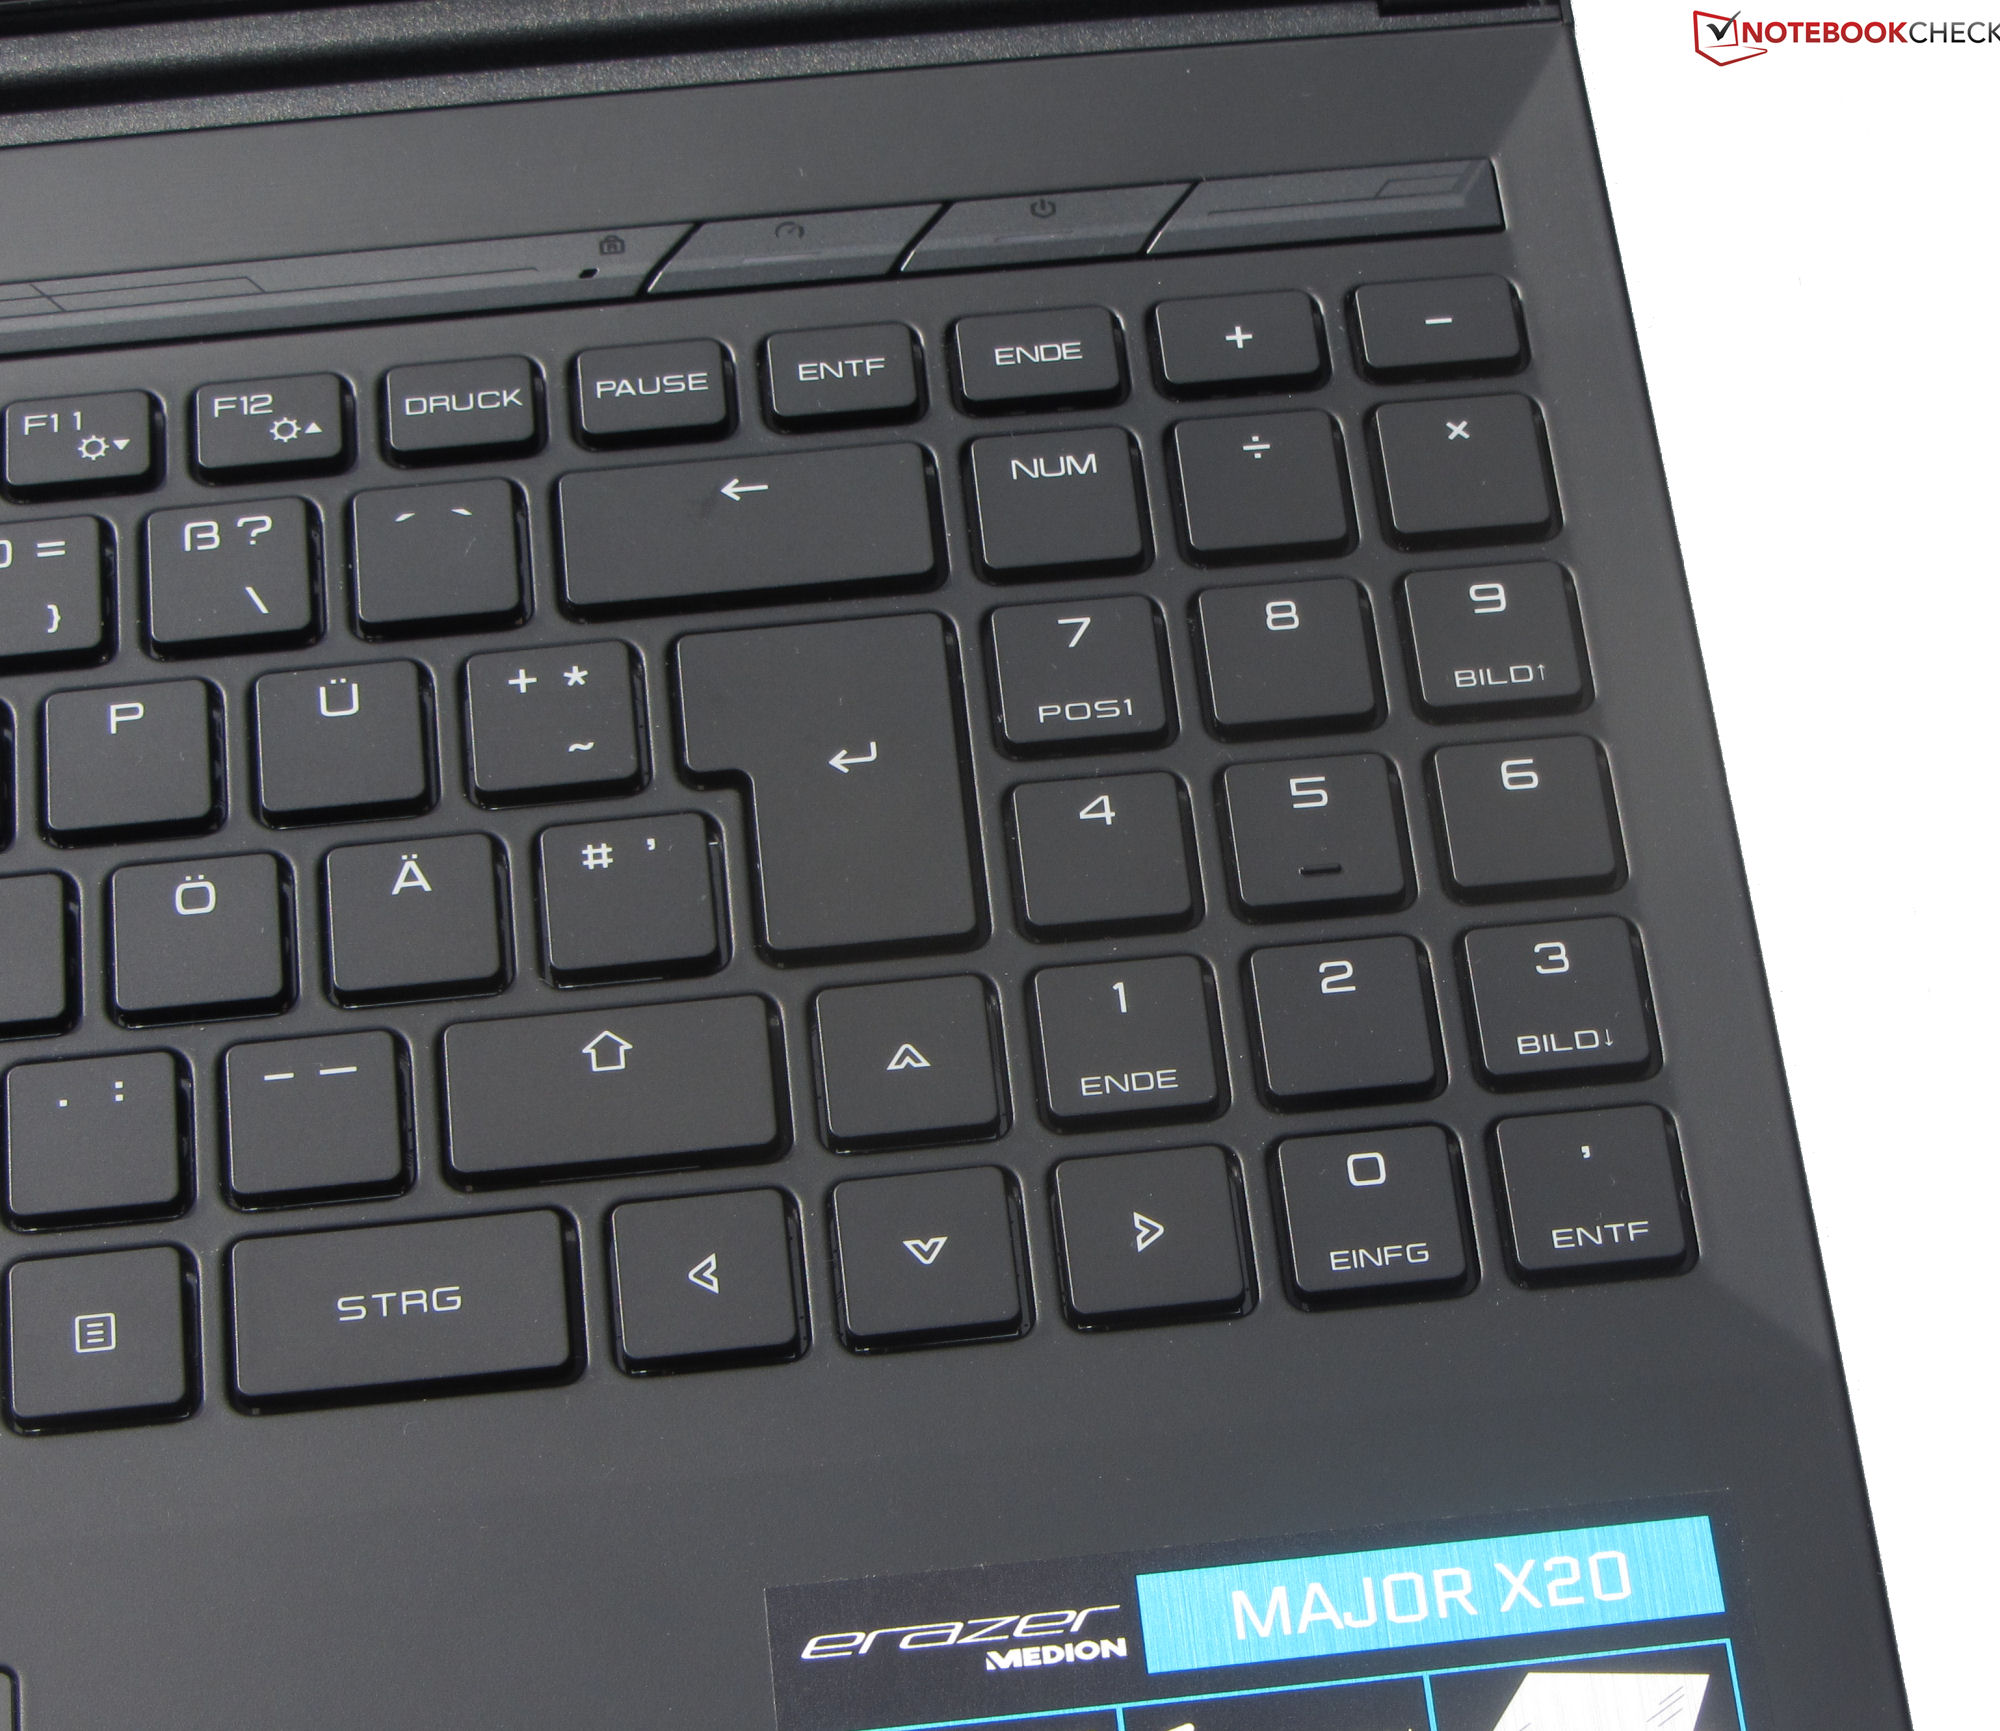
Dispositivos de entrada - Teclado mecánico con interruptores Cherry MX
Teclado
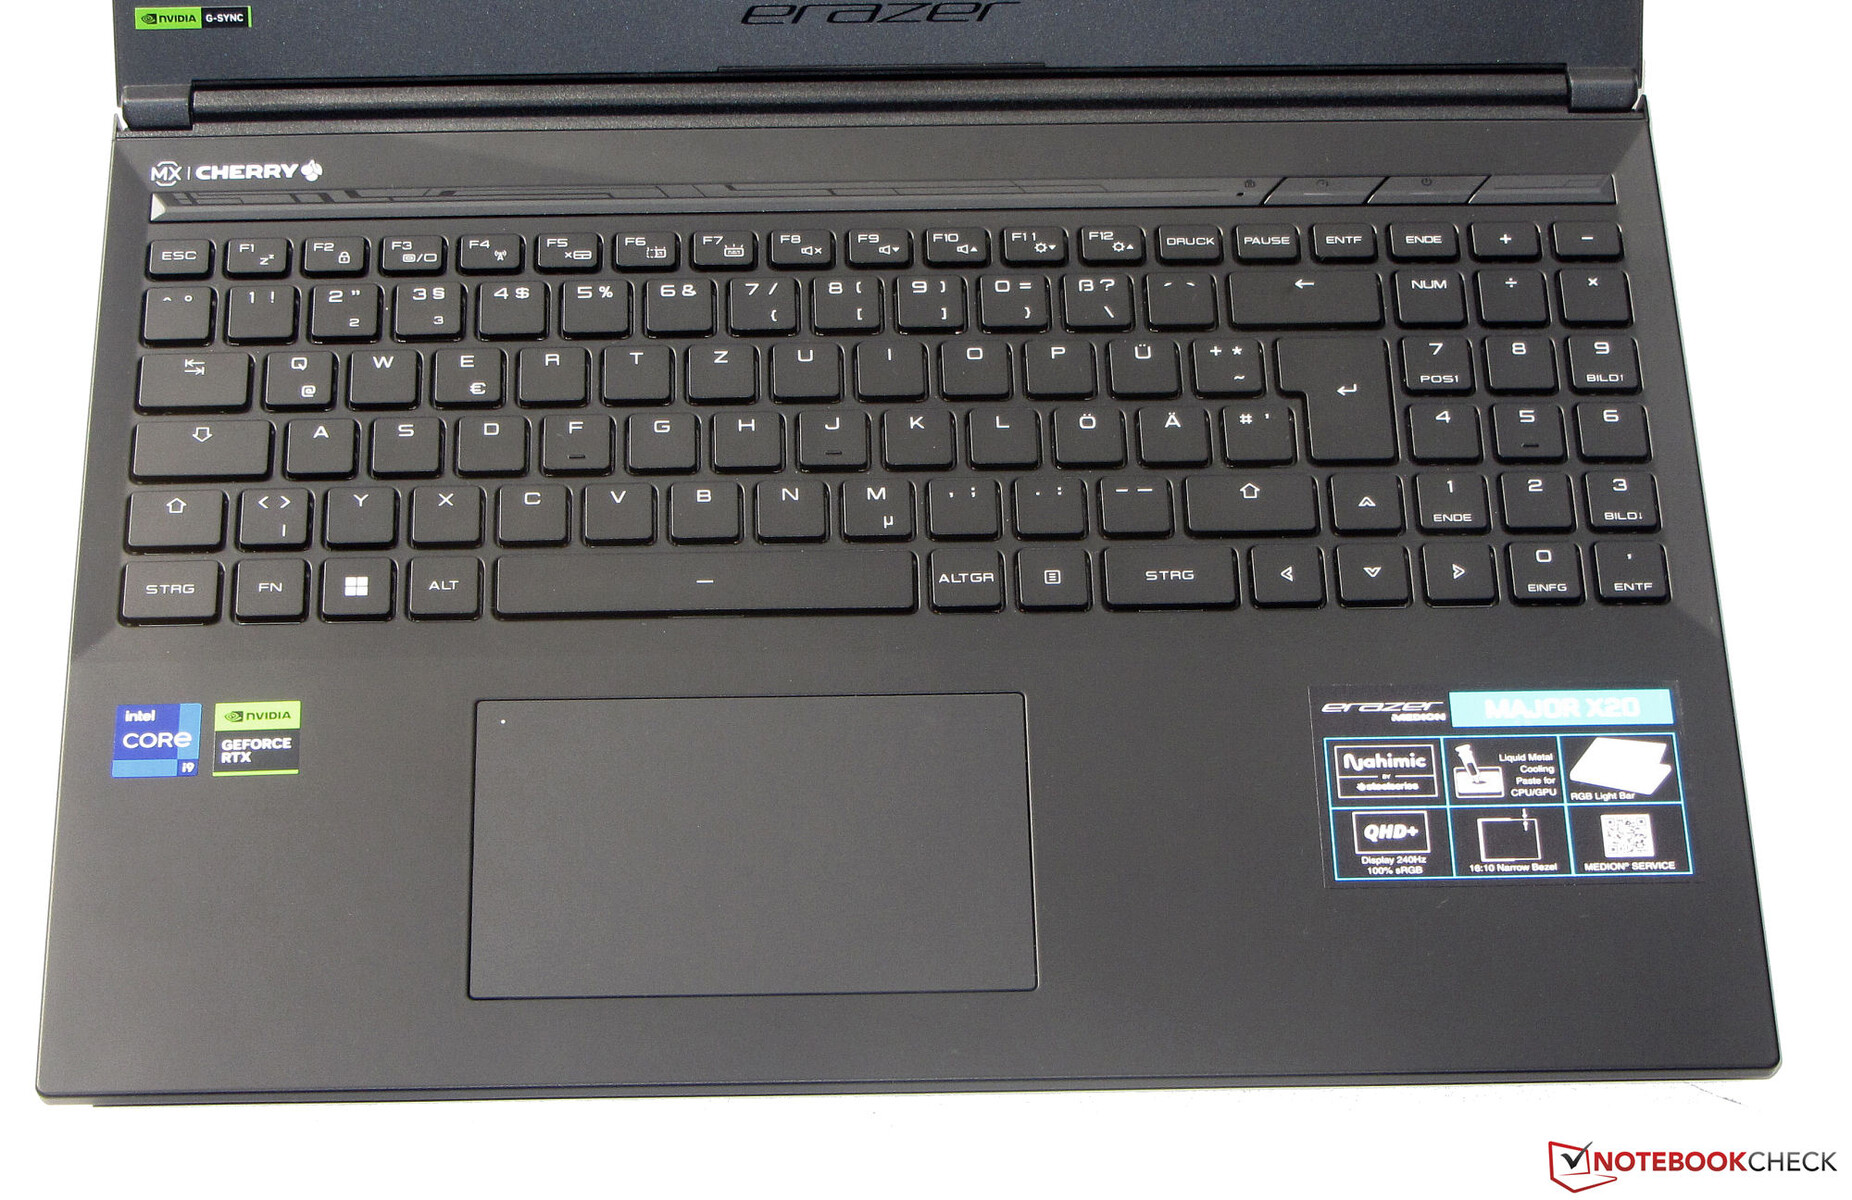
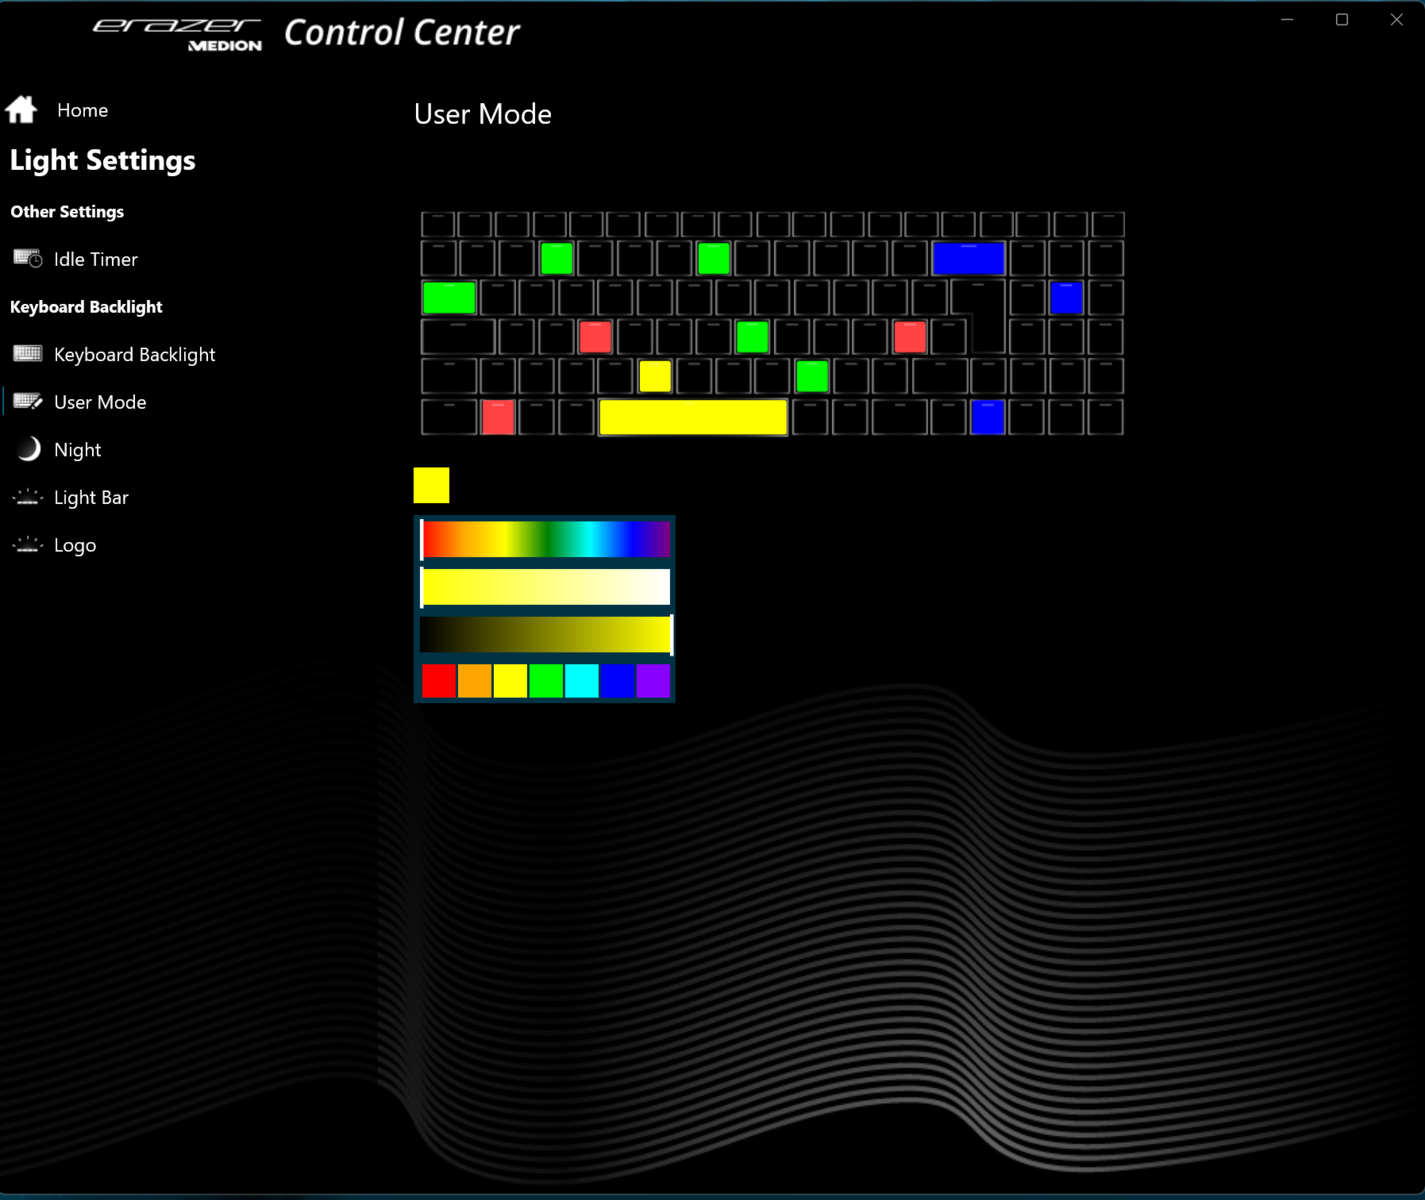
En lugar de un teclado chiclet, Medion ha instalado un teclado mecánico en el X20. Los interruptores Cherry MX tienen un recorrido medio y un punto de presión claramente audible y perceptible. El usuario disfruta de una sensación de escritura rica y una respuesta precisa, y el teclado no cede al escribir. Dos teclas de función regulan el brillo de la iluminación individual de cuatro niveles de las teclas (RGB). En general, podemos hablar de un teclado sólido.
Panel táctil
Un clickpad multitáctil (aprox. 11,6 x 7,2 cm) sirve como sustituto del ratón. Su superficie lisa facilita el deslizamiento de los dedos. Ofrece un recorrido corto y un punto de presión claro. Un toque con el dedo en el LED de la esquina superior izquierda enciende o apaga todo el pad.
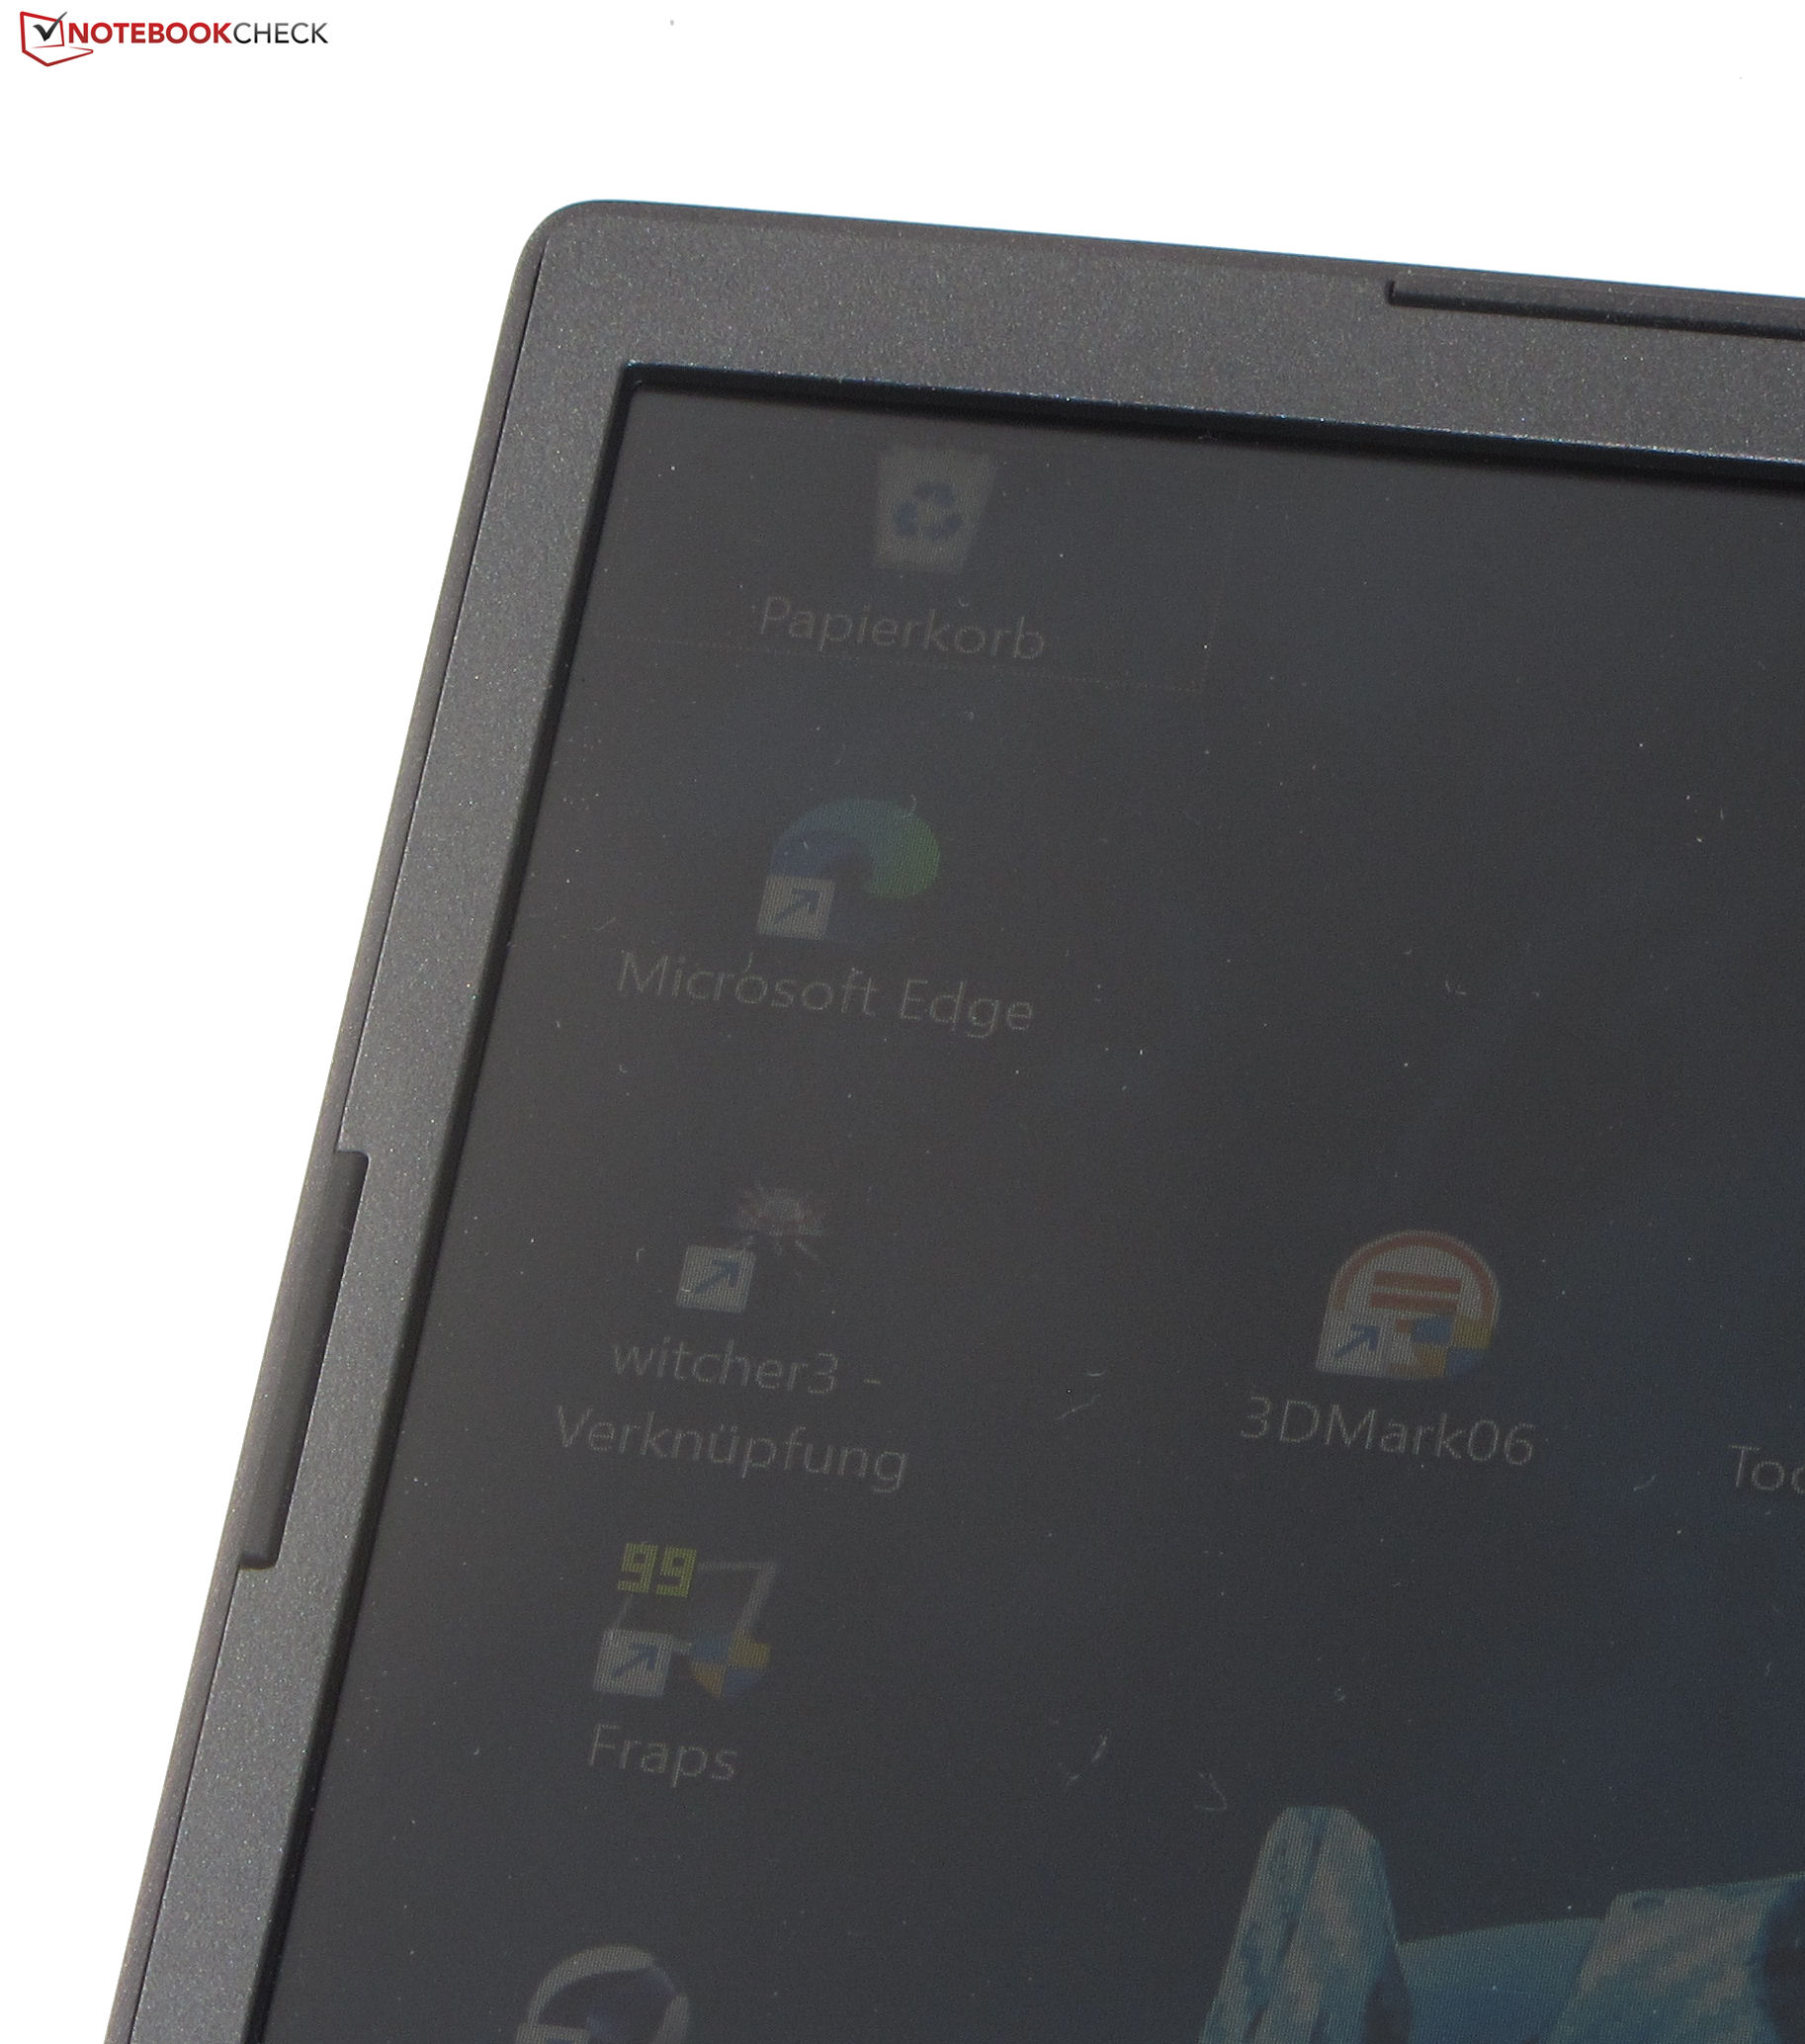
Pantalla - QHD+ en formato 16:10
Medion instala un panel de 240 Hz compatible con G-Sync. Este último ajusta dinámicamente las frecuencias de refresco de la pantalla y la GPU para crear la calidad de imagen más fluida posible - particularmente al jugar.
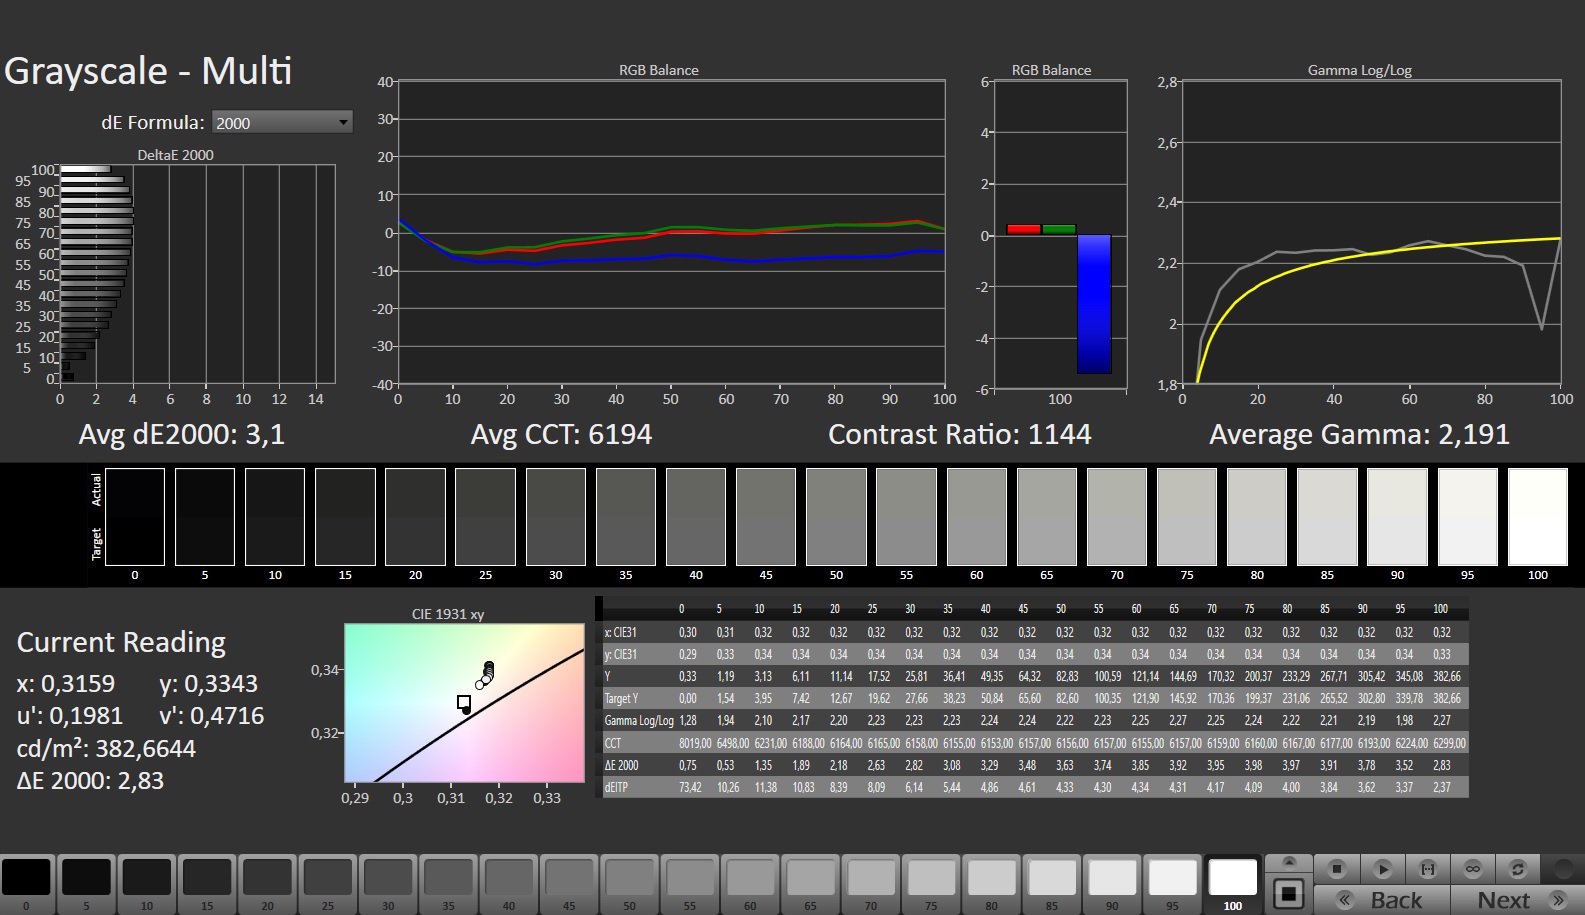
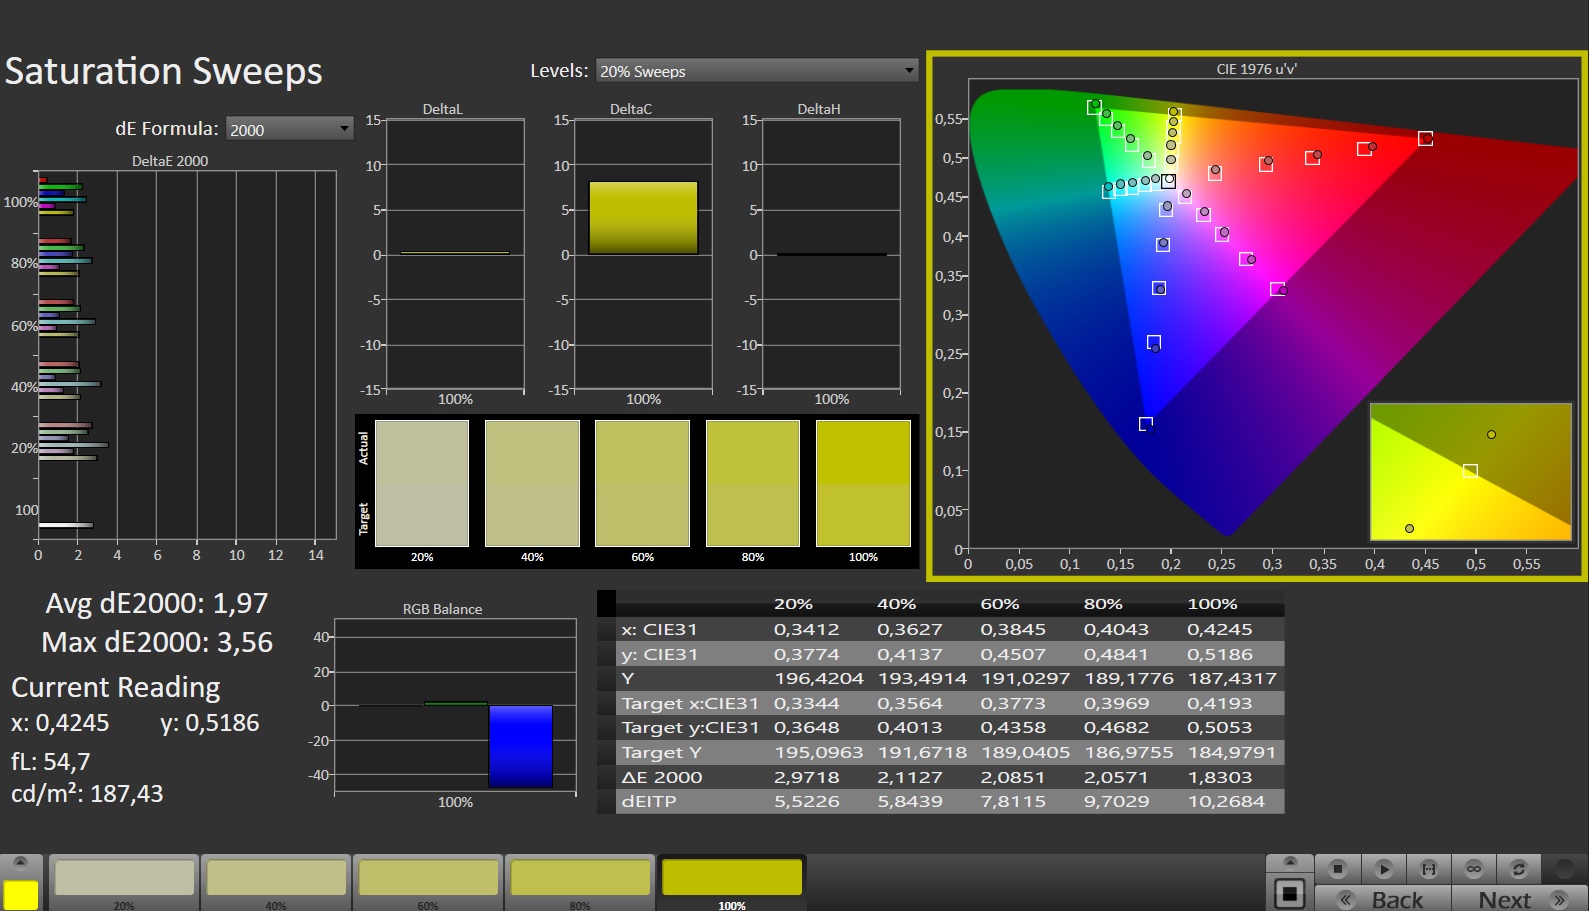
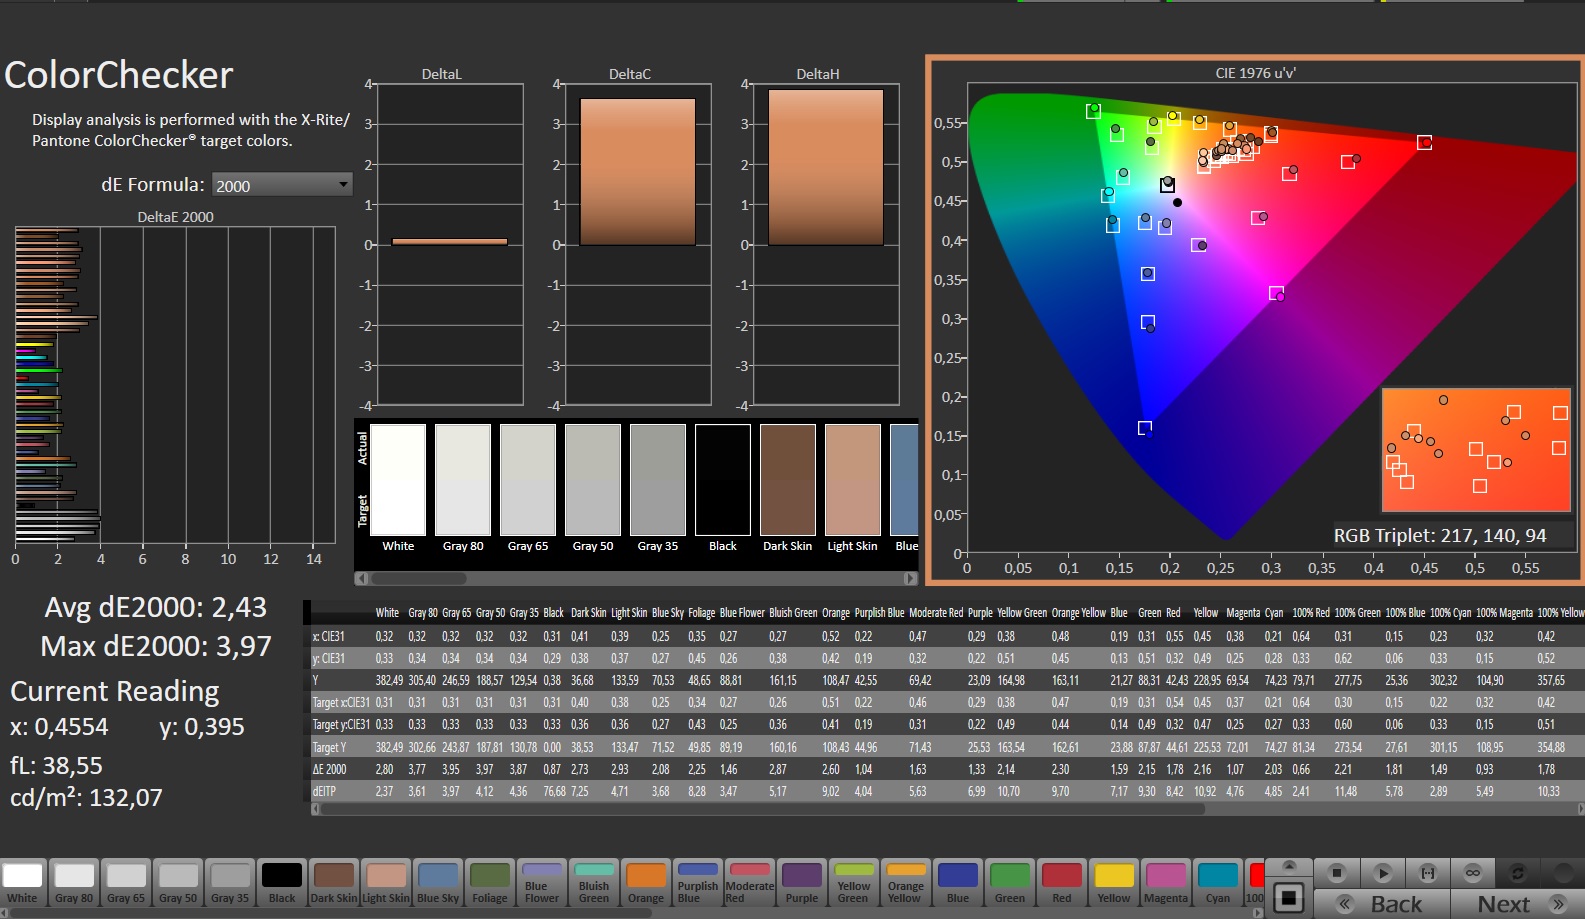
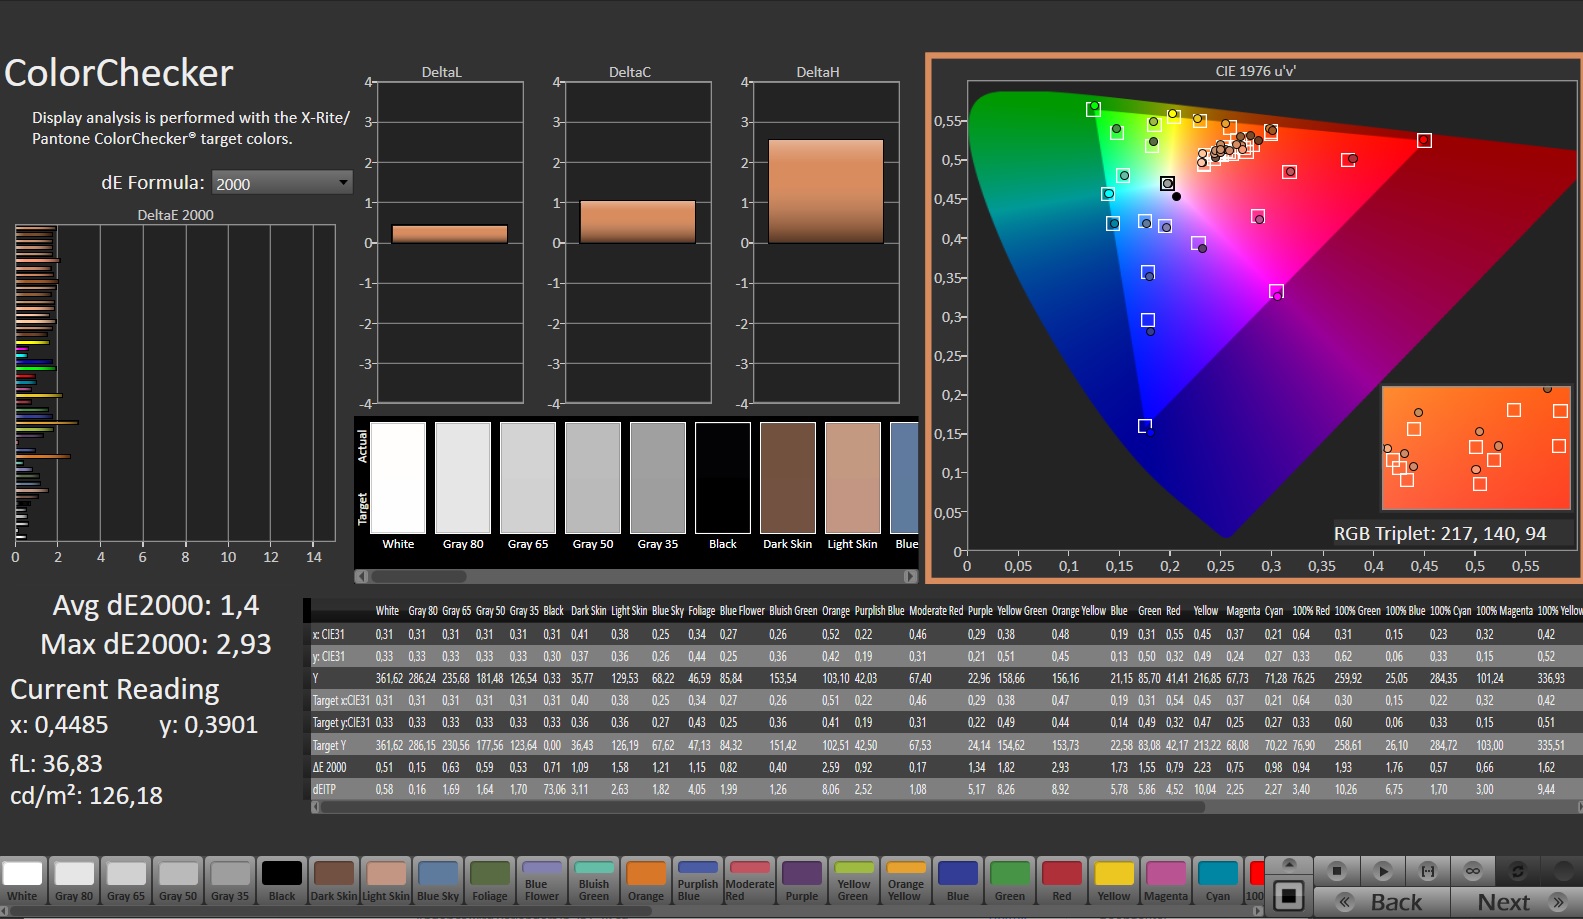
El parpadeo PWM no está presente en ningún ajuste de brillo. El brillo y el contraste del panel mate de 16 pulgadas (2560x1600) en el formato 16:10, que facilita el trabajo, alcanzan el objetivo correspondiente (> 300 cd/m² o 1000:1).
| |||||||||||||||||||||||||
iluminación: 92 %
Brillo con batería: 374 cd/m²
Contraste: 1133:1 (Negro: 0.33 cd/m²)
ΔE ColorChecker Calman: 2.43 | ∀{0.5-29.43 Ø4.71}
calibrated: 1.4
ΔE Greyscale Calman: 3.1 | ∀{0.09-98 Ø4.96}
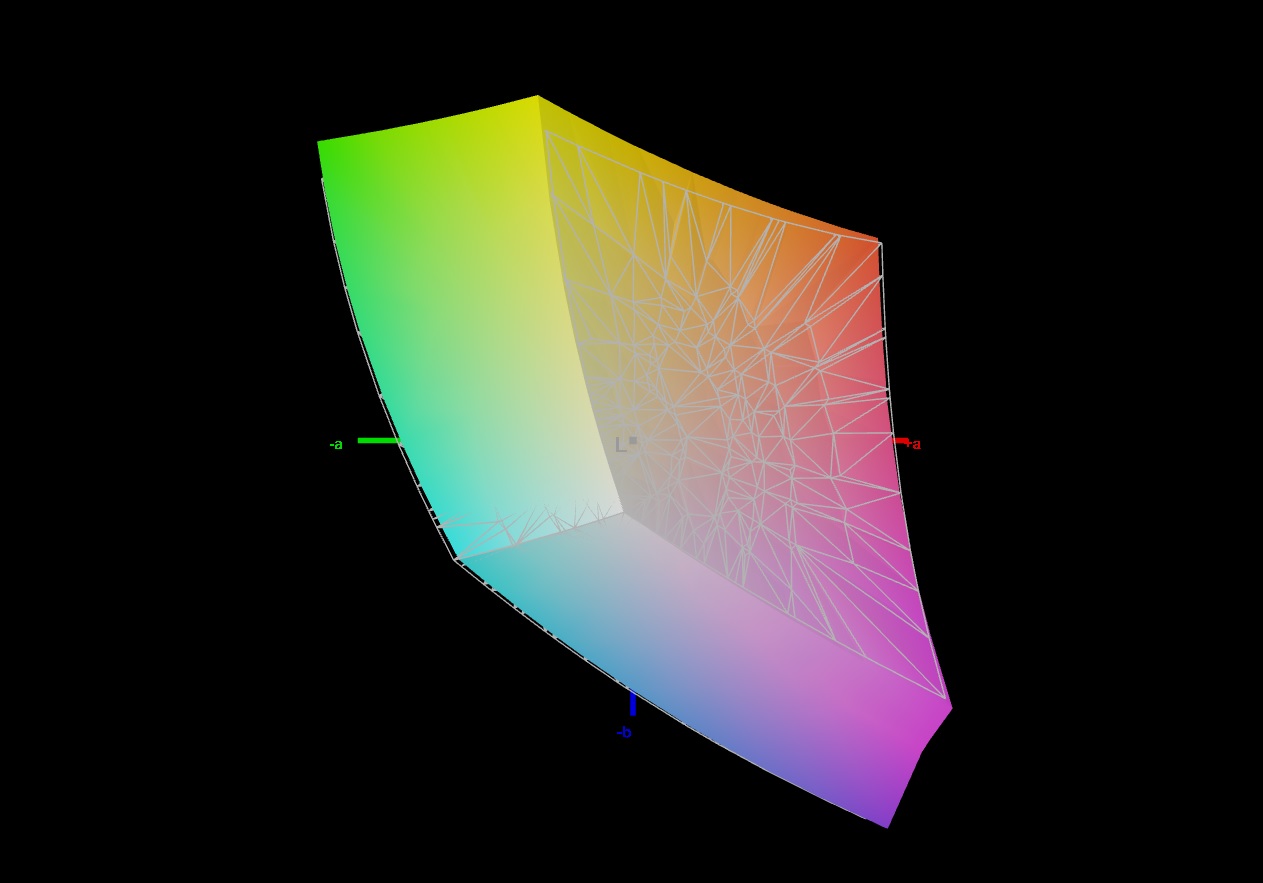
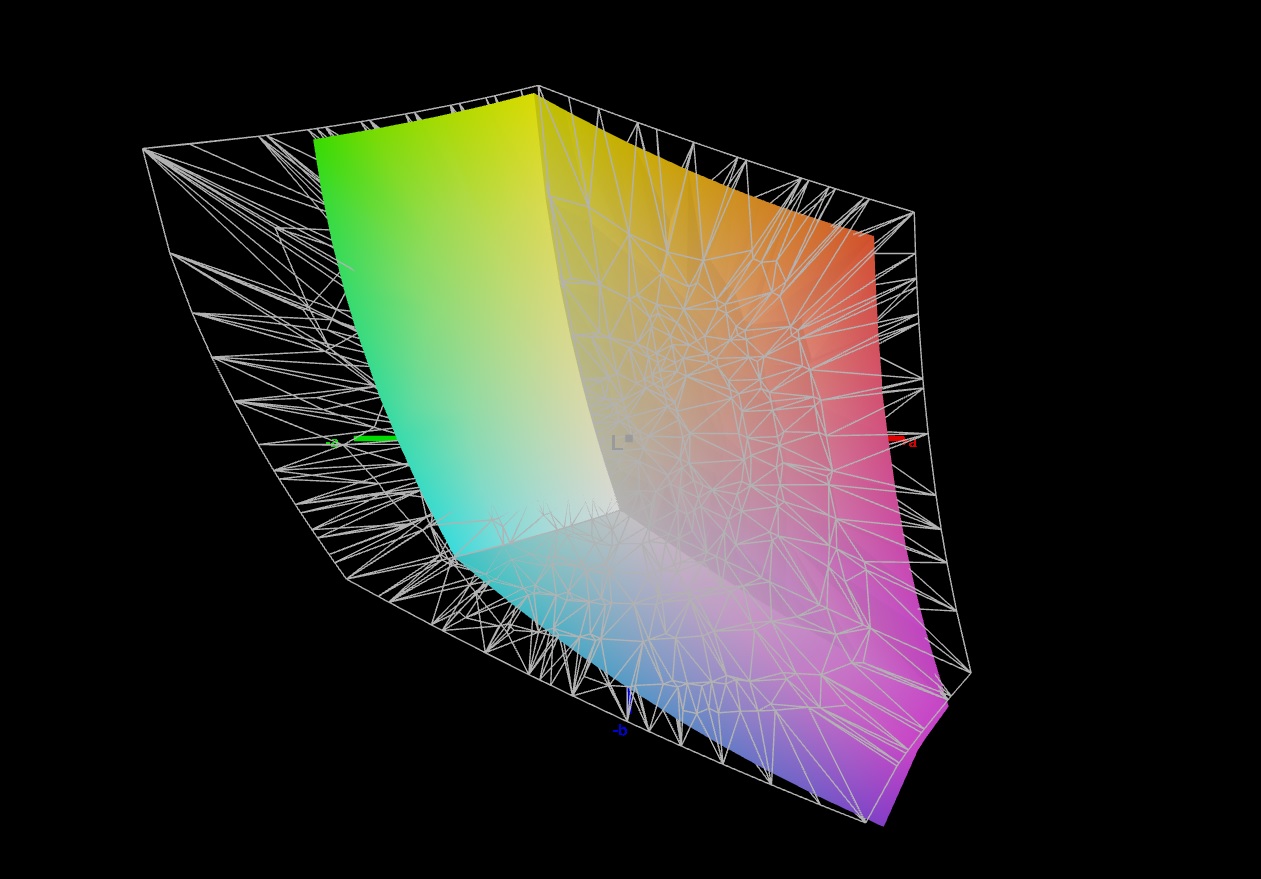
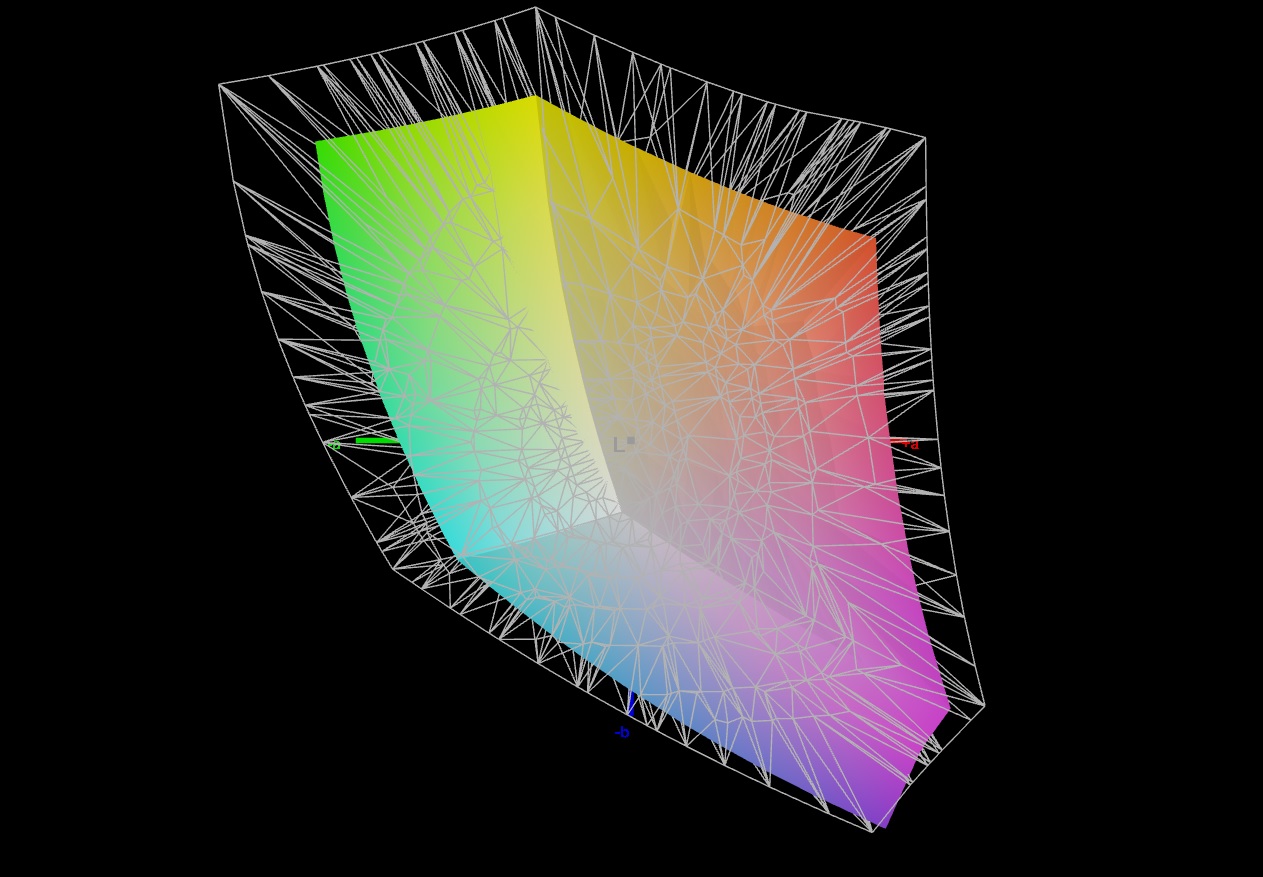
70.9% AdobeRGB 1998 (Argyll 3D)
98% sRGB (Argyll 3D)
69.4% Display P3 (Argyll 3D)
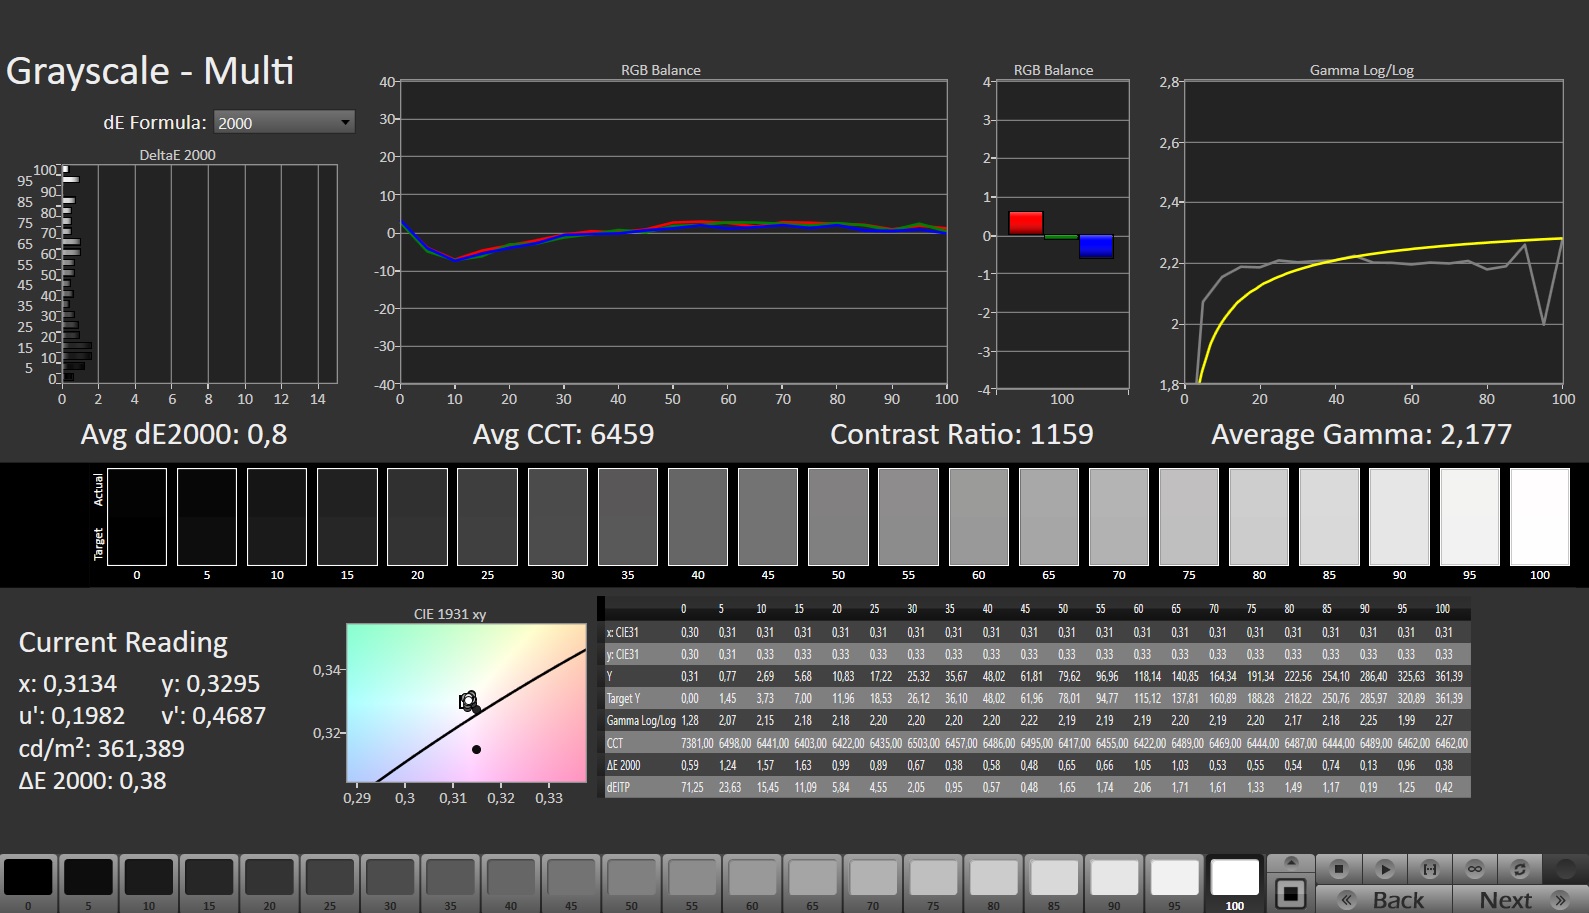
Gamma: 2.191
CCT: 6194 K
| Medion Erazer Major X20 BOE CQ NE160QDM-NZ1, IPS, 2560x1600, 16" | Aorus 15X ASF BOE CQ NE156QHM-NZ1, IPS, 2560x1440, 15.6" | Razer Blade 15 OLED (Early 2022) Samsung ATNA562P02-0, OLED, 2560x1440, 15.6" | Asus ROG Strix G17 G713PI BOE0B69, IPS, 2560x1440, 17.3" | |
|---|---|---|---|---|
| Display | -0% | 25% | 22% | |
| Display P3 Coverage (%) | 69.4 | 69.3 0% | 97.6 41% | 98.3 42% |
| sRGB Coverage (%) | 98 | 98.2 0% | 99.4 1% | 100 2% |
| AdobeRGB 1998 Coverage (%) | 70.9 | 70.5 -1% | 94 33% | 85.9 21% |
| Response Times | -12% | 79% | 21% | |
| Response Time Grey 50% / Grey 80% * (ms) | 13.1 ? | 12.4 ? 5% | 2 ? 85% | 5.3 ? 60% |
| Response Time Black / White * (ms) | 7.3 ? | 9.4 ? -29% | 2 ? 73% | 8.6 ? -18% |
| PWM Frequency (Hz) | 500 ? | |||
| Screen | 14% | 126% | 12% | |
| Brightness middle (cd/m²) | 374 | 316 -16% | 383 2% | 327 -13% |
| Brightness (cd/m²) | 357 | 301 -16% | 384 8% | 320 -10% |
| Brightness Distribution (%) | 92 | 90 -2% | 99 8% | 89 -3% |
| Black Level * (cd/m²) | 0.33 | 0.28 15% | 0.03 91% | 0.38 -15% |
| Contrast (:1) | 1133 | 1129 0% | 12767 1027% | 861 -24% |
| Colorchecker dE 2000 * | 2.43 | 1.54 37% | 1.89 22% | 1.01 58% |
| Colorchecker dE 2000 max. * | 3.97 | 2.46 38% | 3.76 5% | 4.01 -1% |
| Colorchecker dE 2000 calibrated * | 1.4 | 1.21 14% | 2.67 -91% | 0.41 71% |
| Greyscale dE 2000 * | 3.1 | 1.3 58% | 1.26 59% | 1.6 48% |
| Gamma | 2.191 100% | 2.307 95% | 2.41 91% | 2.168 101% |
| CCT | 6194 105% | 6456 101% | 6386 102% | 6659 98% |
| Media total (Programa/Opciones) | 1% /
7% | 77% /
97% | 18% /
16% |
* ... más pequeño es mejor
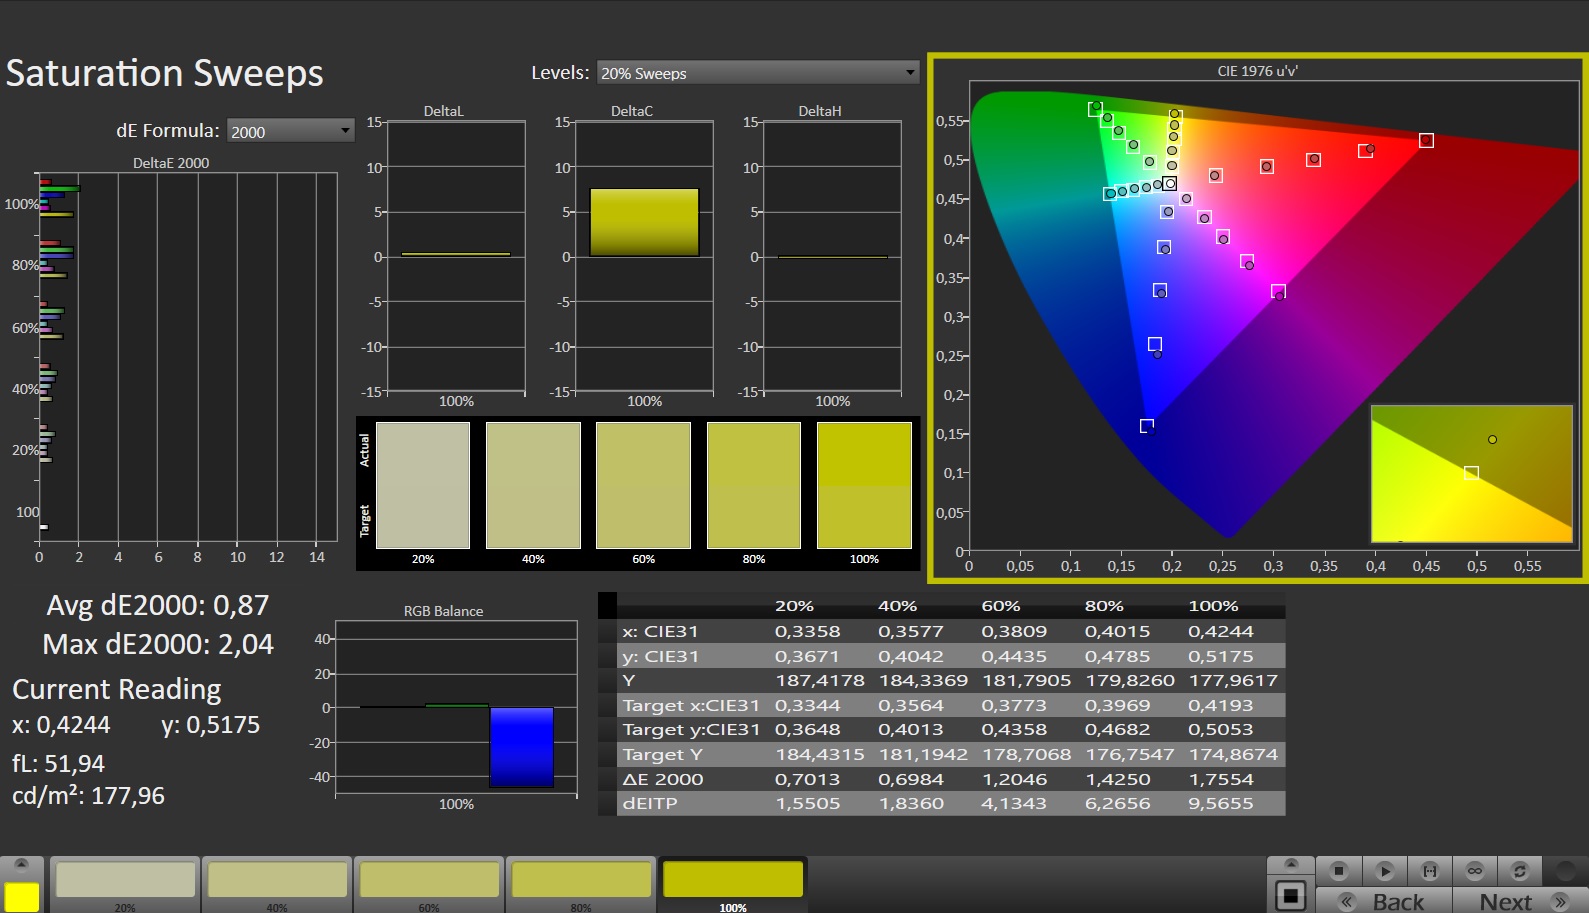
La pantalla produce una buena representación del color en el estado de entrega: El objetivo (DeltaE < 3) se alcanza con una desviación de aproximadamente 2,4. La calibración manual reduce la desviación a 1,4 y garantiza una escala de grises más equilibrada
El panel cubre completamente el espacio de color sRGB, pero no los espacios de color AdobeRGB y DCI-P3. Si se requieren los tres espacios de color, no hay forma de evitar laBlade 15oLED.
Tiempos de respuesta del display
| ↔ Tiempo de respuesta de Negro a Blanco | ||
|---|---|---|
| 7.3 ms ... subida ↗ y bajada ↘ combinada | ↗ 3.1 ms subida | 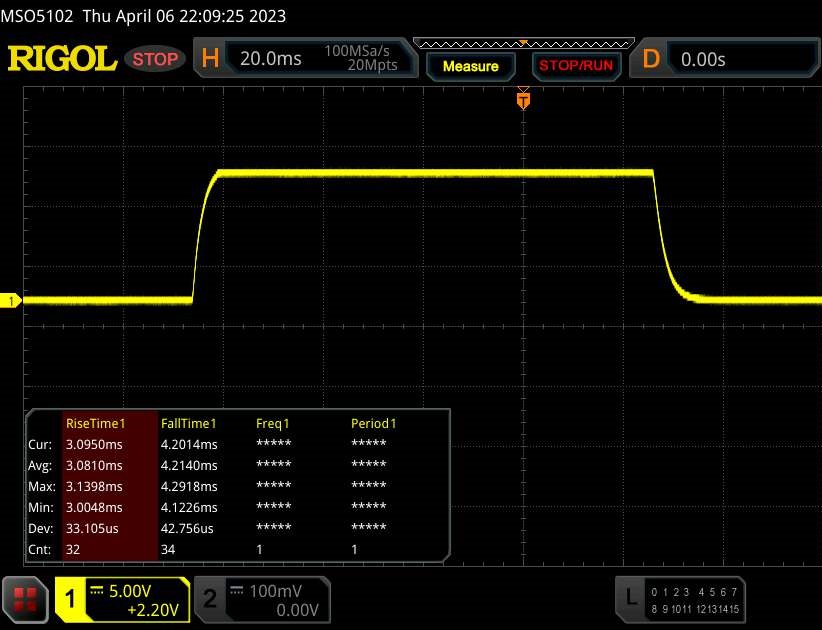 |
| ↘ 4.2 ms bajada | ||
| La pantalla mostró tiempos de respuesta muy rápidos en nuestros tests y debería ser adecuada para juegos frenéticos. En comparación, todos los dispositivos de prueba van de ##min### (mínimo) a 240 (máximo) ms. » 22 % de todos los dispositivos son mejores. Esto quiere decir que el tiempo de respuesta medido es mejor que la media (19.8 ms) de todos los dispositivos testados. | ||
| ↔ Tiempo de respuesta 50% Gris a 80% Gris | ||
| 13.1 ms ... subida ↗ y bajada ↘ combinada | ↗ 6 ms subida | 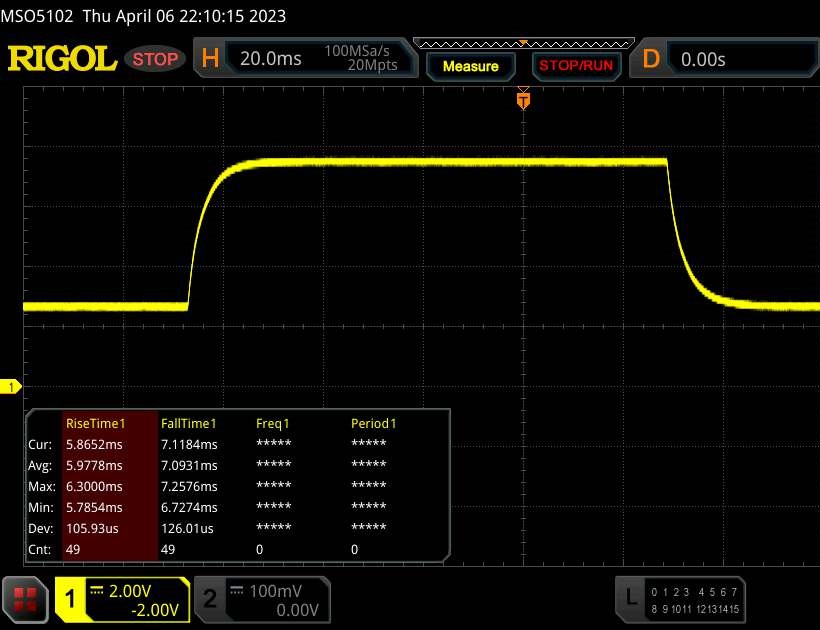 |
| ↘ 7.1 ms bajada | ||
| La pantalla mostró buenos tiempos de respuesta en nuestros tests pero podría ser demasiado lenta para los jugones competitivos. En comparación, todos los dispositivos de prueba van de ##min### (mínimo) a 636 (máximo) ms. » 27 % de todos los dispositivos son mejores. Esto quiere decir que el tiempo de respuesta medido es mejor que la media (31 ms) de todos los dispositivos testados. | ||
Parpadeo de Pantalla / PWM (Pulse-Width Modulation)
| Parpadeo de Pantalla / PWM no detectado | 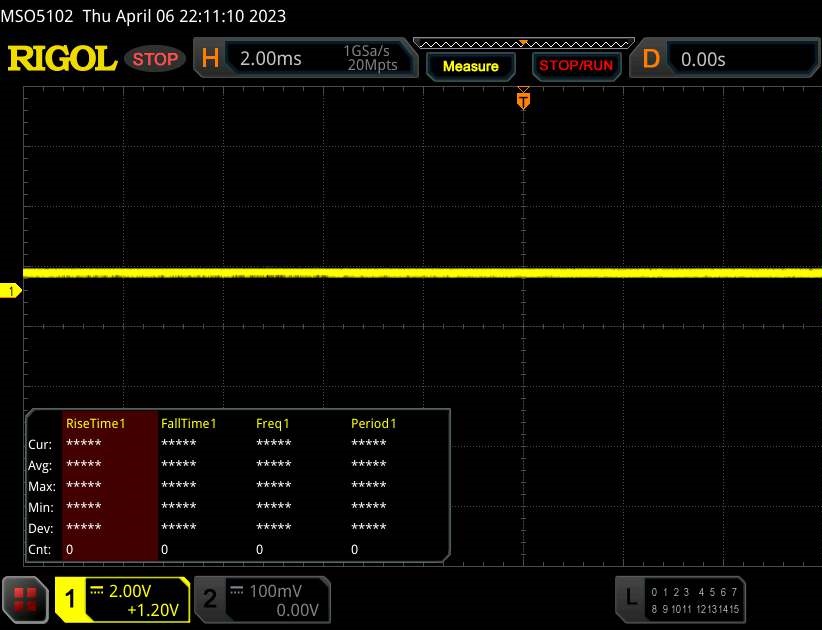 | ||
Comparación: 52 % de todos los dispositivos testados no usaron PWM para atenuar el display. Si se usó, medimos una media de 7757 (mínimo: 5 - máxmo: 343500) Hz. | |||
El panel IPS de ángulo de visión estable puede leerse desde cualquier posición. Es posible leer la pantalla en exteriores si el sol no es demasiado fuerte.

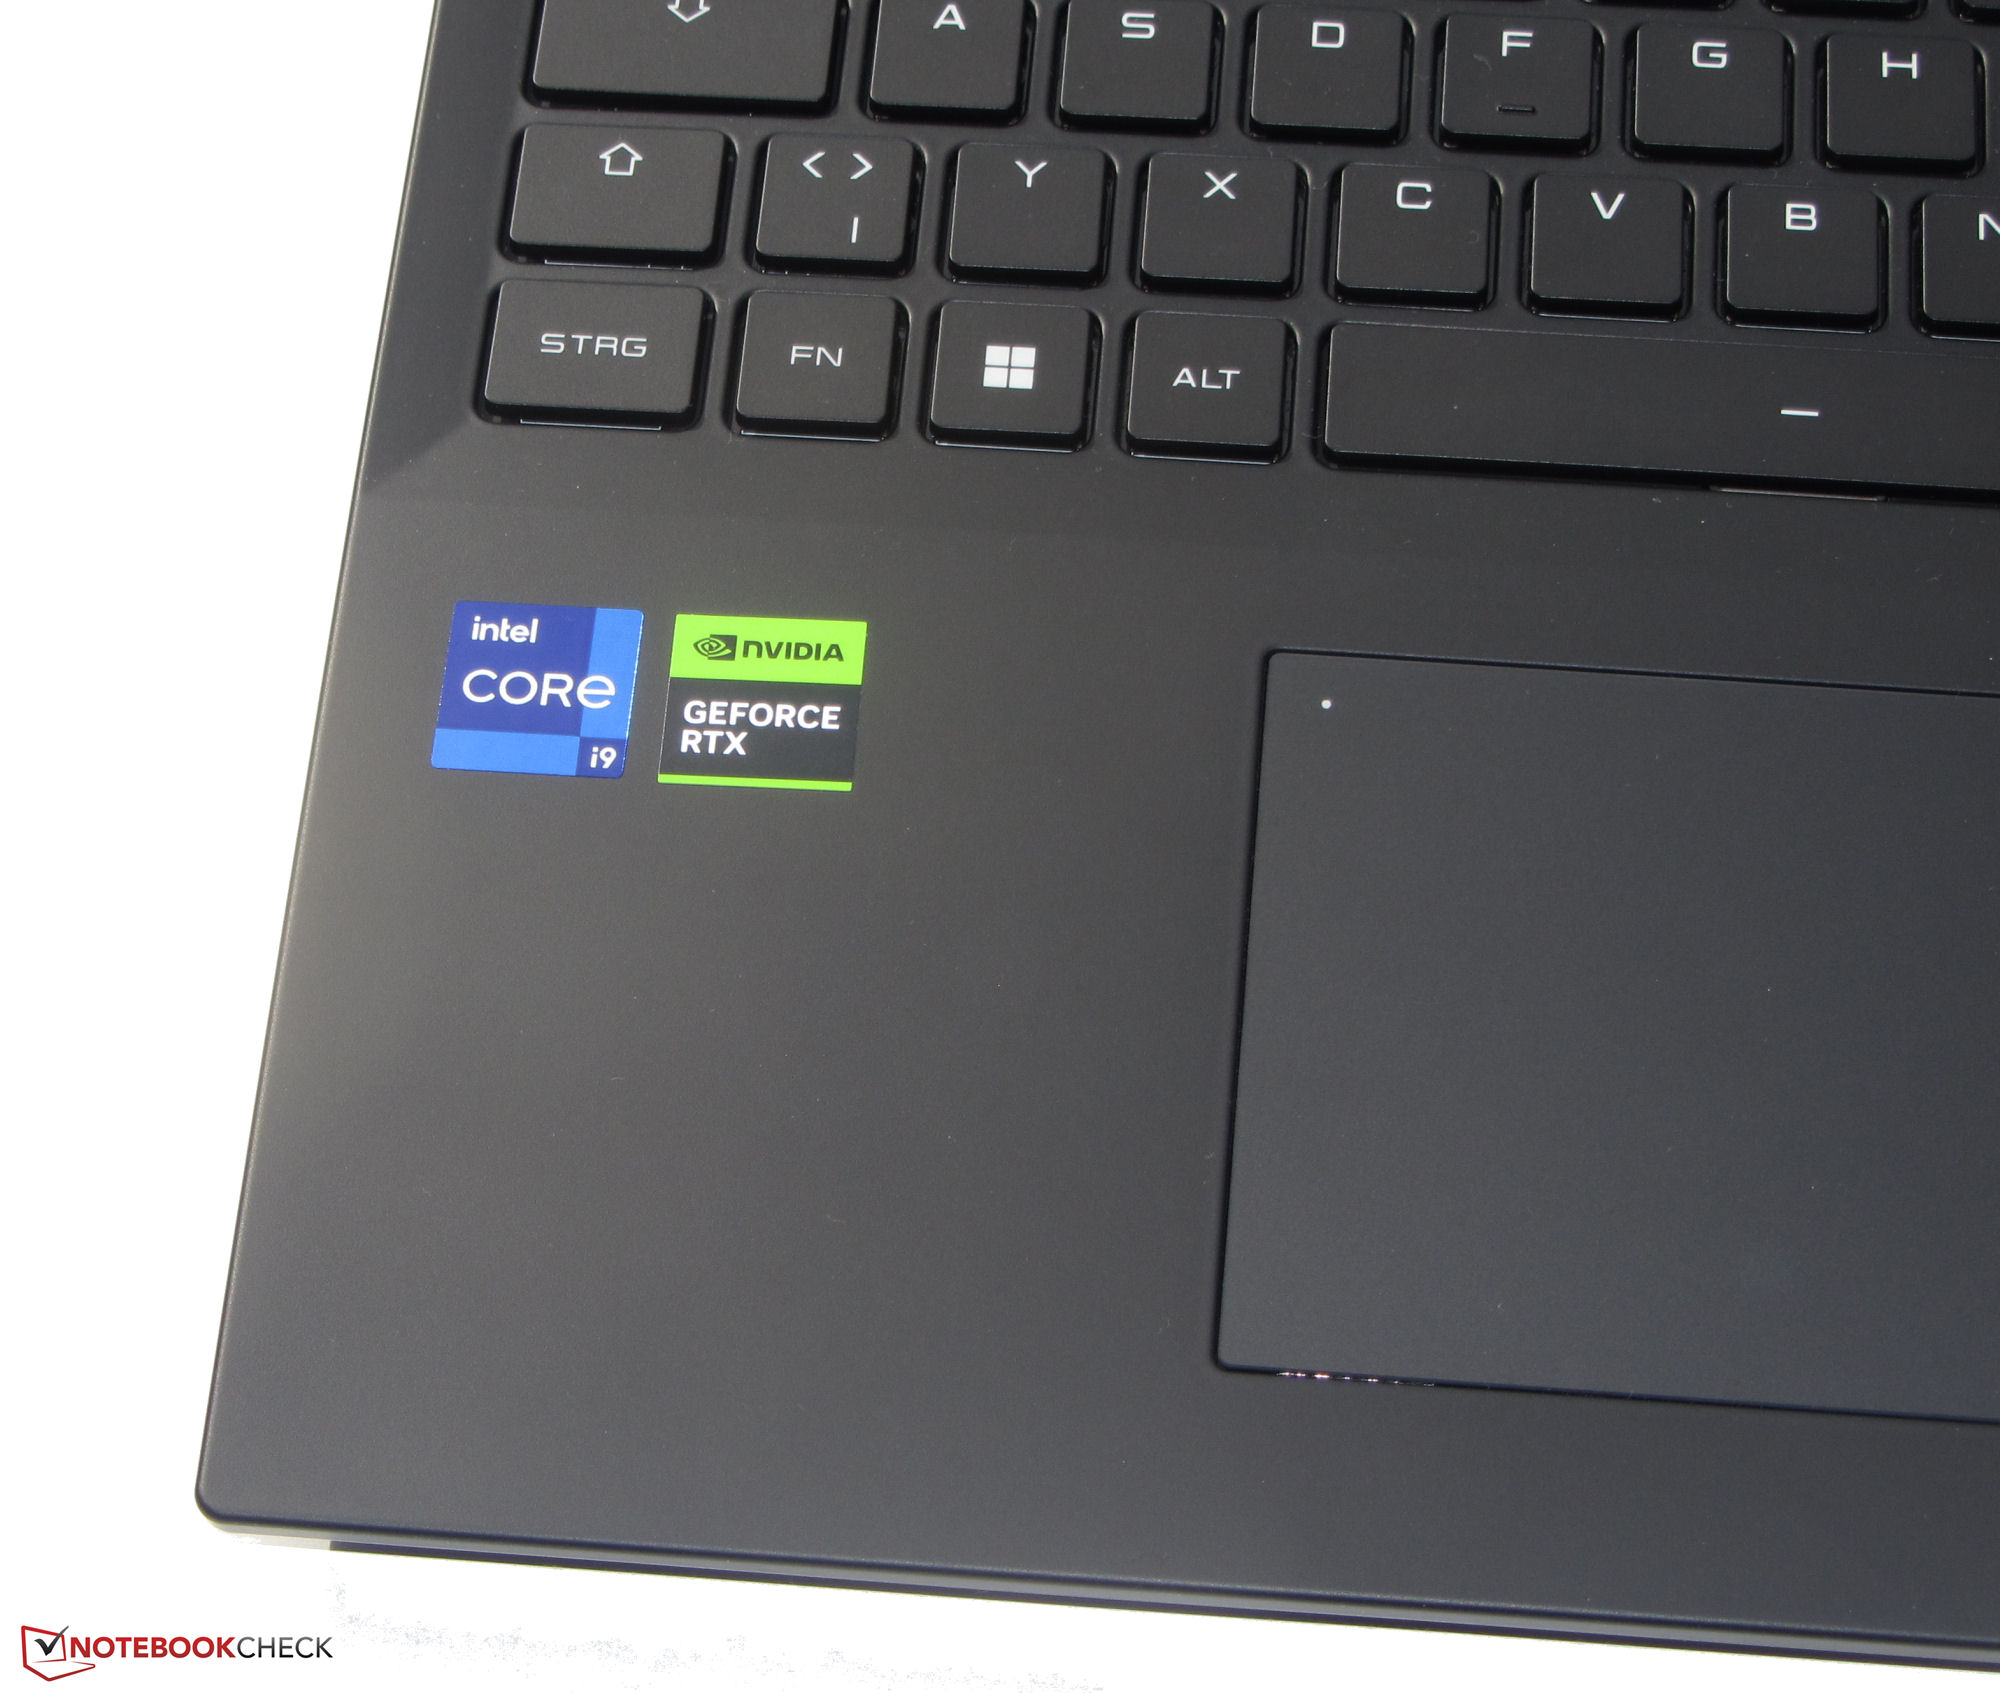
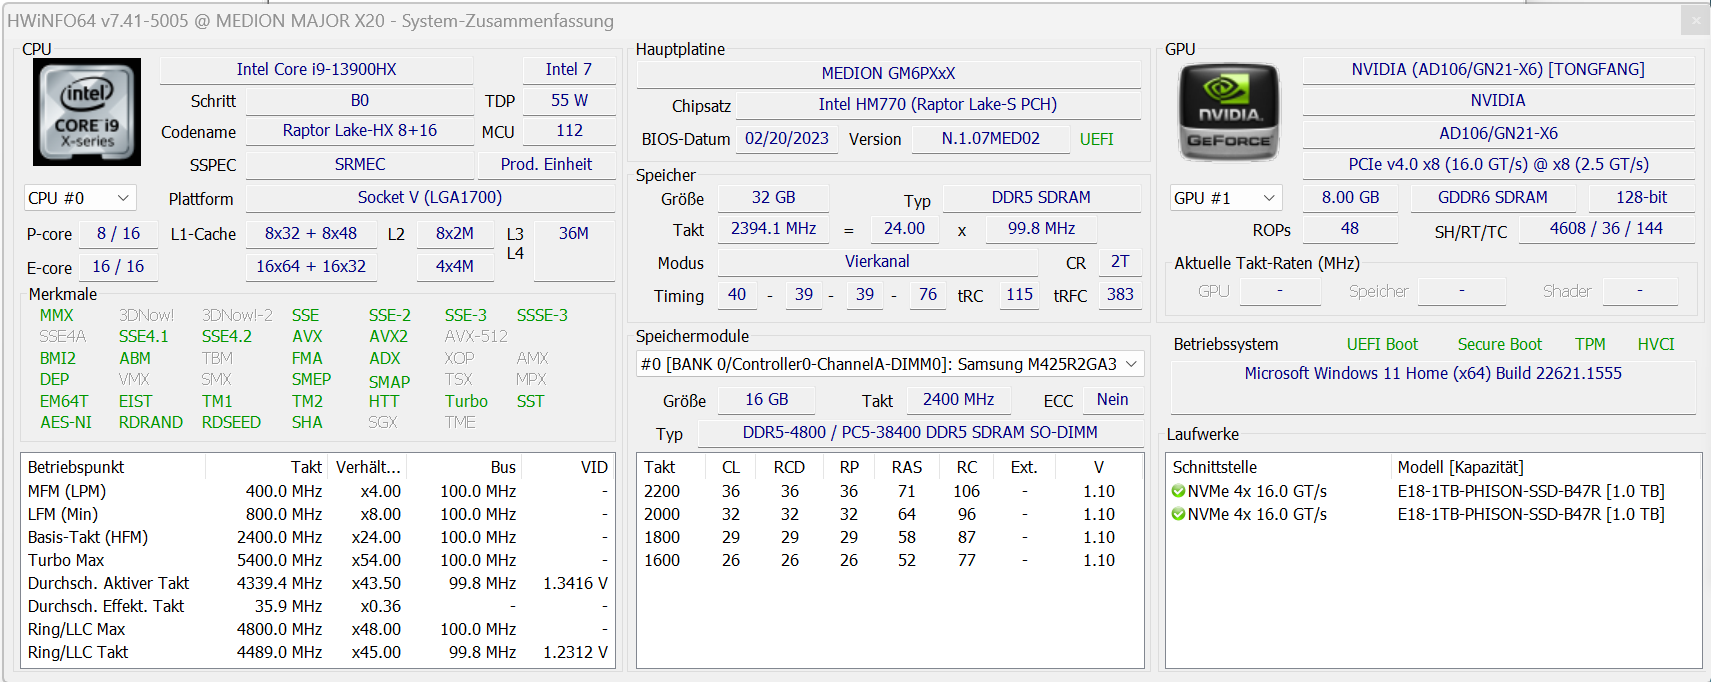
Rendimiento - Raptor Lake y Ada Lovelace impulsan el portátil para juegos
Los juegos, el renderizado y, en general, todas las áreas de aplicación exigentes en cuanto a rendimiento se cuentan entre los escenarios de aplicación del Erazer Major X20. Raptor Lake y Ada Lovelace proporcionan la potencia de cálculo necesaria. Este modelo está disponible por unos 2.500 euros.
Condiciones de ensayo
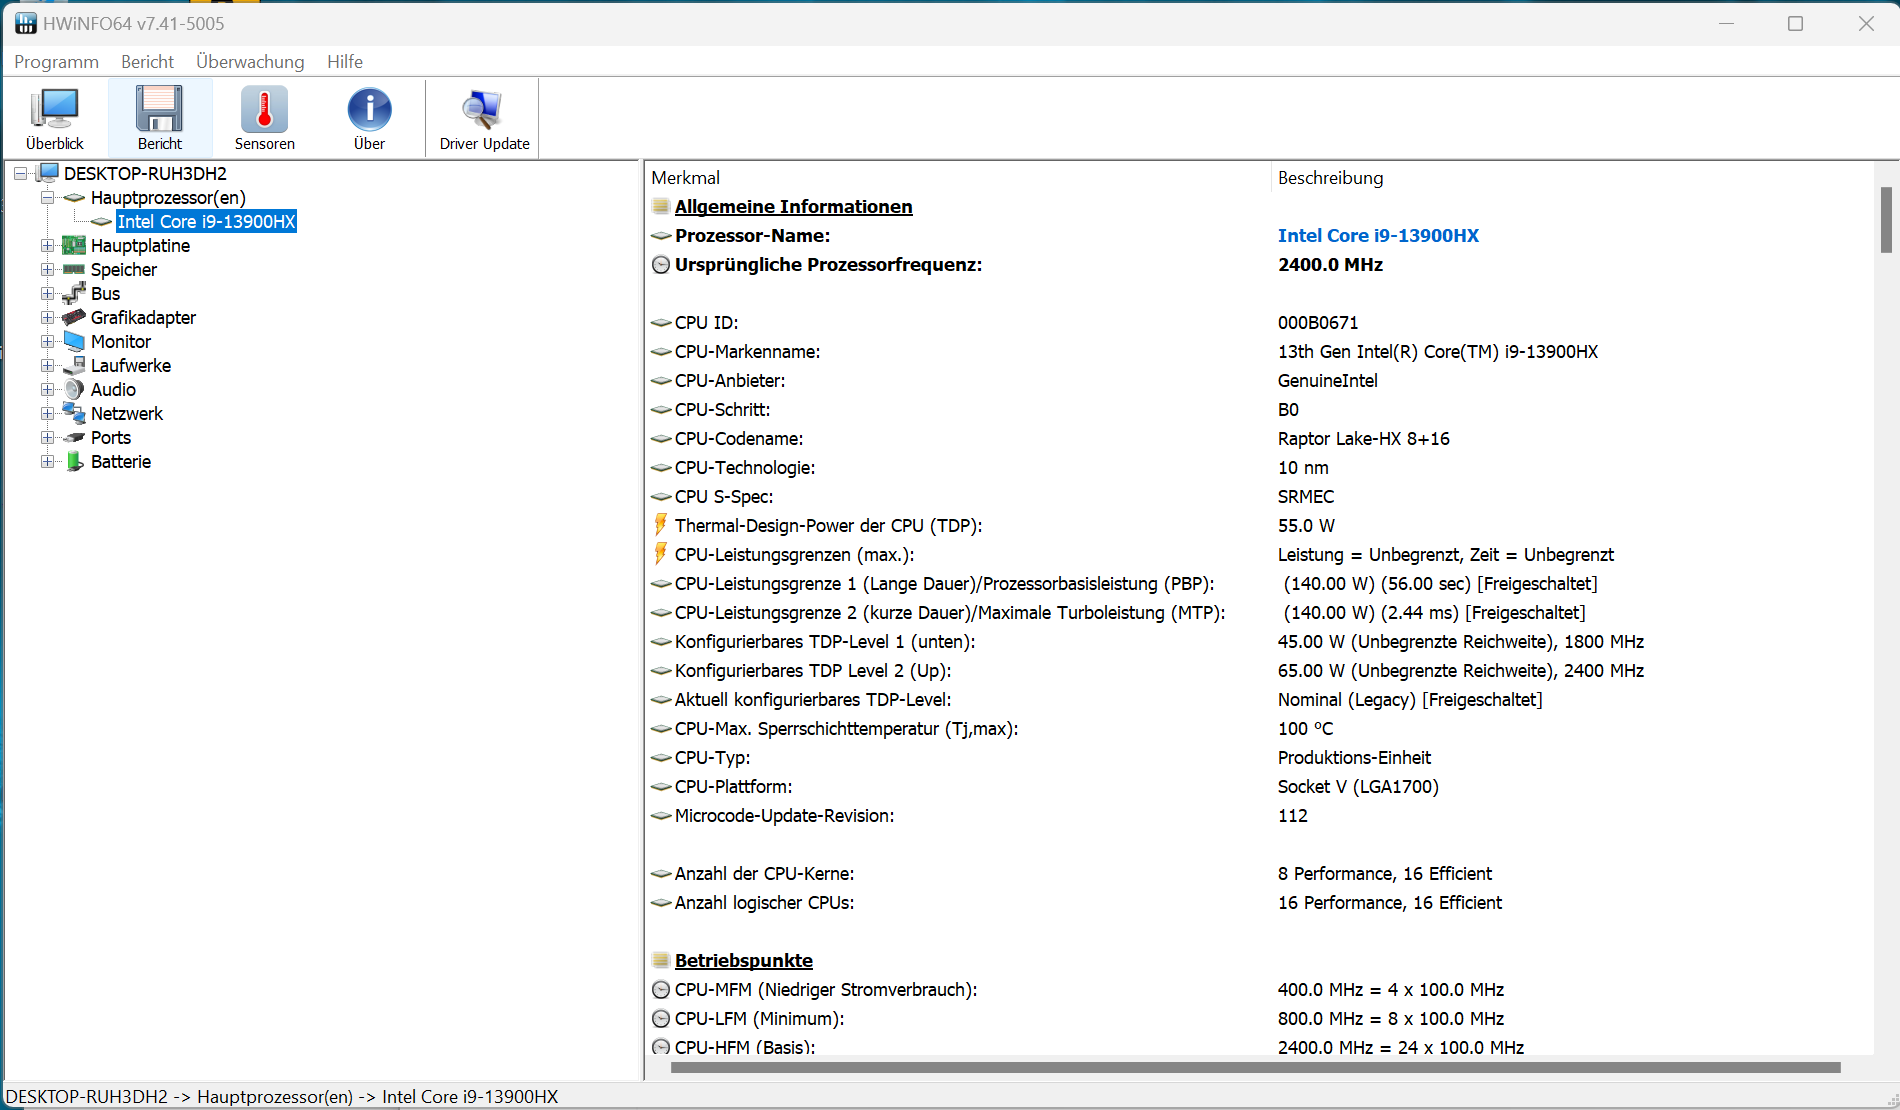
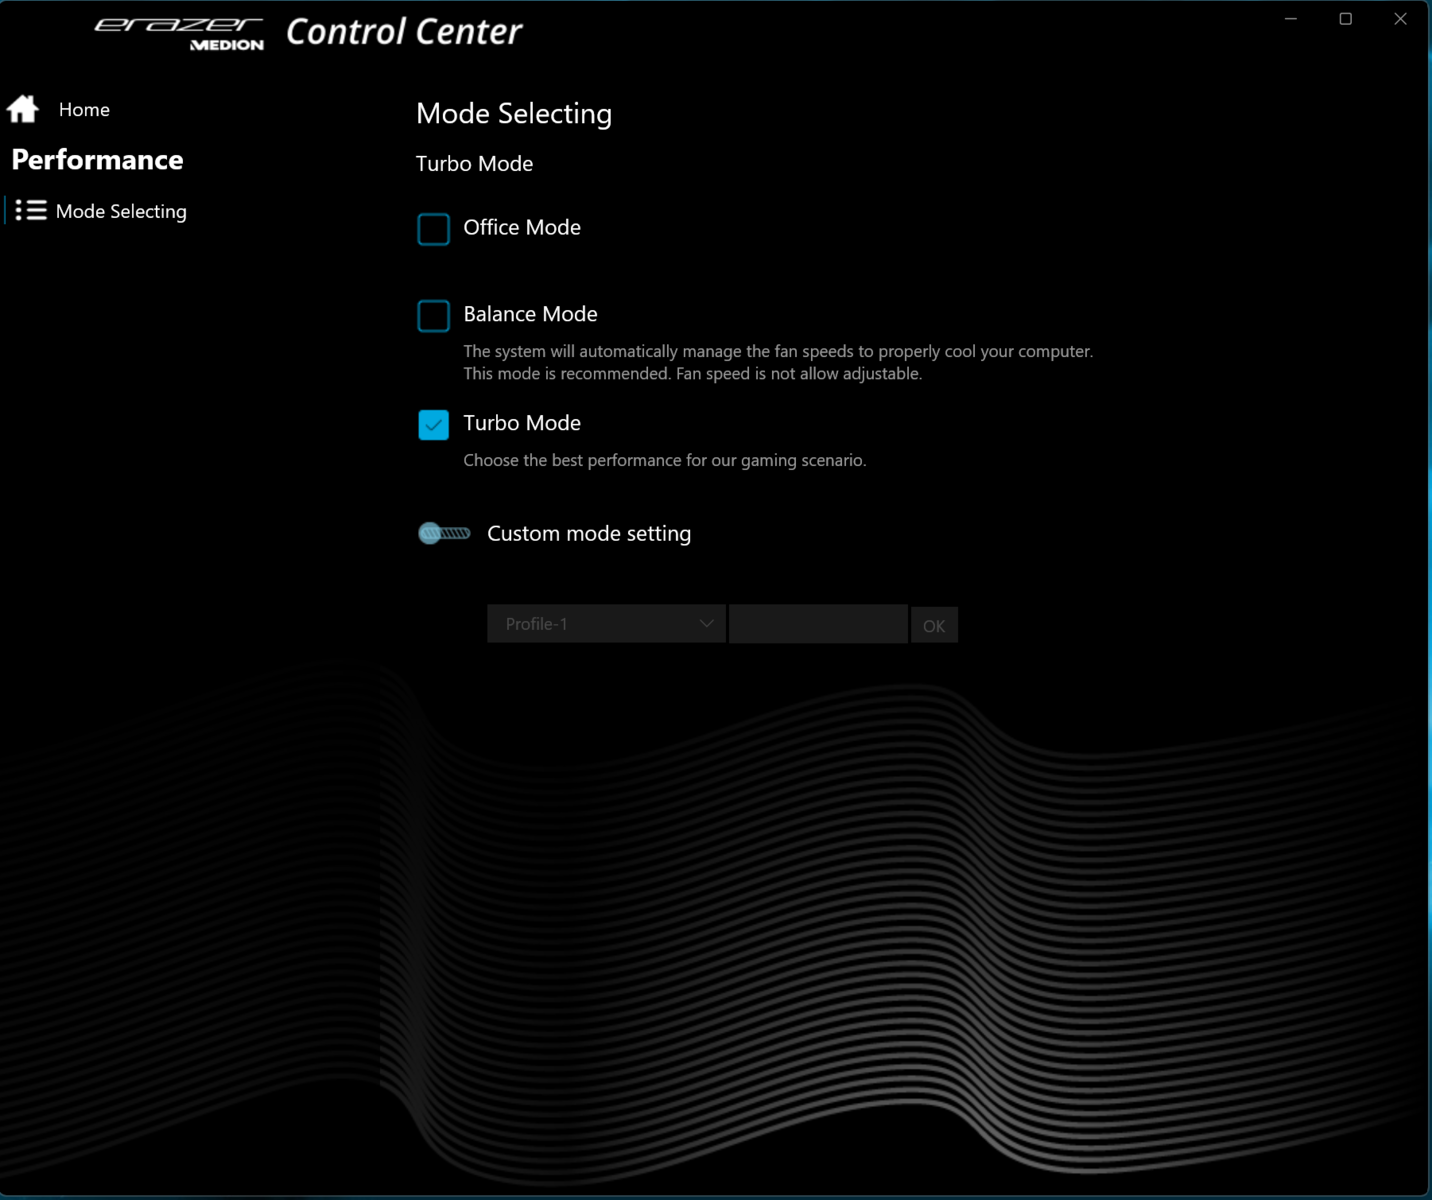
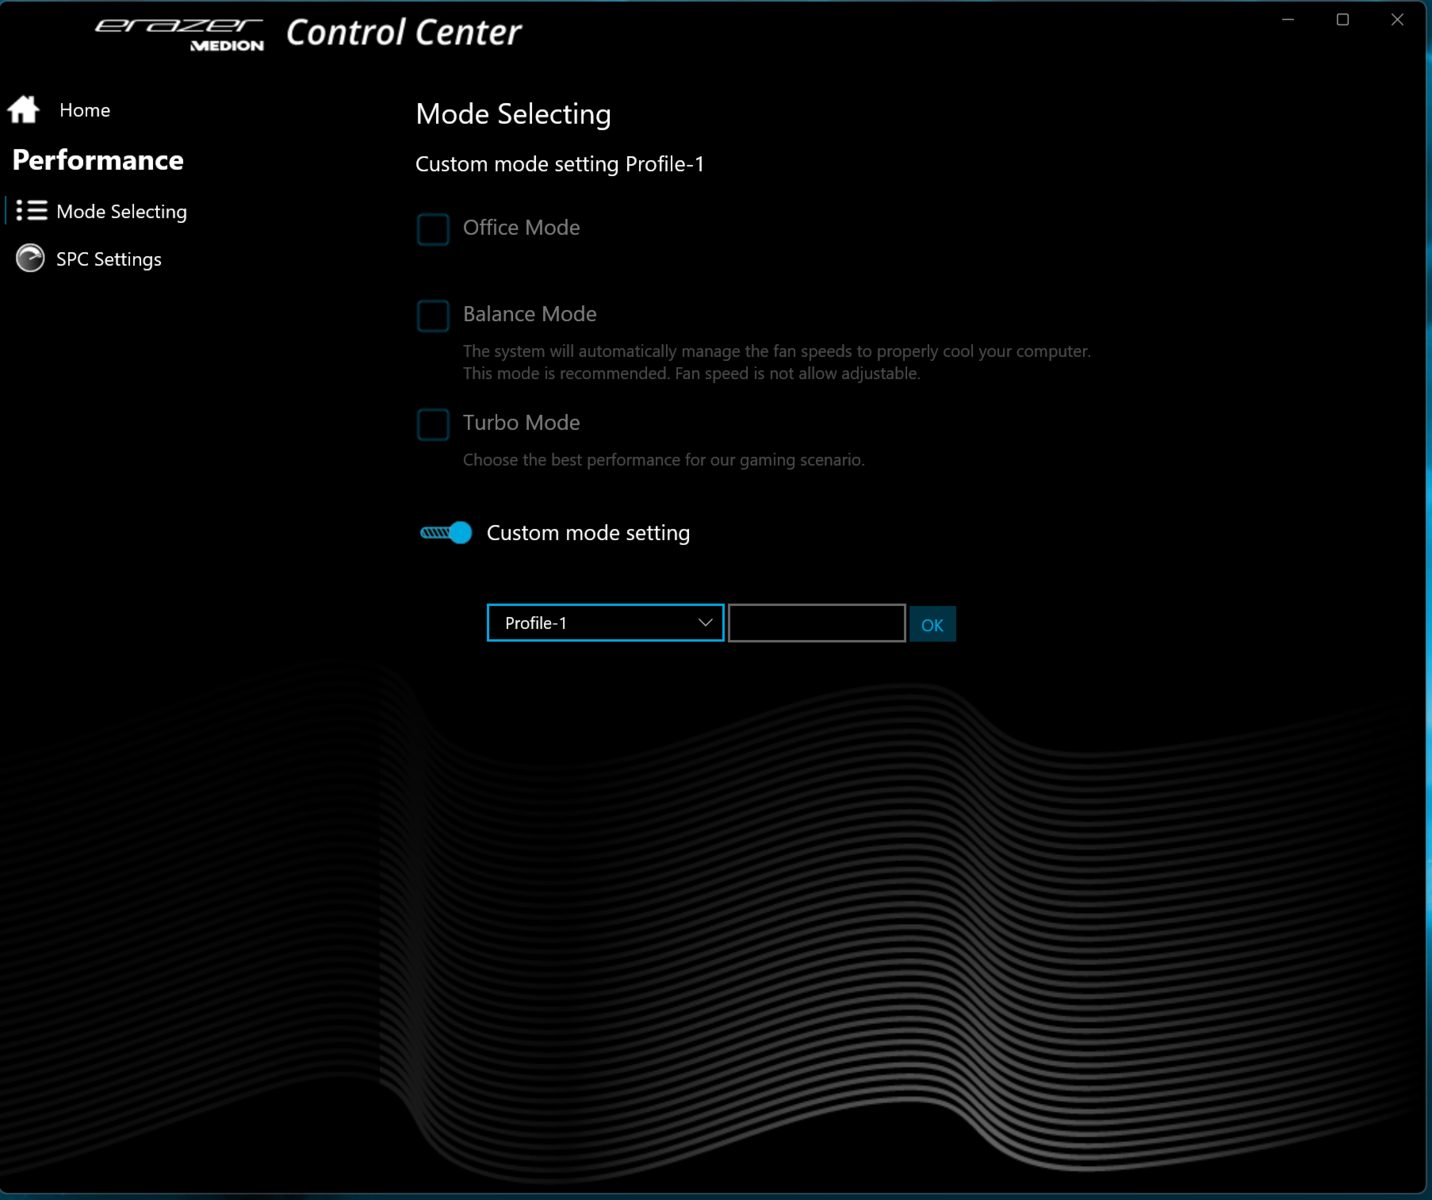
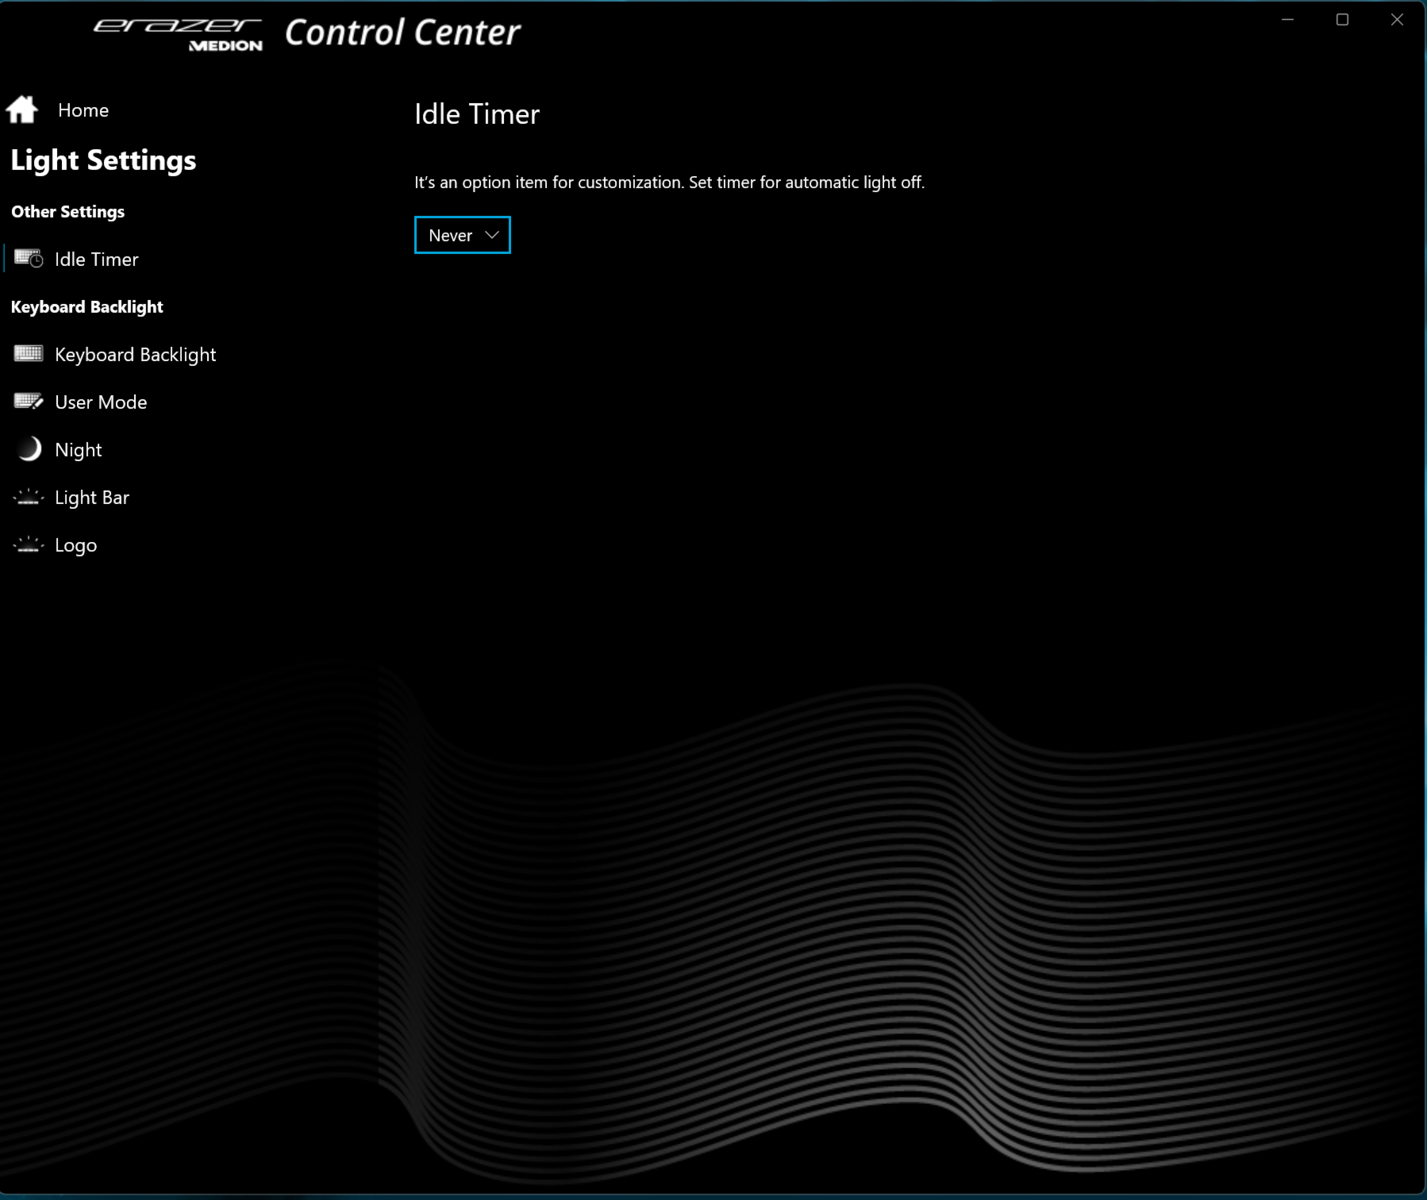
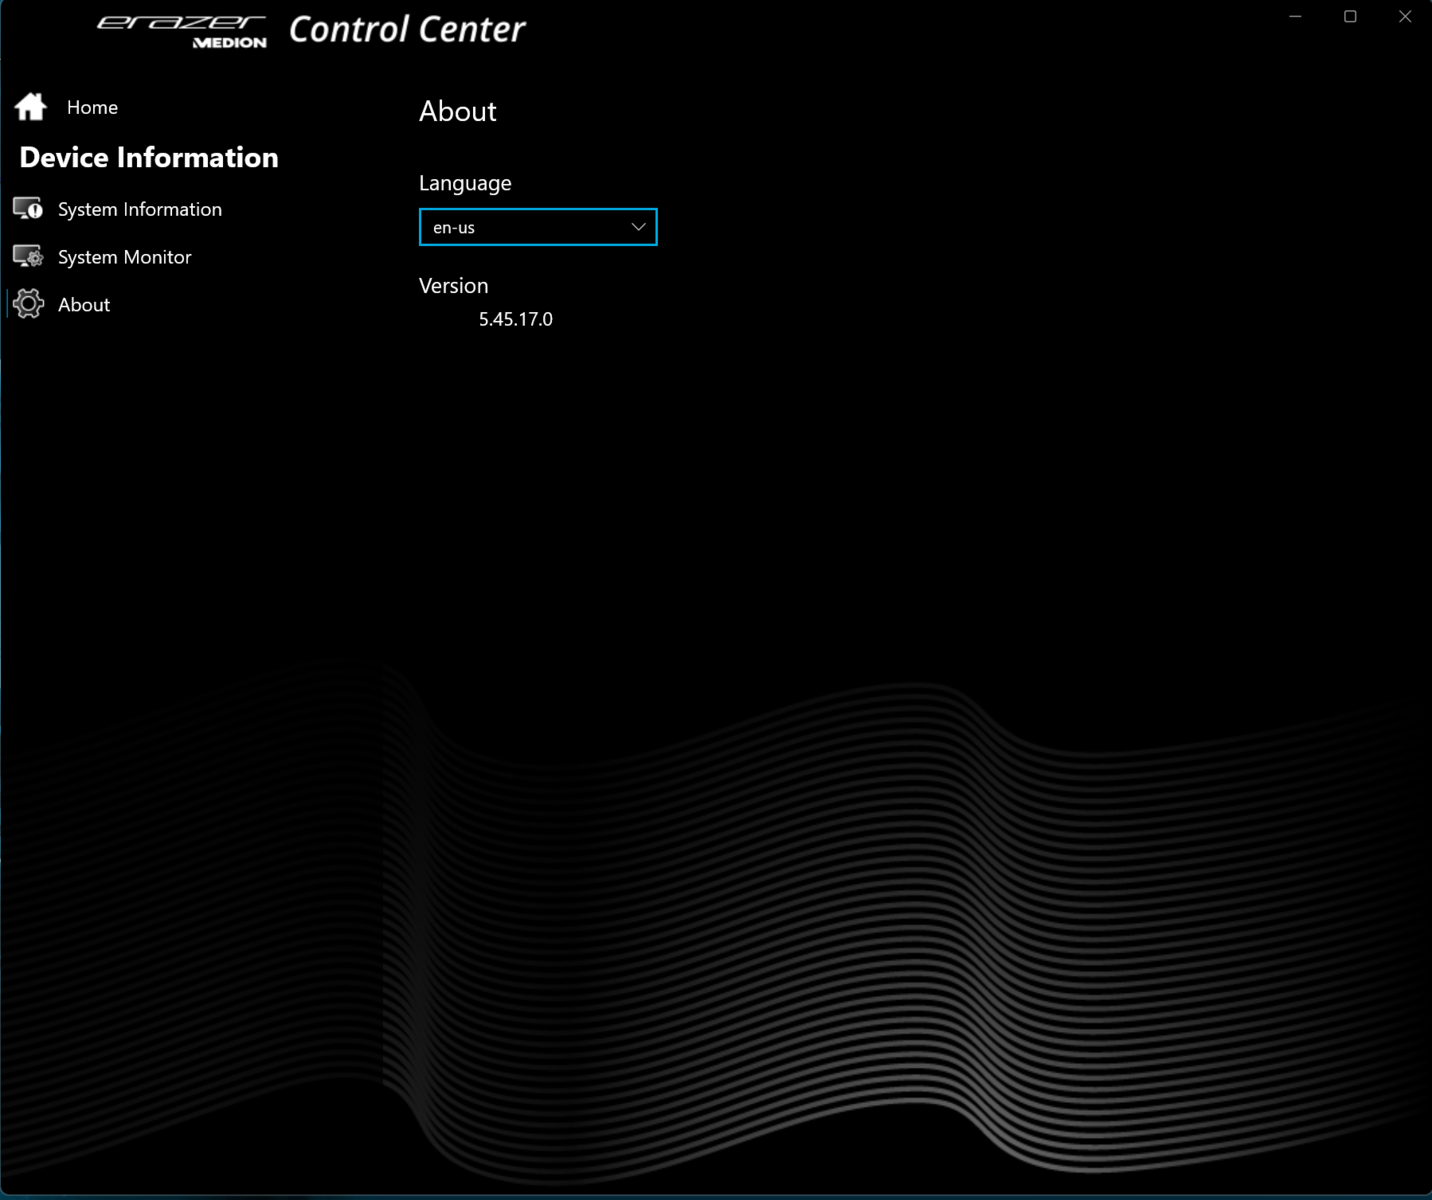
La X20 ofrece tres modos de alimentación específicos del fabricante (ver tabla), que puedes seleccionar mediante un botón independiente (junto al botón de encendido). Un LED de estado revela qué modo está activo. se usaron "Modo Turbo" (benchmarks) y "Modo Oficina" (pruebas de batería). Optimus estaba activo.
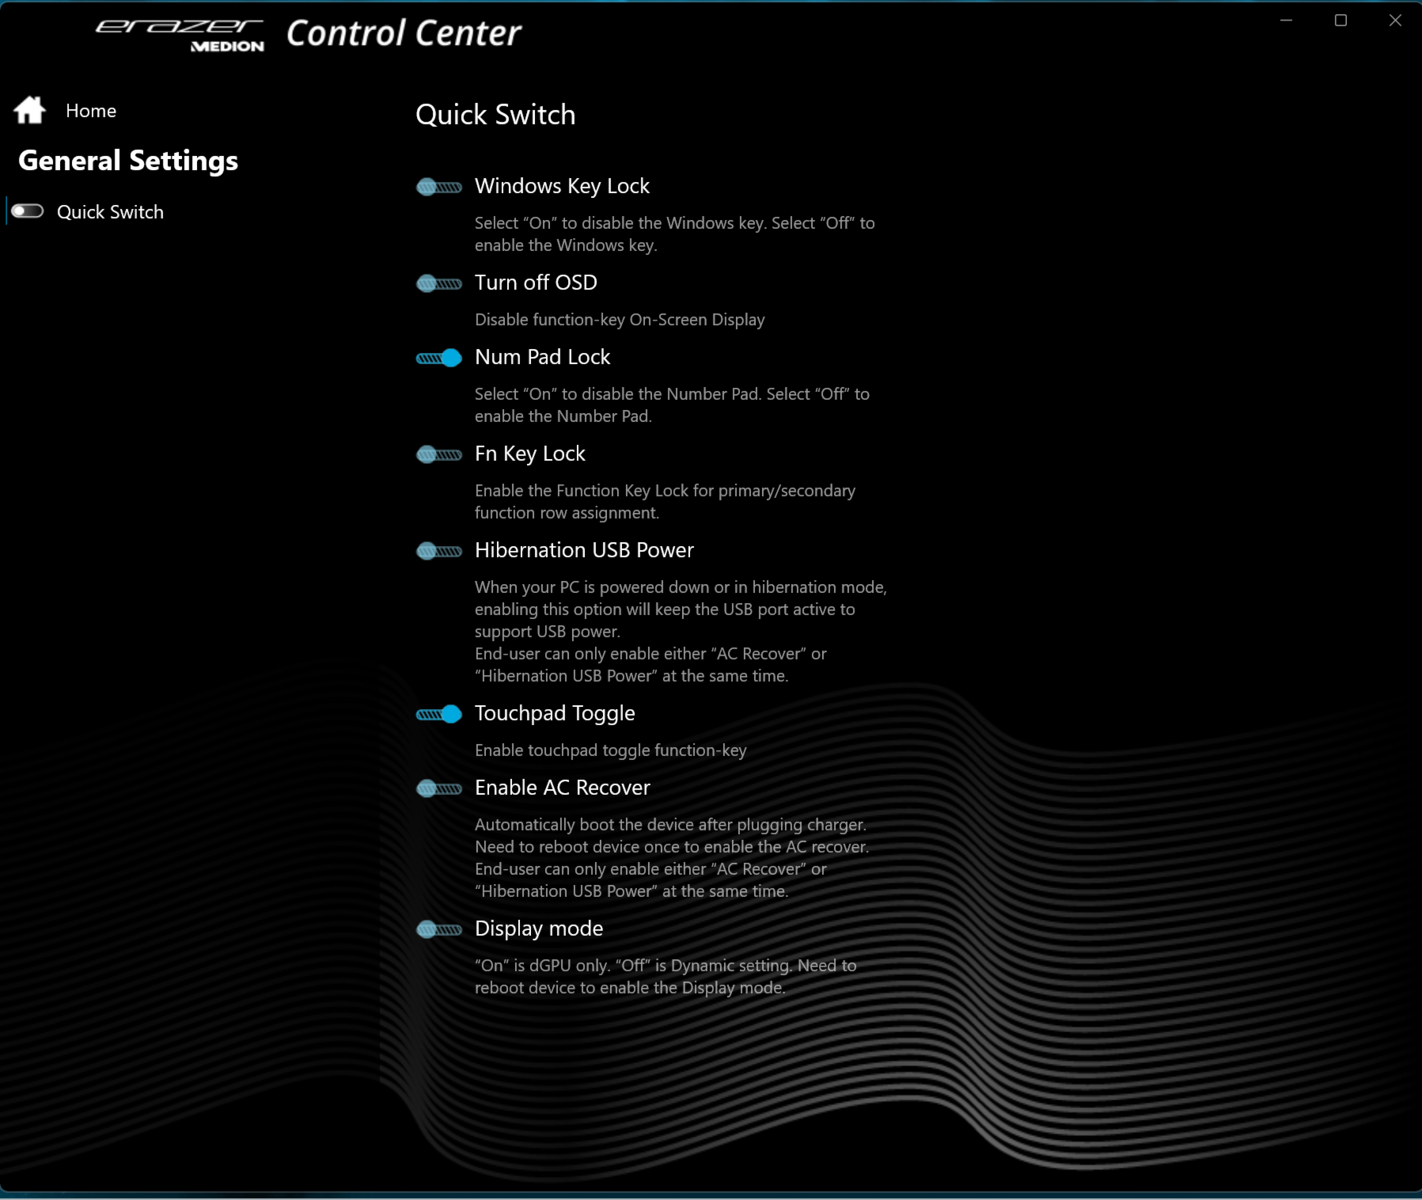
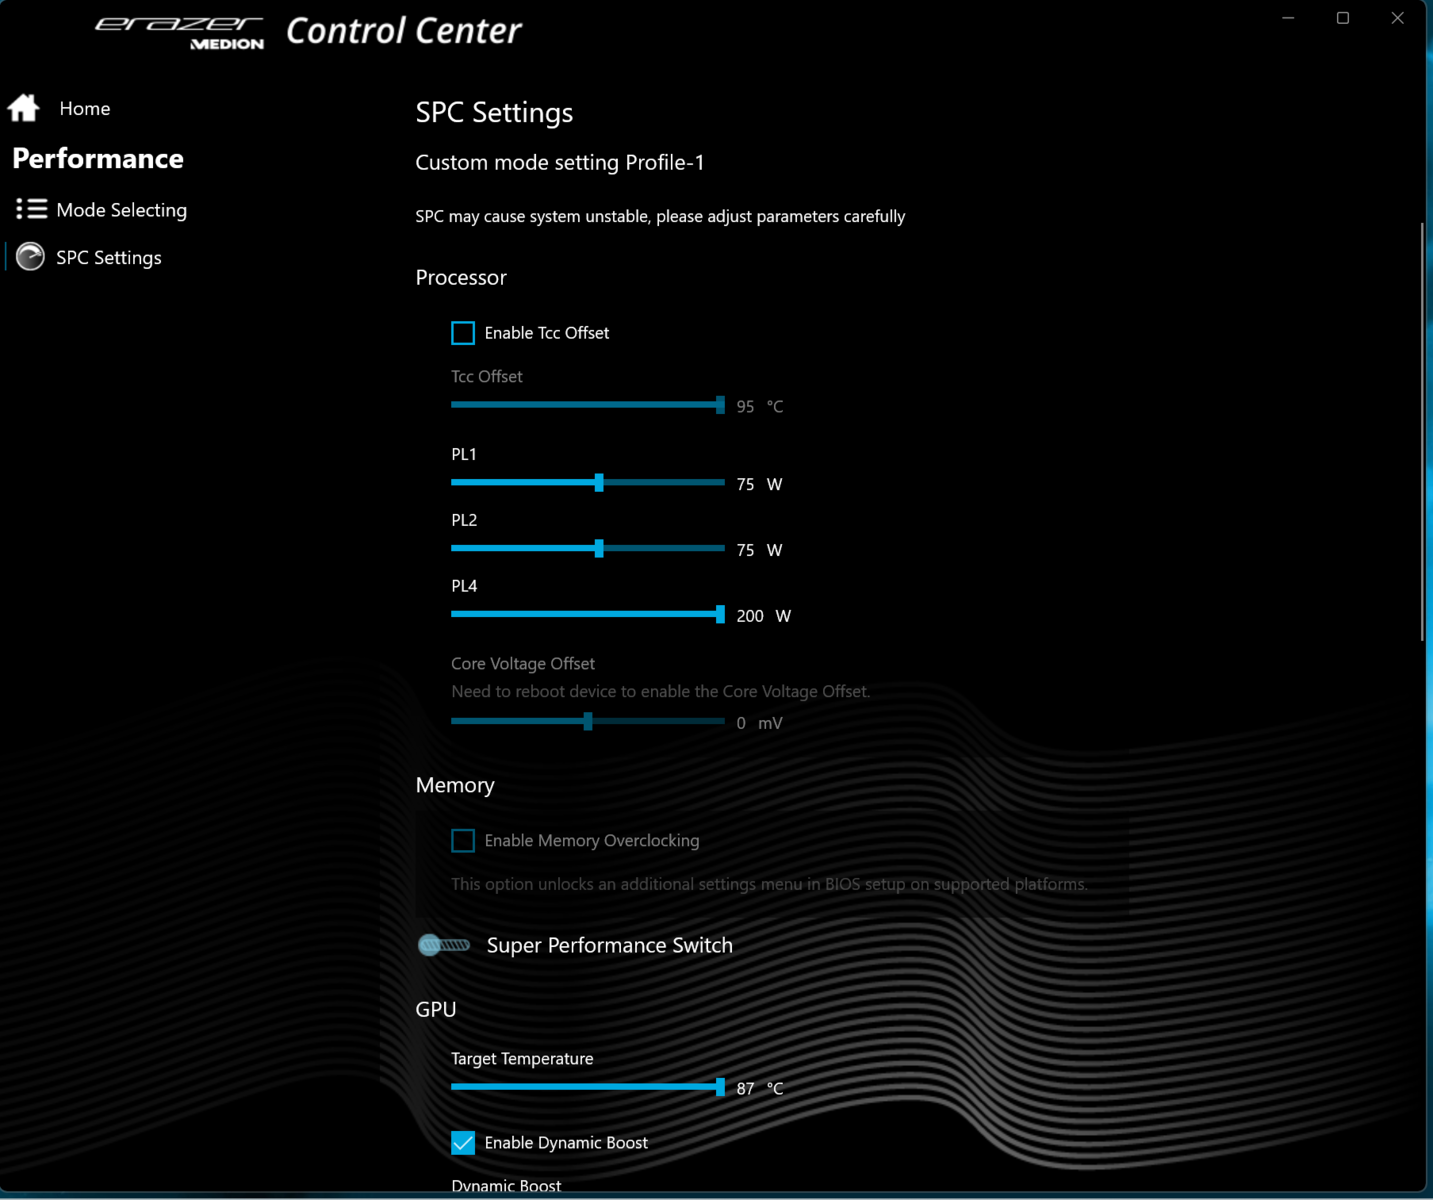
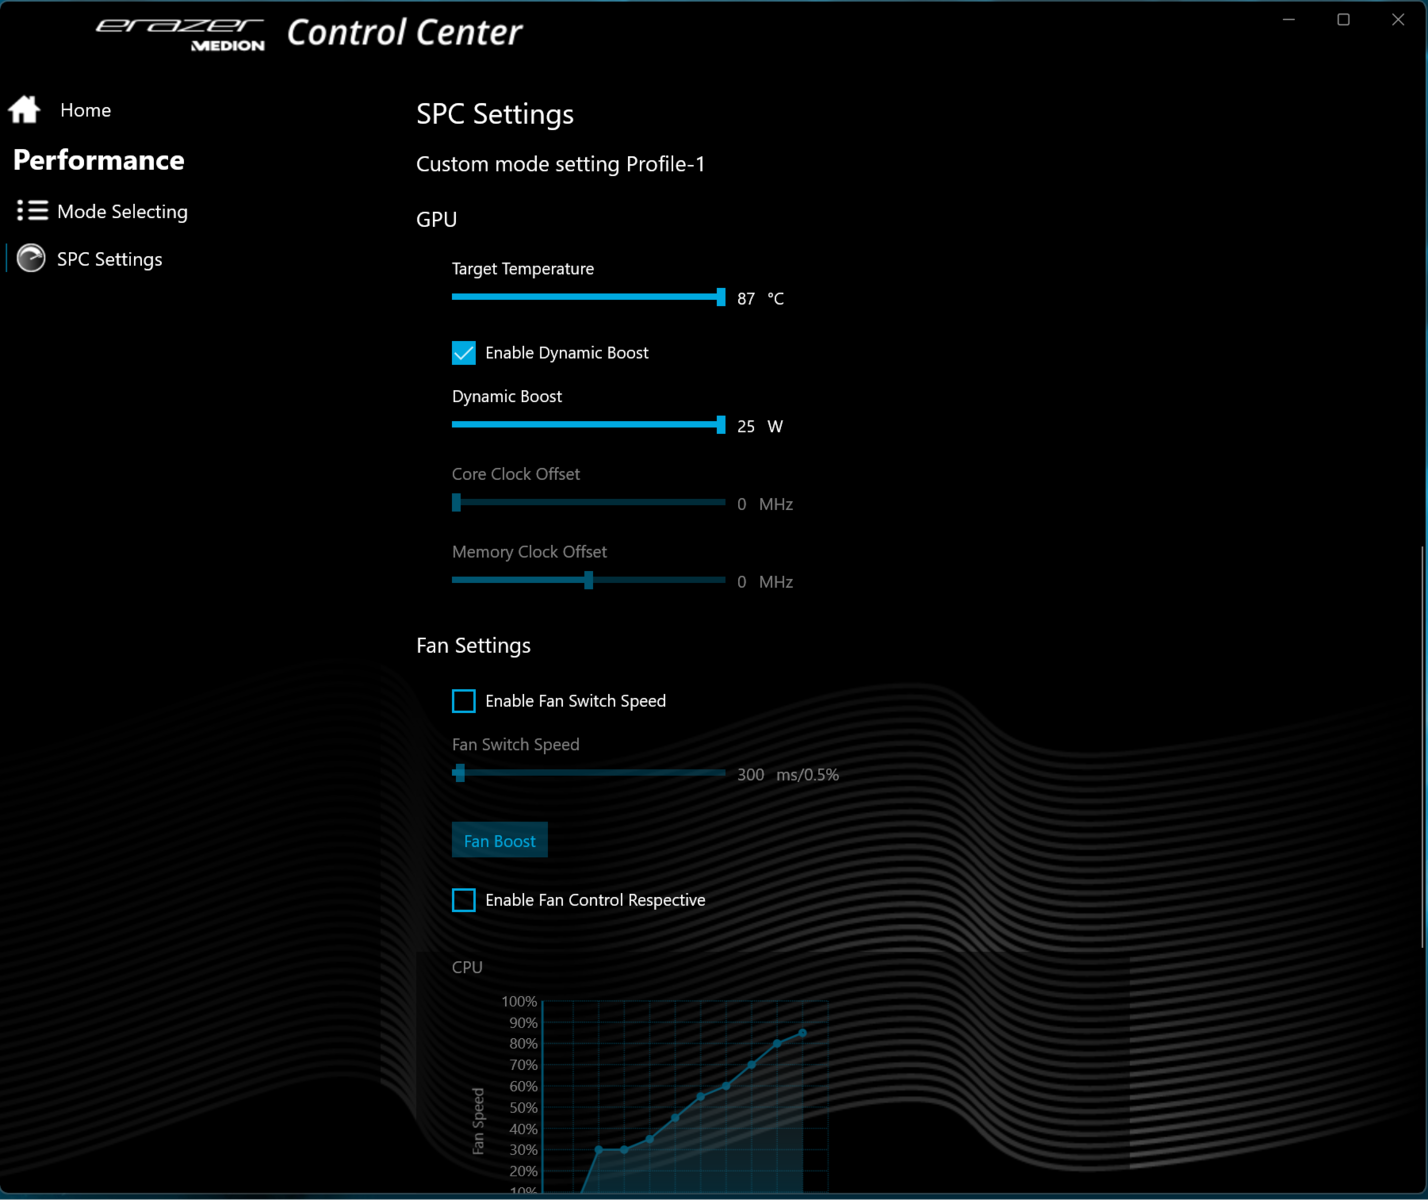
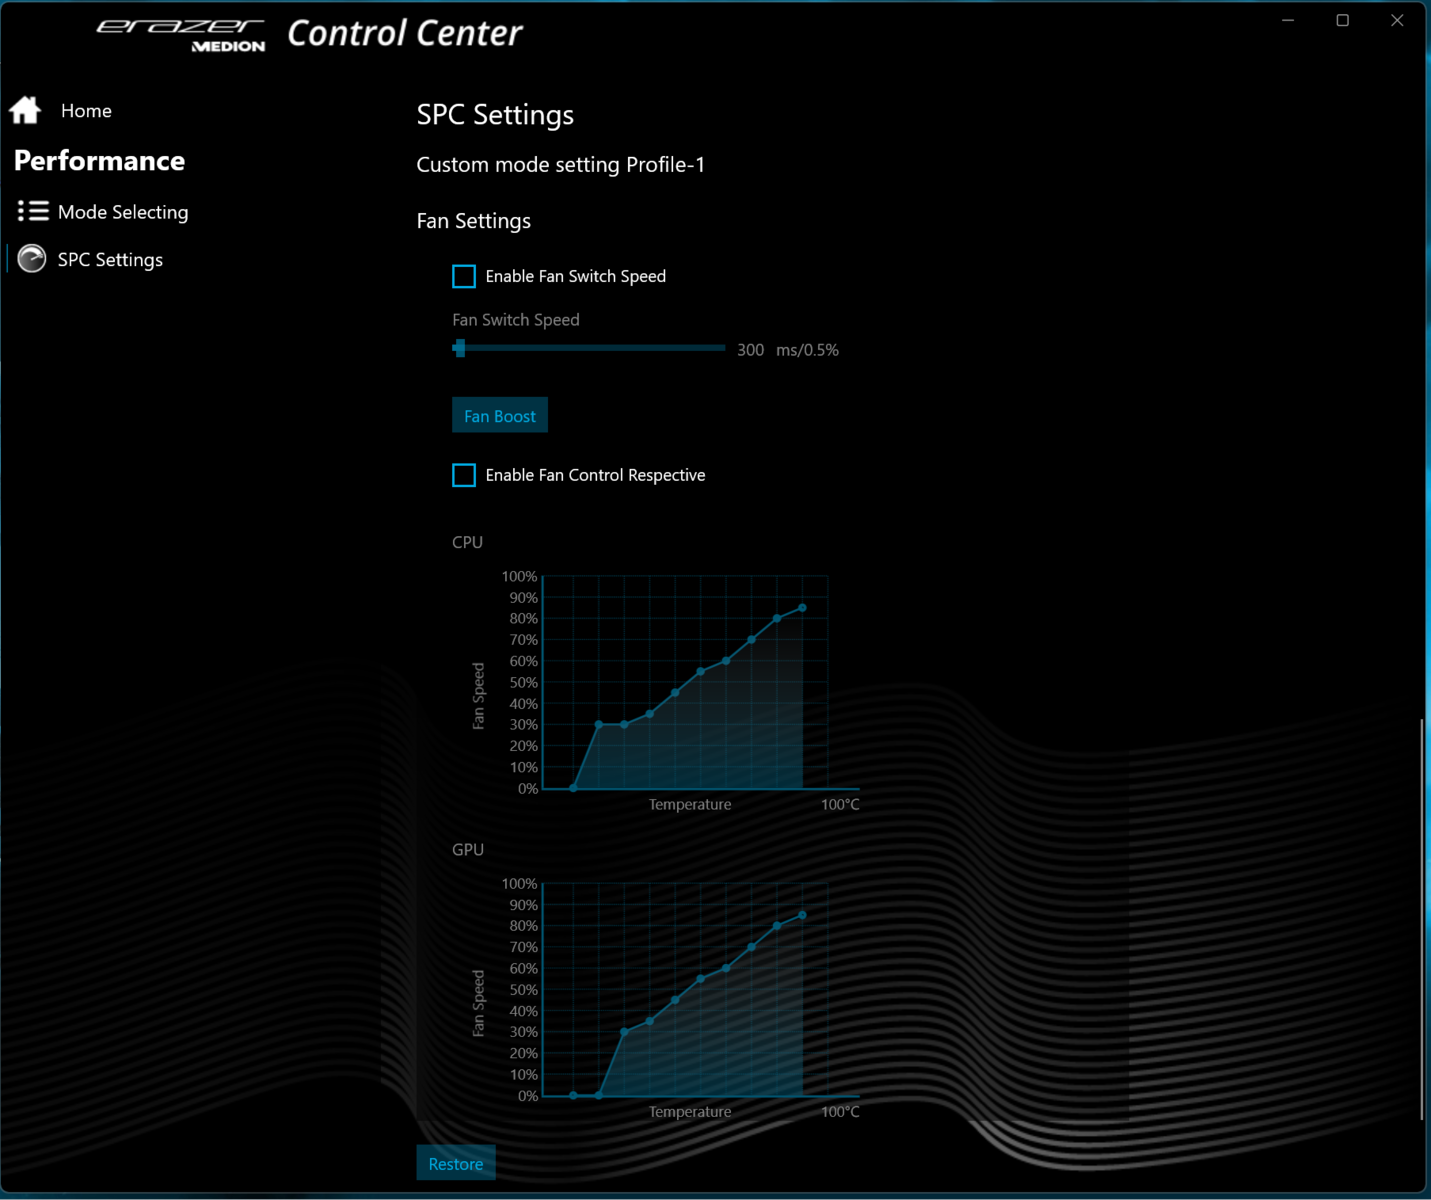
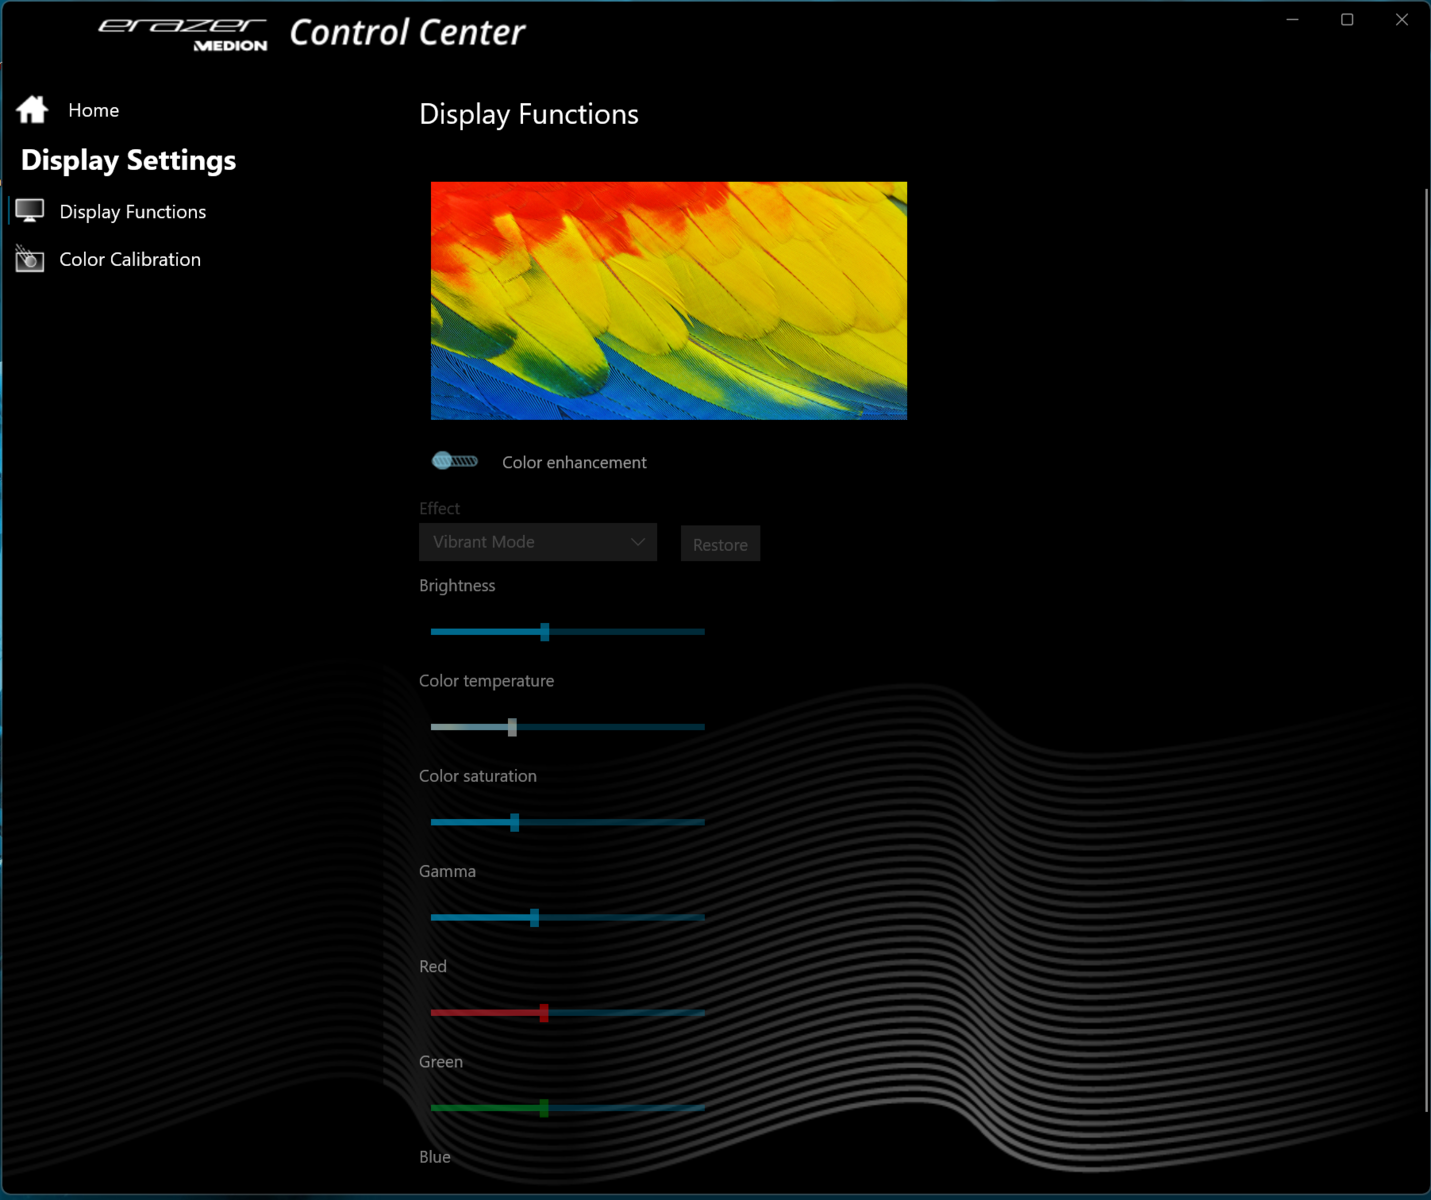
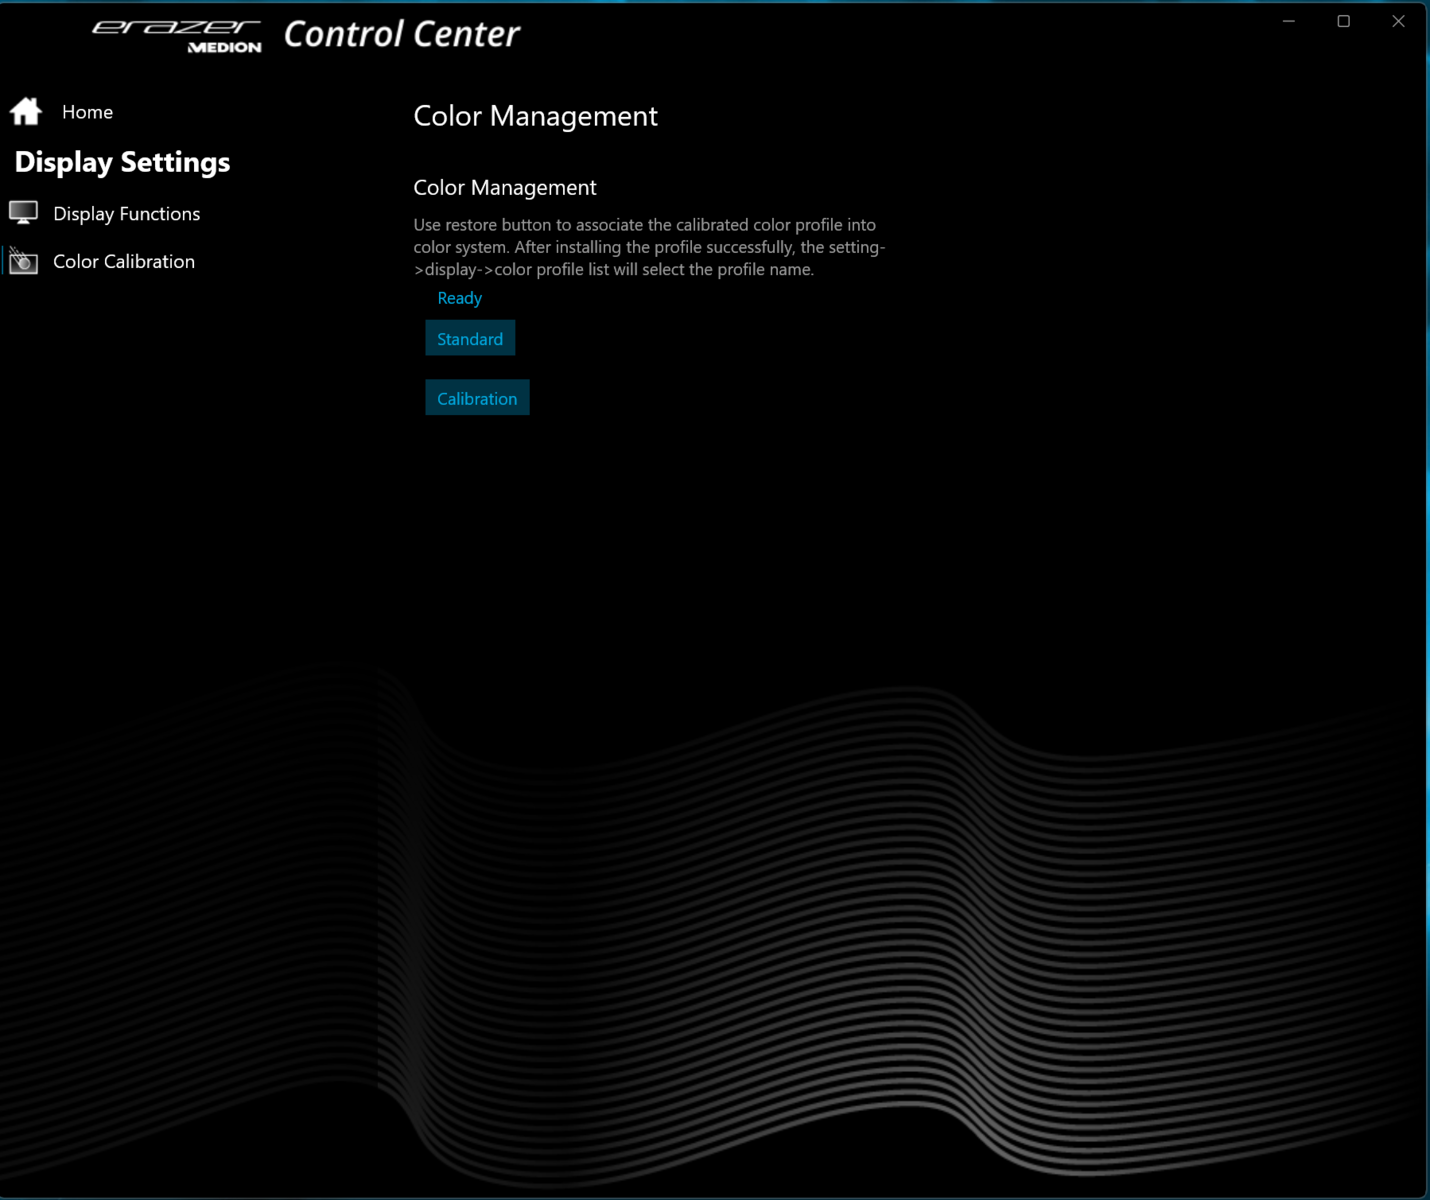
Se pueden crear perfiles individuales con el software Control Center preinstalado. Por ejemplo, se pueden ajustar los límites de potencia de la CPU, el TGP de la GPU y/o los límites superiores de temperatura.
Usamos la interfaz en inglés del software CC porque la traducción al alemán fue parcialmente infructuosa. Puedes cambiar entre los dos idiomas.
| Modo Turbo (dt: Overboost) | Modo Balance (dt: Balanceado) | Modo Office (dt: Balanceado) | |
|---|---|---|---|
| CPU PL1(HWInfo) | 140 vatios | 140 vatios | 140 vatios |
| CPU PL2 (HWInfo) | 140 vatios | 140 vatios | 140 vatios |
| Ruido (Witcher 3 ) | 50-53 dB(A) | 48-51 dB(A) | 36-43 dB(A), más tarde 32-34 dB(A) |
| Rendimiento (Witcher 3 ) | 124 fps | 118 fps | 114-118 fps, más tarde 30 fps lock |
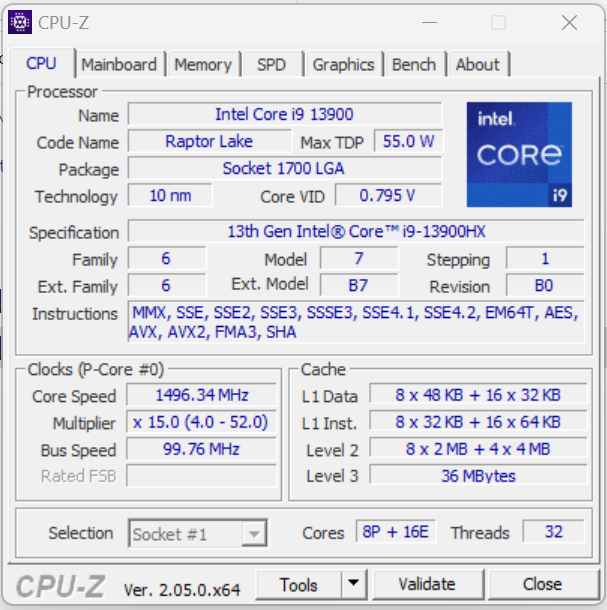
Procesador
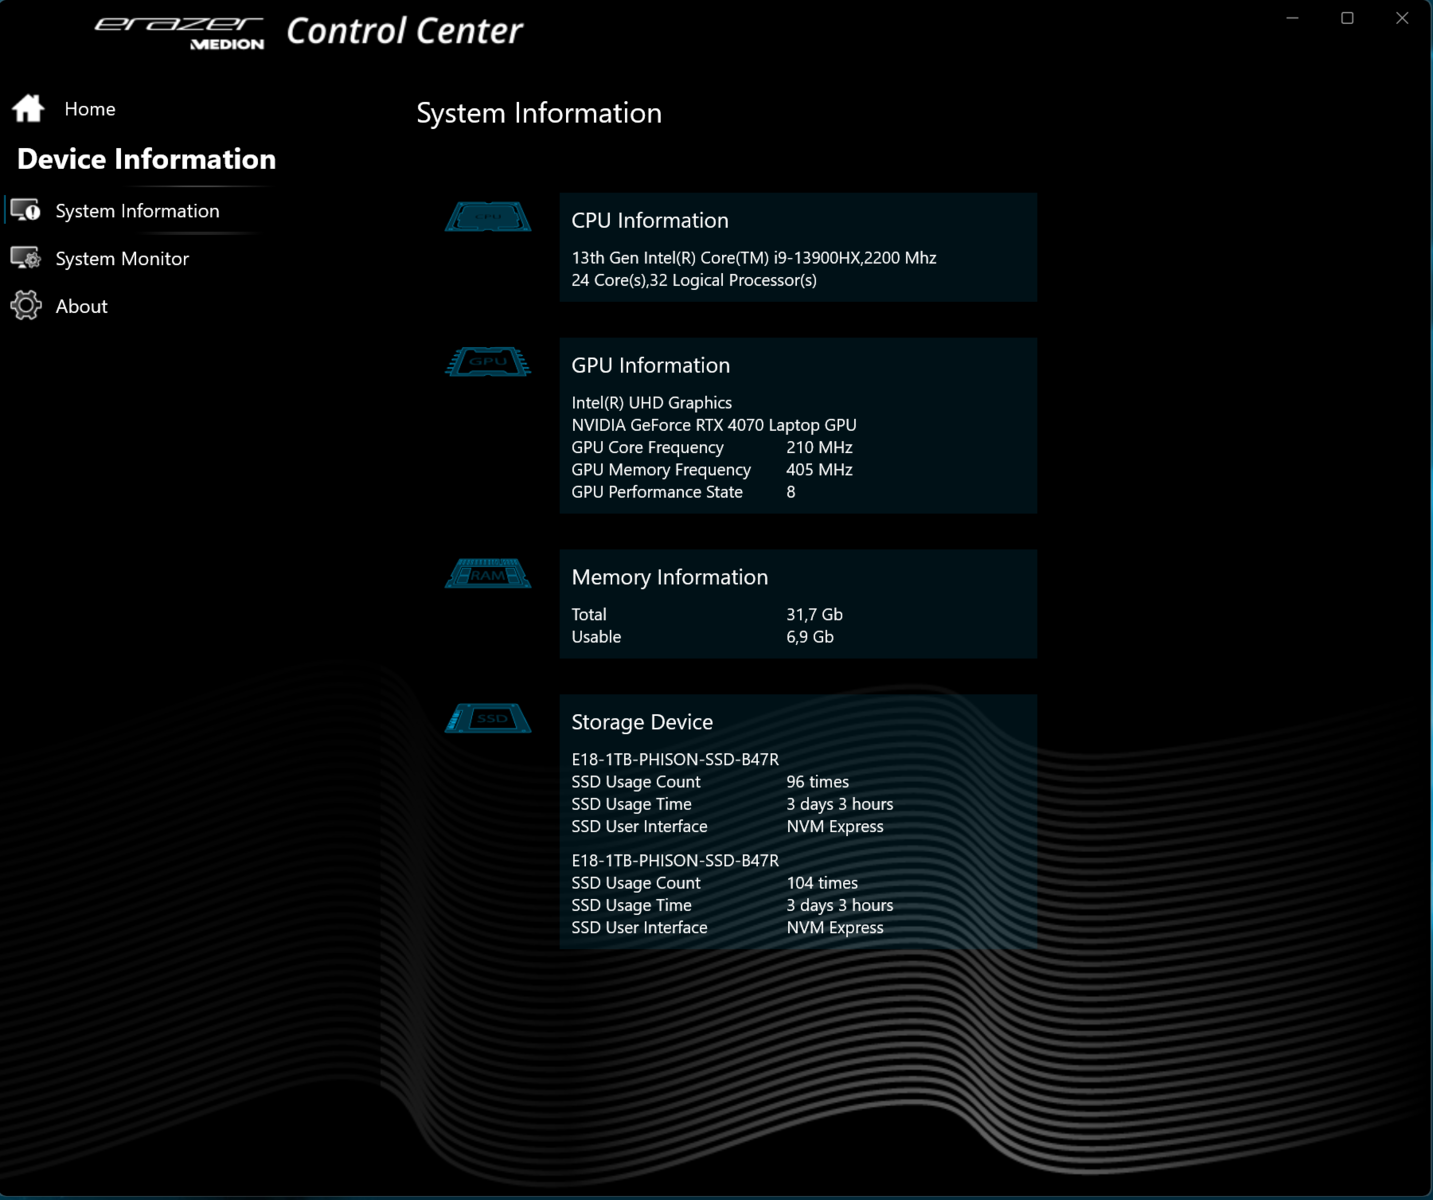
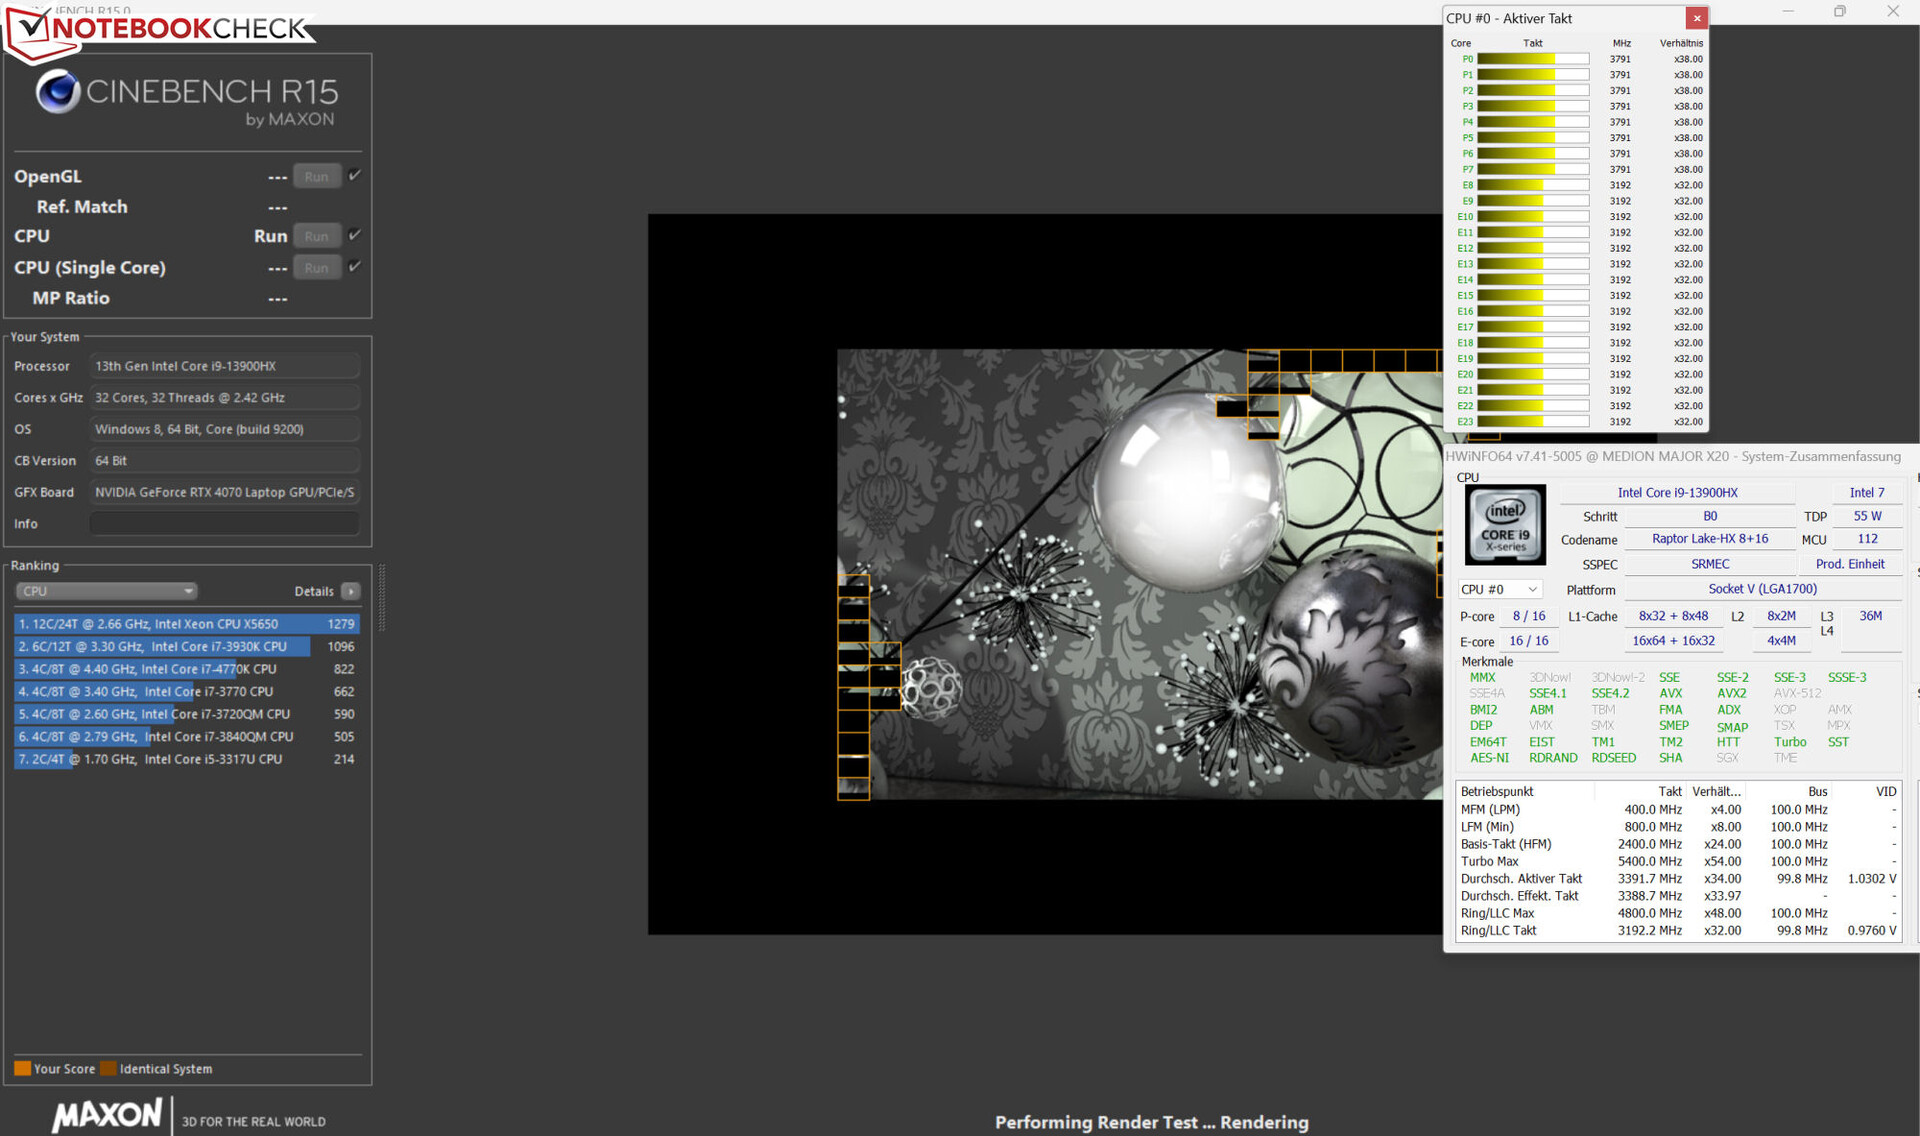
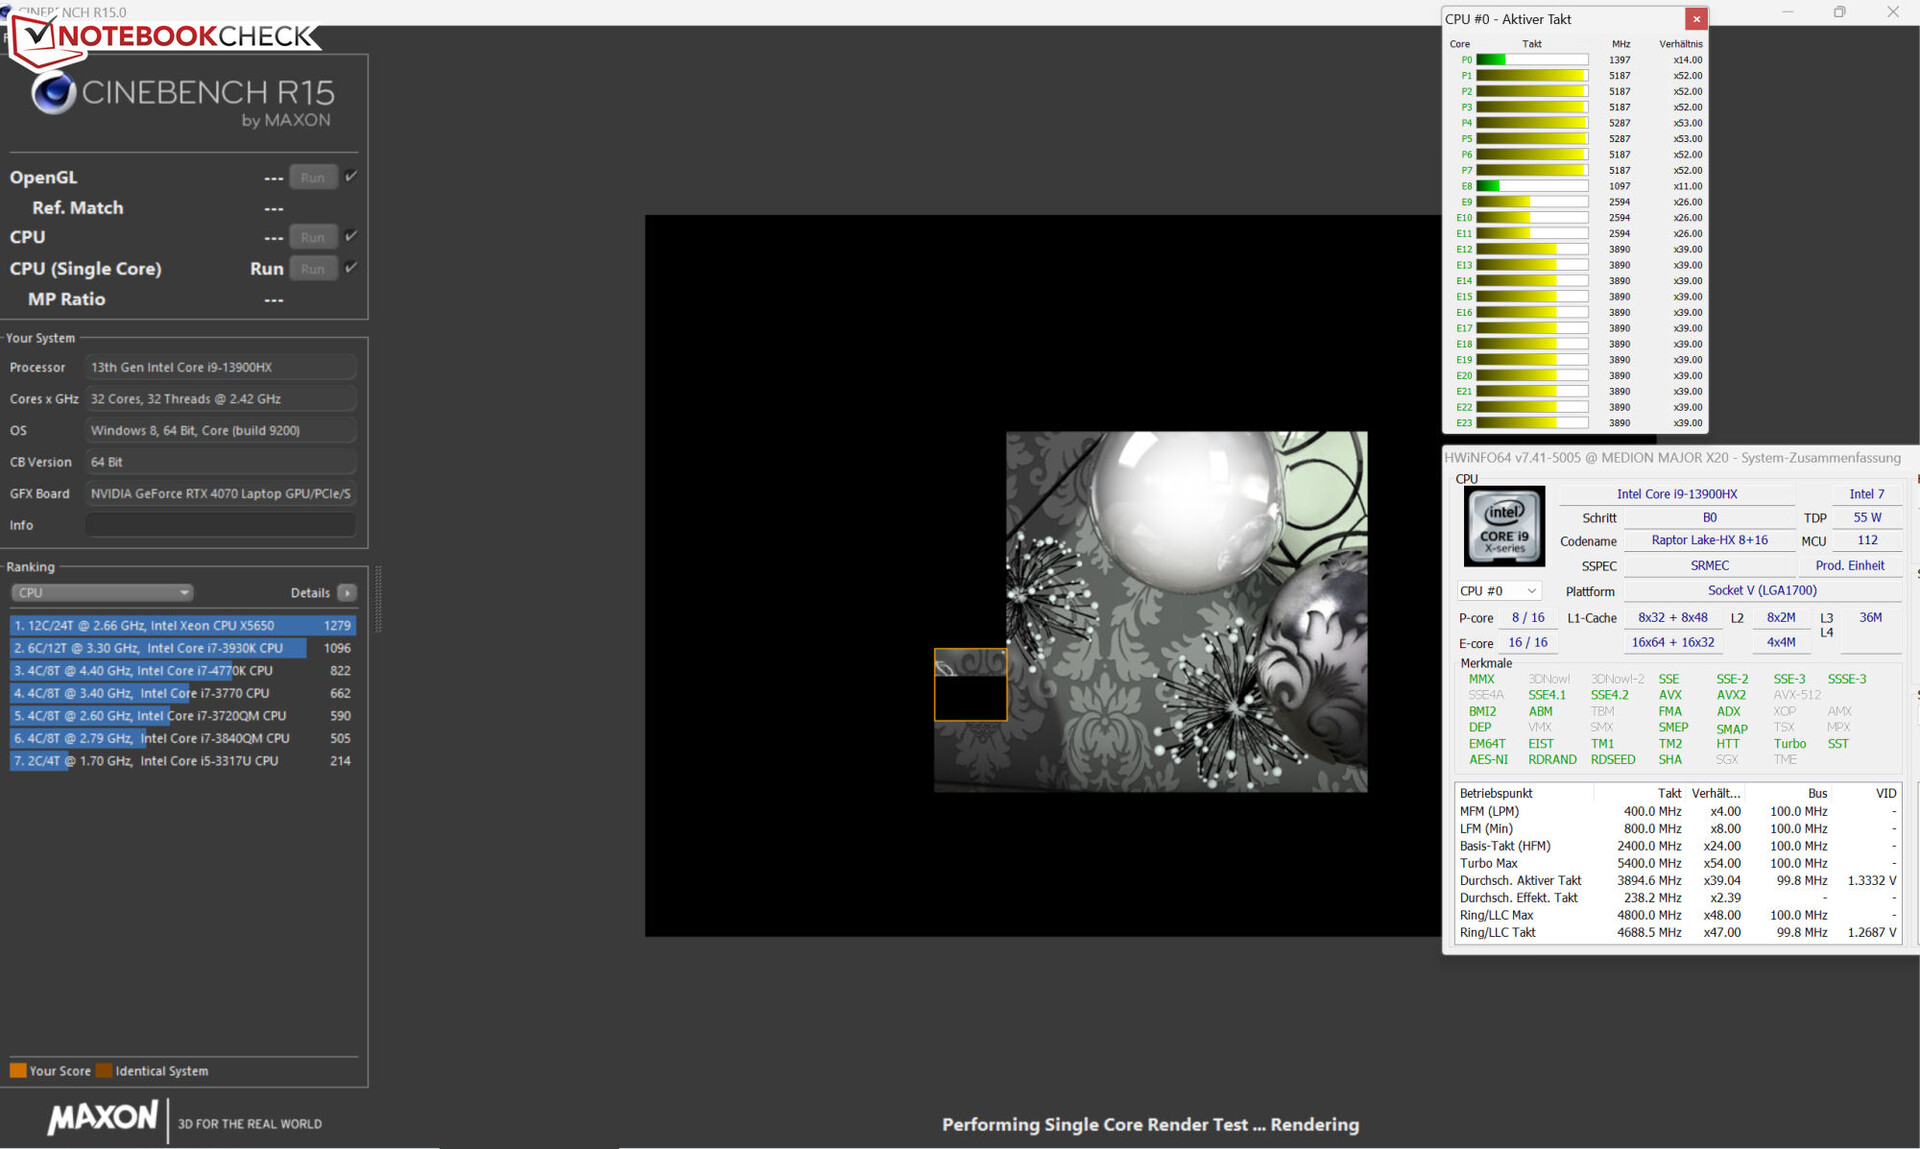
El Core-i9-13900HX (Raptor Lake) consta de ocho núcleos de rendimiento (hyperthreading, de 2,2 a 5,4 GHz) y dieciséis núcleos de eficiencia (sin hyperthreading, de 1,6 a 3,9 GHz). En total, hay 32 núcleos lógicos de CPU. Los resultados del benchmark están a la par con los índices medios de la CPU.
Las pruebas de CPU del benchmark Cinebench R15 se ejecutaron a frecuencias de reloj de altas a máximas en funcionamiento de red. El rendimiento monohilo (222 puntos), que es relevante para el uso diario, cae significativamente menos en modo batería que el rendimiento multihilo (1025 puntos).
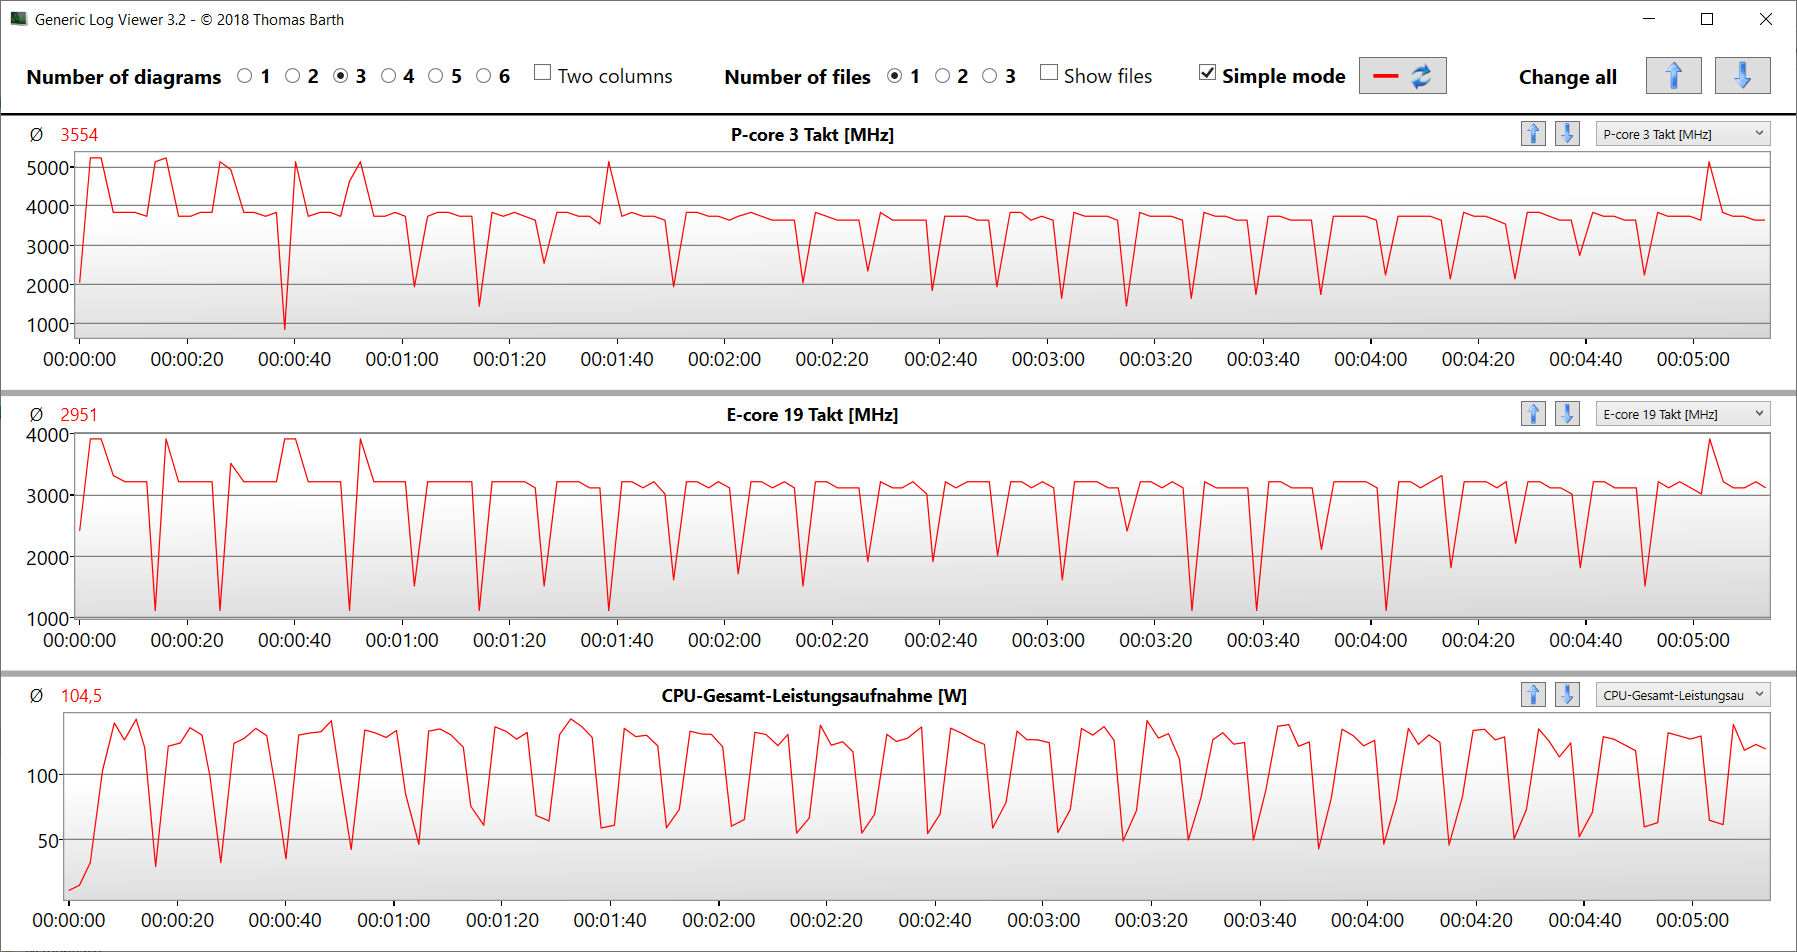
La prueba en bucle CB15 revela que se mantiene un reloj turbo alto bajo carga multihilo en funcionamiento con red eléctrica. La velocidad de reloj sólo desciende mínimamente a lo largo de la prueba.
Cinebench R15 Multi Sustained Load
| CPU Performance rating - Percent | |
| Asus ROG Strix G17 G713PI | |
| Medio Intel Core i9-13900HX | |
| Medion Erazer Major X20 | |
| Media de la clase Gaming | |
| Aorus 15X ASF | |
| Razer Blade 15 OLED (Early 2022) | |
* ... más pequeño es mejor
AIDA64: FP32 Ray-Trace | FPU Julia | CPU SHA3 | CPU Queen | FPU SinJulia | FPU Mandel | CPU AES | CPU ZLib | FP64 Ray-Trace | CPU PhotoWorxx
| Performance rating | |
| Asus ROG Strix G17 G713PI | |
| Media de la clase Gaming | |
| Medio Intel Core i9-13900HX | |
| Medion Erazer Major X20 | |
| Aorus 15X ASF | |
| Razer Blade 15 OLED (Early 2022) | |
| AIDA64 / FP32 Ray-Trace | |
| Asus ROG Strix G17 G713PI | |
| Media de la clase Gaming (10227 - 85542, n=105, últimos 2 años) | |
| Medion Erazer Major X20 | |
| Medio Intel Core i9-13900HX (17589 - 27615, n=22) | |
| Aorus 15X ASF | |
| Razer Blade 15 OLED (Early 2022) | |
| AIDA64 / FPU Julia | |
| Asus ROG Strix G17 G713PI | |
| Media de la clase Gaming (51376 - 238426, n=105, últimos 2 años) | |
| Medion Erazer Major X20 | |
| Medio Intel Core i9-13900HX (88686 - 137015, n=22) | |
| Aorus 15X ASF | |
| Razer Blade 15 OLED (Early 2022) | |
| AIDA64 / CPU SHA3 | |
| Asus ROG Strix G17 G713PI | |
| Media de la clase Gaming (2180 - 10115, n=105, últimos 2 años) | |
| Medion Erazer Major X20 | |
| Medio Intel Core i9-13900HX (4362 - 7029, n=22) | |
| Aorus 15X ASF | |
| Razer Blade 15 OLED (Early 2022) | |
| AIDA64 / CPU Queen | |
| Asus ROG Strix G17 G713PI | |
| Medion Erazer Major X20 | |
| Medio Intel Core i9-13900HX (125644 - 141385, n=22) | |
| Media de la clase Gaming (49785 - 173351, n=90, últimos 2 años) | |
| Aorus 15X ASF | |
| Razer Blade 15 OLED (Early 2022) | |
| AIDA64 / FPU SinJulia | |
| Asus ROG Strix G17 G713PI | |
| Medion Erazer Major X20 | |
| Medio Intel Core i9-13900HX (12334 - 17179, n=22) | |
| Media de la clase Gaming (4424 - 33636, n=105, últimos 2 años) | |
| Aorus 15X ASF | |
| Razer Blade 15 OLED (Early 2022) | |
| AIDA64 / FPU Mandel | |
| Asus ROG Strix G17 G713PI | |
| Media de la clase Gaming (25115 - 128721, n=105, últimos 2 años) | |
| Medion Erazer Major X20 | |
| Medio Intel Core i9-13900HX (43850 - 69202, n=22) | |
| Aorus 15X ASF | |
| Razer Blade 15 OLED (Early 2022) | |
| AIDA64 / CPU AES | |
| Asus ROG Strix G17 G713PI | |
| Aorus 15X ASF | |
| Medio Intel Core i9-13900HX (89413 - 237881, n=22) | |
| Medion Erazer Major X20 | |
| Media de la clase Gaming (39258 - 247074, n=105, últimos 2 años) | |
| Razer Blade 15 OLED (Early 2022) | |
| AIDA64 / CPU ZLib | |
| Asus ROG Strix G17 G713PI | |
| Medion Erazer Major X20 | |
| Medio Intel Core i9-13900HX (1284 - 1958, n=22) | |
| Media de la clase Gaming (574 - 2531, n=105, últimos 2 años) | |
| Aorus 15X ASF | |
| Razer Blade 15 OLED (Early 2022) | |
| AIDA64 / FP64 Ray-Trace | |
| Asus ROG Strix G17 G713PI | |
| Media de la clase Gaming (5509 - 45446, n=105, últimos 2 años) | |
| Medion Erazer Major X20 | |
| Medio Intel Core i9-13900HX (9481 - 15279, n=22) | |
| Aorus 15X ASF | |
| Razer Blade 15 OLED (Early 2022) | |
| AIDA64 / CPU PhotoWorxx | |
| Medio Intel Core i9-13900HX (42994 - 51994, n=22) | |
| Media de la clase Gaming (12271 - 89891, n=105, últimos 2 años) | |
| Medion Erazer Major X20 | |
| Aorus 15X ASF | |
| Razer Blade 15 OLED (Early 2022) | |
| Razer Blade 15 OLED (Early 2022) | |
| Asus ROG Strix G17 G713PI | |
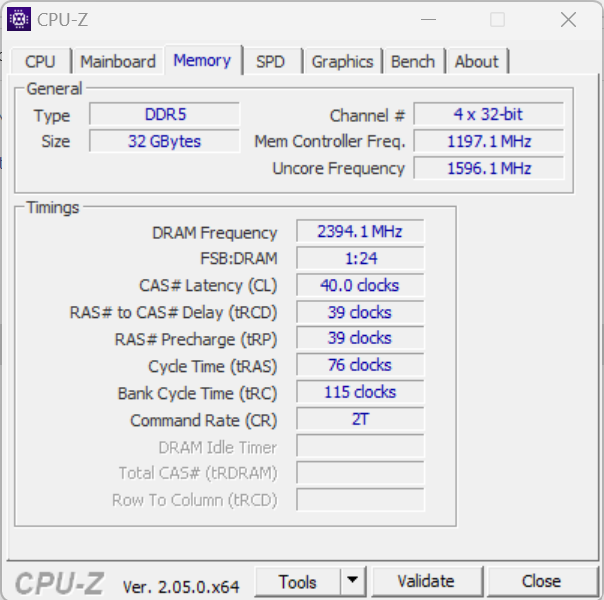
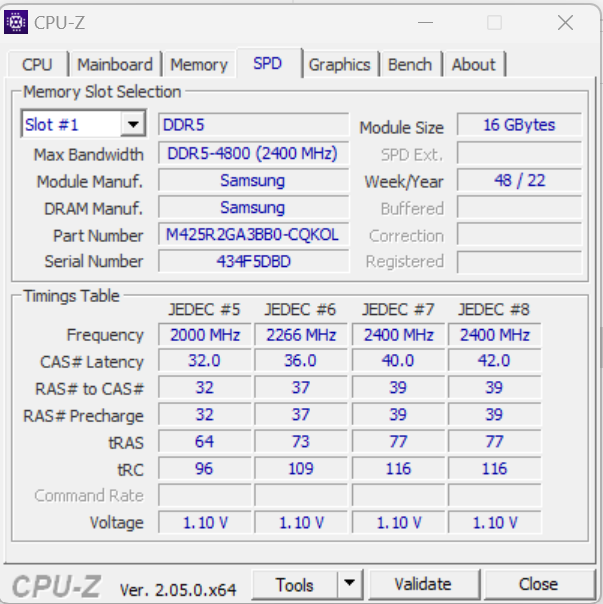
Rendimiento del sistema
Al sistema de funcionamiento fluido no le falta potencia de cálculo. El portátil maneja juegos, renderizado y edición de vídeo sin problemas, como confirman los buenos resultados PCMark. Las tasas de transferencia de la RAM están a un nivel normal para una memoria DDR5-4800.
CrossMark: Overall | Productivity | Creativity | Responsiveness
| PCMark 10 / Score | |
| Media de la clase Gaming (5828 - 12414, n=93, últimos 2 años) | |
| Medion Erazer Major X20 | |
| Medio Intel Core i9-13900HX, NVIDIA GeForce RTX 4070 Laptop GPU (6956 - 8153, n=3) | |
| Asus ROG Strix G17 G713PI | |
| Razer Blade 15 OLED (Early 2022) | |
| Aorus 15X ASF | |
| PCMark 10 / Essentials | |
| Medion Erazer Major X20 | |
| Asus ROG Strix G17 G713PI | |
| Medio Intel Core i9-13900HX, NVIDIA GeForce RTX 4070 Laptop GPU (9865 - 11653, n=3) | |
| Aorus 15X ASF | |
| Media de la clase Gaming (8810 - 11935, n=97, últimos 2 años) | |
| Razer Blade 15 OLED (Early 2022) | |
| PCMark 10 / Productivity | |
| Media de la clase Gaming (6845 - 25323, n=95, últimos 2 años) | |
| Asus ROG Strix G17 G713PI | |
| Razer Blade 15 OLED (Early 2022) | |
| Medion Erazer Major X20 | |
| Medio Intel Core i9-13900HX, NVIDIA GeForce RTX 4070 Laptop GPU (9470 - 9850, n=3) | |
| Aorus 15X ASF | |
| PCMark 10 / Digital Content Creation | |
| Media de la clase Gaming (7602 - 19954, n=95, últimos 2 años) | |
| Medio Intel Core i9-13900HX, NVIDIA GeForce RTX 4070 Laptop GPU (9776 - 13370, n=3) | |
| Razer Blade 15 OLED (Early 2022) | |
| Medion Erazer Major X20 | |
| Aorus 15X ASF | |
| Asus ROG Strix G17 G713PI | |
| CrossMark / Overall | |
| Aorus 15X ASF | |
| Asus ROG Strix G17 G713PI | |
| Media de la clase Gaming (1366 - 2409, n=94, últimos 2 años) | |
| Medio Intel Core i9-13900HX, NVIDIA GeForce RTX 4070 Laptop GPU (1842 - 2029, n=3) | |
| Medion Erazer Major X20 | |
| Razer Blade 15 OLED (Early 2022) | |
| CrossMark / Productivity | |
| Aorus 15X ASF | |
| Asus ROG Strix G17 G713PI | |
| Media de la clase Gaming (1386 - 2254, n=94, últimos 2 años) | |
| Medio Intel Core i9-13900HX, NVIDIA GeForce RTX 4070 Laptop GPU (1700 - 1872, n=3) | |
| Medion Erazer Major X20 | |
| Razer Blade 15 OLED (Early 2022) | |
| CrossMark / Creativity | |
| Asus ROG Strix G17 G713PI | |
| Media de la clase Gaming (1343 - 2786, n=94, últimos 2 años) | |
| Medio Intel Core i9-13900HX, NVIDIA GeForce RTX 4070 Laptop GPU (2088 - 2316, n=3) | |
| Aorus 15X ASF | |
| Medion Erazer Major X20 | |
| Razer Blade 15 OLED (Early 2022) | |
| CrossMark / Responsiveness | |
| Aorus 15X ASF | |
| Media de la clase Gaming (1226 - 2334, n=94, últimos 2 años) | |
| Asus ROG Strix G17 G713PI | |
| Medio Intel Core i9-13900HX, NVIDIA GeForce RTX 4070 Laptop GPU (1557 - 1752, n=3) | |
| Medion Erazer Major X20 | |
| Razer Blade 15 OLED (Early 2022) | |
| PCMark 8 Home Score Accelerated v2 | 4889 puntos | |
| PCMark 8 Work Score Accelerated v2 | 6067 puntos | |
| PCMark 10 Score | 7575 puntos | |
ayuda | ||
| AIDA64 / Memory Copy | |
| Medio Intel Core i9-13900HX (67716 - 79193, n=22) | |
| Media de la clase Gaming (21750 - 129946, n=105, últimos 2 años) | |
| Medion Erazer Major X20 | |
| Aorus 15X ASF | |
| Razer Blade 15 OLED (Early 2022) | |
| Asus ROG Strix G17 G713PI | |
| AIDA64 / Memory Read | |
| Medio Intel Core i9-13900HX (73998 - 88462, n=22) | |
| Media de la clase Gaming (22956 - 118858, n=105, últimos 2 años) | |
| Medion Erazer Major X20 | |
| Aorus 15X ASF | |
| Razer Blade 15 OLED (Early 2022) | |
| Asus ROG Strix G17 G713PI | |
| AIDA64 / Memory Write | |
| Media de la clase Gaming (22297 - 135096, n=105, últimos 2 años) | |
| Medio Intel Core i9-13900HX (65472 - 77045, n=22) | |
| Medion Erazer Major X20 | |
| Asus ROG Strix G17 G713PI | |
| Razer Blade 15 OLED (Early 2022) | |
| Aorus 15X ASF | |
| AIDA64 / Memory Latency | |
| Media de la clase Gaming (75.3 - 259, n=105, últimos 2 años) | |
| Razer Blade 15 OLED (Early 2022) | |
| Medion Erazer Major X20 | |
| Asus ROG Strix G17 G713PI | |
| Aorus 15X ASF | |
| Medio Intel Core i9-13900HX (75.3 - 91.1, n=22) | |
* ... más pequeño es mejor
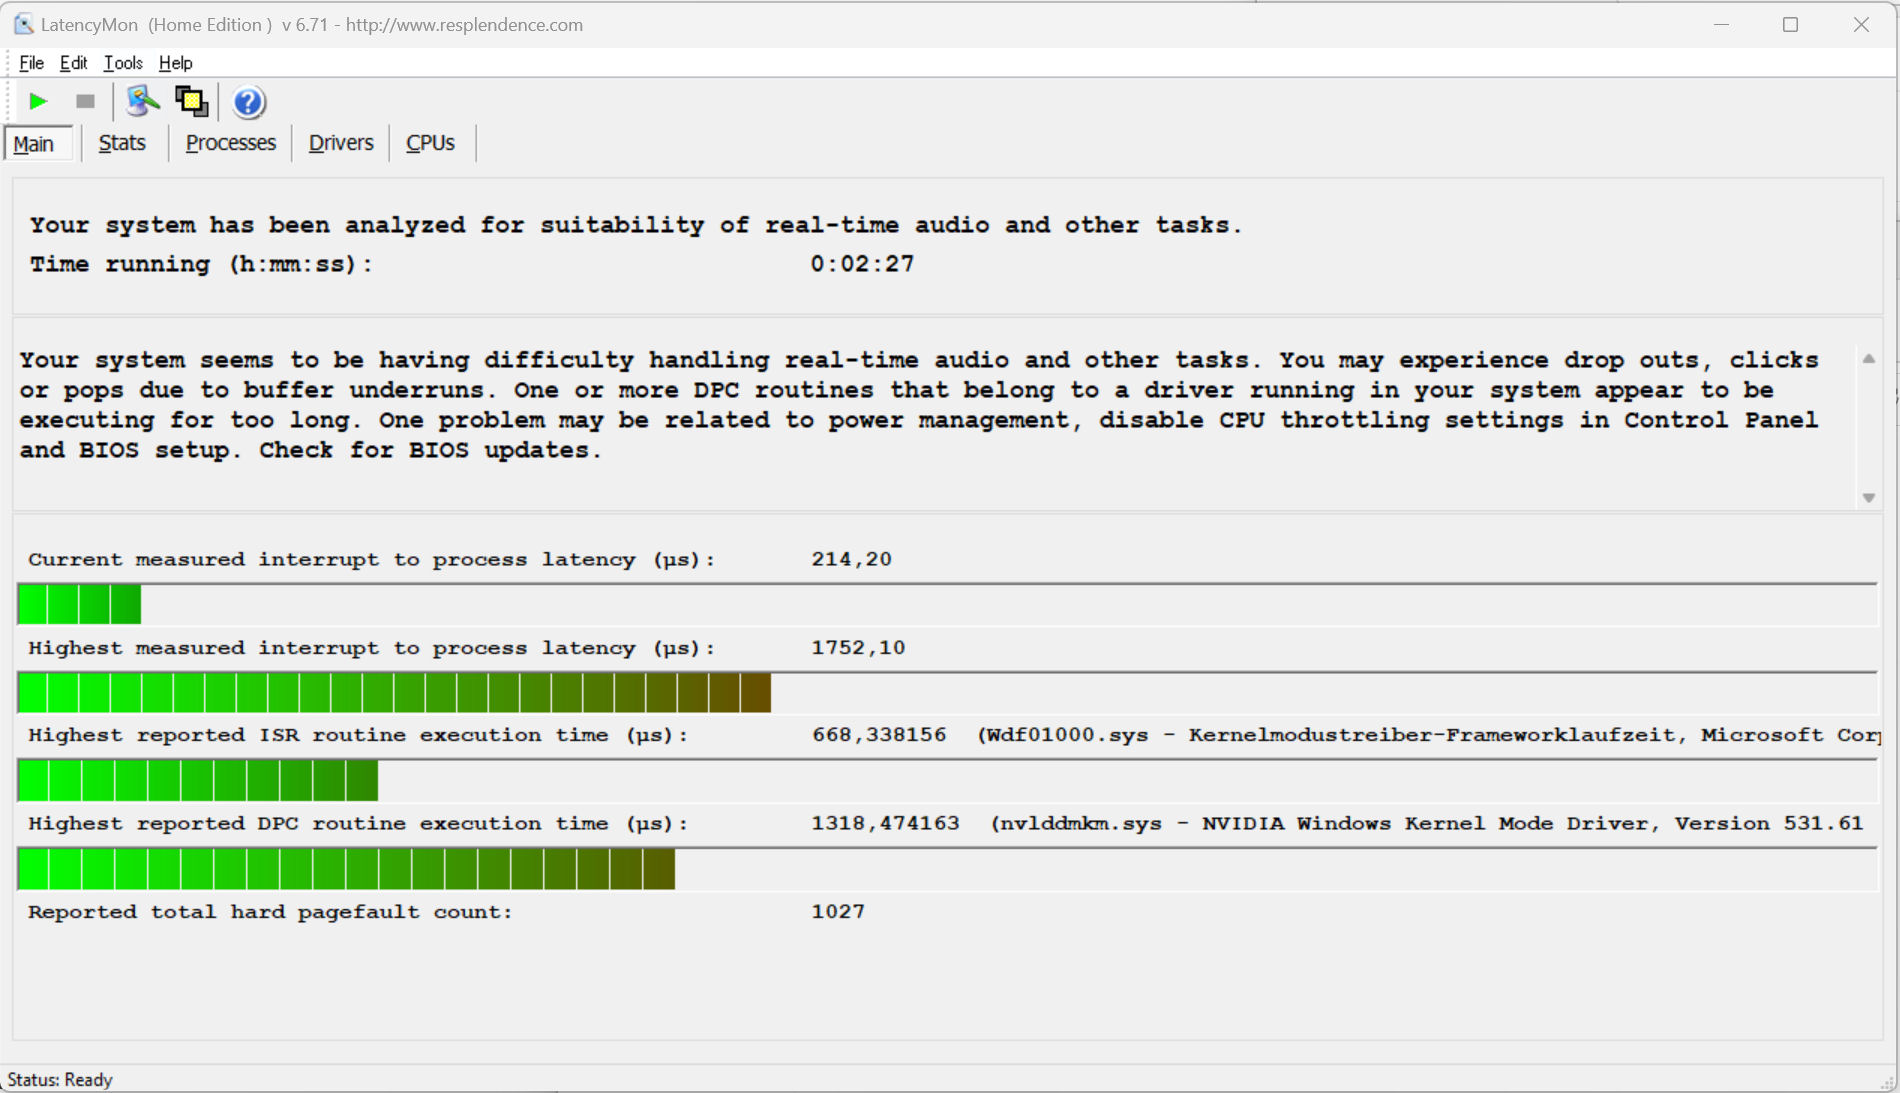
Latencia del CPD
La prueba de monitorización de latencia estandarizada (navegación web, reproducción de vídeo 4k, Prime95 de alta carga) reveló anomalías. El sistema no parece adecuado para la edición de vídeo y audio en tiempo real. Futuras actualizaciones de software podrían mejorar esta situación o provocar un mayor deterioro.
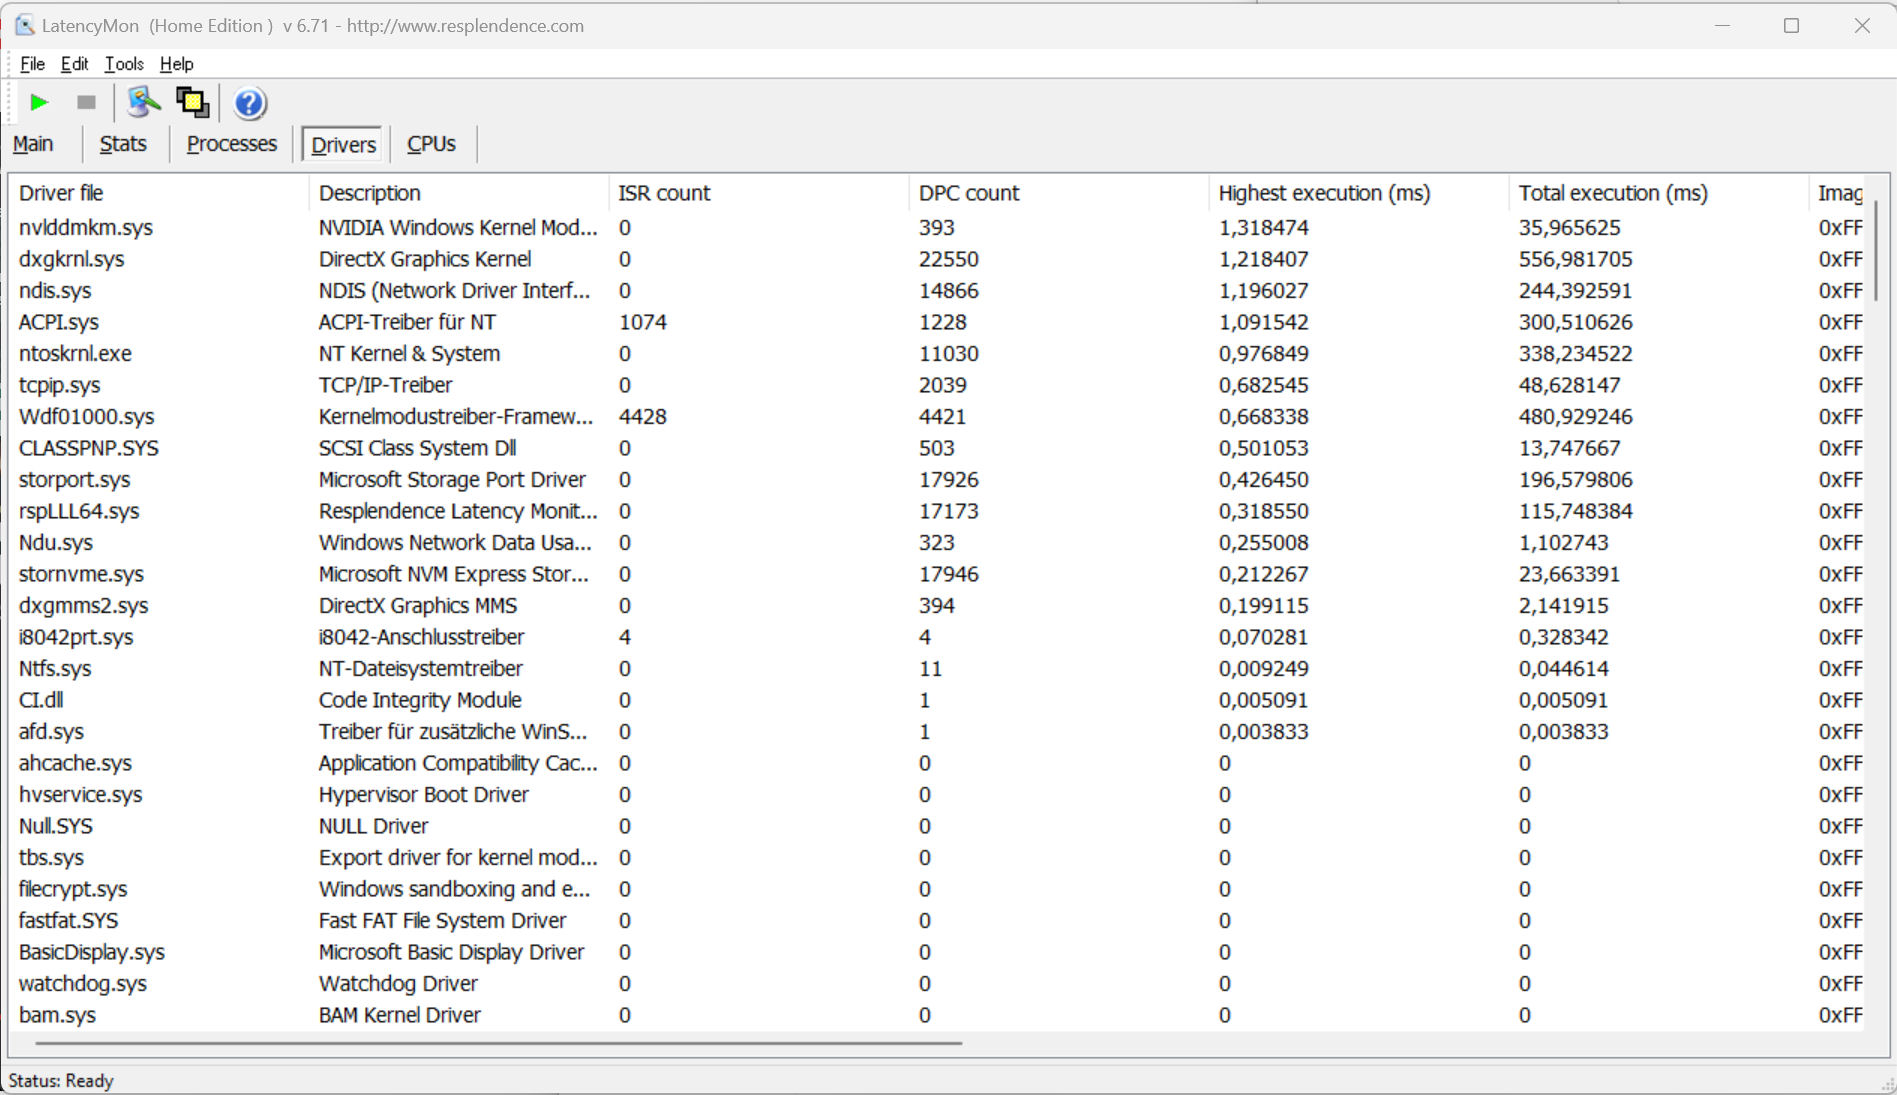
| DPC Latencies / LatencyMon - interrupt to process latency (max), Web, Youtube, Prime95 | |
| Aorus 15X ASF | |
| Medion Erazer Major X20 | |
| Asus ROG Strix G17 G713PI | |
| Razer Blade 15 OLED (Early 2022) | |
* ... más pequeño es mejor
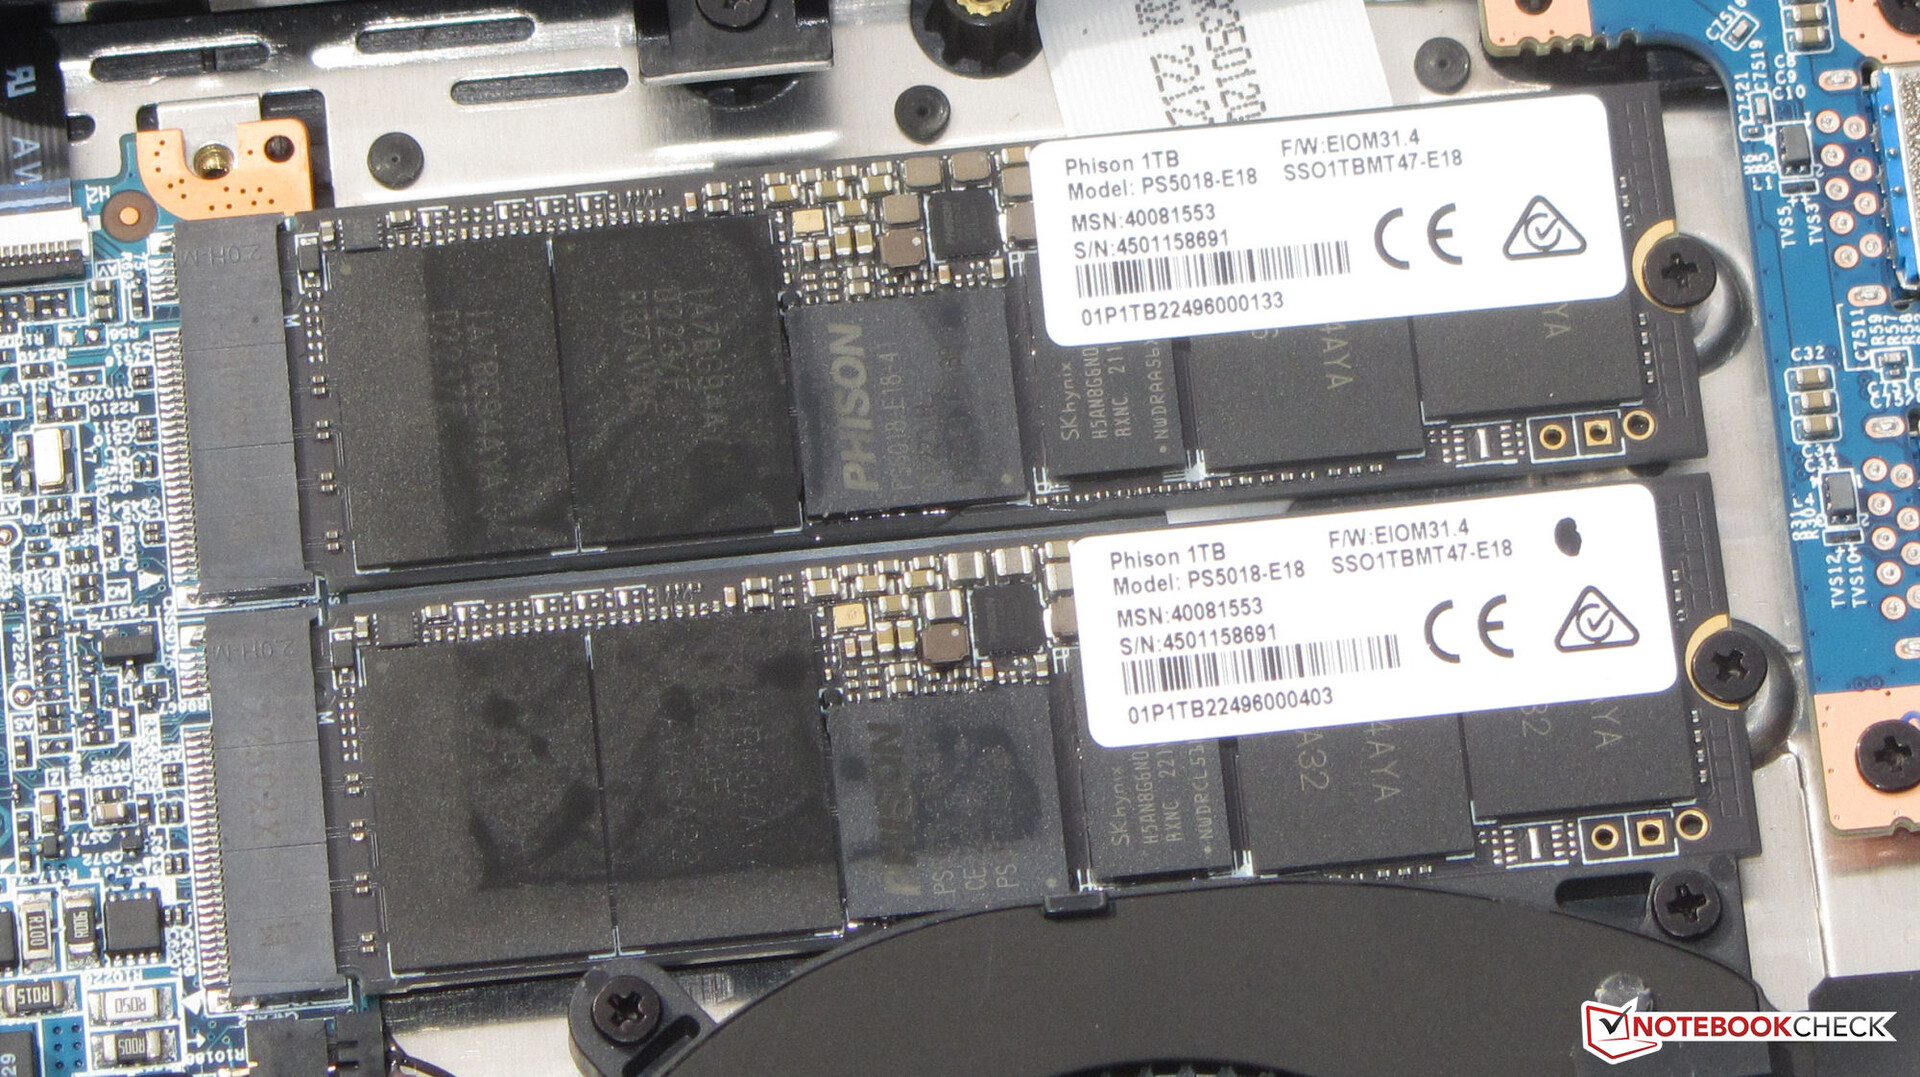
Dispositivos de almacenamiento
El Erazer alberga dos SSD de 1 TB (PCIe 4, M.2-2280) de Phison, que ofrecen buenos índices de rendimiento en general. Los SSDs no forman una matriz RAID, ni el X20 ofrece soporte RAID - un SSD sirve como unidad de sistema, el otro como almacenamiento de datos. Un aspecto positivo: no se observó estrangulamiento térmico.

| Drive Performance rating - Percent | |
| Aorus 15X ASF | |
| Medio Phison E18-1TB-PHISON-SSD-B47R | |
| Medion Erazer Major X20 | |
| Razer Blade 15 OLED (Early 2022) | |
| Media de la clase Gaming | |
| Asus ROG Strix G17 G713PI | |
* ... más pequeño es mejor
Sustained Read Performance: DiskSpd Read Loop, Queue Depth 8
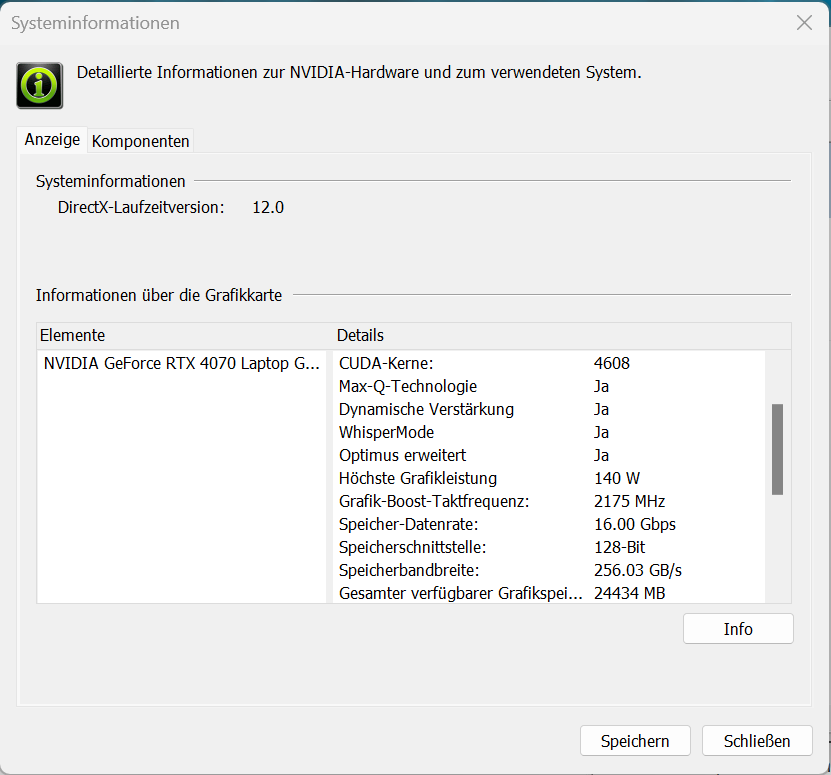
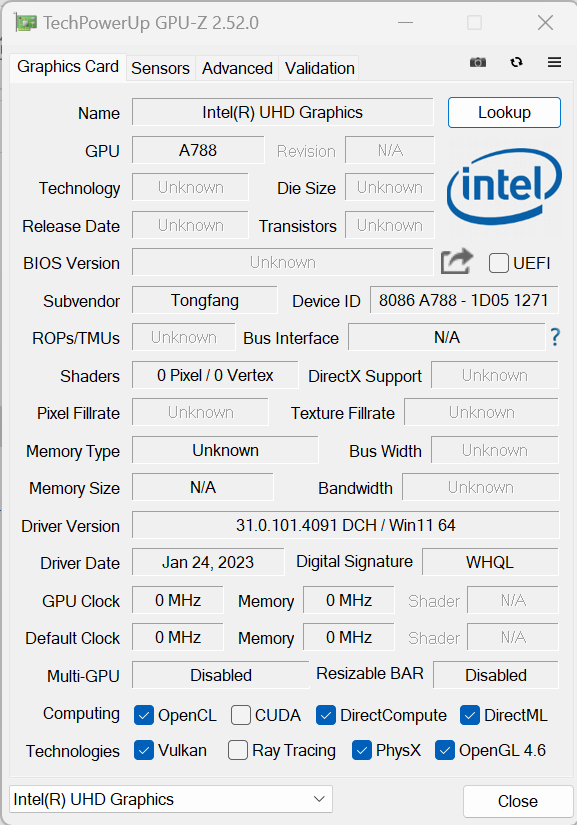
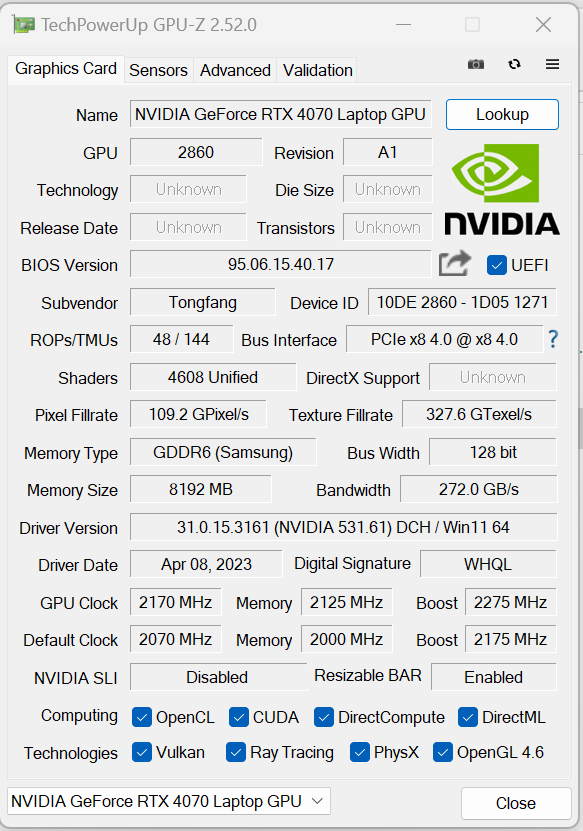
Tarjeta gráfica
Sin (más) experimentos: Mientras Medion instalaba una de las entonces nuevas GPU Arc de Intel en elMajor X10el X20 viene con una GeForce Portátil RTX 4070 (VRAM: 8,192 GB GDDR6) de Nvidia. Dispone de un TGP máximo posible de 140 vatios (115 vatios + 25 vatios Dynamic Boost), que no se aprovecha del todo según la prueba Witcher 3.
Los resultados del benchmark están por encima de la media anterior de la RTX 4070 - se nota un aumento significativo del rendimiento comparado con elArc A730M GPU del Major X10. El modo dGPU no aporta ninguna mejora. Cambiar entre dGPU y Optimus no requiere reiniciar - soporta Advanced Optimus.
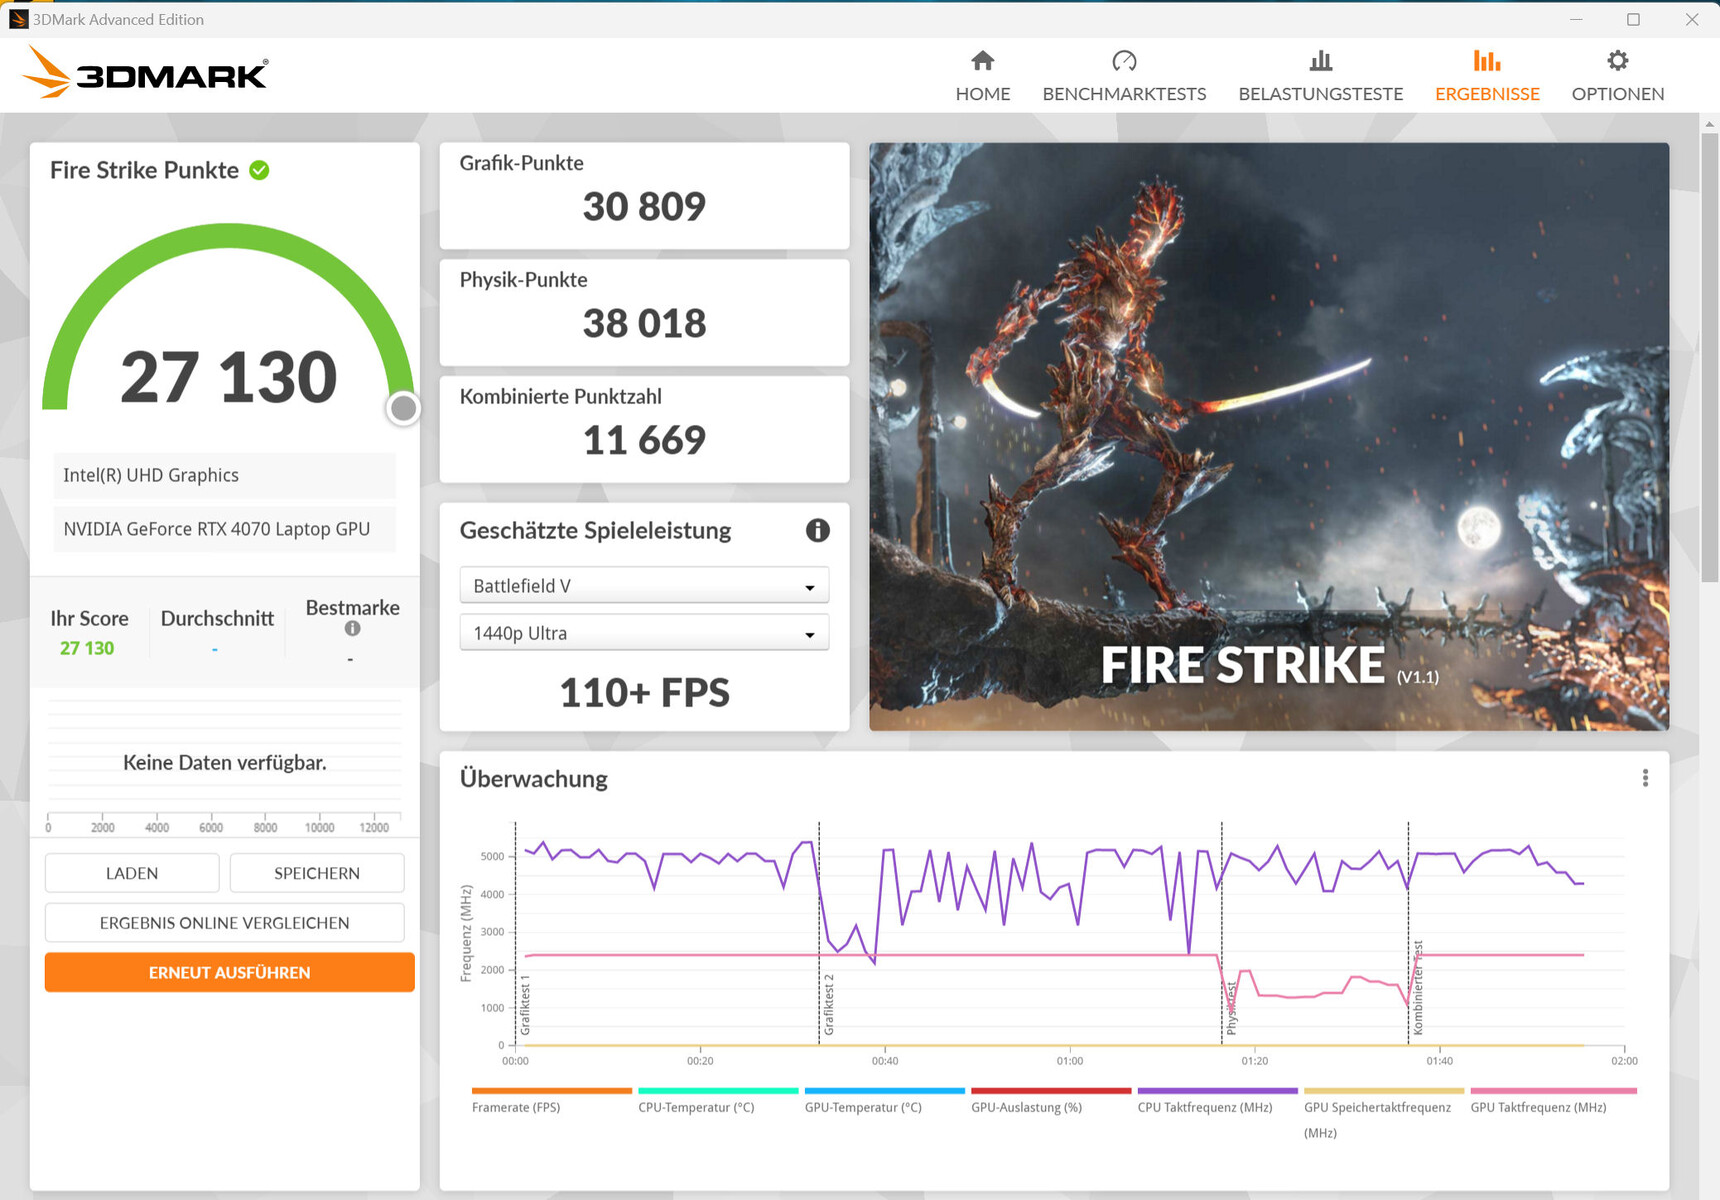
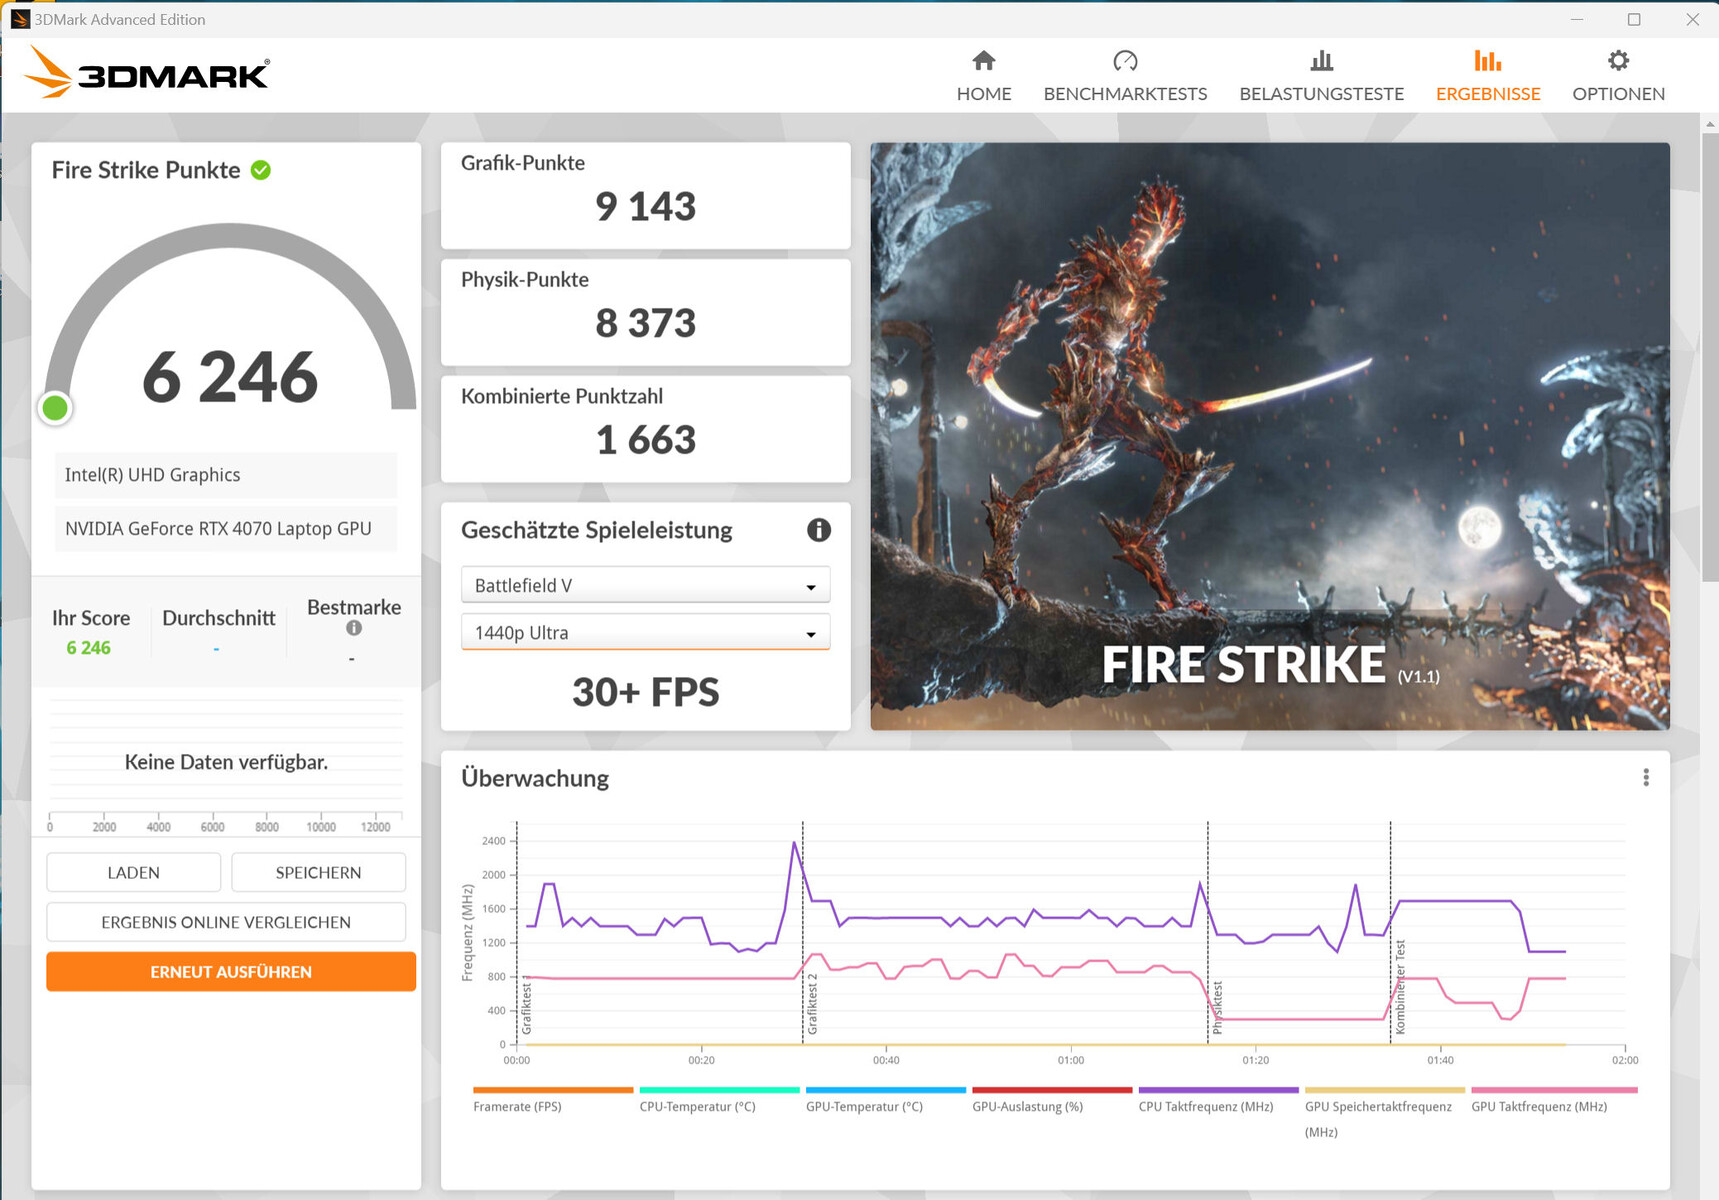
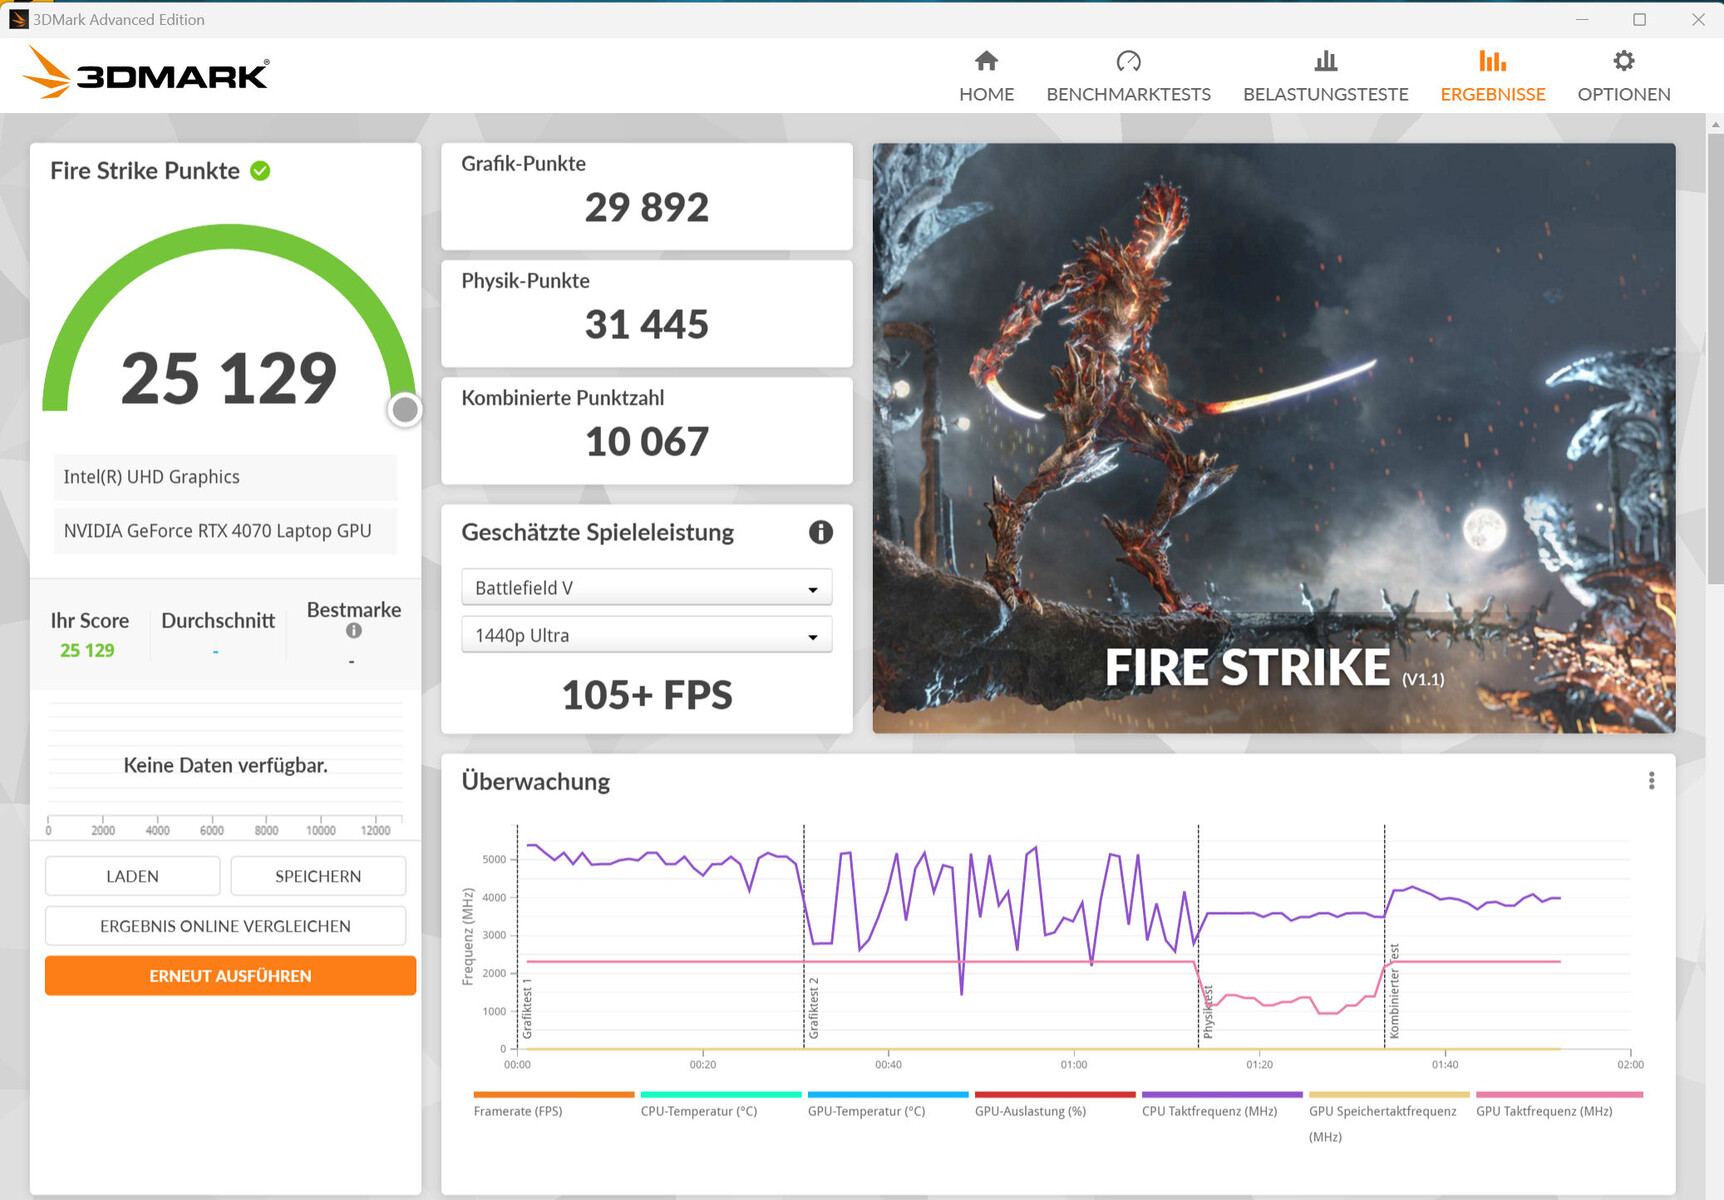
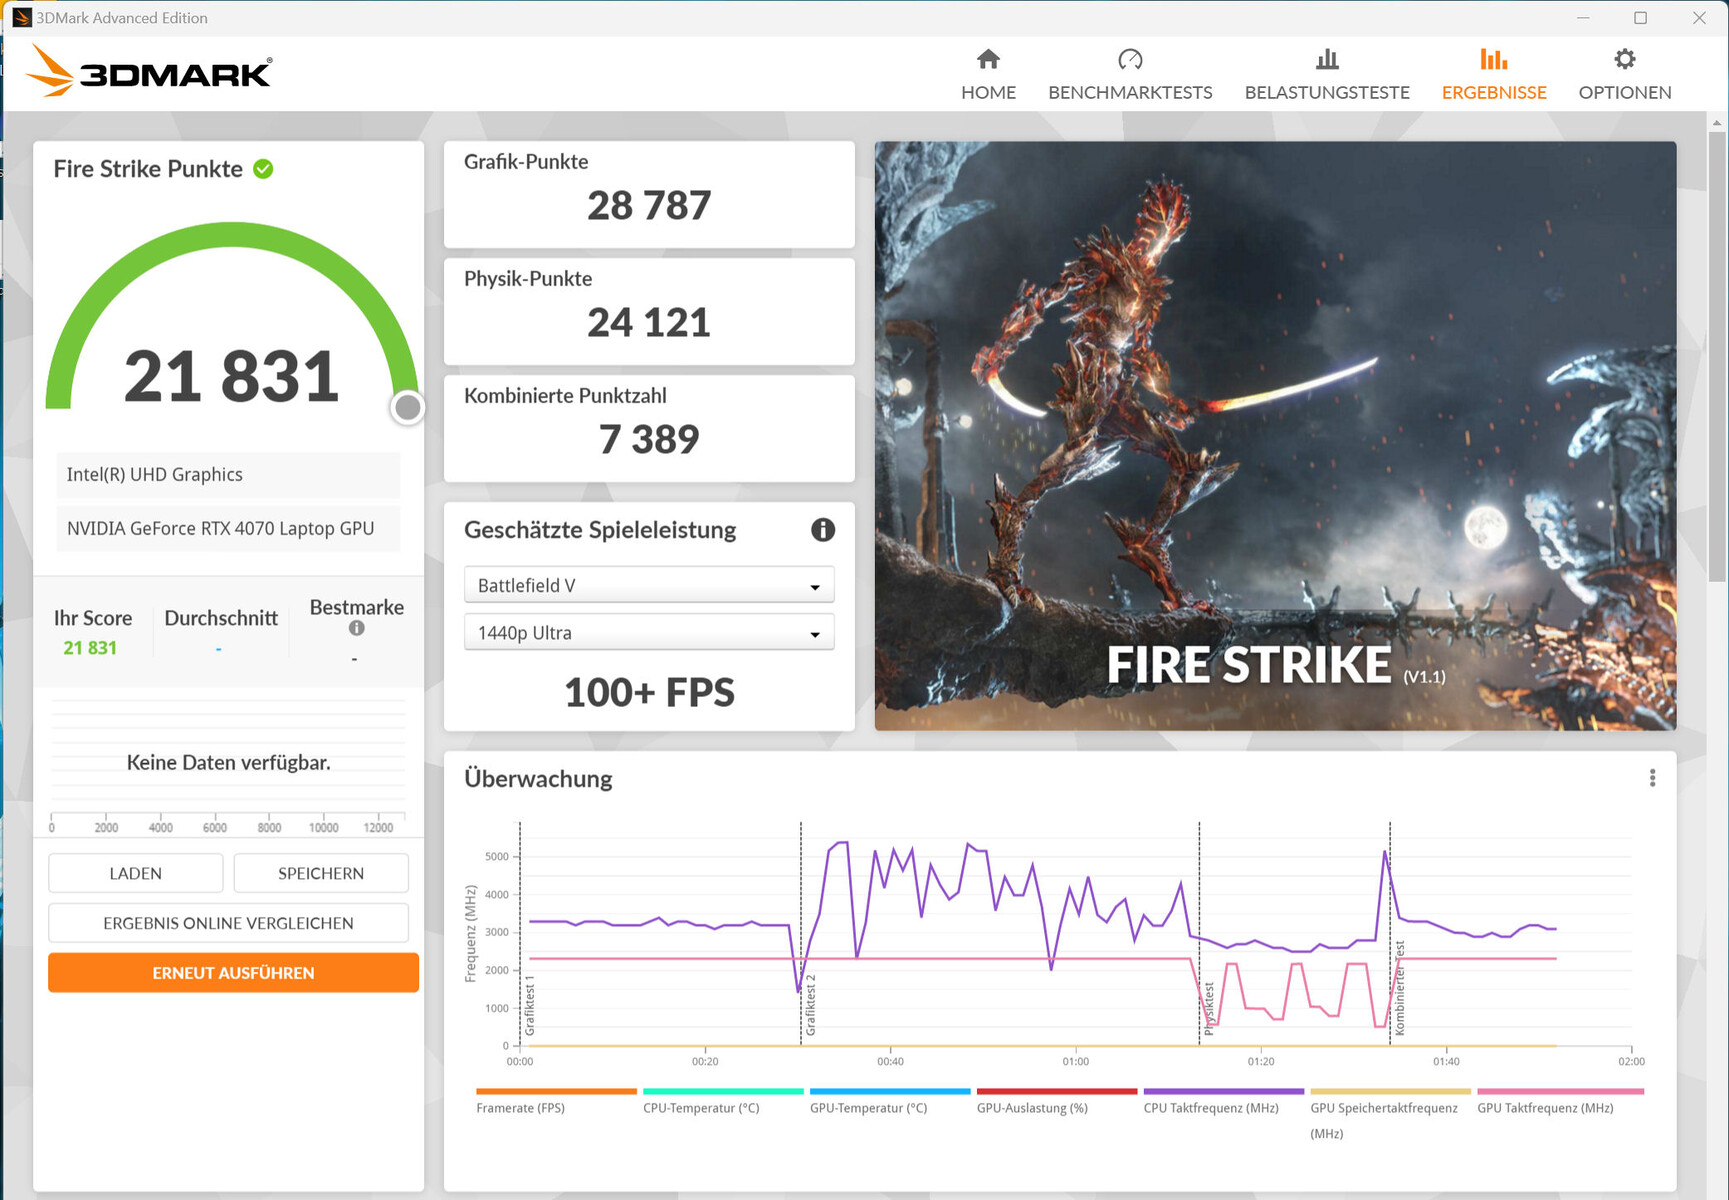

| 3DMark 06 Standard Score | 60496 puntos | |
| 3DMark 11 Performance | 35727 puntos | |
| 3DMark Cloud Gate Standard Score | 66380 puntos | |
| 3DMark Fire Strike Score | 27130 puntos | |
| 3DMark Time Spy Score | 12846 puntos | |
ayuda | ||
* ... más pequeño es mejor
Rendimiento en juegos
El portátil permite jugar en QHD con ajustes de altos a máximos. Resoluciones superiores serían posibles usando un monitor externo - posiblemente con ajustes reducidos. Los frame rates de los títulos probados están por encima de la media determinada de la RTX 4070. El modo dGPU puede aumentar los frame rates de algunos juegos en pequeña medida.
| The Witcher 3 - 1920x1080 Ultra Graphics & Postprocessing (HBAO+) | |
| Media de la clase Gaming (104.7 - 240, n=7, últimos 2 años) | |
| Medion Erazer Major X20 | |
| Asus ROG Strix G17 G713PI | |
| Aorus 15X ASF | |
| Medio NVIDIA GeForce RTX 4070 Laptop GPU (69.8 - 133.7, n=57) | |
| Razer Blade 15 OLED (Early 2022) | |
| Medion Erazer Major X10 | |
| Final Fantasy XV Benchmark - 1920x1080 High Quality | |
| Media de la clase Gaming (41 - 215, n=95, últimos 2 años) | |
| Medion Erazer Major X20 | |
| Aorus 15X ASF | |
| Asus ROG Strix G17 G713PI | |
| Medio NVIDIA GeForce RTX 4070 Laptop GPU (41 - 131.9, n=65) | |
| Razer Blade 15 OLED (Early 2022) | |
| Medion Erazer Major X10 | |
Para comprobar si la tasa de imágenes por segundo se mantiene constante durante un periodo más largo, ejecutamos el juego "The Witcher 3" durante unos 60 minutos en resolución Full HD y con los ajustes de máxima calidad. El personaje del juego no se movió. No se registró ninguna caída de la frecuencia de imagen.
Witcher 3 FPS chart
| bajo | medio | alto | ultra | QHD | |
|---|---|---|---|---|---|
| GTA V (2015) | 187.3 | 187.2 | 183.8 | 128 | 72.6 |
| The Witcher 3 (2015) | 545 | 391.4 | 242.3 | 127 | |
| Dota 2 Reborn (2015) | 205 | 183.3 | 169.9 | 158.8 | |
| Final Fantasy XV Benchmark (2018) | 220 | 175.2 | 121.2 | 88.4 | |
| X-Plane 11.11 (2018) | 182.3 | 155.9 | 120.8 | ||
| Far Cry 5 (2018) | 188 | 161 | 153 | 144 | 122 |
| Strange Brigade (2018) | 490 | 310 | 244 | 208 | 131.4 |
| F1 22 (2022) | 262 | 264 | 206 | 83.9 | 53.3 |
Emisiones - El portátil Erazer puede producir mucho ruido
Ruido
El X20 puede producir mucho ruido bajo carga: se alcanzan valores máximos de hasta 57 dB(A) cuando está activo el "Modo Turbo". El ruido de fondo es algo parecido a un silbido. Los ventiladores no emiten ningún ruido de fondo molesto. Se puede conseguir un nivel de ruido general más bajo utilizando los otros dos perfiles de rendimiento, a expensas de la potencia de cálculo.
Las emisiones en ralentí y en el uso diario (oficina, internet) son agradables: los ventiladores funcionan a velocidades muy bajas y suelen estar en ralentí - en los tres perfiles de rendimiento.
| Modo Turbo (dt: Overboost) | Modo Equilibrado (dt: Balanced) | Modo Office (dt: Balanced) | |
|---|---|---|---|
| CPU PL1(HWInfo) | 140 vatios | 140 vatios | 140 vatios |
| CPU PL2 (HWInfo) | 140 vatios | 140 vatios | 140 vatios |
| Ruido (Witcher 3 ) | 50-53 dB(A) | 48-51 dB(A) | 36-43 dB(A) después 32-34 dB(A) |
| Rendimiento (Witcher 3 ) | 124 fps | 118 fps | 114-118 fps más tarde 30 fps Bloqueo |
Ruido
| Ocioso |
| 25 / 29 / 31 dB(A) |
| Carga |
| 50 / 57 dB(A) |
 | ||
30 dB silencioso 40 dB(A) audible 50 dB(A) ruidosamente alto |
||
min: | ||
| Medion Erazer Major X20 i9-13900HX, GeForce RTX 4070 Laptop GPU | Aorus 15X ASF i7-13700HX, GeForce RTX 4070 Laptop GPU | Razer Blade 15 OLED (Early 2022) i9-12900H, GeForce RTX 3070 Ti Laptop GPU | Asus ROG Strix G17 G713PI R9 7945HX, GeForce RTX 4070 Laptop GPU | |
|---|---|---|---|---|
| Noise | -5% | 7% | 5% | |
| apagado / medio ambiente * (dB) | 24 | 25 -4% | 26 -8% | 25 -4% |
| Idle Minimum * (dB) | 25 | 28 -12% | 28 -12% | 26 -4% |
| Idle Average * (dB) | 29 | 29 -0% | 28 3% | 29 -0% |
| Idle Maximum * (dB) | 31 | 36 -16% | 28 10% | 30 3% |
| Load Average * (dB) | 50 | 50 -0% | 38.5 23% | 46 8% |
| Witcher 3 ultra * (dB) | 53 | 54 -2% | 46 13% | |
| Load Maximum * (dB) | 57 | 58 -2% | 43.9 23% | 47 18% |
* ... más pequeño es mejor
Temperatura
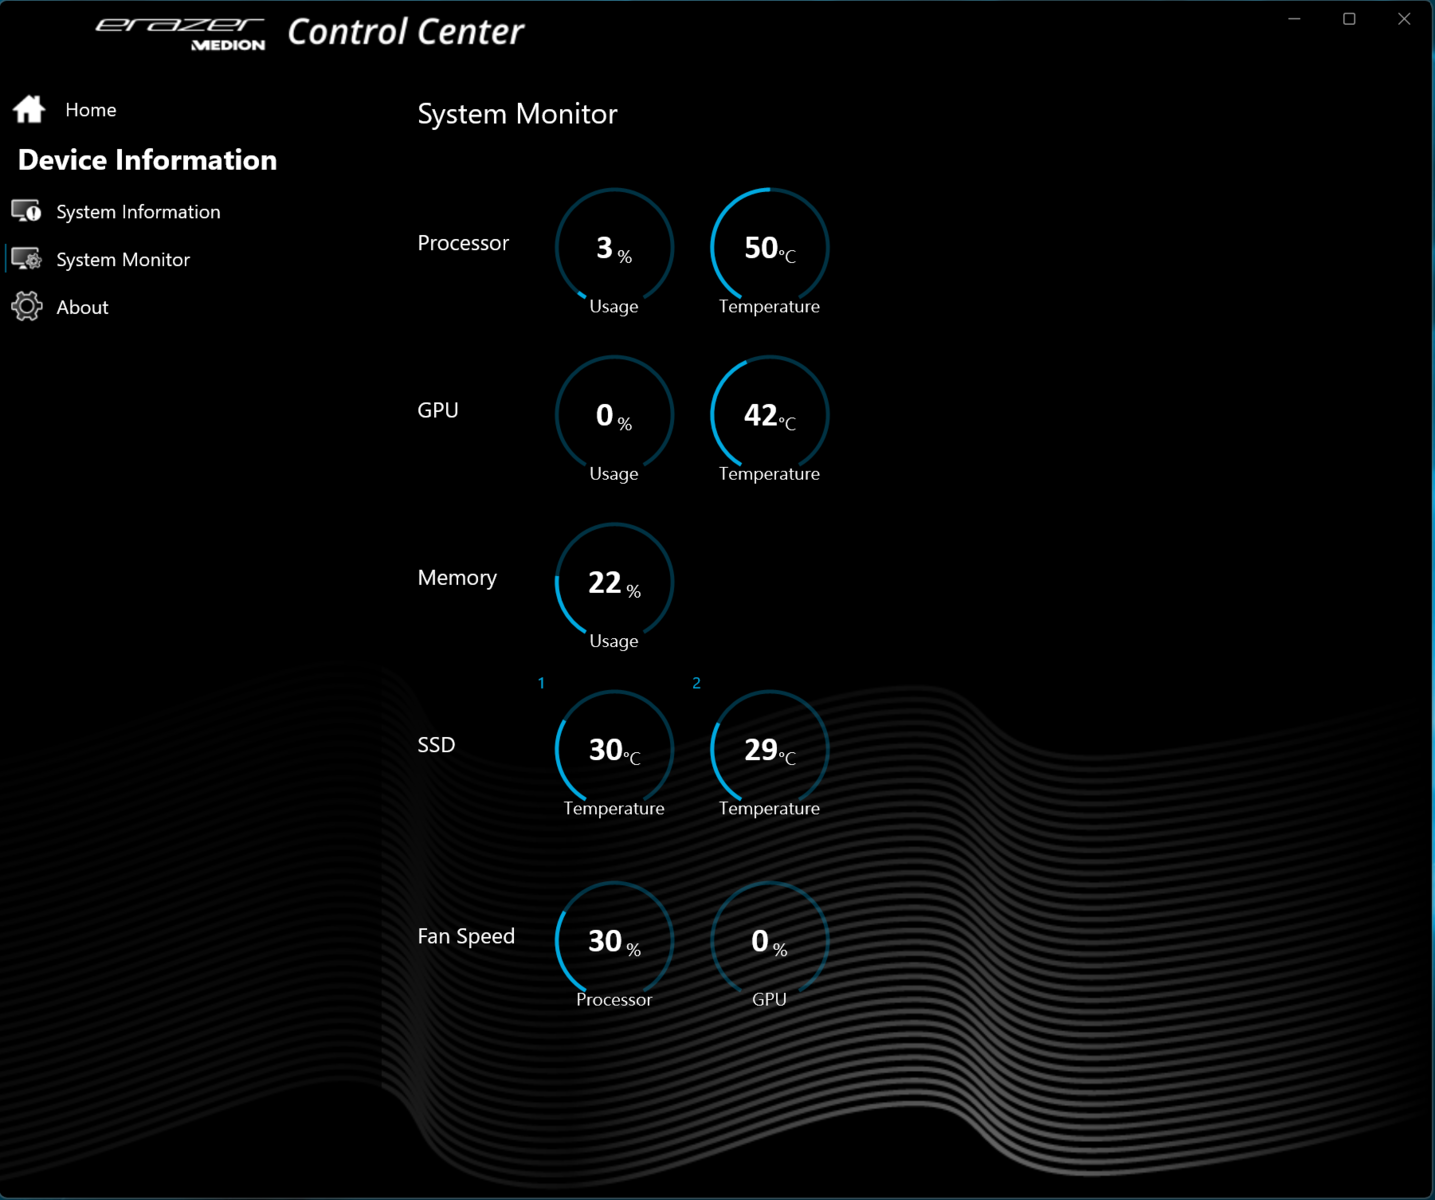
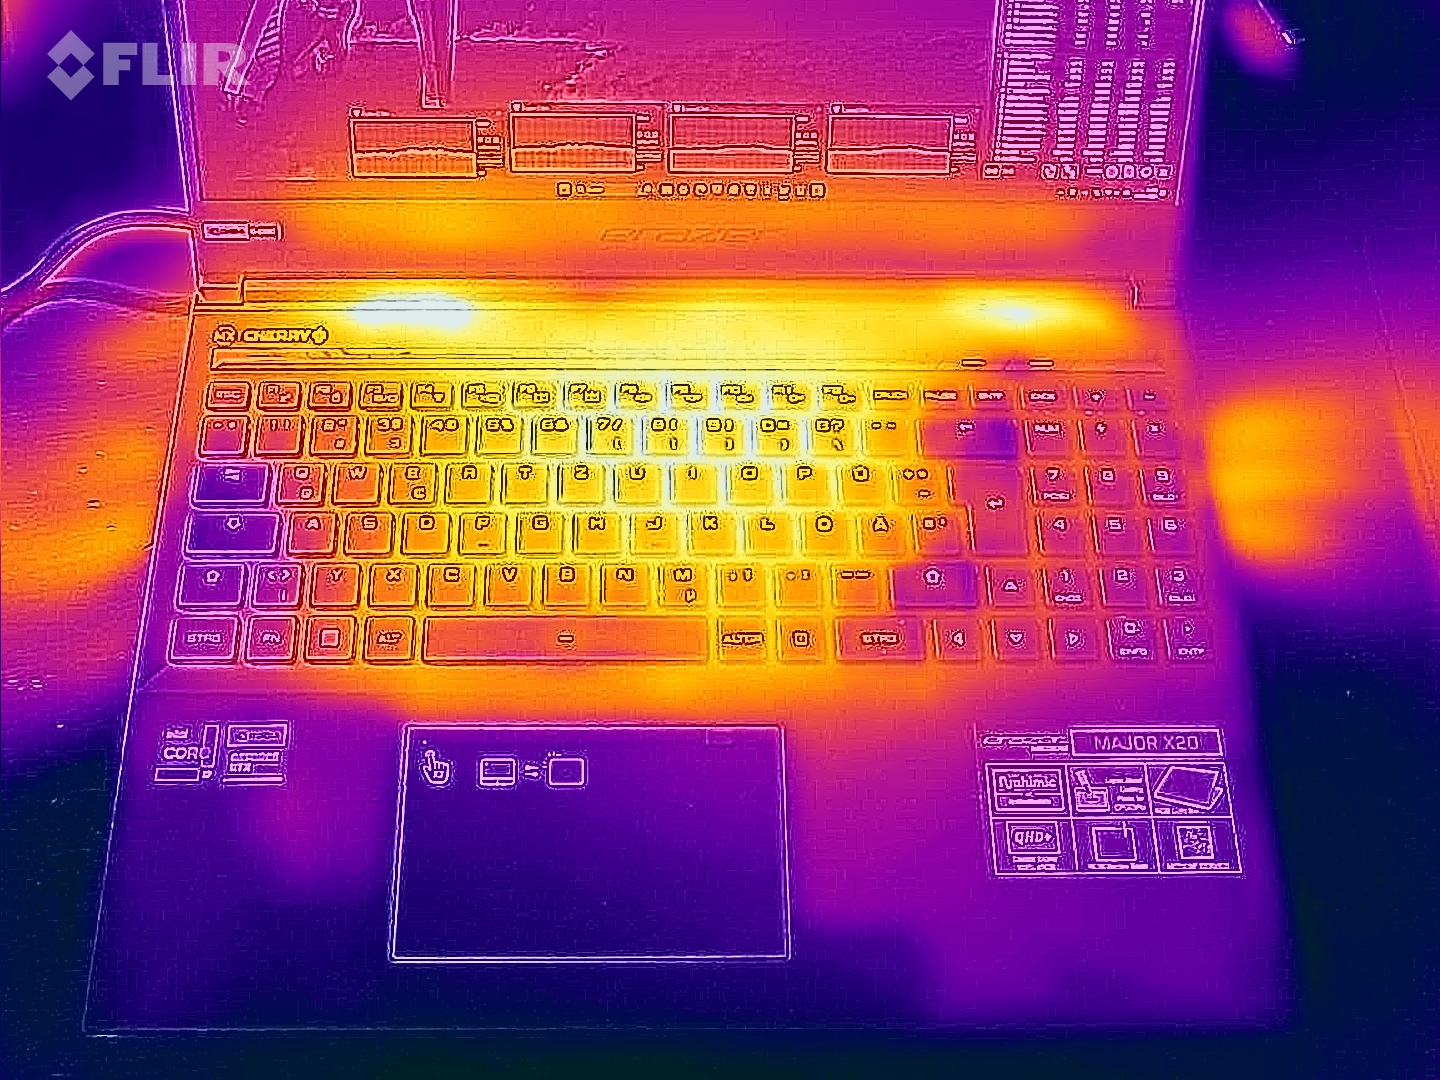
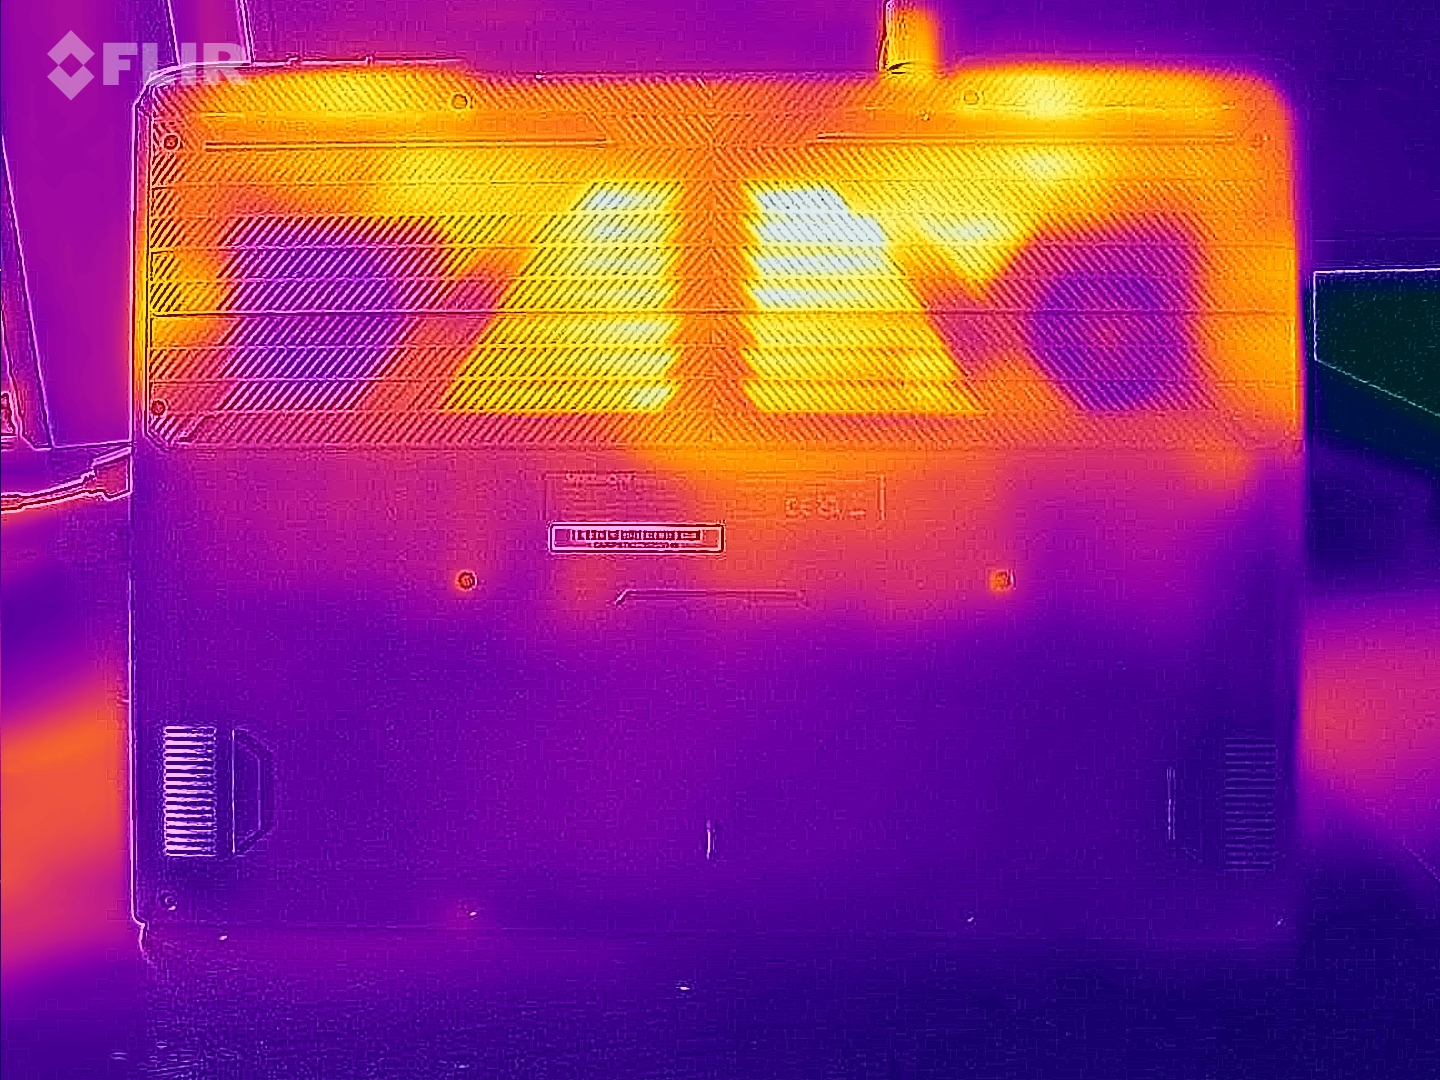
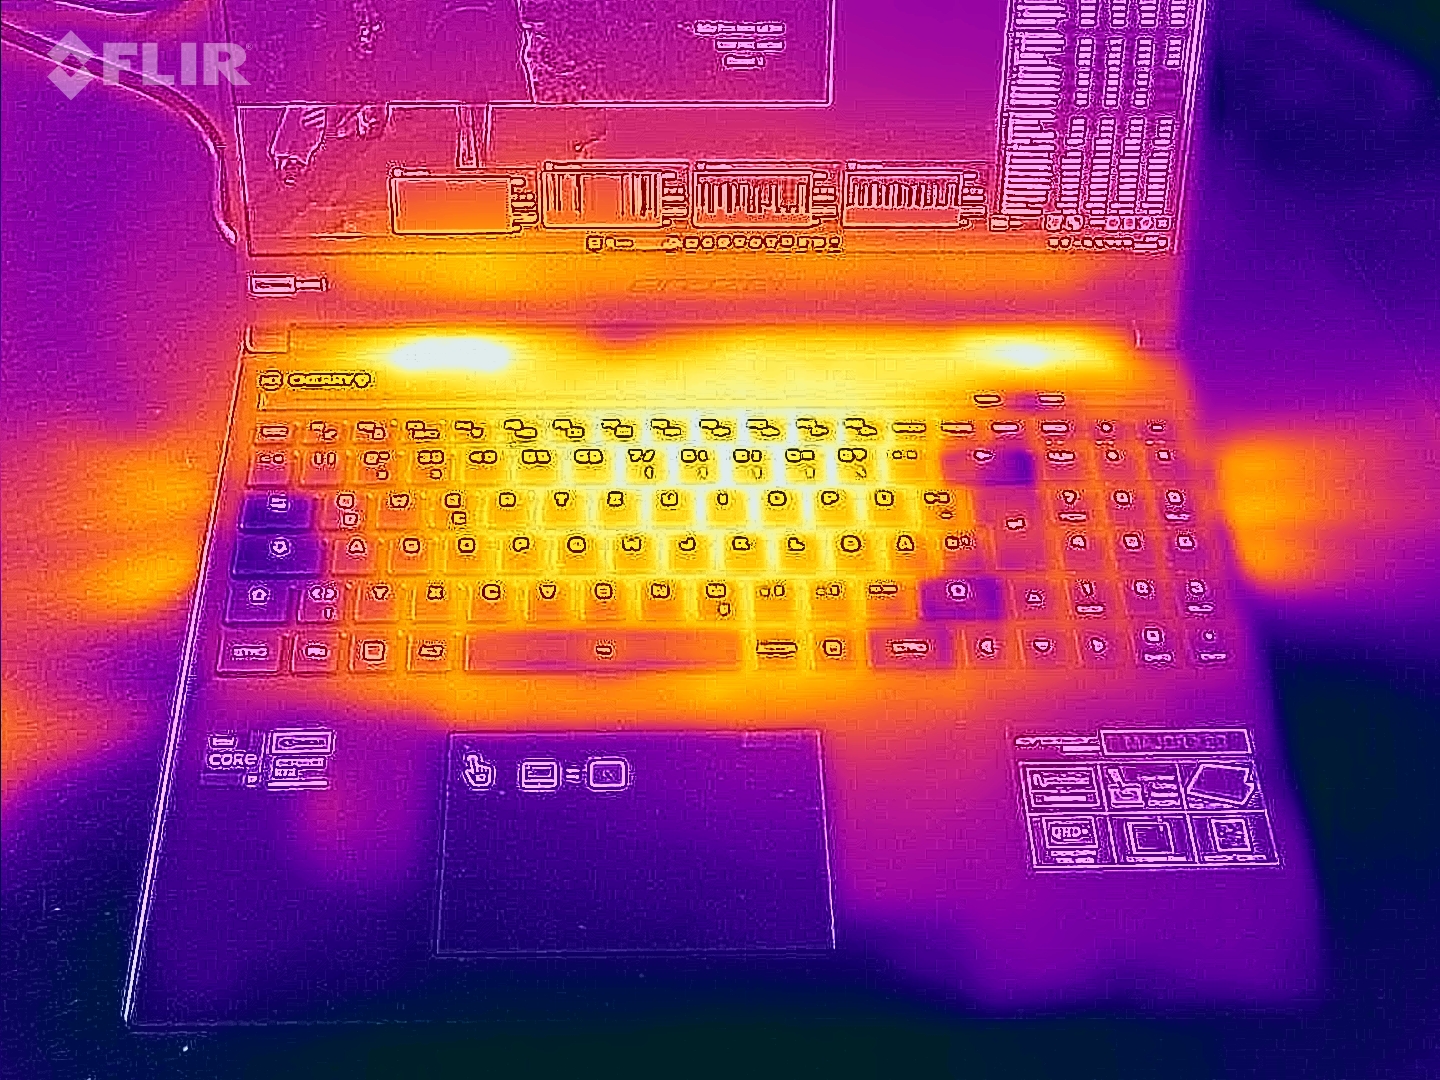
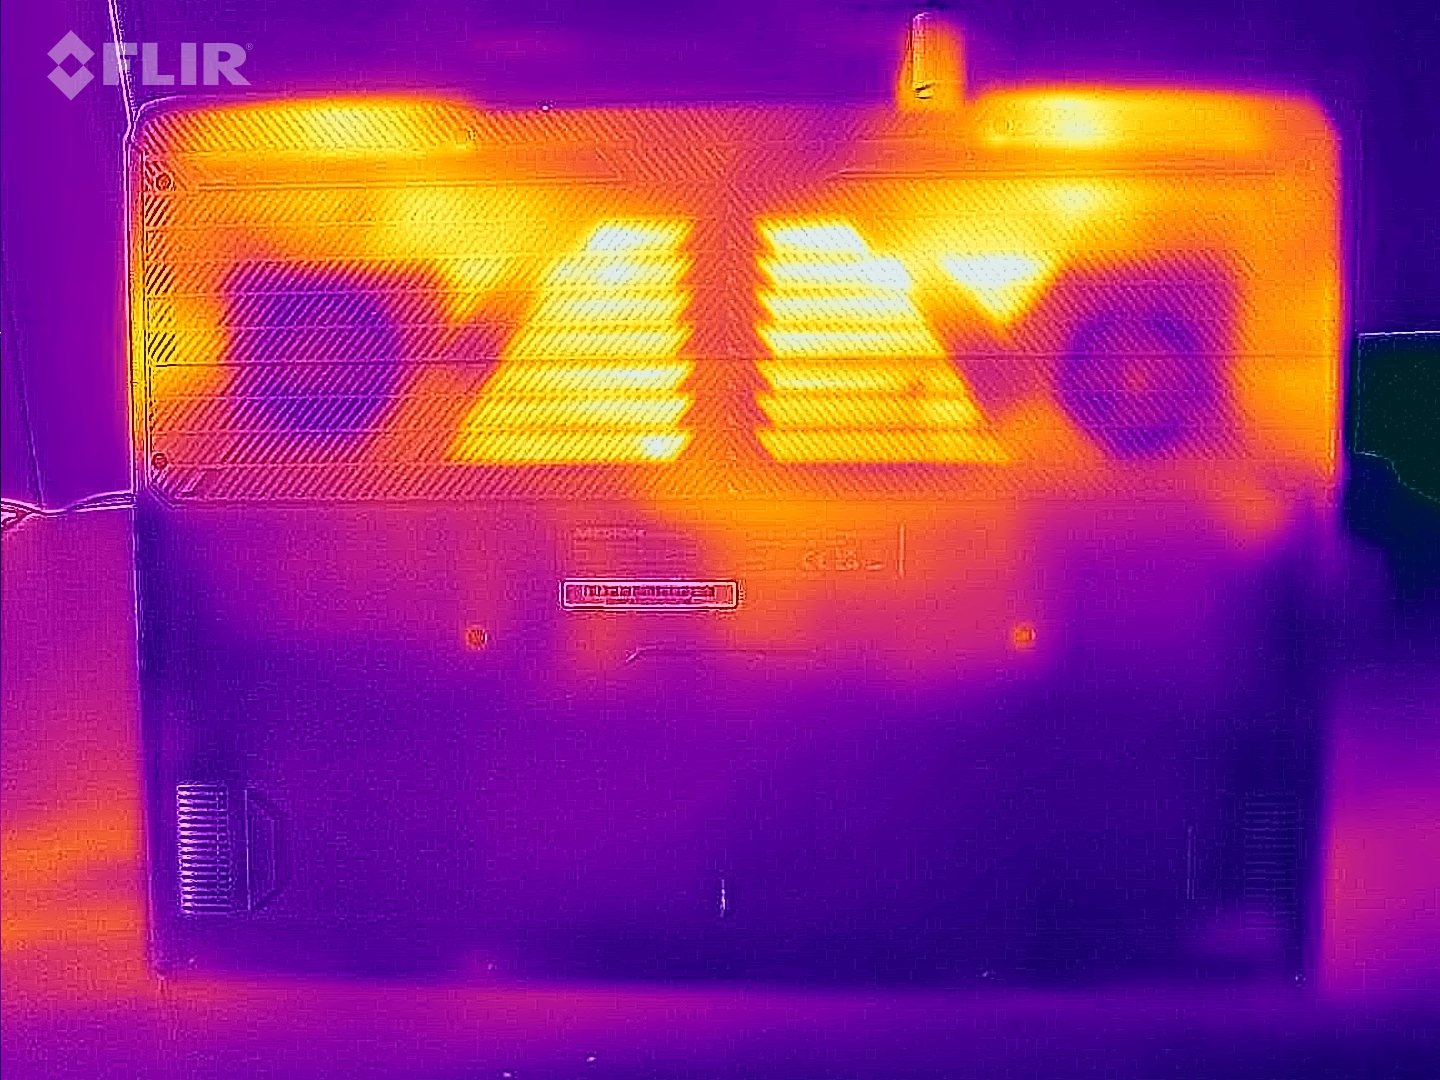
En el uso diario (oficina, internet), las temperaturas del portátil se mantienen dentro del rango verde. El portátil se calienta notablemente bajo carga (test de estrés, Witcher 3 test), pero no excesivamente. Las temperaturas de la CPU no son nada preocupantes.
(-) La temperatura máxima en la parte superior es de 46 °C / 115 F, frente a la media de 40.4 °C / 105 F, que oscila entre 21.2 y 68.8 °C para la clase Gaming.
(-) El fondo se calienta hasta un máximo de 49 °C / 120 F, frente a la media de 43.2 °C / 110 F
(±) En reposo, la temperatura media de la parte superior es de 32 °C / 90# F, frente a la media del dispositivo de 33.9 °C / 93 F.
(±) Jugando a The Witcher 3, la temperatura media de la parte superior es de 37 °C / 99 F, frente a la media del dispositivo de 33.9 °C / 93 F.
(+) El reposamanos y el panel táctil están a una temperatura inferior a la de la piel, con un máximo de 31 °C / 87.8 F y, por tanto, son fríos al tacto.
(-) La temperatura media de la zona del reposamanos de dispositivos similares fue de 28.8 °C / 83.8 F (-2.2 °C / -4 F).
| Medion Erazer Major X20 Intel Core i9-13900HX, NVIDIA GeForce RTX 4070 Laptop GPU | Aorus 15X ASF Intel Core i7-13700HX, NVIDIA GeForce RTX 4070 Laptop GPU | Razer Blade 15 OLED (Early 2022) Intel Core i9-12900H, NVIDIA GeForce RTX 3070 Ti Laptop GPU | Asus ROG Strix G17 G713PI AMD Ryzen 9 7945HX, NVIDIA GeForce RTX 4070 Laptop GPU | |
|---|---|---|---|---|
| Heat | 16% | 3% | 12% | |
| Maximum Upper Side * (°C) | 46 | 42 9% | 49.5 -8% | 42 9% |
| Maximum Bottom * (°C) | 49 | 51 -4% | 47.5 3% | 41 16% |
| Idle Upper Side * (°C) | 37 | 27 27% | 33.4 10% | 33 11% |
| Idle Bottom * (°C) | 38 | 26 32% | 35 8% | 34 11% |
* ... más pequeño es mejor
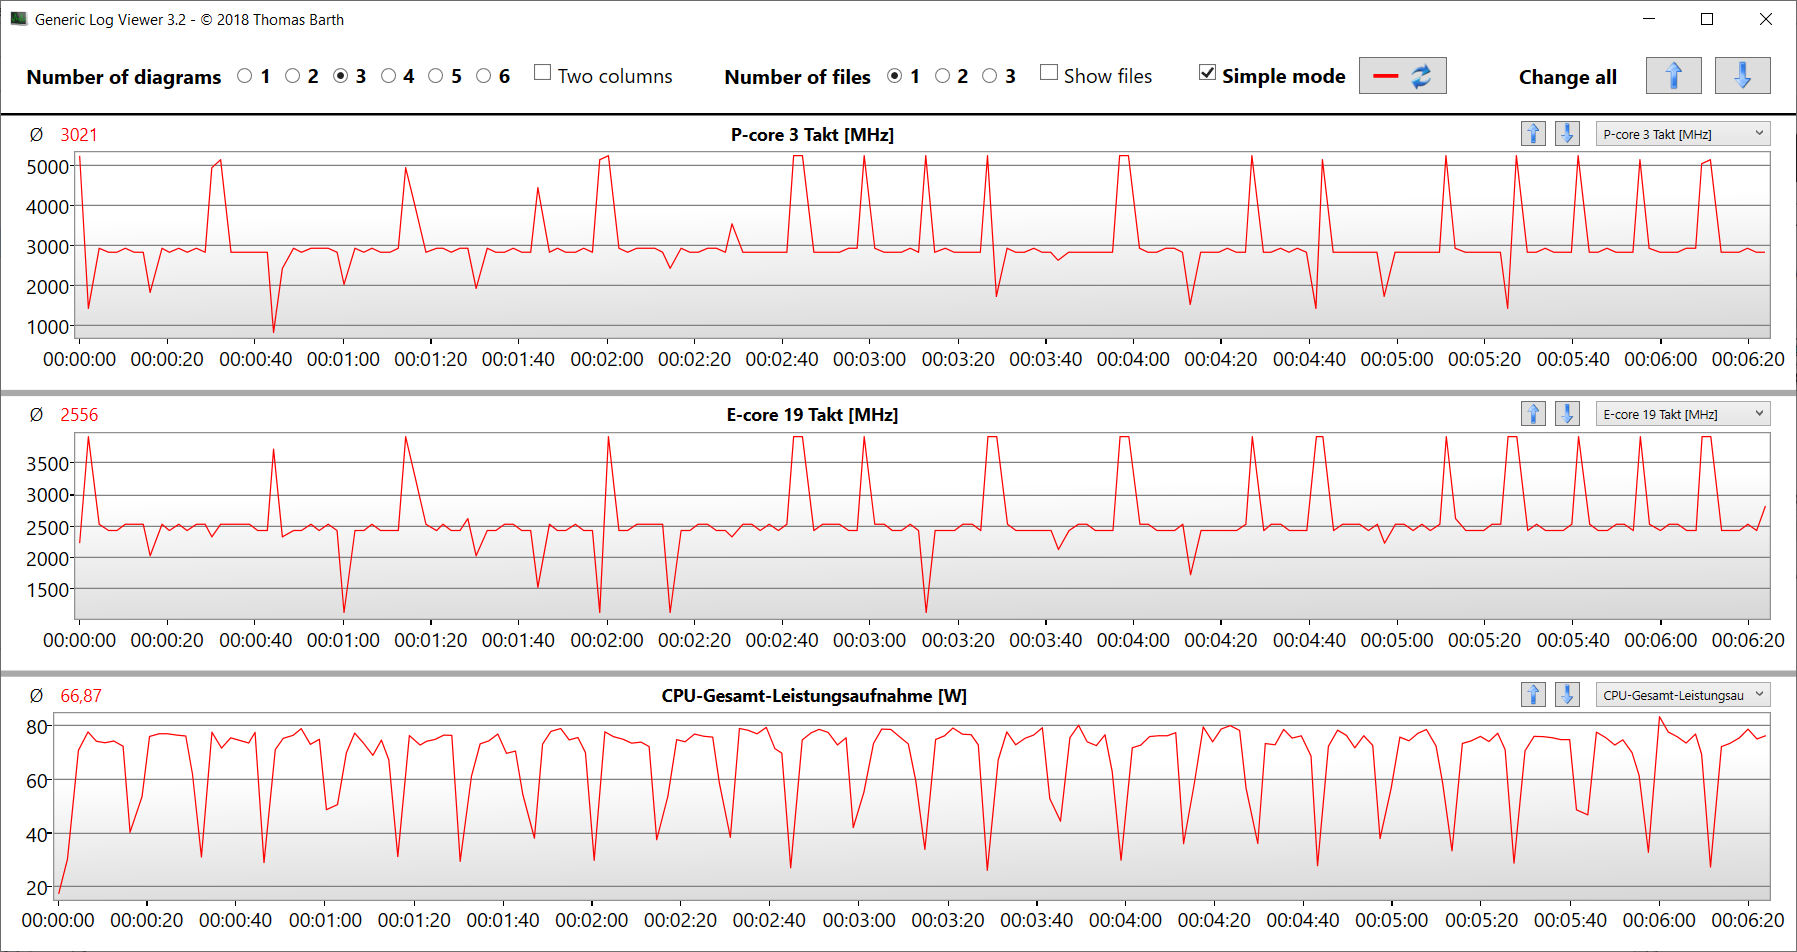
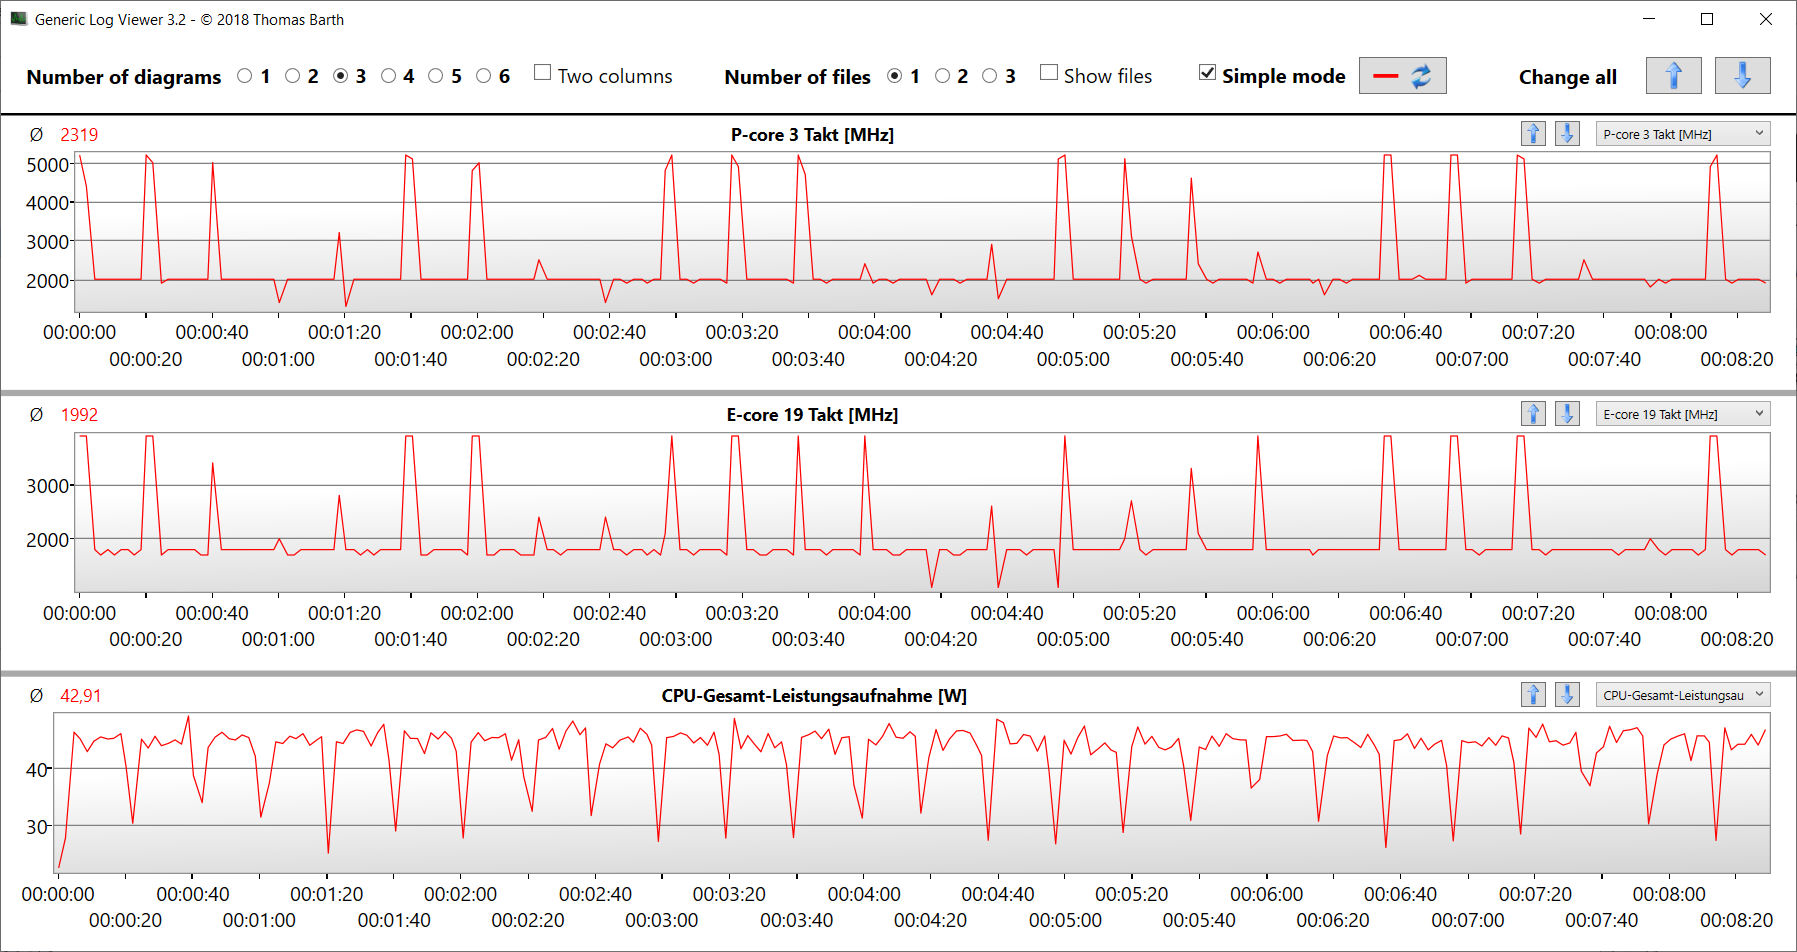
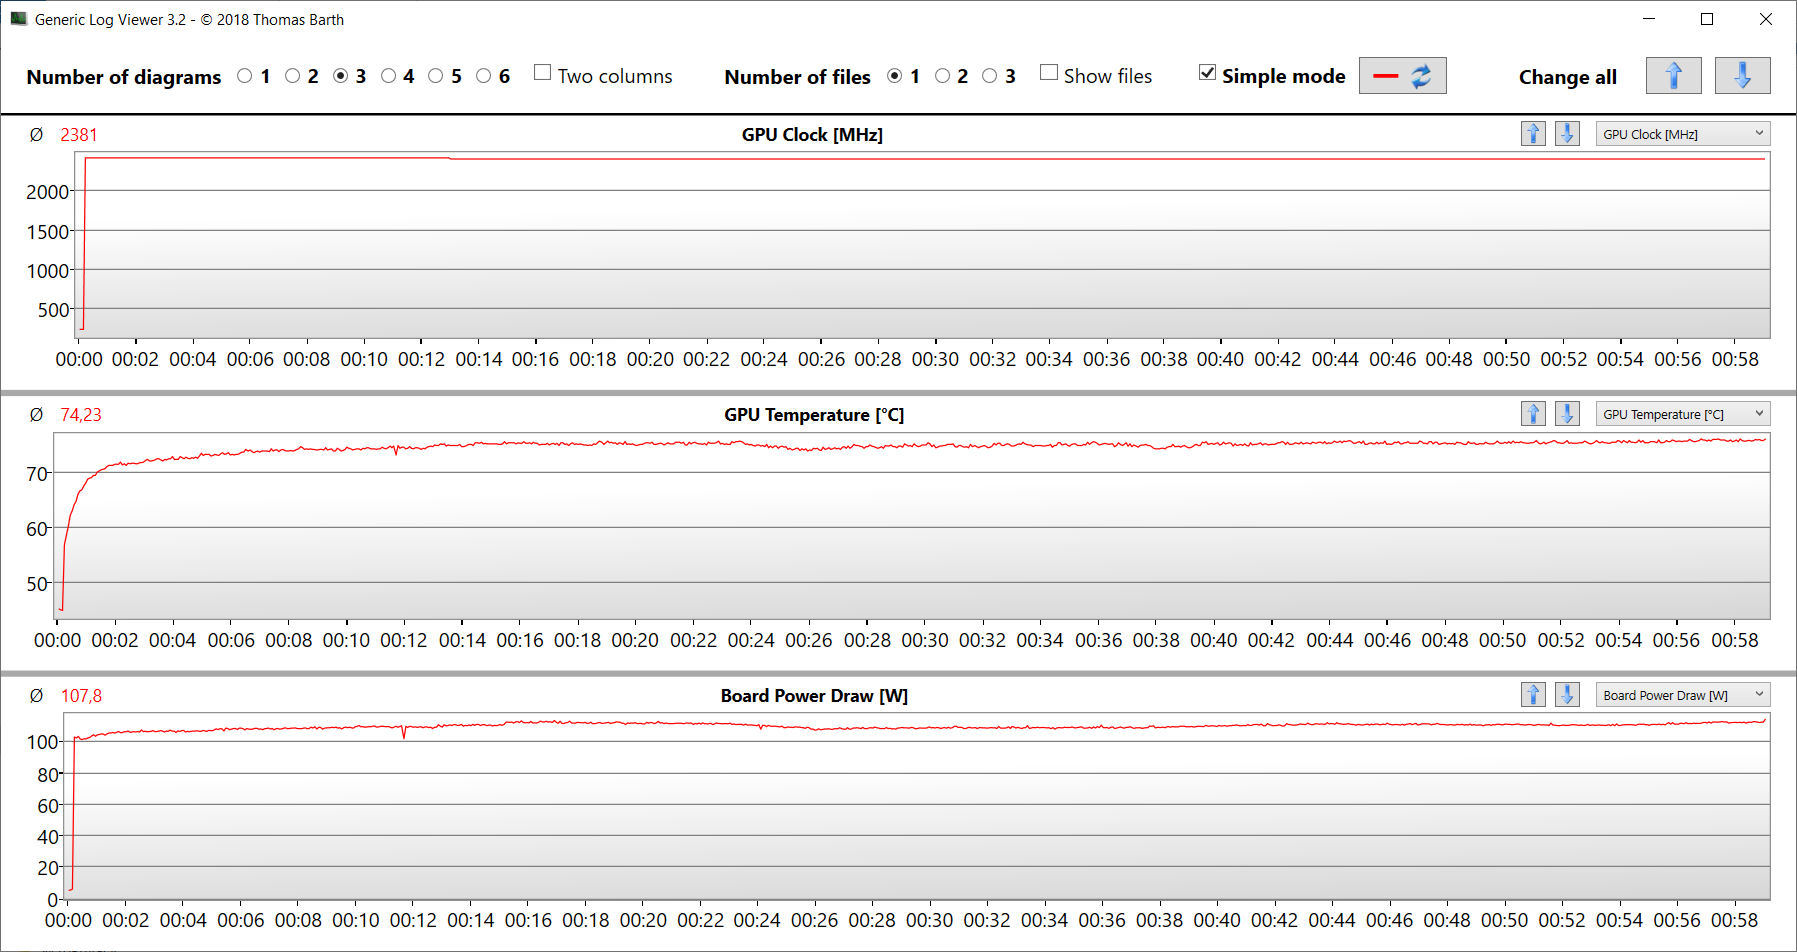
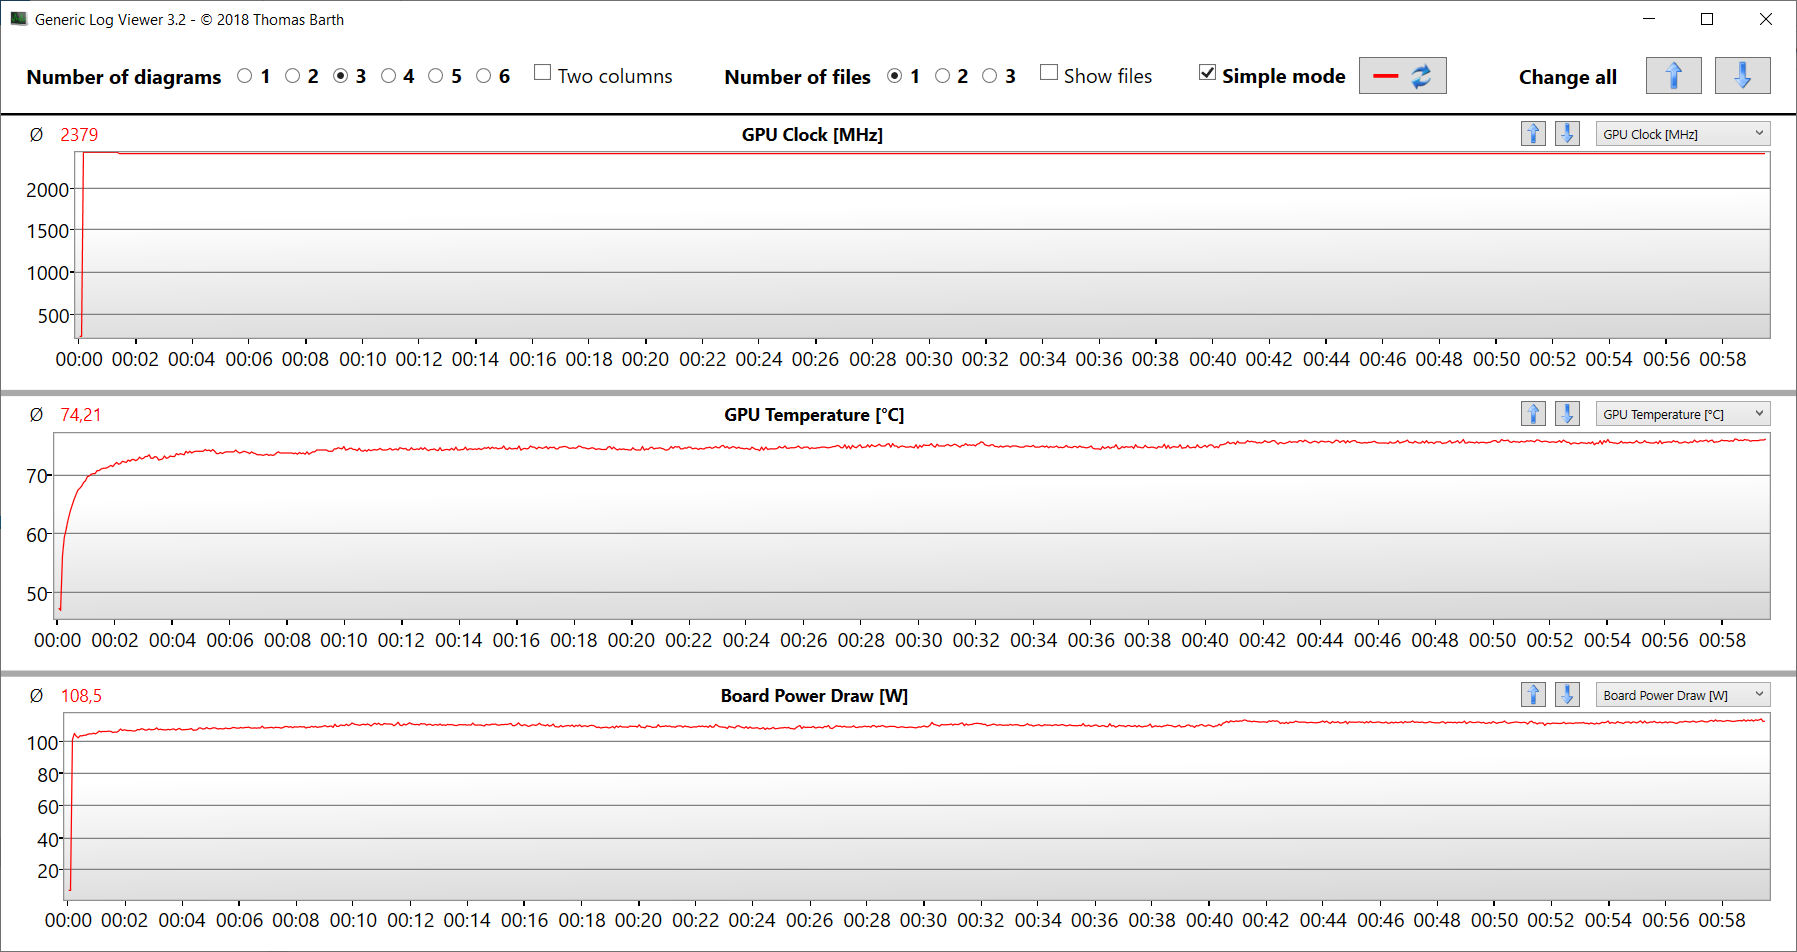
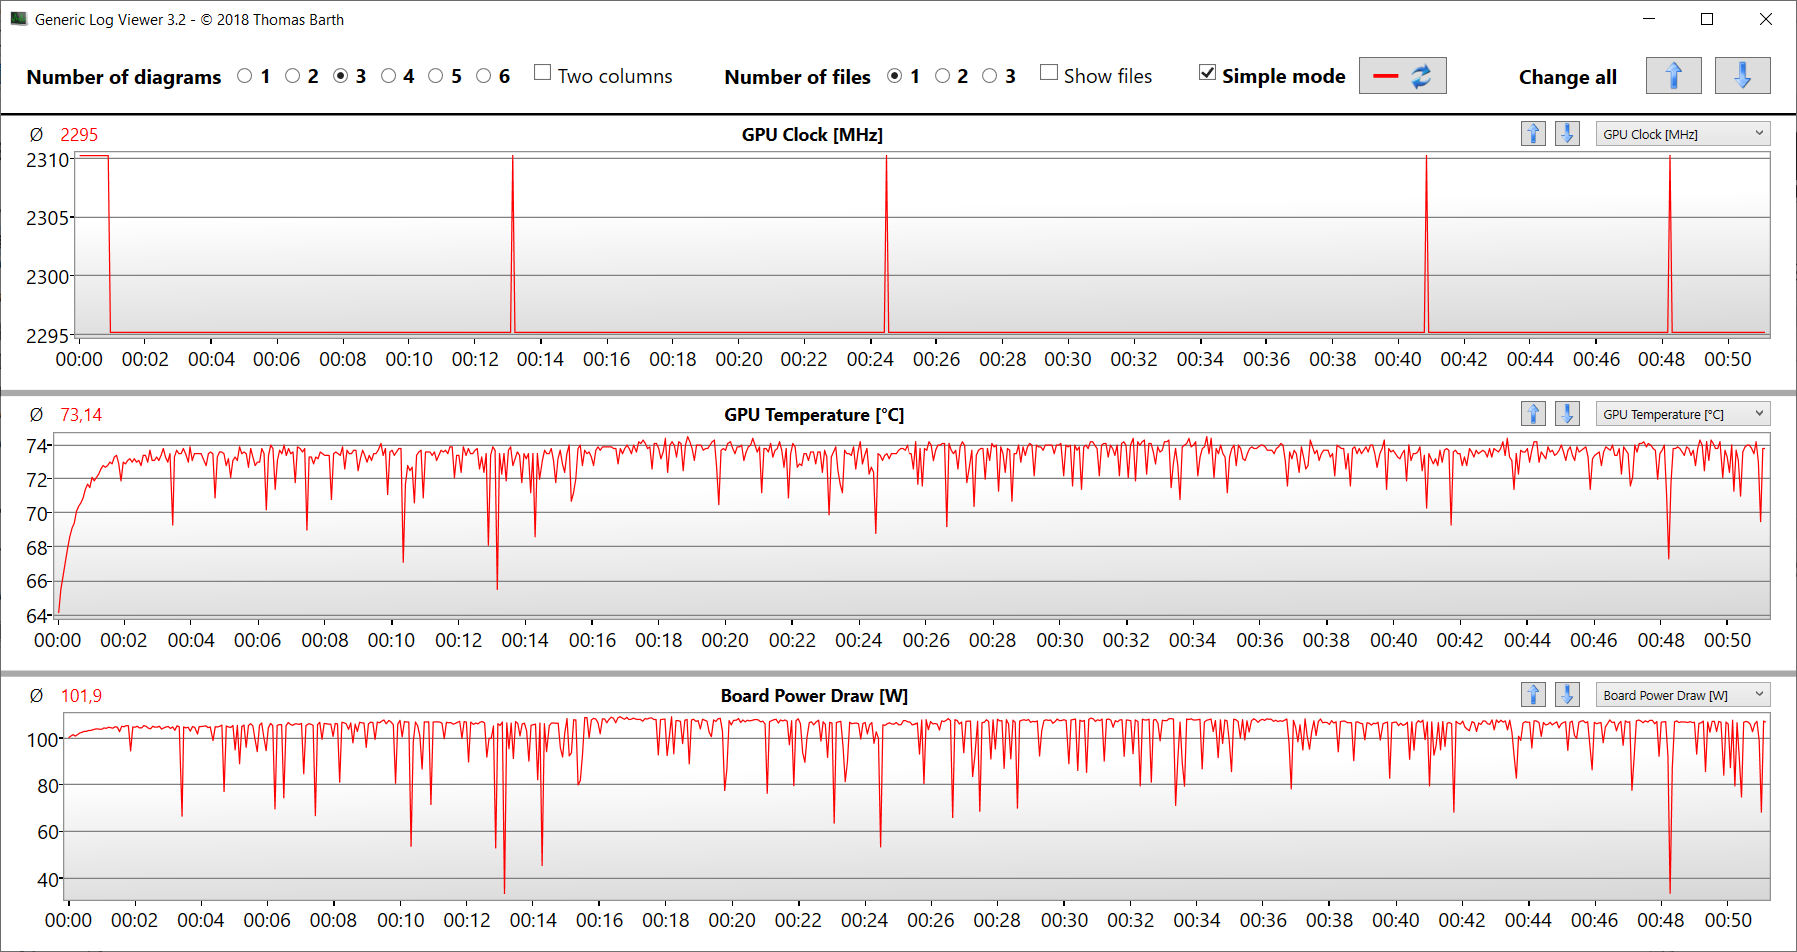
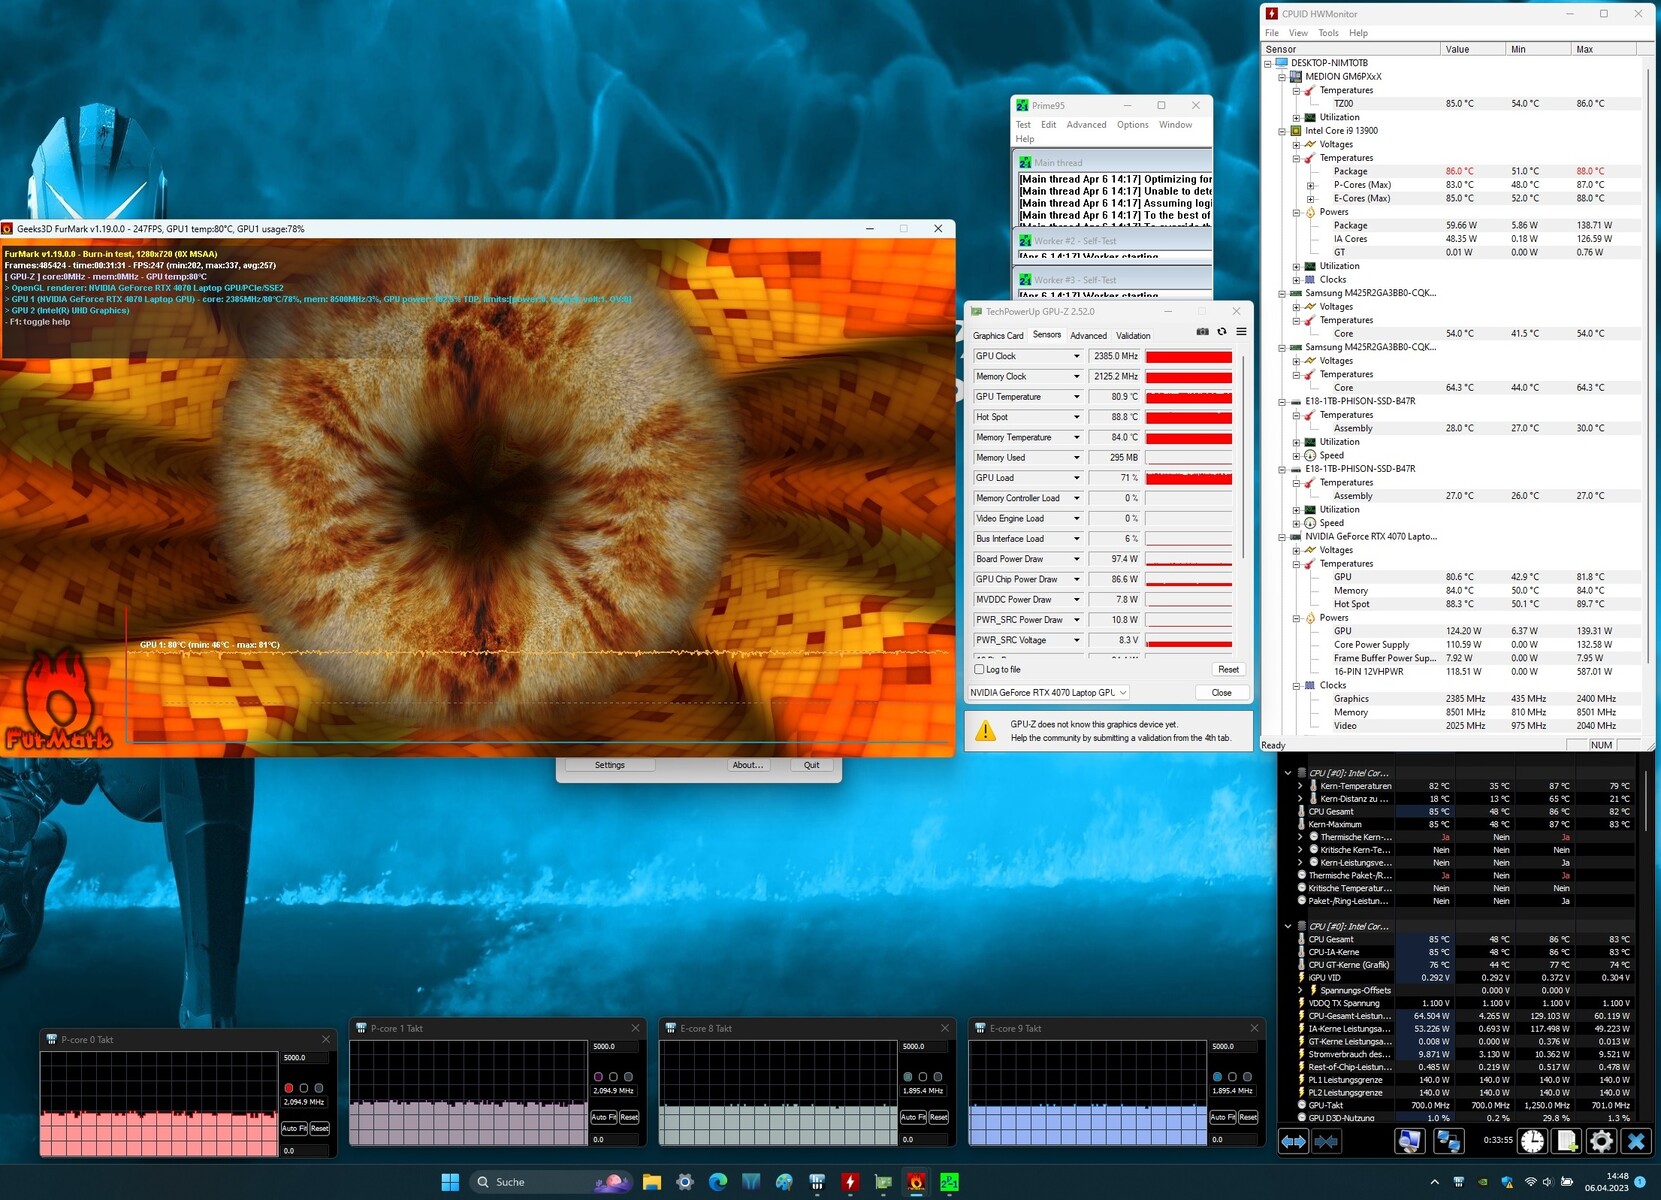
Prueba de resistencia
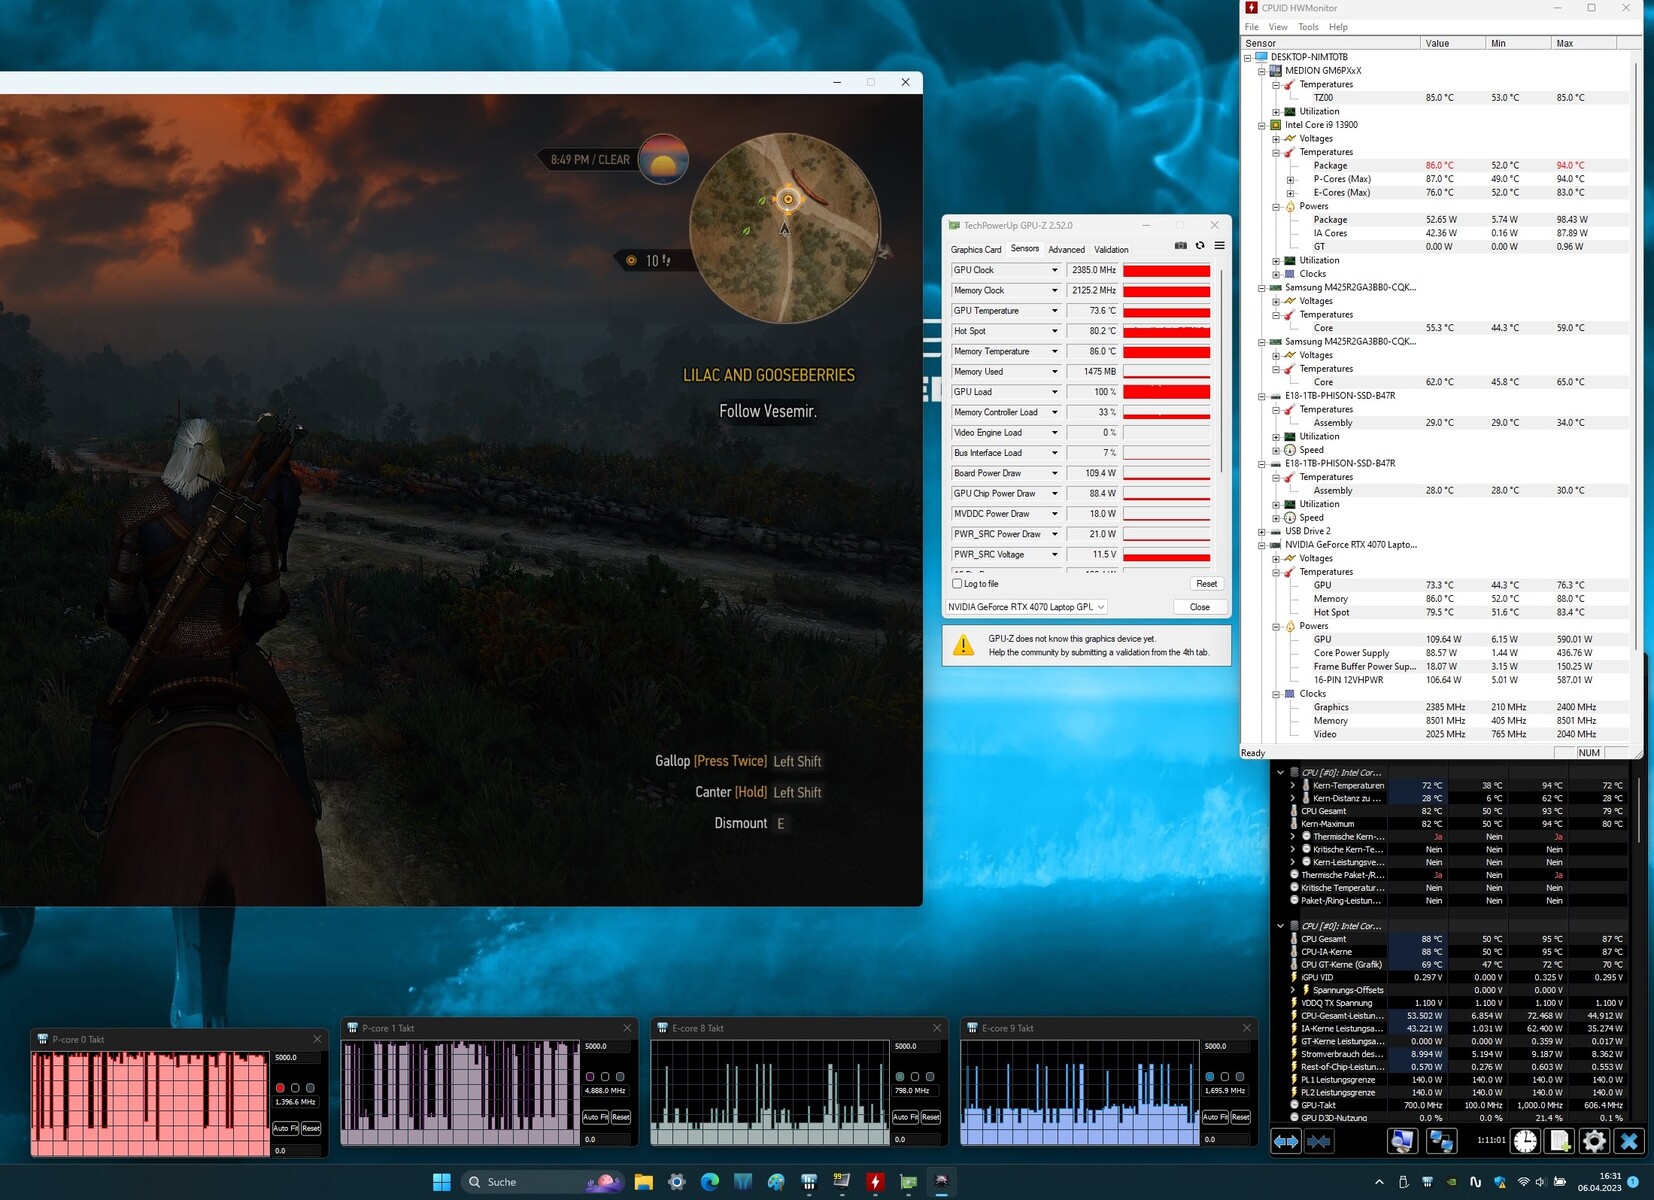
La prueba de estrés (Prime95 y Furmark en funcionamiento continuo) representa un escenario extremo para probar la estabilidad del sistema a plena carga. La CPU comienza la prueba a altas velocidades de reloj (P: 4 GHz, E: 3,3 GHz), mientras que la GPU arranca a 1,5 o 2 GHz. En los primeros 5 minutos, el reloj de la CPU desciende gradualmente hasta 2 o 2,4 GHz (núcleos P) y 1,9 o 2,1 GHz (núcleos E). Al mismo tiempo, el reloj de la GPU aumenta de 2,3 a 2,4 GHz.
Altavoces
Los altavoces estéreo producen un sonido muy decente, pero podrían utilizar más graves. Se recomiendan auriculares o altavoces externos para una mejor calidad de sonido.
Medion Erazer Major X20 análisis de audio
(+) | los altavoces pueden reproducir a un volumen relativamente alto (#86 dB)
Graves 100 - 315 Hz
(±) | lubina reducida - en promedio 11.9% inferior a la mediana
(±) | la linealidad de los graves es media (9.7% delta a frecuencia anterior)
Medios 400 - 2000 Hz
(+) | medios equilibrados - a sólo 3.7% de la mediana
(+) | los medios son lineales (4.7% delta a la frecuencia anterior)
Altos 2 - 16 kHz
(+) | máximos equilibrados - a sólo 2.3% de la mediana
(+) | los máximos son lineales (3.4% delta a la frecuencia anterior)
Total 100 - 16.000 Hz
(+) | el sonido global es lineal (10.4% de diferencia con la mediana)
En comparación con la misma clase
» 6% de todos los dispositivos probados de esta clase eran mejores, 2% similares, 92% peores
» El mejor tuvo un delta de 6%, la media fue 18%, el peor fue ###max##%
En comparación con todos los dispositivos probados
» 5% de todos los dispositivos probados eran mejores, 1% similares, 93% peores
» El mejor tuvo un delta de 4%, la media fue 23%, el peor fue ###max##%
Aorus 15X ASF análisis de audio
(+) | los altavoces pueden reproducir a un volumen relativamente alto (#83 dB)
Graves 100 - 315 Hz
(-) | casi sin bajos - de media 27.3% inferior a la mediana
(-) | los graves no son lineales (15.1% delta a la frecuencia anterior)
Medios 400 - 2000 Hz
(±) | medias más altas - de media 5.8% más altas que la mediana
(+) | los medios son lineales (4.8% delta a la frecuencia anterior)
Altos 2 - 16 kHz
(+) | máximos equilibrados - a sólo 3.1% de la mediana
(+) | los máximos son lineales (6.3% delta a la frecuencia anterior)
Total 100 - 16.000 Hz
(±) | la linealidad del sonido global es media (20.1% de diferencia con la mediana)
En comparación con la misma clase
» 71% de todos los dispositivos probados de esta clase eran mejores, 6% similares, 23% peores
» El mejor tuvo un delta de 6%, la media fue 18%, el peor fue ###max##%
En comparación con todos los dispositivos probados
» 52% de todos los dispositivos probados eran mejores, 8% similares, 40% peores
» El mejor tuvo un delta de 4%, la media fue 23%, el peor fue ###max##%
Gestión de la energía - El Medion X20 ofrece una escasa autonomía
Consumo de energía
El portátil Medion no muestra ninguna anomalía en términos de consumo de energía. Las tasas están en un nivel normal para el hardware instalado. La prueba Witcher 3 y la prueba de estrés se ejecutaron con tasas de consumo de energía relativamente constantes. Por tanto, la fuente de alimentación (330 vatios) está suficientemente dimensionada.
| Off / Standby | |
| Ocioso | |
| Carga |
|
Clave:
min: | |
| Medion Erazer Major X20 i9-13900HX, GeForce RTX 4070 Laptop GPU | Aorus 15X ASF i7-13700HX, GeForce RTX 4070 Laptop GPU | Razer Blade 15 OLED (Early 2022) i9-12900H, GeForce RTX 3070 Ti Laptop GPU | Asus ROG Strix G17 G713PI R9 7945HX, GeForce RTX 4070 Laptop GPU | Medio NVIDIA GeForce RTX 4070 Laptop GPU | Media de la clase Gaming | |
|---|---|---|---|---|---|---|
| Power Consumption | 7% | -46% | -6% | 6% | 0% | |
| Idle Minimum * (Watt) | 12 | 11 8% | 31.6 -163% | 15 -25% | 13.2 ? -10% | 13 ? -8% |
| Idle Average * (Watt) | 16 | 16 -0% | 33.3 -108% | 20 -25% | 18.2 ? -14% | 19 ? -19% |
| Idle Maximum * (Watt) | 26 | 24 8% | 38.6 -48% | 29 -12% | 24.6 ? 5% | 24.6 ? 5% |
| Load Average * (Watt) | 115 | 104 10% | 149 -30% | 121 -5% | 97 ? 16% | 110.7 ? 4% |
| Witcher 3 ultra * (Watt) | 191.6 | 185.4 3% | 149.6 22% | 179.8 6% | ||
| Load Maximum * (Watt) | 319 | 272 15% | 160 50% | 246 23% | 221 ? 31% | 259 ? 19% |
* ... más pequeño es mejor
Energieaufnahme Witcher 3 / Stresstest
Power consumption with an external monitor
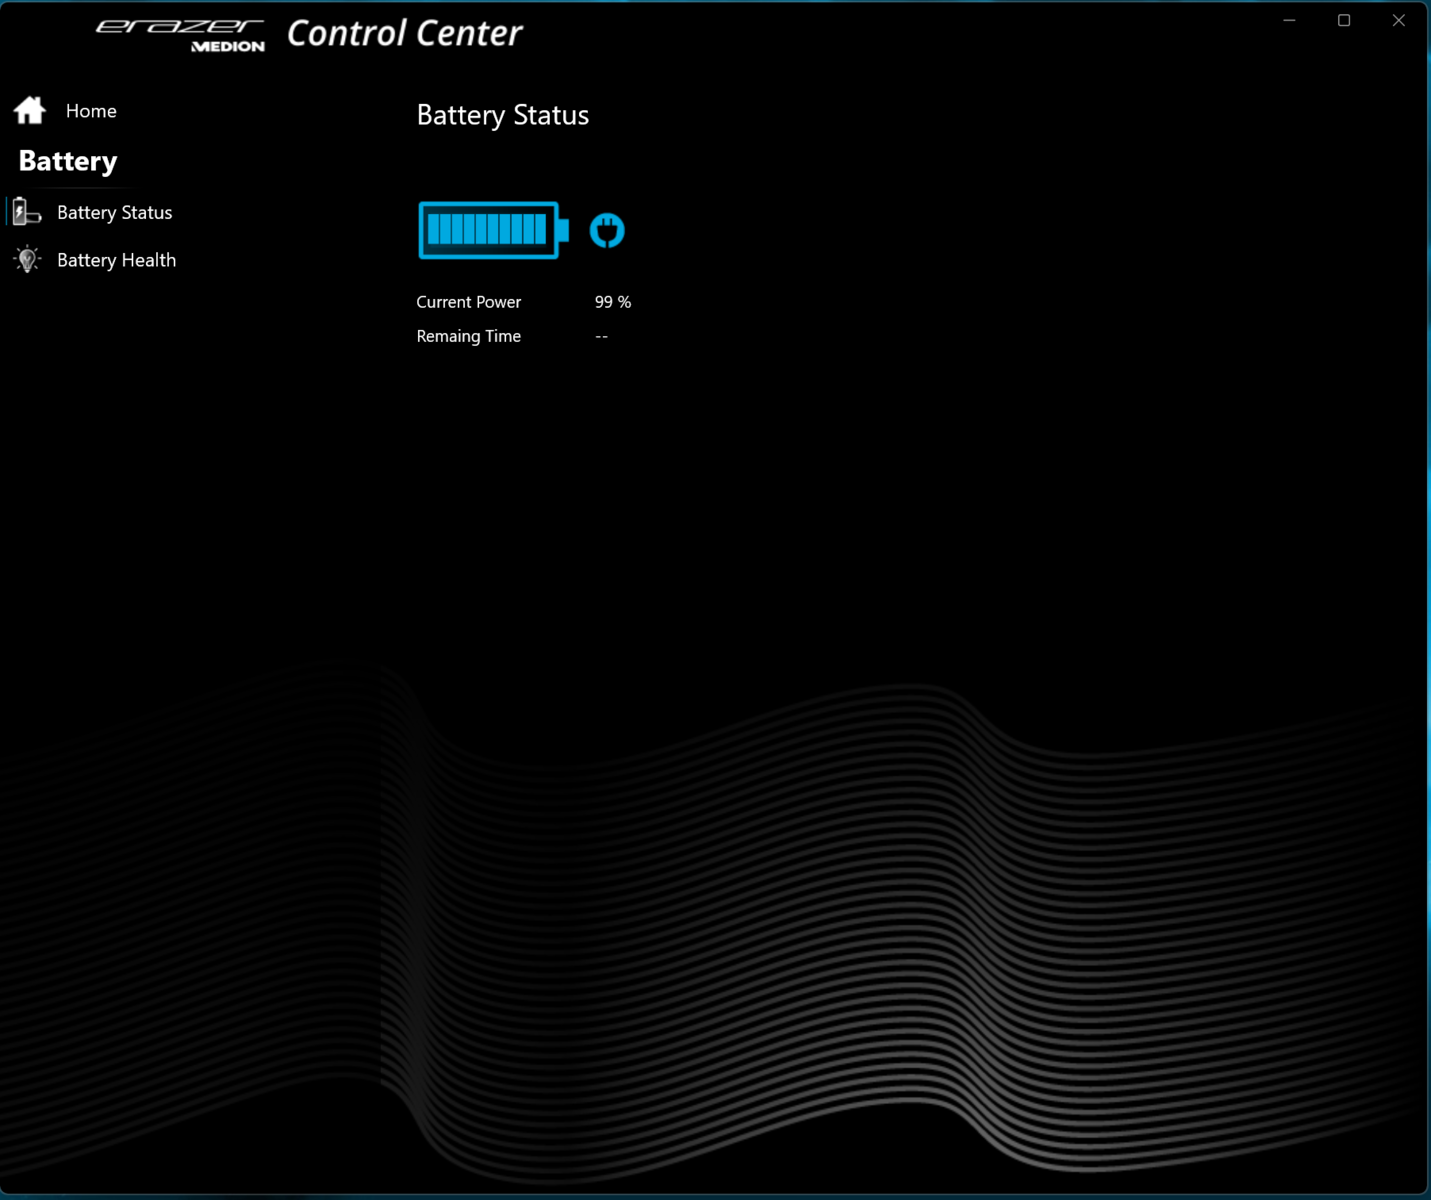
Duración de la batería
En la prueba WLAN, el portátil de 16 pulgadas logra tiempos de ejecución de 3:52 h y 4:12 h (carga de sitios web usando un script) y prueba de vídeo (cortometraje Big Buck Bunny, codificación H.264, FHD, en bucle), respectivamente. Las funciones de ahorro de energía del portátil se desactivaron durante ambas pruebas y el brillo de la pantalla se ajustó a unos 150 cd/m². Los módulos de radio también se desactivaron para la prueba de vídeo.
La duración general por debajo de la media se debe a la baja capacidad de la batería (62.3 Wh) para un portátil de juegos. Habría sido posible más con la batería de 80 Wh del predecesor.
| Medion Erazer Major X20 i9-13900HX, GeForce RTX 4070 Laptop GPU, 62.3 Wh | Aorus 15X ASF i7-13700HX, GeForce RTX 4070 Laptop GPU, 99 Wh | Razer Blade 15 OLED (Early 2022) i9-12900H, GeForce RTX 3070 Ti Laptop GPU, 80 Wh | Asus ROG Strix G17 G713PI R9 7945HX, GeForce RTX 4070 Laptop GPU, 90 Wh | Media de la clase Gaming | |
|---|---|---|---|---|---|
| Duración de Batería | 80% | 26% | -20% | 54% | |
| Reader / Idle (h) | 5.8 | 11.3 95% | 6.7 16% | 8.27 ? 43% | |
| H.264 (h) | 4.2 | 7.9 88% | 5.9 40% | 2.8 -33% | 8.32 ? 98% |
| WiFi v1.3 (h) | 3.9 | 8.2 110% | 4.6 18% | 4.3 10% | 7.11 ? 82% |
| Load (h) | 1.6 | 2 25% | 2.1 31% | 1 -37% | 1.502 ? -6% |
| Witcher 3 ultra (h) | 1.1 |
Pro
Contra
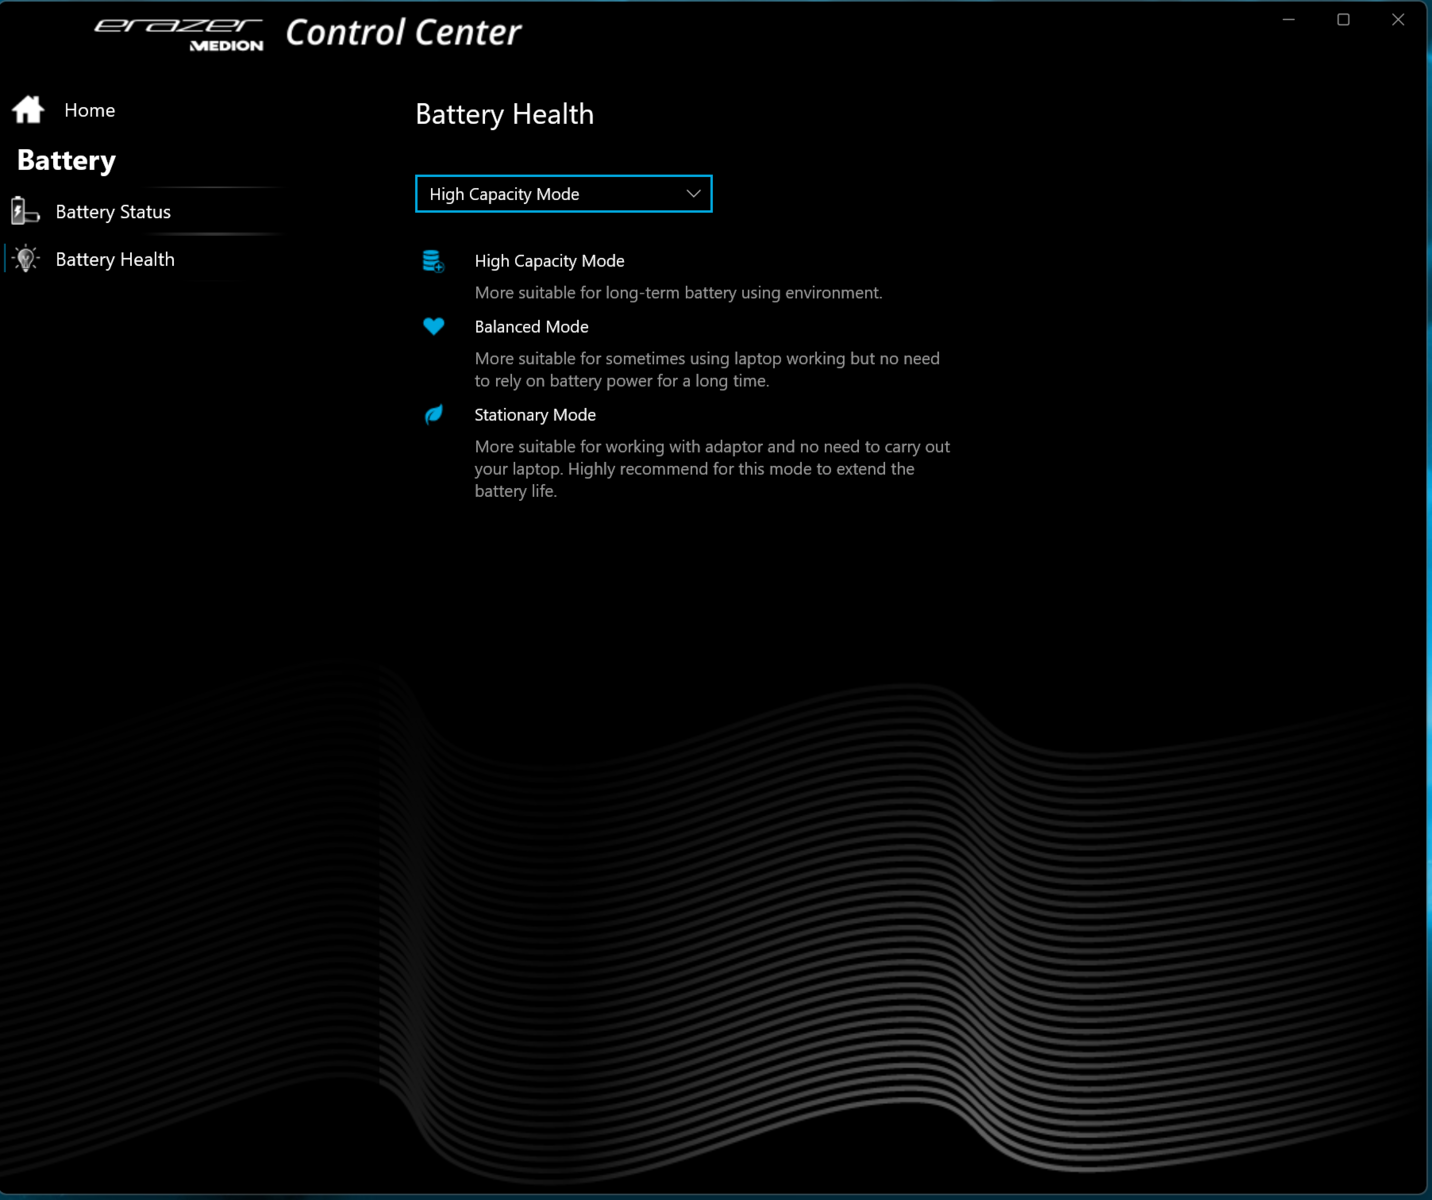
Veredicto: Mucho equipamiento
Este potente portátil permite jugar en QHD+, pero también brilla en otras áreas. A Core i9-13900HX y una GeForce RTX 4070 funcionan a frecuencias consistentemente altas, dos SSDs de 1 TB aseguran tiempos de carga cortos y suficiente espacio de almacenamiento. El ruido y el desarrollo de calor están en el rango alto, típico para esta clase de portátil.
En el Erazer Major X20, Medion presenta un portátil de juego de gama media bien equipado sin debilidades graves.
El teclado chiclet del modelo anterior ha dado paso a un modelo mecánico (interruptores Cherry MX, iluminación individual de teclas RGB), una mejora significativa. Los usuarios no familiarizados con este tipo de teclado descubrirán una nueva experiencia de escritura.
La pantalla mate de 16 pulgadas (QHD+, IPS, 240 Hz, G-Sync, sRGB) en un formato 16:10 que facilita el trabajo da una buena impresión en general. Un puerto Thunderbolt 4 asegura opciones de expansión (GPU externa, solución de anclaje, display), pero no soporta Power Delivery. La duración de la batería tampoco impresiona.
El Aorus 15X ASF es una alternativa con una duración significativamente mejor. Ofrece el mismo rendimiento gráfico que el X20, pero menos CPU.
Precio y disponibilidad
La configuración analizada del Medion Erazer Major X20 aparece en la tienda en línea de Medion a un precio de poco menos de 2.500 euros, pero actualmente está agotada. La disponibilidad del modelo parece limitada fuera de Alemania por el momento.
Medion Erazer Major X20
- 04/20/2023 v7 (old)
Sascha Mölck
Transparencia
La selección de los dispositivos que se van a reseñar corre a cargo de nuestro equipo editorial. La muestra de prueba fue proporcionada al autor en calidad de préstamo por el fabricante o el minorista a los efectos de esta reseña. El prestamista no tuvo ninguna influencia en esta reseña, ni el fabricante recibió una copia de la misma antes de su publicación. No había ninguna obligación de publicar esta reseña. Como empresa de medios independiente, Notebookcheck no está sujeta a la autoridad de fabricantes, minoristas o editores.
Así es como prueba Notebookcheck
Cada año, Notebookcheck revisa de forma independiente cientos de portátiles y smartphones utilizando procedimientos estandarizados para asegurar que todos los resultados son comparables. Hemos desarrollado continuamente nuestros métodos de prueba durante unos 20 años y hemos establecido los estándares de la industria en el proceso. En nuestros laboratorios de pruebas, técnicos y editores experimentados utilizan equipos de medición de alta calidad. Estas pruebas implican un proceso de validación en varias fases. Nuestro complejo sistema de clasificación se basa en cientos de mediciones y puntos de referencia bien fundamentados, lo que mantiene la objetividad.Price comparison

