Análisis del portátil MSI Pulse GL76: 105 W TGP GeForce gráficos RTX 3070
El Pulse GL76 es un portátil para juegos de gama media de MSI, entre las series Katana o Sword, más baratas, y las series GE Raider o GT Titan, más caras. Es esencialmente la versión de 17,3 pulgadas del más pequeño de 15,6 pulgadas Pulse GL66. Los modelos GL76 de 2021 y 2022 tienen chasis de idéntico diseño.
Nuestra unidad de análisis es una configuración de gama alta con la CPU Core i7-12700H de 12ª generación, GPU GeForce RTX 3070 de 105 W y pantalla IPS 1080p de 360 Hz por unos 1.300 dólares al por menor. Hay otras versiones disponibles con frecuencias de actualización de pantalla más lentas, GPU GeForce RTX 3050/3050 Ti/3060 o CPU Core i5-12500H.
Entre los competidores del Pulse GL76 se incluyen otros portátiles para juegos de 17,3 pulgadas de gama media como el Acer Nitro 5, La serie TUF de Asus, La serie HP Victuso la serie Serie G de Dell.
Más opiniones sobre MSI:
Posibles contendientes en la comparación
Valoración | Fecha | Modelo | Peso | Altura | Tamaño | Resolución | Precio |
|---|---|---|---|---|---|---|---|
| 83.2 % v7 (old) | 01/2023 | MSI Pulse GL76 12UGK i7-12700H, GeForce RTX 3070 Laptop GPU | 2.6 kg | 24.2 mm | 17.30" | 1920x1080 | |
| 86.1 % v7 (old) | 01/2023 | Alienware m17 R5 (R9 6900HX, RX 6850M XT) R9 6900HX, Radeon RX 6850M XT | 3.4 kg | 26.7 mm | 17.00" | 3840x2160 | |
| 86.9 % v7 (old) | 11/2022 | Asus ROG Strix Scar 17 SE G733CX-LL014W i9-12950HX, GeForce RTX 3080 Ti Laptop GPU | 2.9 kg | 28.3 mm | 17.30" | 2560x1440 | |
| 86.5 % v7 (old) | 11/2022 | Acer Predator Helios 300 (i7-12700H, RTX 3070 Ti) i7-12700H, GeForce RTX 3070 Ti Laptop GPU | 3 kg | 27.65 mm | 17.30" | 2560x1440 | |
| 89.9 % v7 (old) | 07/2022 | Razer Blade 17 Early 2022 i9-12900H, GeForce RTX 3080 Ti Laptop GPU | 2.8 kg | 19.9 mm | 17.30" | 3840x2160 | |
| 86.7 % v7 (old) | 05/2022 | MSI Vector GP76 12UGS-434 i7-12700H, GeForce RTX 3070 Ti Laptop GPU | 2.9 kg | 25.9 mm | 17.30" | 1920x1080 |
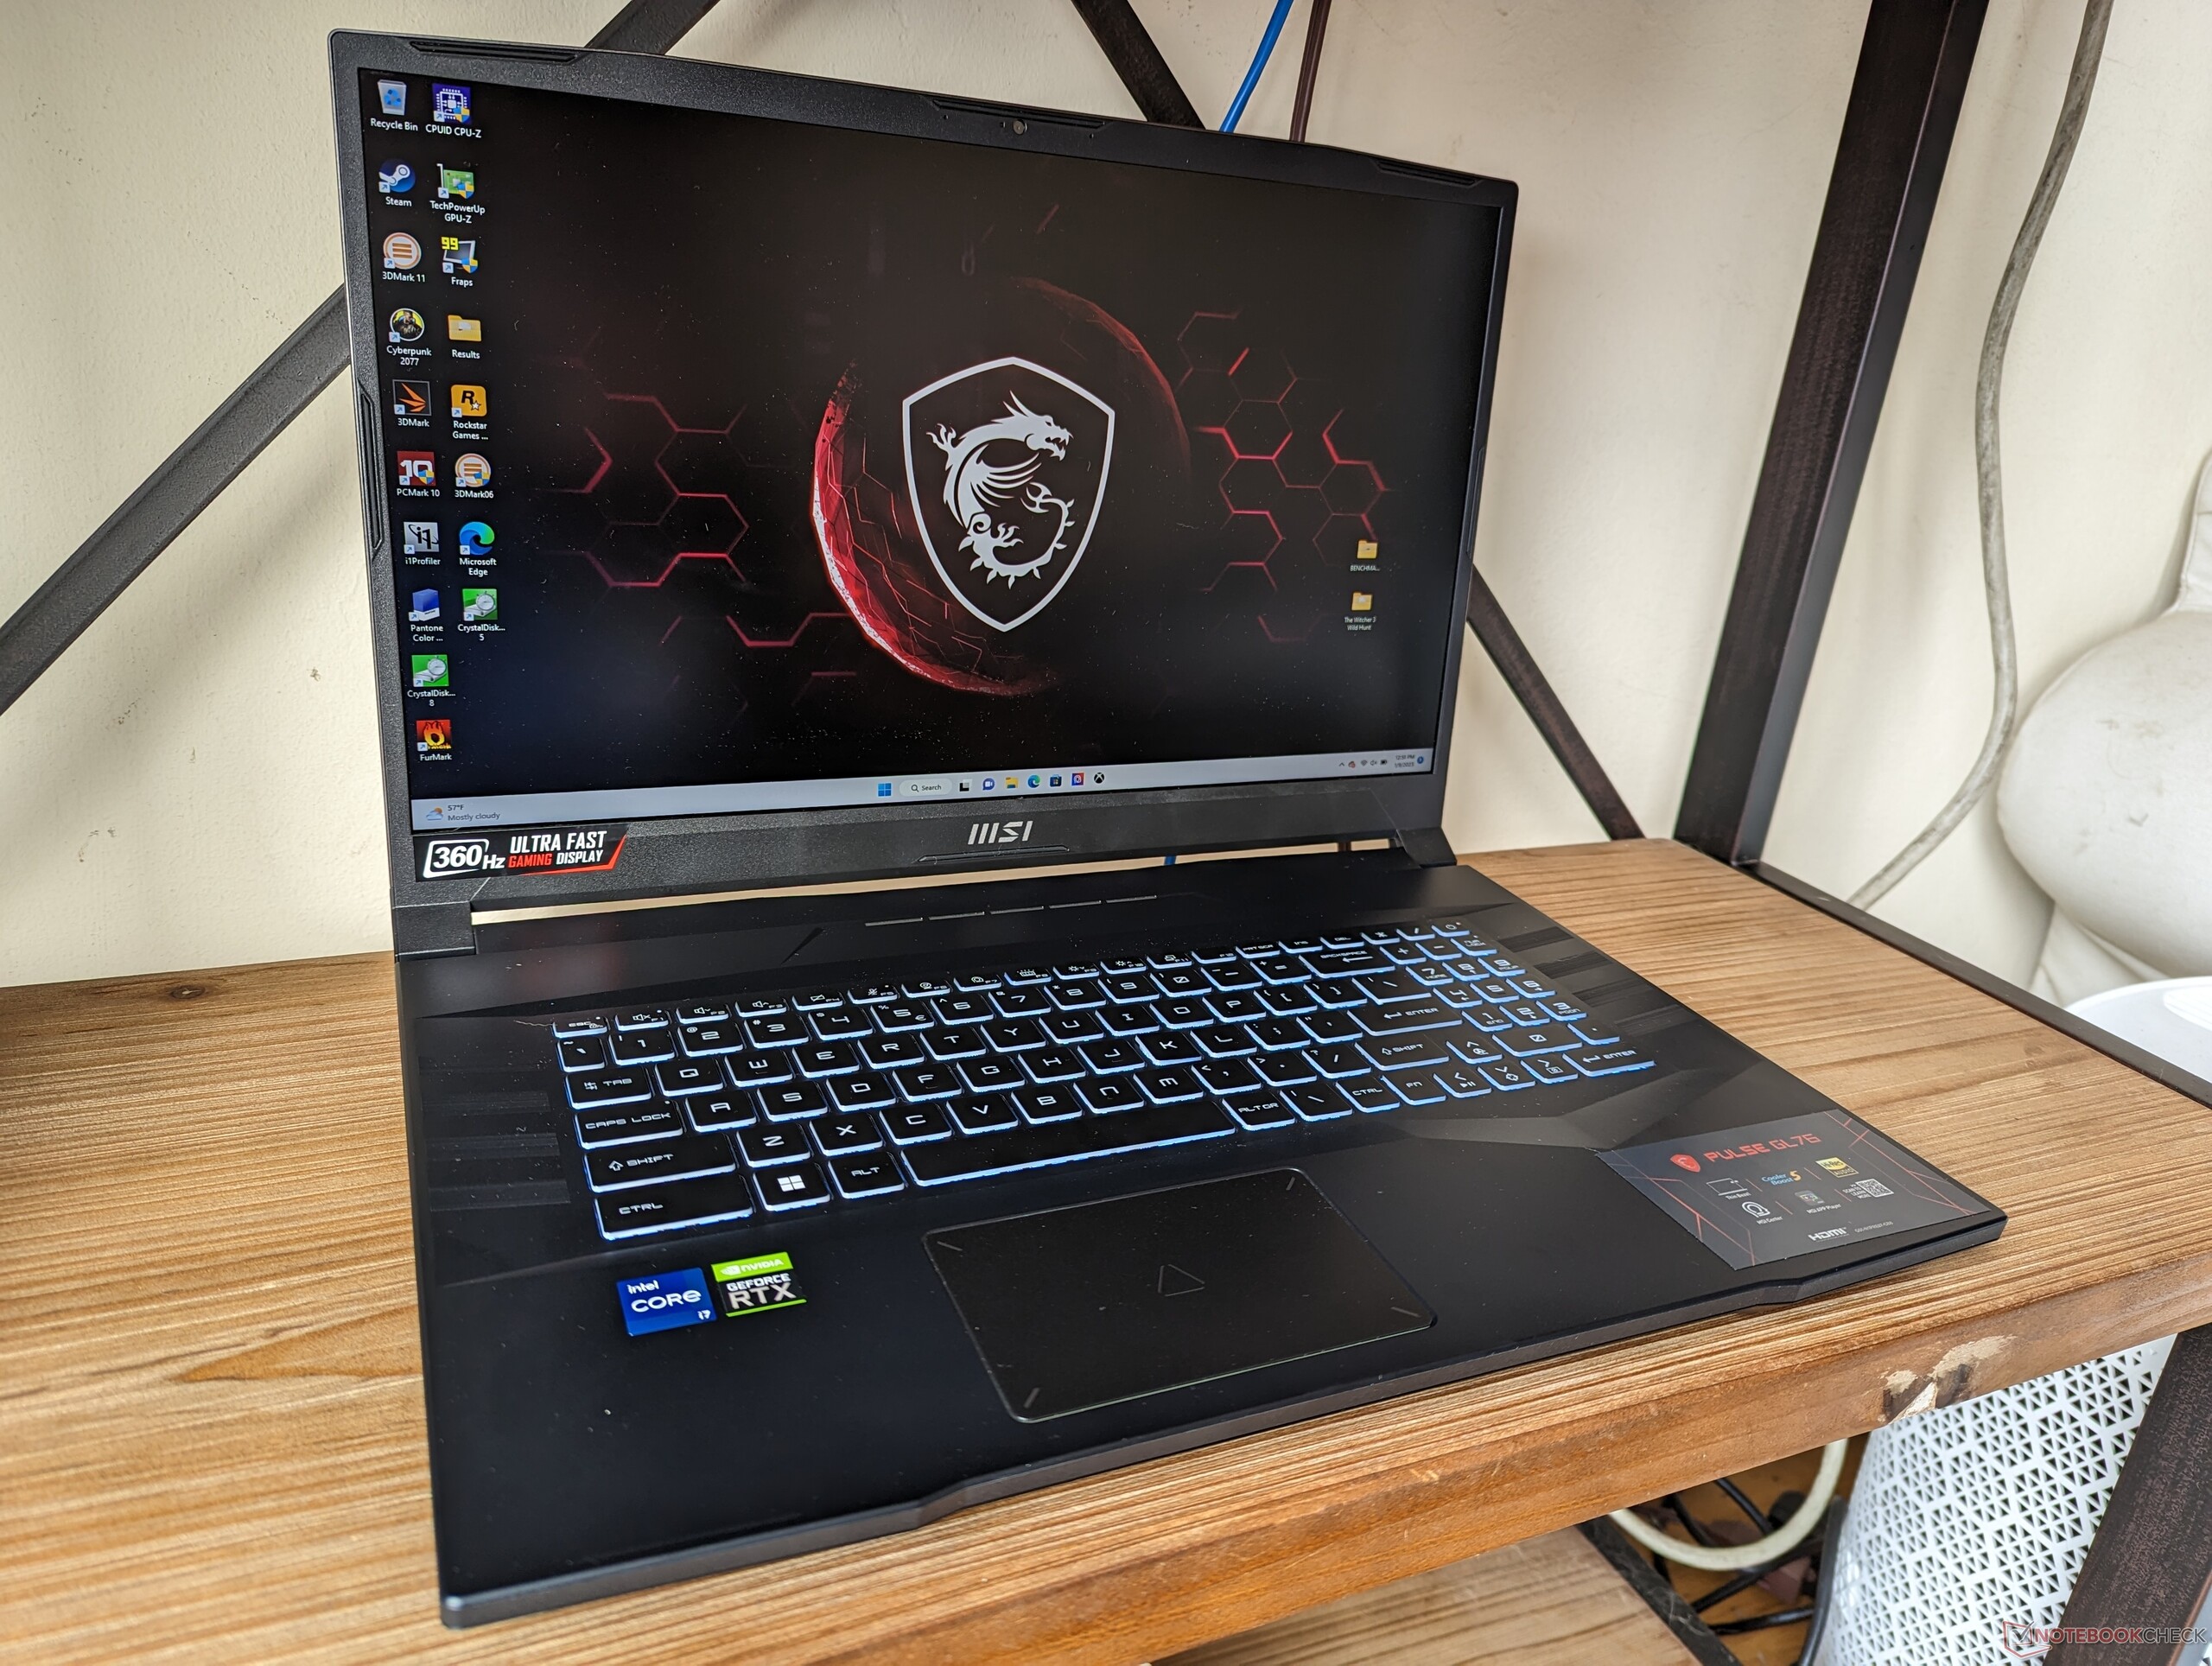
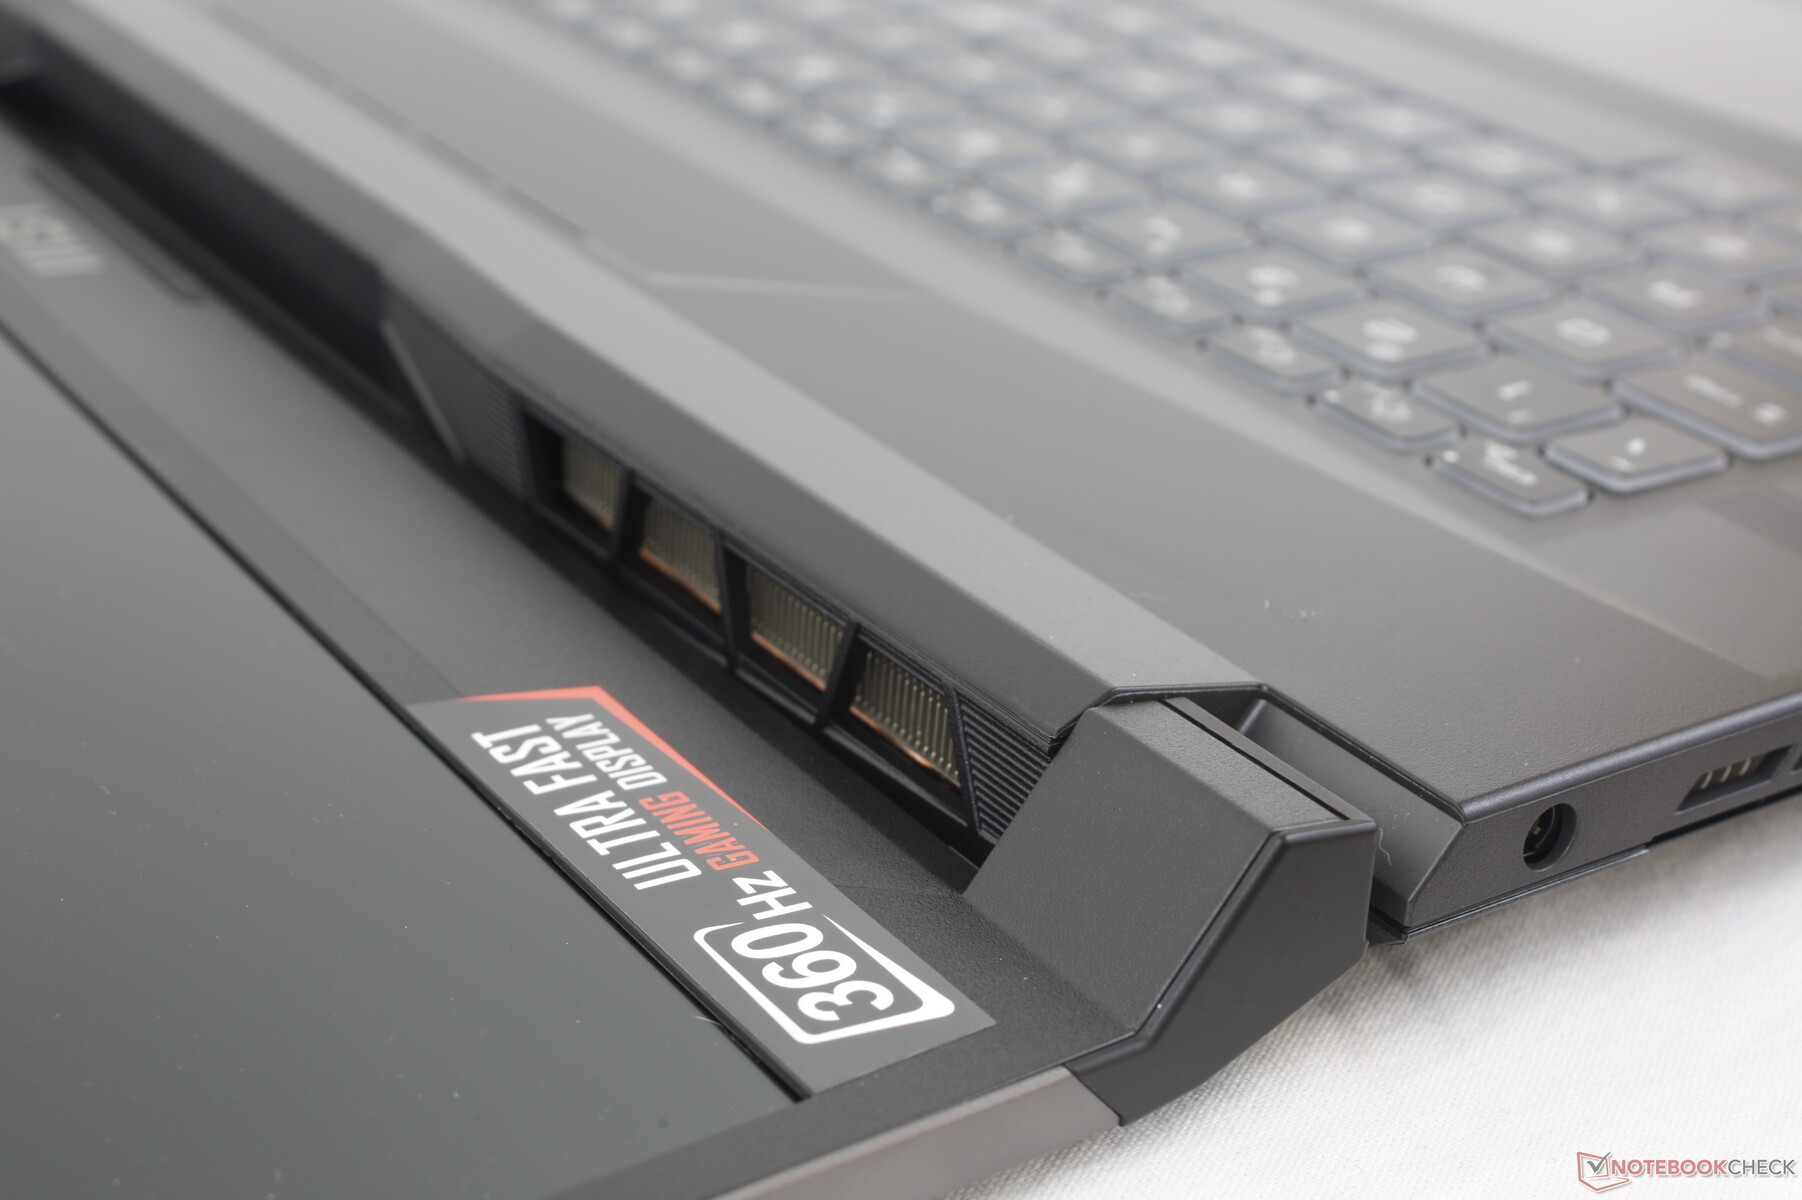
Estuche - Sin colores extravagantes ni LED
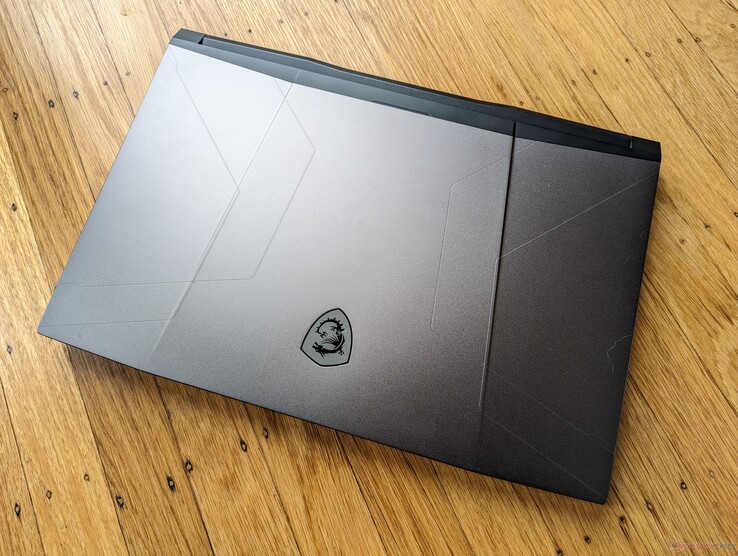
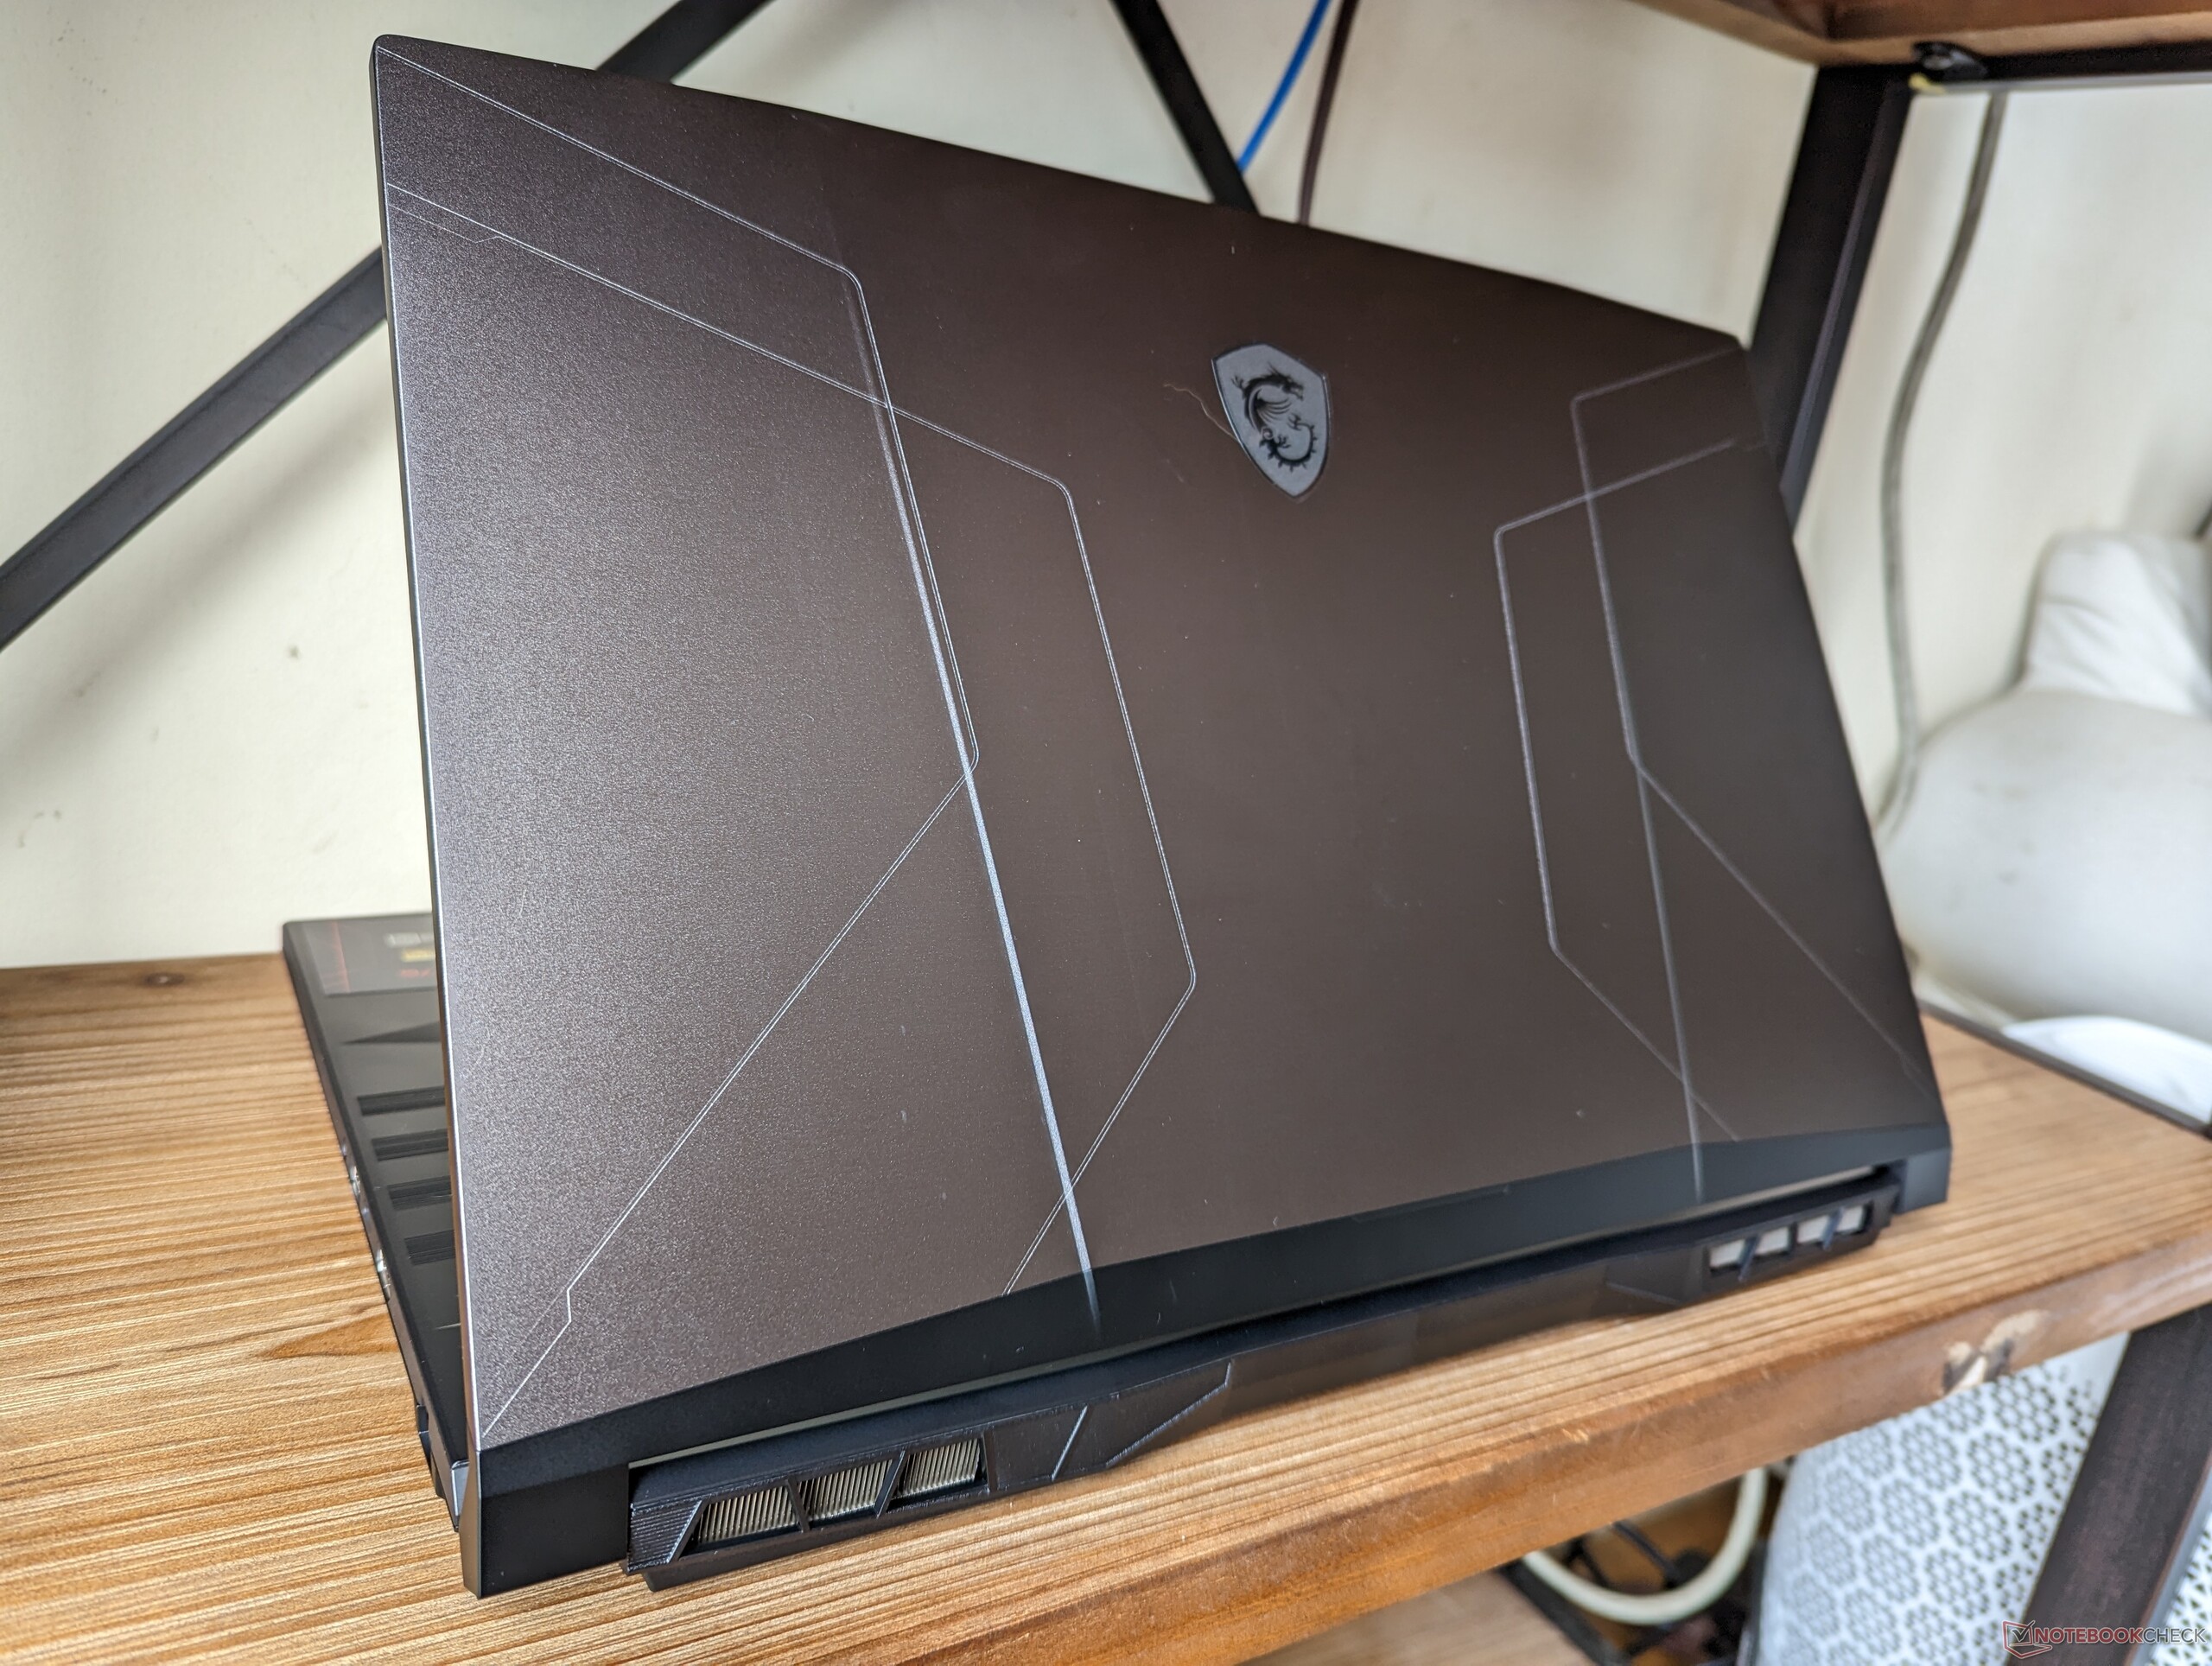
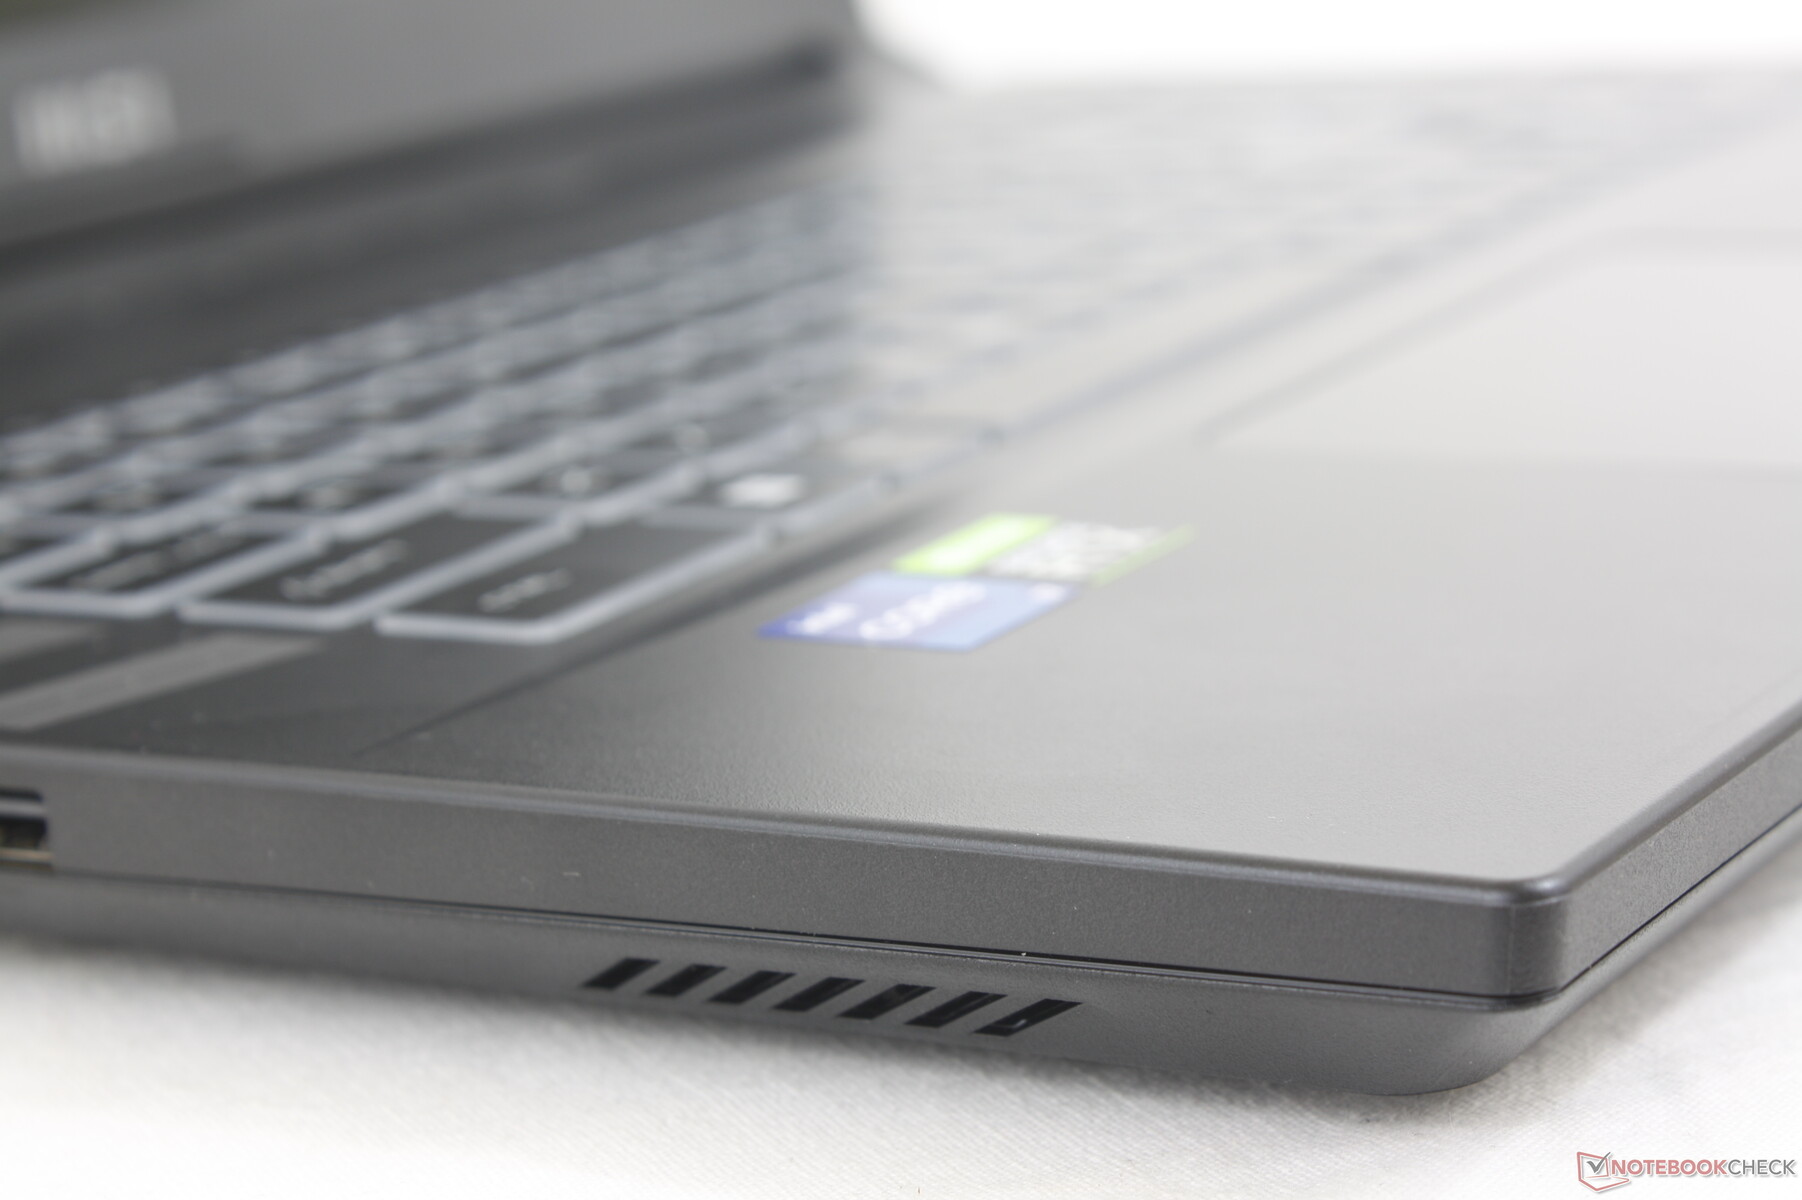
El chasis es mayoritariamente de plástico, como en todos los portátiles para juegos de gama media y económica de MSI. Carece de los toques lujosos, los LED llamativos y el tacto más suave de modelos de gama más alta como el MSI GE77 o el Razer Blade 17 para una impresión más sosa. Esto no debería sorprender, ya que la apariencia es una de las primeras cosas que se reducen al recortar costes en los modelos de juego de gama media.
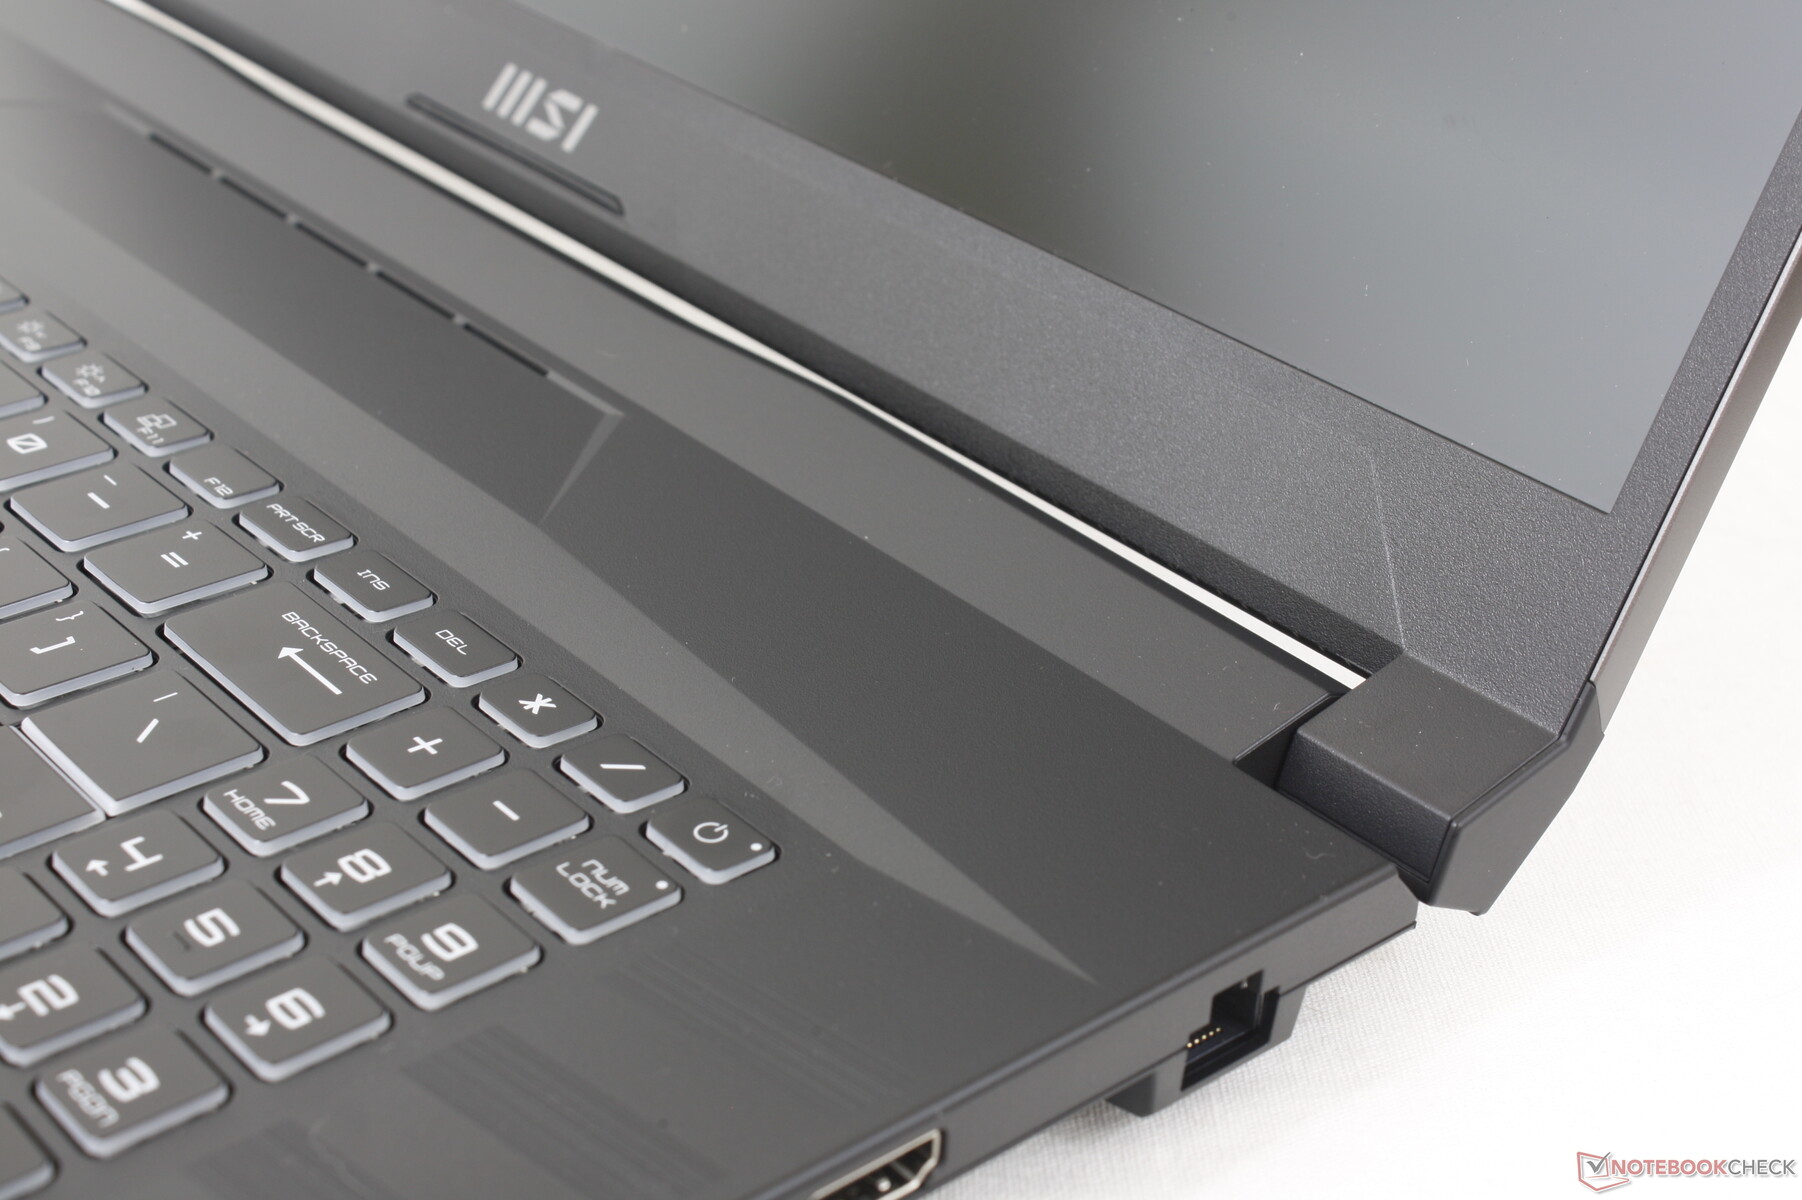
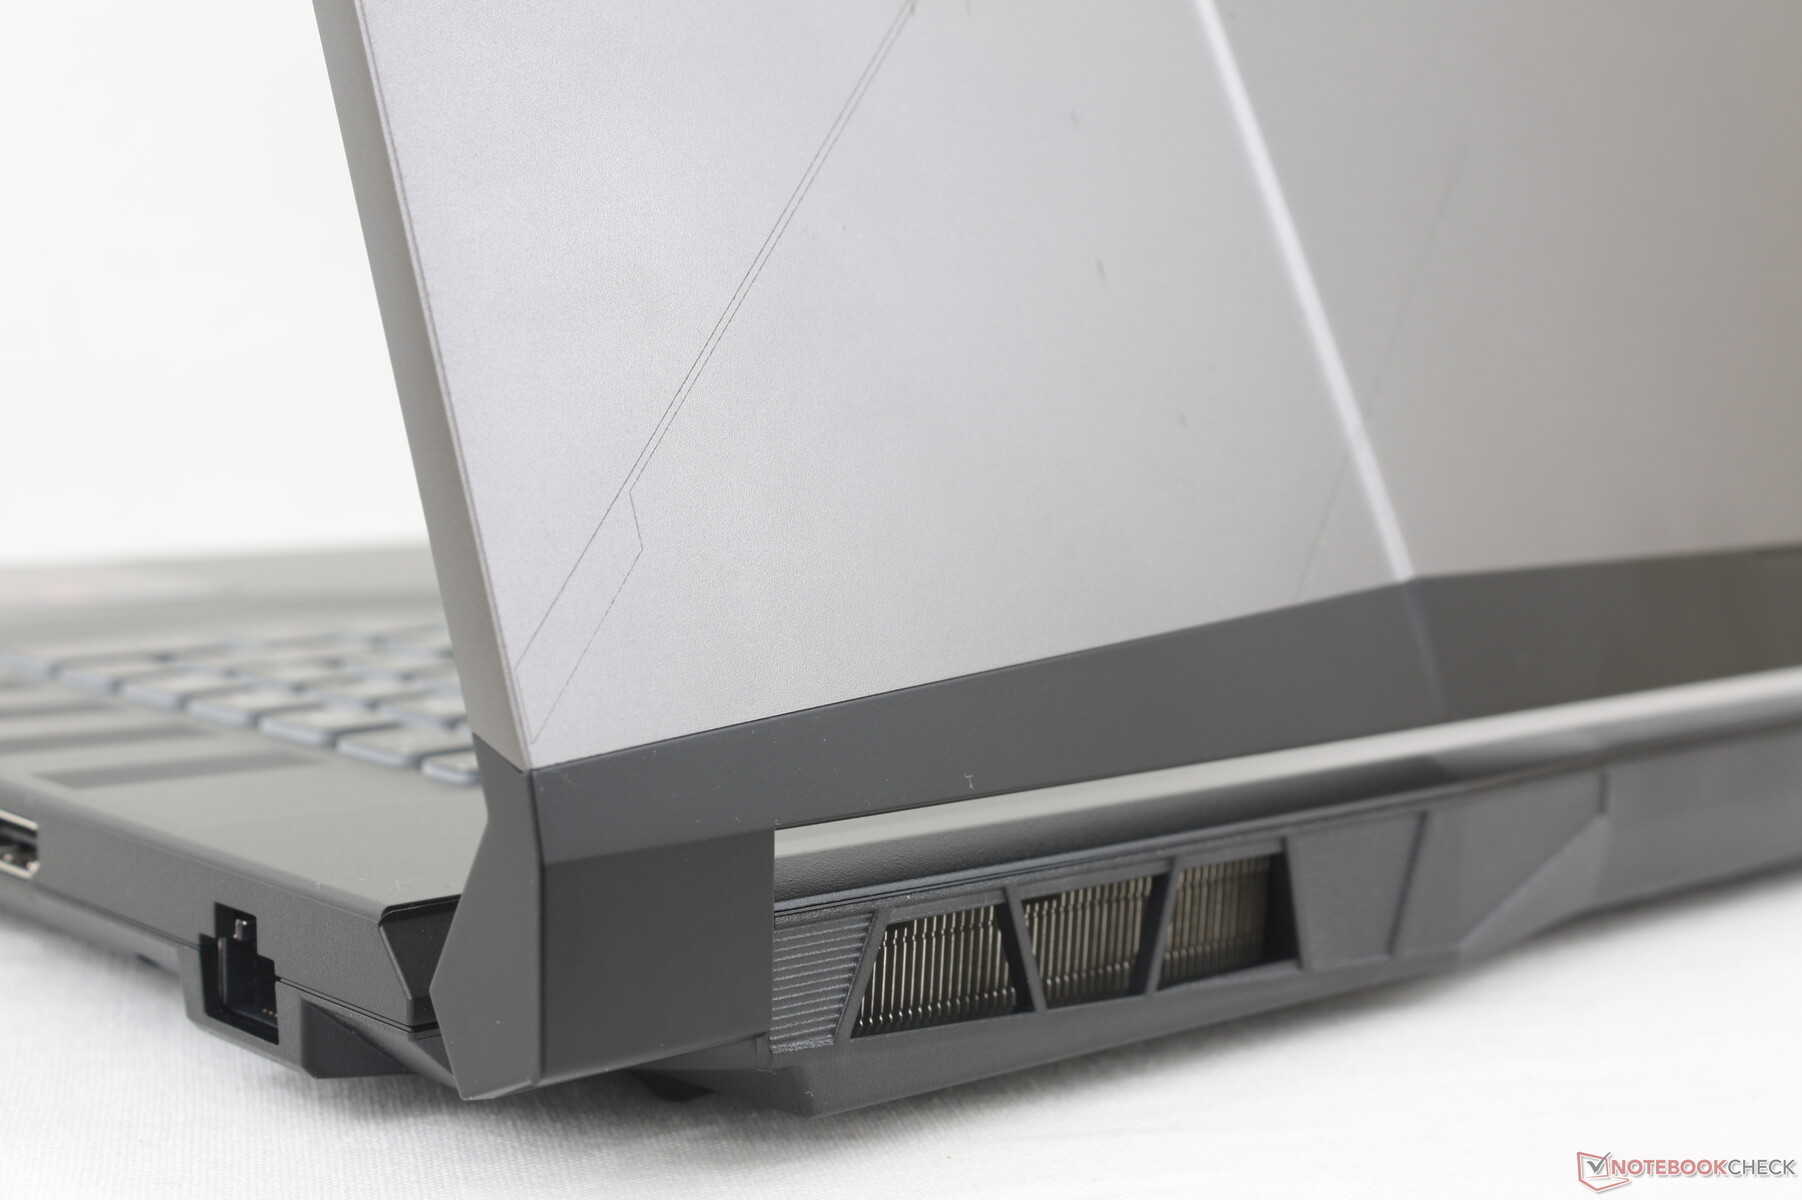
Afortunadamente, la rigidez del chasis no se ve comprometida. Aunque las superficies de plástico parecen más baratas al tacto que en un modelo GE, GS o GT, son bastante robustas y resistentes a las torsiones o depresiones, incluso en el centro del teclado o en la tapa exterior. Tampoco hay grandes problemas de crujidos. Sin embargo, las bisagras podrían haber sido más rígidas en ángulos más amplios para una mejor sensación de longevidad.
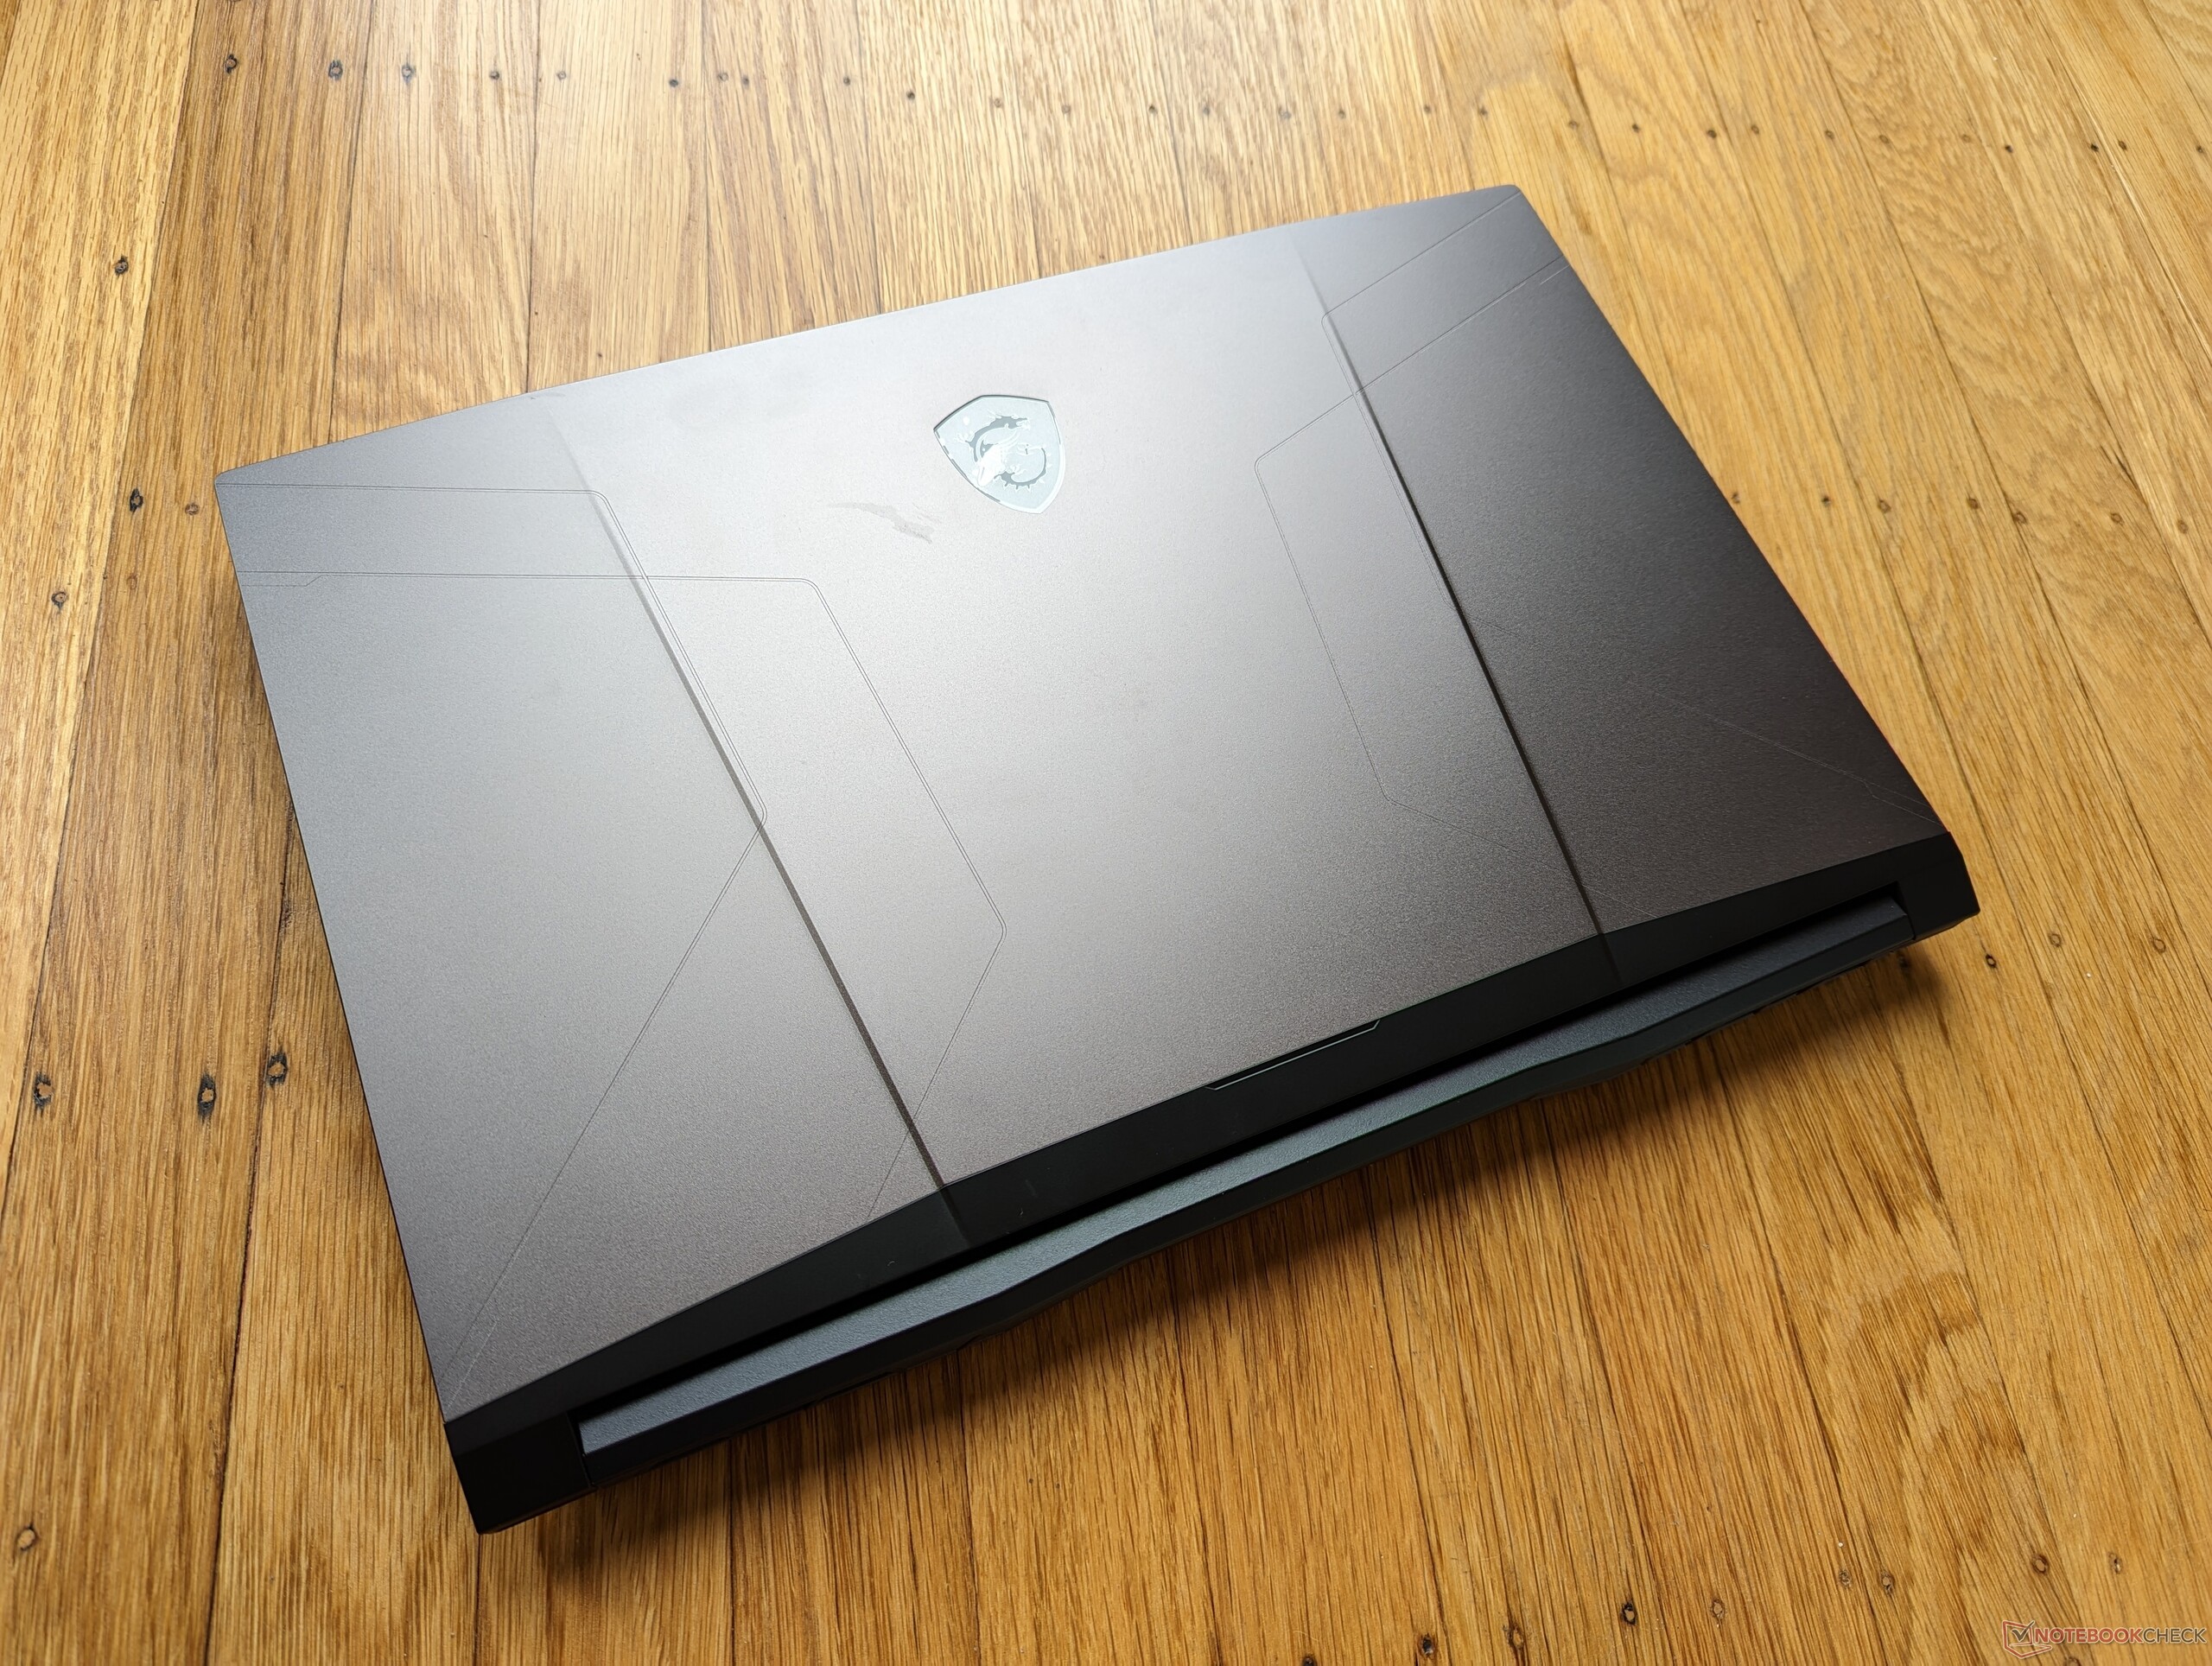
El sistema es más ligero de lo esperado, especialmente para un portátil de juegos de 17,3 pulgadas. Con 2,6 kg, es más ligero que el Razer Blade 17, el Asus ROG Strix Scar 17 y elAcer Predator Helios 300 por unos cientos de gramos cada uno. La ventaja de peso se debe probablemente a la notable menor longitud del diseño del chasis GL76. Sin embargo, es un poco más ancho, pero el ahorro de peso compensa la huella ligeramente más larga.
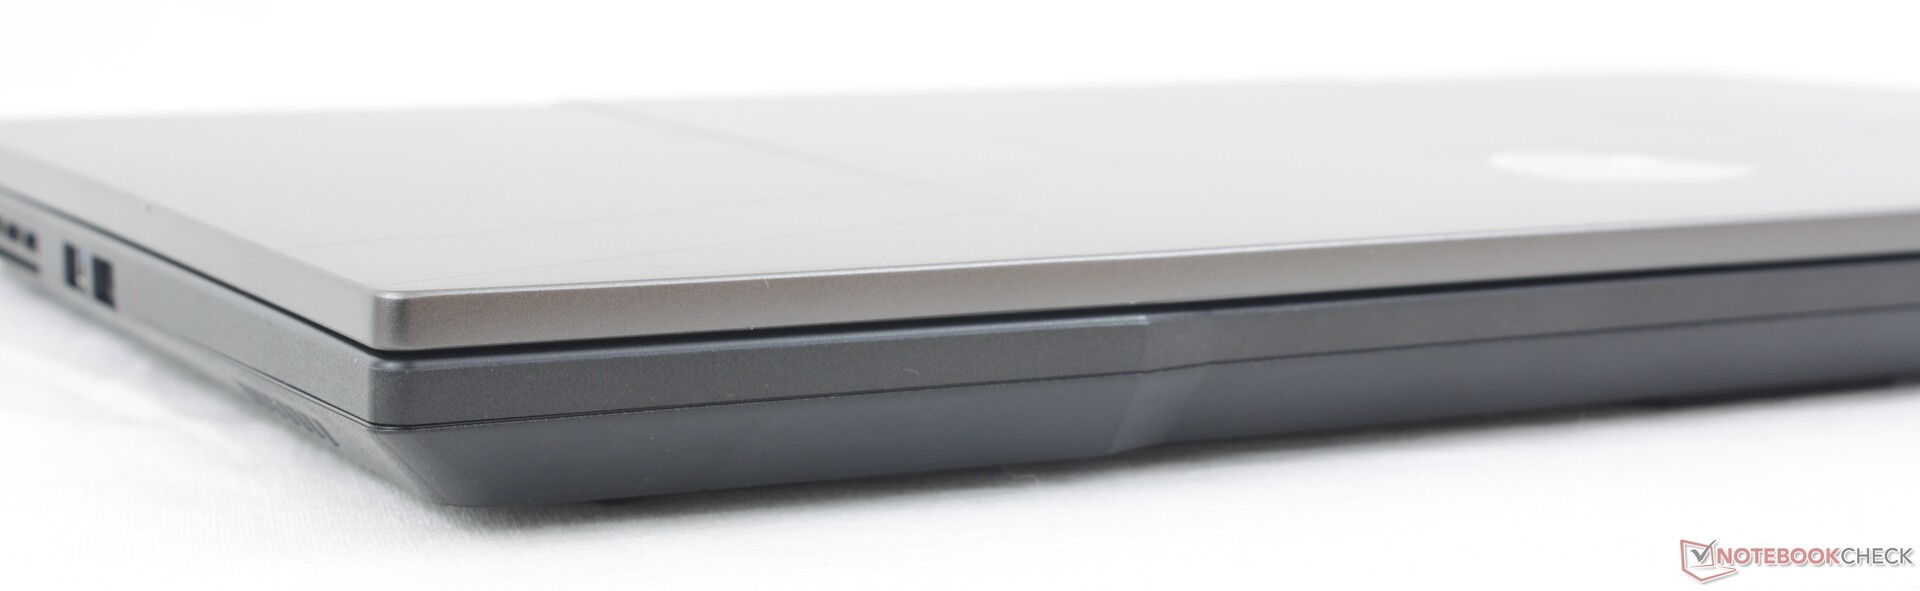
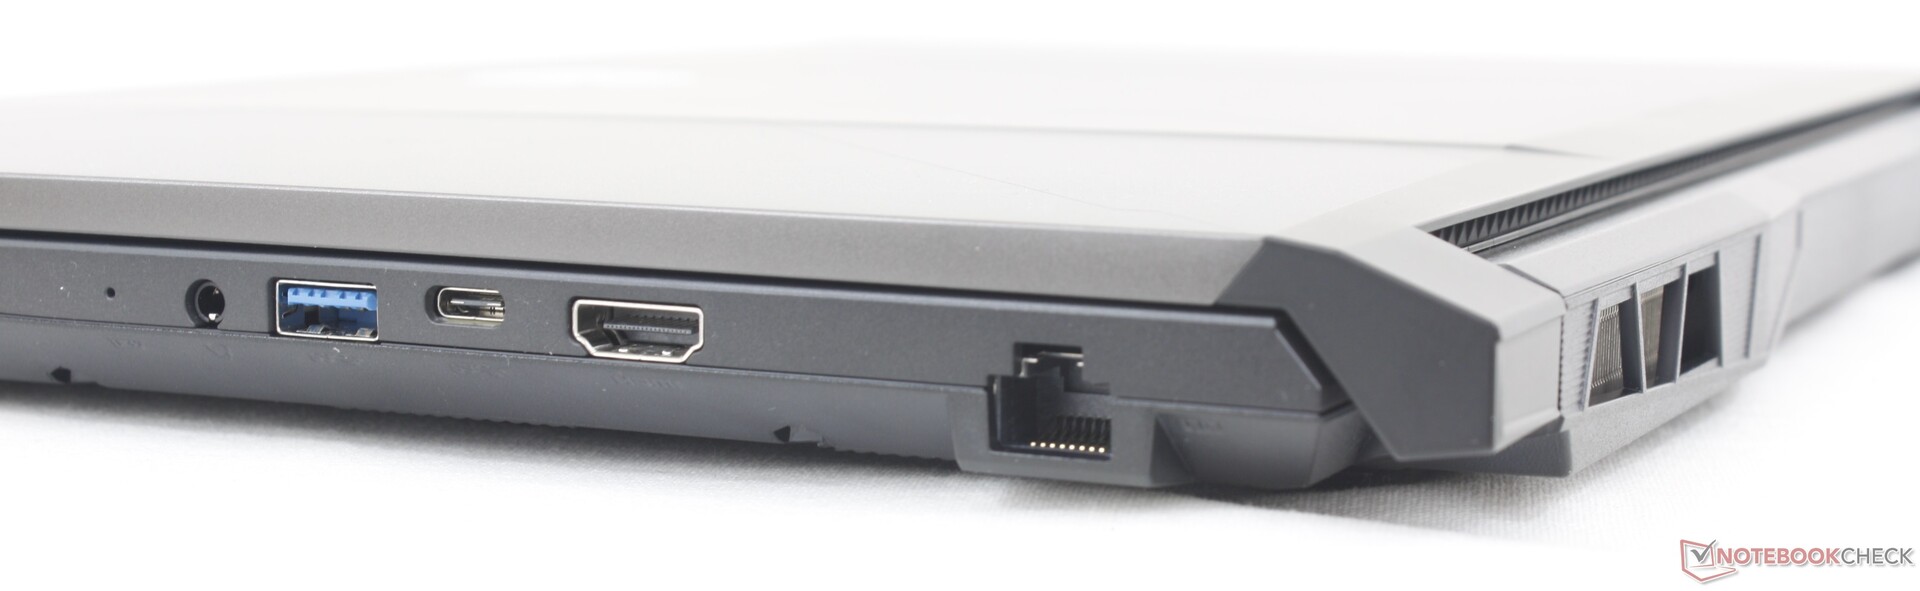
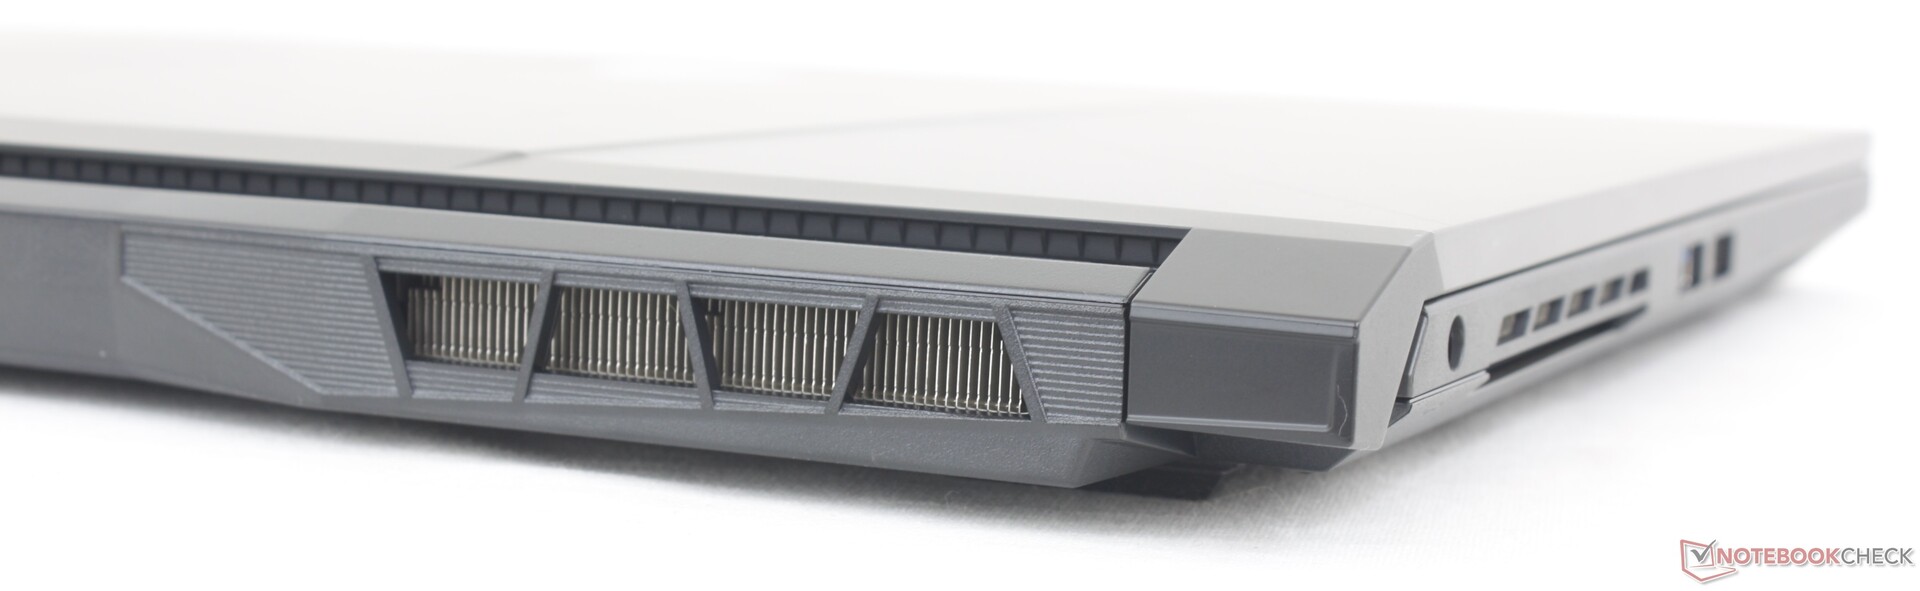
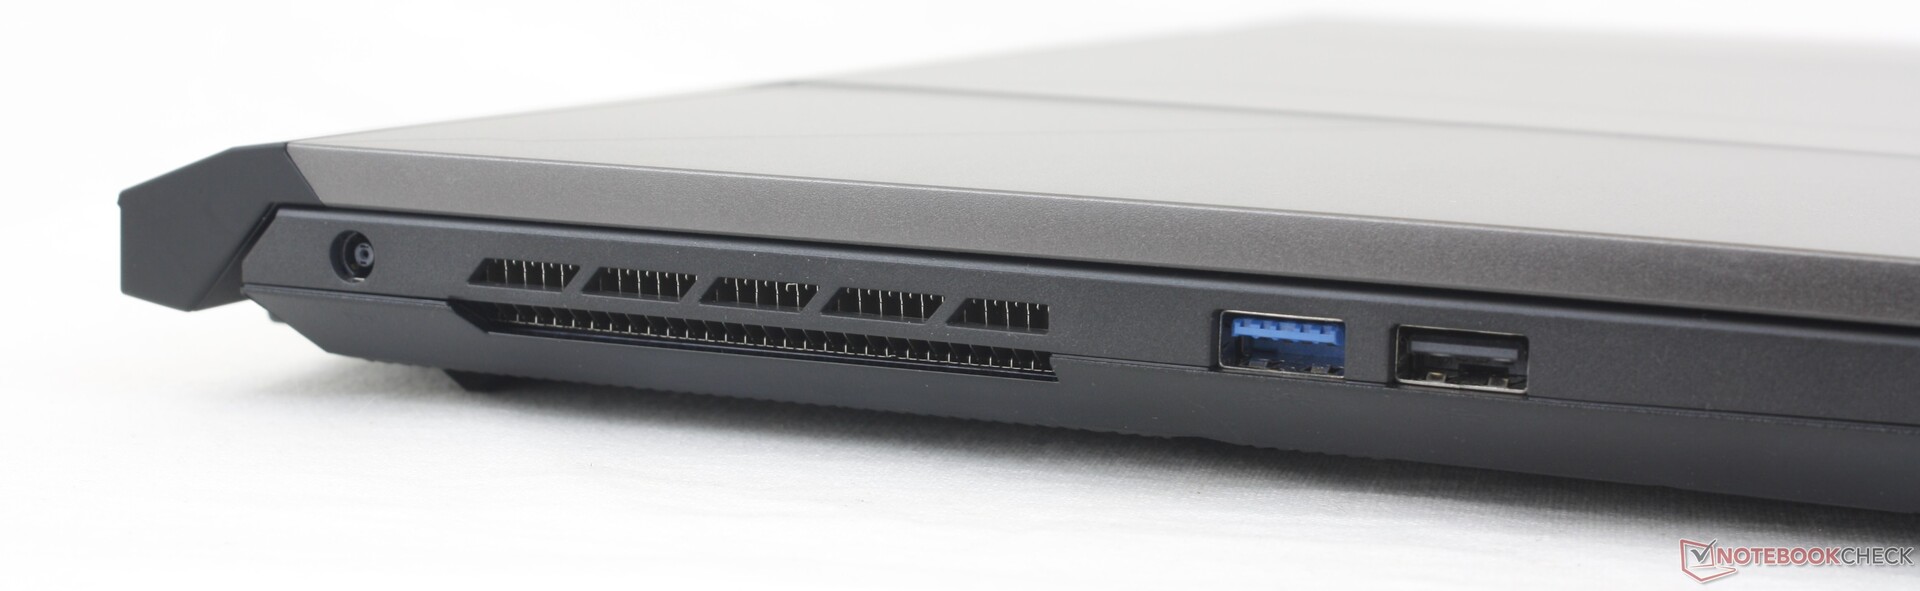
Conectividad - Limitada para el tamaño
Las opciones de puertos son más limitadas en comparación con otros portátiles para juegos de gama media como el Dell G16acer Nitro 5, o Asus TUF G17. La omisión más importante aquí es la falta de soporte Thunderbolt mientras que las tres alternativas mencionadas lo llevan. Esto es probablemente un esfuerzo consciente de MSI para animar a los usuarios a considerar las series GE, GS, o GT de gama alta en su lugar.
DisplayPort sobre USB no es compatible. Nuestra unidad de pruebas no reconoció ninguno de nuestros monitores externos por USB-C.
Comunicación
Un Intel AX201 viene de serie para la conectividad Wi-Fi 6 y Bluetooth 5.2. El Wi-Fi 6E no se incluye para ahorrar costes, pero el usuario final puede actualizarlo sin problemas. El rendimiento sigue siendo estable sin problemas notables cuando se conecta a nuestro router Asus AXE11000.
| Networking | |
| iperf3 transmit AX12 | |
| MSI Vector GP76 12UGS-434 | |
| iperf3 receive AX12 | |
| MSI Vector GP76 12UGS-434 | |
| iperf3 receive AXE11000 6GHz | |
| Asus ROG Strix Scar 17 SE G733CX-LL014W | |
| Acer Predator Helios 300 (i7-12700H, RTX 3070 Ti) | |
| iperf3 receive AXE11000 | |
| Razer Blade 17 Early 2022 | |
| MSI Pulse GL76 12UGK | |
| Alienware m17 R5 (R9 6900HX, RX 6850M XT) | |
| iperf3 transmit AXE11000 | |
| MSI Pulse GL76 12UGK | |
| Alienware m17 R5 (R9 6900HX, RX 6850M XT) | |
| iperf3 transmit AXE11000 6GHz | |
| Asus ROG Strix Scar 17 SE G733CX-LL014W | |
| Acer Predator Helios 300 (i7-12700H, RTX 3070 Ti) | |
Cámara web
La webcam integrada de 720p produce imágenes turbias con colores pobres. Una alternativa sin juegos como el HP Spectre si la calidad de la cámara es importante.
Un interruptor de apagado de cámara digital está ligado a la tecla F7 mientras que Windows Hello no está soportado.


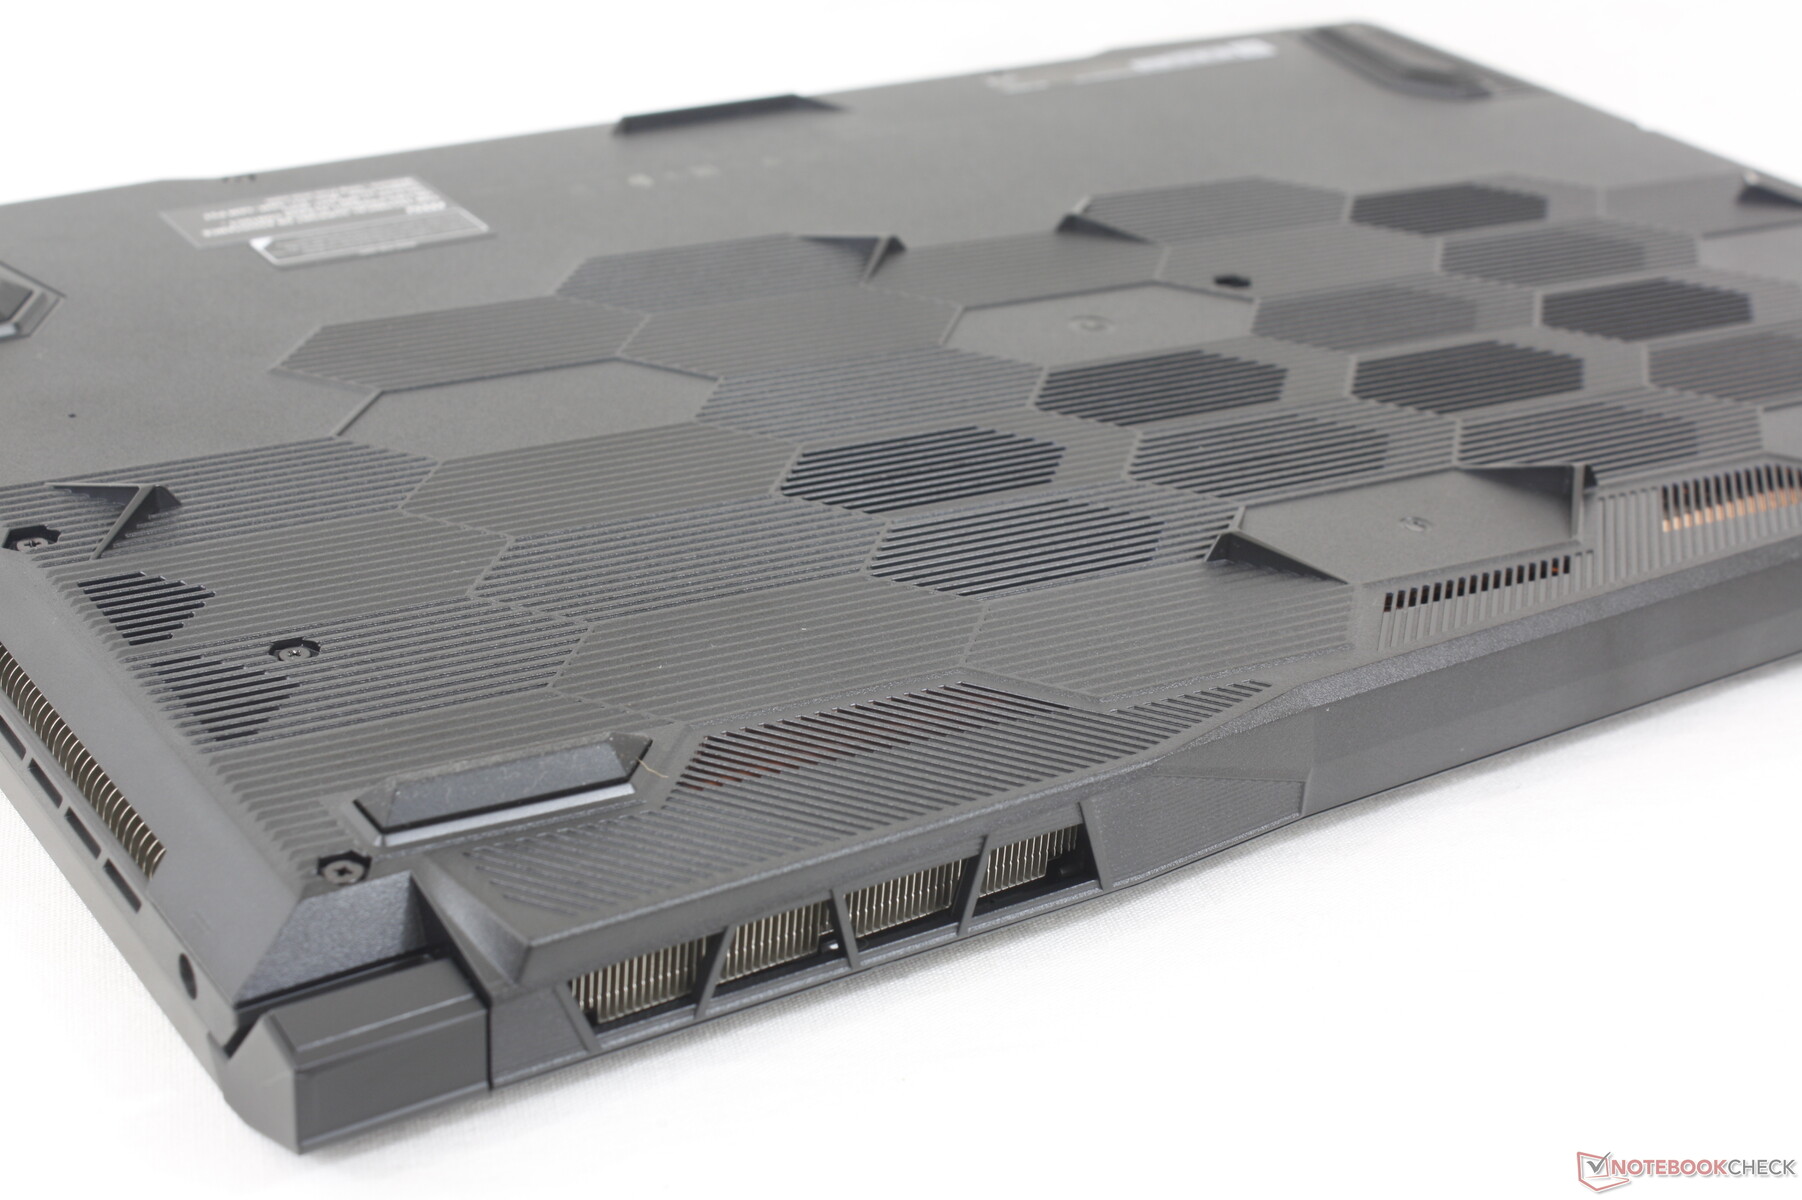
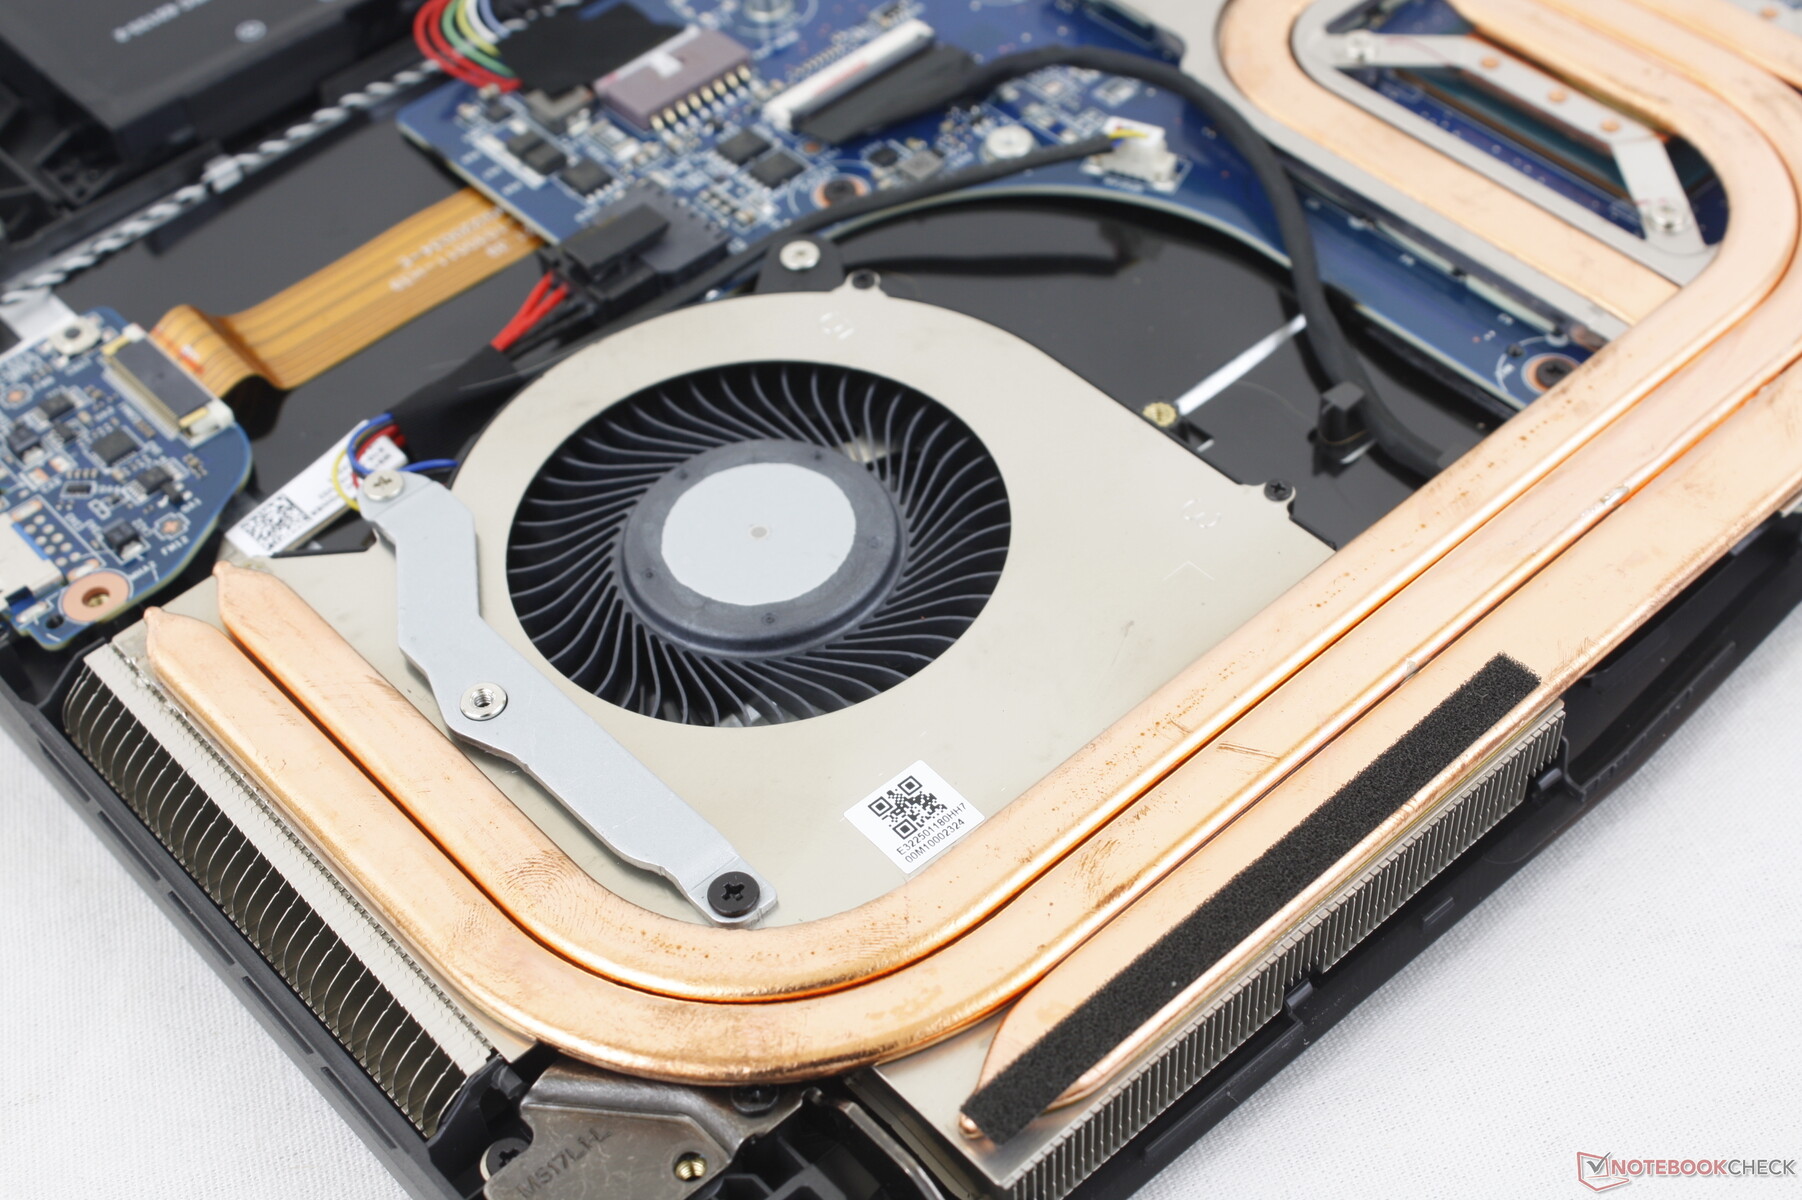
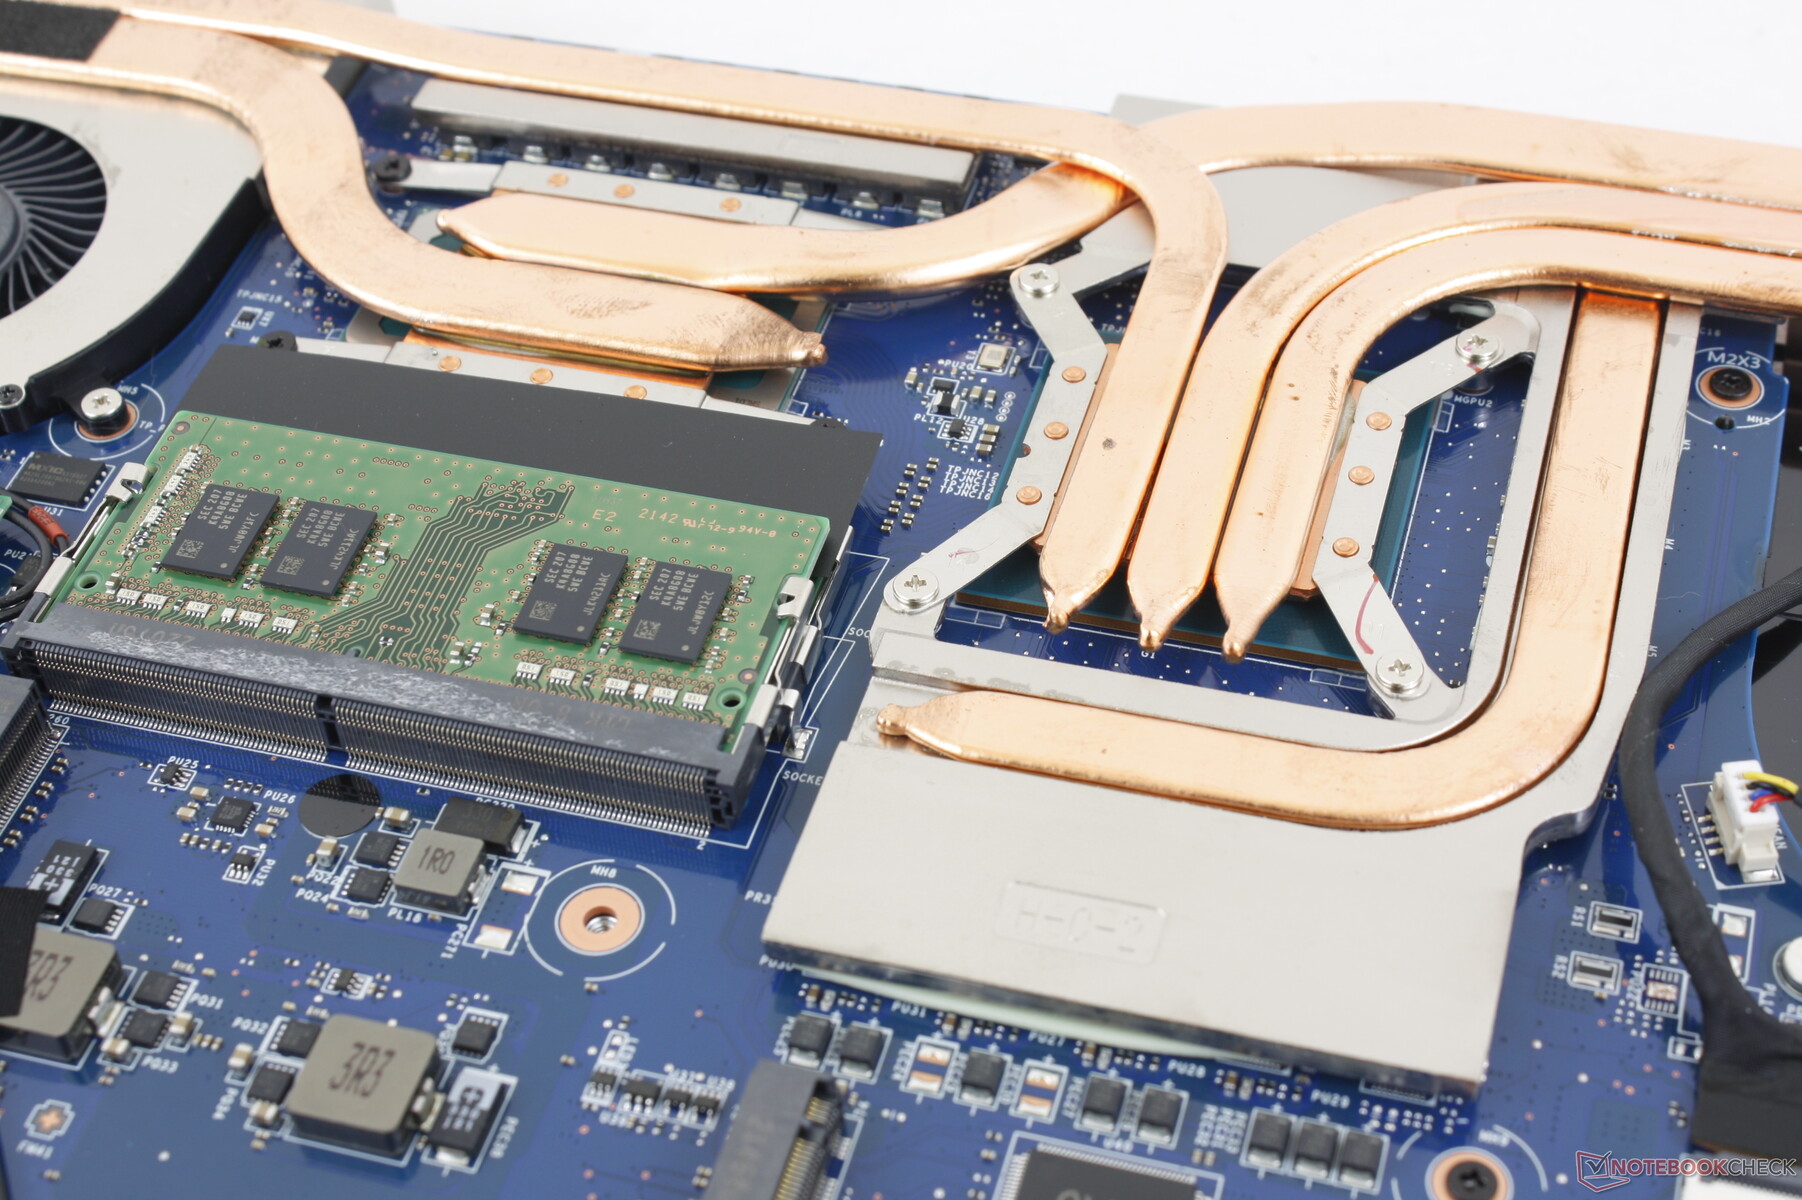
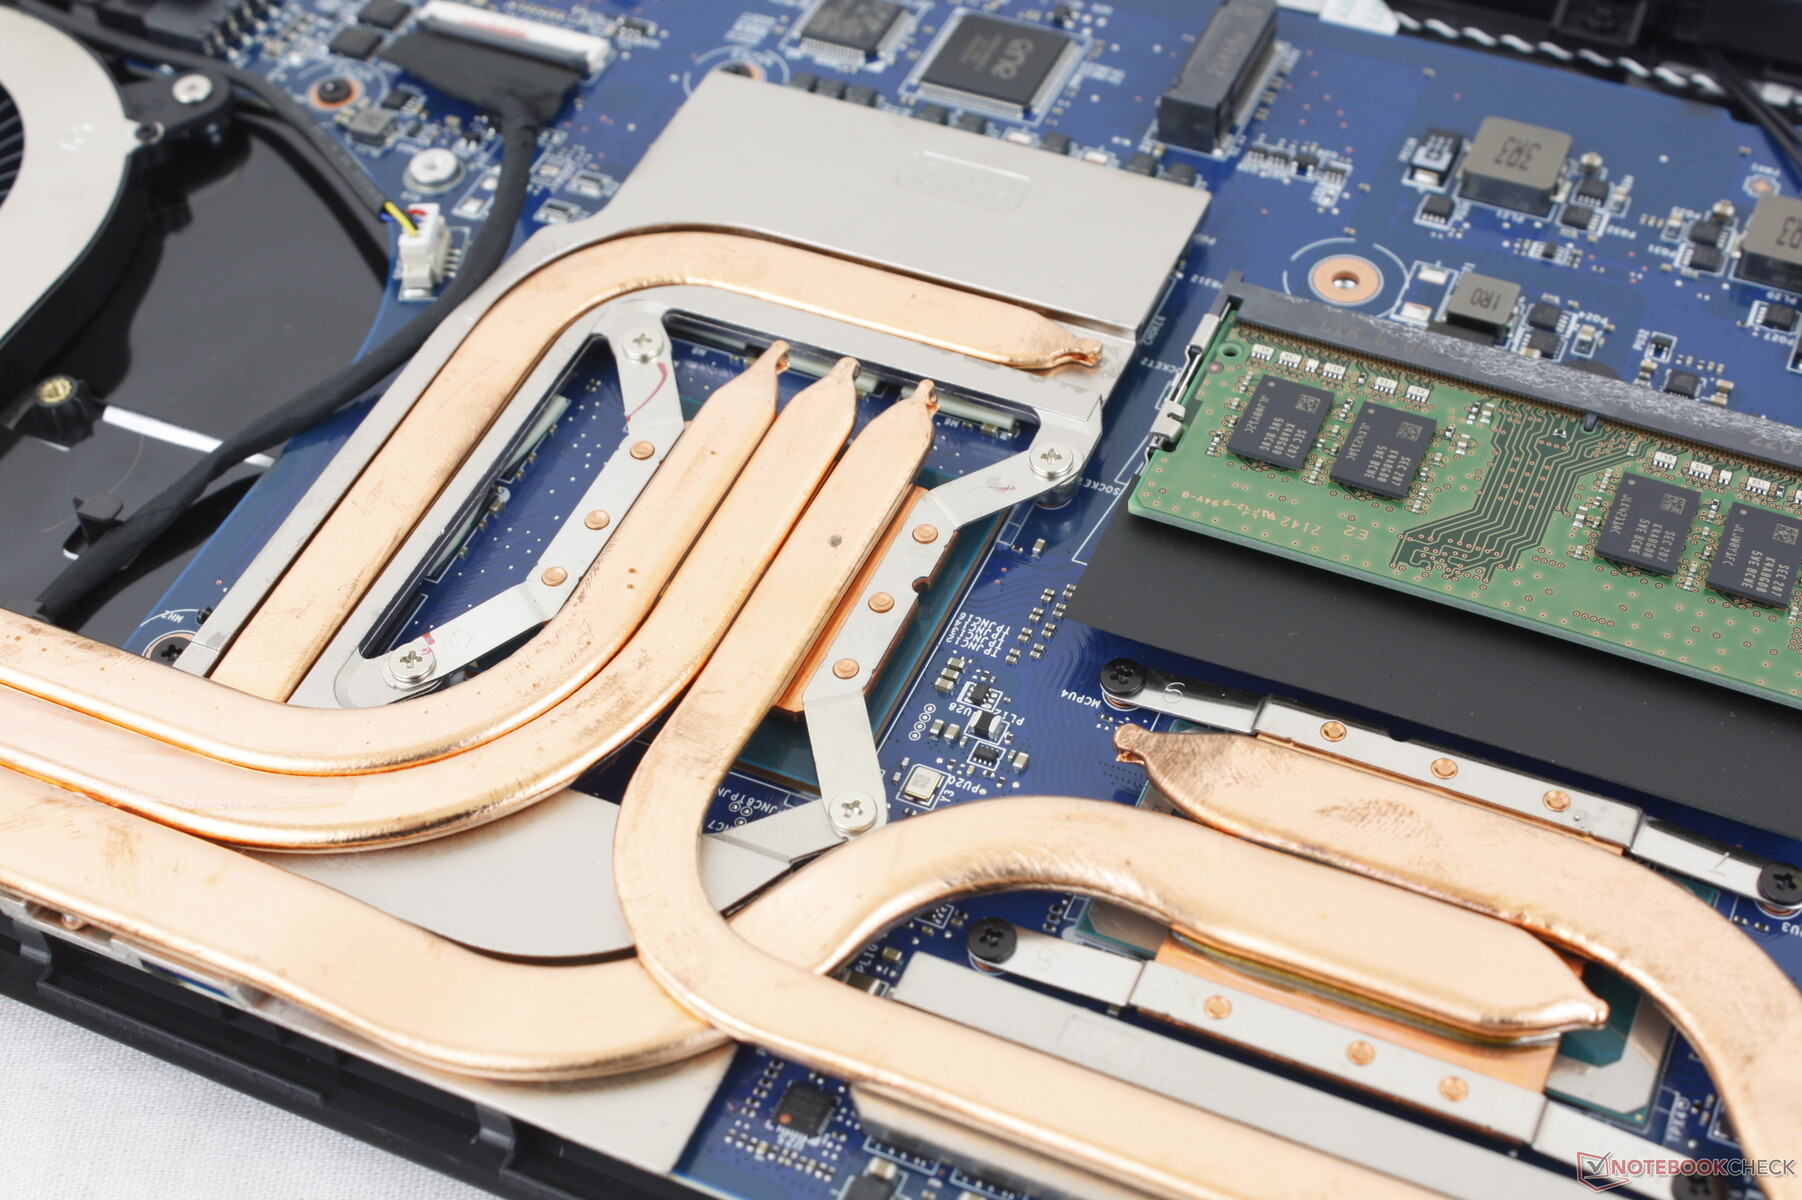
Mantenimiento
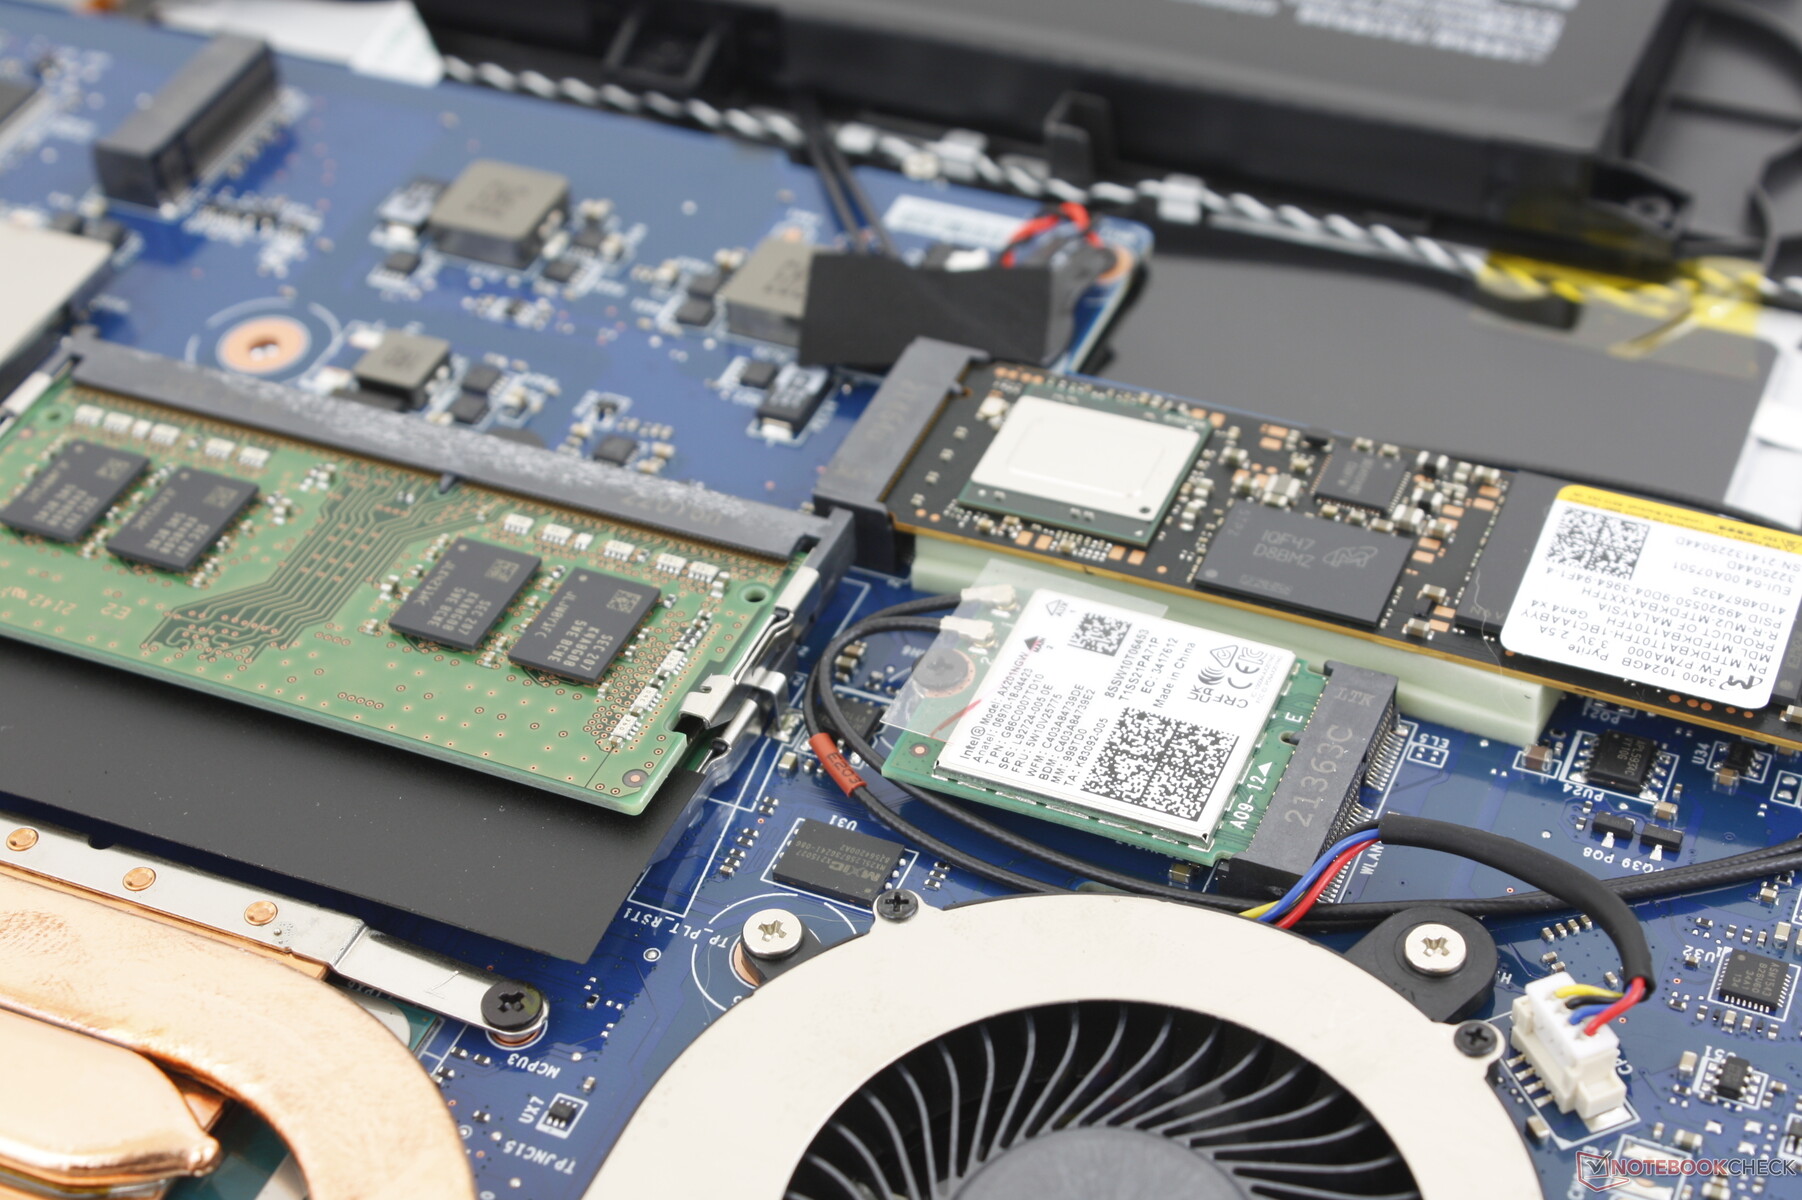
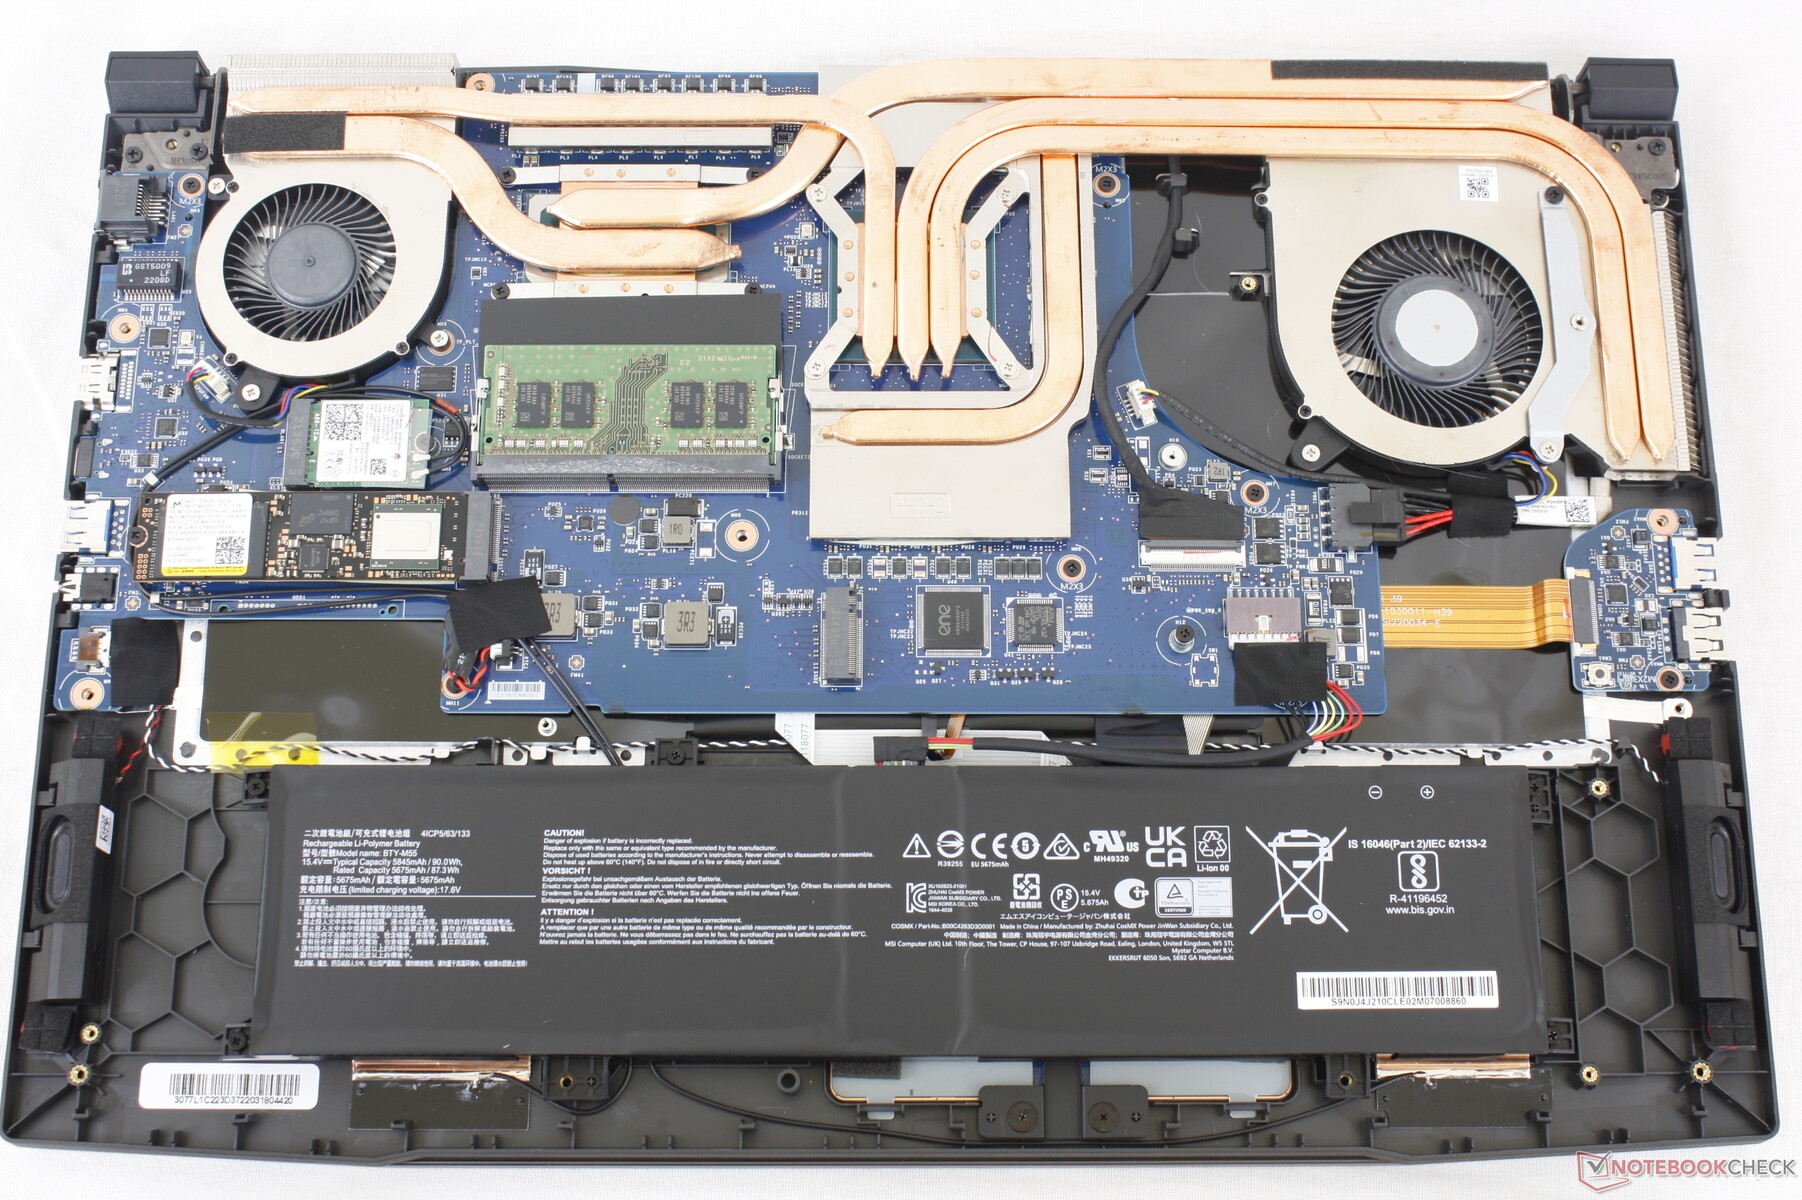
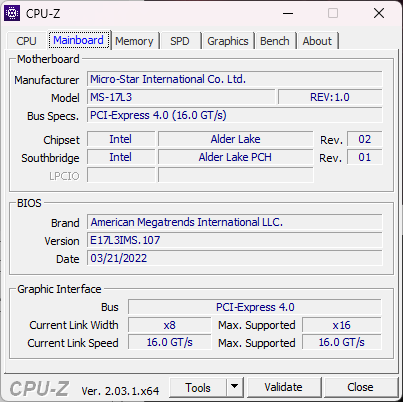
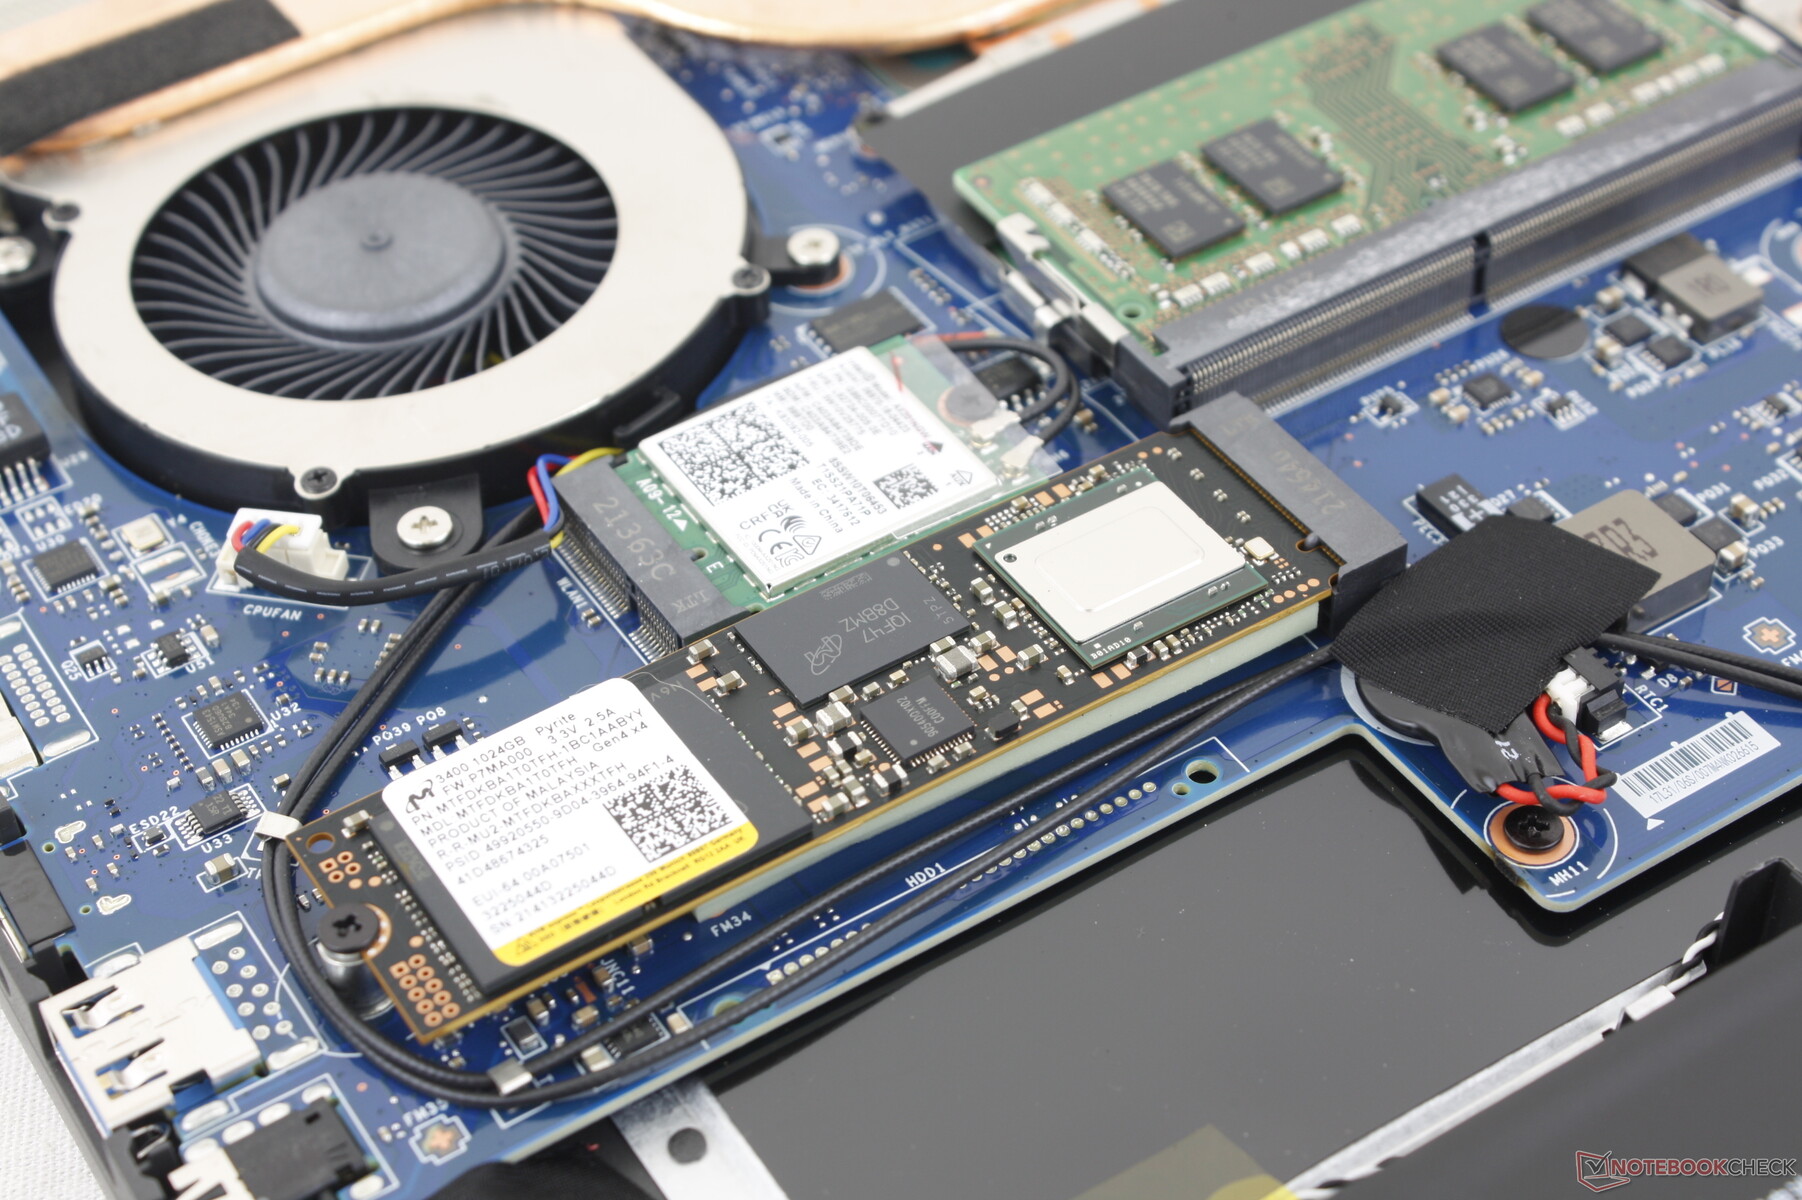
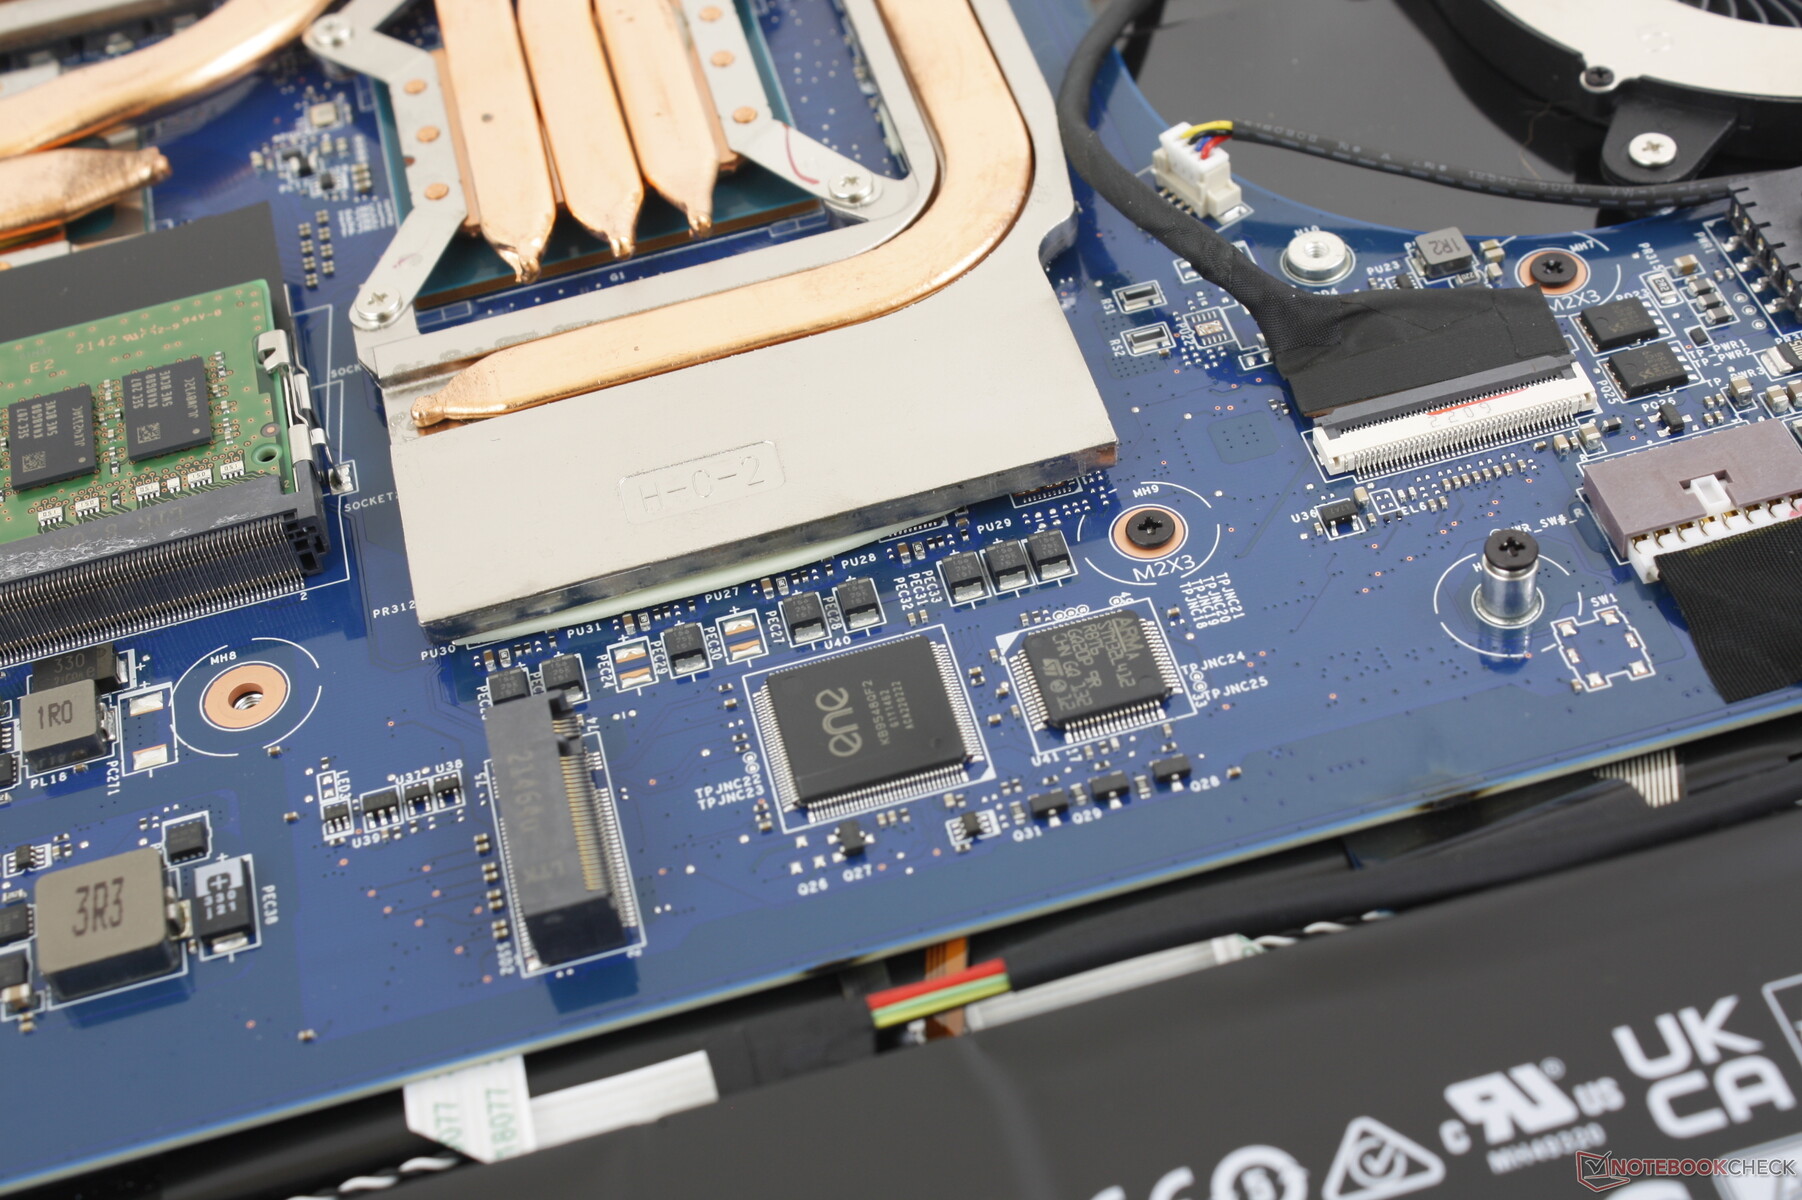
El panel inferior se fija mediante 13 tornillos Philips fáciles de quitar. Sin embargo, hay que tener en cuenta que hay que romper una pegatina de precinto de fábrica para hacerlo. MSI sigue siendo uno de los pocos fabricantes importantes que tienen una pegatina de sellado de fábrica incluso para actualizaciones sencillas como RAM o almacenamiento.
Una vez dentro, los usuarios tendrán acceso directo a 2x ranuras SSD PCIe4, 2x ranuras SODIMM, módulo WLAN, batería y solución de refrigeración.
Accesorios y garantía
No hay extras en la caja, aparte del adaptador de CA y la documentación. Se aplica una garantía limitada estándar de un año si se adquiere en EE.UU.
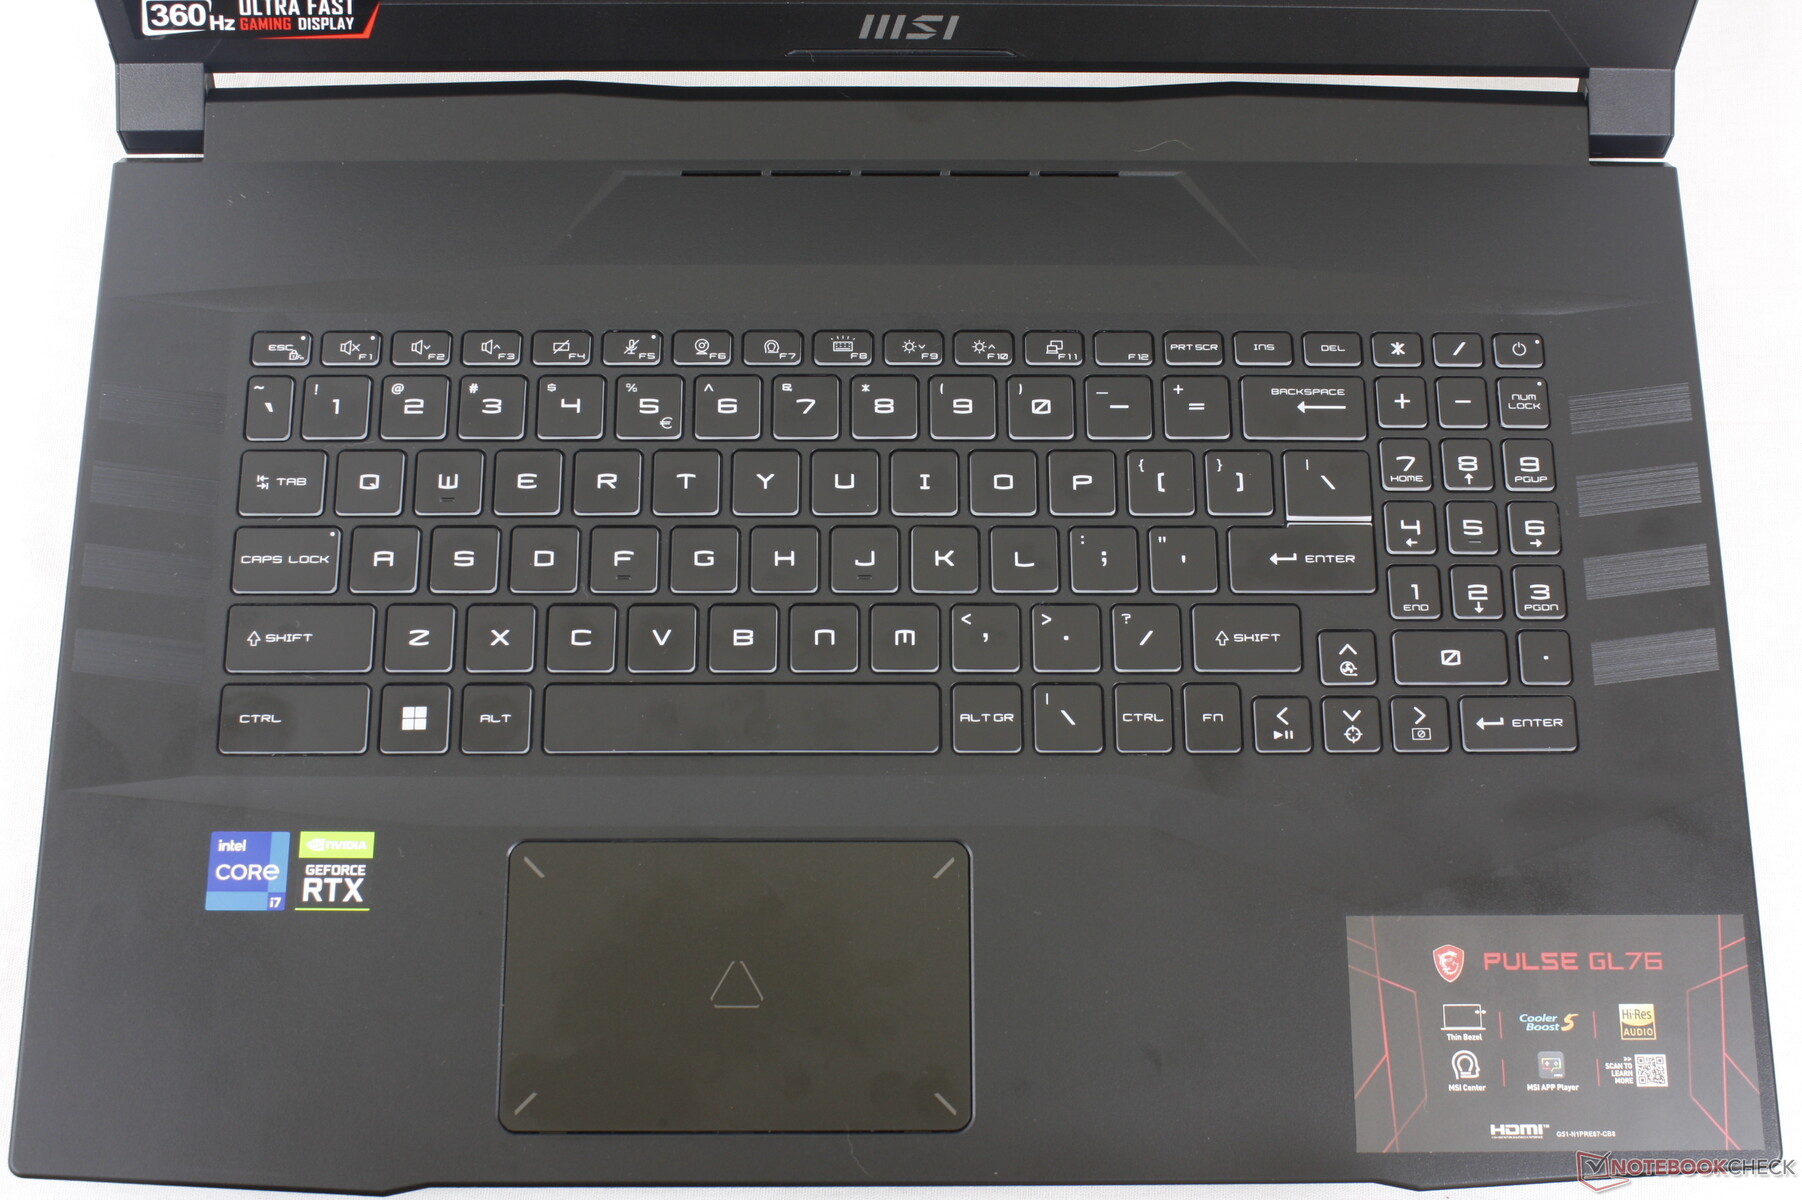
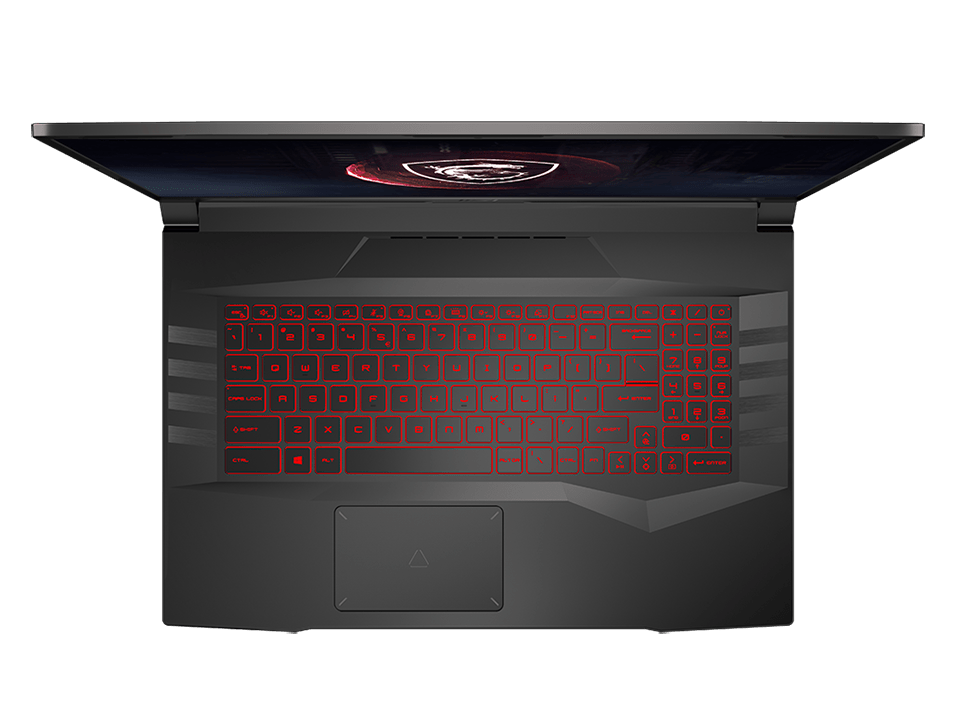
Dispositivos de entrada - Teclado OK, Clickpad esponjoso
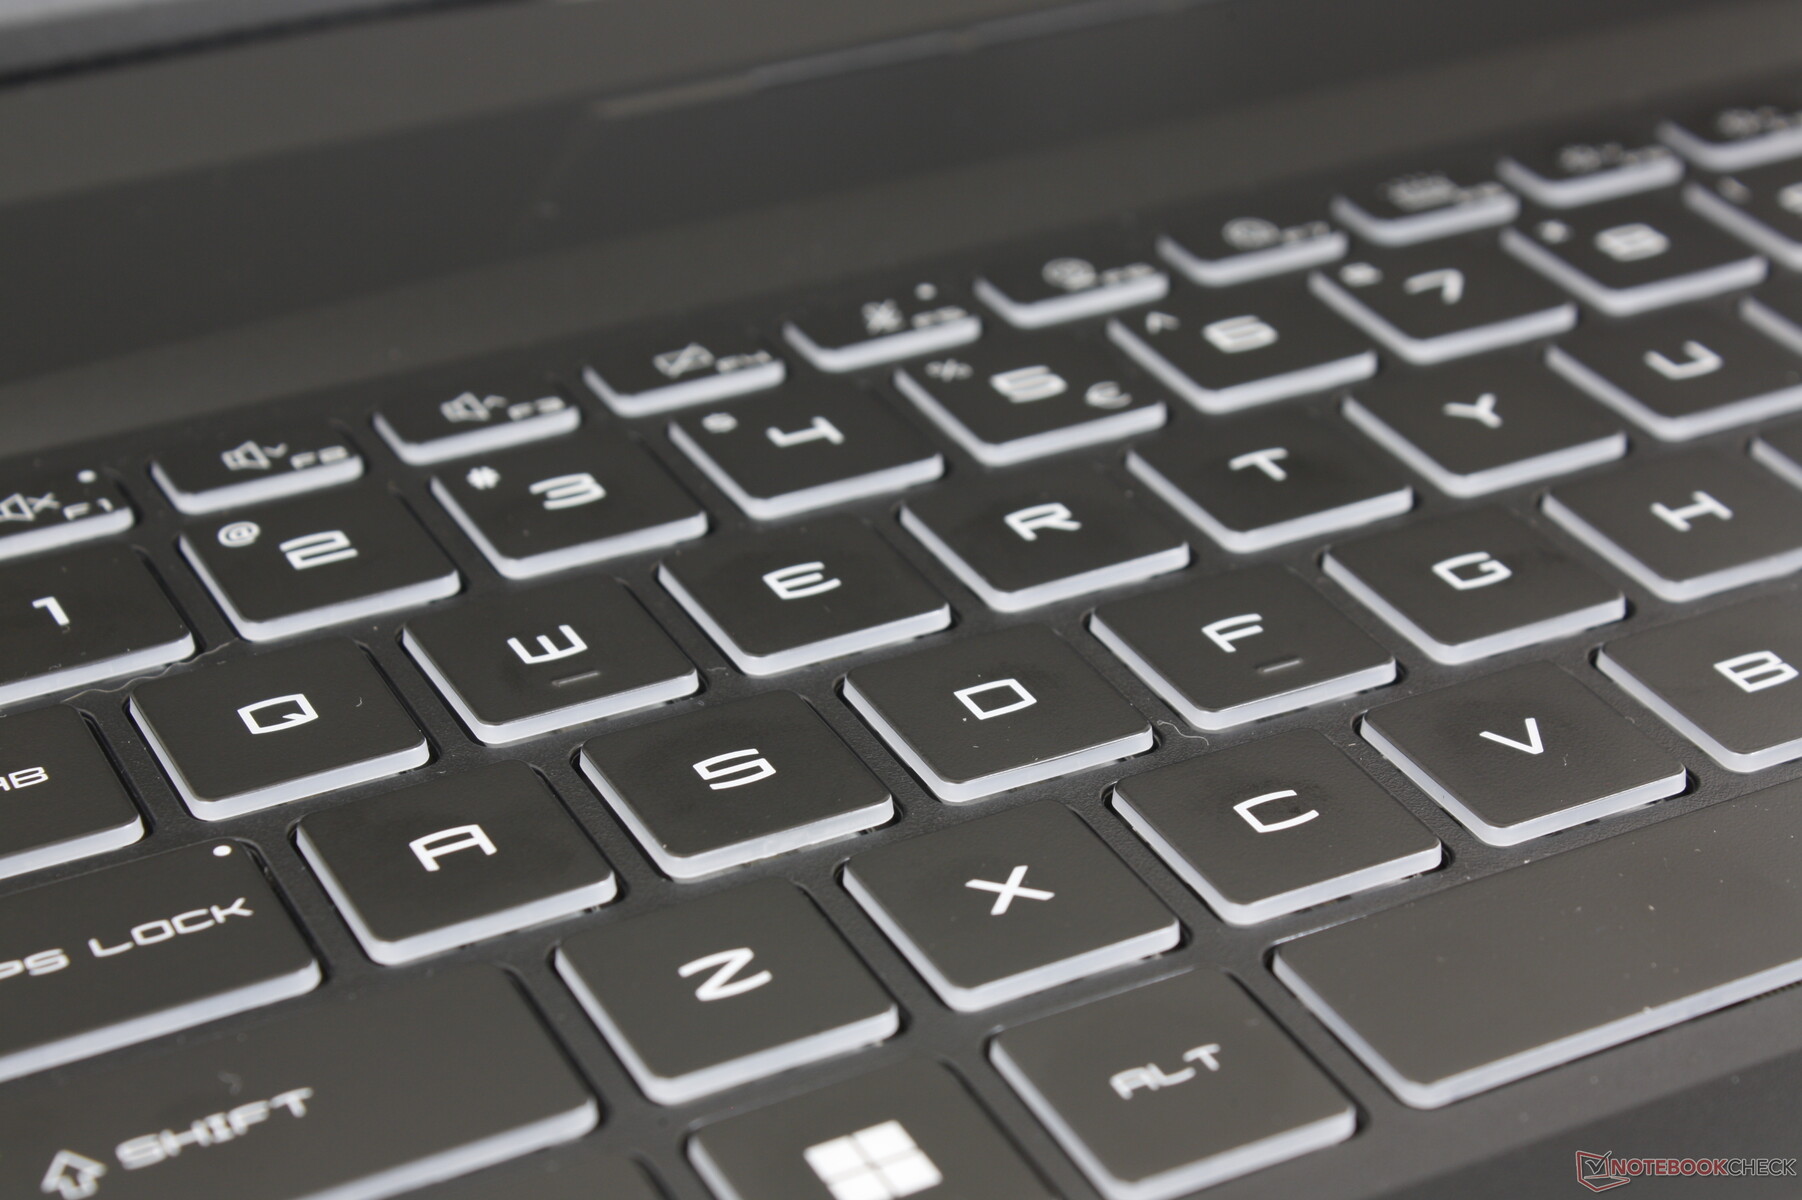
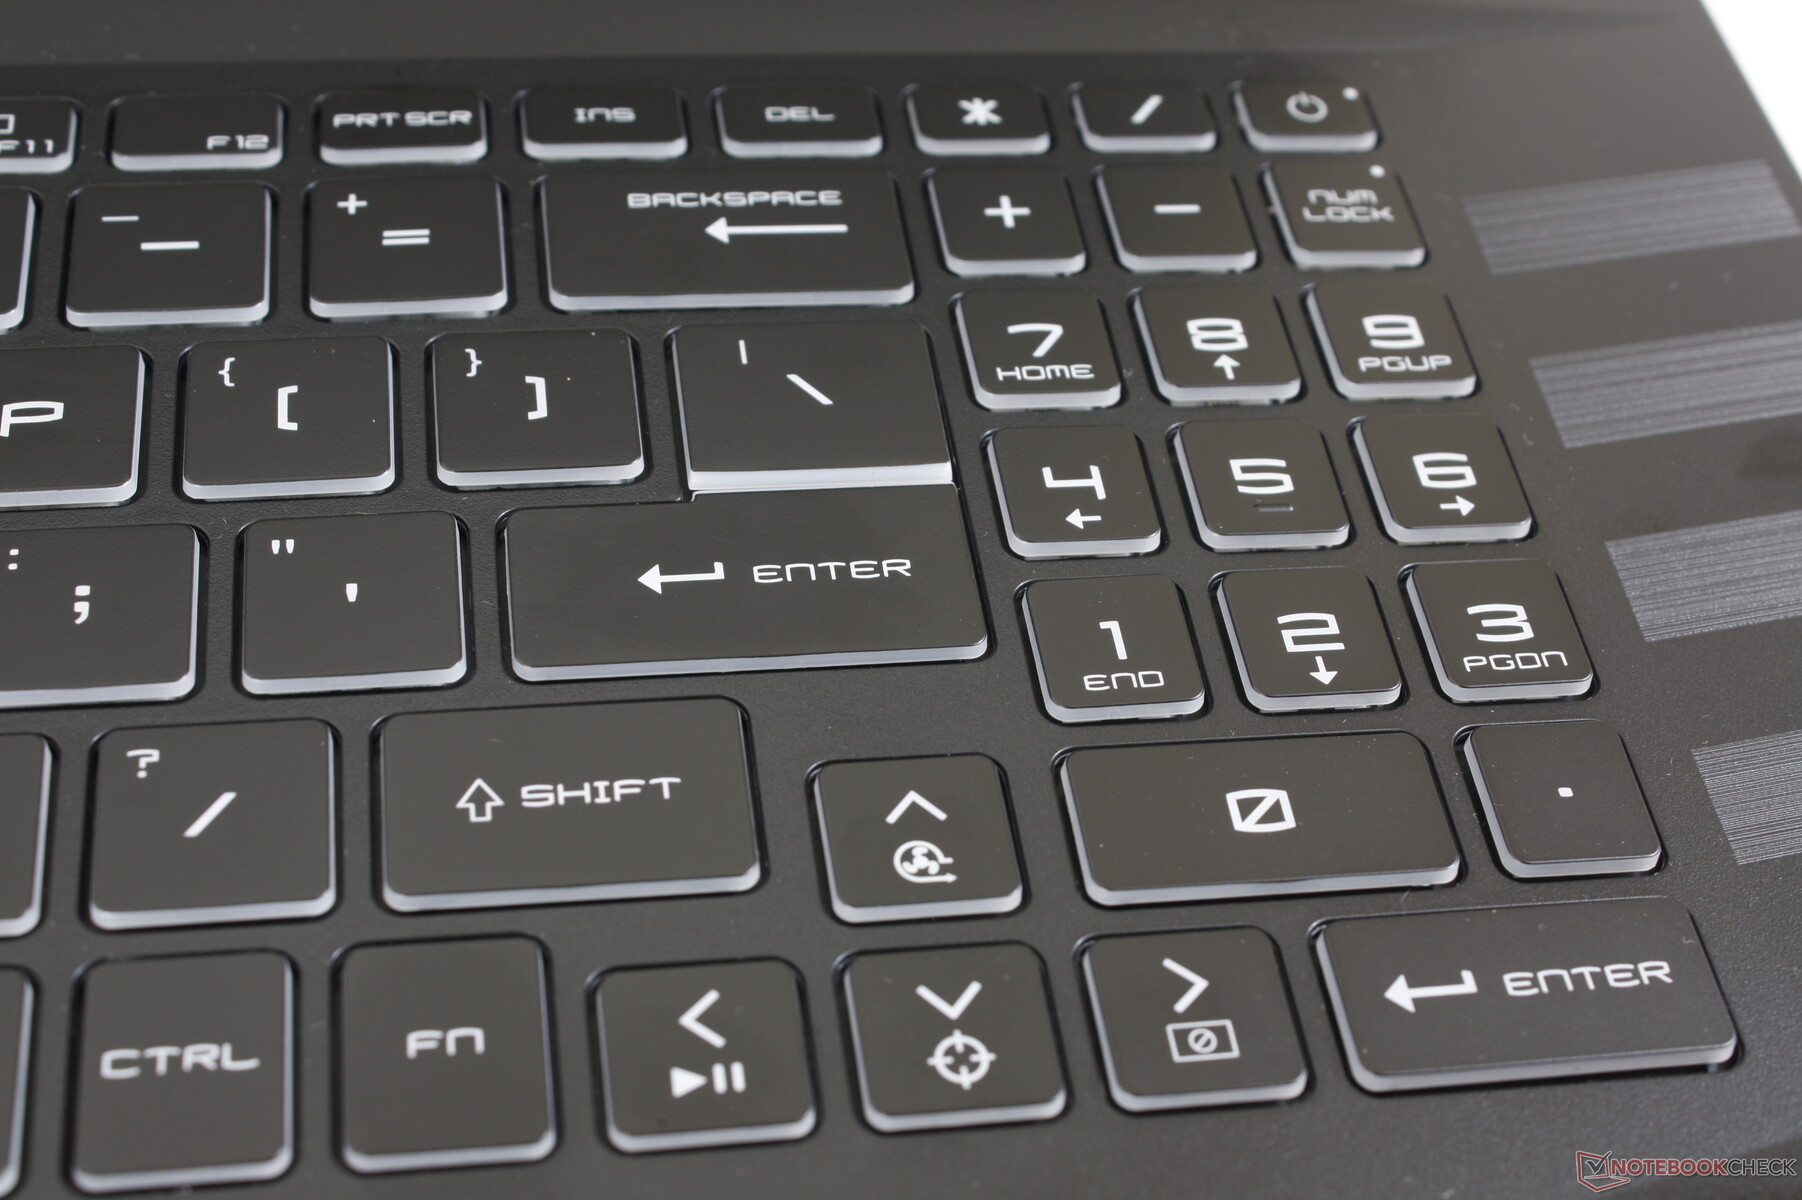
Teclado
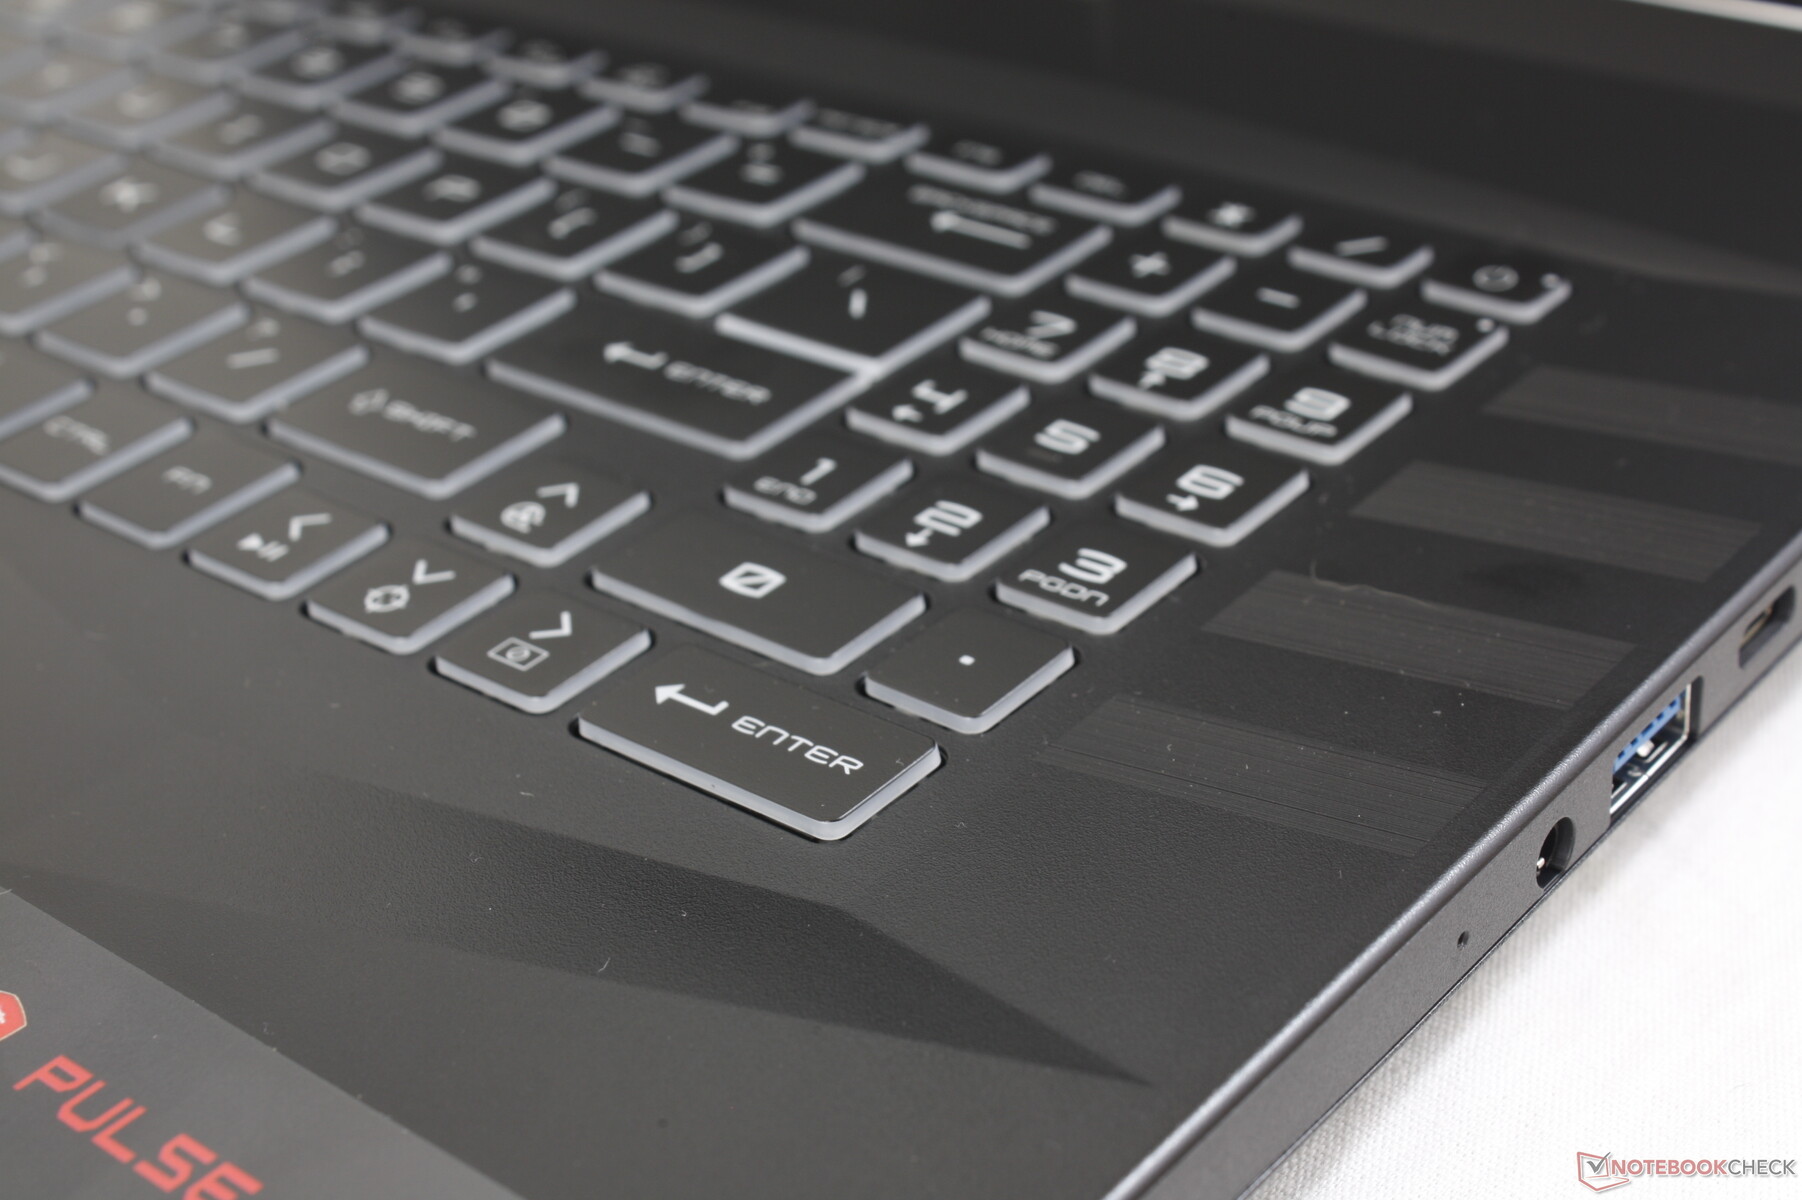
El GL76 comparte el mismo teclado y la misma experiencia de escritura que el GL66 a pesar de las diferencias de formato. Por tanto, el corto desplazamiento de tecla y la respuesta pasable del GL66 se aplican también al GL76. Es una pena que MSI no haya aprovechado mejor el mayor factor de forma de 17,3 pulgadas aumentando el tamaño del teclado numérico y las teclas de flecha, ya que son más pequeñas, esponjosas y estrechas en comparación con las teclas QWERTY más grandes. Este rasgo lo comparte con el Asus TUF Gaming F17.
Una retroiluminación RGB de una sola zona viene de serie sin opciones RGB por tecla. Todas las teclas y símbolos están iluminados.
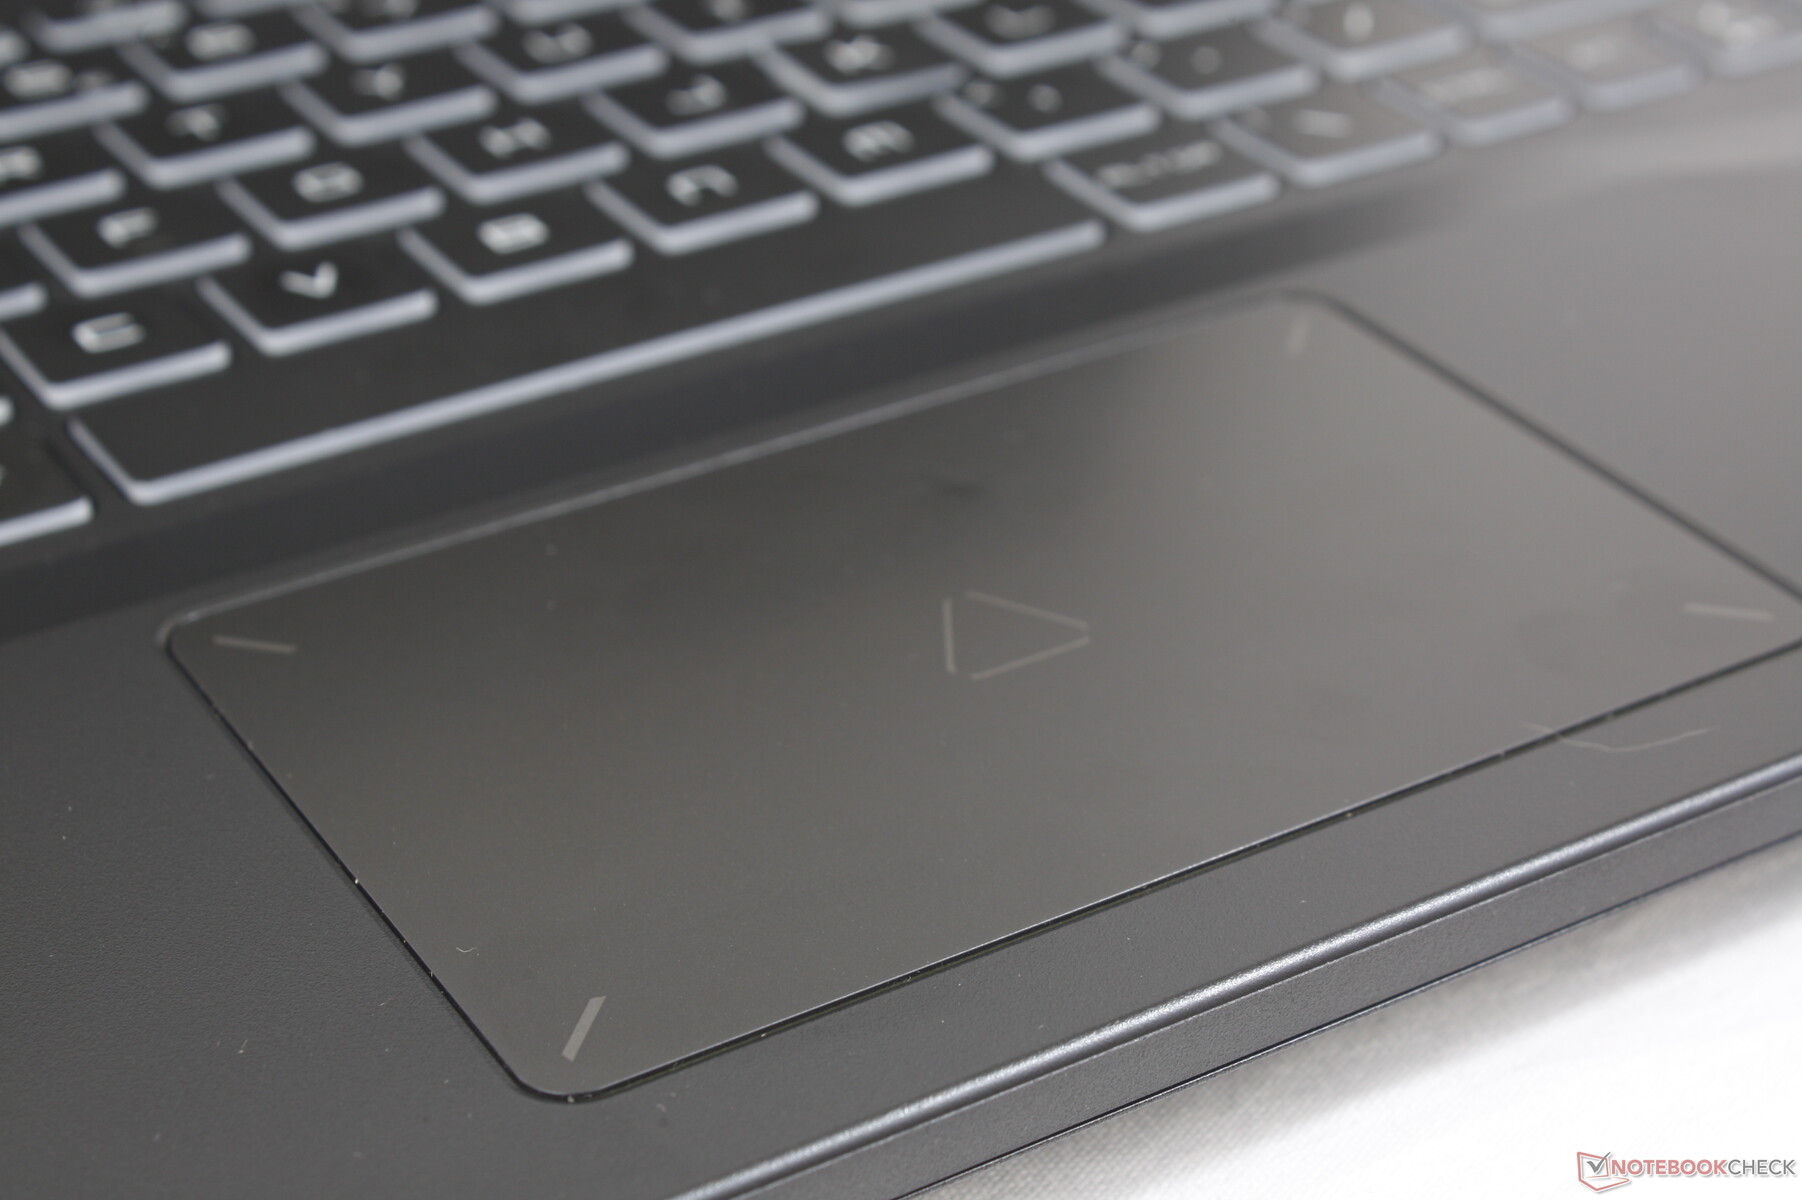
Panel táctil
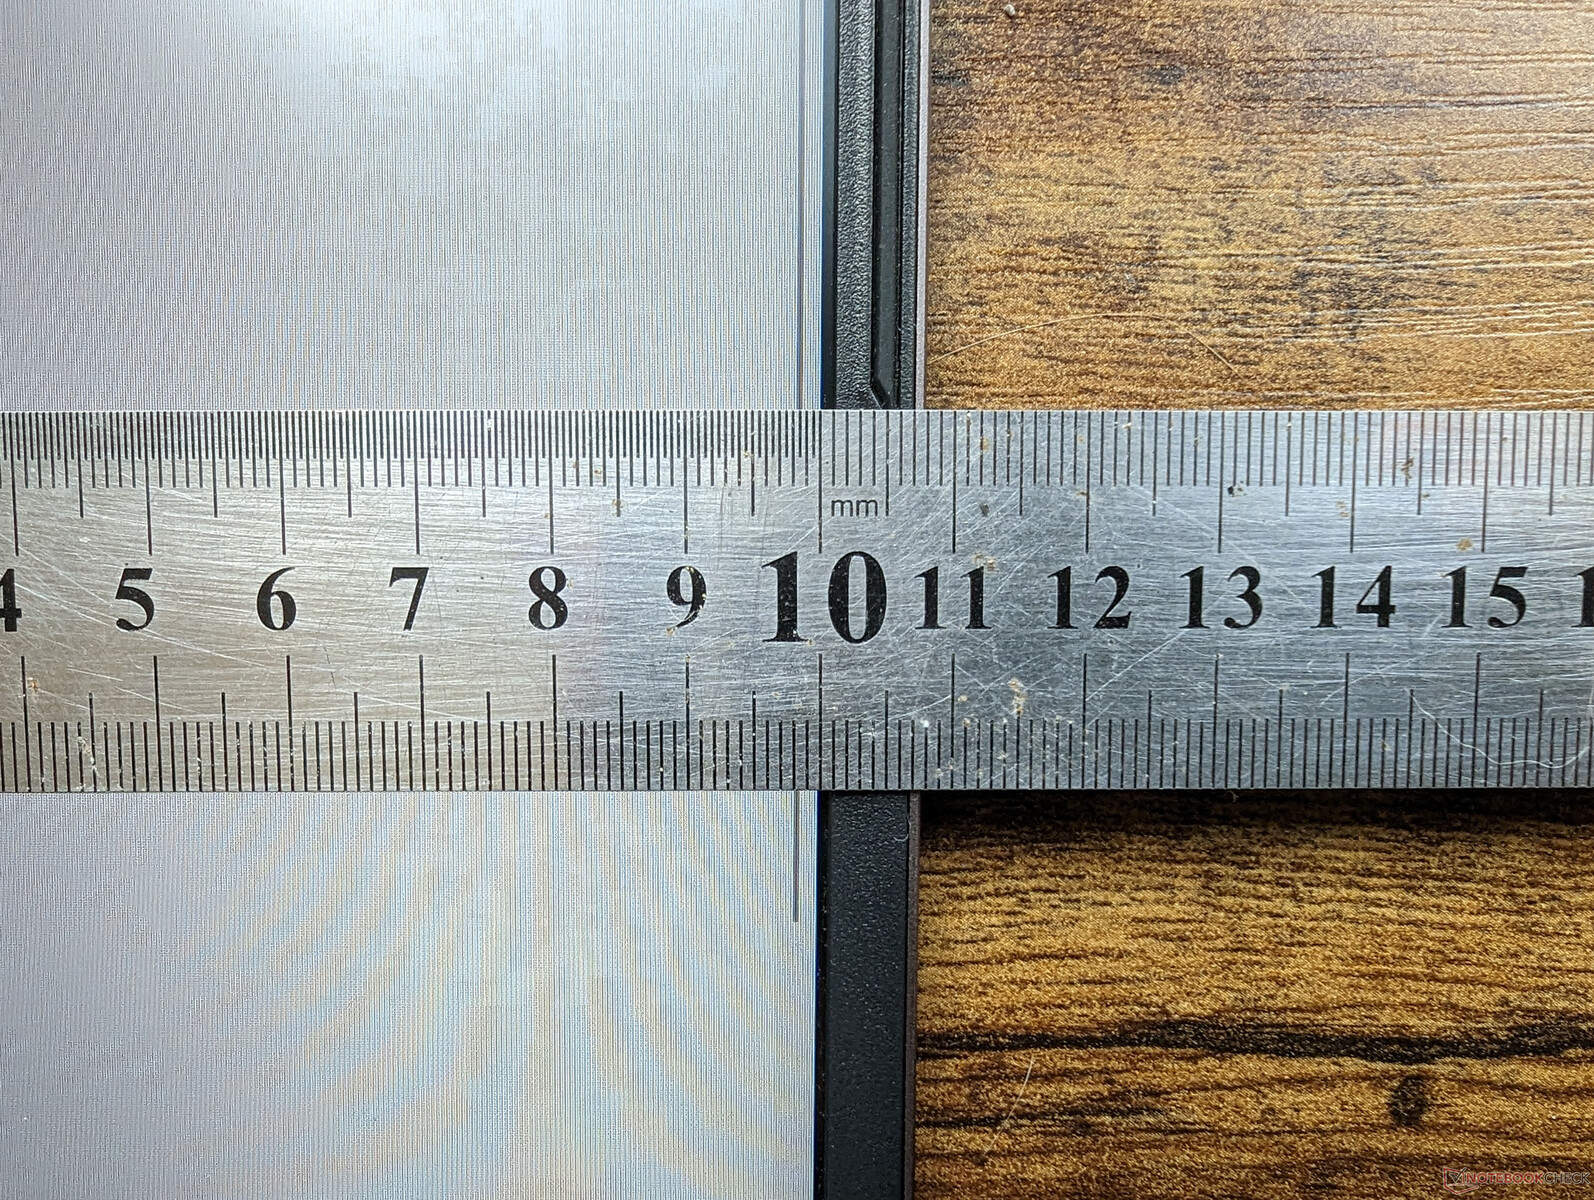
El clickpad es relativamente pequeño, de 10,5 x 6,7 cm, pero al menos es ligeramente mayor que el clickpad de 10,5 x 6 cm del Dell G16. Su superficie de plástico tiende a pegarse cuando se desliza a velocidades medias o lentas, lo que puede hacer que el control del cursor sea un poco irregular a veces. Además, la retroalimentación al hacer clic en la superficie es esponjosa para una sensación muy insatisfactoria. Siempre que sea posible, hay que tener a mano un ratón externo adecuado.
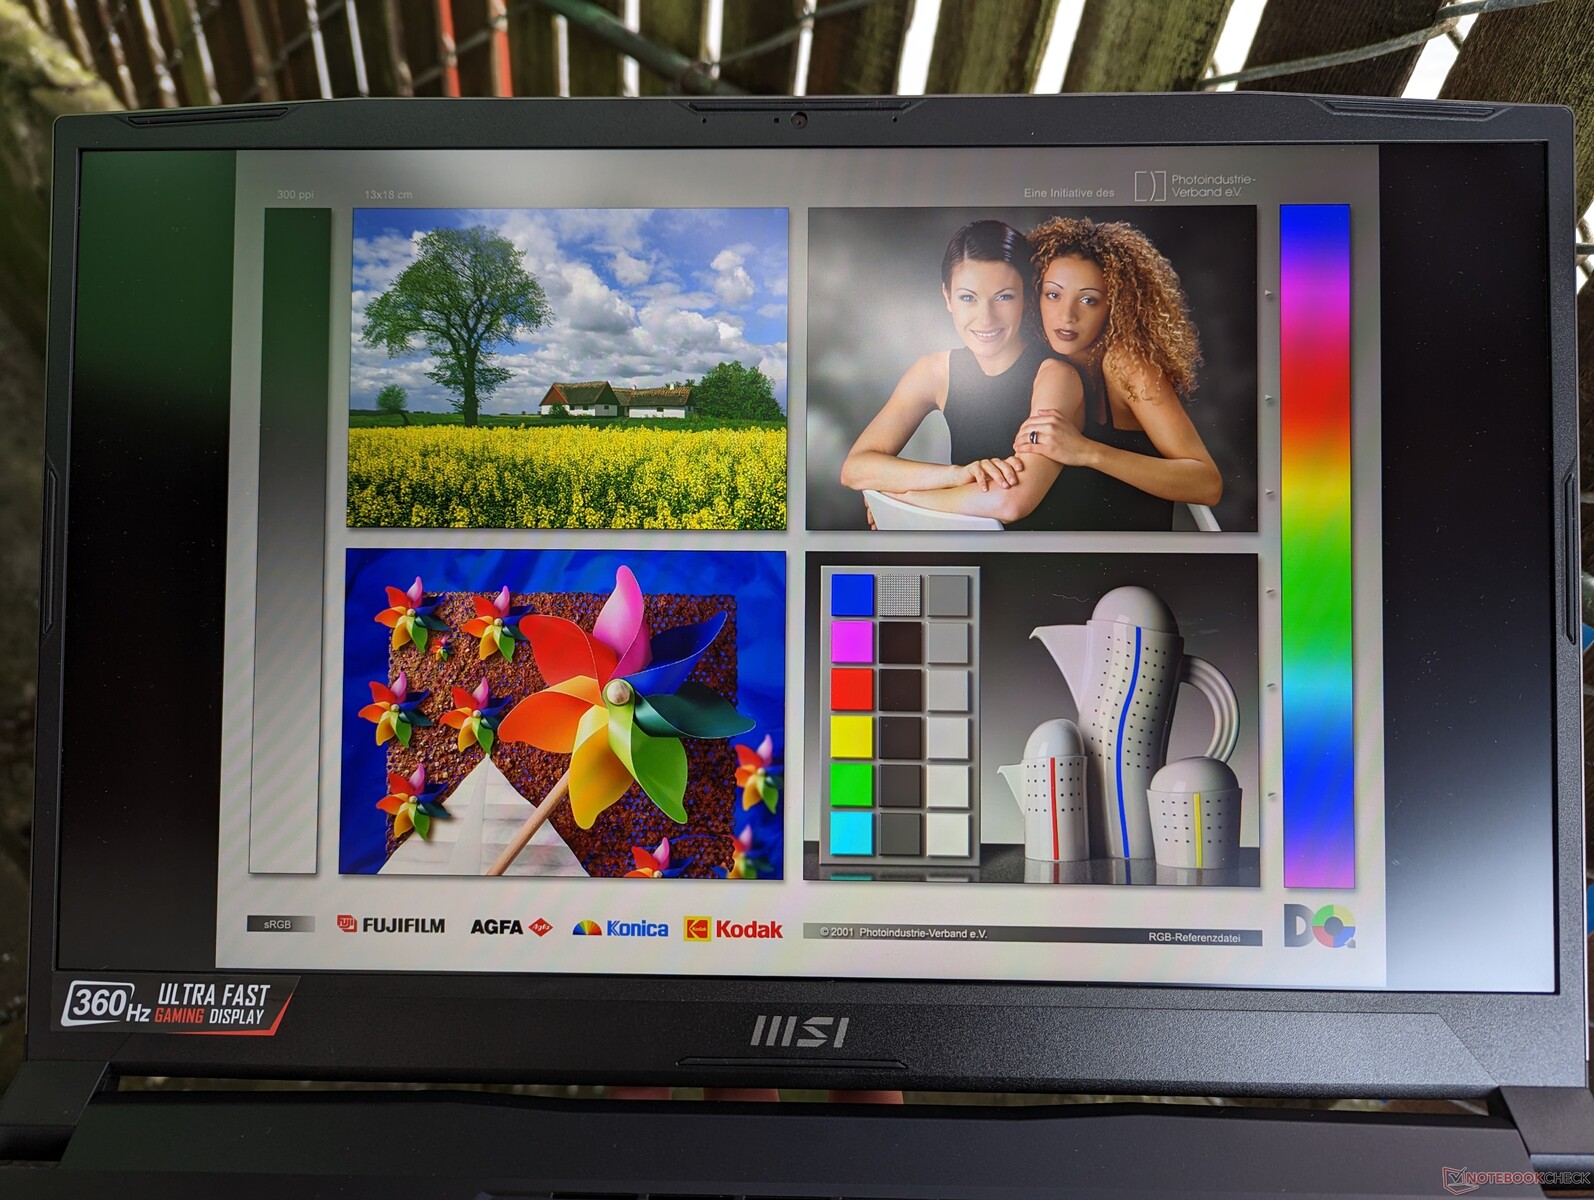
Pantalla - Sólo 1080p
Sólo hay dos opciones de panel para el GL76 2022, como se indica a continuación. 1080p es la única opción de resolución por ahora, mientras que el modelo 2021 tenía una SKU QHD.
- 144 Hz, 1080p, 60% sRGB, IPS
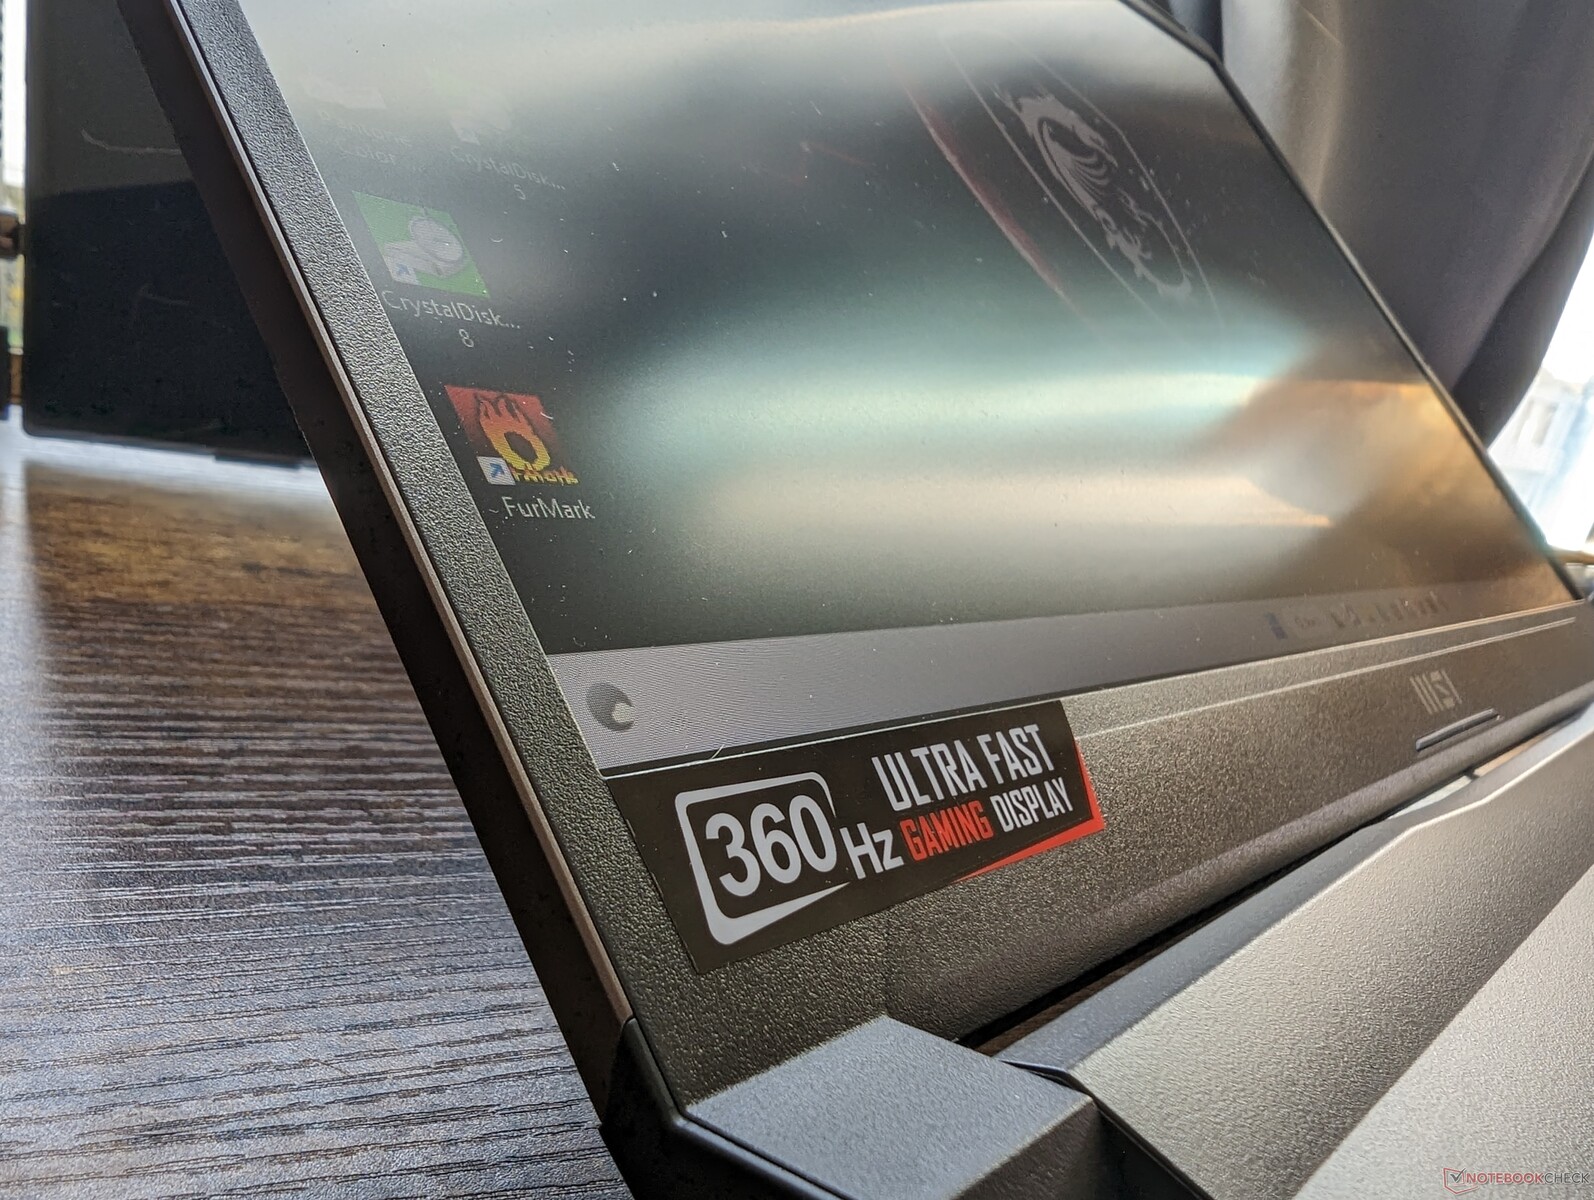
- 360 Hz, 1080p, 100% sRGB, IPS
El panel de 360 Hz tiene tiempos de respuesta blanco-negro mucho más rápidos que el panel de 144 Hz. También es el mismo panel IPS Sharp LQ173M1JW08 que MSI también utiliza en su buque insignia Titan GT77. Recomendamos evitar la opción de 144 Hz ya que su limitado espacio de color es un buen indicador de un panel muy barato.
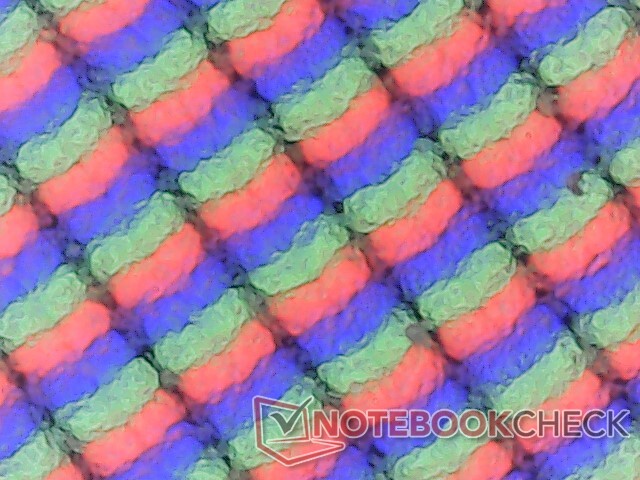
La calidad de imagen es excelente y suave como la mantequilla gracias a la rapidísima frecuencia de refresco. Hay que tener en cuenta que no es tan nítido como la mayoría de Ultrabooks o portátiles gaming de 15,6 pulgadas debido a los relativamente bajos PPI. Este panel en particular prioriza la capacidad de respuesta y la velocidad de fotogramas sobre la resolución.
| |||||||||||||||||||||||||
iluminación: 82 %
Brillo con batería: 337.7 cd/m²
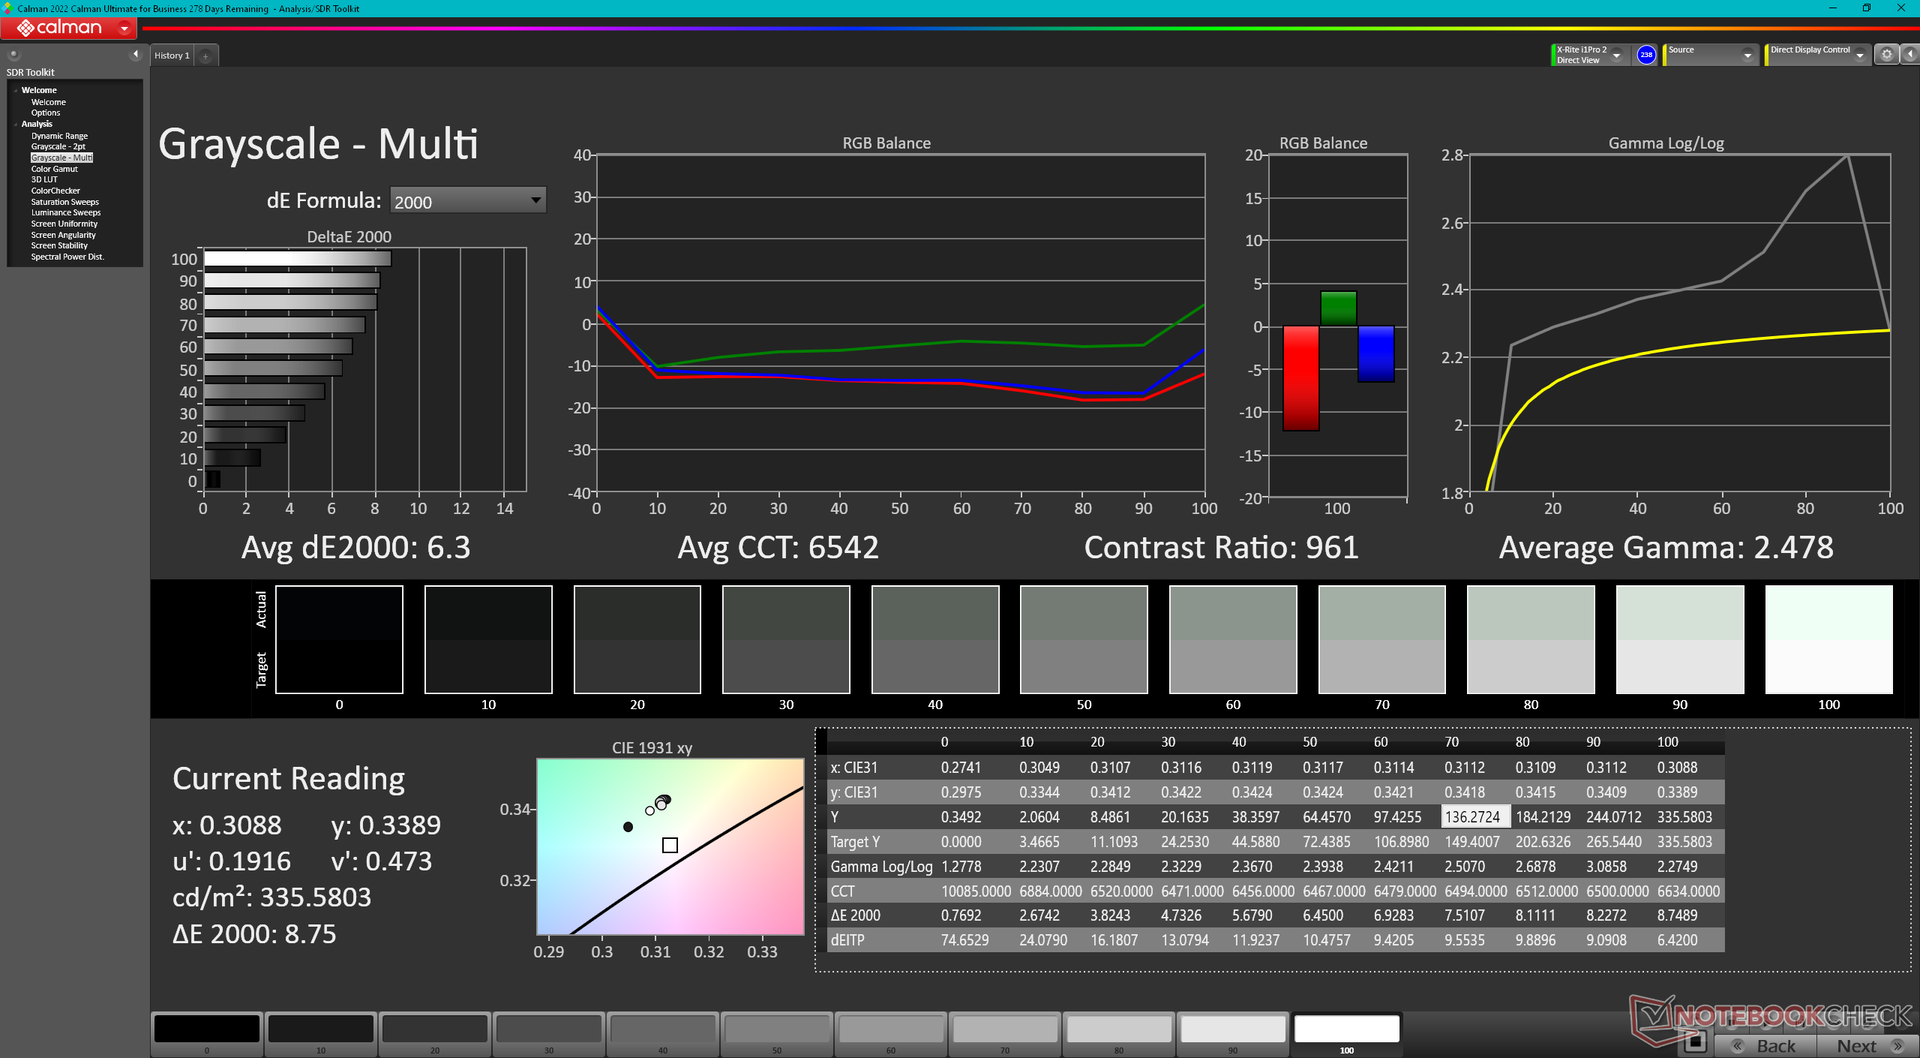
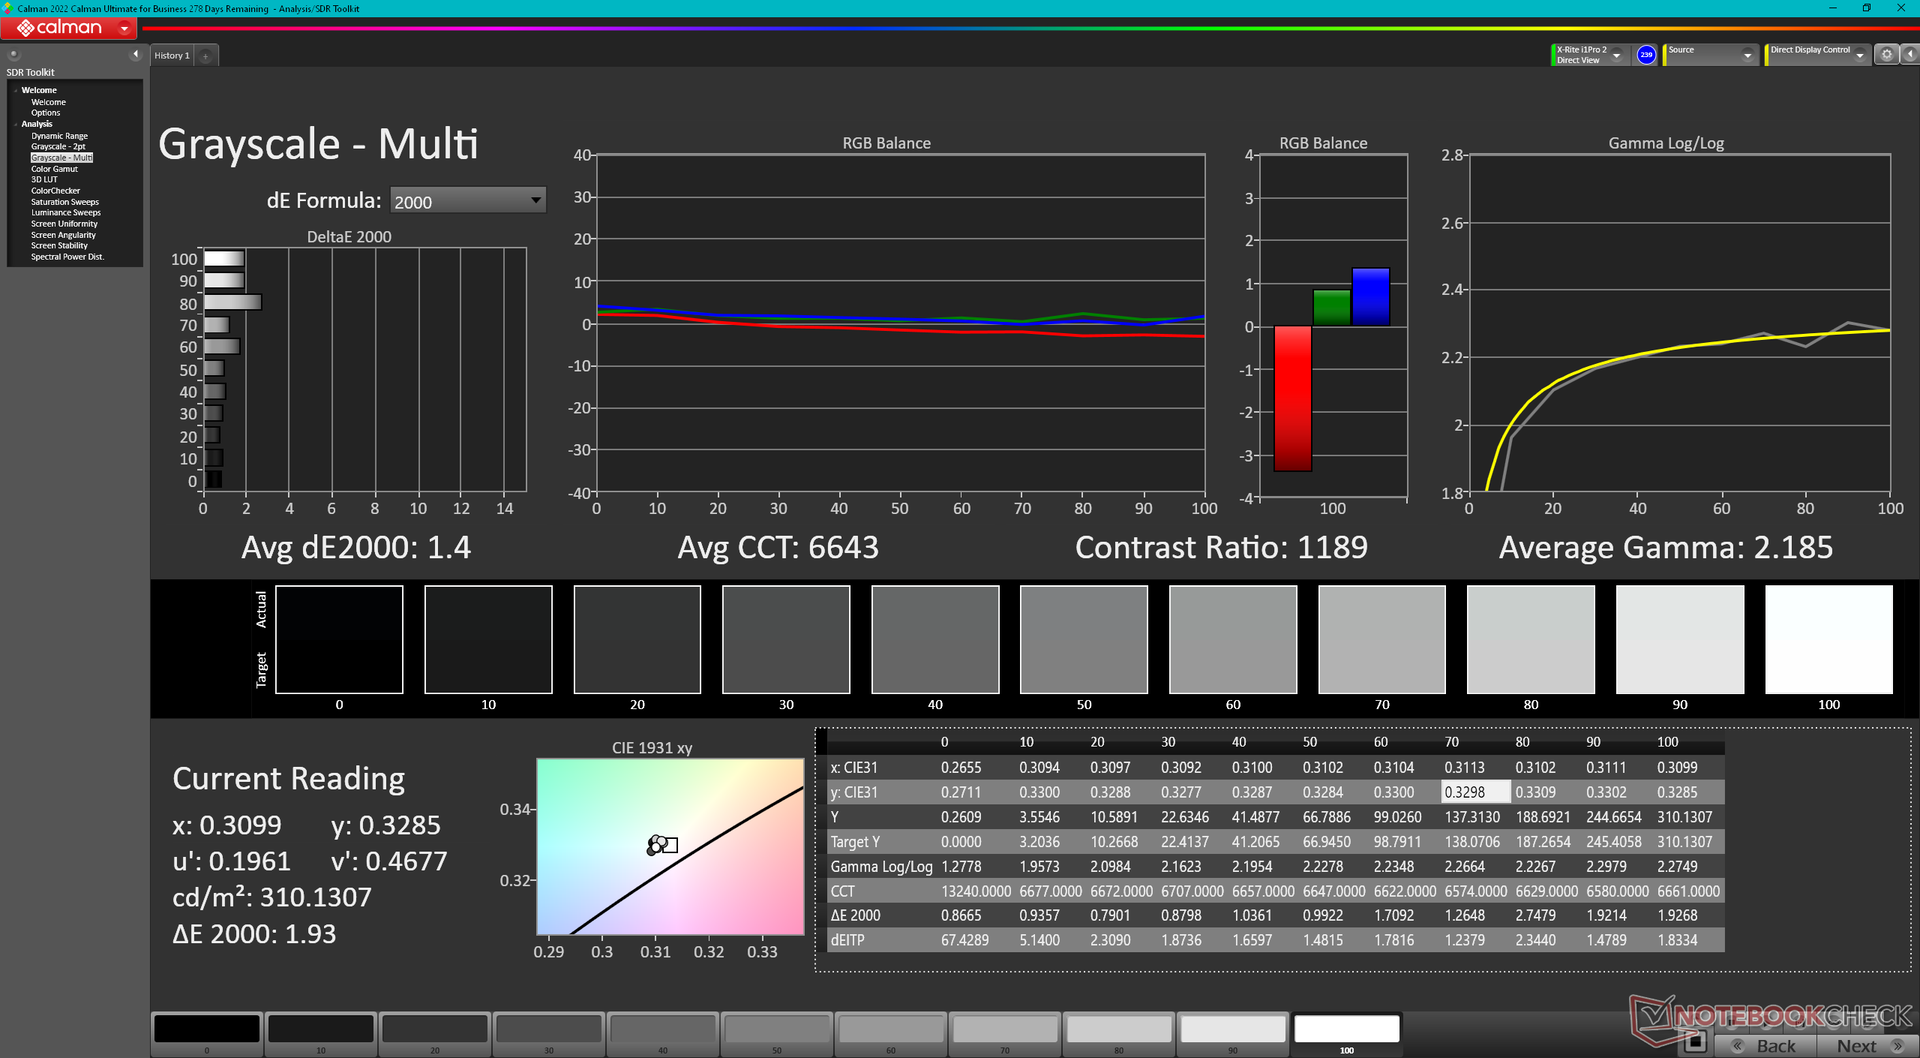
Contraste: 1089:1 (Negro: 0.31 cd/m²)
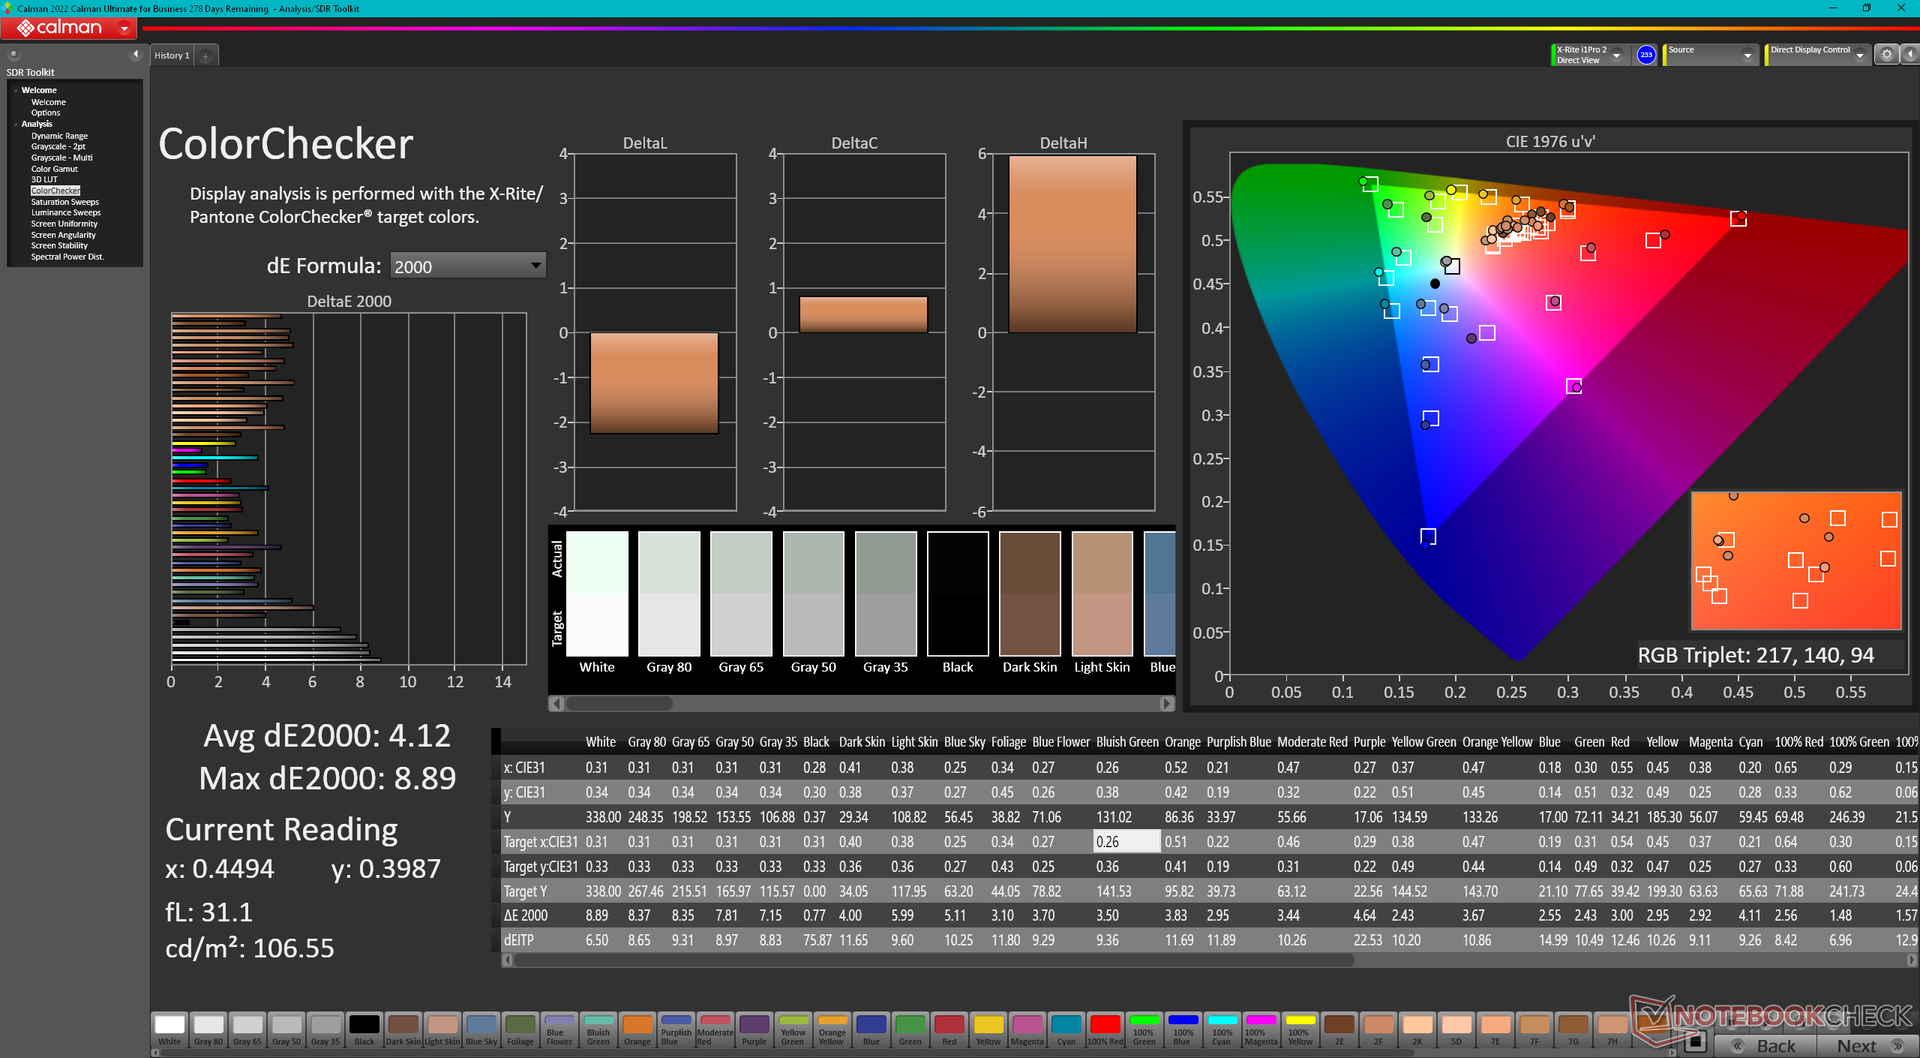
ΔE ColorChecker Calman: 4.12 | ∀{0.5-29.43 Ø4.72}
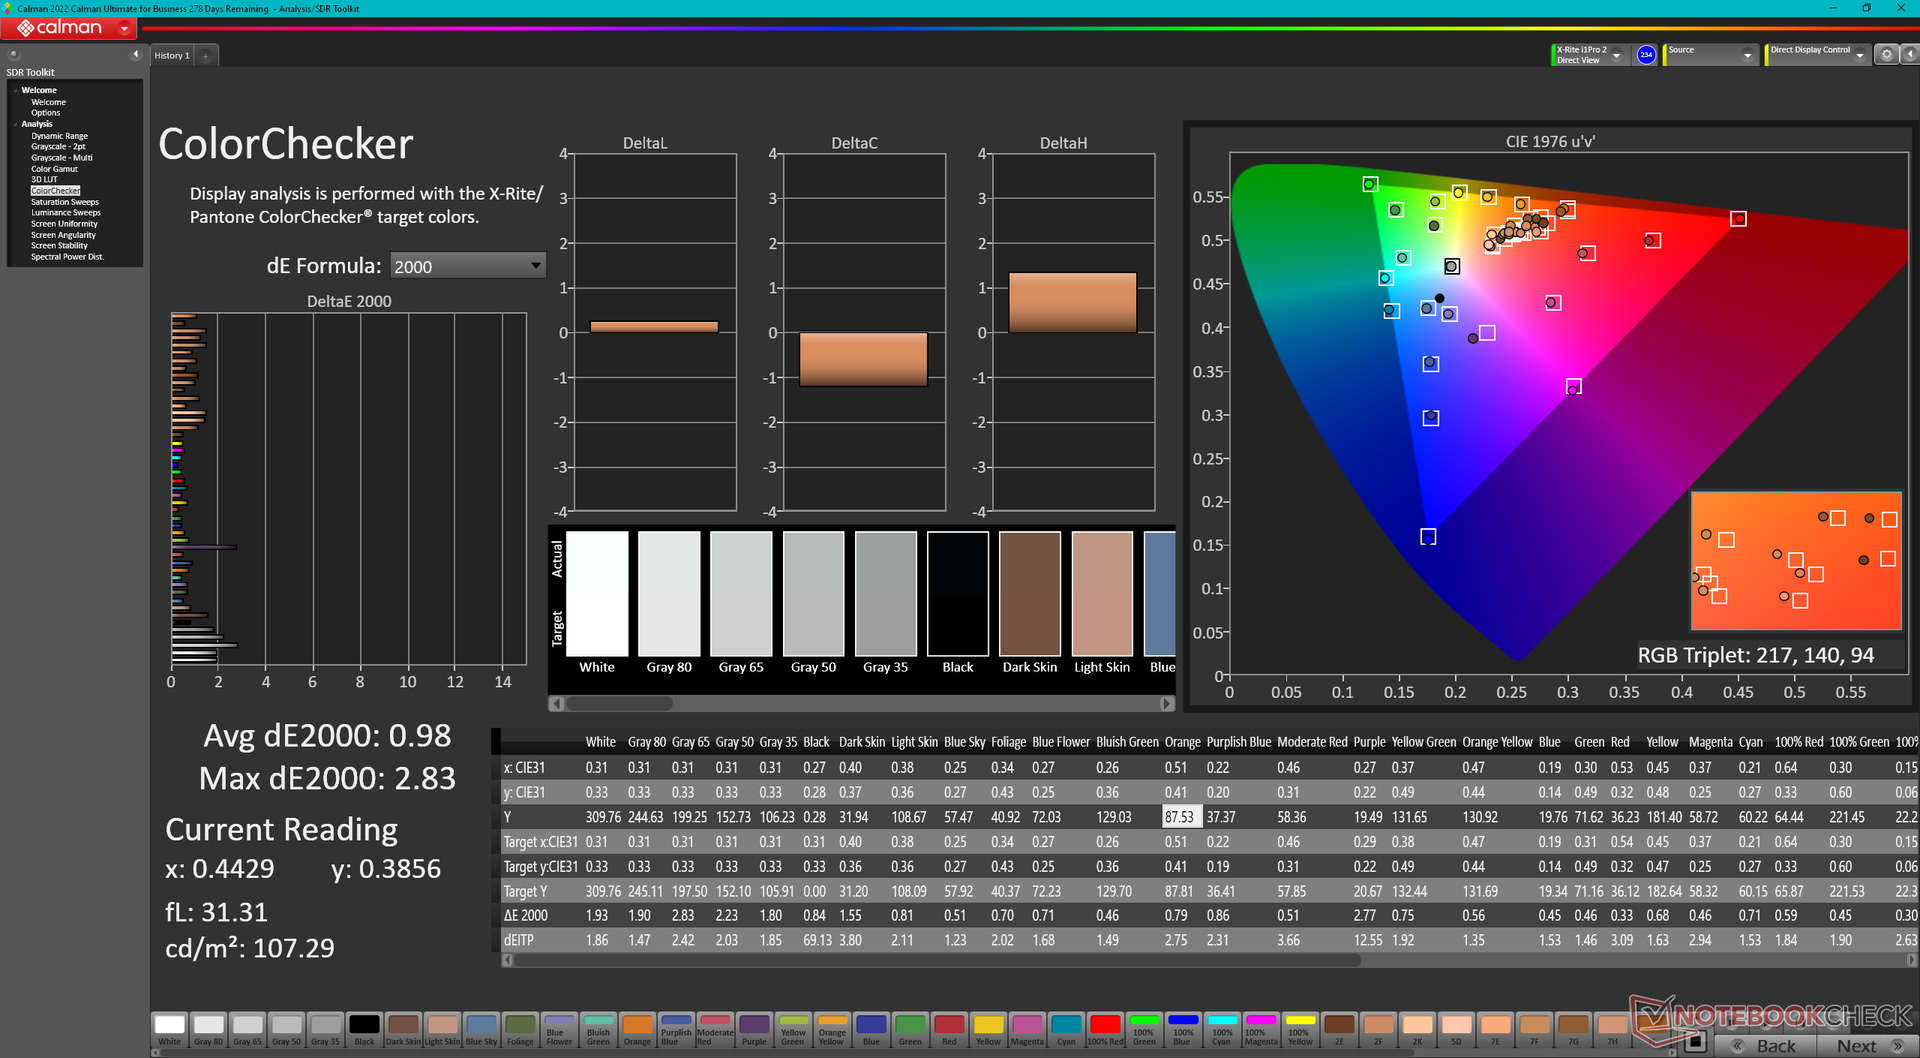
calibrated: 0.98
ΔE Greyscale Calman: 6.3 | ∀{0.09-98 Ø4.97}
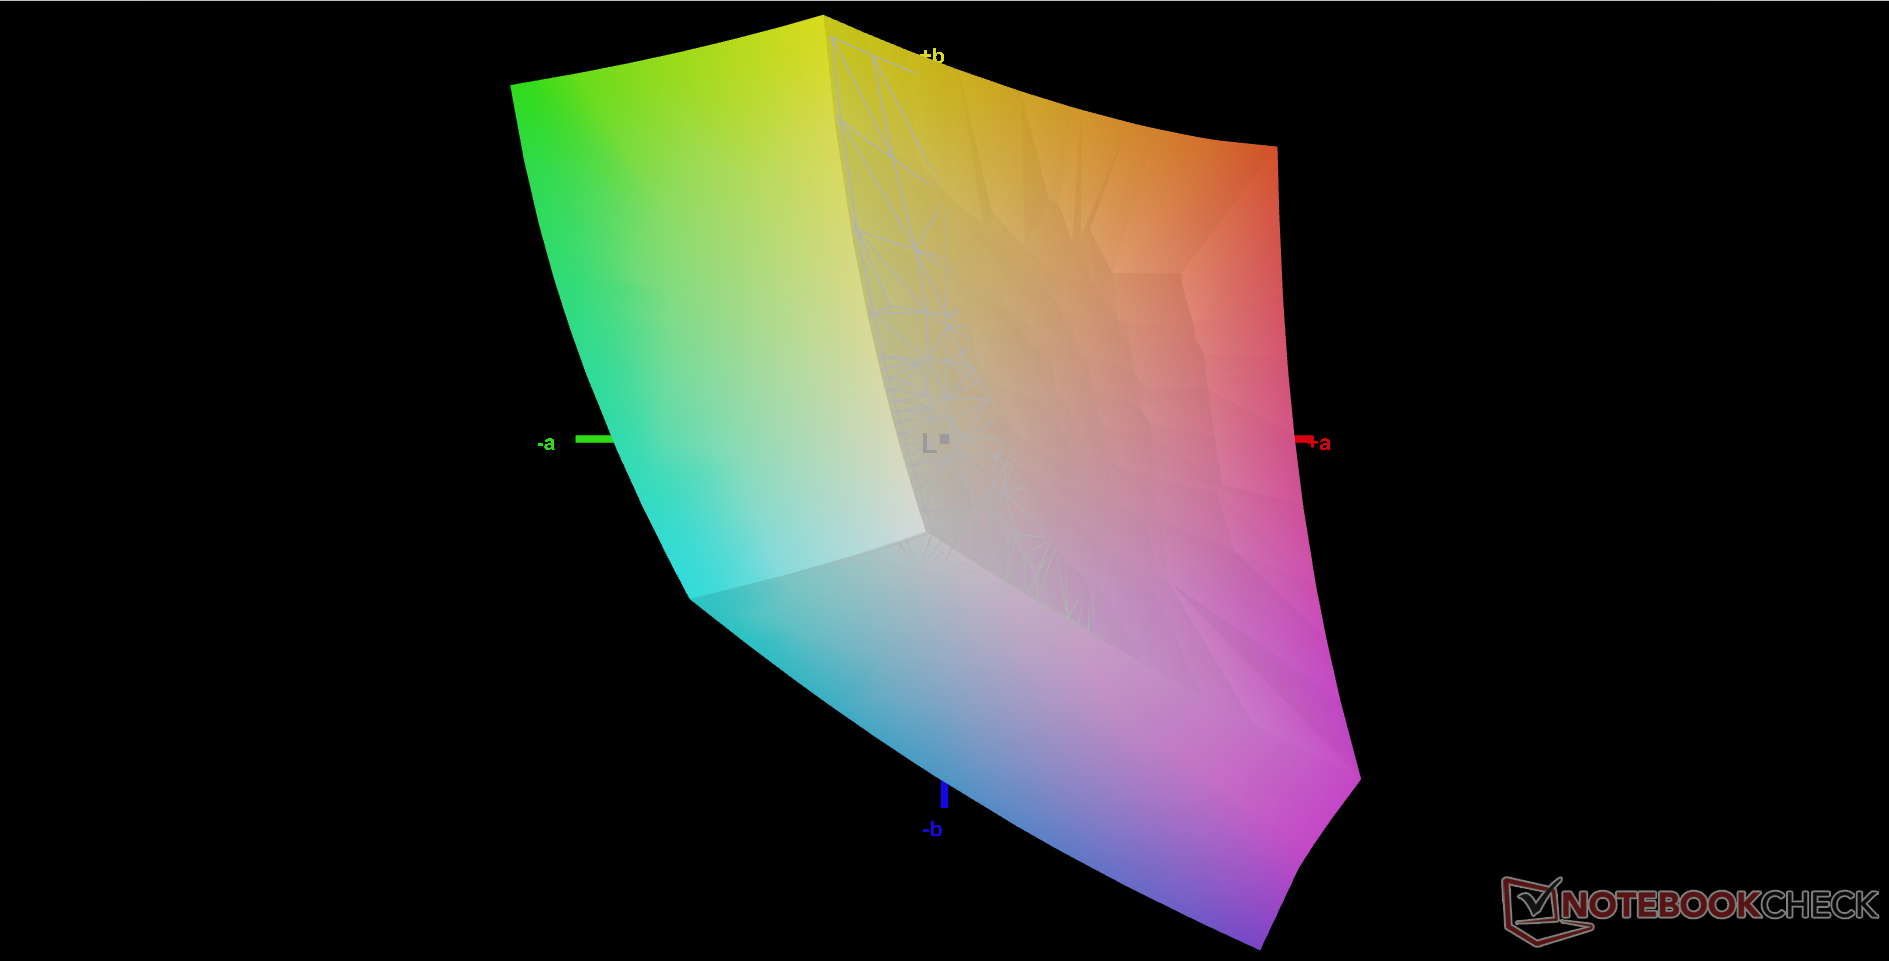
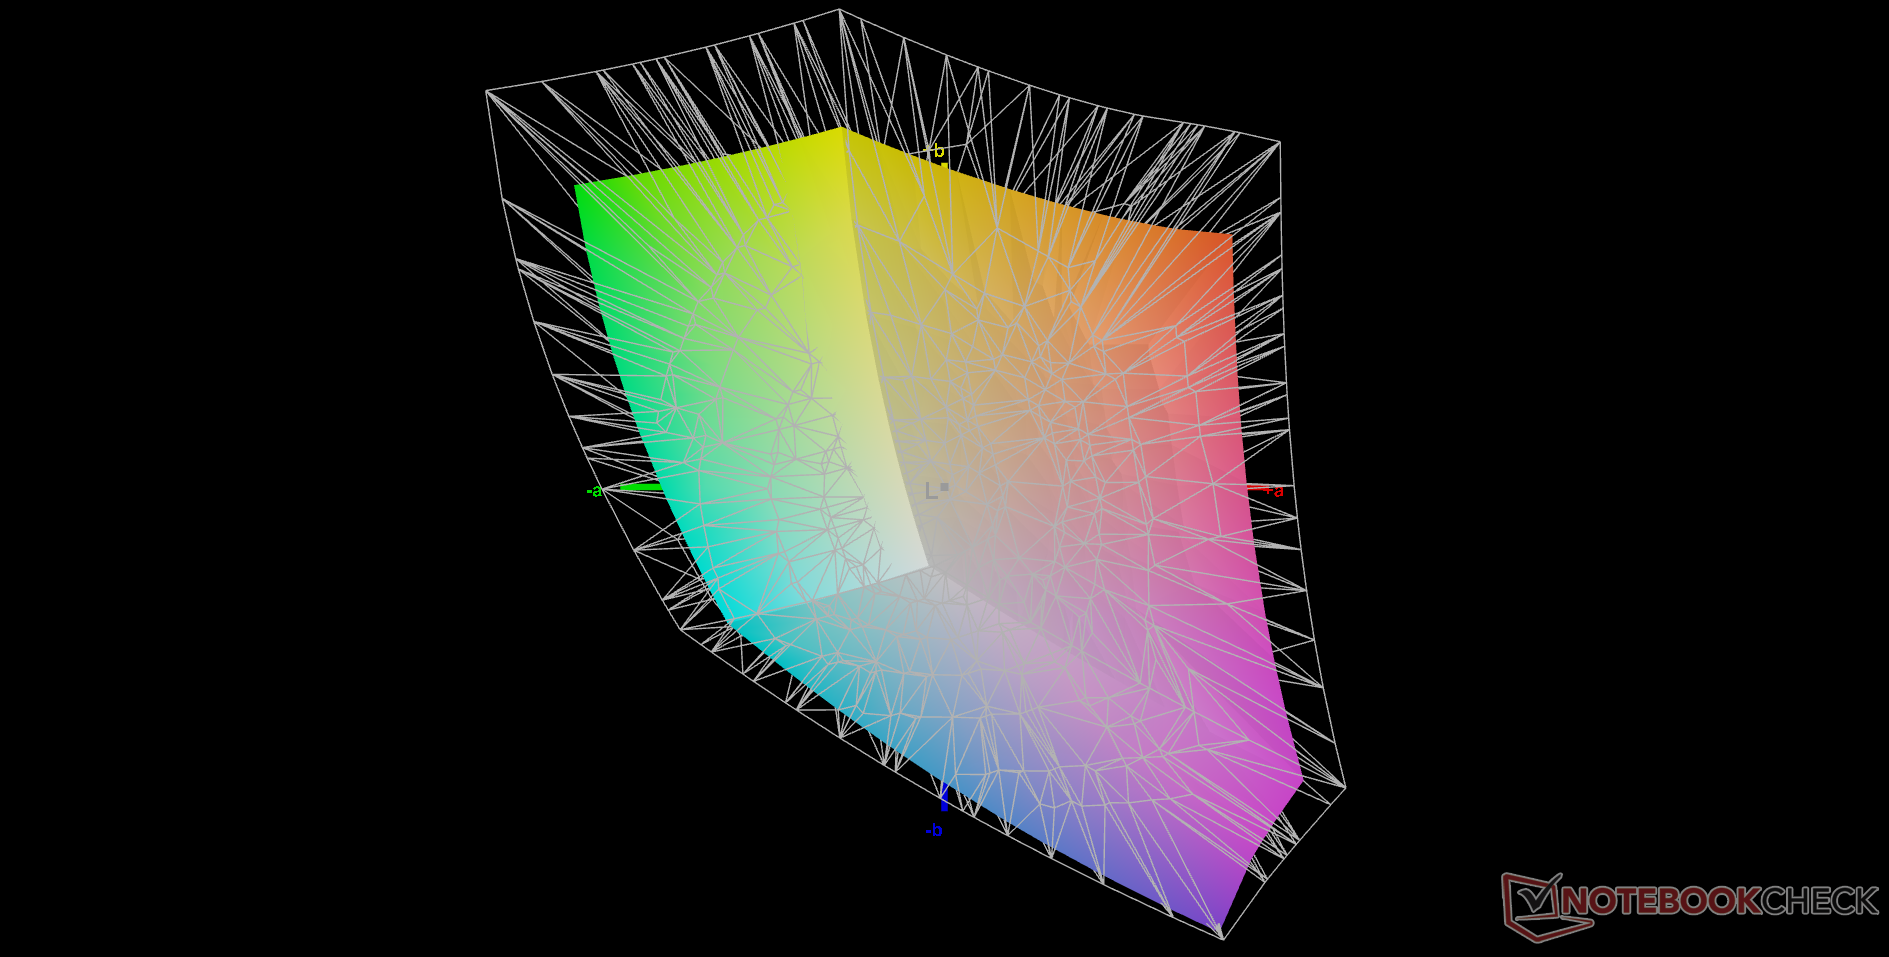
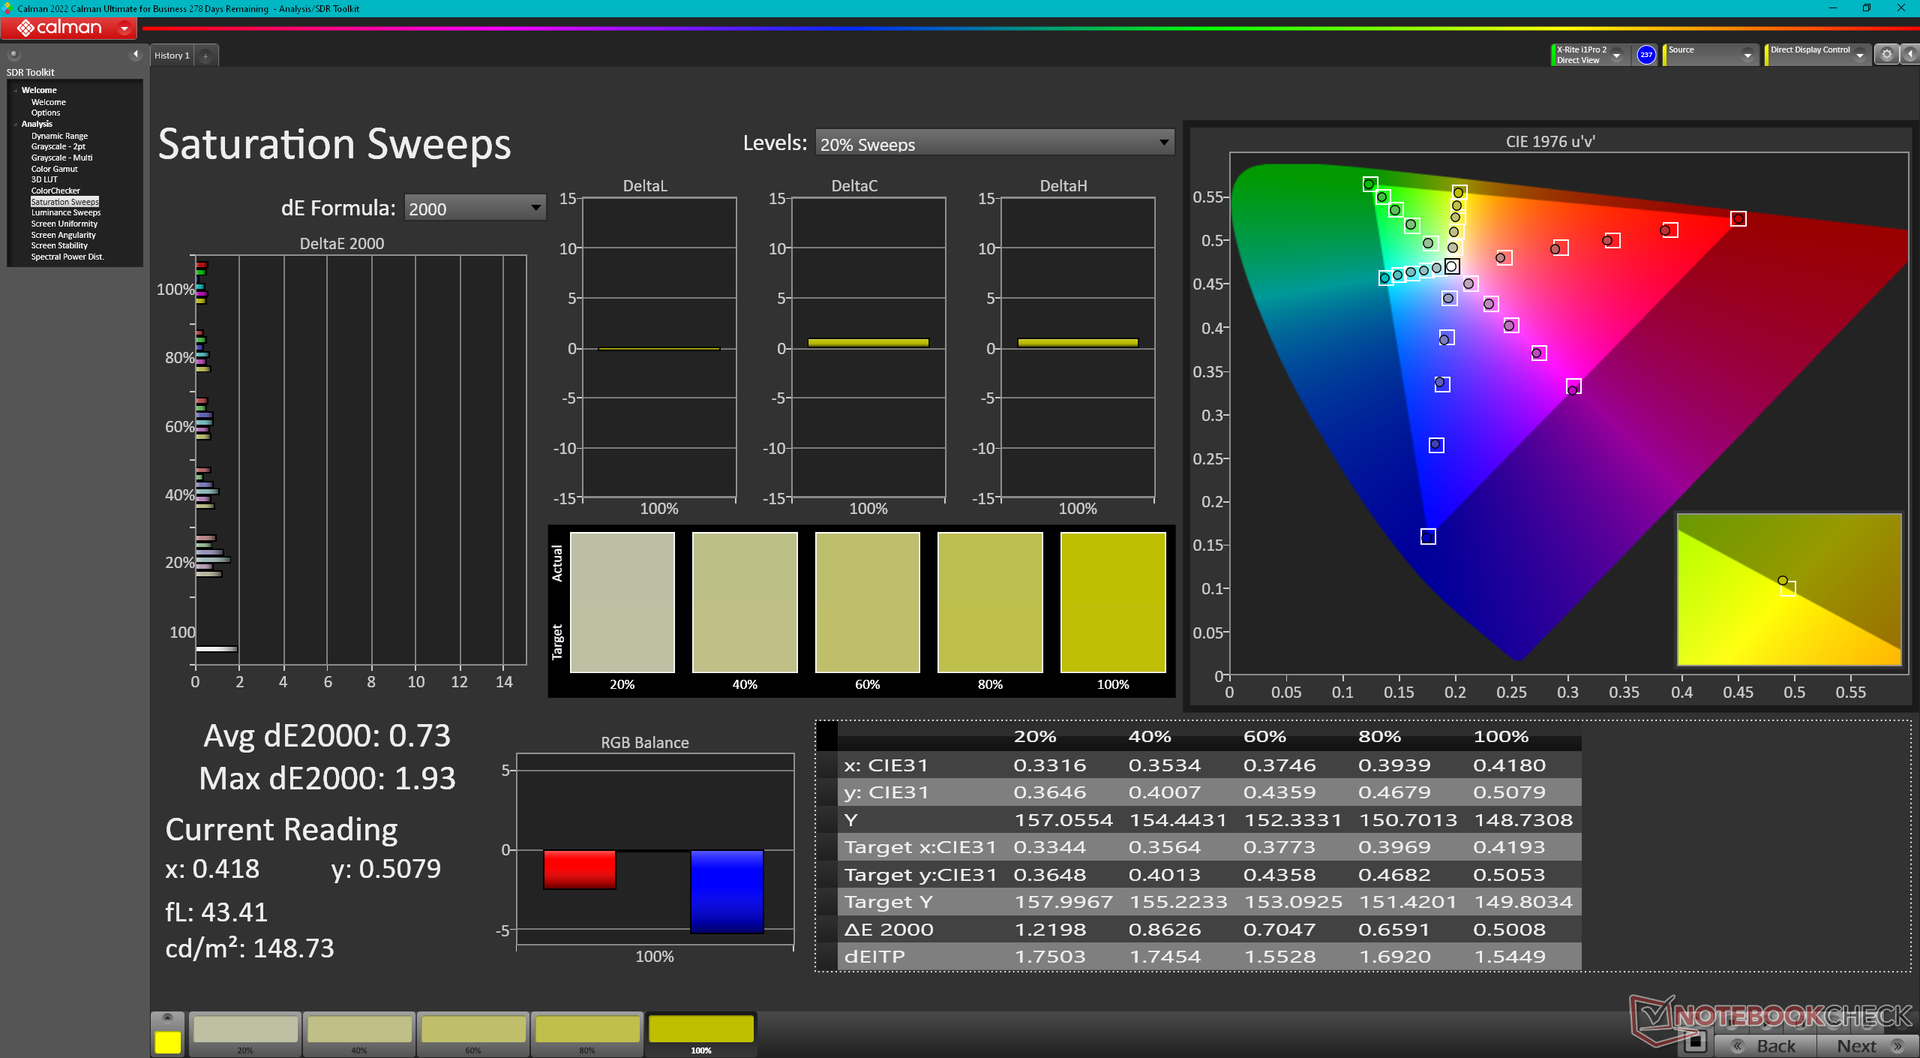
73.7% AdobeRGB 1998 (Argyll 3D)
99.9% sRGB (Argyll 3D)
71.9% Display P3 (Argyll 3D)
Gamma: 2.48
CCT: 6542 K
| MSI Pulse GL76 12UGK Sharp LQ173M1JW08, IPS, 1920x1080, 17.3" | Alienware m17 R5 (R9 6900HX, RX 6850M XT) AU Optronics AUODBA3, IPS, 3840x2160, 17" | Asus ROG Strix Scar 17 SE G733CX-LL014W NE173QHM-NZ2, IPS, 2560x1440, 17.3" | Acer Predator Helios 300 (i7-12700H, RTX 3070 Ti) BOE0A1A, IPS, 2560x1440, 17.3" | Razer Blade 17 Early 2022 AU Optronics B173ZAN06.9, IPS, 3840x2160, 17.3" | MSI Vector GP76 12UGS-434 AUO B173HAN05.4, IPS, 1920x1080, 17.3" | |
|---|---|---|---|---|---|---|
| Display | 18% | 17% | 17% | 19% | -3% | |
| Display P3 Coverage (%) | 71.9 | 97.2 35% | 97.1 35% | 96.8 35% | 99.4 38% | 70.09 -3% |
| sRGB Coverage (%) | 99.9 | 99.6 0% | 99.9 0% | 99.9 0% | 100 0% | 98.98 -1% |
| AdobeRGB 1998 Coverage (%) | 73.7 | 88.4 20% | 84.8 15% | 84.8 15% | 87.3 18% | 70.91 -4% |
| Response Times | -131% | -7% | -129% | -7% | 21% | |
| Response Time Grey 50% / Grey 80% * (ms) | 4.6 ? | 16.4 ? -257% | 5.7 ? -24% | 16.4 ? -257% | 7.5 ? -63% | 4 ? 13% |
| Response Time Black / White * (ms) | 11.2 ? | 11.6 ? -4% | 10.1 ? 10% | 11.2 ? -0% | 5.6 ? 50% | 8 ? 29% |
| PWM Frequency (Hz) | ||||||
| Screen | -43% | 28% | -12% | 34% | 11% | |
| Brightness middle (cd/m²) | 337.7 | 484 43% | 320 -5% | 366 8% | 503 49% | 274 -19% |
| Brightness (cd/m²) | 331 | 449 36% | 303 -8% | 340 3% | 486 47% | 264 -20% |
| Brightness Distribution (%) | 82 | 87 6% | 87 6% | 85 4% | 84 2% | 87 6% |
| Black Level * (cd/m²) | 0.31 | 0.55 -77% | 0.3 3% | 0.31 -0% | 0.44 -42% | 0.25 19% |
| Contrast (:1) | 1089 | 880 -19% | 1067 -2% | 1181 8% | 1143 5% | 1096 1% |
| Colorchecker dE 2000 * | 4.12 | 4.8 -17% | 1.1 73% | 3.56 14% | 1.08 74% | 2.53 39% |
| Colorchecker dE 2000 max. * | 8.89 | 7.48 16% | 2.7 70% | 5.66 36% | 4.54 49% | 6.76 24% |
| Colorchecker dE 2000 calibrated * | 0.98 | 4.74 -384% | 3.31 -238% | 0.6 39% | 0.98 -0% | |
| Greyscale dE 2000 * | 6.3 | 5.5 13% | 1.1 83% | 2.84 55% | 1.3 79% | 3.49 45% |
| Gamma | 2.48 89% | 2.42 91% | 2.13 103% | 2.29 96% | 2.151 102% | 2.31 95% |
| CCT | 6542 99% | 6148 106% | 6599 98% | 6835 95% | 6541 99% | 6714 97% |
| Media total (Programa/Opciones) | -52% /
-42% | 13% /
20% | -41% /
-23% | 15% /
25% | 10% /
9% |
* ... más pequeño es mejor
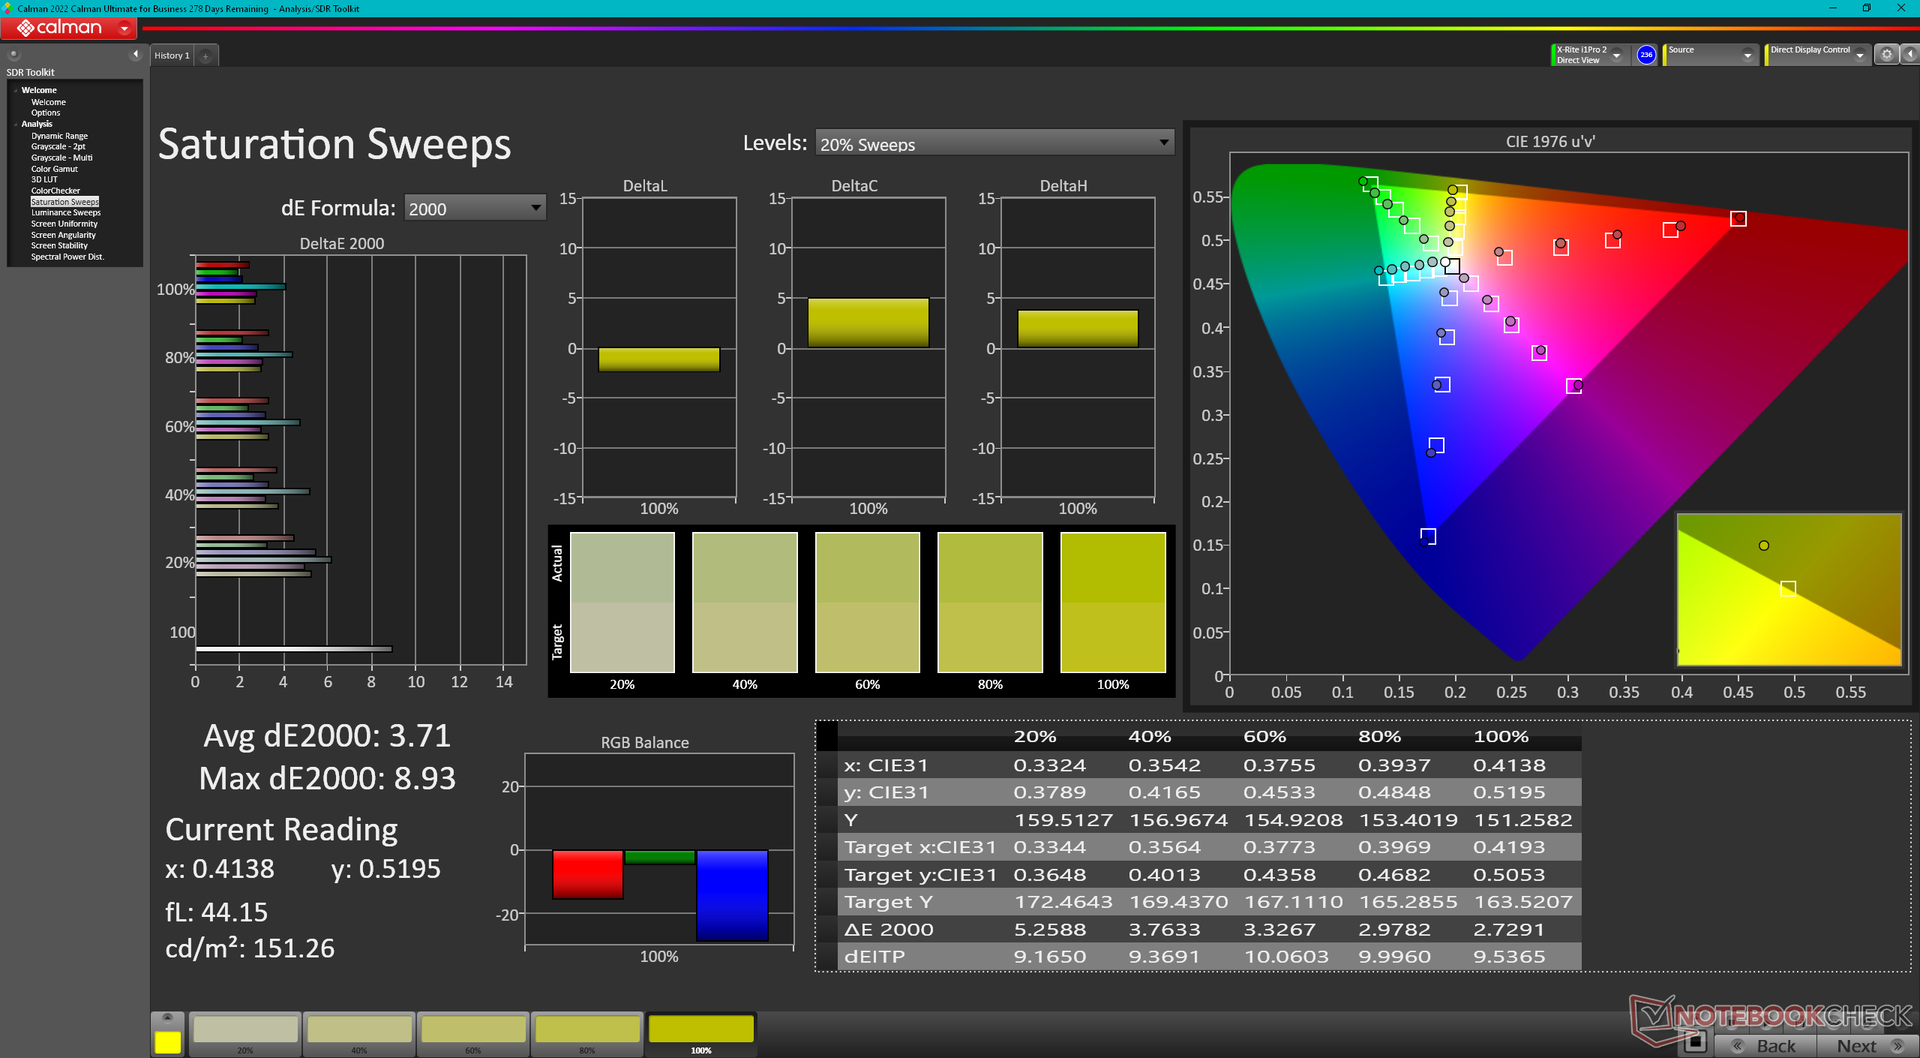
La pantalla no está calibrada de fábrica. Los valores DeltaE medios de escala de grises y color mejorarían significativamente de 6,3 y 4,12 a sólo 1,4 y 0,98, respectivamente, tras una calibración adecuada con un colorímetro X-Rite. Recomendamos aplicar nuestro perfil ICM anterior para aprovechar mejor toda la cobertura sRGB del panel.
Tiempos de respuesta del display
| ↔ Tiempo de respuesta de Negro a Blanco | ||
|---|---|---|
| 11.2 ms ... subida ↗ y bajada ↘ combinada | ↗ 6.8 ms subida | 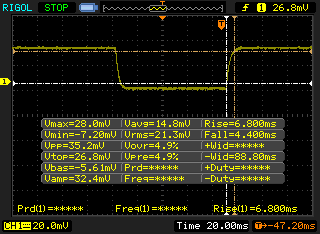 |
| ↘ 4.4 ms bajada | ||
| La pantalla mostró buenos tiempos de respuesta en nuestros tests pero podría ser demasiado lenta para los jugones competitivos. En comparación, todos los dispositivos de prueba van de ##min### (mínimo) a 240 (máximo) ms. » 30 % de todos los dispositivos son mejores. Esto quiere decir que el tiempo de respuesta medido es mejor que la media (19.8 ms) de todos los dispositivos testados. | ||
| ↔ Tiempo de respuesta 50% Gris a 80% Gris | ||
| 4.6 ms ... subida ↗ y bajada ↘ combinada | ↗ 2.2 ms subida | 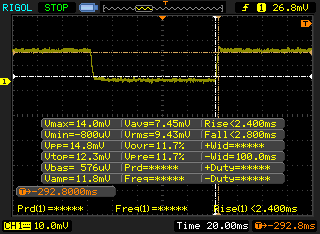 |
| ↘ 2.4 ms bajada | ||
| La pantalla mostró tiempos de respuesta muy rápidos en nuestros tests y debería ser adecuada para juegos frenéticos. En comparación, todos los dispositivos de prueba van de ##min### (mínimo) a 636 (máximo) ms. » 16 % de todos los dispositivos son mejores. Esto quiere decir que el tiempo de respuesta medido es mejor que la media (31 ms) de todos los dispositivos testados. | ||
Parpadeo de Pantalla / PWM (Pulse-Width Modulation)
| Parpadeo de Pantalla / PWM no detectado | 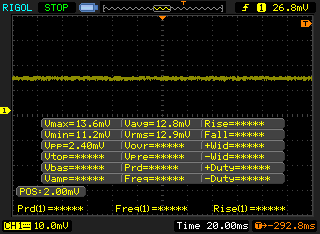 | ||
Comparación: 52 % de todos los dispositivos testados no usaron PWM para atenuar el display. Si se usó, medimos una media de 7763 (mínimo: 5 - máxmo: 343500) Hz. | |||
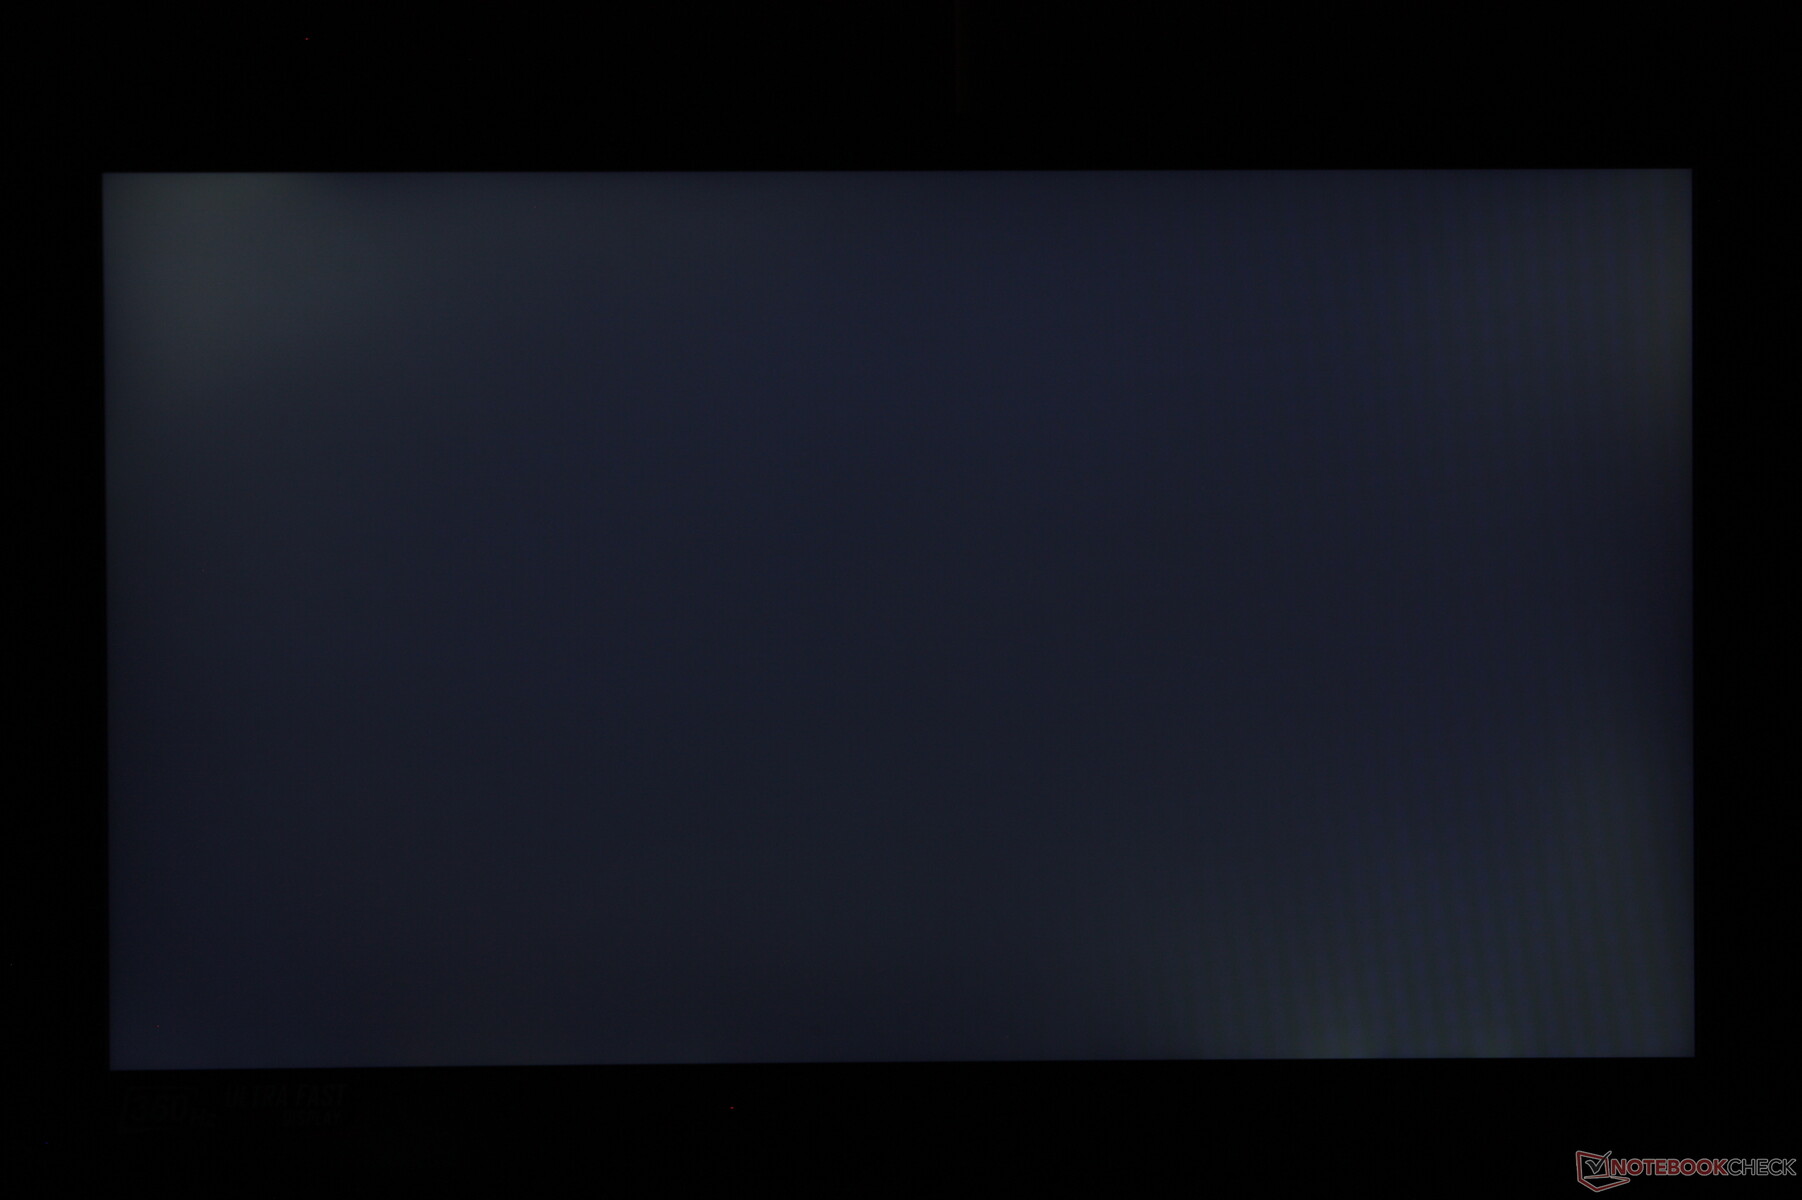
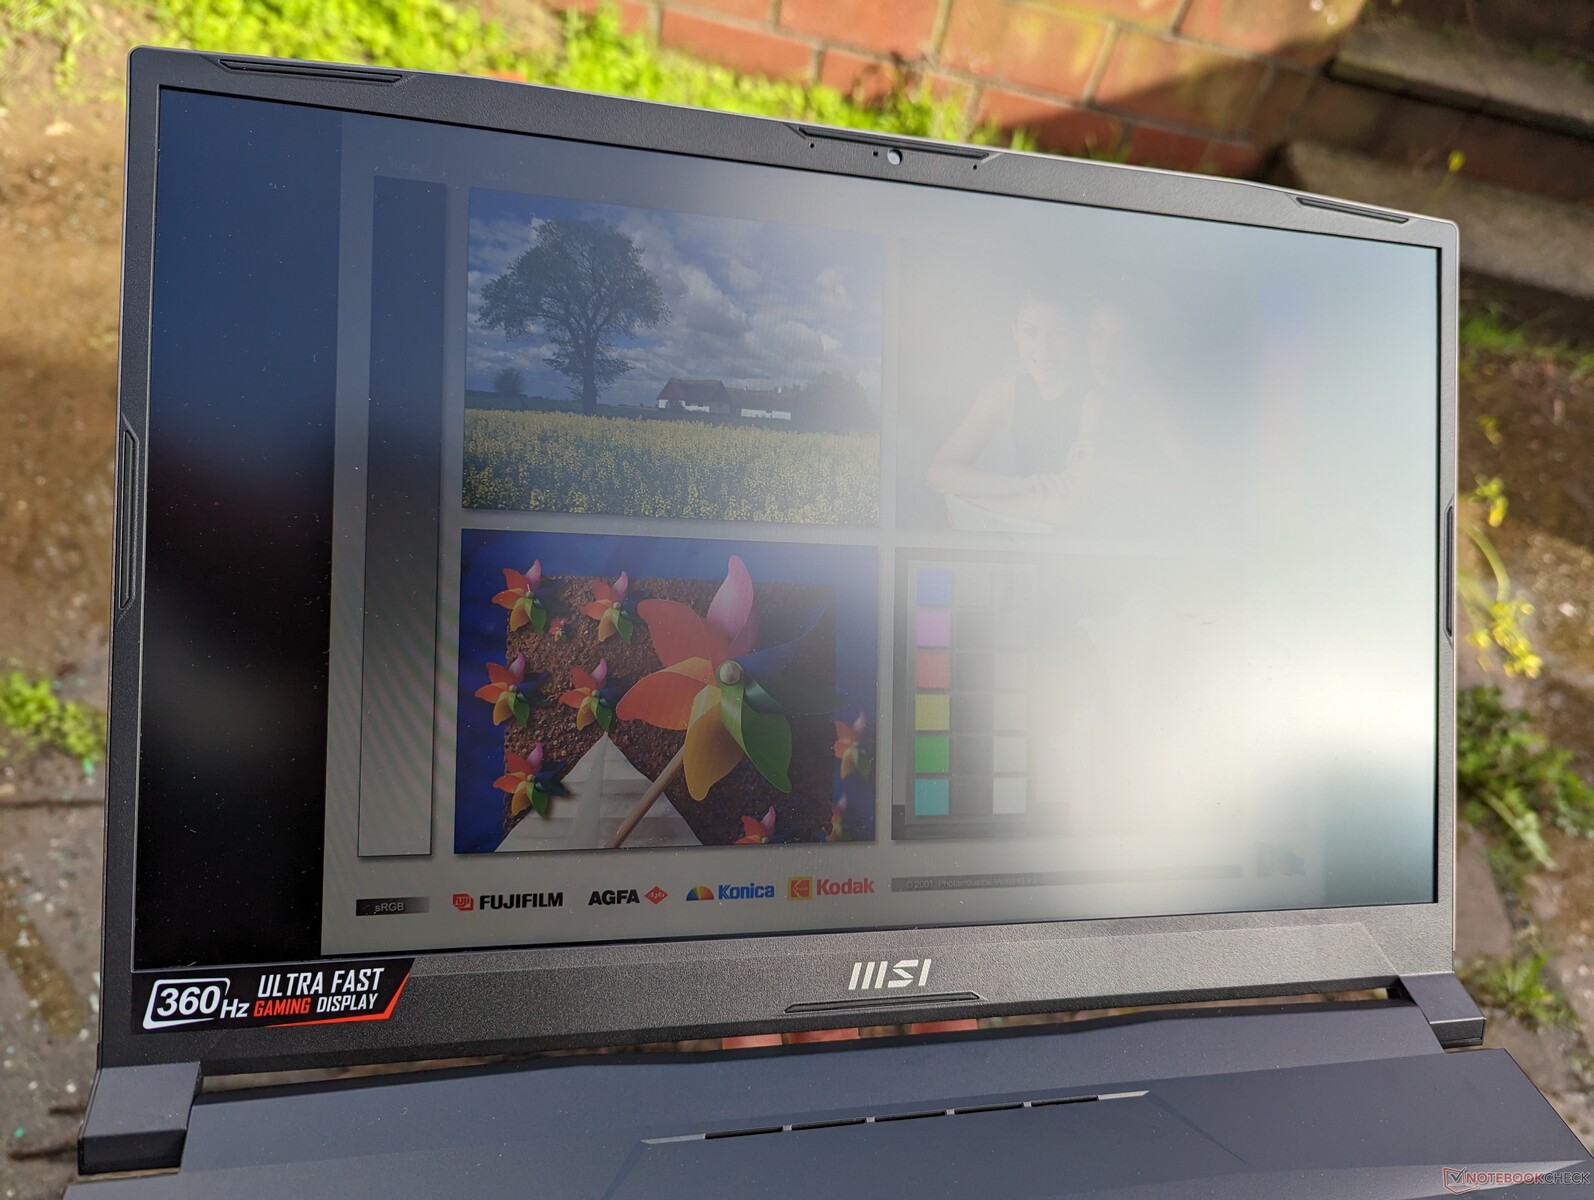
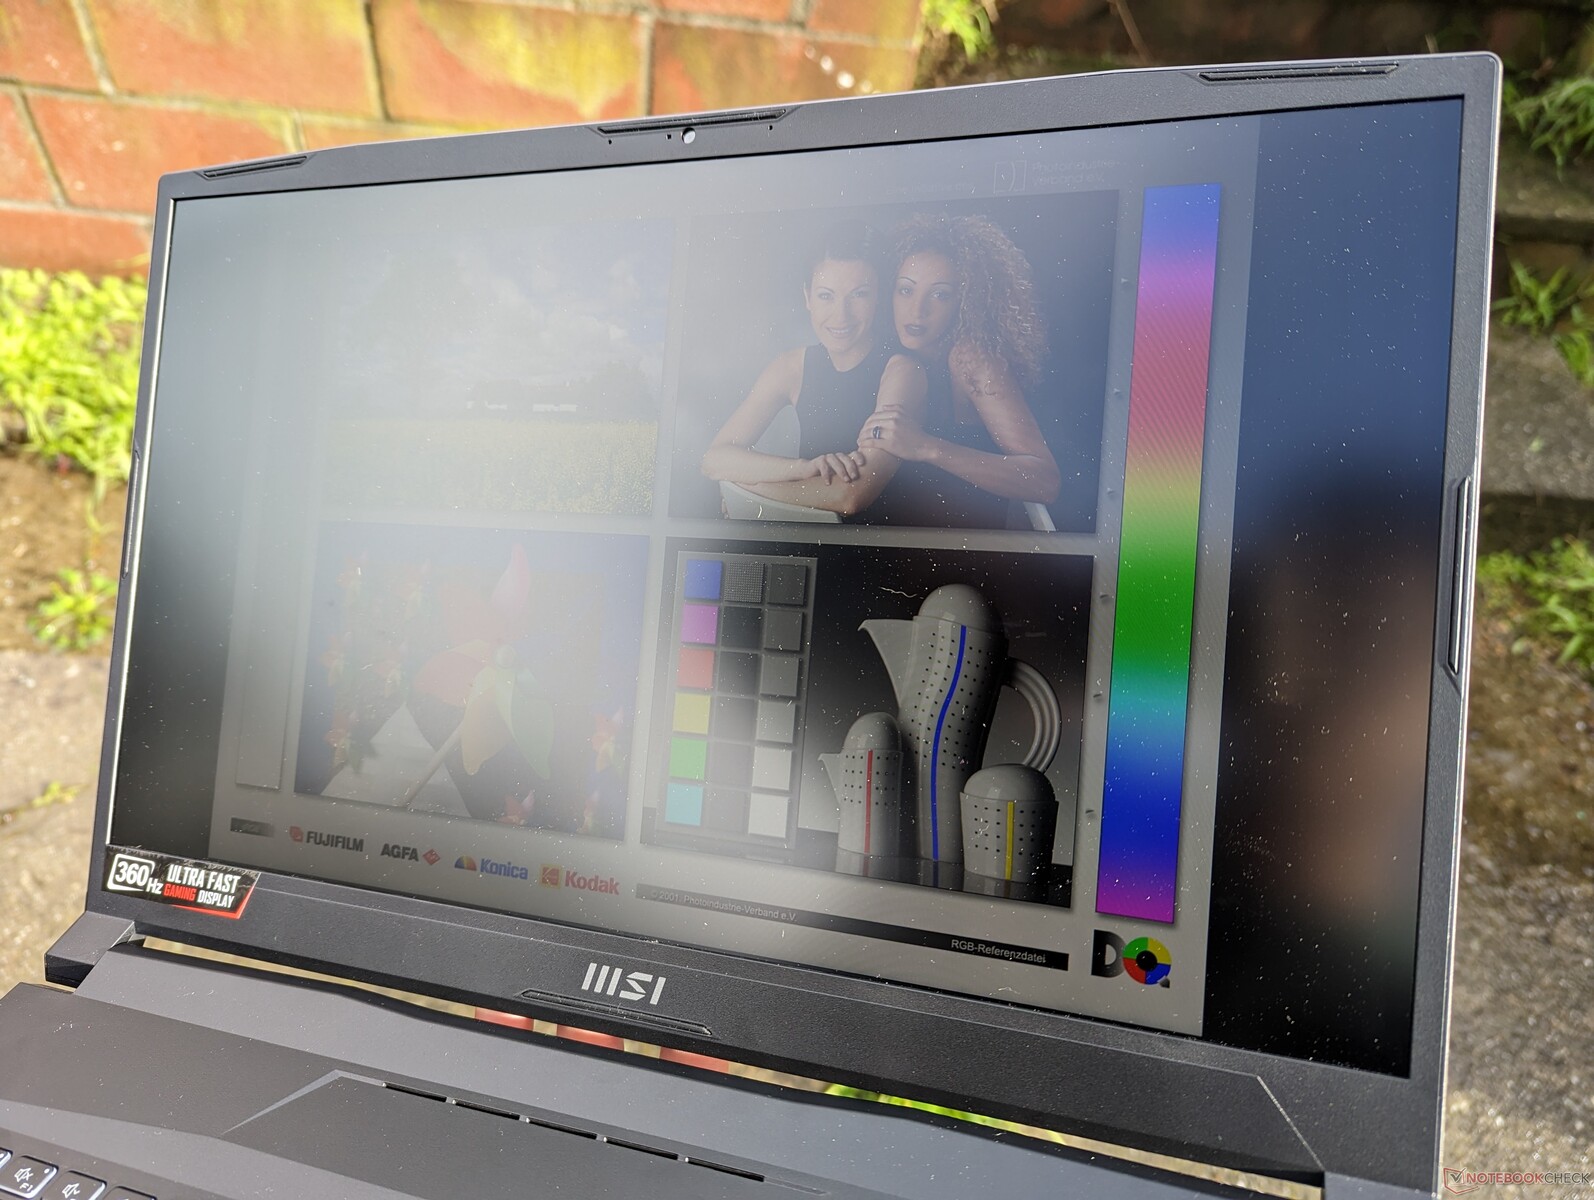
La pantalla mate es lo suficientemente brillante para usarla a la sombra, pero no está diseñada para condiciones exteriores más brillantes. Algunos portátiles para juegos, como el Razer Blade 17 OLEDtienen pantallas de 500 nits más brillantes para facilitar la lectura en exteriores.
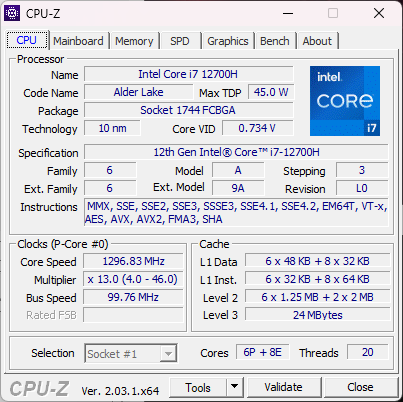
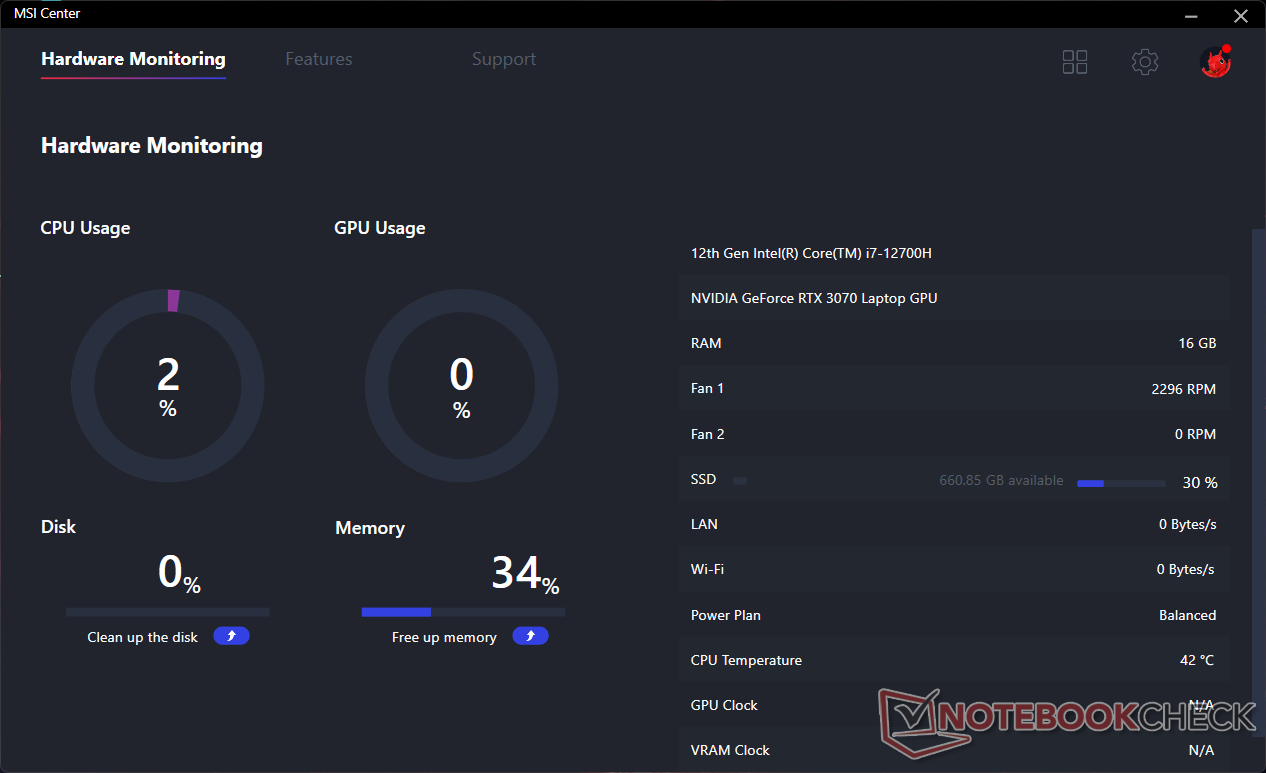
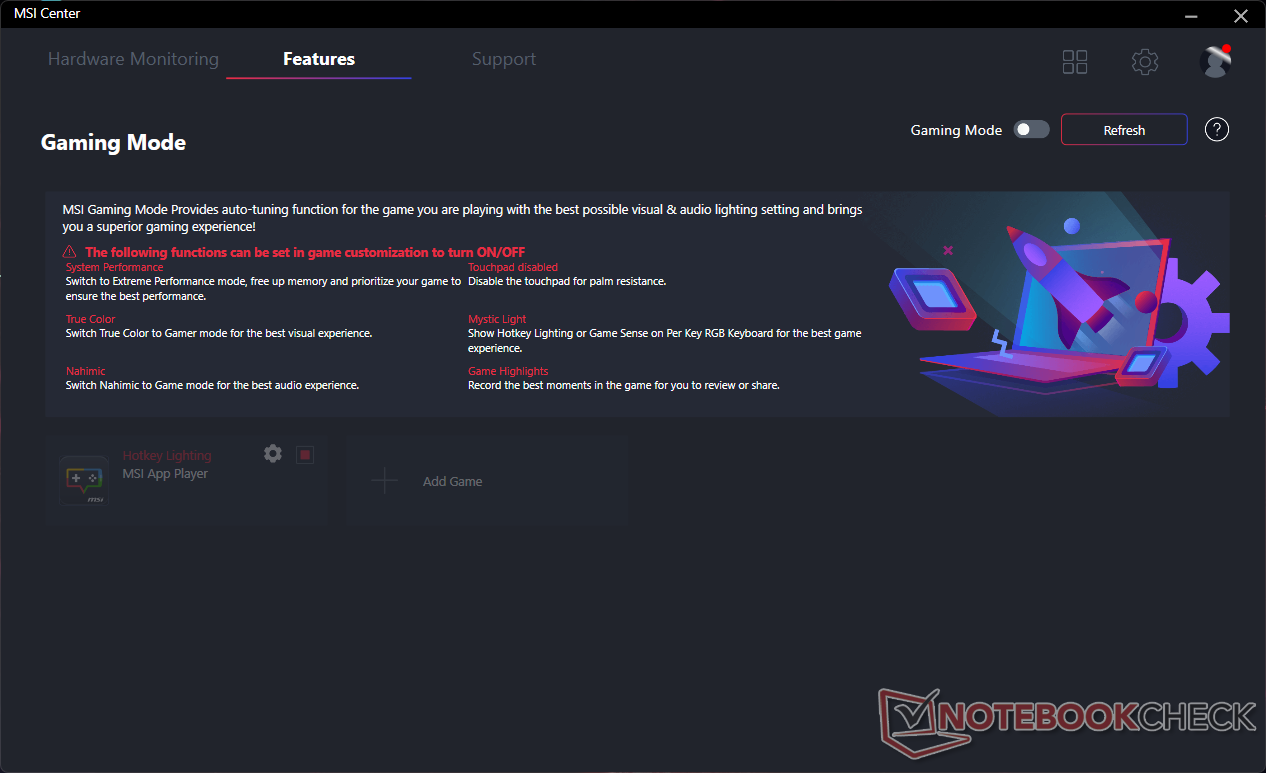
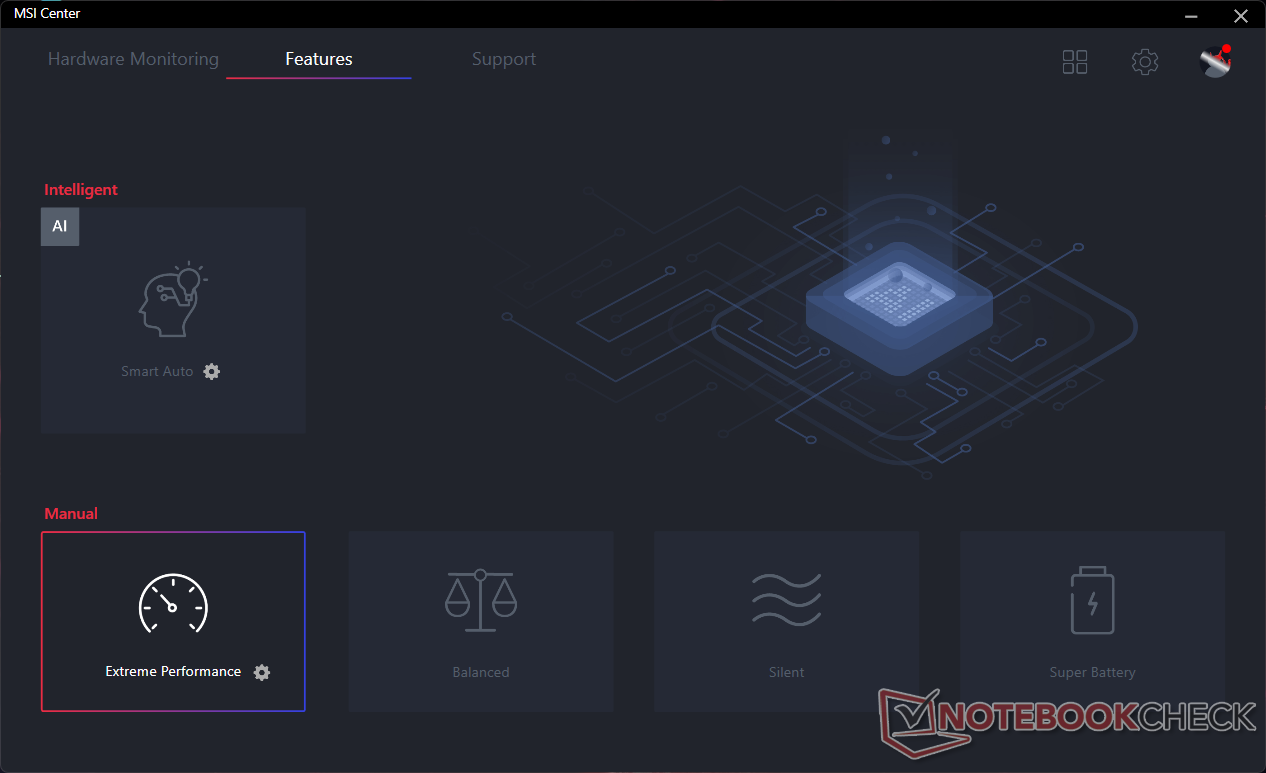
Rendimiento - Intel de 12ª generación Alder Lake-H
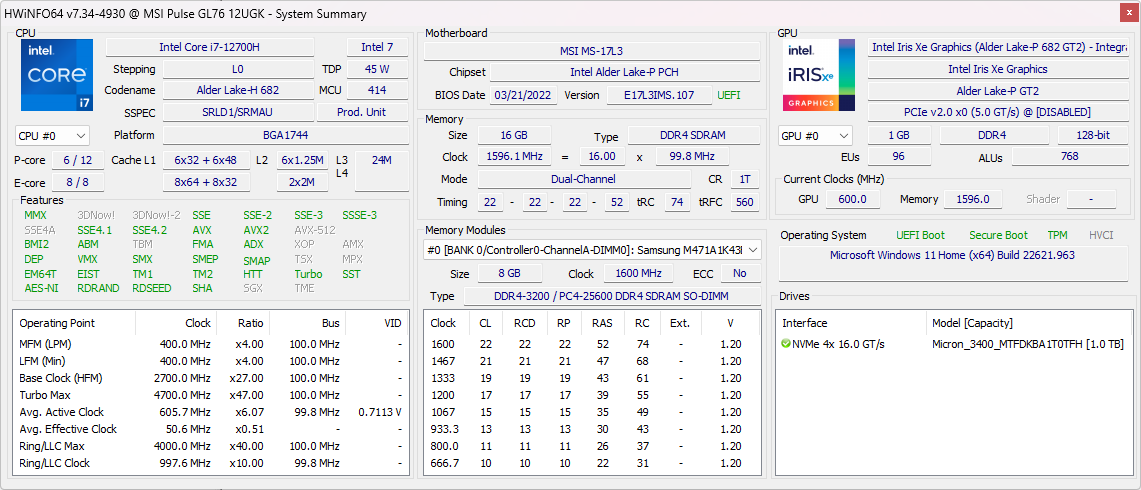
Condiciones de ensayo
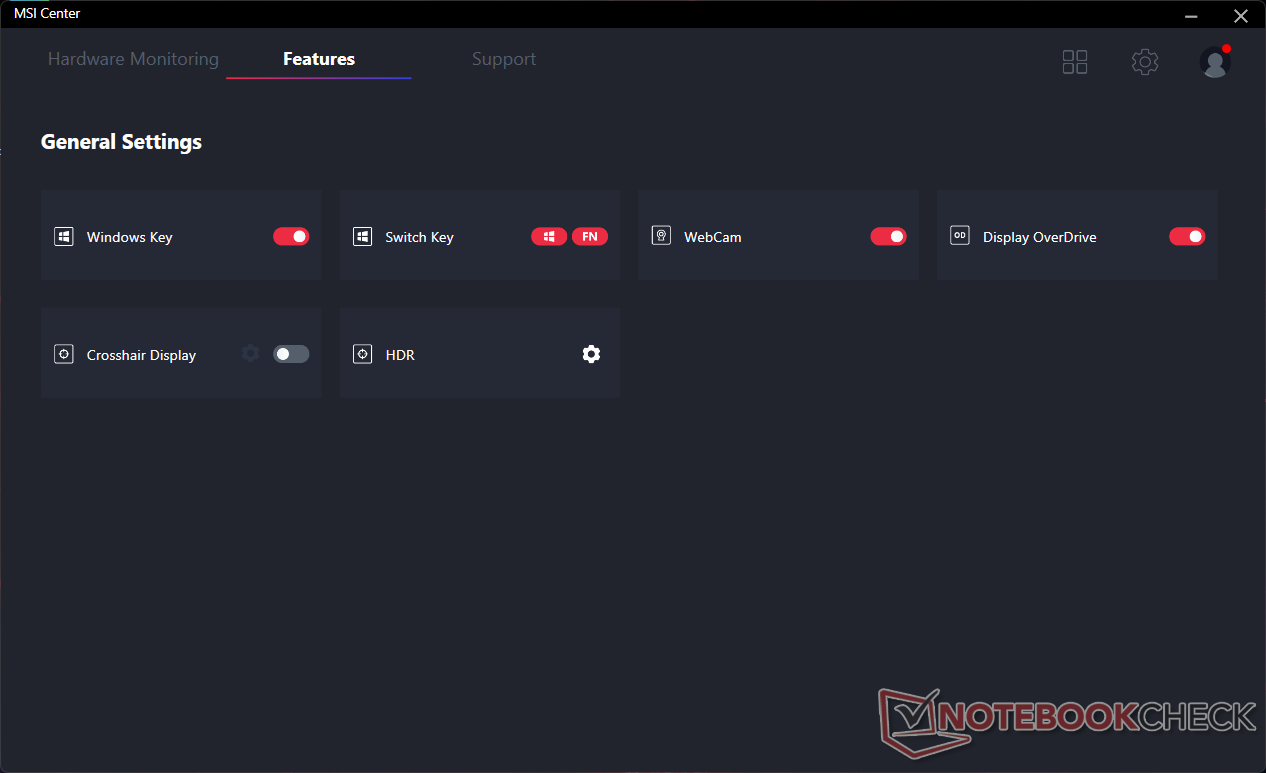
Pusimos nuestra unidad en modo Rendimiento a través de Windows y en modo Rendimiento extremo a través de MSI Center con la dGPU activa antes de ejecutar las pruebas de rendimiento que se indican a continuación. El modo ventilador también estaba en Auto. Los usuarios deben familiarizarse con el Centro MSI, ya que es el centro de control para las actualizaciones específicas de MSI, perfiles de rendimiento, monitoreo de hardware, y más, como se muestra en las capturas de pantalla a continuación.
No hay soporte para Advanced Optimus o MUX en la serie GL76.
Procesador
El rendimiento de la CPU es excelente con resultados multihilo que son aproximadamente un 10 por ciento más rápidos que la media de portátiles de nuestra base de datos equipados con el mismo Core i7-12700H CPU. En general, está a unos pocos puntos porcentuales del Core i9-12900H del mucho más caro Alienware x15 R2.
Optar por la gama baja Core i5-12500H en lugar de nuestro Core i7, el resultado sería un déficit de rendimiento multihilo de alrededor del 15 por ciento.
Cinebench R15 Multi Loop
Cinebench R20: CPU (Multi Core) | CPU (Single Core)
Cinebench R23: Multi Core | Single Core
Cinebench R15: CPU Multi 64Bit | CPU Single 64Bit
Blender: v2.79 BMW27 CPU
7-Zip 18.03: 7z b 4 | 7z b 4 -mmt1
Geekbench 5.5: Multi-Core | Single-Core
HWBOT x265 Benchmark v2.2: 4k Preset
LibreOffice : 20 Documents To PDF
R Benchmark 2.5: Overall mean
| HWBOT x265 Benchmark v2.2 / 4k Preset | |
| MSI GE67 HX 12UGS | |
| Asus ROG Strix Scar 17 SE G733CX-LL014W | |
| Alienware x15 R2 P111F | |
| MSI Pulse GL76 12UGK | |
| Razer Blade 15 2022 | |
| Alienware m17 R5 (R9 6900HX, RX 6850M XT) | |
| Medio Intel Core i7-12700H (4.67 - 21.8, n=64) | |
| HP Omen 16-n0033dx | |
| Lenovo IdeaPad Gaming 3 15IAH7 | |
| MSI GE76 Raider 10UH | |
| Schenker XMG Apex 15 Max | |
* ... más pequeño es mejor
AIDA64: FP32 Ray-Trace | FPU Julia | CPU SHA3 | CPU Queen | FPU SinJulia | FPU Mandel | CPU AES | CPU ZLib | FP64 Ray-Trace | CPU PhotoWorxx
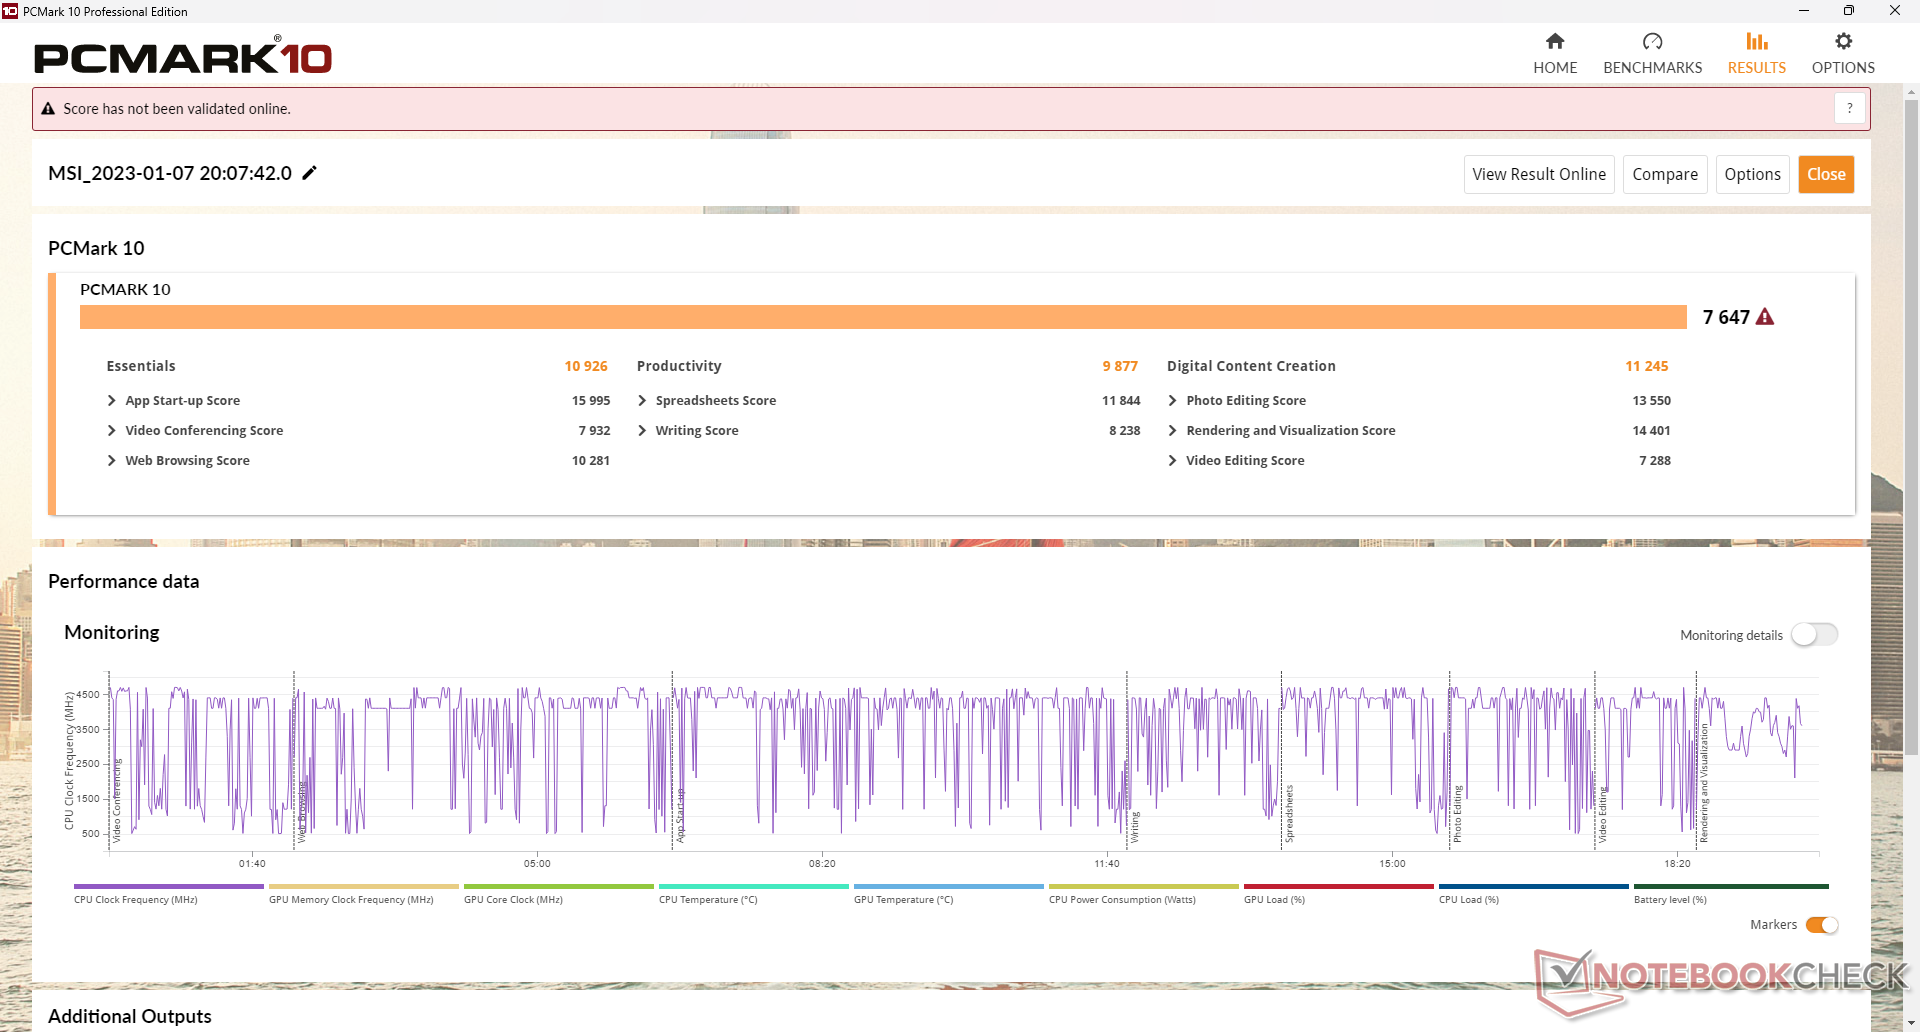
Rendimiento del sistema
Los resultados de PCMark son excelentes y comparables a los de portátiles para juegos de gama alta como elAsus ROG Strix Scar 17. En otras palabras, el GL76 puede ofrecer casi el mismo rendimiento que una alternativa emblemática pero por mucho menos dinero.
CrossMark: Overall | Productivity | Creativity | Responsiveness
| PCMark 10 / Score | |
| MSI Vector GP76 12UGS-434 | |
| Acer Predator Helios 300 (i7-12700H, RTX 3070 Ti) | |
| MSI Pulse GL76 12UGK | |
| Medio Intel Core i7-12700H, NVIDIA GeForce RTX 3070 Laptop GPU (7082 - 7647, n=2) | |
| Alienware m17 R5 (R9 6900HX, RX 6850M XT) | |
| Asus ROG Strix Scar 17 SE G733CX-LL014W | |
| Razer Blade 17 Early 2022 | |
| PCMark 10 / Essentials | |
| MSI Pulse GL76 12UGK | |
| Acer Predator Helios 300 (i7-12700H, RTX 3070 Ti) | |
| MSI Vector GP76 12UGS-434 | |
| Medio Intel Core i7-12700H, NVIDIA GeForce RTX 3070 Laptop GPU (10076 - 10926, n=2) | |
| Asus ROG Strix Scar 17 SE G733CX-LL014W | |
| Razer Blade 17 Early 2022 | |
| Alienware m17 R5 (R9 6900HX, RX 6850M XT) | |
| PCMark 10 / Productivity | |
| MSI Vector GP76 12UGS-434 | |
| Acer Predator Helios 300 (i7-12700H, RTX 3070 Ti) | |
| MSI Pulse GL76 12UGK | |
| Asus ROG Strix Scar 17 SE G733CX-LL014W | |
| Medio Intel Core i7-12700H, NVIDIA GeForce RTX 3070 Laptop GPU (9460 - 9877, n=2) | |
| Razer Blade 17 Early 2022 | |
| Alienware m17 R5 (R9 6900HX, RX 6850M XT) | |
| PCMark 10 / Digital Content Creation | |
| Acer Predator Helios 300 (i7-12700H, RTX 3070 Ti) | |
| MSI Vector GP76 12UGS-434 | |
| Alienware m17 R5 (R9 6900HX, RX 6850M XT) | |
| MSI Pulse GL76 12UGK | |
| Medio Intel Core i7-12700H, NVIDIA GeForce RTX 3070 Laptop GPU (10113 - 11245, n=2) | |
| Razer Blade 17 Early 2022 | |
| Asus ROG Strix Scar 17 SE G733CX-LL014W | |
| CrossMark / Overall | |
| Asus ROG Strix Scar 17 SE G733CX-LL014W | |
| MSI Vector GP76 12UGS-434 | |
| Medio Intel Core i7-12700H, NVIDIA GeForce RTX 3070 Laptop GPU (1844 - 2003, n=2) | |
| Acer Predator Helios 300 (i7-12700H, RTX 3070 Ti) | |
| MSI Pulse GL76 12UGK | |
| Razer Blade 17 Early 2022 | |
| Alienware m17 R5 (R9 6900HX, RX 6850M XT) | |
| CrossMark / Productivity | |
| Asus ROG Strix Scar 17 SE G733CX-LL014W | |
| MSI Vector GP76 12UGS-434 | |
| Medio Intel Core i7-12700H, NVIDIA GeForce RTX 3070 Laptop GPU (1785 - 1971, n=2) | |
| MSI Pulse GL76 12UGK | |
| Acer Predator Helios 300 (i7-12700H, RTX 3070 Ti) | |
| Razer Blade 17 Early 2022 | |
| Alienware m17 R5 (R9 6900HX, RX 6850M XT) | |
| CrossMark / Creativity | |
| Asus ROG Strix Scar 17 SE G733CX-LL014W | |
| Acer Predator Helios 300 (i7-12700H, RTX 3070 Ti) | |
| Medio Intel Core i7-12700H, NVIDIA GeForce RTX 3070 Laptop GPU (1912 - 1979, n=2) | |
| MSI Vector GP76 12UGS-434 | |
| MSI Pulse GL76 12UGK | |
| Razer Blade 17 Early 2022 | |
| Alienware m17 R5 (R9 6900HX, RX 6850M XT) | |
| CrossMark / Responsiveness | |
| MSI Vector GP76 12UGS-434 | |
| Medio Intel Core i7-12700H, NVIDIA GeForce RTX 3070 Laptop GPU (1824 - 2182, n=2) | |
| Asus ROG Strix Scar 17 SE G733CX-LL014W | |
| MSI Pulse GL76 12UGK | |
| Acer Predator Helios 300 (i7-12700H, RTX 3070 Ti) | |
| Razer Blade 17 Early 2022 | |
| Alienware m17 R5 (R9 6900HX, RX 6850M XT) | |
| PCMark 10 Score | 7647 puntos | |
ayuda | ||
| AIDA64 / Memory Latency | |
| Alienware m17 R5 (R9 6900HX, RX 6850M XT) | |
| MSI Pulse GL76 12UGK | |
| MSI Vector GP76 12UGS-434 | |
| Acer Predator Helios 300 (i7-12700H, RTX 3070 Ti) | |
| Asus ROG Strix Scar 17 SE G733CX-LL014W | |
| Medio Intel Core i7-12700H (76.2 - 133.9, n=62) | |
* ... más pequeño es mejor
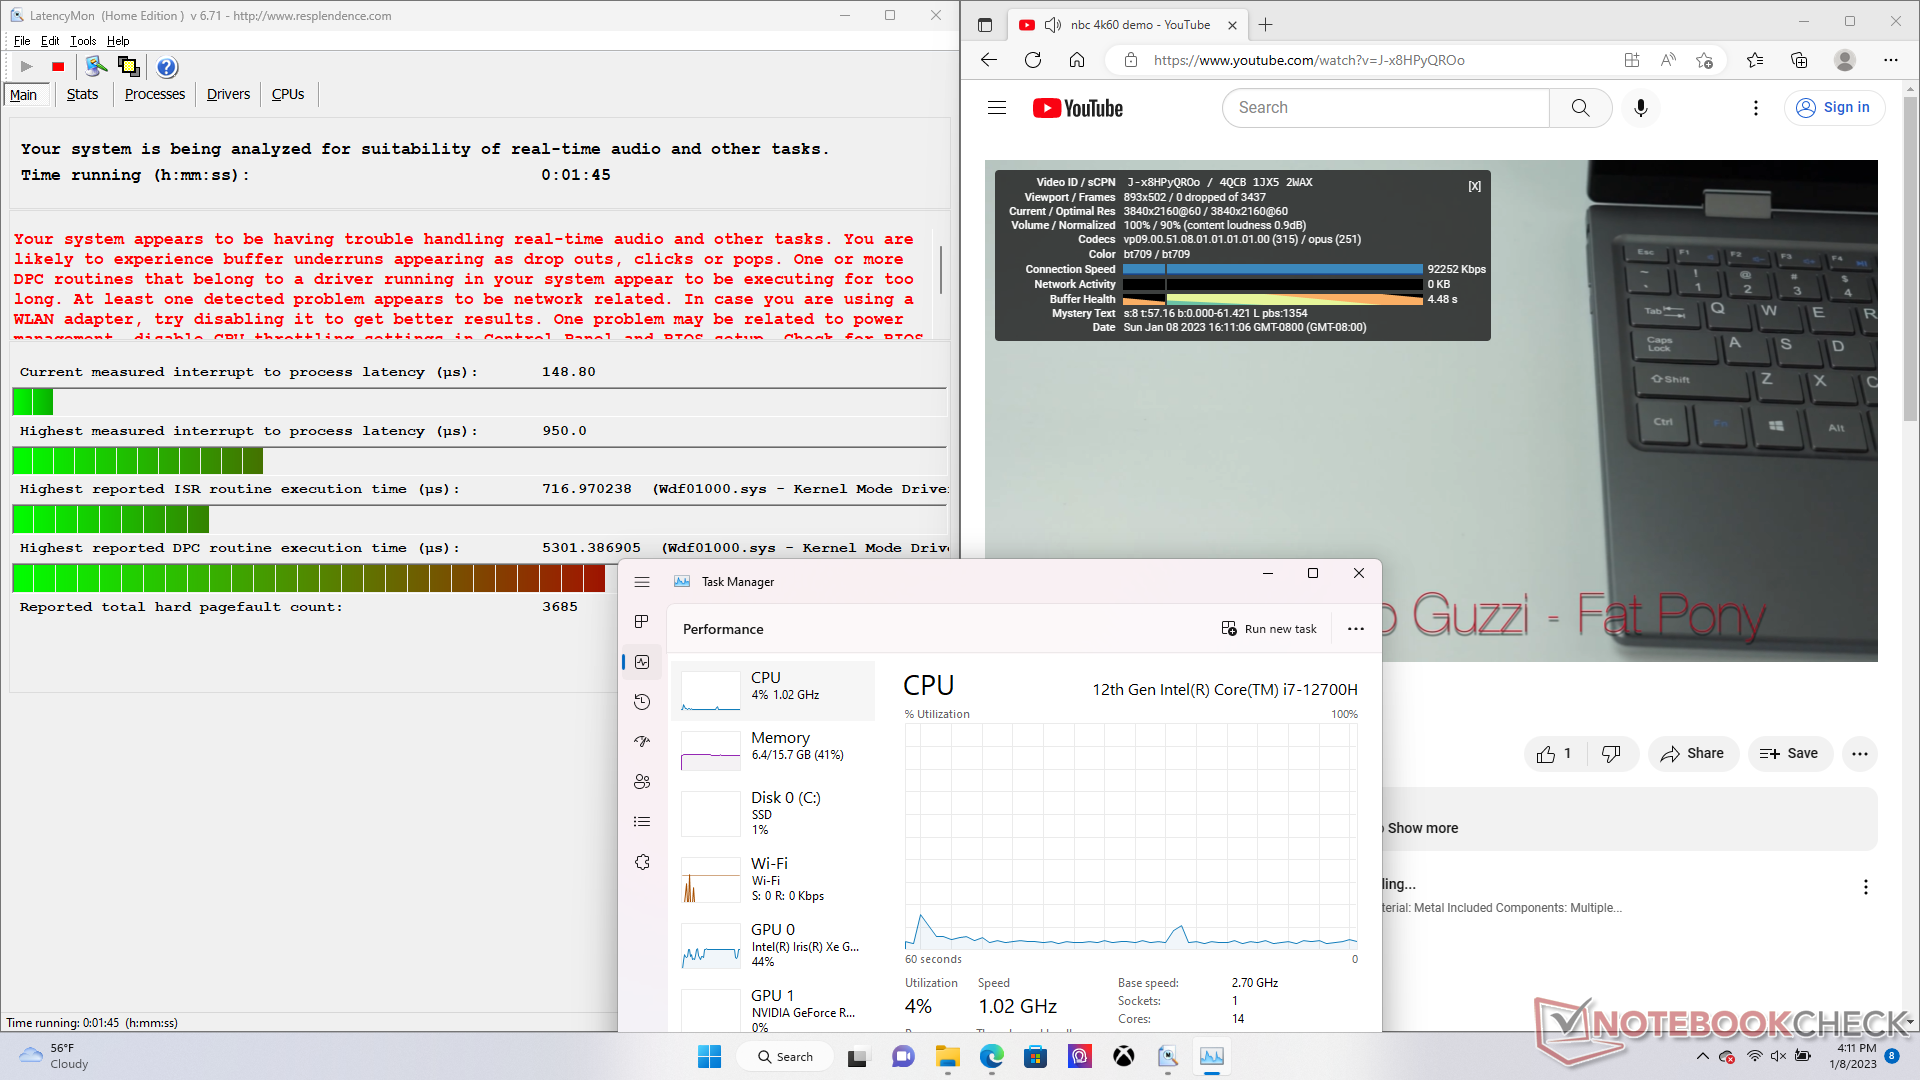
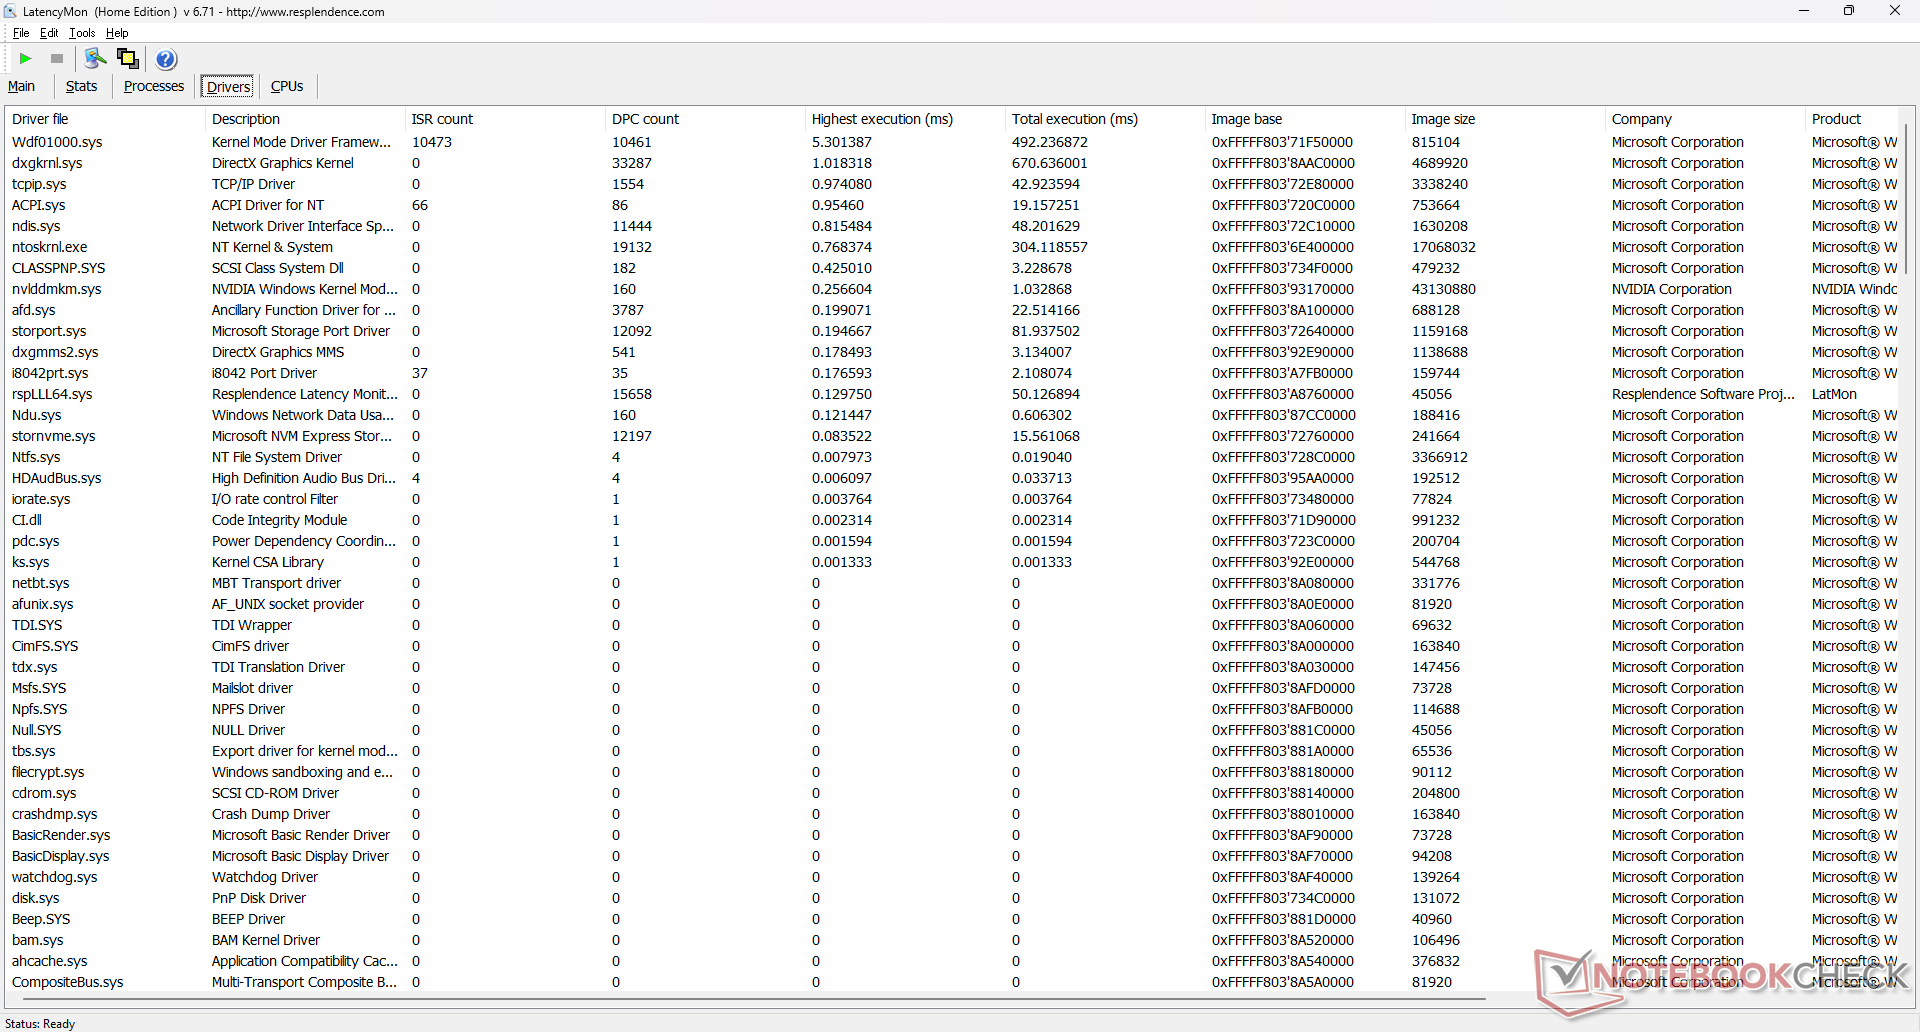
Latencia del CPD
LatencyMon no revela problemas de CPD al abrir varias pestañas de nuestra página de inicio. la reproducción de vídeo 4K a 60 FPS también es impecable, sin caídas de fotogramas.
| DPC Latencies / LatencyMon - interrupt to process latency (max), Web, Youtube, Prime95 | |
| Asus ROG Strix Scar 17 SE G733CX-LL014W | |
| MSI Vector GP76 12UGS-434 | |
| Acer Predator Helios 300 (i7-12700H, RTX 3070 Ti) | |
| Alienware m17 R5 (R9 6900HX, RX 6850M XT) | |
| MSI Pulse GL76 12UGK | |
| Razer Blade 17 Early 2022 | |
* ... más pequeño es mejor
Dispositivos de almacenamiento: hasta dos SSD NVMe
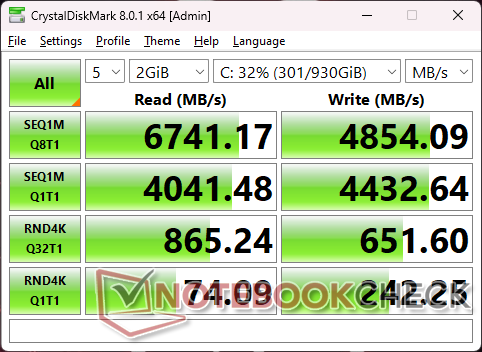
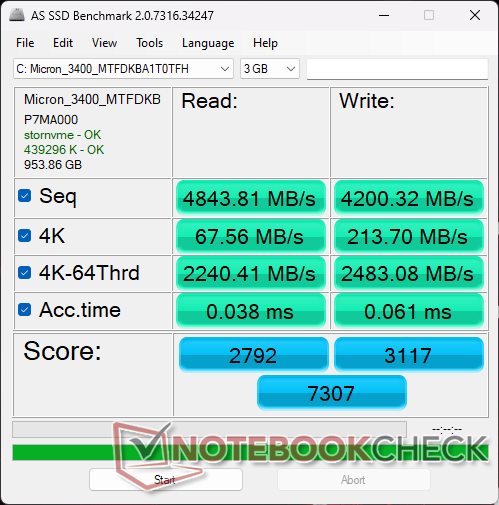
Nuestra unidad se entrega con un 1 TB Micron 3400 PCIe4 x4 NVMe de 1 TB en vez del más común Samsung PM9A1 de 1 TB para ahorrar costes. Las tasas de transferencia son ligeramente inferiores en un 10% de media. Nos impresiona más la capacidad del disco de mantener tasas de transferencia muy altas de más de 6400 MB/s durante periodos prolongados sin disipador de calor.

* ... más pequeño es mejor
Disk Throttling: DiskSpd Read Loop, Queue Depth 8
Rendimiento de la GPU - Gráficos TGP de 105 W
El rendimiento de los gráficos en bruto es aproximadamente un 25 por ciento más lento que nuestra GeForce RTX 3070 de sobremesa. En comparación con laGeForce RTX 3070 en el Schenker XMG Apex 15nuestra versión de 105 W se queda sólo un 5% por detrás. El cambio al RTX 3060 o RTX 3050 afectará al rendimiento gráfico entre un 10 y un 15 por ciento y entre un 40 y un 45 por ciento, respectivamente.
Todos los títulos actuales son jugables a la resolución nativa de 1080p con los ajustes al máximo. Sin embargo, para aprovechar mejor la rápida tasa de refresco nativa de 360 Hz, es posible que quieras considerar reducir la configuración a media o inferior, especialmente en juegos competitivos como CS:GO u Overwatch.
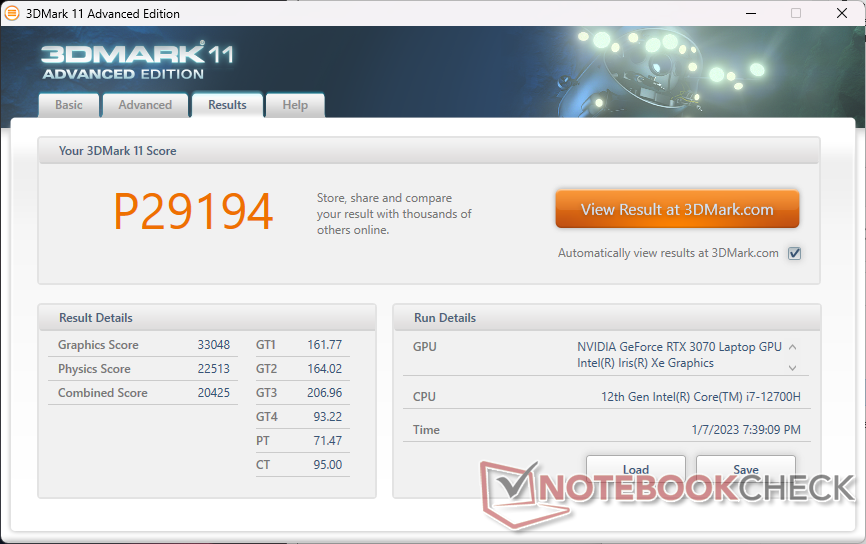
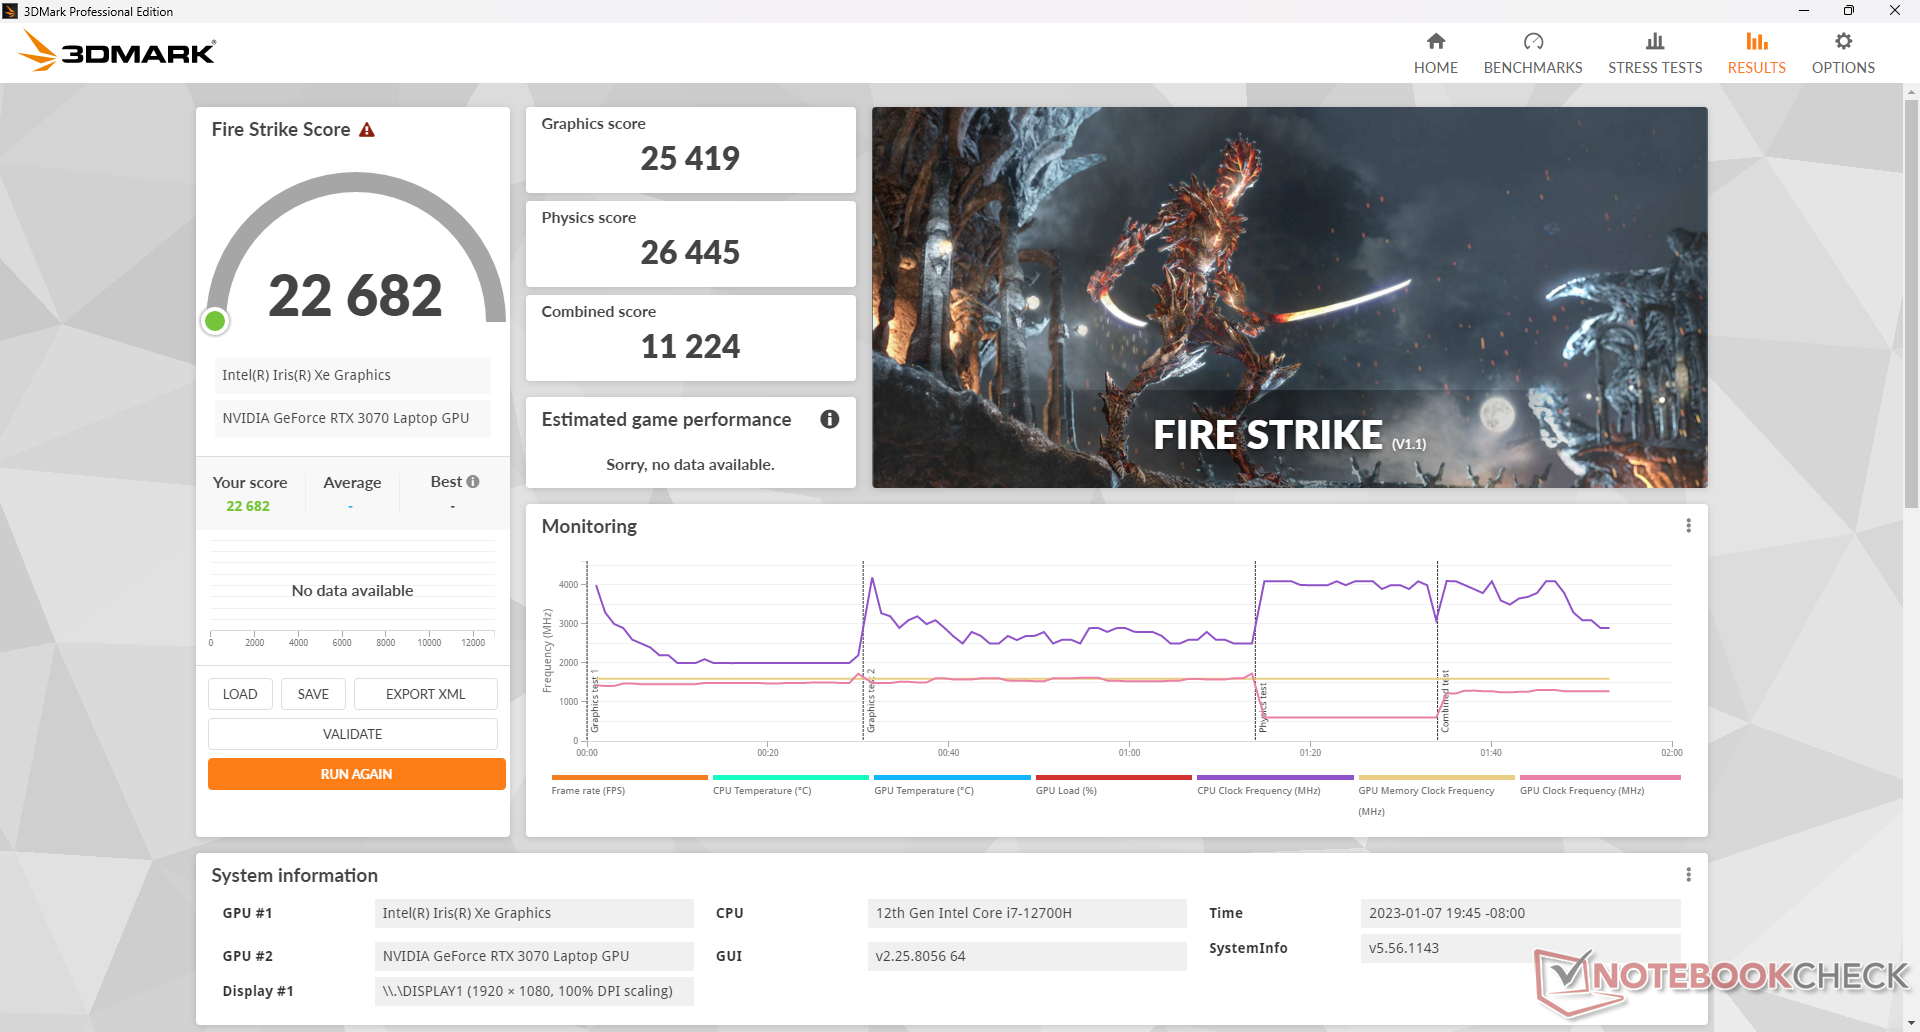
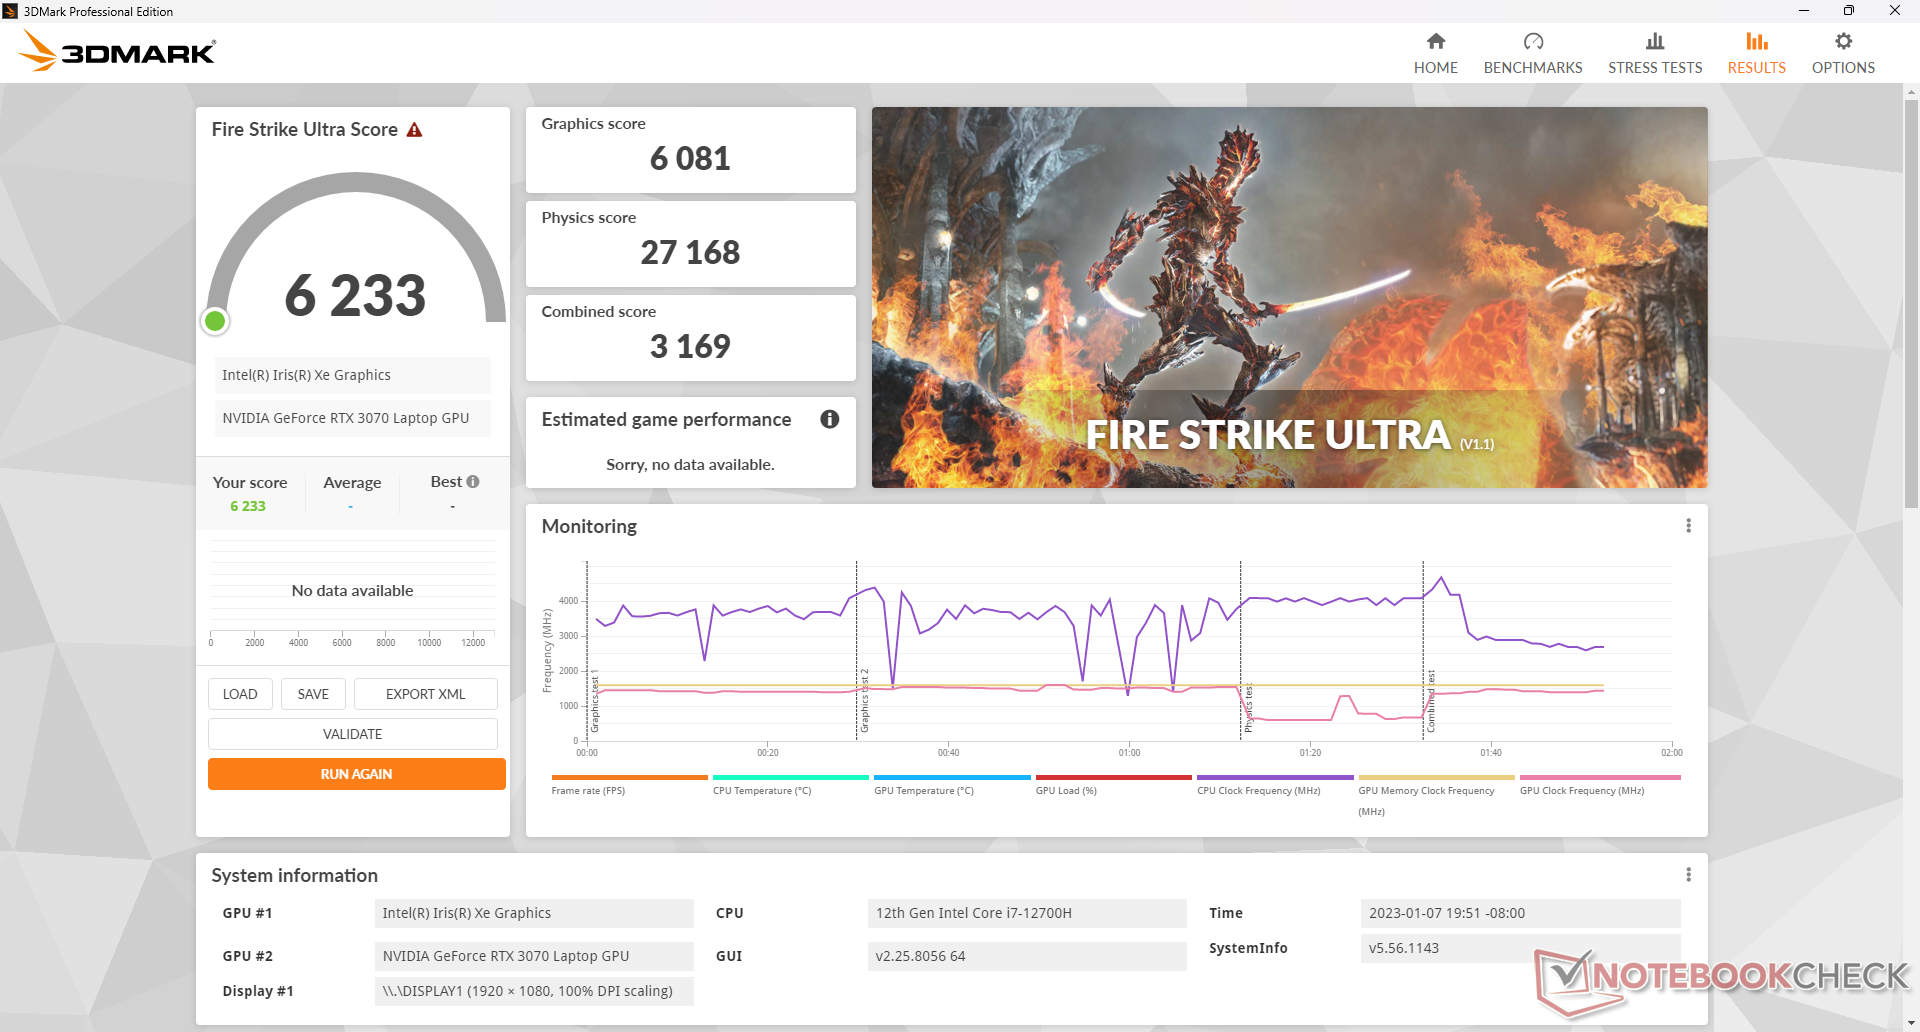
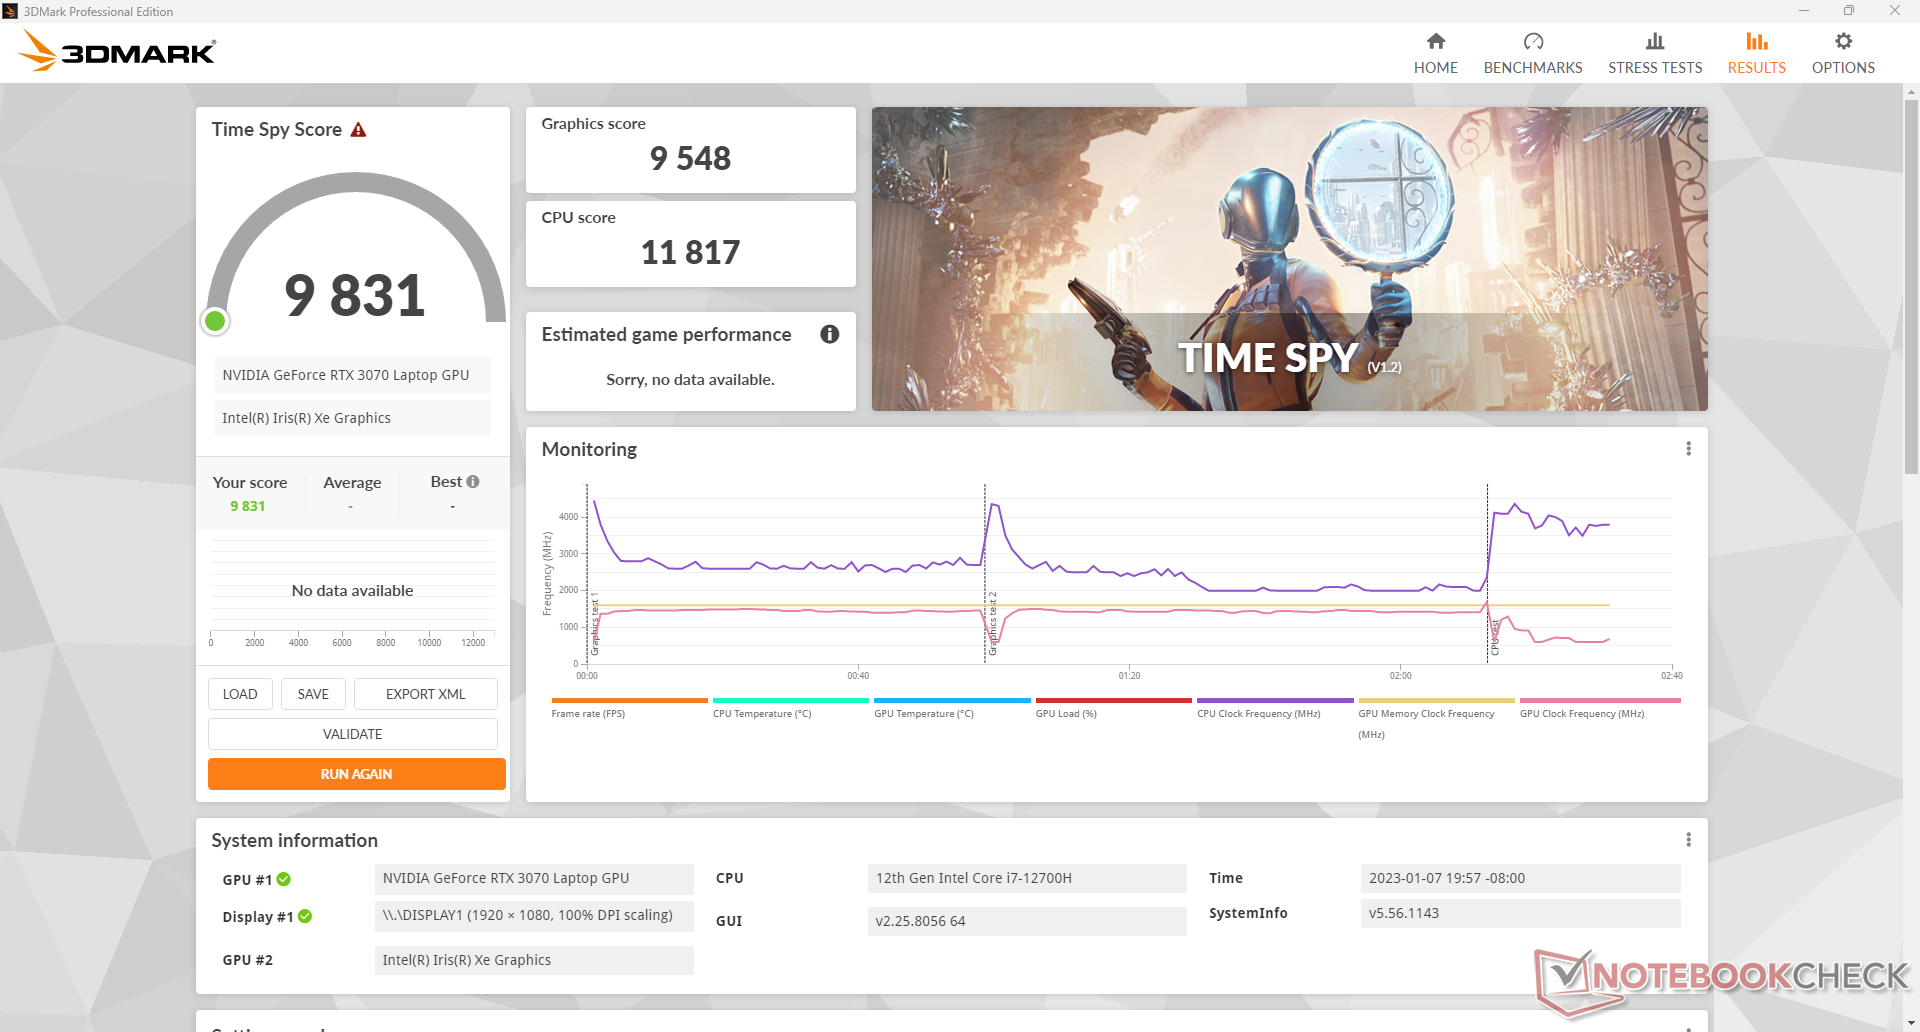
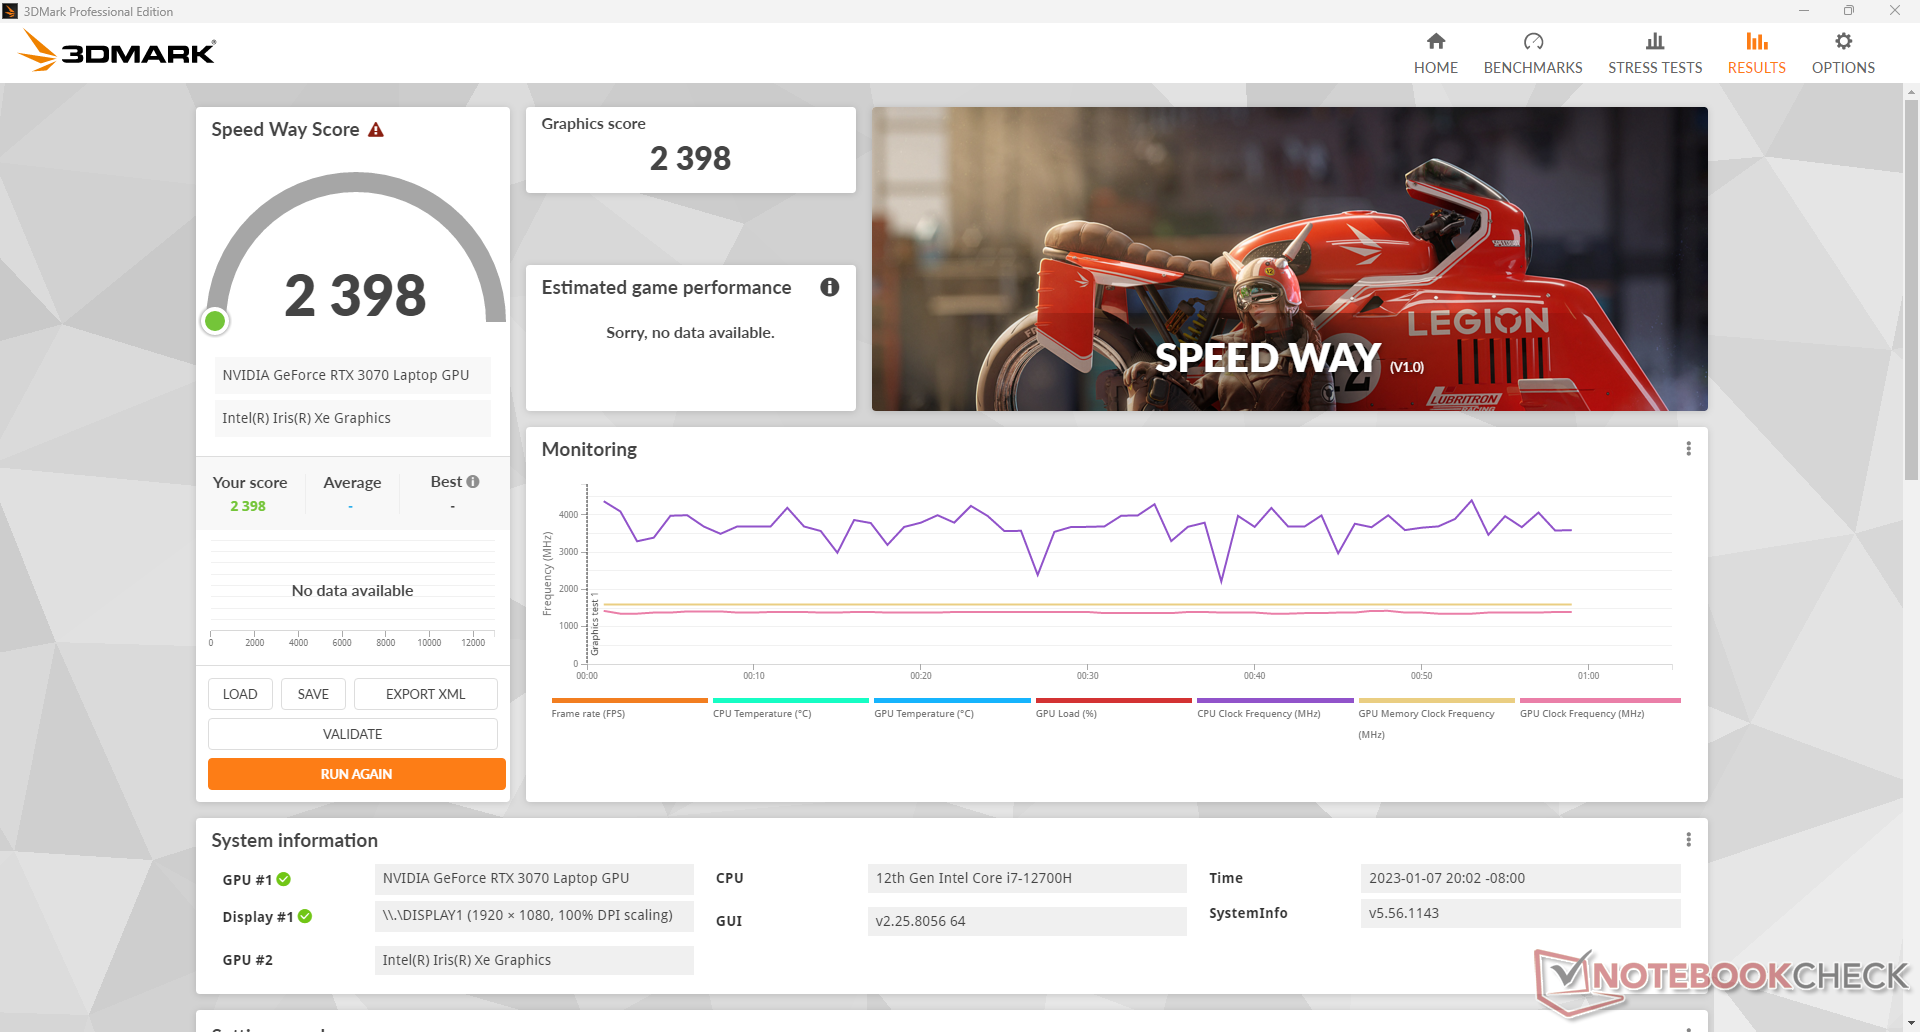
| 3DMark 11 Performance | 29194 puntos | |
| 3DMark Fire Strike Score | 22682 puntos | |
| 3DMark Time Spy Score | 9831 puntos | |
ayuda | ||
* ... más pequeño es mejor
Witcher 3 FPS Chart
| bajo | medio | alto | ultra | |
|---|---|---|---|---|
| GTA V (2015) | 185.7 | 182.3 | 175.5 | 108.1 |
| The Witcher 3 (2015) | 377.1 | 252.8 | 170.5 | 92.8 |
| Dota 2 Reborn (2015) | 168.1 | 152.1 | 141.2 | 132.8 |
| Final Fantasy XV Benchmark (2018) | 186.3 | 118.5 | 89.7 | |
| X-Plane 11.11 (2018) | 139.9 | 122.9 | 97.7 | |
| Strange Brigade (2018) | 414 | 224 | 186.6 | 164.5 |
| Cyberpunk 2077 1.6 (2022) | 118.8 | 102.4 | 83.2 | 69.8 |
Emisiones - No demasiado altas
Ruido del sistema
Los ventiladores no paran ni siquiera en modo "silencioso". Podemos registrar un mínimo de 26,9 dB(A) contra un fondo silencioso de 24,1 dB(A) que apenas es audible en la mayoría de los escenarios. En cambio, el modo "Silencioso" es excelente para evitar que los ventiladores internos pulsen en respuesta a los cambios de carga en pantalla. Cuando se transmiten vídeos o se navega por Internet, por ejemplo, se recomienda el modo Silencioso en lugar del modo Equilibrado, en el que los ventiladores pulsan con frecuencia entre 27 y 43,8 dB(A).
El ruido del ventilador en funcionamiento Witcher 3 se estabiliza justo por debajo de 45 dB(A) para ser más silencioso que muchos de sus competidores, como se muestra en la siguiente tabla. Si se activa Cooler Boost (es decir, el modo de ventilador máximo), el ruido del ventilador se dispara hasta los 58 dB(A). Este modo es más para reducir las temperaturas que para aumentar el rendimiento, por lo que no es necesario para la mayoría de los escenarios de juego.

Ruido
| Ocioso |
| 26.9 / 26.9 / 27 dB(A) |
| Carga |
| 43.8 / 58.3 dB(A) |
 | ||
30 dB silencioso 40 dB(A) audible 50 dB(A) ruidosamente alto |
||
min: | ||
| MSI Pulse GL76 12UGK GeForce RTX 3070 Laptop GPU, i7-12700H, Micron 3400 1TB MTFDKBA1T0TFH | Alienware m17 R5 (R9 6900HX, RX 6850M XT) Radeon RX 6850M XT, R9 6900HX, SSSTC CA6-8D1024 | Asus ROG Strix Scar 17 SE G733CX-LL014W GeForce RTX 3080 Ti Laptop GPU, i9-12950HX, Samsung PM9A1 MZVL22T0HBLB | Acer Predator Helios 300 (i7-12700H, RTX 3070 Ti) GeForce RTX 3070 Ti Laptop GPU, i7-12700H, Samsung PM9A1 MZVL21T0HCLR | Razer Blade 17 Early 2022 GeForce RTX 3080 Ti Laptop GPU, i9-12900H, Samsung PM9A1 MZVL21T0HCLR | MSI Vector GP76 12UGS-434 GeForce RTX 3070 Ti Laptop GPU, i7-12700H, Micron 2450 1TB MTFDKBA1T0TFK | |
|---|---|---|---|---|---|---|
| Noise | 6% | 13% | -10% | -6% | -6% | |
| apagado / medio ambiente * (dB) | 24.1 | 23 5% | 23.9 1% | 23 5% | 26 -8% | 25.6 -6% |
| Idle Minimum * (dB) | 26.9 | 23 14% | 23.9 11% | 23 14% | 26 3% | 27 -0% |
| Idle Average * (dB) | 26.9 | 28.11 -4% | 23.9 11% | 25.92 4% | 27 -0% | 27 -0% |
| Idle Maximum * (dB) | 27 | 28.11 -4% | 23.9 11% | 40.67 -51% | 32 -19% | 30.1 -11% |
| Load Average * (dB) | 43.8 | 30.62 30% | 34.3 22% | 42.7 3% | 50 -14% | 54.4 -24% |
| Witcher 3 ultra * (dB) | 44.7 | 49.75 -11% | 62.48 -40% | 51 -14% | ||
| Load Maximum * (dB) | 58.3 | 50.17 14% | 45.9 21% | 62.67 -7% | 51 13% | 56.2 4% |
* ... más pequeño es mejor
Temperatura
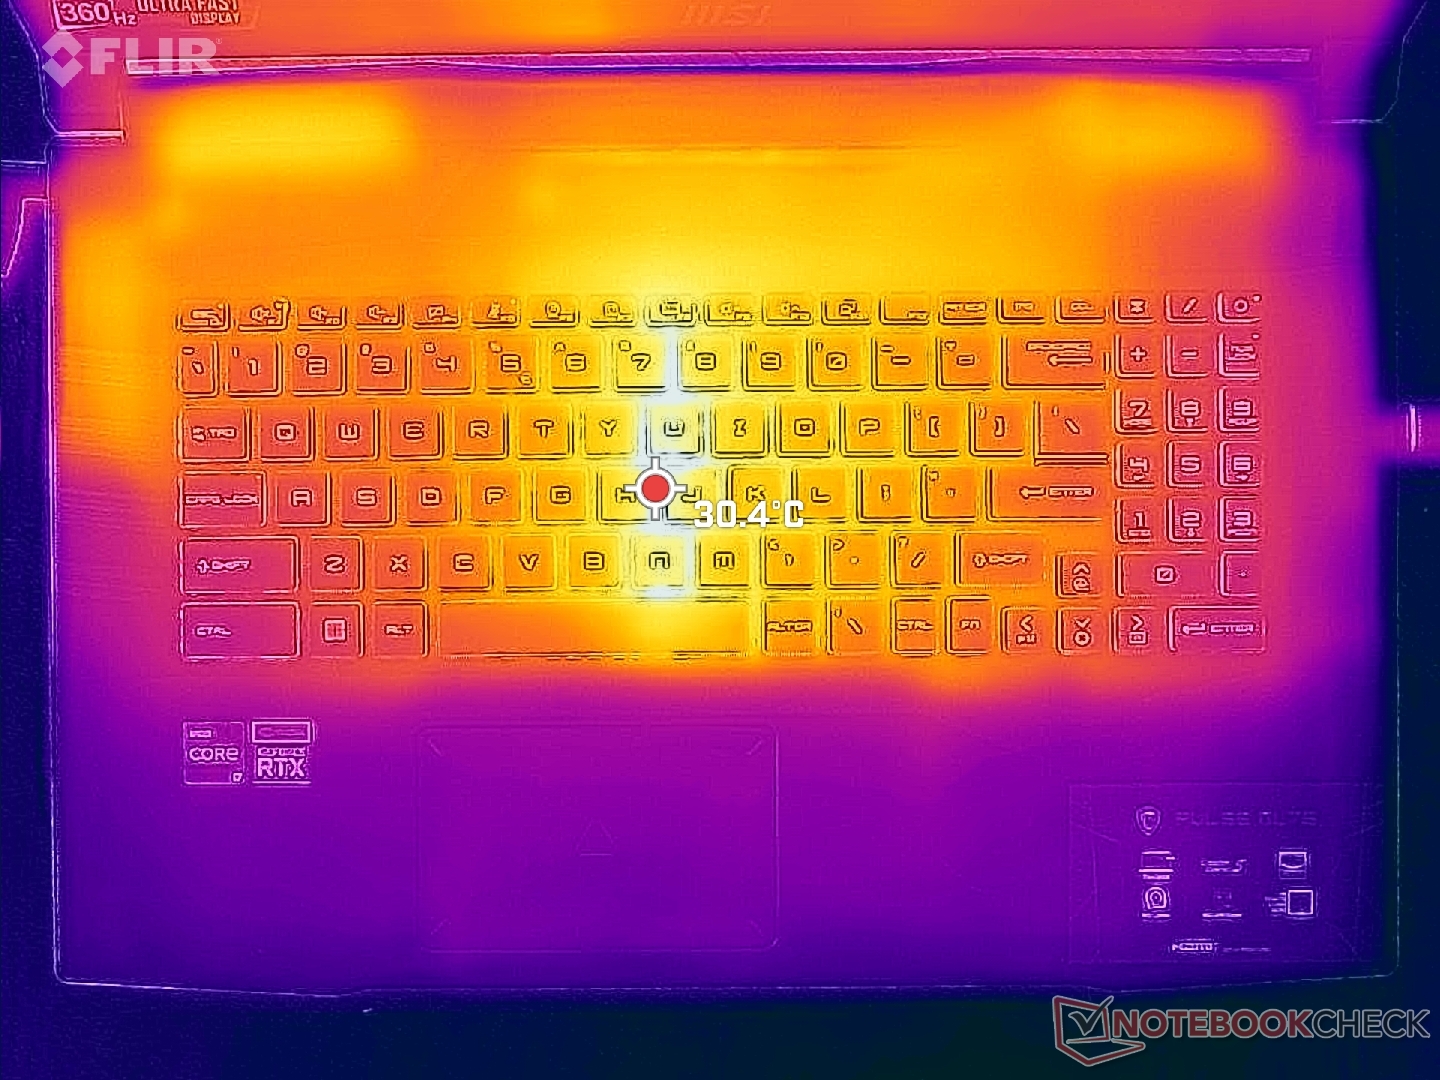
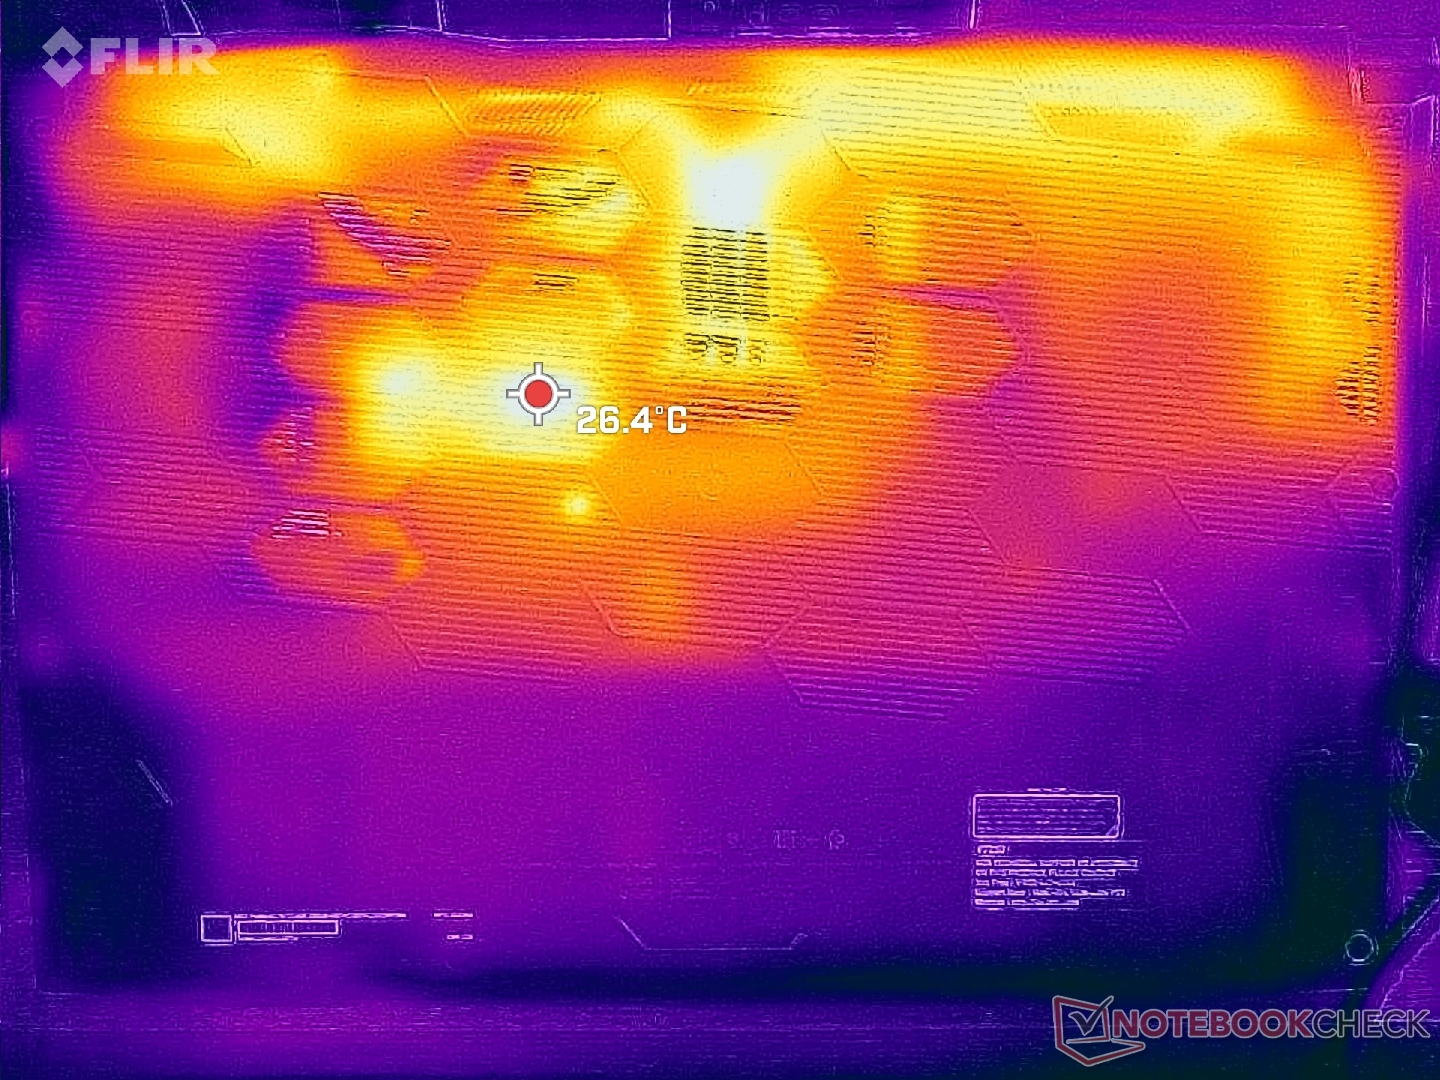
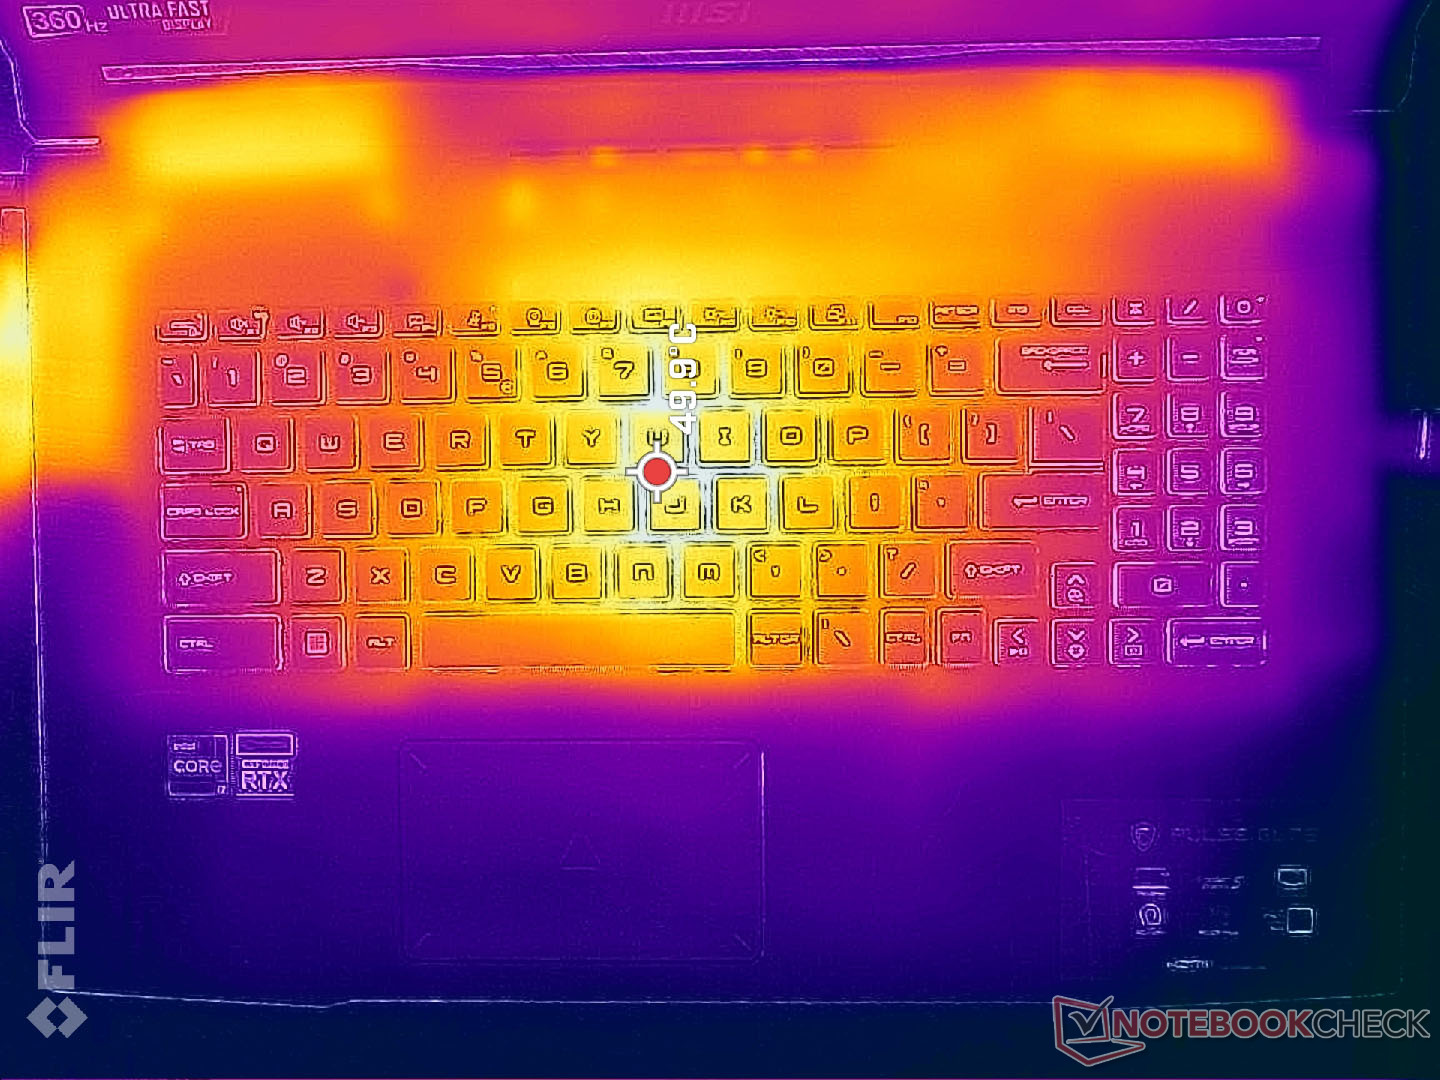
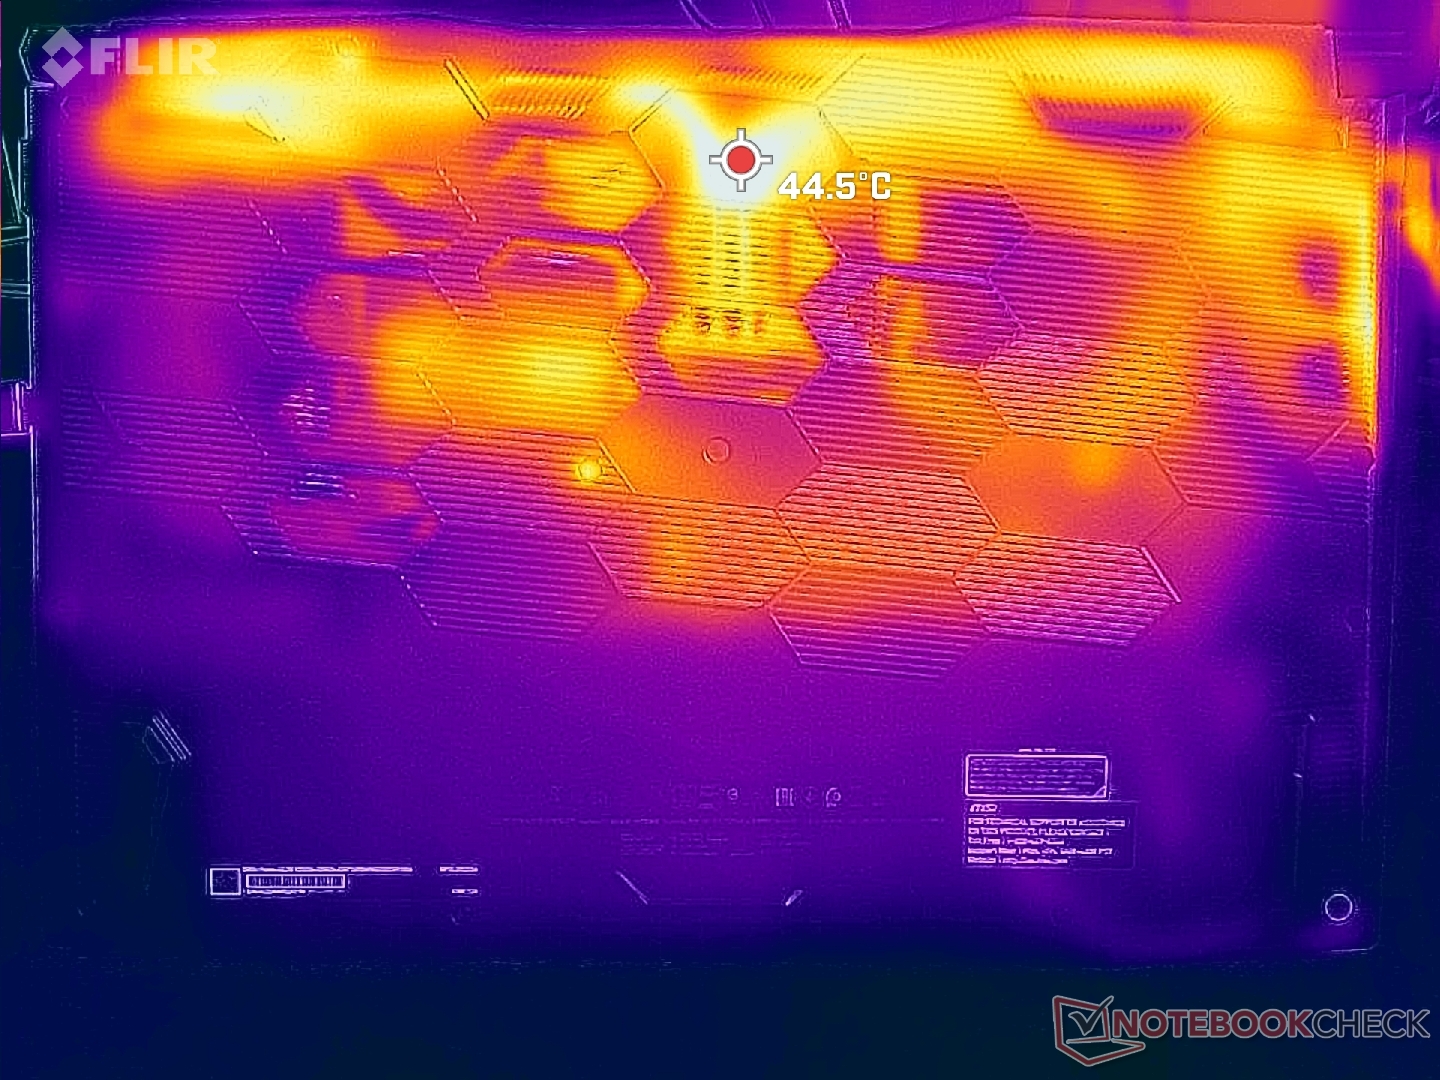
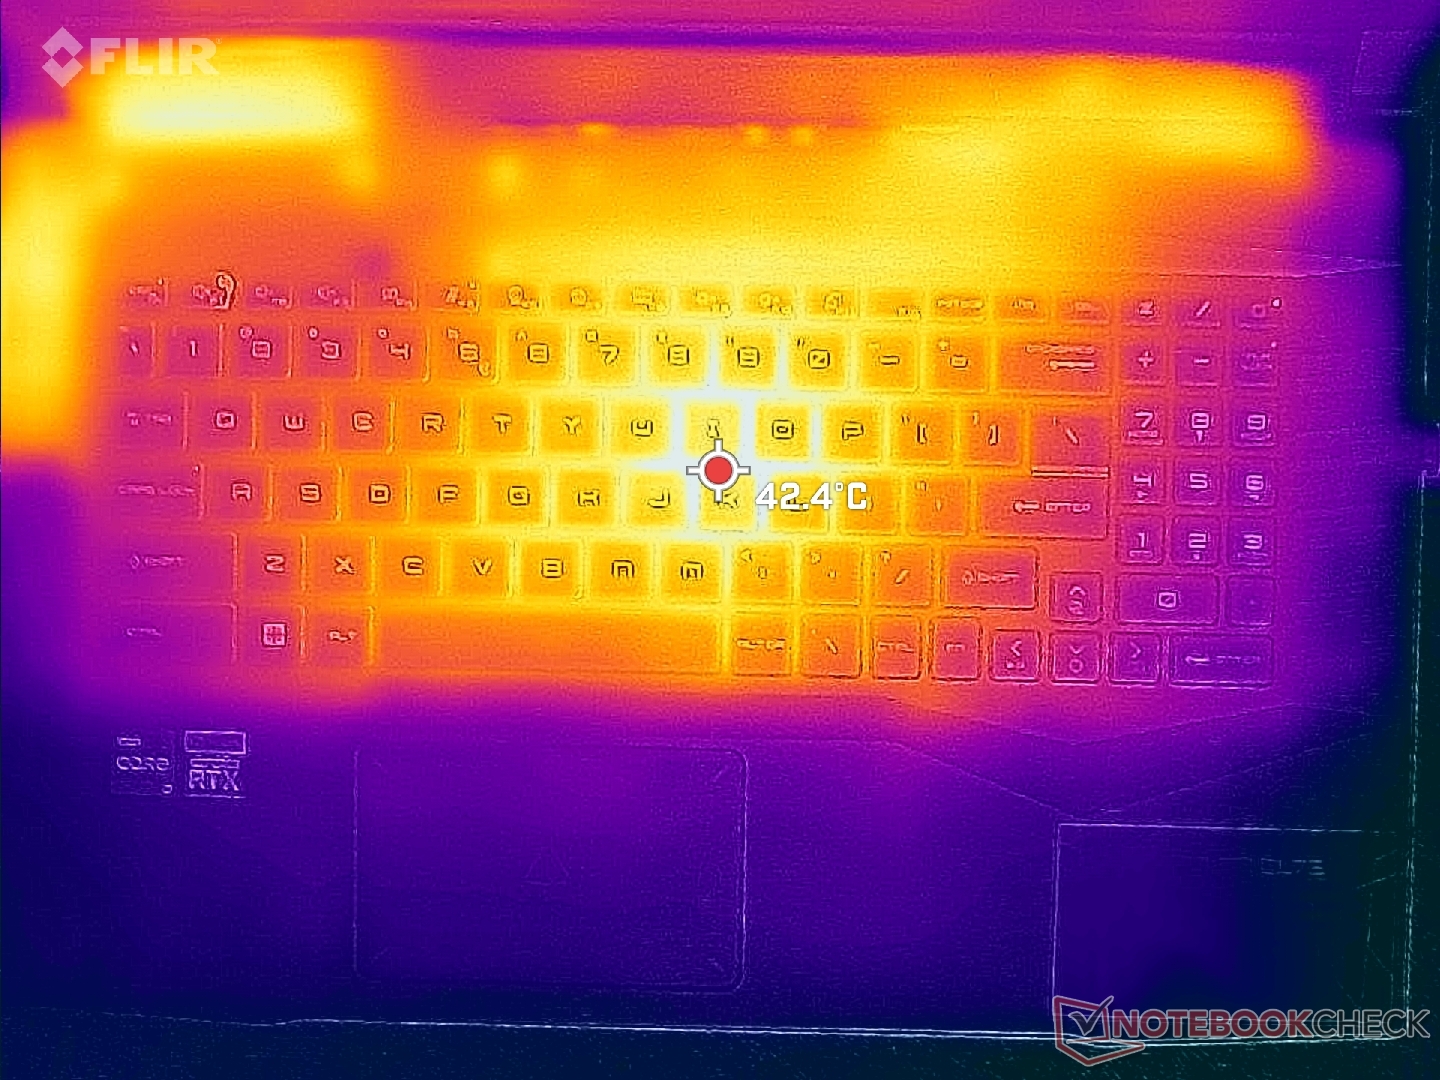
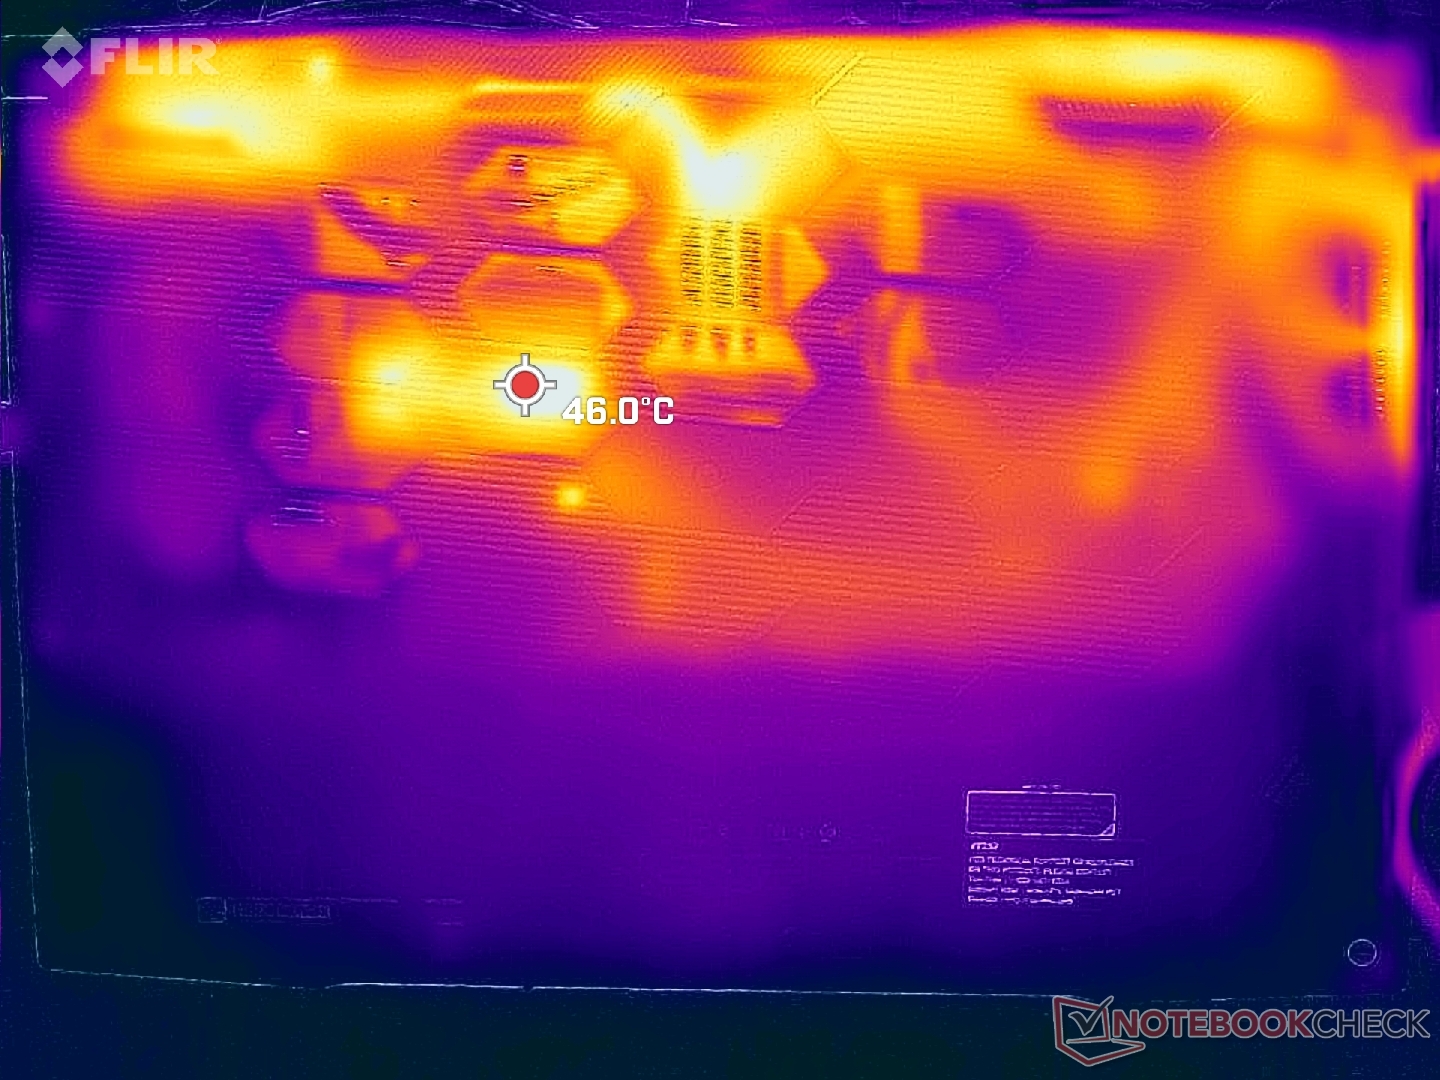
Las temperaturas medias de superficie no son incómodamente cálidas y los puntos calientes están muy aislados debido al gran factor de forma de 17.3 pulgadas y el chasis mayormente de plástico. El centro del teclado, por ejemplo, puede alcanzar casi 50 C cuando se juega, mientras que los reposamanos y los laterales del teclado están mucho más frescos, en los rangos medios de 20 C y 30 C, respectivamente. Los puntos calientes de la parte superior e inferior apenas se notan al jugar, ya que el contacto con la piel es poco habitual en estas zonas.
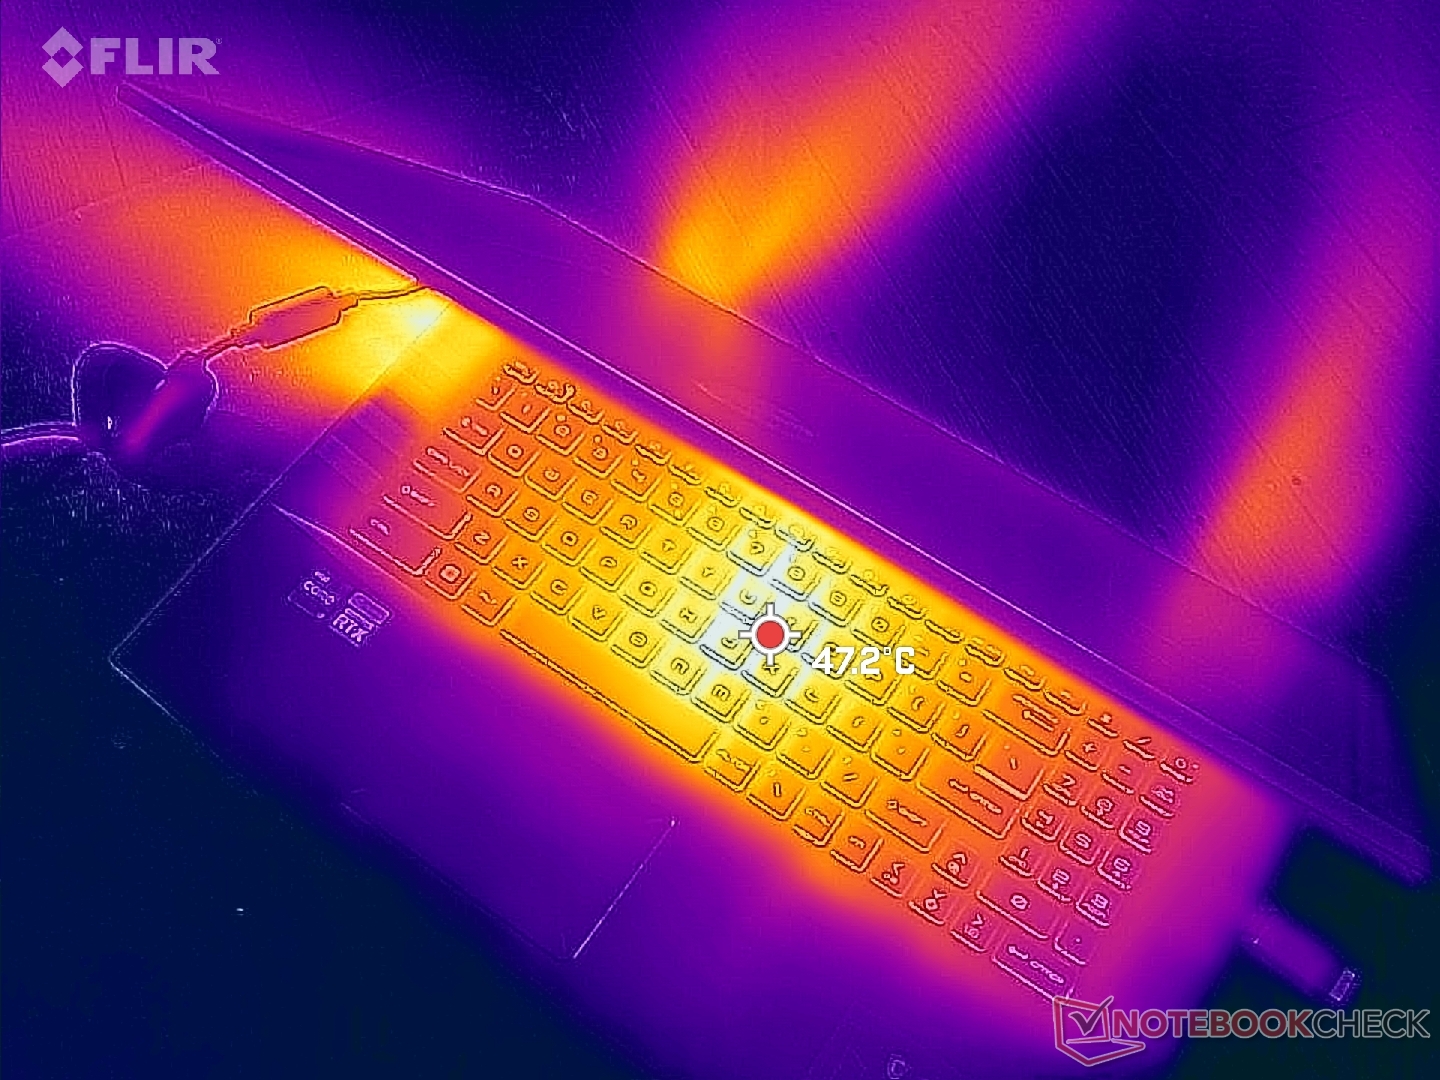
(±) La temperatura máxima en la parte superior es de 44.2 °C / 112 F, frente a la media de 40.4 °C / 105 F, que oscila entre 21.2 y 68.8 °C para la clase Gaming.
(-) El fondo se calienta hasta un máximo de 45.2 °C / 113 F, frente a la media de 43.2 °C / 110 F
(+) En reposo, la temperatura media de la parte superior es de 27.7 °C / 82# F, frente a la media del dispositivo de 33.9 °C / 93 F.
(±) Jugando a The Witcher 3, la temperatura media de la parte superior es de 35.1 °C / 95 F, frente a la media del dispositivo de 33.9 °C / 93 F.
(+) El reposamanos y el panel táctil están a una temperatura inferior a la de la piel, con un máximo de 25.4 °C / 77.7 F y, por tanto, son fríos al tacto.
(+) La temperatura media de la zona del reposamanos de dispositivos similares fue de 28.8 °C / 83.8 F (+3.4 °C / 6.1 F).
| MSI Pulse GL76 12UGK Intel Core i7-12700H, NVIDIA GeForce RTX 3070 Laptop GPU | Alienware m17 R5 (R9 6900HX, RX 6850M XT) AMD Ryzen 9 6900HX, AMD Radeon RX 6850M XT | Asus ROG Strix Scar 17 SE G733CX-LL014W Intel Core i9-12950HX, NVIDIA GeForce RTX 3080 Ti Laptop GPU | Acer Predator Helios 300 (i7-12700H, RTX 3070 Ti) Intel Core i7-12700H, NVIDIA GeForce RTX 3070 Ti Laptop GPU | Razer Blade 17 Early 2022 Intel Core i9-12900H, NVIDIA GeForce RTX 3080 Ti Laptop GPU | MSI Vector GP76 12UGS-434 Intel Core i7-12700H, NVIDIA GeForce RTX 3070 Ti Laptop GPU | |
|---|---|---|---|---|---|---|
| Heat | -3% | -2% | 6% | -12% | -3% | |
| Maximum Upper Side * (°C) | 44.2 | 53 -20% | 48.8 -10% | 35 21% | 50 -13% | 46.3 -5% |
| Maximum Bottom * (°C) | 45.2 | 56 -24% | 52.4 -16% | 53 -17% | 56 -24% | 45 -0% |
| Idle Upper Side * (°C) | 35.4 | 30 15% | 30.4 14% | 29 18% | 36 -2% | 34.2 3% |
| Idle Bottom * (°C) | 35 | 29 17% | 34.1 3% | 34 3% | 38 -9% | 38.3 -9% |
* ... más pequeño es mejor
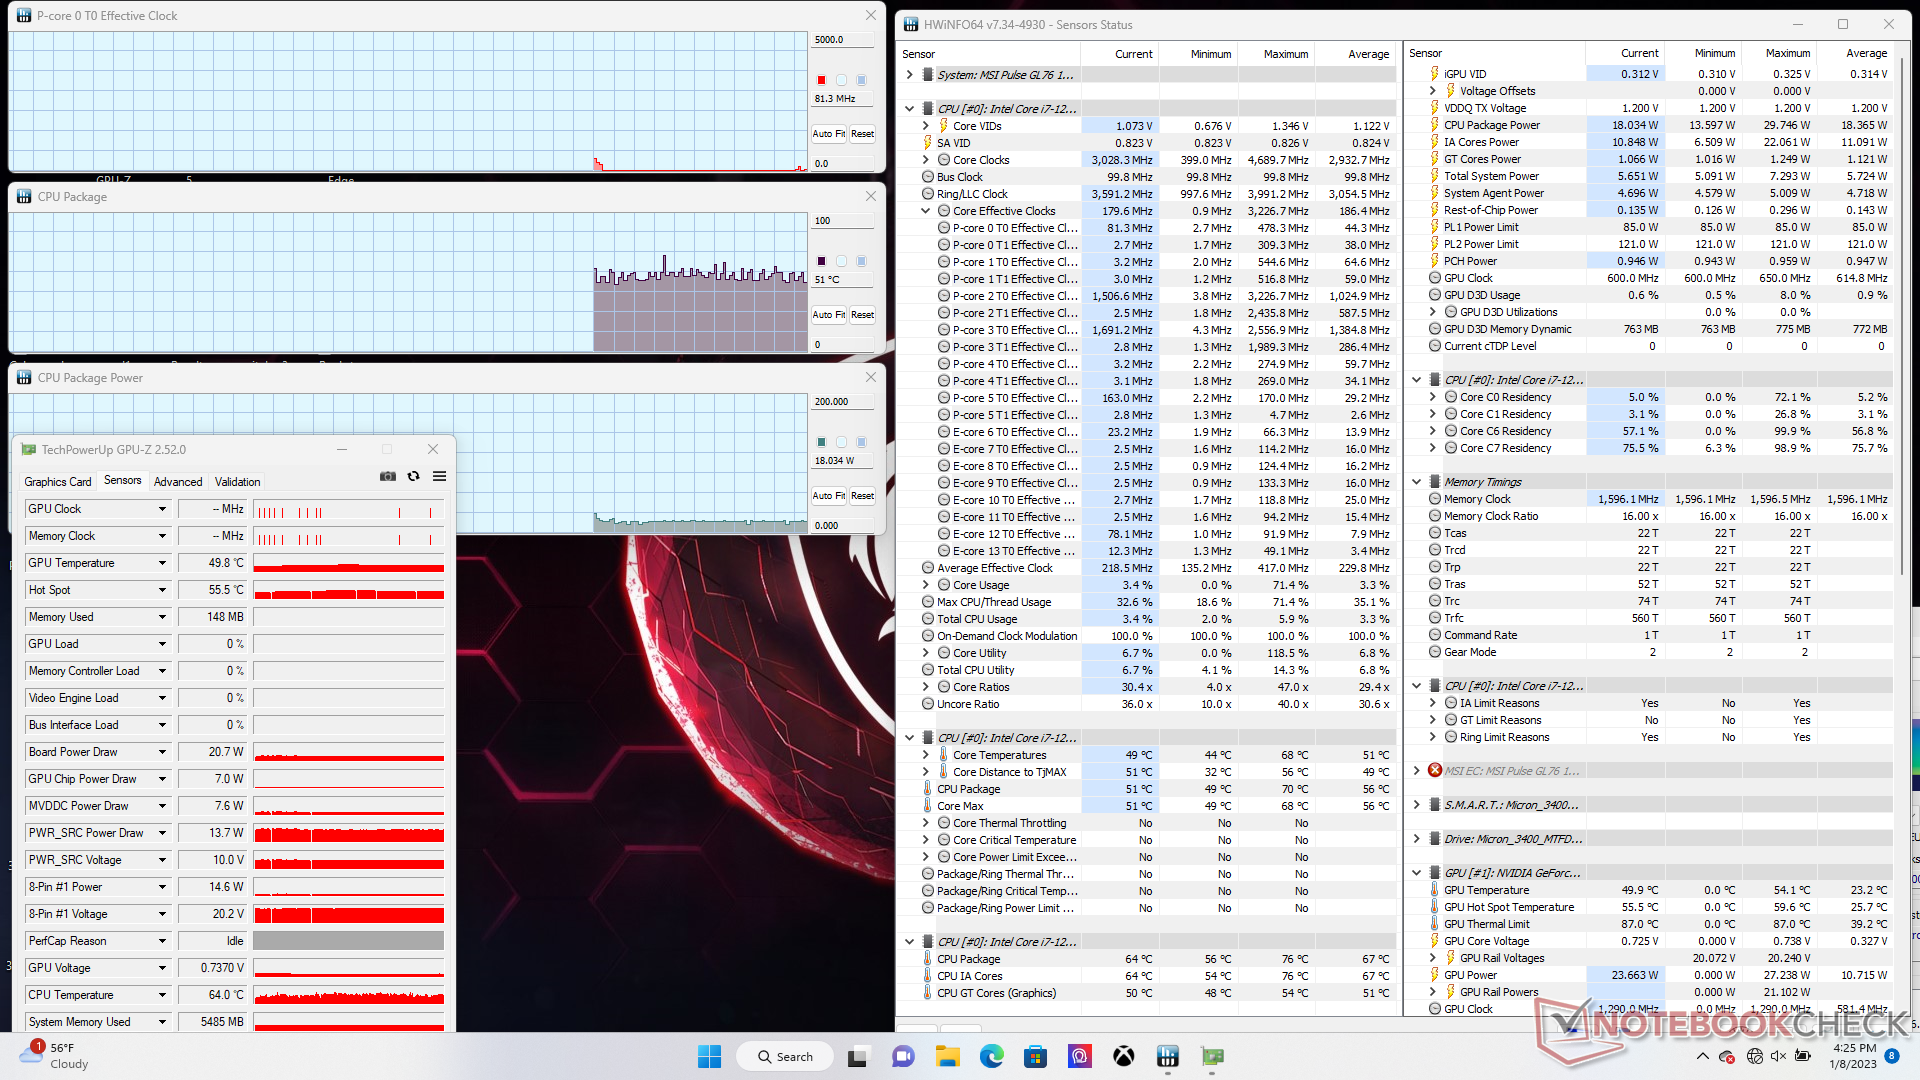
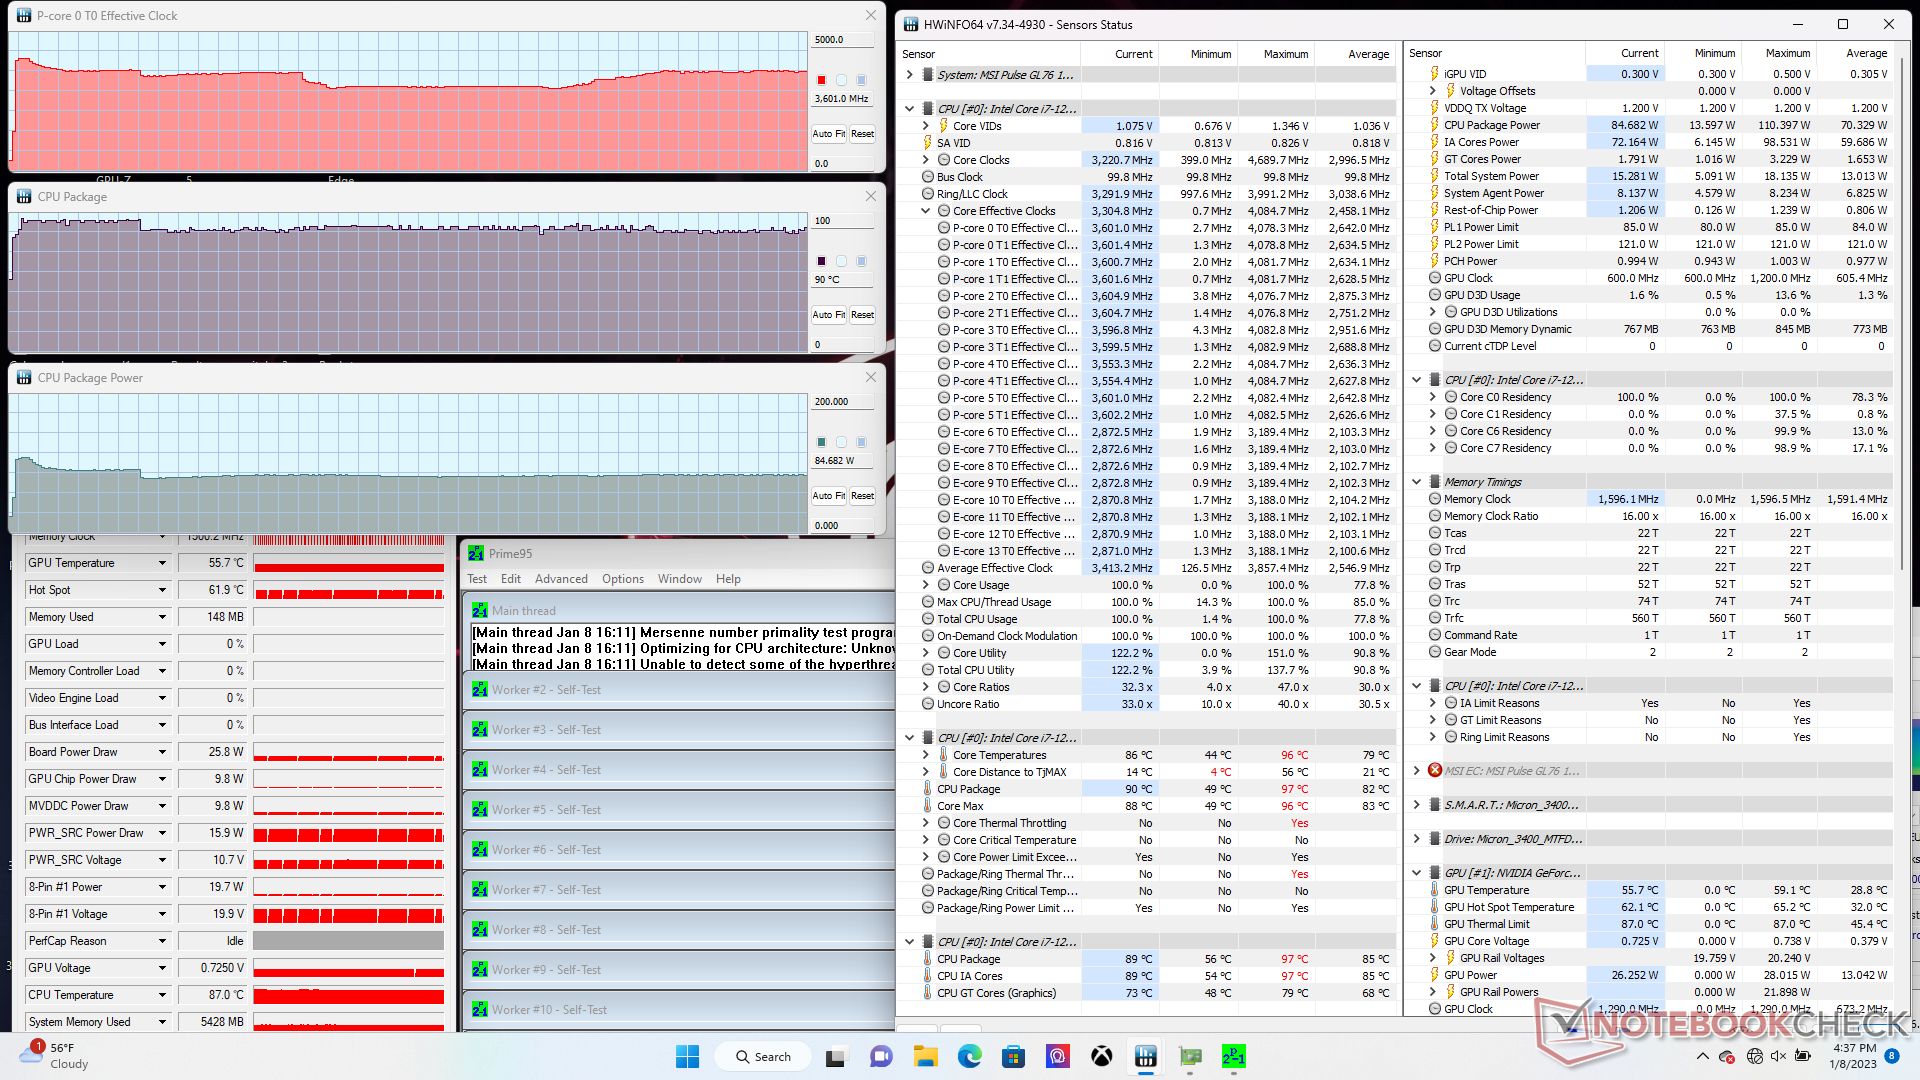
Prueba de resistencia
Cuando se ejecuta Prime95, las frecuencias de reloj de la CPU y el consumo de la placa aumentan a 4,1 GHz y 110 W, respectivamente, y duran sólo unos segundos o hasta que la temperatura del núcleo alcanza los 95 C. A partir de entonces, las frecuencias de reloj y el consumo de la placa caen a 3,6 GHz y 92 W antes de estabilizarse finalmente entre 3,1 y 3,6 GHz y 85 W, respectivamente. La temperatura del núcleo también se estabiliza en 90 C, lo que indica que la solución de refrigeración está prácticamente al límite.
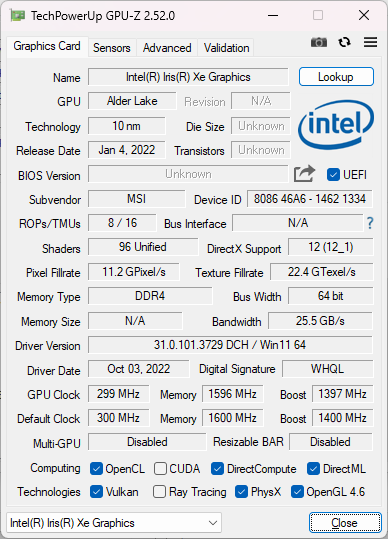
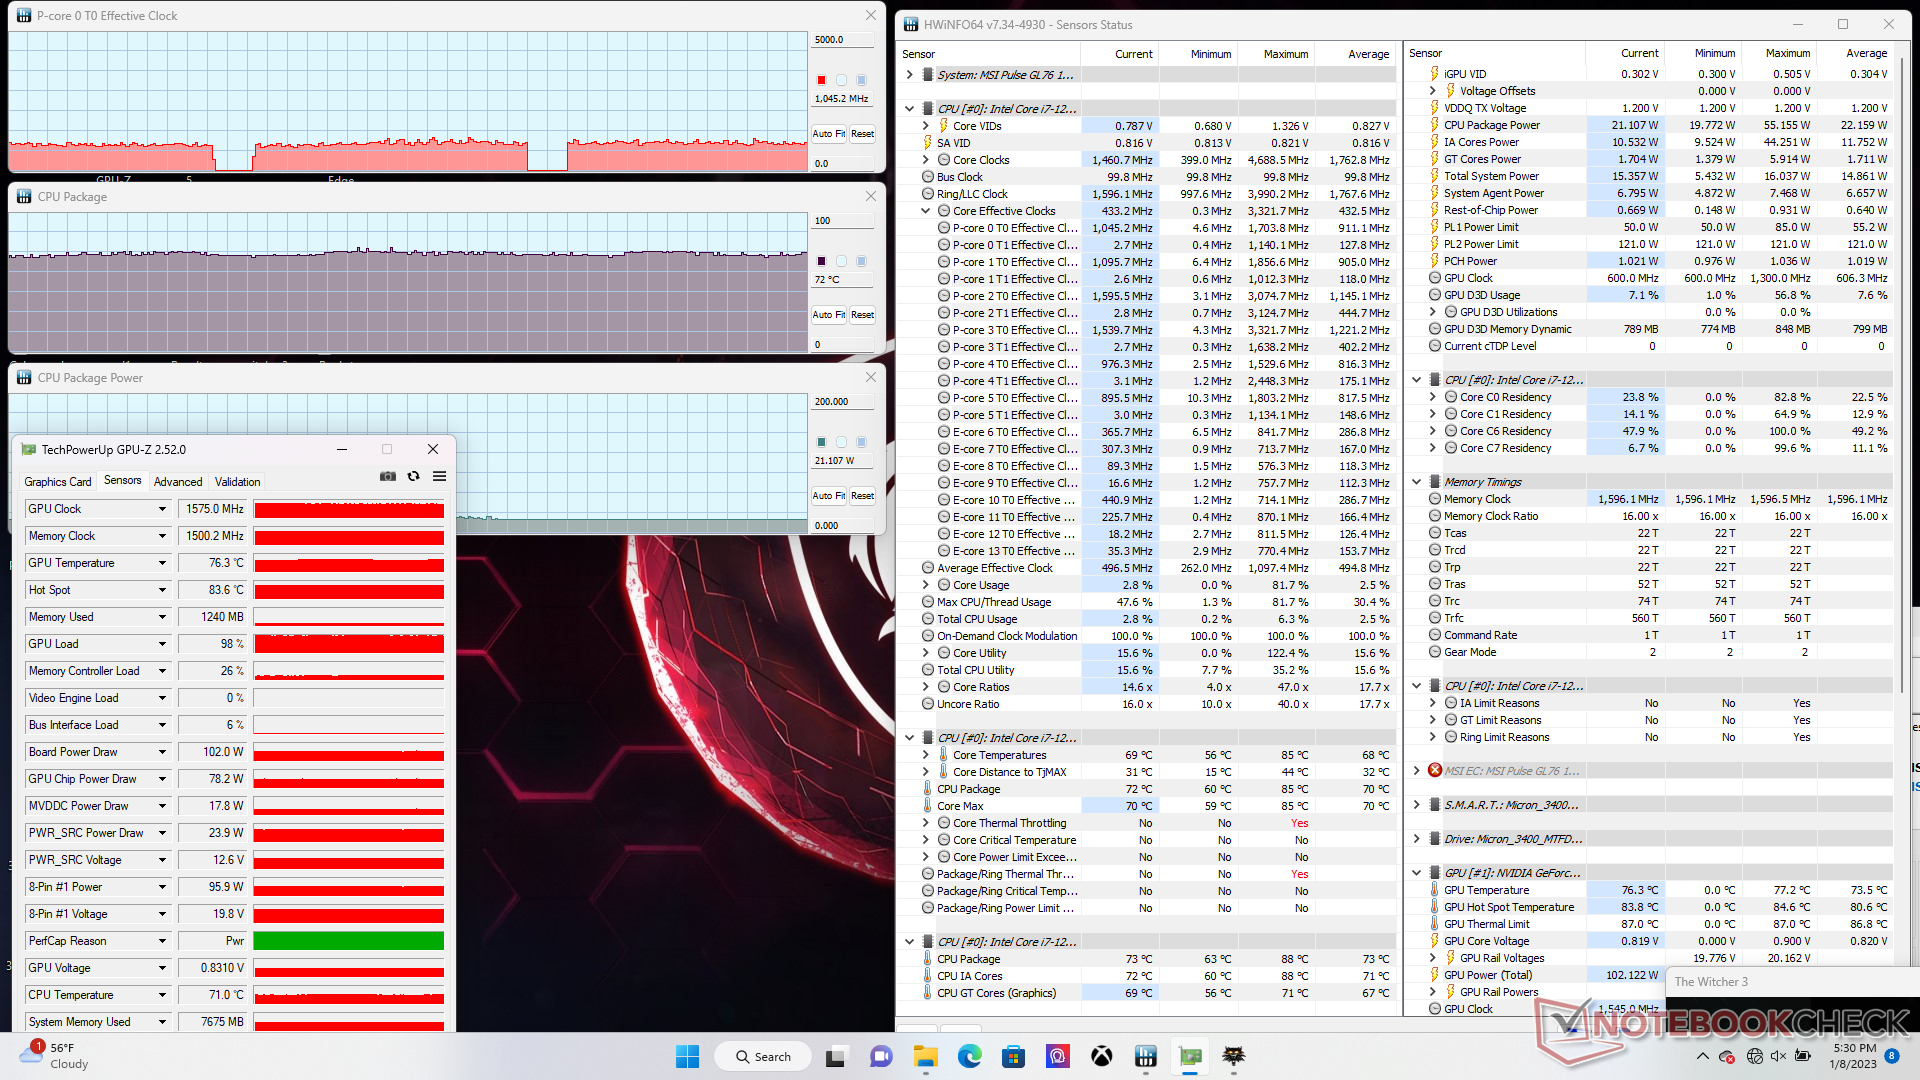
La GPU Nvidia se estabilizaría a 1575 MHz y 76 C al ejecutar Witcher 3 en comparación con los 1725 MHz y 72 C del Razer Blade 17 equipado con una TGP GeForce RTX 3070 de 130 W superior. GPU-Z en nuestra unidad de pruebas MSI también indicaría un consumo de la placa GPU de 102 W para estar muy cerca del objetivo anunciado de 105 W.
Funcionar con batería limita el rendimiento. Un test 3DMark 11 en batería arrojaría unas puntuaciones de Física y Gráficos de 9089 y 11291 puntos, respectivamente, comparados con los 22513 y 33048 puntos cuando está conectado a la red.
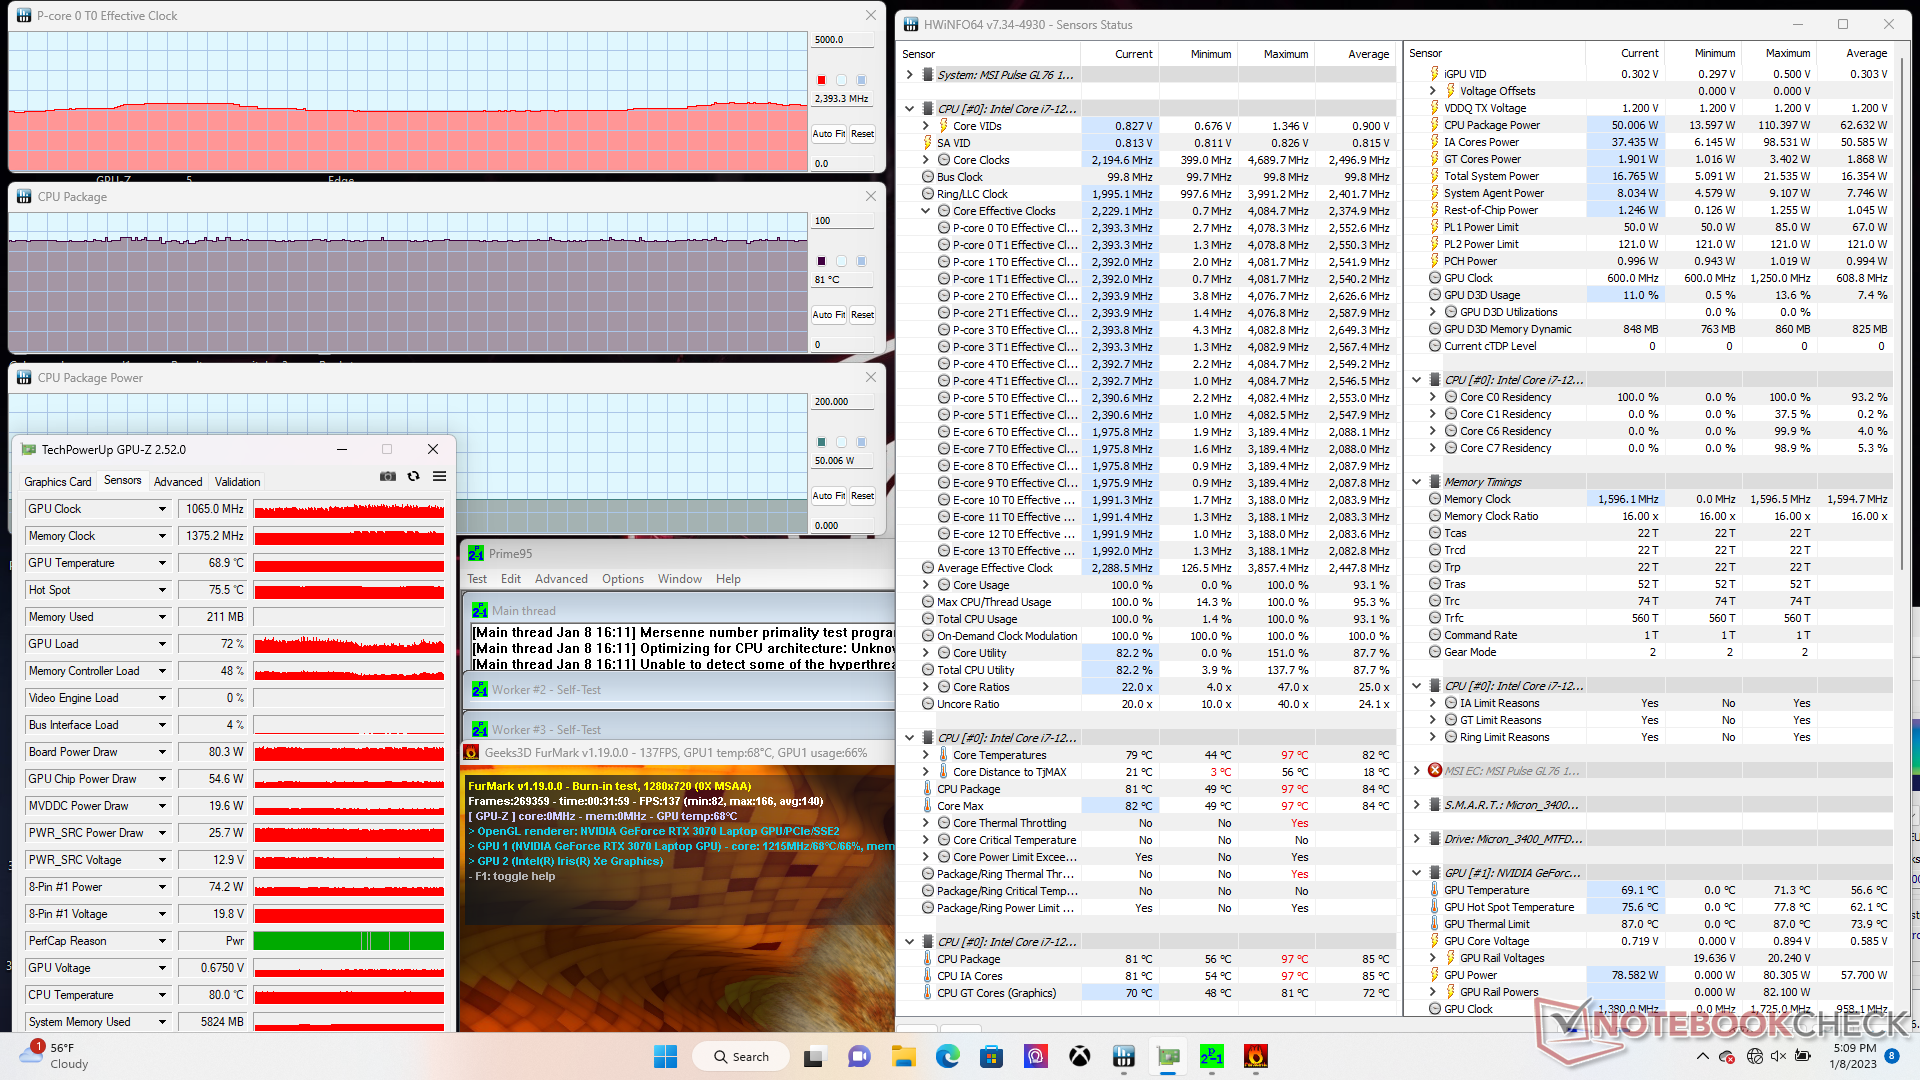
| RelojCPU (GHz) | Reloj GPU (MHz) | Temperatura mediaCPU (°C) | Temperatura media GPU (°C) | |
| Sistema en reposo | -- | -- | 51 | 50 |
| Prime95 Stress | 3.4 - 3.6 | -- | 90 | 56 |
| Prime95+ FurMark Estrés | 2,3 - 2,4 | 1065 | 81 | 69 |
| Witcher 3 Tensión | ~1,1 | 1575 | 72 | 76 |
Altavoces
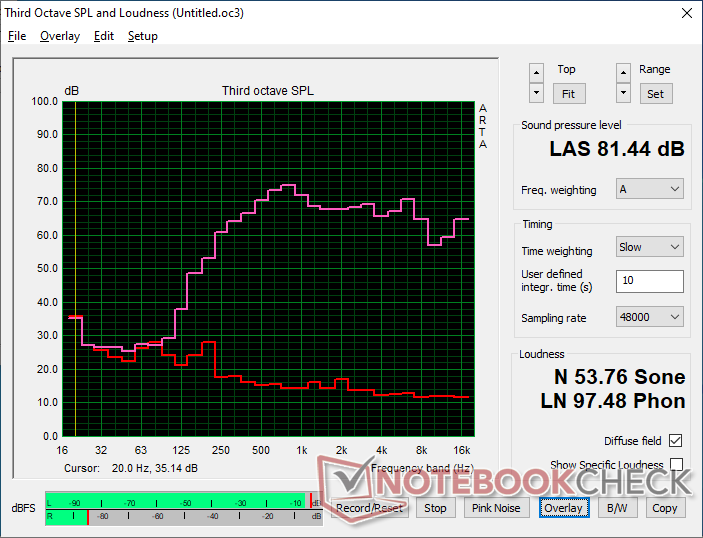
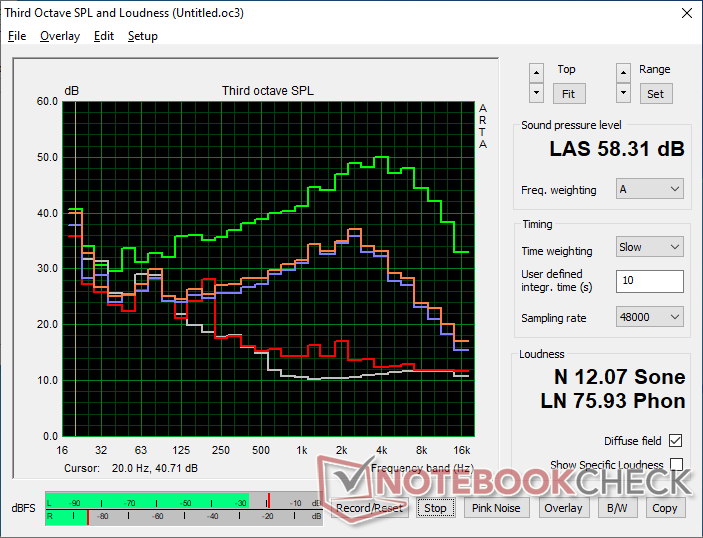
MSI Pulse GL76 12UGK análisis de audio
(±) | la sonoridad del altavoz es media pero buena (81.4 dB)
Graves 100 - 315 Hz
(-) | casi sin bajos - de media 17.5% inferior a la mediana
(±) | la linealidad de los graves es media (11.8% delta a frecuencia anterior)
Medios 400 - 2000 Hz
(+) | medios equilibrados - a sólo 3.7% de la mediana
(+) | los medios son lineales (4.3% delta a la frecuencia anterior)
Altos 2 - 16 kHz
(+) | máximos equilibrados - a sólo 3.1% de la mediana
(+) | los máximos son lineales (6.6% delta a la frecuencia anterior)
Total 100 - 16.000 Hz
(+) | el sonido global es lineal (14.8% de diferencia con la mediana)
En comparación con la misma clase
» 29% de todos los dispositivos probados de esta clase eran mejores, 7% similares, 64% peores
» El mejor tuvo un delta de 6%, la media fue 18%, el peor fue ###max##%
En comparación con todos los dispositivos probados
» 20% de todos los dispositivos probados eran mejores, 4% similares, 76% peores
» El mejor tuvo un delta de 4%, la media fue 23%, el peor fue ###max##%
Apple MacBook Pro 16 2021 M1 Pro análisis de audio
(+) | los altavoces pueden reproducir a un volumen relativamente alto (#84.7 dB)
Graves 100 - 315 Hz
(+) | buen bajo - sólo 3.8% lejos de la mediana
(+) | el bajo es lineal (5.2% delta a la frecuencia anterior)
Medios 400 - 2000 Hz
(+) | medios equilibrados - a sólo 1.3% de la mediana
(+) | los medios son lineales (2.1% delta a la frecuencia anterior)
Altos 2 - 16 kHz
(+) | máximos equilibrados - a sólo 1.9% de la mediana
(+) | los máximos son lineales (2.7% delta a la frecuencia anterior)
Total 100 - 16.000 Hz
(+) | el sonido global es lineal (4.6% de diferencia con la mediana)
En comparación con la misma clase
» 0% de todos los dispositivos probados de esta clase eran mejores, 0% similares, 100% peores
» El mejor tuvo un delta de 5%, la media fue 17%, el peor fue ###max##%
En comparación con todos los dispositivos probados
» 0% de todos los dispositivos probados eran mejores, 0% similares, 100% peores
» El mejor tuvo un delta de 4%, la media fue 23%, el peor fue ###max##%
Gestión de la energía: más eficiente de lo esperado
Consumo de energía
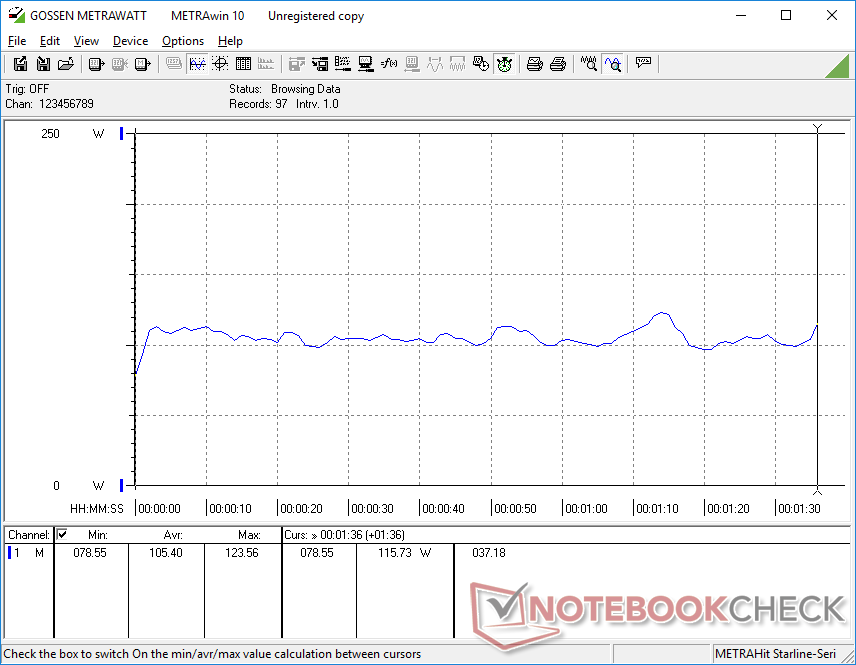
El funcionamiento en ralentí en el sobremesa consume sólo 12 W en el perfil de ahorro de energía con la iGPU activa y el brillo al mínimo. Por el contrario, el modo inactivo en el escritorio puede consumir algo más de 25 W en el modo de rendimiento extremo con el brillo al máximo. Por tanto, el cambio entre modos de energía es un factor importante para prolongar la duración de la batería.
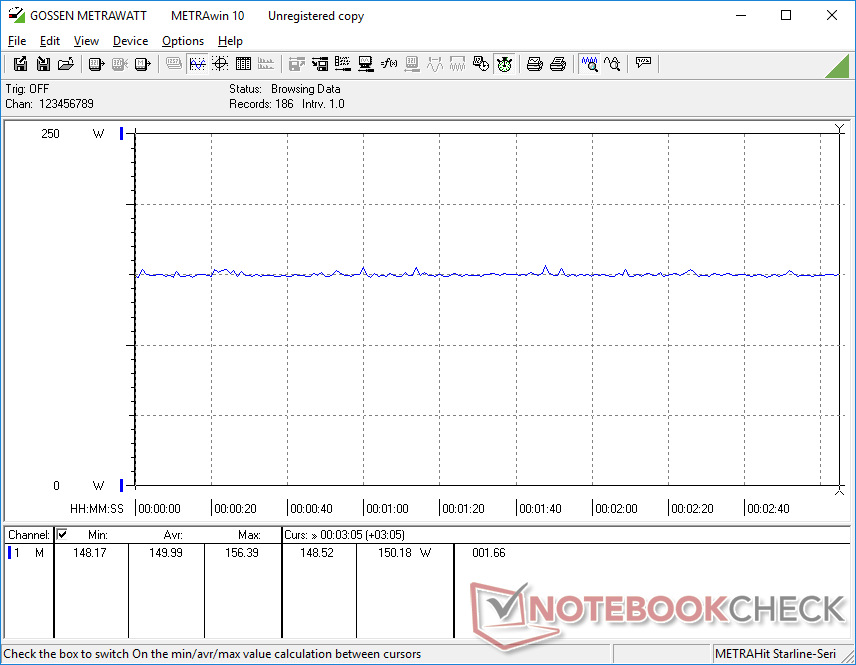
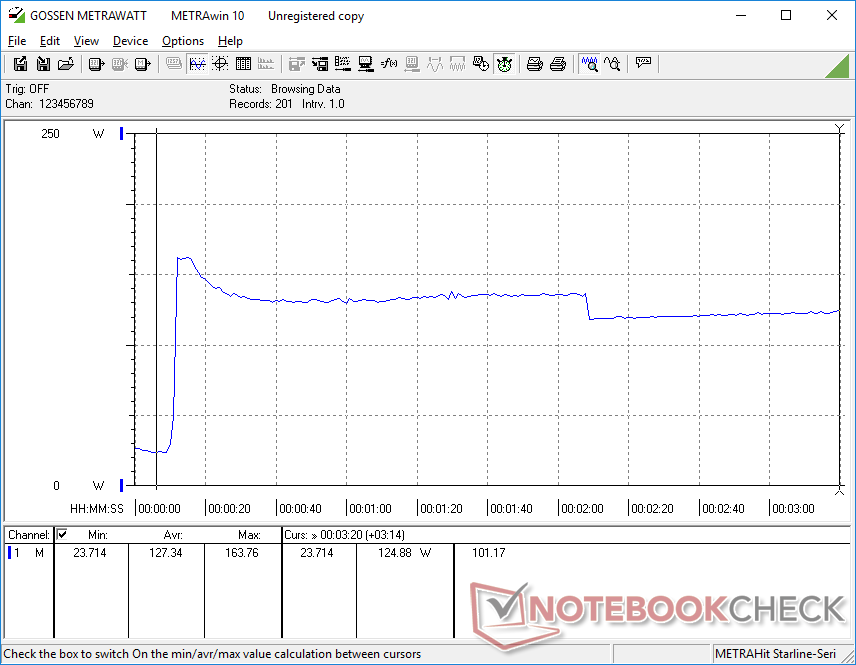
En general, el consumo de energía es inferior al de la mayoría de los portátiles de 17,3 pulgadas para juegos. Ejecutando Witcher 3, por ejemplo, consumiría sólo 150 W comparados con los 199 W y 231 W del MSI Vector GP76 y Acer Predator Helios 300, respectivamente, cada uno con la GPU RTX 3070 Ti. El consumo también es significativamente inferior al de la Radeon RX 6850M XT del Alienware m17 R5 ofreciendo casi el mismo rendimiento gráfico bruto.
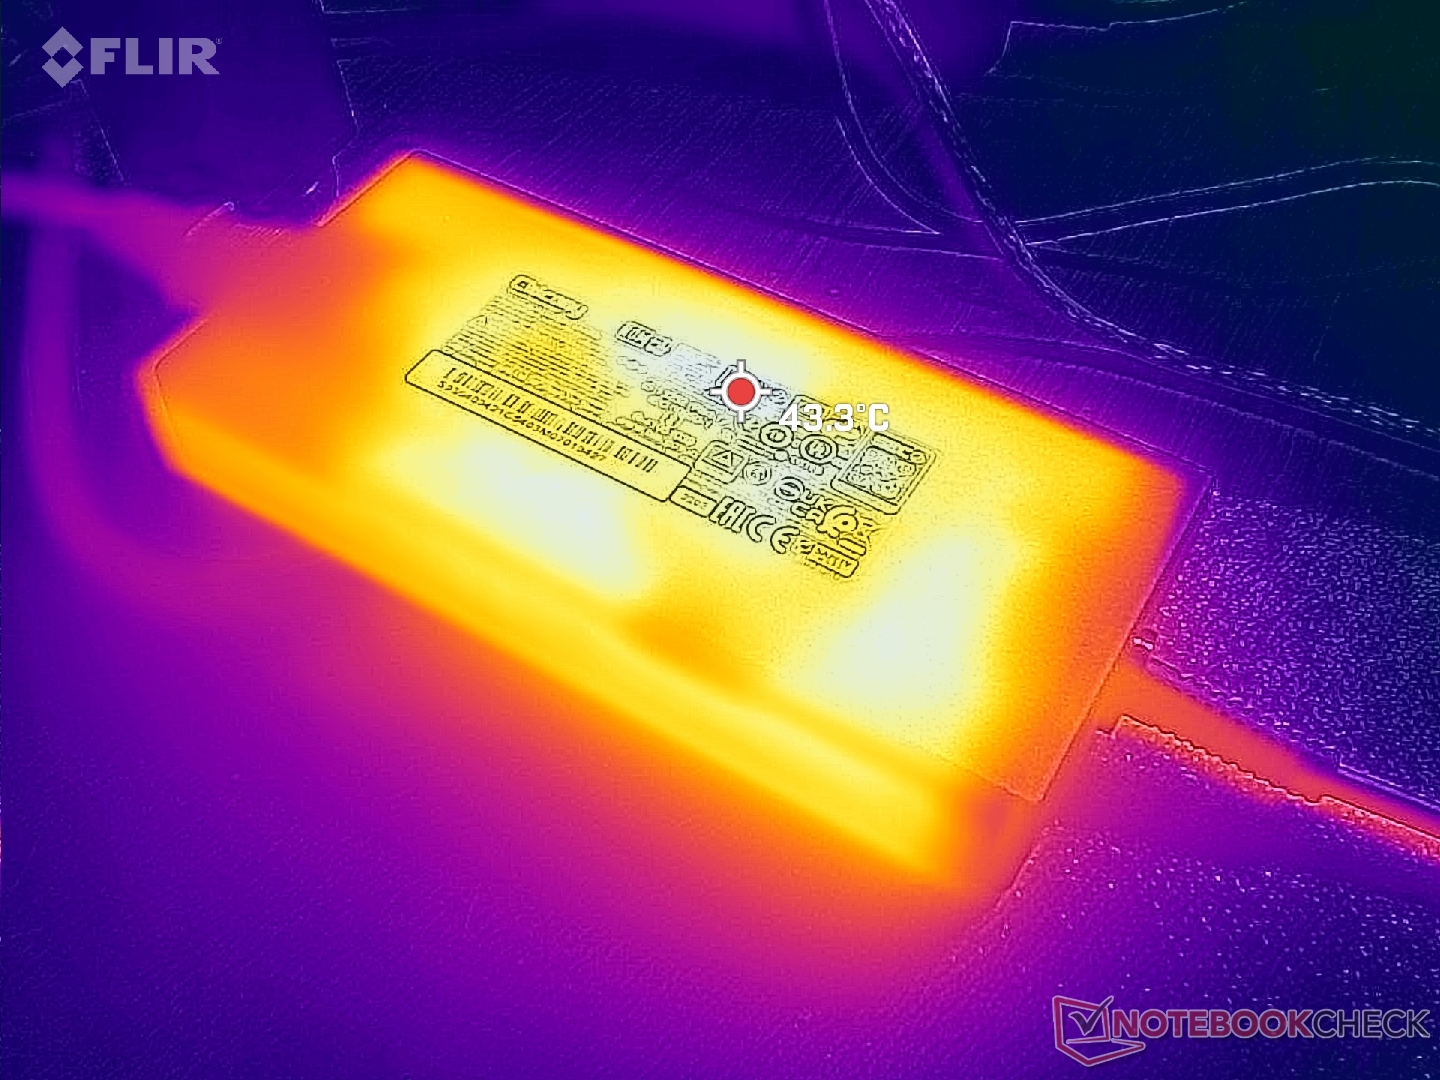
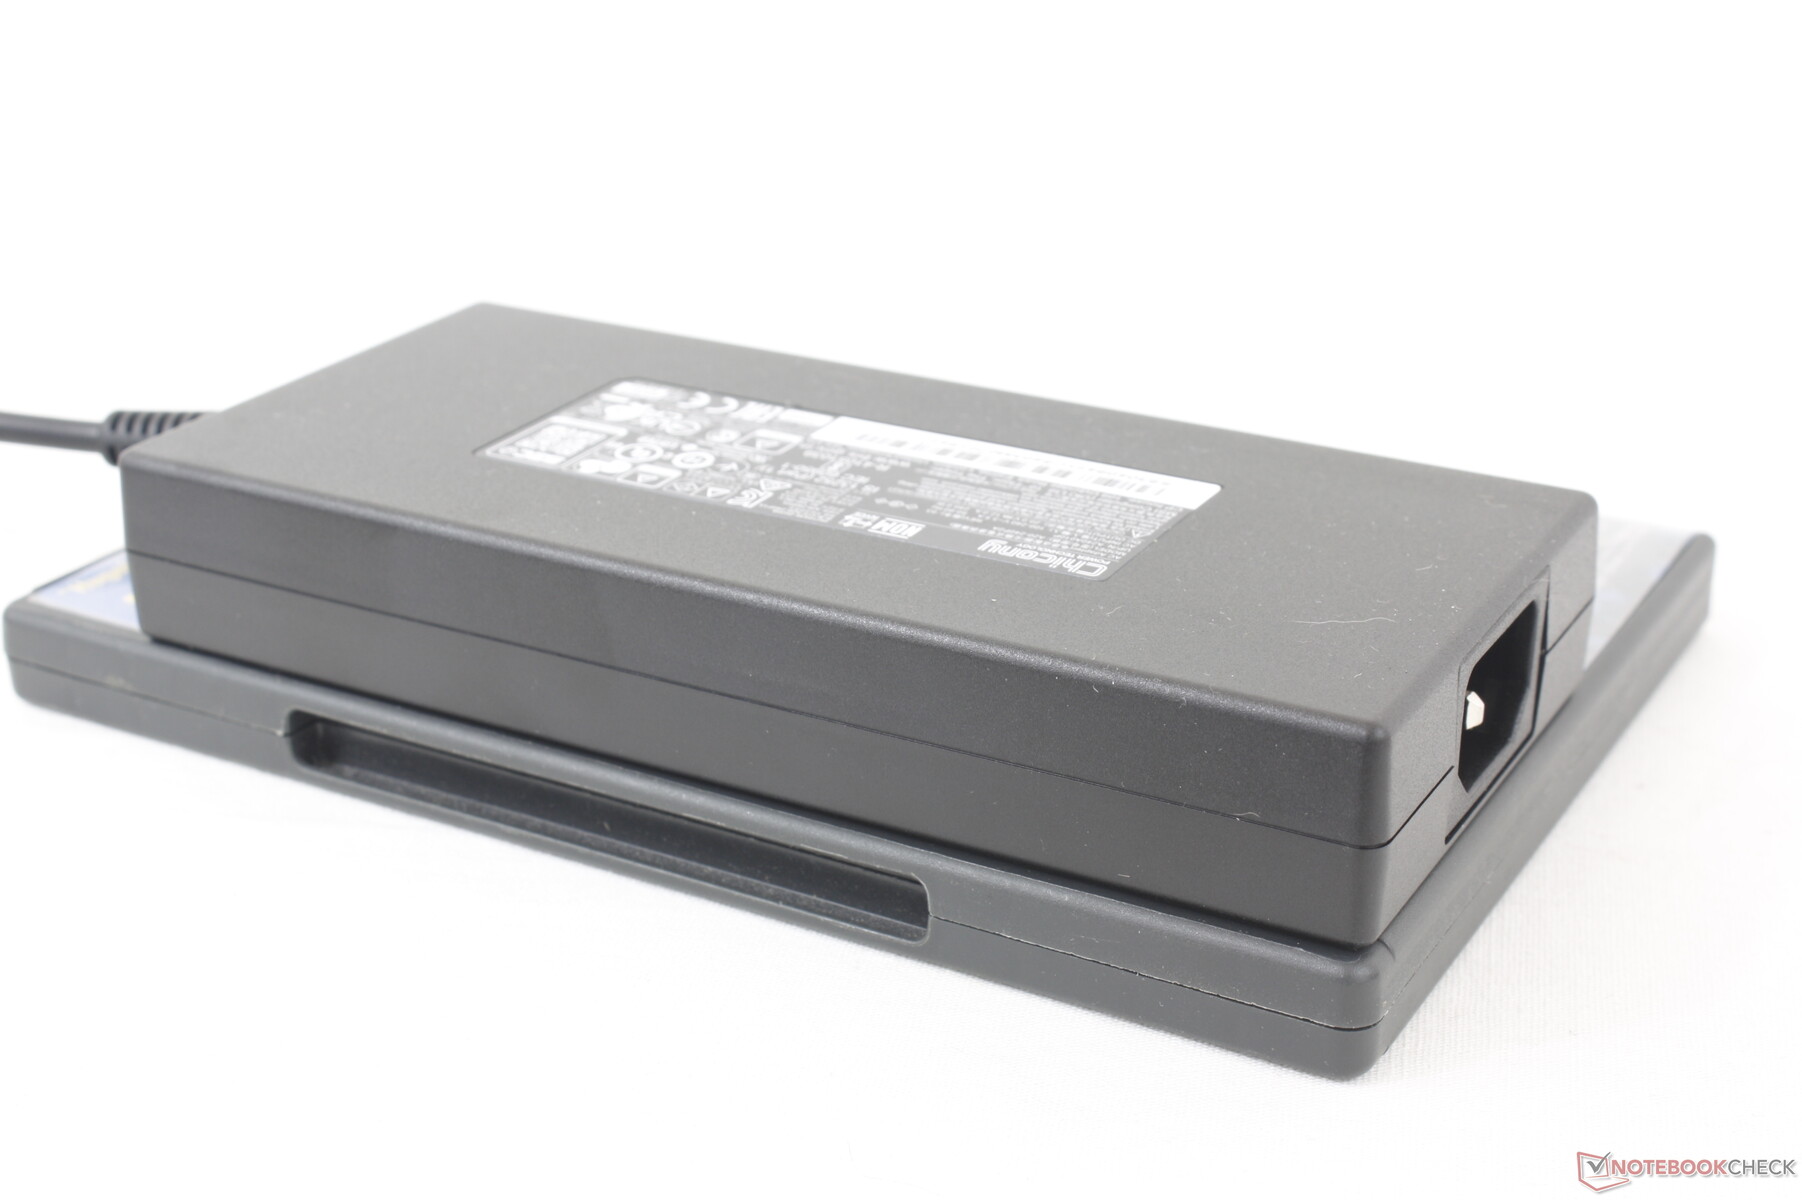
Podemos medir un consumo máximo de 241 W del adaptador de CA de 240 W de tamaño medio (~16.4 x 7.4 x 2.5 cm) cuando CPU y GPU están al 100% de uso. Esta tasa es sólo temporal, como muestran las capturas de pantalla de abajo, debido al limitado potencial Turbo Boost de la CPU. La batería puede seguir cargándose a un ritmo decente mientras se ejecutan cargas altas como juegos.
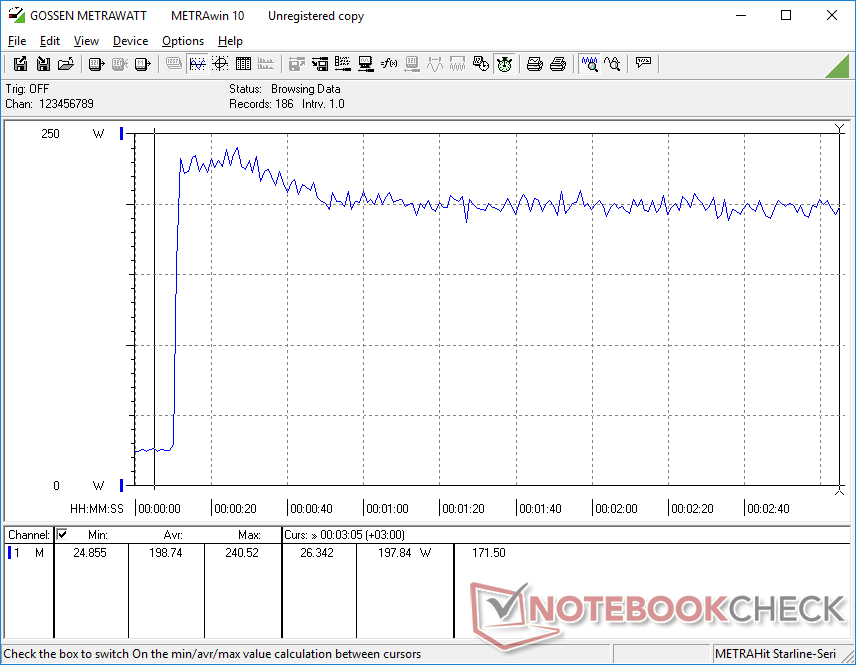
| Off / Standby | |
| Ocioso | |
| Carga |
|
Clave:
min: | |
| MSI Pulse GL76 12UGK i7-12700H, GeForce RTX 3070 Laptop GPU, Micron 3400 1TB MTFDKBA1T0TFH, IPS, 1920x1080, 17.3" | Alienware m17 R5 (R9 6900HX, RX 6850M XT) R9 6900HX, Radeon RX 6850M XT, SSSTC CA6-8D1024, IPS, 3840x2160, 17" | Asus ROG Strix Scar 17 SE G733CX-LL014W i9-12950HX, GeForce RTX 3080 Ti Laptop GPU, Samsung PM9A1 MZVL22T0HBLB, IPS, 2560x1440, 17.3" | Acer Predator Helios 300 (i7-12700H, RTX 3070 Ti) i7-12700H, GeForce RTX 3070 Ti Laptop GPU, Samsung PM9A1 MZVL21T0HCLR, IPS, 2560x1440, 17.3" | Razer Blade 17 Early 2022 i9-12900H, GeForce RTX 3080 Ti Laptop GPU, Samsung PM9A1 MZVL21T0HCLR, IPS, 3840x2160, 17.3" | MSI Vector GP76 12UGS-434 i7-12700H, GeForce RTX 3070 Ti Laptop GPU, Micron 2450 1TB MTFDKBA1T0TFK, IPS, 1920x1080, 17.3" | |
|---|---|---|---|---|---|---|
| Power Consumption | -8% | -46% | -27% | -36% | -27% | |
| Idle Minimum * (Watt) | 12.4 | 13 -5% | 19.3 -56% | 15 -21% | 17 -37% | 13.5 -9% |
| Idle Average * (Watt) | 13.1 | 16.5 -26% | 26.5 -102% | 20 -53% | 23 -76% | 15.6 -19% |
| Idle Maximum * (Watt) | 25.3 | 17 33% | 27.1 -7% | 22.3 12% | 34 -34% | 20.6 19% |
| Load Average * (Watt) | 105.4 | 93 12% | 141 -34% | 133 -26% | 120 -14% | 198 -88% |
| Witcher 3 ultra * (Watt) | 150 | 239 -59% | 225 -50% | 231 -54% | 229 -53% | 199 -33% |
| Load Maximum * (Watt) | 240.5 | 251 -4% | 307.9 -28% | 290 -21% | 243 -1% | 319 -33% |
* ... más pequeño es mejor
Power Consumption Witcher 3 / Stresstest
Power Consumption external Monitor
Duración de la batería - 99 Wh Li-Ion Pack
Curiosamente, las especificaciones oficiales de MSI en https://us.msi.com/Laptop/Pulse-GL76-12UX/Specification afirman que el GL76 tiene una batería de 53 Wh, mientras que en HWiNFO y en la batería física de nuestra unidad de pruebas la capacidad es de 90 Wh. La discrepancia es probablemente un error del fabricante. No obstante, la duración de la batería es buena para un portátil de juegos. Hemos podido registrar una autonomía WLAN de algo menos de 6 horas, unas 2 horas más que en el Razer Blade 17 o el Asus ROG Strix Scar 17.
La carga de vacío a lleno tarda algo más de 2 horas. No soporta USB-PD, por lo que el sistema sólo puede recargarse con el adaptador de CA tipo barril incluido.
| MSI Pulse GL76 12UGK i7-12700H, GeForce RTX 3070 Laptop GPU, 90 Wh | Alienware m17 R5 (R9 6900HX, RX 6850M XT) R9 6900HX, Radeon RX 6850M XT, 97 Wh | Asus ROG Strix Scar 17 SE G733CX-LL014W i9-12950HX, GeForce RTX 3080 Ti Laptop GPU, 90 Wh | Acer Predator Helios 300 (i7-12700H, RTX 3070 Ti) i7-12700H, GeForce RTX 3070 Ti Laptop GPU, 90 Wh | Razer Blade 17 Early 2022 i9-12900H, GeForce RTX 3080 Ti Laptop GPU, 82 Wh | MSI Vector GP76 12UGS-434 i7-12700H, GeForce RTX 3070 Ti Laptop GPU, 65 Wh | |
|---|---|---|---|---|---|---|
| Duración de Batería | -17% | -29% | -6% | -19% | -11% | |
| Reader / Idle (h) | 7.3 | 7.1 -3% | 7.3 0% | |||
| WiFi v1.3 (h) | 5.9 | 4.8 -19% | 4.2 -29% | 6 2% | 3.8 -36% | 5.1 -14% |
| Load (h) | 2.1 | 1.8 -14% | 1.8 -14% | 1.7 -19% | 1.7 -19% | |
| H.264 (h) | 4.9 | 5.9 | 4.8 |
Pro
Contra
Veredicto - Mucha potencia bruta, pero le faltan algunas características clave
El Pulse GL76 da en el clavo en lo que se refiere a precio, rendimiento y pantalla. El Core i7-12700H hace buena pareja con la GeForce RTX 3070, mientras que el panel 1080p de 360 Hz es el mismo que MSI utiliza para su mucho más cara GT77 Titan. Por $1400 USD o incluso $1200 si está a la venta, sería difícil encontrar otro portátil para juegos de 17,3 pulgadas con mejor CPU, GPU y pantalla que nuestro GL76.
Sin embargo, una vez que miras más allá de los procesadores y la pantalla, empiezan a verse los recortes. La falta de G-Sync, MUX, Advanced Optimus y Thunderbolt, en particular, echa por tierra un sistema por lo demás potente. Alternativas como el Asus TUF Gaming F17 o el Acer Predator Helios 300 llevan muchas de estas características que faltan y que los usuarios avanzados o los jugadores podrían apreciar. No esperamos que los portátiles de juego económicos tengan características tan modernas, pero el GL76 supera con creces los 1.000 dólares como para merecer al menos algunas de ellas.
El MSI Pulse GL76 prioriza el rendimiento bruto de Intel y Nvidia junto con una pantalla IPS de 360 Hz de alta calidad. Se echan en falta algunas características avanzadas, probablemente para mantener los costes bajo control.
Otras desventajas como el esponjoso clickpad, la webcam turbia, las bisagras normales, el diseño mayoritariamente de plástico y la falta de iluminación RGB por tecla son típicas de los portátiles de juego de gama media y no suponen un problema. Los jugadores que quieran maximizar el rendimiento y la calidad de pantalla sin arruinarse deberían considerar el GL76.
Precio y disponibilidad
El Pulse GL76 tal y como está configurado se puede adquirir actualmente en Costco por entre 1200 y 1400 USD. El modelo también está disponible en Amazon por $1650 USD, Newegg por $1750 USD, o en Best Buy por $1700 USD.
MSI Pulse GL76 12UGK
- 01/11/2023 v7 (old)
Allen Ngo
Price comparison

