Breve análisis del Asus AsusPro P4540UQ (7200U, 940MX, Full-HD)
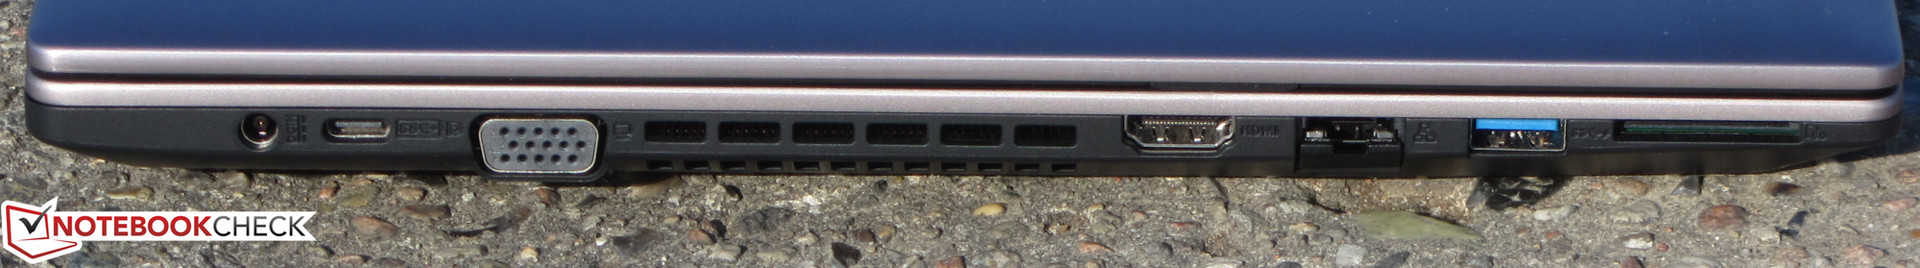
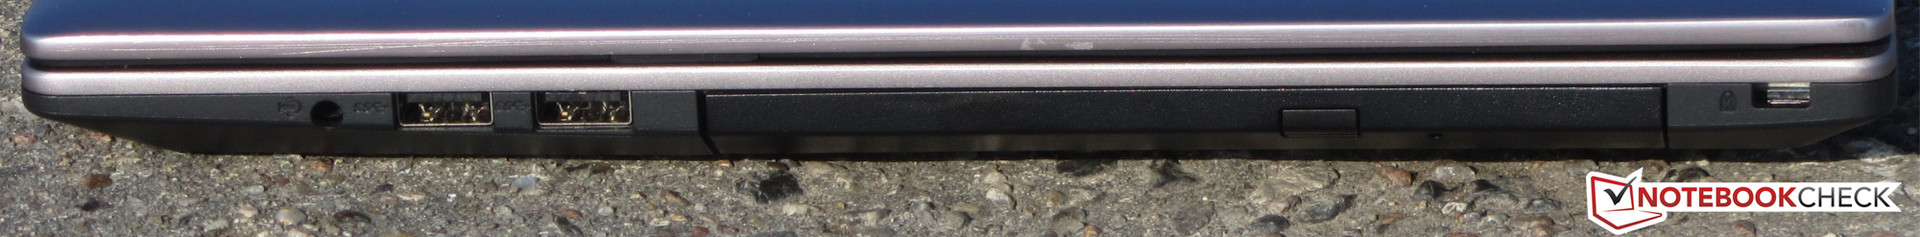
Connectivity
| SD Card Reader | |
| average JPG Copy Test (av. of 3 runs) | |
| HP ProBook 450 G4 Y8B60EA | |
| Asus AsusPro P4540UQ-FY0056R | |
| Acer TravelMate P259-MG-71UU | |
| Lenovo ThinkPad E570-20H6S00000 | |
| Dell Vostro 15-5568 | |
| maximum AS SSD Seq Read Test (1GB) | |
| HP ProBook 450 G4 Y8B60EA | |
| Lenovo ThinkPad E570-20H6S00000 | |
| Dell Vostro 15-5568 | |
| |||||||||||||||||||||||||
iluminación: 85 %
Brillo con batería: 296 cd/m²
Contraste: 1022:1 (Negro: 0.27 cd/m²)
ΔE ColorChecker Calman: 3.92 | ∀{0.5-29.43 Ø4.71}
ΔE Greyscale Calman: 2.6 | ∀{0.09-98 Ø4.96}
83.7% sRGB (Argyll 1.6.3 3D)
54.5% AdobeRGB 1998 (Argyll 1.6.3 3D)
61.1% AdobeRGB 1998 (Argyll 3D)
83.6% sRGB (Argyll 3D)
63.3% Display P3 (Argyll 3D)
Gamma: 2.53
CCT: 6561 K
| Asus AsusPro P4540UQ-FY0056R IPS, 1920x1080, 15.6" | HP ProBook 450 G4 Y8B60EA TN LED, 1920x1080, 15.6" | Lenovo ThinkPad E570-20H6S00000 IPS LED, 1920x1080, 15.6" | Acer TravelMate P259-MG-71UU TN LED, 1920x1080, 15.6" | Dell Vostro 15-5568 TN LED, 1920x1080, 15.6" | |
|---|---|---|---|---|---|
| Display | -33% | -35% | -35% | ||
| Display P3 Coverage (%) | 63.3 | 39.89 -37% | 38.65 -39% | 38.58 -39% | |
| sRGB Coverage (%) | 83.6 | 59.5 -29% | 58 -31% | 58 -31% | |
| AdobeRGB 1998 Coverage (%) | 61.1 | 41.24 -33% | 39.94 -35% | 39.85 -35% | |
| Response Times | -19% | -3% | 6% | -10% | |
| Response Time Grey 50% / Grey 80% * (ms) | 38 ? | 51 ? -34% | 44.8 ? -18% | 43 ? -13% | 47.6 ? -25% |
| Response Time Black / White * (ms) | 29 ? | 30 ? -3% | 25.6 ? 12% | 22 ? 24% | 27.2 ? 6% |
| PWM Frequency (Hz) | 21000 ? | 50 ? | |||
| Screen | -84% | -15% | -84% | -82% | |
| Brightness middle (cd/m²) | 276 | 214 -22% | 242 -12% | 180 -35% | 229 -17% |
| Brightness (cd/m²) | 283 | 201 -29% | 243 -14% | 178 -37% | 222 -22% |
| Brightness Distribution (%) | 85 | 77 -9% | 75 -12% | 93 9% | 82 -4% |
| Black Level * (cd/m²) | 0.27 | 0.43 -59% | 0.24 11% | 0.45 -67% | 0.56 -107% |
| Contrast (:1) | 1022 | 498 -51% | 1008 -1% | 400 -61% | 409 -60% |
| Colorchecker dE 2000 * | 3.92 | 10.68 -172% | 4.65 -19% | 9.91 -153% | 10.36 -164% |
| Colorchecker dE 2000 max. * | 9.13 | 18.07 -98% | 9.64 -6% | 18.19 -99% | 14.95 -64% |
| Greyscale dE 2000 * | 2.6 | 11.32 -335% | 3.39 -30% | 11.25 -333% | 10.9 -319% |
| Gamma | 2.53 87% | 2.26 97% | 2.7 81% | 2.35 94% | 2.21 100% |
| CCT | 6561 99% | 12204 53% | 6246 104% | 12115 54% | 10084 64% |
| Color Space (Percent of AdobeRGB 1998) (%) | 54.5 | 38 -30% | 36.69 -33% | 37 -32% | 37.69 -31% |
| Color Space (Percent of sRGB) (%) | 83.7 | 59 -30% | 57.66 -31% | 58 -31% | 57.92 -31% |
| Media total (Programa/Opciones) | -45% /
-65% | -18% /
-17% | -38% /
-62% | -46% /
-70% |
* ... más pequeño es mejor
Parpadeo de Pantalla / PWM (Pulse-Width Modulation)
| Parpadeo de Pantalla / PWM detectado | 21000 Hz | ≤ 90 % de brillo | 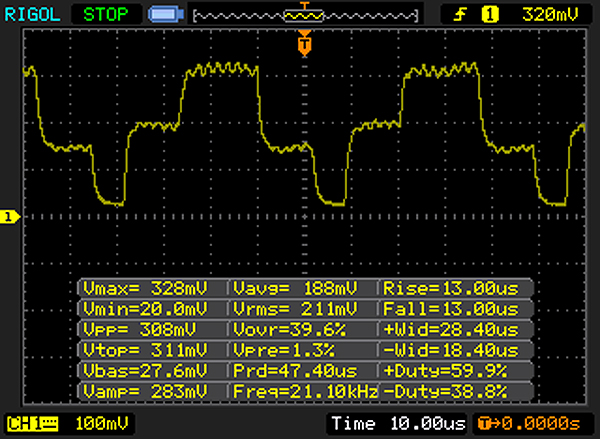 |
La retroiluminación del display parpadea a 21000 Hz (seguramente usa PWM - Pulse-Width Modulation) a un brillo del 90 % e inferior. Sobre este nivel de brillo no debería darse parpadeo / PWM. La frecuencia de 21000 Hz es bastante alta, por lo que la mayoría de gente sensible al parpadeo no debería ver parpadeo o tener fatiga visual. Comparación: 52 % de todos los dispositivos testados no usaron PWM para atenuar el display. Si se usó, medimos una media de 7754 (mínimo: 5 - máxmo: 343500) Hz. | |||
Tiempos de respuesta del display
| ↔ Tiempo de respuesta de Negro a Blanco | ||
|---|---|---|
| 29 ms ... subida ↗ y bajada ↘ combinada | ↗ 17 ms subida | 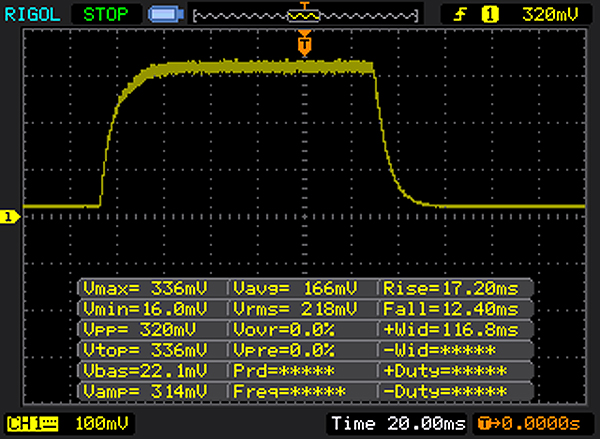 |
| ↘ 12 ms bajada | ||
| La pantalla mostró tiempos de respuesta relativamente lentos en nuestros tests pero podría ser demasiado lenta para los jugones. En comparación, todos los dispositivos de prueba van de ##min### (mínimo) a 240 (máximo) ms. » 77 % de todos los dispositivos son mejores. Eso quiere decir que el tiempo de respuesta es peor que la media (19.8 ms) de todos los dispositivos testados. | ||
| ↔ Tiempo de respuesta 50% Gris a 80% Gris | ||
| 38 ms ... subida ↗ y bajada ↘ combinada | ↗ 20 ms subida | 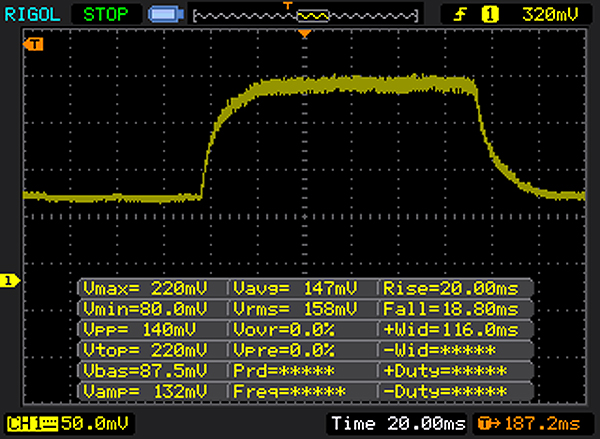 |
| ↘ 18 ms bajada | ||
| La pantalla mostró tiempos de respuesta lentos en nuestros tests y podría ser demasiado lenta para los jugones. En comparación, todos los dispositivos de prueba van de ##min### (mínimo) a 636 (máximo) ms. » 55 % de todos los dispositivos son mejores. Eso quiere decir que el tiempo de respuesta es peor que la media (31 ms) de todos los dispositivos testados. | ||
| Cinebench R10 | |
| Rendering Multiple CPUs 32Bit | |
| Acer TravelMate P259-MG-71UU | |
| Asus AsusPro P4540UQ-FY0056R | |
| Rendering Single 32Bit | |
| Asus AsusPro P4540UQ-FY0056R | |
| Acer TravelMate P259-MG-71UU | |
| Geekbench 3 | |
| 32 Bit Single-Core Score | |
| Acer TravelMate P259-MG-71UU | |
| Asus AsusPro P4540UQ-FY0056R | |
| 32 Bit Multi-Core Score | |
| Acer TravelMate P259-MG-71UU | |
| Asus AsusPro P4540UQ-FY0056R | |
| Geekbench 4.0 | |
| 64 Bit Single-Core Score | |
| Acer TravelMate P259-MG-71UU | |
| Asus AsusPro P4540UQ-FY0056R | |
| 64 Bit Multi-Core Score | |
| Acer TravelMate P259-MG-71UU | |
| Asus AsusPro P4540UQ-FY0056R | |
| JetStream 1.1 - 1.1 Total | |
| HP ProBook 450 G4 Y8B60EA | |
| Dell Vostro 15-5568 | |
| Asus AsusPro P4540UQ-FY0056R | |
| Lenovo ThinkPad E570-20H6S00000 | |
| Acer TravelMate P259-MG-71UU | |
| PCMark 8 Home Score Accelerated v2 | 3428 puntos | |
| PCMark 8 Creative Score Accelerated v2 | 4256 puntos | |
| PCMark 8 Work Score Accelerated v2 | 4478 puntos | |
ayuda | ||

| Asus AsusPro P4540UQ-FY0056R SK Hynix HFS256G39TND-N210A | HP ProBook 450 G4 Y8B60EA SanDisk SD8SNAT256G1002 | Lenovo ThinkPad E570-20H6S00000 Toshiba THNSF5256GPUK | Acer TravelMate P259-MG-71UU Liteonit CV3-8D256 | Dell Vostro 15-5568 SanDisk X400 256GB, SATA (SD8SB8U-256G) | |
|---|---|---|---|---|---|
| AS SSD | -15% | 71% | 5% | 10% | |
| Seq Read (MB/s) | 502 | 493.8 -2% | 1227 144% | 402.9 -20% | 502 0% |
| Seq Write (MB/s) | 190.8 | 315.9 66% | 636 233% | 333.5 75% | 465.2 144% |
| 4K Read (MB/s) | 27.19 | 17.96 -34% | 37.12 37% | 29.56 9% | 26.84 -1% |
| 4K Write (MB/s) | 63.5 | 73.4 16% | 73.1 15% | 62.9 -1% | 50.3 -21% |
| 4K-64 Read (MB/s) | 364.5 | 137.1 -62% | 654 79% | 328.5 -10% | 357.9 -2% |
| 4K-64 Write (MB/s) | 233.6 | 195.5 -16% | 232.5 0% | 163.6 -30% | 156.4 -33% |
| Access Time Read * (ms) | 0.084 | 0.141 -68% | 0.06 29% | 0.091 -8% | 0.098 -17% |
| Access Time Write * (ms) | 0.224 | 0.159 29% | 0.036 84% | 0.057 75% | 0.083 63% |
| Score Read (Points) | 442 | 204 -54% | 813 84% | 398 -10% | 435 -2% |
| Score Write (Points) | 316 | 300 -5% | 369 17% | 260 -18% | 253 -20% |
| Score Total (Points) | 977 | 607 -38% | 1578 62% | 869 -11% | 917 -6% |
* ... más pequeño es mejor
| 3DMark 11 Performance | 2800 puntos | |
| 3DMark Ice Storm Standard Score | 51531 puntos | |
| 3DMark Cloud Gate Standard Score | 7704 puntos | |
| 3DMark Fire Strike Score | 1916 puntos | |
| 3DMark Time Spy Score | 633 puntos | |
ayuda | ||
| 3DMark 11 - 1280x720 Performance GPU | |
| Lenovo ThinkPad E570-20H6S00000 | |
| Acer TravelMate P259-MG-71UU | |
| Asus AsusPro P4540UQ-FY0056R | |
| Lenovo ThinkPad E470-20H2S00400 | |
| Dell Vostro 15 5568 | |
| Asus Vivobook F556UQ-XO626D | |
| MSI CX62 7QL | |
| HP ProBook 450 G4 Y8B60EA | |
| Dell Vostro 15-5568 | |
| 3DMark - 1920x1080 Fire Strike Score | |
| Lenovo ThinkPad E570-20H6S00000 | |
| Acer TravelMate P259-MG-71UU | |
| Asus AsusPro P4540UQ-FY0056R | |
| Dell Vostro 15 5568 | |
| Lenovo ThinkPad E470-20H2S00400 | |
| MSI CX62 7QL | |
| HP ProBook 450 G4 Y8B60EA | |
| Dell Vostro 15-5568 | |
| bajo | medio | alto | ultra | |
|---|---|---|---|---|
| BioShock Infinite (2013) | 111 | 63.3 | 55 | 20.2 |
| Dota 2 Reborn (2015) | 105.9 | 89.8 | 53.1 | 47.7 |
| Resident Evil 7 (2017) | 70 | 34.3 | 19.7 | 5.7 |
| For Honor (2017) | 50.7 | 18.2 | 17.4 | 12.9 |
| Ghost Recon Wildlands (2017) | 32.2 | 12.5 | 11.3 | 6 |
| Mass Effect Andromeda (2017) | 31.2 | 14.5 | 9.8 | 8.6 |
| BioShock Infinite - 1366x768 High Preset | |
| Lenovo ThinkPad E570-20H6S00000 | |
| Acer TravelMate P259-MG-71UU | |
| Asus AsusPro P4540UQ-FY0056R | |
| Dell Vostro 15 5568 | |
| MSI CX62 7QL | |
| Lenovo ThinkPad E470-20H2S00400 | |
| HP ProBook 450 G4 Y8B60EA | |
| Asus Vivobook F556UQ-XO626D | |
| Dell Vostro 15-5568 | |
Ruido
| Ocioso |
| 30.3 / 30.3 / 30.3 dB(A) |
| DVD |
| 36.5 / dB(A) |
| Carga |
| 35.4 / 37.2 dB(A) |
 | ||
30 dB silencioso 40 dB(A) audible 50 dB(A) ruidosamente alto |
||
min: | ||
(+) La temperatura máxima en la parte superior es de 38 °C / 100 F, frente a la media de 34.3 °C / 94 F, que oscila entre 21.2 y 62.5 °C para la clase Office.
(+) El fondo se calienta hasta un máximo de 39.1 °C / 102 F, frente a la media de 36.8 °C / 98 F
(+) En reposo, la temperatura media de la parte superior es de 22 °C / 72# F, frente a la media del dispositivo de 29.5 °C / 85 F.
(+) El reposamanos y el panel táctil están a una temperatura inferior a la de la piel, con un máximo de 31.4 °C / 88.5 F y, por tanto, son fríos al tacto.
(-) La temperatura media de la zona del reposamanos de dispositivos similares fue de 27.5 °C / 81.5 F (-3.9 °C / -7 F).
Asus AsusPro P4540UQ-FY0056R análisis de audio
(±) | la sonoridad del altavoz es media pero buena (78 dB)
Graves 100 - 315 Hz
(±) | lubina reducida - en promedio 9.1% inferior a la mediana
(+) | el bajo es lineal (5.3% delta a la frecuencia anterior)
Medios 400 - 2000 Hz
(+) | medios equilibrados - a sólo 1.9% de la mediana
(+) | los medios son lineales (3.2% delta a la frecuencia anterior)
Altos 2 - 16 kHz
(±) | máximos más altos - de media 13.3% más altos que la mediana
(±) | la linealidad de los máximos es media (8.3% delta a frecuencia anterior)
Total 100 - 16.000 Hz
(±) | la linealidad del sonido global es media (20.5% de diferencia con la mediana)
En comparación con la misma clase
» 46% de todos los dispositivos probados de esta clase eran mejores, 10% similares, 44% peores
» El mejor tuvo un delta de 7%, la media fue 21%, el peor fue ###max##%
En comparación con todos los dispositivos probados
» 54% de todos los dispositivos probados eran mejores, 8% similares, 38% peores
» El mejor tuvo un delta de 4%, la media fue 23%, el peor fue ###max##%
Apple MacBook 12 (Early 2016) 1.1 GHz análisis de audio
(+) | los altavoces pueden reproducir a un volumen relativamente alto (#83.6 dB)
Graves 100 - 315 Hz
(±) | lubina reducida - en promedio 11.3% inferior a la mediana
(±) | la linealidad de los graves es media (14.2% delta a frecuencia anterior)
Medios 400 - 2000 Hz
(+) | medios equilibrados - a sólo 2.4% de la mediana
(+) | los medios son lineales (5.5% delta a la frecuencia anterior)
Altos 2 - 16 kHz
(+) | máximos equilibrados - a sólo 2% de la mediana
(+) | los máximos son lineales (4.5% delta a la frecuencia anterior)
Total 100 - 16.000 Hz
(+) | el sonido global es lineal (10.2% de diferencia con la mediana)
En comparación con la misma clase
» 7% de todos los dispositivos probados de esta clase eran mejores, 2% similares, 90% peores
» El mejor tuvo un delta de 5%, la media fue 18%, el peor fue ###max##%
En comparación con todos los dispositivos probados
» 5% de todos los dispositivos probados eran mejores, 1% similares, 94% peores
» El mejor tuvo un delta de 4%, la media fue 23%, el peor fue ###max##%
| Off / Standby | |
| Ocioso | |
| Carga |
|
Clave:
min: | |
| Battery Runtime - WiFi Websurfing | |
| Asus AsusPro P4540UQ-FY0056R | |
| HP ProBook 450 G4 Y8B60EA | |
| Lenovo ThinkPad E570-20H6S00000 | |
| Dell Vostro 15-5568 | |
| Acer TravelMate P259-MG-71UU | |
Pro
Contra
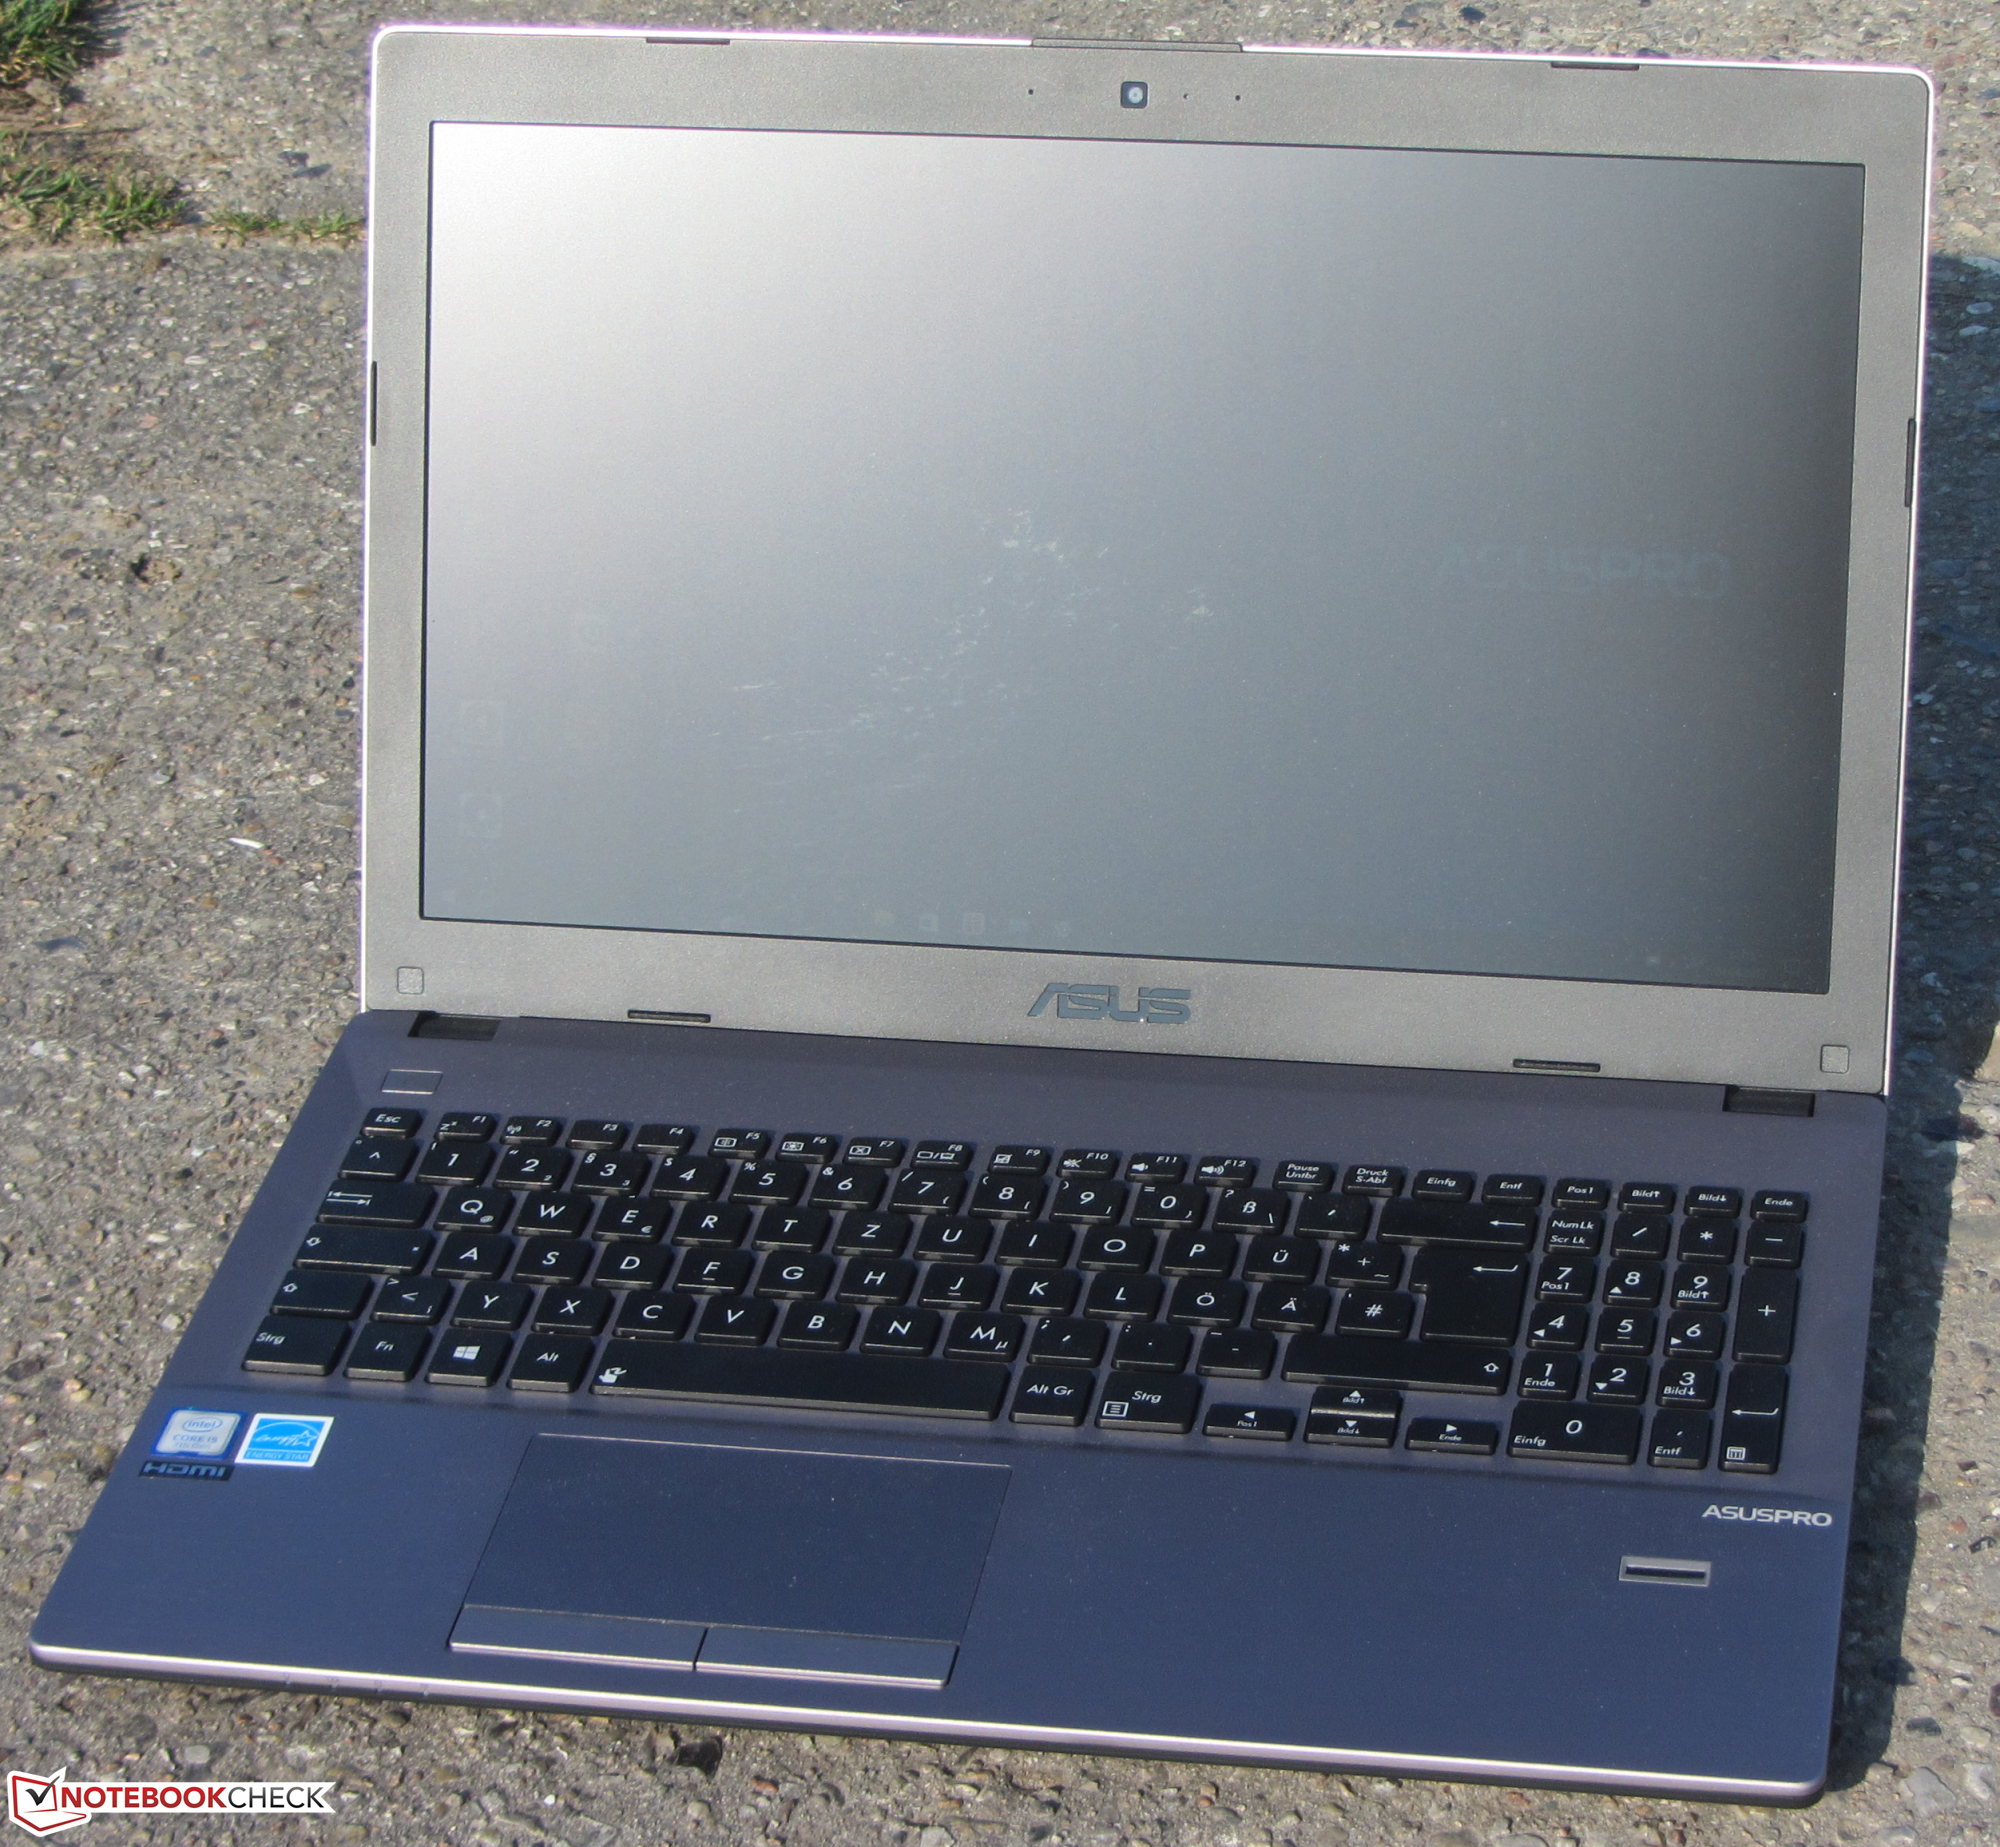
El Asus AsusPro P4540UQ lleva un procesador Core-i5 Kaby-Lake que debería satisfacer completamente las demandas de la mayoría de usuarios. La GPU GeForce permite el uso de videojuegos. A pesar de la decente potencia de cálculo del dispositivo, apenas se caldea y casi siempre funciona de forma queda.
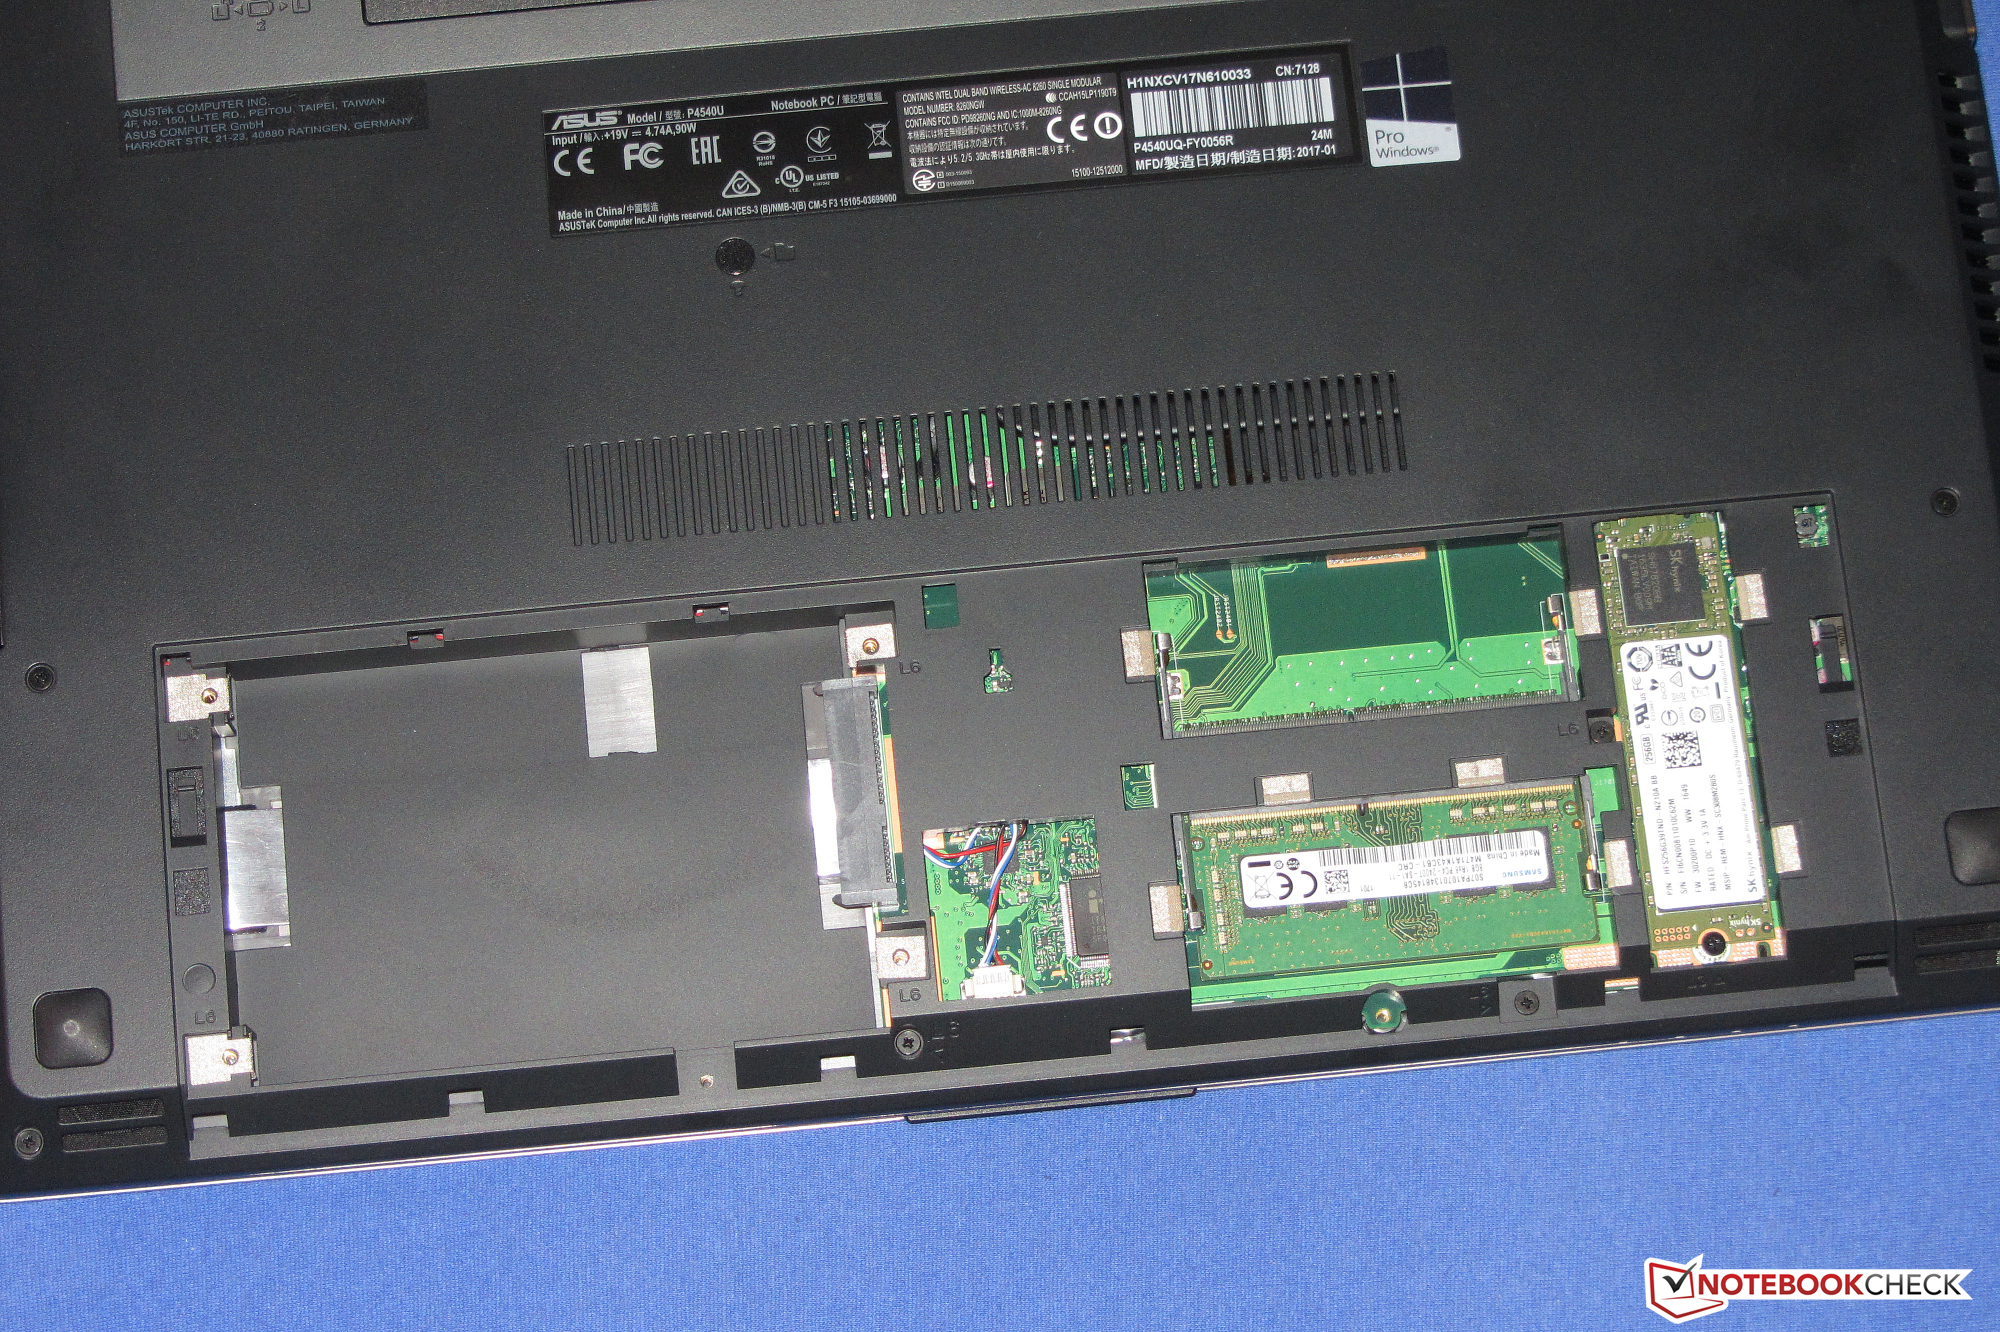
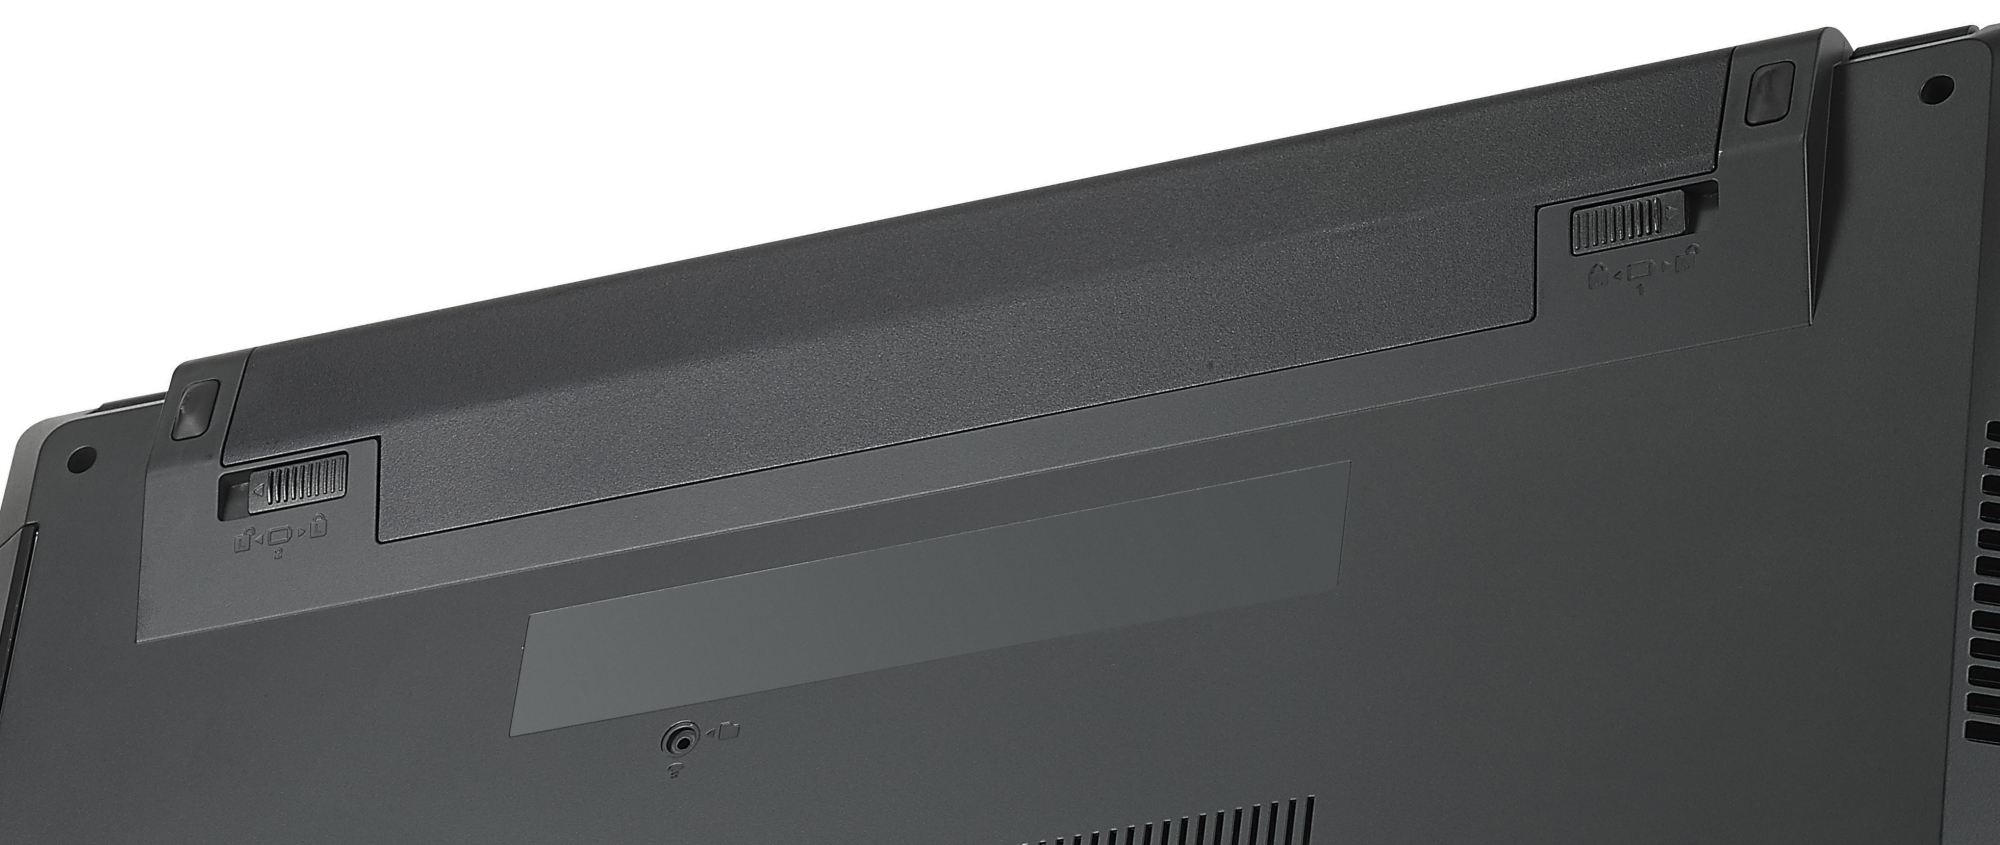
Un SSD se asegura de que el sistema vaya rápido. Gracias a la escotilla de mantenimiento, se puede cambiar el SSD rápidamente. También está la opción de insertar un disco 2.5" adicional en el ordenador. Sin embargo, haría falta un marco de monta para ello. La pantalla mate IPS del ordenador agrada con ángulos de visión estables, buen contraste, y brillo decente. El excelente aguante tampoco debería olvidarse.
Con el AsusPro P4540UQ, Asus compite de verdad con los jefazos establecidos.
El teclado puede mejorar. No que el teclado integrado sea malo, pero no le puede hacer frente a los modelos integrados en HP Probook 450 G4 y Lenovo Thinkpad E570. Lo que es más, al teclado Asus le falta iluminación. Pero a ese respecto, la competencia no va tampoco muy allá.
Ésta es una versión acortada del análisis original. Puedes leer el análisis completo en inglés aquí.
Asus AsusPro P4540UQ-FY0056R
- 04/06/2017 v6 (old)
Sascha Mölck