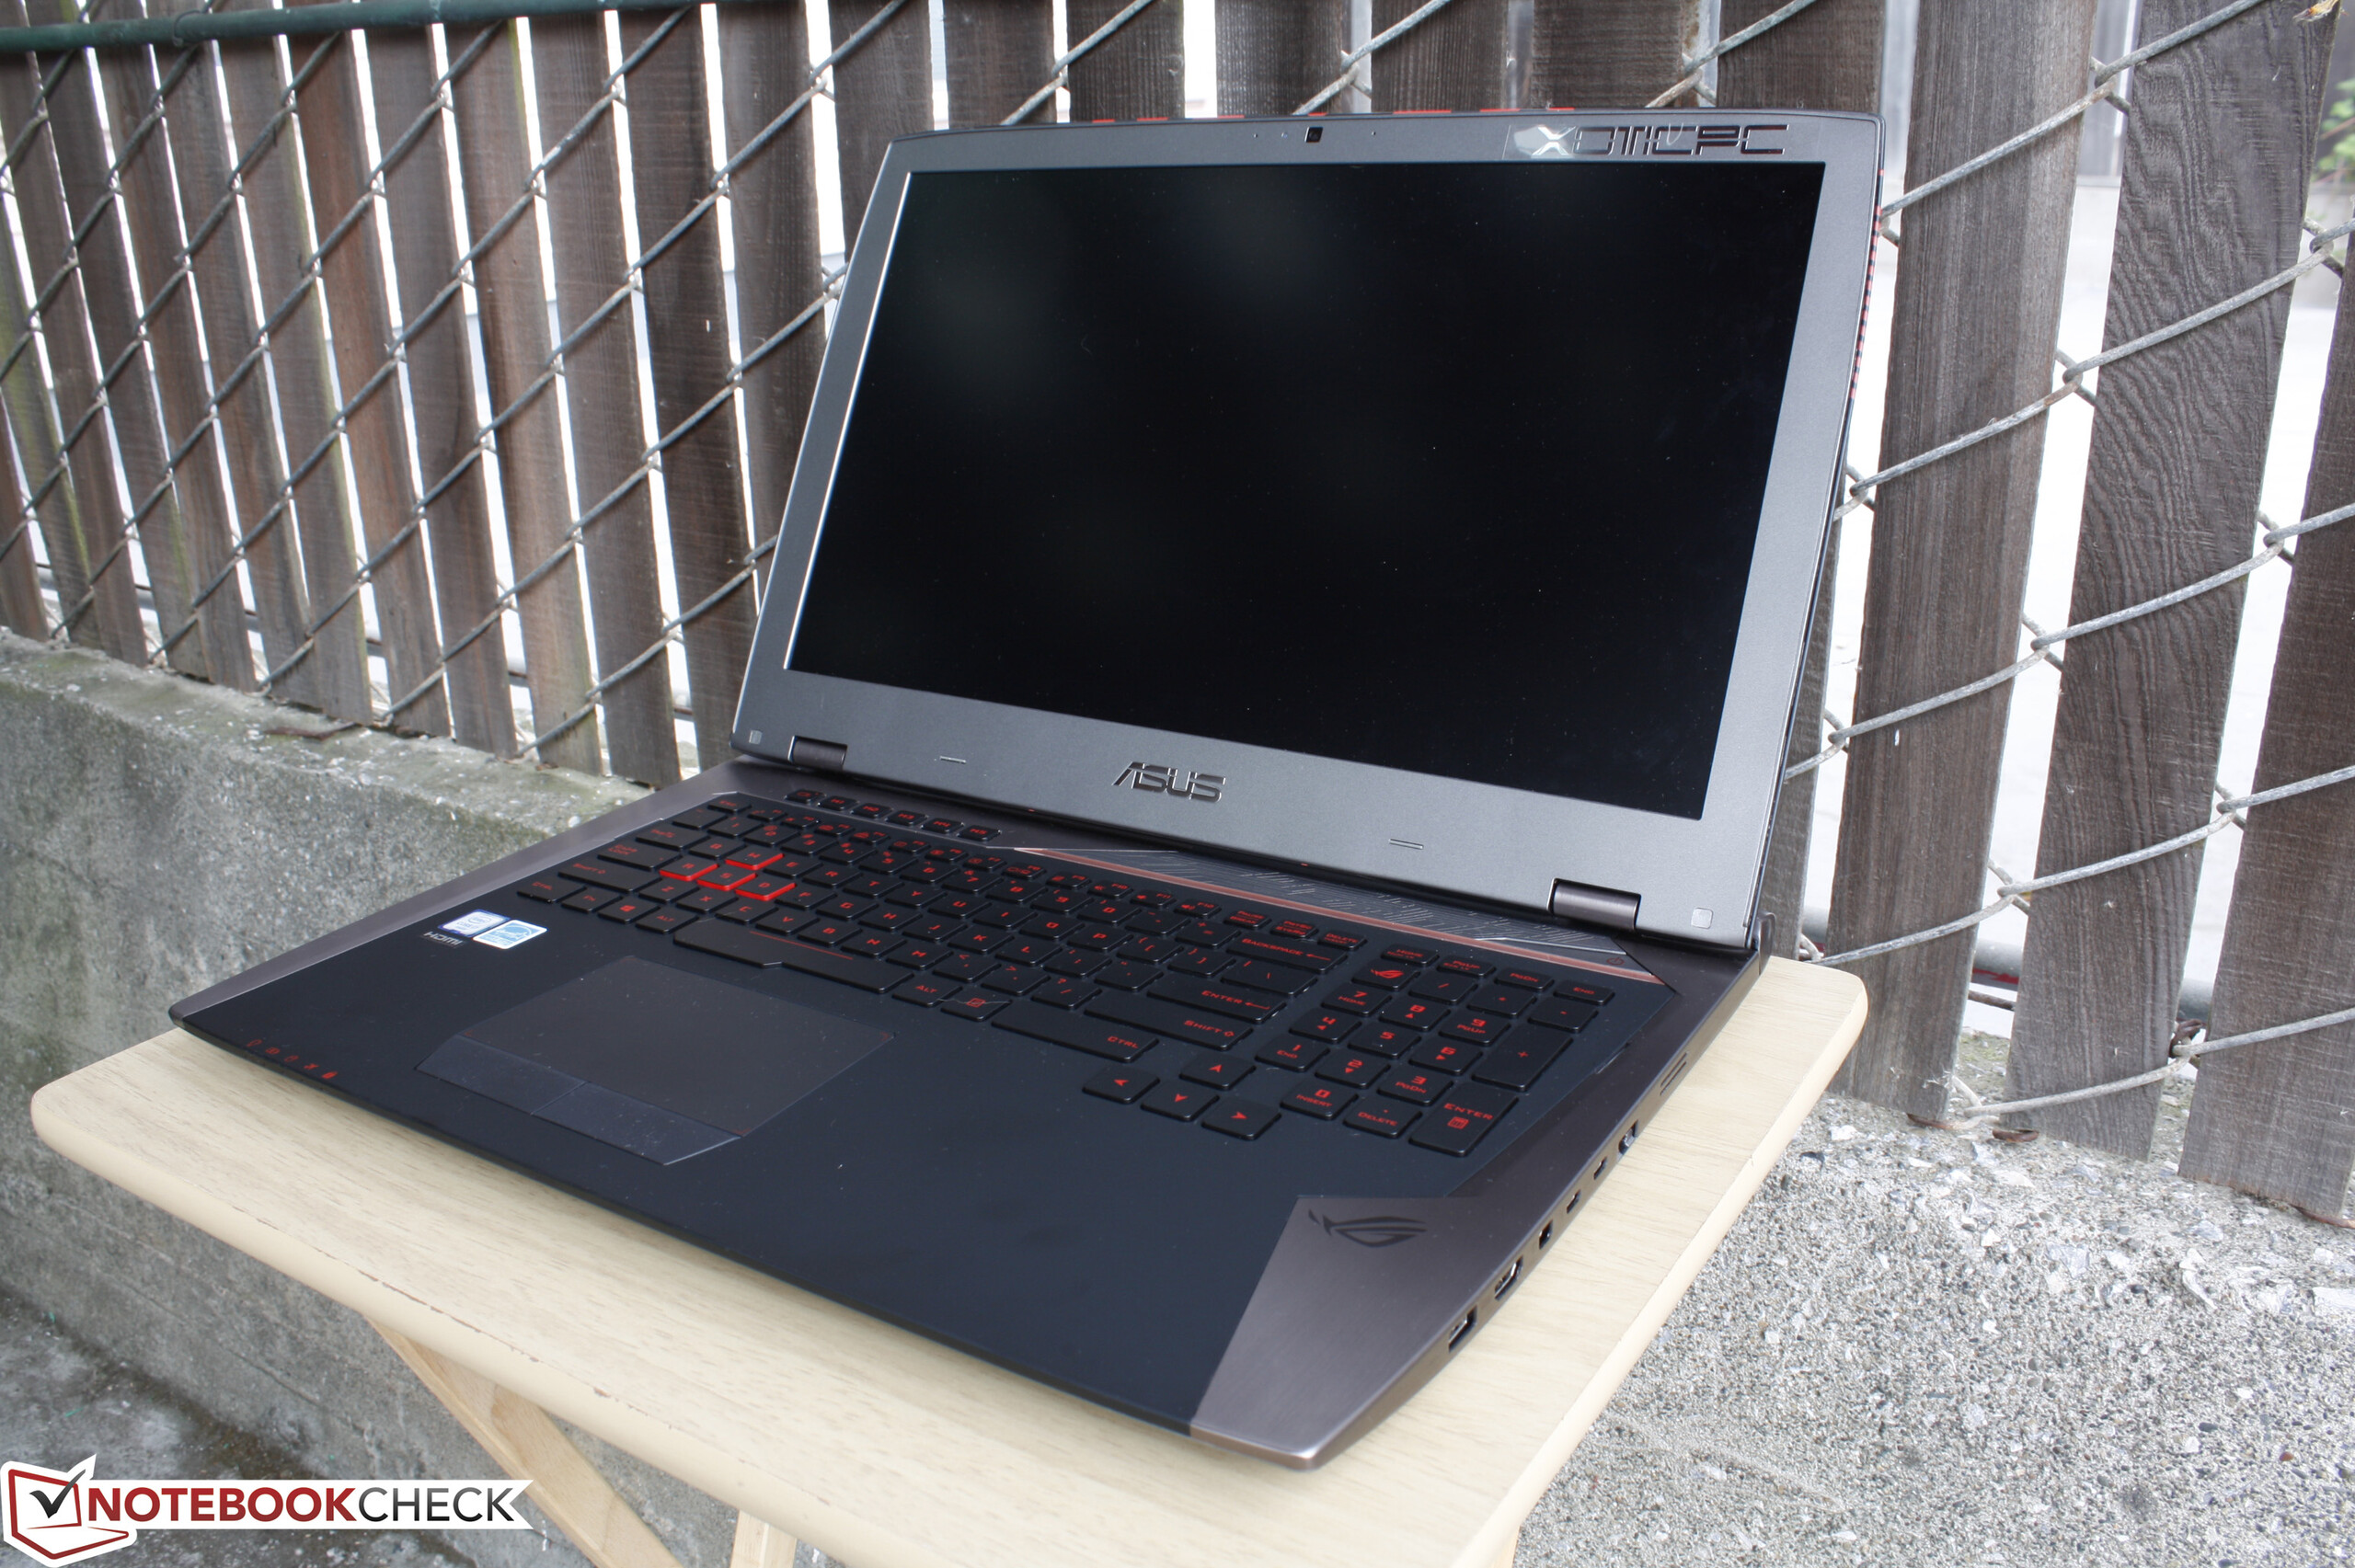
Breve análisis del Asus ROG G701VO-CS74K Xotic PC Edition


| SD Card Reader | |
| average JPG Copy Test (av. of 3 runs) | |
| Asus G701VO-CS74K | |
| Apple MacBook Pro Retina 13 inch 2013-10 | |
| Alienware 17 R3 (A17-9935) | |
| Lenovo Yoga 710-14ISK | |
| maximum AS SSD Seq Read Test (1GB) | |
| Asus G701VO-CS74K | |
| Lenovo Yoga 710-14ISK | |
| Alienware 17 R3 (A17-9935) | |
| Networking | |
| iperf Server (receive) TCP 1 m | |
| Apple MacBook 12 (Early 2016) 1.1 GHz | |
| Dell Inspiron 15 5568 | |
| iperf Client (transmit) TCP 1 m | |
| Apple MacBook 12 (Early 2016) 1.1 GHz | |
| Dell Inspiron 15 5568 | |
| |||||||||||||||||||||||||
iluminación: 86 %
Brillo con batería: 368.1 cd/m²
Contraste: 1008:1 (Negro: 0.365 cd/m²)
ΔE ColorChecker Calman: 4.16 | ∀{0.5-29.43 Ø4.73}
ΔE Greyscale Calman: 3.86 | ∀{0.09-98 Ø4.97}
87.6% sRGB (Argyll 1.6.3 3D)
57.6% AdobeRGB 1998 (Argyll 1.6.3 3D)
64.1% AdobeRGB 1998 (Argyll 3D)
87.7% sRGB (Argyll 3D)
68.8% Display P3 (Argyll 3D)
Gamma: 2.19
CCT: 6892 K
| Asus G701VO-CS74K IPS, 17.3", 1920x1080 | Alienware 17 R3 (A17-9935) CV69H_173WF4 (LGD0459), IPS, 17.3", 1920x1080 | Eurocom Sky DLX7 IPS, 17.3", 3840x2160 | MSI GT72S 6QF Name: LG Philips LP173WF4-SPF1, ID: LGD0469, IPS, 17.3", 1920x1080 | Asus G752VY-RH71 ID: LG Philips LGD04E8, Name: LP173WF-SPF3, IPS, 17.3", 1920x1080 | |
|---|---|---|---|---|---|
| Display | -4% | 31% | -2% | -3% | |
| Display P3 Coverage (%) | 68.8 | 66.9 -3% | 86.3 25% | 67.6 -2% | 67.2 -2% |
| sRGB Coverage (%) | 87.7 | 83.9 -4% | 99.9 14% | 86.1 -2% | 85.2 -3% |
| AdobeRGB 1998 Coverage (%) | 64.1 | 61.4 -4% | 99.5 55% | 63 -2% | 62.3 -3% |
| Response Times | 0% | -30% | -29% | -28% | |
| Response Time Grey 50% / Grey 80% * (ms) | 29.2 ? | 33 ? -13% | 45 -54% | 43 ? -47% | 42.8 ? -47% |
| Response Time Black / White * (ms) | 26.4 ? | 23 ? 13% | 28 -6% | 29 ? -10% | 28.4 ? -8% |
| PWM Frequency (Hz) | |||||
| Screen | -8% | 3% | 7% | 1% | |
| Brightness middle (cd/m²) | 368.1 | 360 -2% | 324.1 -12% | 356.7 -3% | 346.8 -6% |
| Brightness (cd/m²) | 349 | 336 -4% | 314 -10% | 326 -7% | 330 -5% |
| Brightness Distribution (%) | 86 | 90 5% | 81 -6% | 85 -1% | 91 6% |
| Black Level * (cd/m²) | 0.365 | 0.44 -21% | 0.4 -10% | 0.282 23% | 0.393 -8% |
| Contrast (:1) | 1008 | 818 -19% | 810 -20% | 1265 25% | 882 -12% |
| Colorchecker dE 2000 * | 4.16 | 4.76 -14% | 4.57 -10% | 4.16 -0% | 3.72 11% |
| Colorchecker dE 2000 max. * | 8.7 | 10.8 -24% | 8.45 3% | ||
| Greyscale dE 2000 * | 3.86 | 3.69 4% | 2.81 27% | 2.47 36% | 2.93 24% |
| Gamma | 2.19 100% | 2.24 98% | 2.43 91% | 2.29 96% | 2.23 99% |
| CCT | 6892 94% | 6091 107% | 6313 103% | 6860 95% | 6525 100% |
| Color Space (Percent of AdobeRGB 1998) (%) | 57.6 | 55 -5% | 88 53% | 56 -3% | 56 -3% |
| Color Space (Percent of sRGB) (%) | 87.6 | 84 -4% | 100 14% | 85 -3% | 85.2 -3% |
| Media total (Programa/Opciones) | -4% /
-6% | 1% /
4% | -8% /
0% | -10% /
-4% |
* ... más pequeño es mejor
Tiempos de respuesta del display
| ↔ Tiempo de respuesta de Negro a Blanco | ||
|---|---|---|
| 26.4 ms ... subida ↗ y bajada ↘ combinada | ↗ 5.2 ms subida | 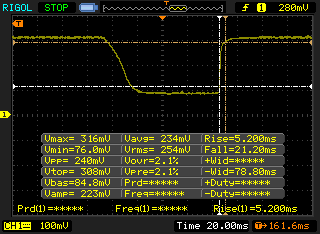 |
| ↘ 21.2 ms bajada | ||
| La pantalla mostró tiempos de respuesta relativamente lentos en nuestros tests pero podría ser demasiado lenta para los jugones. En comparación, todos los dispositivos de prueba van de ##min### (mínimo) a 240 (máximo) ms. » 66 % de todos los dispositivos son mejores. Eso quiere decir que el tiempo de respuesta es peor que la media (19.9 ms) de todos los dispositivos testados. | ||
| ↔ Tiempo de respuesta 50% Gris a 80% Gris | ||
| 29.2 ms ... subida ↗ y bajada ↘ combinada | ↗ 11.6 ms subida | 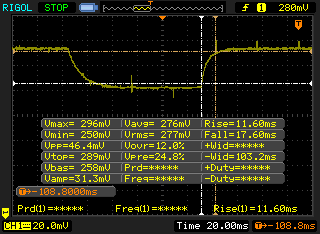 |
| ↘ 17.6 ms bajada | ||
| La pantalla mostró tiempos de respuesta relativamente lentos en nuestros tests pero podría ser demasiado lenta para los jugones. En comparación, todos los dispositivos de prueba van de ##min### (mínimo) a 636 (máximo) ms. » 39 % de todos los dispositivos son mejores. Eso quiere decir que el tiempo de respuesta es similar al dispositivo testado medio (31.1 ms). | ||
Parpadeo de Pantalla / PWM (Pulse-Width Modulation)
| Parpadeo de Pantalla / PWM no detectado | 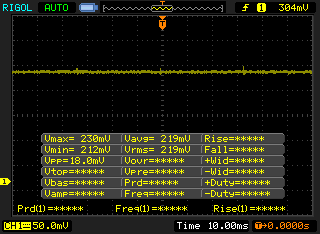 | ||
Comparación: 52 % de todos los dispositivos testados no usaron PWM para atenuar el display. Si se usó, medimos una media de 7784 (mínimo: 5 - máxmo: 343500) Hz. | |||
| Cinebench R15 | |
| CPU Single 64Bit (ordenar por valor) | |
| Asus G701VO-CS74K | |
| DogHouse Systems Mobius SS | |
| Asus Strix GL502VY-DS71 | |
| MSI GE62 2QC-468XPL | |
| Clevo P150SM-A | |
| CPU Multi 64Bit (ordenar por valor) | |
| Asus G701VO-CS74K | |
| DogHouse Systems Mobius SS | |
| Asus Strix GL502VY-DS71 | |
| MSI GE62 2QC-468XPL | |
| Clevo P150SM-A | |
| Cinebench R11.5 | |
| CPU Single 64Bit (ordenar por valor) | |
| Asus G701VO-CS74K | |
| DogHouse Systems Mobius SS | |
| Asus Strix GL502VY-DS71 | |
| MSI GE62 2QC-468XPL | |
| Clevo P150SM-A | |
| CPU Multi 64Bit (ordenar por valor) | |
| Asus G701VO-CS74K | |
| DogHouse Systems Mobius SS | |
| Asus Strix GL502VY-DS71 | |
| MSI GE62 2QC-468XPL | |
| Clevo P150SM-A | |
| Cinebench R10 | |
| Rendering Multiple CPUs 32Bit (ordenar por valor) | |
| Asus G701VO-CS74K | |
| DogHouse Systems Mobius SS | |
| Asus Strix GL502VY-DS71 | |
| MSI GE62 2QC-468XPL | |
| Clevo P150SM-A | |
| Rendering Single 32Bit (ordenar por valor) | |
| Asus G701VO-CS74K | |
| DogHouse Systems Mobius SS | |
| Asus Strix GL502VY-DS71 | |
| MSI GE62 2QC-468XPL | |
| Clevo P150SM-A | |
| wPrime 2.10 - 1024m (ordenar por valor) | |
| Asus G701VO-CS74K | |
| DogHouse Systems Mobius SS | |
| Asus Strix GL502VY-DS71 | |
| MSI GE62 2QC-468XPL | |
| Clevo P150SM-A | |
| Super Pi Mod 1.5 XS 32M - 32M (ordenar por valor) | |
| Asus G701VO-CS74K | |
| DogHouse Systems Mobius SS | |
| Asus Strix GL502VY-DS71 | |
| MSI GE62 2QC-468XPL | |
| Clevo P150SM-A | |
* ... más pequeño es mejor
| PCMark 8 | |
| Home Score Accelerated v2 (ordenar por valor) | |
| Asus G701VO-CS74K | |
| MSI GT72S 6QF | |
| DogHouse Systems Mobius SS | |
| Acer Predator 17 G9-791-75PV | |
| Alienware 17 R2 | |
| Work Score Accelerated v2 (ordenar por valor) | |
| Asus G701VO-CS74K | |
| MSI GT72S 6QF | |
| DogHouse Systems Mobius SS | |
| Alienware 17 R2 | |
| Creative Score Accelerated v2 (ordenar por valor) | |
| Asus G701VO-CS74K | |
| MSI GT72S 6QF | |
| DogHouse Systems Mobius SS | |
| Acer Predator 17 G9-791-75PV | |
| PCMark 8 Home Score Accelerated v2 | 5160 puntos | |
| PCMark 8 Creative Score Accelerated v2 | 7460 puntos | |
| PCMark 8 Work Score Accelerated v2 | 5653 puntos | |
ayuda | ||
| Asus G701VO-CS74K 2x Samsung SM951 MZVPV512HDGL (RAID 0) | Alienware 17 R3 (A17-9935) Samsung PM951 NVMe 512 GB | Eurocom Sky DLX7 Samsung SM951 MZVPV512HDGL m.2 PCI-e | MSI GT72S 6QE-071PL 2x Toshiba HG6 THNSNJ128G8NU (RAID 0) | Asus G752VY-RH71 Samsung SSD 950 Pro 512GB m.2 NVMe | |
|---|---|---|---|---|---|
| CrystalDiskMark 3.0 | -40% | -7% | -22% | -13% | |
| Read Seq (MB/s) | 3067 | 1263 -59% | 1819 -41% | 3047 -1% | 2007 -35% |
| Write Seq (MB/s) | 2434 | 587 -76% | 1566 -36% | 979 -60% | 1536 -37% |
| Read 512 (MB/s) | 1582 | 569 -64% | 1056 -33% | 1599 1% | 1022 -35% |
| Write 512 (MB/s) | 2255 | 265.2 -88% | 1561 -31% | 1002 -56% | 1510 -33% |
| Read 4k (MB/s) | 47.25 | 42.59 -10% | 54 14% | 39.91 -16% | 51.6 9% |
| Write 4k (MB/s) | 110.7 | 140.6 27% | 166.7 51% | 104.7 -5% | 150.2 36% |
| Read 4k QD32 (MB/s) | 584 | 610 4% | 758 30% | 535 -8% | 576 -1% |
| Write 4k QD32 (MB/s) | 463.3 | 232.8 -50% | 421.8 -9% | 325.4 -30% | 413.7 -11% |

| 3DMark 11 | |
| 1280x720 Performance GPU (ordenar por valor) | |
| Asus G701VO-CS74K | |
| Asus Strix GTX 980 Ti Desktop PC | |
| MSI GT80-2QES32SR311BW | |
| Asus Strix GL502VY-DS71 | |
| Asus Strix GL502VT-DS74 | |
| MSI Prestige PE70 6QE-055XUS | |
| 1280x720 Performance Combined (ordenar por valor) | |
| Asus G701VO-CS74K | |
| Asus Strix GTX 980 Ti Desktop PC | |
| MSI GT80-2QES32SR311BW | |
| Asus Strix GL502VY-DS71 | |
| Asus Strix GL502VT-DS74 | |
| MSI Prestige PE70 6QE-055XUS | |
| 3DMark | |
| 1920x1080 Fire Strike Graphics (ordenar por valor) | |
| Asus G701VO-CS74K | |
| Asus Strix GTX 980 Ti Desktop PC | |
| MSI GT80-2QES32SR311BW | |
| Asus Strix GL502VY-DS71 | |
| Asus Strix GL502VT-DS74 | |
| MSI Prestige PE70 6QE-055XUS | |
| Fire Strike Extreme Graphics (ordenar por valor) | |
| Asus G701VO-CS74K | |
| Asus Strix GTX 980 Ti Desktop PC | |
| Asus Strix GL502VY-DS71 | |
| Asus Strix GL502VT-DS74 | |
| MSI Prestige PE70 6QE-055XUS | |
| 3840x2160 Fire Strike Ultra Graphics (ordenar por valor) | |
| Asus G701VO-CS74K | |
| Asus Strix GTX 980 Ti Desktop PC | |
| Asus Strix GL502VY-DS71 | |
| 3DMark 11 Performance | 14046 puntos | |
| 3DMark Ice Storm Standard Score | 120819 puntos | |
| 3DMark Cloud Gate Standard Score | 24329 puntos | |
| 3DMark Fire Strike Score | 10869 puntos | |
| 3DMark Fire Strike Extreme Score | 5753 puntos | |
ayuda | ||
| BioShock Infinite - 1920x1080 Ultra Preset, DX11 (DDOF) | |
| Asus Strix GTX 980 Ti Desktop PC | |
| MSI GT80 Titan SLI | |
| Asus G701VO-CS74K | |
| Asus Strix GL502VY-DS71 | |
| Asus Strix GL502VT-DS74 | |
| MSI Prestige PE70 6QE-055XUS | |
| Sleeping Dogs - 1920x1080 Extreme Preset AA:Extreme | |
| MSI GT80 Titan SLI | |
| Asus G701VO-CS74K | |
| Asus Strix GL502VY-DS71 | |
| Asus Strix GL502VT-DS74 | |
| MSI Prestige PE70 6QE-055XUS | |
| Metro: Last Light - 1920x1080 Very High (DX11) AF:16x | |
| Asus Strix GTX 980 Ti Desktop PC | |
| Asus G701VO-CS74K | |
| MSI GT80 Titan SLI | |
| Asus Strix GL502VT-DS74 | |
| MSI Prestige PE70 6QE-055XUS | |
| Thief - 1920x1080 Very High Preset AA:FXAA & High SS AF:8x | |
| MSI GT80 Titan SLI | |
| Asus G701VO-CS74K | |
| Asus Strix GL502VY-DS71 | |
| Asus Strix GL502VT-DS74 | |
| MSI Prestige PE70 6QE-055XUS | |
| Batman: Arkham Knight - 1920x1080 High / On AA:SM AF:16x | |
| Asus G701VO-CS74K | |
| MSI GT80 Titan SLI | |
| Asus Strix GL502VT-DS74 | |
| Fallout 4 - 1920x1080 Ultra Preset AA:T AF:16x | |
| Asus Strix GTX 980 Ti Desktop PC | |
| Asus G701VO-CS74K | |
| Asus Strix GL502VY-DS71 | |
| Asus Strix GL502VT-DS74 | |
| MSI Prestige PE70 6QE-055XUS | |
| Rise of the Tomb Raider - 1920x1080 Very High Preset AA:FX AF:16x | |
| Asus Strix GTX 980 Ti Desktop PC | |
| Asus G701VO-CS74K | |
| Asus Strix GL502VY-DS71 | |
| Asus Strix GL502VT-DS74 | |
| MSI Prestige PE70 6QE-055XUS | |
| Doom - 1920x1080 Ultra Preset AA:SM | |
| Asus Strix GTX 980 Ti Desktop PC | |
| Asus G701VO-CS74K | |
| Asus Strix GL502VY-DS71 | |
| Overwatch - 1920x1080 Epic (Render Scale 100 %) AA:SM AF:16x | |
| Asus Strix GTX 980 Ti Desktop PC | |
| Asus G701VO-CS74K | |
| Asus Strix GL502VY-DS71 | |
| bajo | medio | alto | ultra | |
|---|---|---|---|---|
| Sleeping Dogs (2012) | 75.2 | |||
| BioShock Infinite (2013) | 106.2 | |||
| Metro: Last Light (2013) | 88.3 | |||
| Thief (2014) | 67.9 | |||
| Batman: Arkham Knight (2015) | 63 | |||
| Metal Gear Solid V (2015) | 60 | |||
| Fallout 4 (2015) | 79.3 | |||
| Rise of the Tomb Raider (2016) | 60.4 | |||
| Doom (2016) | 84.3 | |||
| Overwatch (2016) | 118.2 |
Ruido
| Ocioso |
| 29.1 / 31.9 / 31.9 dB(A) |
| Carga |
| 46 / 47.5 dB(A) |
 | ||
30 dB silencioso 40 dB(A) audible 50 dB(A) ruidosamente alto |
||
min: | ||
| Asus G701VO-CS74K GeForce GTX 980 (Laptop), 6820HK, 2x Samsung SM951 MZVPV512HDGL (RAID 0) | Alienware 17 R3 (A17-9935) GeForce GTX 980M, 6700HQ, Samsung PM951 NVMe 512 GB | Asus GX700 GeForce GTX 980 (Laptop), 6820HK, 2x Samsung SM951 MZVPV512HDGL (RAID 0) | Asus G752VY-GC110T GeForce GTX 980M, 6700HQ, Plextor PX-G256M6e | MSI GT72S 6QF GeForce GTX 980 (Laptop), 6820HK, 2x Micron M600 MTFDDAV128MBF NVMe (RAID 0) | |
|---|---|---|---|---|---|
| Noise | -0% | -11% | 3% | -6% | |
| apagado / medio ambiente * (dB) | 29.1 | 30 -3% | |||
| Idle Minimum * (dB) | 29.1 | 31 -7% | 33 -13% | 31.2 -7% | 33.1 -14% |
| Idle Average * (dB) | 31.9 | 32 -0% | 35 -10% | 31.9 -0% | 33.3 -4% |
| Idle Maximum * (dB) | 31.9 | 33 -3% | 42 -32% | 32.8 -3% | 37 -16% |
| Load Average * (dB) | 46 | 38 17% | 46 -0% | 38.2 17% | 39 15% |
| Load Maximum * (dB) | 47.5 | 50 -5% | 48 -1% | 44 7% | 52.2 -10% |
* ... más pequeño es mejor
(-) La temperatura máxima en la parte superior es de 55 °C / 131 F, frente a la media de 40.4 °C / 105 F, que oscila entre 21.2 y 68.8 °C para la clase Gaming.
(-) El fondo se calienta hasta un máximo de 49.8 °C / 122 F, frente a la media de 43.2 °C / 110 F
(+) En reposo, la temperatura media de la parte superior es de 25.8 °C / 78# F, frente a la media del dispositivo de 33.9 °C / 93 F.
(+) El reposamanos y el panel táctil están a una temperatura inferior a la de la piel, con un máximo de 26.8 °C / 80.2 F y, por tanto, son fríos al tacto.
(±) La temperatura media de la zona del reposamanos de dispositivos similares fue de 28.8 °C / 83.8 F (+2 °C / 3.6 F).
| Off / Standby | |
| Ocioso | |
| Carga |
|
Clave:
min: | |
| Asus G701VO-CS74K 6820HK, GeForce GTX 980 (Laptop), 2x Samsung SM951 MZVPV512HDGL (RAID 0), IPS, 1920x1080, 17.3" | Alienware 17 R3 (A17-9935) 6700HQ, GeForce GTX 980M, Samsung PM951 NVMe 512 GB, IPS, 1920x1080, 17.3" | Asus GX700 6820HK, GeForce GTX 980 (Laptop), 2x Samsung SM951 MZVPV512HDGL (RAID 0), IPS, 1920x1080, 17.3" | Asus G752VL-T7023T 6700HQ, GeForce GTX 965M, Samsung SSD 950 Pro 512GB m.2 NVMe, IPS, 1920x1080, 17.3" | MSI GT72S 6QE-071PL 6820HK, GeForce GTX 980M, 2x Toshiba HG6 THNSNJ128G8NU (RAID 0), IPS, 1920x1080, 17.3" | |
|---|---|---|---|---|---|
| Power Consumption | 31% | -42% | 26% | 0% | |
| Idle Minimum * (Watt) | 28.2 | 12 57% | 40 -42% | 14.5 49% | 14.5 49% |
| Idle Average * (Watt) | 32 | 18 44% | 45 -41% | 22.3 30% | 28.3 12% |
| Idle Maximum * (Watt) | 32.6 | 26 20% | 51 -56% | 29.4 10% | 44 -35% |
| Load Average * (Watt) | 162.2 | 95 41% | 149 8% | 110.5 32% | 165.5 -2% |
| Load Maximum * (Watt) | 173.5 | 188 -8% | 313 -80% | 160.8 7% | 214.8 -24% |
* ... más pequeño es mejor
| Asus G701VO-CS74K 6820HK, GeForce GTX 980 (Laptop), 93 Wh | Alienware 17 R3 (A17-9935) 6700HQ, GeForce GTX 980M, 92 Wh | Eurocom Sky DLX7 6700K, GeForce GTX 980 (Laptop), 82 Wh | Asus G752VY-RH71 6700HQ, GeForce GTX 980M, 67 Wh | MSI GT72S 6QF 6820HK, GeForce GTX 980 (Laptop), 83 Wh | |
|---|---|---|---|---|---|
| Duración de Batería | 118% | -25% | 28% | 36% | |
| Reader / Idle (h) | 4 | 12.6 215% | 2.6 -35% | 6.1 53% | 6.5 63% |
| WiFi v1.3 (h) | 3.4 | 7.4 118% | 2.3 -32% | 4 18% | 4.9 44% |
| Load (h) | 1.5 | 1.8 20% | 1.4 -7% | 1.7 13% | 1.5 0% |
Pro
Contra
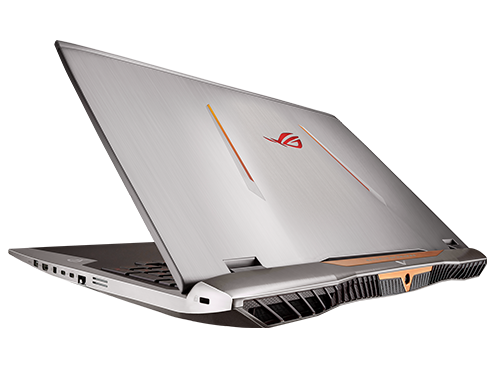

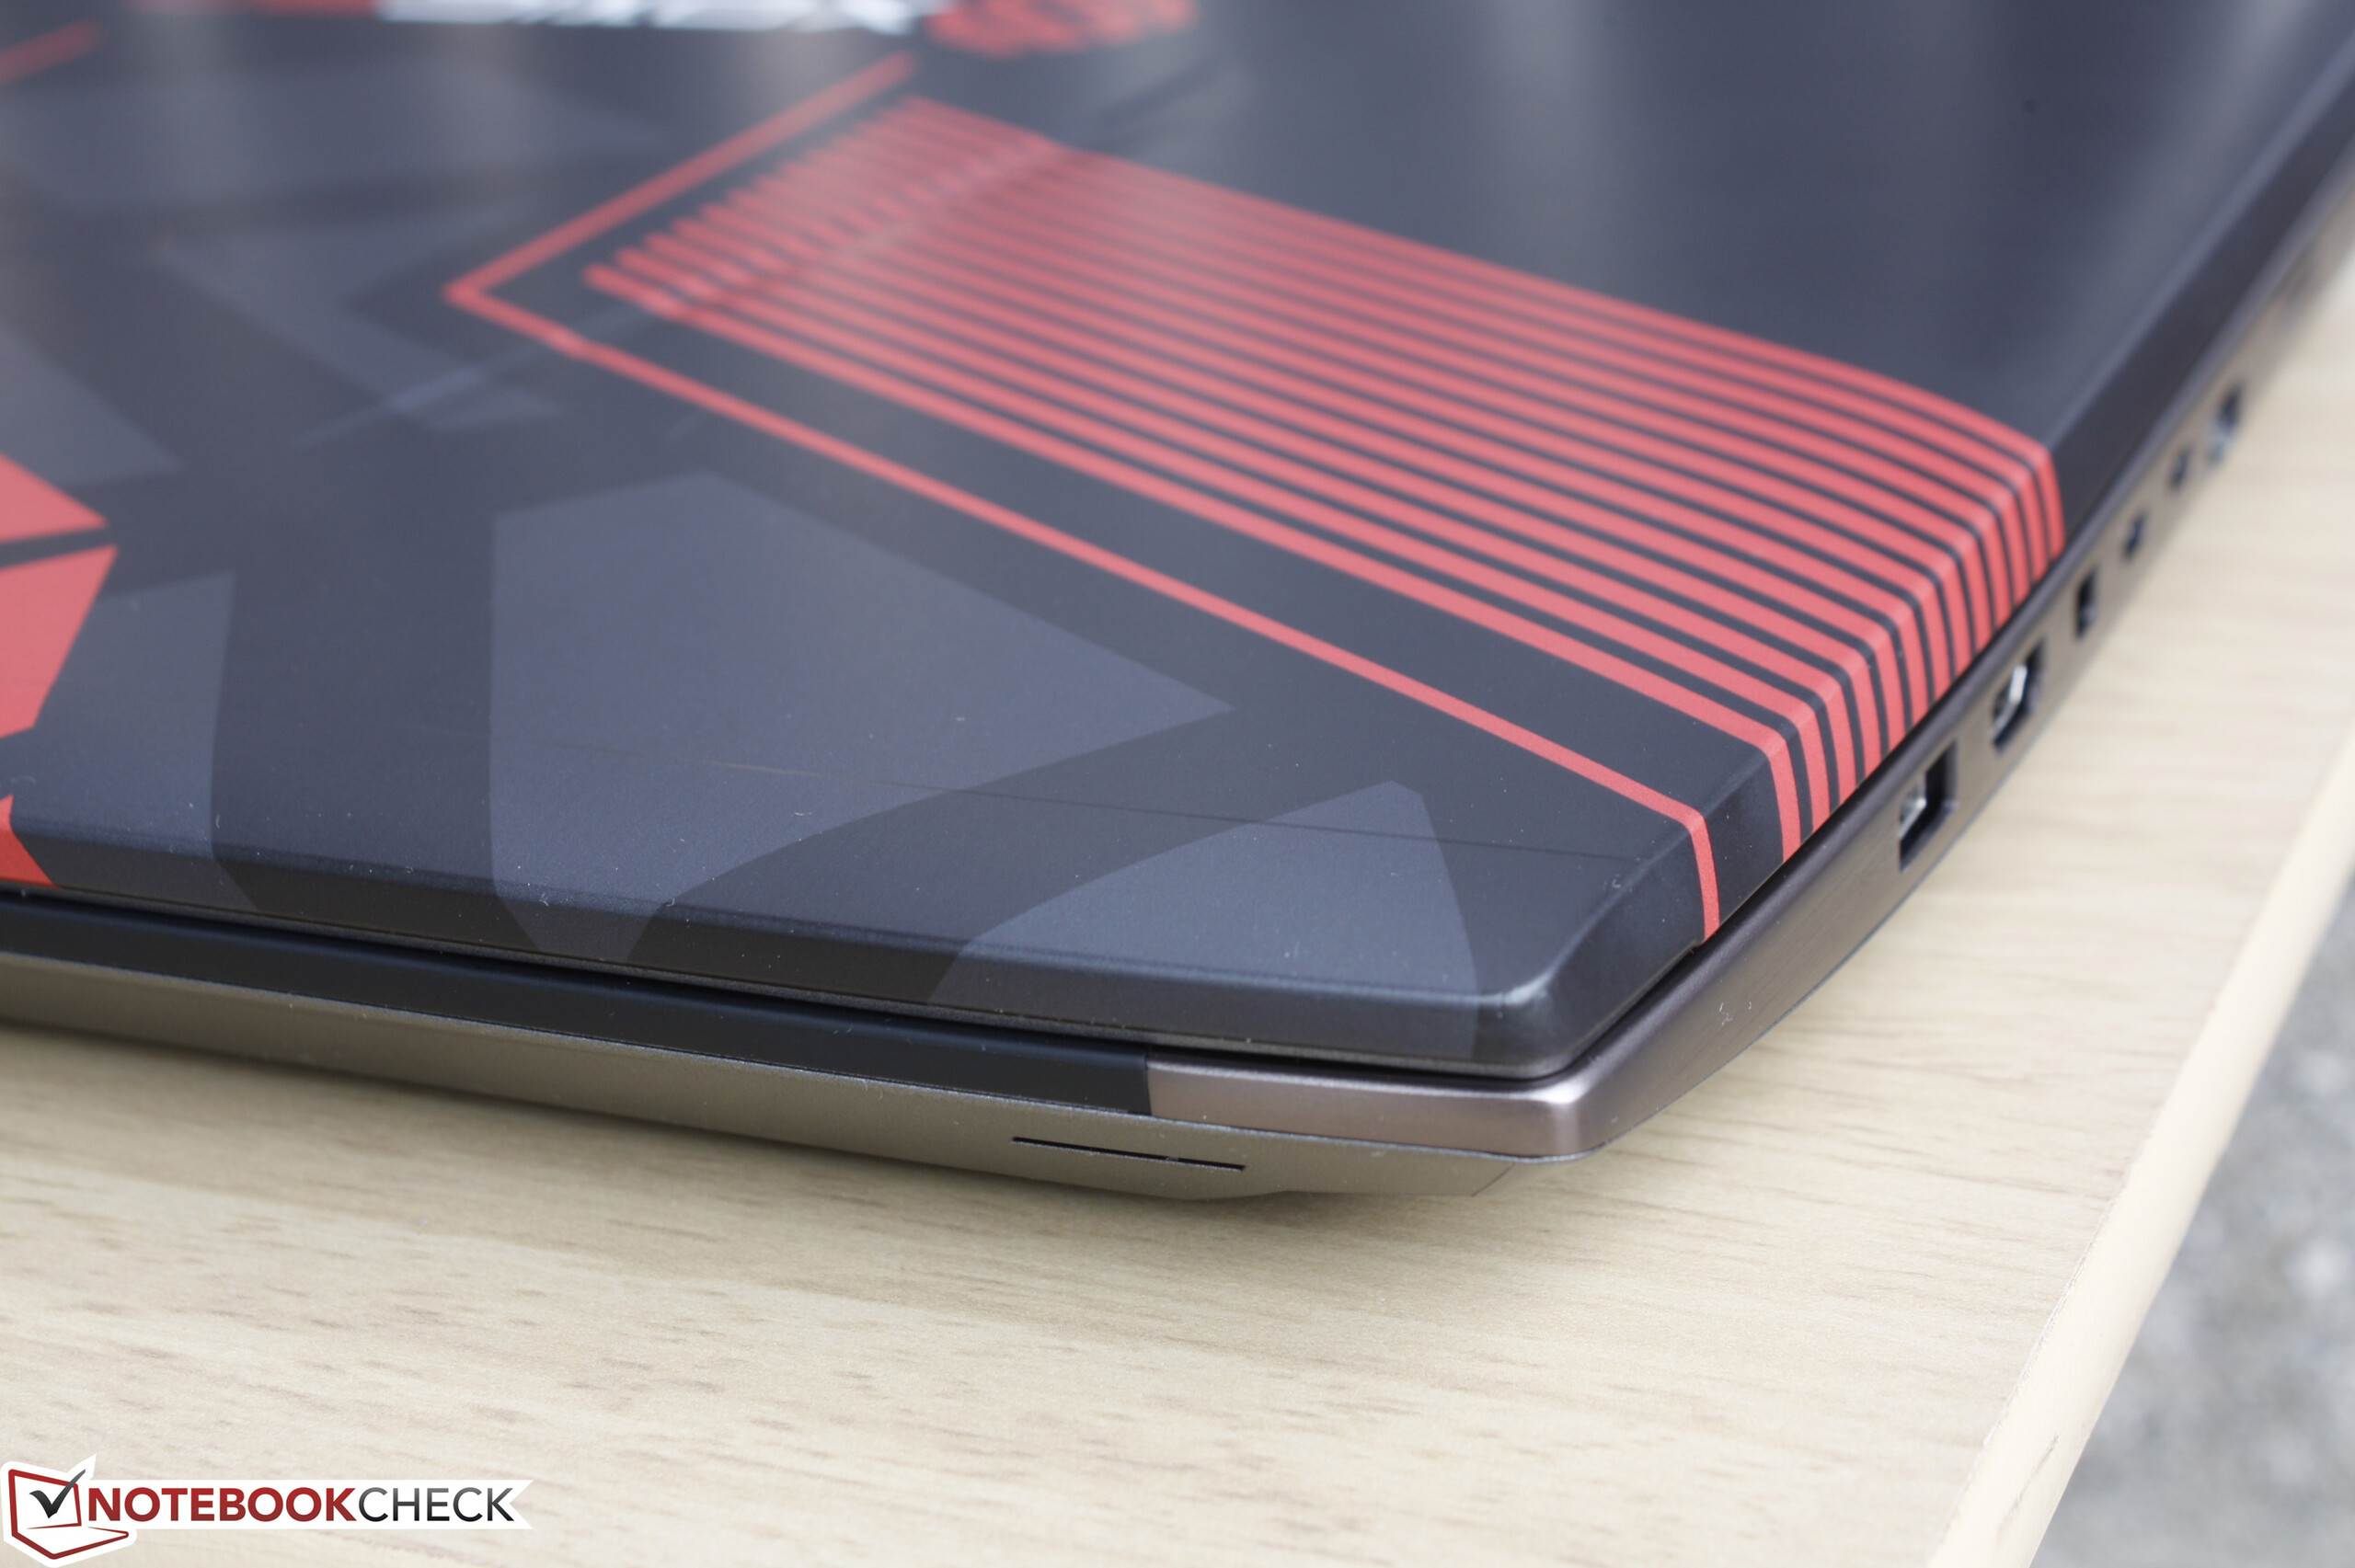
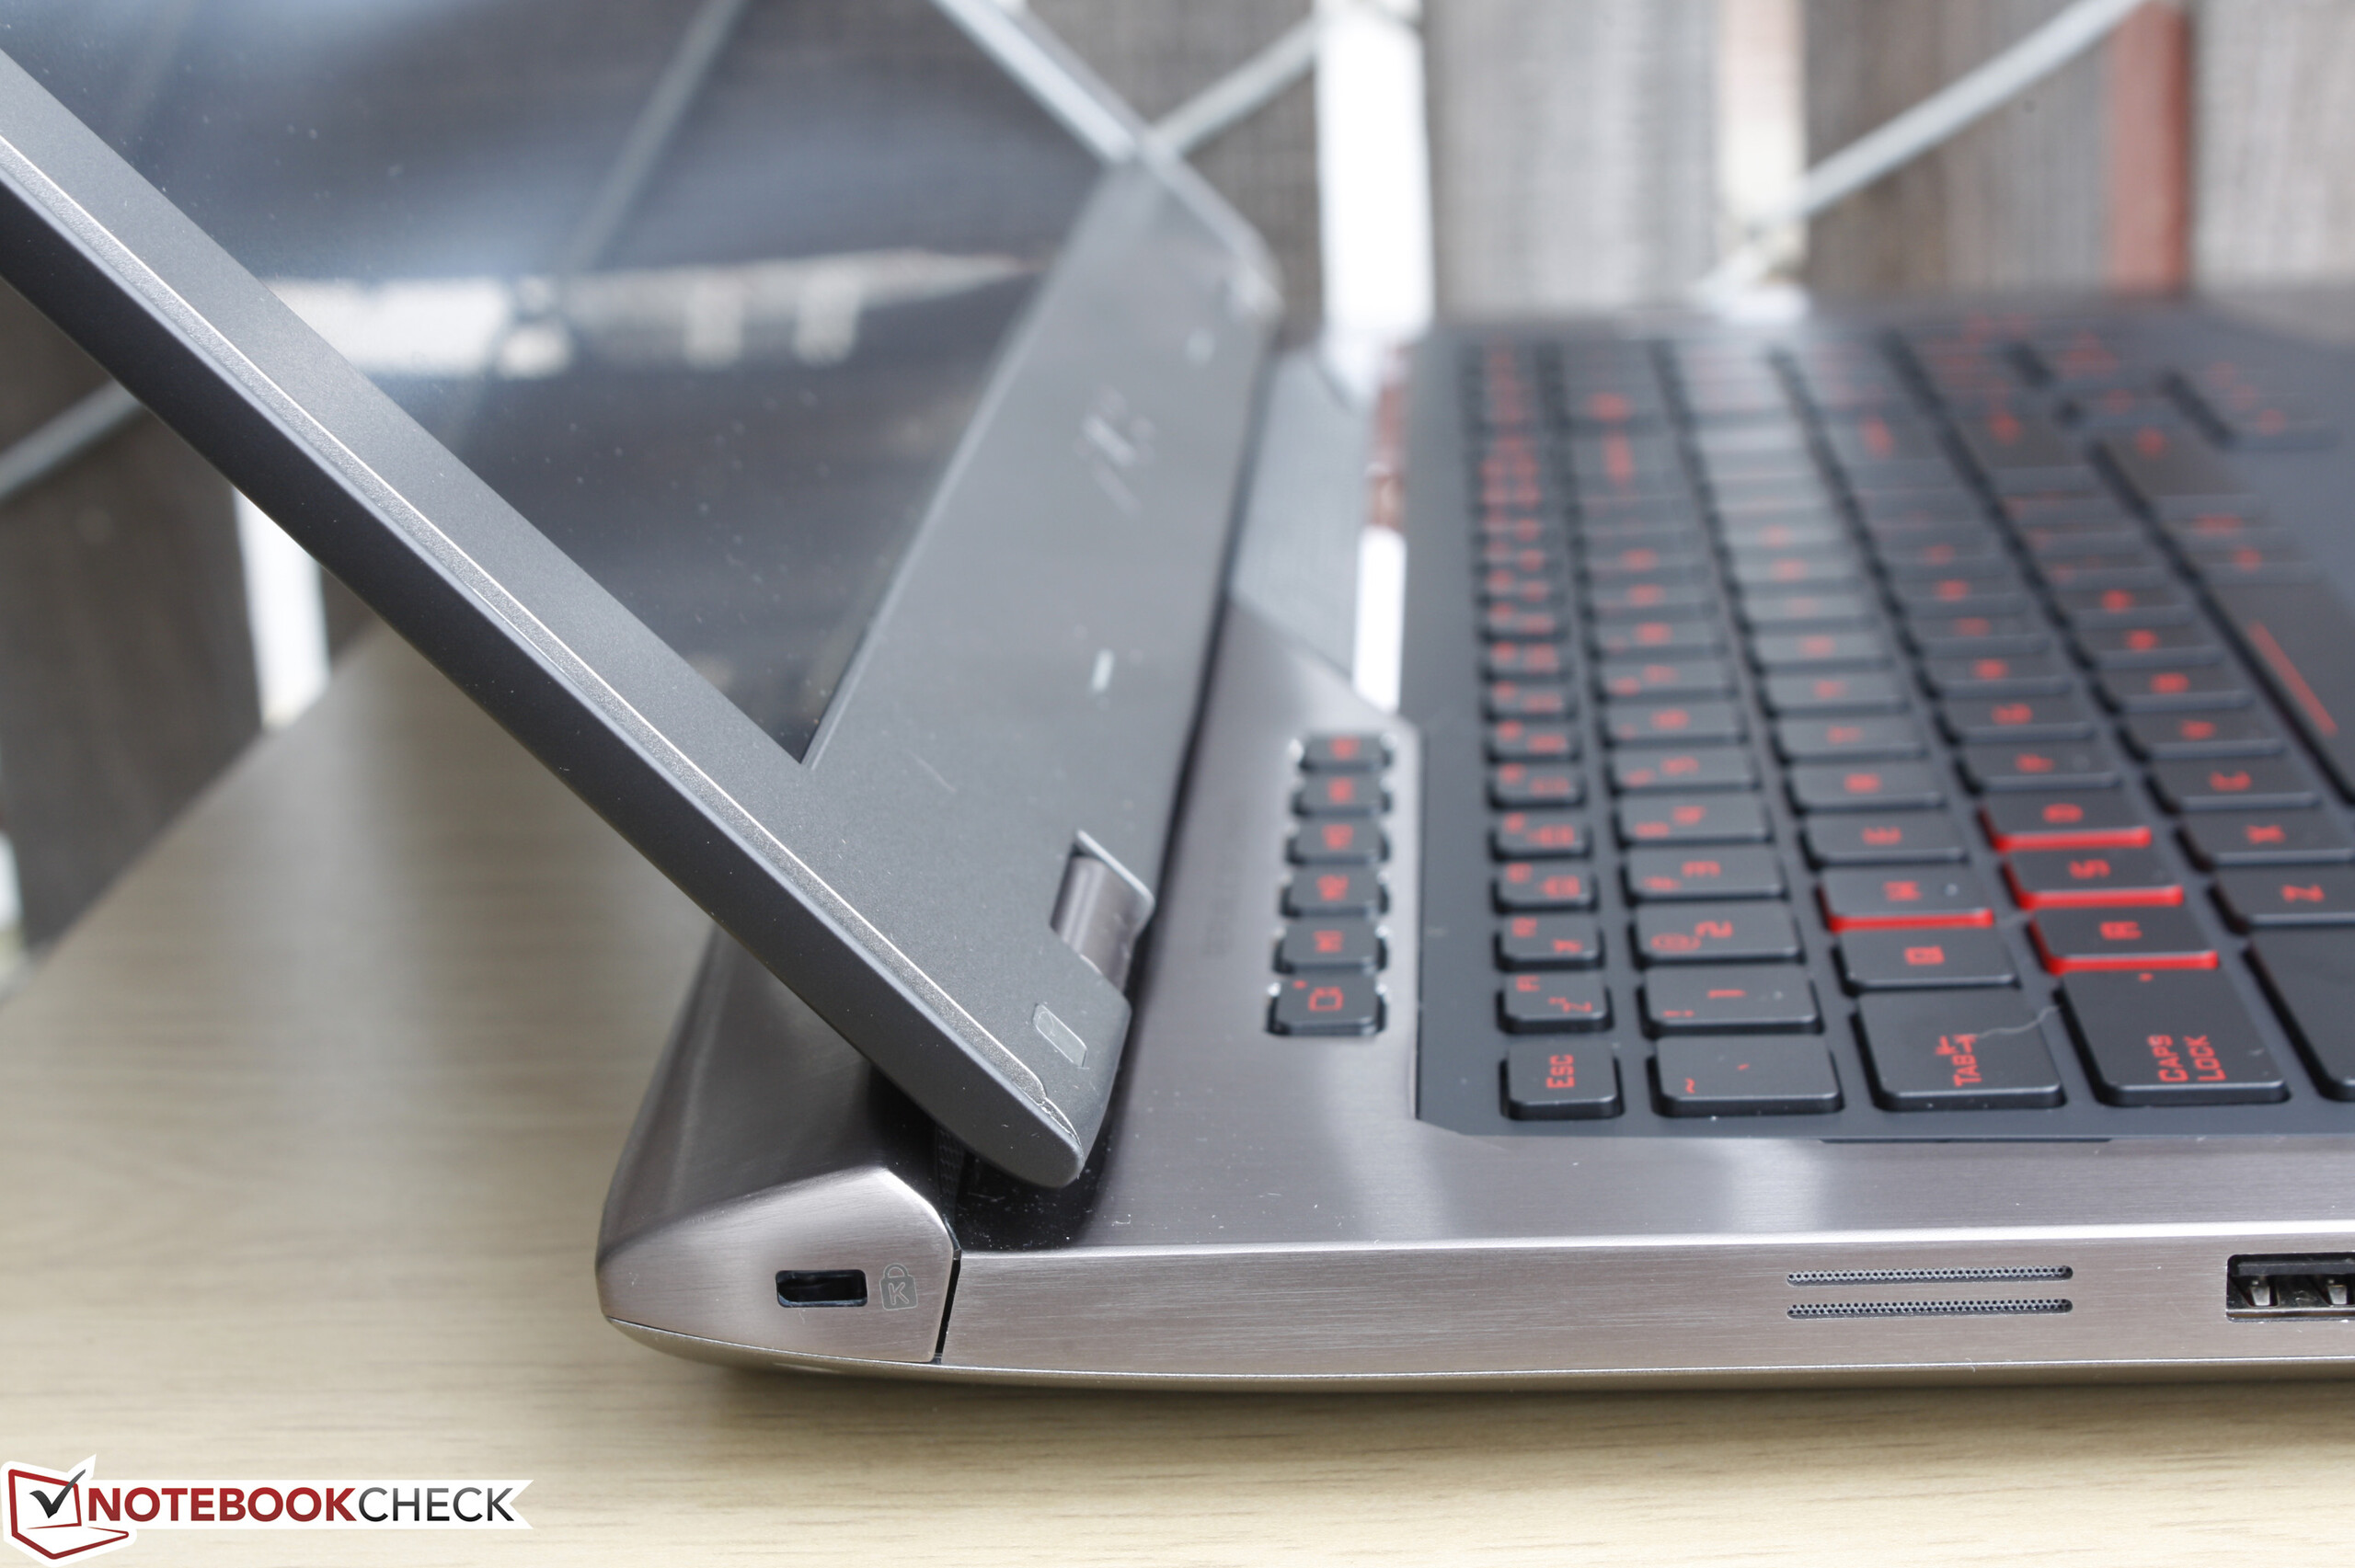
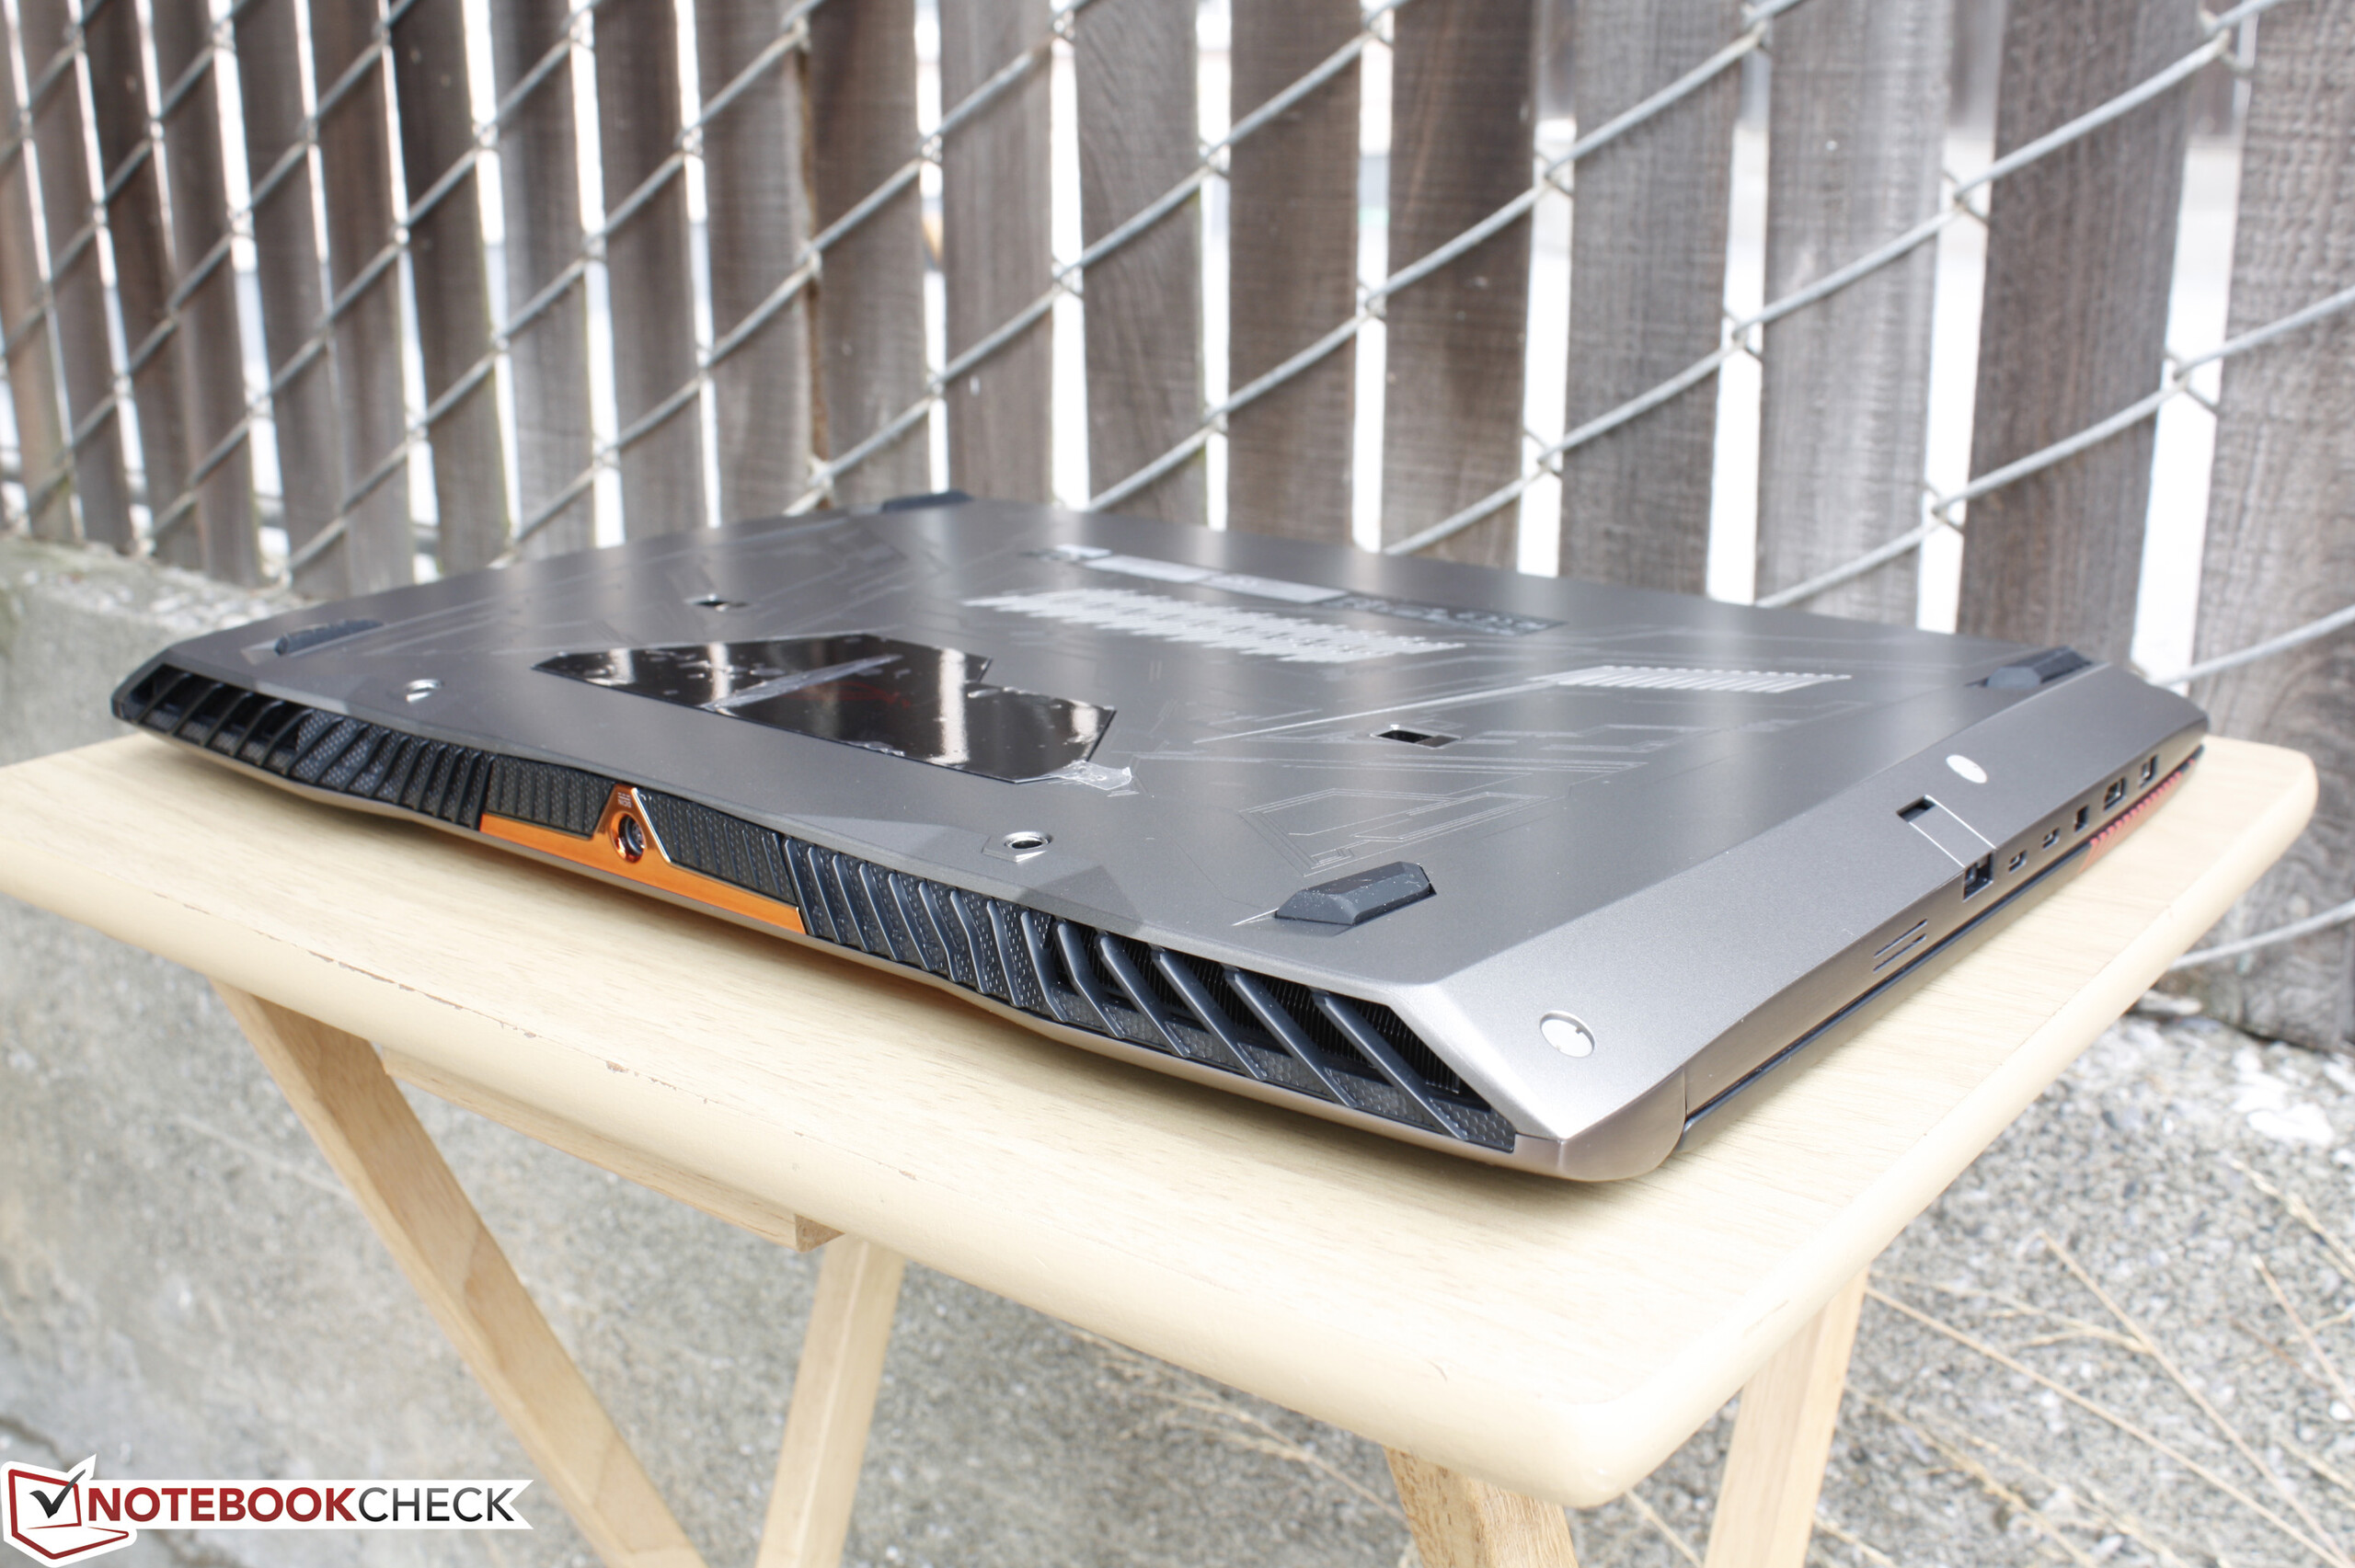
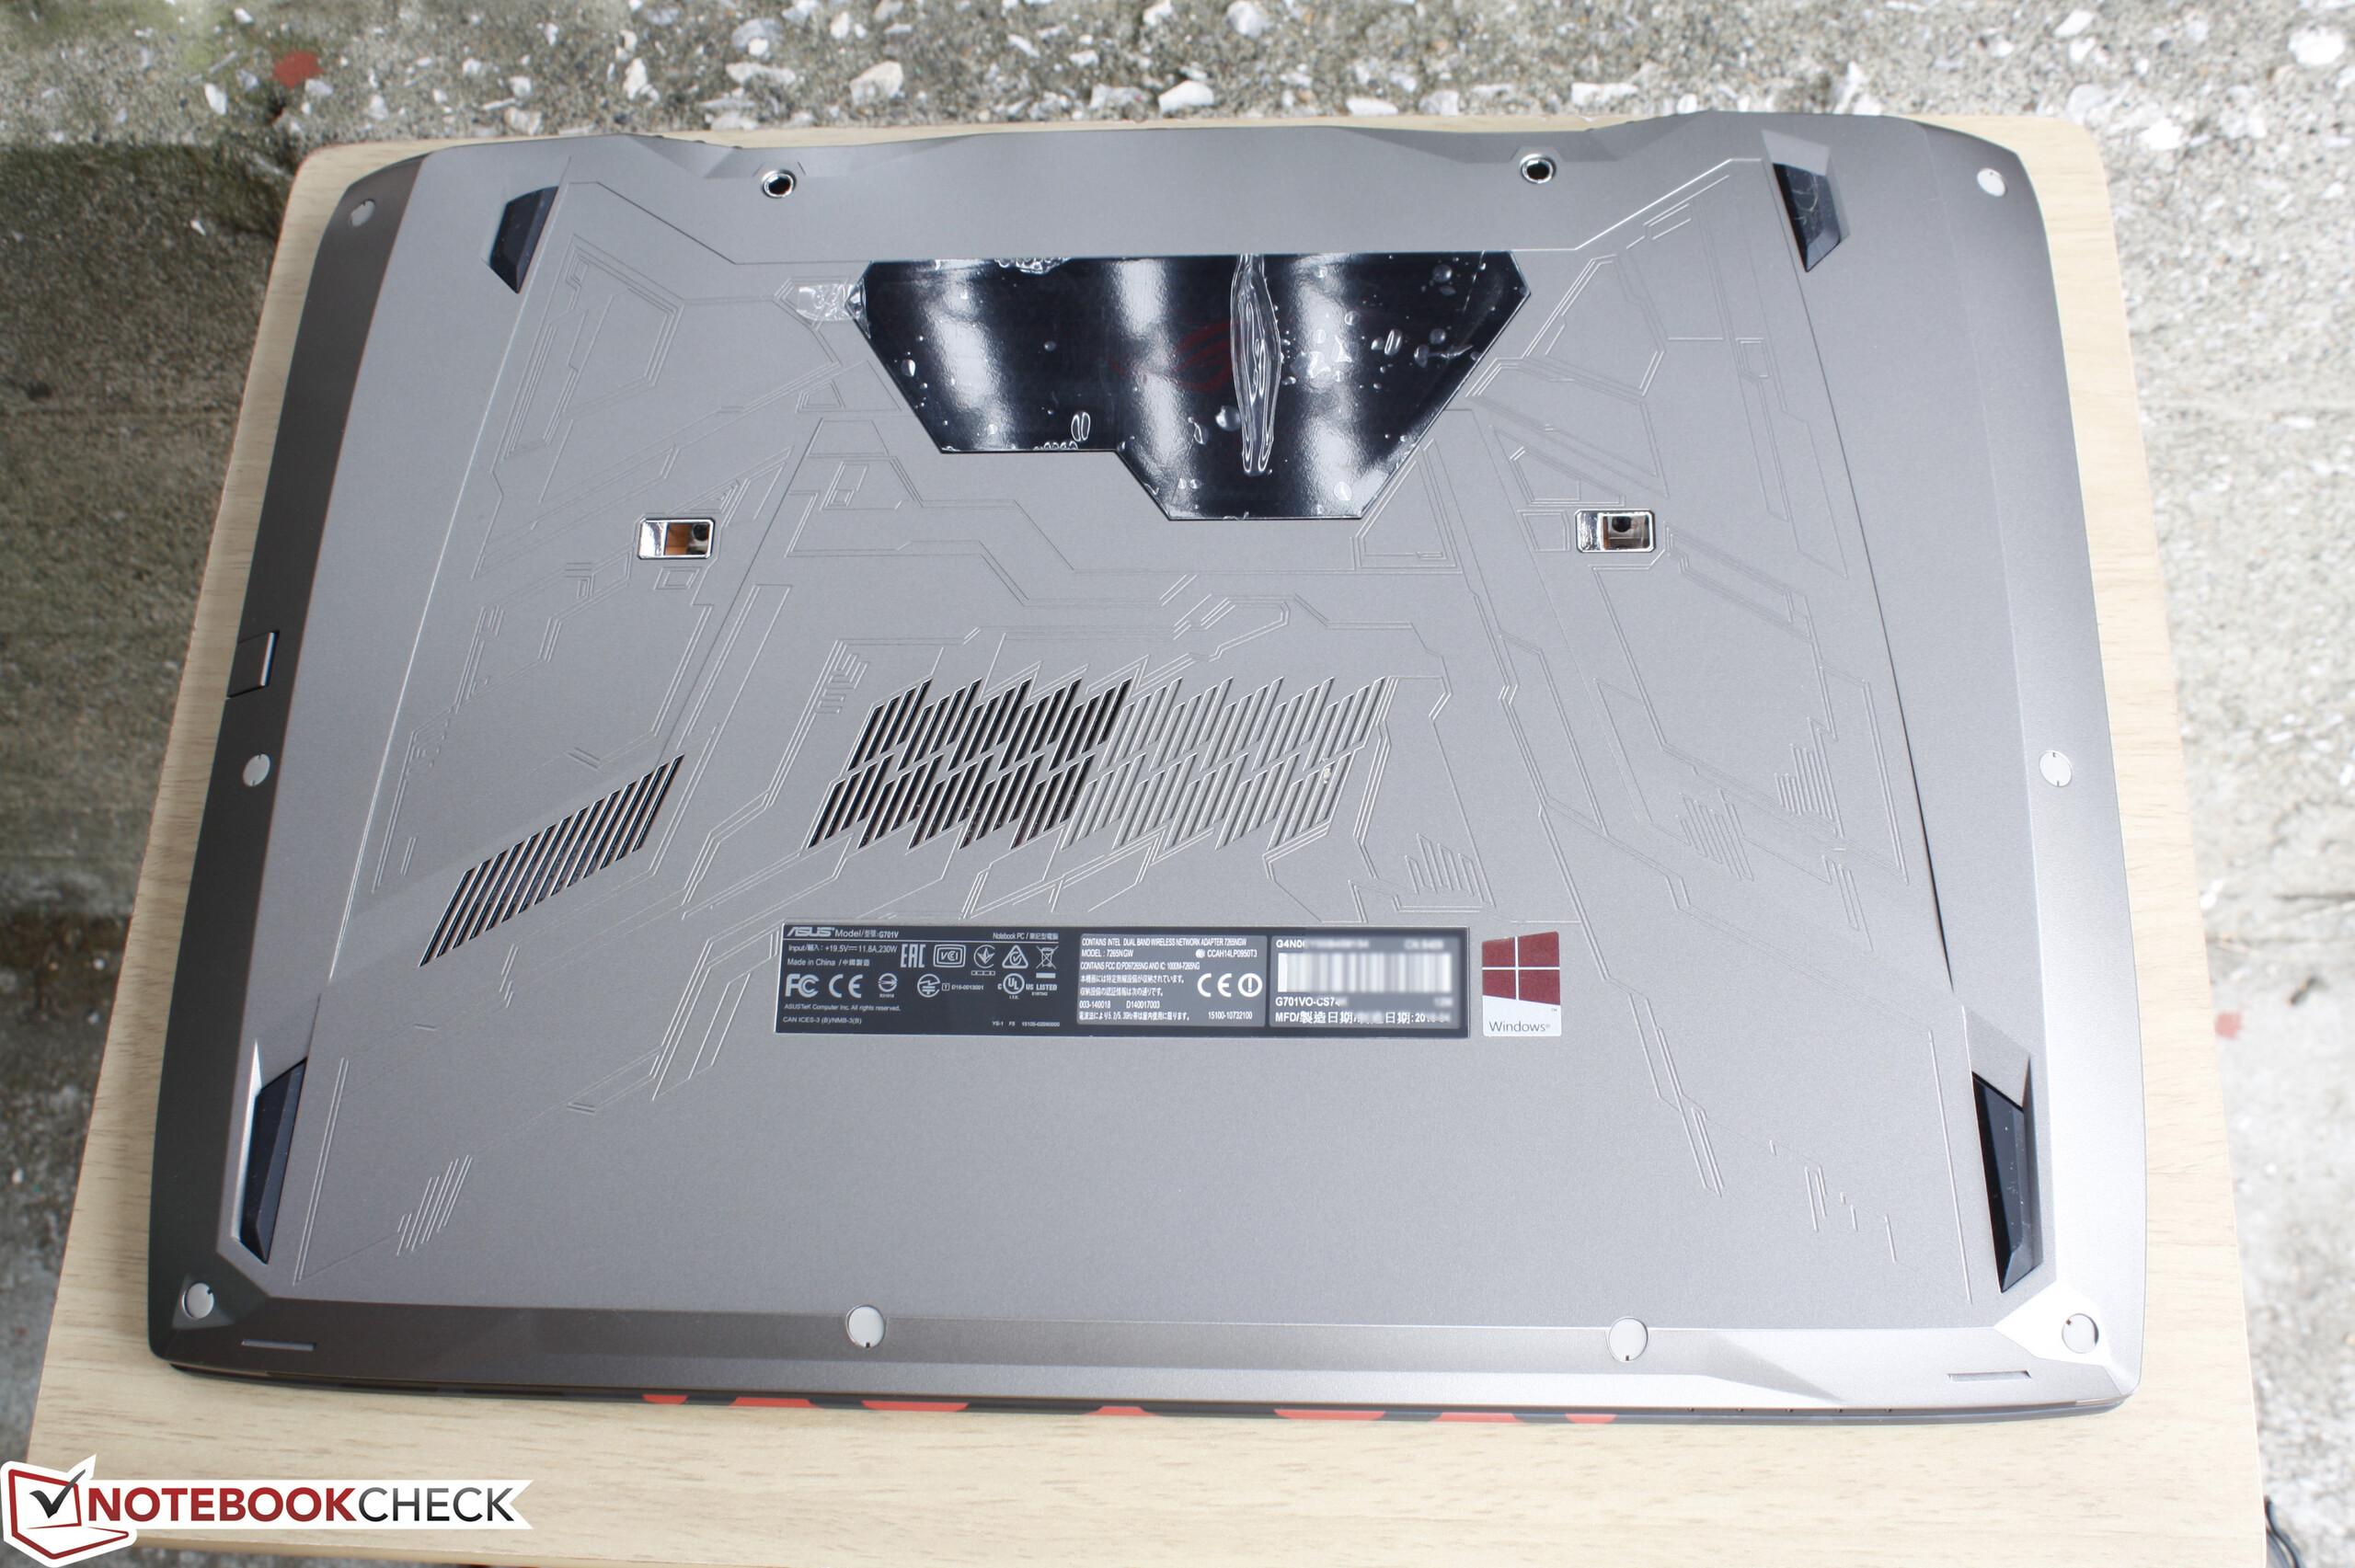
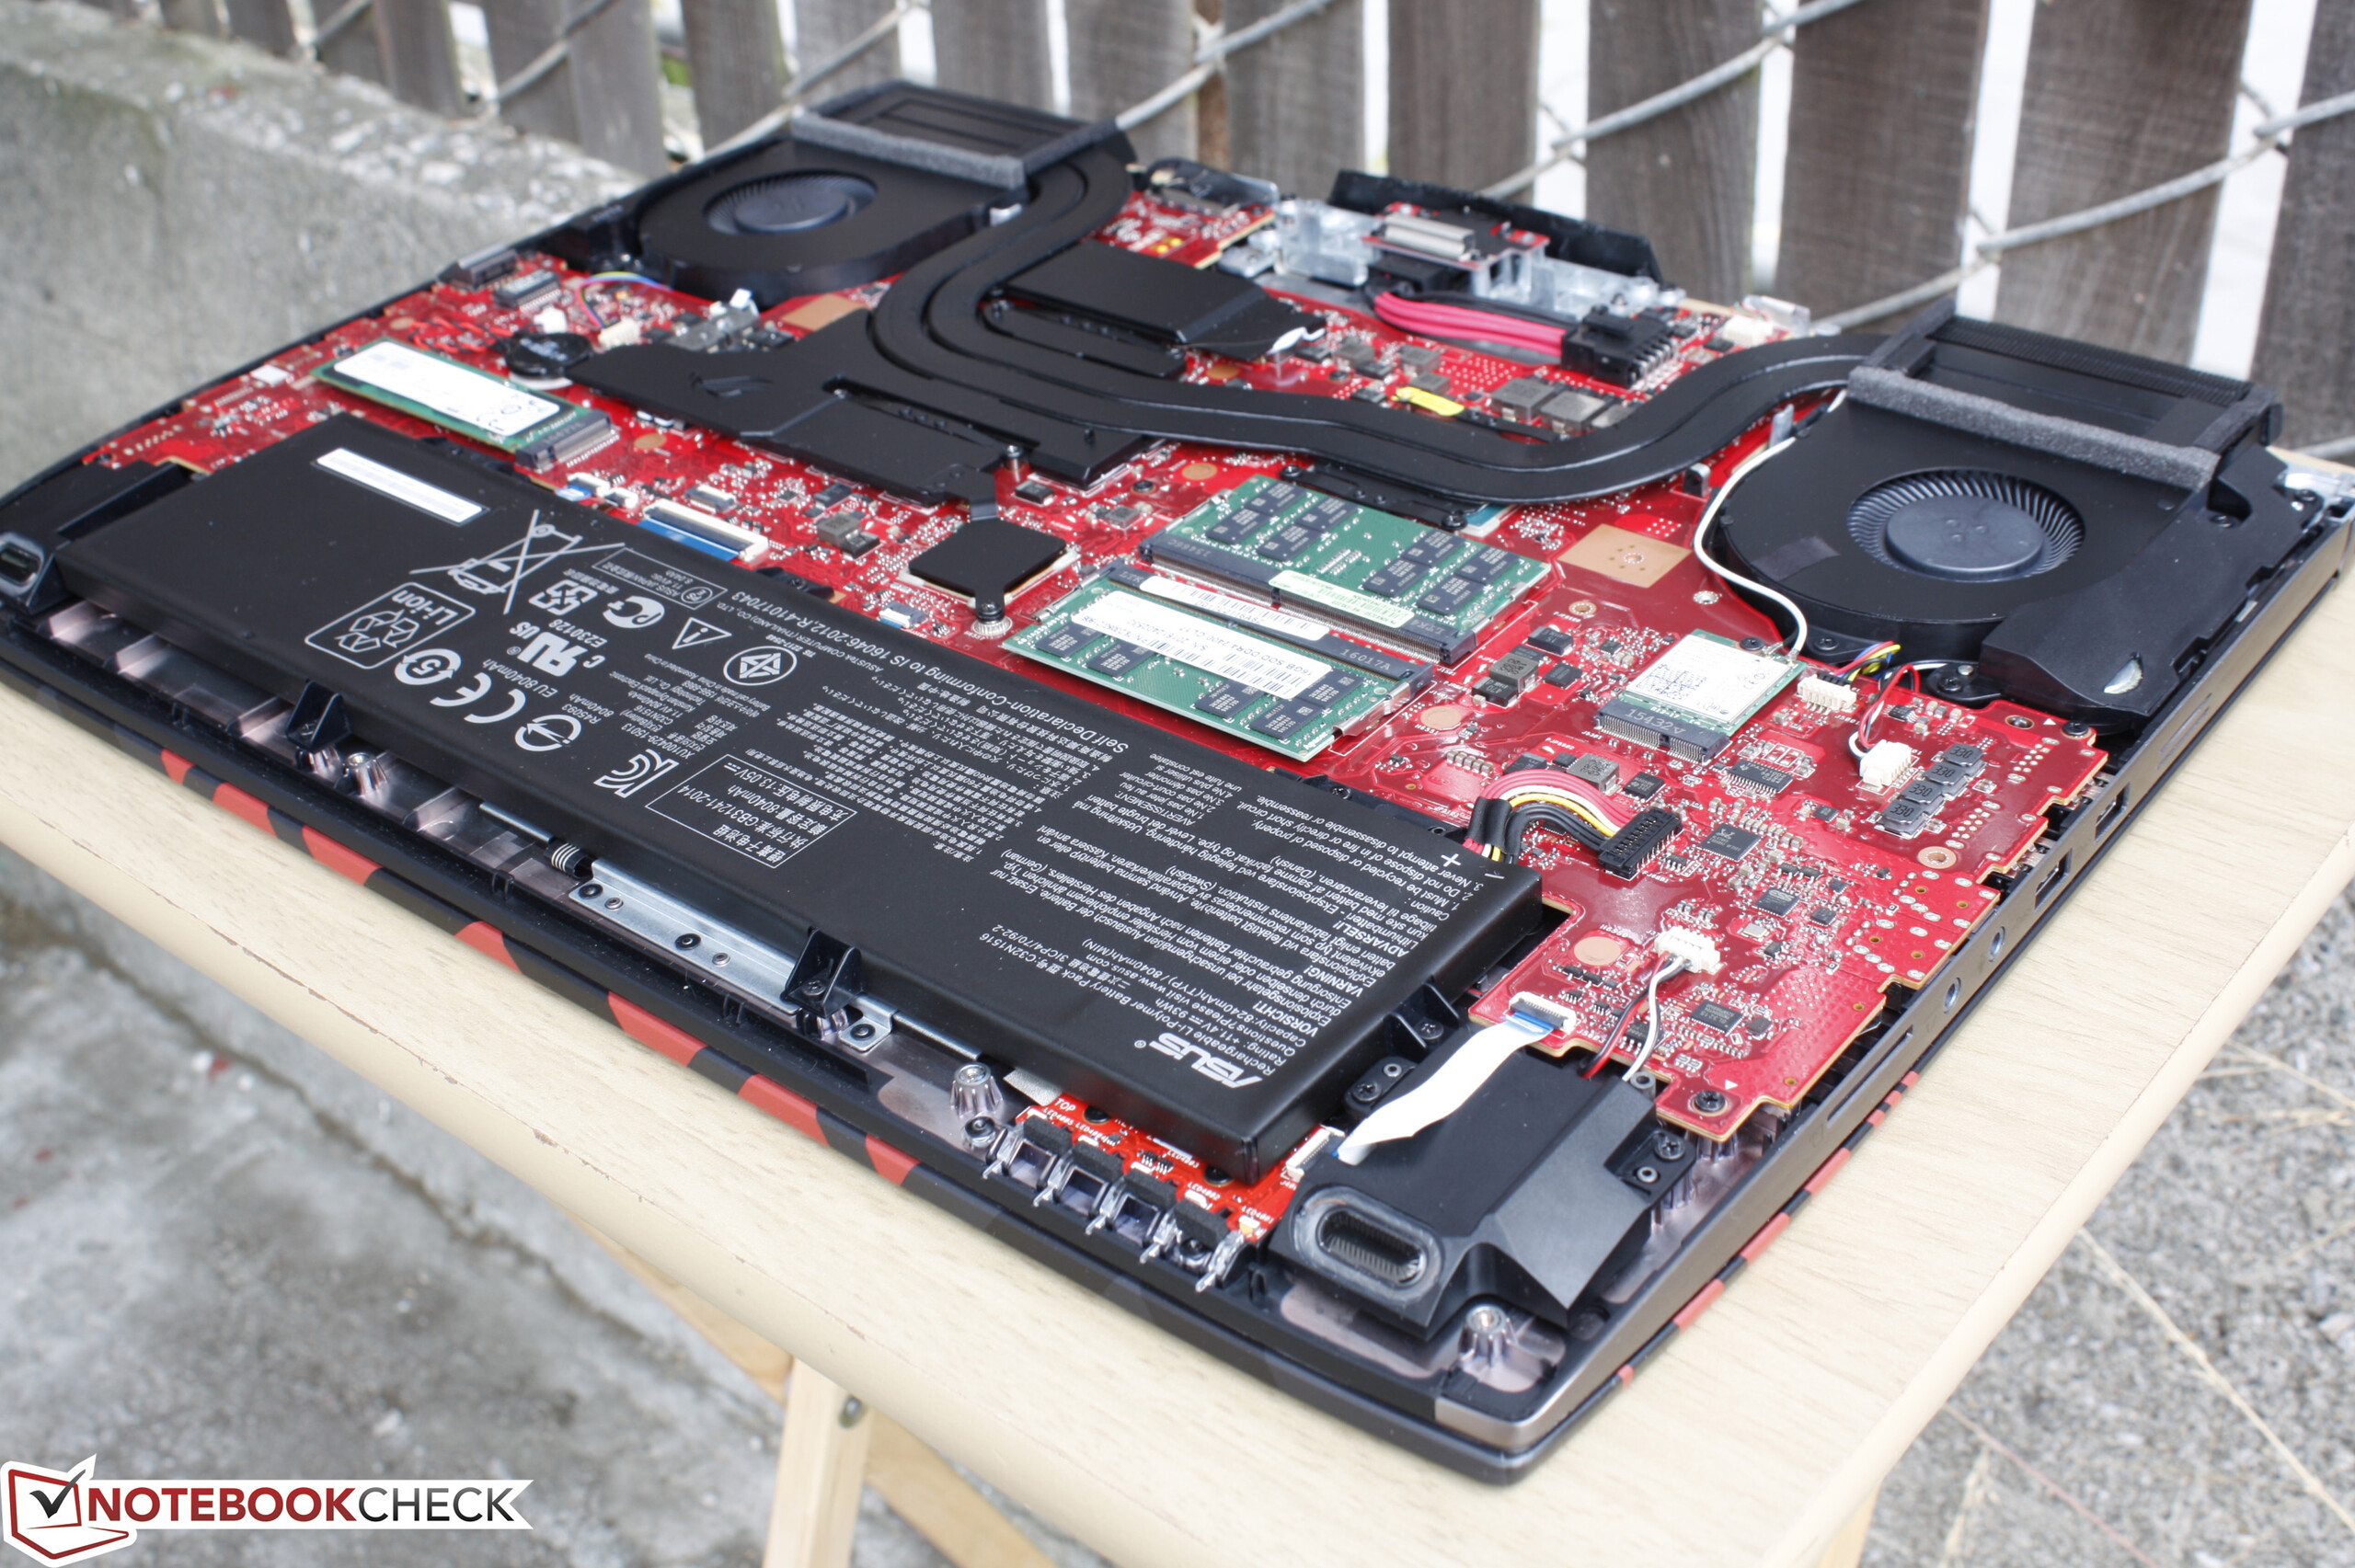
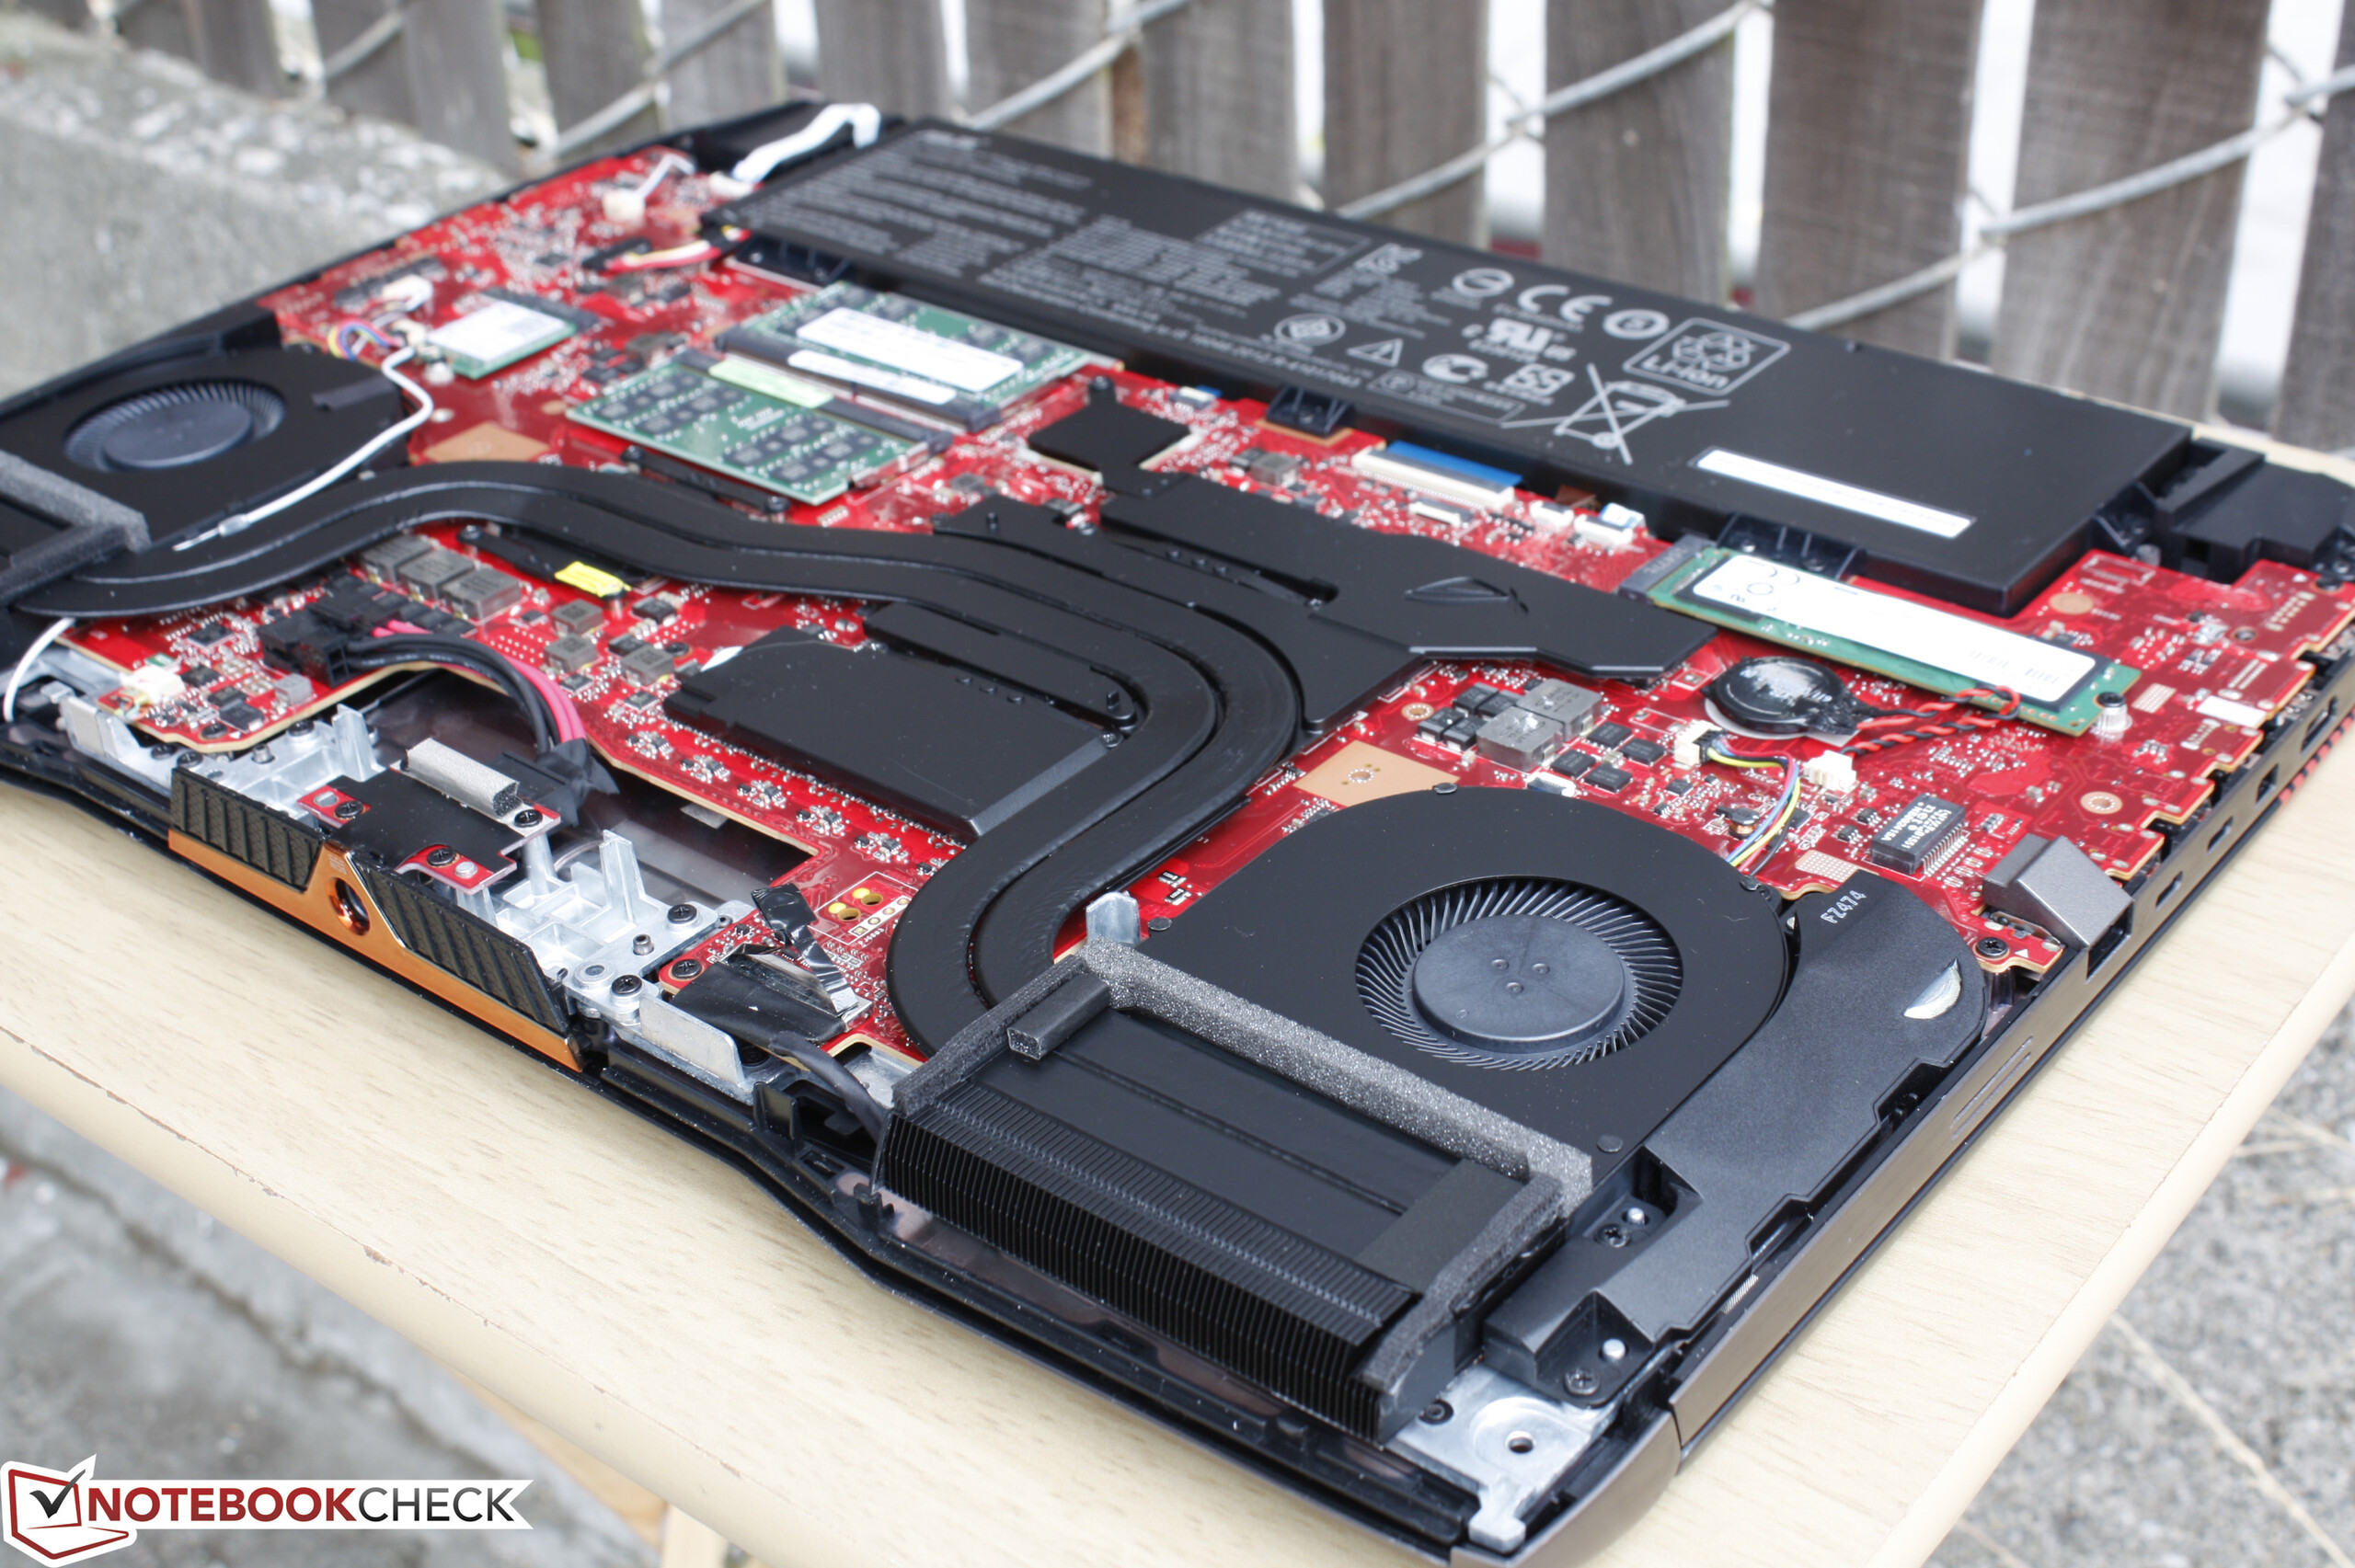
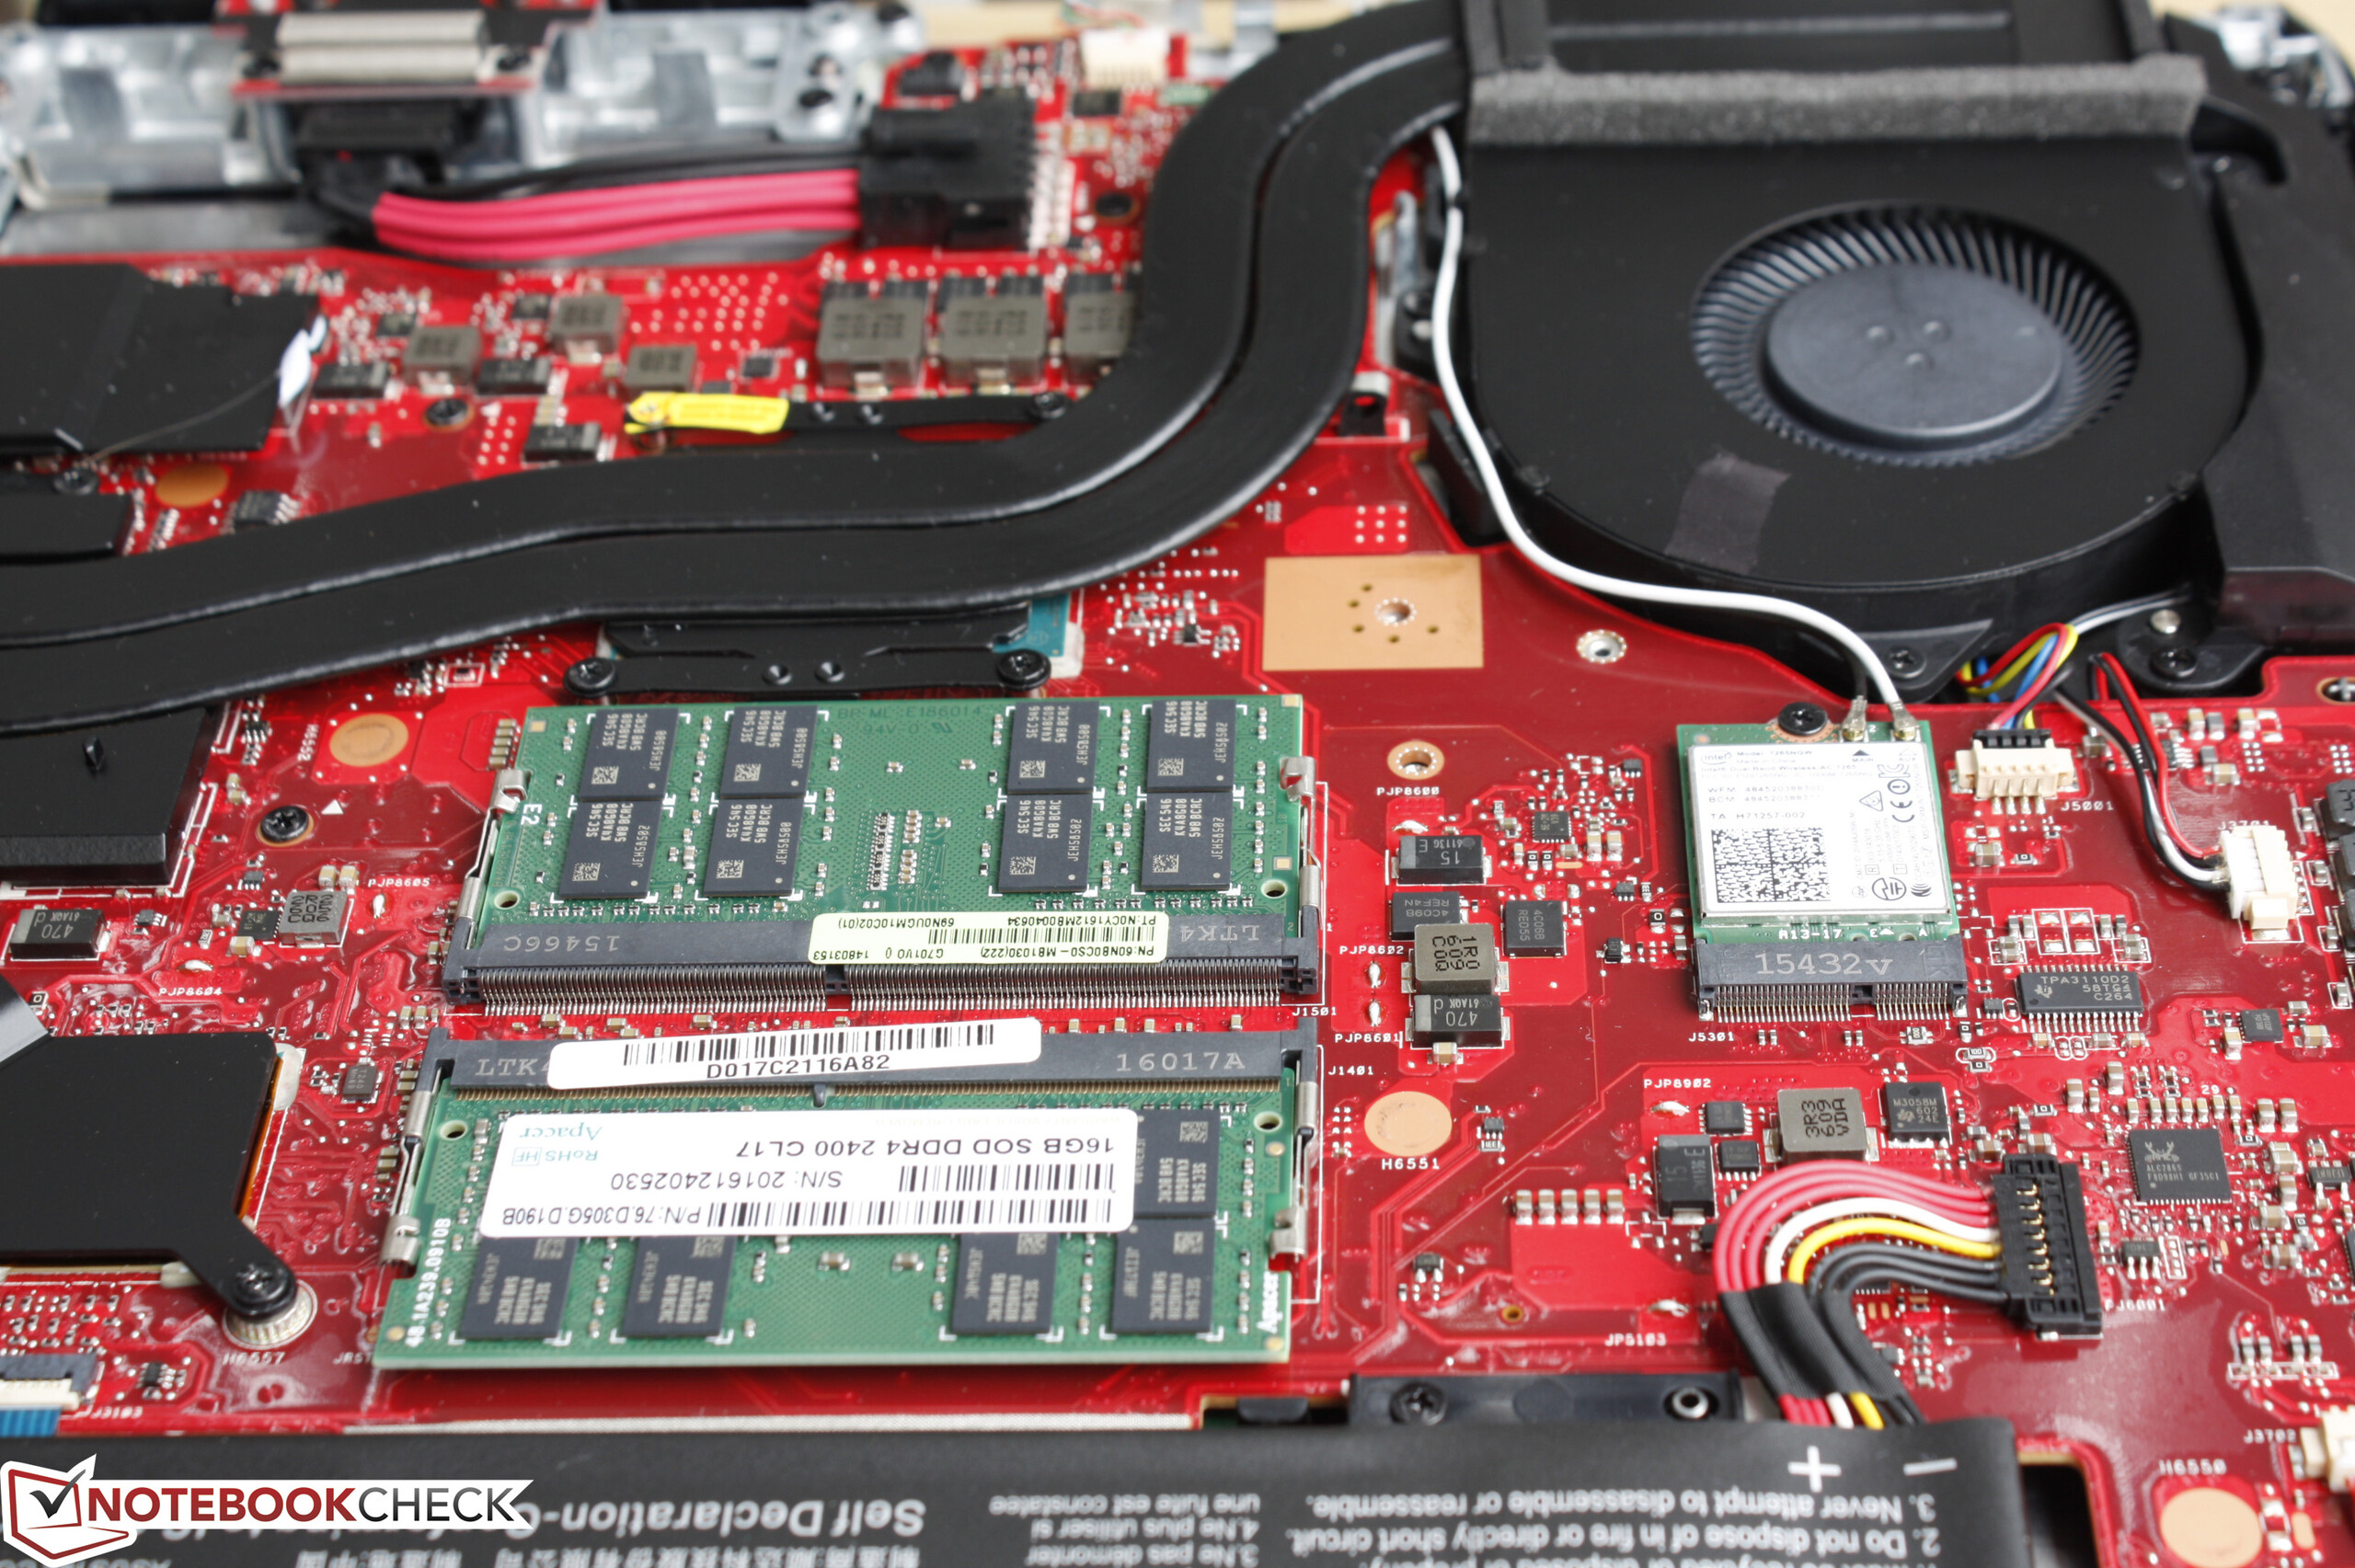
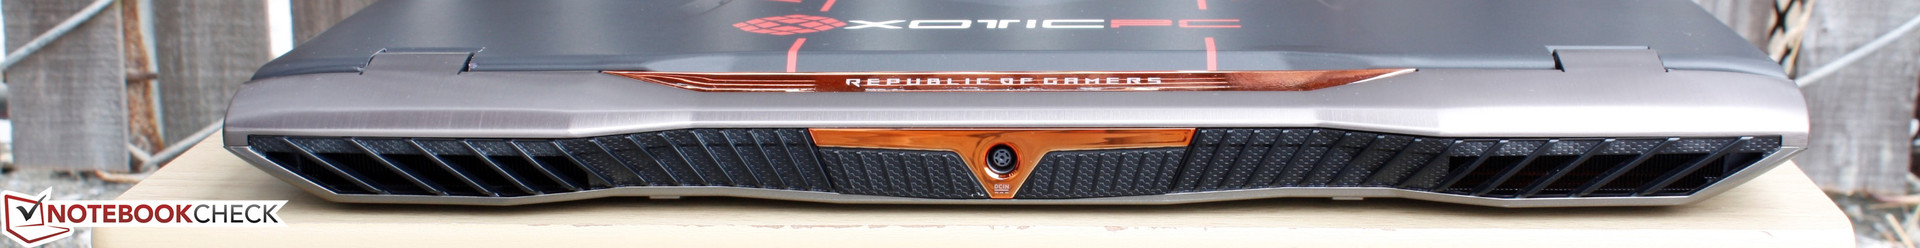
Los fans de ROG que hayan estado esperando un sistema con GTX 980 sin tener que comprar el entusiasta GX700 ahora tienen la opción con el delgado G701. Si bien hay poco que disguste en lo que ofrece G701, es lo que no ofrece lo que hace que los modelos competidores como el MSI GT72S o el equivalente Clevo barebones sean mejor compra. Por ejemplo, las opciones de almacenamiento interno del G701 se limitan a M.2 y su sistema de ventilación más ligero (y ruidoso) implican que su CPU va más caliente que la del GT72S o Eurocom DLX7 bajo estrés de juego. A resultas, su potencial de almacenamiento es inferior, lo que es decepcionante dado que su GPU está soldada para reducir el volumen. El sistema puede ser notablemente más delgado que el GT72S casi 10 mm, pero su mantenibilidad y ampliabilidad también están más limitadas.
No obstante, el G701 sigue siendo uno de los poquísimos portátiles disponibles con la GPU GTX 980 y su hardware va muy bien con las frecuencias bajas de serie. También llega en vísperas de la rumoreada línea Pascal para portátiles, por lo que se espera que caigan los precios en las próximas semanas o meses.
Ésta es una versión acortada del análisis original. Puedes leer el análisis completo en inglés aquí.
Asus G701VO-CS74K
- 07/29/2016 v5.1 (old)
Allen Ngo
Price comparison
