Breve análisis del Convertible Dell Inspiron 15 5568
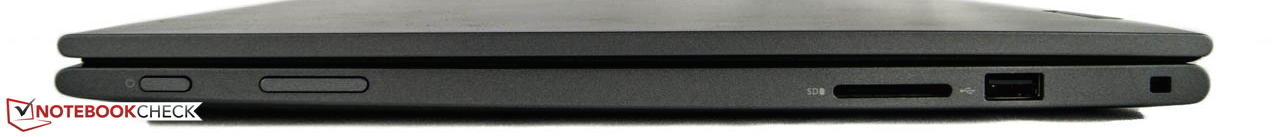


| SD Card Reader | |
| average JPG Copy Test (av. of 3 runs) | |
| Dell XPS 13 2016 9350 (FHD, i7-6560U) | |
| Lenovo Yoga 510-15ISK | |
| HP Envy 15-w103ng x360 | |
| Dell Inspiron 15 5568 | |
| Acer Aspire R14 R5-471T-79GQ | |
| Lenovo Ideapad 500-15ISK 80NT005WGE | |
| maximum AS SSD Seq Read Test (1GB) | |
| Dell XPS 13 2016 9350 (FHD, i7-6560U) | |
| HP Envy 15-w103ng x360 | |
| Lenovo Yoga 510-15ISK | |
| Dell Inspiron 15 5568 | |
| Lenovo Ideapad 500-15ISK 80NT005WGE | |
| Acer Aspire R14 R5-471T-79GQ | |
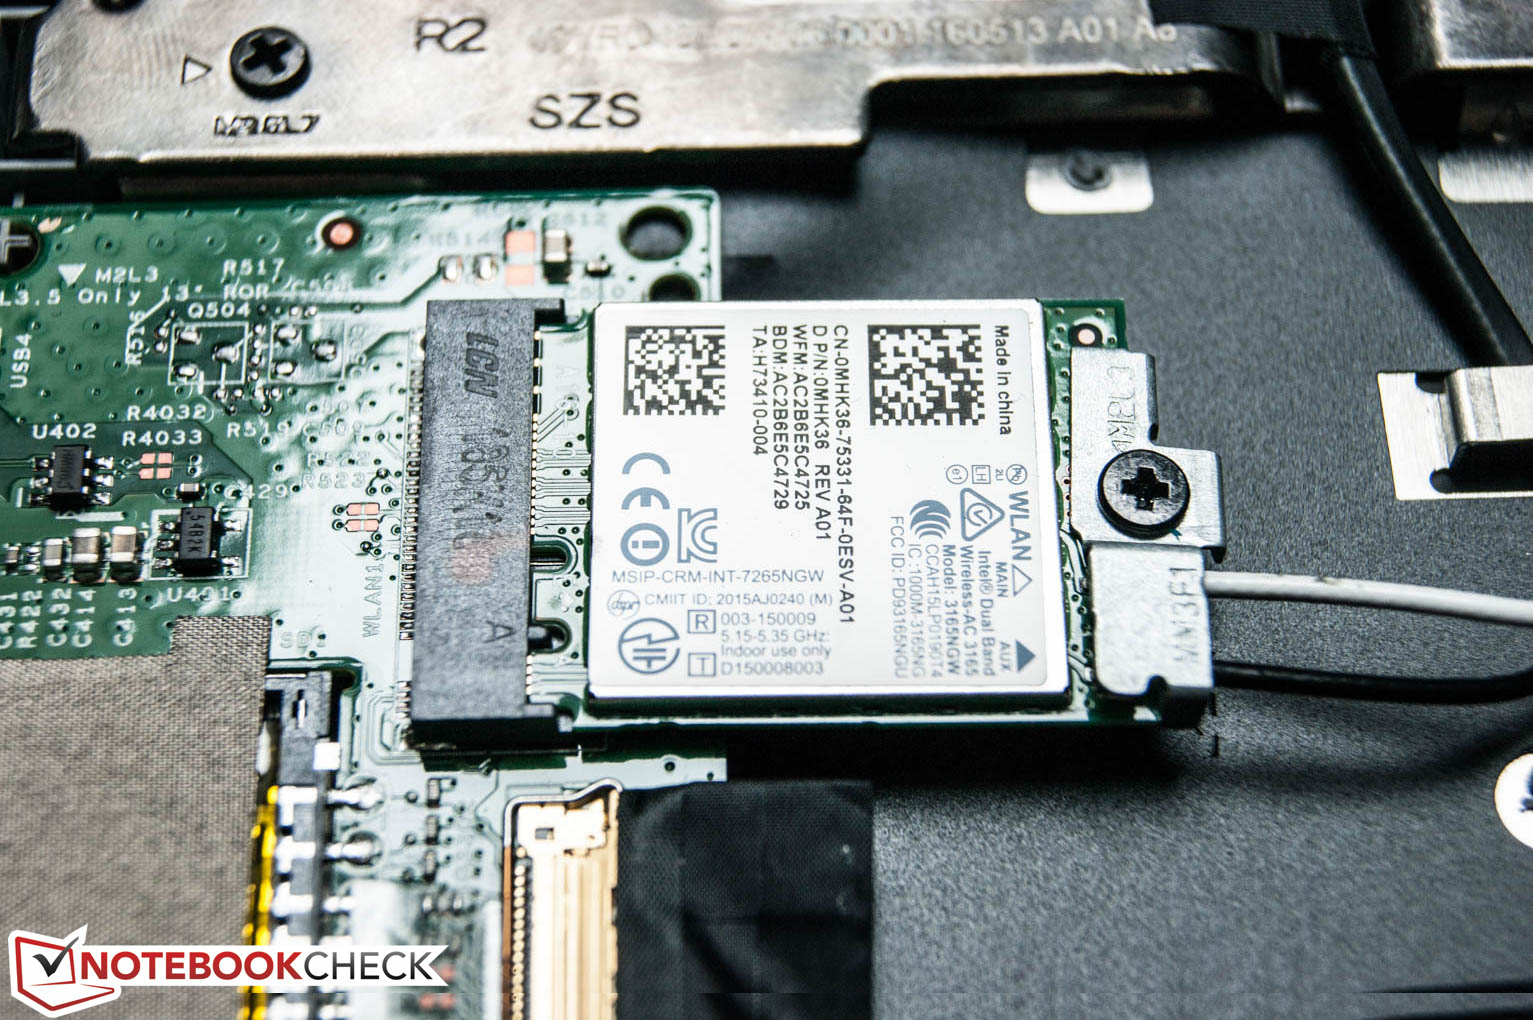
| Networking | |
| iperf Server (receive) TCP 1 m | |
| Dell Inspiron 15 5568 | |
| HP x2 210 G1 | |
| iperf Client (transmit) TCP 1 m | |
| Dell Inspiron 15 5568 | |
| HP x2 210 G1 | |
| |||||||||||||||||||||||||
iluminación: 85 %
Brillo con batería: 266 cd/m²
Contraste: 1023:1 (Negro: 0.26 cd/m²)
ΔE ColorChecker Calman: 4.98 | ∀{0.5-29.43 Ø4.71}
ΔE Greyscale Calman: 2.68 | ∀{0.09-98 Ø4.96}
57% sRGB (Argyll 1.6.3 3D)
36% AdobeRGB 1998 (Argyll 1.6.3 3D)
39.3% AdobeRGB 1998 (Argyll 3D)
57.1% sRGB (Argyll 3D)
38.04% Display P3 (Argyll 3D)
Gamma: 2.27
CCT: 6583 K
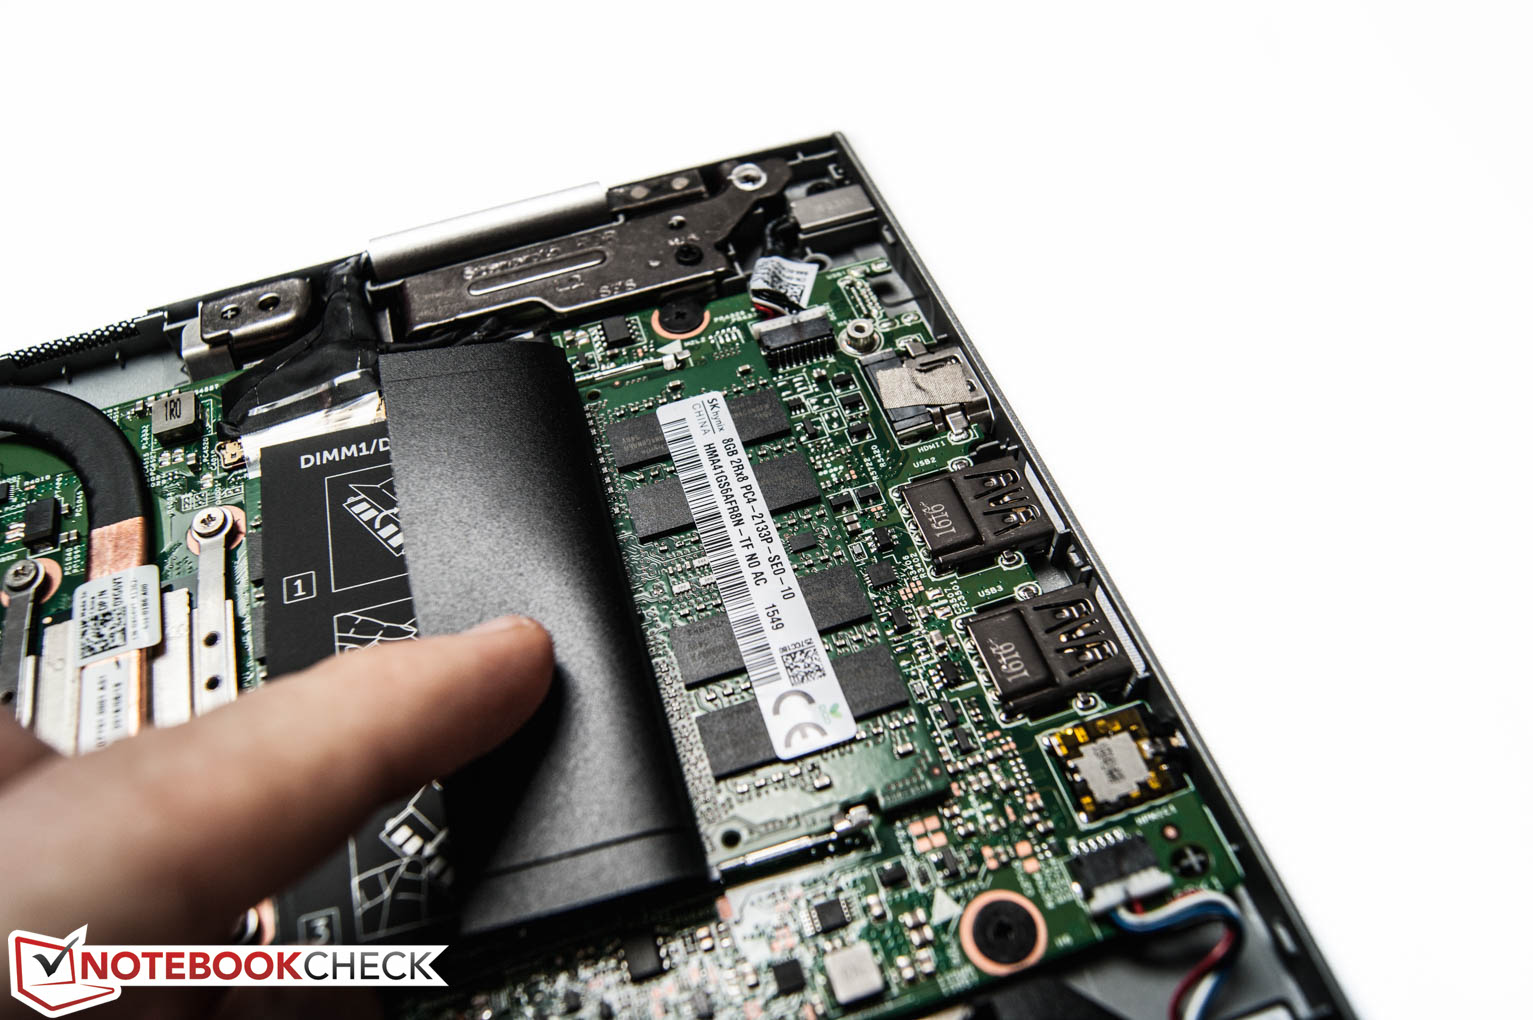
| Dell Inspiron 15 5568 HD Graphics 520, 6500U, Toshiba THNSNK256GCS8 | HP Spectre x360 15-ap012dx HD Graphics 520, 6200U, Sandisk X300 SD7SN6S-256G-1006 | HP Envy 15-w103ng x360 GeForce 930M, 6200U, Samsung SSD PM851 256 GB MZNTE256HMHP | Lenovo Yoga 510-15ISK Radeon R7 M460, 6200U, Liteonit CV3-DE256 | Acer Aspire R14 R5-471T-79GQ HD Graphics 520, 6500U | |
|---|---|---|---|---|---|
| Display | 61% | 5% | 12% | -3% | |
| Display P3 Coverage (%) | 38.04 | 62.8 65% | 39.97 5% | 42.58 12% | 36.92 -3% |
| sRGB Coverage (%) | 57.1 | 88.2 54% | 59.8 5% | 63.9 12% | 55.4 -3% |
| AdobeRGB 1998 Coverage (%) | 39.3 | 63.9 63% | 41.32 5% | 43.99 12% | 38.15 -3% |
| Response Times | -3% | -8% | -22% | -63% | |
| Response Time Grey 50% / Grey 80% * (ms) | 42 ? | 32.8 ? 22% | 37 ? 12% | 43.2 ? -3% | 80 ? -90% |
| Response Time Black / White * (ms) | 22 ? | 28 ? -27% | 28 ? -27% | 30.8 ? -40% | 30 ? -36% |
| PWM Frequency (Hz) | |||||
| Screen | 4% | -30% | 4% | -7% | |
| Brightness middle (cd/m²) | 266 | 298 12% | 208 -22% | 254 -5% | 215 -19% |
| Brightness (cd/m²) | 249 | 295 18% | 205 -18% | 230 -8% | 203 -18% |
| Brightness Distribution (%) | 85 | 88 4% | 80 -6% | 86 1% | 85 0% |
| Black Level * (cd/m²) | 0.26 | 0.57 -119% | 0.26 -0% | 0.26 -0% | 0.25 4% |
| Contrast (:1) | 1023 | 523 -49% | 800 -22% | 977 -4% | 860 -16% |
| Colorchecker dE 2000 * | 4.98 | 4.43 11% | 6.97 -40% | 4.23 15% | 5.04 -1% |
| Colorchecker dE 2000 max. * | 11.82 | 6.62 44% | 9.5 20% | 10.6 10% | |
| Greyscale dE 2000 * | 2.68 | 2.45 9% | 7.37 -175% | 2.87 -7% | 3.3 -23% |
| Gamma | 2.27 97% | 2.45 90% | 2.34 94% | 2.35 94% | 2.35 94% |
| CCT | 6583 99% | 6326 103% | 6823 95% | 5965 109% | 6370 102% |
| Color Space (Percent of AdobeRGB 1998) (%) | 36 | 57.2 59% | 38 6% | 40.35 12% | 35 -3% |
| Color Space (Percent of sRGB) (%) | 57 | 87.8 54% | 59 4% | 63.48 11% | 55 -4% |
| Media total (Programa/Opciones) | 21% /
15% | -11% /
-20% | -2% /
2% | -24% /
-14% |
* ... más pequeño es mejor
Tiempos de respuesta del display
| ↔ Tiempo de respuesta de Negro a Blanco | ||
|---|---|---|
| 22 ms ... subida ↗ y bajada ↘ combinada | ↗ 6 ms subida | 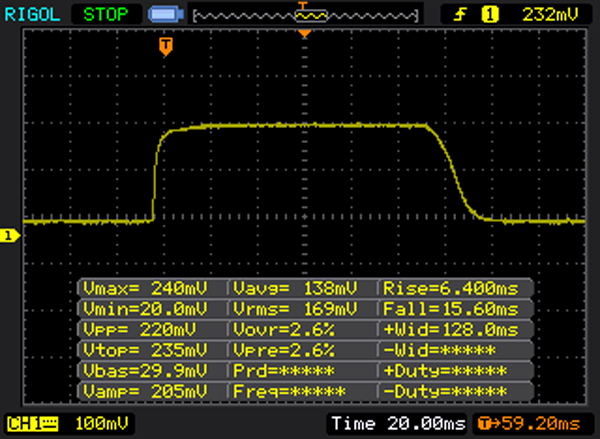 |
| ↘ 16 ms bajada | ||
| La pantalla mostró buenos tiempos de respuesta en nuestros tests pero podría ser demasiado lenta para los jugones competitivos. En comparación, todos los dispositivos de prueba van de ##min### (mínimo) a 240 (máximo) ms. » 49 % de todos los dispositivos son mejores. Eso quiere decir que el tiempo de respuesta es peor que la media (19.8 ms) de todos los dispositivos testados. | ||
| ↔ Tiempo de respuesta 50% Gris a 80% Gris | ||
| 42 ms ... subida ↗ y bajada ↘ combinada | ↗ 19 ms subida | 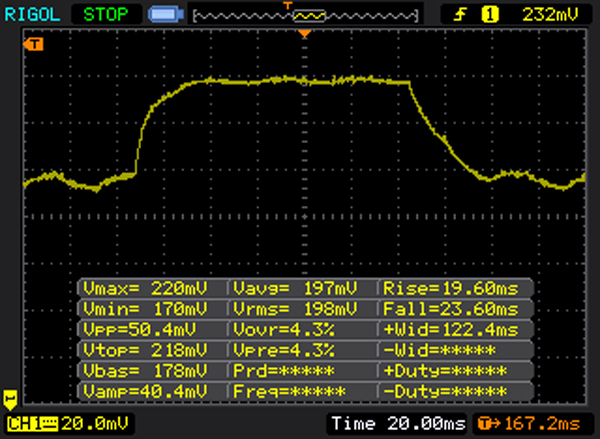 |
| ↘ 23 ms bajada | ||
| La pantalla mostró tiempos de respuesta lentos en nuestros tests y podría ser demasiado lenta para los jugones. En comparación, todos los dispositivos de prueba van de ##min### (mínimo) a 636 (máximo) ms. » 67 % de todos los dispositivos son mejores. Eso quiere decir que el tiempo de respuesta es peor que la media (30.9 ms) de todos los dispositivos testados. | ||
Parpadeo de Pantalla / PWM (Pulse-Width Modulation)
| Parpadeo de Pantalla / PWM no detectado | ||
Comparación: 52 % de todos los dispositivos testados no usaron PWM para atenuar el display. Si se usó, medimos una media de 7748 (mínimo: 5 - máxmo: 343500) Hz. | ||
| PCMark 8 Home Score Accelerated v2 | 3607 puntos | |
| PCMark 8 Work Score Accelerated v2 | 4433 puntos | |
ayuda | ||
| Dell Inspiron 15 5568 HD Graphics 520, 6500U, Toshiba THNSNK256GCS8 | HP Spectre x360 15-ap012dx HD Graphics 520, 6200U, Sandisk X300 SD7SN6S-256G-1006 | HP Envy 15-w103ng x360 GeForce 930M, 6200U, Samsung SSD PM851 256 GB MZNTE256HMHP | Acer Aspire R14 R5-471T-79GQ HD Graphics 520, 6500U | Lenovo Yoga 510-15ISK Radeon R7 M460, 6200U, Liteonit CV3-DE256 | |
|---|---|---|---|---|---|
| CrystalDiskMark 3.0 | 14% | 13% | -9% | 18% | |
| Read Seq (MB/s) | 458.6 | 475.6 4% | 515 12% | 503 10% | 487 6% |
| Write Seq (MB/s) | 270 | 425 57% | 240.7 -11% | 161.6 -40% | 450.7 67% |
| Read 512 (MB/s) | 397.4 | 258.4 -35% | 391.3 -2% | 319.7 -20% | 384.5 -3% |
| Write 512 (MB/s) | 242 | 318.9 32% | 240 -1% | 161.5 -33% | 356.3 47% |
| Read 4k (MB/s) | 19.88 | 35.48 78% | 27.64 39% | 26.04 31% | 27.05 36% |
| Write 4k (MB/s) | 86.7 | 93 7% | 95.2 10% | 81.6 -6% | 63.7 -27% |
| Read 4k QD32 (MB/s) | 275.3 | 281.2 2% | 367.9 34% | 278.5 1% | 281.5 2% |
| Write 4k QD32 (MB/s) | 197.6 | 138.7 -30% | 239 21% | 161.6 -18% | 232 17% |

| 3DMark 11 Performance | 1672 puntos | |
| 3DMark Cloud Gate Standard Score | 6323 puntos | |
ayuda | ||
| Tomb Raider | |
| 1366x768 Normal Preset AA:FX AF:4x | |
| HP Envy 15-w103ng x360 | |
| Dell Inspiron 15 5568 | |
| Lenovo Ideapad 500-15ISK 80NT005WGE | |
| Acer Aspire R14 R5-471T-79GQ | |
| Lenovo Yoga 510-15ISK | |
| Asus ASUSPRO P2530UA-DM0046E | |
| Acer TravelMate P648-M-757N | |
| Lenovo ThinkPad X260-20F6007RGE | |
| 1366x768 High Preset AA:FX AF:8x | |
| HP Envy 15-w103ng x360 | |
| Lenovo Ideapad 500-15ISK 80NT005WGE | |
| Lenovo Yoga 510-15ISK | |
| Dell Inspiron 15 5568 | |
| Asus ASUSPRO P2530UA-DM0046E | |
| Acer Aspire R14 R5-471T-79GQ | |
| Acer TravelMate P648-M-757N | |
| Lenovo ThinkPad X260-20F6007RGE | |
| bajo | medio | alto | ultra | |
|---|---|---|---|---|
| Tomb Raider (2013) | 84.1 | 42.7 | 27.9 | 12.6 |
| BioShock Infinite (2013) | 54.4 | 31.5 | 27.7 | 8.2 |
| Rise of the Tomb Raider (2016) | 17.6 | 10.8 | 6.2 |
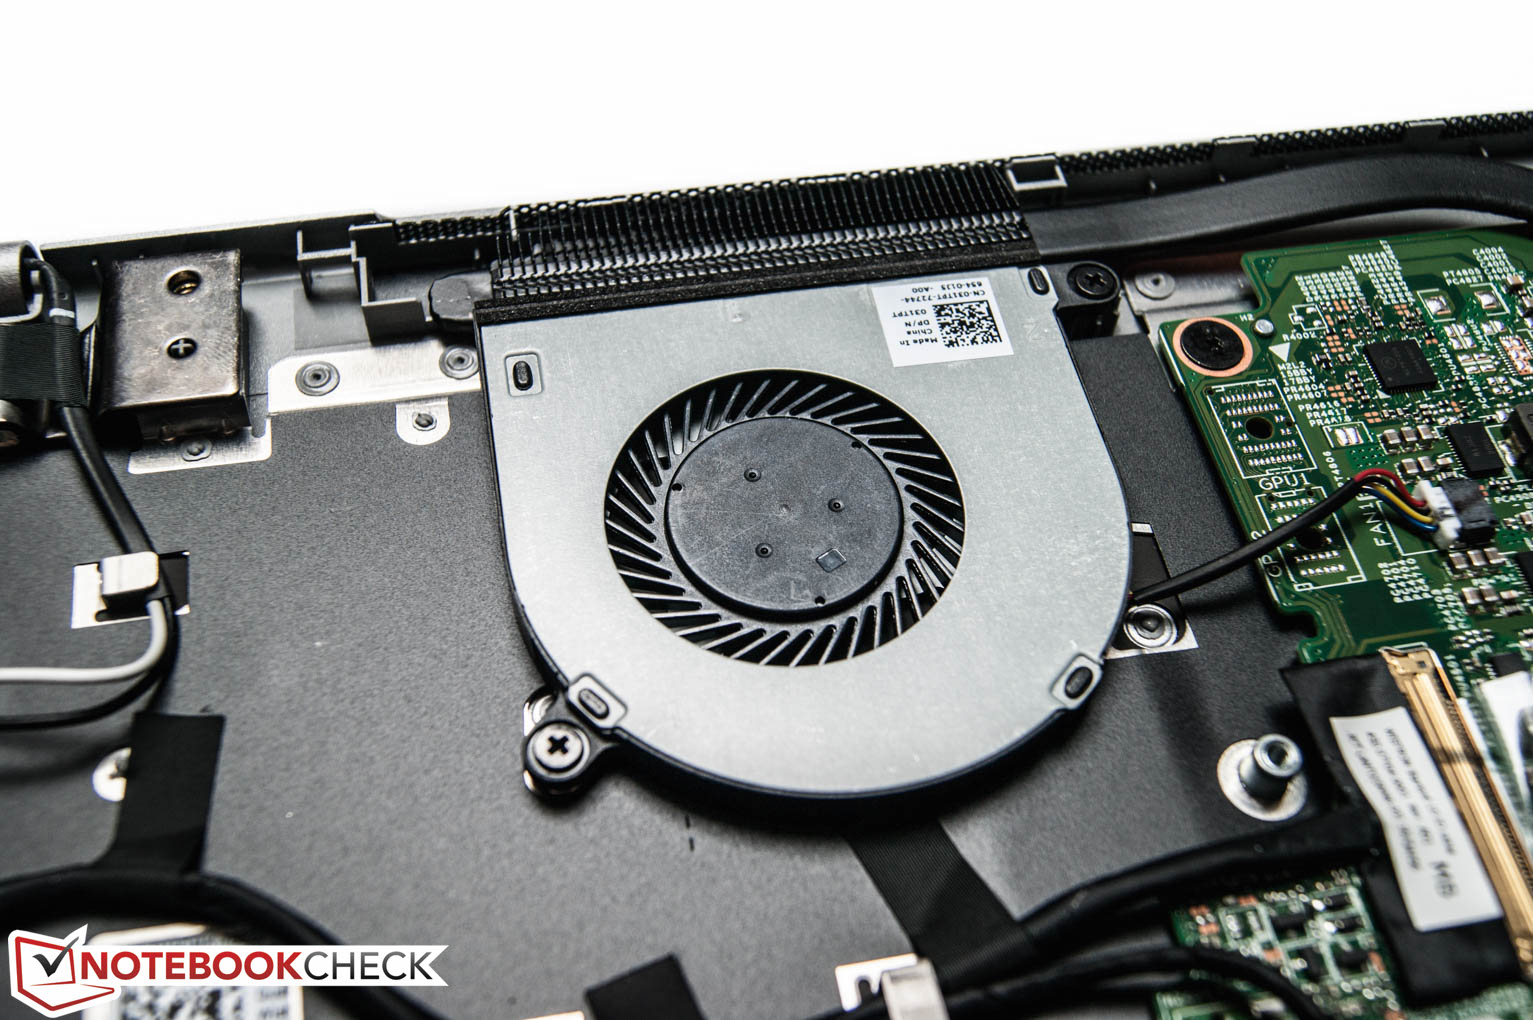
Ruido
| Ocioso |
| 32.8 / 32.8 / 33.8 dB(A) |
| Carga |
| 36.3 / 36.3 dB(A) |
 | ||
30 dB silencioso 40 dB(A) audible 50 dB(A) ruidosamente alto |
||
min: | ||
(+) La temperatura máxima en la parte superior es de 37.2 °C / 99 F, frente a la media de 35.4 °C / 96 F, que oscila entre 19.6 y 60 °C para la clase Convertible.
(-) El fondo se calienta hasta un máximo de 50.6 °C / 123 F, frente a la media de 36.9 °C / 98 F
(+) En reposo, la temperatura media de la parte superior es de 26.2 °C / 79# F, frente a la media del dispositivo de 30.3 °C / 87 F.
(+) El reposamanos y el panel táctil están a una temperatura inferior a la de la piel, con un máximo de 25.2 °C / 77.4 F y, por tanto, son fríos al tacto.
(+) La temperatura media de la zona del reposamanos de dispositivos similares fue de 28 °C / 82.4 F (+2.8 °C / 5 F).
| Off / Standby | |
| Ocioso | |
| Carga |
|
Clave:
min: | |
| Dell Inspiron 15 5568 HD Graphics 520, 6500U, Toshiba THNSNK256GCS8 | HP Spectre x360 15-ap012dx HD Graphics 520, 6200U, Sandisk X300 SD7SN6S-256G-1006 | HP Envy 15-w103ng x360 GeForce 930M, 6200U, Samsung SSD PM851 256 GB MZNTE256HMHP | Lenovo Yoga 510-15ISK Radeon R7 M460, 6200U, Liteonit CV3-DE256 | Acer Aspire R14 R5-471T-79GQ HD Graphics 520, 6500U | |
|---|---|---|---|---|---|
| Power Consumption | -45% | -13% | -20% | 4% | |
| Idle Minimum * (Watt) | 4.34 | 6.5 -50% | 4.15 4% | 4 8% | 4 8% |
| Idle Average * (Watt) | 7.5 | 13.3 -77% | 8.2 -9% | 7.5 -0% | 6.6 12% |
| Idle Maximum * (Watt) | 8.4 | 15.1 -80% | 8.2 2% | 8.1 4% | 8.6 -2% |
| Load Average * (Watt) | 30.4 | 30.8 -1% | 34.6 -14% | 40.8 -34% | 30.5 -0% |
| Load Maximum * (Watt) | 32.5 | 38.5 -18% | 48 -48% | 57.3 -76% | 32.2 1% |
* ... más pequeño es mejor
| Dell Inspiron 15 5568 HD Graphics 520, 6500U, Toshiba THNSNK256GCS8 | HP Spectre x360 15-ap012dx HD Graphics 520, 6200U, Sandisk X300 SD7SN6S-256G-1006 | HP Envy 15-w103ng x360 GeForce 930M, 6200U, Samsung SSD PM851 256 GB MZNTE256HMHP | Acer Aspire R14 R5-471T-79GQ HD Graphics 520, 6500U | Lenovo Yoga 510-15ISK Radeon R7 M460, 6200U, Liteonit CV3-DE256 | |
|---|---|---|---|---|---|
| Duración de Batería | 40% | 32% | 50% | 23% | |
| Reader / Idle (h) | 7.5 | 11.8 57% | 12.2 63% | ||
| H.264 (h) | 5 | 5.6 12% | |||
| WiFi v1.3 (h) | 5 | 7.2 44% | 6.6 32% | 7.5 50% | 5.6 12% |
| Load (h) | 1.6 | 1.9 19% | 1.7 6% |
Pro
Contra
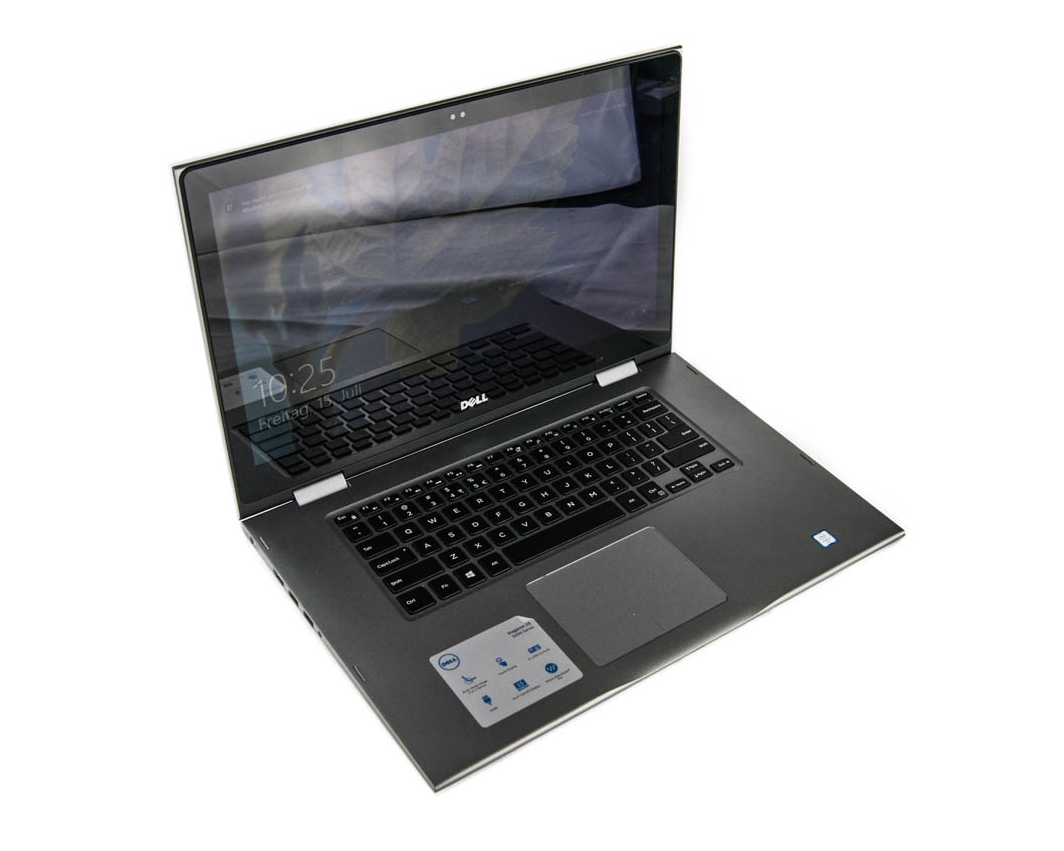
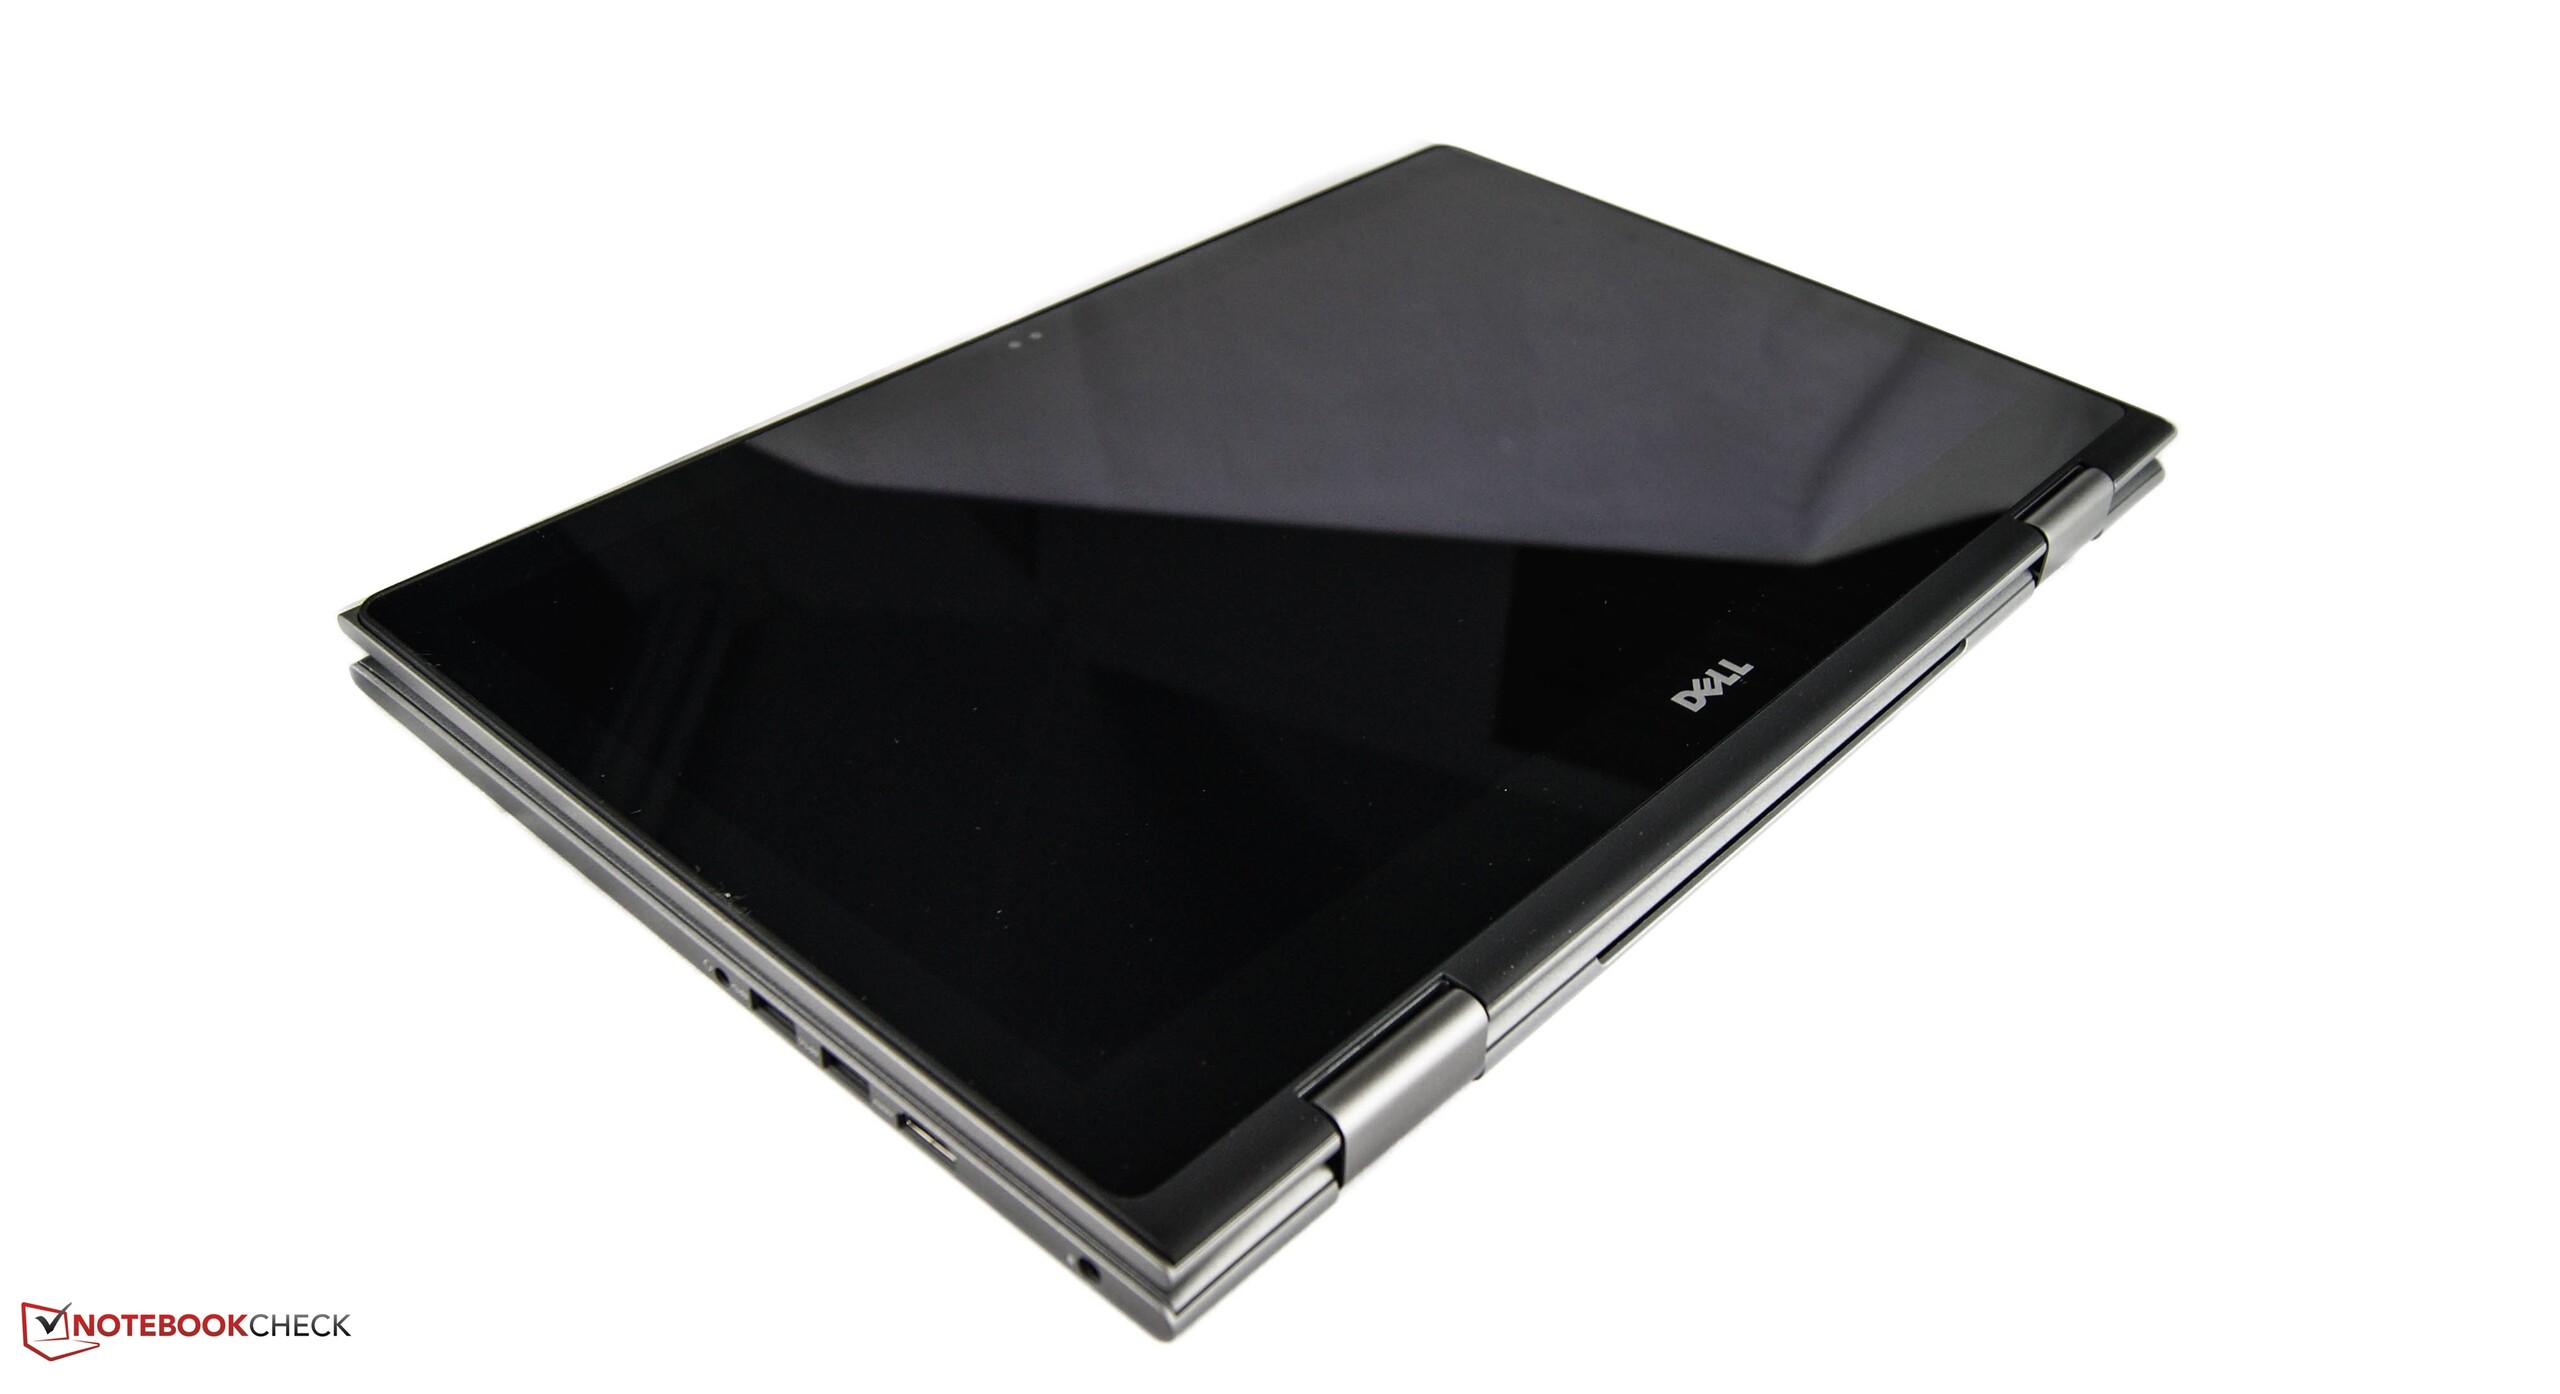
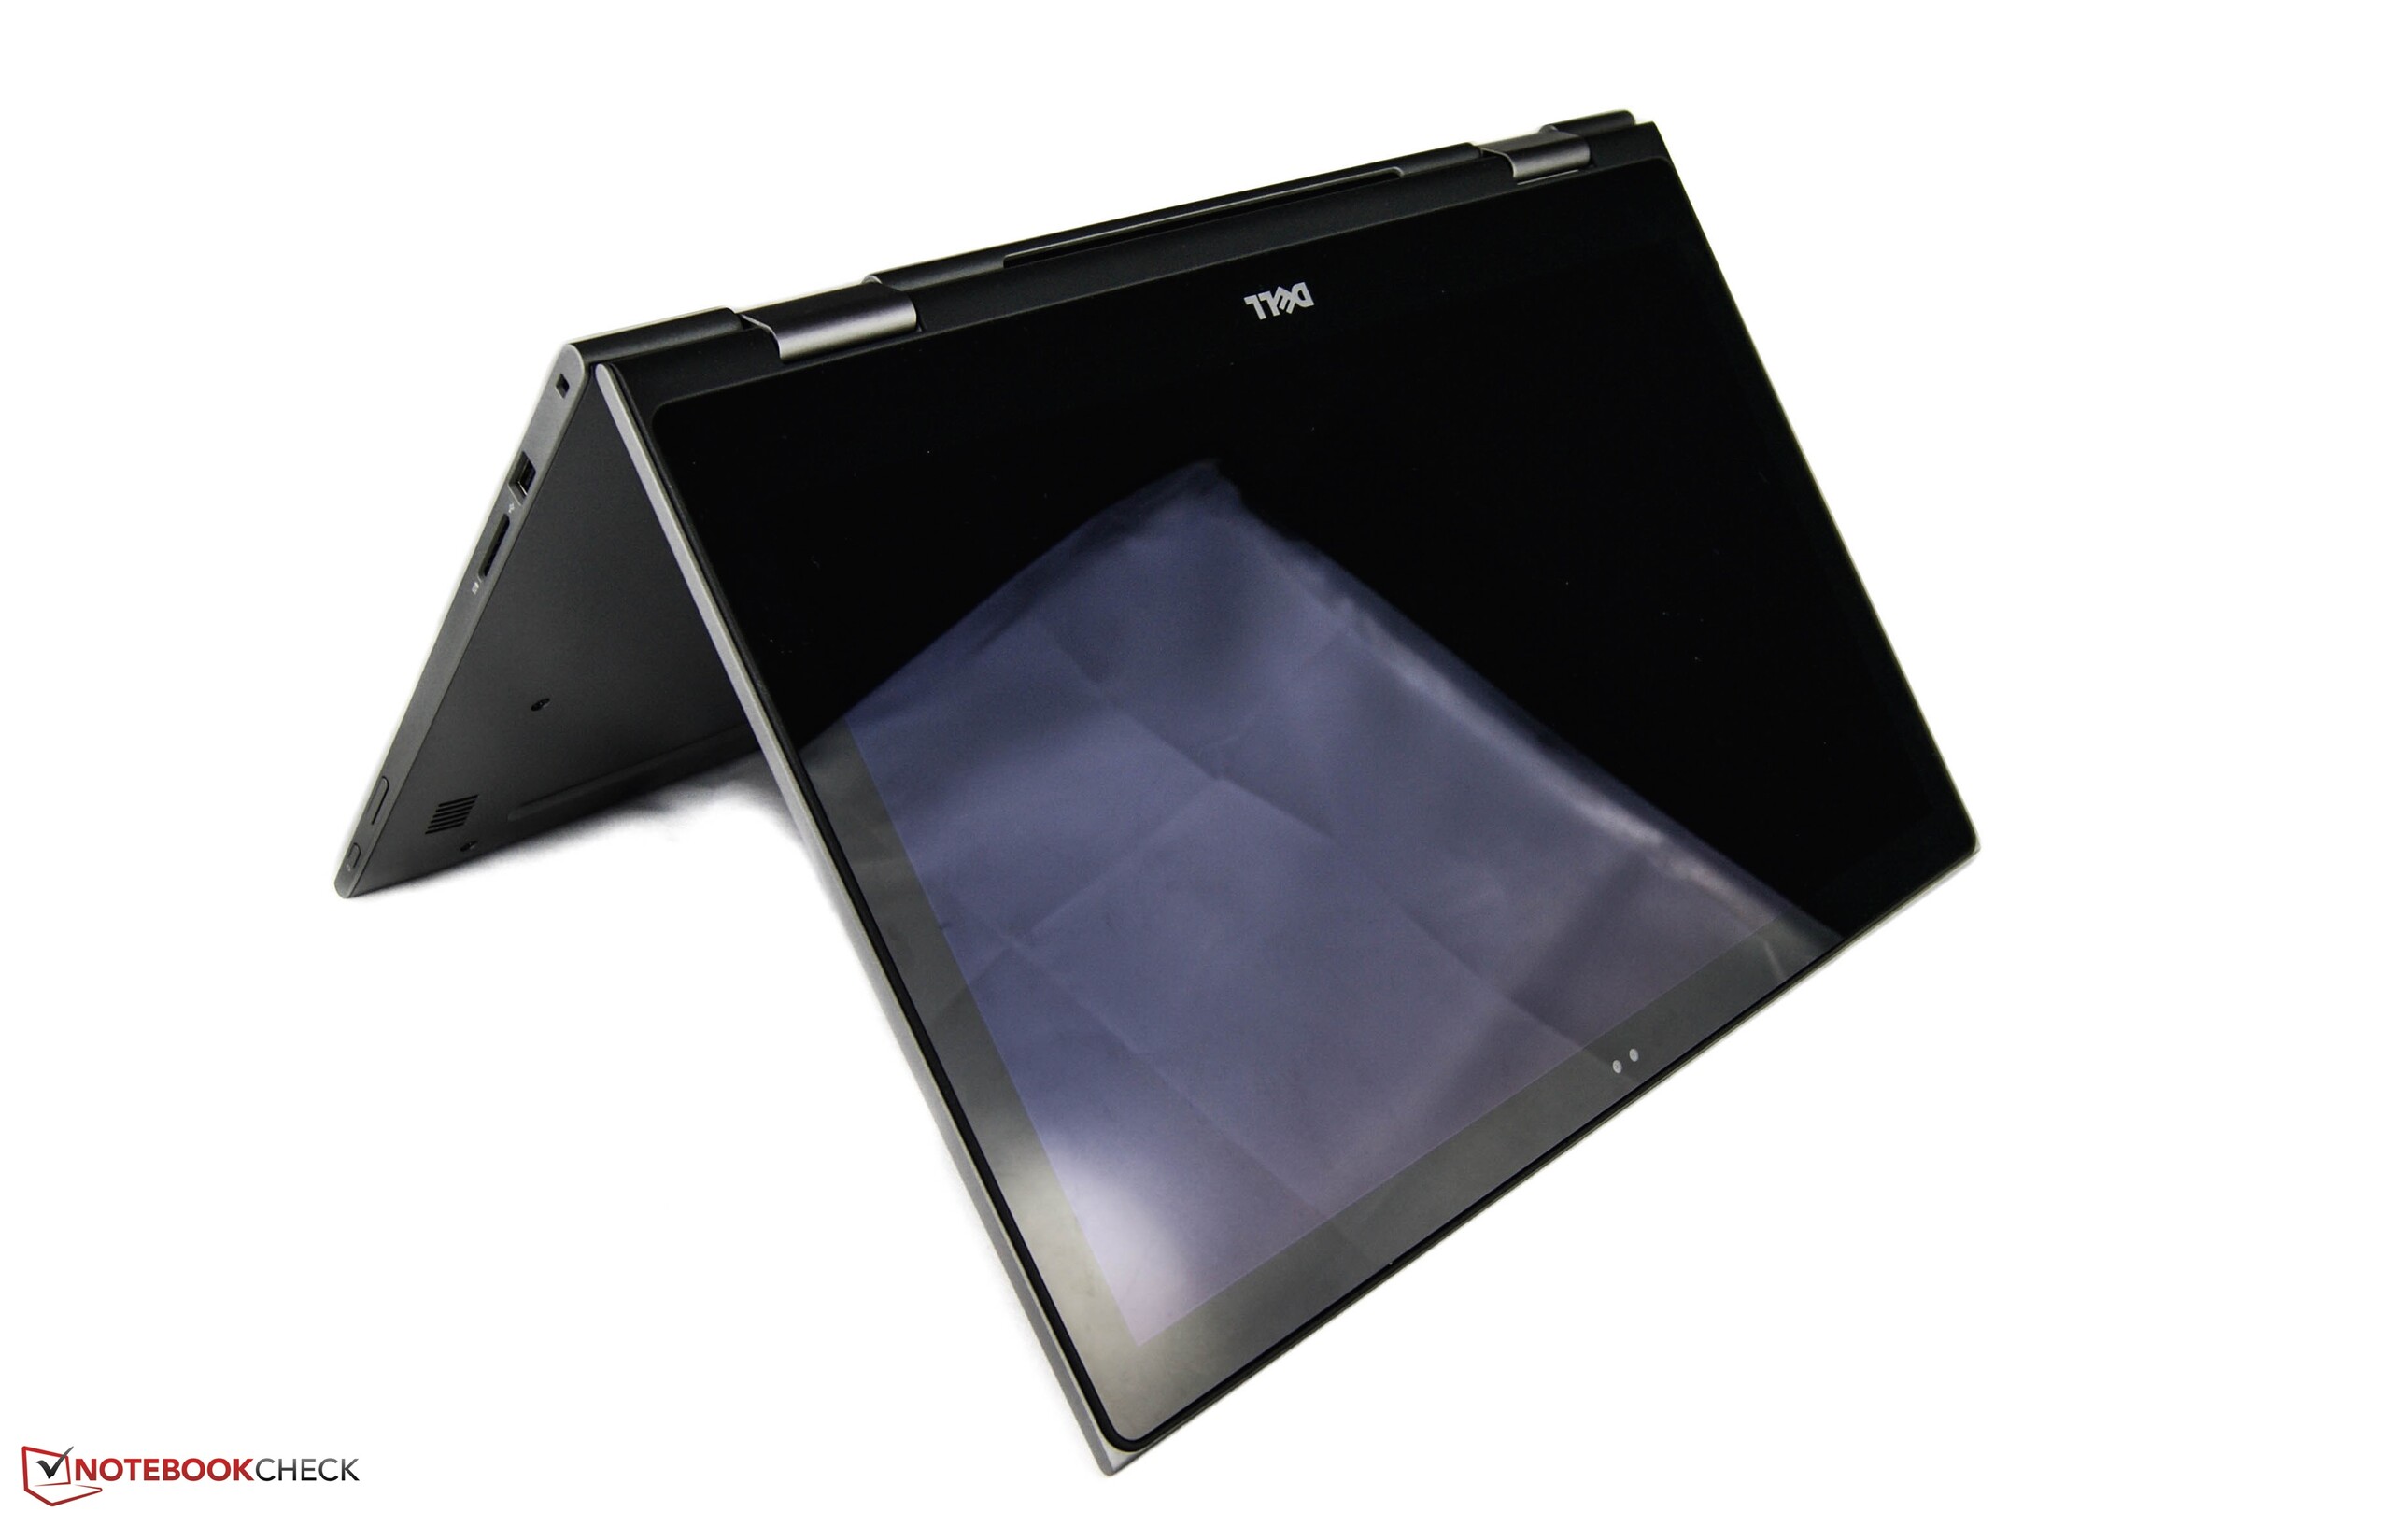
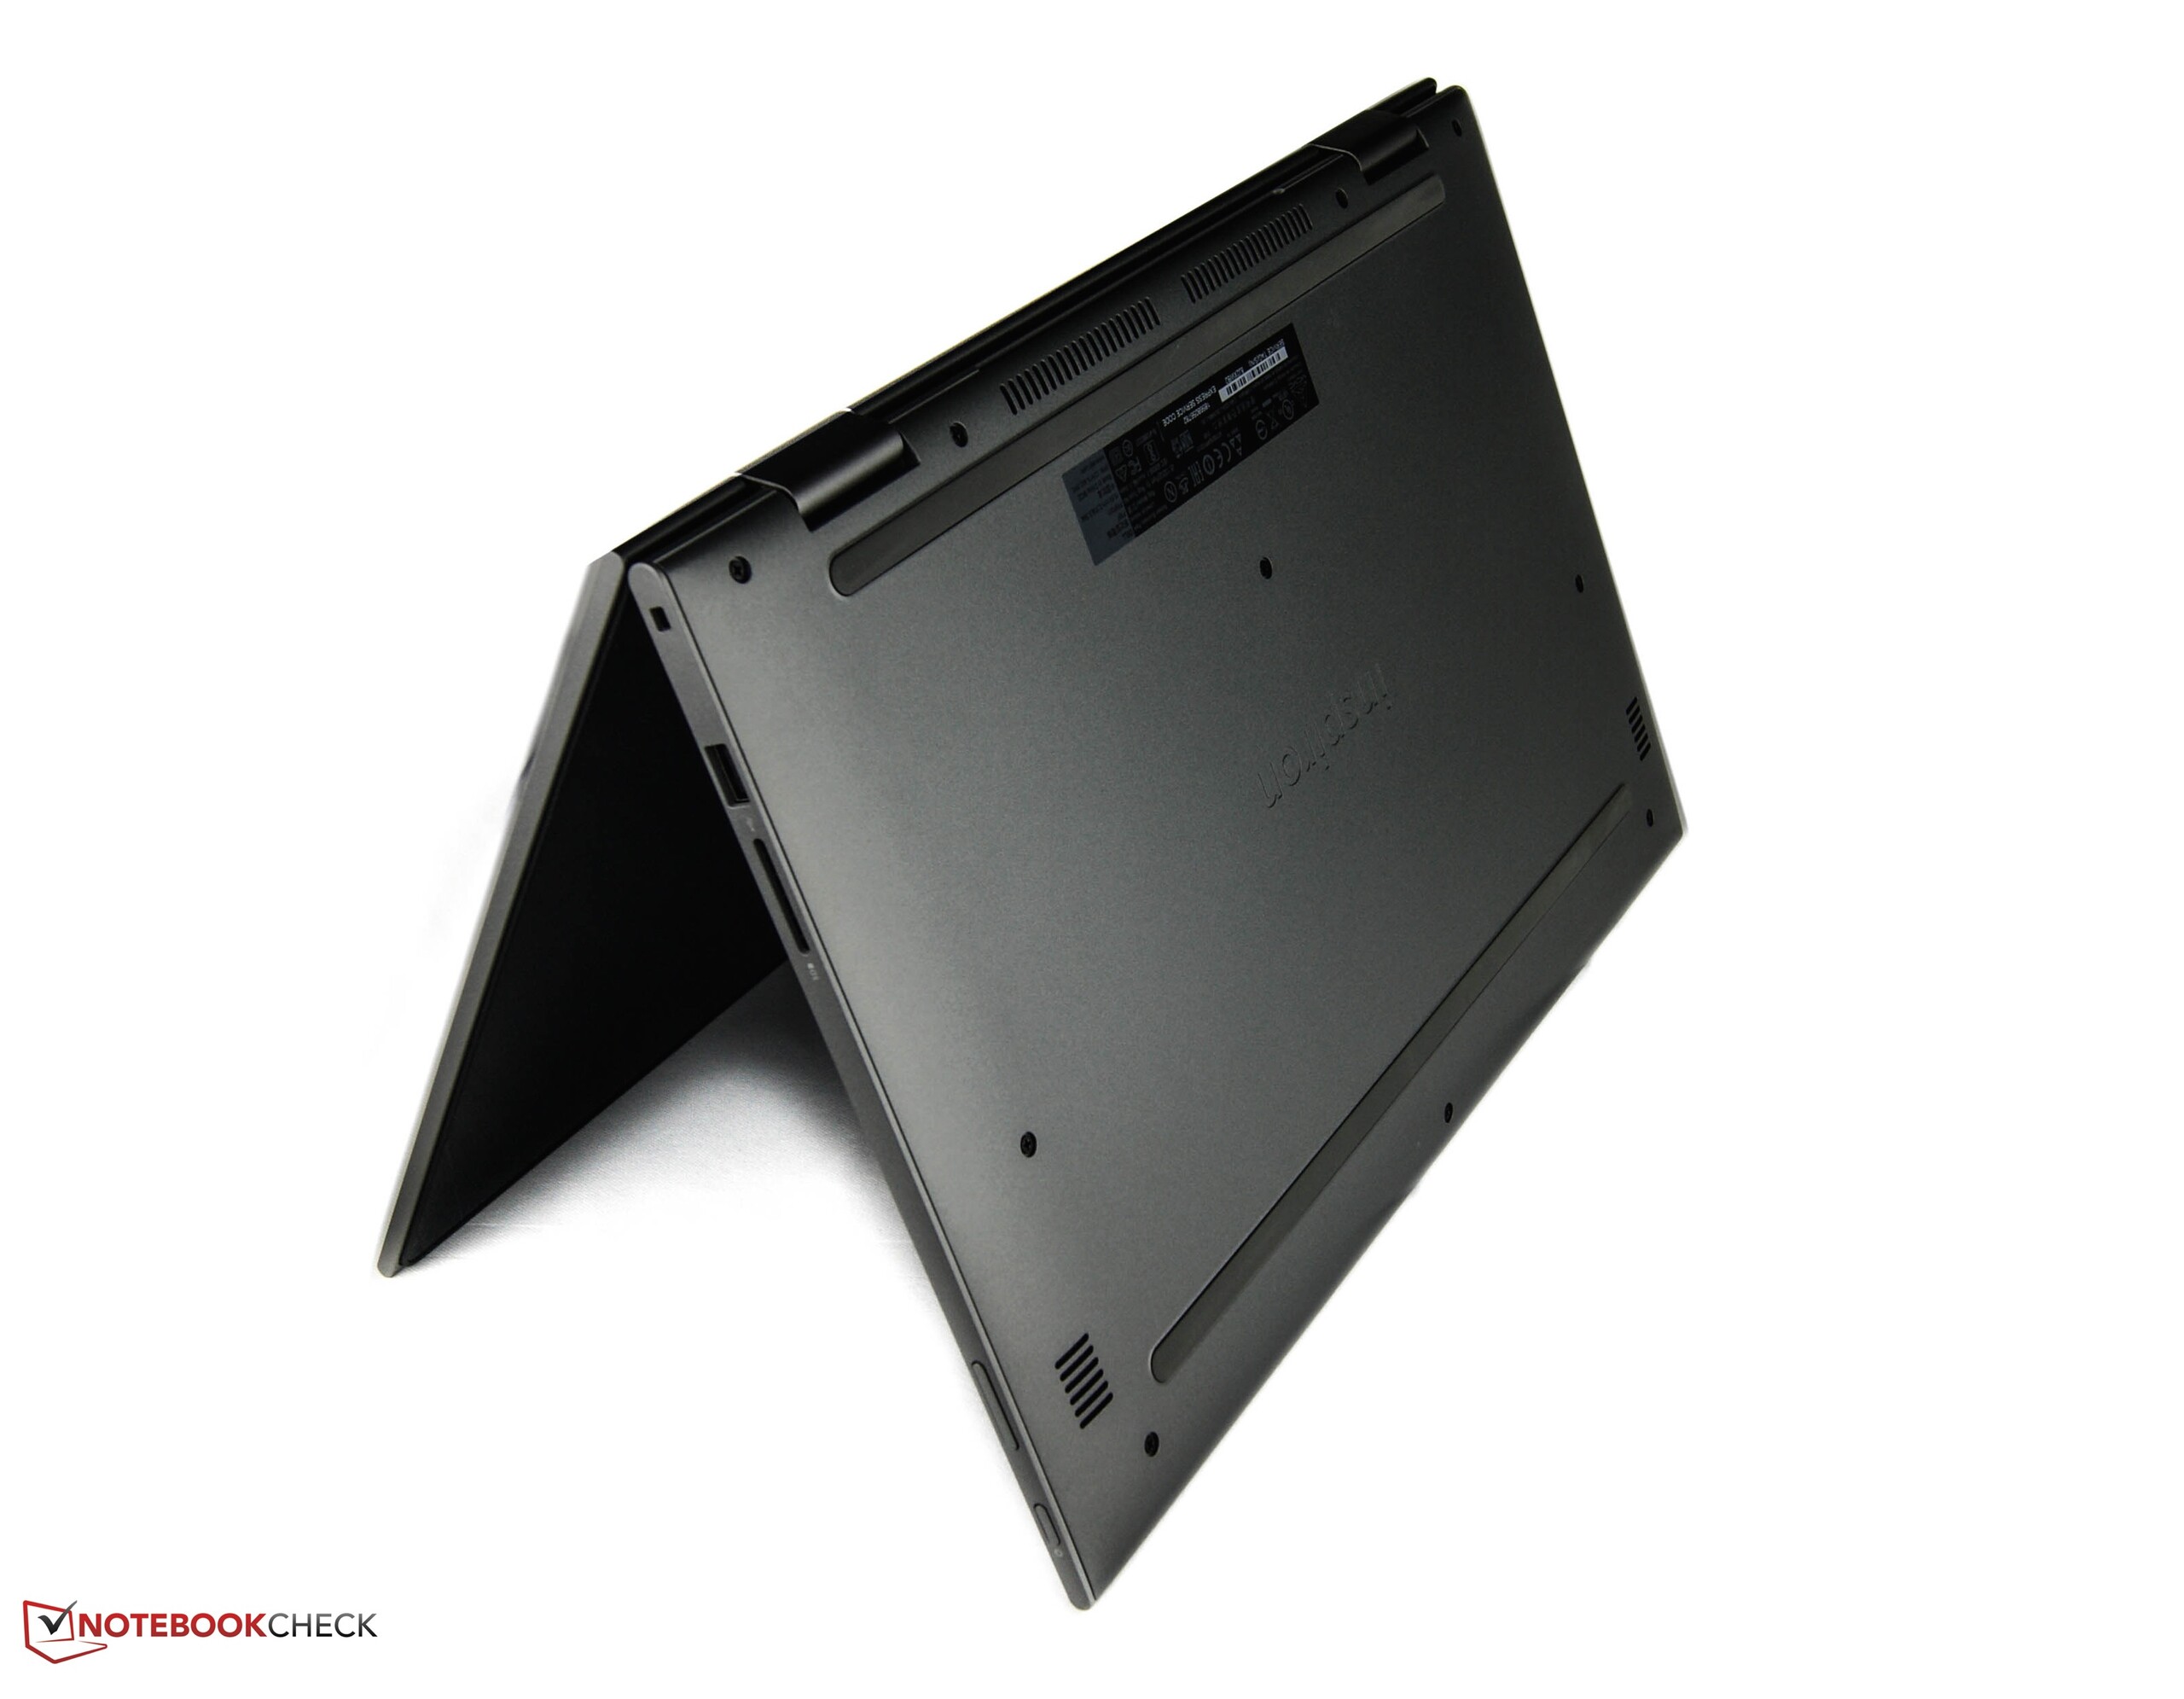
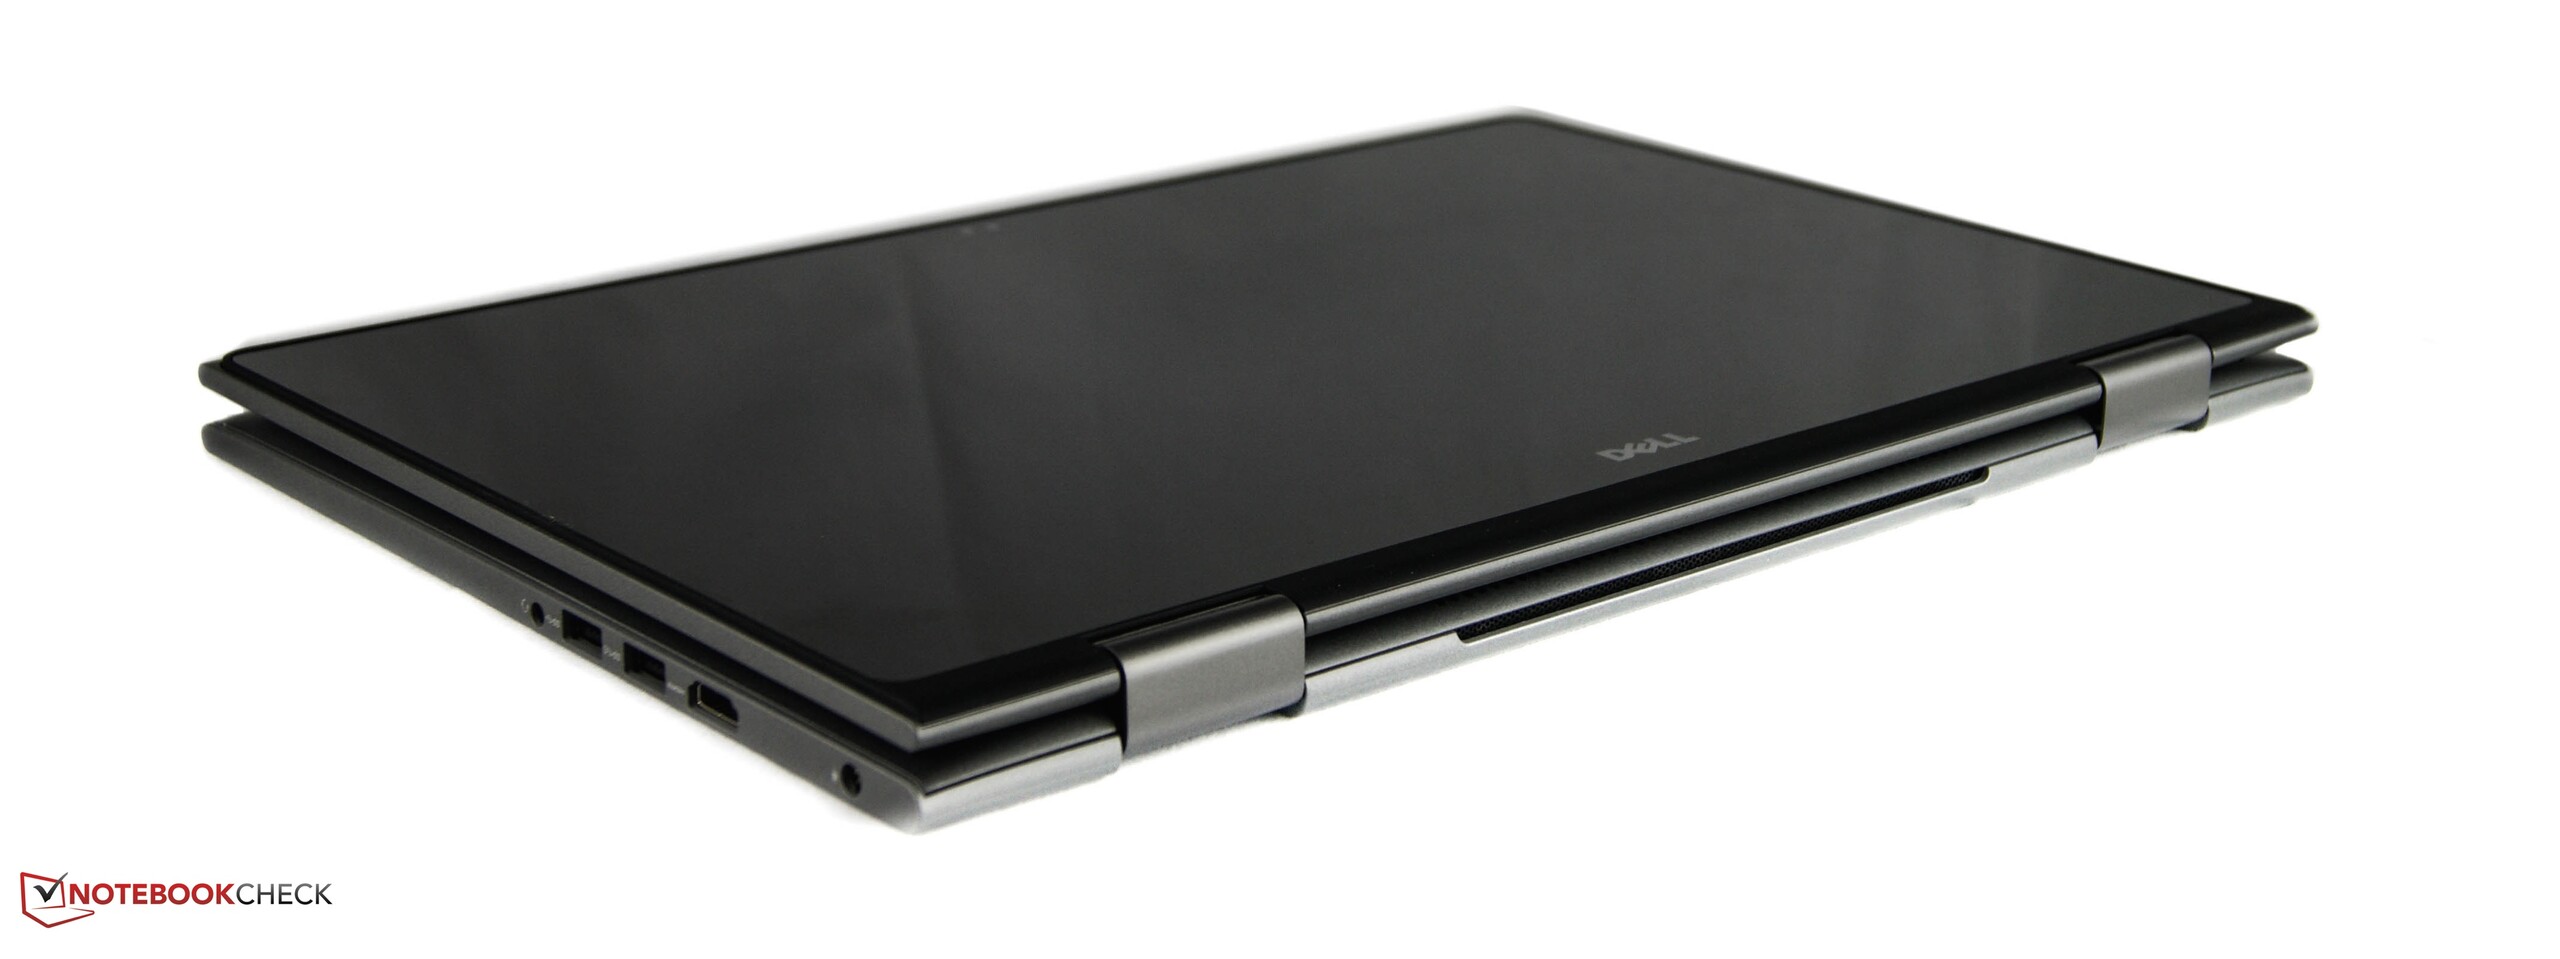
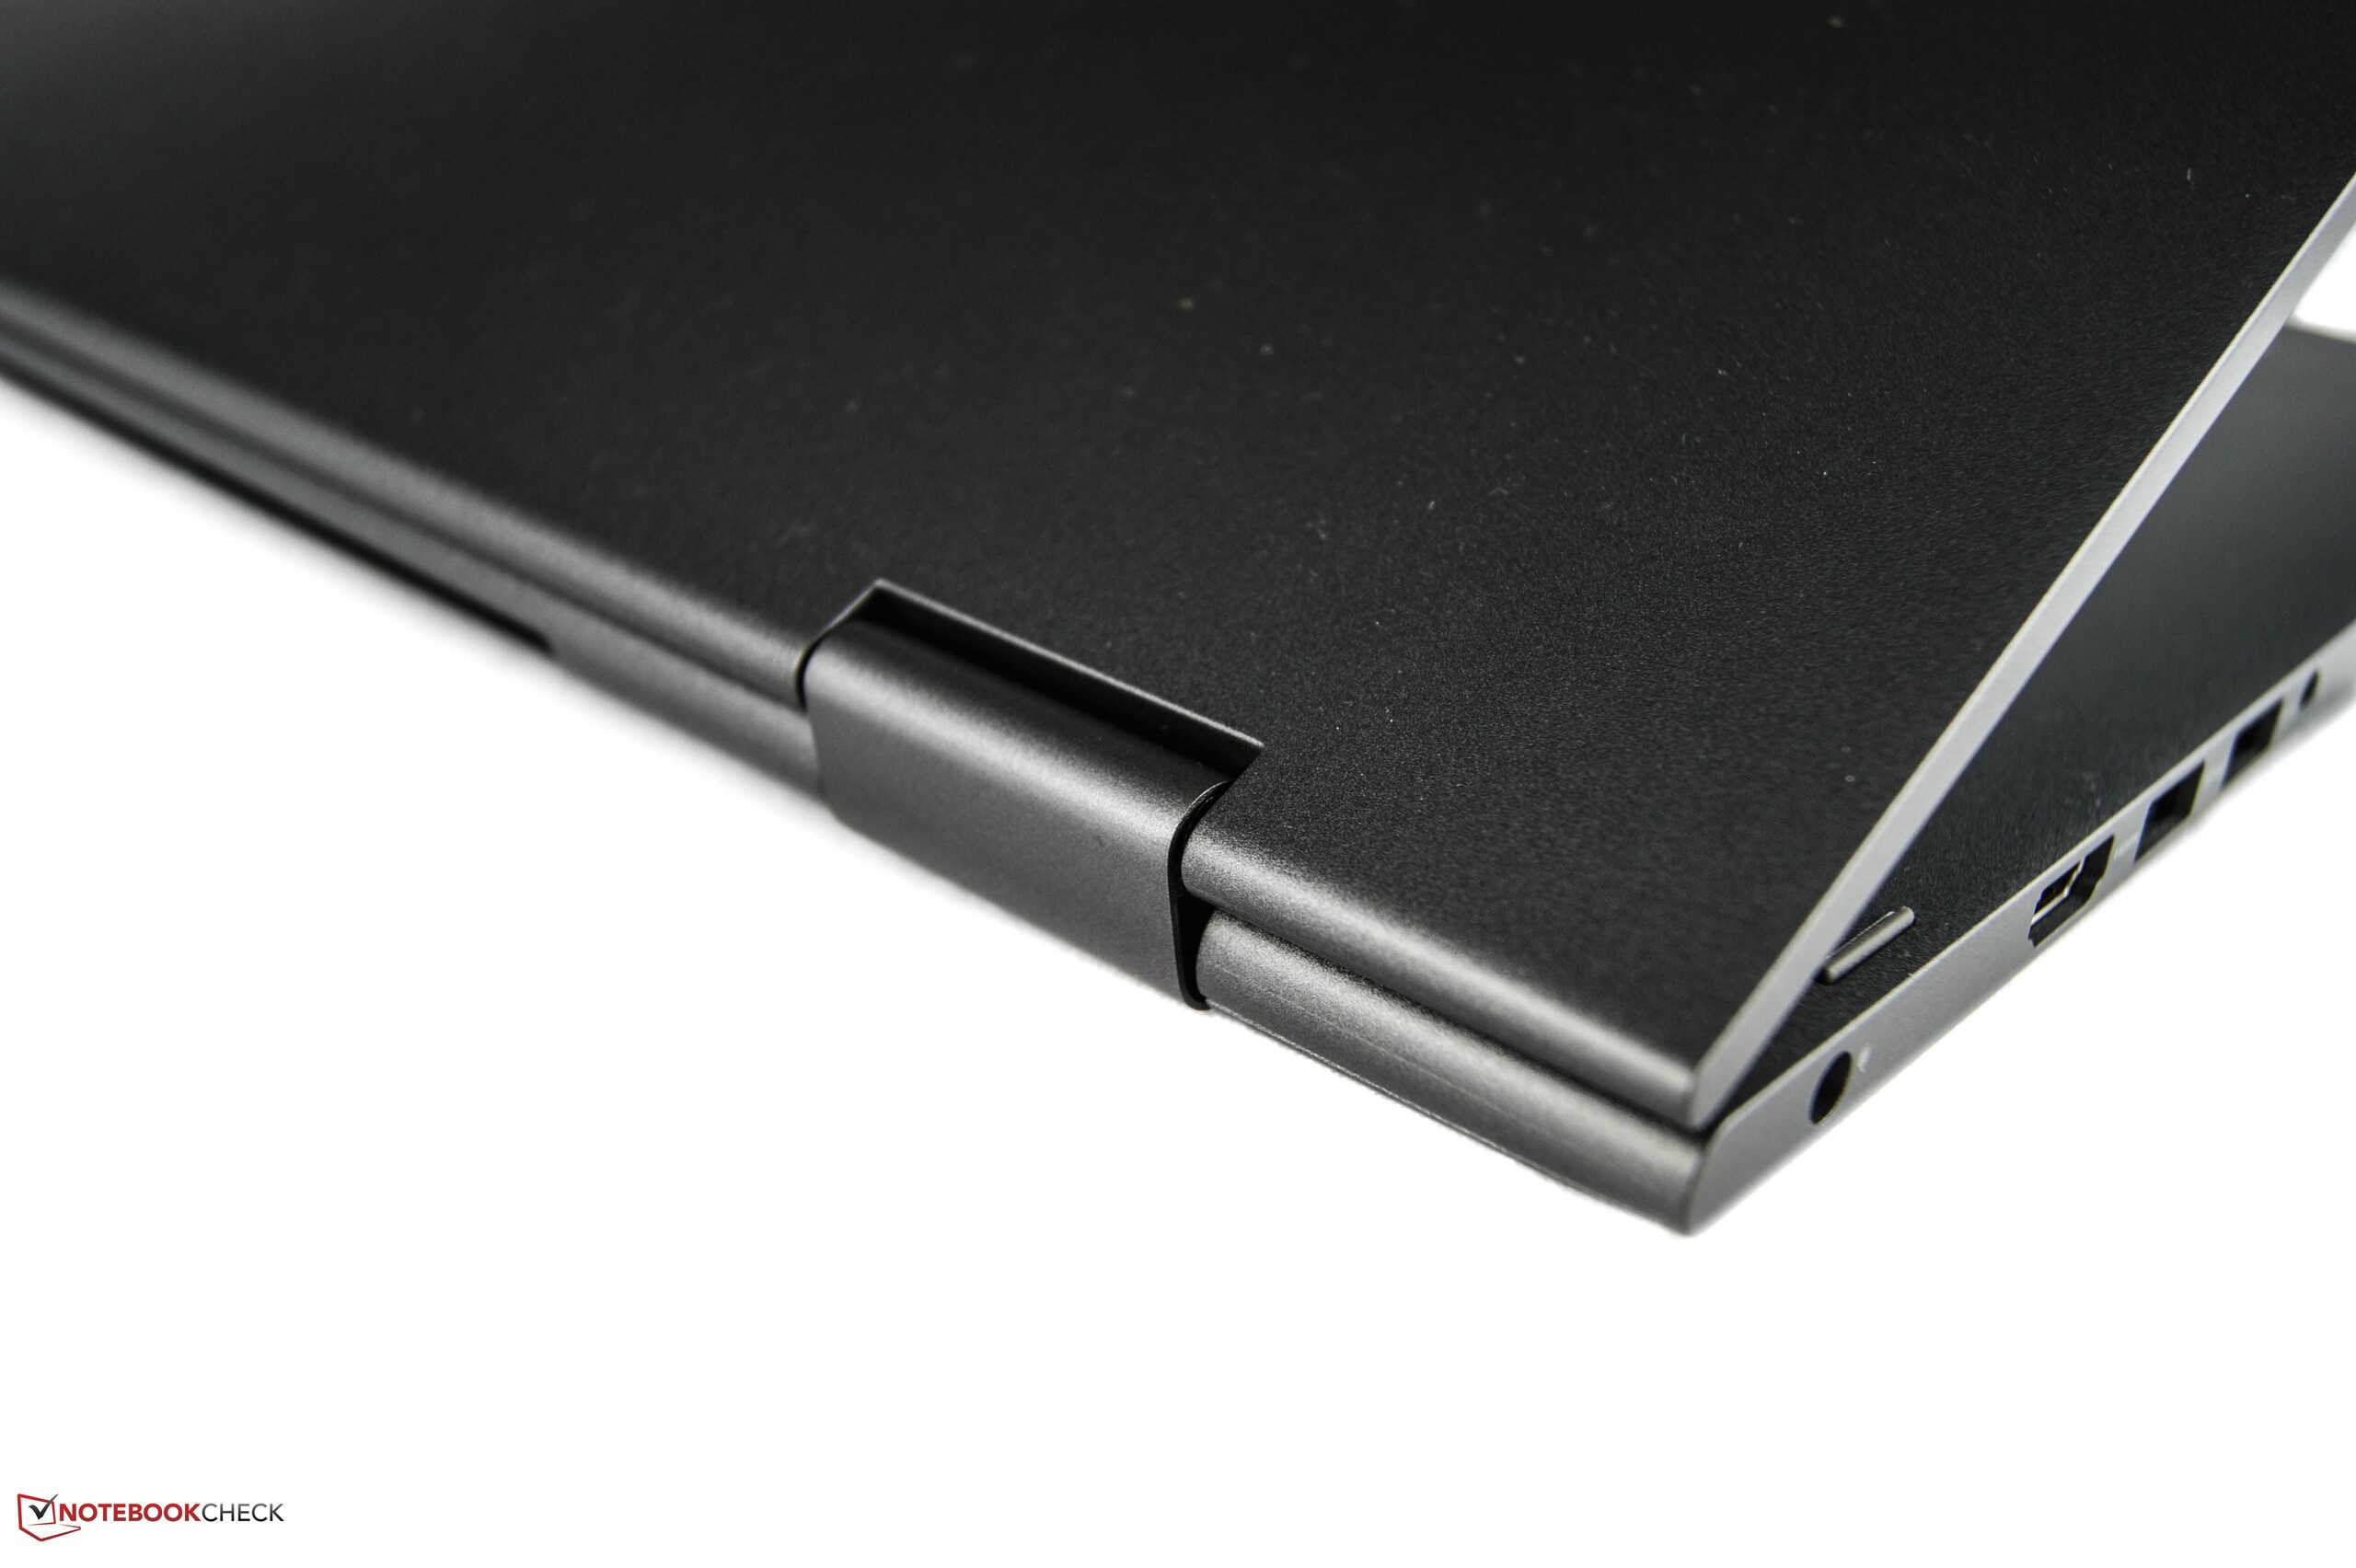
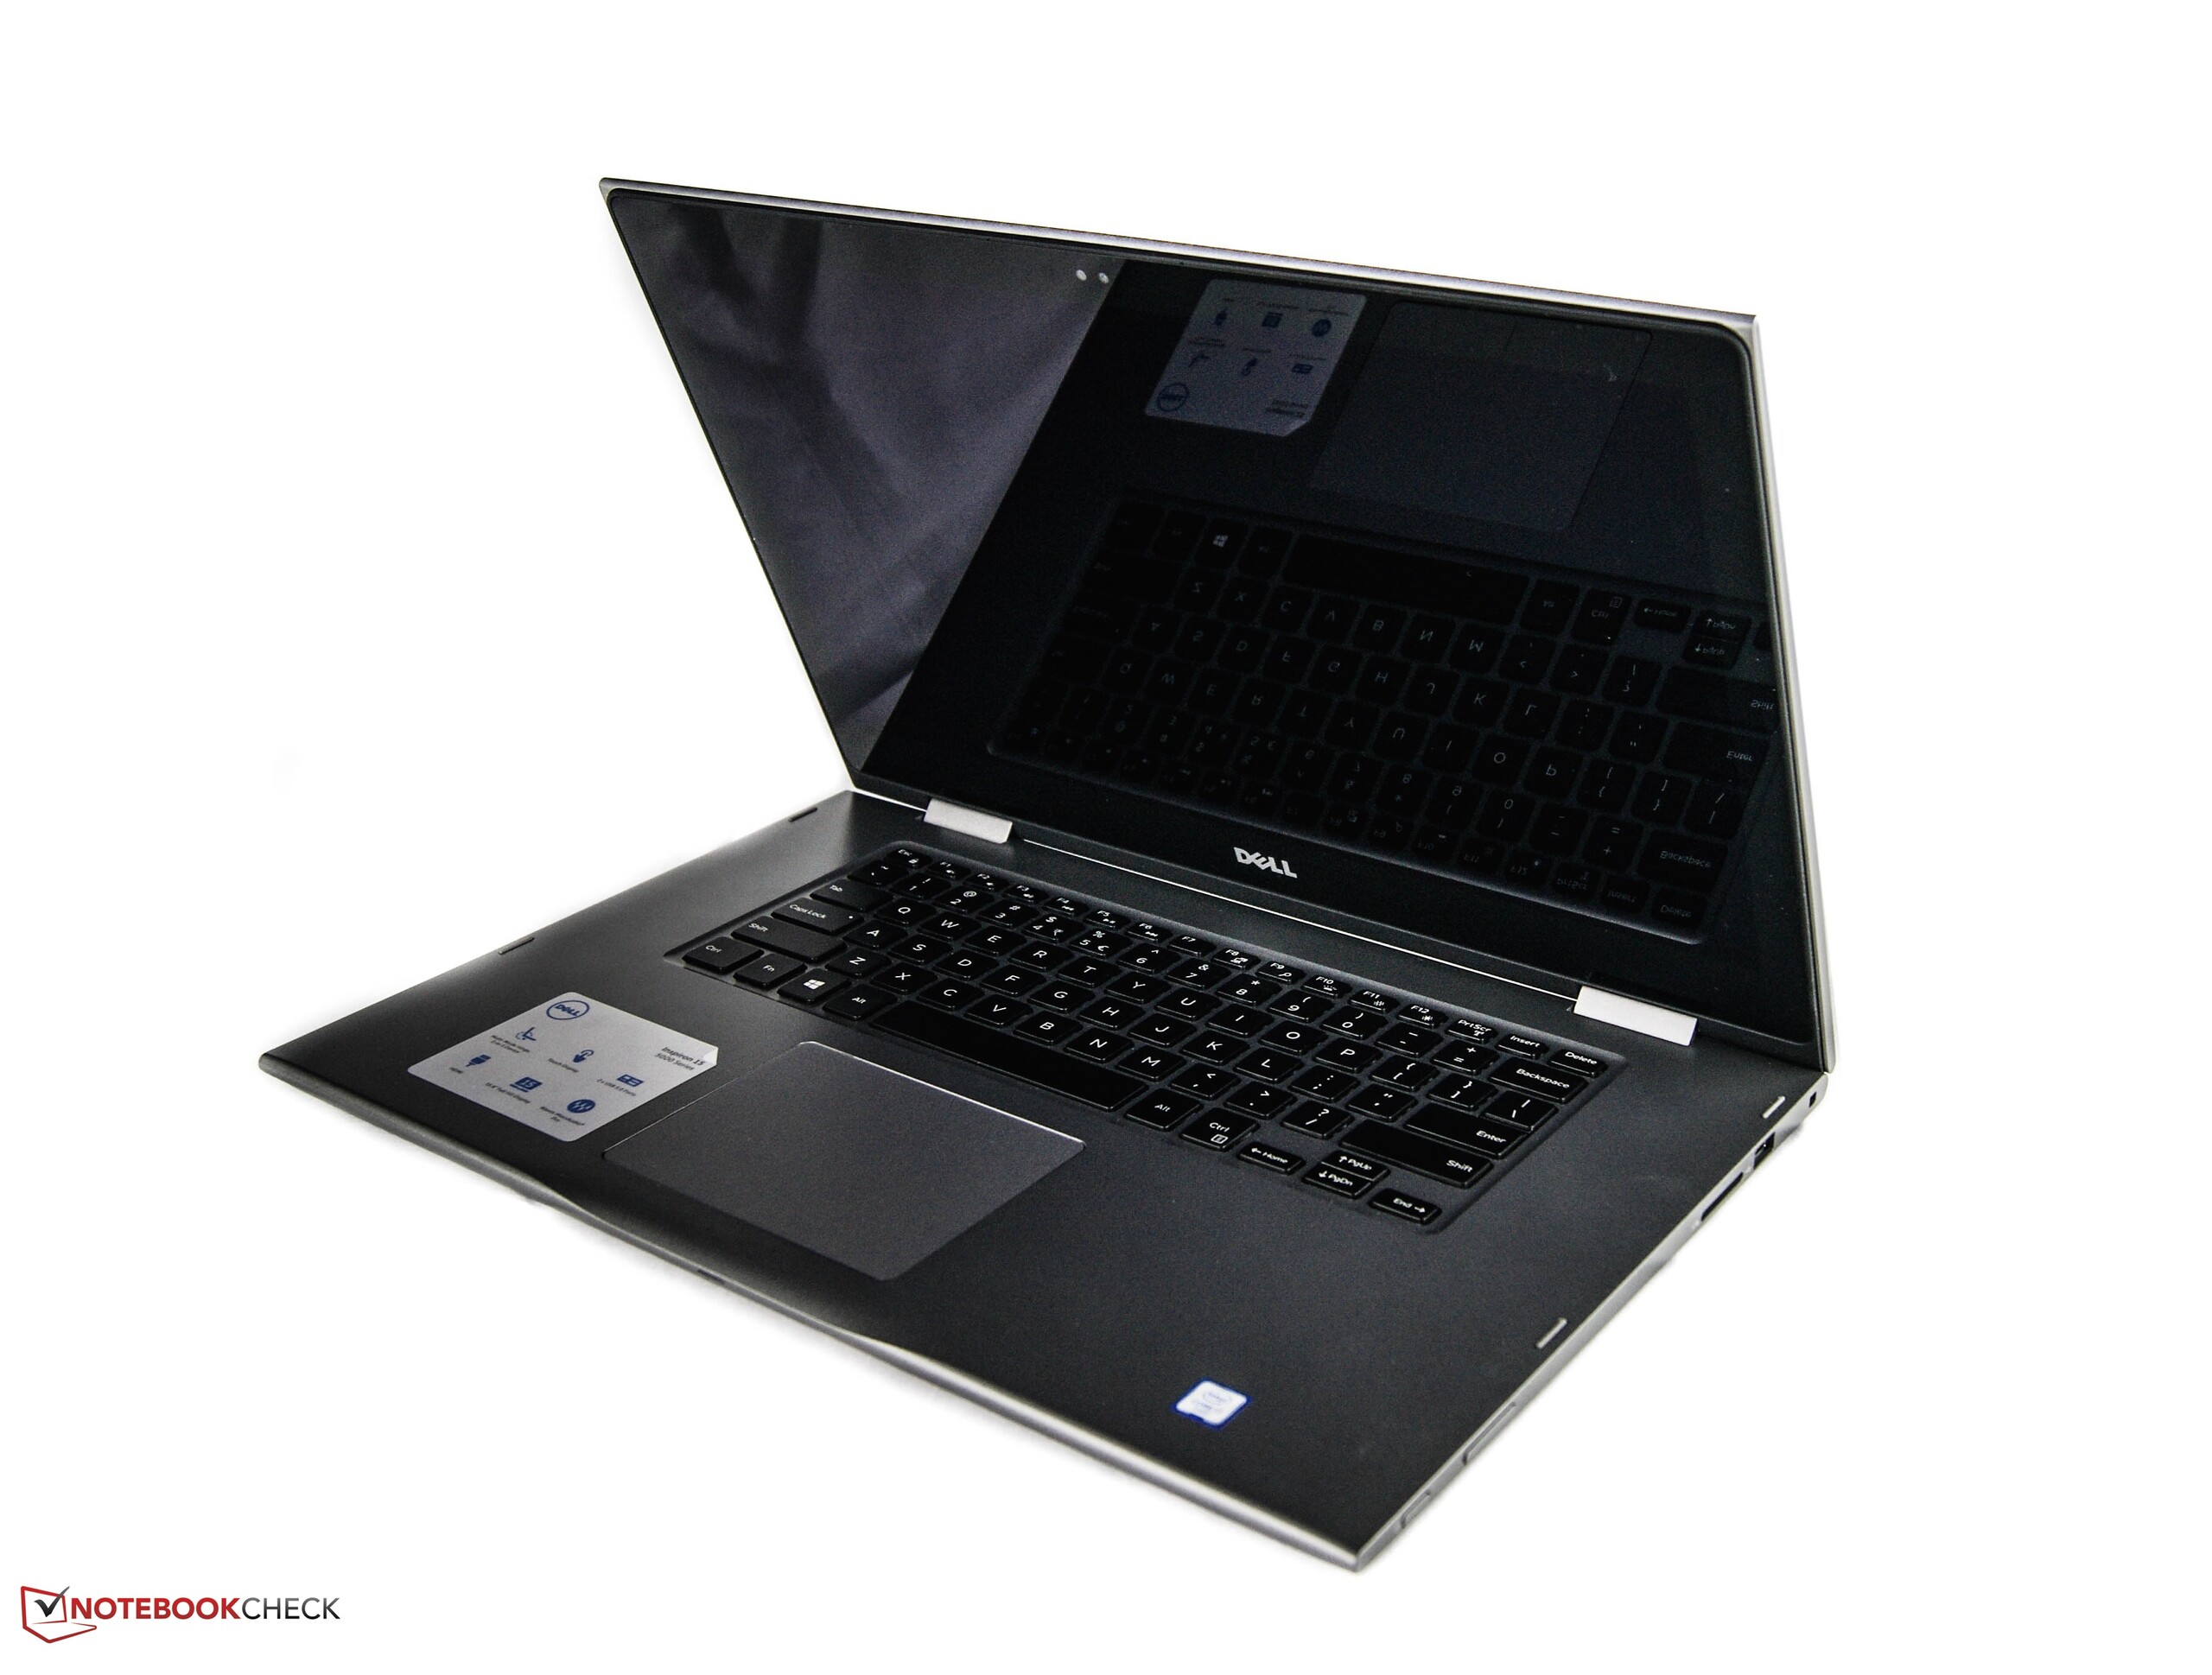
Para cumplir los requisitos de un convertible, el dispositivo debería ir equipado con un buen equilibrio de rendimiento, construcción de primera y movilidad. Aparte de ciertas excepciones menores, Dell lo logra en su nuevo Inspiron 15 5568. La carcasa puede sobresalir de la competencia salvo por un par de debilidades menores. La buena calidad nos resulta particularmente positiva. Sólo la trasera del display debería ser más robusta y el peso y su distribución deberían mejorar en el futuro. No tenemos mucho de qué quejarnos con la pantalla; aunque algo más de brillo le iría bien. El siguiente criterio importante es el rendimiento y los tiempos de respuesta. Dado que Dell ha instalado exclusivamente hardware de alto rendimiento, nuestro modelo de pruebas pudo exhibirse en las pruebas de sistema. Sin embargo, esto tiene un impacto en el desarrollo de temperatura. El calor está demasiado ligado a un lado, por lo que el Inspiron se calienta mucho en un punto durante la carga permanente. Lo que es más, el aguante de la batería es algo corto, cuando es bastante superior en algunos oponentes.
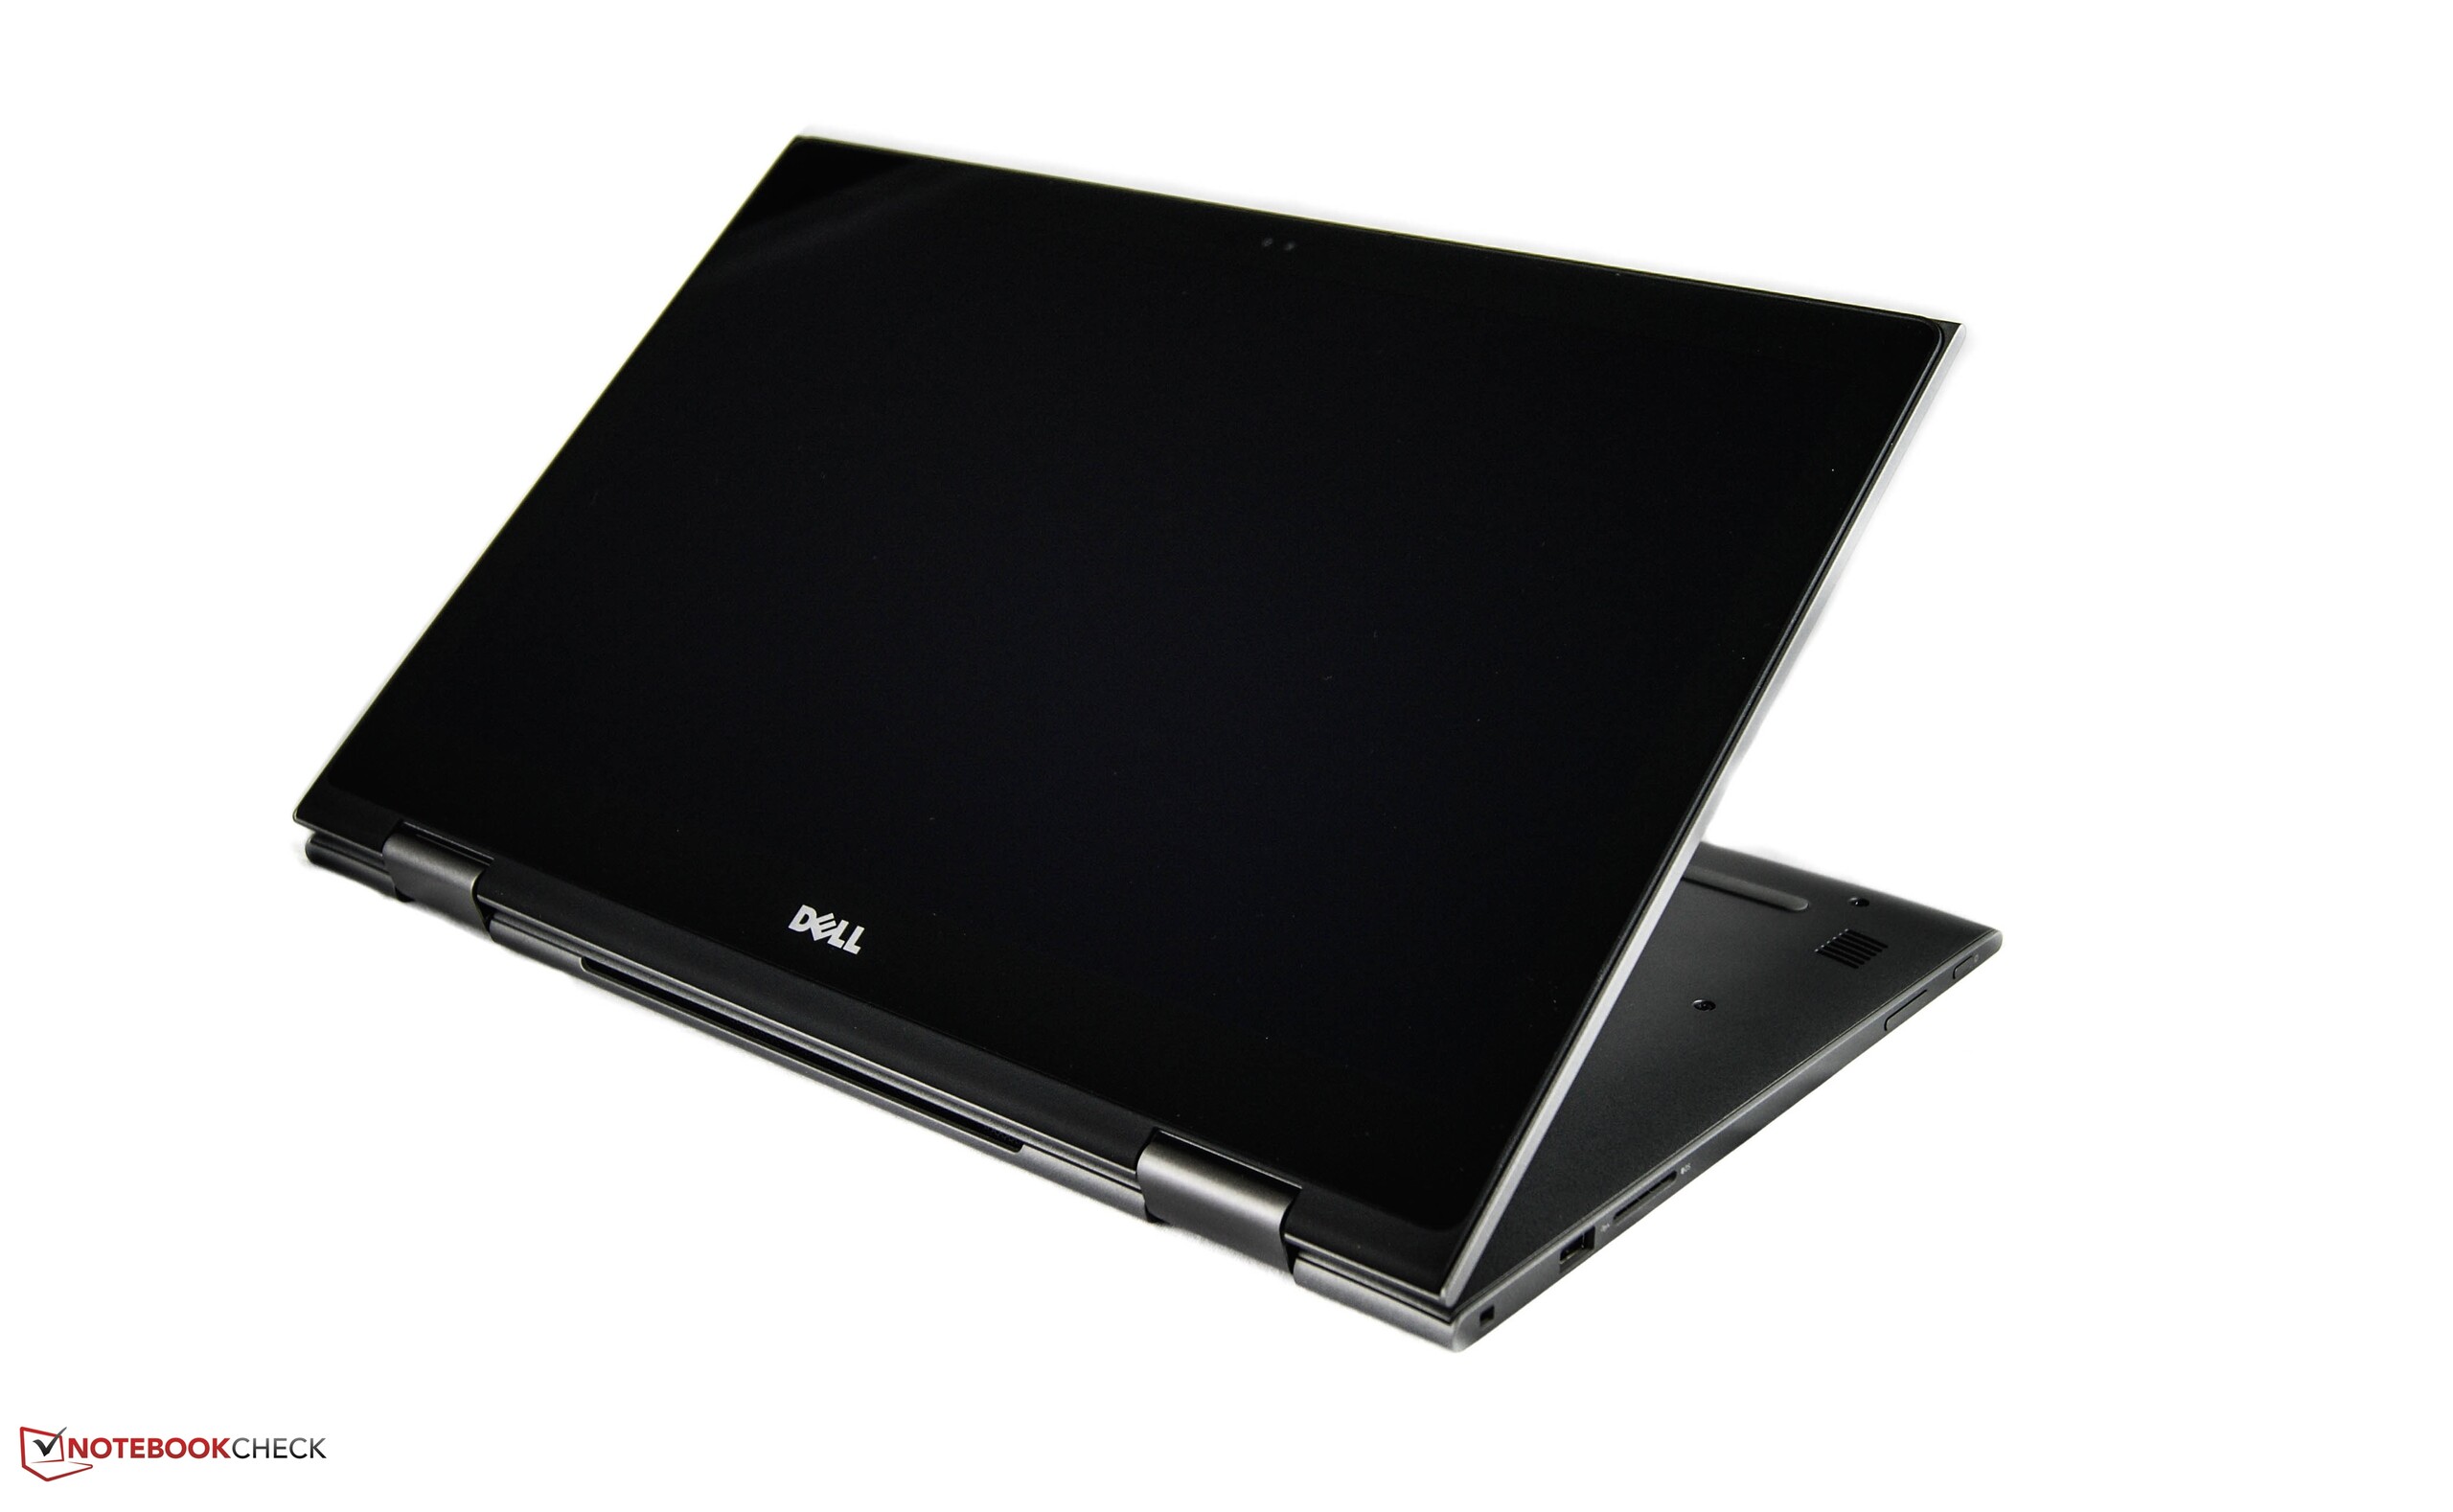
Los usuarios que busquen un convertible de 15" estiloso, versátil y siempre listo lo encontrarán en la nueva serie Dell Inspiron 5000.
Los compradores que no estén dispuestos a gastar 1000 Euros también pueden echarlo un vistazo a la alternativa 200 Euros más barata de la línea. Tampoco debería pasar de la competencia. Un ejemplo a mencionar vuelve a ser el HP Spectre x360 que representa una opción interesante con una pantalla más brillante, más aguante de batería y un peso inferior.
Ésta es una versión acortada del análisis original. Puedes leer el análisis completo en inglés aquí.
Dell Inspiron 15 5568
- 07/19/2016 v5.1 (old)
Nino Ricchizzi