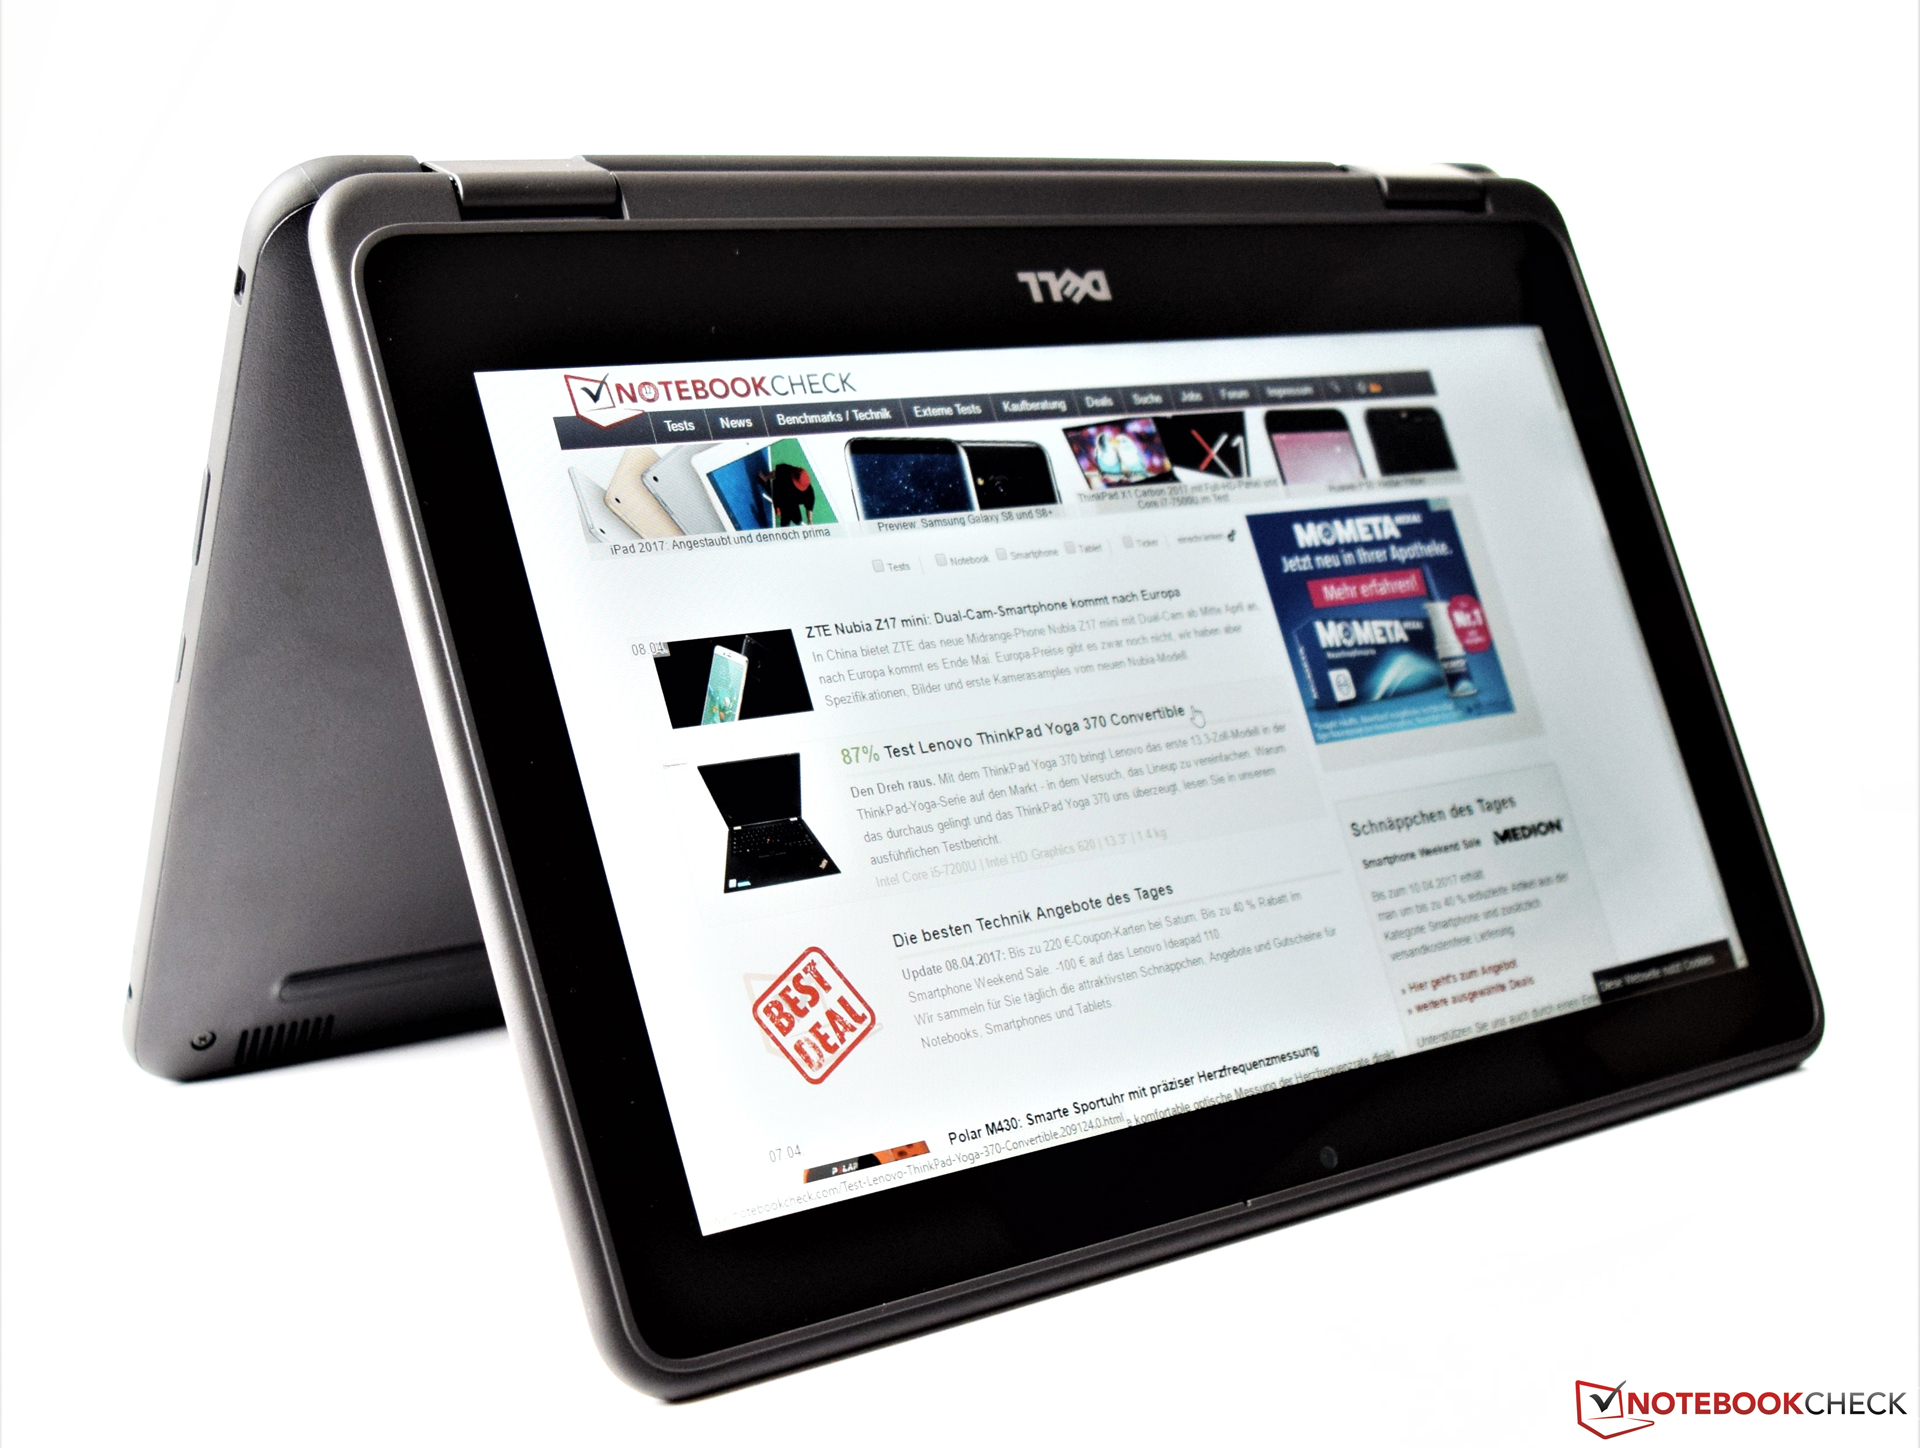
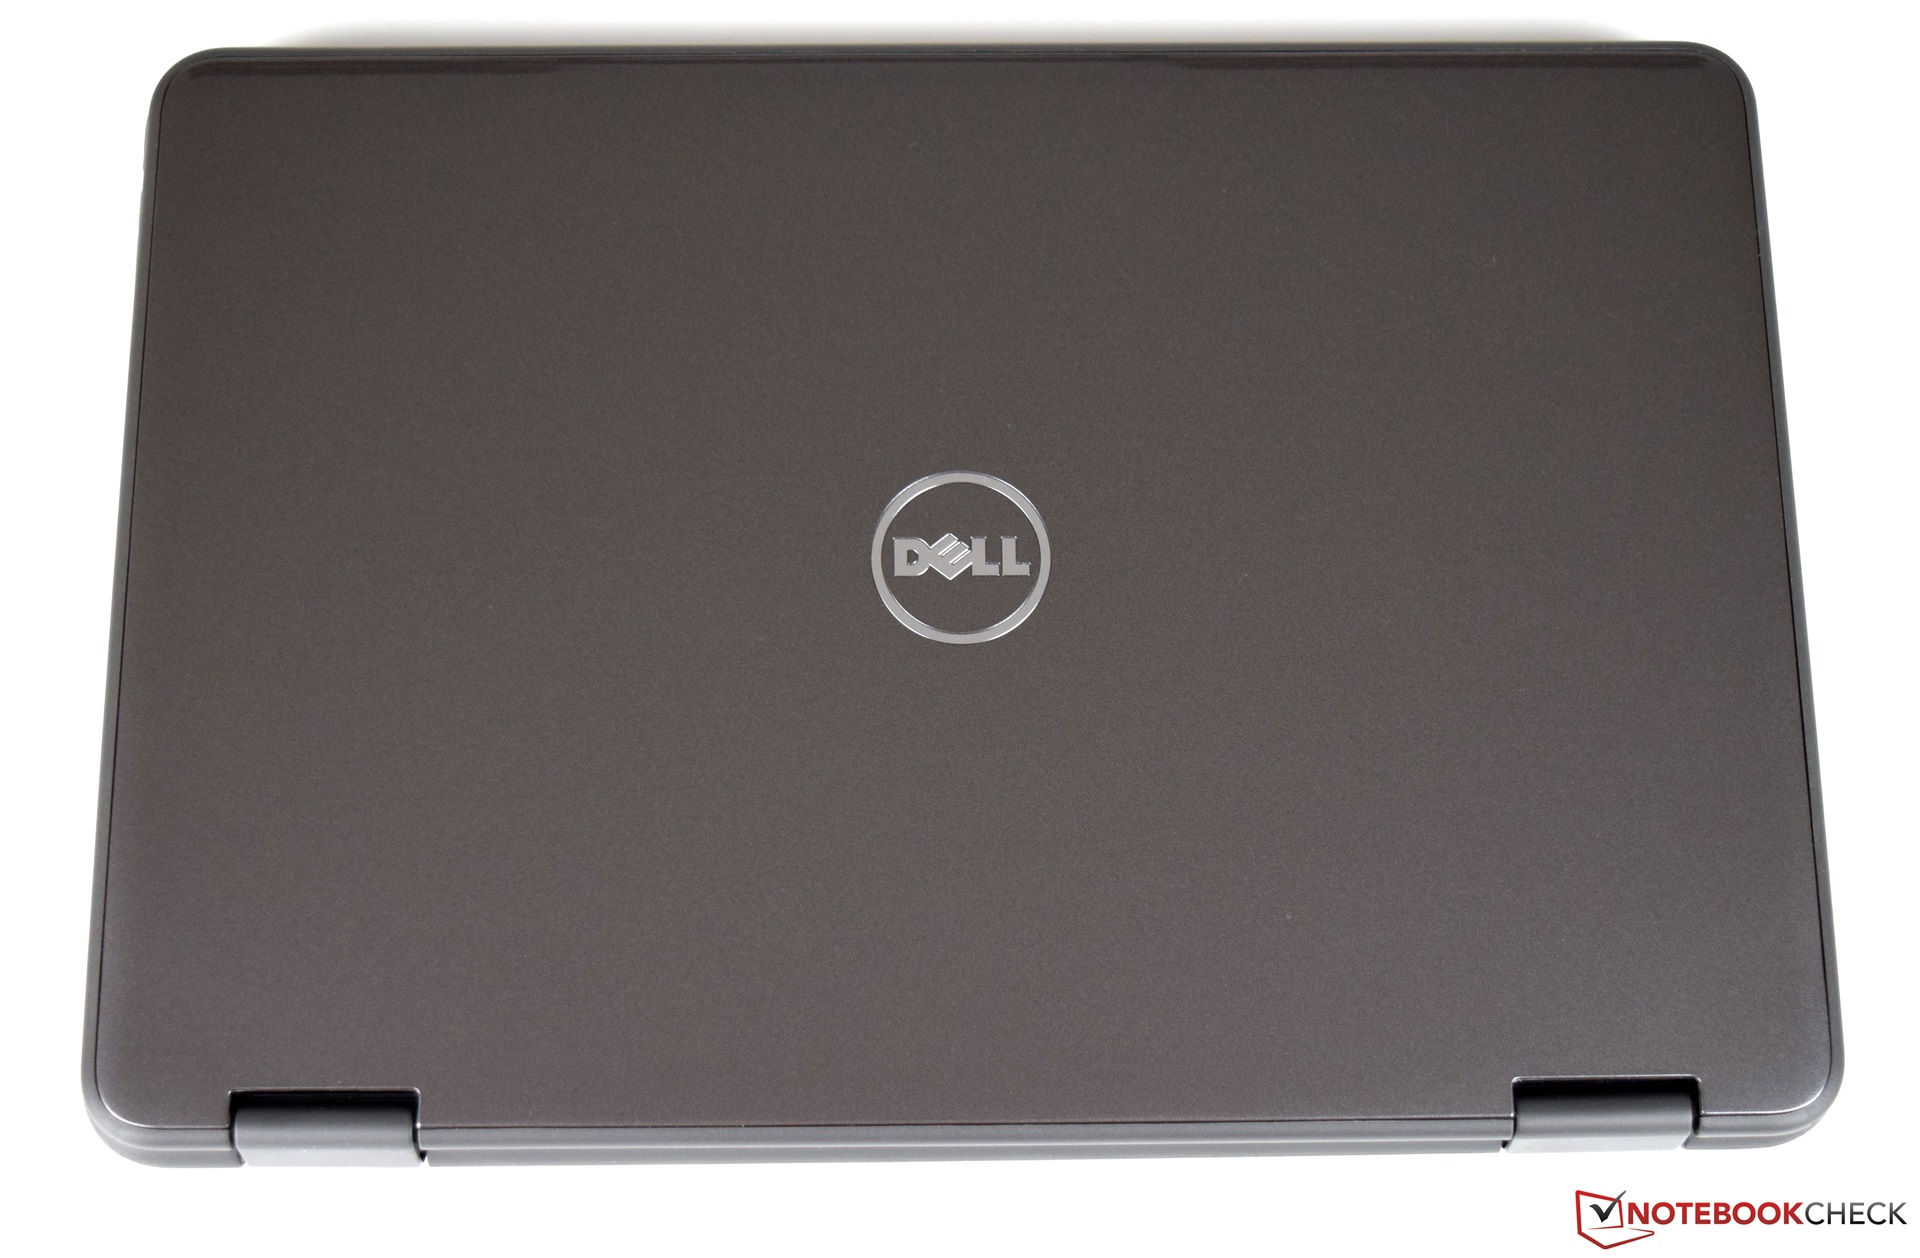
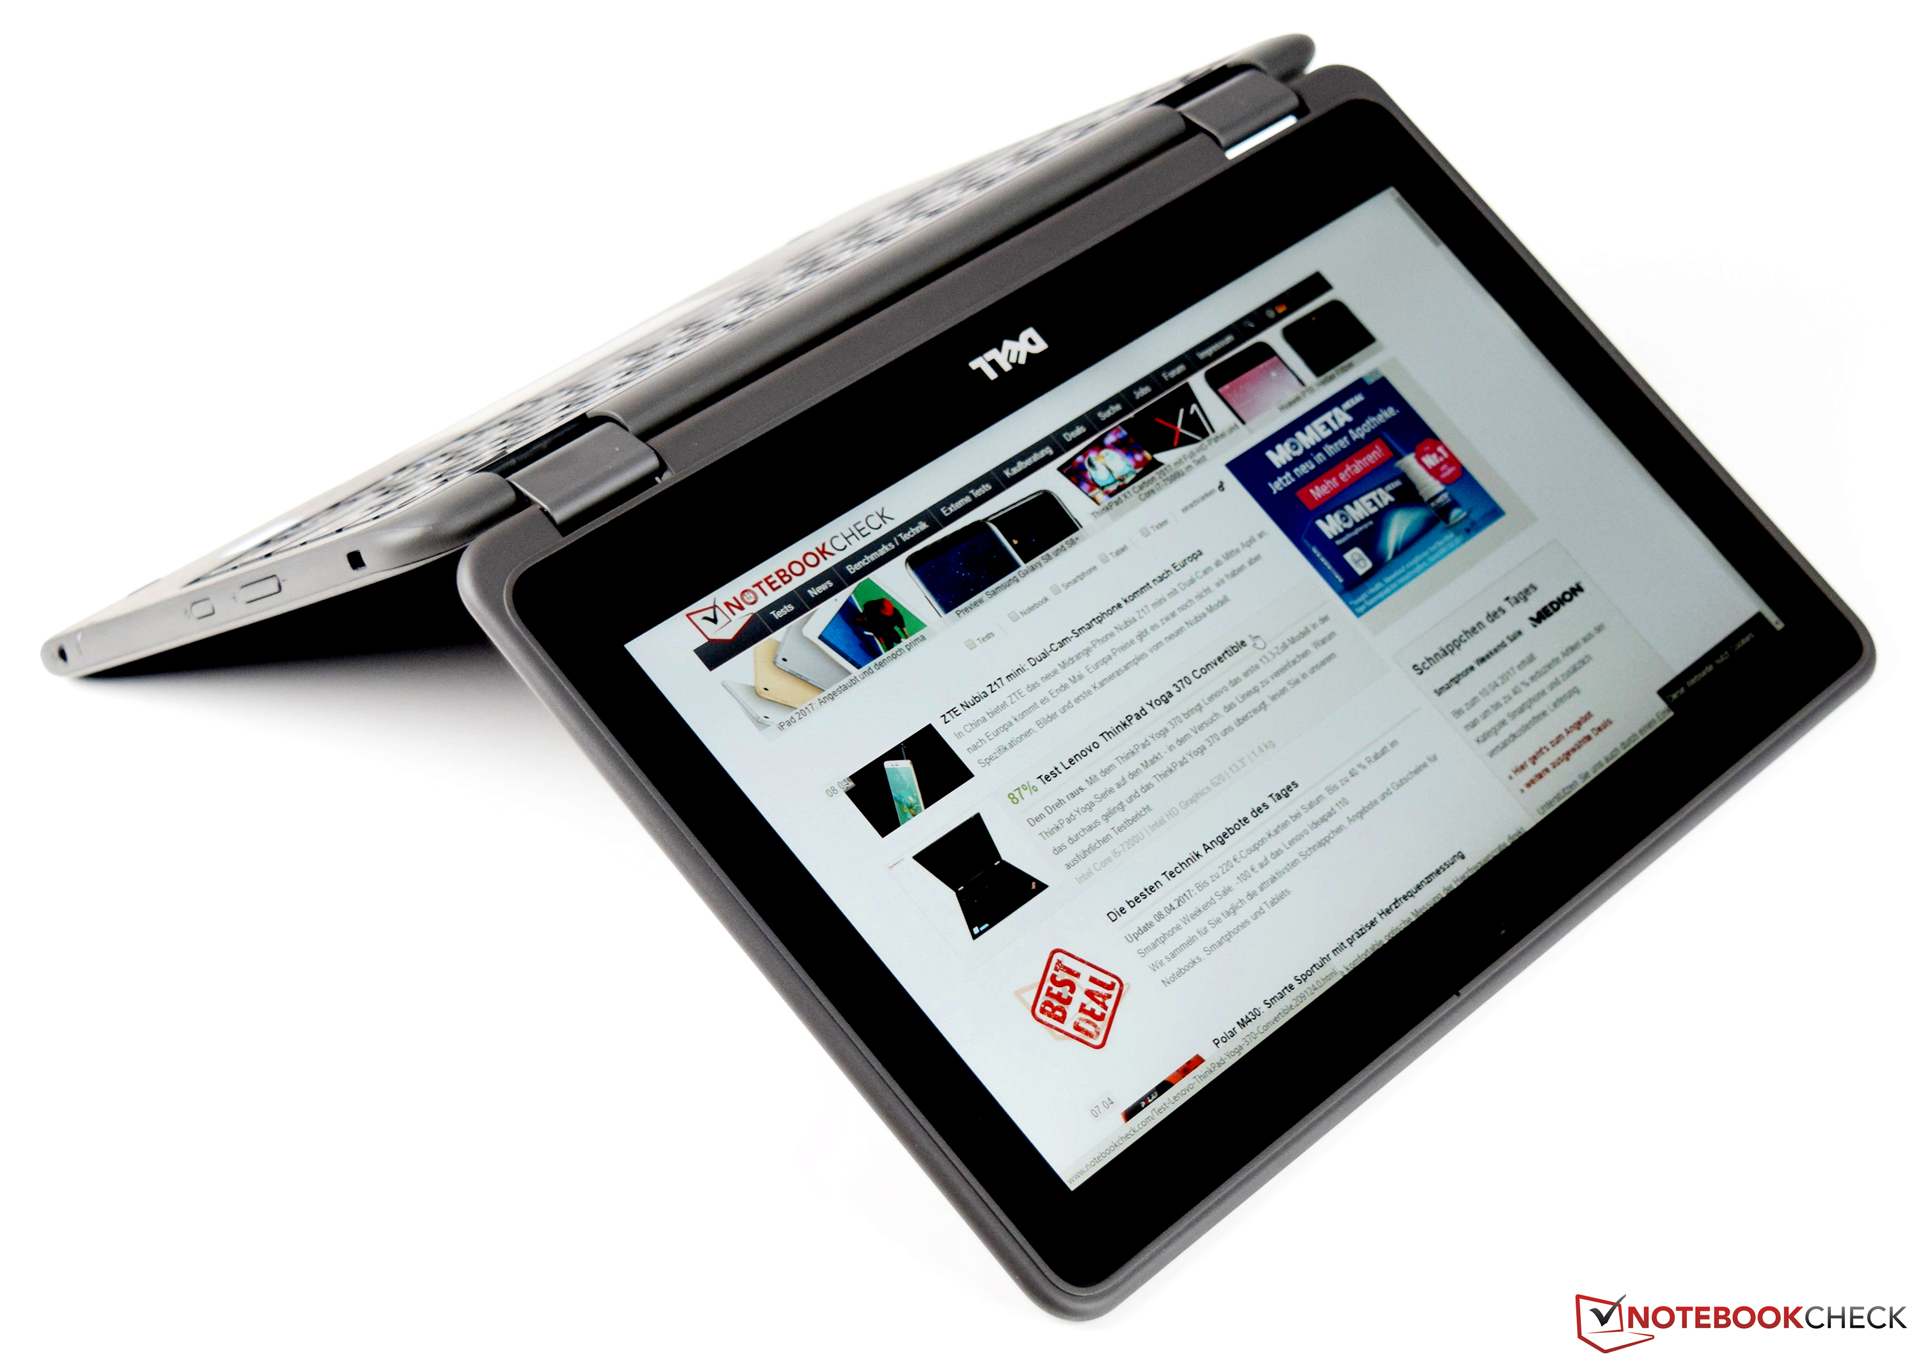
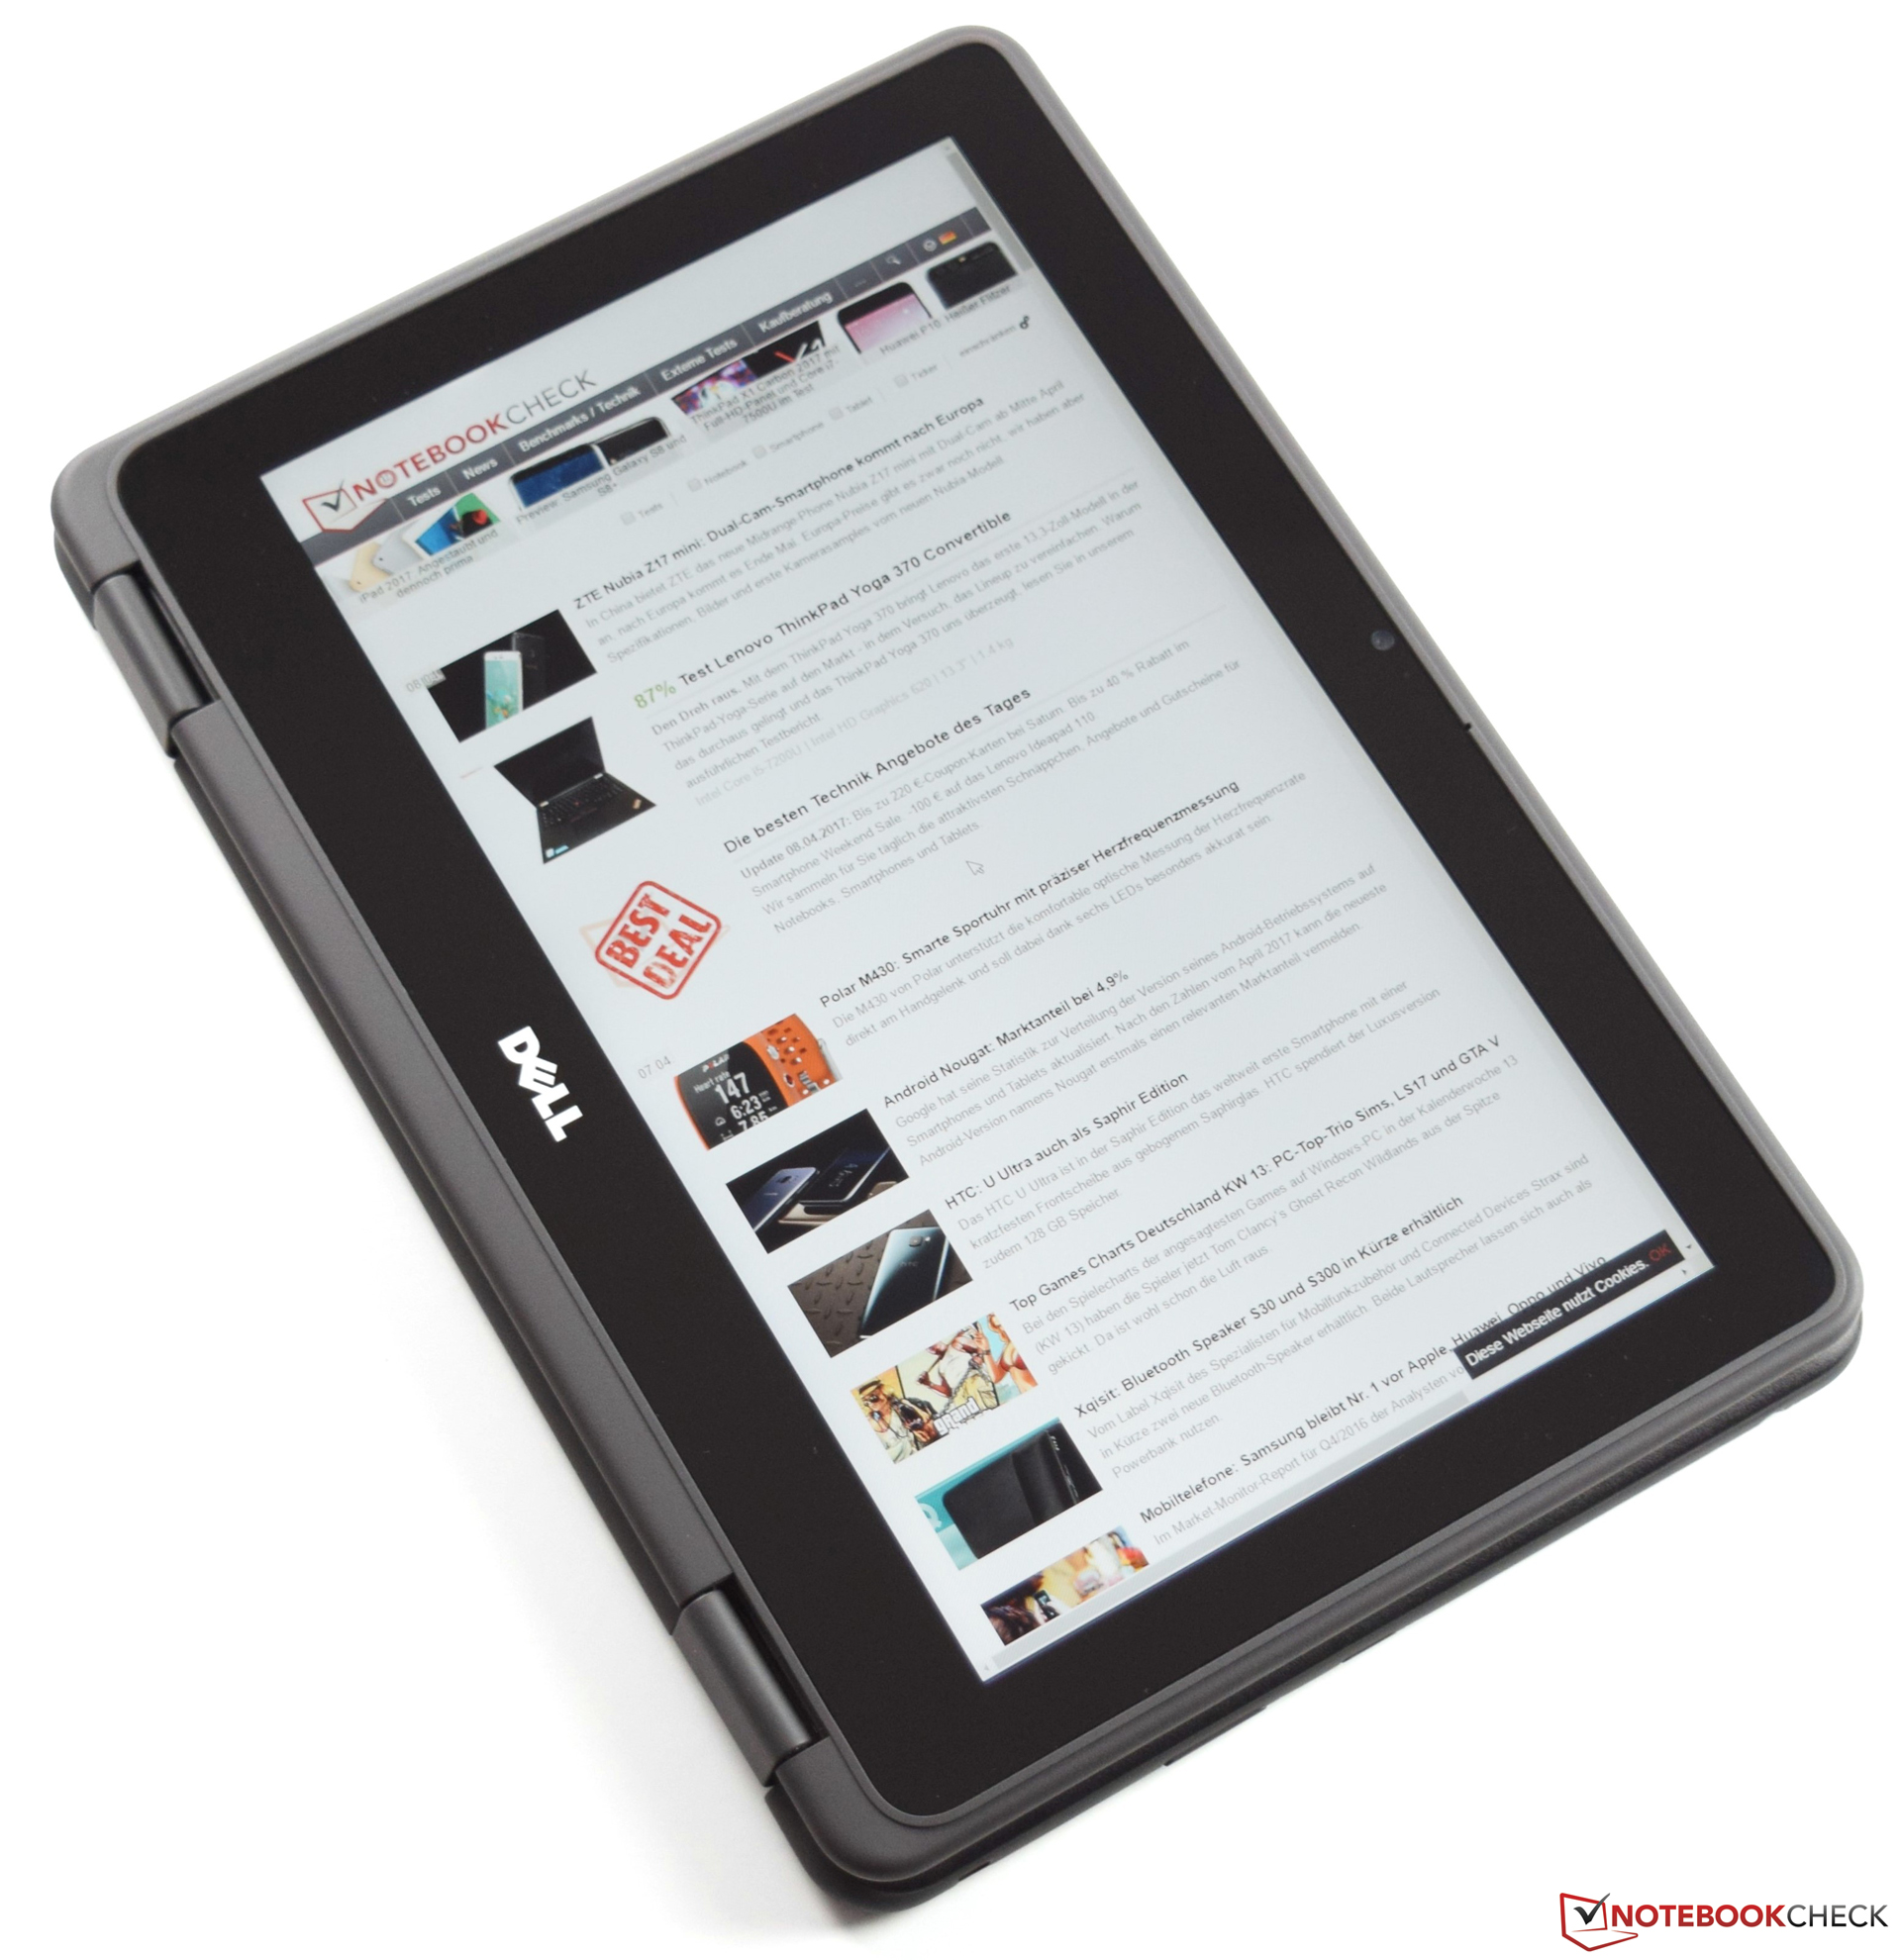
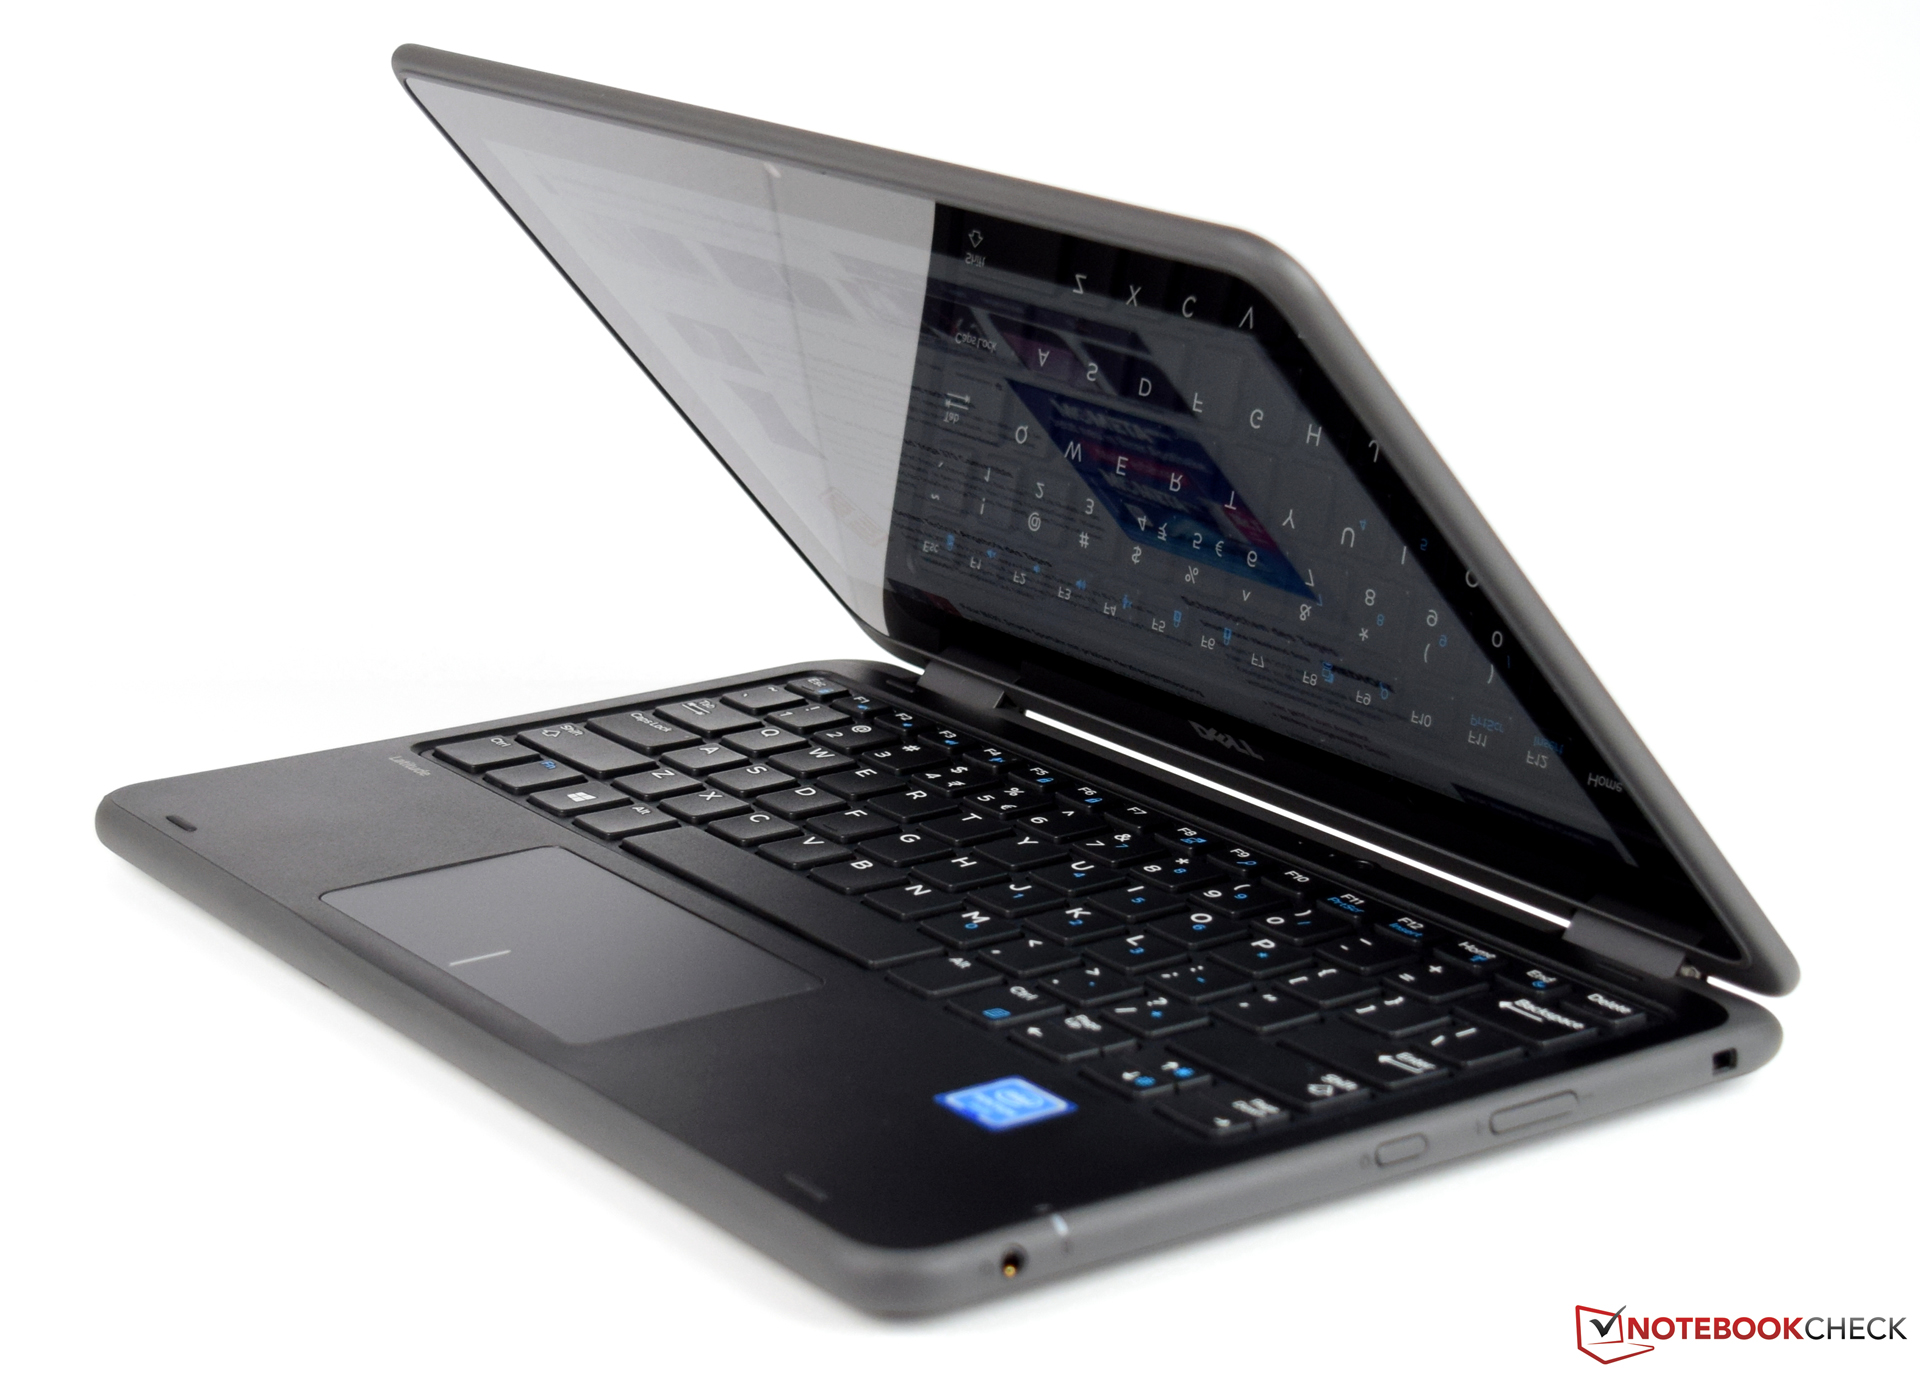
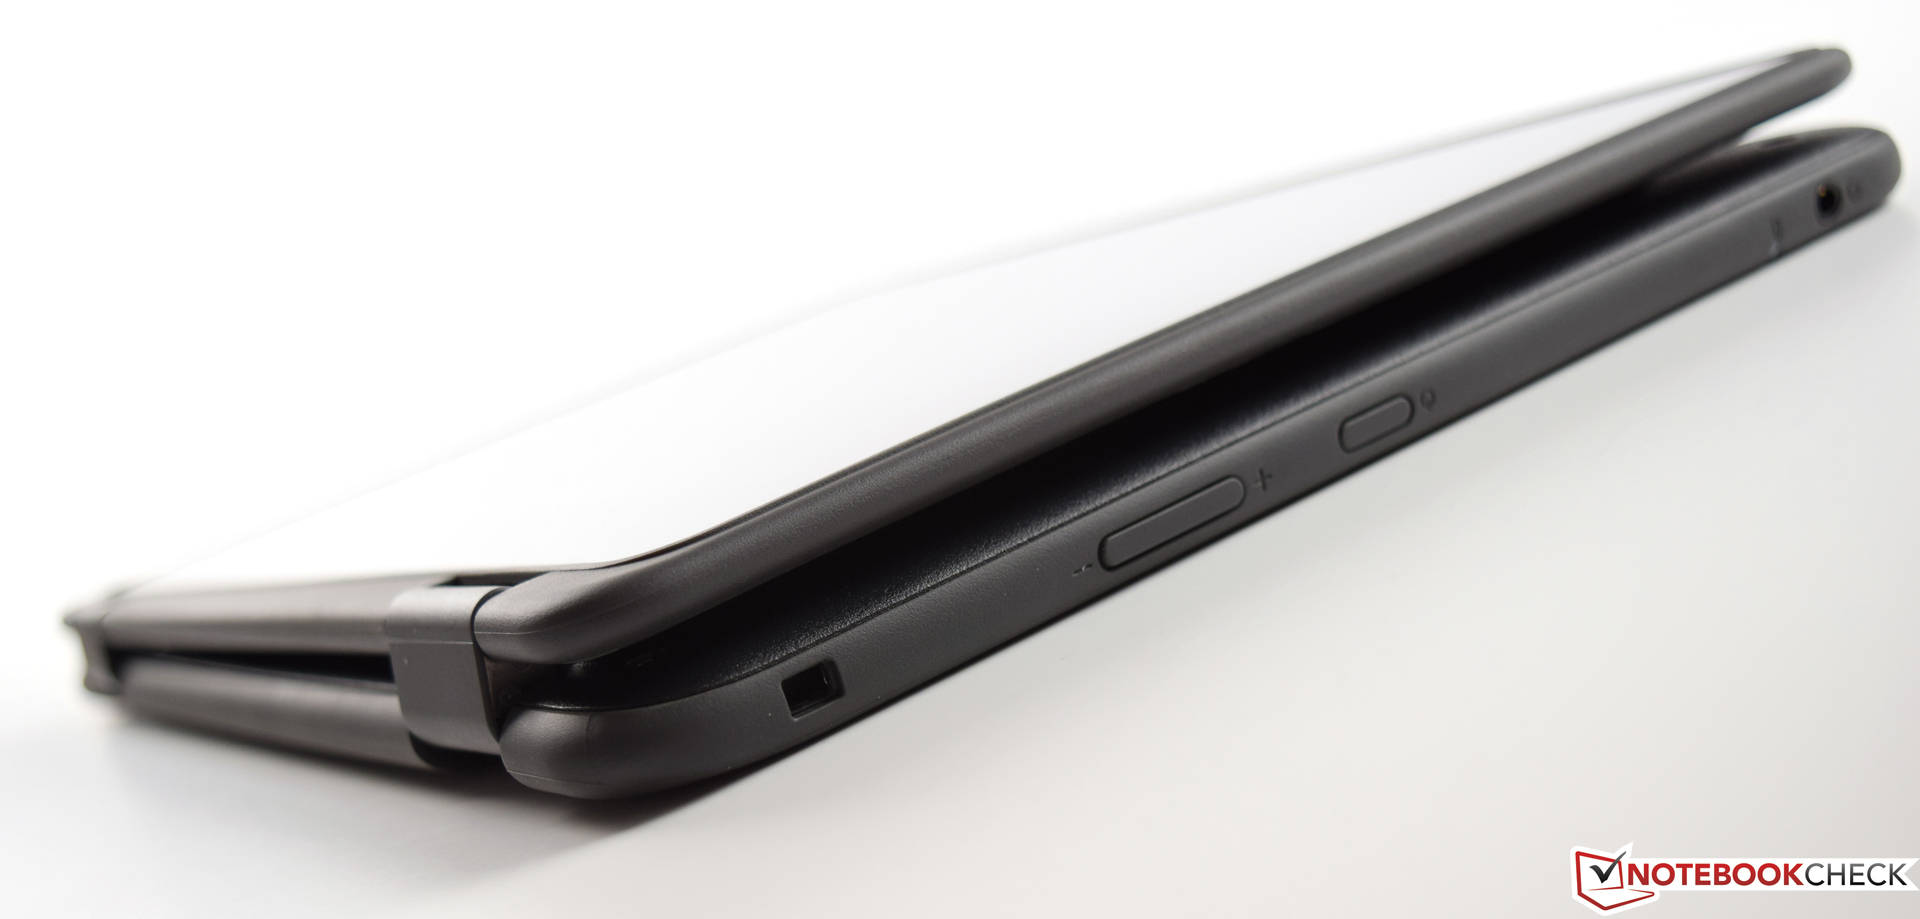
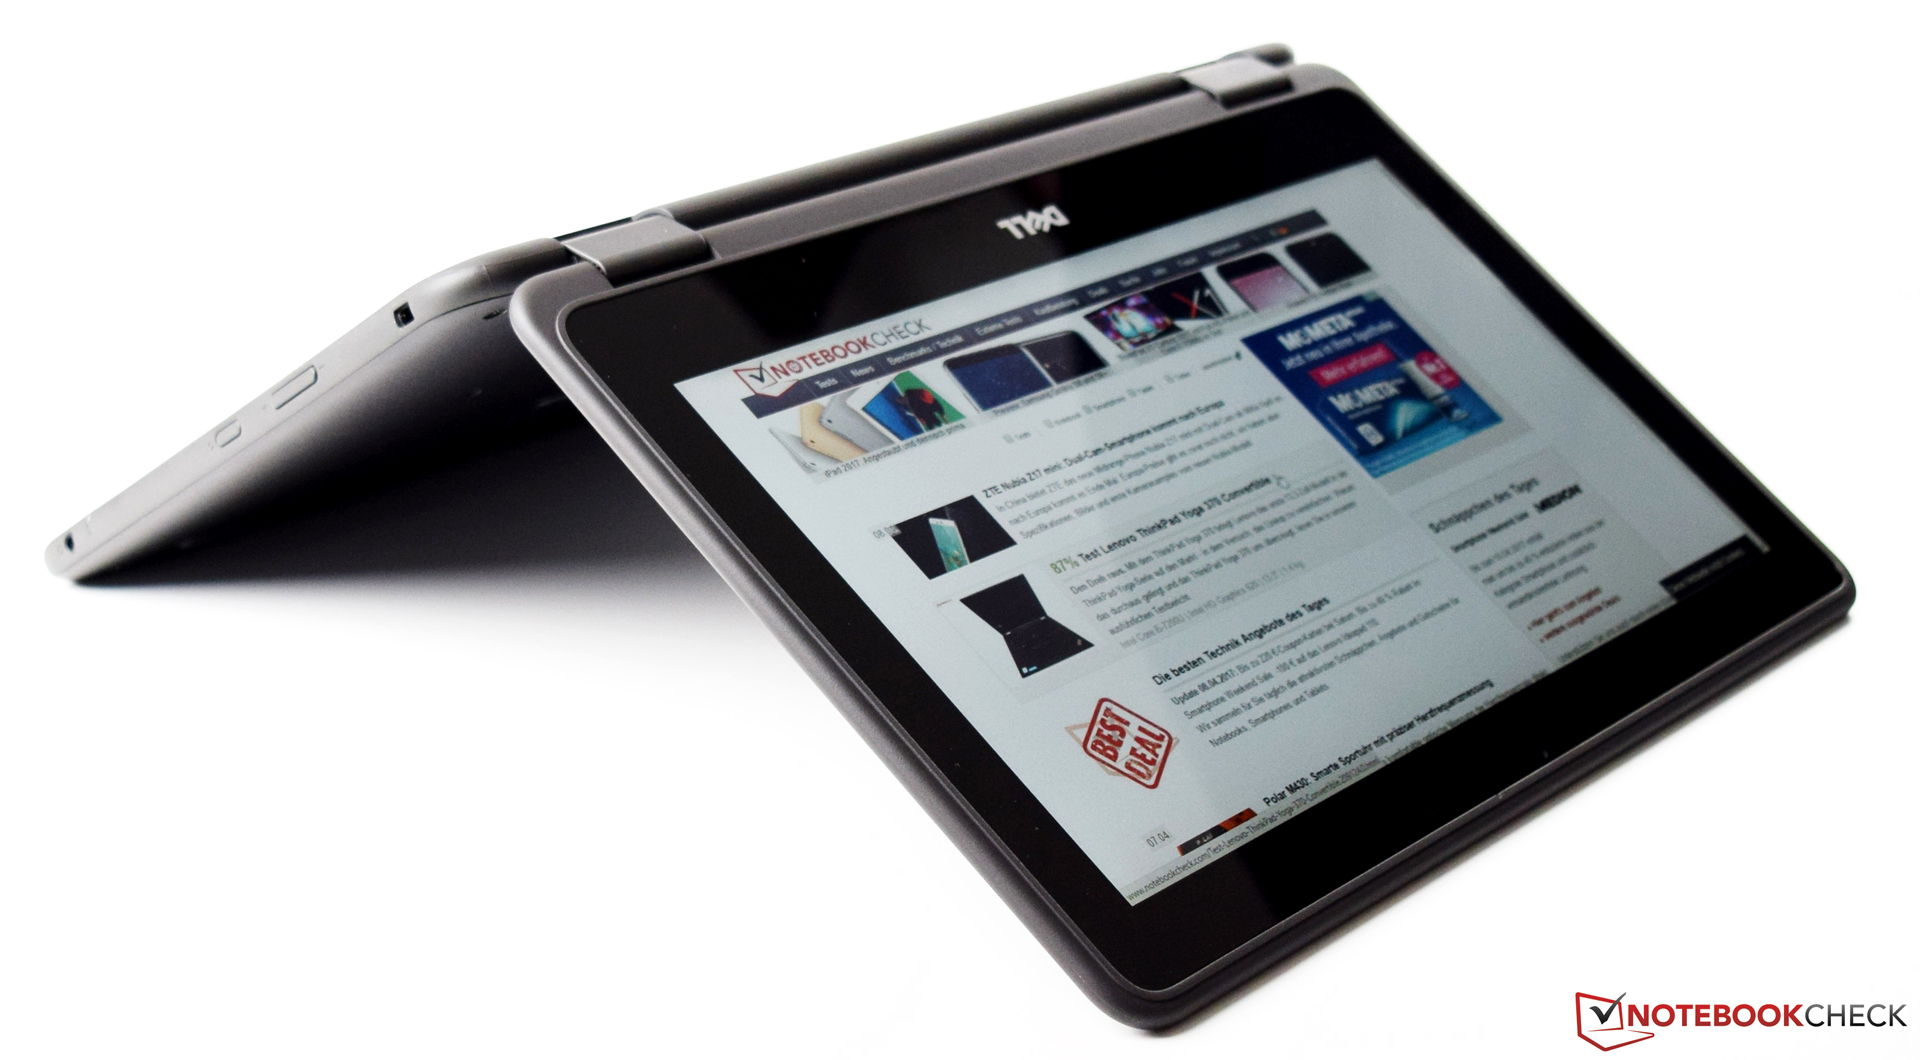
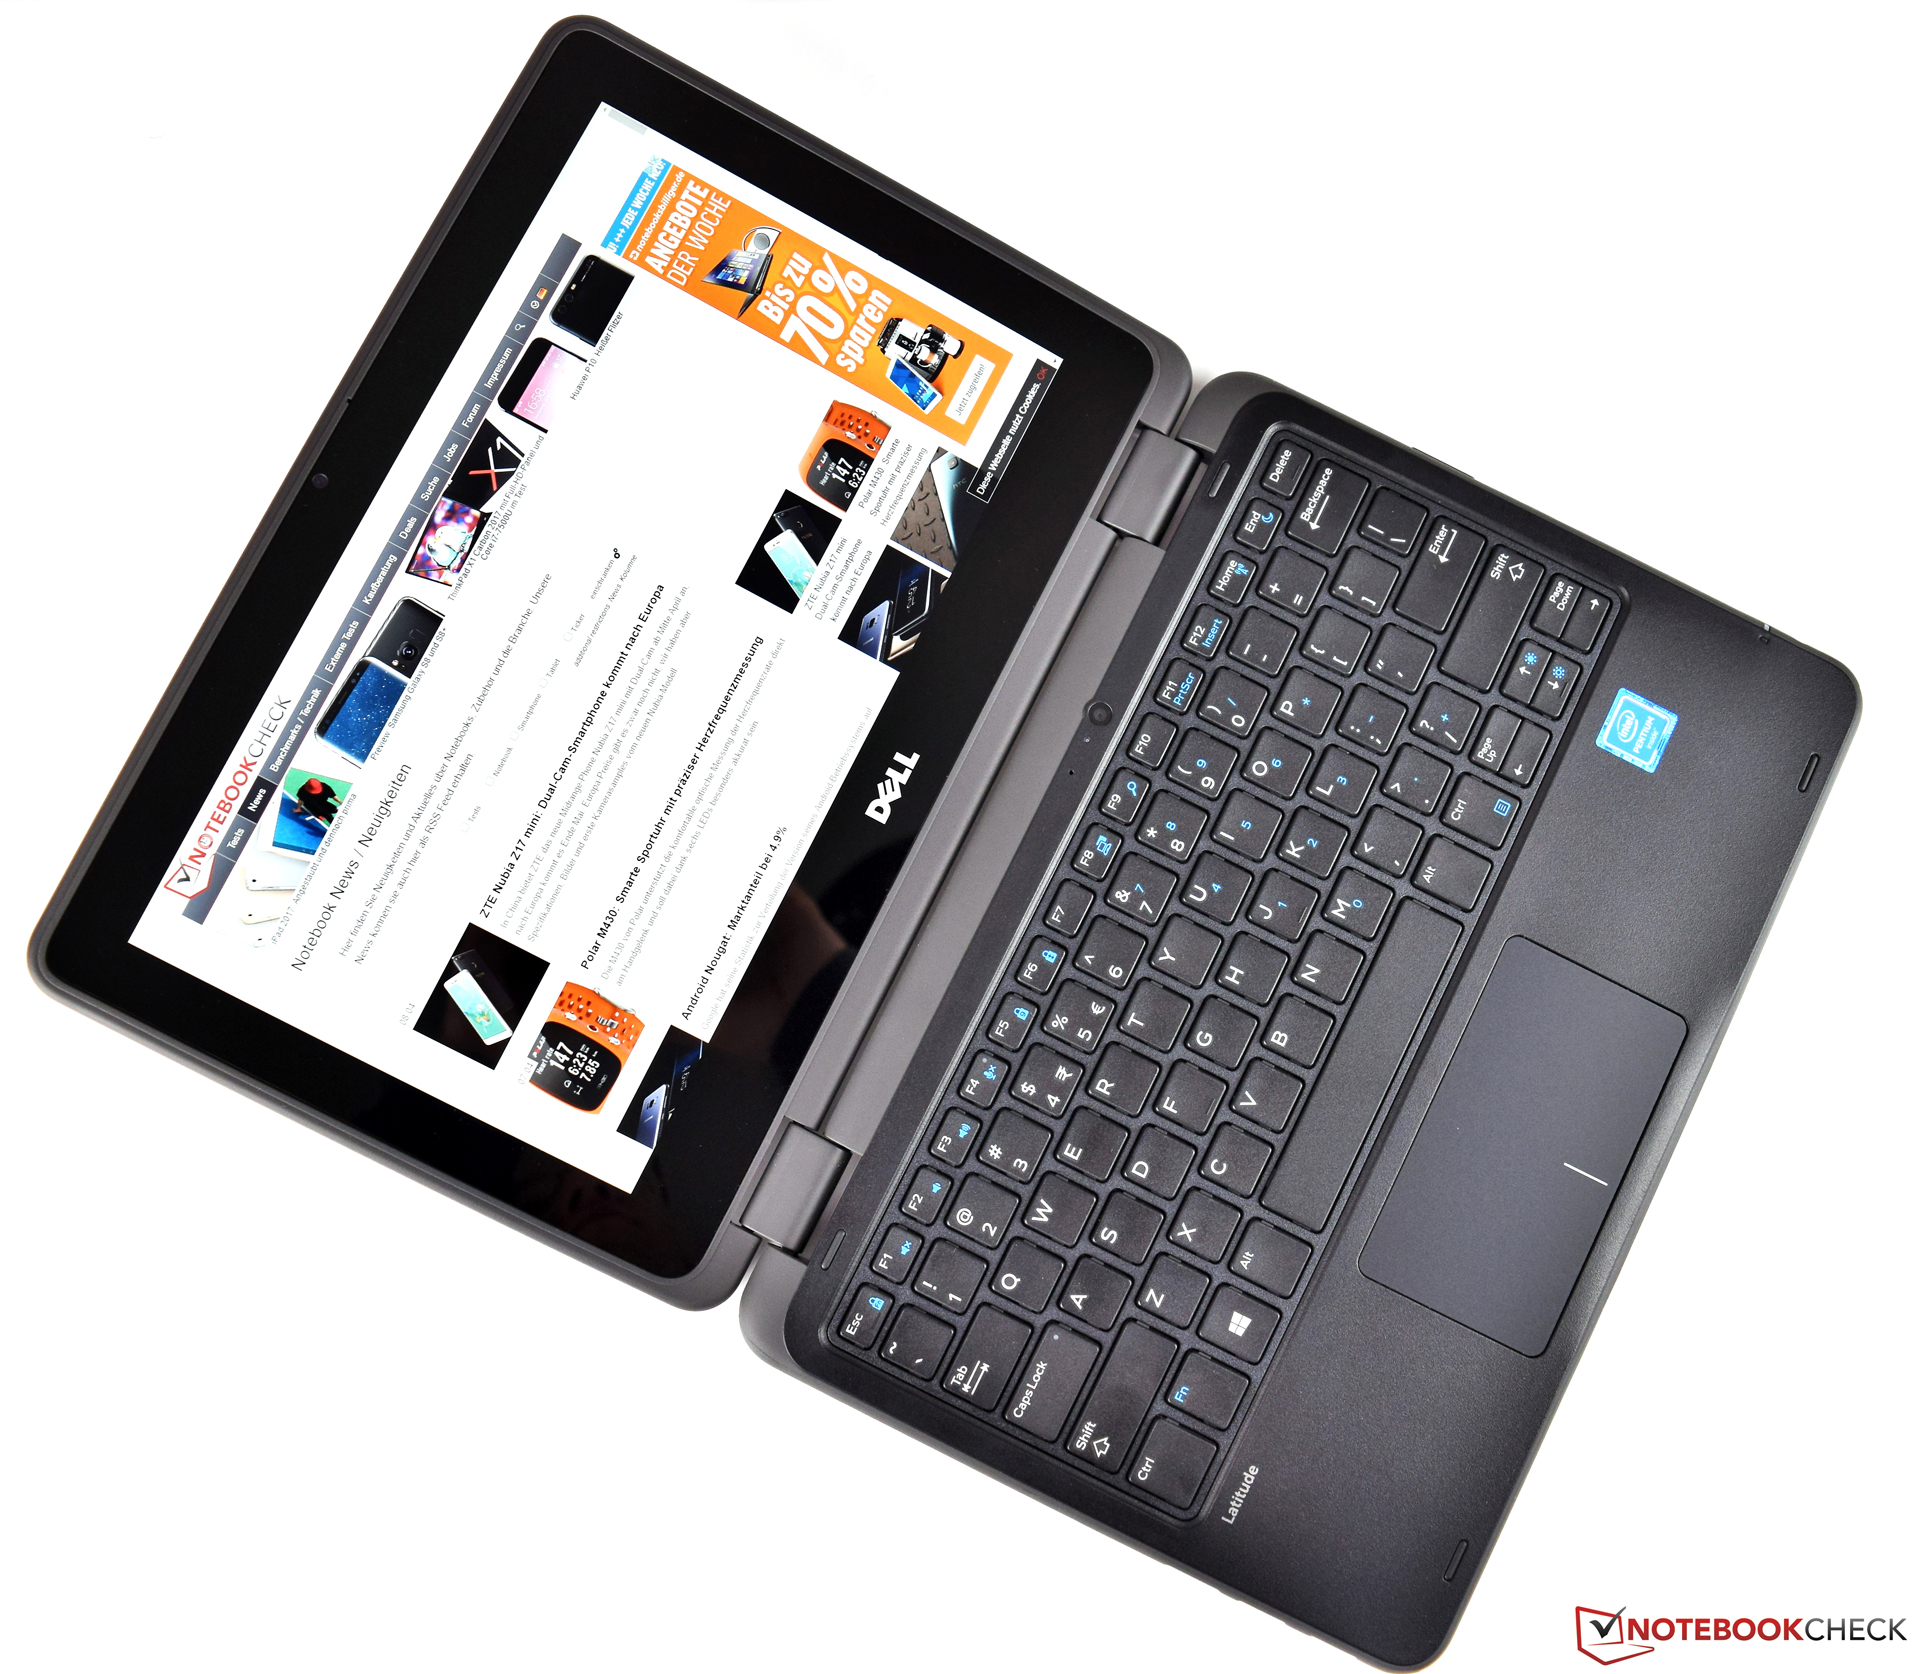
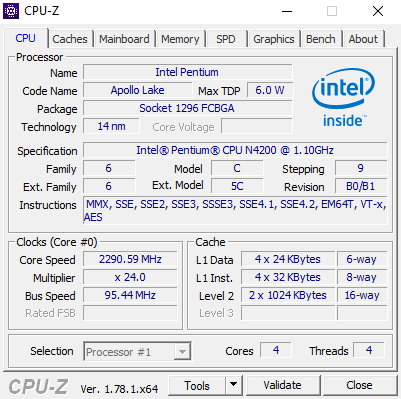
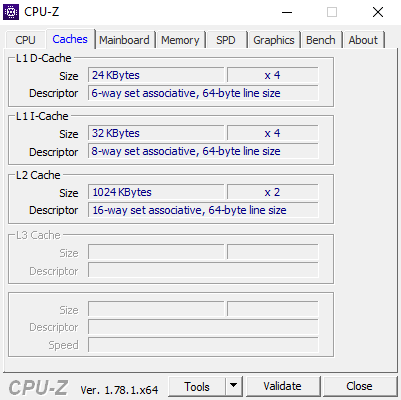
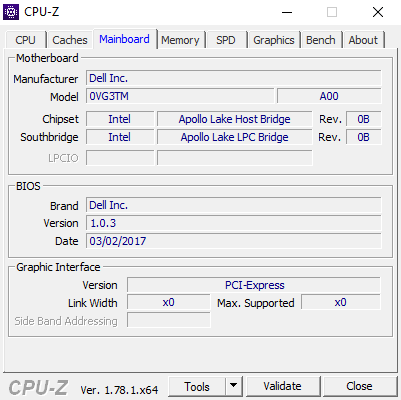
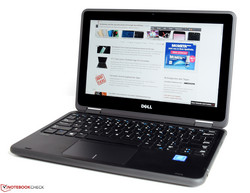
Breve análisis del Convertible Dell Latitude 3189 (N4200, HD)


| SD Card Reader | |
| average JPG Copy Test (av. of 3 runs) | |
| HP Pavilion x360 13-u102ng | |
| Dell Latitude 3189 | |
| HP Pavilion 11-k103ng x360 | |
| Lenovo Yoga 700-11ISK | |
| maximum AS SSD Seq Read Test (1GB) | |
| HP Pavilion x360 13-u102ng | |
| Dell Latitude 3189 | |
| HP Pavilion 11-k103ng x360 | |
| Lenovo Yoga 700-11ISK | |
| Networking | |
| iperf3 transmit AX12 | |
| Medion Akoya P3401T 2in1 | |
| Dell Latitude 3189 | |
| iperf3 receive AX12 | |
| Dell Latitude 3189 | |
| Medion Akoya P3401T 2in1 | |
| |||||||||||||||||||||||||
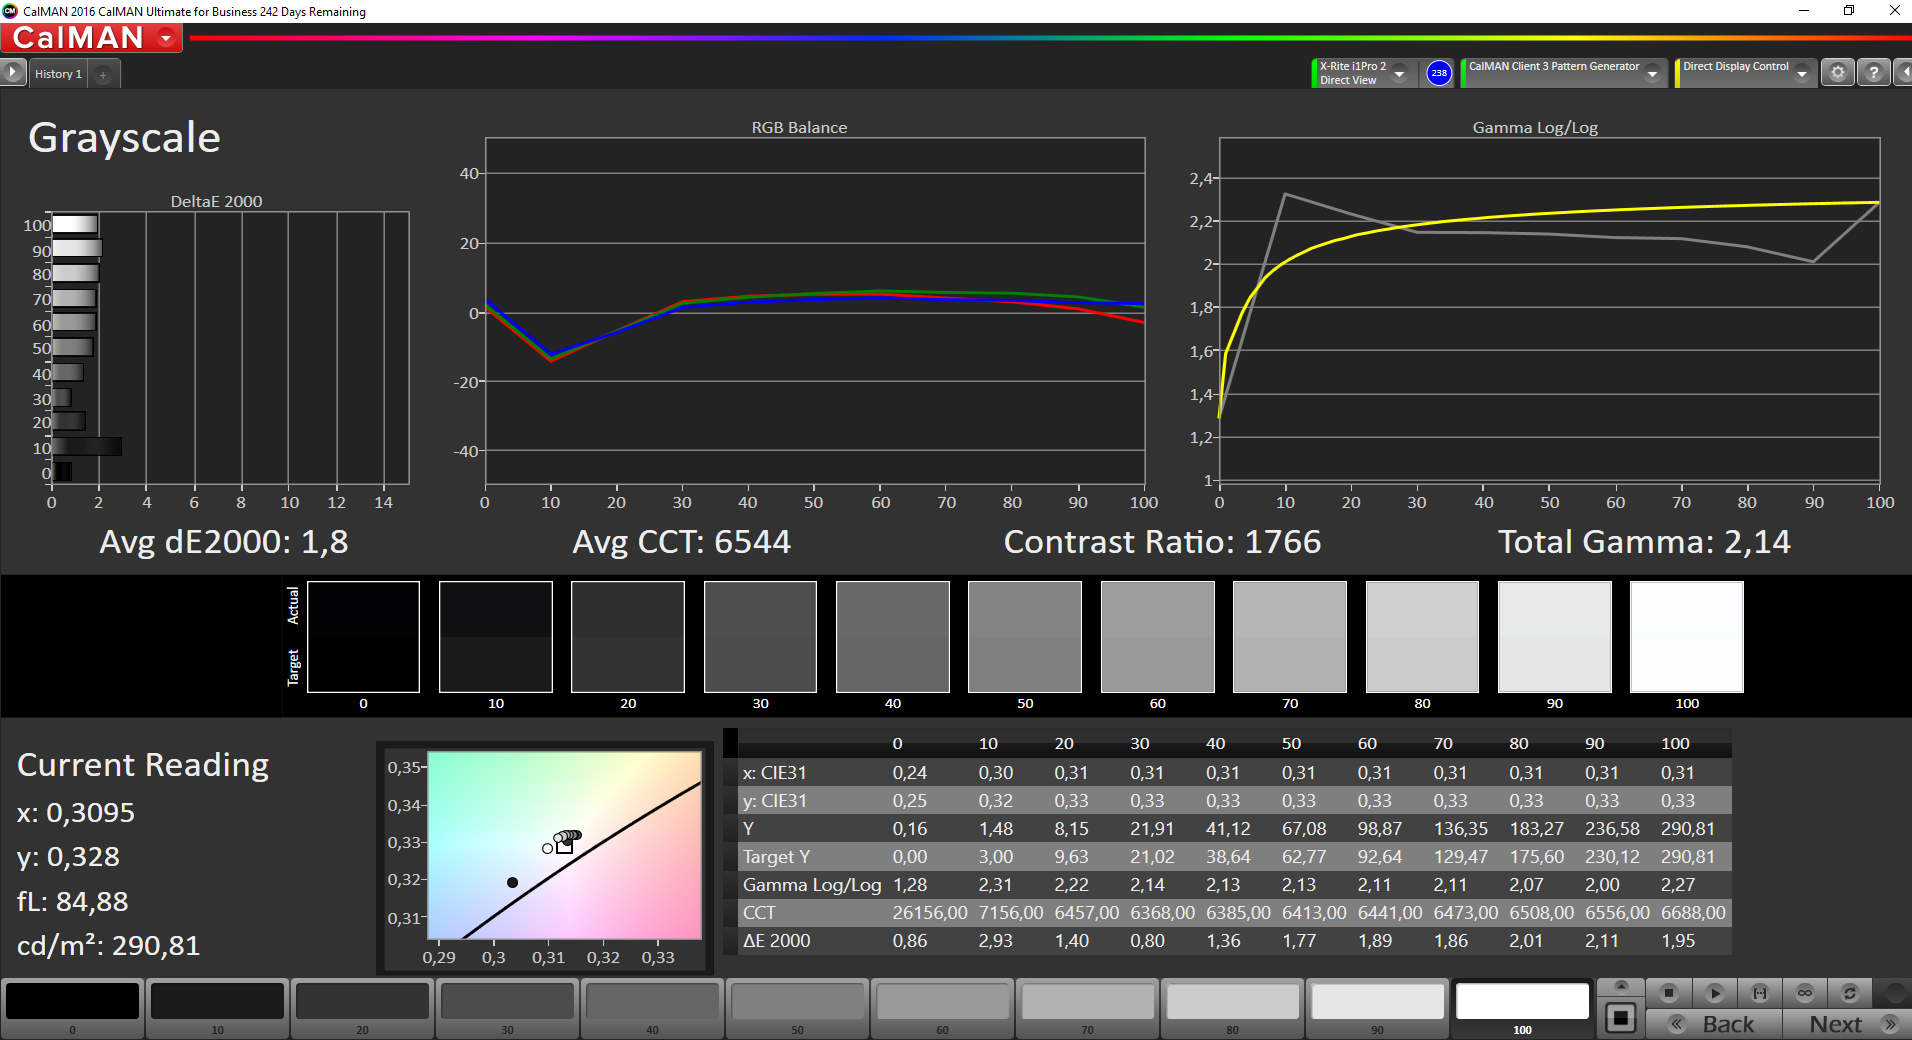
iluminación: 92 %
Brillo con batería: 291 cd/m²
Contraste: 1819:1 (Negro: 0.16 cd/m²)
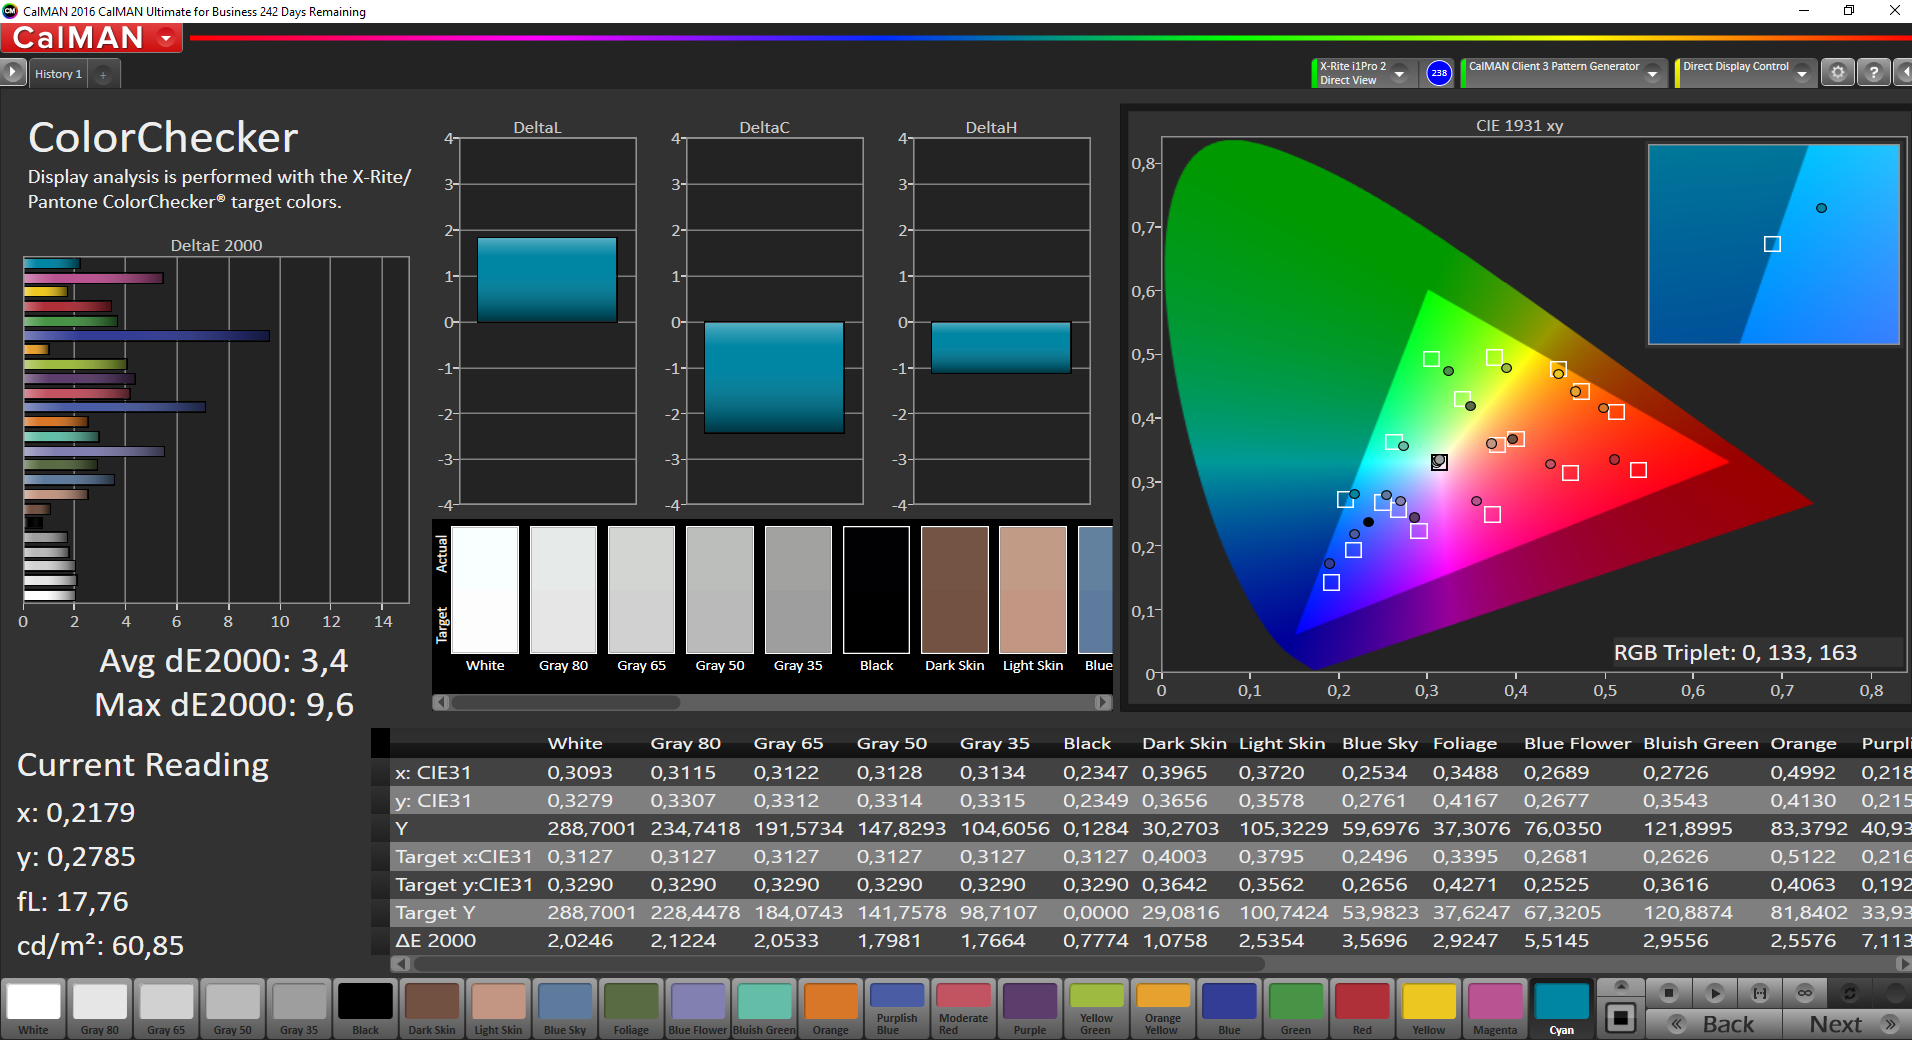
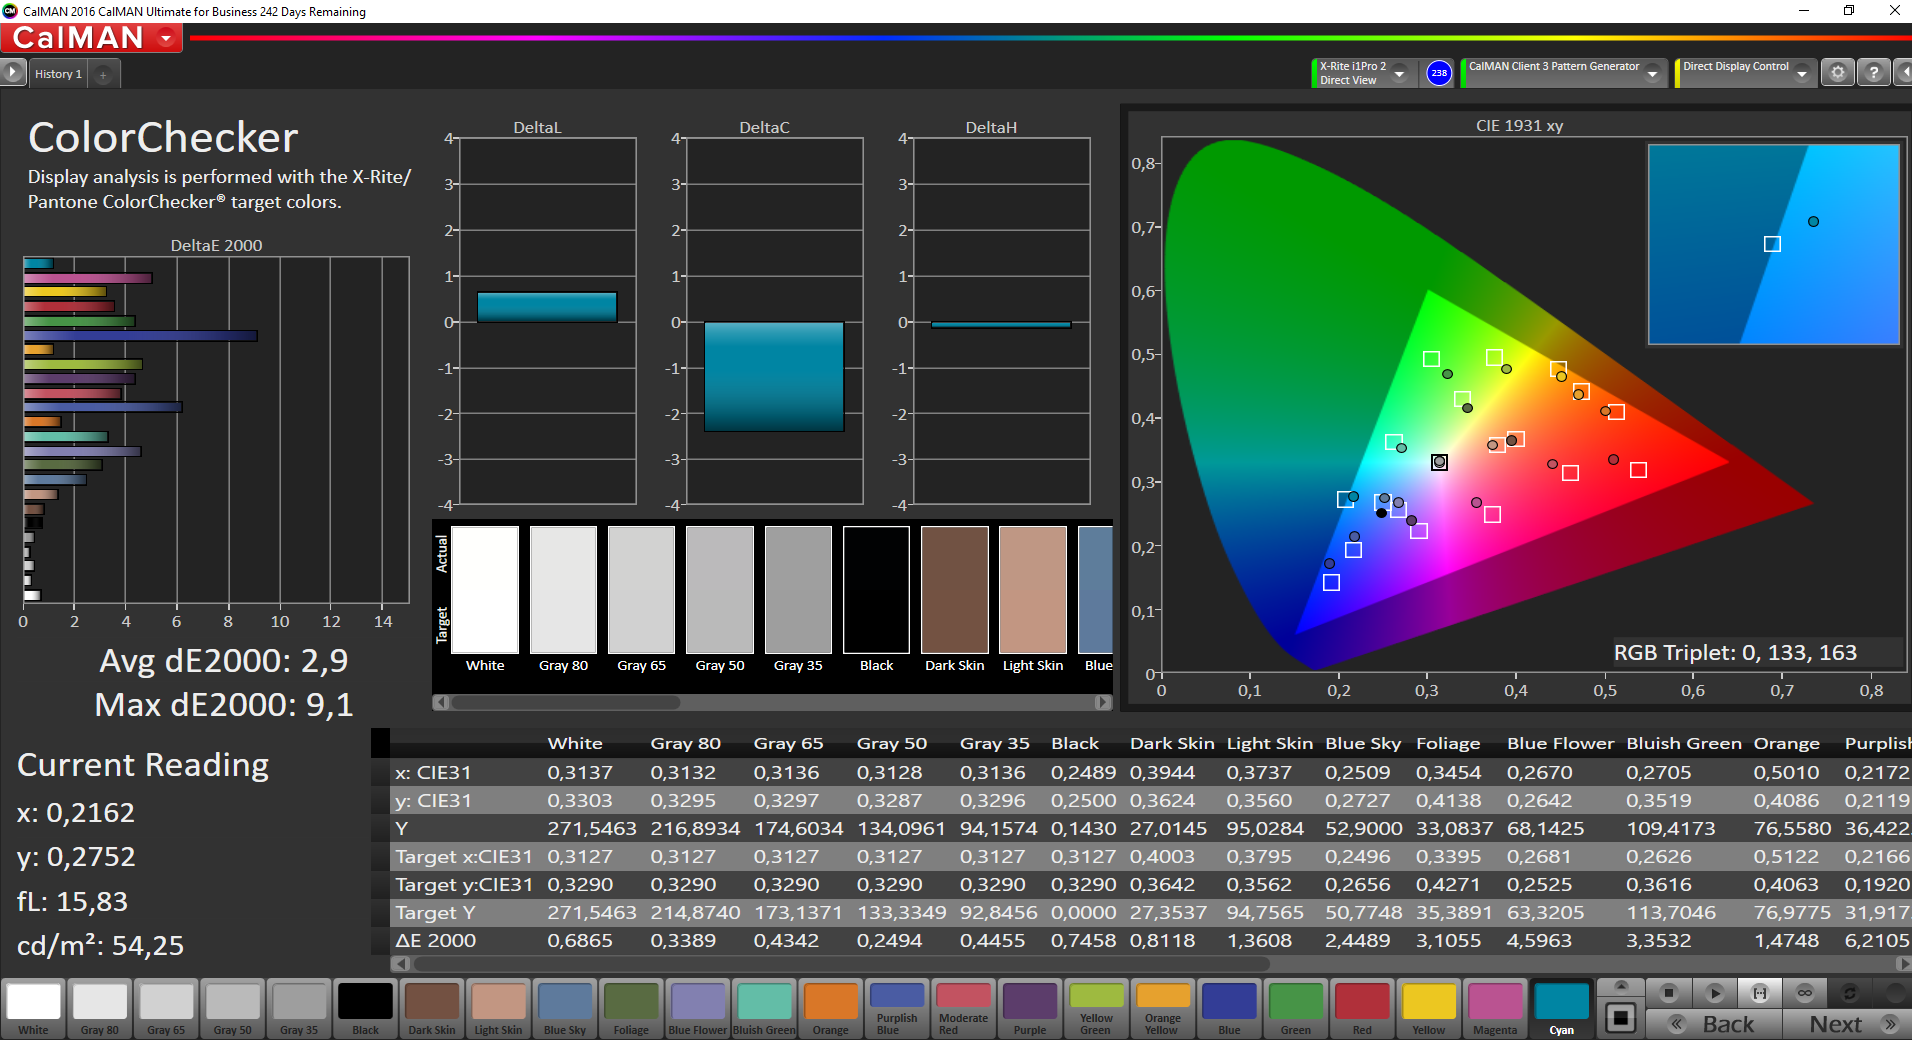
ΔE ColorChecker Calman: 3.4 | ∀{0.5-29.43 Ø4.72}
ΔE Greyscale Calman: 1.8 | ∀{0.09-98 Ø4.97}
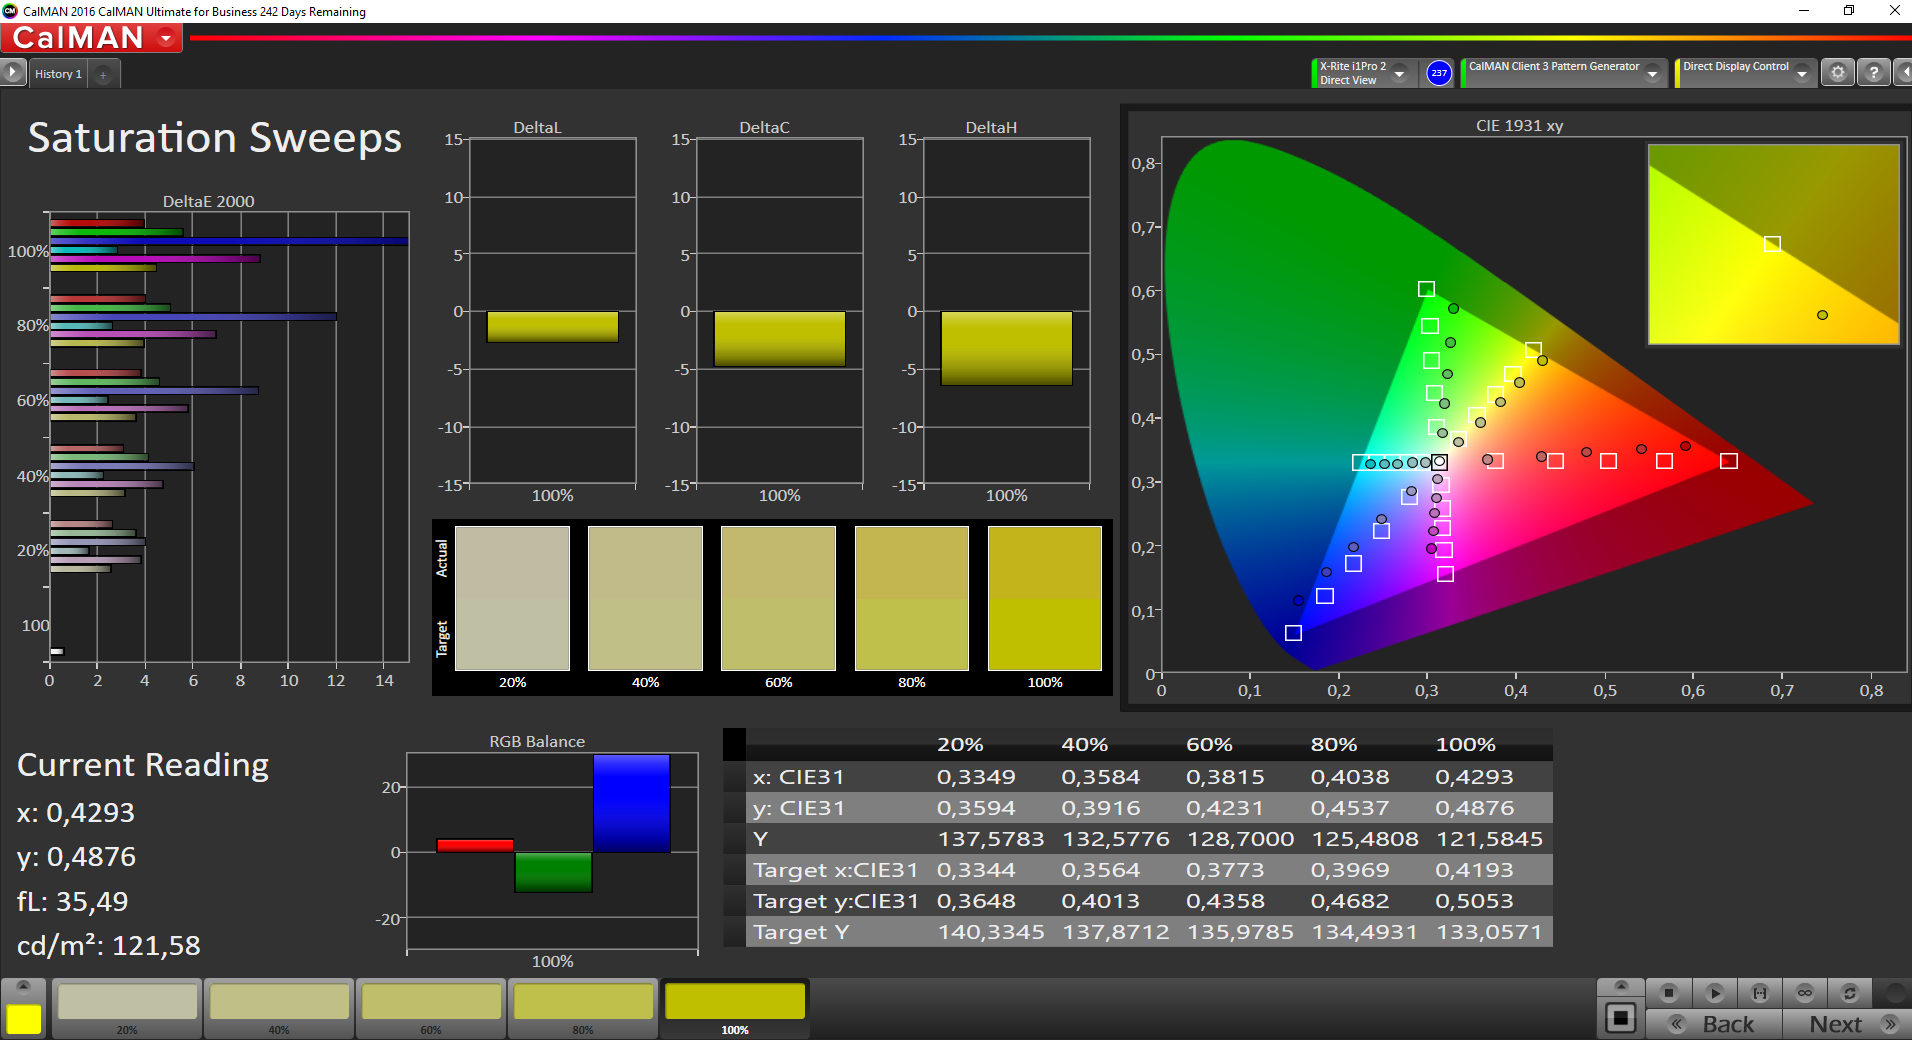
67% sRGB (Argyll 1.6.3 3D)
42.8% AdobeRGB 1998 (Argyll 1.6.3 3D)
46.49% AdobeRGB 1998 (Argyll 3D)
67.3% sRGB (Argyll 3D)
44.96% Display P3 (Argyll 3D)
Gamma: 2.14
CCT: 6544 K
| Dell Latitude 3189 IPS, 1366x768, 11.6" | Medion Akoya P3401T 2in1 IPS, 1920x1080, 12.5" | HP Pavilion 11-k103ng x360 IPS, 1366x768, 11.6" | HP Pavilion x360 13-u102ng IPS, 1920x1080, 13.3" | Lenovo Yoga 700-11ISK IPS, 1920x1080, 11.6" | Acer Aspire Switch Alpha 12 SA5-271-56HM IPS, 2160x1440, 12" | |
|---|---|---|---|---|---|---|
| Display | -5% | 1% | -12% | -4% | 44% | |
| Display P3 Coverage (%) | 44.96 | 42.92 -5% | 45.21 1% | 39.43 -12% | 43.6 -3% | 65.5 46% |
| sRGB Coverage (%) | 67.3 | 64.3 -4% | 67.8 1% | 59.1 -12% | 64.2 -5% | 96.1 43% |
| AdobeRGB 1998 Coverage (%) | 46.49 | 44.35 -5% | 46.73 1% | 40.76 -12% | 45.17 -3% | 66.9 44% |
| Response Times | 7% | 39% | 12% | 40% | 19% | |
| Response Time Grey 50% / Grey 80% * (ms) | 40 ? | 40 ? -0% | 18.8 ? 53% | 38 ? 5% | 23 ? 43% | 20 ? 50% |
| Response Time Black / White * (ms) | 30.4 ? | 26 ? 14% | 23.2 ? 24% | 25 ? 18% | 19 ? 37% | 34 ? -12% |
| PWM Frequency (Hz) | 50 ? | 1000 ? | ||||
| Screen | -27% | -13% | -44% | -76% | -47% | |
| Brightness middle (cd/m²) | 291 | 392 35% | 194 -33% | 277 -5% | 300 3% | 345 19% |
| Brightness (cd/m²) | 284 | 392 38% | 186 -35% | 263 -7% | 284 0% | 328 15% |
| Brightness Distribution (%) | 92 | 93 1% | 86 -7% | 88 -4% | 82 -11% | 91 -1% |
| Black Level * (cd/m²) | 0.16 | 0.33 -106% | 0.22 -38% | 0.31 -94% | 0.33 -106% | 0.38 -138% |
| Contrast (:1) | 1819 | 1188 -35% | 882 -52% | 894 -51% | 909 -50% | 908 -50% |
| Colorchecker dE 2000 * | 3.4 | 4.99 -47% | 3.06 10% | 5.57 -64% | 7.87 -131% | 8.4 -147% |
| Colorchecker dE 2000 max. * | 9.6 | 9.08 5% | 8.81 8% | 13.6 -42% | 17.75 -85% | 11.9 -24% |
| Greyscale dE 2000 * | 1.8 | 4.53 -152% | 1.42 21% | 4.56 -153% | 8.45 -369% | 4.3 -139% |
| Gamma | 2.14 103% | 2.46 89% | 2.34 94% | 2.28 96% | 2.42 91% | 2.63 84% |
| CCT | 6544 99% | 7394 88% | 6432 101% | 6648 98% | 6856 95% | 7368 88% |
| Color Space (Percent of AdobeRGB 1998) (%) | 42.8 | 41 -4% | 42.98 0% | 38 -11% | 41 -4% | 62 45% |
| Color Space (Percent of sRGB) (%) | 67 | 64 -4% | 67.56 1% | 59 -12% | 64 -4% | |
| Media total (Programa/Opciones) | -8% /
-18% | 9% /
-3% | -15% /
-30% | -13% /
-46% | 5% /
-18% |
* ... más pequeño es mejor

Tiempos de respuesta del display
| ↔ Tiempo de respuesta de Negro a Blanco | ||
|---|---|---|
| 30.4 ms ... subida ↗ y bajada ↘ combinada | ↗ 16.4 ms subida | 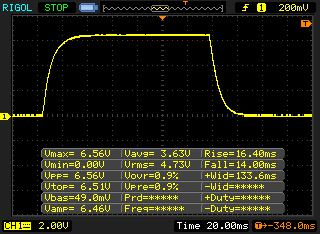 |
| ↘ 14 ms bajada | ||
| La pantalla mostró tiempos de respuesta lentos en nuestros tests y podría ser demasiado lenta para los jugones. En comparación, todos los dispositivos de prueba van de ##min### (mínimo) a 240 (máximo) ms. » 82 % de todos los dispositivos son mejores. Eso quiere decir que el tiempo de respuesta es peor que la media (19.9 ms) de todos los dispositivos testados. | ||
| ↔ Tiempo de respuesta 50% Gris a 80% Gris | ||
| 40 ms ... subida ↗ y bajada ↘ combinada | ↗ 18.8 ms subida | 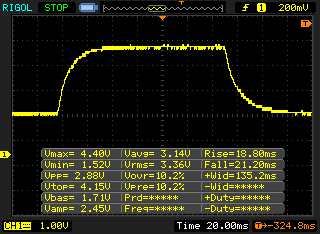 |
| ↘ 21.2 ms bajada | ||
| La pantalla mostró tiempos de respuesta lentos en nuestros tests y podría ser demasiado lenta para los jugones. En comparación, todos los dispositivos de prueba van de ##min### (mínimo) a 636 (máximo) ms. » 61 % de todos los dispositivos son mejores. Eso quiere decir que el tiempo de respuesta es peor que la media (31.1 ms) de todos los dispositivos testados. | ||
Parpadeo de Pantalla / PWM (Pulse-Width Modulation)
| Parpadeo de Pantalla / PWM no detectado |  | ||
Comparación: 52 % de todos los dispositivos testados no usaron PWM para atenuar el display. Si se usó, medimos una media de 7784 (mínimo: 5 - máxmo: 343500) Hz. | |||
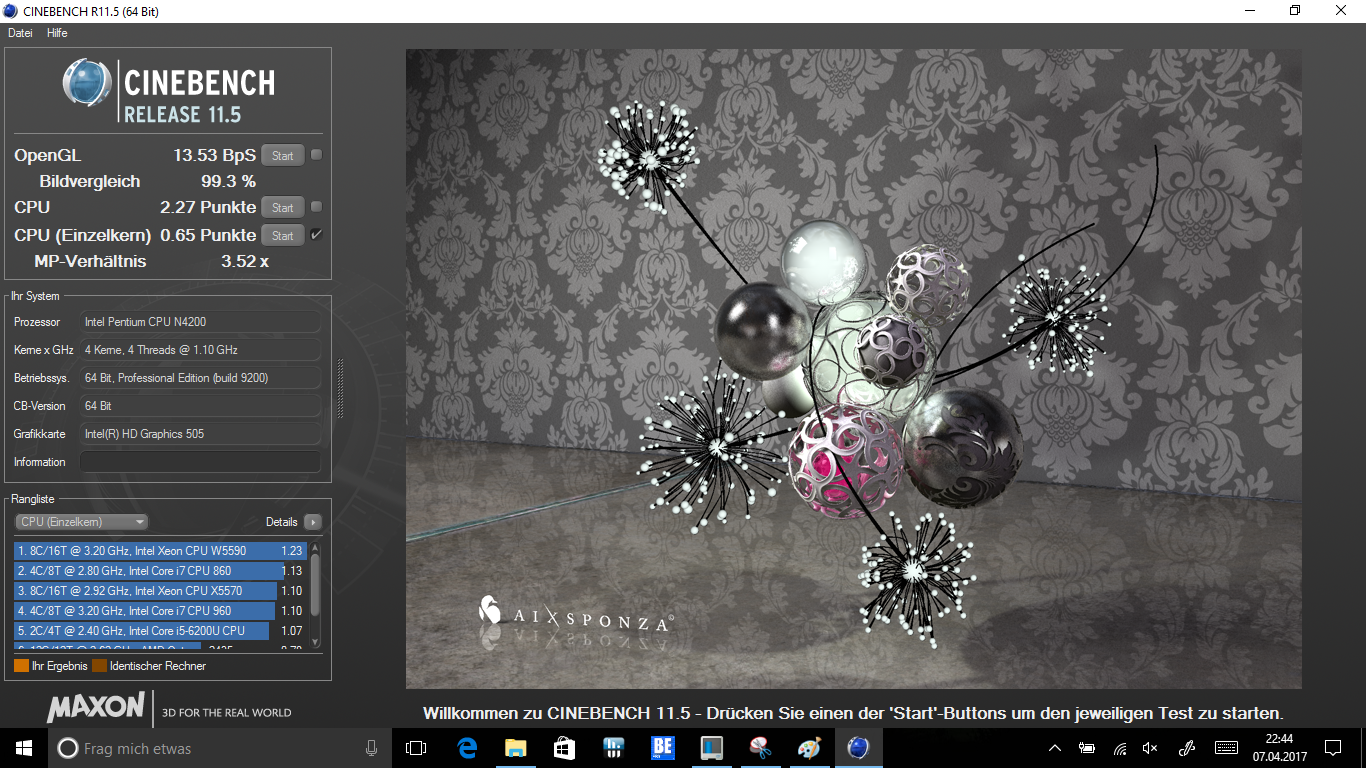
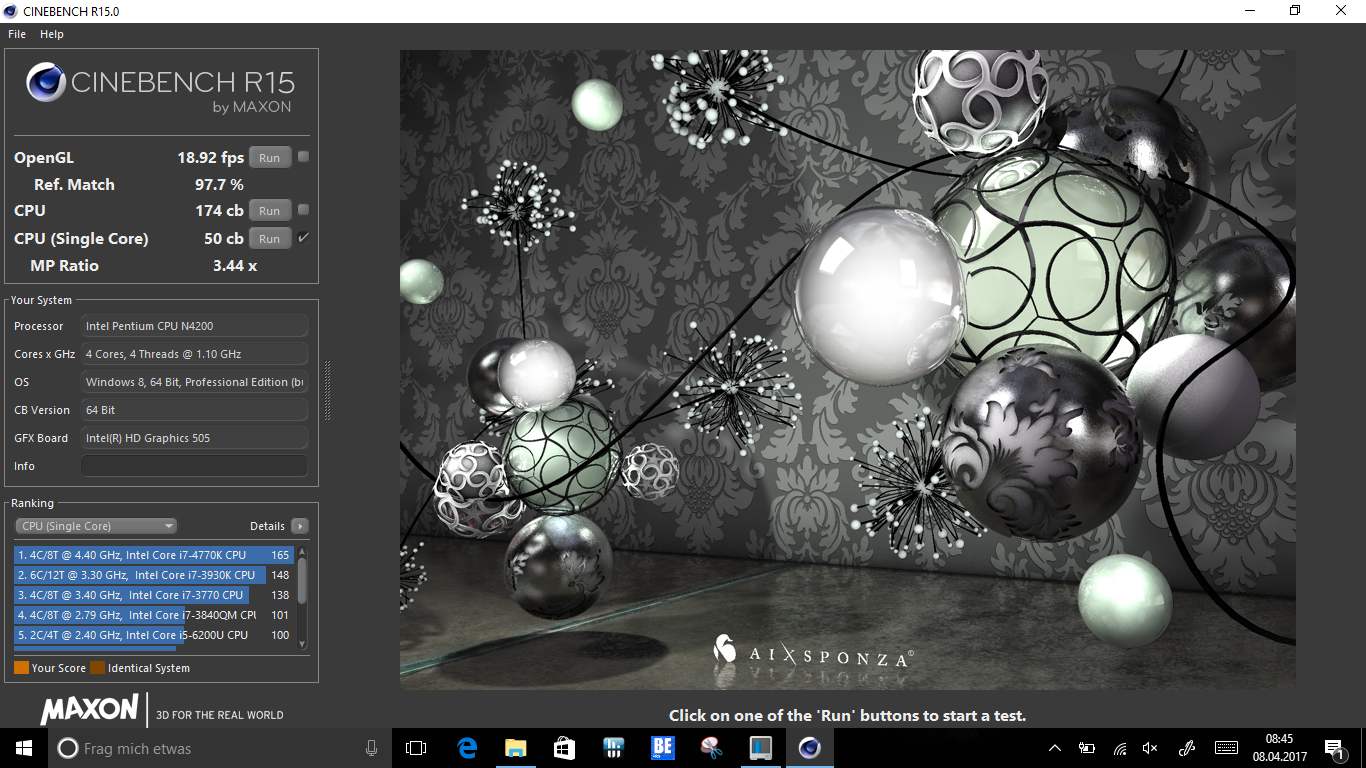
| Cinebench R11.5 | |
| CPU Single 64Bit | |
| HP Pavilion x360 13-u102ng | |
| Dell Latitude 3189 | |
| CPU Multi 64Bit | |
| HP Pavilion x360 13-u102ng | |
| Dell Latitude 3189 | |
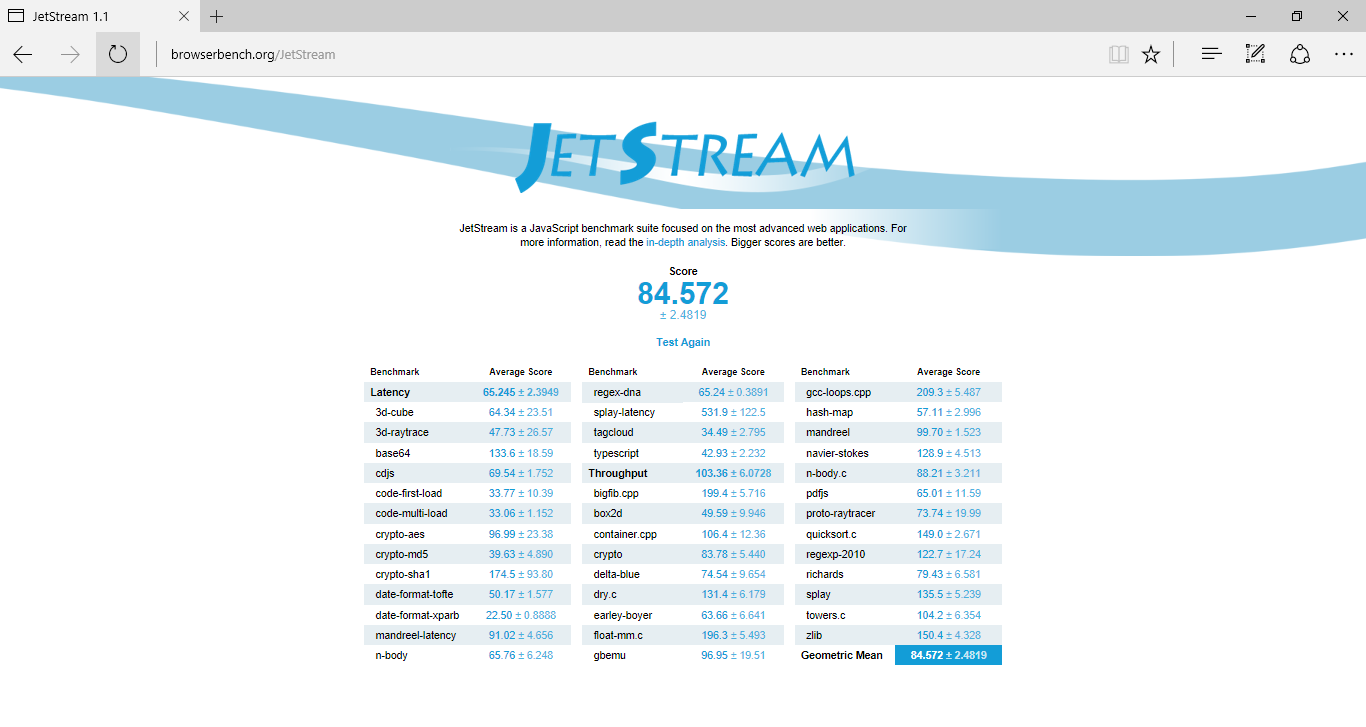
| JetStream 1.1 - 1.1 Total | |
| HP Pavilion x360 13-u102ng | |
| Medion Akoya P3401T 2in1 | |
| Acer Aspire Switch Alpha 12 SA5-271-56HM | |
| Lenovo Yoga 700-11ISK | |
| Dell Latitude 3189 | |
| HP Pavilion 11-k103ng x360 | |
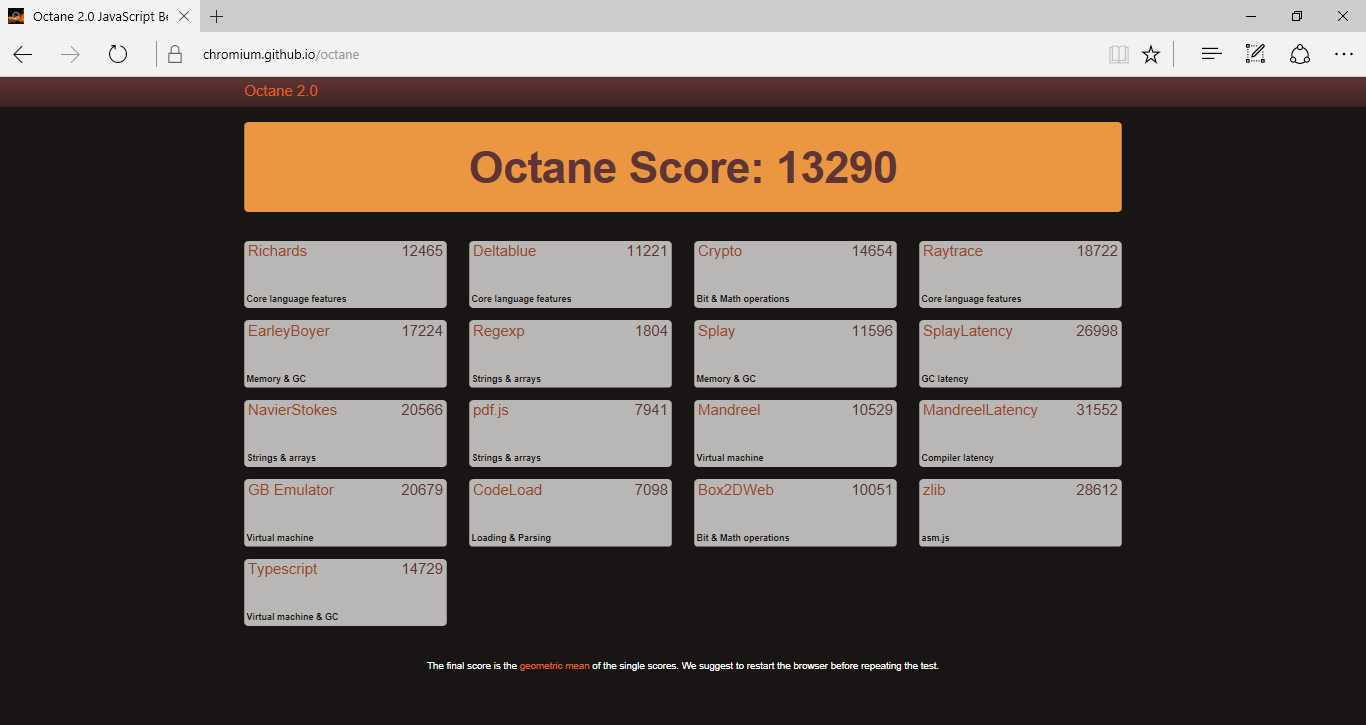
| Octane V2 - Total Score | |
| HP Pavilion x360 13-u102ng | |
| Acer Aspire Switch Alpha 12 SA5-271-56HM | |
| Lenovo Yoga 700-11ISK | |
| Dell Latitude 3189 | |
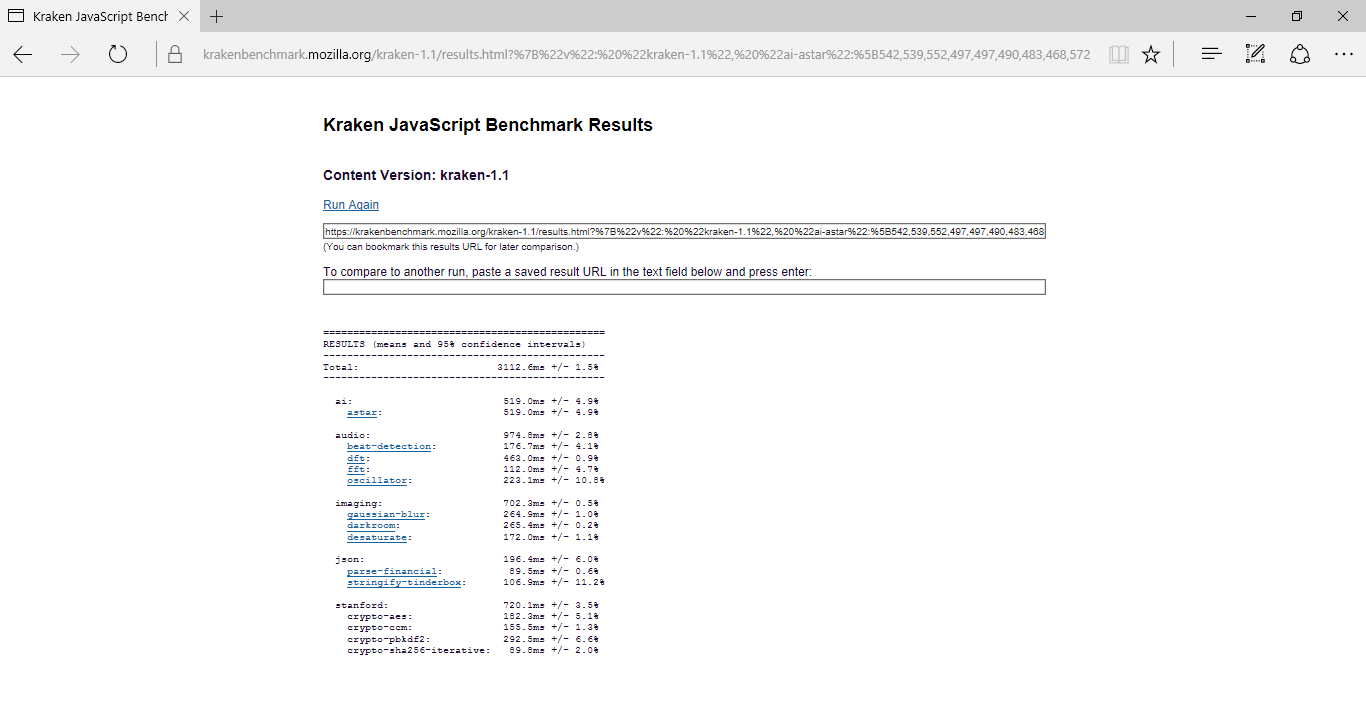
| Mozilla Kraken 1.1 - Total | |
| Dell Latitude 3189 | |
| Lenovo Yoga 700-11ISK | |
| Acer Aspire Switch Alpha 12 SA5-271-56HM | |
| HP Pavilion x360 13-u102ng | |
* ... más pequeño es mejor
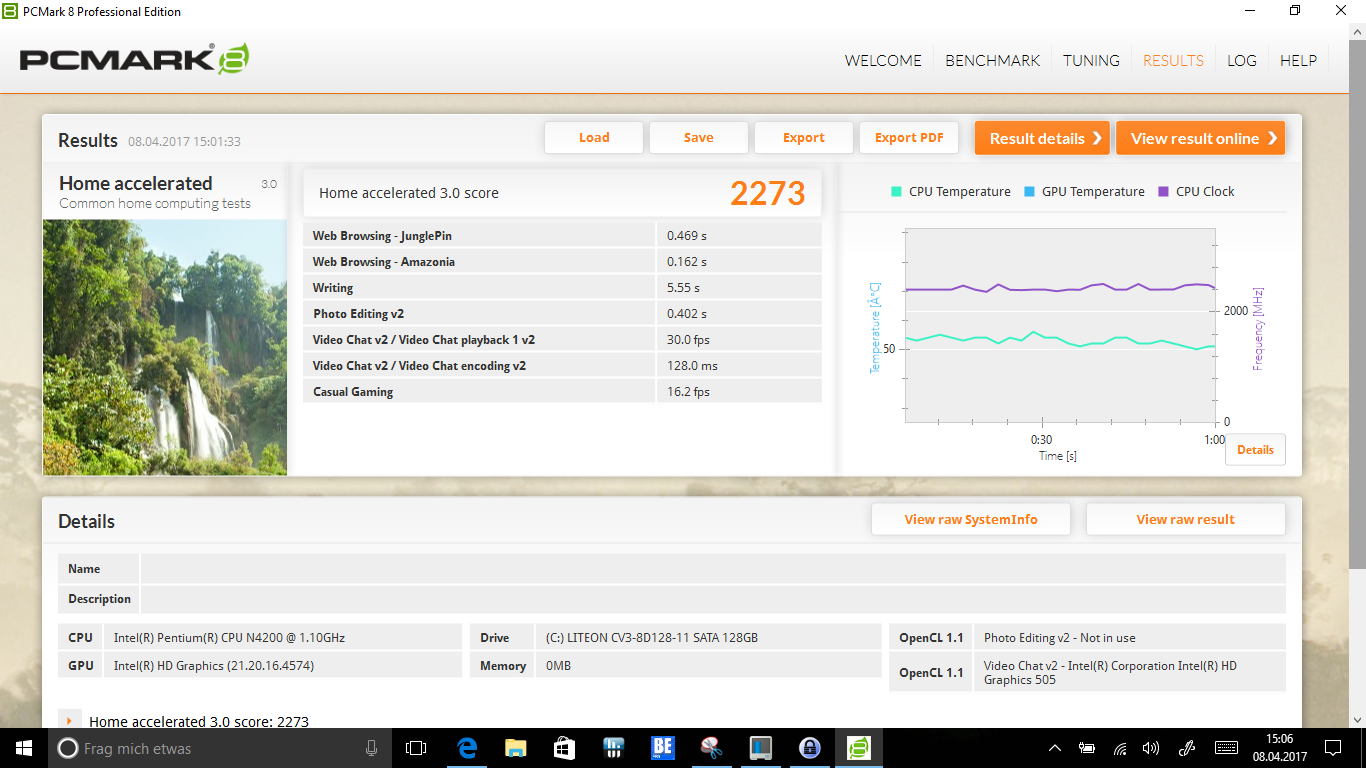
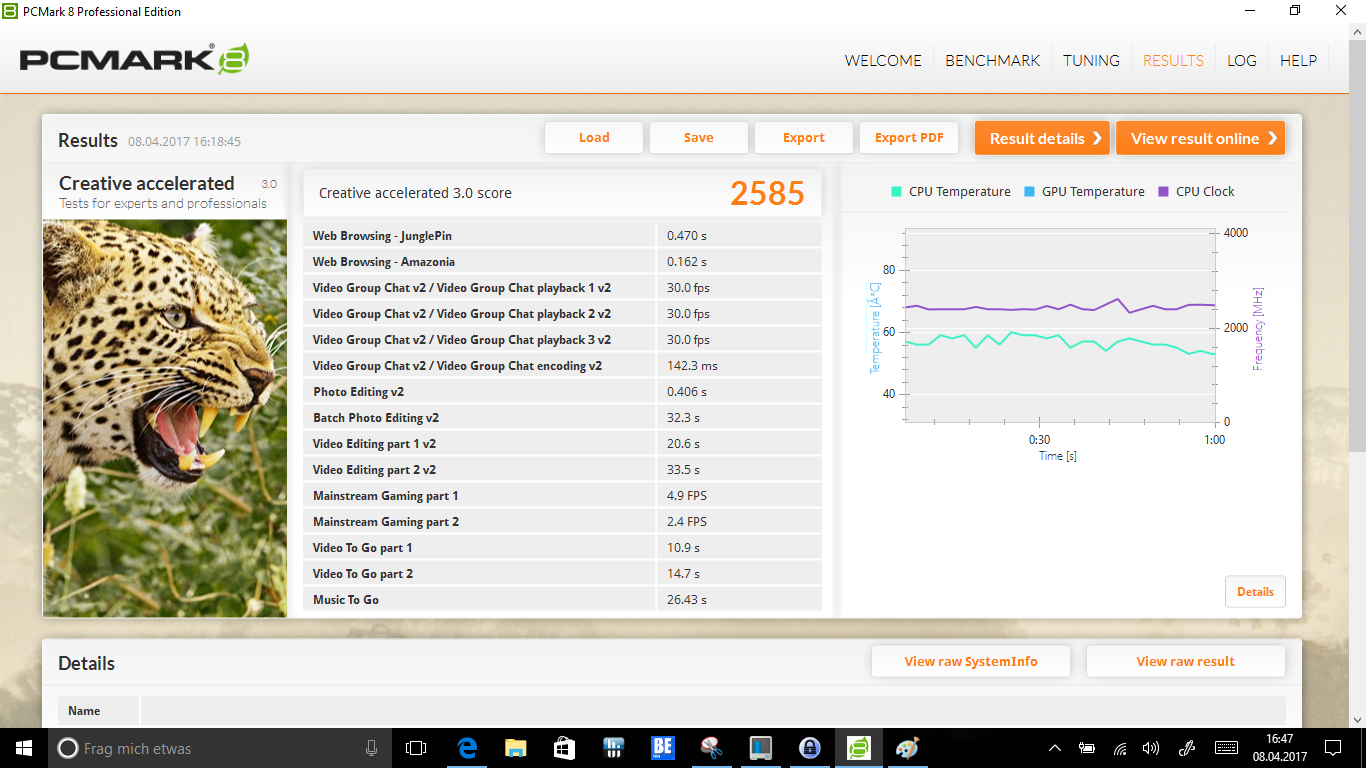
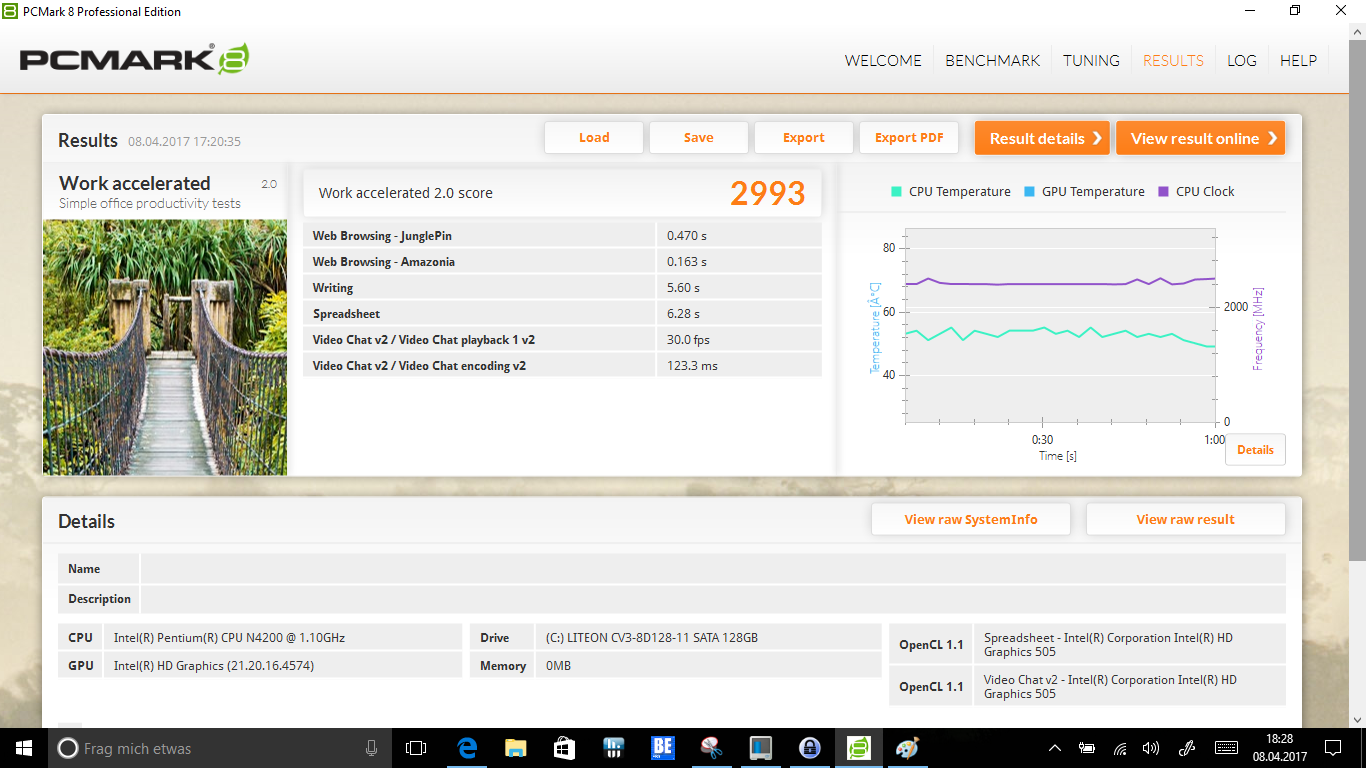
| PCMark 8 | |
| Home Score Accelerated v2 | |
| Acer Aspire Switch Alpha 12 SA5-271-56HM | |
| HP Pavilion x360 13-u102ng | |
| Medion Akoya P3401T 2in1 | |
| Lenovo Yoga 700-11ISK | |
| Dell Latitude 3189 | |
| HP Pavilion 11-k103ng x360 | |
| Work Score Accelerated v2 | |
| HP Pavilion x360 13-u102ng | |
| Acer Aspire Switch Alpha 12 SA5-271-56HM | |
| Lenovo Yoga 700-11ISK | |
| Dell Latitude 3189 | |
| Creative Score Accelerated v2 | |
| HP Pavilion x360 13-u102ng | |
| Lenovo Yoga 700-11ISK | |
| Dell Latitude 3189 | |
| PCMark 7 | |
| Score | |
| Dell Latitude 3189 | |
| HP Pavilion x360 13-u102ng | |
| Productivity | |
| Dell Latitude 3189 | |
| HP Pavilion x360 13-u102ng | |
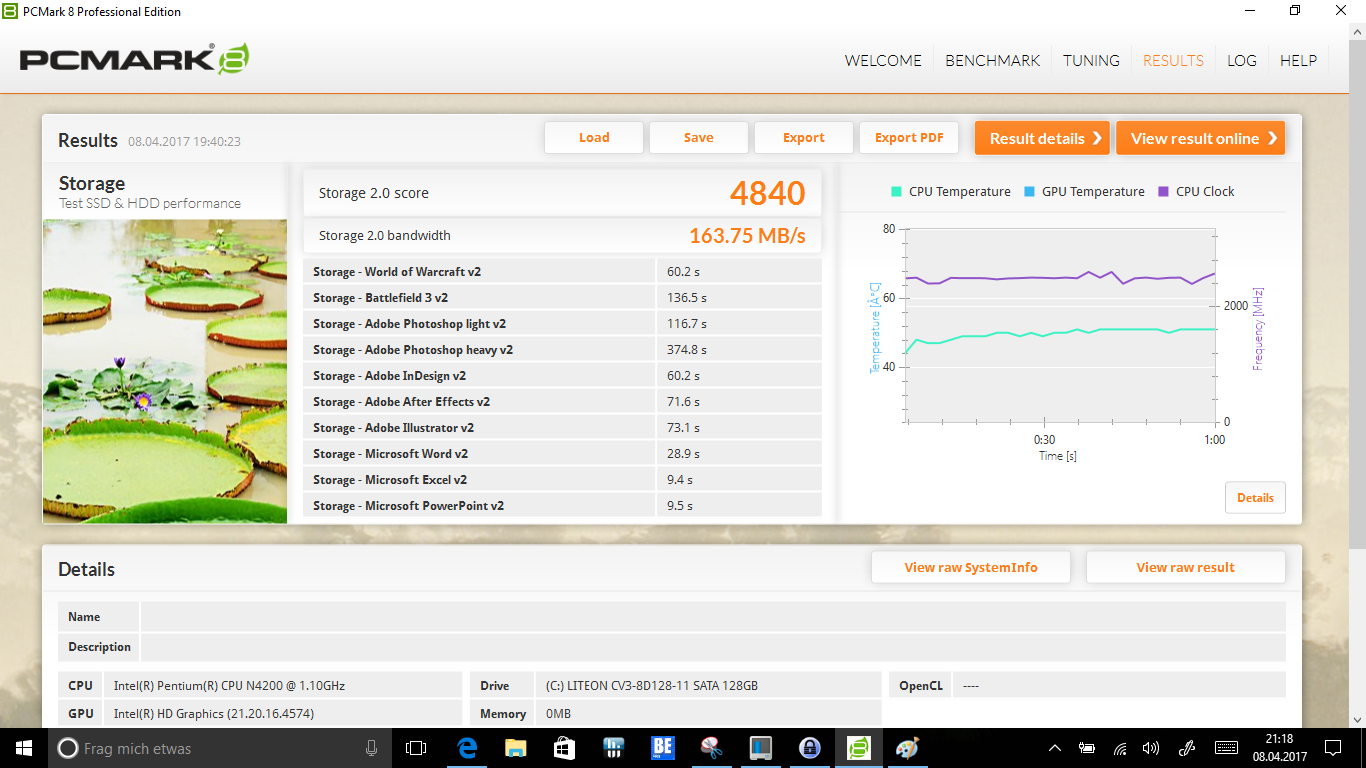
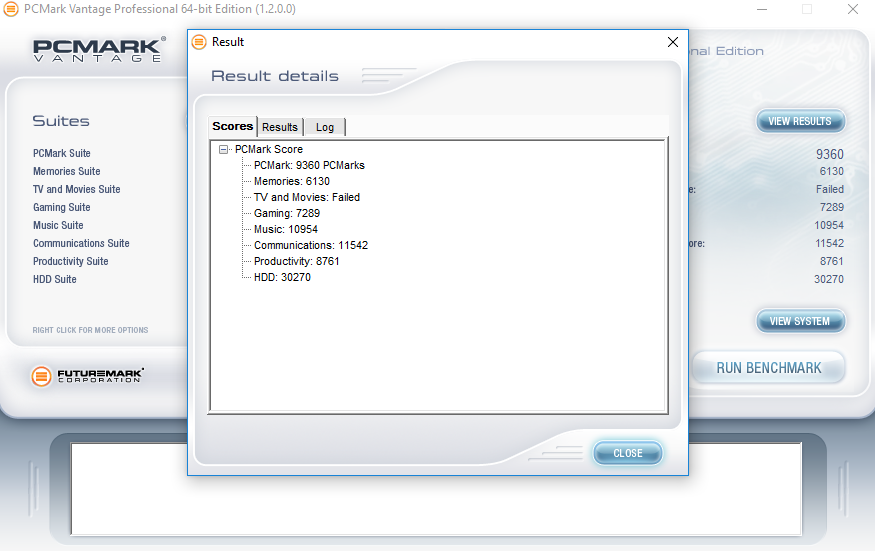
| PCMark Vantage Result | 9360 puntos | |
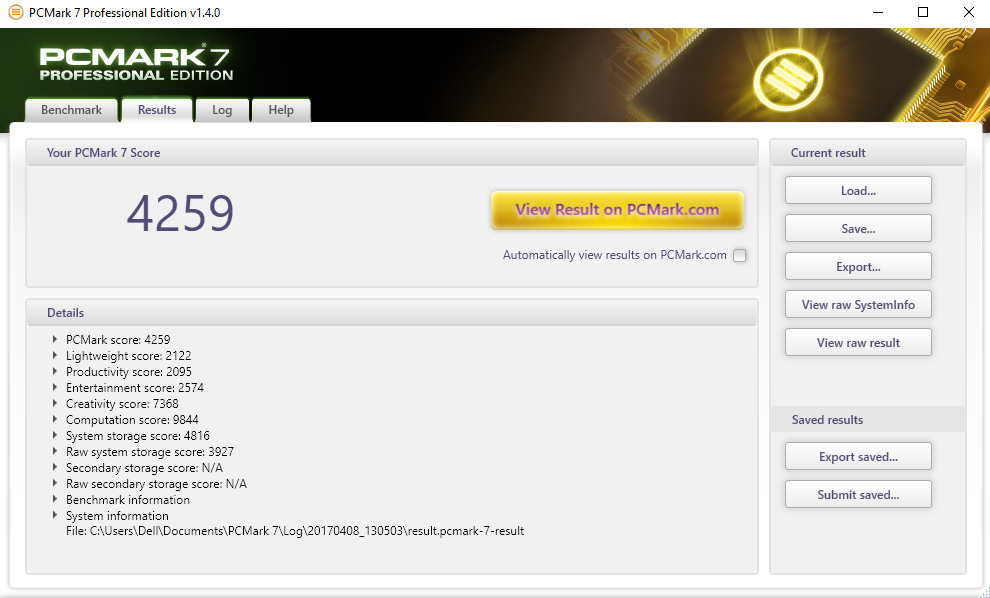
| PCMark 7 Score | 4259 puntos | |
| PCMark 8 Home Score Accelerated v2 | 2273 puntos | |
| PCMark 8 Creative Score Accelerated v2 | 2585 puntos | |
| PCMark 8 Work Score Accelerated v2 | 2993 puntos | |
ayuda | ||
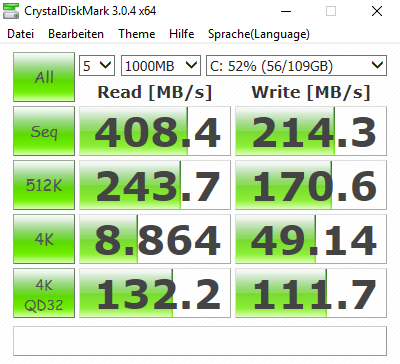
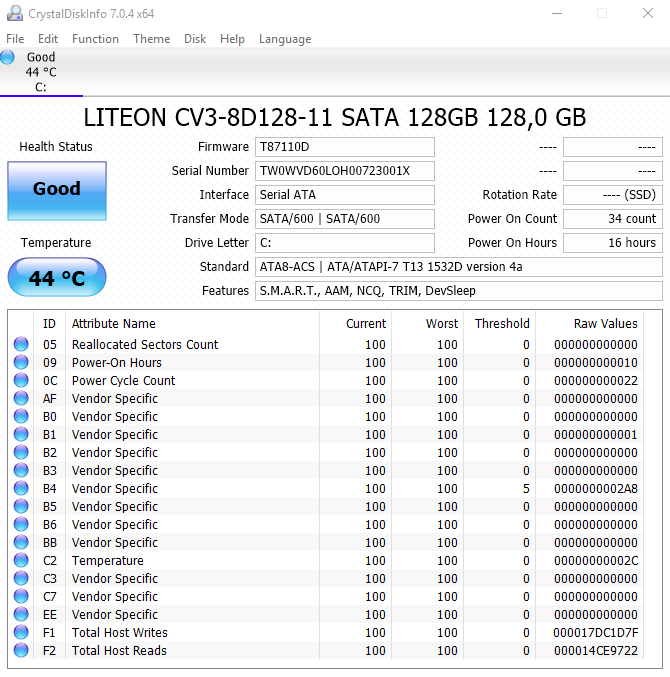
| Dell Latitude 3189 Liteonit CV3-8D128 | Medion Akoya P3401T 2in1 | HP Pavilion 11-k103ng x360 Hitachi Travelstar Z5K500 HTS545050A7E680 | HP Pavilion x360 13-u102ng HGST Travelstar 5K1000 HTS541010A7E630 | Lenovo Yoga 700-11ISK Samsung SSD PM871 MZNLN256HCHP | Acer Aspire Switch Alpha 12 SA5-271-56HM Kingston RBU-SNS8152S3256GG2 | |
|---|---|---|---|---|---|---|
| CrystalDiskMark 3.0 | 37% | -85% | -87% | 97% | 70% | |
| Read Seq (MB/s) | 408.4 | 427.6 5% | 106 -74% | 104.8 -74% | 456.2 12% | 518 27% |
| Write Seq (MB/s) | 214.3 | 286.5 34% | 106.1 -50% | 91 -58% | 302.8 41% | 199.9 -7% |
| Read 512 (MB/s) | 243.7 | 324.1 33% | 33.53 -86% | 20.67 -92% | 385.7 58% | 374.9 54% |
| Write 512 (MB/s) | 170.6 | 121.8 -29% | 39.03 -77% | 45.05 -74% | 301.9 77% | 201 18% |
| Read 4k (MB/s) | 8.864 | 28.11 217% | 0.407 -95% | 0.215 -98% | 31.27 253% | 29.3 231% |
| Write 4k (MB/s) | 49.14 | 41.68 -15% | 1.026 -98% | 1.037 -98% | 73.6 50% | 76.8 56% |
| Read 4k QD32 (MB/s) | 132.2 | 249.2 89% | 0.898 -99% | 0.968 -99% | 324.2 145% | 272 106% |
| Write 4k QD32 (MB/s) | 111.7 | 68.8 -38% | 1.003 -99% | 1.09 -99% | 268.6 140% | 197.1 76% |

| 3DMark | |
| 1280x720 Cloud Gate Standard Graphics | |
| Acer Aspire Switch Alpha 12 SA5-271-56HM | |
| HP Pavilion x360 13-u102ng | |
| Dell Latitude 3189 | |
| Lenovo Yoga 700-11ISK | |
| 1920x1080 Fire Strike Graphics | |
| HP Pavilion x360 13-u102ng | |
| Dell Latitude 3189 | |
| Lenovo Yoga 700-11ISK | |
| 3DMark 11 - 1280x720 Performance GPU | |
| Acer Aspire Switch Alpha 12 SA5-271-56HM | |
| HP Pavilion x360 13-u102ng | |
| Medion Akoya P3401T 2in1 | |
| Lenovo Yoga 700-11ISK | |
| Dell Latitude 3189 | |
| HP Pavilion 11-k103ng x360 | |
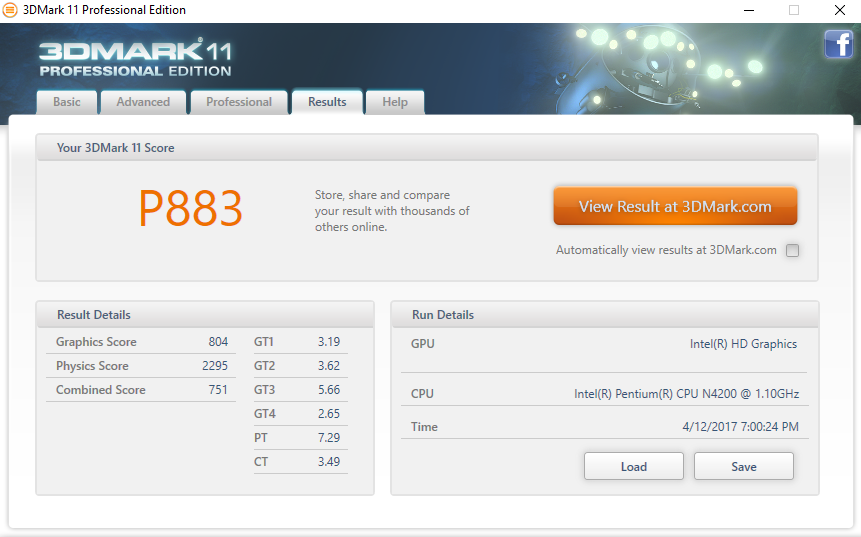
| 3DMark 11 Performance | 883 puntos | |
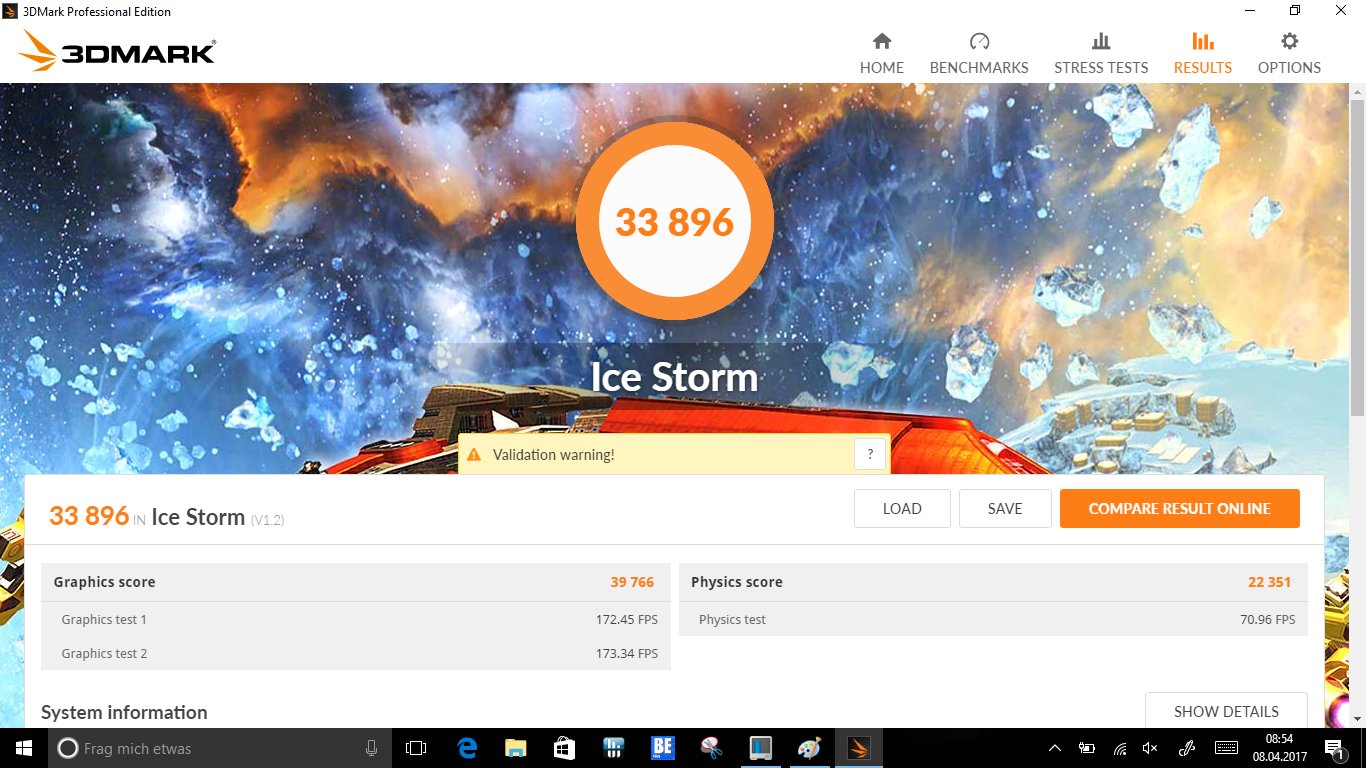
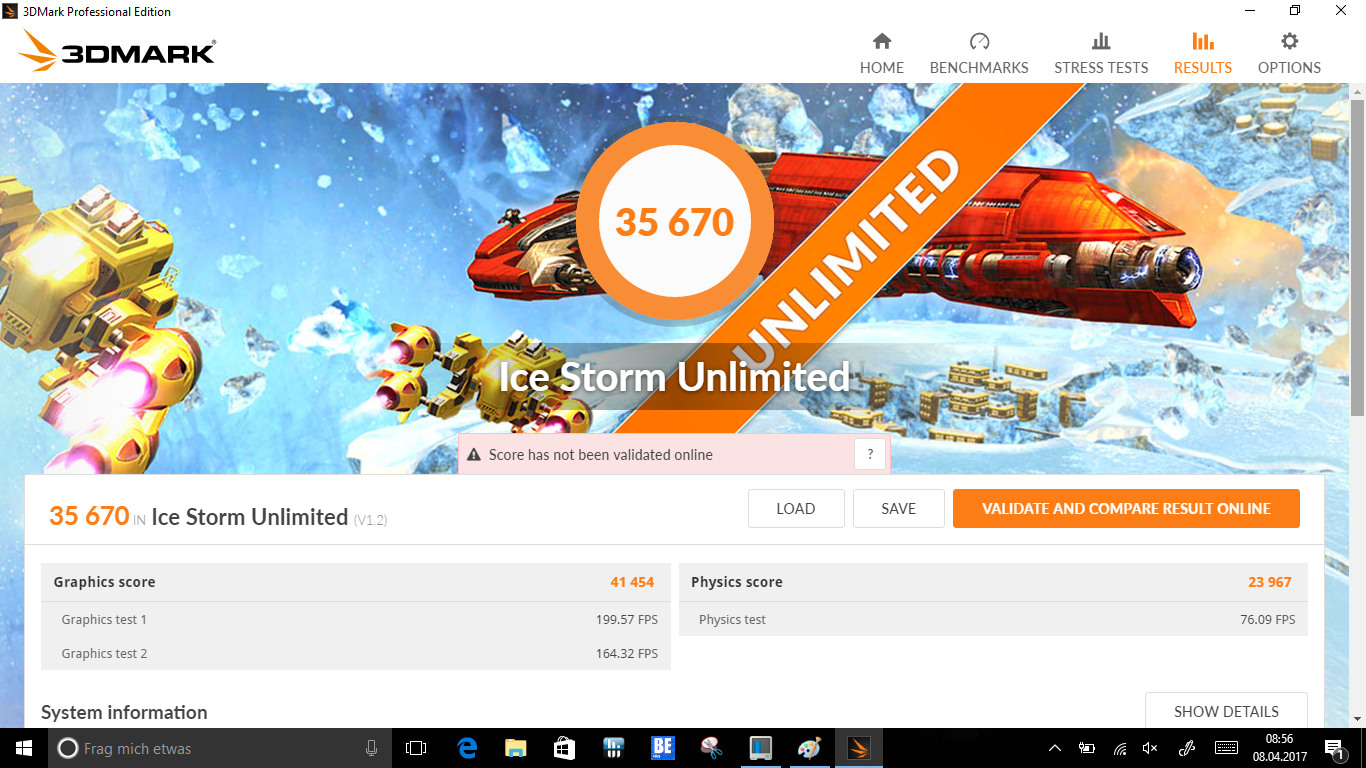
| 3DMark Ice Storm Standard Score | 33896 puntos | |
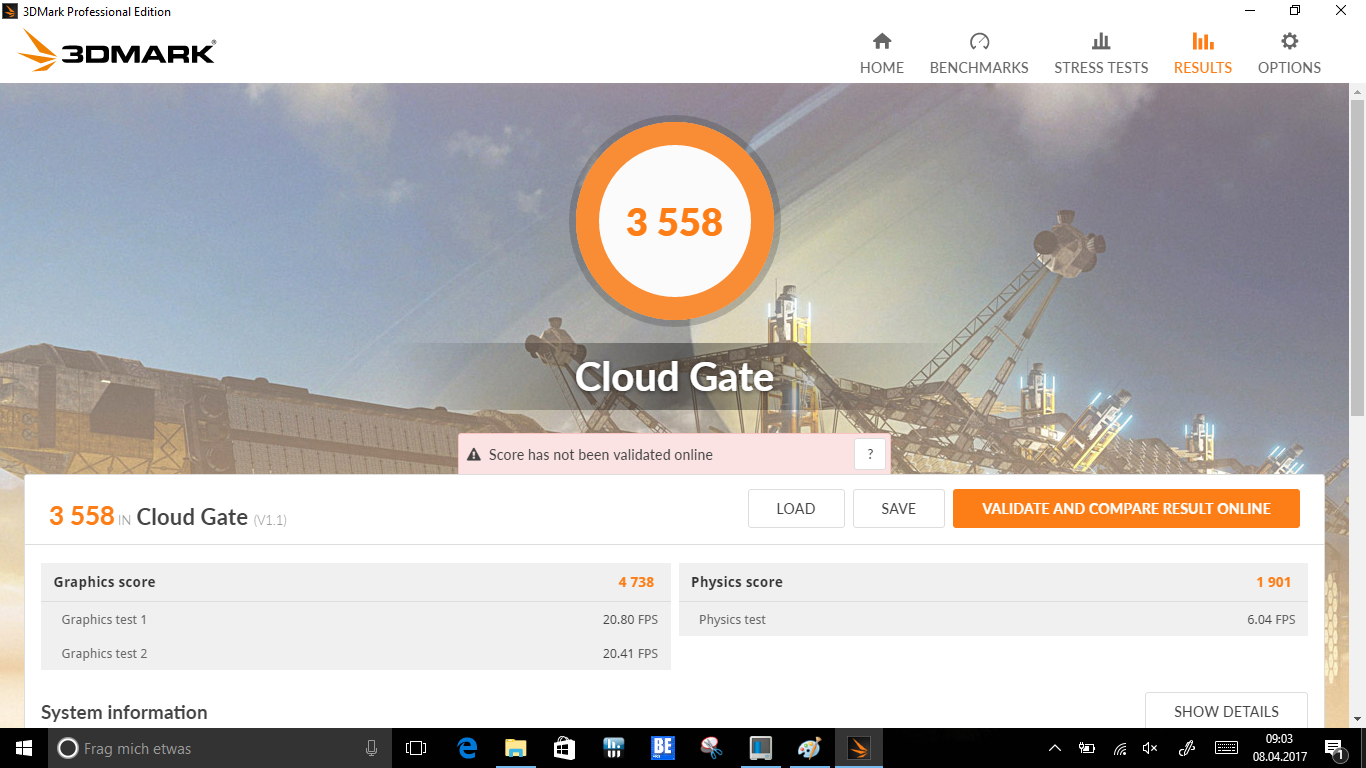
| 3DMark Cloud Gate Standard Score | 3558 puntos | |
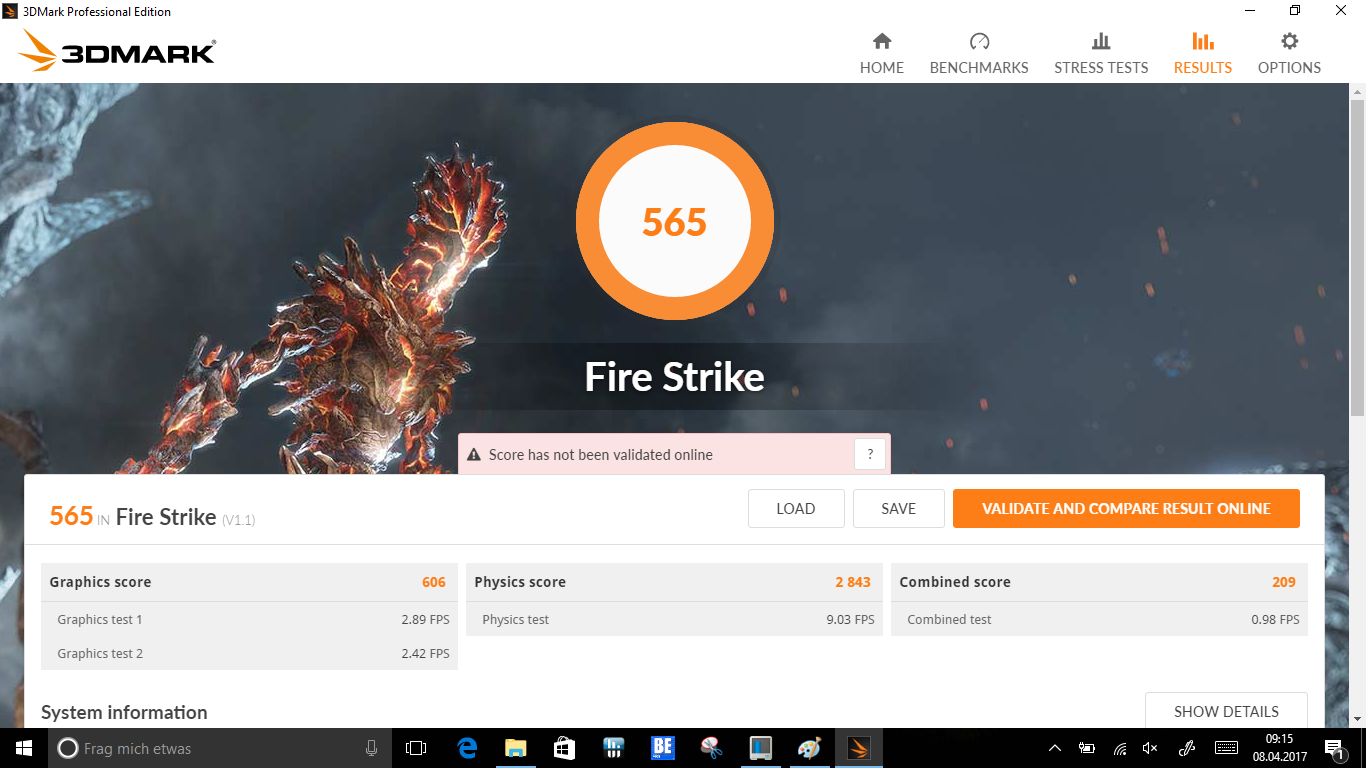
| 3DMark Fire Strike Score | 565 puntos | |
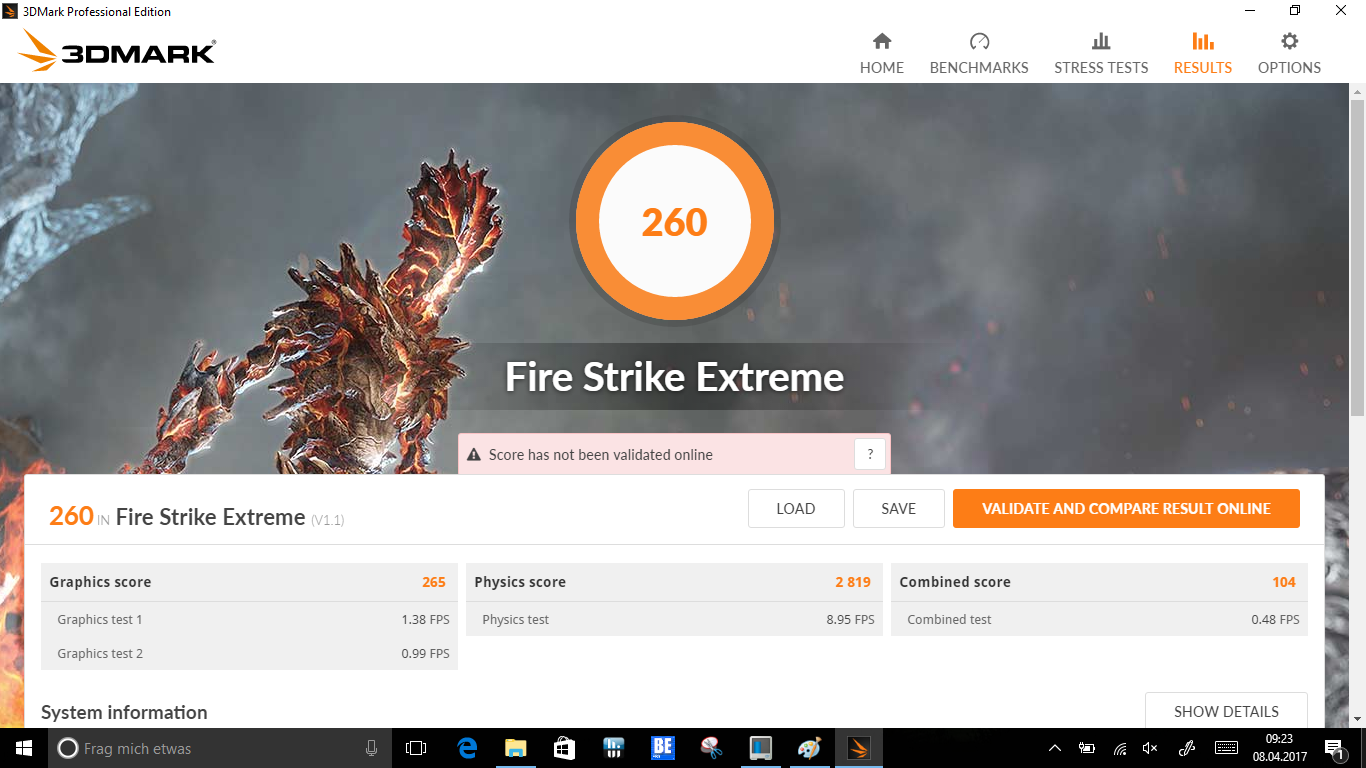
| 3DMark Fire Strike Extreme Score | 260 puntos | |
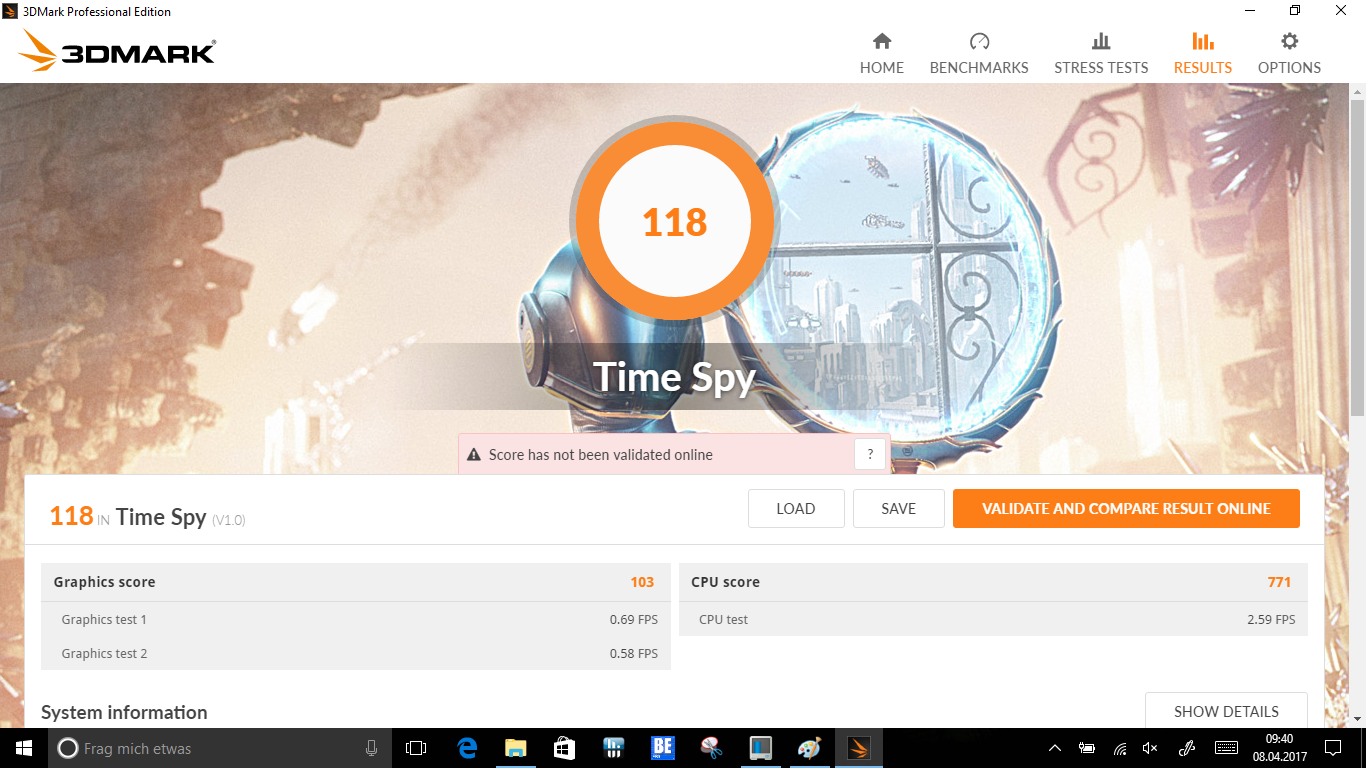
| 3DMark Time Spy Score | 118 puntos | |
ayuda | ||
| bajo | medio | alto | ultra | |
|---|---|---|---|---|
| BioShock Infinite (2013) | 30.6 | 17.3 | 15.1 | |
| Battlefield 4 (2013) | 20.9 | 15.2 | 9.5 | |
| Rise of the Tomb Raider (2016) | 6.1 | 4 |
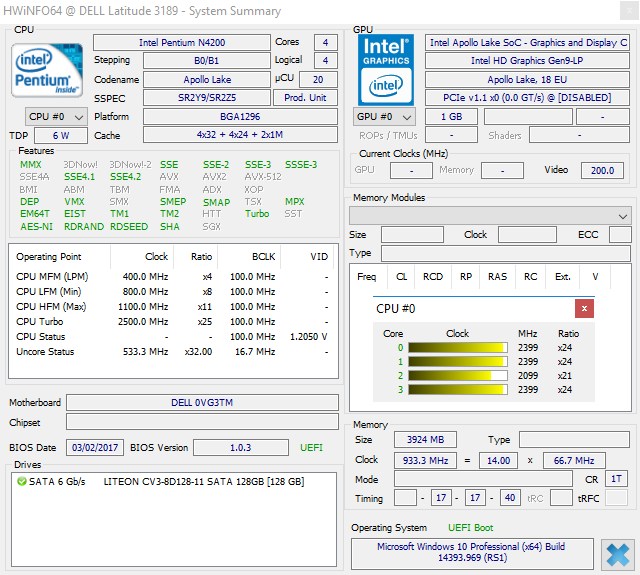
| Dell Latitude 3189 Pentium N4200, HD Graphics 505 | Medion Akoya P3401T 2in1 6Y54, HD Graphics 515 | HP Pavilion 11-k103ng x360 N3050, HD Graphics (Braswell) | HP Pavilion x360 13-u102ng i5-7200U, HD Graphics 620 | Lenovo Yoga 700-11ISK 6Y30, HD Graphics 515 | Acer Aspire Switch Alpha 12 SA5-271-56HM 6200U, HD Graphics 520 | |
|---|---|---|---|---|---|---|
| Emissions | ||||||
| Fan Noise (dB(A)) | 37.3 |
(±) La temperatura máxima en la parte superior es de 43.3 °C / 110 F, frente a la media de 35.4 °C / 96 F, que oscila entre 19.6 y 60 °C para la clase Convertible.
(-) El fondo se calienta hasta un máximo de 54.9 °C / 131 F, frente a la media de 36.9 °C / 98 F
(+) En reposo, la temperatura media de la parte superior es de 26 °C / 79# F, frente a la media del dispositivo de 30.3 °C / 87 F.
(±) El reposamanos y el touchpad pueden calentarse mucho al tacto con un máximo de 37.9 °C / 100.2 F.
(-) La temperatura media de la zona del reposamanos de dispositivos similares fue de 28 °C / 82.4 F (-9.9 °C / -17.8 F).
| Dell Latitude 3189 Pentium N4200, HD Graphics 505 | Medion Akoya P3401T 2in1 6Y54, HD Graphics 515 | HP Pavilion 11-k103ng x360 N3050, HD Graphics (Braswell) | HP Pavilion x360 13-u102ng i5-7200U, HD Graphics 620 | Lenovo Yoga 700-11ISK 6Y30, HD Graphics 515 | Acer Aspire Switch Alpha 12 SA5-271-56HM 6200U, HD Graphics 520 | |
|---|---|---|---|---|---|---|
| Heat | 12% | -17% | 15% | -1% | -3% | |
| Maximum Upper Side * (°C) | 43.3 | 38.1 12% | 44.6 -3% | 34.6 20% | 36.8 15% | 46.7 -8% |
| Maximum Bottom * (°C) | 54.9 | 41.7 24% | 53.1 3% | 36.4 34% | 42 23% | 51 7% |
| Idle Upper Side * (°C) | 27.5 | 27.9 -1% | 35.2 -28% | 26.6 3% | 32.1 -17% | 29.5 -7% |
| Idle Bottom * (°C) | 27.9 | 24.1 14% | 38.6 -38% | 27.7 1% | 34.4 -23% | 28.6 -3% |
* ... más pequeño es mejor
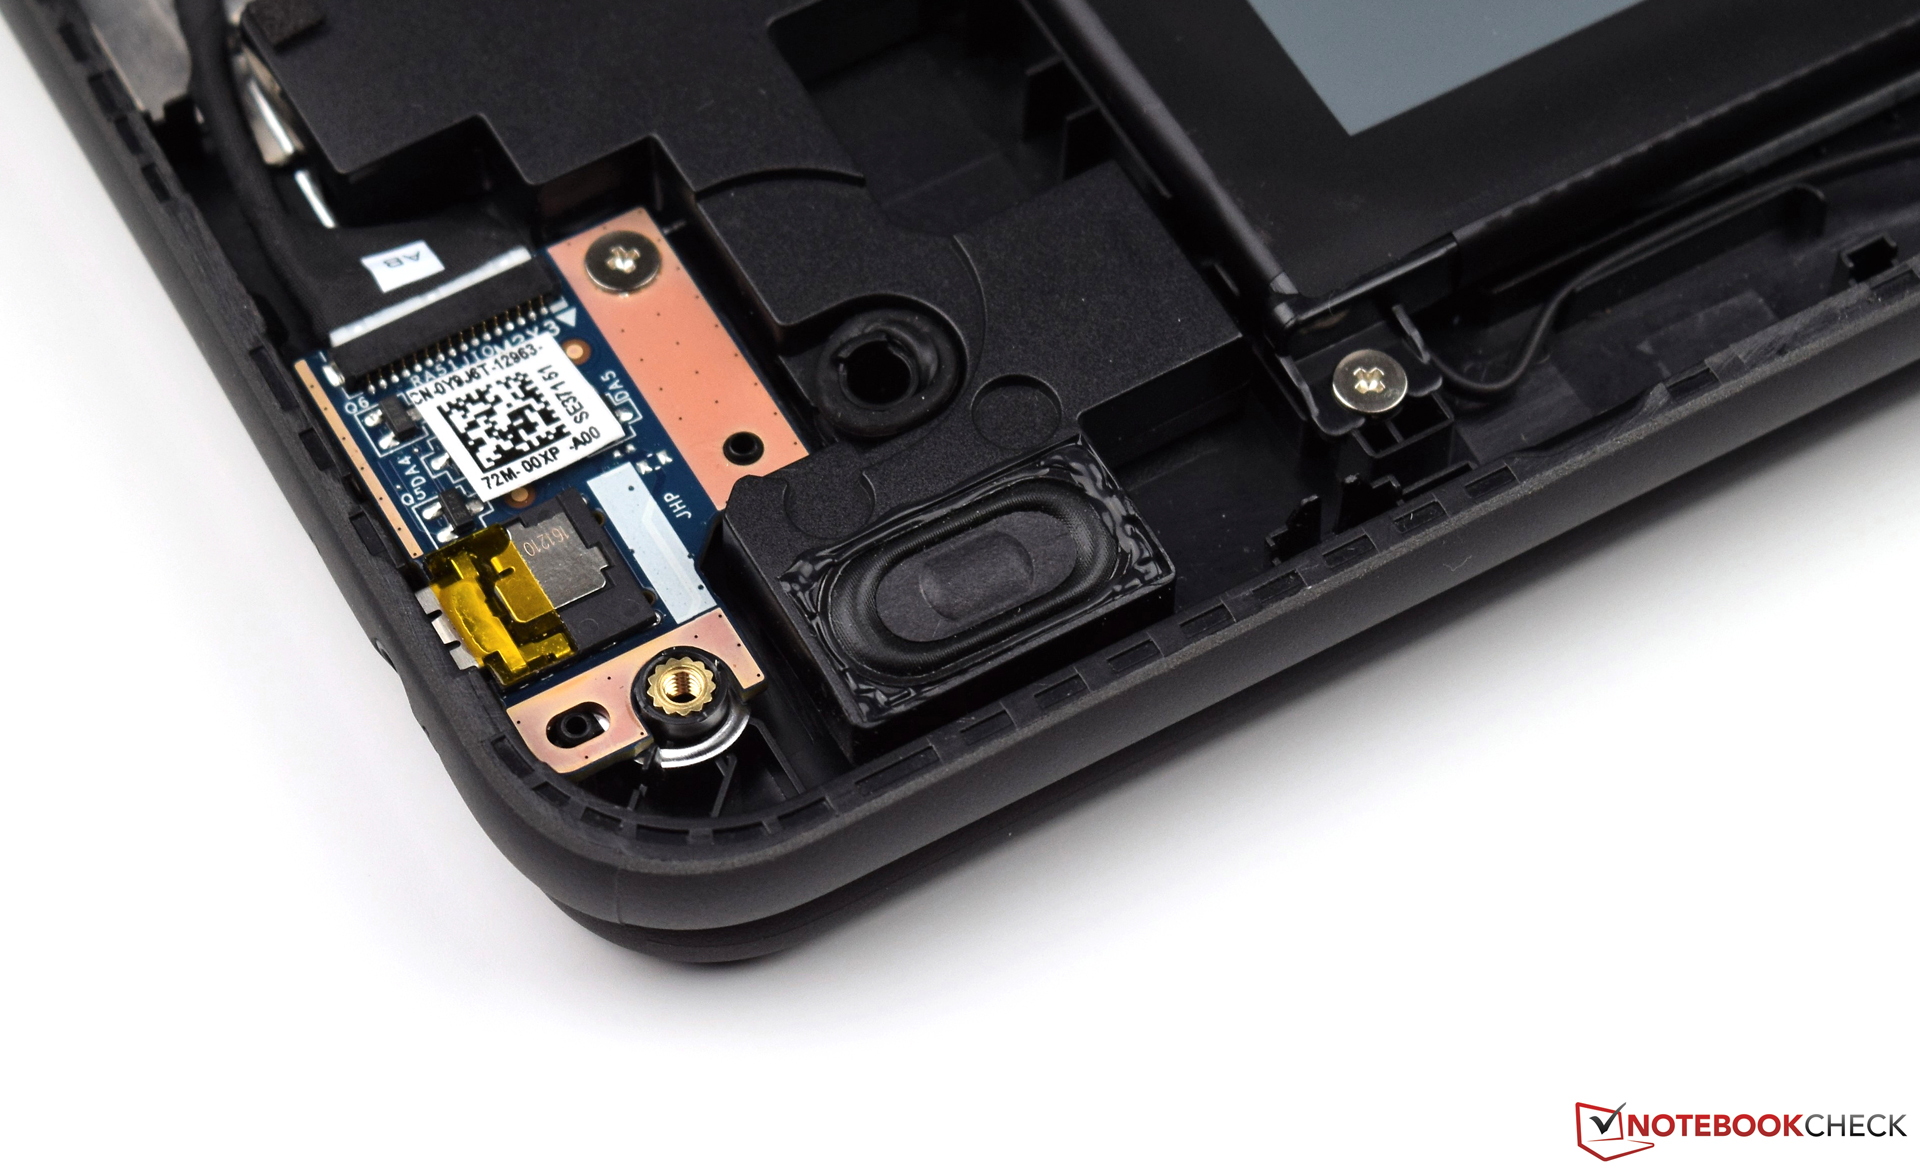
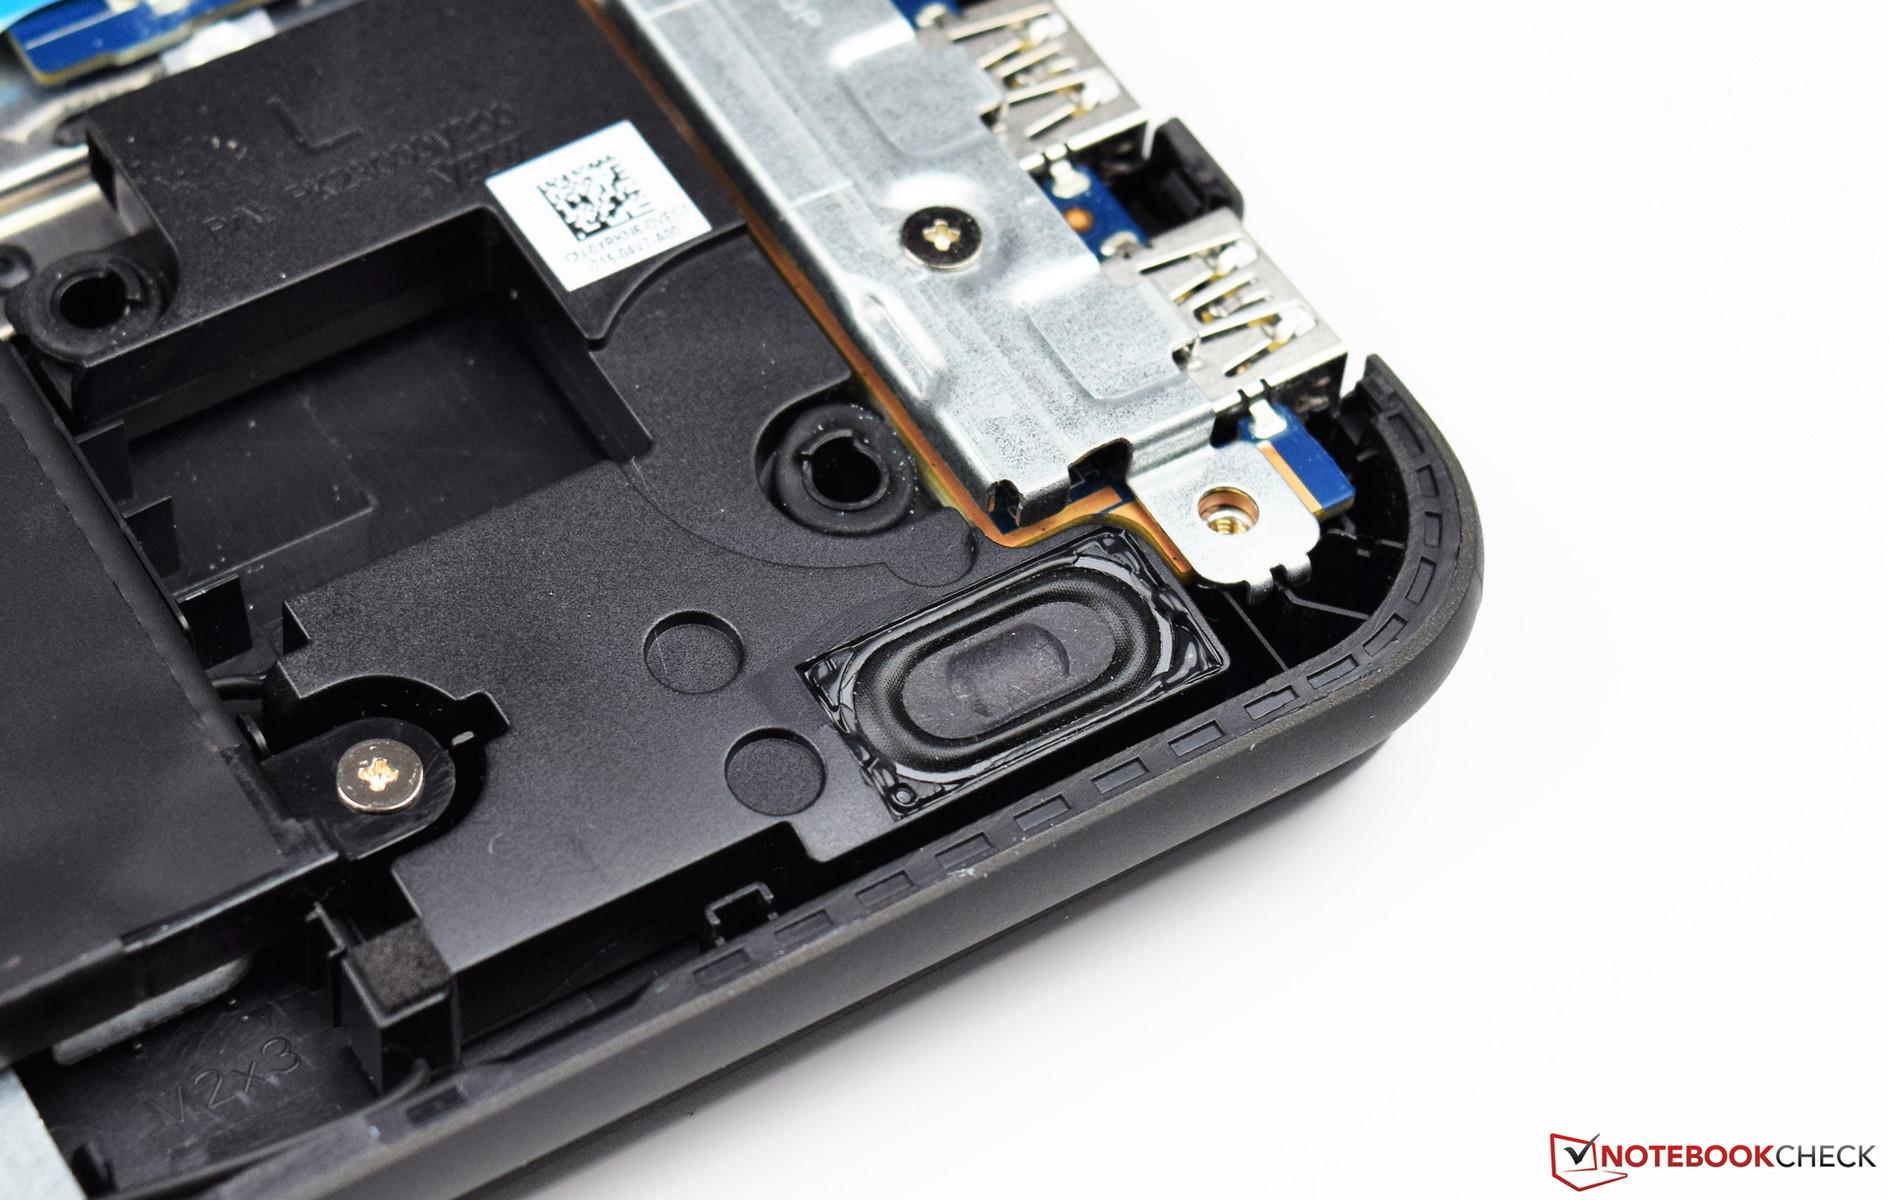
Dell Latitude 3189 análisis de audio
(+) | los altavoces pueden reproducir a un volumen relativamente alto (#83 dB)
Graves 100 - 315 Hz
(-) | casi sin bajos - de media 23.3% inferior a la mediana
(±) | la linealidad de los graves es media (8.3% delta a frecuencia anterior)
Medios 400 - 2000 Hz
(±) | medios reducidos - de media 5% inferior a la mediana
(±) | la linealidad de los medios es media (8.1% delta respecto a la frecuencia anterior)
Altos 2 - 16 kHz
(+) | máximos equilibrados - a sólo 4.5% de la mediana
(+) | los máximos son lineales (6.5% delta a la frecuencia anterior)
Total 100 - 16.000 Hz
(±) | la linealidad del sonido global es media (19.2% de diferencia con la mediana)
En comparación con la misma clase
» 46% de todos los dispositivos probados de esta clase eran mejores, 7% similares, 47% peores
» El mejor tuvo un delta de 6%, la media fue 20%, el peor fue ###max##%
En comparación con todos los dispositivos probados
» 46% de todos los dispositivos probados eran mejores, 7% similares, 47% peores
» El mejor tuvo un delta de 4%, la media fue 24%, el peor fue ###max##%
Apple MacBook 12 (Early 2016) 1.1 GHz análisis de audio
(+) | los altavoces pueden reproducir a un volumen relativamente alto (#83.6 dB)
Graves 100 - 315 Hz
(±) | lubina reducida - en promedio 11.3% inferior a la mediana
(±) | la linealidad de los graves es media (14.2% delta a frecuencia anterior)
Medios 400 - 2000 Hz
(+) | medios equilibrados - a sólo 2.4% de la mediana
(+) | los medios son lineales (5.5% delta a la frecuencia anterior)
Altos 2 - 16 kHz
(+) | máximos equilibrados - a sólo 2% de la mediana
(+) | los máximos son lineales (4.5% delta a la frecuencia anterior)
Total 100 - 16.000 Hz
(+) | el sonido global es lineal (10.2% de diferencia con la mediana)
En comparación con la misma clase
» 7% de todos los dispositivos probados de esta clase eran mejores, 2% similares, 91% peores
» El mejor tuvo un delta de 5%, la media fue 18%, el peor fue ###max##%
En comparación con todos los dispositivos probados
» 5% de todos los dispositivos probados eran mejores, 1% similares, 94% peores
» El mejor tuvo un delta de 4%, la media fue 24%, el peor fue ###max##%
| Off / Standby | |
| Ocioso | |
| Carga |
|
Clave:
min: | |
| Dell Latitude 3189 Pentium N4200, HD Graphics 505, Liteonit CV3-8D128, IPS, 1366x768, 11.6" | Medion Akoya P3401T 2in1 6Y54, HD Graphics 515, , IPS, 1920x1080, 12.5" | HP Pavilion 11-k103ng x360 N3050, HD Graphics (Braswell), Hitachi Travelstar Z5K500 HTS545050A7E680, IPS, 1366x768, 11.6" | HP Pavilion x360 13-u102ng i5-7200U, HD Graphics 620, HGST Travelstar 5K1000 HTS541010A7E630, IPS, 1920x1080, 13.3" | Lenovo Yoga 700-11ISK 6Y30, HD Graphics 515, Samsung SSD PM871 MZNLN256HCHP, IPS, 1920x1080, 11.6" | Acer Aspire Switch Alpha 12 SA5-271-56HM 6200U, HD Graphics 520, Kingston RBU-SNS8152S3256GG2, IPS, 2160x1440, 12" | |
|---|---|---|---|---|---|---|
| Power Consumption | -37% | -45% | -66% | -29% | -105% | |
| Idle Minimum * (Watt) | 2.17 | 3.8 -75% | 5.3 -144% | 4.7 -117% | 4.3 -98% | 7.3 -236% |
| Idle Average * (Watt) | 4.31 | 7.1 -65% | 7.1 -65% | 7.2 -67% | 7.1 -65% | 10 -132% |
| Idle Maximum * (Watt) | 5.79 | 8.1 -40% | 8.2 -42% | 7.9 -36% | 7.2 -24% | 10.15 -75% |
| Load Average * (Watt) | 15.8 | 19.1 -21% | 15.5 2% | 30 -90% | 14.6 8% | 25.2 -59% |
| Load Maximum * (Watt) | 24.2 | 20.2 17% | 18.9 22% | 29 -20% | 15.7 35% | 29.3 -21% |
* ... más pequeño es mejor

| Dell Latitude 3189 Pentium N4200, HD Graphics 505, 42 Wh | Medion Akoya P3401T 2in1 6Y54, HD Graphics 515, 51 Wh | HP Pavilion 11-k103ng x360 N3050, HD Graphics (Braswell), 32 Wh | HP Pavilion x360 13-u102ng i5-7200U, HD Graphics 620, 41 Wh | Lenovo Yoga 700-11ISK 6Y30, HD Graphics 515, 40 Wh | Acer Aspire Switch Alpha 12 SA5-271-56HM 6200U, HD Graphics 520, 37 Wh | |
|---|---|---|---|---|---|---|
| Duración de Batería | -28% | -52% | -52% | -21% | -40% | |
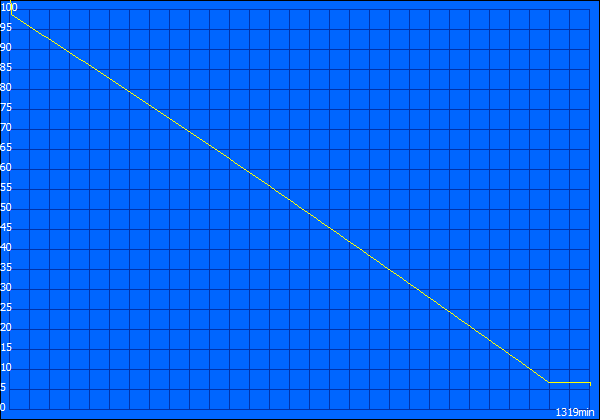
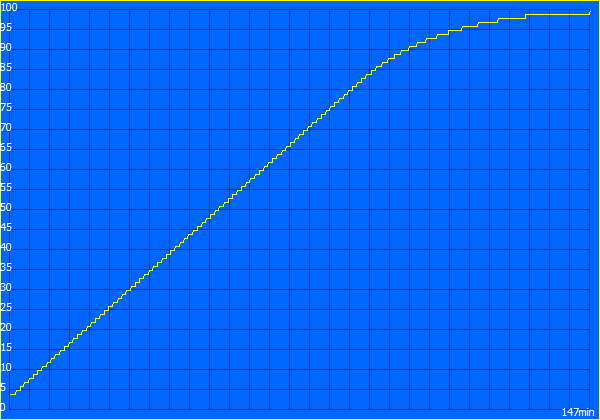
| Reader / Idle (h) | 22 | 9.3 -58% | 14.4 -35% | 10.7 -51% | ||
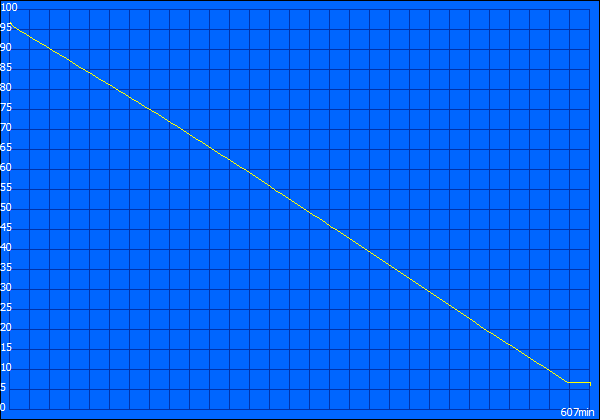
| H.264 (h) | 8.4 | 5.3 -37% | 7.7 -8% | 7.8 -7% | ||
| WiFi v1.3 (h) | 10.1 | 7.3 -28% | 4.8 -52% | 5.4 -47% | 7 -31% | 5.4 -47% |
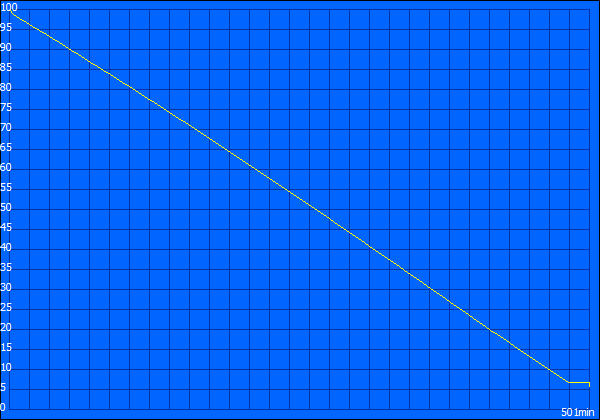
| Load (h) | 4.2 | 1.4 -67% | 3.8 -10% | 1.9 -55% |
Pro
Contra
Dell ha apuntado el Latitude 3189 principalmente al sector educativo. La base para ello se ha establecido con su robusto diseño. Otras características como una pantalla táctil son buenas y un valor añadido al dispositivo. Esto hace mucho más versátil el dispositivo. El Intel Pentium N4200, que se apoya en 4 GB de RAM DDR3, es lo máximo que el fabricante ofrece en rendimiento. No recomendaríamos la configuración CPU alternativa con el Intel Celeron N3350. Nuestro modelo de pruebas, que no es barato a 799 Euros, va bastante bien, pero con un Intel Celeron N3350 (dual core), el rendimiento sería bastante peor.
El Dell Latitude 3189 es un dispositivo muy robusto que ayuda a los niños a manejarse con los nuevos medios. La estable unidad base puede aguantar mucho gracias a su genial aguante de batería, una carga aguanta fácilmente un día entero de clase.
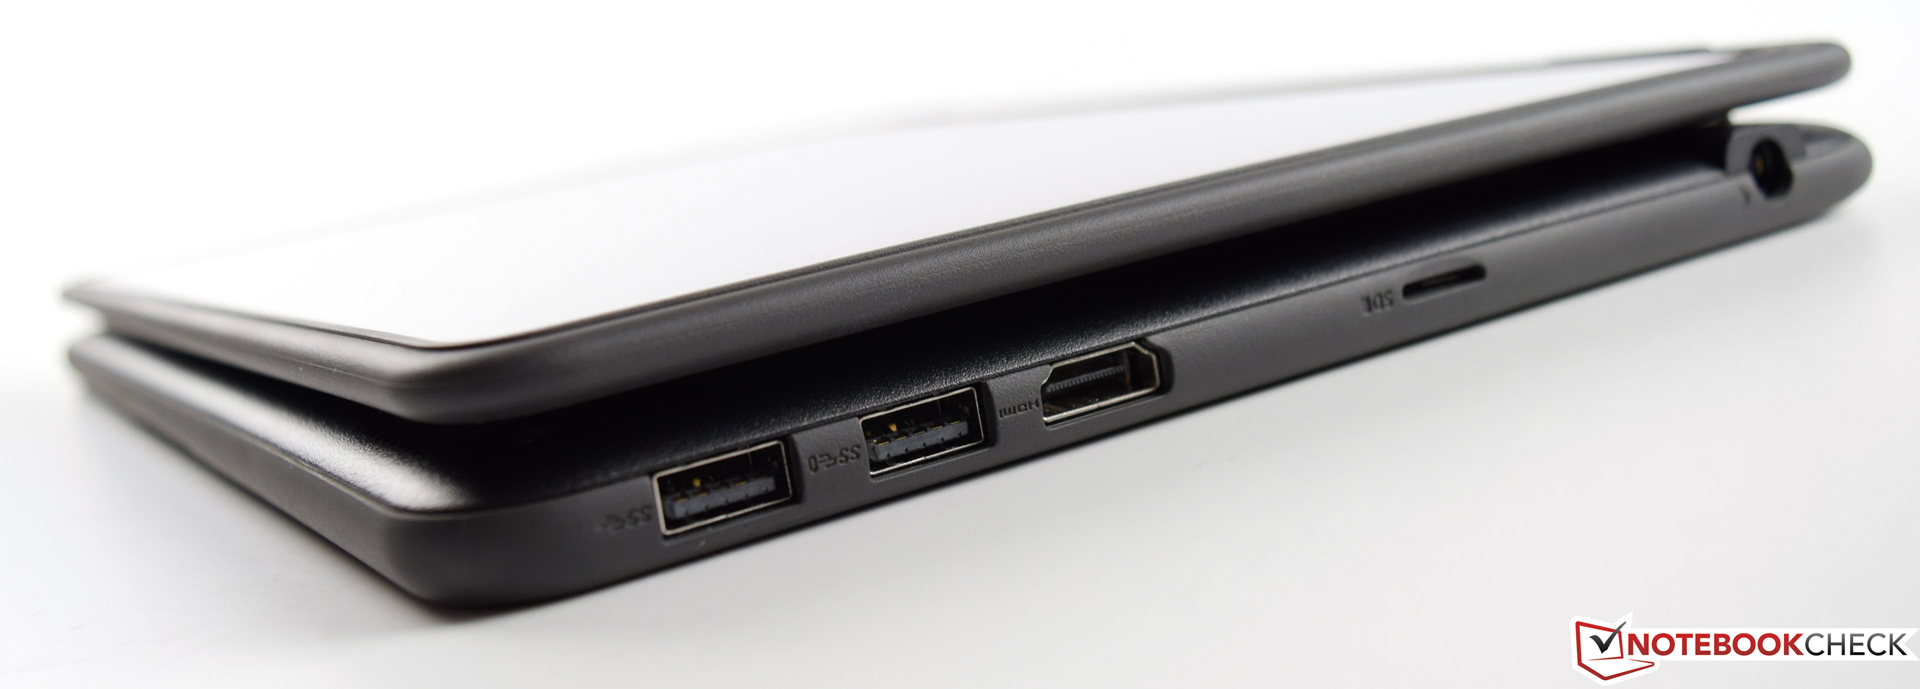
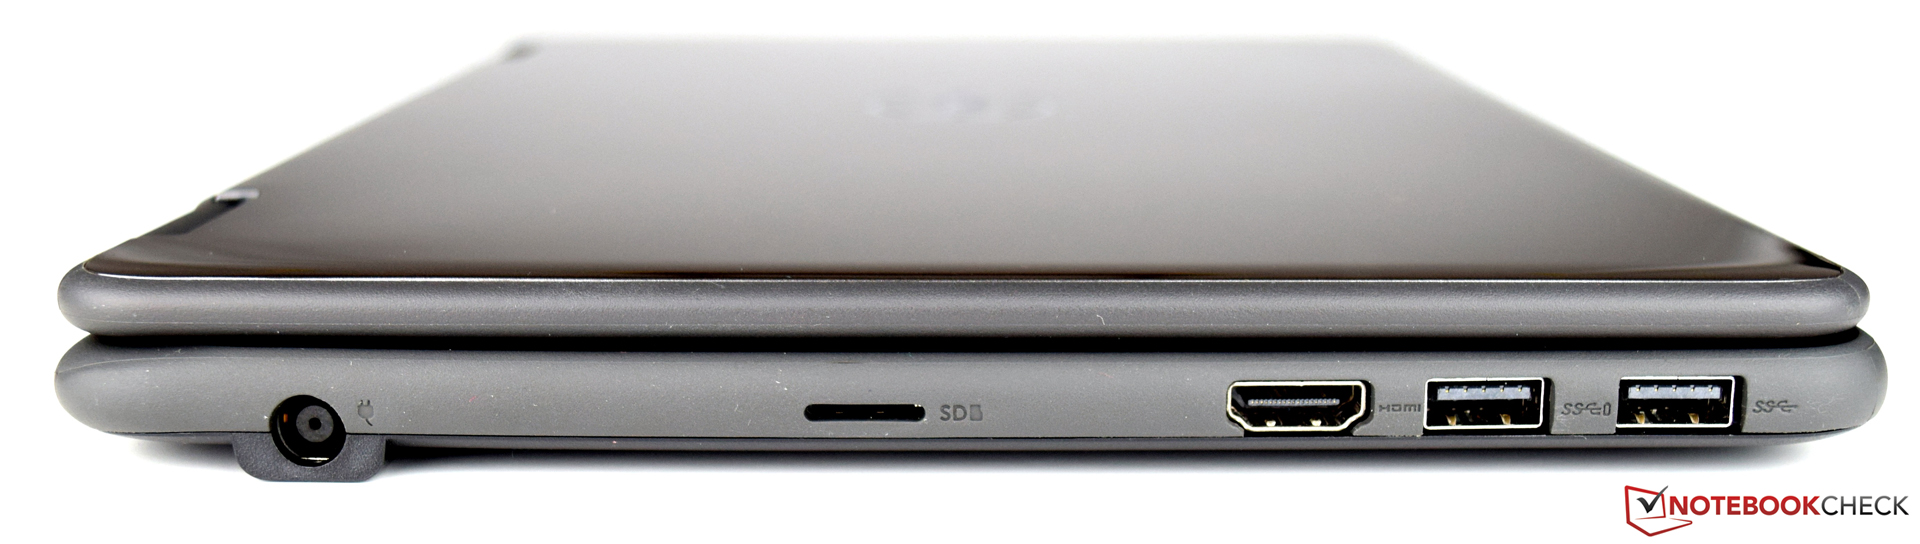
Tenemos un par de cosas que criticar del Dell Latitude 3189: por ejemplo, la falta de puerto USB Type-C, que aseguraría el futuro del dispositivo, y el display tan reflectante, que puede resultar irritante y puede dificultar trabajar en espacios iluminados. El almacenamiento tiene sus ventajas y desventajas. Una vez instalado el sistema operativo y algunos programas, no queda mucho espacio libre de los 128 GB. En general, podemos decir que a pesar de no hacerlo tan bien en algunas áreas respecto a otros modelos de pruebas, el Dell Latitude 3189 hace una labor sólida. El rendimiento de sistema subjetivo fue mucho mejor de lo que mostaron los resultados de pruebas.
Ésta es una versión acortada del análisis original. Puedes leer el análisis completo en inglés aquí.
Dell Latitude 3189
- 04/25/2017 v6 (old)
Sebastian Bade