Breve análisis del Convertible Microsoft Surface Book (Core i7, 940M)
| |||||||||||||||||||||||||
iluminación: 88 %
Brillo con batería: 438 cd/m²
Contraste: 1752:1 (Negro: 0.25 cd/m²)
ΔE ColorChecker Calman: 2.06 | ∀{0.5-29.43 Ø4.71}
ΔE Greyscale Calman: 2.87 | ∀{0.09-98 Ø4.96}
96% sRGB (Argyll 1.6.3 3D)
64% AdobeRGB 1998 (Argyll 1.6.3 3D)
68% AdobeRGB 1998 (Argyll 3D)
96% sRGB (Argyll 3D)
66.3% Display P3 (Argyll 3D)
Gamma: 2.44
CCT: 6820 K
| Microsoft Surface Book Core i7 13.5", 3000x2000 | Apple MacBook Pro Retina 13 inch 2015-03 13.3", 2560x1600 | Toshiba KIRA-10D 13.3", 1920x1080 | Microsoft Surface Pro 4, Core i5, 128GB 12.3", 2736x1824 | Dell XPS 13 9343 Core i7 13.3", 3200x1800 | HP Spectre x360 13-4104ng 13.3", 2560x1440 | HP Spectre x2 12-a003ng K3D42EA 12", 1920x1080 | |
|---|---|---|---|---|---|---|---|
| Display | -0% | 3% | -1% | -6% | -1% | -23% | |
| Display P3 Coverage (%) | 66.3 | 65.9 -1% | 69.1 4% | 65 -2% | 62.6 -6% | 66.8 1% | 52.9 -20% |
| sRGB Coverage (%) | 96 | 97 1% | 98.2 2% | 96.5 1% | 89.8 -6% | 92.8 -3% | 71.8 -25% |
| AdobeRGB 1998 Coverage (%) | 68 | 67.4 -1% | 71 4% | 67 -1% | 64.2 -6% | 67.3 -1% | 52.6 -23% |
| Response Times | -5% | 41% | 2% | ||||
| Response Time Grey 50% / Grey 80% * (ms) | 39 ? | 46 ? -18% | 24 ? 38% | 47 ? -21% | |||
| Response Time Black / White * (ms) | 34 ? | 31.2 ? 8% | 19 ? 44% | 26 ? 24% | |||
| PWM Frequency (Hz) | 50 ? | ||||||
| Screen | -9% | -11% | -20% | -28% | -34% | -59% | |
| Brightness middle (cd/m²) | 438 | 361 -18% | 334 -24% | 413 -6% | 232 -47% | 324 -26% | 353 -19% |
| Brightness (cd/m²) | 414 | 342 -17% | 316 -24% | 396 -4% | 231 -44% | 324 -22% | 347 -16% |
| Brightness Distribution (%) | 88 | 81 -8% | 92 5% | 87 -1% | 82 -7% | 90 2% | 91 3% |
| Black Level * (cd/m²) | 0.25 | 0.361 -44% | 0.29 -16% | 0.36 -44% | 0.25 -0% | 0.34 -36% | 0.44 -76% |
| Contrast (:1) | 1752 | 1000 -43% | 1152 -34% | 1147 -35% | 928 -47% | 953 -46% | 802 -54% |
| Colorchecker dE 2000 * | 2.06 | 1.82 12% | 2.27 -10% | 3.09 -50% | 3.63 -76% | 4.36 -112% | 6.09 -196% |
| Greyscale dE 2000 * | 2.87 | 1.8 37% | 2.47 14% | 3.92 -37% | 2.57 10% | 4.62 -61% | 6.24 -117% |
| Gamma | 2.44 90% | 2.49 88% | 2.36 93% | 2.3 96% | 2.17 101% | 2.18 101% | 2.41 91% |
| CCT | 6820 95% | 6417 101% | 6872 95% | 7333 89% | 6422 101% | 6857 95% | 7238 90% |
| Color Space (Percent of AdobeRGB 1998) (%) | 64 | 61.9 -3% | 64 0% | 61 -5% | 58 -9% | 60 -6% | 46 -28% |
| Color Space (Percent of sRGB) (%) | 96 | 96.9 1% | 97 1% | 93 -3% | 71 -26% | ||
| Colorchecker dE 2000 max. * | 3.26 | ||||||
| Media total (Programa/Opciones) | -5% /
-7% | -4% /
-7% | -9% /
-14% | -17% /
-22% | 2% /
-17% | -27% /
-42% |
* ... más pequeño es mejor
Tiempos de respuesta del display
| ↔ Tiempo de respuesta de Negro a Blanco | ||
|---|---|---|
| 34 ms ... subida ↗ y bajada ↘ combinada | ↗ 10 ms subida | 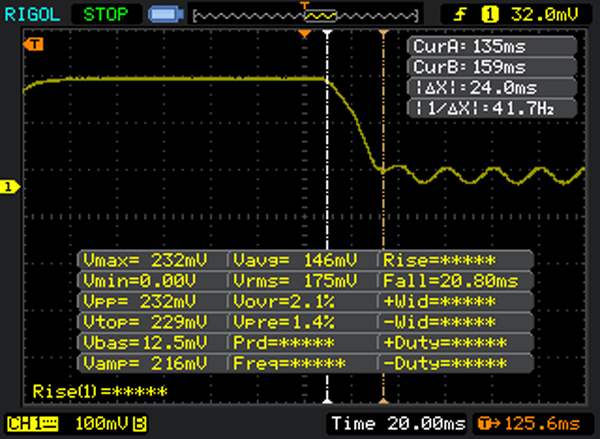 |
| ↘ 24 ms bajada | ||
| La pantalla mostró tiempos de respuesta lentos en nuestros tests y podría ser demasiado lenta para los jugones. En comparación, todos los dispositivos de prueba van de ##min### (mínimo) a 240 (máximo) ms. » 91 % de todos los dispositivos son mejores. Eso quiere decir que el tiempo de respuesta es peor que la media (19.8 ms) de todos los dispositivos testados. | ||
| ↔ Tiempo de respuesta 50% Gris a 80% Gris | ||
| 39 ms ... subida ↗ y bajada ↘ combinada | ↗ 24 ms subida | 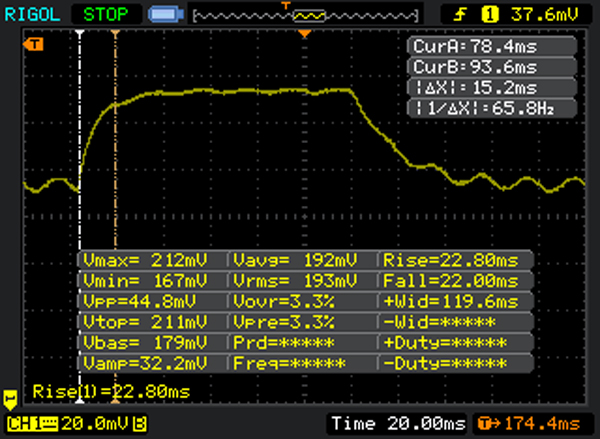 |
| ↘ 15 ms bajada | ||
| La pantalla mostró tiempos de respuesta lentos en nuestros tests y podría ser demasiado lenta para los jugones. En comparación, todos los dispositivos de prueba van de ##min### (mínimo) a 636 (máximo) ms. » 59 % de todos los dispositivos son mejores. Eso quiere decir que el tiempo de respuesta es peor que la media (31 ms) de todos los dispositivos testados. | ||
Parpadeo de Pantalla / PWM (Pulse-Width Modulation)
| Parpadeo de Pantalla / PWM no detectado | ||
Comparación: 52 % de todos los dispositivos testados no usaron PWM para atenuar el display. Si se usó, medimos una media de 7754 (mínimo: 5 - máxmo: 343500) Hz. | ||
| PCMark 7 | |
| Score (ordenar por valor) | |
| Microsoft Surface Book Core i7 | |
| Microsoft Surface Book Core i5 | |
| Microsoft Surface Pro 4, Core m3 | |
| Microsoft Surface Pro 4, Core i5, 128GB | |
| Microsoft Surface Pro 4 Core i7 | |
| HP EliteBook Folio 1040 G2 | |
| Apple MacBook Pro Retina 13 inch 2015-03 | |
| Toshiba KIRA-10D | |
| HP Spectre x360 13-4104ng | |
| HP Spectre x360 13-4104ng | |
| Productivity (ordenar por valor) | |
| Microsoft Surface Book Core i7 | |
| Microsoft Surface Book Core i5 | |
| Microsoft Surface Pro 4, Core i5, 128GB | |
| Microsoft Surface Pro 4 Core i7 | |
| HP EliteBook Folio 1040 G2 | |
| Apple MacBook Pro Retina 13 inch 2015-03 | |
| HP Spectre x360 13-4104ng | |
| HP Spectre x360 13-4104ng | |
| PCMark 7 Score | 5178 puntos | |
| PCMark 8 Home Score Accelerated v2 | 2947 puntos | |
| PCMark 8 Creative Score Accelerated v2 | 3755 puntos | |
| PCMark 8 Work Score Accelerated v2 | 3782 puntos | |
ayuda | ||
| Microsoft Surface Book Core i7 13.5", 3000x2000 | Microsoft Surface Book Core i5 13.5", 3000x2000 | Microsoft Surface Pro 4 Core i7 12.3", 2736x1824 | HP EliteBook Folio 1040 G2 14", 1920x1080 | Apple MacBook Pro Retina 13 inch 2015-03 13.3", 2560x1600 | Toshiba KIRA-10D 13.3", 1920x1080 | Dell XPS 13 9343 Core i7 13.3", 3200x1800 | HP Spectre x2 12-a003ng K3D42EA 12", 1920x1080 | |
|---|---|---|---|---|---|---|---|---|
| AS SSD | -14% | -15% | -50% | -29% | -47% | -48% | -60% | |
| Seq Read (MB/s) | 1342 | 1223 -9% | 1312 -2% | 480.7 -64% | 1233 -8% | 515 -62% | 515 -62% | 439.1 -67% |
| Seq Write (MB/s) | 545 | 275.2 -50% | 274.8 -50% | 250.1 -54% | 616 13% | 467.6 -14% | 233.4 -57% | 216.9 -60% |
| 4K Read (MB/s) | 37.25 | 34.31 -8% | 33.47 -10% | 25.98 -30% | 20.6 -45% | 21.74 -42% | 26.28 -29% | 23.12 -38% |
| 4K Write (MB/s) | 109 | 85 -22% | 89.2 -18% | 84.4 -23% | 30.2 -72% | 78.8 -28% | 91.7 -16% | 49.2 -55% |
| 4K-64 Read (MB/s) | 919 | 1409 53% | 1280 39% | 356.1 -61% | 891 -3% | 352.6 -62% | 359 -61% | 265.6 -71% |
| 4K-64 Write (MB/s) | 520 | 281.4 -46% | 268.7 -48% | 182.7 -65% | 221.2 -57% | 149.7 -71% | 181 -65% | 151.8 -71% |
| CrystalDiskMark 3.0 | -27% | -39% | -1% | -31% | -40% | -52% | ||
| Read Seq (MB/s) | 953 | 834 -12% | 499.9 -48% | 1403 47% | 530 -44% | 527 -45% | 410.1 -57% | |
| Write Seq (MB/s) | 592 | 304 -49% | 264.3 -55% | 657 11% | 474.3 -20% | 237.2 -60% | 316 -47% | |
| Read 512 (MB/s) | 520 | 396.7 -24% | 418.9 -19% | 810 56% | 426.1 -18% | 420.5 -19% | 260.8 -50% | |
| Write 512 (MB/s) | 591 | 304.3 -49% | 264.6 -55% | 648 10% | 445.8 -25% | 241.6 -59% | 241.6 -59% | |
| Read 4k (MB/s) | 42.66 | 40.75 -4% | 28.4 -33% | 20.95 -51% | 23.27 -45% | 28.29 -34% | 27.4 -36% | |
| Write 4k (MB/s) | 136.3 | 106.3 -22% | 101.2 -26% | 32.43 -76% | 90.1 -34% | 103.7 -24% | 53.5 -61% | |
| Media total (Programa/Opciones) | -14% /
-14% | -21% /
-21% | -45% /
-44% | -15% /
-15% | -39% /
-39% | -44% /
-44% | -56% /
-56% |

| Microsoft Surface Book Core i7 13.5", 3000x2000 | Microsoft Surface Book i7 Heat Keyboard iGPU 13.5", 3000x2000 | Microsoft Surface Book Core i5 13.5", 3000x2000 | Microsoft Surface Pro 4, Core m3 12.3", 2736x1824 | Microsoft Surface Pro 4, Core i5, 128GB 12.3", 2736x1824 | Microsoft Surface Pro 4 Core i7 12.3", 2736x1824 | HP EliteBook Folio 1040 G2 14", 1920x1080 | Apple MacBook Pro Retina 13 inch 2015-03 13.3", 2560x1600 | Dell XPS 13 9343 Core i7 13.3", 3200x1800 | HP Spectre x2 12-a003ng K3D42EA 12", 1920x1080 | |
|---|---|---|---|---|---|---|---|---|---|---|
| 3DMark 11 | -32% | -5% | -47% | -35% | -3% | -47% | -28% | -44% | -56% | |
| 1280x720 Performance Physics (Points) | 4760 | 4765 0% | 4199 -12% | 3067 -36% | 3984 -16% | 4919 3% | 3692 -22% | 4084 -14% | 3845 -19% | 2604 -45% |
| 1280x720 Performance GPU (Points) | 2606 | 1319 -49% | 2548 -2% | 1206 -54% | 1402 -46% | 2450 -6% | 1011 -61% | 1706 -35% | 1115 -57% | 996 -62% |
| 1280x720 Performance (Points) | 2761 | 1480 -46% | 2711 -2% | 1344 -51% | 1565 -43% | 2624 -5% | 1133 -59% | 1828 -34% | 1252 -55% | 1098 -60% |
| 3DMark | -34% | -2% | -36% | -19% | 12% | -11% | -14% | -21% | -36% | |
| 1280x720 Cloud Gate Standard Physics (Points) | 3745 | 3701 -1% | 3362 -10% | 2238 -40% | 3342 -11% | 3639 -3% | 3185 -15% | 3527 -6% | 3362 -10% | 2304 -38% |
| 1280x720 Ice Storm Standard Physics (Points) | 36360 | 31340 -14% | 38206 5% | 25720 -29% | 38764 7% | 44259 22% | 37081 2% | 38688 6% | 38854 7% | 27821 -23% |
| 1280x720 Ice Storm Standard Graphics (Points) | 54706 | 22709 -58% | 54088 -1% | 51362 -6% | 56071 2% | 91565 67% | 60003 10% | 60636 11% | 54695 0% | 50126 -8% |
| 1280x720 Cloud Gate Standard Graphics (Points) | 11420 | 6274 -45% | 11340 -1% | 6597 -42% | 7455 -35% | 11650 2% | 6585 -42% | 7894 -31% | 6475 -43% | 6298 -45% |
| 1920x1080 Fire Strike Graphics (Points) | 2120 | 1010 -52% | 2031 -4% | 810 -62% | 905 -57% | 1477 -30% | 1020 -52% | 834 -61% | 725 -66% | |
| Media total (Programa/Opciones) | -33% /
-33% | -4% /
-3% | -42% /
-40% | -27% /
-25% | 5% /
6% | -29% /
-27% | -21% /
-19% | -33% /
-30% | -46% /
-43% |
| 3DMark 11 Performance | 2761 puntos | |
| 3DMark Ice Storm Standard Score | 50418 puntos | |
| 3DMark Cloud Gate Standard Score | 7505 puntos | |
| 3DMark Fire Strike Score | 1952 puntos | |
ayuda | ||
| Microsoft Surface Book Core i7 13.5", 3000x2000 | Microsoft Surface Book Core i5 13.5", 3000x2000 | Microsoft Surface Pro 4 Core i7 12.3", 2736x1824 | HP EliteBook Folio 1040 G2 14", 1920x1080 | Apple MacBook Pro Retina 13 inch 2015-03 13.3", 2560x1600 | Toshiba KIRA-10D 13.3", 1920x1080 | Dell XPS 13 9343 Core i7 13.3", 3200x1800 | HP Spectre x360 13-4104ng 13.3", 2560x1440 | |
|---|---|---|---|---|---|---|---|---|
| Noise | 3% | 3% | 4% | -1% | -2% | -3% | 3% | |
| apagado / medio ambiente * (dB) | 31.3 | |||||||
| Idle Minimum * (dB) | 31.3 | 29.5 6% | 28.4 9% | 29.6 5% | 29 7% | 29.6 5% | 29.6 5% | 29.6 5% |
| Idle Average * (dB) | 31.3 | 29.6 5% | 28.6 9% | 29.6 5% | 29 7% | 29.6 5% | 29.6 5% | 29.6 5% |
| Idle Maximum * (dB) | 31.3 | 29.7 5% | 28.7 8% | 32.2 -3% | 29 7% | 30.7 2% | 33.2 -6% | 34.6 -11% |
| Load Average * (dB) | 38 | 37.5 1% | 40.8 -7% | 36.4 4% | 42.5 -12% | 43.9 -16% | 43.2 -14% | 34.7 9% |
| Load Maximum * (dB) | 40.5 | 40.9 -1% | 41.4 -2% | 36.4 10% | 45.6 -13% | 43.9 -8% | 43.2 -7% | 37.9 6% |
* ... más pequeño es mejor
Ruido
| Ocioso |
| 31.3 / 31.3 / 31.3 dB(A) |
| Carga |
| 38 / 40.5 dB(A) |
 | ||
30 dB silencioso 40 dB(A) audible 50 dB(A) ruidosamente alto |
||
min: | ||
| Microsoft Surface Book Core i7 13.5", 3000x2000 | Microsoft Surface Book Core i5 13.5", 3000x2000 | Microsoft Surface Pro 4, Core i5, 128GB 12.3", 2736x1824 | Microsoft Surface Pro 4 Core i7 12.3", 2736x1824 | HP EliteBook Folio 1040 G2 14", 1920x1080 | Apple MacBook Pro Retina 13 inch 2015-03 13.3", 2560x1600 | Toshiba KIRA-10D 13.3", 1920x1080 | Dell XPS 13 9343 Core i7 13.3", 3200x1800 | HP Spectre x2 12-a003ng K3D42EA 12", 1920x1080 | |
|---|---|---|---|---|---|---|---|---|---|
| Heat | 13% | -21% | 12% | 10% | 7% | 13% | 14% | 2% | |
| Maximum Upper Side * (°C) | 47.4 | 44.2 7% | 52.3 -10% | 45.4 4% | 35.9 24% | 45.1 5% | 42.2 11% | 43.4 8% | 43.5 8% |
| Maximum Bottom * (°C) | 50.2 | 41.2 18% | 51.4 -2% | 43.2 14% | 42.4 16% | 39.6 21% | 34.4 31% | 37 26% | 42 16% |
| Idle Upper Side * (°C) | 30.4 | 26 14% | 43.2 -42% | 25.2 17% | 28.5 6% | 28.5 6% | 26.2 14% | 25.9 15% | 33 -9% |
| Idle Bottom * (°C) | 27.4 | 23.8 13% | 36 -31% | 24 12% | 29 -6% | 28.3 -3% | 28.5 -4% | 25.1 8% | 29.3 -7% |
* ... más pequeño es mejor
Heat Tablet
(-) La temperatura máxima en la parte superior es de 47.4 °C / 117 F, frente a la media de 35.4 °C / 96 F, que oscila entre 19.6 y 60 °C para la clase Convertible.
(-) El fondo se calienta hasta un máximo de 50.2 °C / 122 F, frente a la media de 36.9 °C / 98 F
(+) En reposo, la temperatura media de la parte superior es de 26.6 °C / 80# F, frente a la media del dispositivo de 30.3 °C / 87 F.
(-) El reposamanos y el touchpad pueden calentarse mucho al tacto con un máximo de 47.35 °C / 117.2 F.
(-) La temperatura media de la zona del reposamanos de dispositivos similares fue de 28 °C / 82.4 F (-19.4 °C / -34.8 F).
Heat Keyboard with Maxwell Geforce
(+) La temperatura máxima en la parte superior es de 39.6 °C / 103 F, frente a la media de 35.4 °C / 96 F, que oscila entre 19.6 y 60 °C para la clase Convertible.
(±) El fondo se calienta hasta un máximo de 40.7 °C / 105 F, frente a la media de 36.9 °C / 98 F
(+) El reposamanos y el panel táctil están a una temperatura inferior a la de la piel, con un máximo de 28.6 °C / 83.5 F y, por tanto, son fríos al tacto.
(±) La temperatura media de la zona del reposamanos de dispositivos similares fue de 28 °C / 82.4 F (-0.6 °C / -1.1 F).
| Microsoft Surface Book Core i7 13.5", 3000x2000 | Microsoft Surface Pro 4, Core i5, 128GB 12.3", 2736x1824 | HP EliteBook Folio 1040 G2 14", 1920x1080 | Apple MacBook Pro Retina 13 inch 2015-03 13.3", 2560x1600 | Toshiba KIRA-10D 13.3", 1920x1080 | Dell XPS 13 9343 Core i7 13.3", 3200x1800 | HP Spectre x360 13-4104ng 13.3", 2560x1440 | HP Spectre x2 12-a003ng K3D42EA 12", 1920x1080 | |
|---|---|---|---|---|---|---|---|---|
| Power Consumption | 29% | 40% | 13% | 41% | 8% | 30% | 35% | |
| Idle Minimum * (Watt) | 4.5 | 4.4 2% | 3.2 29% | 2.8 38% | 2.6 42% | 6.6 -47% | 3.9 13% | 4.5 -0% |
| Idle Average * (Watt) | 9.8 | 9 8% | 6.5 34% | 7.8 20% | 6.3 36% | 9.3 5% | 7.4 24% | 7.7 21% |
| Idle Maximum * (Watt) | 12.2 | 10.7 12% | 7.4 39% | 8.1 34% | 6.5 47% | 11 10% | 9.2 25% | 8.3 32% |
| Load Average * (Watt) | 46 | 19.6 57% | 25.6 44% | 52.4 -14% | 30.9 33% | 32.2 30% | 28.1 39% | 19.8 57% |
| Load Maximum * (Watt) | 56 | 19.9 64% | 26.1 53% | 62.8 -12% | 30.9 45% | 33.2 41% | 27.6 51% | 20.6 63% |
* ... más pequeño es mejor
| Off / Standby | |
| Ocioso | |
| Carga |
|
Clave:
min: | |
Pro
Contra
Lo intenta con fuerza y puede puntuar en más de una ocasión que su hermano Core i5 de nuestro primer análisis del Surface Book. El factor decisivo fue la mayor duración de batería, ya que sólo pudiumos encontrar - si acaso - pequeñísimas ventajas en la versión i7/512 GB respecto a rendimiento de procesador y aplicación. El gran SSD logra mayores velocidades de escritura, lo que es un aspecto. El desarrollo de calor es mayor comparado con el modelo i5, pero el reposamanos permanece cómodamente fresco. Nuestras mediciones de consumo las hicimos para el Surface Book por primera vez en este análisis.
Chippy, uno de nuestros editores de vídeo, mostró en su Power Director Renders Test (Intel Quick Sync) que el Surface Book i7 es casi un 30% más rápido que los rivales Lenovo Miix 700 (core m3), HP Spectre X2 (Core m7) y Microsoft Surface Pro 3 (Haswell Core i5). La razón: La ventilación activa asegura un alto uso del Turbo incluso durante el test de estrés, mientras que los sistemas sin ventilador tienen que reducir sus frecuencias. El potente Surface Book – da igual si es Core i5 o i7 – es por tanto adeucado para las aplicaciones especiales y centradas en el procesador que tienen que realizarse en el camino de vez en cuando (rendimiento completo en batería).
Si quieres guardar cada minuto durante el renderizado, el Surface Book es ciertamente la mejor elección. Ofrece el rendimiento CPU de un pequeño portátil multimedia y puede vencer a competidores de tamaño similar como el MacBook Pro 13 o Dell XPS 13. Tendrás que decidir por ti mismo si esto vale los de 2,000 a casi 3,000 Euros. Pero el Surface Book es sin duda una buena elección para los entusiastas de la tecnología.
Todos los detalles del Surface Book están disponibles en el análisis de la versión Core i5: Microsoft Surface Book Core i5.
Nota: Ajustamos la valoración del Surface Book i5 debido a una nueva versión de valoración. Gracias a la mayor subvaloración de conectividad, la valoración final aumenta de 85 a 86%.
Ésta es una versión acortada del análisis original. Puedes leer el análisis completo en inglés aquí.
Microsoft Surface Book Core i7
- 04/27/2016 v5.1 (old)
Sebastian Jentsch
Price comparison
