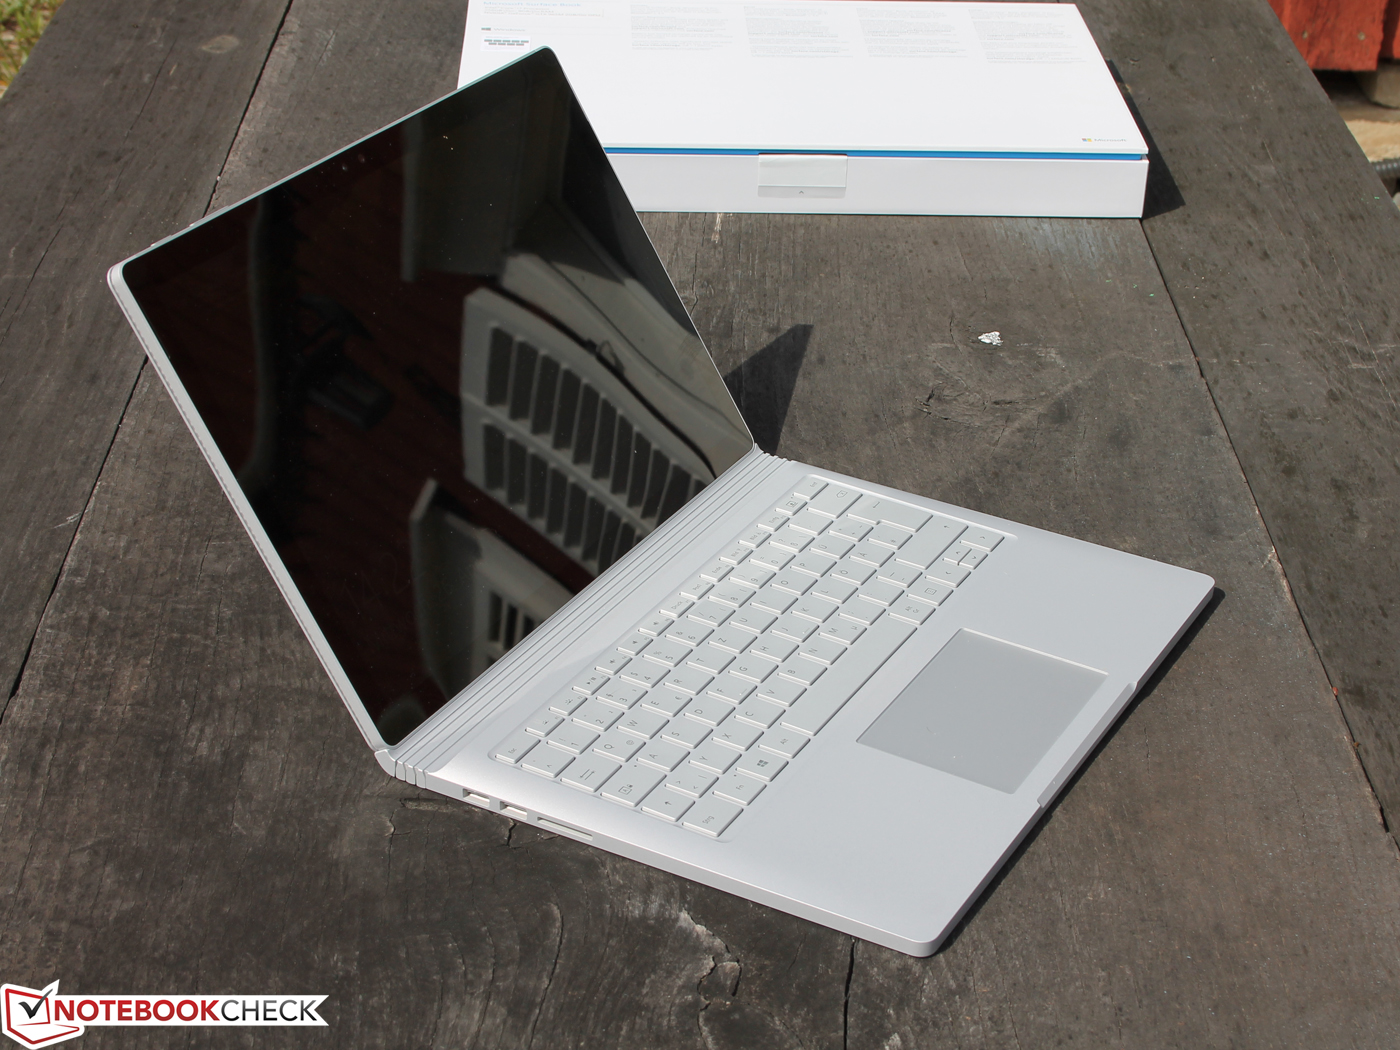
Breve análisis del convertible Microsoft Surface Book (GTX 965M)
| |||||||||||||||||||||||||
iluminación: 86 %
Brillo con batería: 459 cd/m²
Contraste: 1241:1 (Negro: 0.37 cd/m²)
ΔE ColorChecker Calman: 2.28 | ∀{0.5-29.43 Ø4.72}
ΔE Greyscale Calman: 2.48 | ∀{0.09-98 Ø4.97}
96% sRGB (Argyll 1.6.3 3D)
62% AdobeRGB 1998 (Argyll 1.6.3 3D)
67.6% AdobeRGB 1998 (Argyll 3D)
95.4% sRGB (Argyll 3D)
66.4% Display P3 (Argyll 3D)
Gamma: 2.5
CCT: 8602 K
| Microsoft Surface Book with Performance Base Panasonic MEI96A2, , 3000x2000, 13.5" | Microsoft Surface Book Core i5 3000x2000, 13.5" | Microsoft Surface Pro 4, Core i5, 128GB Samsung 123YL01-001 ID: SDC3853, , 2736x1824, 12.3" | HP Spectre x360 15-bl002xx UHD UWVA eDP BrightView WLED-backlit , , 3840x2160, 15.6" | Lenovo Yoga 710-14IKB 80V4002HGE AU Optronics B140HAN03.0, , 1920x1080, 14" | Asus UX310UQ-FC396T AU Optronics AUO272D, , 1920x1080, 13.3" | Apple MacBook Pro 13 2016 (2.9 GHz) APPA033, , 2560x1600, 13.3" | |
|---|---|---|---|---|---|---|---|
| Display | 1% | -1% | -4% | -6% | -3% | 28% | |
| Display P3 Coverage (%) | 66.4 | 67 1% | 65 -2% | 67.9 2% | 62 -7% | 64.1 -3% | 99.2 49% |
| sRGB Coverage (%) | 95.4 | 95.8 0% | 96.5 1% | 88.2 -8% | 89.5 -6% | 92.2 -3% | 99.9 5% |
| AdobeRGB 1998 Coverage (%) | 67.6 | 68.9 2% | 67 -1% | 64.4 -5% | 63.3 -6% | 65.3 -3% | 87.6 30% |
| Response Times | 16% | 21% | 12% | 12% | 46% | -10% | |
| Response Time Grey 50% / Grey 80% * (ms) | 61 ? | 48.4 ? 21% | 46 ? 25% | 44 ? 28% | 53 ? 13% | 31 ? 49% | 47.2 ? 23% |
| Response Time Black / White * (ms) | 37 ? | 32.8 ? 11% | 31.2 ? 16% | 38.8 ? -5% | 33 ? 11% | 21 ? 43% | 53 ? -43% |
| PWM Frequency (Hz) | 50 ? | 1000 ? | 50 ? | 192 ? | |||
| Screen | 10% | -13% | -12% | -76% | -43% | 10% | |
| Brightness middle (cd/m²) | 459 | 430.9 -6% | 413 -10% | 351.5 -23% | 340 -26% | 362 -21% | 569 24% |
| Brightness (cd/m²) | 423 | 410 -3% | 396 -6% | 336 -21% | 302 -29% | 343 -19% | 542 28% |
| Brightness Distribution (%) | 86 | 93 8% | 87 1% | 83 -3% | 77 -10% | 92 7% | 90 5% |
| Black Level * (cd/m²) | 0.37 | 0.254 31% | 0.36 3% | 0.24 35% | 0.31 16% | 0.28 24% | 0.56 -51% |
| Contrast (:1) | 1241 | 1696 37% | 1147 -8% | 1465 18% | 1097 -12% | 1293 4% | 1016 -18% |
| Colorchecker dE 2000 * | 2.28 | 2.06 10% | 3.09 -36% | 3.3 -45% | 6.75 -196% | 5.08 -123% | 1.4 39% |
| Colorchecker dE 2000 max. * | 3.61 | 7.3 -102% | 12.4 -243% | 8.95 -148% | 2.9 20% | ||
| Greyscale dE 2000 * | 2.48 | 2.22 10% | 3.92 -58% | 1.9 23% | 8.47 -242% | 6.21 -150% | 1.8 27% |
| Gamma | 2.5 88% | 2.13 103% | 2.3 96% | 2.09 105% | 2.22 99% | 2.4 92% | 2.16 102% |
| CCT | 8602 76% | 6520 100% | 7333 89% | 6784 96% | 6557 99% | 6817 95% | 6877 95% |
| Color Space (Percent of AdobeRGB 1998) (%) | 62 | 64 3% | 61 -2% | 64.4 4% | 58 -6% | 60 -3% | 78.4 26% |
| Color Space (Percent of sRGB) (%) | 96 | 96 0% | 97 1% | 88.2 -8% | 89 -7% | 92 -4% | 99.3 3% |
| Media total (Programa/Opciones) | 9% /
9% | 2% /
-5% | -1% /
-7% | -23% /
-50% | 0% /
-23% | 9% /
11% |
* ... más pequeño es mejor
Tiempos de respuesta del display
| ↔ Tiempo de respuesta de Negro a Blanco | ||
|---|---|---|
| 37 ms ... subida ↗ y bajada ↘ combinada | ↗ 21 ms subida | 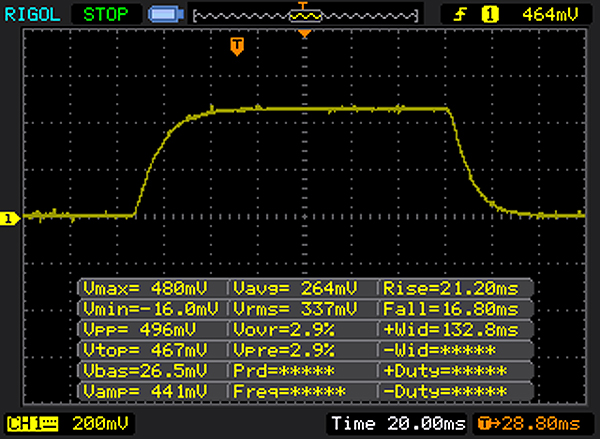 |
| ↘ 16 ms bajada | ||
| La pantalla mostró tiempos de respuesta lentos en nuestros tests y podría ser demasiado lenta para los jugones. En comparación, todos los dispositivos de prueba van de ##min### (mínimo) a 240 (máximo) ms. » 95 % de todos los dispositivos son mejores. Eso quiere decir que el tiempo de respuesta es peor que la media (19.8 ms) de todos los dispositivos testados. | ||
| ↔ Tiempo de respuesta 50% Gris a 80% Gris | ||
| 61 ms ... subida ↗ y bajada ↘ combinada | ↗ 28 ms subida | 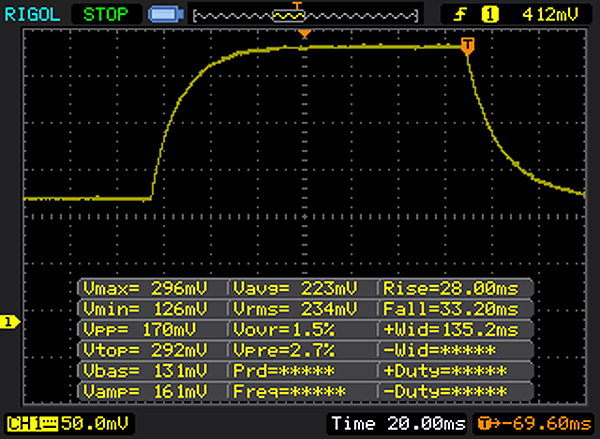 |
| ↘ 33 ms bajada | ||
| La pantalla mostró tiempos de respuesta lentos en nuestros tests y podría ser demasiado lenta para los jugones. En comparación, todos los dispositivos de prueba van de ##min### (mínimo) a 636 (máximo) ms. » 96 % de todos los dispositivos son mejores. Eso quiere decir que el tiempo de respuesta es peor que la media (31 ms) de todos los dispositivos testados. | ||
Parpadeo de Pantalla / PWM (Pulse-Width Modulation)
| Parpadeo de Pantalla / PWM no detectado | ||
Comparación: 52 % de todos los dispositivos testados no usaron PWM para atenuar el display. Si se usó, medimos una media de 7753 (mínimo: 5 - máxmo: 343500) Hz. | ||
| PCMark 8 Home Score Accelerated v2 | 3040 puntos | |
| PCMark 8 Creative Score Accelerated v2 | 4136 puntos | |
| PCMark 8 Work Score Accelerated v2 | 3949 puntos | |
ayuda | ||
| Microsoft Surface Book with Performance Base Toshiba NVMe THNSN5256GPU7 | Microsoft Surface Book Core i7 Samsung MZFLV512 NVMe | Lenovo Yoga 710-14IKB 80V4002HGE Samsung MZYTY256HDHP | HP Spectre x360 15-bl002xx Toshiba XG4 NVMe (THNSN5512GPUK) | Asus UX310UQ-FC396T SanDisk SD8SN8U512G1002 | Apple MacBook Pro 13 2016 (2.9 GHz) Apple SSD AP0256 | |
|---|---|---|---|---|---|---|
| CrystalDiskMark 3.0 | 11% | -35% | 21% | -37% | 36% | |
| Read Seq (MB/s) | 1017 | 953 -6% | 490.5 -52% | 1266 24% | 519 -49% | 1662 63% |
| Write Seq (MB/s) | 861 | 592 -31% | 452.3 -47% | 982 14% | 468 -46% | 1336 55% |
| Read 512 (MB/s) | 687 | 520 -24% | 386.2 -44% | 834 21% | 344.8 -50% | 1183 72% |
| Write 512 (MB/s) | 698 | 591 -15% | 219.9 -68% | 714 2% | 458 -34% | 1481 112% |
| Read 4k (MB/s) | 40.91 | 42.66 4% | 34.35 -16% | 40.72 0% | 28.45 -30% | 16.1 -61% |
| Write 4k (MB/s) | 108.6 | 136.3 26% | 91.2 -16% | 139.4 28% | 56.2 -48% | 23.5 -78% |
| Read 4k QD32 (MB/s) | 326.9 | 615 88% | 378.9 16% | 527 61% | 286 -13% | 657 101% |
| Write 4k QD32 (MB/s) | 347.1 | 517 49% | 152.2 -56% | 395.2 14% | 257.7 -26% | 419 21% |

| 3DMark 11 - 1280x720 Performance GPU | |
| Acer Aspire VN7-593G-73HP V15 Nitro BE | |
| HP Omen 15-ax007ng | |
| HP Omen 17-w010ng | |
| Asus G752VL-T7023T | |
| Microsoft Surface Book with Performance Base | |
| Acer TravelMate P658-M-59J7 Graphics Dock | |
| Asus Zenbook UX510UW-CN044T | |
| Acer Aspire V5-591G-50NC | |
| Asus F756UX-T7013T | |
| Apple MacBook Pro 13 2016 (2.9 GHz) | |
| HP Spectre x360 15-bl002xx | |
| Microsoft Surface Book Core i5 | |
| Asus UX310UQ-FC396T | |
| Lenovo Yoga 710-14IKB 80V4002HGE | |
| 3DMark | |
| 1280x720 Cloud Gate Standard Graphics | |
| Acer Aspire VN7-593G-73HP V15 Nitro BE | |
| HP Omen 15-ax007ng | |
| HP Omen 17-w010ng | |
| Dell XPS 15 9560 (i7-7700HQ, UHD) | |
| Dell XPS 15 9550 i7 FHD | |
| Acer TravelMate P658-M-59J7 Graphics Dock | |
| Asus Zenbook UX510UW-CN044T | |
| Acer Aspire V5-591G-50NC | |
| Asus F756UX-T7013T | |
| Asus G752VL-T7023T | |
| Microsoft Surface Book with Performance Base | |
| Apple MacBook Pro 13 2016 (2.9 GHz) | |
| HP Spectre x360 15-bl002xx | |
| Microsoft Surface Book Core i5 | |
| Asus UX310UQ-FC396T | |
| Lenovo Yoga 710-14IKB 80V4002HGE | |
| 1920x1080 Fire Strike Graphics | |
| Acer Aspire VN7-593G-73HP V15 Nitro BE | |
| Dell XPS 15 9560 (i7-7700HQ, UHD) | |
| HP Omen 15-ax007ng | |
| HP Omen 17-w010ng | |
| Asus G752VL-T7023T | |
| Microsoft Surface Book with Performance Base | |
| Dell XPS 15 9550 i7 FHD | |
| Asus Zenbook UX510UW-CN044T | |
| Acer TravelMate P658-M-59J7 Graphics Dock | |
| Acer Aspire V5-591G-50NC | |
| Asus F756UX-T7013T | |
| HP Spectre x360 15-bl002xx | |
| Microsoft Surface Book Core i5 | |
| Apple MacBook Pro 13 2016 (2.9 GHz) | |
| Asus UX310UQ-FC396T | |
| Lenovo Yoga 710-14IKB 80V4002HGE | |
| 3DMark 11 Performance | 5941 puntos | |
| 3DMark Cloud Gate Standard Score | 8836 puntos | |
| 3DMark Fire Strike Score | 4395 puntos | |
ayuda | ||
| Rise of the Tomb Raider - 1920x1080 High Preset AA:FX AF:4x | |
| Acer Aspire VN7-593G-73HP V15 Nitro BE | |
| Dell XPS 15 9560 (i7-7700HQ, UHD) | |
| HP Omen 15-ax007ng | |
| Microsoft Surface Book with Performance Base | |
| Acer TravelMate P658-M-59J7 Graphics Dock | |
| Dell XPS 15 9550 i7 FHD | |
| HP Spectre x360 15-bl002xx | |
| Lenovo Yoga 710-14IKB 80V4002HGE | |
| Deus Ex Mankind Divided - 1920x1080 High Preset AF:4x | |
| Acer Aspire VN7-593G-73HP V15 Nitro BE | |
| Microsoft Surface Book with Performance Base | |
| Asus Zenbook UX510UW-CN044T | |
| The Witcher 3 - 1920x1080 Ultra Graphics & Postprocessing (HBAO+) | |
| Acer Aspire VN7-593G-73HP V15 Nitro BE | |
| Dell XPS 15 9560 (i7-7700HQ, UHD) | |
| Asus G752VL-T7023T | |
| Microsoft Surface Book with Performance Base | |
| Asus UX310UQ-FC396T | |
| bajo | medio | alto | ultra | |
|---|---|---|---|---|
| BioShock Infinite (2013) | 128 | 118 | 49.9 | |
| The Witcher 3 (2015) | 31.3 | 17.4 | ||
| Rise of the Tomb Raider (2016) | 34.6 | 22.4 | ||
| Deus Ex Mankind Divided (2016) | 49 | 26.4 | 11.4 |
Ruido
| Ocioso |
| 29.4 / 29.4 / 29.7 dB(A) |
| Carga |
| 39 / 40.2 dB(A) |
 | ||
30 dB silencioso 40 dB(A) audible 50 dB(A) ruidosamente alto |
||
min: | ||
(-) La temperatura máxima en la parte superior es de 47 °C / 117 F, frente a la media de 35.4 °C / 96 F, que oscila entre 19.6 y 60 °C para la clase Convertible.
(-) El fondo se calienta hasta un máximo de 47 °C / 117 F, frente a la media de 36.9 °C / 98 F
(+) En reposo, la temperatura media de la parte superior es de 28.1 °C / 83# F, frente a la media del dispositivo de 30.3 °C / 87 F.
(±) Jugando a The Witcher 3, la temperatura media de la parte superior es de 33.7 °C / 93 F, frente a la media del dispositivo de 30.3 °C / 87 F.
(-) El reposamanos y el touchpad pueden calentarse mucho al tacto con un máximo de 47 °C / 116.6 F.
(-) La temperatura media de la zona del reposamanos de dispositivos similares fue de 28 °C / 82.4 F (-19 °C / -34.2 F).
Microsoft Surface Book with Performance Base análisis de audio
(-) | altavoces no muy altos (#63 dB)
Graves 100 - 315 Hz
(±) | lubina reducida - en promedio 5.9% inferior a la mediana
(±) | la linealidad de los graves es media (7.1% delta a frecuencia anterior)
Medios 400 - 2000 Hz
(+) | medios equilibrados - a sólo 4.3% de la mediana
(±) | la linealidad de los medios es media (8.1% delta respecto a la frecuencia anterior)
Altos 2 - 16 kHz
(+) | máximos equilibrados - a sólo 4.7% de la mediana
(±) | la linealidad de los máximos es media (8% delta a frecuencia anterior)
Total 100 - 16.000 Hz
(±) | la linealidad del sonido global es media (19% de diferencia con la mediana)
En comparación con la misma clase
» 45% de todos los dispositivos probados de esta clase eran mejores, 7% similares, 48% peores
» El mejor tuvo un delta de 6%, la media fue 20%, el peor fue ###max##%
En comparación con todos los dispositivos probados
» 45% de todos los dispositivos probados eran mejores, 7% similares, 48% peores
» El mejor tuvo un delta de 4%, la media fue 23%, el peor fue ###max##%
Apple MacBook Pro 13 2016 (2.9 GHz) análisis de audio
(+) | los altavoces pueden reproducir a un volumen relativamente alto (#86.9 dB)
Graves 100 - 315 Hz
(±) | lubina reducida - en promedio 13.2% inferior a la mediana
(±) | la linealidad de los graves es media (10.7% delta a frecuencia anterior)
Medios 400 - 2000 Hz
(+) | medios equilibrados - a sólo 4.1% de la mediana
(+) | los medios son lineales (6.3% delta a la frecuencia anterior)
Altos 2 - 16 kHz
(+) | máximos equilibrados - a sólo 2.9% de la mediana
(+) | los máximos son lineales (4% delta a la frecuencia anterior)
Total 100 - 16.000 Hz
(+) | el sonido global es lineal (12.2% de diferencia con la mediana)
En comparación con la misma clase
» 15% de todos los dispositivos probados de esta clase eran mejores, 5% similares, 81% peores
» El mejor tuvo un delta de 5%, la media fue 18%, el peor fue ###max##%
En comparación con todos los dispositivos probados
» 10% de todos los dispositivos probados eran mejores, 2% similares, 88% peores
» El mejor tuvo un delta de 4%, la media fue 23%, el peor fue ###max##%
HP Spectre x360 15-bl002xx análisis de audio
(±) | la sonoridad del altavoz es media pero buena (72.9 dB)
Graves 100 - 315 Hz
(±) | lubina reducida - en promedio 14.8% inferior a la mediana
(±) | la linealidad de los graves es media (14% delta a frecuencia anterior)
Medios 400 - 2000 Hz
(+) | medios equilibrados - a sólo 4.4% de la mediana
(±) | la linealidad de los medios es media (10.1% delta respecto a la frecuencia anterior)
Altos 2 - 16 kHz
(+) | máximos equilibrados - a sólo 1.2% de la mediana
(+) | los máximos son lineales (4.9% delta a la frecuencia anterior)
Total 100 - 16.000 Hz
(±) | la linealidad del sonido global es media (20.3% de diferencia con la mediana)
En comparación con la misma clase
» 68% de todos los dispositivos probados de esta clase eran mejores, 9% similares, 24% peores
» El mejor tuvo un delta de 5%, la media fue 17%, el peor fue ###max##%
En comparación con todos los dispositivos probados
» 53% de todos los dispositivos probados eran mejores, 8% similares, 39% peores
» El mejor tuvo un delta de 4%, la media fue 23%, el peor fue ###max##%
| Off / Standby | |
| Ocioso | |
| Carga |
|
Clave:
min: | |
| Microsoft Surface Book with Performance Base 6600U, GeForce GTX 965M, Toshiba NVMe THNSN5256GPU7, IPS, 3000x2000, 13.5" | Microsoft Surface Book Core i7 6600U, Maxwell GPU (940M, GDDR5), Samsung MZFLV512 NVMe, IPS, 3000x2000, 13.5" | Microsoft Surface Pro 4, Core i5, 128GB 6300U, HD Graphics 520, Samsung MZFLV128 NVMe, IPS, 2736x1824, 12.3" | Lenovo Yoga 710-14IKB 80V4002HGE i5-7200U, HD Graphics 620, Samsung MZYTY256HDHP, a-Si WLED TFT, IPS, 1920x1080, 14" | Apple MacBook Pro 13 2016 (2.9 GHz) 6267U, Iris Graphics 550, Apple SSD AP0256, , 2560x1600, 13.3" | |
|---|---|---|---|---|---|
| Power Consumption | 5% | 27% | 33% | 24% | |
| Idle Minimum * (Watt) | 4.15 | 4.5 -8% | 4.4 -6% | 3.7 11% | 2.1 49% |
| Idle Average * (Watt) | 8 | 9.8 -23% | 9 -13% | 7.16 10% | 7.6 5% |
| Idle Maximum * (Watt) | 11.9 | 12.2 -3% | 10.7 10% | 8.3 30% | 8.2 31% |
| Load Average * (Watt) | 67 | 46 31% | 19.6 71% | 30.4 55% | 56.4 16% |
| Witcher 3 ultra * (Watt) | 58 | ||||
| Load Maximum * (Watt) | 76 | 56 26% | 19.9 74% | 30.3 60% | 59.8 21% |
* ... más pequeño es mejor
| Microsoft Surface Book with Performance Base 6600U, GeForce GTX 965M, 78 Wh | Microsoft Surface Book Core i5 6300U, Maxwell GPU (940M, GDDR5), 78 Wh | Microsoft Surface Book Core i7 6600U, Maxwell GPU (940M, GDDR5), 78 Wh | Microsoft Surface Pro 4, Core i5, 128GB 6300U, HD Graphics 520, 38 Wh | Lenovo Yoga 710-14IKB 80V4002HGE i5-7200U, HD Graphics 620, 53 Wh | HP Spectre x360 15-bl002xx i7-7500U, GeForce 940MX, 79.2 Wh | Apple MacBook Pro 13 2016 (2.9 GHz) 6267U, Iris Graphics 550, 49.2 Wh | |
|---|---|---|---|---|---|---|---|
| Duración de Batería | 4% | 13% | -13% | 0% | 5% | -15% | |
| Reader / Idle (h) | 25.5 | 17.8 -30% | 15 -41% | 16 -37% | 14.4 -44% | ||
| WiFi v1.3 (h) | 9.6 | 6.7 -30% | 10.8 13% | 7.1 -26% | 9.4 -2% | 8.9 -7% | 9.4 -2% |
| Load (h) | 1.5 | 2.6 73% | 1.9 27% | 2.1 40% | 2.5 67% | 1.1 -27% | |
| H.264 (h) | 10.1 | 8.7 | 8.1 |
Pro
Contra
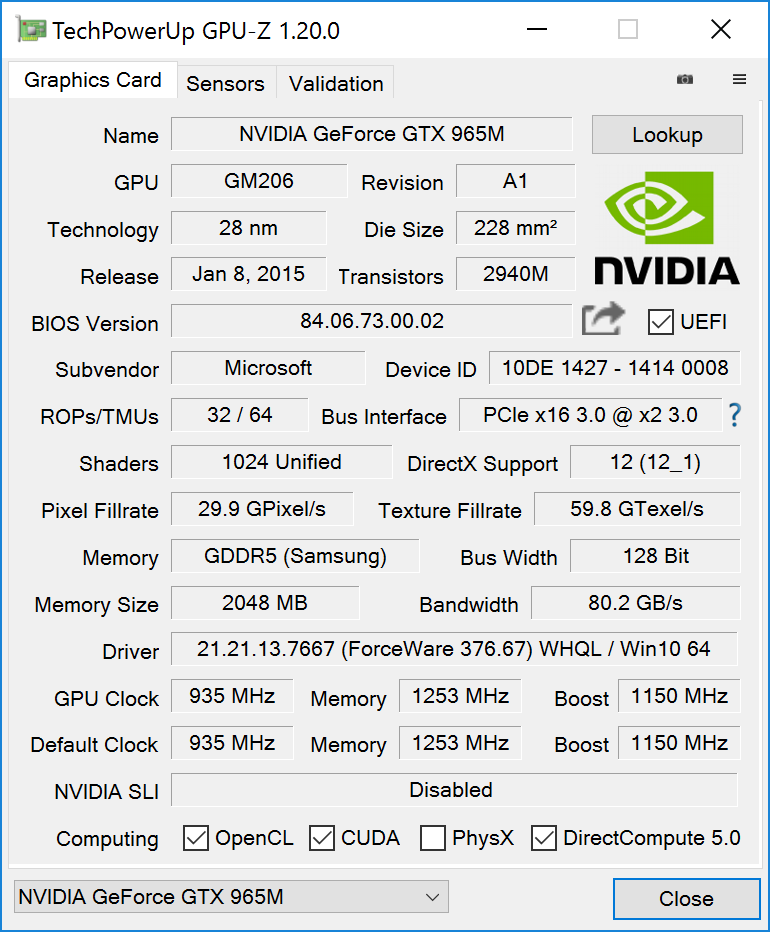
El chip GeForce incluido en el teclado es apenas capaz de utilizar todo su potencial y se queda en la frecuencia por defecto de 950 MHz al ejecutar The Witcher 3. A pesar de que el impacto real en juegos pueda ser escaso, el impacto en los tests es muy apreciable: es la razón por la que el dispositivo es bastante más lento que otros portátiles con GTX 965M.
La mayoría de los juegos modernos no serán jugables en FullHD con nivel de detalle alto. Si estás conforme con esto, obtienes un portátil con un rendimiento por encima de la media en este nivel de movilidad. No esperes sin embargo que el Surface Book iguale a portátiles multimedia con alimentación de 45 W- para conseguirlo Microsoft debería haber mejorado la refrigeración y añadir una GPU con núcleos Pascal.
Los jugones deberían pensarlo dos veces antes de comprar el dispositivo. Nuestra unidad de prueba cuesta unos 2600 euros. Por esa cantidad podrías obtener dos portátiles Acer V15 con GPU GTX 1060. Los jugones no son la audiencia principal a la que se orienta el dispositivo, sin embargo, y Microsoft se centra en diseñadores, arquitectos, profesionales de CAD y en general profesionales que requieran potencia de GPU para trabajar.
No es una estación de trabajo al uso
El Surface Book no es una estación de trabajo real. No solo carece de las certificaciones CAD/CAM necesarias, si no que tiene una CPU de 15W, lo que supone un problema en este mercado. A pesar de esto, HP, Dell y Lenovo no deben temer competición en este mercado.
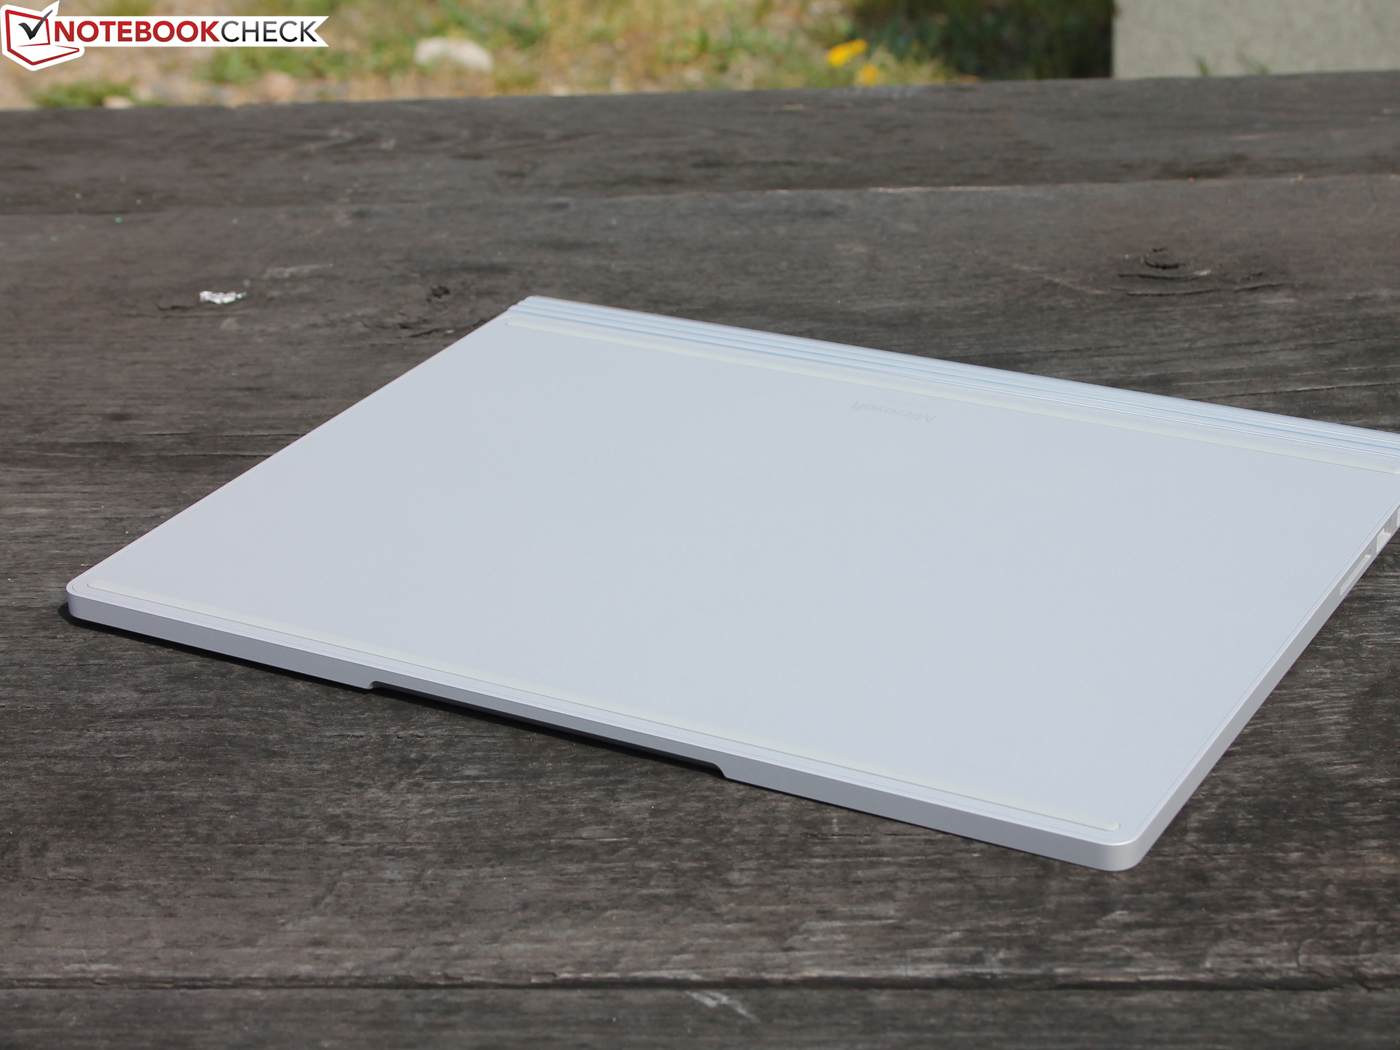
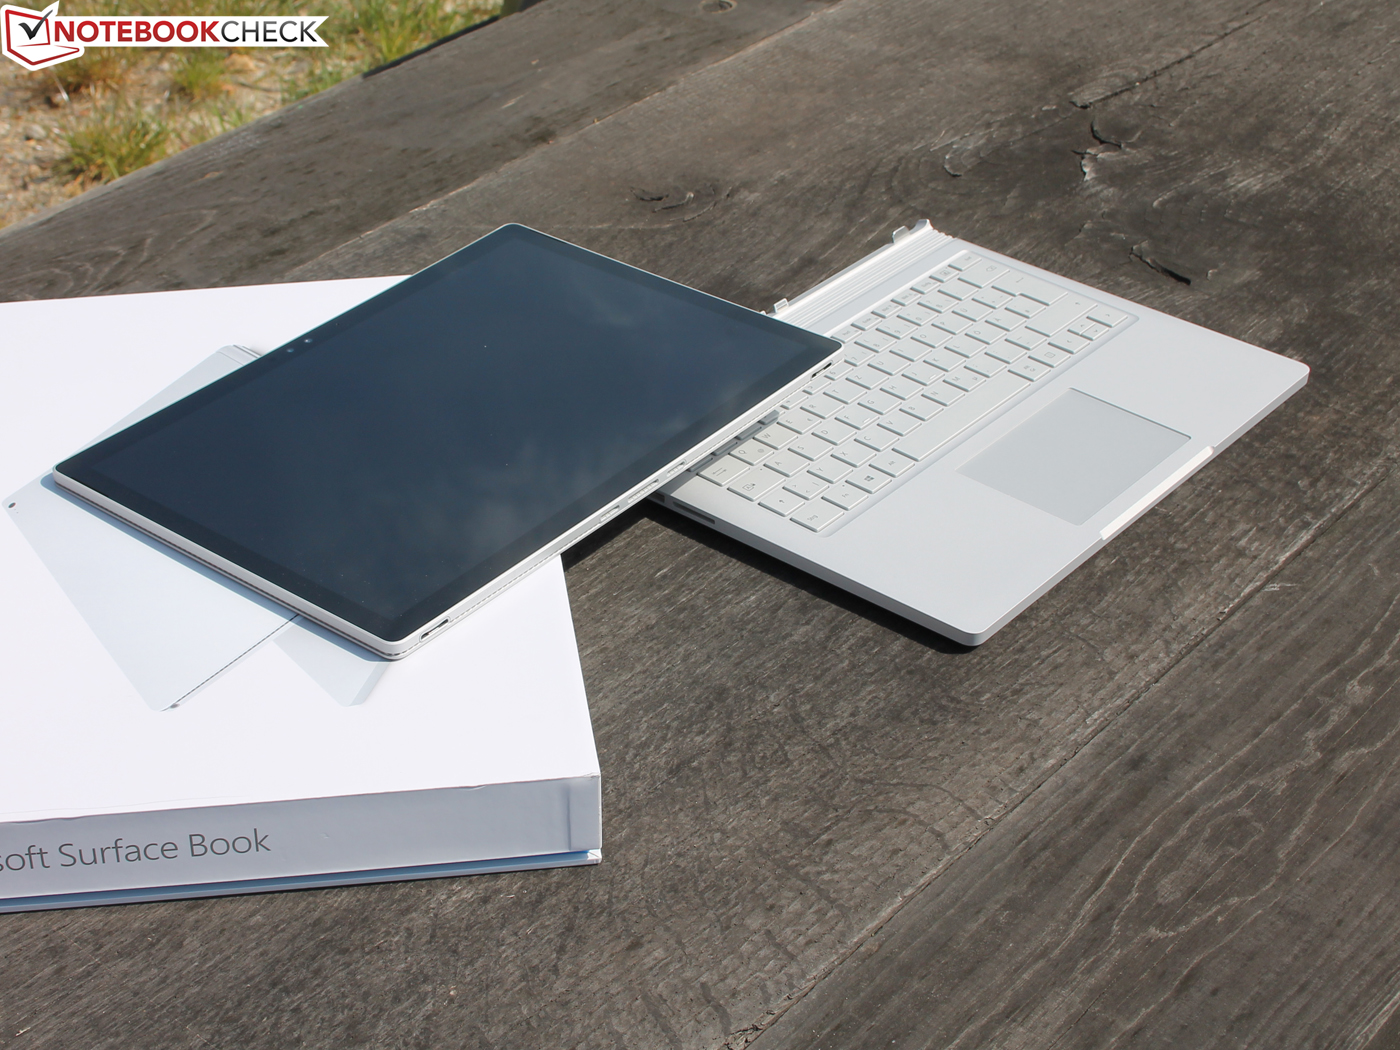
El punto fuerte del Surface Book es la movilidad: desmontar de la base y llevar el tablet de 13 pulgadas y el stylus allí donde vayas. Aquí es donde el Surface Book destaca, con su pantalla IPS muy brillante (casi cubre el 100% de la cobertura sRGB), sus dispositivos de entrada excelentes, su carcasa de alta calidad, sus buenas cámaras y micrófono, y una impresionante duración de batería. El enganche/desenganche de la base funcionó perfectamente durante las pruebas.
Sus puntos flacos son la ausencia de puertos y LTE y su alto precio, que está muy por encima de lo que los clientes piensan gastar en un portátil. Un modelo con pantalla FullHD, gráfica integrada y un SSD de 256 GB por unos 1000 euros arrasaría en el mercado. Desafortunadamente el Surface Book más barato con CPU Core i5-6300 y un SSD de 128 GB cuesta más de 1500 euros.
GPU Thunderbolt 3 externa
En teoría cualquier portátil/tablet/convertible 2-en-1 con Thunderbolt 3 puede ser actualizado con una base gráfica externa de Razer, Acer o Asus. De esta forma, incluso dispositivos ultraportátiles como el Dell XPS 13 2-en-1 o el XPS 13 normal pueden transformarse en dispositivos para juegos. Si quieres leer más, echa un ojo a nuestro análisis del Razer. Desafortunadamente, Acer ha dejado de vender su GPU externa, y Asus y Razer piden 500 y 600 dólares respectivamente (450$ por la Razer si se compra con un portátil). Recuerda que los precios no incluyen tarjeta gráfica.
- Razer Core (GPU intercambiable)
- Acer Graphics Dock (GTX 960M, no intercambiable)
- Asus ROG XG Station 2 (GPU intercambiable)
The following alternatives are based on the newer
Las siguientes alternativas se basan en el nuevo controlador TI3 que, sim embargo, aún tiene algunos bugs y problemas de compatiblidad (aqui puedes obtener más información):
- Manitz Venus
- AKiTiO Node
- PowerColor Devil Box
¿Alternativa 2-en-1 con gráfica dedicada?
There are no other docking solutions that include a GPU underneath the keyboard available on the market as we speak. The often-mentioned Lenovo Yoga 710-14 might seem like a low-cost alternative but, at least according to the Lenovo Forums, it drives its users crazy with its obnoxious fan. HP's 15-inch Spectre x360 is far from portable.
A día de hoy no hay otras soluciones con base de anclaje que incluyan una GPU bajo el teclado en el mercado. El Lenovo Yoga 710-14 puede parecer una alternativa de bajo coste pero, al menos según los foros que hemos visto, vuelve locos a los usuarios con el funcionamiento del ventilador. El Spectre x360 de 15 pulgadas dista mucho de ser portable.
Ésta es una versión acortada del análisis original. Puedes leer el análisis completo en inglés aquí.
Microsoft Surface Book with Performance Base
- 05/03/2017 v6 (old)
Sebastian Jentsch
Price comparison
