Notebookcheck Logo

Breve análisis del Tablet/Convertible Microsoft Surface 3

"Asesino de portátiles" Vol. 3 - Después de que saliera el Surface Pro 3 el pasado otoño, Microsoft saca ahora la versión ligera llamada Surface 3. Ya tenemos un modelo de pruebas y publicaremos nuestros primeros resultados. Actualización 05/02/2015: Rendimiento del almacenamiento eMMC y duración/tiempo de carga de la batería.
Microsoft Surface 3 (Surface Serie)
Procesador
Intel Atom x7-Z8700 4 x 1.6 - 2.4 GHz, Cherry Trail
Adaptador gráfico
Intel HD Graphics (Cherry Trail)
Memoría
4 GB 
pantalla
10.80 pulgadas 3:2, 1920 x 1280 pixels, multitáctil 10 dedos, native pen support, Panasonic MEI9001, IPS, lustroso: si, detachable screen
Disco duro
128 GB eMMC Flash, 128 GB 
, 93.2 GB libre
Conexiones
1 USB 2.0, 1 USB 3.0, 1 DisplayPort, Audio Conexiones: clavija de headset (3.5 mm), Card Reader: microSD , Brightness Sensor, Sensores: luz ambiente, proximidad, acelerómetro, giroscopio, magnetómetro, Puerto de carga Micro-USB
Equipamento de red
802.11 a/b/g/n/ac (a/b/g/n = Wi-Fi 4/ac = Wi-Fi 5/), Bluetooth 4.0
Tamaño
Alto x ancho x profundidad (en mm): 8.7 x 267 x 187
Battería
28 Wh, Duración de la Batería (según el fabricante): 10 h
Sistema Operativo
Microsoft Windows 8.1 64 Bit
Camera
Webcam: 3.5 MP, trasera 8.0 MP
Primary Camera: 8 MPix
Secondary Camera: 3.5 MPix
Características adicionales
Altavoces: Estéreo con Dolby Audio, Teclado: Type Cover opcional, Luz de Teclado: no, Office 365 Personal (1 año), 24 Meses Garantía, fanless
Peso
917 g, Suministro de Electricidad: 168 g
Precio
719 Euros
Note: The manufacturer may use components from different suppliers including display panels, drives or memory sticks with similar specifications.


In Comparison

292 mm 201 mm 9 mm 810 g275 mm 173 mm 8.9 mm 643 g267 mm 187 mm 8.7 mm 917 g240 mm 169.5 mm 6.1 mm 444 g297 mm 210 mm 1 mm 5.7 g
Surface 3 Pro vs Surface 3
Larger display...
Larger display...
...and thicker dimensions for the Pro
Webcam indoors
Webcam indoors
Webcam indoors
Webcam indoors
Rear camera indoors
Rear camera indoors
Rear camera indoors
Rear camera indoors
Rear camera outdoors
Rear camera indoors low-light
366
cd/m²
404
cd/m²
390
cd/m²
373
cd/m²
399
cd/m²
373
cd/m²
363
cd/m²
374
cd/m²
374
cd/m²
Temperatura del cuarto
Panasonic MEI9001 tested with X-Rite i1Pro 2
Máximo: 404 cd/m² (Nits) Médio: 379.6 cd/m²
iluminación: 90 %
Brillo con batería: 399 cd/m²
Contraste: 814:1 (Negro: 0.49 cd/m²)
ΔE Color 1.66 | 0.5-29.43 Ø5
ΔE Greyscale 2.75 | 0.57-98 Ø5.3
98.8% sRGB (Argyll 1.6.3 3D)
64.4% AdobeRGB 1998 (Argyll 1.6.3 3D)
70.4% AdobeRGB 1998 (Argyll 2.2.0 3D)
98.7% sRGB (Argyll 2.2.0 3D)
68.8% Display P3 (Argyll 2.2.0 3D)
Gamma: 2.22
Microsoft Surface 3
HD Graphics (Cherry Trail), Z8700, 128 GB eMMC Flash
Microsoft Surface Pro 3
HD Graphics 4400, 4300U, Hynix HFS128G3MNM
Microsoft Surface 2
GeForce Tegra 4, 4, 32 GB eMMC Flash
Apple iPad Air 2 2014
PowerVR GXA6850, A8X, 128 GB eMMC Flash
Screen
-36%
-22%
-5%
Brightness middle
399
355.3
-11%
357
-11%
423
6%
Brightness
380
338
-11%
369
-3%
427
12%
Brightness Distribution
90
91
1%
89
-1%
92
2%
Black Level *
0.49
0.33
33%
0.51
-4%
0.61
-24%
Contrast
814
1077
32%
700
-14%
693
-15%
Colorchecker dE 2000 *
1.66
4.72
-184%
3.86
-133%
2.86
-72%
Colorchecker dE 2000 max. *
3.24
Greyscale dE 2000 *
2.75
6.53
-137%
2.4
13%
2.37
14%
Gamma
2.22 99%
2.17 101%
2.46 89%
2.43 91%
CCT
6358 102%
6707 97%
6740 96%
6941 94%
Color Space (Percent of AdobeRGB 1998)
64.4
59.37
-8%
88
37%
Color Space (Percent of sRGB)
98.8

* ... más pequeño es mejor

Cinebench R11.5
CPU Single 64Bit (ordenar por valor)
Microsoft Surface 3, Z8700
0.46 Points
HP ElitePad 1000 G2, Z3795
0.44 Points -4%
Toshiba Satellite W30t-A-101, 4020Y
0.67 Points +46%
Microsoft Surface Pro 3, 4300U
1.12 Points +143%
CPU Multi 64Bit (ordenar por valor)
Microsoft Surface 3, Z8700
1.79 Points
HP ElitePad 1000 G2, Z3795
1.64 Points -8%
Toshiba Satellite W30t-A-101, 4020Y
1.63 Points -9%
Microsoft Surface Pro 3, 4300U
2.77 Points +55%
Cinebench R15
CPU Single 64Bit (ordenar por valor)
Microsoft Surface 3, Z8700
38 Points
HP ElitePad 1000 G2, Z3795
36 Points -5%
Toshiba Satellite W30t-A-101, 4020Y
60 Points +58%
CPU Multi 64Bit (ordenar por valor)
Microsoft Surface 3, Z8700
134 Points
HP ElitePad 1000 G2, Z3795
134 Points 0%
Toshiba Satellite W30t-A-101, 4020Y
152 Points +13%
Cinebench R10
Rendering Single 32Bit (ordenar por valor)
Microsoft Surface 3, Z8700
1225 Points
Fujitsu Stylistic Q584, Z3770
997 Points -19%
HP Omni 10 5600eg (F4W59EA), Z3770
1230 Points 0%
HP ElitePad 1000 G2, Z3795
1234 Points +1%
Toshiba Satellite W30t-A-101, 4020Y
2241 Points +83%
Microsoft Surface Pro 3, 4300U
3675 Points +200%
Rendering Multiple CPUs 32Bit (ordenar por valor)
Microsoft Surface 3, Z8700
4356 Points
Fujitsu Stylistic Q584, Z3770
2848 Points -35%
HP Omni 10 5600eg (F4W59EA), Z3770
3939 Points -10%
HP ElitePad 1000 G2, Z3795
4106 Points -6%
Toshiba Satellite W30t-A-101, 4020Y
5004 Points +15%
Microsoft Surface Pro 3, 4300U
7067 Points +62%
X264 HD Benchmark 4.0
Pass 1 (ordenar por valor)
Microsoft Surface 3, Z8700
50.8 fps
HP ElitePad 1000 G2, Z3795
47.13 fps -7%
Toshiba Satellite W30t-A-101, 4020Y
52.2 fps +3%
Microsoft Surface Pro 3, 4300U
75.5 fps +49%
Pass 2 (ordenar por valor)
Microsoft Surface 3, Z8700
10.28 fps
HP ElitePad 1000 G2, Z3795
9.5 fps -8%
Toshiba Satellite W30t-A-101, 4020Y
9.6 fps -7%
Microsoft Surface Pro 3, 4300U
13.47 fps +31%
Super Pi mod 1.5 XS 1M - 1M (ordenar por valor)
Microsoft Surface 3, Z8700
49.78 s *
HP Omni 10 5600eg (F4W59EA), Z3770
27 s * +46%
HP ElitePad 1000 G2, Z3795
36.26 s * +27%
Toshiba Satellite W30t-A-101, 4020Y
24.81 s * +50%
Microsoft Surface Pro 3, 4300U
13 s * +74%
Super Pi mod 1.5 XS 2M - 2M (ordenar por valor)
Microsoft Surface 3, Z8700
96.7 s *
HP Omni 10 5600eg (F4W59EA), Z3770
61 s * +37%
HP ElitePad 1000 G2, Z3795
79.6 s * +18%
Toshiba Satellite W30t-A-101, 4020Y
54.9 s * +43%
Microsoft Surface Pro 3, 4300U
30 s * +69%
wPrime 2.10 - 32m (ordenar por valor)
Microsoft Surface 3, Z8700
24.51 s *
HP Omni 10 5600eg (F4W59EA), Z3770
24 s * +2%
HP ElitePad 1000 G2, Z3795
25.93 s * -6%
Toshiba Satellite W30t-A-101, 4020Y
35.31 s * -44%
Microsoft Surface Pro 3, 4300U
19.9 s * +19%

Leyenda

 
Microsoft Surface 3 Intel Atom x7-Z8700, Intel HD Graphics (Cherry Trail), 128 GB eMMC Flash
 
Fujitsu Stylistic Q584 Intel Atom Z3770, Intel HD Graphics (Bay Trail), 128 GB eMMC Flash
 
HP Omni 10 5600eg (F4W59EA) Intel Atom Z3770, Intel HD Graphics (Bay Trail), 32 GB eMMC Flash
 
HP ElitePad 1000 G2 Intel Atom Z3795, Intel HD Graphics (Bay Trail), 128 GB eMMC Flash
 
Toshiba Satellite W30t-A-101 Intel Core i3-4020Y, Intel HD Graphics 4200, WD Blue UltraSlim WD5000MPCK-22AWHT0
 
Microsoft Surface Pro 3 Intel Core i5-4300U, Intel HD Graphics 4400, Hynix HFS128G3MNM

* ... más pequeño es mejor

Microsoft Surface 3
128 GB eMMC Flash
Microsoft Surface Pro 3
Hynix HFS128G3MNM
Dell Venue 11 Pro 7140
Sandisk X110 M.2 SD6SP1M-128G
Lenovo ThinkPad Helix 2
Toshiba THNSFJ256GDNU 256 GB
Acer Aspire Switch 11 SW5-171-31U3
Lite-On IT L8T-64L9G
Acer Aspire Switch 10 SW5-012-13DP
32 GB eMMC Flash
Lenovo ThinkPad Yoga 12
Seagate ST500LM000 Solid State Hybrid Drive
CrystalDiskMark 3.0
765%
417%
447%
409%
14%
-49%
Read Seq
149.3
501
236%
395.6
165%
422.7
183%
504
238%
169.3
13%
33.57
-78%
Write Seq
47.99
324
575%
221.9
362%
247.4
416%
167.2
248%
72.8
52%
107.6
124%
Read 512
133.7
357.8
168%
209.1
56%
333.7
150%
378.7
183%
151.1
13%
29.68
-78%
Write 512
39.9
324.6
714%
153.5
285%
164.9
313%
167.2
319%
72.7
82%
47.23
18%
Read 4k
12.64
20.81
65%
22.9
81%
19.44
54%
29.46
133%
18.31
45%
0.351
-97%
Write 4k
9.52
76.2
700%
35.29
271%
43.08
353%
57.6
505%
5.603
-41%
0.64
-93%
Read 4k QD32
27.94
345
1135%
256.4
818%
295.9
959%
195
598%
26.66
-5%
0.706
-97%
Write 4k QD32
11.2
294.4
2529%
156.1
1294%
139.3
1144%
128.1
1044%
5.642
-50%
0.665
-94%
3DMark 11 - 1280x720 Performance (ordenar por valor)
Microsoft Surface 3, Z8700, HD Graphics (Cherry Trail)
562 Points
Fujitsu Stylistic Q584, Z3770, HD Graphics (Bay Trail)
207 Points -63%
HP Omni 10 5600eg (F4W59EA), Z3770, HD Graphics (Bay Trail)
202 Points -64%
HP ElitePad 1000 G2, Z3795, HD Graphics (Bay Trail)
233 Points -59%
Toshiba Satellite W30t-A-101, 4020Y, HD Graphics 4200
828 Points +47%
Microsoft Surface Pro 3, 4300U, HD Graphics 4400
877 Points +56%
Cinebench R11.5 - OpenGL 64Bit (ordenar por valor)
Microsoft Surface 3, Z8700, HD Graphics (Cherry Trail)
11.71 fps
HP ElitePad 1000 G2, Z3795, HD Graphics (Bay Trail)
6.74 fps -42%
Toshiba Satellite W30t-A-101, 4020Y, HD Graphics 4200
18.78 fps +60%
Microsoft Surface Pro 3, 4300U, HD Graphics 4400
19.48 fps +66%
Cinebench R15
OpenGL 64Bit (ordenar por valor)
Microsoft Surface 3, Z8700, HD Graphics (Cherry Trail)
14.71 fps
HP ElitePad 1000 G2, Z3795, HD Graphics (Bay Trail)
5.1 fps -65%
Ref. Match 64Bit (ordenar por valor)
Microsoft Surface 3, Z8700, HD Graphics (Cherry Trail)
98 %
HP ElitePad 1000 G2, Z3795, HD Graphics (Bay Trail)
97.8 % 0%
Cinebench R10 - Shading 64Bit (ordenar por valor)
HP ElitePad 1000 G2, Z3795, HD Graphics (Bay Trail)
2304 Points
Toshiba Satellite W30t-A-101, 4020Y, HD Graphics 4200
4471 Points
Microsoft Surface Pro 3, 4300U, HD Graphics 4400
7154 Points

Leyenda

 
Microsoft Surface 3 Intel Atom x7-Z8700, Intel HD Graphics (Cherry Trail), 128 GB eMMC Flash
 
Fujitsu Stylistic Q584 Intel Atom Z3770, Intel HD Graphics (Bay Trail), 128 GB eMMC Flash
 
HP Omni 10 5600eg (F4W59EA) Intel Atom Z3770, Intel HD Graphics (Bay Trail), 32 GB eMMC Flash
 
HP ElitePad 1000 G2 Intel Atom Z3795, Intel HD Graphics (Bay Trail), 128 GB eMMC Flash
 
Toshiba Satellite W30t-A-101 Intel Core i3-4020Y, Intel HD Graphics 4200, WD Blue UltraSlim WD5000MPCK-22AWHT0
 
Microsoft Surface Pro 3 Intel Core i5-4300U, Intel HD Graphics 4400, Hynix HFS128G3MNM
Tiempo de Ejecución de la Batería
Ocioso (sin WLAN, min brillo)
13h 48min
Navegando con WLAN
7h 05min
WiFi Websurfing
7h 17min
Carga (máximo brillo)
2h 53min
Microsoft Surface 3
Z8700, 28 Wh
Microsoft Surface Pro 3
4300U, 42 Wh
Dell Venue 11 Pro 7140
5Y10a, 38 Wh
Lenovo ThinkPad Helix 2
5Y71, 35 Wh
Acer Aspire Switch 11 SW5-171-31U3
4012Y, 32 Wh
Acer Aspire Switch 10 SW5-012-13DP
Z3735F, 24 Wh
Lenovo ThinkPad Yoga 12
5200U, 47 Wh
MSI S100
Z3740D, 27 Wh
Lenovo ThinkPad Yoga 11e 20D9000QGE
N2930, 34 Wh
Duración de Batería
8%
22%
8%
-22%
7%
-12%
-17%
-32%
Reader / Idle
828
1096
32%
777
-6%
964
16%
788
-5%
720
-13%
WiFi
425
504
19%
562
32%
396
-7%
331
-22%
453
7%
433
2%
340
-20%
WiFi v1.3
437
297
-32%
Load
173
124
-28%
244
41%
197
14%
117
-32%
H.264
360
330
Surface 3: ¿Trabajo bien hecho?

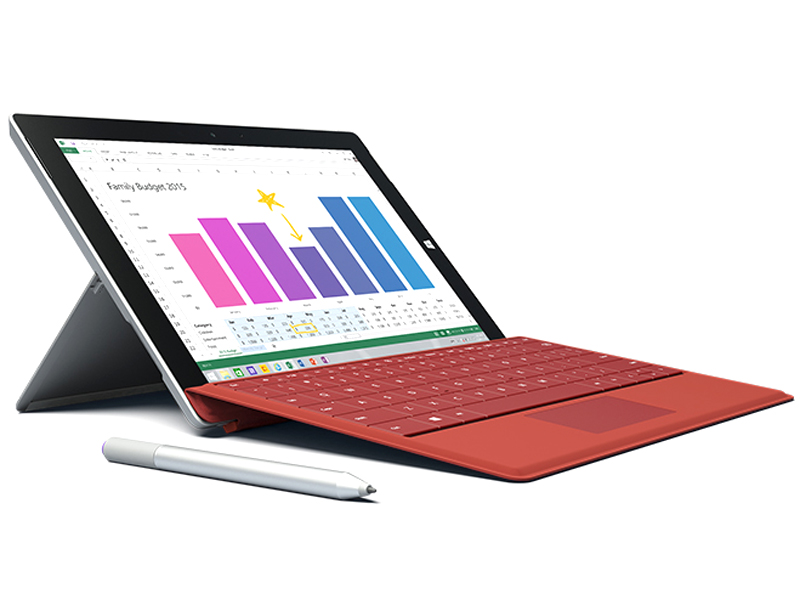
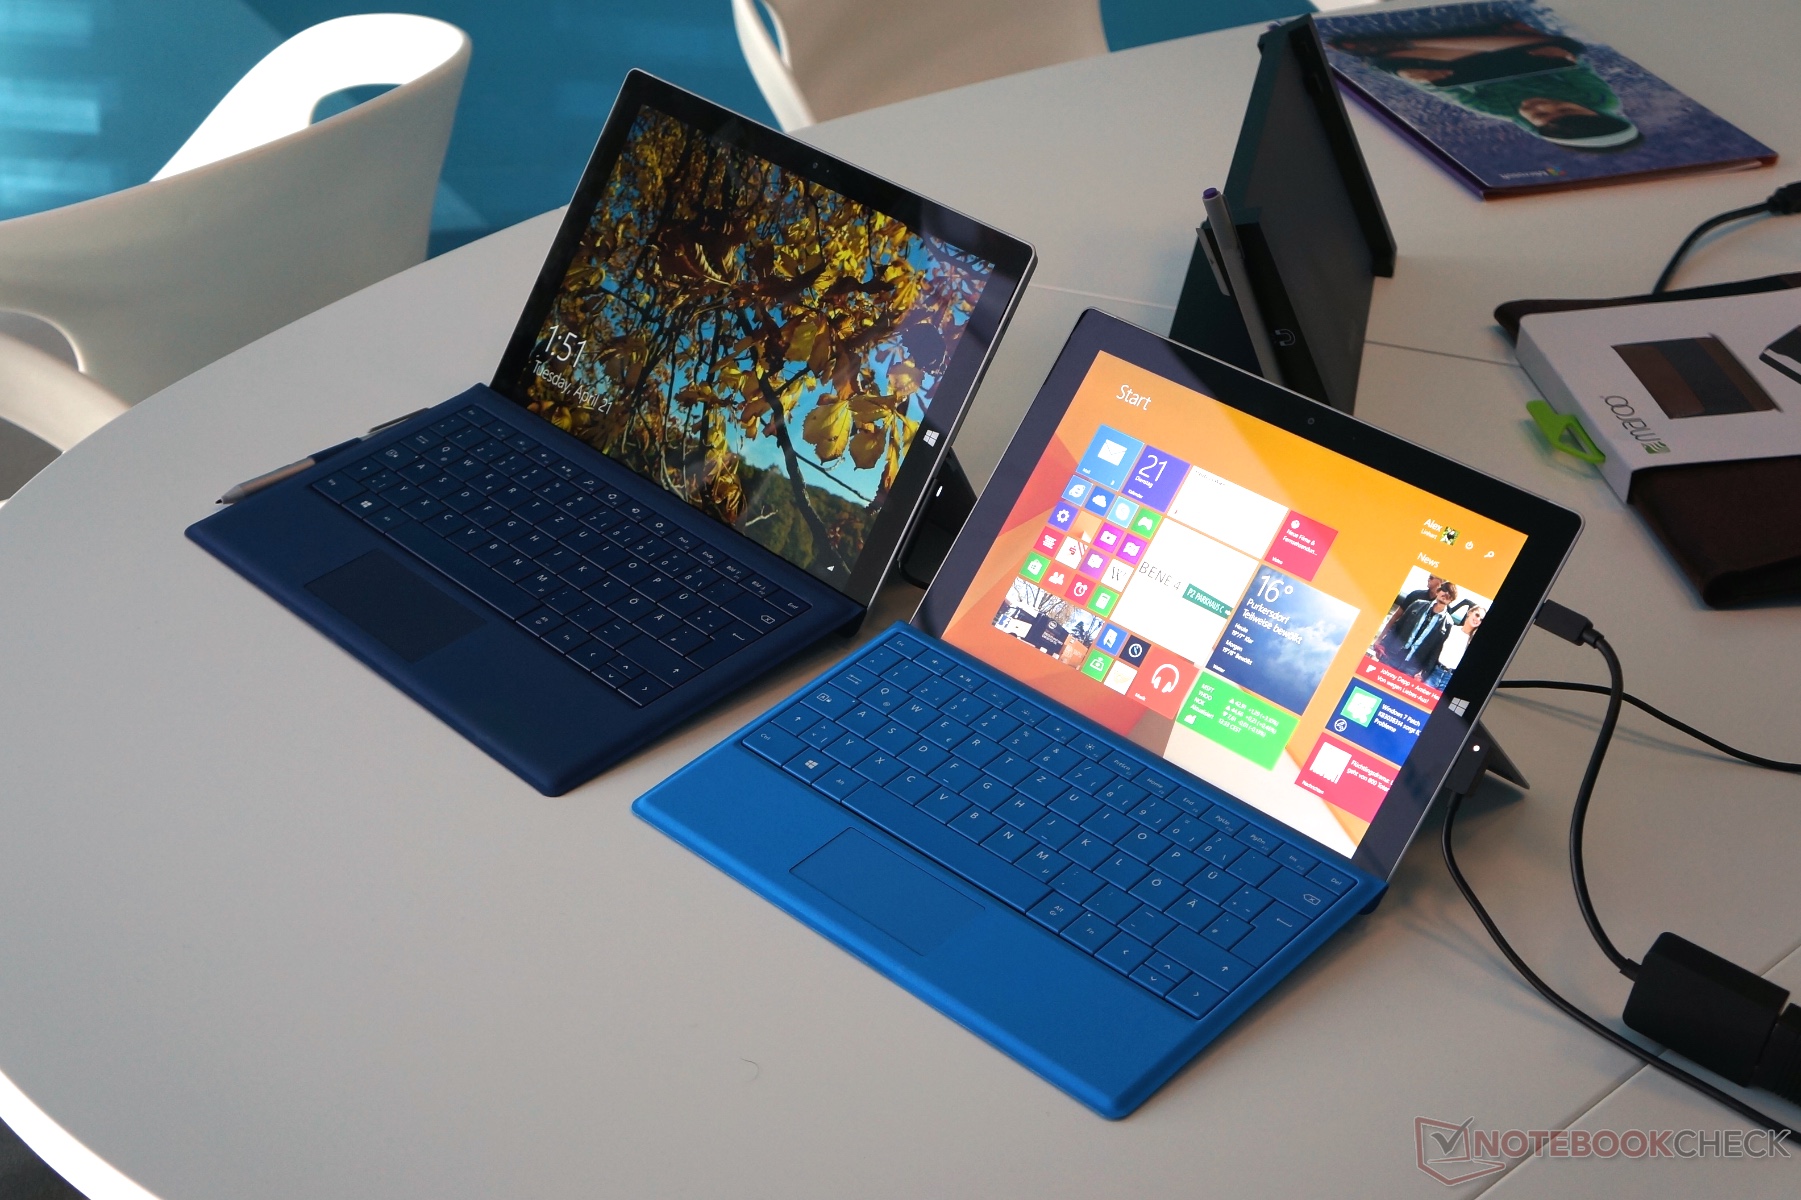
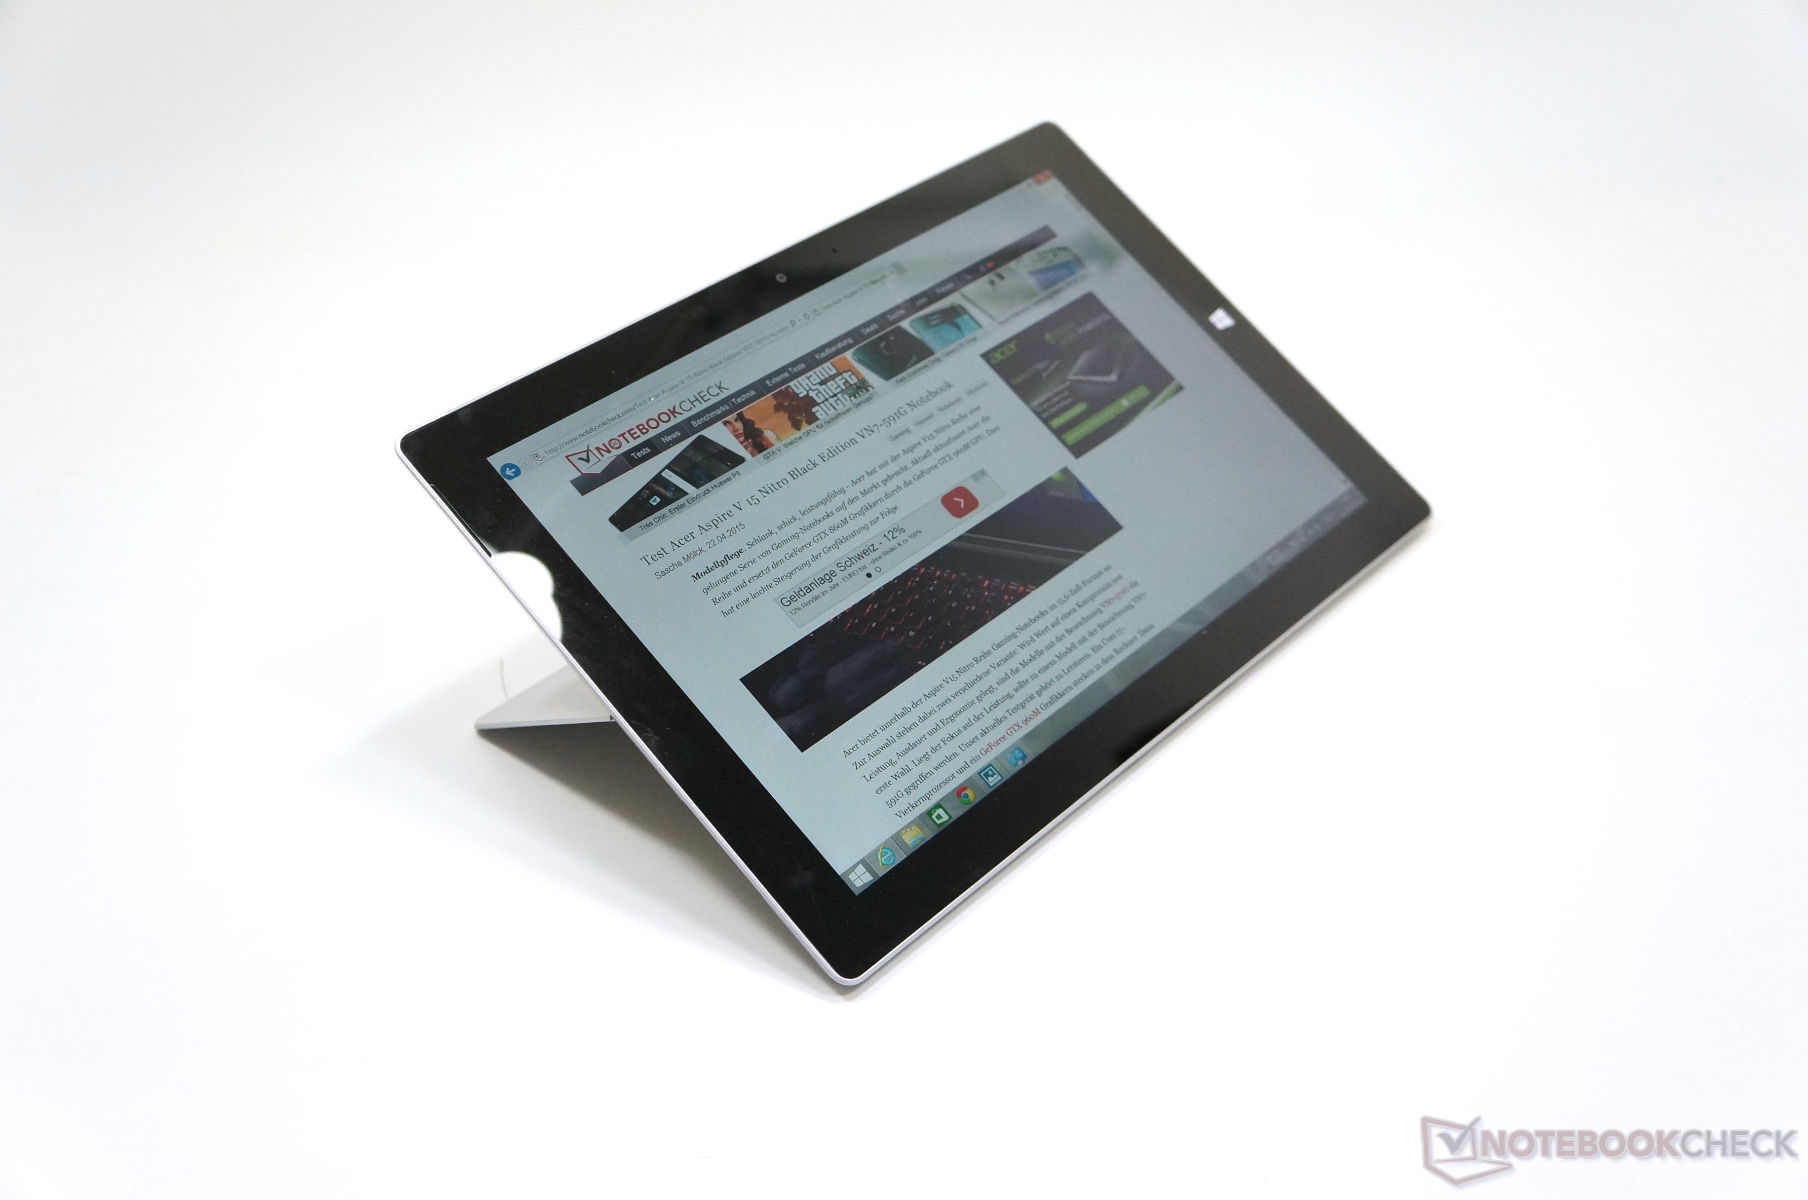
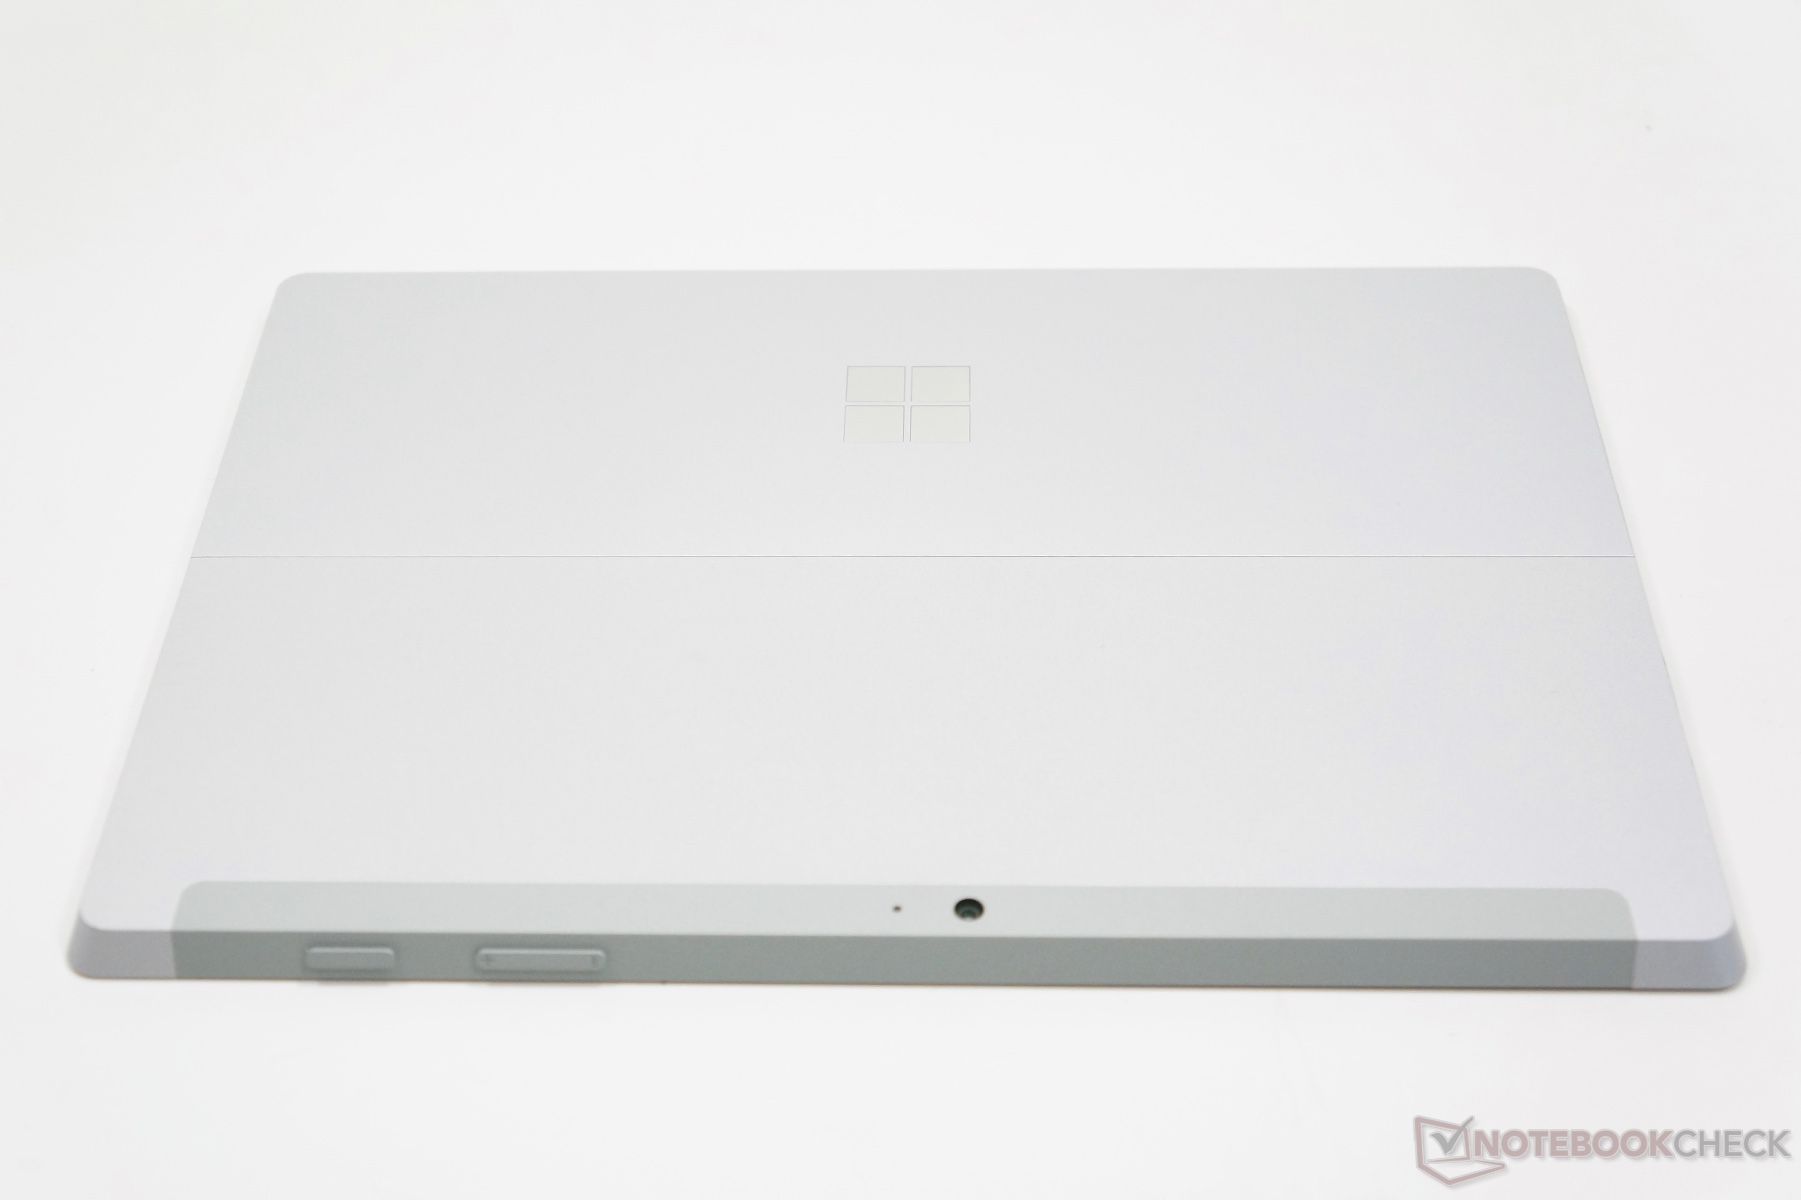
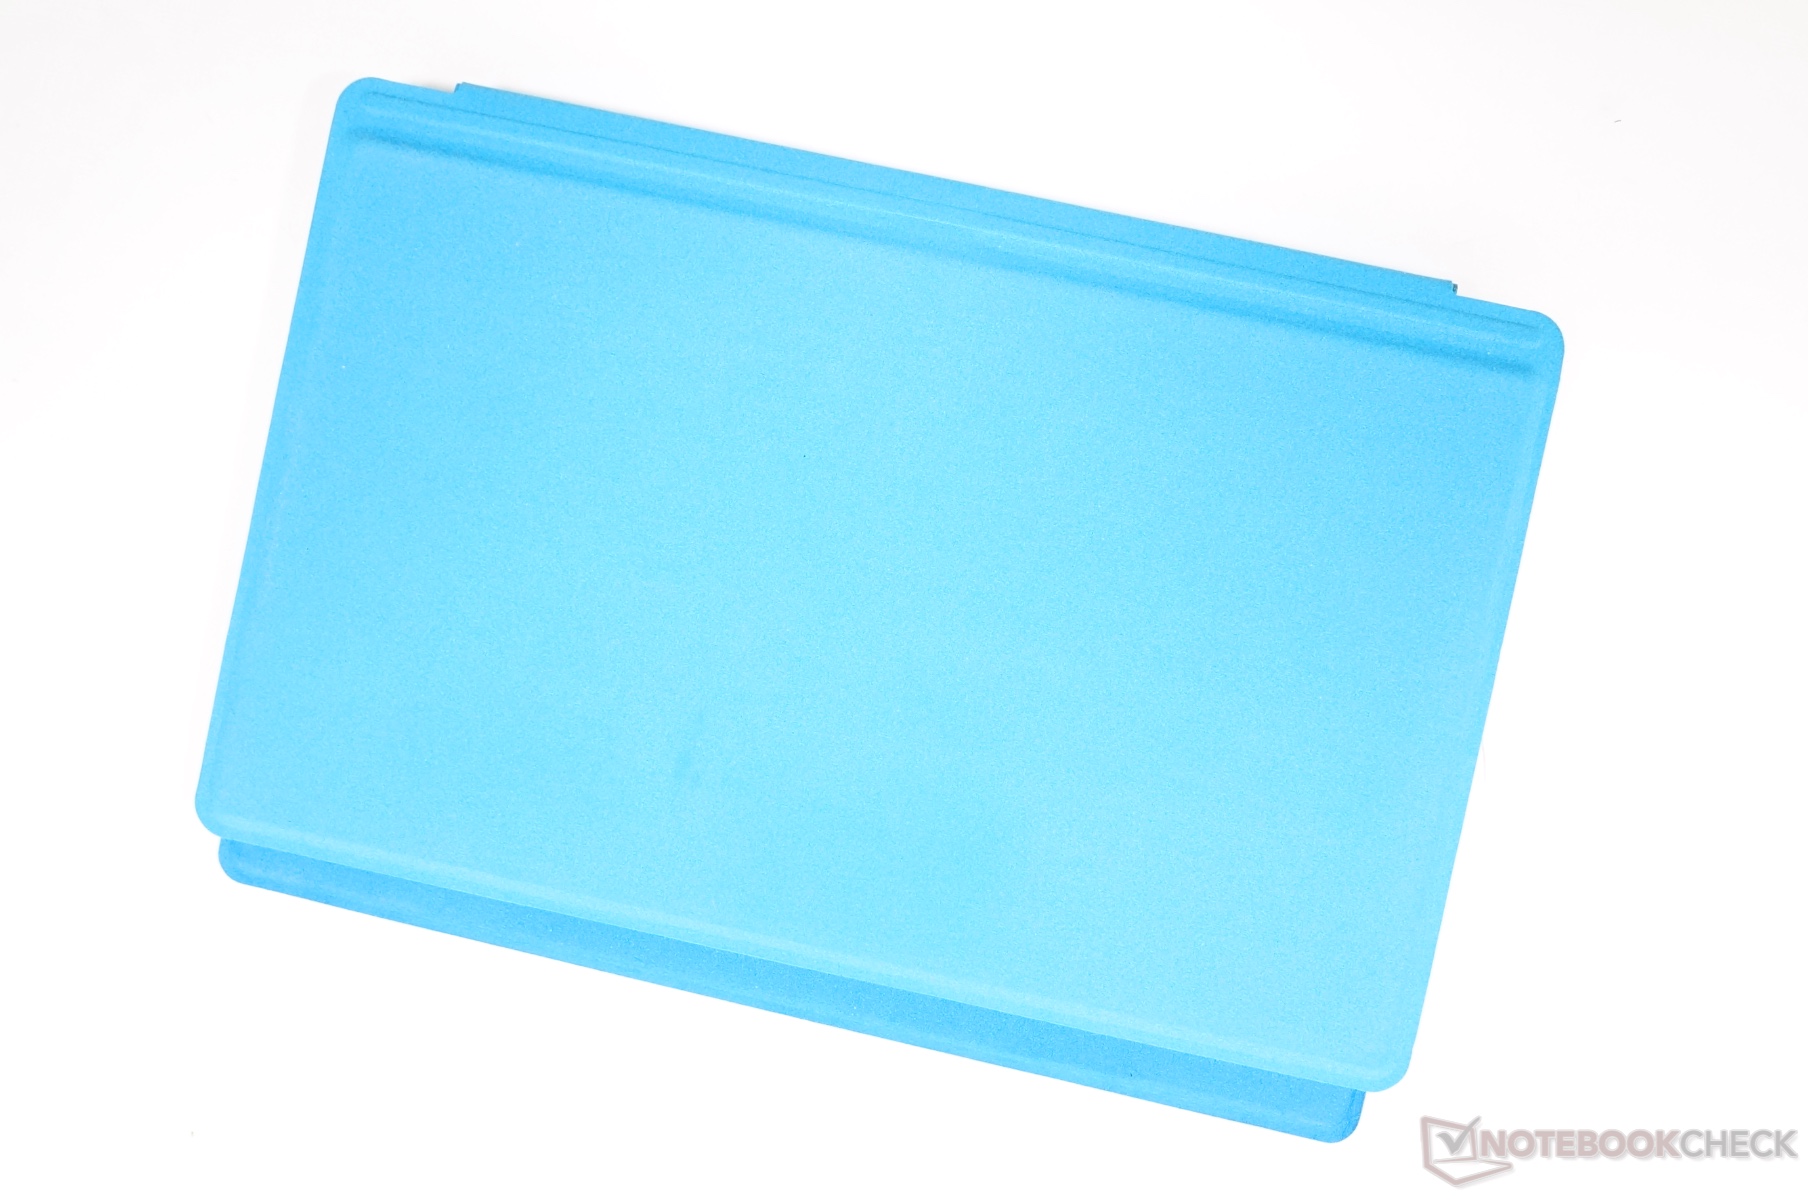
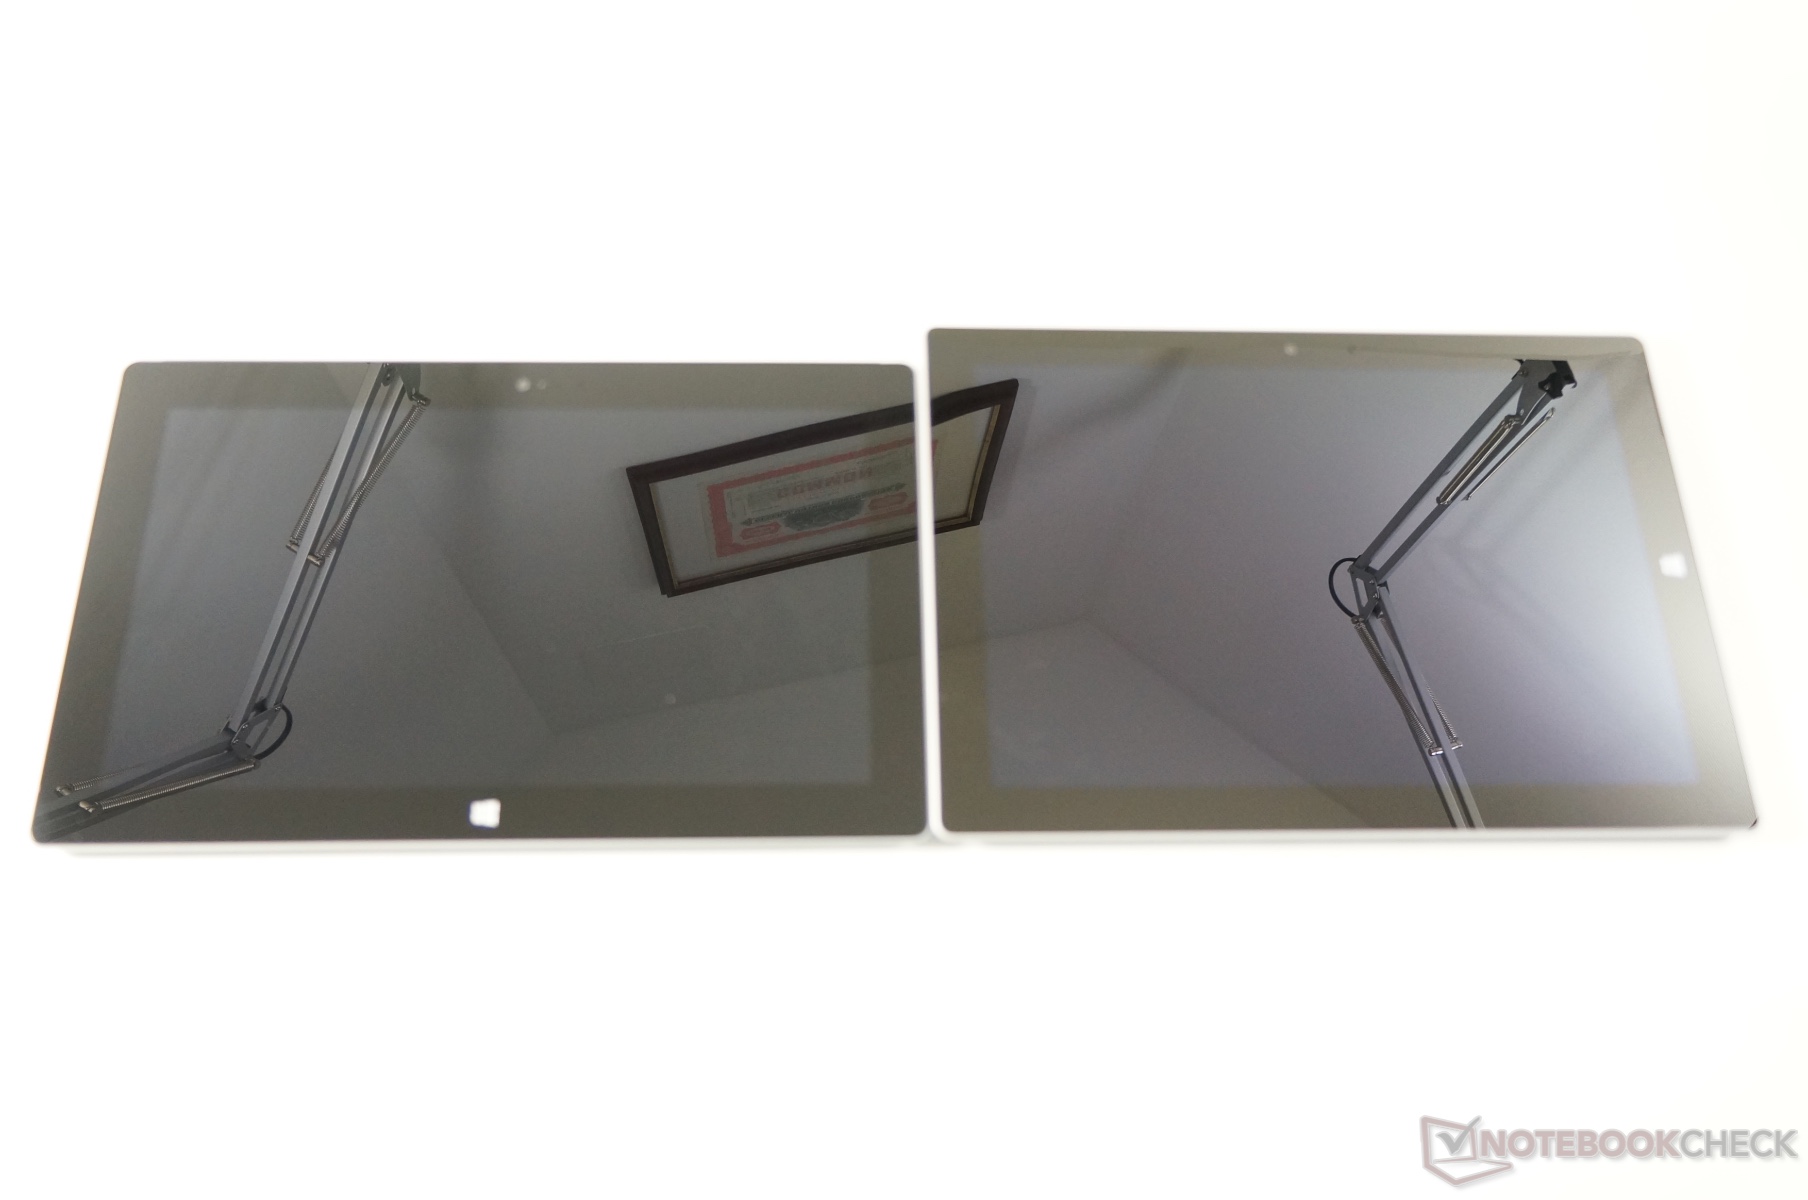
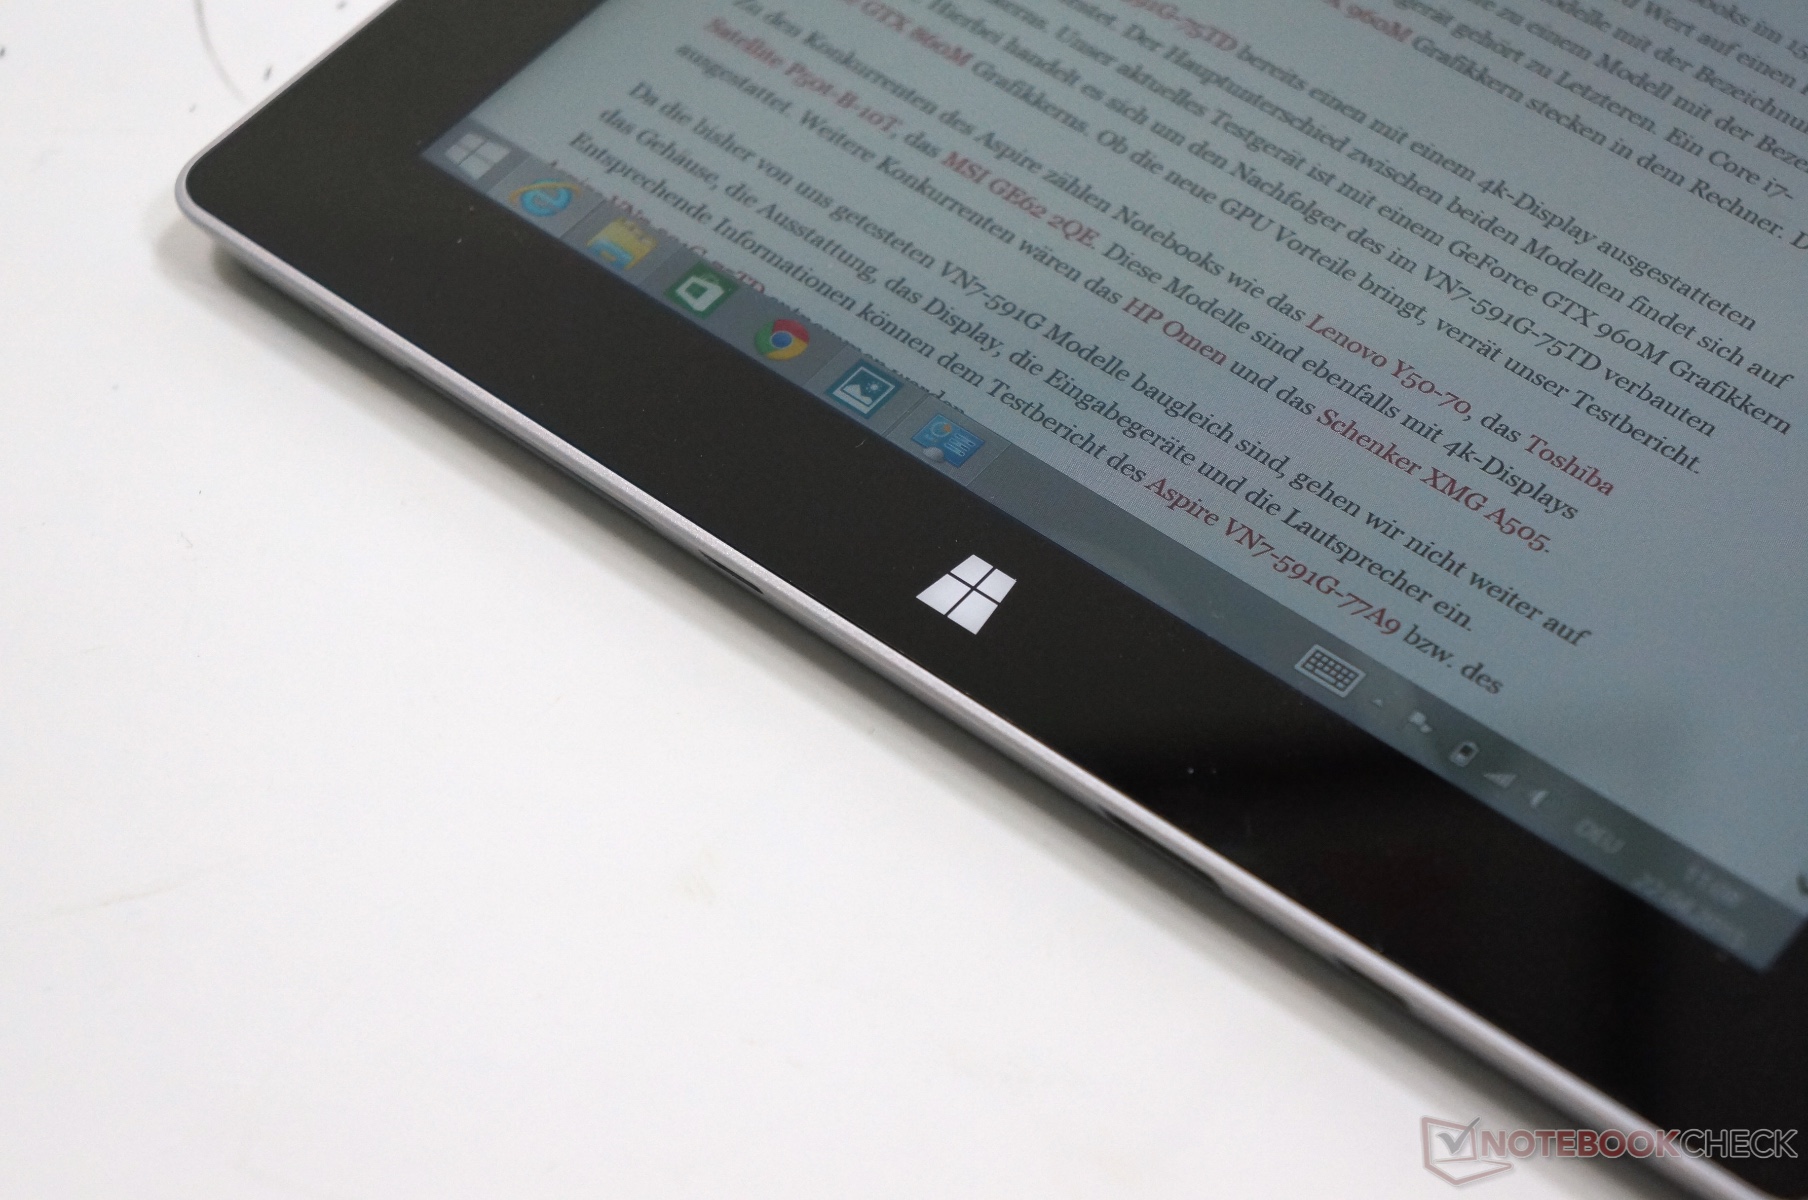
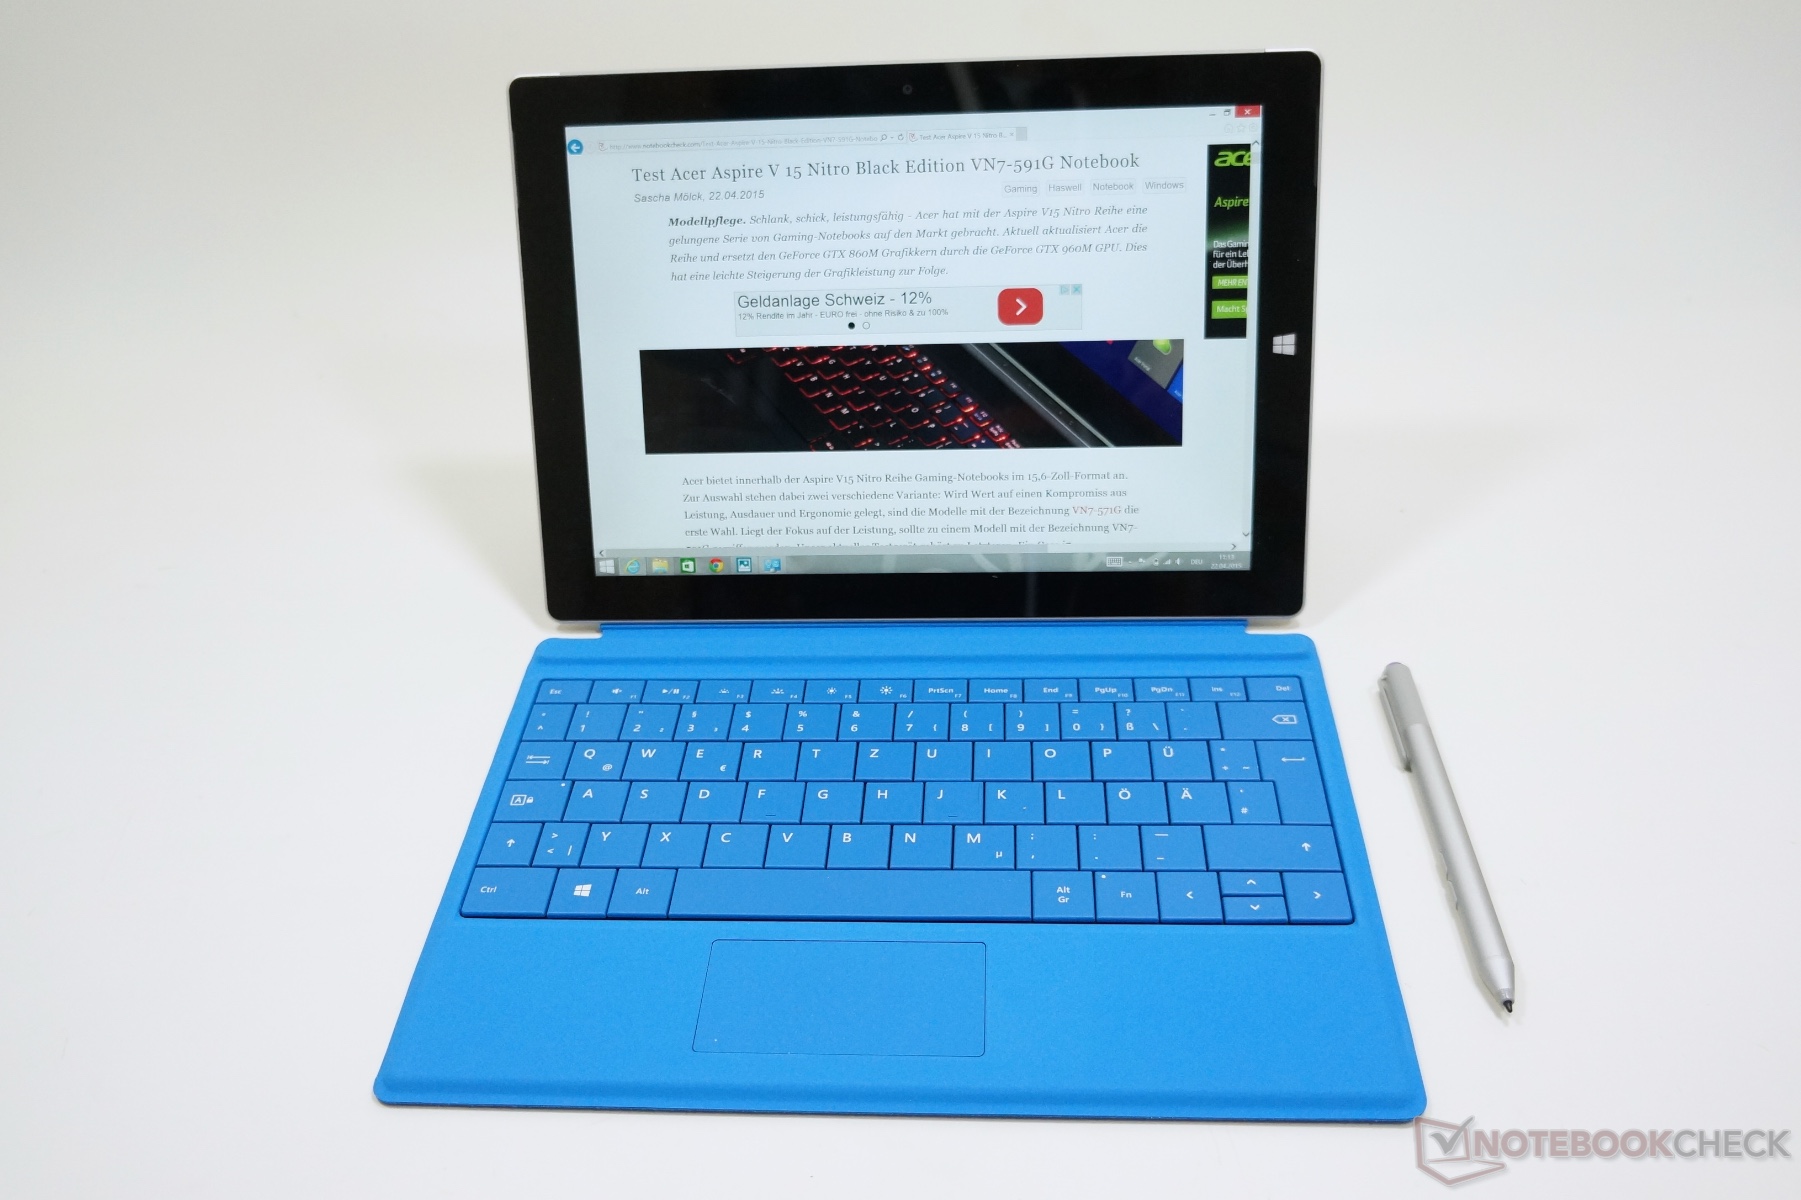
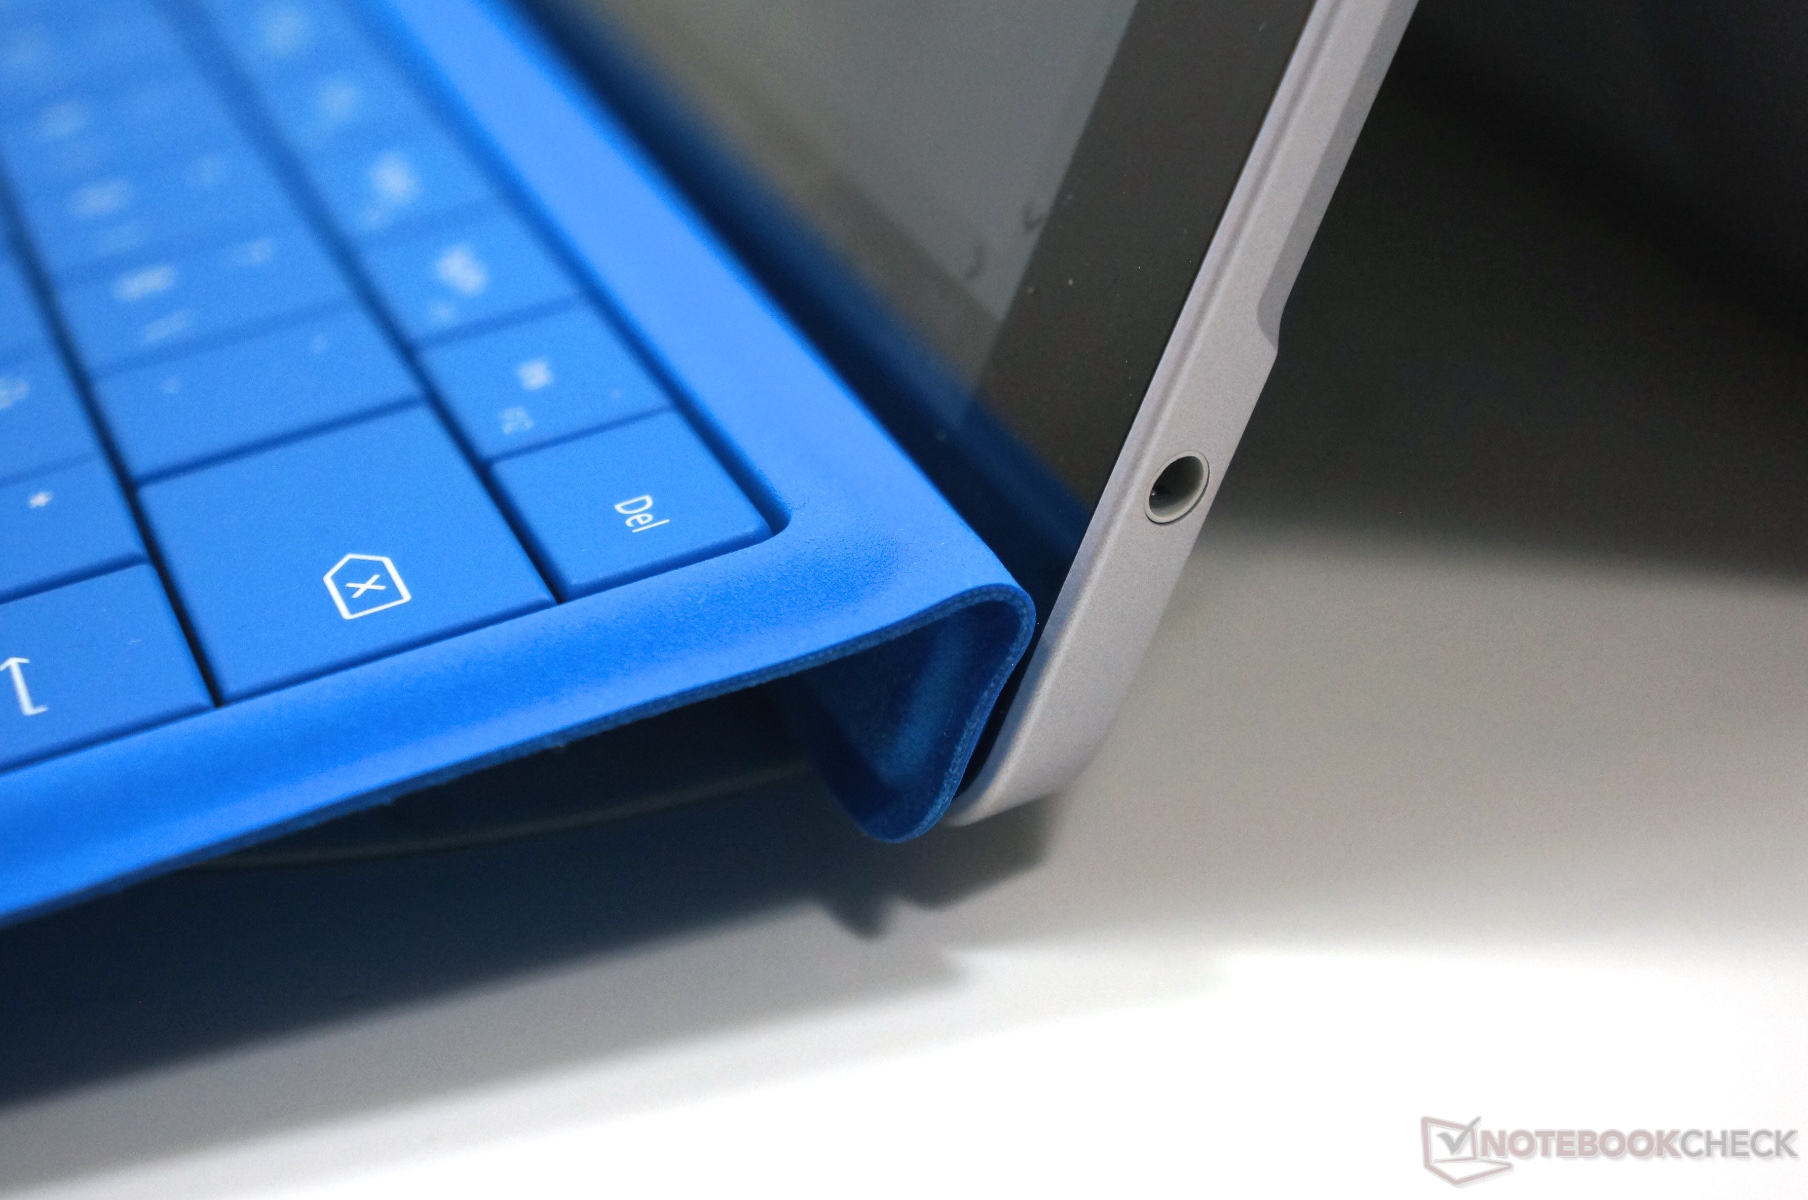
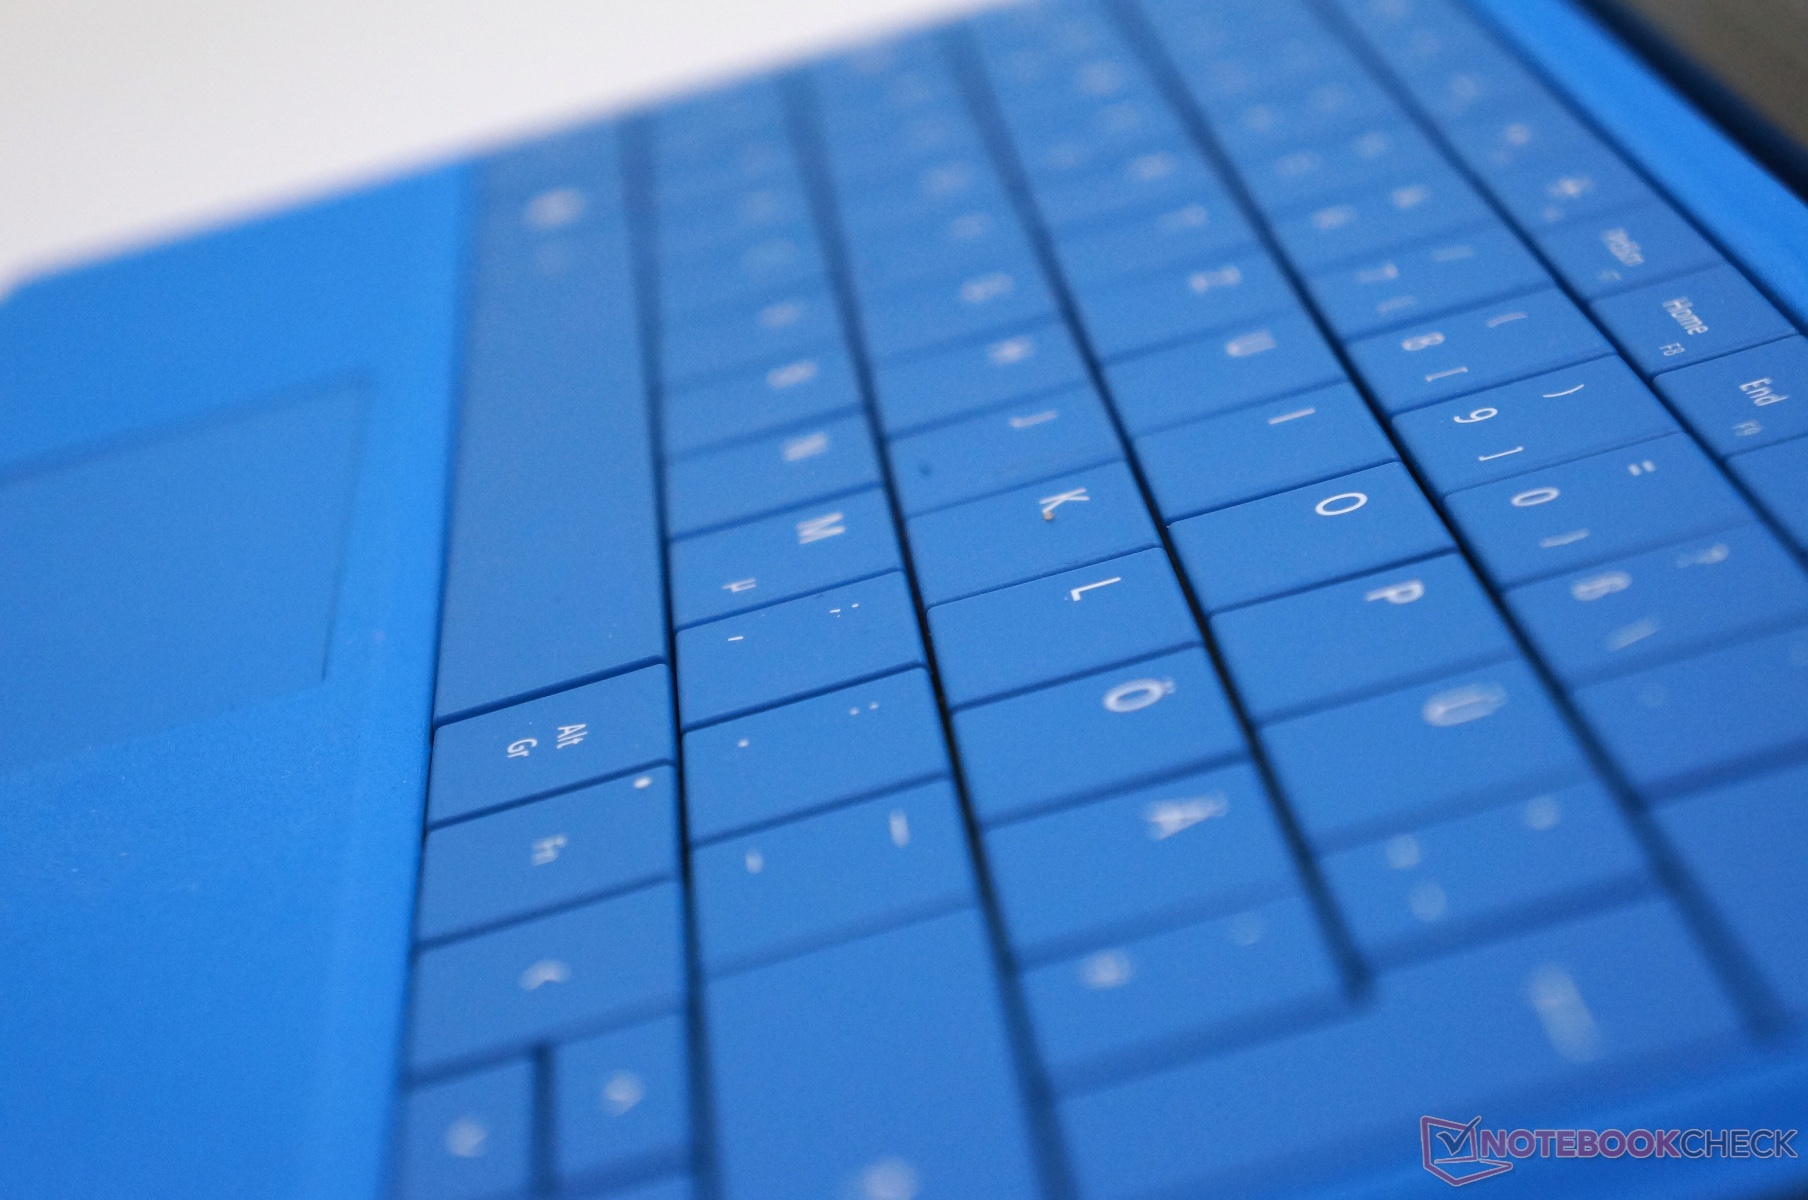
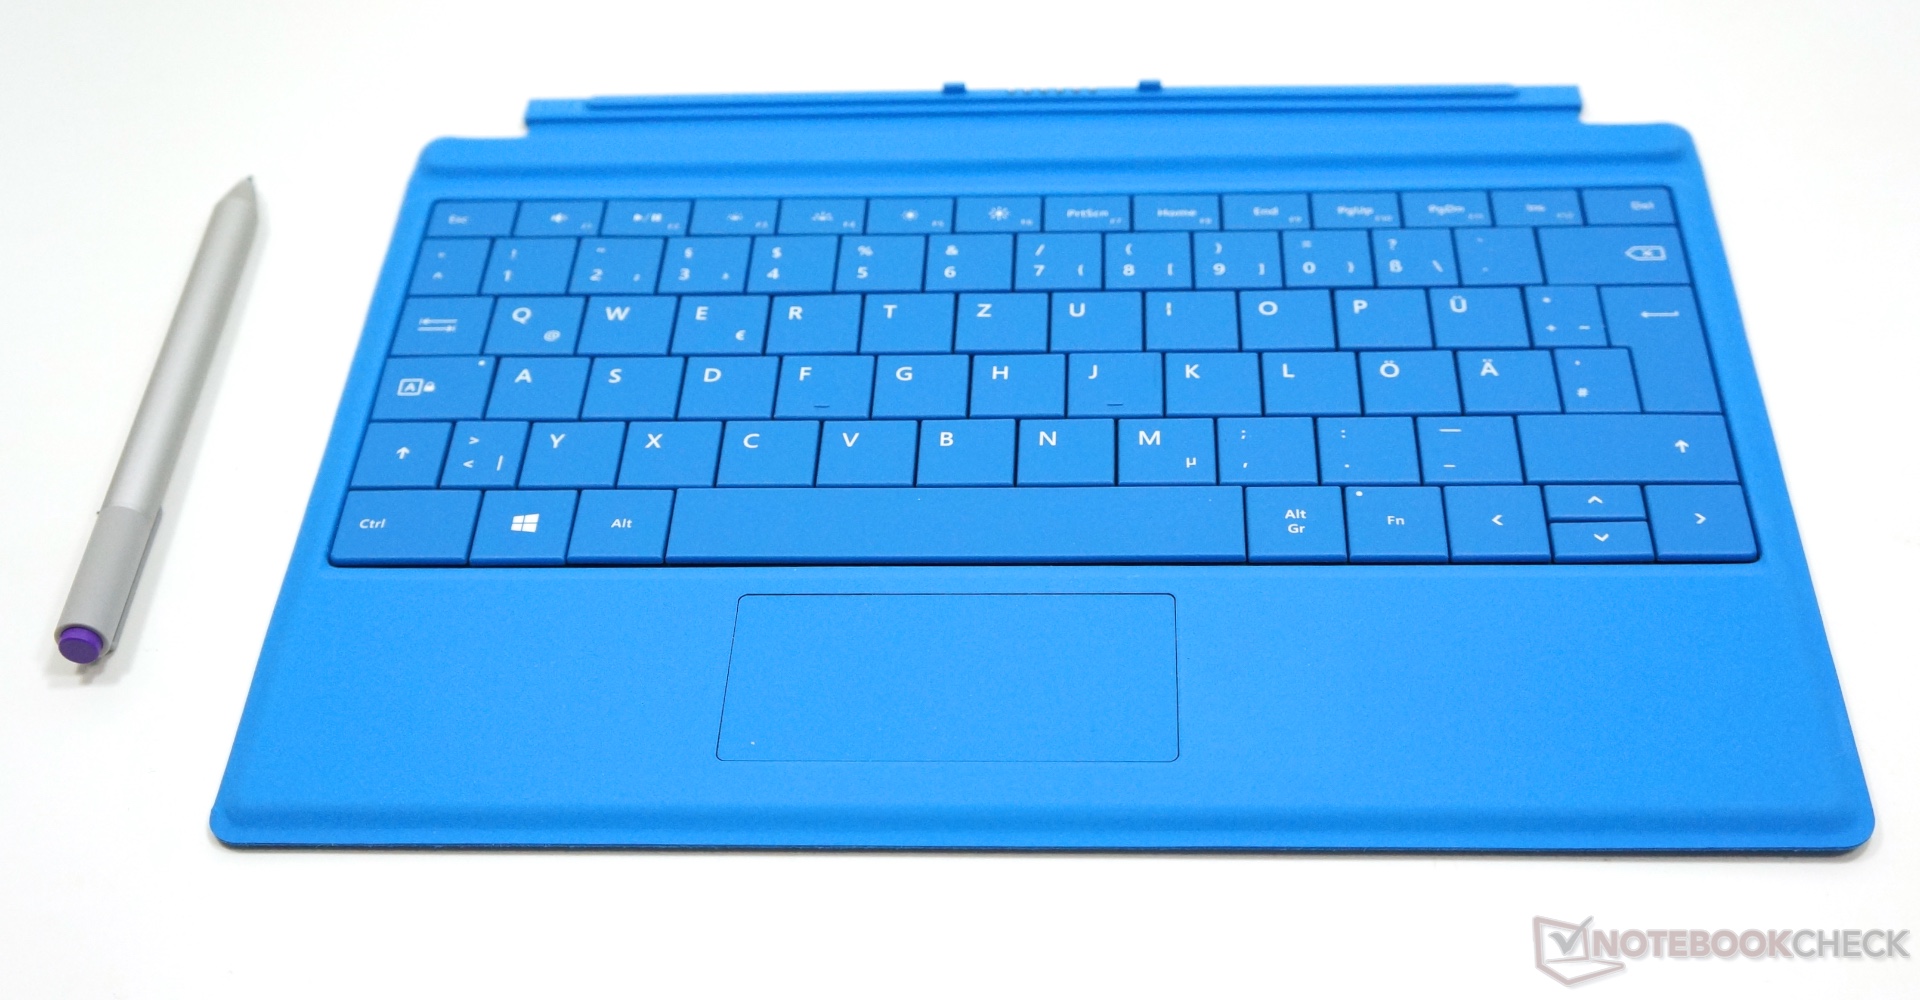
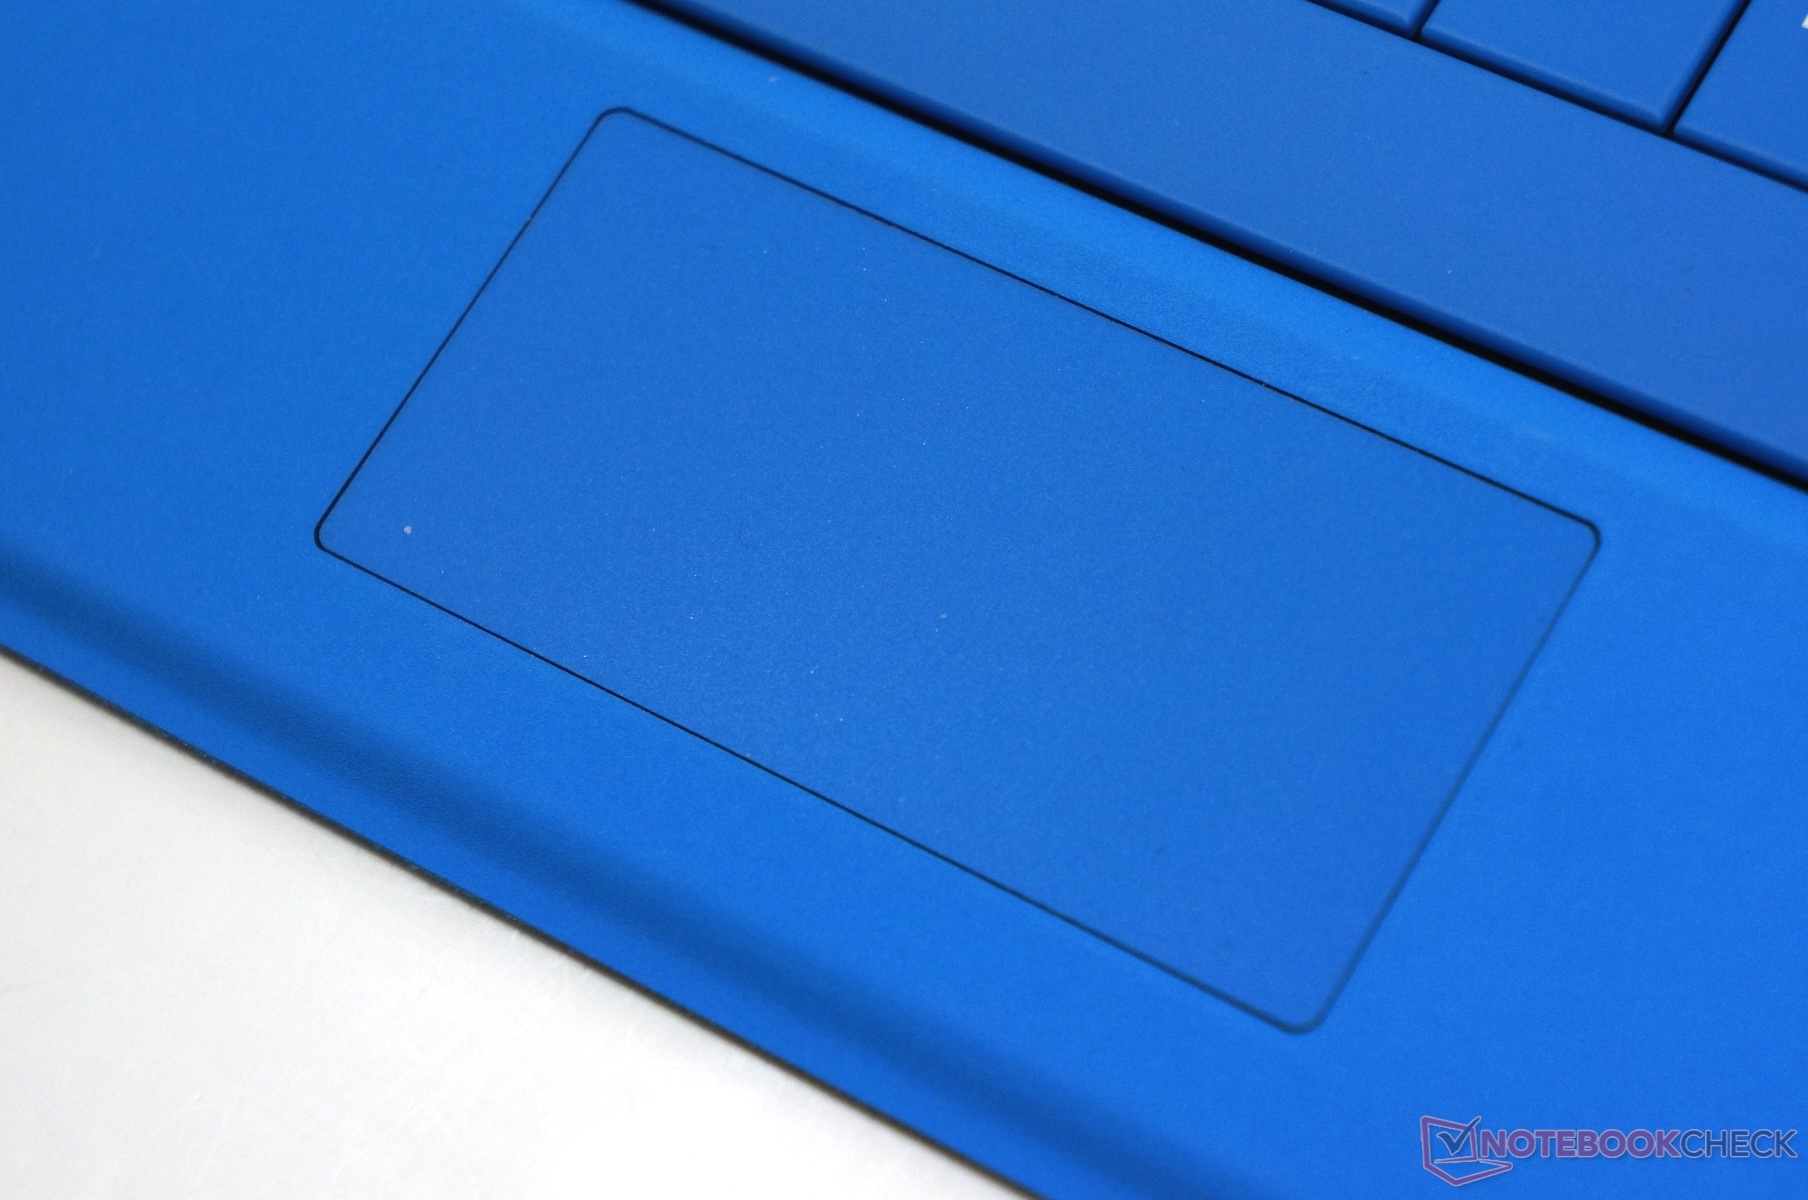
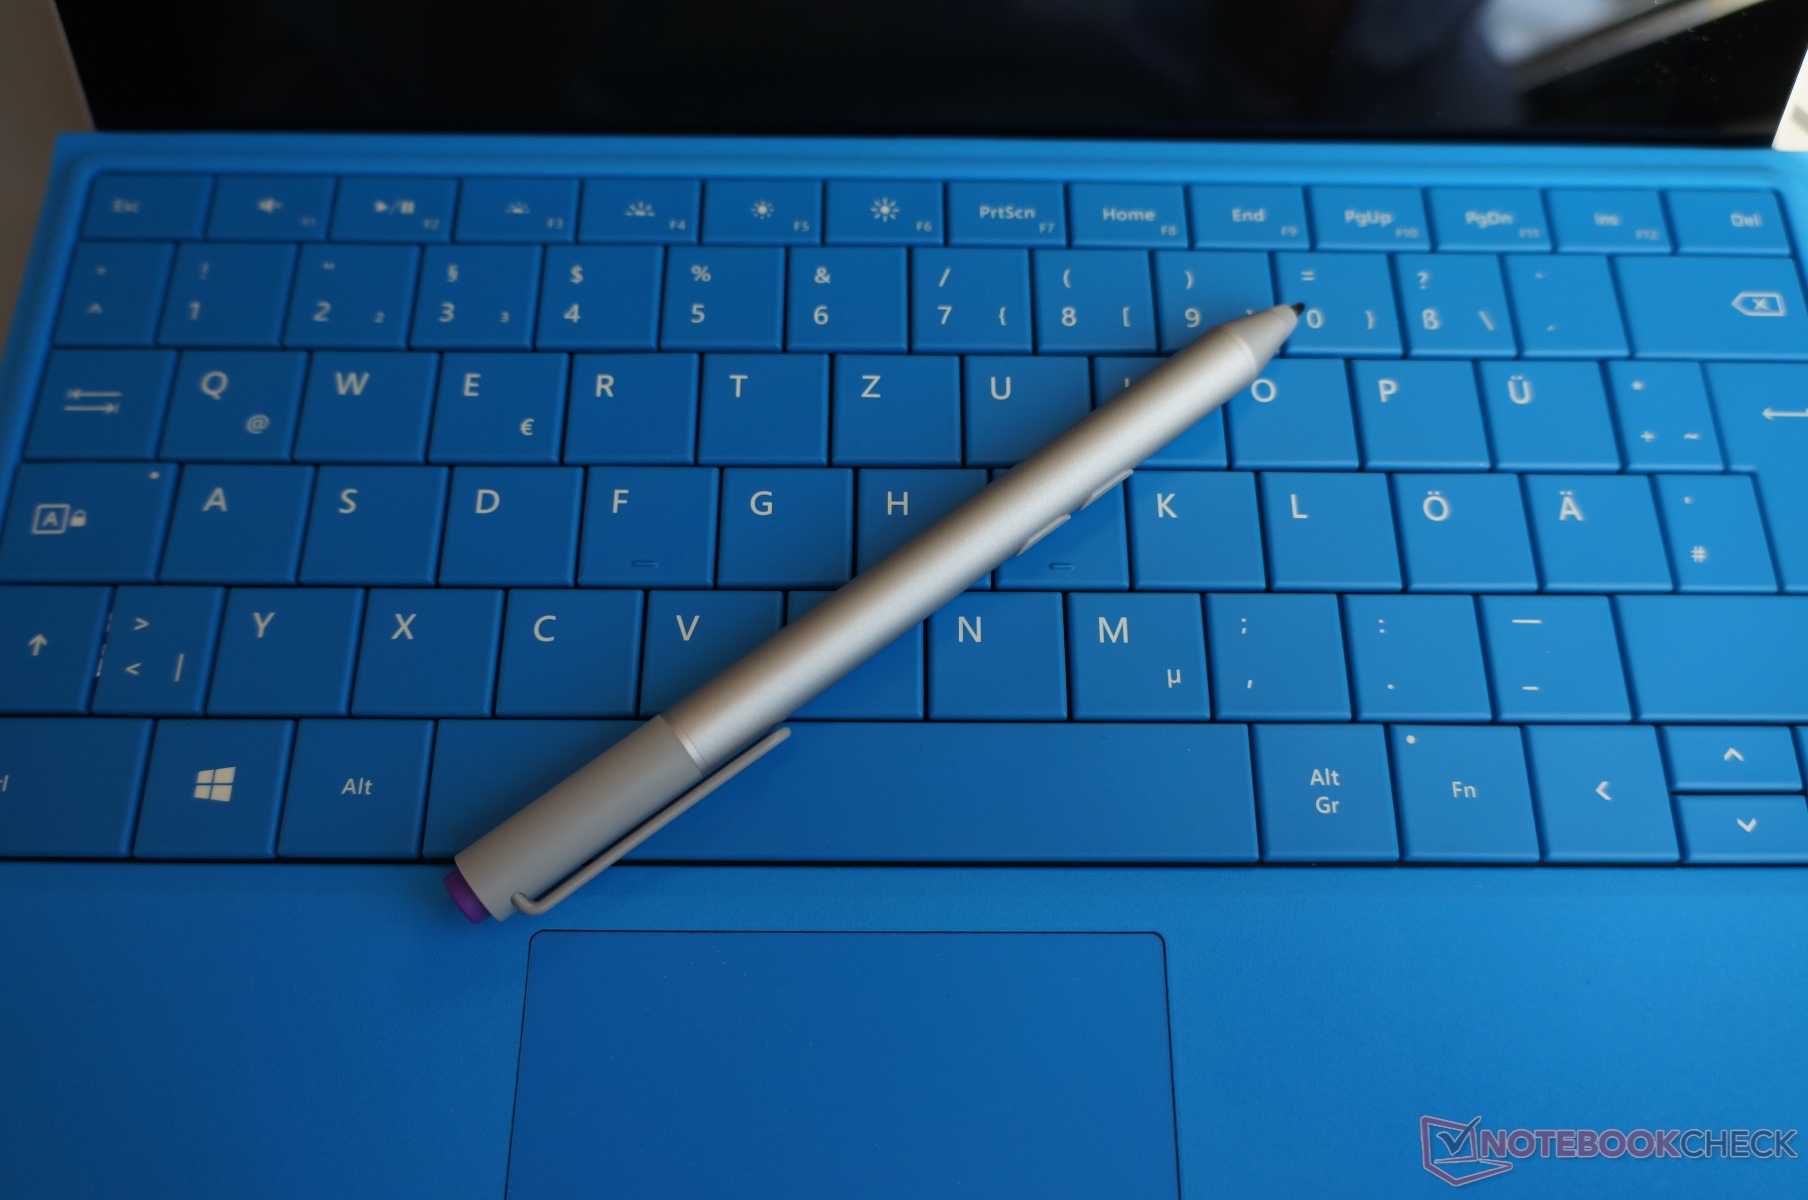
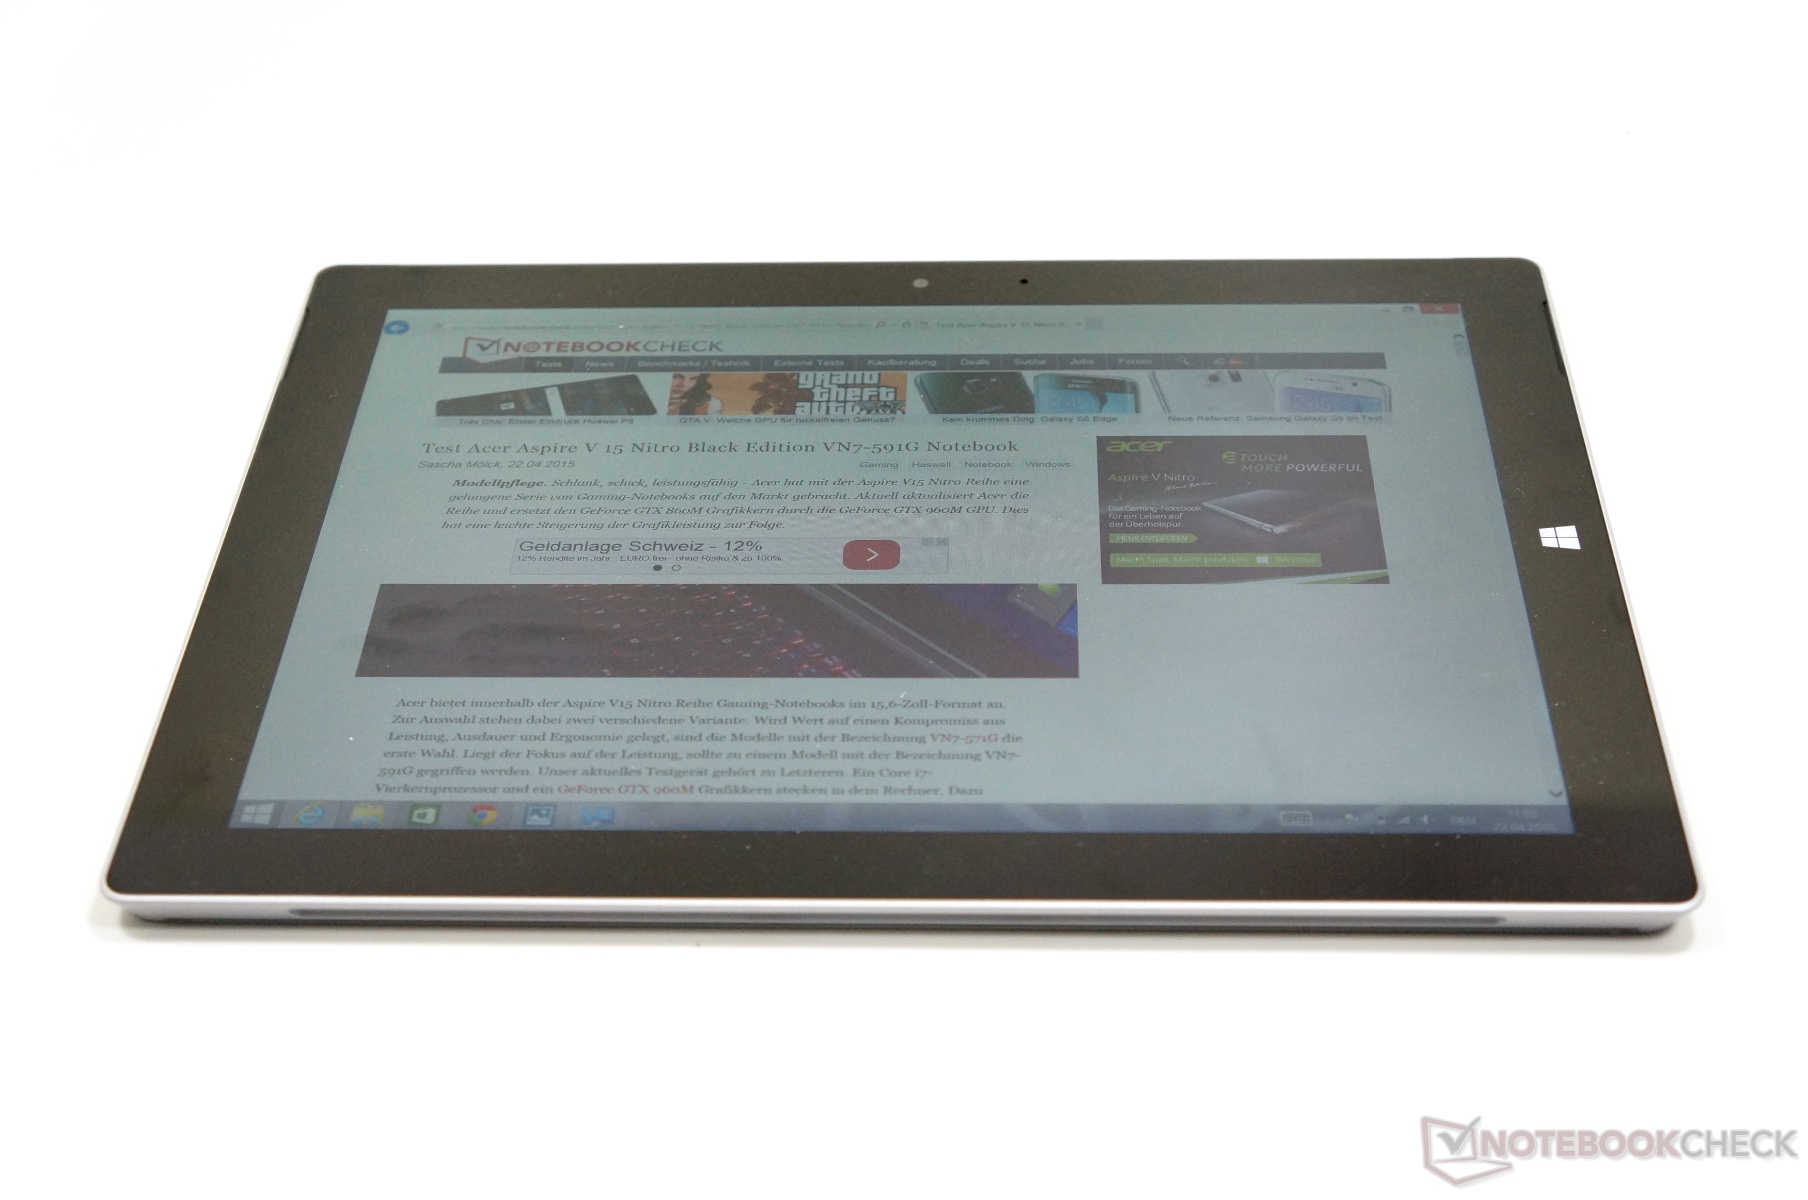
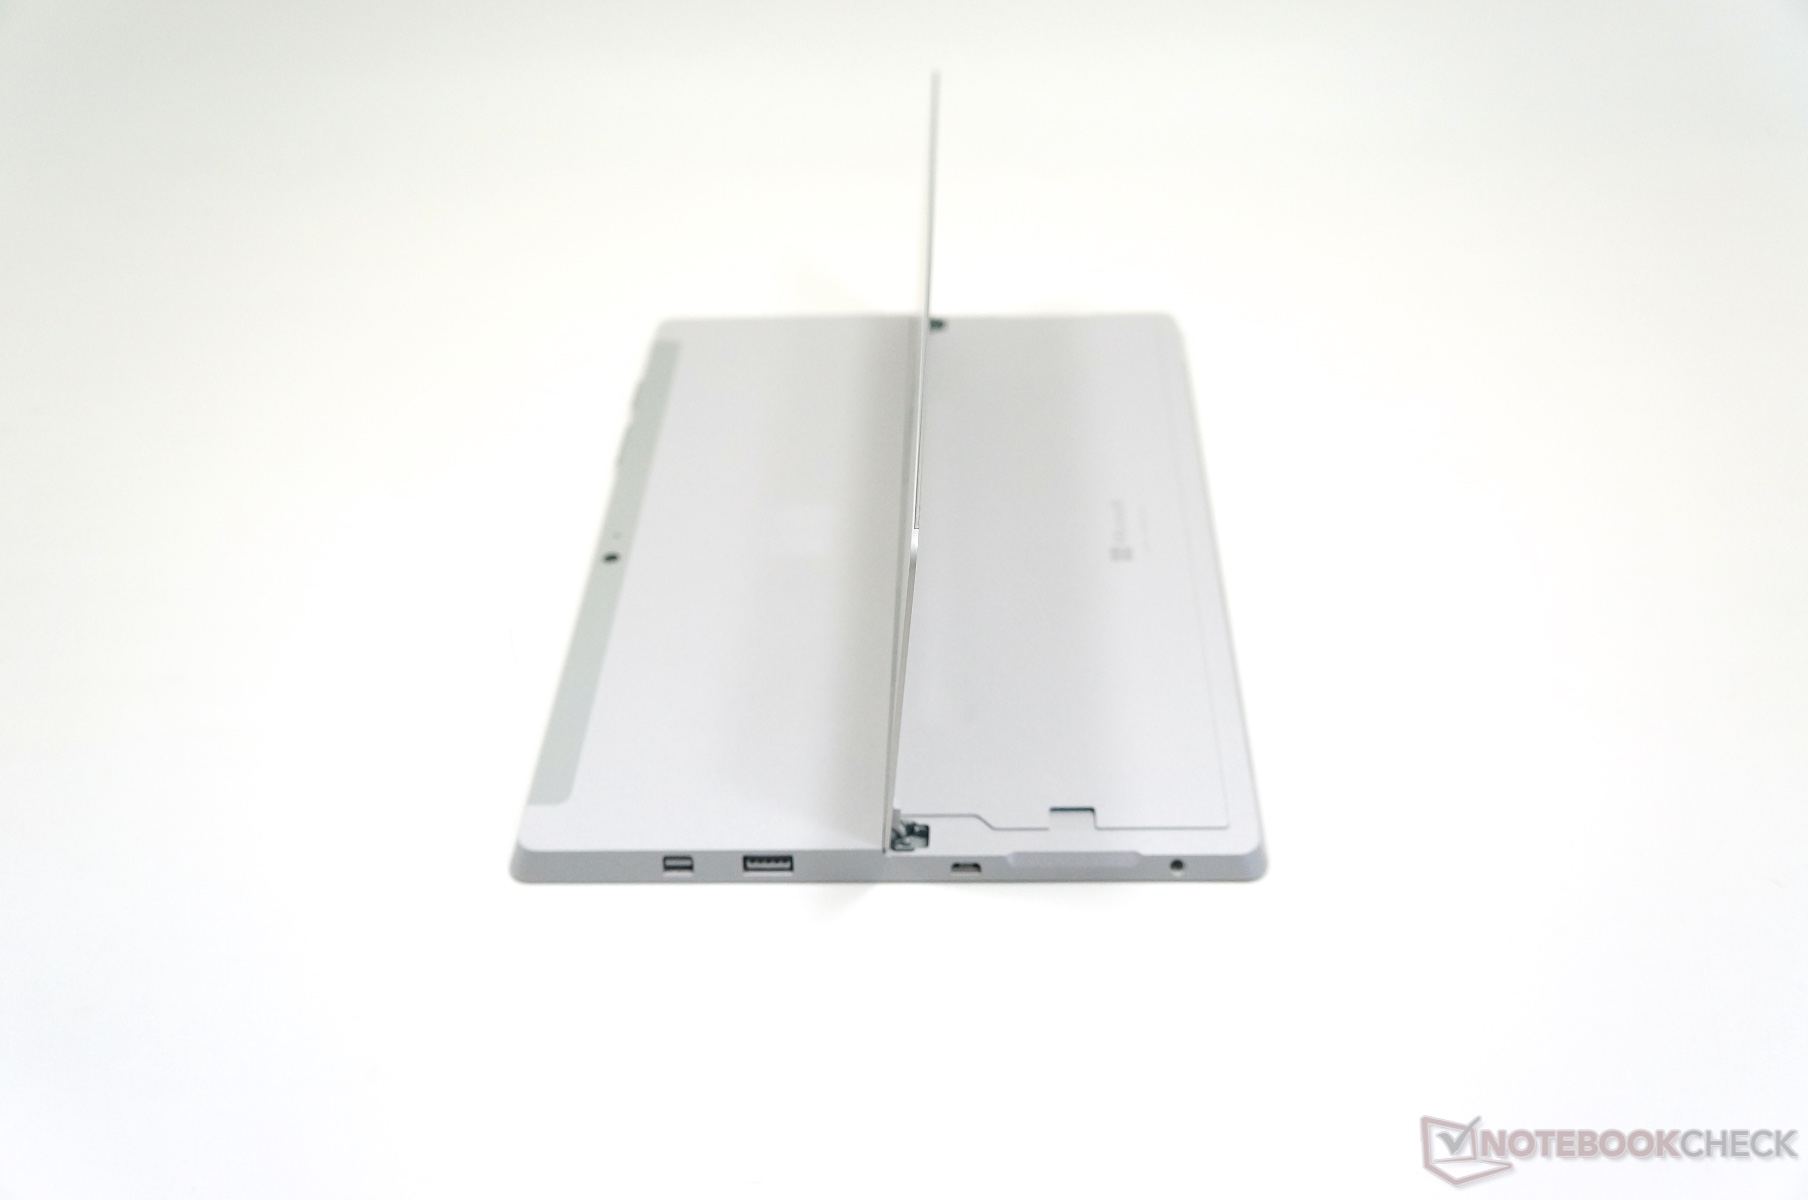
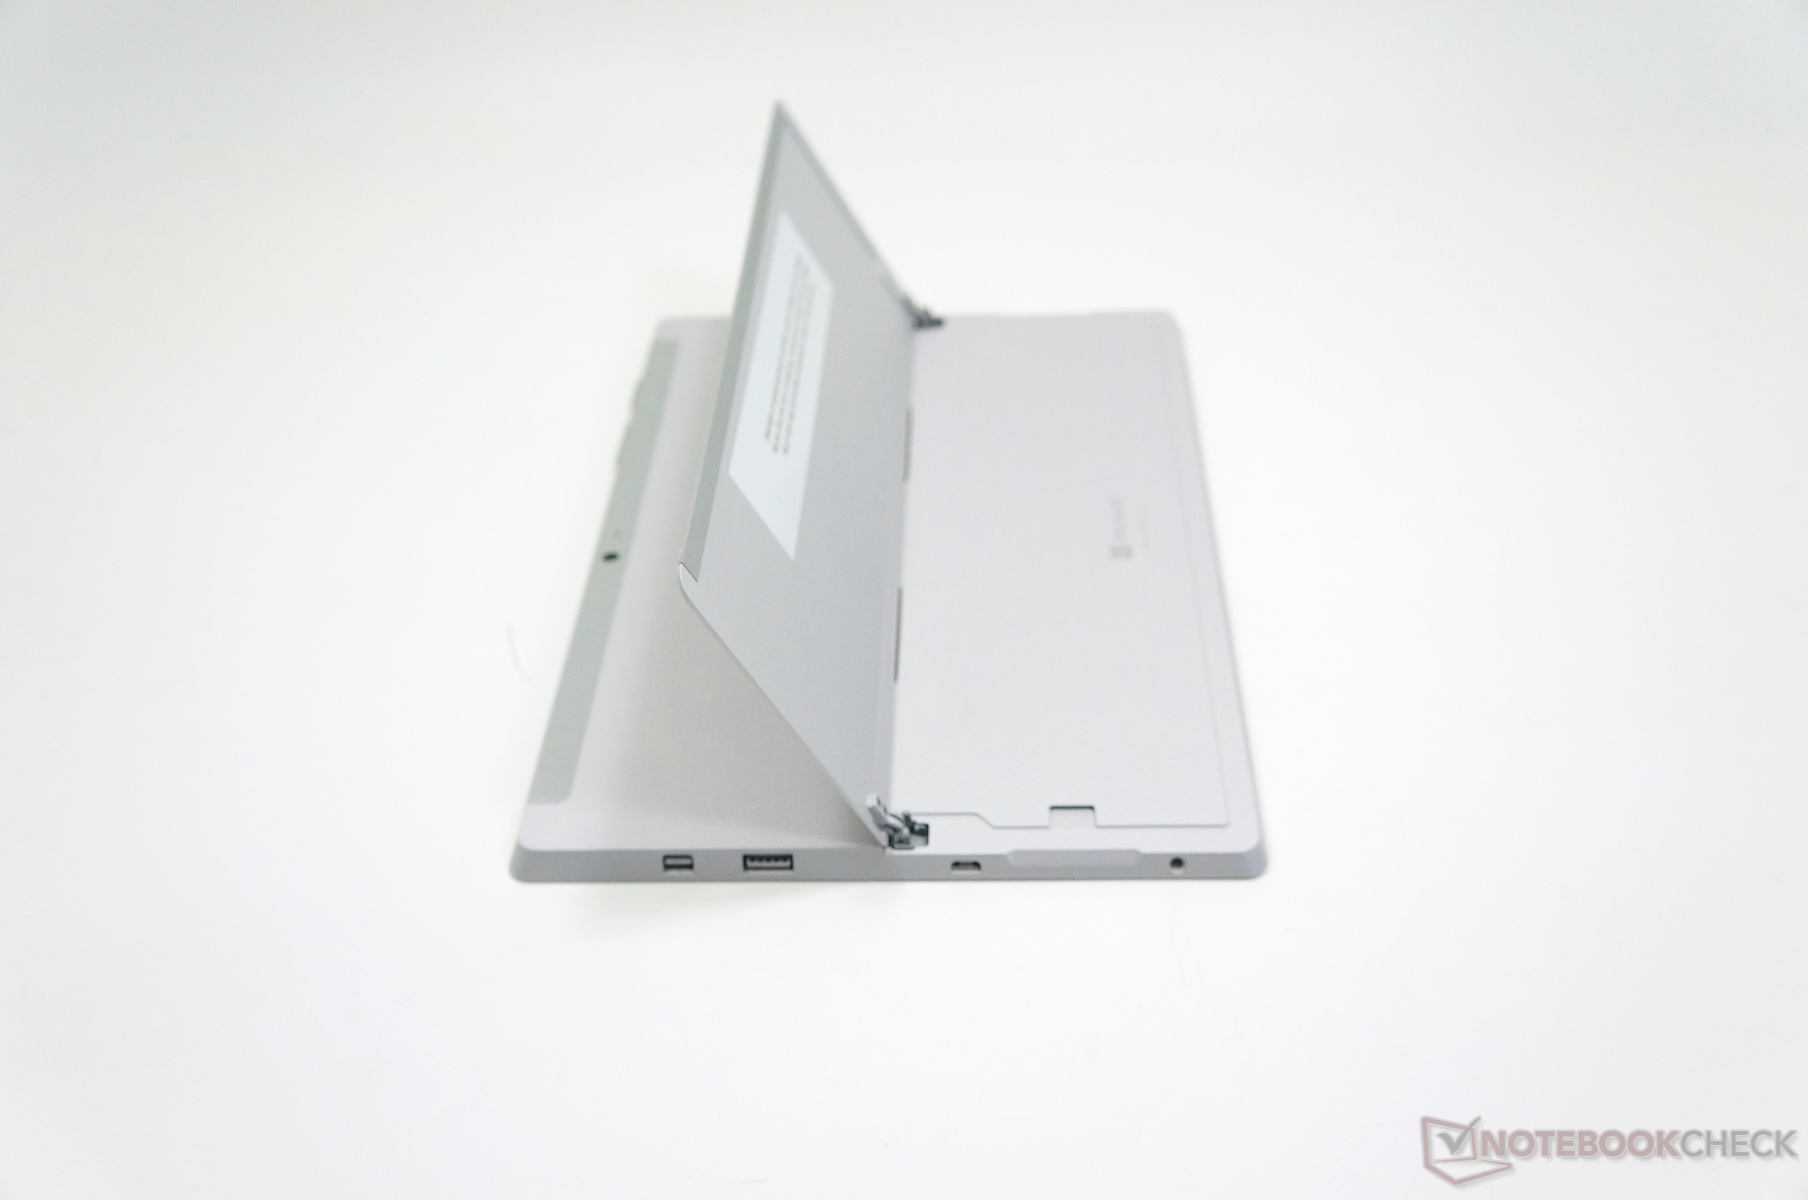
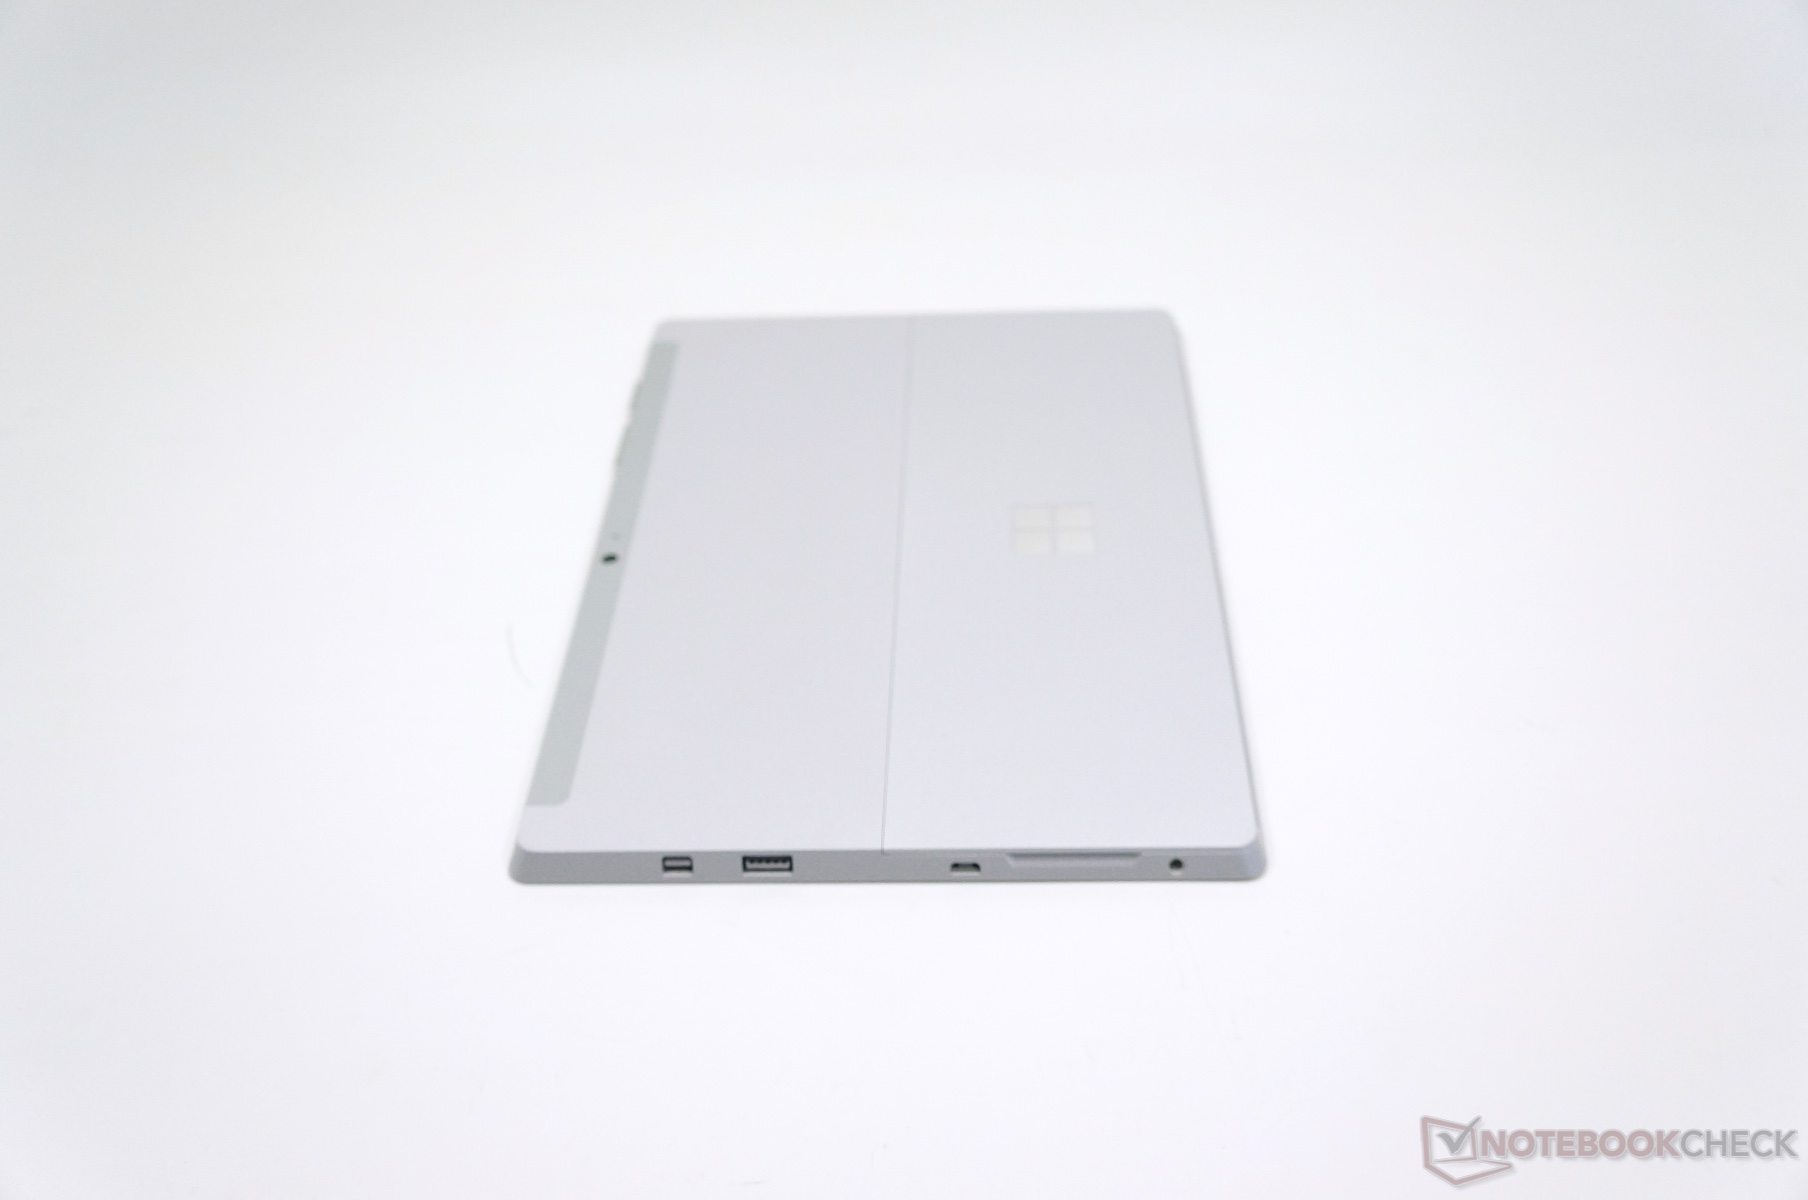
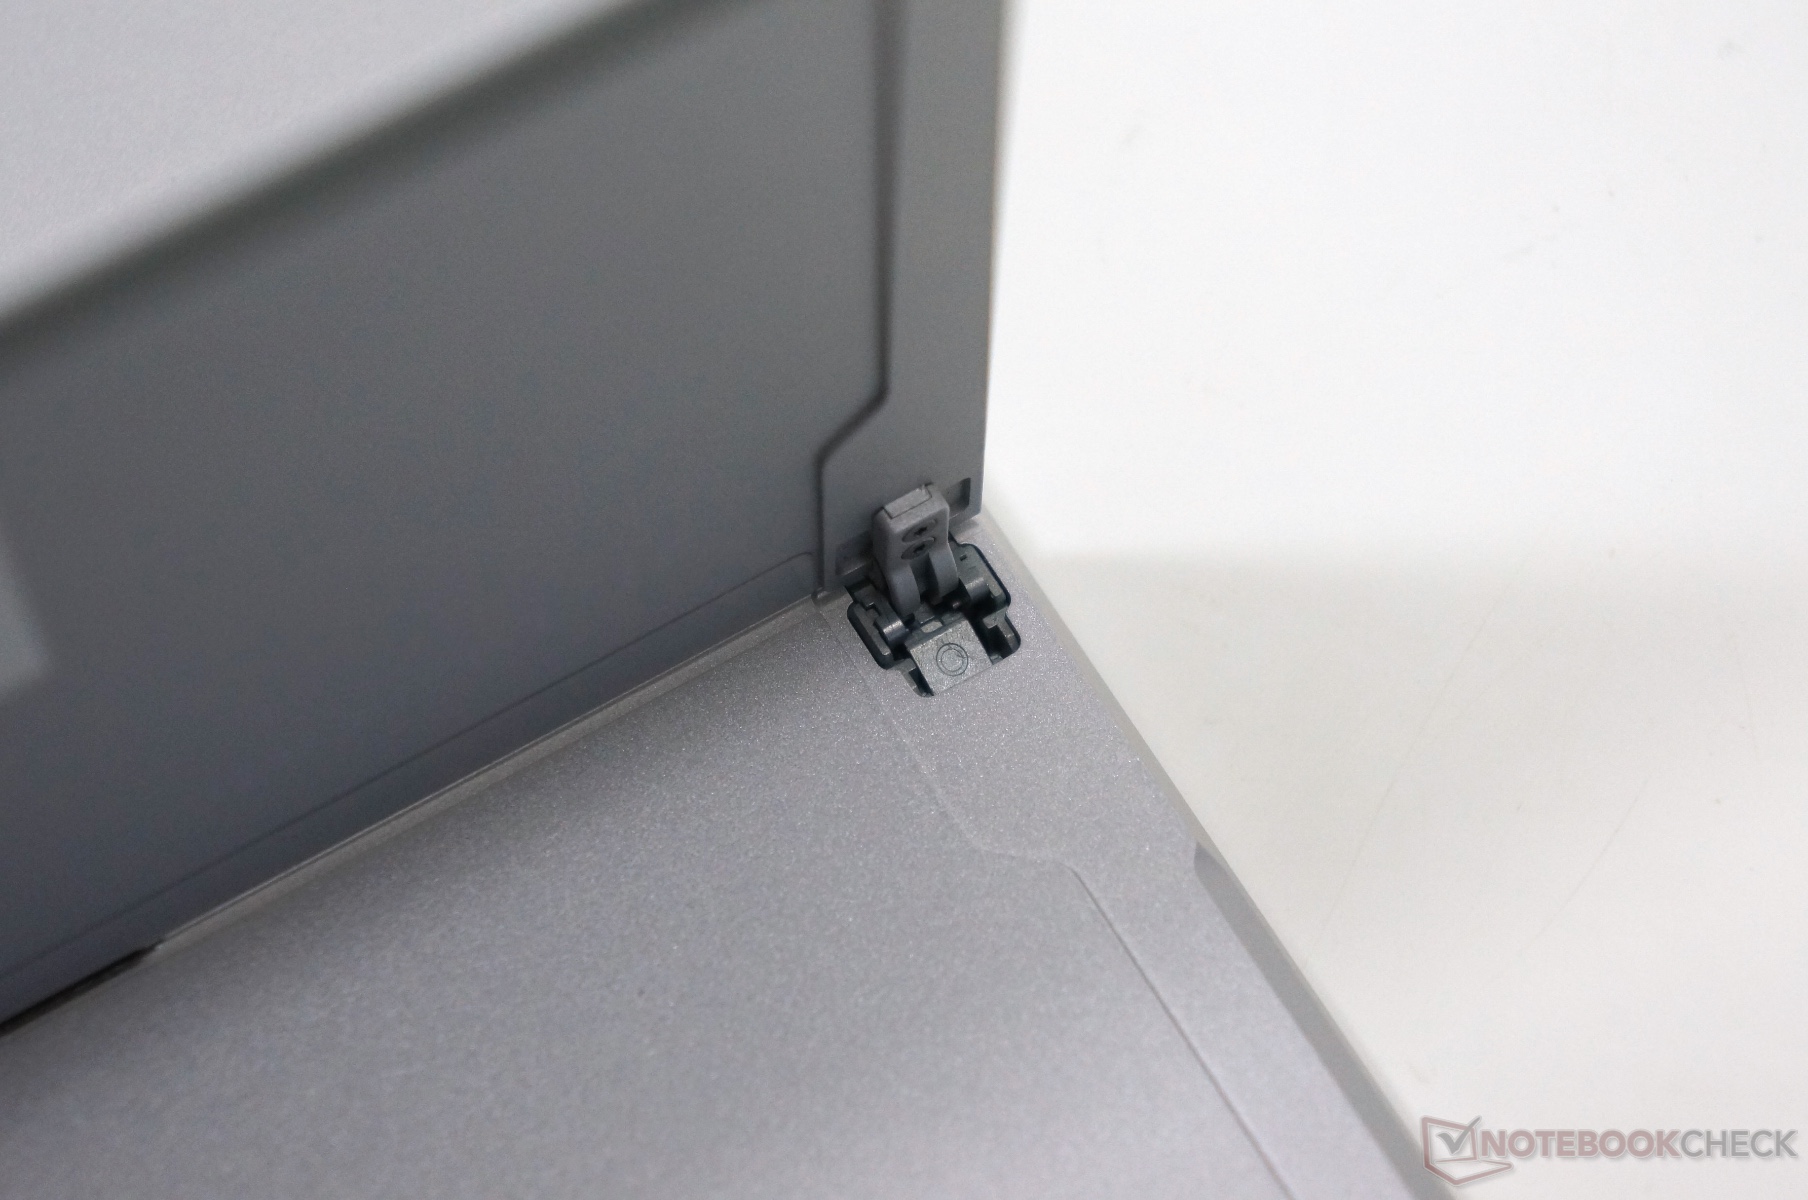
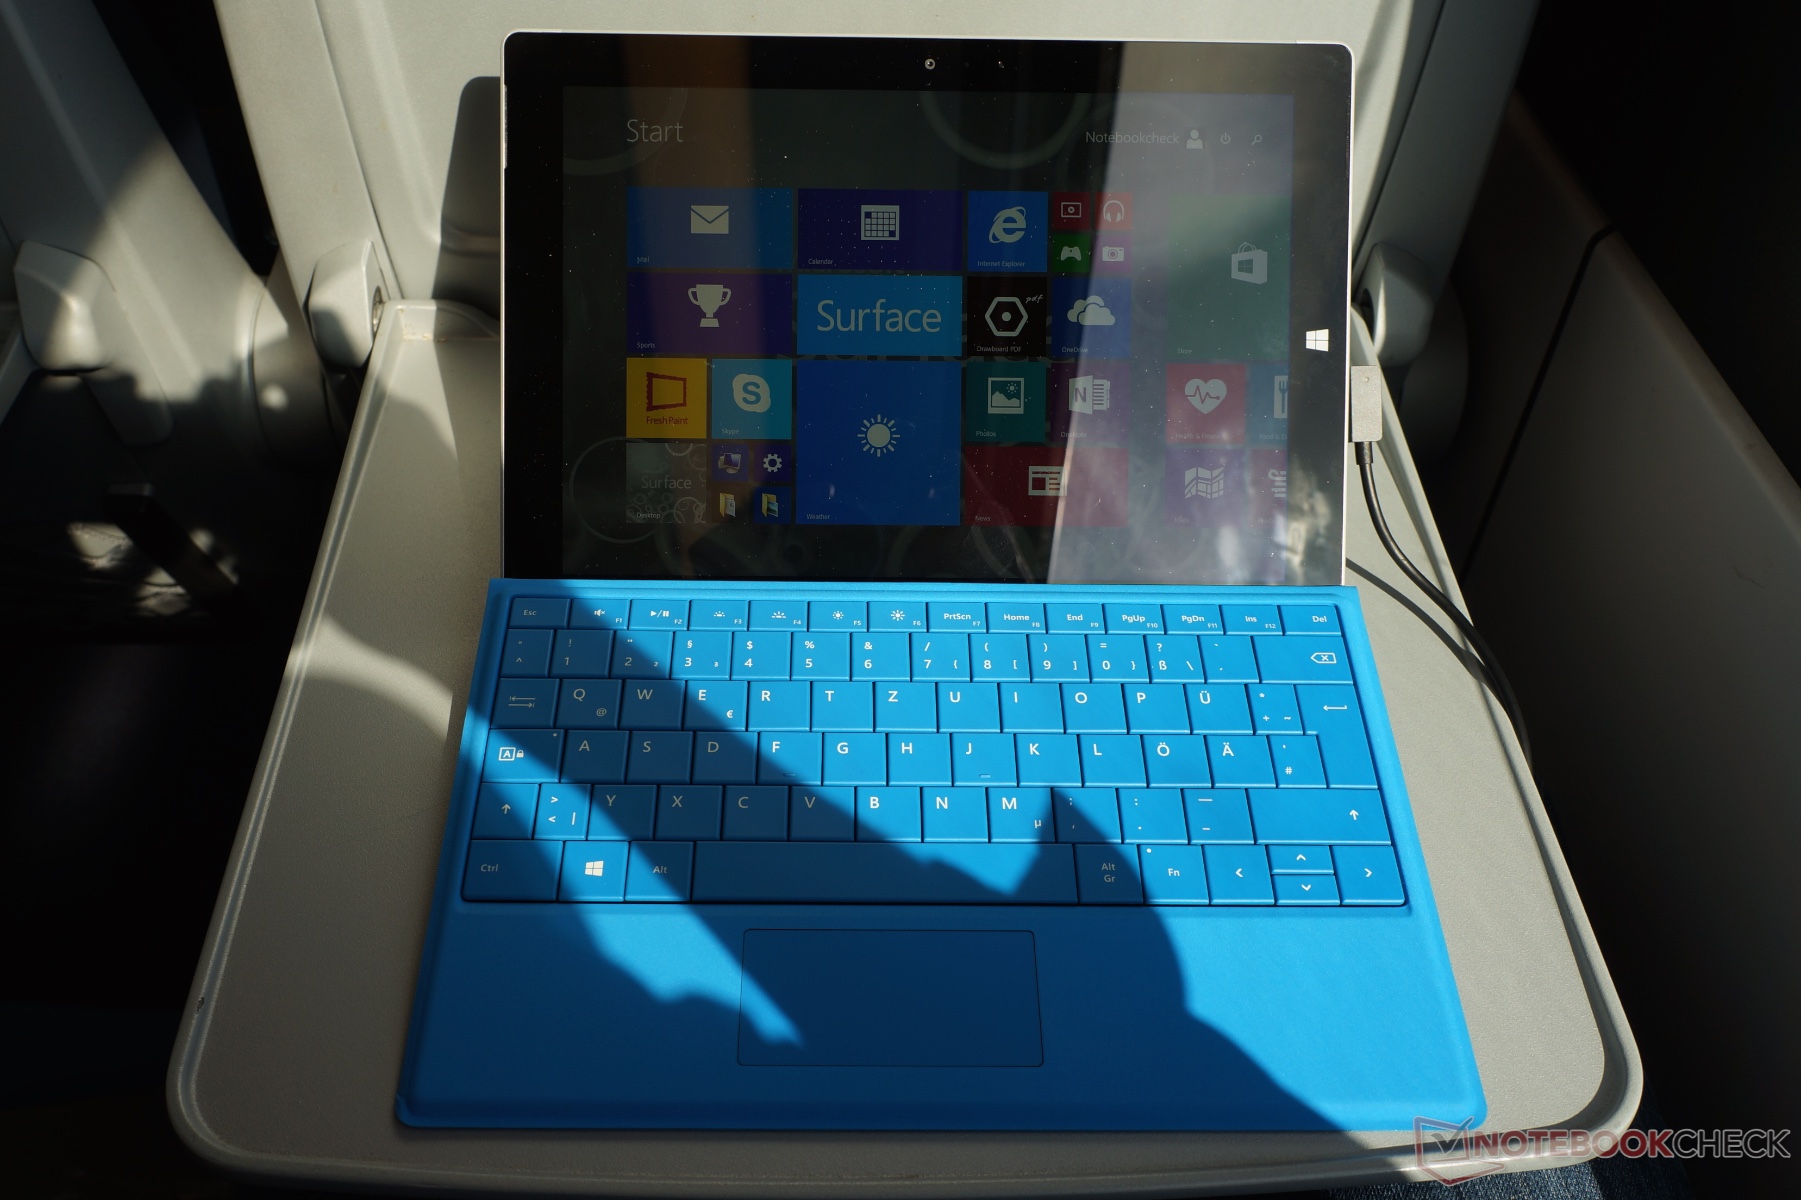
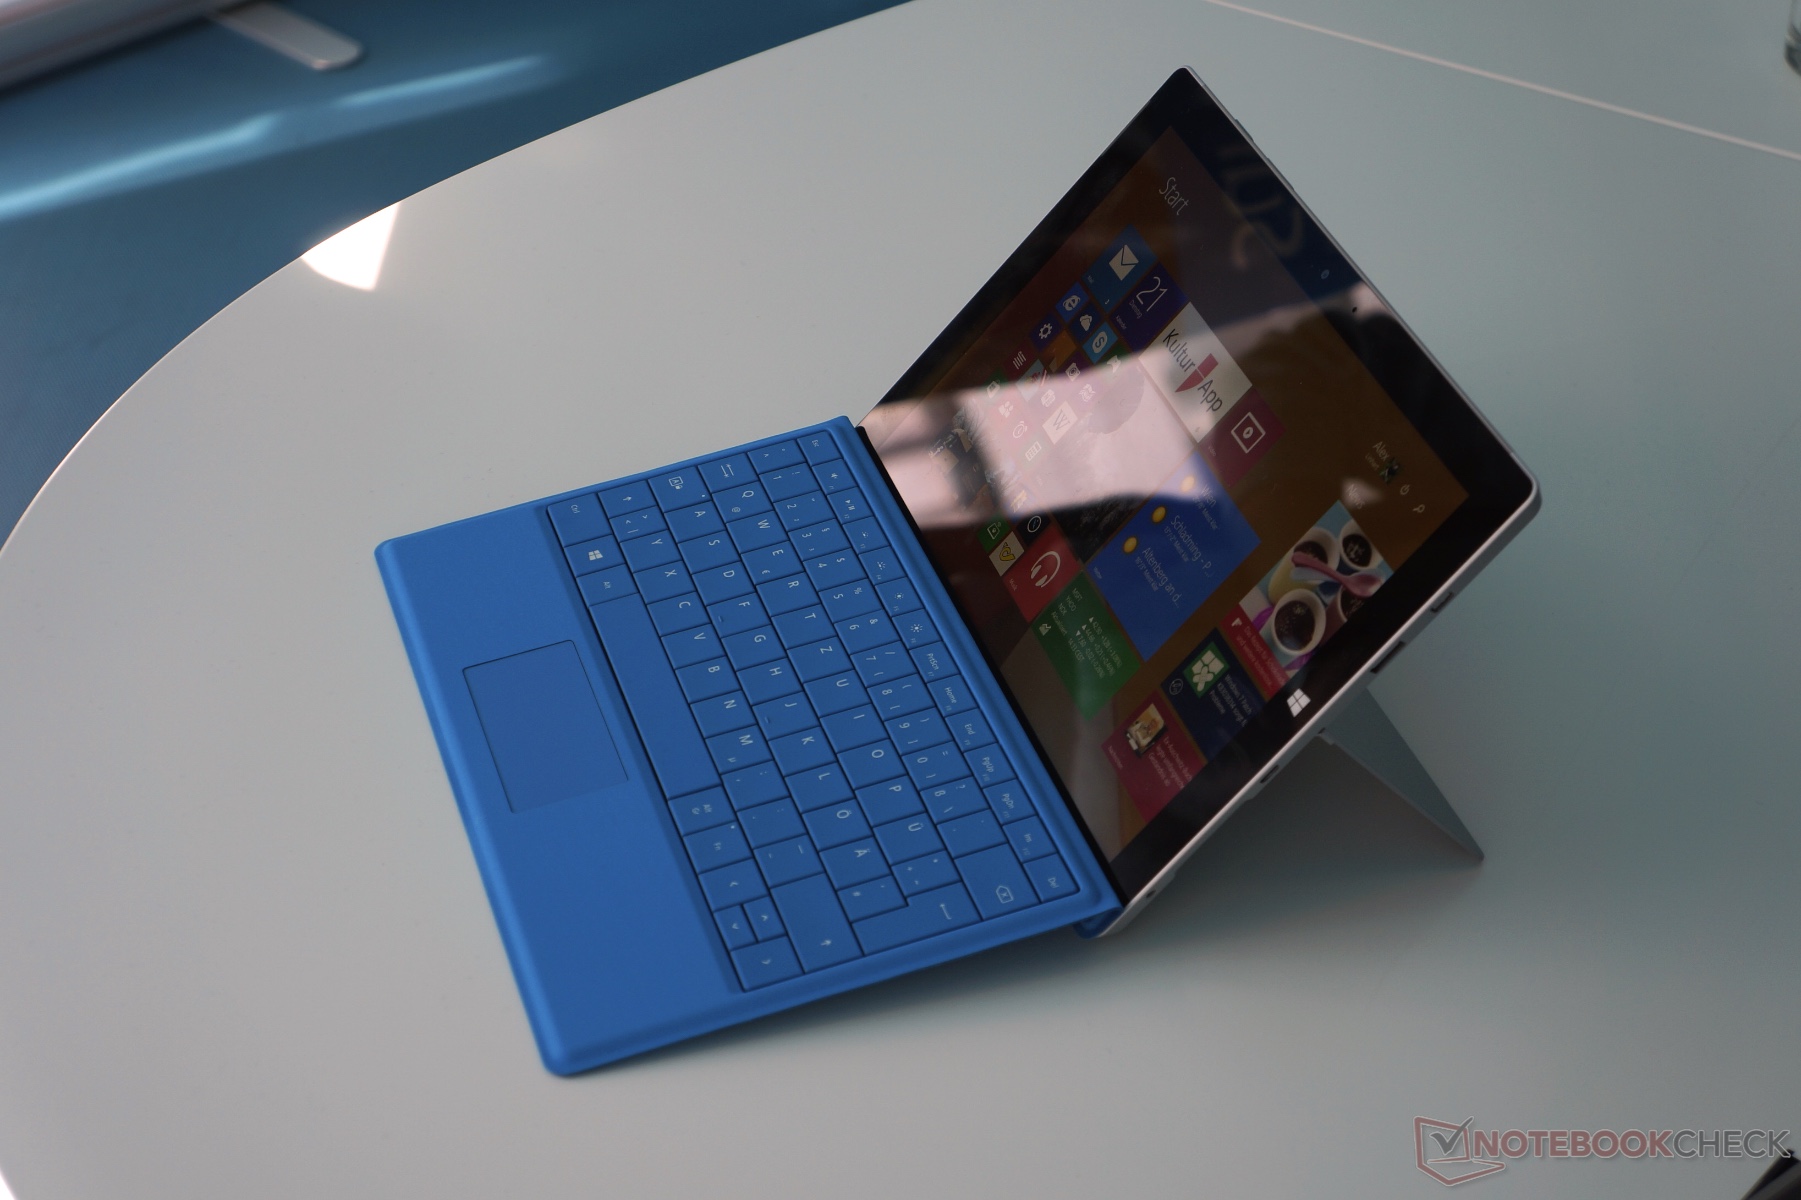
Ya hemos mencionado que el Microsoft Surface 3 es un paquete interesante, que no revela ningún problema serio a primera vista. Chasis y calidad de construcción mantienen el buen nivel del predecesor, la Type Cover se puede usar par atextos largos, el display convence con buena iluminación y colores precisos y el nuevo formato de 3:2 puede ser una pequeña ventaja para la productividad. El rendimiento también parece ser suficiente.  

El Surface 3 cierra el hueco entre un tablet y un notebook como nunca habíamos visto antes. Estamos deseando seguir el viaje de los productos  Surface el próximo par de años.

Seguiremos haciendo tests, pruebas y mediciones en el Surface 3 y añadiendo los resultados paso a paso en este artículo.

Actualización 05/02/2015: Como era de esperar, el análisis de la solución de almacenamiento (eMMC) revela grandes problemas comparado con los SSD convencionales. Esto se nota principalmente al copiar ficheros, pero también al abrir y guardar ficheros desde dentro de aplicaciones.
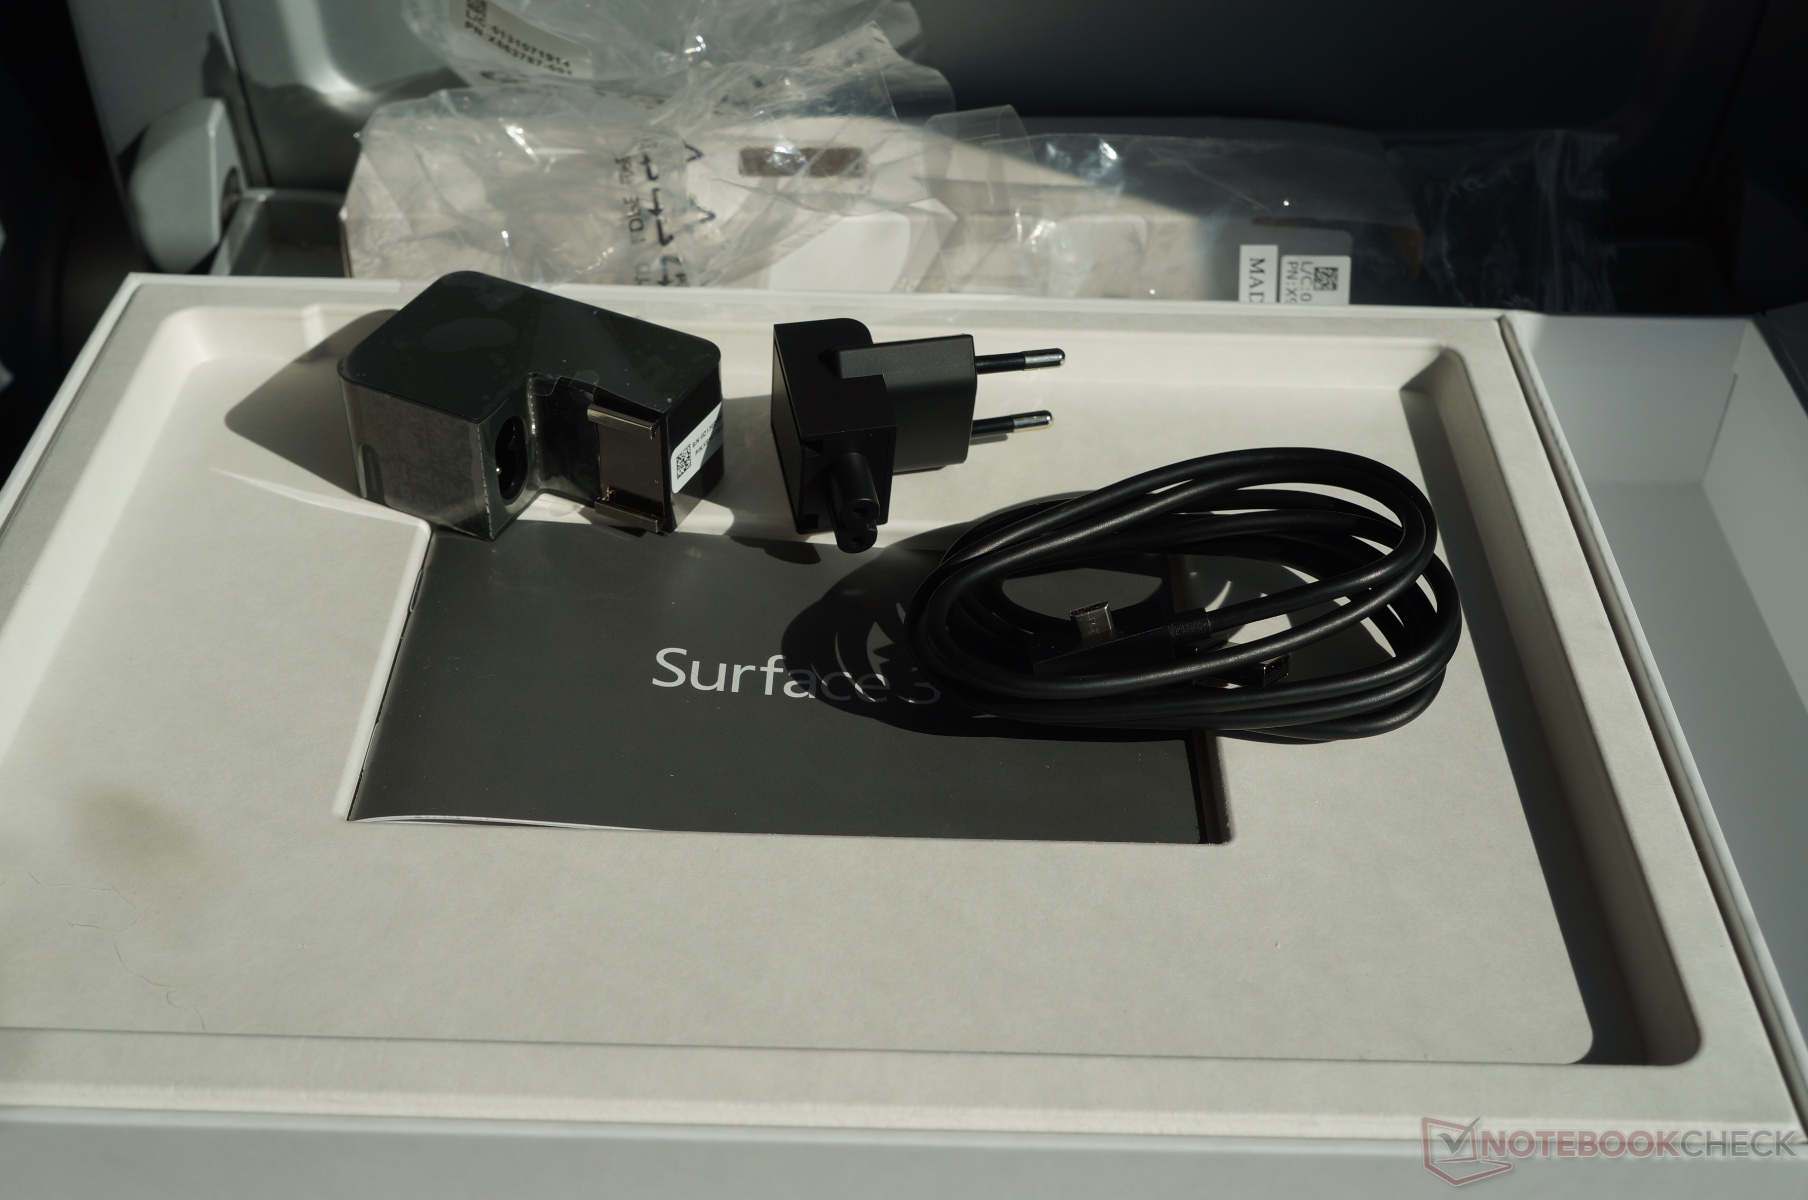
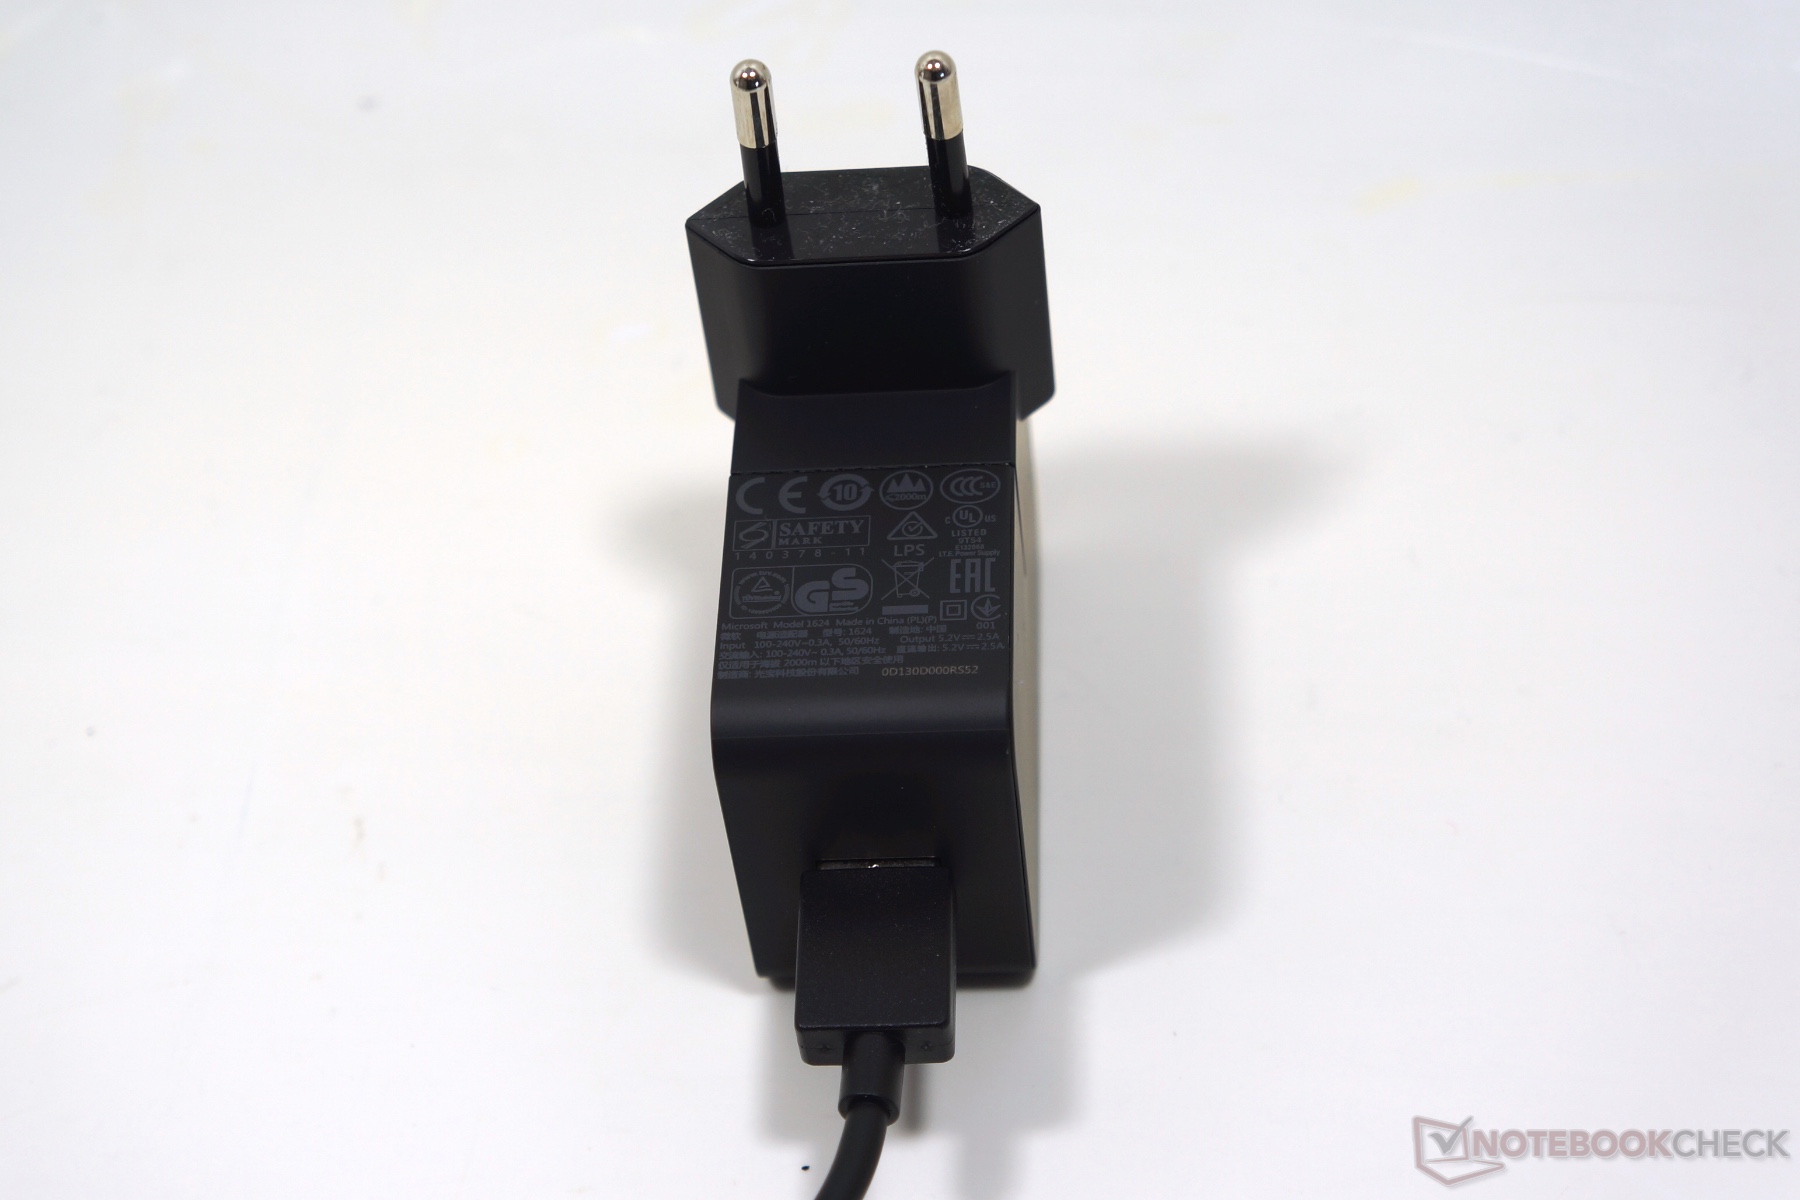
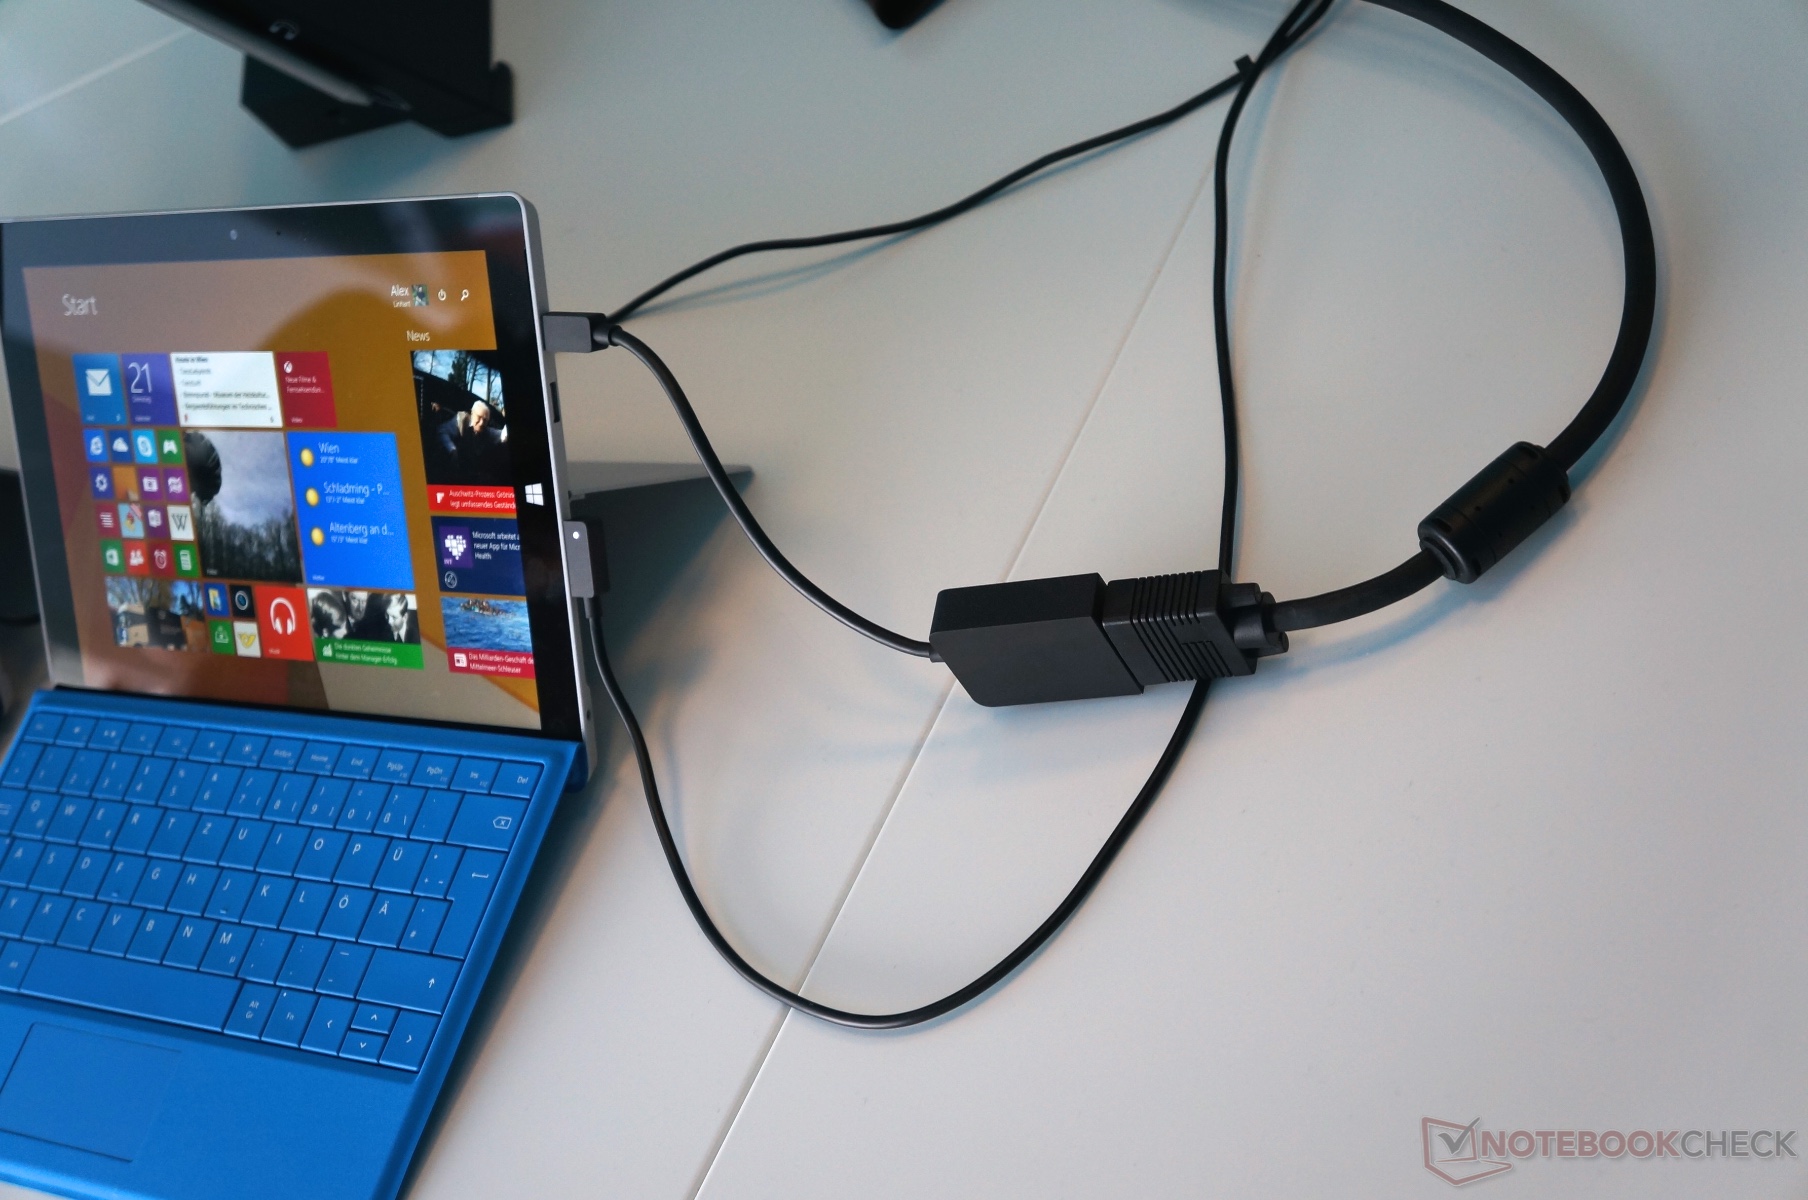
La duración de batería del Surface 3 es buena y logra más de 7 horas en nuestro test WLAN. El defecto del Surface 3, empero, es el tiempo de carga. No puedes usar el dispositivo si quieres cargar por completo la batería en 3-4 horas. Si usas el dispositivo, puedes esperar tiempos de carga de hasta 8 horas cuando la batería esté vacía. Esto resultó en problemas bastante grandes cuando probamos el dispositivo en la carretera.

Ésta es una versión acortada del análisis original. Puedes leer el análisis completo en inglés aquí.

Microsoft Surface 3 vs Nvidia Shield Tablet LTE
3rd party accessory bags
13-watt USB power adaptor
USB charging cable
Surface 2 vs Surface 3

Pricecompare

Please share our article, every link counts!
> Análisis y pruebas de ordenadores portátiles y móviles teléfonos > Análisis > Breve análisis del Tablet/Convertible Microsoft Surface 3
J. Simon Leitner, Klaus A. Hinum, 2015-05- 8 (Update: 2020-06- 8)