Análisis para el Intel Core i7-6600U procesador
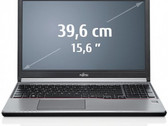
Breve análisis del portátil Fujitsu LifeBook E756 (i7-6600U, HD520)
Muchos puertos. El LifeBook E756 es un portátil para usuarios business. En nuestro análisis, el portátil de 15" destaca con sus excelentes características de mantenimiento; sin embargo, en otros lugares tiene algunas dificultades menores. Qué tipo de impresión general nos dejó el dispositivo y cómo funciona en comparación con la competencia, puedes descubrirlo en nuestro análisis.
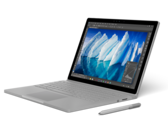
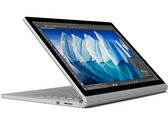
Intel Core i7-6600U, HD Graphics 520, 15.6", 1.9 kgBreve análisis del Surface Book con Performance Base – actualización 1 TB SSD
Top model.Analizamos la versión de gama alta del 2 en 1 de lujo de Microsoft con una rápido SSD NVMe de 1 TB y 16 GB de RAM DDR4. Comprobamos las diferencias con el modelo básico de 2017 que ya hemos analizado.
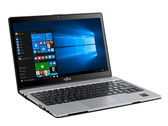
Intel Core i7-6600U, NVIDIA GeForce GTX 965M, 13.5", 1.7 kgBreve análisis del Fujitsu Lifebook S936 (6600U, 512 GB) PalmSecure
Amo de la Movilidad. Con su nuevo buque insignia, Fujitsu se dirige al usuario business viajero para el que un paquete móvil todoterreno sin problemas vale mucho dinero. No cambia nada en sus competencias principales que el fabricante la líe en algunos detalles y no evitará que el público objetivo compre el portátil.
Intel Core i7-6600U, HD Graphics 520, 13.3", 1.4 kgBreve análisis del convertible Microsoft Surface Book (GTX 965M)
Vitaminado. ¿Se ha mejorado más la versión premium? El nuevo Surface Book no incluye la GPU Pascal de Nvidia, pero Microsoft ha incluido un chip Maxwell que debería ofrecer muy buen rendimiento. ¿Lo hace?
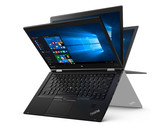
Intel Core i7-6600U, NVIDIA GeForce GTX 965M, 13.5", 1.7 kgBreve análisis del Convertible Lenovo ThinkPad X1 Yoga (OLED)
Una categoría propia. Lenovo echa el resto con el ThinkPad X1 Yoga 20FRS1VS00. la guinda del pastel es la pantalla OLED. Nuestro análisis descubrirá cómo rinde el convertible insignia de Lenovo.
Intel Core i7-6600U, HD Graphics 520, 14", 1.3 kgLenovo ThinkPad P40 Yoga 20GQ-000EUS: NVIDIA Quadro M500M, 14.10", 1.8 kg
análise » Breve análisis de la estación de trabajo Lenovo ThinkPad P40 Yoga 20GQ-000EUS
Dell Latitude 14 7000 Series E7470: Intel HD Graphics 520, 14.00", 1.7 kg
análise » Breve análisis del Ultrabook Dell Latitude 14 E7470
Lenovo ThinkPad T460s-20FA003GGE: Intel HD Graphics 520, 14.00", 1.3 kg
análise » Análisis completo del Ultrabook Lenovo ThinkPad T460s (Core i7, WQHD)
HP ZBook 15u G3: AMD FirePro W4190M, 15.60", 2.2 kg
análise » Breve análisis de la estación de trabajo HP ZBook 15u G3
Microsoft Surface Book Core i7: NVIDIA Maxwell GPU Surface Book, 13.50", 1.5 kg
análise » Breve análisis del Convertible Microsoft Surface Book (Core i7, 940M)
Lenovo ThinkPad T560-20FH002RGE: NVIDIA GeForce 940MX, 15.60", 2.3 kg
análise externo » Lenovo ThinkPad T560-20FH002RGE
Microsoft Surface Book with Performance Base: NVIDIA GeForce GTX 965M, 13.50", 1.7 kg
análise externo » Microsoft Surface Book with Performance Base
Dell Latitude 15 E5570-X2DCY: AMD Radeon R7 M360, 15.60", 2.1 kg
análise externo » Dell Latitude 15 E5570-X2DCY
HP ProBook 650 G2-Y3B47ES: Intel HD Graphics 520, 15.60", 2.3 kg
análise externo » HP ProBook 650 G2-Y3B47ES
HP ProBook 640 G2-Y3B44ES: Intel HD Graphics 520, 14.10", 2 kg
análise externo » HP ProBook 640 G2-Y3B44ES
Dell Latitude 12 Rugged Extreme-7214: Intel HD Graphics 520, 11.60", 2.7 kg
análise externo » Dell Latitude 12 Rugged Extreme-7214
Microsoft Surface Book 2016, Core i7: NVIDIA GeForce GTX 965M, 13.50", 1.7 kg
análise externo » Microsoft Surface Book 2016, Core i7
Lenovo Thinkpad X1 Yoga 20FX-0045GE: Intel HD Graphics 520, 14.00", 1.4 kg
análise externo » Lenovo Thinkpad X1 Yoga 20FX-0045GE
Lenovo ThinkPad T460s-20F90058GE: Intel HD Graphics 520, 14.00", 1.4 kg
análise externo » Lenovo ThinkPad T460s-20F90058GE
Lenovo ThinkPad X1 Yoga 20FQ005TMS: Intel HD Graphics 520, 14.00", 1.4 kg
análise externo » Lenovo ThinkPad X1 Yoga 20FQ005TMS
HP EliteBook 1040 G3-V1B13EA: Intel HD Graphics 520, 14.00", 1.4 kg
análise externo » HP EliteBook 1040 G3-V1B13EA
Fujitsu Lifebook T936: Intel HD Graphics 520, 13.30", 1.6 kg
análise externo » Fujitsu Lifebook T936
Toshiba Tecra Z40-C-103: NVIDIA GeForce 930M, 14.00", 1.5 kg
análise externo » Toshiba Tecra Z40-C-103
Lenovo ThinkPad X260-20F5003JGE: Intel HD Graphics 520, 12.50", 1.5 kg
análise externo » Lenovo ThinkPad X260-20F5003JGE
HP Spectre Pro x360 G2-V1B04EA: Intel HD Graphics 520, 13.30", 1.5 kg
análise externo » HP Spectre Pro x360 G2-V1B04EA
HP ProBook 650 G2-X9V26UT: Intel HD Graphics 520, 15.60", 2.3 kg
análise externo » HP ProBook 650 G2-X9V26UT
Lenovo ThinkPad P40 Yoga 20GQ-000EUS: NVIDIA Quadro M500M, 14.10", 1.8 kg
análise externo » Lenovo ThinkPad P40 Yoga 20GQ-000EUS
Fujitsu Stylistic R726-0M871PDE: Intel HD Graphics 520, 12.50", 1.2 kg
análise externo » Fujitsu Stylistic R726-0M871PDE
Lenovo ThinkPad X1 Yoga 20FQ0044GE: Intel HD Graphics 520, 14.00", 1.4 kg
análise externo » Lenovo ThinkPad X1 Yoga 20FQ0044GE
Fujitsu LifeBook E736-0M87BPDE: Intel HD Graphics 520, 13.30", 1.6 kg
análise externo » Fujitsu LifeBook E736-0M87BPDE
Toshiba Portege Z30-C1320: Intel HD Graphics 520, 13.30", 1.2 kg
análise externo » Toshiba Portege Z30-C1320
HP ZBook 15u G3: AMD FirePro W4190M, 15.60", 2.2 kg
análise externo » HP ZBook 15u G3
Toshiba Tecra Z50-C1550: NVIDIA GeForce 930M, 15.60", 2.2 kg
análise externo » Toshiba Tecra Z50-C1550
Toshiba Tecra Z40-C1420: Intel HD Graphics 520, 14.00", 1.5 kg
análise externo » Toshiba Tecra Z40-C1420
Asus N552VW-FI043T: NVIDIA GeForce GTX 960M, 15.60", 2.5 kg
análise externo » Asus N552VW-FI043T
Dell Latitude 14 7000 Series E7470: Intel HD Graphics 520, 14.00", 1.7 kg
análise externo » Dell Latitude 14 7000 Series E7470
Microsoft Surface Book Core i7: NVIDIA Maxwell GPU Surface Book, 13.50", 1.5 kg
análise externo » Microsoft Surface Book, Core i7