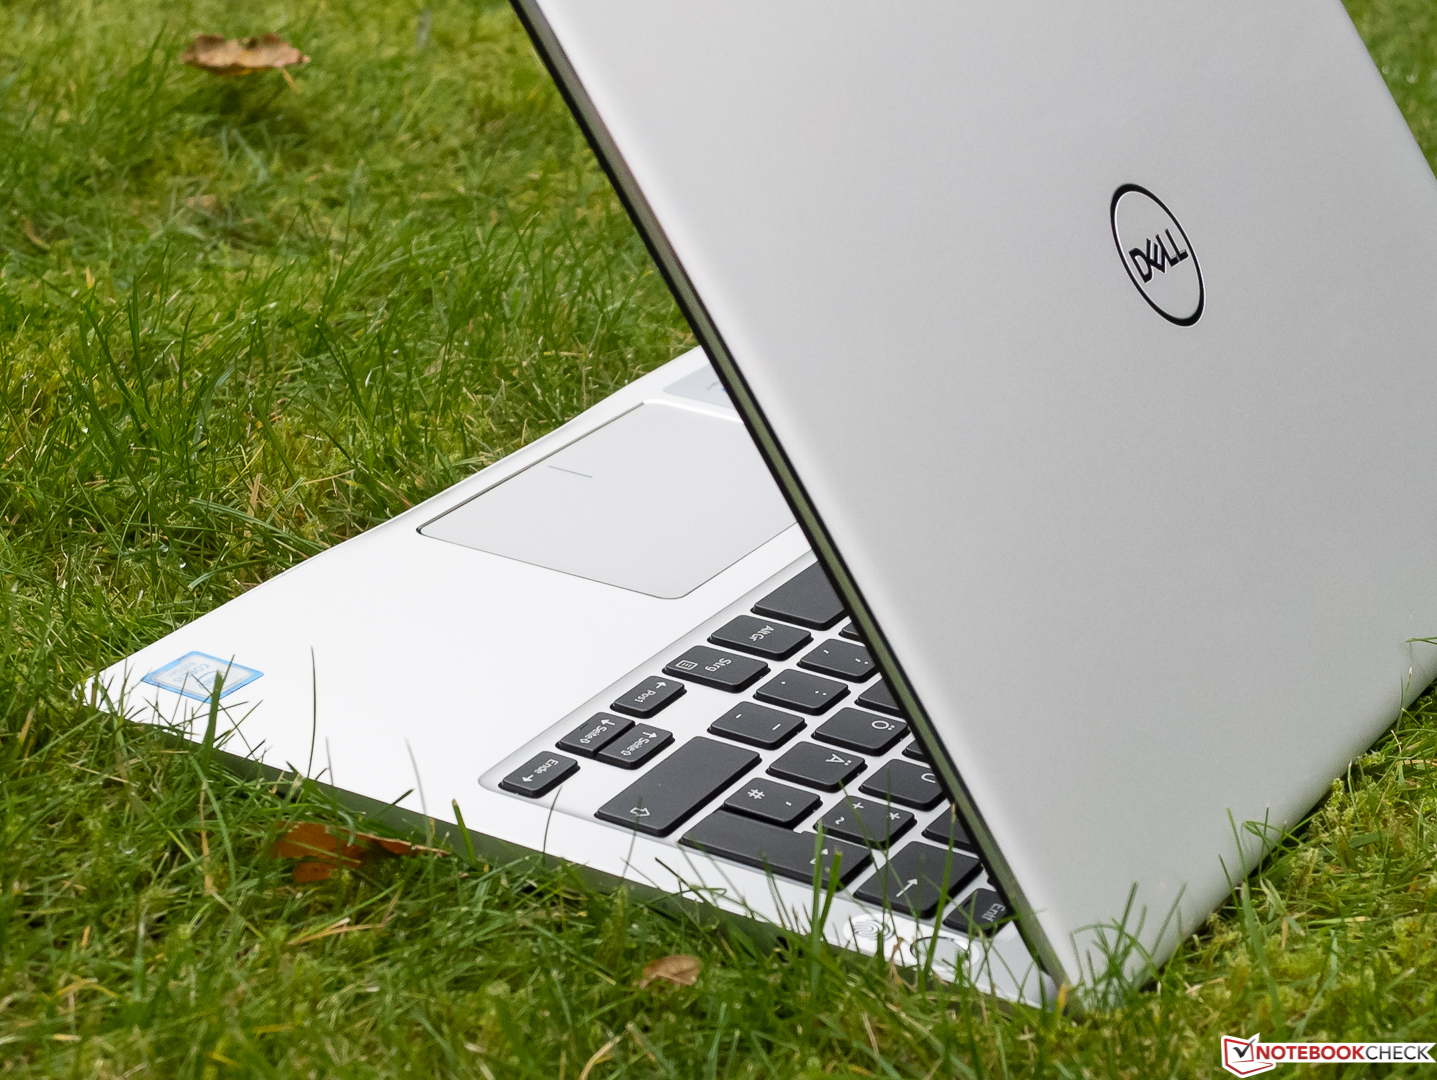
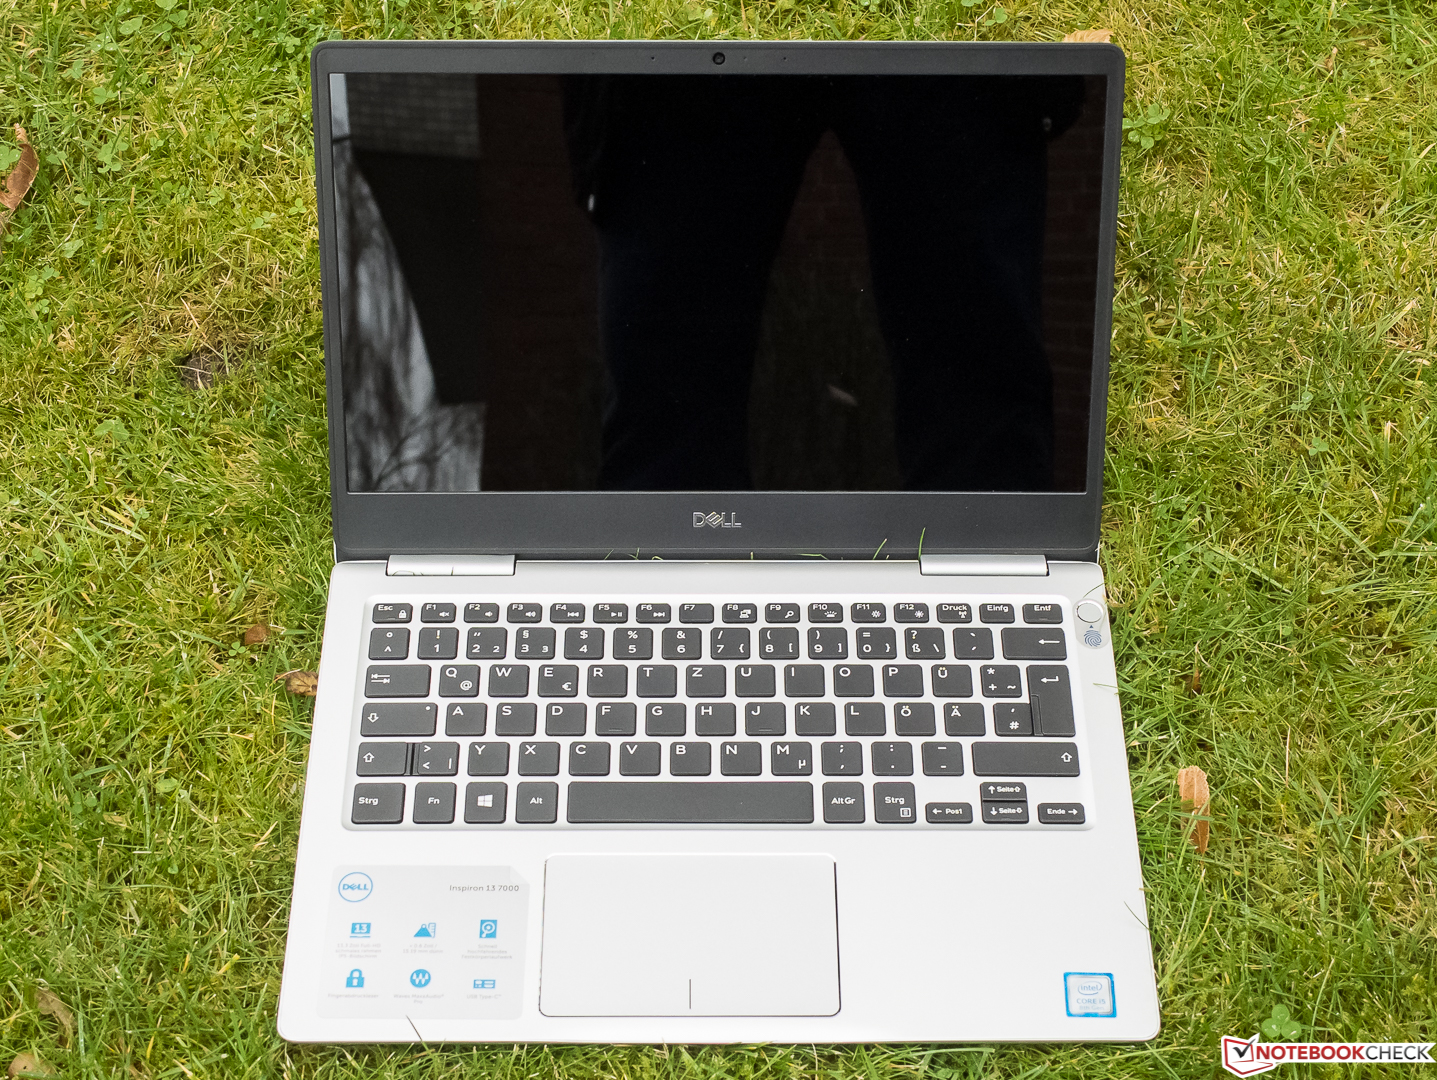
Breve análisis del Dell Inspiron 13 7370 (i5-8250U)

| SD Card Reader | |
| average JPG Copy Test (av. of 3 runs) | |
| Toshiba Tecra X40-D | |
| Dell Inspiron 13 7370 (Toshiba Exceria Pro SDXC 64 GB UHS-II) | |
| maximum AS SSD Seq Read Test (1GB) | |
| Toshiba Tecra X40-D | |
| Dell Inspiron 13 7370 (Toshiba Exceria Pro SDXC 64 GB UHS-II) | |
| Networking | |
| iperf3 transmit AX12 | |
| Dell Inspiron 13 7370 | |
| HP Spectre 13-v131ng | |
| Microsoft Surface Laptop i5 | |
| Toshiba Tecra X40-D | |
| iperf3 receive AX12 | |
| Toshiba Tecra X40-D | |
| Microsoft Surface Laptop i5 | |
| Dell Inspiron 13 7370 | |
| HP Spectre 13-v131ng | |
| |||||||||||||||||||||||||
iluminación: 87 %
Brillo con batería: 246 cd/m²
Contraste: 912:1 (Negro: 0.33 cd/m²)
ΔE ColorChecker Calman: 5.39 | ∀{0.5-29.43 Ø4.71}
ΔE Greyscale Calman: 5.93 | ∀{0.09-98 Ø4.96}
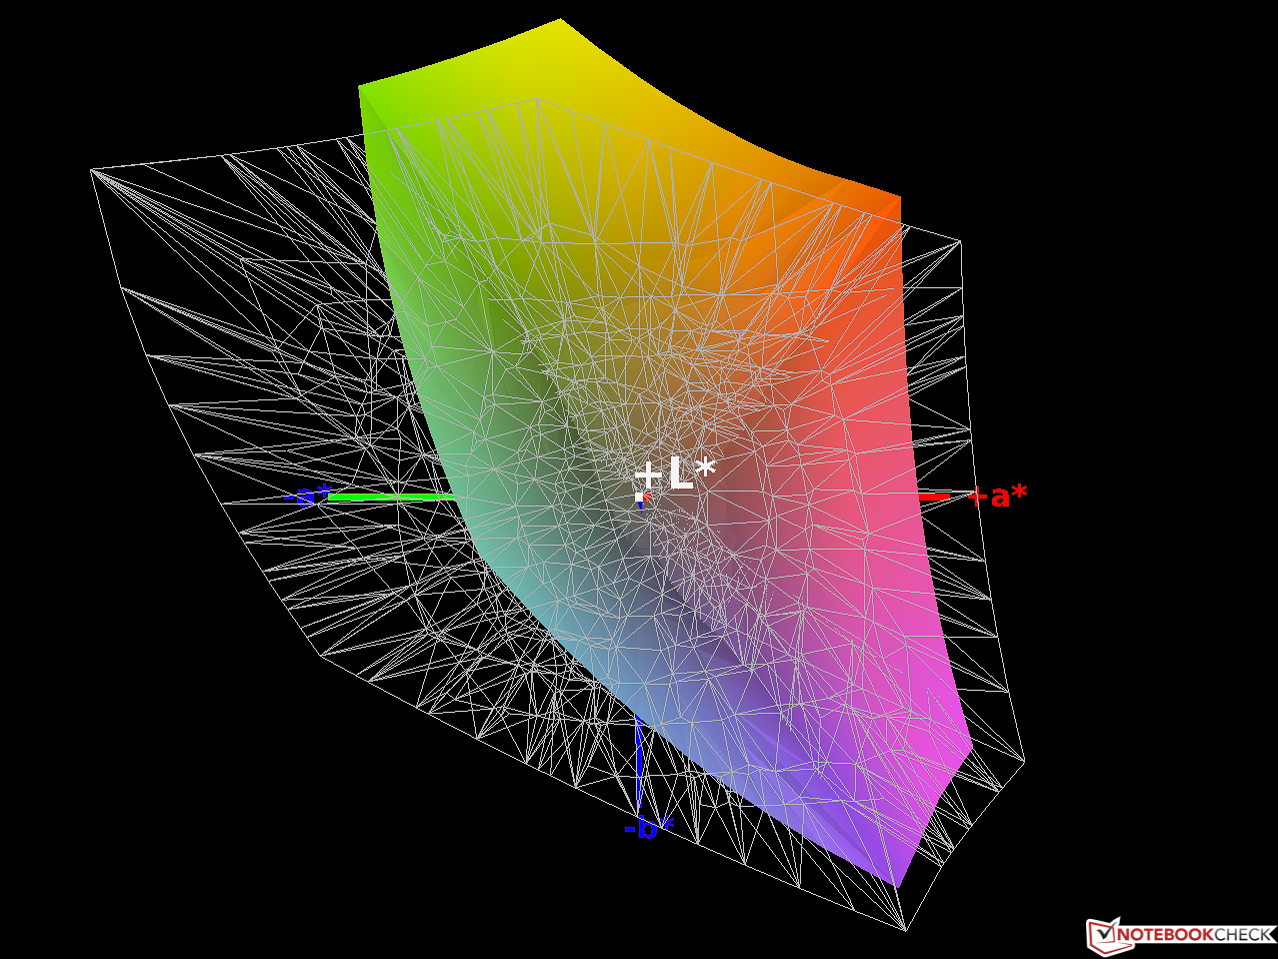
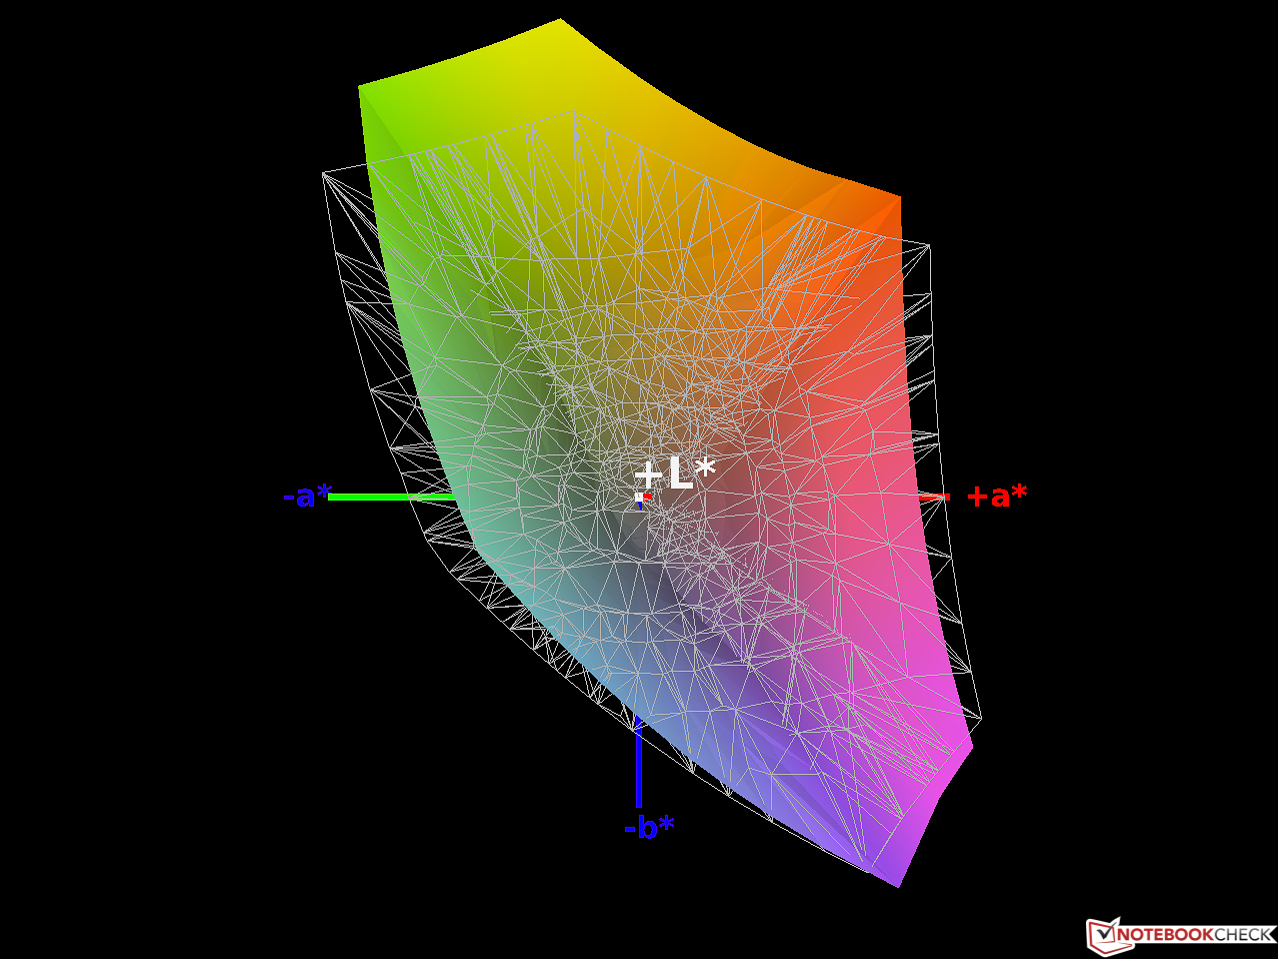
86% sRGB (Argyll 1.6.3 3D)
56% AdobeRGB 1998 (Argyll 1.6.3 3D)
63% AdobeRGB 1998 (Argyll 3D)
86.2% sRGB (Argyll 3D)
66.7% Display P3 (Argyll 3D)
Gamma: 2.6
CCT: 6358 K
| Dell Inspiron 13 7370 BOE071A / NV13FHM / Dell G64PY, , 1920x1080, 13.3" | HP Spectre 13-v131ng CMN1374, , 1920x1080, 13.3" | Toshiba Tecra X40-D Toshiba TOS508F, , 1920x1080, 14" | Microsoft Surface Laptop i5 ID: MEI96A2, Name: Panasonic VVX14T092N00, , 2256x1504, 13.5" | |
|---|---|---|---|---|
| Display | 1% | -34% | 7% | |
| Display P3 Coverage (%) | 66.7 | 64.6 -3% | 40.55 -39% | 67.8 2% |
| sRGB Coverage (%) | 86.2 | 88.8 3% | 61 -29% | 94.3 9% |
| AdobeRGB 1998 Coverage (%) | 63 | 64.8 3% | 41.89 -34% | 69.5 10% |
| Response Times | 0% | 18% | -12% | |
| Response Time Grey 50% / Grey 80% * (ms) | 46 ? | 46 ? -0% | 38 ? 17% | 50.8 ? -10% |
| Response Time Black / White * (ms) | 33 ? | 33 ? -0% | 26.8 ? 19% | 37.2 ? -13% |
| PWM Frequency (Hz) | 201 ? | 20410 ? | ||
| Screen | 8% | -17% | 29% | |
| Brightness middle (cd/m²) | 301 | 404 34% | 283.9 -6% | 384.2 28% |
| Brightness (cd/m²) | 291 | 382 31% | 261 -10% | 378 30% |
| Brightness Distribution (%) | 87 | 91 5% | 85 -2% | 90 3% |
| Black Level * (cd/m²) | 0.33 | 0.35 -6% | 0.25 24% | 0.36 -9% |
| Contrast (:1) | 912 | 1154 27% | 1136 25% | 1067 17% |
| Colorchecker dE 2000 * | 5.39 | 5.37 -0% | 6.4 -19% | 1.8 67% |
| Colorchecker dE 2000 max. * | 8.56 | 9.46 -11% | 18.7 -118% | 4.2 51% |
| Greyscale dE 2000 * | 5.93 | 6.44 -9% | 6.3 -6% | 1.2 80% |
| Gamma | 2.6 85% | 2.52 87% | 2.39 92% | 2.21 100% |
| CCT | 6358 102% | 6738 96% | 6511 100% | 6708 97% |
| Color Space (Percent of AdobeRGB 1998) (%) | 56 | 58 4% | 38 -32% | 63.7 14% |
| Color Space (Percent of sRGB) (%) | 86 | 89 3% | 60 -30% | 94.2 10% |
| Media total (Programa/Opciones) | 3% /
5% | -11% /
-16% | 8% /
19% |
* ... más pequeño es mejor
Tiempos de respuesta del display
| ↔ Tiempo de respuesta de Negro a Blanco | ||
|---|---|---|
| 33 ms ... subida ↗ y bajada ↘ combinada | ↗ 17 ms subida | 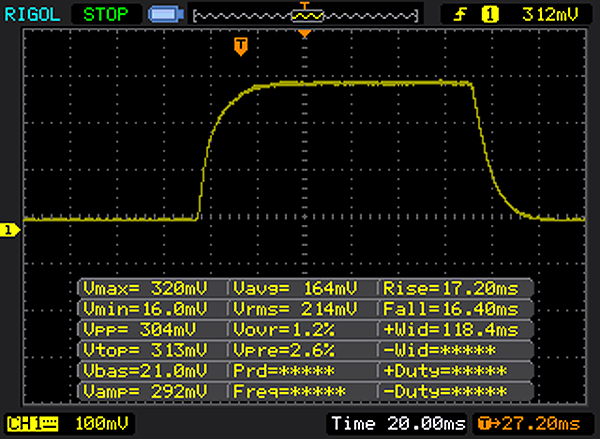 |
| ↘ 16 ms bajada | ||
| La pantalla mostró tiempos de respuesta lentos en nuestros tests y podría ser demasiado lenta para los jugones. En comparación, todos los dispositivos de prueba van de ##min### (mínimo) a 240 (máximo) ms. » 89 % de todos los dispositivos son mejores. Eso quiere decir que el tiempo de respuesta es peor que la media (19.8 ms) de todos los dispositivos testados. | ||
| ↔ Tiempo de respuesta 50% Gris a 80% Gris | ||
| 46 ms ... subida ↗ y bajada ↘ combinada | ↗ 21 ms subida | 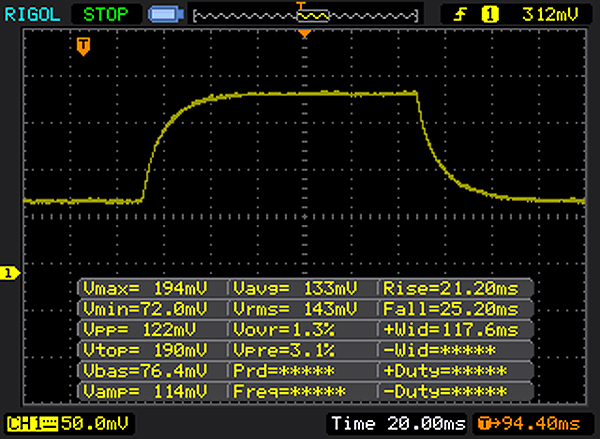 |
| ↘ 25 ms bajada | ||
| La pantalla mostró tiempos de respuesta lentos en nuestros tests y podría ser demasiado lenta para los jugones. En comparación, todos los dispositivos de prueba van de ##min### (mínimo) a 636 (máximo) ms. » 79 % de todos los dispositivos son mejores. Eso quiere decir que el tiempo de respuesta es peor que la media (30.9 ms) de todos los dispositivos testados. | ||
Parpadeo de Pantalla / PWM (Pulse-Width Modulation)
| Parpadeo de Pantalla / PWM detectado | 201 Hz | ≤ 90 % de brillo | 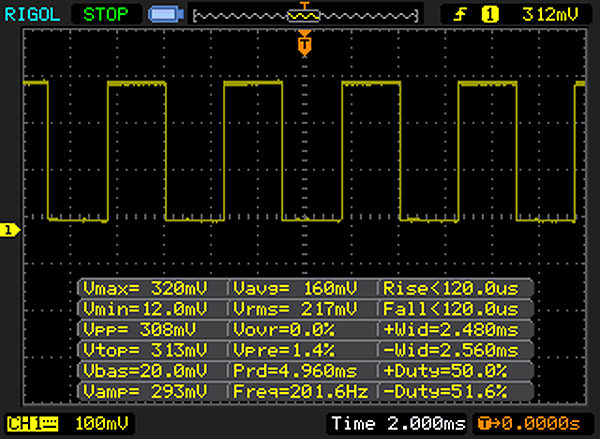 |
La retroiluminación del display parpadea a 201 Hz (seguramente usa PWM - Pulse-Width Modulation) a un brillo del 90 % e inferior. Sobre este nivel de brillo no debería darse parpadeo / PWM. La frecuencia de 201 Hz es relativamente baja, por lo que la gente sensible debería ver parpadeos y padecer fatiga visual por la pantalla (usado al brillo indicado a continuación). Comparación: 52 % de todos los dispositivos testados no usaron PWM para atenuar el display. Si se usó, medimos una media de 7744 (mínimo: 5 - máxmo: 343500) Hz. | |||

| Cinebench R15 | |
| CPU Single 64Bit | |
| Toshiba Tecra X40-D | |
| Dell Inspiron 13 7370 | |
| HP Spectre 13-v131ng | |
| Microsoft Surface Laptop i5 | |
| CPU Multi 64Bit | |
| Dell Inspiron 13 7370 | |
| Toshiba Tecra X40-D | |
| Microsoft Surface Laptop i5 | |
| HP Spectre 13-v131ng | |
| PCMark 8 | |
| Home Score Accelerated v2 | |
| Dell Inspiron 13 7370 | |
| HP Spectre 13-v131ng | |
| Toshiba Tecra X40-D | |
| Microsoft Surface Laptop i5 | |
| Work Score Accelerated v2 | |
| HP Spectre 13-v131ng | |
| Toshiba Tecra X40-D | |
| Dell Inspiron 13 7370 | |
| Microsoft Surface Laptop i5 | |
| PCMark 8 Home Score Accelerated v2 | 3902 puntos | |
| PCMark 8 Work Score Accelerated v2 | 4786 puntos | |
ayuda | ||
| Dell Inspiron 13 7370 Micron 1100 MTFDDAV256TBN | HP Spectre 13-v131ng Samsung PM961 NVMe MZVLW512HMJP | Microsoft Surface Laptop i5 Toshiba THNSN0128GTYA | |
|---|---|---|---|
| CrystalDiskMark 3.0 | 153% | -40% | |
| Read Seq (MB/s) | 476.8 | 1090 129% | 425.6 -11% |
| Write Seq (MB/s) | 458.3 | 1088 137% | 128.2 -72% |
| Read 512 (MB/s) | 351 | 753 115% | 278.5 -21% |
| Write 512 (MB/s) | 298.2 | 911 205% | 126.7 -58% |
| Read 4k (MB/s) | 20.79 | 57.5 177% | 22.15 7% |
| Write 4k (MB/s) | 65.8 | 140.2 113% | 40.45 -39% |
| Read 4k QD32 (MB/s) | 172.8 | 497.1 188% | 77.8 -55% |
| Write 4k QD32 (MB/s) | 160.3 | 416 160% | 41.18 -74% |

| 3DMark 11 - 1280x720 Performance GPU | |
| Dell Inspiron 13 7370 | |
| Toshiba Tecra X40-D | |
| HP Spectre 13-v131ng | |
| Microsoft Surface Laptop i5 | |
| 3DMark | |
| 1280x720 Cloud Gate Standard Graphics | |
| Dell Inspiron 13 7370 | |
| Toshiba Tecra X40-D | |
| HP Spectre 13-v131ng | |
| Microsoft Surface Laptop i5 | |
| 1920x1080 Fire Strike Graphics | |
| Dell Inspiron 13 7370 | |
| Toshiba Tecra X40-D | |
| HP Spectre 13-v131ng | |
| Microsoft Surface Laptop i5 | |
| 3DMark 11 Performance | 1935 puntos | |
| 3DMark Cloud Gate Standard Score | 8527 puntos | |
| 3DMark Fire Strike Score | 1059 puntos | |
ayuda | ||
| bajo | medio | alto | ultra | |
|---|---|---|---|---|
| Rise of the Tomb Raider (2016) | 21.1 | |||
| Deus Ex Mankind Divided (2016) | 16.8 | |||
| Farming Simulator 17 (2016) | 95.9 | 63.3 | 25.4 |
Ruido
| Ocioso |
| 30.3 / 30.3 / 30.3 dB(A) |
| Carga |
| 33.6 / 36.8 dB(A) |
 | ||
30 dB silencioso 40 dB(A) audible 50 dB(A) ruidosamente alto |
||
min: | ||
(±) La temperatura máxima en la parte superior es de 41.1 °C / 106 F, frente a la media de 34.3 °C / 94 F, que oscila entre 21.2 y 62.5 °C para la clase Office.
(-) El fondo se calienta hasta un máximo de 47.6 °C / 118 F, frente a la media de 36.8 °C / 98 F
(+) En reposo, la temperatura media de la parte superior es de 26.2 °C / 79# F, frente a la media del dispositivo de 29.5 °C / 85 F.
(+) El reposamanos y el panel táctil están a una temperatura inferior a la de la piel, con un máximo de 30 °C / 86 F y, por tanto, son fríos al tacto.
(-) La temperatura media de la zona del reposamanos de dispositivos similares fue de 27.6 °C / 81.7 F (-2.4 °C / -4.3 F).
Dell Inspiron 13 7370 análisis de audio
(-) | altavoces no muy altos (#70 dB)
Graves 100 - 315 Hz
(-) | casi sin bajos - de media 19.5% inferior a la mediana
(±) | la linealidad de los graves es media (10.2% delta a frecuencia anterior)
Medios 400 - 2000 Hz
(±) | medias más altas - de media 6.7% más altas que la mediana
(±) | la linealidad de los medios es media (12.5% delta respecto a la frecuencia anterior)
Altos 2 - 16 kHz
(+) | máximos equilibrados - a sólo 3.2% de la mediana
(±) | la linealidad de los máximos es media (8.9% delta a frecuencia anterior)
Total 100 - 16.000 Hz
(±) | la linealidad del sonido global es media (26% de diferencia con la mediana)
En comparación con la misma clase
» 79% de todos los dispositivos probados de esta clase eran mejores, 7% similares, 14% peores
» El mejor tuvo un delta de 7%, la media fue 21%, el peor fue ###max##%
En comparación con todos los dispositivos probados
» 80% de todos los dispositivos probados eran mejores, 4% similares, 16% peores
» El mejor tuvo un delta de 4%, la media fue 23%, el peor fue ###max##%
HP Spectre 13-v131ng análisis de audio
(-) | altavoces no muy altos (#68 dB)
Graves 100 - 315 Hz
(-) | casi sin bajos - de media 23.7% inferior a la mediana
(±) | la linealidad de los graves es media (9.6% delta a frecuencia anterior)
Medios 400 - 2000 Hz
(±) | medios reducidos - de media 5.1% inferior a la mediana
(±) | la linealidad de los medios es media (7.6% delta respecto a la frecuencia anterior)
Altos 2 - 16 kHz
(±) | máximos más altos - de media 7.7% más altos que la mediana
(+) | los máximos son lineales (3.1% delta a la frecuencia anterior)
Total 100 - 16.000 Hz
(±) | la linealidad del sonido global es media (28.6% de diferencia con la mediana)
En comparación con la misma clase
» 90% de todos los dispositivos probados de esta clase eran mejores, 2% similares, 7% peores
» El mejor tuvo un delta de 5%, la media fue 18%, el peor fue ###max##%
En comparación con todos los dispositivos probados
» 86% de todos los dispositivos probados eran mejores, 3% similares, 11% peores
» El mejor tuvo un delta de 4%, la media fue 23%, el peor fue ###max##%
Toshiba Tecra X40-D análisis de audio
(±) | la sonoridad del altavoz es media pero buena (77.3 dB)
Graves 100 - 315 Hz
(-) | casi sin bajos - de media 15.2% inferior a la mediana
(±) | la linealidad de los graves es media (7.2% delta a frecuencia anterior)
Medios 400 - 2000 Hz
(+) | medios equilibrados - a sólo 3.6% de la mediana
(+) | los medios son lineales (5.7% delta a la frecuencia anterior)
Altos 2 - 16 kHz
(±) | máximos más altos - de media 5.6% más altos que la mediana
(+) | los máximos son lineales (5.2% delta a la frecuencia anterior)
Total 100 - 16.000 Hz
(±) | la linealidad del sonido global es media (22% de diferencia con la mediana)
En comparación con la misma clase
» 58% de todos los dispositivos probados de esta clase eran mejores, 8% similares, 34% peores
» El mejor tuvo un delta de 7%, la media fue 21%, el peor fue ###max##%
En comparación con todos los dispositivos probados
» 64% de todos los dispositivos probados eran mejores, 6% similares, 30% peores
» El mejor tuvo un delta de 4%, la media fue 23%, el peor fue ###max##%
Microsoft Surface Laptop i5 análisis de audio
(-) | altavoces no muy altos (#64.6 dB)
Graves 100 - 315 Hz
(±) | lubina reducida - en promedio 7.1% inferior a la mediana
(±) | la linealidad de los graves es media (11.8% delta a frecuencia anterior)
Medios 400 - 2000 Hz
(+) | medios equilibrados - a sólo 4.1% de la mediana
(+) | los medios son lineales (5.6% delta a la frecuencia anterior)
Altos 2 - 16 kHz
(+) | máximos equilibrados - a sólo 1.2% de la mediana
(+) | los máximos son lineales (4.7% delta a la frecuencia anterior)
Total 100 - 16.000 Hz
(±) | la linealidad del sonido global es media (15.6% de diferencia con la mediana)
En comparación con la misma clase
» 36% de todos los dispositivos probados de esta clase eran mejores, 5% similares, 58% peores
» El mejor tuvo un delta de 5%, la media fue 18%, el peor fue ###max##%
En comparación con todos los dispositivos probados
» 24% de todos los dispositivos probados eran mejores, 5% similares, 72% peores
» El mejor tuvo un delta de 4%, la media fue 23%, el peor fue ###max##%
| Off / Standby | |
| Ocioso | |
| Carga |
|
Clave:
min: | |
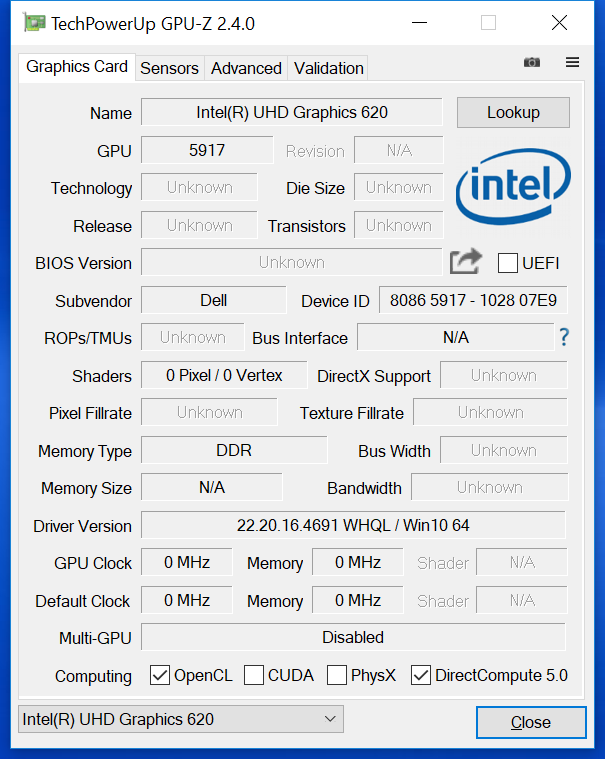
| Dell Inspiron 13 7370 i5-8250U, UHD Graphics 620, Micron 1100 MTFDDAV256TBN, IPS, 1920x1080, 13.3" | HP Spectre 13-v131ng i7-7500U, HD Graphics 620, Samsung PM961 NVMe MZVLW512HMJP, IPS UWVA, 1920x1080, 13.3" | Toshiba Tecra X40-D i7-7600U, HD Graphics 620, Samsung PM961 MZVLW256HEHP, IPS, 1920x1080, 14" | Microsoft Surface Laptop i5 i5-7200U, HD Graphics 620, Toshiba THNSN0128GTYA, IPS, 2256x1504, 13.5" | |
|---|---|---|---|---|
| Power Consumption | 3% | 5% | 12% | |
| Idle Minimum * (Watt) | 3.6 | 3.6 -0% | 5.2 -44% | 3.2 11% |
| Idle Average * (Watt) | 6.8 | 6.4 6% | 6.9 -1% | 6.5 4% |
| Idle Maximum * (Watt) | 8.9 | 9.2 -3% | 7 21% | 6.8 24% |
| Load Average * (Watt) | 36 | 34 6% | 24.6 32% | 28.2 22% |
| Load Maximum * (Watt) | 36.5 | 34.4 6% | 30.1 18% | 36 1% |
* ... más pequeño es mejor
| Dell Inspiron 13 7370 i5-8250U, UHD Graphics 620, 38 Wh | HP Spectre 13-v131ng i7-7500U, HD Graphics 620, 38 Wh | Toshiba Tecra X40-D i7-7600U, HD Graphics 620, 48 Wh | Microsoft Surface Laptop i5 i5-7200U, HD Graphics 620, 45 Wh | |
|---|---|---|---|---|
| Duración de Batería | 2% | 26% | 69% | |
| Reader / Idle (h) | 12.9 | 12 -7% | 14.6 13% | 22.5 74% |
| WiFi v1.3 (h) | 5.8 | 6.6 14% | 6 3% | 10 72% |
| Load (h) | 1.3 | 1.3 0% | 2.1 62% | 2.1 62% |
| H.264 (h) | 6.1 |
Pro
Contra
 cortesía de Cyberport.de")
Ignorando el aguante de batería algo corto, los reflejos de la pantalla, y la baja frecuencia PWM de 200 Hz, el Dell Inspiron 13 7370 de construcción inmaculada y con clase no tiene grandes debilidades.
Los cuatro núcleos con Hyperthreading definitivamente pueden berse como una mejora respecto a los modelos anteriores, ya que no hay problemas térmicos y no hay un consumo de energía importante en nuestro dispositivo de pruebas. Sin embargo, también pensamos que la mayoría de usuarios ofimáticos no encontrarán ningún uso notable para los ocho hilos y básicamente trabajarán igual de bien con los tradicionales procesadores dual-core ULV con Hyperthreading. Naturalmente, no será el caso si se usa software bien optimizado para ejecutarse en paralelo.
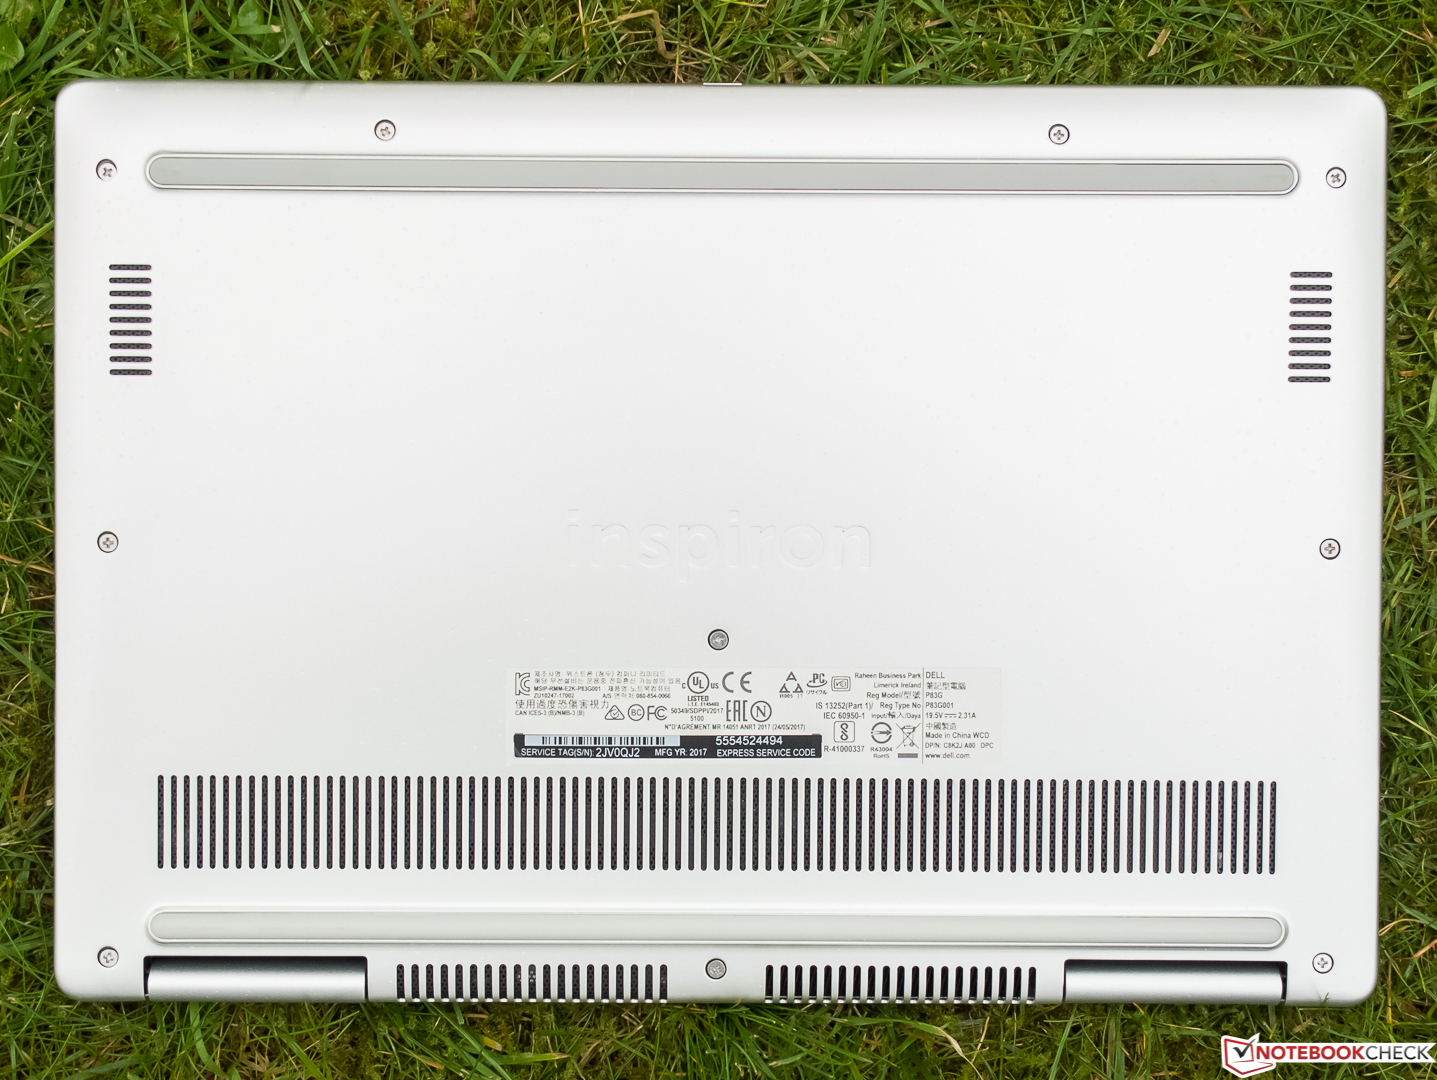
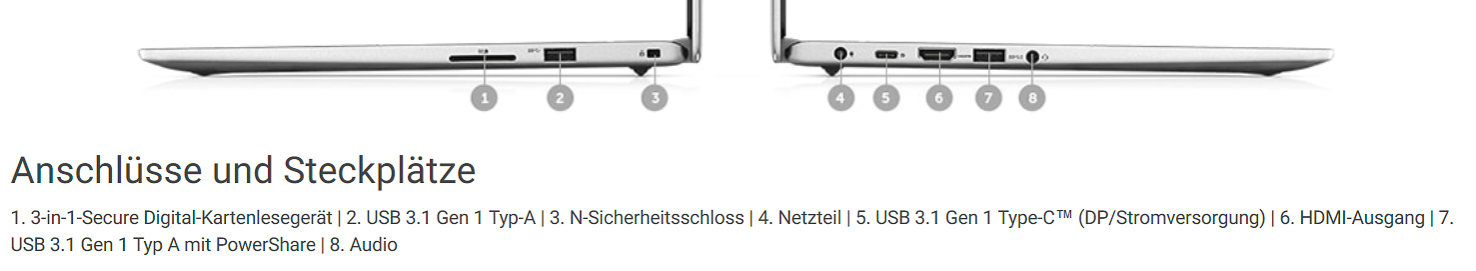
Por qué Dell eligió un acabado lustroso para su display definitivamente sigue siendo un secreto, aunque no encontramos problemas importantes con los reflejos de la pantalla. Podría ser algo más brillante y mostrar un mejor abanico de colores, el lector SD tortura a los fotógrafos con su proceso de copia innecesariamente largo, y tampoco queda bien en lo tocante a facilidad de reparación.
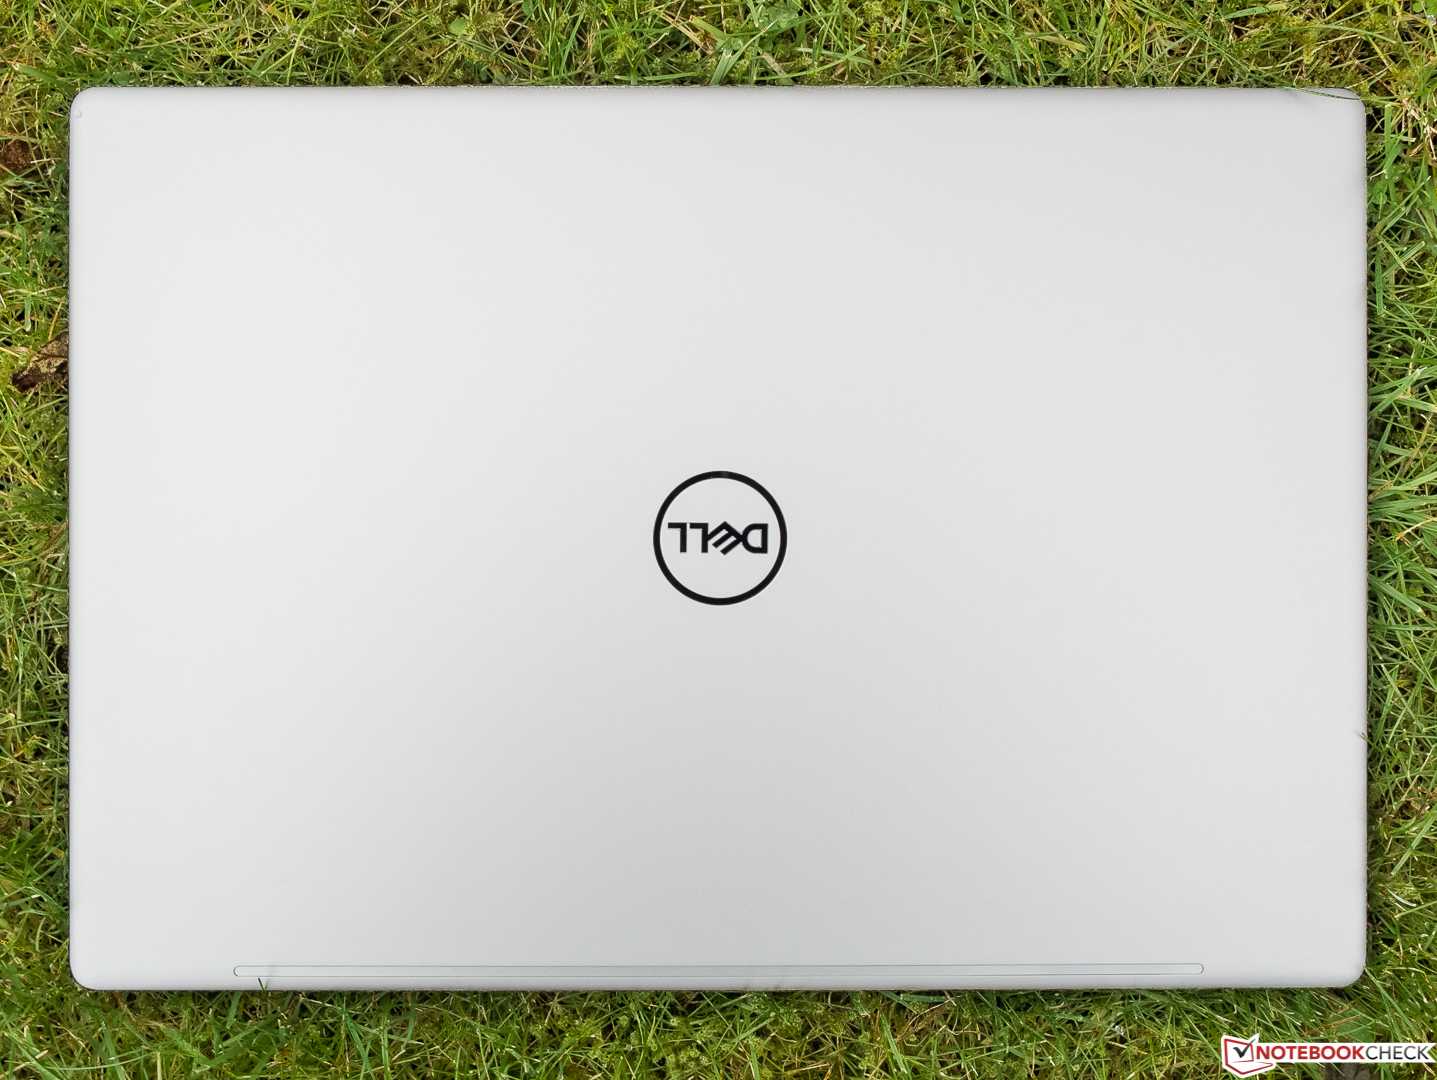
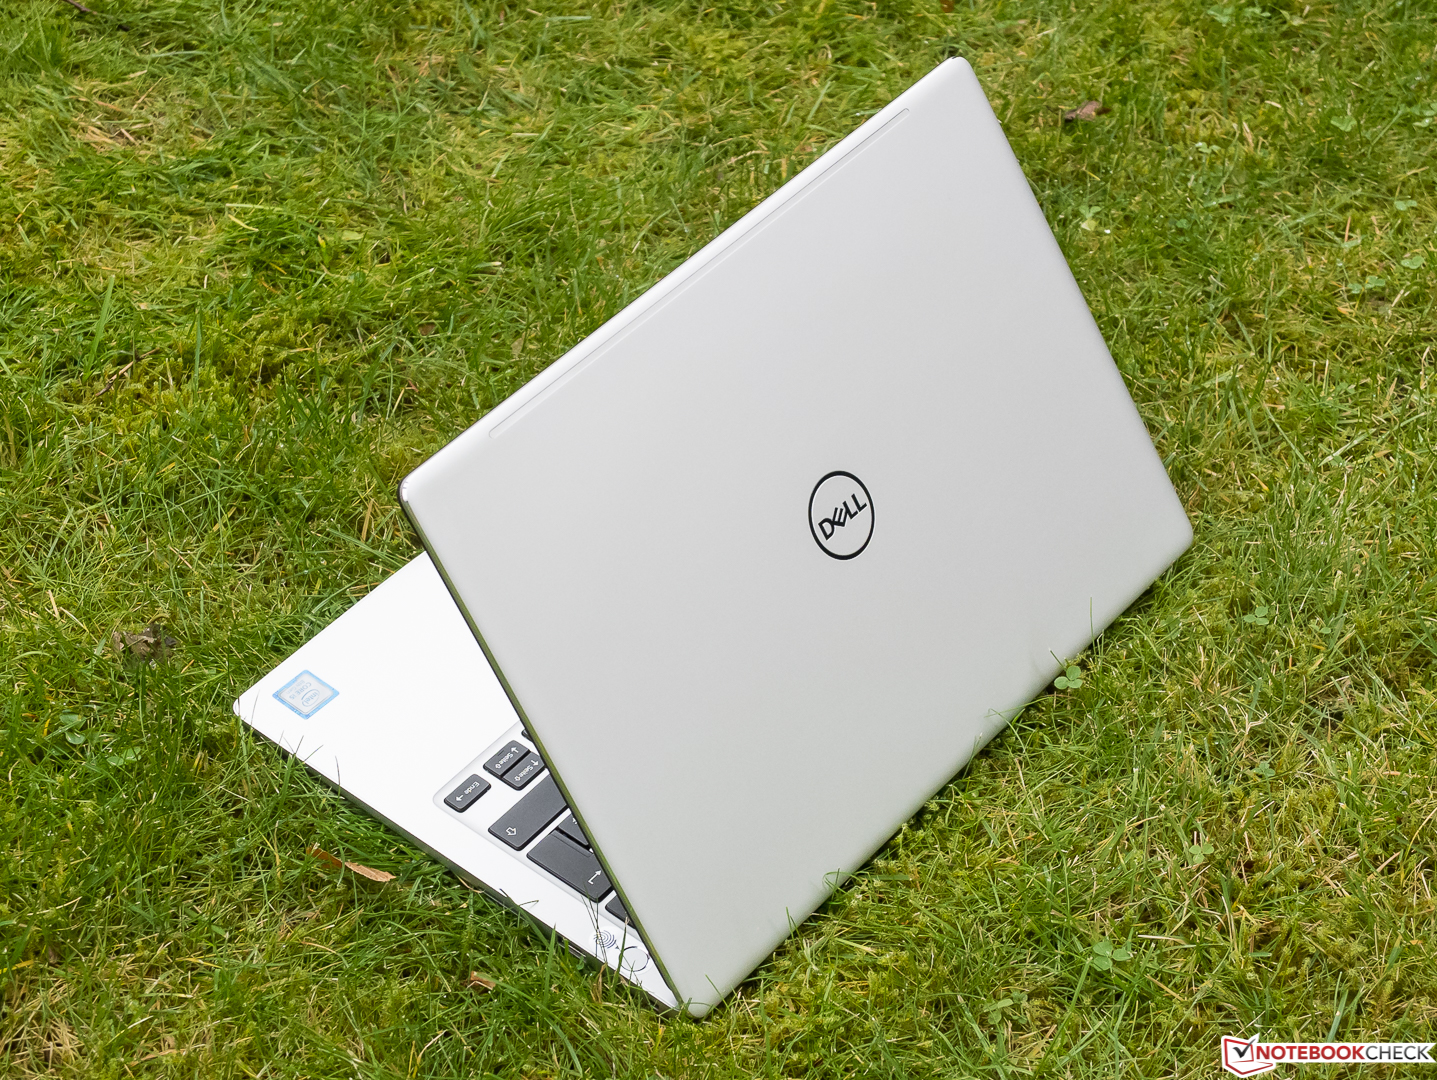
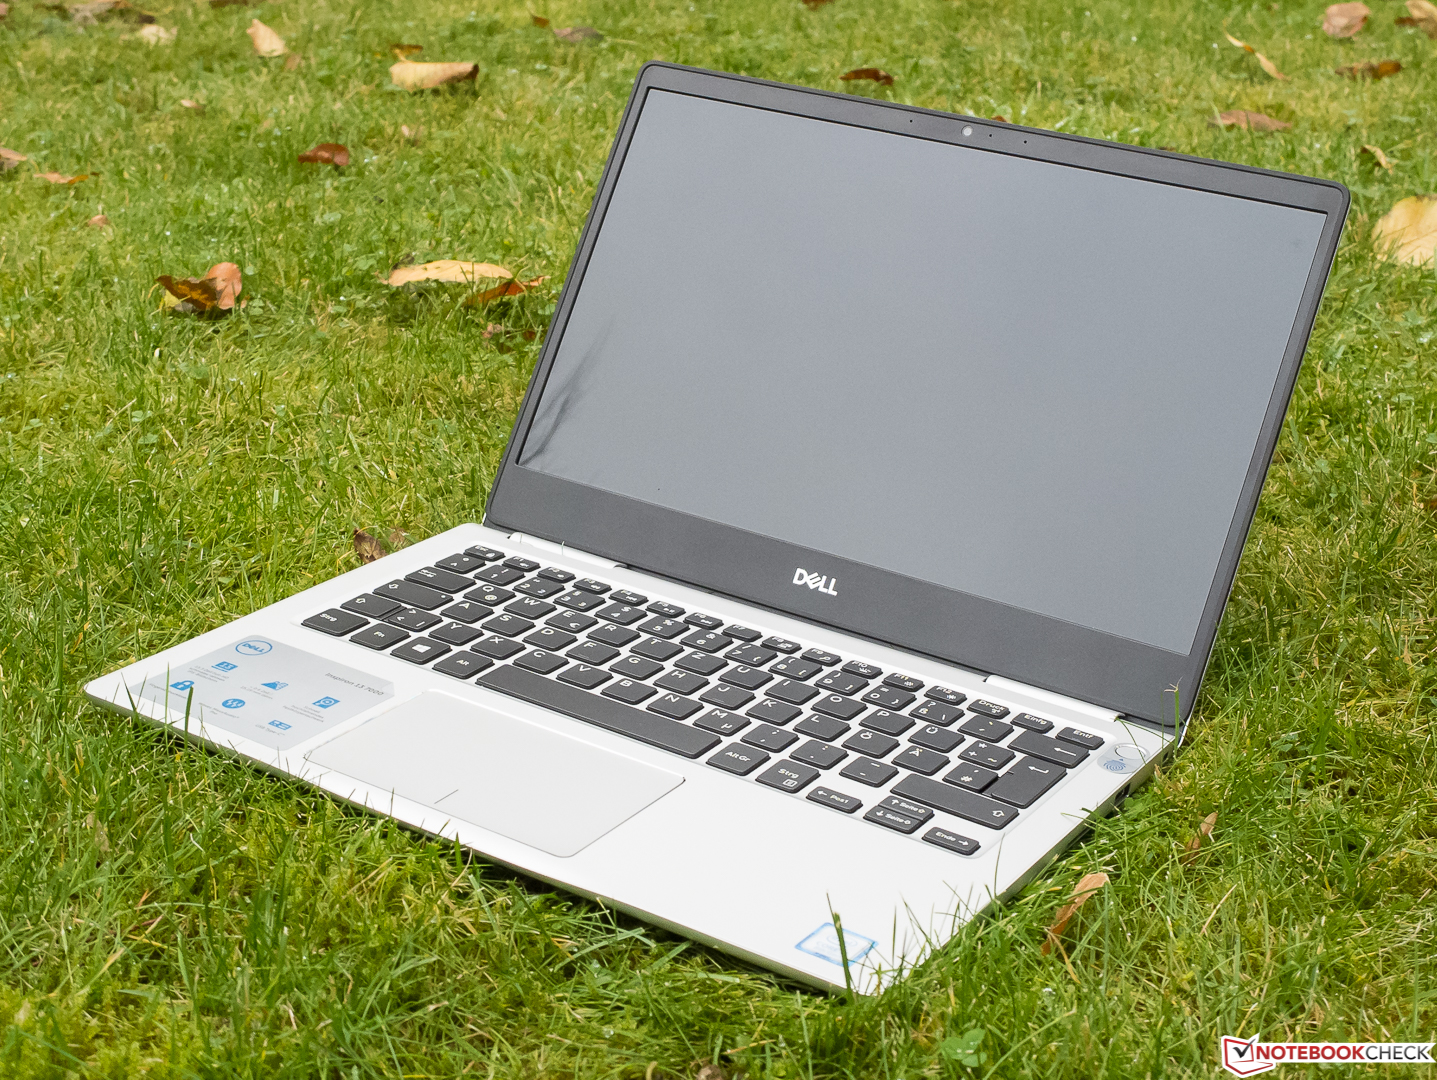
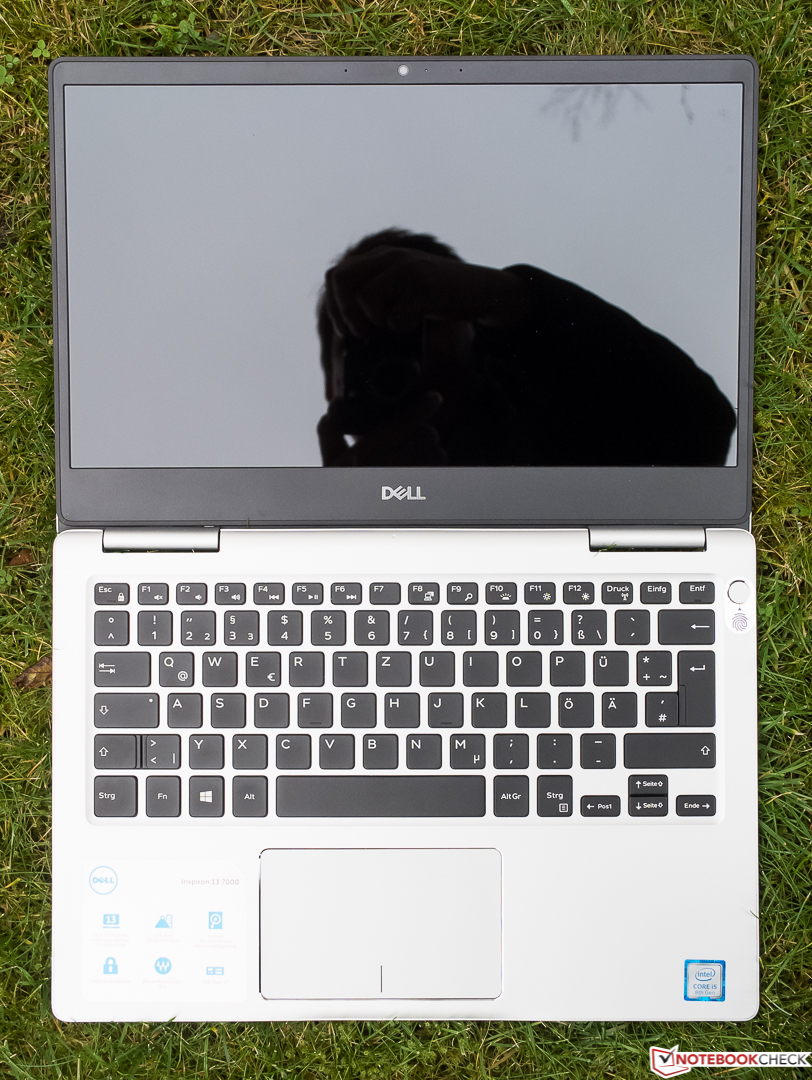
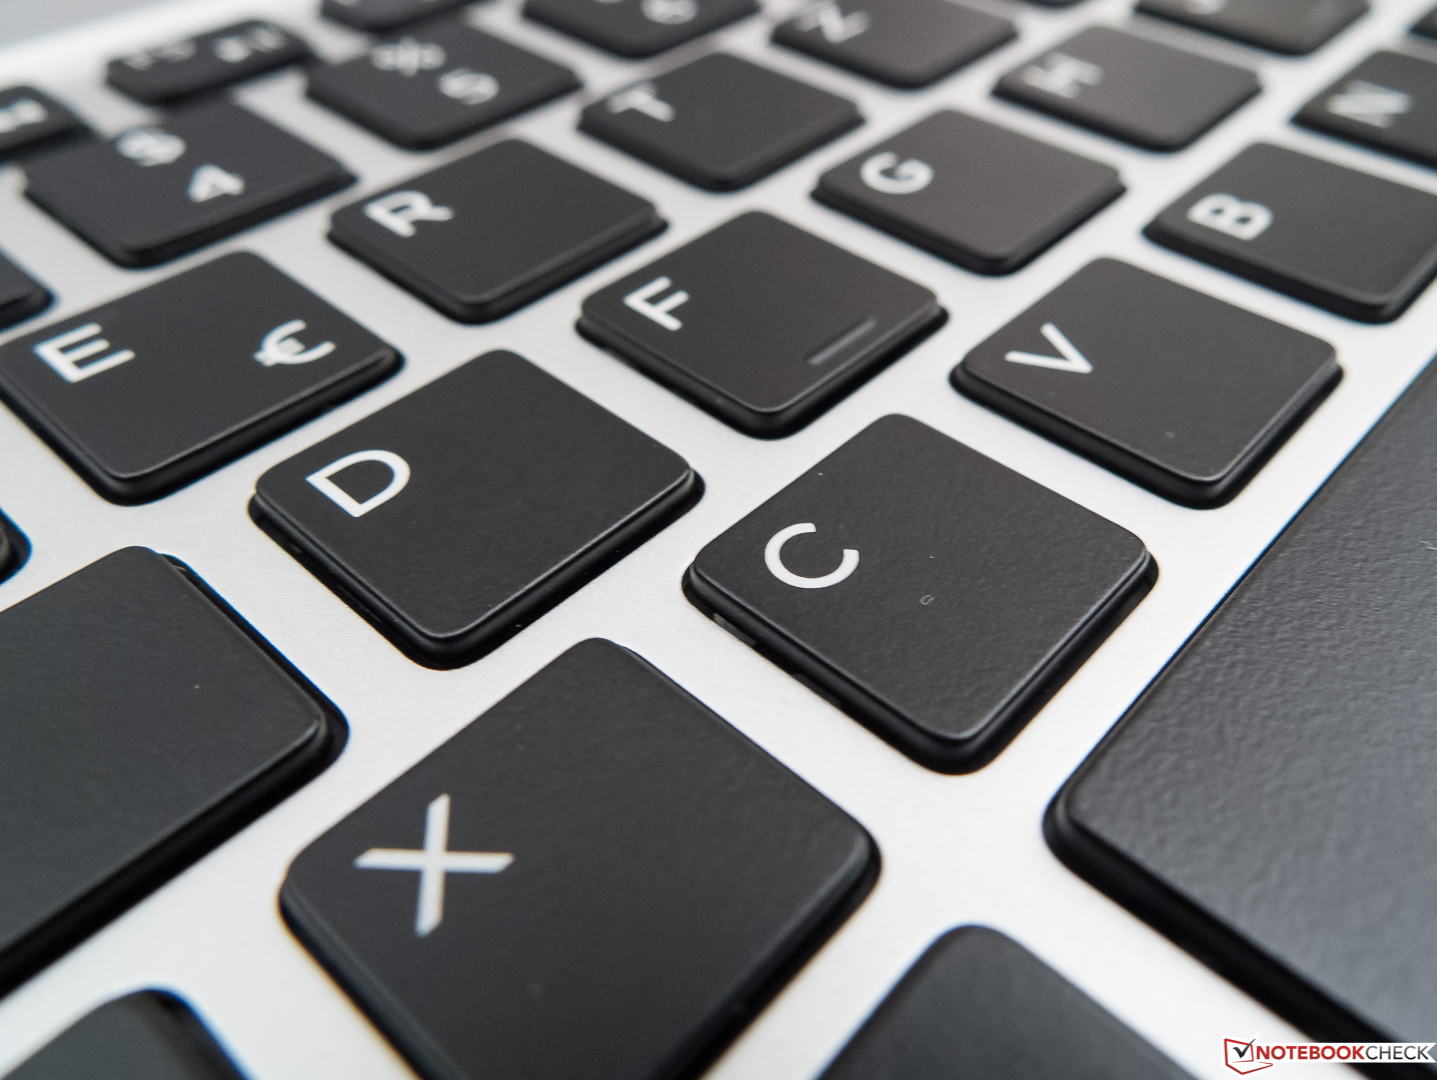
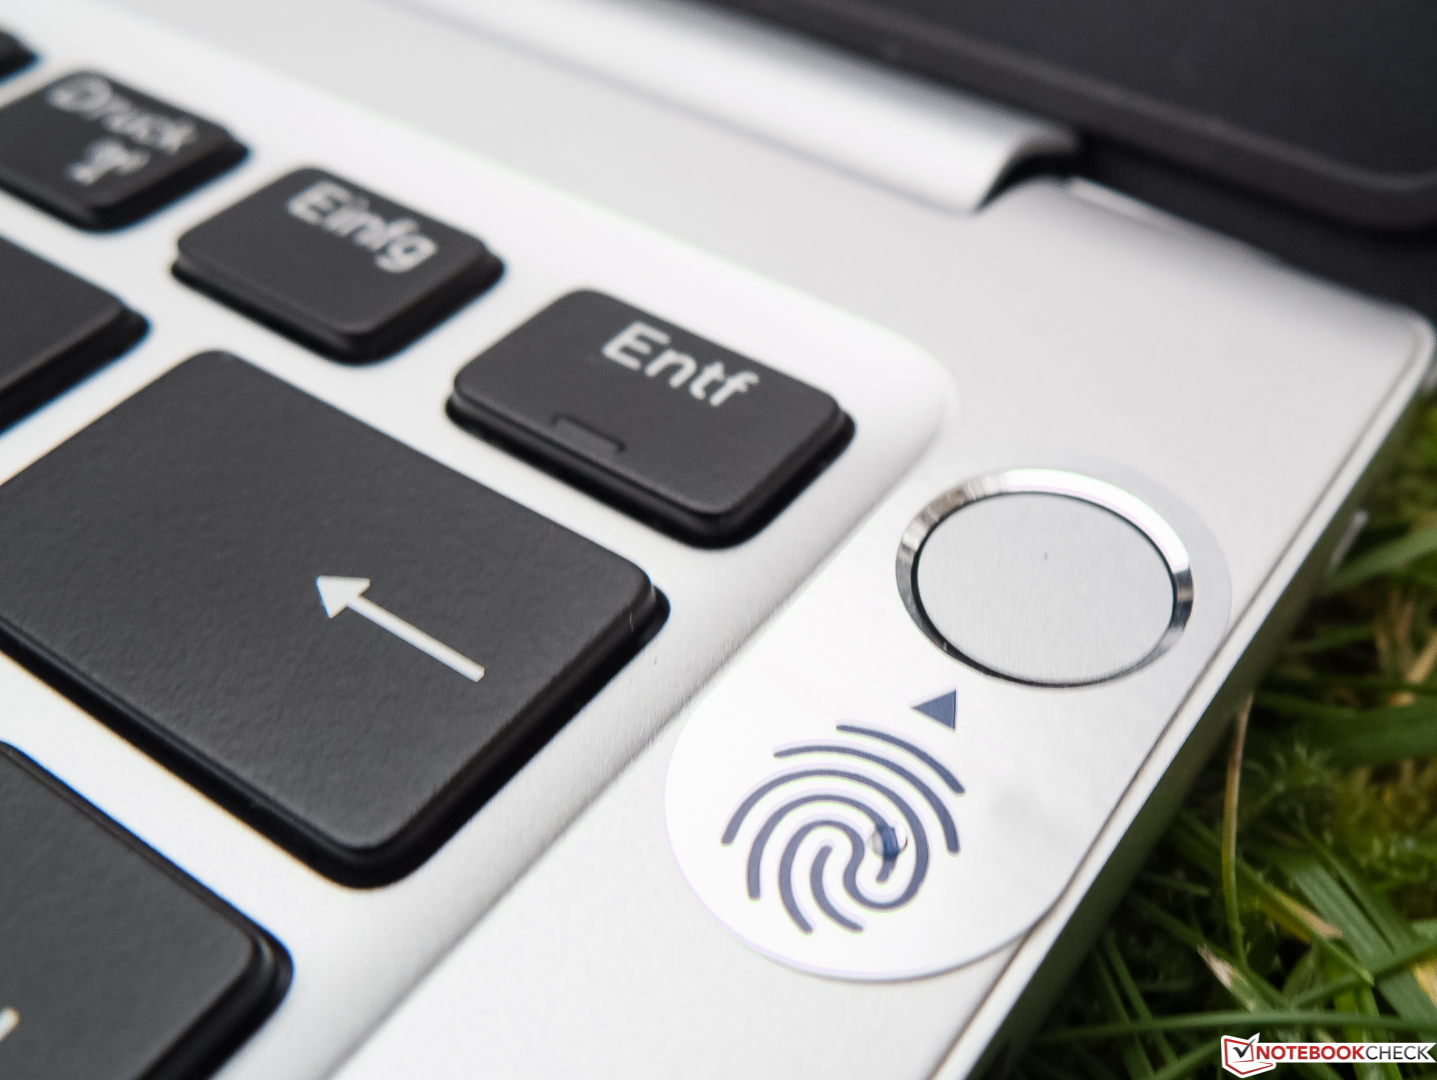
En el lado positivo, está la carcasa sólida bien fabricada, el diseño ligero y compacto, el funcionamiento normalmente fresco y quedo así como unos dispositivos de entrada geniales. El Inspiron 7370 no alcanza una puntuación total de "muy bueno" por los pelos, aunque nada impide una recomendación de compra. El dispositivo compacto más comparable es el HP Spectre 13, que es algo más plano, tiene una pantalla más brillante, un SSD-NVMe más rápido, y ofrece puertos USB Type C de segunda generación con Thunderbolt. Sin embargo, también tiene un ventilador ruidoso y molesto, no tiene lector SD alguno, y no puede beneficiarse del modo turbo.
Ésta es una versión acortada del análisis original. Puedes leer el análisis completo en inglés aquí.
Dell Inspiron 13 7370
- 11/16/2017 v6 (old)
Sven Kloevekorn