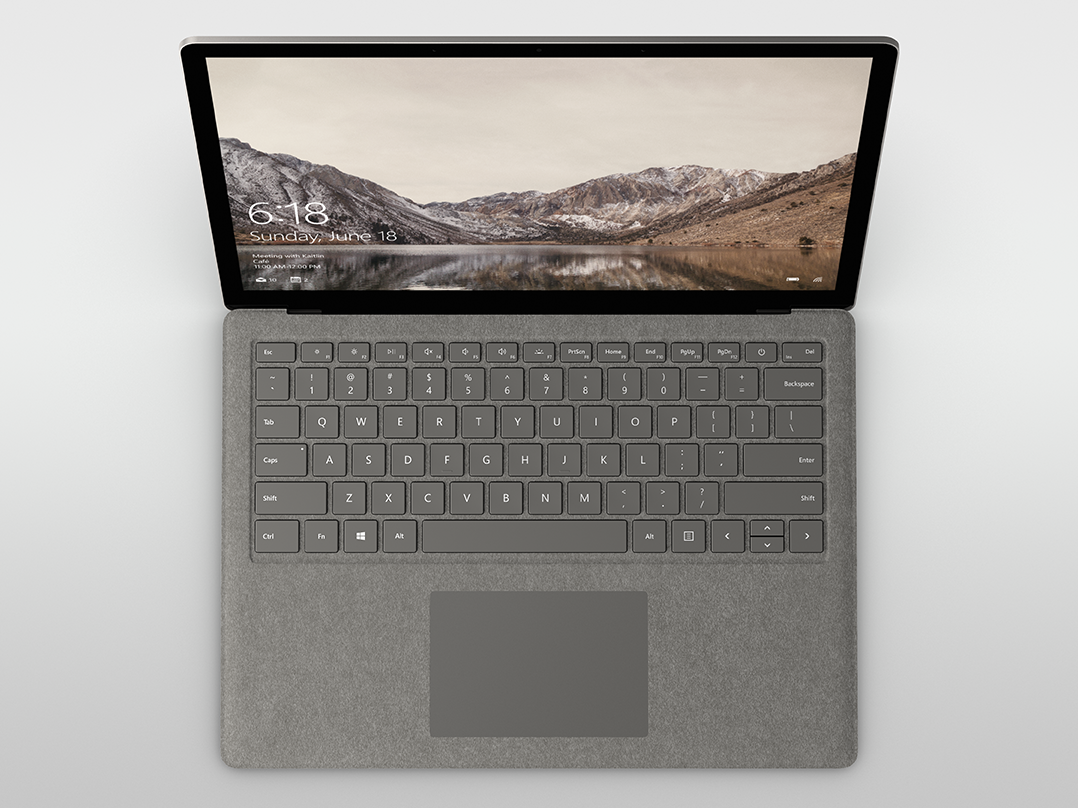
Breve análisis del Microsoft Surface Laptop (i5-7200U)
| Networking | |
| iperf3 transmit AX12 | |
| Microsoft Surface Book with Performance Base | |
| Dell XPS 13 9360 FHD i5 | |
| Microsoft Surface Laptop i5 | |
| iperf3 receive AX12 | |
| Microsoft Surface Laptop i5 | |
| Dell XPS 13 9360 FHD i5 | |
| Microsoft Surface Book with Performance Base | |
| |||||||||||||||||||||||||
iluminación: 90 %
Brillo con batería: 384.1 cd/m²
Contraste: 1067:1 (Negro: 0.36 cd/m²)
ΔE ColorChecker Calman: 1.8 | ∀{0.5-29.43 Ø4.72}
ΔE Greyscale Calman: 1.2 | ∀{0.09-98 Ø4.97}
94.2% sRGB (Argyll 1.6.3 3D)
63.7% AdobeRGB 1998 (Argyll 1.6.3 3D)
69.5% AdobeRGB 1998 (Argyll 3D)
94.3% sRGB (Argyll 3D)
67.8% Display P3 (Argyll 3D)
Gamma: 2.21
CCT: 6708 K
| Microsoft Surface Laptop i5 ID: MEI96A2, Name: Panasonic VVX14T092N00, IPS, 13.5", 2256x1504 | Microsoft Surface Book with Performance Base Panasonic MEI96A2, IPS, 13.5", 3000x2000 | Microsoft Surface Pro 4, Core i5, 128GB Samsung 123YL01-001 ID: SDC3853, IPS, 12.3", 2736x1824 | Apple MacBook Pro 13 2016 (2.9 GHz) APPA033, , 13.3", 2560x1600 | Dell XPS 13 9360 FHD i5 Sharp SHP1449 LQ133M1, IPS, 13.3", 1920x1080 | |
|---|---|---|---|---|---|
| Display | -1% | -2% | 26% | -26% | |
| Display P3 Coverage (%) | 67.8 | 66.4 -2% | 65 -4% | 99.2 46% | 48.94 -28% |
| sRGB Coverage (%) | 94.3 | 95.4 1% | 96.5 2% | 99.9 6% | 73.3 -22% |
| AdobeRGB 1998 Coverage (%) | 69.5 | 67.6 -3% | 67 -4% | 87.6 26% | 50.5 -27% |
| Response Times | -10% | 13% | -18% | 23% | |
| Response Time Grey 50% / Grey 80% * (ms) | 50.8 ? | 61 ? -20% | 46 ? 9% | 47.2 ? 7% | 32.8 ? 35% |
| Response Time Black / White * (ms) | 37.2 ? | 37 ? 1% | 31.2 ? 16% | 53 ? -42% | 33.2 ? 11% |
| PWM Frequency (Hz) | 50 ? | ||||
| Screen | -8% | -32% | 6% | -84% | |
| Brightness middle (cd/m²) | 384.2 | 459 19% | 413 7% | 569 48% | 351.2 -9% |
| Brightness (cd/m²) | 378 | 423 12% | 396 5% | 542 43% | 325 -14% |
| Brightness Distribution (%) | 90 | 86 -4% | 87 -3% | 90 0% | 89 -1% |
| Black Level * (cd/m²) | 0.36 | 0.37 -3% | 0.36 -0% | 0.56 -56% | 0.195 46% |
| Contrast (:1) | 1067 | 1241 16% | 1147 7% | 1016 -5% | 1801 69% |
| Colorchecker dE 2000 * | 1.8 | 2.28 -27% | 3.09 -72% | 1.4 22% | 7.4 -311% |
| Colorchecker dE 2000 max. * | 4.2 | 3.61 14% | 2.9 31% | 9.08 -116% | |
| Greyscale dE 2000 * | 1.2 | 2.48 -107% | 3.92 -227% | 1.8 -50% | 6.71 -459% |
| Gamma | 2.21 100% | 2.5 88% | 2.3 96% | 2.16 102% | 2.74 80% |
| CCT | 6708 97% | 8602 76% | 7333 89% | 6877 95% | 7222 90% |
| Color Space (Percent of AdobeRGB 1998) (%) | 63.7 | 62 -3% | 61 -4% | 78.4 23% | 50.48 -21% |
| Color Space (Percent of sRGB) (%) | 94.2 | 96 2% | 97 3% | 99.3 5% | 73.31 -22% |
| Media total (Programa/Opciones) | -6% /
-7% | -7% /
-19% | 5% /
7% | -29% /
-58% |
* ... más pequeño es mejor
Tiempos de respuesta del display
| ↔ Tiempo de respuesta de Negro a Blanco | ||
|---|---|---|
| 37.2 ms ... subida ↗ y bajada ↘ combinada | ↗ 20 ms subida | 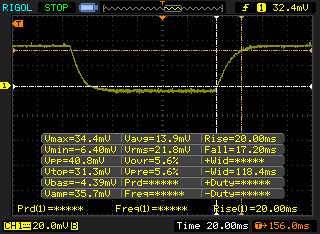 |
| ↘ 17.2 ms bajada | ||
| La pantalla mostró tiempos de respuesta lentos en nuestros tests y podría ser demasiado lenta para los jugones. En comparación, todos los dispositivos de prueba van de ##min### (mínimo) a 240 (máximo) ms. » 95 % de todos los dispositivos son mejores. Eso quiere decir que el tiempo de respuesta es peor que la media (19.8 ms) de todos los dispositivos testados. | ||
| ↔ Tiempo de respuesta 50% Gris a 80% Gris | ||
| 50.8 ms ... subida ↗ y bajada ↘ combinada | ↗ 25.6 ms subida | 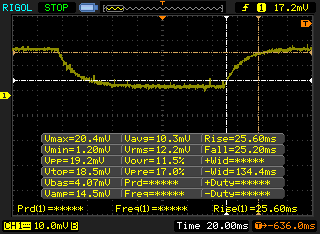 |
| ↘ 25.2 ms bajada | ||
| La pantalla mostró tiempos de respuesta lentos en nuestros tests y podría ser demasiado lenta para los jugones. En comparación, todos los dispositivos de prueba van de ##min### (mínimo) a 636 (máximo) ms. » 87 % de todos los dispositivos son mejores. Eso quiere decir que el tiempo de respuesta es peor que la media (31 ms) de todos los dispositivos testados. | ||
Parpadeo de Pantalla / PWM (Pulse-Width Modulation)
| Parpadeo de Pantalla / PWM no detectado | 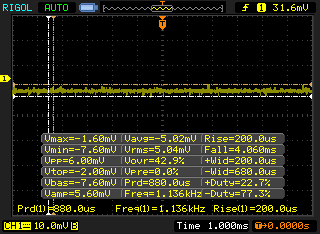 | ||
Comparación: 52 % de todos los dispositivos testados no usaron PWM para atenuar el display. Si se usó, medimos una media de 7763 (mínimo: 5 - máxmo: 343500) Hz. | |||
| wPrime 2.10 - 1024m | |
| Microsoft Surface Pro 4, Core m3 | |
| Lenovo Thinkpad 13-20J1001BUS | |
| Apple MacBook Pro 13 2016 | |
| Dell Latitude 5280 | |
| Microsoft Surface Laptop i5 | |
| Samsung Notebook 9 NP900X5N-X01US | |
* ... más pequeño es mejor
| PCMark 8 | |
| Home Score Accelerated v2 | |
| Apple MacBook Pro 13 2016 | |
| Microsoft Surface Laptop i5 | |
| Microsoft Surface Book with Performance Base | |
| Work Score Accelerated v2 | |
| Microsoft Surface Laptop i5 | |
| Microsoft Surface Book with Performance Base | |
| Apple MacBook Pro 13 2016 | |
| Creative Score Accelerated v2 | |
| Apple MacBook Pro 13 2016 | |
| Microsoft Surface Book with Performance Base | |
| Microsoft Surface Laptop i5 | |
| PCMark 8 Home Score Accelerated v2 | 3071 puntos | |
| PCMark 8 Creative Score Accelerated v2 | 3962 puntos | |
| PCMark 8 Work Score Accelerated v2 | 4106 puntos | |
ayuda | ||
| Microsoft Surface Laptop i5 Toshiba THNSN0128GTYA | Microsoft Surface Book with Performance Base Toshiba NVMe THNSN5256GPU7 | Microsoft Surface Pro 4, Core i5, 128GB Samsung MZFLV128 NVMe | Apple MacBook Pro 13 2016 (2.9 GHz) Apple SSD AP0256 | Dell XPS 13 9360 FHD i5 Toshiba NVMe THNSN5256GPUK | |
|---|---|---|---|---|---|
| CrystalDiskMark 3.0 | 328% | 115% | 527% | 294% | |
| Read Seq (MB/s) | 425.6 | 1017 139% | 666 56% | 1662 291% | 1233 190% |
| Write Seq (MB/s) | 128.2 | 861 572% | 154.2 20% | 1336 942% | 733 472% |
| Read 512 (MB/s) | 278.5 | 687 147% | 266.3 -4% | 1183 325% | 1036 272% |
| Write 512 (MB/s) | 126.7 | 698 451% | 154.2 22% | 1481 1069% | 439.9 247% |
| Read 4k (MB/s) | 22.15 | 40.91 85% | 28.51 29% | 16.1 -27% | 29.31 32% |
| Write 4k (MB/s) | 40.45 | 108.6 168% | 101.5 151% | 23.5 -42% | 116.9 189% |
| Read 4k QD32 (MB/s) | 77.8 | 326.9 320% | 368.3 373% | 657 744% | 479.2 516% |
| Write 4k QD32 (MB/s) | 41.18 | 347.1 743% | 153.6 273% | 419 917% | 218.3 430% |

| 3DMark 11 Performance | 1586 puntos | |
| 3DMark Ice Storm Standard Score | 48984 puntos | |
| 3DMark Cloud Gate Standard Score | 5454 puntos | |
| 3DMark Fire Strike Score | 743 puntos | |
ayuda | ||
| bajo | medio | alto | ultra | |
|---|---|---|---|---|
| BioShock Infinite (2013) | 45.8 | 27.4 | 22.7 | 7 |
| Rise of the Tomb Raider (2016) | 18.5 |
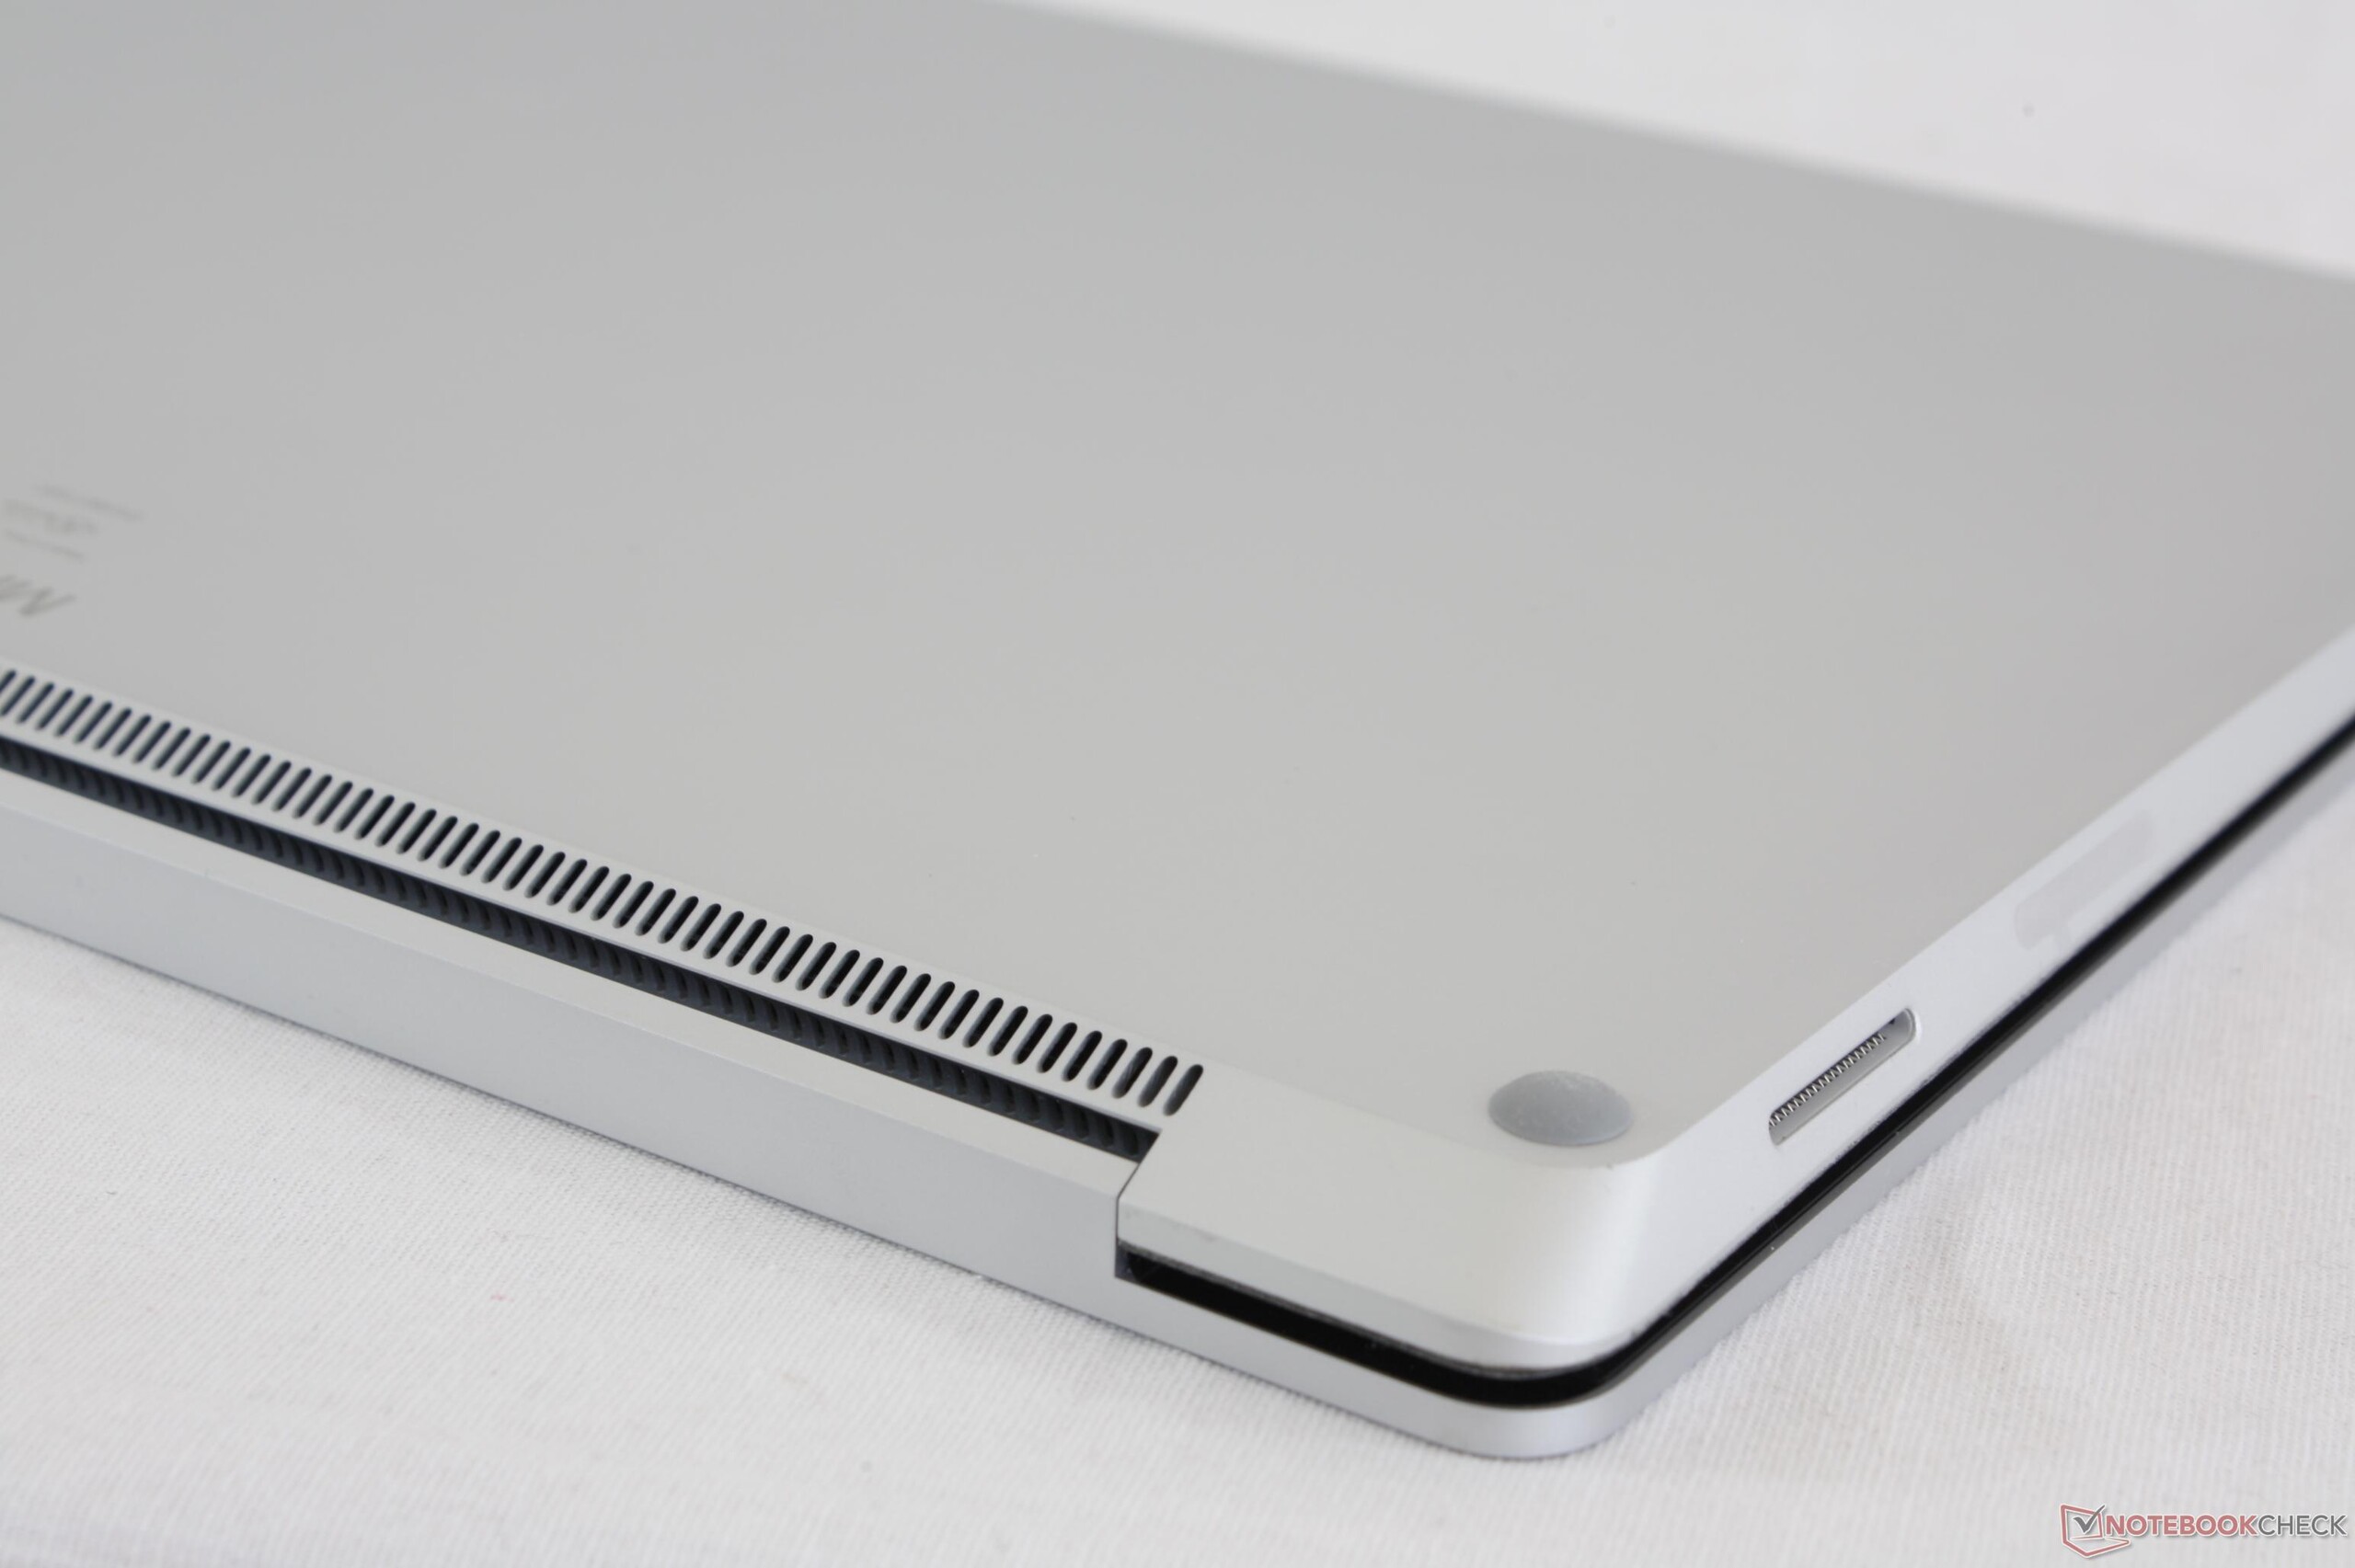
Ruido
| Ocioso |
| 28.2 / 28.2 / 29 dB(A) |
| Carga |
| 30.3 / 39.3 dB(A) |
 | ||
30 dB silencioso 40 dB(A) audible 50 dB(A) ruidosamente alto |
||
min: | ||
| Microsoft Surface Laptop i5 HD Graphics 620, i5-7200U, Toshiba THNSN0128GTYA | Microsoft Surface Book with Performance Base GeForce GTX 965M, 6600U, Toshiba NVMe THNSN5256GPU7 | Microsoft Surface Pro 4, Core i5, 128GB HD Graphics 520, 6300U, Samsung MZFLV128 NVMe | Apple MacBook Pro 13 2016 (2.9 GHz) Iris Graphics 550, 6267U, Apple SSD AP0256 | Dell XPS 13 9360 FHD i5 HD Graphics 620, i5-7200U, Toshiba NVMe THNSN5256GPUK | |
|---|---|---|---|---|---|
| Noise | -8% | -14% | -4% | 2% | |
| apagado / medio ambiente * (dB) | 28.2 | 29.4 -4% | 30.2 -7% | ||
| Idle Minimum * (dB) | 28.2 | 29.4 -4% | 31.5 -12% | 30.2 -7% | 28.9 -2% |
| Idle Average * (dB) | 28.2 | 29.4 -4% | 31.5 -12% | 30.2 -7% | 28.9 -2% |
| Idle Maximum * (dB) | 29 | 29.7 -2% | 31.5 -9% | 30.2 -4% | 28.9 -0% |
| Load Average * (dB) | 30.3 | 39 -29% | 40.5 -34% | 33 -9% | 30.9 -2% |
| Load Maximum * (dB) | 39.3 | 40.2 -2% | 40.7 -4% | 36.2 8% | 33.5 15% |
| Witcher 3 ultra * (dB) | 39.5 |
* ... más pequeño es mejor
(+) La temperatura máxima en la parte superior es de 36.4 °C / 98 F, frente a la media de 35.9 °C / 97 F, que oscila entre 21.4 y 59 °C para la clase Subnotebook.
(-) El fondo se calienta hasta un máximo de 45.2 °C / 113 F, frente a la media de 39.2 °C / 103 F
(+) En reposo, la temperatura media de la parte superior es de 26.7 °C / 80# F, frente a la media del dispositivo de 30.8 °C / 87 F.
(+) El reposamanos y el panel táctil están a una temperatura inferior a la de la piel, con un máximo de 26.4 °C / 79.5 F y, por tanto, son fríos al tacto.
(±) La temperatura media de la zona del reposamanos de dispositivos similares fue de 28.2 °C / 82.8 F (+1.8 °C / 3.3 F).
Microsoft Surface Laptop i5 análisis de audio
(-) | altavoces no muy altos (#64.6 dB)
Graves 100 - 315 Hz
(±) | lubina reducida - en promedio 7.1% inferior a la mediana
(±) | la linealidad de los graves es media (11.8% delta a frecuencia anterior)
Medios 400 - 2000 Hz
(+) | medios equilibrados - a sólo 4.1% de la mediana
(+) | los medios son lineales (5.6% delta a la frecuencia anterior)
Altos 2 - 16 kHz
(+) | máximos equilibrados - a sólo 1.2% de la mediana
(+) | los máximos son lineales (4.7% delta a la frecuencia anterior)
Total 100 - 16.000 Hz
(±) | la linealidad del sonido global es media (15.6% de diferencia con la mediana)
En comparación con la misma clase
» 36% de todos los dispositivos probados de esta clase eran mejores, 5% similares, 59% peores
» El mejor tuvo un delta de 5%, la media fue 18%, el peor fue ###max##%
En comparación con todos los dispositivos probados
» 23% de todos los dispositivos probados eran mejores, 5% similares, 72% peores
» El mejor tuvo un delta de 4%, la media fue 24%, el peor fue ###max##%
Apple MacBook 12 (Early 2016) 1.1 GHz análisis de audio
(+) | los altavoces pueden reproducir a un volumen relativamente alto (#83.6 dB)
Graves 100 - 315 Hz
(±) | lubina reducida - en promedio 11.3% inferior a la mediana
(±) | la linealidad de los graves es media (14.2% delta a frecuencia anterior)
Medios 400 - 2000 Hz
(+) | medios equilibrados - a sólo 2.4% de la mediana
(+) | los medios son lineales (5.5% delta a la frecuencia anterior)
Altos 2 - 16 kHz
(+) | máximos equilibrados - a sólo 2% de la mediana
(+) | los máximos son lineales (4.5% delta a la frecuencia anterior)
Total 100 - 16.000 Hz
(+) | el sonido global es lineal (10.2% de diferencia con la mediana)
En comparación con la misma clase
» 7% de todos los dispositivos probados de esta clase eran mejores, 2% similares, 91% peores
» El mejor tuvo un delta de 5%, la media fue 18%, el peor fue ###max##%
En comparación con todos los dispositivos probados
» 5% de todos los dispositivos probados eran mejores, 1% similares, 94% peores
» El mejor tuvo un delta de 4%, la media fue 24%, el peor fue ###max##%
| Off / Standby | |
| Ocioso | |
| Carga |
|
Clave:
min: | |
| Microsoft Surface Laptop i5 i5-7200U, HD Graphics 620, Toshiba THNSN0128GTYA, IPS, 2256x1504, 13.5" | Microsoft Surface Book with Performance Base 6600U, GeForce GTX 965M, Toshiba NVMe THNSN5256GPU7, IPS, 3000x2000, 13.5" | Microsoft Surface Pro 4, Core i5, 128GB 6300U, HD Graphics 520, Samsung MZFLV128 NVMe, IPS, 2736x1824, 12.3" | Apple MacBook Pro 13 2016 (2.9 GHz) 6267U, Iris Graphics 550, Apple SSD AP0256, , 2560x1600, 13.3" | Dell XPS 13 9360 FHD i5 i5-7200U, HD Graphics 620, Toshiba NVMe THNSN5256GPUK, IPS, 1920x1080, 13.3" | |
|---|---|---|---|---|---|
| Power Consumption | -75% | -12% | -34% | 14% | |
| Idle Minimum * (Watt) | 3.2 | 4.15 -30% | 4.4 -38% | 2.1 34% | 4.1 -28% |
| Idle Average * (Watt) | 6.5 | 8 -23% | 9 -38% | 7.6 -17% | 4.2 35% |
| Idle Maximum * (Watt) | 6.8 | 11.9 -75% | 10.7 -57% | 8.2 -21% | 5.1 25% |
| Load Average * (Watt) | 28.2 | 67 -138% | 19.6 30% | 56.4 -100% | 22.1 22% |
| Load Maximum * (Watt) | 36 | 76 -111% | 19.9 45% | 59.8 -66% | 29.4 18% |
| Witcher 3 ultra * (Watt) | 58 |
* ... más pequeño es mejor
| Microsoft Surface Laptop i5 i5-7200U, HD Graphics 620, 45 Wh | Microsoft Surface Book with Performance Base 6600U, GeForce GTX 965M, 78 Wh | Microsoft Surface Pro 4, Core i5, 128GB 6300U, HD Graphics 520, 38 Wh | Apple MacBook Pro 13 2016 (2.9 GHz) 6267U, Iris Graphics 550, 49.2 Wh | Dell XPS 13 9360 FHD i5 i5-7200U, HD Graphics 620, 60 Wh | Asus Zenbook UX3410UQ-GV077T i7-7500U, GeForce 940MX, 48 Wh | |
|---|---|---|---|---|---|---|
| Duración de Batería | -7% | -24% | -27% | 11% | -15% | |
| Reader / Idle (h) | 22.5 | 25.5 13% | 15 -33% | 21.6 -4% | ||
| WiFi v1.3 (h) | 10 | 9.6 -4% | 7.1 -29% | 9.4 -6% | 11.3 13% | 8.5 -15% |
| Load (h) | 2.1 | 1.5 -29% | 1.9 -10% | 1.1 -48% | 2.6 24% |
Pro
Contra
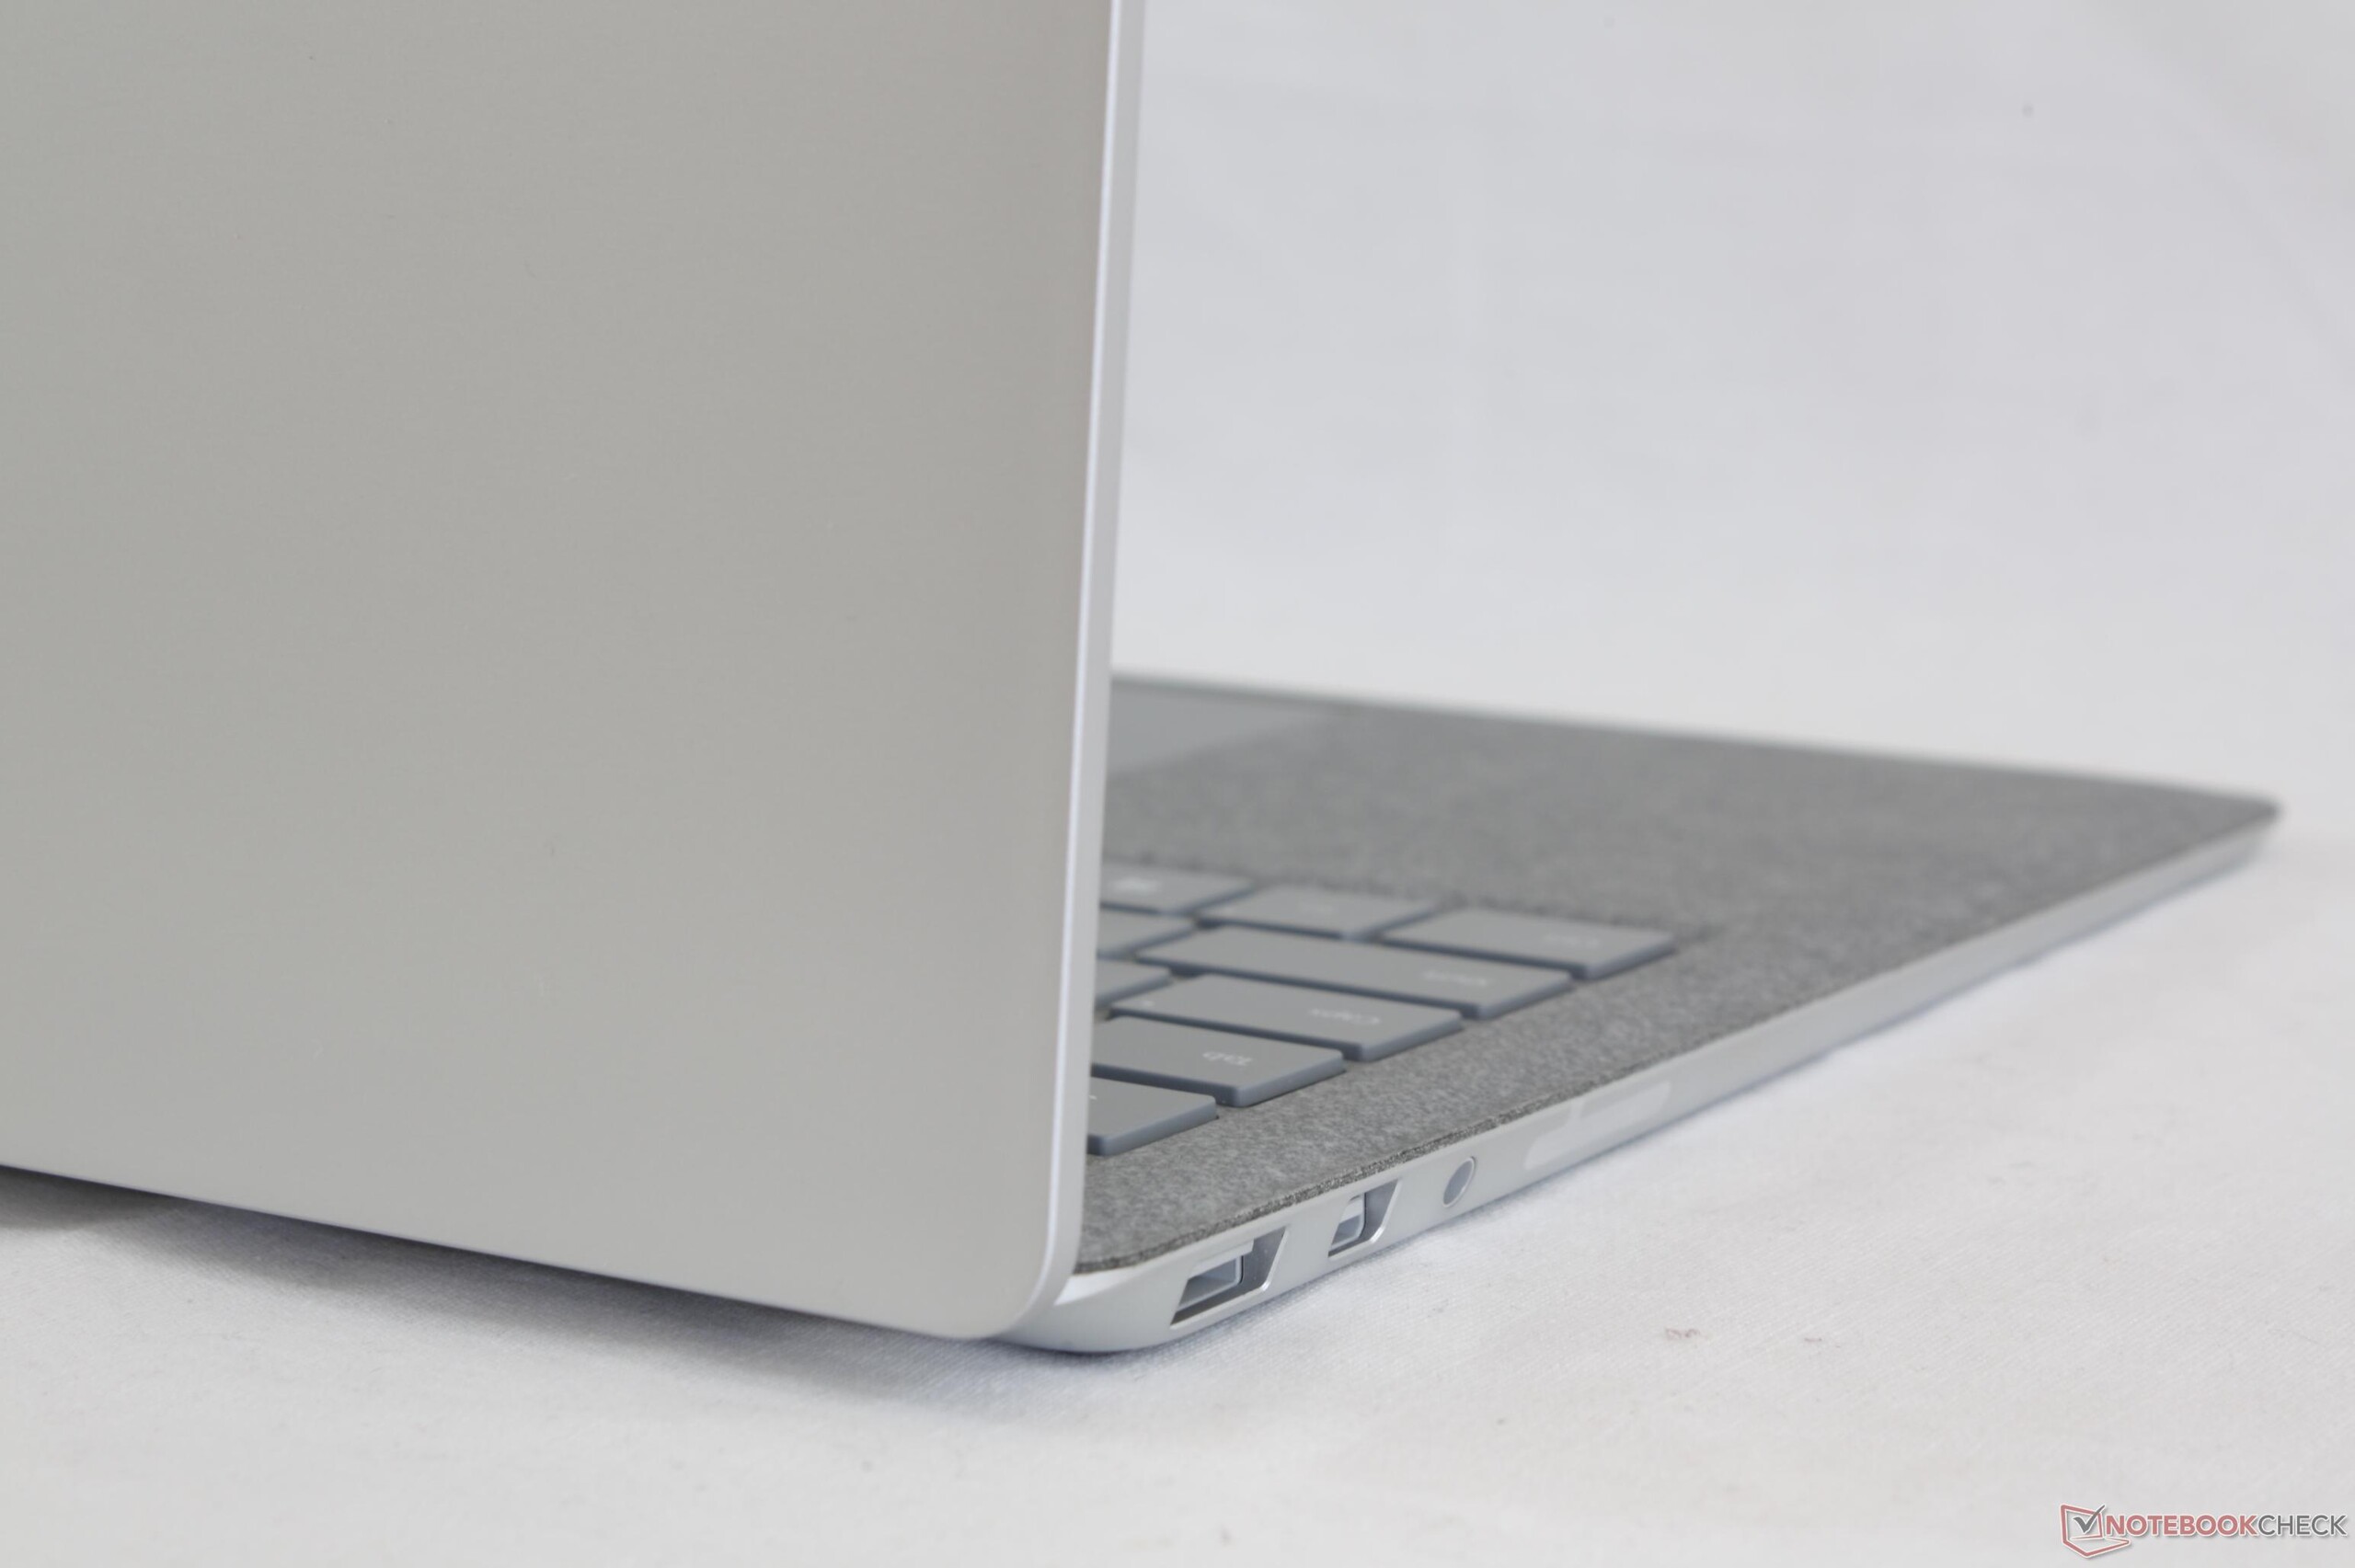
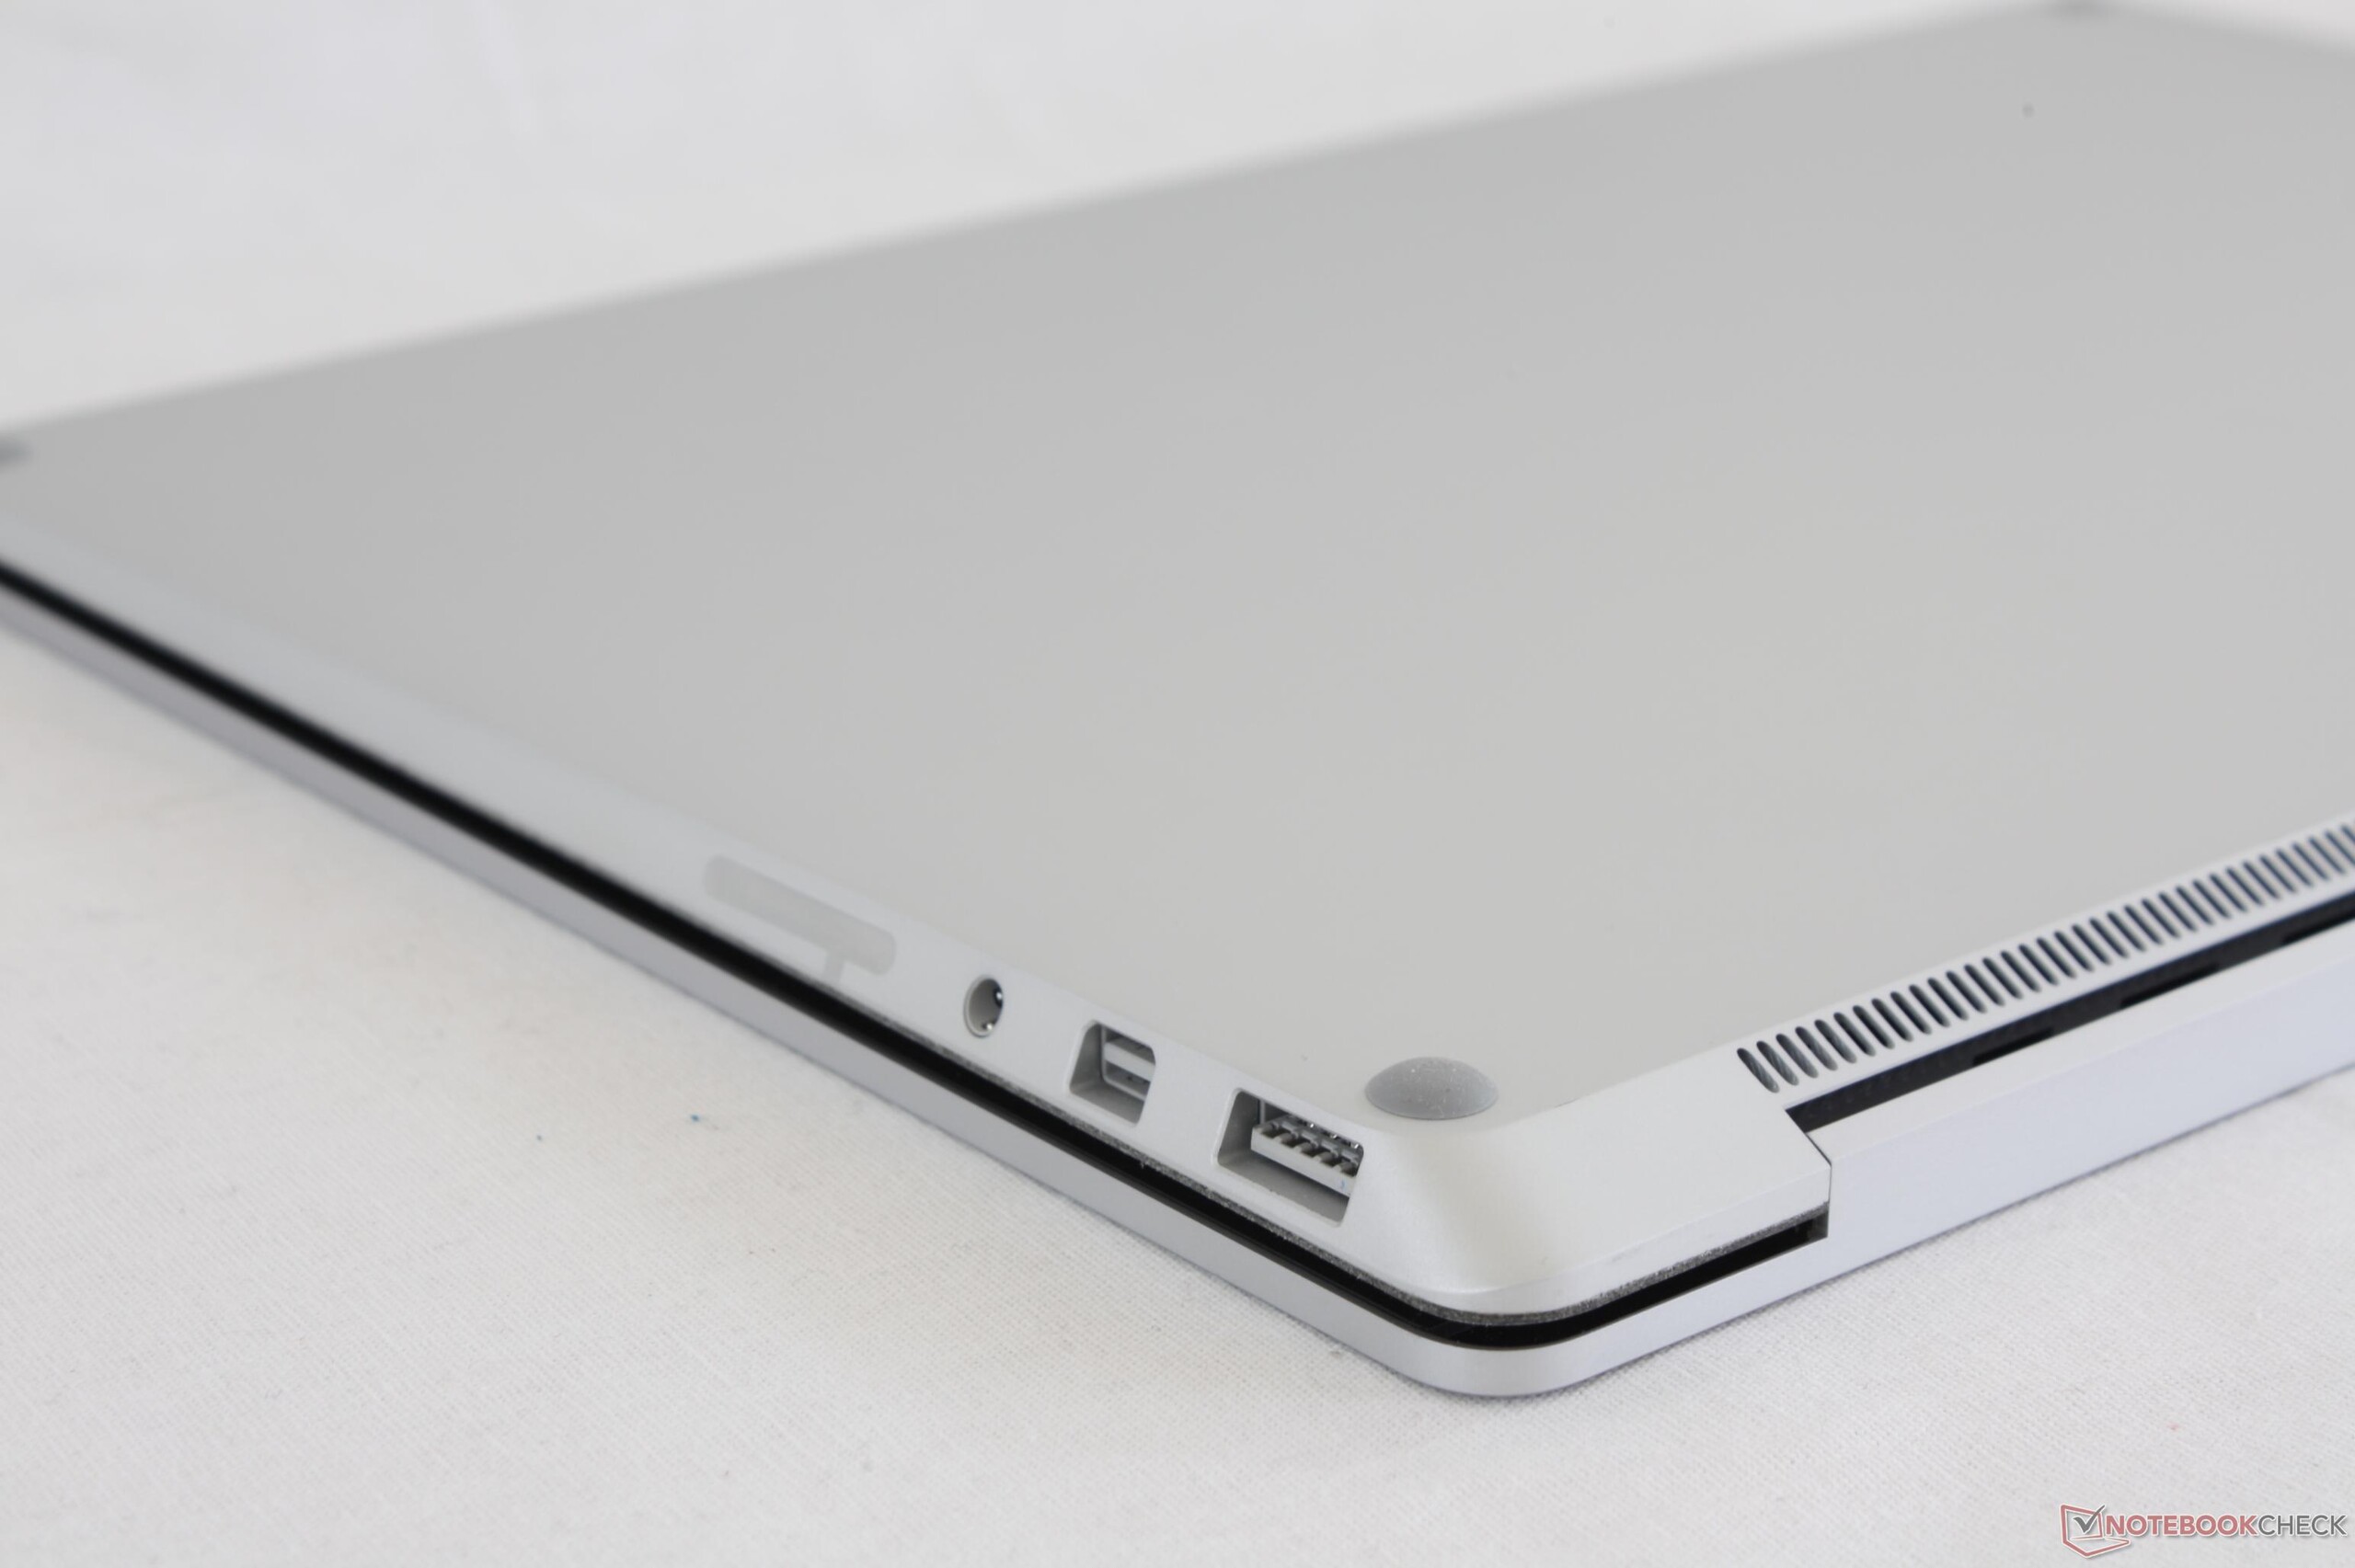
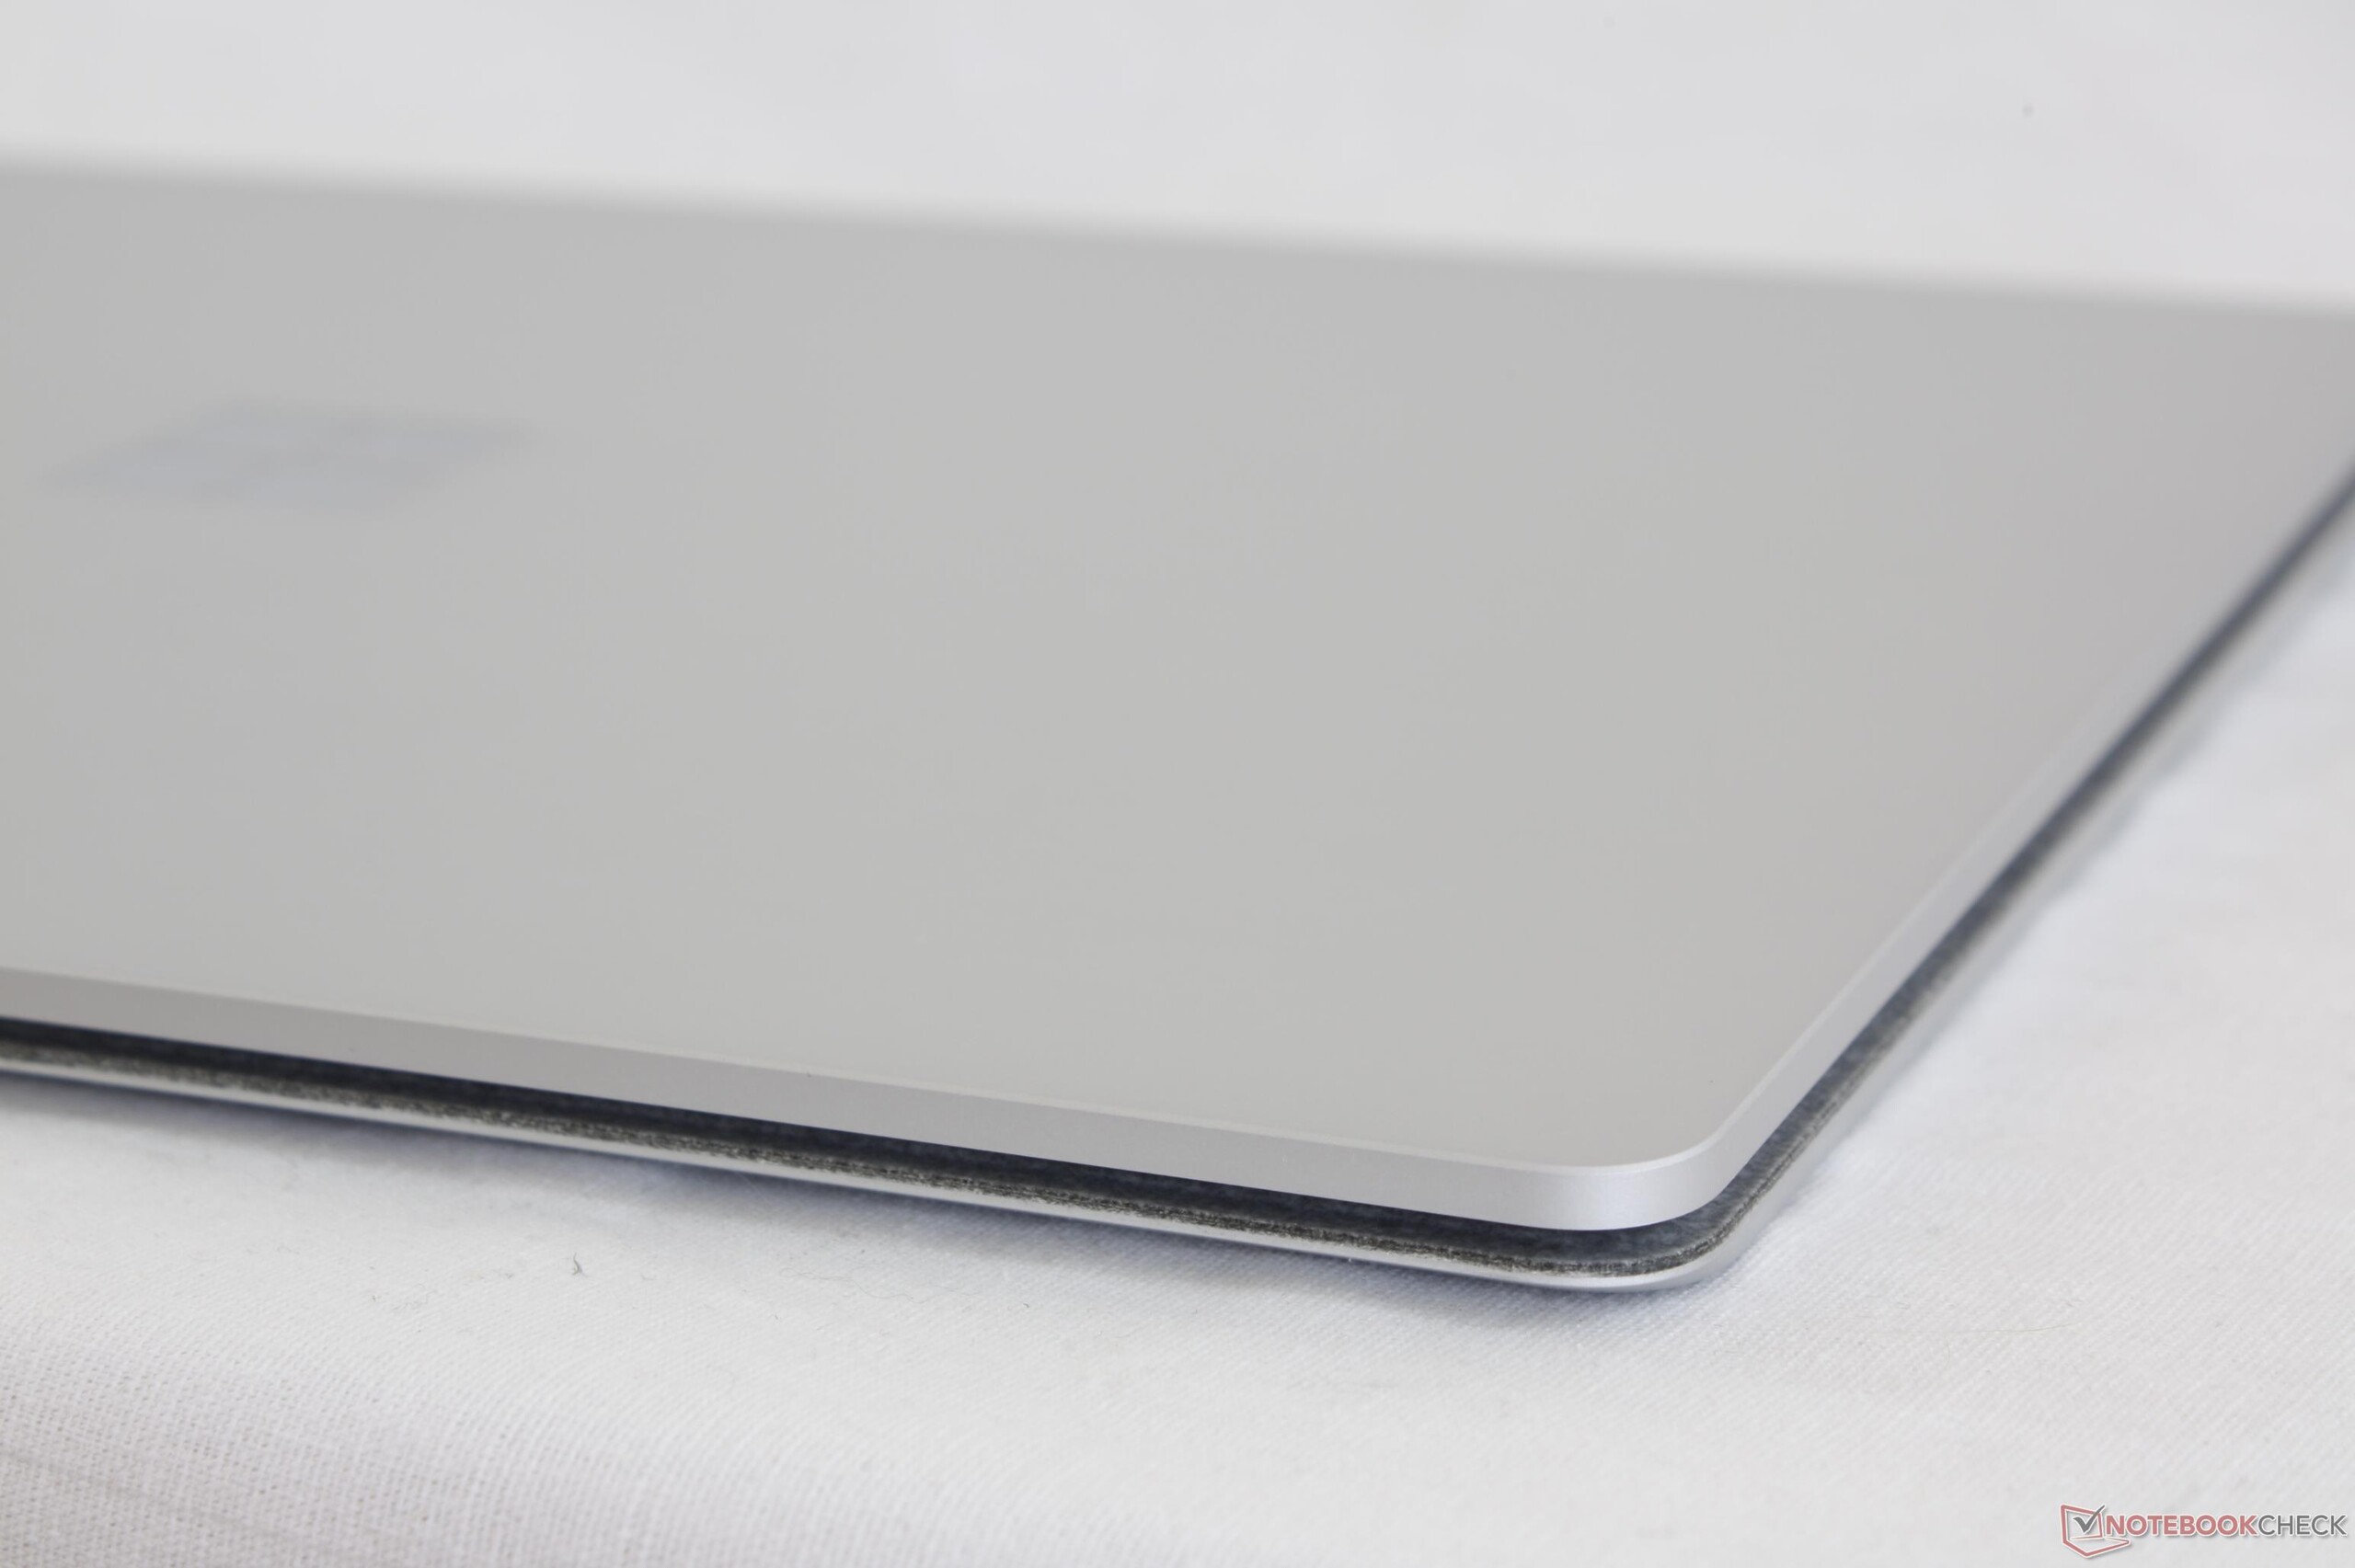
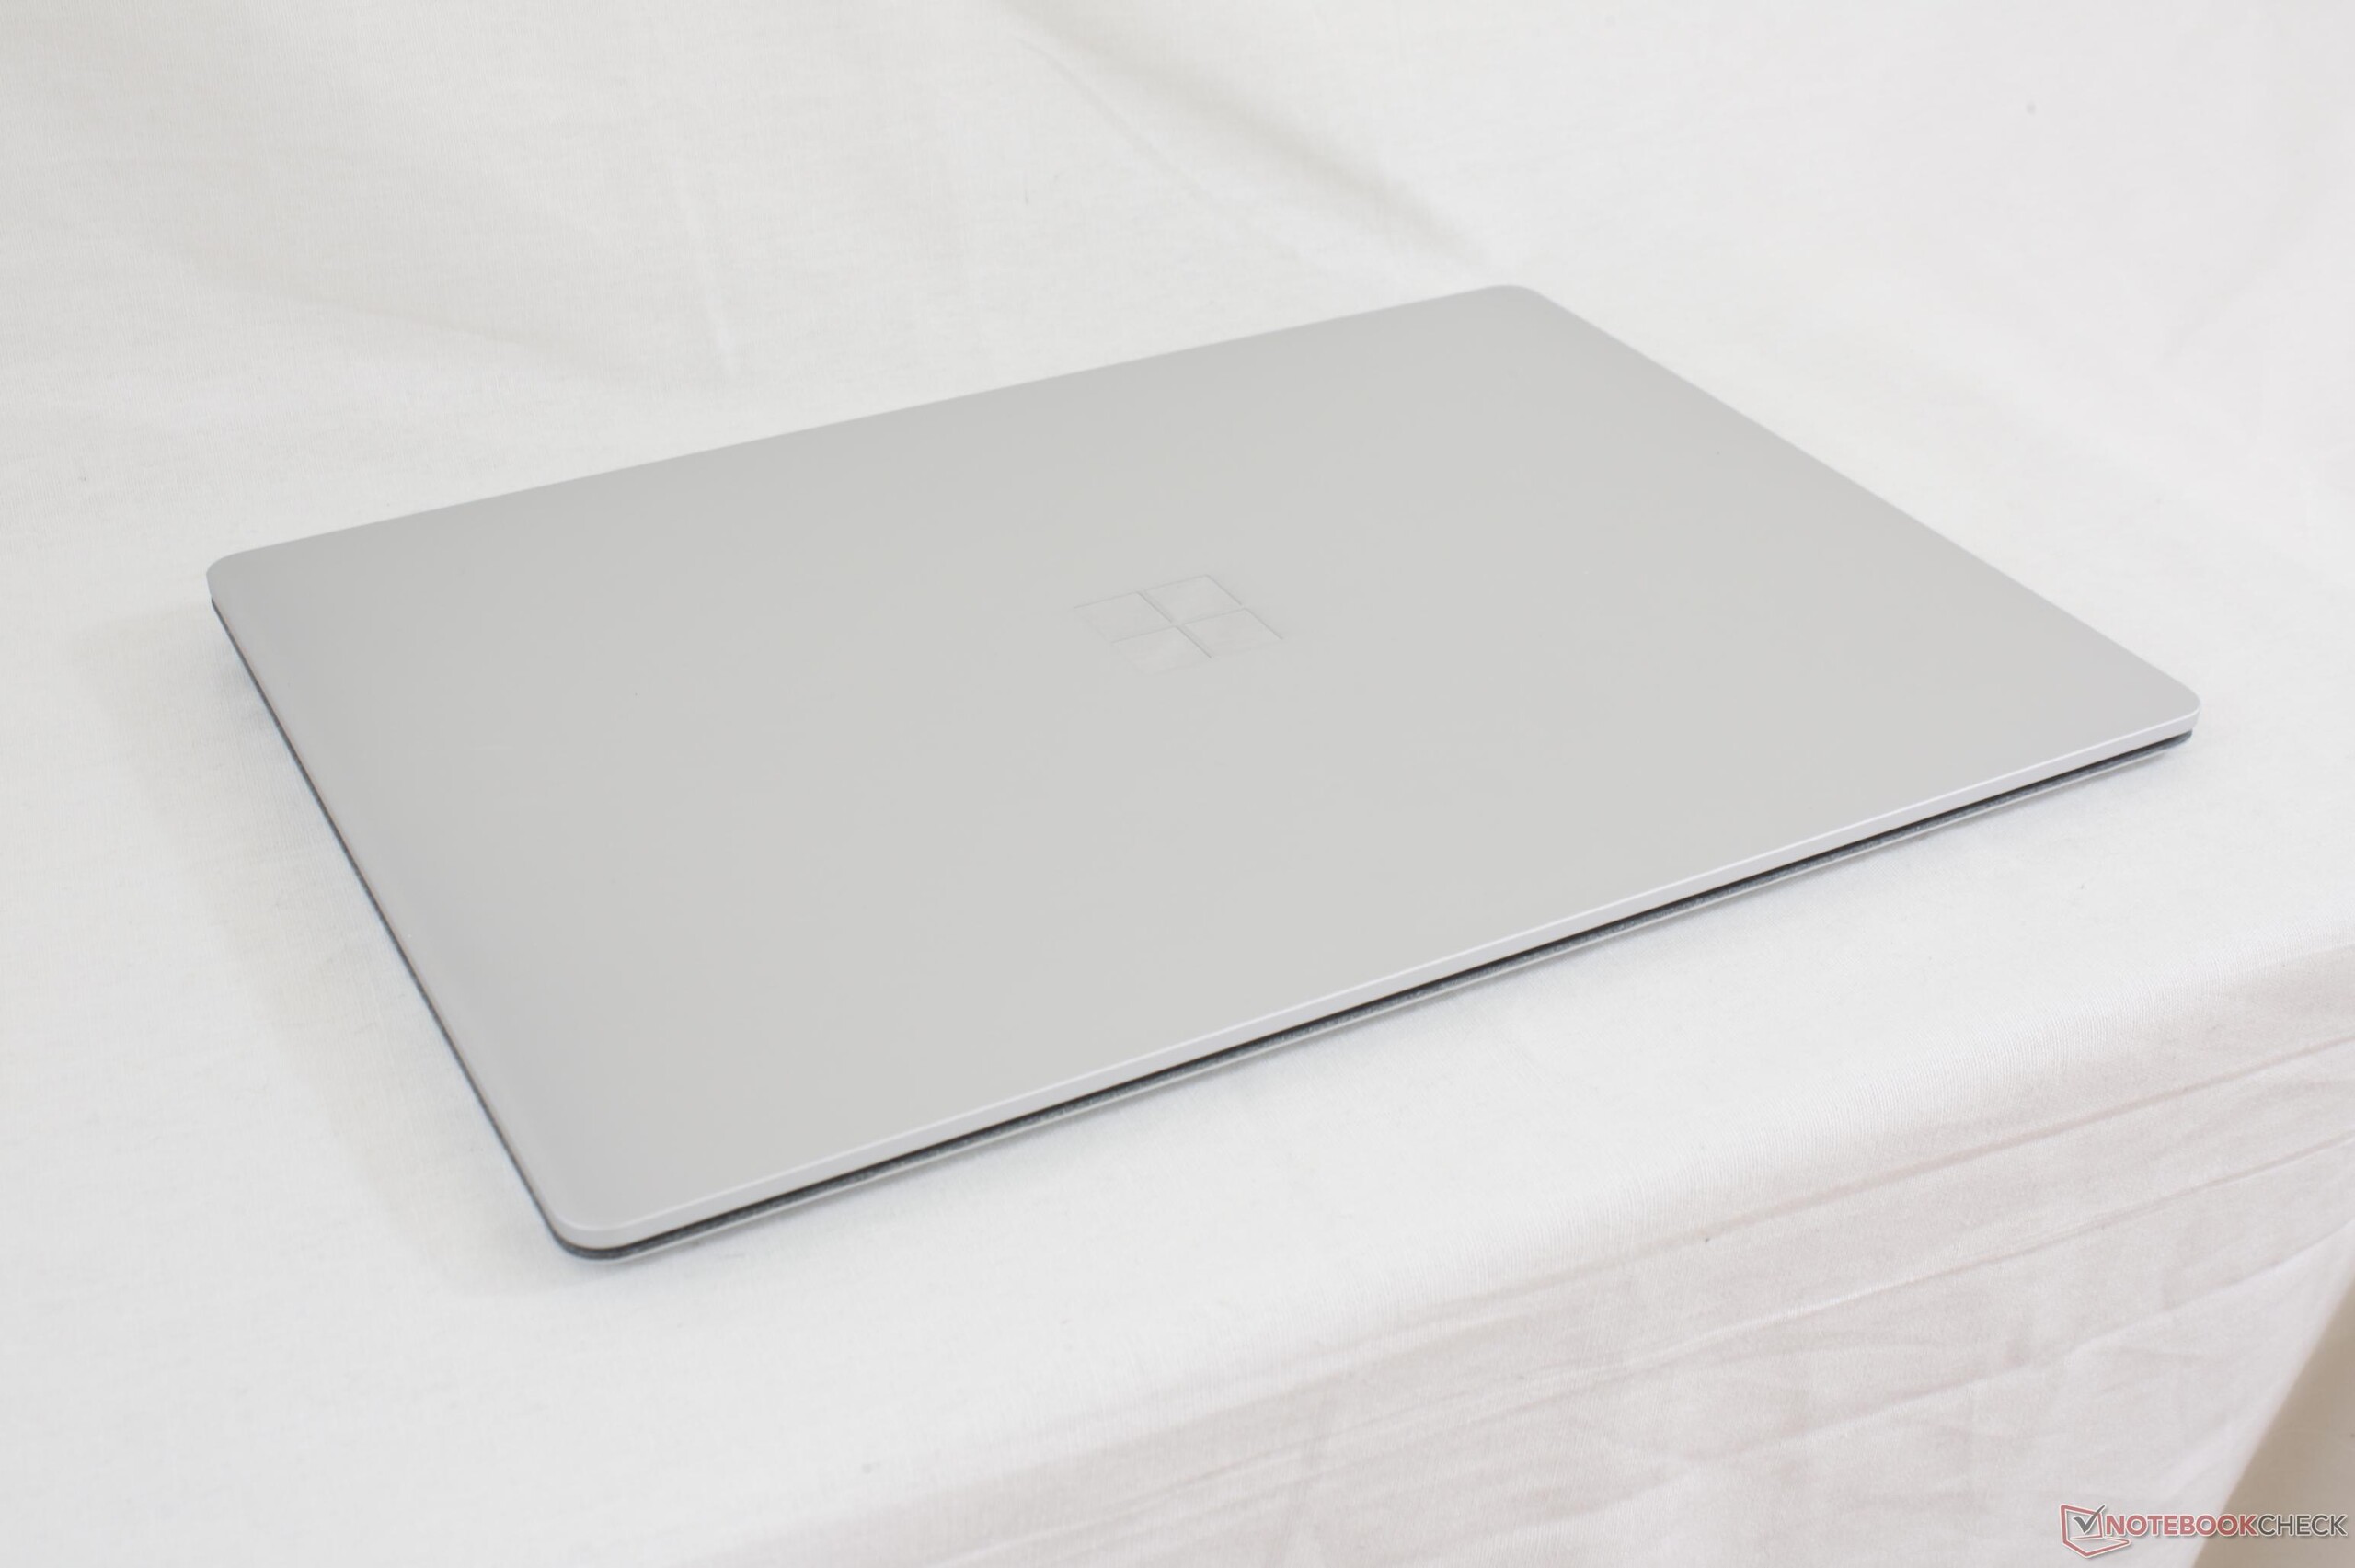
Microsoft anuncia el Surface Laptop como "más que un portátil tradicional", pero nuestra experiencia ha sido la opuesta. Si características como USB Type-C, lector SD, y NVMe son importantes, los actuales Ultrabooks insignia de Lenovo, HP, y Dell tienen más de lo que el último Microsoft Surface puede ofrecer. La base Alcantara ciertamente es diferente y da otro punto único de venta, pero su inclusión parece superficial sin ventajas importantes para el usuario final.
El mayor motivo para comprar un Surface Laptop es su display de 13.5" ya que todo lo demás es bastante decepcionante. Si el panel 3:2 o la configuración con Iris Graphics no son movitos para comprarlo, el portátil resulta mucho menos atractivo comparado con la plétora de alternativas de 13 y 14" disponibles. El gran aguante de batería, bajo ruido de ventilador, y amplia cobertura de color del portátil Microsoft también se pueden encontrar en competidores como XPS 13 9360 QHD o Notebook 9.
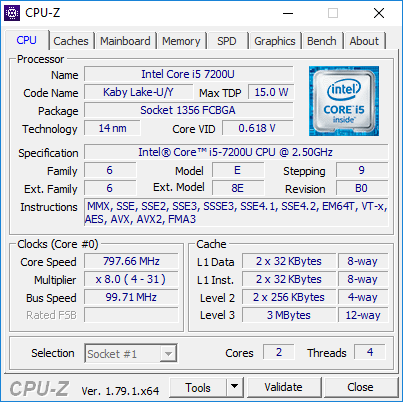
Cómo rendirá la versión con Core i7 bajo estrés será algo interesante de ver en un futuro análisis. Si nuestra configuración Core i5 apenas puede mantener la velocidad Turbo Boost en la horquilla 2.7 - 2.8 GHz, nos preguntamos cómo la configuración más exigente con Core i7 puede mantener su velocidad Turbo Boost máxima de 4.0 GHz. También nos preocupa si la RAM DDR3 contendrá el potencial completo de la GPU Iris Plus Graphics 640 de modo parecido al que nuestra GPU HD Graphics 620 decepciona en nuestra configuración Core i5.
Microsoft dirige su portátil a estudiantes, por lo que nos gusta que la calidad del dispositivo no parece sufrir recortes. Dicho eso, su larga lista de características ausentes limita severamente la versatilidad del Surface Laptop y hace que nos cueste recomendarlo tanto a estudiantes como a usuarios en general.
Demasiado poco, demasiado tarde. El Surface Laptop es un portátil sin florituras construido sólidamente con un display hermoso. Por desgracia, no ofrece mucho más y ni se acerca a la versatilidad del Surface Pro 4 o de la mayoría de Ultrabooks actualmente en el mercado.
Ésta es una versión acortada del análisis original. Puedes leer el análisis completo en inglés aquí.
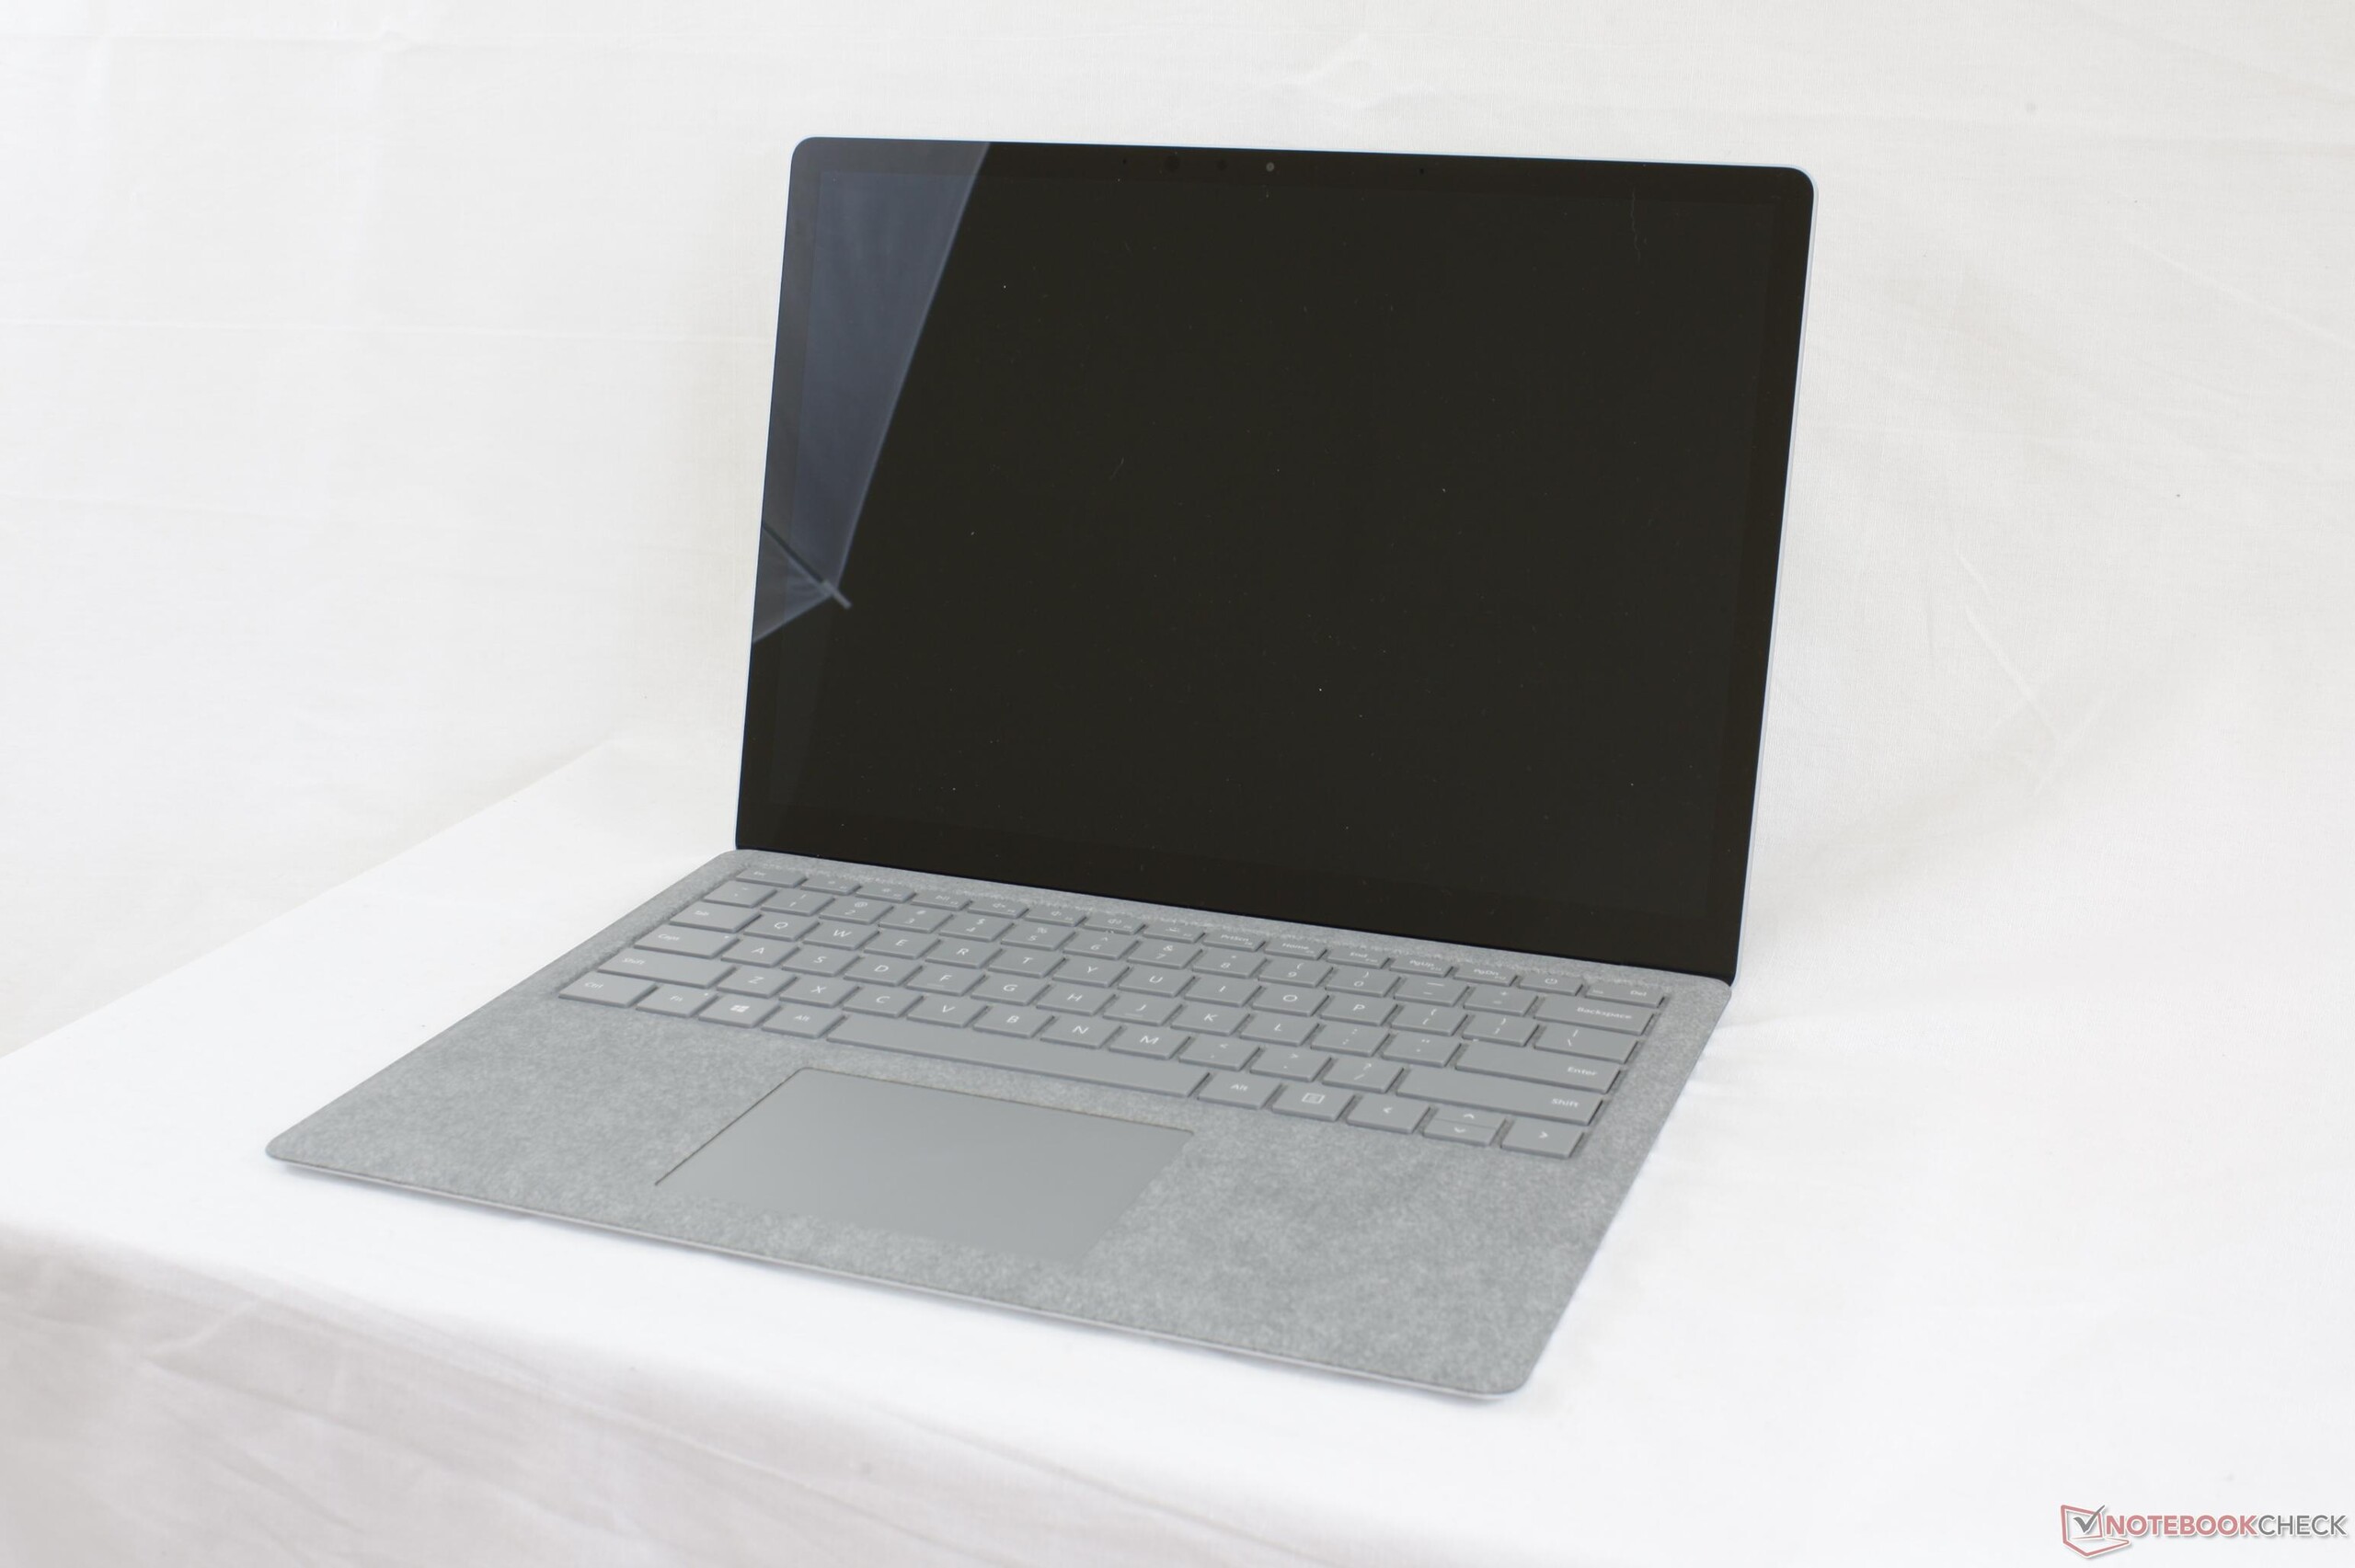
Microsoft Surface Laptop i5
- 06/18/2017 v6 (old)
Allen Ngo
Price comparison
