Breve análisis del portátil Toshiba Tecra X40-D (i7-7600U, FHD)
| SD Card Reader | |
| average JPG Copy Test (av. of 3 runs) | |
| Dell XPS 13 9360 FHD i7 Iris | |
| Toshiba Tecra X40-D | |
| Lenovo ThinkPad T470s-20HF0012US | |
| Lenovo ThinkPad X1 Carbon 2017-20HR0021GE | |
| Toshiba Portege X30-D (PT274U-01N001) | |
| maximum AS SSD Seq Read Test (1GB) | |
| Dell XPS 13 9360 FHD i7 Iris | |
| Lenovo ThinkPad T470s-20HF0012US | |
| Toshiba Portege X30-D (PT274U-01N001) | |
| Lenovo ThinkPad X1 Carbon 2017-20HR0021GE | |
| Toshiba Tecra X40-D | |
| |||||||||||||||||||||||||
iluminación: 85 %
Brillo con batería: 283.9 cd/m²
Contraste: 1136:1 (Negro: 0.25 cd/m²)
ΔE ColorChecker Calman: 6.4 | ∀{0.5-29.43 Ø4.71}
ΔE Greyscale Calman: 6.3 | ∀{0.09-98 Ø4.96}
60% sRGB (Argyll 1.6.3 3D)
38% AdobeRGB 1998 (Argyll 1.6.3 3D)
41.89% AdobeRGB 1998 (Argyll 3D)
61% sRGB (Argyll 3D)
40.55% Display P3 (Argyll 3D)
Gamma: 2.39
CCT: 6511 K
| Toshiba Tecra X40-D Toshiba TOS508F, IPS, 14", 1920x1080 | Toshiba Portege X30-D (PT274U-01N001) Toshiba TOS508F, IPS, 13.3", 1920x1080 | Lenovo ThinkPad X1 Carbon 2017-20HR0021GE B140HAN03_1, IPS, 14", 1920x1080 | Lenovo ThinkPad T470s-20HF0012US LEN40A9 (R140NWF5 R1), IPS, 14", 1920x1080 | HP Spectre 13-v131ng CMN1374, IPS UWVA, 13.3", 1920x1080 | |
|---|---|---|---|---|---|
| Display | 59% | 48% | -0% | 53% | |
| Display P3 Coverage (%) | 40.55 | 66.4 64% | 61.6 52% | 40.35 0% | 64.6 59% |
| sRGB Coverage (%) | 61 | 93.5 53% | 87.6 44% | 60.3 -1% | 88.8 46% |
| AdobeRGB 1998 Coverage (%) | 41.89 | 66.6 59% | 62.6 49% | 41.72 0% | 64.8 55% |
| Response Times | -4% | -20% | -7% | -22% | |
| Response Time Grey 50% / Grey 80% * (ms) | 38 ? | 36.8 ? 3% | 48 ? -26% | 40.8 ? -7% | 46 ? -21% |
| Response Time Black / White * (ms) | 26.8 ? | 29.6 ? -10% | 30.4 ? -13% | 28.8 ? -7% | 33 ? -23% |
| PWM Frequency (Hz) | 20410 ? | 219.3 ? | |||
| Screen | 34% | 33% | 0% | 22% | |
| Brightness middle (cd/m²) | 283.9 | 332.6 17% | 278 -2% | 271.6 -4% | 404 42% |
| Brightness (cd/m²) | 261 | 323 24% | 271 4% | 264 1% | 382 46% |
| Brightness Distribution (%) | 85 | 86 1% | 91 7% | 88 4% | 91 7% |
| Black Level * (cd/m²) | 0.25 | 0.28 -12% | 0.16 36% | 0.24 4% | 0.35 -40% |
| Contrast (:1) | 1136 | 1188 5% | 1738 53% | 1132 0% | 1154 2% |
| Colorchecker dE 2000 * | 6.4 | 2.6 59% | 4.5 30% | 6.1 5% | 5.37 16% |
| Colorchecker dE 2000 max. * | 18.7 | 6.7 64% | 8.4 55% | 28.6 -53% | 9.46 49% |
| Greyscale dE 2000 * | 6.3 | 2.5 60% | 3.2 49% | 3.4 46% | 6.44 -2% |
| Gamma | 2.39 92% | 2.12 104% | 2.02 109% | 2.12 104% | 2.52 87% |
| CCT | 6511 100% | 6720 97% | 7042 92% | 6077 107% | 6738 96% |
| Color Space (Percent of AdobeRGB 1998) (%) | 38 | 62 63% | 57 50% | 38 0% | 58 53% |
| Color Space (Percent of sRGB) (%) | 60 | 94 57% | 87.5 46% | 60 0% | 89 48% |
| Media total (Programa/Opciones) | 30% /
34% | 20% /
29% | -2% /
-1% | 18% /
22% |
* ... más pequeño es mejor
Tiempos de respuesta del display
| ↔ Tiempo de respuesta de Negro a Blanco | ||
|---|---|---|
| 26.8 ms ... subida ↗ y bajada ↘ combinada | ↗ 16.4 ms subida | 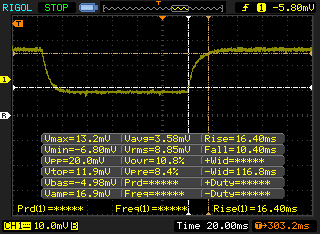 |
| ↘ 10.4 ms bajada | ||
| La pantalla mostró tiempos de respuesta relativamente lentos en nuestros tests pero podría ser demasiado lenta para los jugones. En comparación, todos los dispositivos de prueba van de ##min### (mínimo) a 240 (máximo) ms. » 67 % de todos los dispositivos son mejores. Eso quiere decir que el tiempo de respuesta es peor que la media (19.8 ms) de todos los dispositivos testados. | ||
| ↔ Tiempo de respuesta 50% Gris a 80% Gris | ||
| 38 ms ... subida ↗ y bajada ↘ combinada | ↗ 19.6 ms subida | 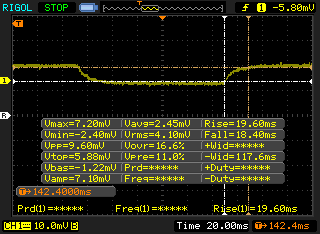 |
| ↘ 18.4 ms bajada | ||
| La pantalla mostró tiempos de respuesta lentos en nuestros tests y podría ser demasiado lenta para los jugones. En comparación, todos los dispositivos de prueba van de ##min### (mínimo) a 636 (máximo) ms. » 55 % de todos los dispositivos son mejores. Eso quiere decir que el tiempo de respuesta es peor que la media (30.9 ms) de todos los dispositivos testados. | ||
Parpadeo de Pantalla / PWM (Pulse-Width Modulation)
| Parpadeo de Pantalla / PWM detectado | 20410 Hz | ≤ 99 % de brillo | 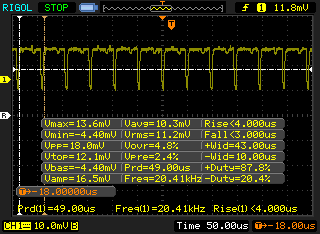 |
La retroiluminación del display parpadea a 20410 Hz (seguramente usa PWM - Pulse-Width Modulation) a un brillo del 99 % e inferior. Sobre este nivel de brillo no debería darse parpadeo / PWM. La frecuencia de 20410 Hz es bastante alta, por lo que la mayoría de gente sensible al parpadeo no debería ver parpadeo o tener fatiga visual. Comparación: 52 % de todos los dispositivos testados no usaron PWM para atenuar el display. Si se usó, medimos una media de 7748 (mínimo: 5 - máxmo: 343500) Hz. | |||
| Cinebench R15 | |
| CPU Single 64Bit | |
| Dell XPS 13 9360 FHD i7 Iris | |
| Lenovo ThinkPad X270 20HN0012PB | |
| Toshiba Tecra X40-D | |
| Lenovo ThinkPad T470s-20HF0012US | |
| HP Spectre 13-v131ng | |
| Lenovo ThinkPad X1 Carbon 2017-20HR0021GE | |
| Toshiba Portege X30-D (PT274U-01N001) | |
| CPU Multi 64Bit | |
| Lenovo ThinkPad T470s-20HF0012US | |
| Toshiba Tecra X40-D | |
| Toshiba Portege X30-D (PT274U-01N001) | |
| Dell XPS 13 9360 FHD i7 Iris | |
| Lenovo ThinkPad X270 20HN0012PB | |
| Lenovo ThinkPad X1 Carbon 2017-20HR0021GE | |
| HP Spectre 13-v131ng | |
| Cinebench R10 | |
| Rendering Multiple CPUs 32Bit | |
| Toshiba Tecra X40-D | |
| Toshiba Portege X30-D (PT274U-01N001) | |
| HP Spectre 13-v131ng | |
| Lenovo ThinkPad X1 Carbon 2017-20HR0021GE | |
| Rendering Single 32Bit | |
| Toshiba Portege X30-D (PT274U-01N001) | |
| HP Spectre 13-v131ng | |
| Lenovo ThinkPad X1 Carbon 2017-20HR0021GE | |
| wPrime 2.10 - 1024m | |
| Lenovo ThinkPad X270 20HN0012PB | |
| Toshiba Portege X30-D (PT274U-01N001) | |
| Toshiba Tecra X40-D | |
| Lenovo ThinkPad T470s-20HF0012US | |
* ... más pequeño es mejor
| PCMark 7 Score | 5979 puntos | |
| PCMark 8 Home Score Accelerated v2 | 3738 puntos | |
| PCMark 8 Creative Score Accelerated v2 | 4784 puntos | |
| PCMark 8 Work Score Accelerated v2 | 4963 puntos | |
| PCMark 10 Score | 2464 puntos | |
ayuda | ||
| Toshiba Tecra X40-D Samsung PM961 MZVLW256HEHP | Toshiba Portege X30-D (PT274U-01N001) Samsung PM961 MZVLW256HEHP | Lenovo ThinkPad X1 Carbon 2017-20HR0021GE Toshiba THNSF5256GPUK | Lenovo ThinkPad X270 20HN0012PB Toshiba THNSF5256GPUK | Lenovo ThinkPad T470s-20HF0012US Samsung PM961 MZVLW256HEHP | HP Spectre 13-v131ng Samsung PM961 NVMe MZVLW512HMJP | |
|---|---|---|---|---|---|---|
| AS SSD | -678% | -46% | -43% | 9% | 14% | |
| Copy Game MB/s (MB/s) | 229 | 309.9 | 397.9 | |||
| Copy Program MB/s (MB/s) | 172.4 | 291 | 426 | |||
| Copy ISO MB/s (MB/s) | 623 | 797 | 720 | |||
| Score Total (Points) | 3576 | 2687 -25% | 1398 -61% | 1638 -54% | 3875 8% | 3617 1% |
| Score Write (Points) | 675 | 162 -76% | 337 -50% | 442 -35% | 803 19% | 1115 65% |
| Score Read (Points) | 1963 | 1723 -12% | 726 -63% | 802 -59% | 2083 6% | 1654 -16% |
| Access Time Write * (ms) | 0.028 | 2.01 -7079% | 0.034 -21% | 0.033 -18% | 0.025 11% | 0.026 7% |
| Access Time Read * (ms) | 0.061 | 0.05 18% | 0.102 -67% | 0.113 -85% | 0.06 2% | 0.042 31% |
| 4K-64 Write (MB/s) | 438.4 | 125.8 -71% | 149.6 -66% | 264 -40% | 538 23% | 862 97% |
| 4K-64 Read (MB/s) | 1663 | 1483 -11% | 526 -68% | 633 -62% | 1765 6% | 1465 -12% |
| 4K Write (MB/s) | 124.8 | 1.2 -99% | 109.4 -12% | 100 -20% | 147.9 19% | 134.4 8% |
| 4K Read (MB/s) | 51.6 | 42.8 -17% | 34.34 -33% | 38.8 -25% | 48.84 -5% | 56.4 9% |
| Seq Write (MB/s) | 1117 | 352.7 -68% | 775 -31% | 777 -30% | 1170 5% | 1190 7% |
| Seq Read (MB/s) | 2479 | 1972 -20% | 1649 -33% | 1294 -48% | 2691 9% | 1325 -47% |
* ... más pequeño es mejor

| 3DMark 11 | |
| 1280x720 Performance GPU | |
| Acer Aspire 5 A515-51G-51RL | |
| Asus Zenbook UX3430UQ-GV012T | |
| Dell XPS 13 9360 FHD i7 Iris | |
| Toshiba Tecra X40-D | |
| Lenovo ThinkPad T470s-20HF0012US | |
| HP Spectre 13-v131ng | |
| Lenovo ThinkPad X1 Carbon 2017-20HR0021GE | |
| Lenovo ThinkPad X270 20HN0012PB | |
| Toshiba Portege X30-D (PT274U-01N001) | |
| 1280x720 Performance Combined | |
| Acer Aspire 5 A515-51G-51RL | |
| Dell XPS 13 9360 FHD i7 Iris | |
| Asus Zenbook UX3430UQ-GV012T | |
| Lenovo ThinkPad T470s-20HF0012US | |
| Toshiba Tecra X40-D | |
| Lenovo ThinkPad X1 Carbon 2017-20HR0021GE | |
| HP Spectre 13-v131ng | |
| Toshiba Portege X30-D (PT274U-01N001) | |
| Lenovo ThinkPad X270 20HN0012PB | |
| 3DMark | |
| 1280x720 Cloud Gate Standard Graphics | |
| Acer Aspire 5 A515-51G-51RL | |
| Dell XPS 13 9360 FHD i7 Iris | |
| Lenovo ThinkPad T470s-20HF0012US | |
| Toshiba Tecra X40-D | |
| Asus Zenbook UX3430UQ-GV012T | |
| HP Spectre 13-v131ng | |
| Lenovo ThinkPad X1 Carbon 2017-20HR0021GE | |
| Lenovo ThinkPad X270 20HN0012PB | |
| Toshiba Portege X30-D (PT274U-01N001) | |
| 1920x1080 Fire Strike Graphics | |
| Acer Aspire 5 A515-51G-51RL | |
| Asus Zenbook UX3430UQ-GV012T | |
| Dell XPS 13 9360 FHD i7 Iris | |
| Toshiba Tecra X40-D | |
| Lenovo ThinkPad T470s-20HF0012US | |
| Lenovo ThinkPad X1 Carbon 2017-20HR0021GE | |
| HP Spectre 13-v131ng | |
| Lenovo ThinkPad X270 20HN0012PB | |
| Toshiba Portege X30-D (PT274U-01N001) | |
| 1920x1080 Ice Storm Extreme Graphics | |
| Lenovo ThinkPad X1 Carbon 2017-20HR0021GE | |
| HP Spectre 13-v131ng | |
| Acer Aspire 5 A515-51G-51RL | |
| Lenovo ThinkPad X270 20HN0012PB | |
| Toshiba Portege X30-D (PT274U-01N001) | |
| 3DMark 11 Performance | 1789 puntos | |
| 3DMark Cloud Gate Standard Score | 6655 puntos | |
| 3DMark Fire Strike Score | 980 puntos | |
ayuda | ||
| BioShock Infinite - 1920x1080 Ultra Preset, DX11 (DDOF) (ordenar por valor) | |
| Toshiba Tecra X40-D | |
| Lenovo ThinkPad X1 Carbon 2017-20HR0021GE | |
| Lenovo ThinkPad X270 20HN0012PB | |
| Lenovo ThinkPad T470s-20HF0012US | |
| Dell XPS 13 9360 FHD i7 Iris | |
| Acer Aspire 5 A515-51G-51RL | |
| Asus Zenbook UX3410UQ-GV077T | |
| HP Spectre 13-v131ng | |
| Ashes of the Singularity - 1920x1080 high (ordenar por valor) | |
| Toshiba Tecra X40-D | |
| Acer Aspire 5 A515-51G-51RL | |
| Rise of the Tomb Raider - 1920x1080 Very High Preset AA:FX AF:16x (ordenar por valor) | |
| Toshiba Tecra X40-D | |
| Acer Aspire 5 A515-51G-51RL | |
| bajo | medio | alto | ultra | |
|---|---|---|---|---|
| BioShock Infinite (2013) | 27 | 17 | ||
| Rise of the Tomb Raider (2016) | 5 | 2 | ||
| Ashes of the Singularity (2016) | 7 | 6 |
Ruido
| Ocioso |
| 28 / 28 / 28.2 dB(A) |
| Carga |
| 33.2 / 39.9 dB(A) |
 | ||
30 dB silencioso 40 dB(A) audible 50 dB(A) ruidosamente alto |
||
min: | ||
| Toshiba Tecra X40-D HD Graphics 620, i7-7600U, Samsung PM961 MZVLW256HEHP | Toshiba Portege X30-D (PT274U-01N001) HD Graphics 620, i7-7600U, Samsung PM961 MZVLW256HEHP | Lenovo ThinkPad X1 Carbon 2017-20HR0021GE HD Graphics 620, i5-7200U, Toshiba THNSF5256GPUK | Lenovo ThinkPad X270 20HN0012PB HD Graphics 620, i7-7500U, Toshiba THNSF5256GPUK | Lenovo ThinkPad T470s-20HF0012US HD Graphics 620, i5-7300U, Samsung PM961 MZVLW256HEHP | Dell XPS 13 9360 FHD i7 Iris Iris Plus Graphics 640, i7-7560U, Toshiba XG4 NVMe (THNSN5512GPUK) | HP Spectre 13-v131ng HD Graphics 620, i7-7500U, Samsung PM961 NVMe MZVLW512HMJP | |
|---|---|---|---|---|---|---|---|
| Noise | 0% | -4% | -8% | -1% | -3% | -9% | |
| apagado / medio ambiente * (dB) | 28 | 28.4 -1% | 29.6 -6% | 27.8 1% | 29.9 -7% | 30.4 -9% | |
| Idle Minimum * (dB) | 28 | 28.4 -1% | 29.6 -6% | 30 -7% | 27.8 1% | 29.9 -7% | 30.4 -9% |
| Idle Average * (dB) | 28 | 28.4 -1% | 29.6 -6% | 30 -7% | 27.8 1% | 29.9 -7% | 30.4 -9% |
| Idle Maximum * (dB) | 28.2 | 28.4 -1% | 32.2 -14% | 33.2 -18% | 27.8 1% | 30.3 -7% | 30.4 -8% |
| Load Average * (dB) | 33.2 | 33.2 -0% | 34.2 -3% | 37.2 -12% | 34.8 -5% | 33.9 -2% | 40 -20% |
| Load Maximum * (dB) | 39.9 | 37.9 5% | 36.1 10% | 37.9 5% | 42 -5% | 34.9 13% | 40 -0% |
| Witcher 3 ultra * (dB) | 42 |
* ... más pequeño es mejor
(±) La temperatura máxima en la parte superior es de 43 °C / 109 F, frente a la media de 34.3 °C / 94 F, que oscila entre 21.2 y 62.5 °C para la clase Office.
(±) El fondo se calienta hasta un máximo de 42 °C / 108 F, frente a la media de 36.8 °C / 98 F
(+) En reposo, la temperatura media de la parte superior es de 26 °C / 79# F, frente a la media del dispositivo de 29.5 °C / 85 F.
(+) El reposamanos y el panel táctil están a una temperatura inferior a la de la piel, con un máximo de 27.6 °C / 81.7 F y, por tanto, son fríos al tacto.
(±) La temperatura media de la zona del reposamanos de dispositivos similares fue de 27.6 °C / 81.7 F (0 °C / 0 F).
Toshiba Tecra X40-D análisis de audio
(±) | la sonoridad del altavoz es media pero buena (77.3 dB)
Graves 100 - 315 Hz
(-) | casi sin bajos - de media 15.2% inferior a la mediana
(±) | la linealidad de los graves es media (7.2% delta a frecuencia anterior)
Medios 400 - 2000 Hz
(+) | medios equilibrados - a sólo 3.6% de la mediana
(+) | los medios son lineales (5.7% delta a la frecuencia anterior)
Altos 2 - 16 kHz
(±) | máximos más altos - de media 5.6% más altos que la mediana
(+) | los máximos son lineales (5.2% delta a la frecuencia anterior)
Total 100 - 16.000 Hz
(±) | la linealidad del sonido global es media (22% de diferencia con la mediana)
En comparación con la misma clase
» 58% de todos los dispositivos probados de esta clase eran mejores, 8% similares, 34% peores
» El mejor tuvo un delta de 7%, la media fue 21%, el peor fue ###max##%
En comparación con todos los dispositivos probados
» 64% de todos los dispositivos probados eran mejores, 6% similares, 30% peores
» El mejor tuvo un delta de 4%, la media fue 23%, el peor fue ###max##%
Lenovo ThinkPad T470s-20HF0012US análisis de audio
(±) | la sonoridad del altavoz es media pero buena (72 dB)
Graves 100 - 315 Hz
(-) | casi sin bajos - de media 15.3% inferior a la mediana
(±) | la linealidad de los graves es media (14.1% delta a frecuencia anterior)
Medios 400 - 2000 Hz
(+) | medios equilibrados - a sólo 3.2% de la mediana
(±) | la linealidad de los medios es media (11% delta respecto a la frecuencia anterior)
Altos 2 - 16 kHz
(+) | máximos equilibrados - a sólo 4.4% de la mediana
(±) | la linealidad de los máximos es media (12.5% delta a frecuencia anterior)
Total 100 - 16.000 Hz
(±) | la linealidad del sonido global es media (24.8% de diferencia con la mediana)
En comparación con la misma clase
» 74% de todos los dispositivos probados de esta clase eran mejores, 7% similares, 19% peores
» El mejor tuvo un delta de 7%, la media fue 21%, el peor fue ###max##%
En comparación con todos los dispositivos probados
» 76% de todos los dispositivos probados eran mejores, 5% similares, 19% peores
» El mejor tuvo un delta de 4%, la media fue 23%, el peor fue ###max##%
| Off / Standby | |
| Ocioso | |
| Carga |
|
Clave:
min: | |
| Toshiba Tecra X40-D i7-7600U, HD Graphics 620, Samsung PM961 MZVLW256HEHP, IPS, 1920x1080, 14" | Toshiba Portege X30-D (PT274U-01N001) i7-7600U, HD Graphics 620, Samsung PM961 MZVLW256HEHP, IPS, 1920x1080, 13.3" | Lenovo ThinkPad X1 Carbon 2017-20HR0021GE i5-7200U, HD Graphics 620, Toshiba THNSF5256GPUK, IPS, 1920x1080, 14" | Lenovo ThinkPad X270 20HN0012PB i7-7500U, HD Graphics 620, Toshiba THNSF5256GPUK, , 1920x1080, 12.5" | Lenovo ThinkPad T470s-20HF0012US i5-7300U, HD Graphics 620, Samsung PM961 MZVLW256HEHP, IPS, 1920x1080, 14" | HP Spectre 13-v131ng i7-7500U, HD Graphics 620, Samsung PM961 NVMe MZVLW512HMJP, IPS UWVA, 1920x1080, 13.3" | |
|---|---|---|---|---|---|---|
| Power Consumption | -1% | -16% | -6% | -19% | -9% | |
| Idle Minimum * (Watt) | 5.2 | 4.6 12% | 3.8 27% | 3.8 27% | 4.8 8% | 3.6 31% |
| Idle Average * (Watt) | 6.9 | 7.6 -10% | 7.1 -3% | 7.3 -6% | 6.6 4% | 6.4 7% |
| Idle Maximum * (Watt) | 7 | 8.2 -17% | 8.3 -19% | 10 -43% | 7 -0% | 9.2 -31% |
| Load Average * (Watt) | 24.6 | 23.8 3% | 34.2 -39% | 28.1 -14% | 39.2 -59% | 34 -38% |
| Load Maximum * (Watt) | 30.1 | 28 7% | 43.3 -44% | 29 4% | 44.8 -49% | 34.4 -14% |
* ... más pequeño es mejor
| Toshiba Tecra X40-D i7-7600U, HD Graphics 620, 48 Wh | Toshiba Portege X30-D (PT274U-01N001) i7-7600U, HD Graphics 620, 48 Wh | Lenovo ThinkPad X1 Carbon 2017-20HR0021GE i5-7200U, HD Graphics 620, 57 Wh | Lenovo ThinkPad T470s-20HF0012US i5-7300U, HD Graphics 620, 51 Wh | HP Spectre 13-v131ng i7-7500U, HD Graphics 620, 38 Wh | |
|---|---|---|---|---|---|
| Duración de Batería | 6% | 14% | 31% | -15% | |
| Reader / Idle (h) | 14.6 | 15 3% | 13.7 -6% | 17.7 21% | 12 -18% |
| WiFi v1.3 (h) | 6 | 7.2 20% | 9.1 52% | 8.1 35% | 6.6 10% |
| Load (h) | 2.1 | 2 -5% | 2 -5% | 2.9 38% | 1.3 -38% |
Pro
Contra
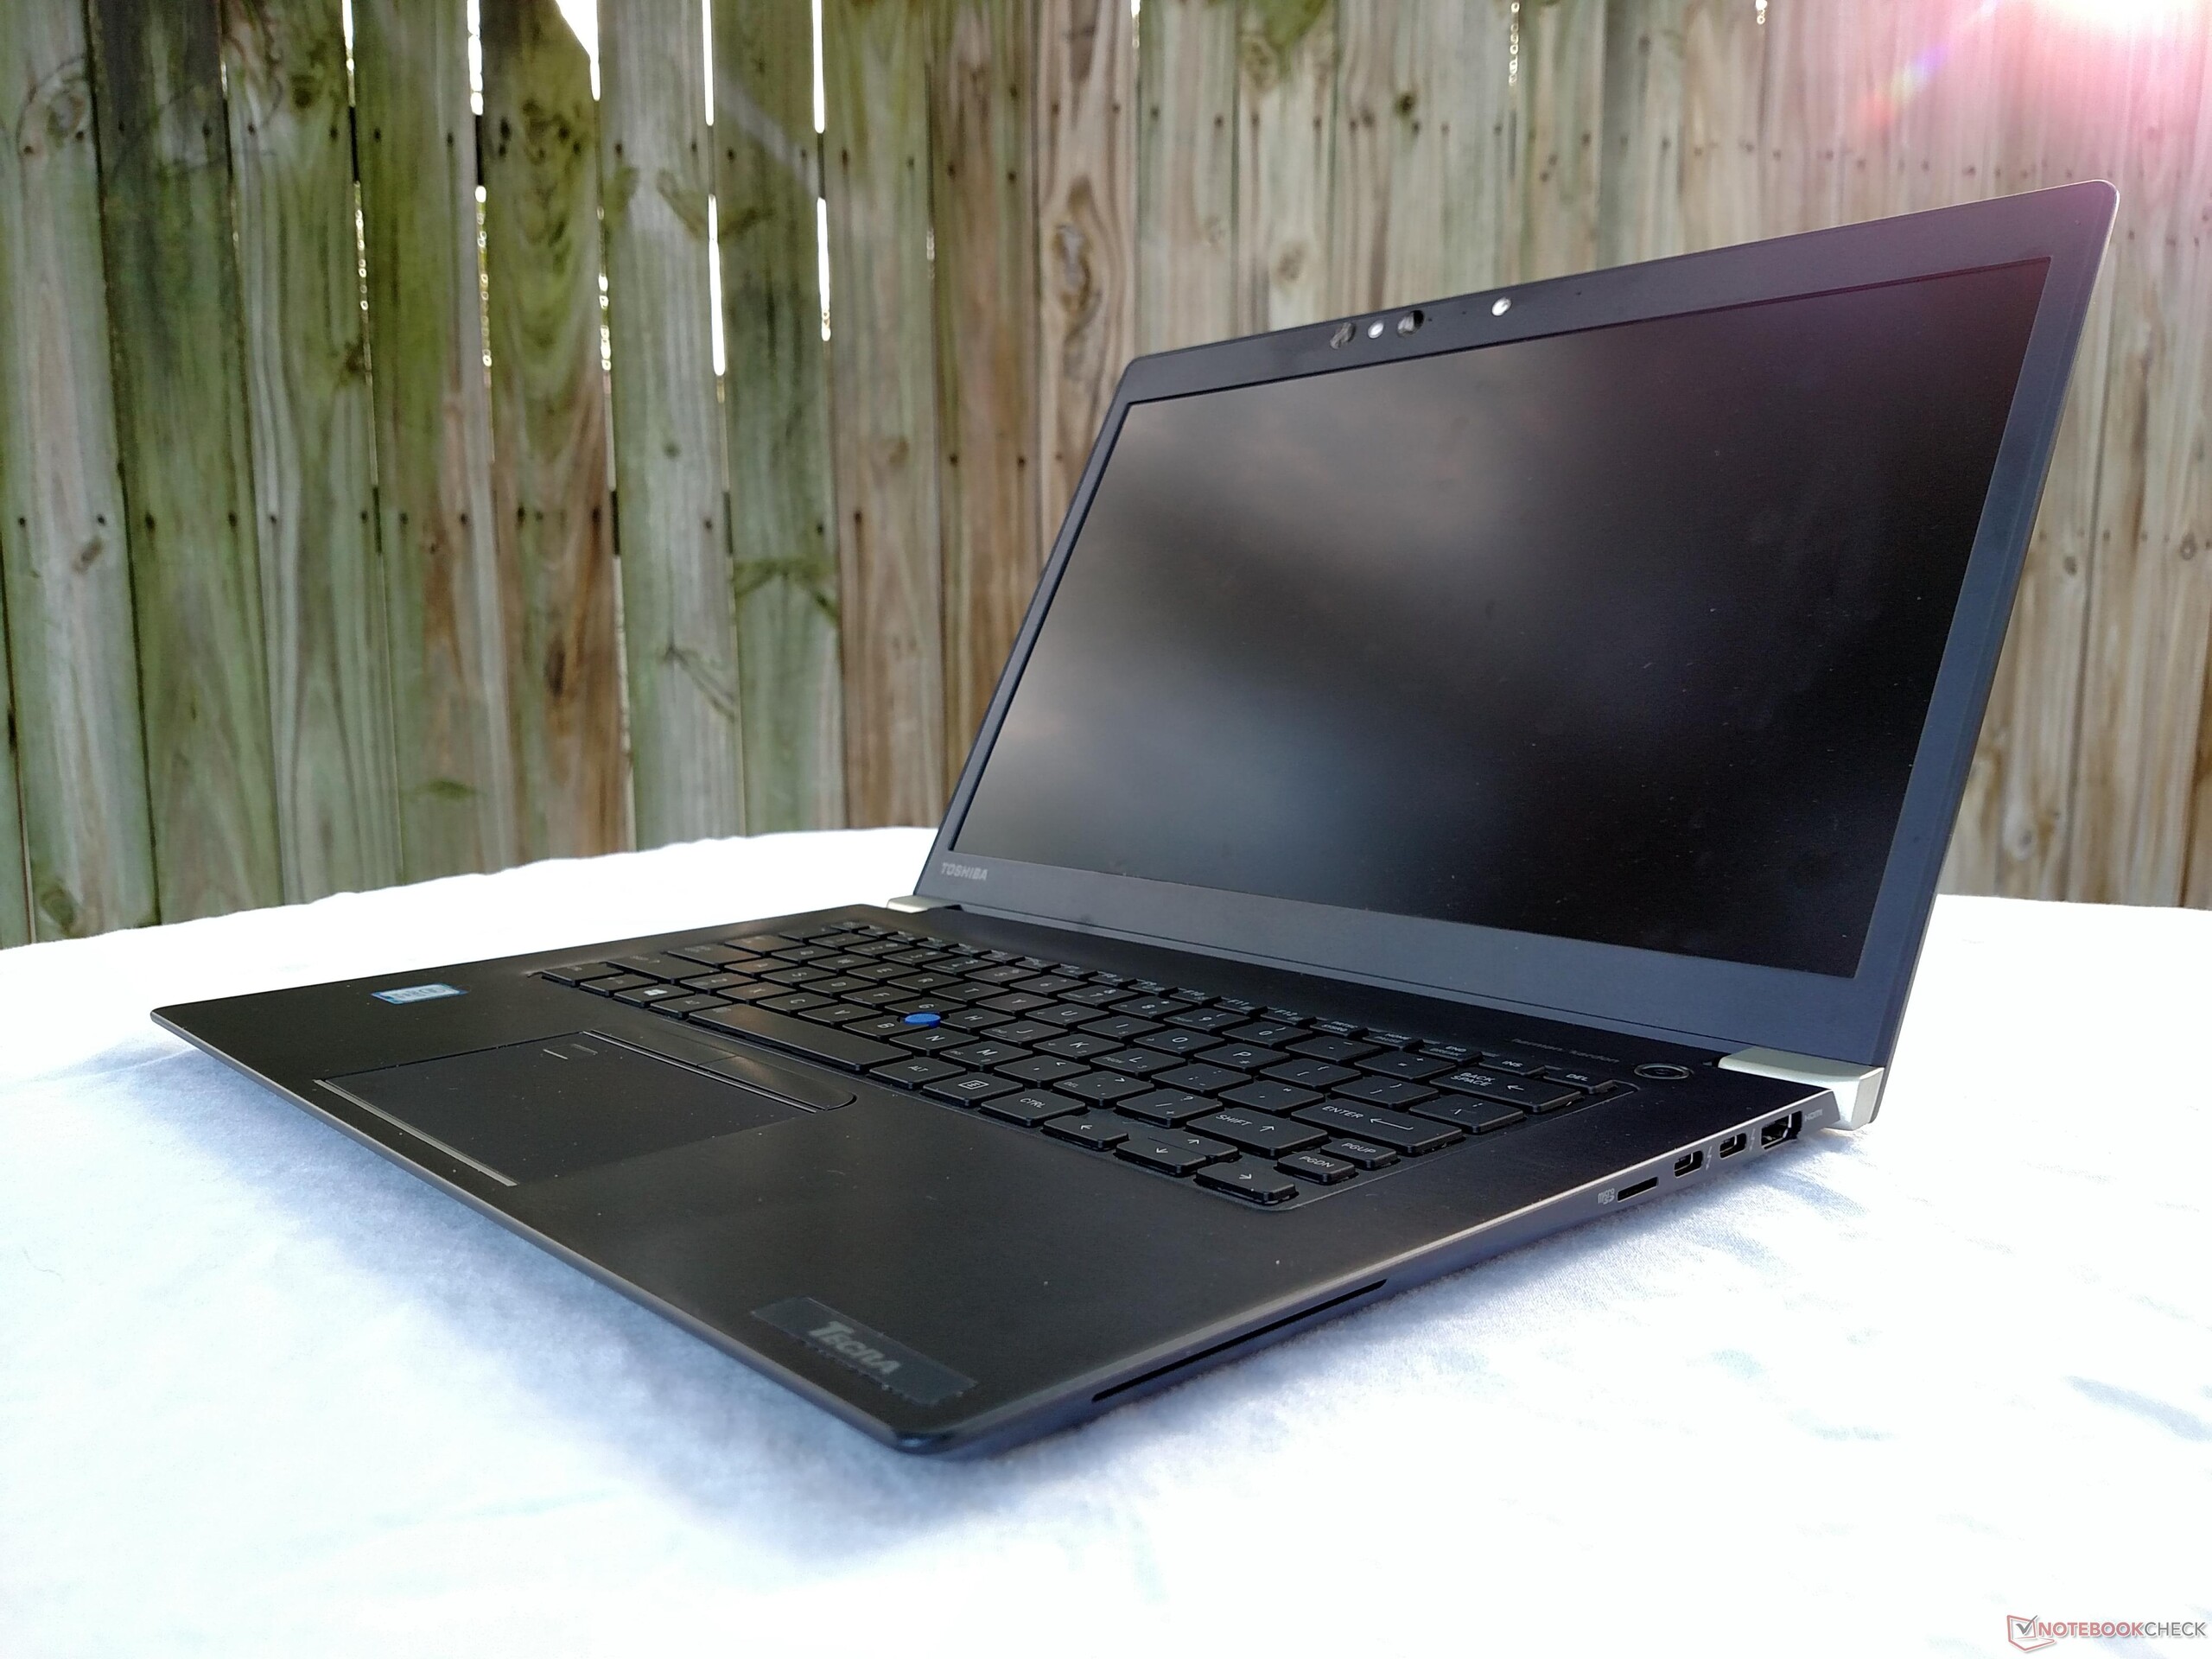
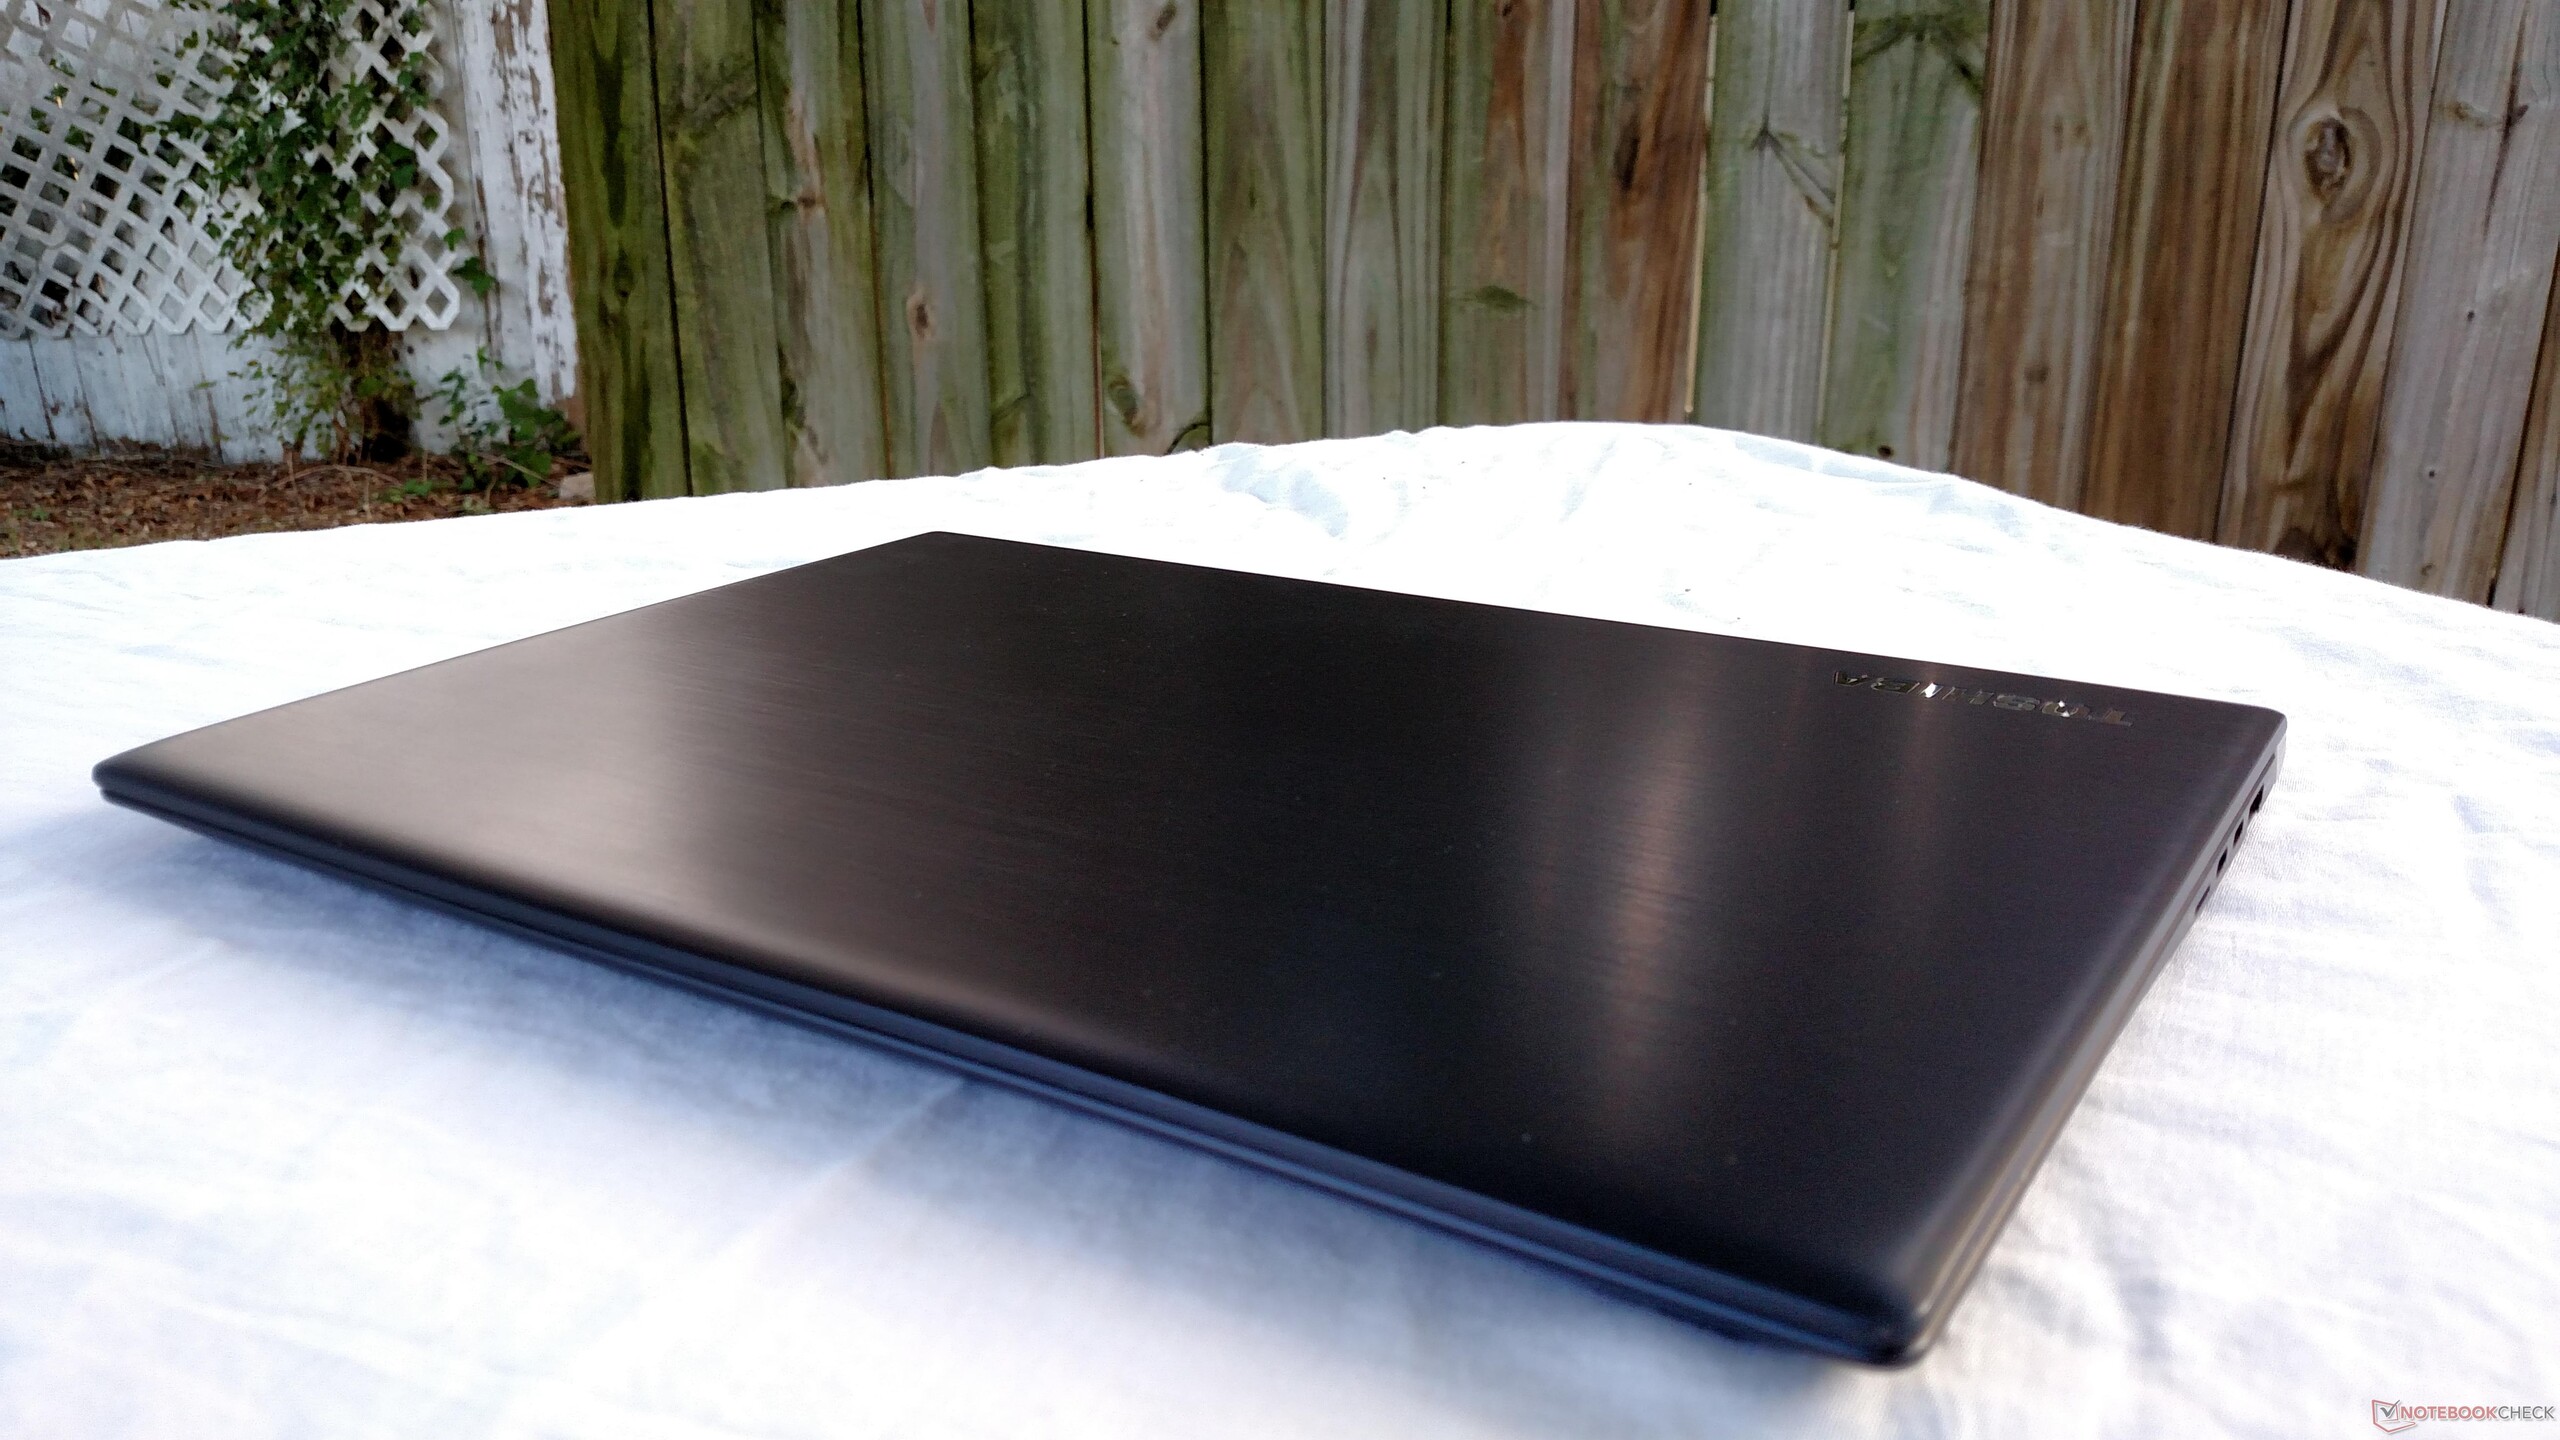
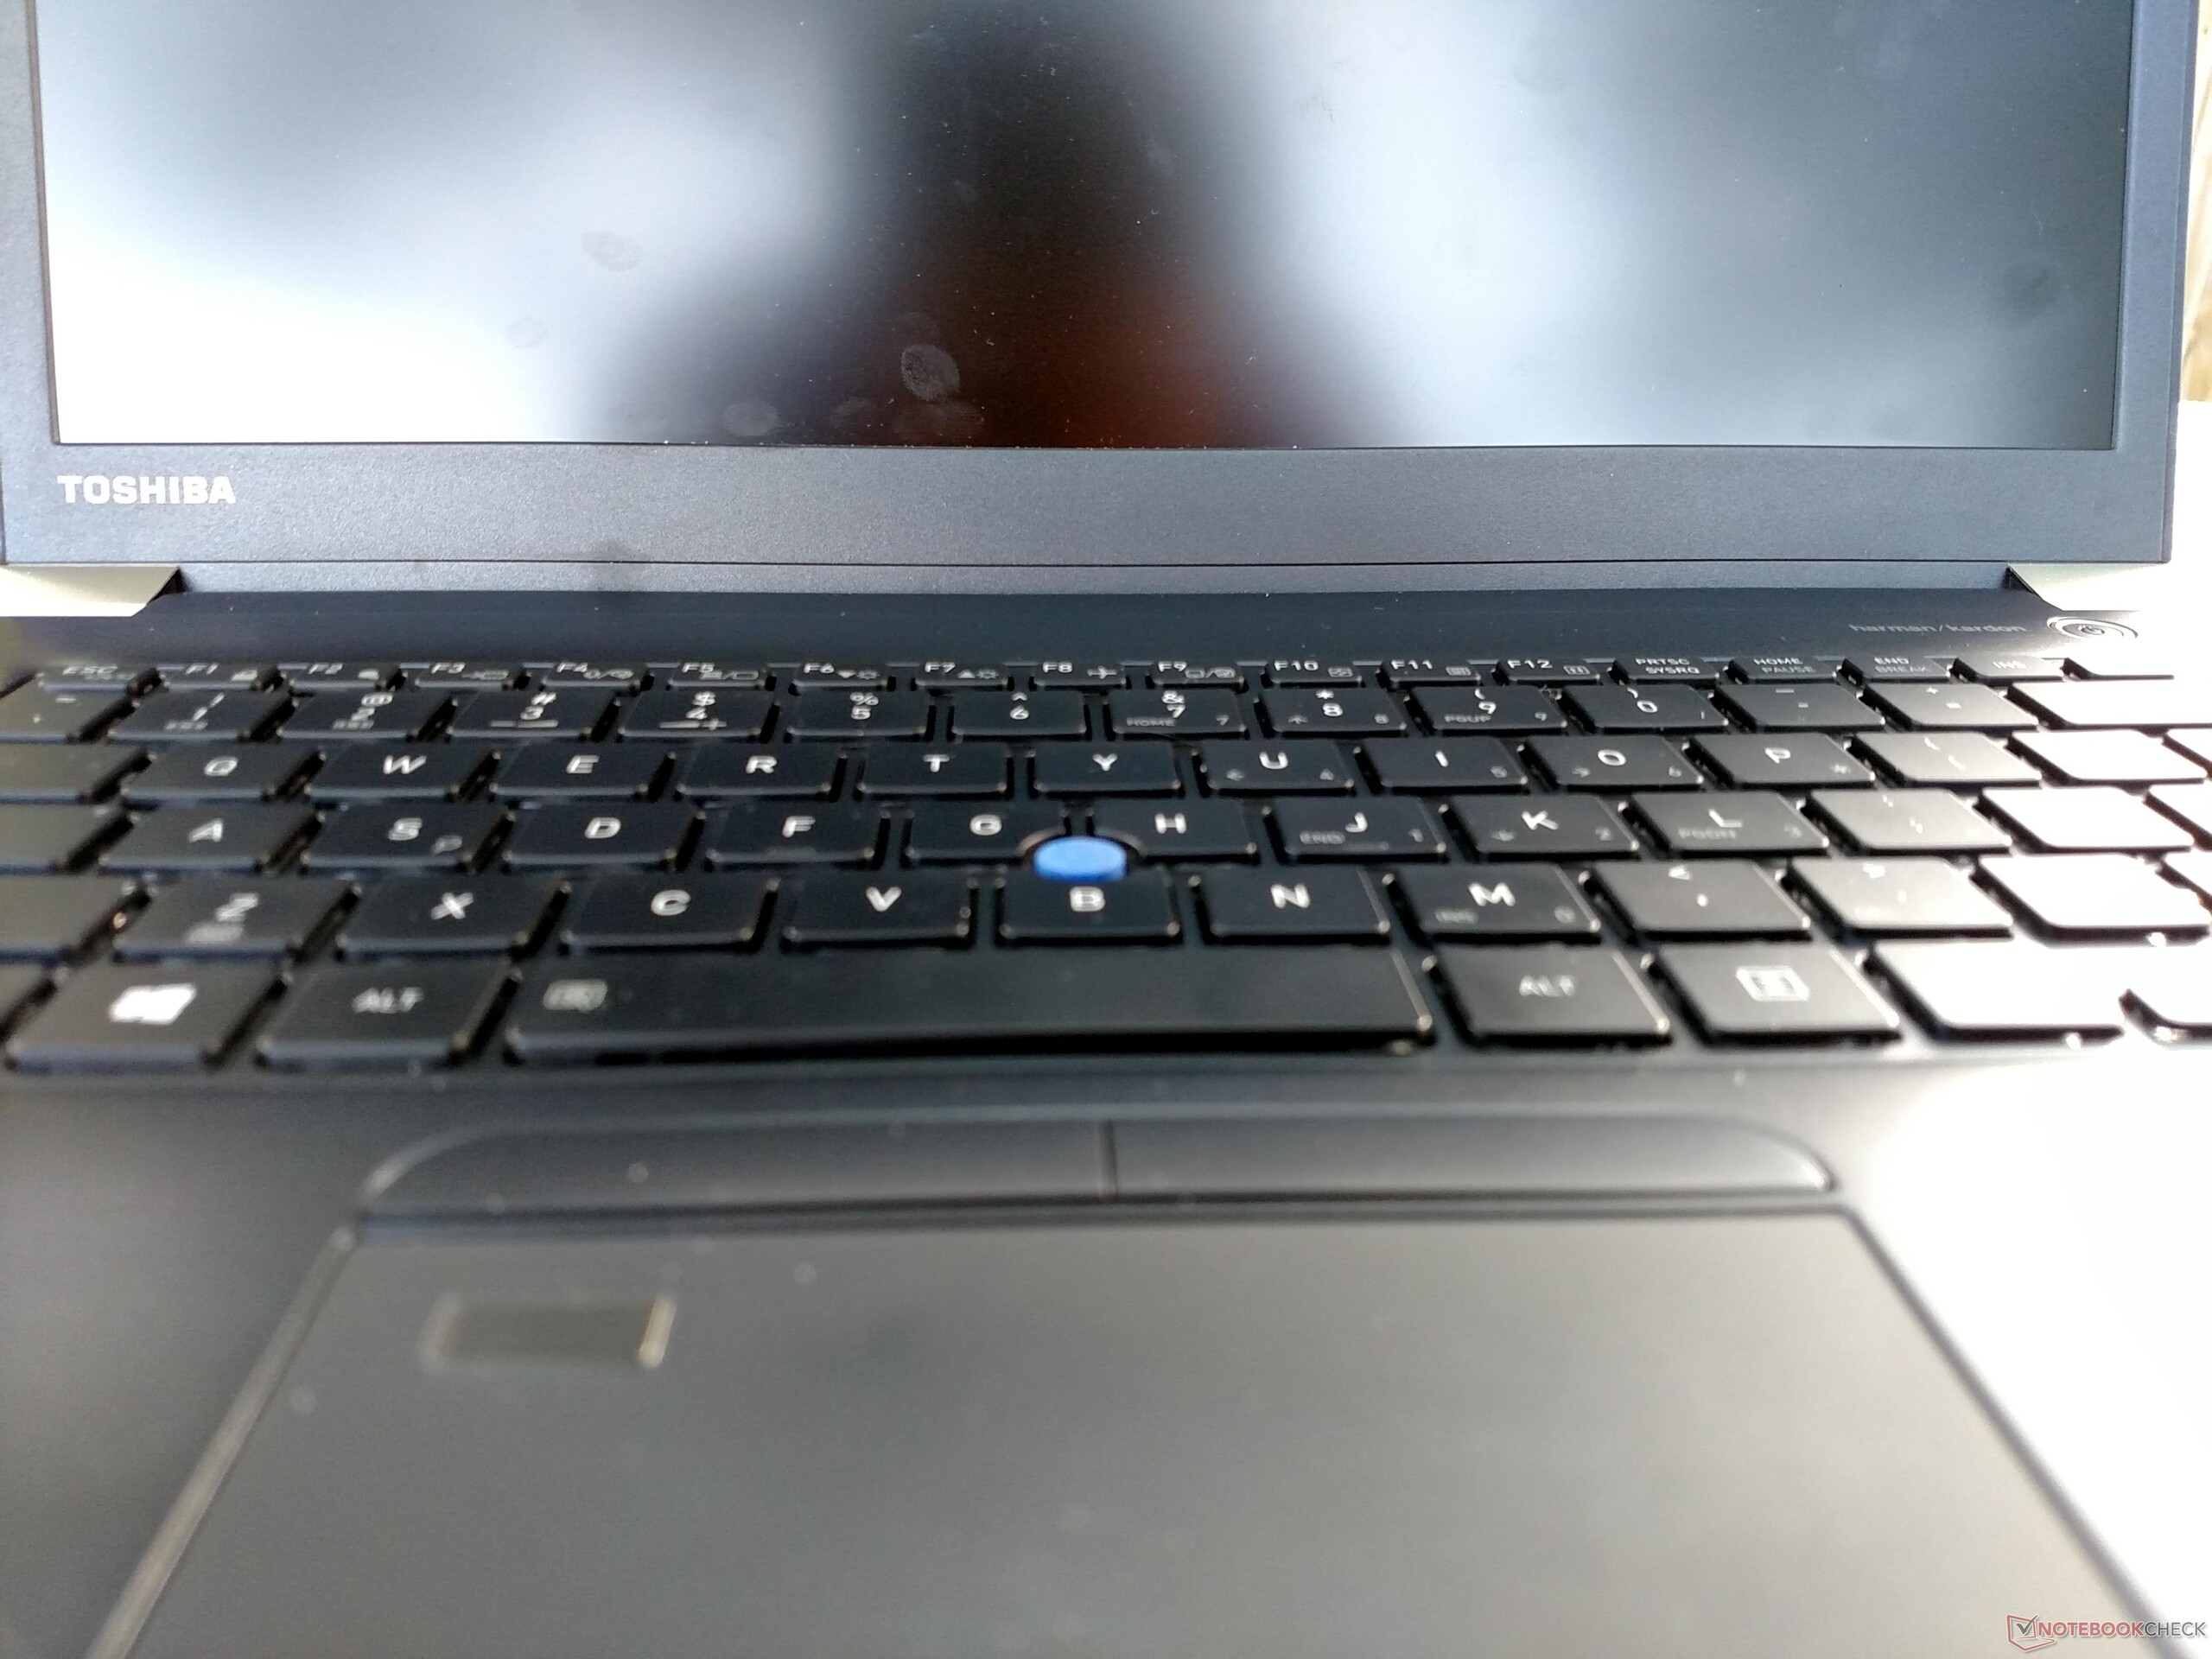
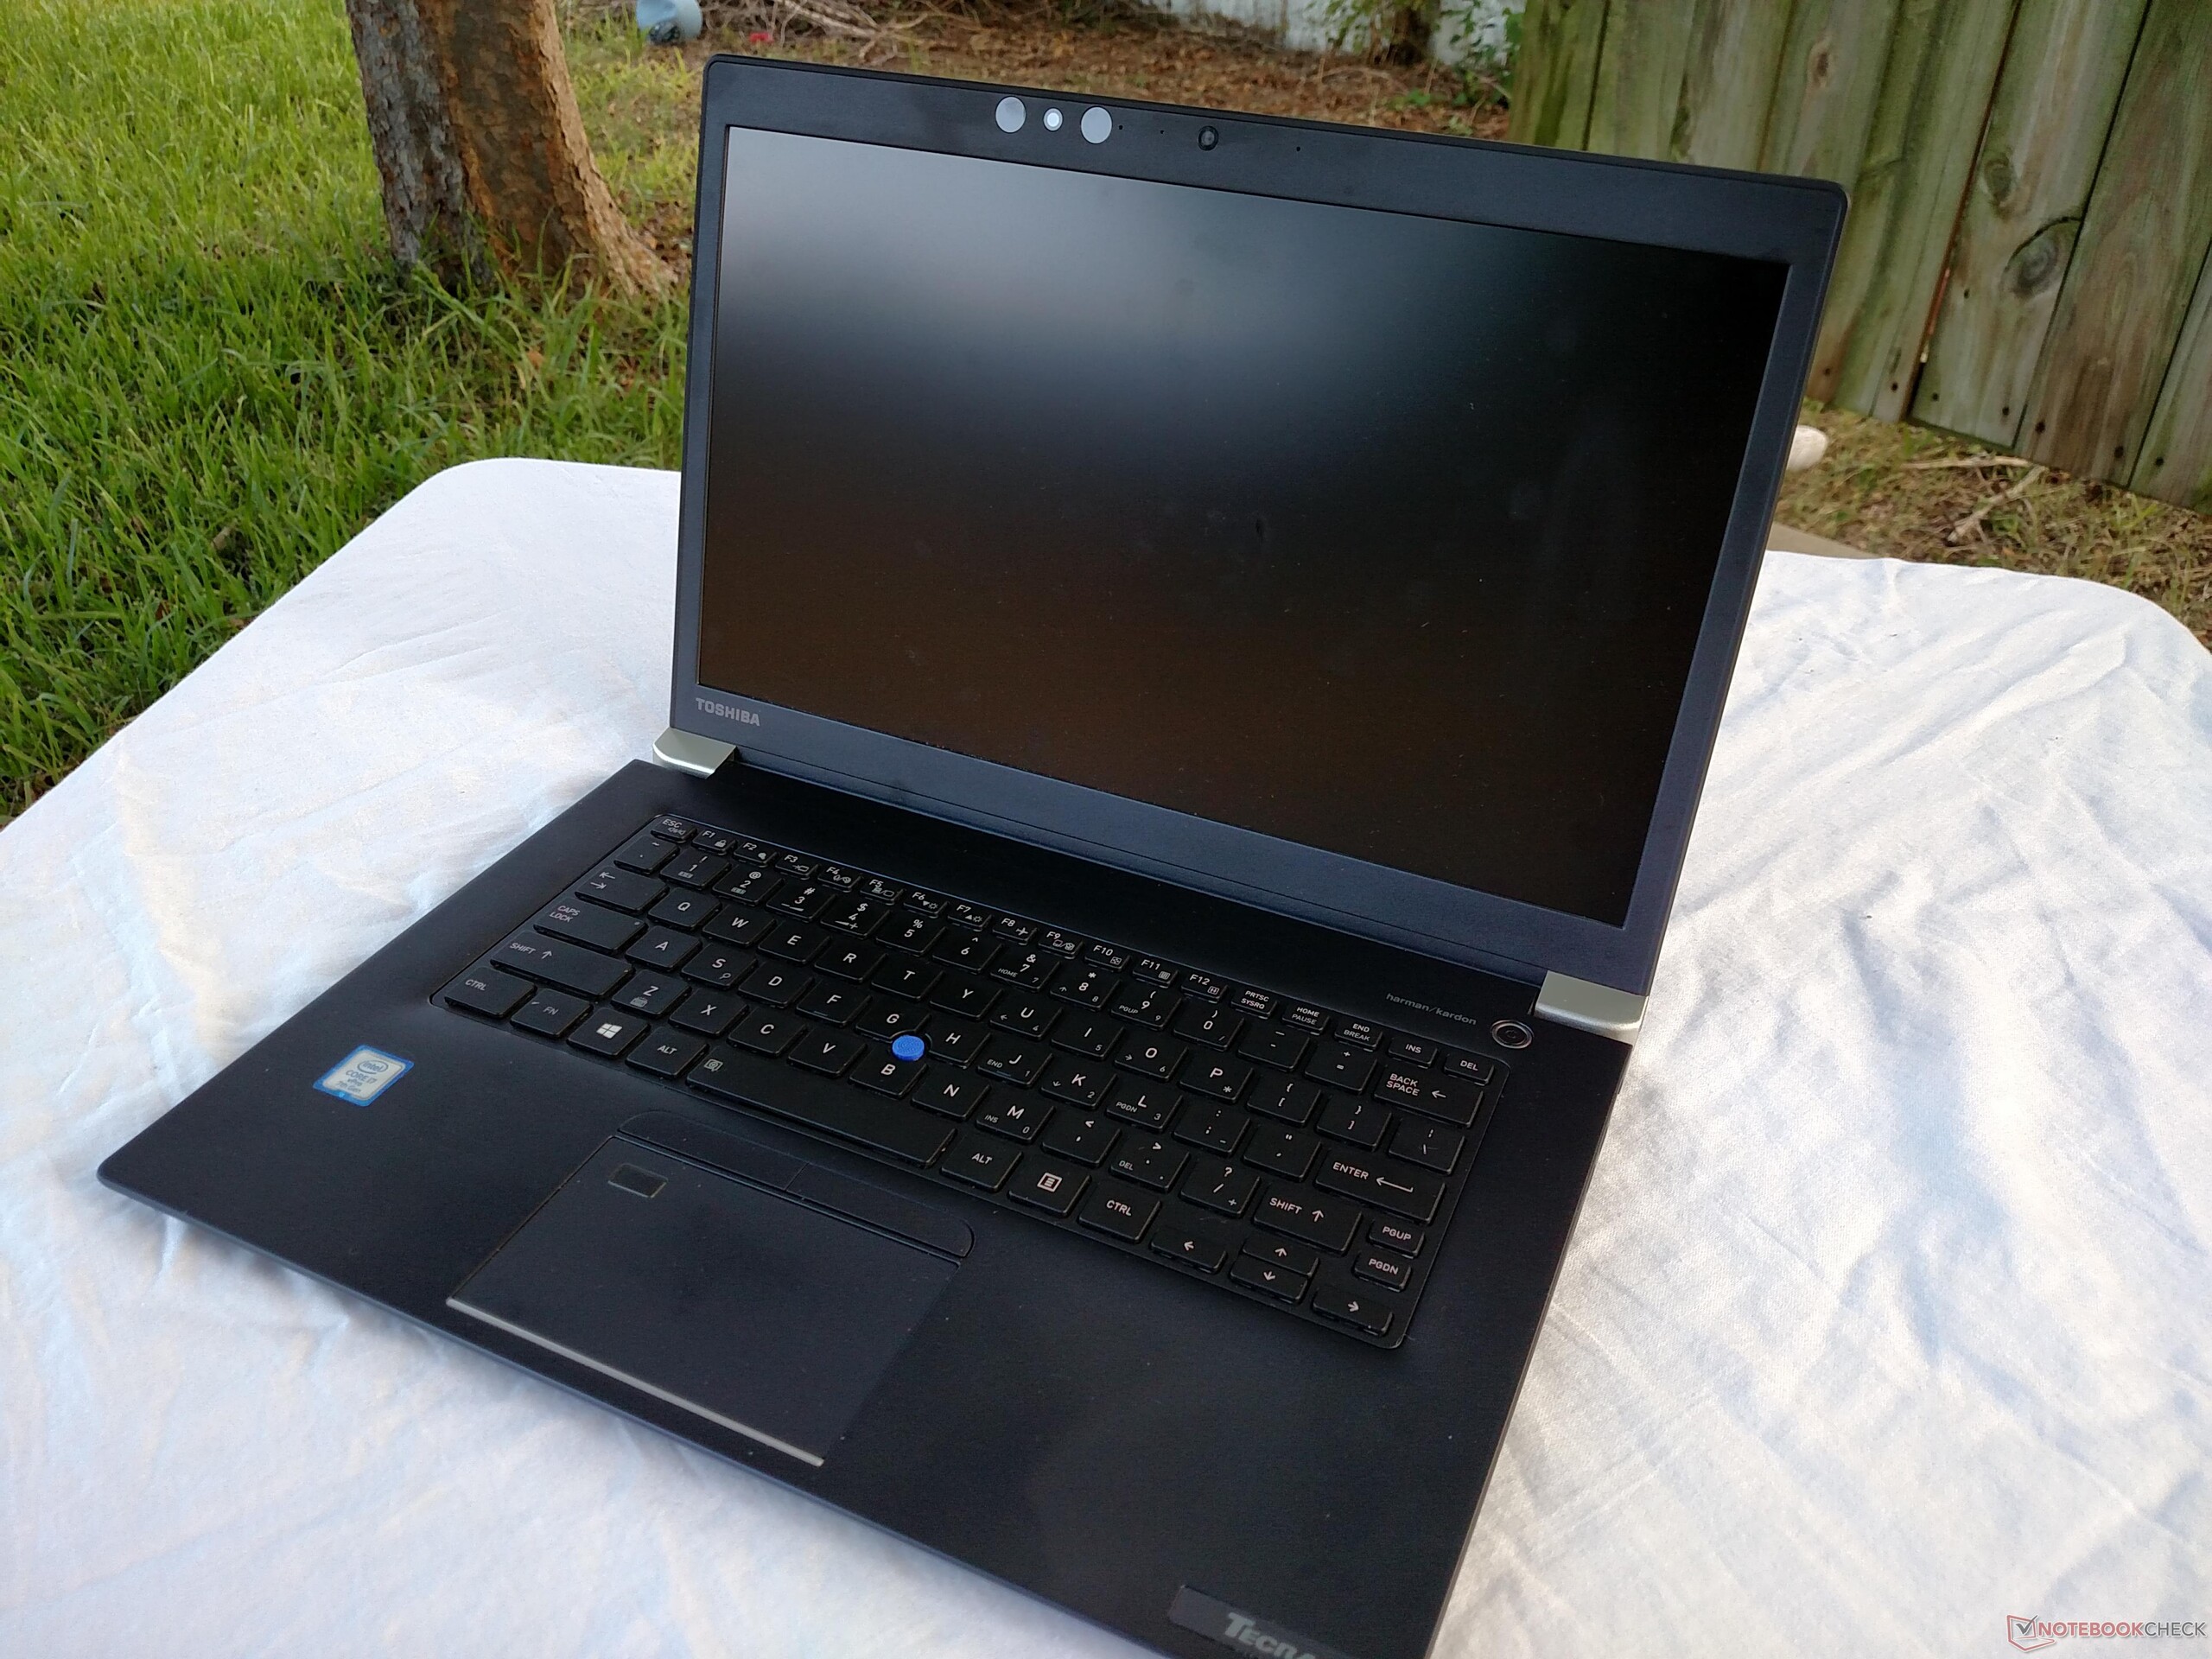
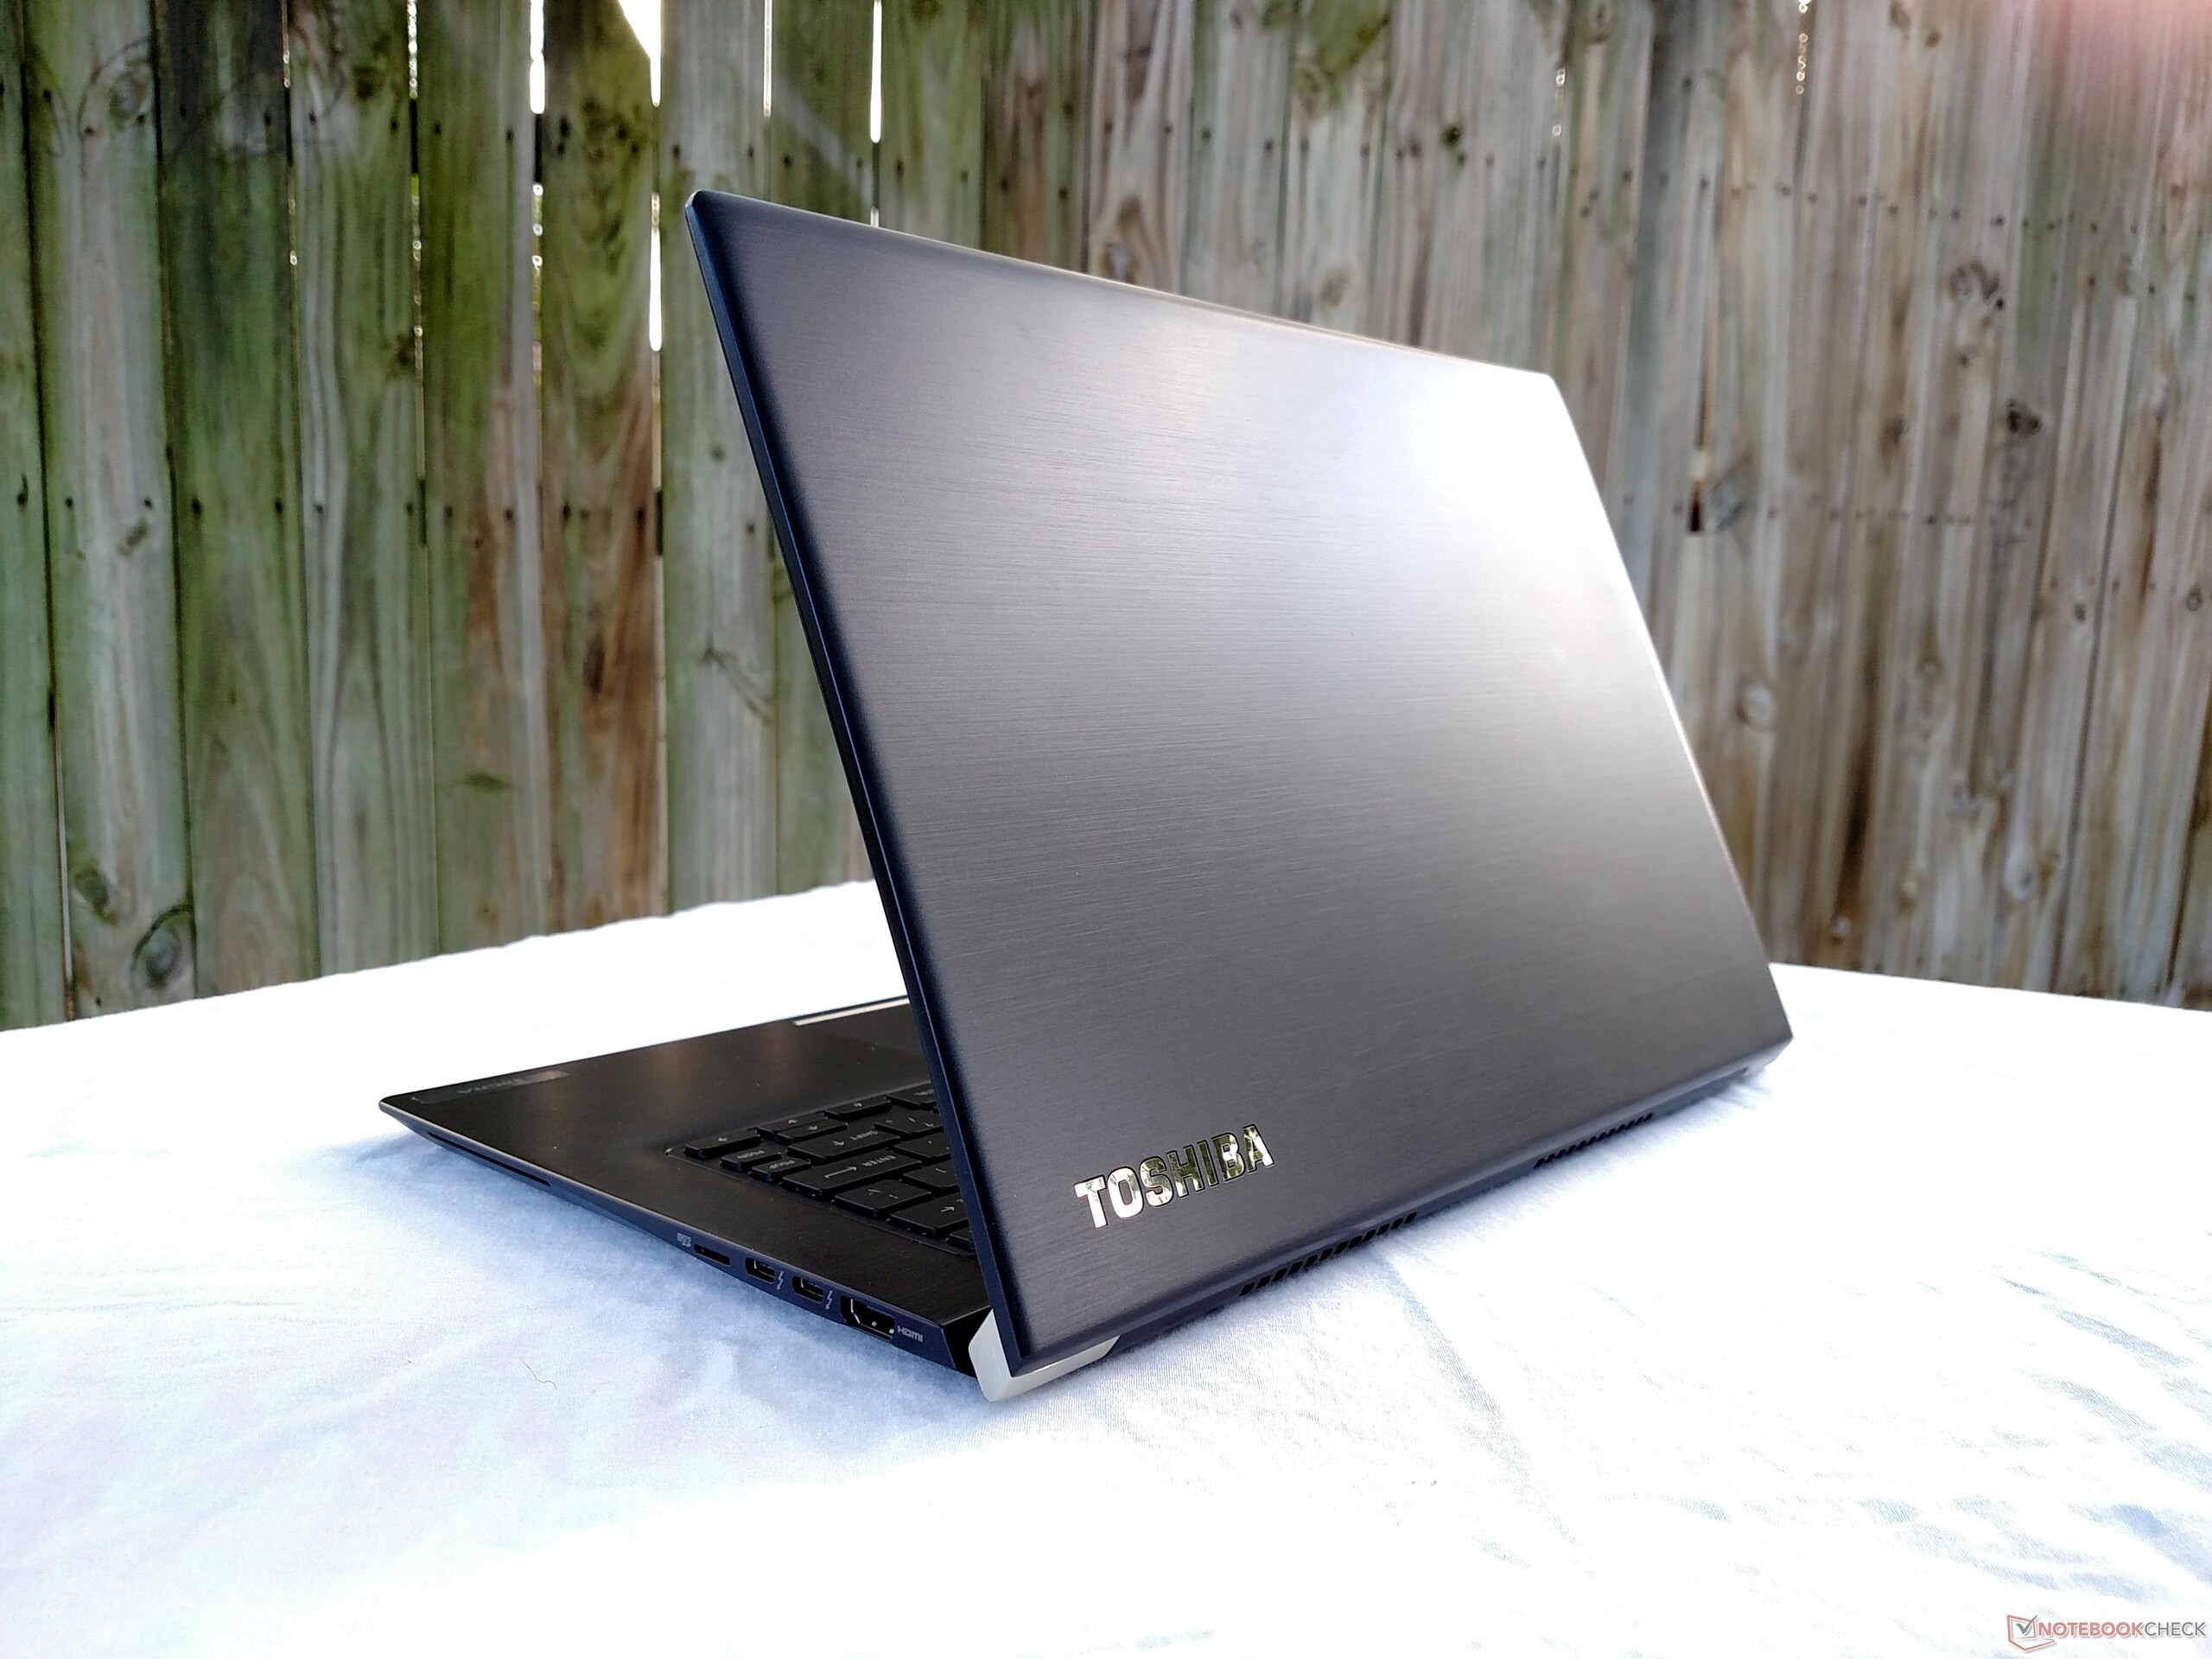
El Toshiba Tecra X40 es esencialmente el Portègè X30 con una pantalla de 14". Como tal, comparte muchas de las mismas fortalezas y debilidades de su hermano menor. El hermoso chasis está bien diseñado y muy resistente, sin dejar de ser bastante ligero para un portátil de 14". Los sensores biométricos son rápidos, fiables y fáciles de usar. El SSD NVMe es increíblemente rápido y hace mucho para que el sistema en su conjunto se sienta muy receptivo y ágil. Junto con el Core i7-7600U, el Tecra X40 es una máquina de business rápida en un cuerpo esbelto y sorprendente.
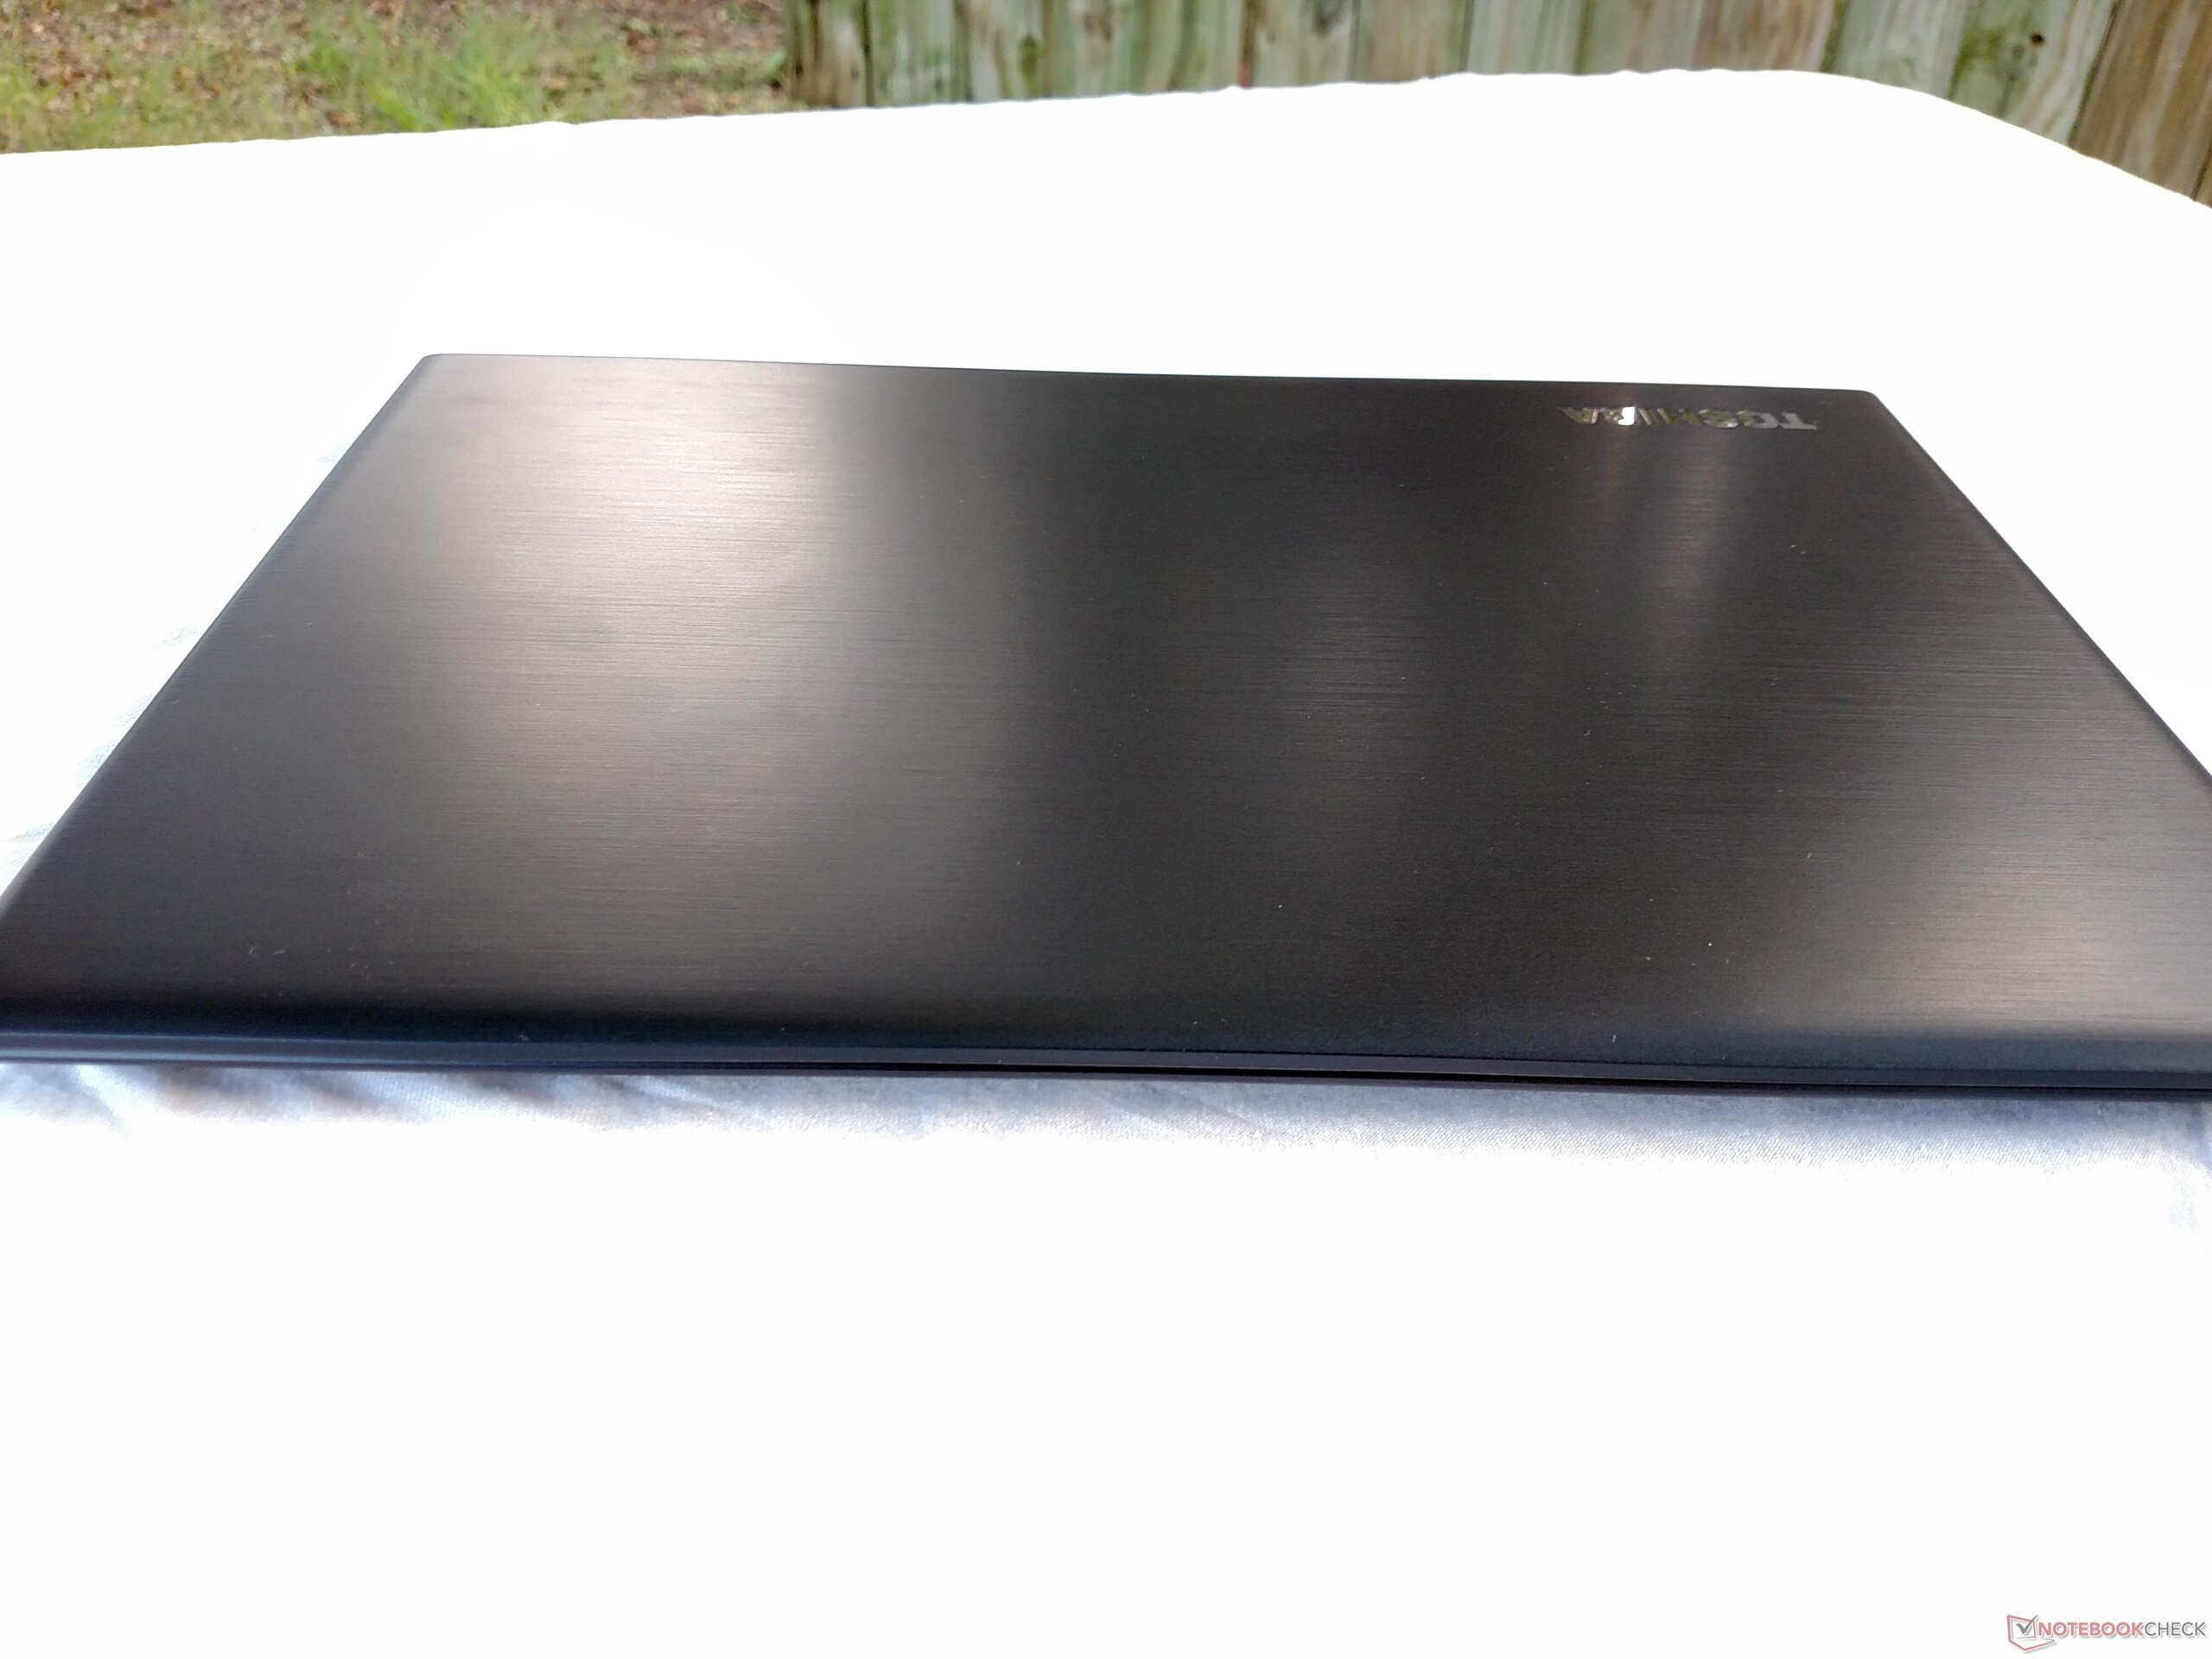
Sin embargo, la tapa se flexiona demasiado para nuestra comodidad y el teclado no es nuestro favorito. Las teclas ruidosas son distracción, y la barra de espacio cogió durante nuestro periodo de prueba la desagradable costumbre de chirriar al presionarla. La pantalla tampoco es tan vibrante o rica como otros portátiles de business, pero es más que aceptable para el uso diario.
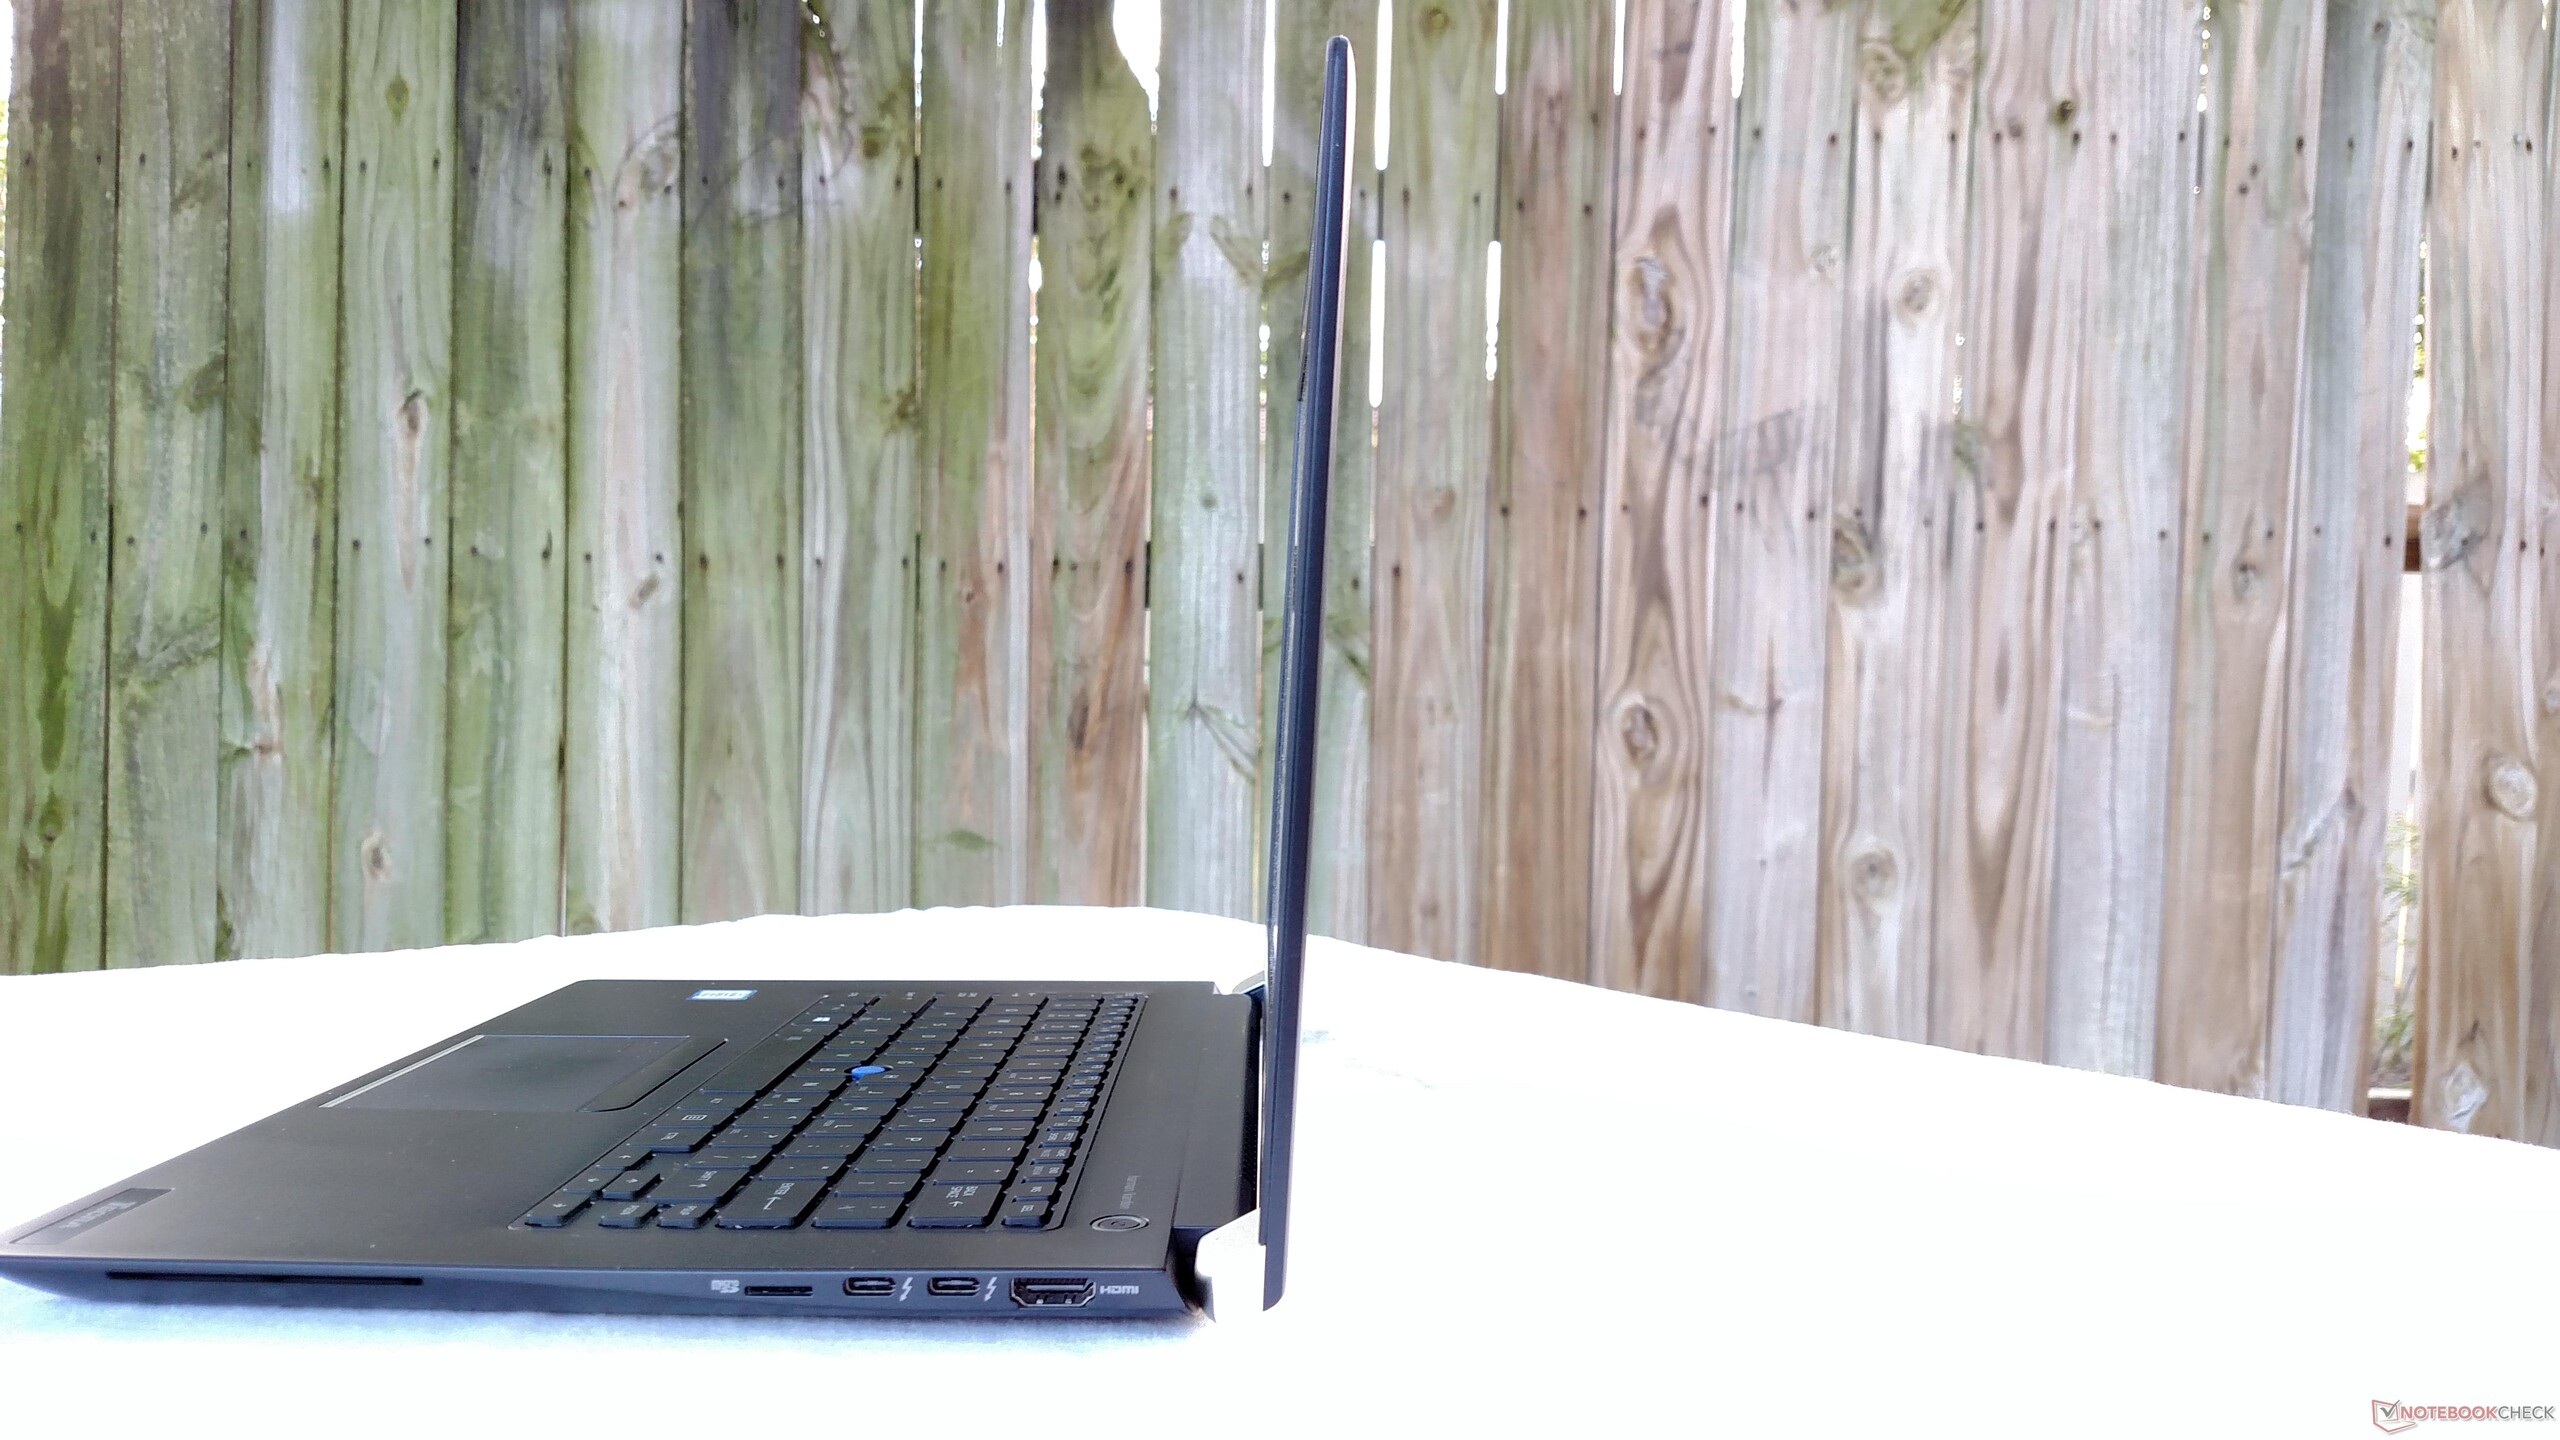
El Toshiba Tecra X40 es un portátil business competente de tamaño medio. No alcanza el nivel de la excelente Lenovo X1 Carbon, pero se acerca lo suficiente como para que las compensaciones puedan valer el menor costo. Si a los usuarios no les importa sacrificar unos cuantos puertos y pueden lidiar con un teclado de menor calidad, definitivamente vale la pena mirar el Tecra X40. El hecho de que también cuesta varios cientos de dólares menos que el X1 Carbon hace más atractiva la oferta.
Ésta es una versión acortada del análisis original. Puedes leer el análisis completo en inglés aquí.
Toshiba Tecra X40-D
- 08/28/2017 v6 (old)
Sam Medley
Price comparison
