Breve análisis del HP Envy 13-ad006ng (i7-7500U, MX150)
| SD Card Reader | |
| average JPG Copy Test (av. of 3 runs) | |
| Dell XPS 13 i7-8550U | |
| HP Envy 13-ad006ng (Toshiba Exceria Pro SDXC 64 GB UHS-II) | |
| Lenovo IdeaPad 710S Plus-13IKB | |
| maximum AS SSD Seq Read Test (1GB) | |
| Dell XPS 13 i7-8550U | |
| Lenovo IdeaPad 710S Plus-13IKB | |
| HP Envy 13-ad006ng (Toshiba Exceria Pro SDXC 64 GB UHS-II) | |
| Networking | |
| iperf3 transmit AX12 | |
| HP Envy 13-ad006ng | |
| Lenovo IdeaPad 710S Plus-13IKB | |
| Dell XPS 13 i7-8550U | |
| iperf3 receive AX12 | |
| Dell XPS 13 i7-8550U | |
| Lenovo IdeaPad 710S Plus-13IKB | |
| HP Envy 13-ad006ng | |
| |||||||||||||||||||||||||
iluminación: 83 %
Brillo con batería: 281 cd/m²
Contraste: 1222:1 (Negro: 0.23 cd/m²)
ΔE ColorChecker Calman: 4.83 | ∀{0.5-29.43 Ø4.71}
ΔE Greyscale Calman: 6.63 | ∀{0.09-98 Ø4.96}
86% sRGB (Argyll 1.6.3 3D)
56% AdobeRGB 1998 (Argyll 1.6.3 3D)
63.1% AdobeRGB 1998 (Argyll 3D)
86.3% sRGB (Argyll 3D)
66.8% Display P3 (Argyll 3D)
Gamma: 1.85
CCT: 6794 K
| HP Envy 13-ad006ng BOE070E, , 1920x1080, 13.3" | HP Envy 13-ad065nr LG Philips LGD0576, , 1920x1080, 13.3" | Dell XPS 13 9360 FHD i5 Sharp SHP1449 LQ133M1, , 1920x1080, 13.3" | Lenovo IdeaPad 710S Plus-13IKB LG Philips LP133WF4-SPB1 (LGD04EF), , 1920x1080, 13.3" | Asus Zenbook UX310UA-FC347T iGP AU Optronics AUO272D, , 1920x1080, 13.3" | Xiaomi Mi Notebook Air 13.3 2016 Samsung LTN133HL09-M01, , 1920x1080, 13.3" | |
|---|---|---|---|---|---|---|
| Display | -3% | -21% | -3% | -8% | 6% | |
| Display P3 Coverage (%) | 66.8 | 65.5 -2% | 48.94 -27% | 65.3 -2% | 64.2 -4% | 66 -1% |
| sRGB Coverage (%) | 86.3 | 83.8 -3% | 73.3 -15% | 82.9 -4% | 65.3 -24% | 95.5 11% |
| AdobeRGB 1998 Coverage (%) | 63.1 | 61.3 -3% | 50.5 -20% | 60.6 -4% | 65.3 3% | 67.8 7% |
| Response Times | 36% | 14% | 8% | 24% | 7% | |
| Response Time Grey 50% / Grey 80% * (ms) | 48 ? | 28 ? 42% | 32.8 ? 32% | 45 ? 6% | 40 ? 17% | 49 ? -2% |
| Response Time Black / White * (ms) | 32 ? | 22.4 ? 30% | 33.2 ? -4% | 29 ? 9% | 22 ? 31% | 27 ? 16% |
| PWM Frequency (Hz) | 1000 ? | 10200 ? | 200 ? | 50 ? | ||
| Screen | -4% | 4% | 4% | 6% | 18% | |
| Brightness middle (cd/m²) | 281 | 290 3% | 351.2 25% | 343 22% | 358 27% | 347 23% |
| Brightness (cd/m²) | 264 | 270 2% | 325 23% | 306 16% | 347 31% | 334 27% |
| Brightness Distribution (%) | 83 | 78 -6% | 89 7% | 81 -2% | 87 5% | 80 -4% |
| Black Level * (cd/m²) | 0.23 | 0.32 -39% | 0.195 15% | 0.3 -30% | 0.26 -13% | 0.27 -17% |
| Contrast (:1) | 1222 | 906 -26% | 1801 47% | 1143 -6% | 1377 13% | 1285 5% |
| Colorchecker dE 2000 * | 4.83 | 4.8 1% | 7.4 -53% | 4.73 2% | 5.22 -8% | 3.29 32% |
| Colorchecker dE 2000 max. * | 8.89 | 11.2 -26% | 9.08 -2% | 9.05 -2% | 9.19 -3% | 4.69 47% |
| Greyscale dE 2000 * | 6.63 | 2.8 58% | 6.71 -1% | 3.29 50% | 6.69 -1% | 3.62 45% |
| Gamma | 1.85 119% | 2.19 100% | 2.74 80% | 2.36 93% | 2.35 94% | 2.23 99% |
| CCT | 6794 96% | 6382 102% | 7222 90% | 6437 101% | 6745 96% | 7307 89% |
| Color Space (Percent of AdobeRGB 1998) (%) | 56 | 54.9 -2% | 50.48 -10% | 54 -4% | 59 5% | 62 11% |
| Color Space (Percent of sRGB) (%) | 86 | 83.5 -3% | 73.31 -15% | 83 -3% | 91 6% | 95 10% |
| Media total (Programa/Opciones) | 10% /
2% | -1% /
0% | 3% /
3% | 7% /
6% | 10% /
14% |
* ... más pequeño es mejor
Tiempos de respuesta del display
| ↔ Tiempo de respuesta de Negro a Blanco | ||
|---|---|---|
| 32 ms ... subida ↗ y bajada ↘ combinada | ↗ 17 ms subida | 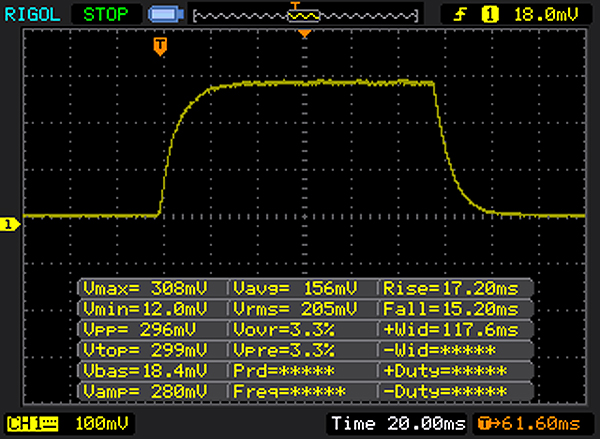 |
| ↘ 15 ms bajada | ||
| La pantalla mostró tiempos de respuesta lentos en nuestros tests y podría ser demasiado lenta para los jugones. En comparación, todos los dispositivos de prueba van de ##min### (mínimo) a 240 (máximo) ms. » 86 % de todos los dispositivos son mejores. Eso quiere decir que el tiempo de respuesta es peor que la media (19.8 ms) de todos los dispositivos testados. | ||
| ↔ Tiempo de respuesta 50% Gris a 80% Gris | ||
| 48 ms ... subida ↗ y bajada ↘ combinada | ↗ 23 ms subida | 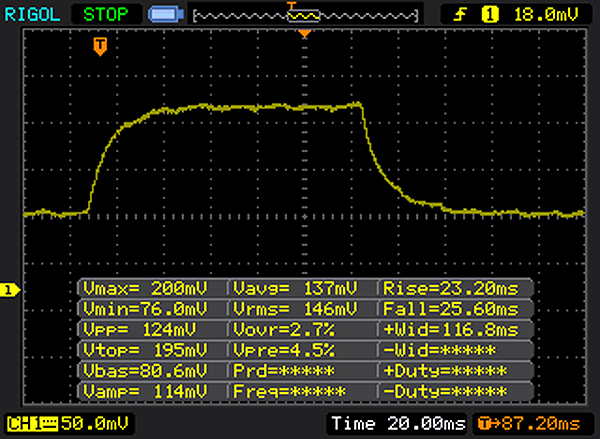 |
| ↘ 25 ms bajada | ||
| La pantalla mostró tiempos de respuesta lentos en nuestros tests y podría ser demasiado lenta para los jugones. En comparación, todos los dispositivos de prueba van de ##min### (mínimo) a 636 (máximo) ms. » 82 % de todos los dispositivos son mejores. Eso quiere decir que el tiempo de respuesta es peor que la media (30.9 ms) de todos los dispositivos testados. | ||
Parpadeo de Pantalla / PWM (Pulse-Width Modulation)
| Parpadeo de Pantalla / PWM detectado | 1000 Hz | ≤ 90 % de brillo | 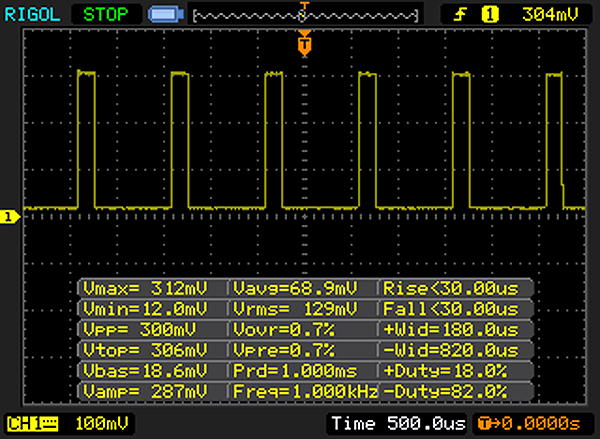 |
La retroiluminación del display parpadea a 1000 Hz (seguramente usa PWM - Pulse-Width Modulation) a un brillo del 90 % e inferior. Sobre este nivel de brillo no debería darse parpadeo / PWM. La frecuencia de 1000 Hz es bastante alta, por lo que la mayoría de gente sensible al parpadeo no debería ver parpadeo o tener fatiga visual. Comparación: 52 % de todos los dispositivos testados no usaron PWM para atenuar el display. Si se usó, medimos una media de 7741 (mínimo: 5 - máxmo: 343500) Hz. | |||
| Cinebench R15 | |
| CPU Single 64Bit | |
| Dell XPS 13 i7-8550U | |
| Asus Zenbook UX310UA-FC347T iGP | |
| HP Envy 13-ad006ng | |
| HP Envy 13-ad065nr | |
| Xiaomi Mi Notebook Air 13.3 2016 | |
| Lenovo IdeaPad 710S Plus-13IKB | |
| CPU Multi 64Bit | |
| Dell XPS 13 i7-8550U | |
| HP Envy 13-ad006ng | |
| Asus Zenbook UX310UA-FC347T iGP | |
| HP Envy 13-ad065nr | |
| Xiaomi Mi Notebook Air 13.3 2016 | |
| Lenovo IdeaPad 710S Plus-13IKB | |
| PCMark 8 | |
| Home Score Accelerated v2 | |
| Asus Zenbook UX310UA-FC347T iGP | |
| HP Envy 13-ad006ng | |
| HP Envy 13-ad065nr | |
| Dell XPS 13 i7-8550U | |
| Lenovo IdeaPad 710S Plus-13IKB | |
| Xiaomi Mi Notebook Air 13.3 2016 | |
| Work Score Accelerated v2 | |
| Asus Zenbook UX310UA-FC347T iGP | |
| HP Envy 13-ad006ng | |
| HP Envy 13-ad065nr | |
| Dell XPS 13 i7-8550U | |
| Xiaomi Mi Notebook Air 13.3 2016 | |
| Lenovo IdeaPad 710S Plus-13IKB | |
| PCMark 10 - Score | |
| HP Envy 13-ad006ng | |
| HP Envy 13-ad065nr | |
| PCMark 8 Home Score Accelerated v2 | 3773 puntos | |
| PCMark 8 Work Score Accelerated v2 | 4900 puntos | |
| PCMark 10 Score | 3282 puntos | |
ayuda | ||
| HP Envy 13-ad006ng Toshiba NVMe THNSN5256GPUK | Lenovo IdeaPad 710S Plus-13IKB Samsung PM961 NVMe MZVLW512HMJP | Xiaomi Mi Notebook Air 13.3 2016 Samsung PM951 NVMe MZVLV256 | Asus Zenbook UX310UA-FC347T iGP Micron SSD 1100 (MTFDDAV256TBN) | HP Envy 13-ad065nr SanDisk X400 SD8SN8U-128G-1006 | Dell XPS 13 i7-8550U Toshiba XG5 KXG50ZNV256G | |
|---|---|---|---|---|---|---|
| CrystalDiskMark 3.0 | 193% | 40% | 14% | |||
| Read Seq (MB/s) | 1019 | 1577 55% | 1209 19% | 489.4 -52% | ||
| Write Seq (MB/s) | 195.4 | 1472 653% | 314 61% | 431.6 121% | ||
| Read 512 (MB/s) | 735 | 1165 59% | 356.7 -51% | |||
| Write 512 (MB/s) | 172.3 | 1244 622% | 389.1 126% | |||
| Read 4k (MB/s) | 34.5 | 54.8 59% | 43.4 26% | 26.68 -23% | ||
| Write 4k (MB/s) | 109.4 | 121.5 11% | 153.4 40% | 88.7 -19% | ||
| Read 4k QD32 (MB/s) | 494.6 | 407.5 -18% | 487.6 -1% | 246.3 -50% | ||
| Write 4k QD32 (MB/s) | 161.3 | 321.4 99% | 312.2 94% | 251.5 56% | ||
| CrystalDiskMark 5.2 / 6 | -26% | 12% | ||||
| Write 4K (MB/s) | 155.7 | 57.5 -63% | 121.5 -22% | |||
| Read 4K (MB/s) | 26.5 | 29.34 11% | 24.92 -6% | |||
| Write Seq (MB/s) | 312.3 | 342.5 10% | 345 10% | |||
| Read Seq (MB/s) | 928 | 503 -46% | 1313 41% | |||
| Write 4K Q32T1 (MB/s) | 208.7 | 160.3 -23% | 346.1 66% | |||
| Read 4K Q32T1 (MB/s) | 478.8 | 285.7 -40% | 389.4 -19% | |||
| Write Seq Q32T1 (MB/s) | 305.1 | 330.8 8% | 334.7 10% | |||
| Read Seq Q32T1 (MB/s) | 1601 | 552 -66% | 1840 15% | |||
| Media total (Programa/Opciones) | 193% /
193% | 40% /
40% | 14% /
14% | -26% /
-26% | 12% /
12% |

| 3DMark 11 - 1280x720 Performance GPU | |
| HP Envy 13-ad006ng | |
| Lenovo IdeaPad 710S Plus-13IKB | |
| Xiaomi Mi Notebook Air 13.3 2016 | |
| Dell XPS 13 i7-8550U | |
| Asus Zenbook UX310UA-FC347T iGP | |
| HP Envy 13-ad065nr | |
| 3DMark | |
| 1280x720 Cloud Gate Standard Graphics | |
| HP Envy 13-ad006ng | |
| Lenovo IdeaPad 710S Plus-13IKB | |
| Xiaomi Mi Notebook Air 13.3 2016 | |
| Dell XPS 13 i7-8550U | |
| Asus Zenbook UX310UA-FC347T iGP | |
| HP Envy 13-ad065nr | |
| 1920x1080 Fire Strike Graphics | |
| HP Envy 13-ad006ng | |
| Xiaomi Mi Notebook Air 13.3 2016 | |
| Lenovo IdeaPad 710S Plus-13IKB | |
| Dell XPS 13 i7-8550U | |
| Asus Zenbook UX310UA-FC347T iGP | |
| HP Envy 13-ad065nr | |
| 3DMark 11 Performance | 3588 puntos | |
| 3DMark Cloud Gate Standard Score | 9800 puntos | |
| 3DMark Fire Strike Score | 2528 puntos | |
ayuda | ||
| The Witcher 3 - 1366x768 Medium Graphics & Postprocessing | |
| Dell XPS 15 2017 9560 (7300HQ, Full-HD) | |
| HP Envy 13-ad006ng | |
| Lenovo IdeaPad 710S Plus-13IKB | |
| Asus Zenbook UX310UA-FC347T iGP | |
| BioShock Infinite - 1366x768 High Preset | |
| HP Envy 13-ad006ng | |
| Xiaomi Mi Notebook Air 13.3 2016 | |
| Dell XPS 13 i7-8550U | |
| Asus Zenbook UX310UA-FC347T iGP | |
| HP Envy 13-ad065nr | |
| bajo | medio | alto | ultra | |
|---|---|---|---|---|
| BioShock Infinite (2013) | 173.9 | 94 | 79 | 29.72 |
| Company of Heroes 2 (2013) | 46.46 | 38.73 | 27.87 | 9.9 |
| The Witcher 3 (2015) | 45.13 | 27.64 | 14.47 | 9 |
| Rise of the Tomb Raider (2016) | 60 | 34.06 | 17 |
Ruido
| Ocioso |
| 30.5 / 30.5 / 30.5 dB(A) |
| Carga |
| 37.3 / 34.2 dB(A) |
 | ||
30 dB silencioso 40 dB(A) audible 50 dB(A) ruidosamente alto |
||
min: | ||
(±) La temperatura máxima en la parte superior es de 41.6 °C / 107 F, frente a la media de 35.9 °C / 97 F, que oscila entre 21.4 y 59 °C para la clase Subnotebook.
(+) El fondo se calienta hasta un máximo de 33.4 °C / 92 F, frente a la media de 39.2 °C / 103 F
(+) En reposo, la temperatura media de la parte superior es de 22.4 °C / 72# F, frente a la media del dispositivo de 30.8 °C / 87 F.
(±) Jugando a The Witcher 3, la temperatura media de la parte superior es de 35 °C / 95 F, frente a la media del dispositivo de 30.8 °C / 87 F.
(+) El reposamanos y el panel táctil están a una temperatura inferior a la de la piel, con un máximo de 30.6 °C / 87.1 F y, por tanto, son fríos al tacto.
(-) La temperatura media de la zona del reposamanos de dispositivos similares fue de 28.2 °C / 82.8 F (-2.4 °C / -4.3 F).
HP Envy 13-ad006ng análisis de audio
(-) | altavoces no muy altos (#70.1 dB)
Graves 100 - 315 Hz
(-) | casi sin bajos - de media 27.6% inferior a la mediana
(±) | la linealidad de los graves es media (9.8% delta a frecuencia anterior)
Medios 400 - 2000 Hz
(+) | medios equilibrados - a sólo 2.2% de la mediana
(+) | los medios son lineales (6.1% delta a la frecuencia anterior)
Altos 2 - 16 kHz
(+) | máximos equilibrados - a sólo 2% de la mediana
(+) | los máximos son lineales (3.7% delta a la frecuencia anterior)
Total 100 - 16.000 Hz
(±) | la linealidad del sonido global es media (20.2% de diferencia con la mediana)
En comparación con la misma clase
» 64% de todos los dispositivos probados de esta clase eran mejores, 9% similares, 27% peores
» El mejor tuvo un delta de 5%, la media fue 18%, el peor fue ###max##%
En comparación con todos los dispositivos probados
» 53% de todos los dispositivos probados eran mejores, 8% similares, 39% peores
» El mejor tuvo un delta de 4%, la media fue 23%, el peor fue ###max##%
Dell XPS 13 i7-8550U análisis de audio
(-) | altavoces no muy altos (#66.8 dB)
Graves 100 - 315 Hz
(+) | buen bajo - sólo 4.5% lejos de la mediana
(±) | la linealidad de los graves es media (8.2% delta a frecuencia anterior)
Medios 400 - 2000 Hz
(±) | medias más altas - de media 5% más altas que la mediana
(+) | los medios son lineales (5.8% delta a la frecuencia anterior)
Altos 2 - 16 kHz
(+) | máximos equilibrados - a sólo 3% de la mediana
(±) | la linealidad de los máximos es media (14.5% delta a frecuencia anterior)
Total 100 - 16.000 Hz
(±) | la linealidad del sonido global es media (17.2% de diferencia con la mediana)
En comparación con la misma clase
» 44% de todos los dispositivos probados de esta clase eran mejores, 9% similares, 46% peores
» El mejor tuvo un delta de 5%, la media fue 18%, el peor fue ###max##%
En comparación con todos los dispositivos probados
» 32% de todos los dispositivos probados eran mejores, 8% similares, 60% peores
» El mejor tuvo un delta de 4%, la media fue 23%, el peor fue ###max##%
| Off / Standby | |
| Ocioso | |
| Carga |
|
Clave:
min: | |
| HP Envy 13-ad006ng i7-7500U, GeForce MX150, Toshiba NVMe THNSN5256GPUK, IPS LED, 1920x1080, 13.3" | HP Envy 13-ad065nr i5-7200U, HD Graphics 620, SanDisk X400 SD8SN8U-128G-1006, IPS, 1920x1080, 13.3" | Lenovo IdeaPad 710S Plus-13IKB i7-7500U, GeForce 940MX, Samsung PM961 NVMe MZVLW512HMJP, IPS, 1920x1080, 13.3" | Asus Zenbook UX310UA-FC347T iGP i7-7500U, HD Graphics 620, Micron SSD 1100 (MTFDDAV256TBN), IPS, LED, 1920x1080, 13.3" | Dell XPS 13 i7-8550U i5-8550U, UHD Graphics 620, Toshiba XG5 KXG50ZNV256G, IGZO IPS, 3200x1800, 13.3" | Xiaomi Mi Notebook Air 13.3 2016 6200U, GeForce 940MX, Samsung PM951 NVMe MZVLV256, IPS, 1920x1080, 13.3" | |
|---|---|---|---|---|---|---|
| Power Consumption | 17% | -10% | 2% | 0% | -10% | |
| Idle Minimum * (Watt) | 2.8 | 2.8 -0% | 3.6 -29% | 3.5 -25% | 4.1 -46% | 4 -43% |
| Idle Average * (Watt) | 5.8 | 5.8 -0% | 7.4 -28% | 6.6 -14% | 5.8 -0% | 6.6 -14% |
| Idle Maximum * (Watt) | 7.7 | 6.4 17% | 8.7 -13% | 7.5 3% | 6 22% | 7.4 4% |
| Load Average * (Watt) | 48 | 31.3 35% | 43 10% | 34.7 28% | 42.5 11% | 41.7 13% |
| Witcher 3 ultra * (Watt) | 35 | |||||
| Load Maximum * (Watt) | 48 | 31.7 34% | 42 12% | 39.6 17% | 41.4 14% | 52.4 -9% |
* ... más pequeño es mejor
| HP Envy 13-ad006ng i7-7500U, GeForce MX150, 51 Wh | HP Envy 13-ad065nr i5-7200U, HD Graphics 620, 53.6 Wh | Lenovo IdeaPad 710S Plus-13IKB i7-7500U, GeForce 940MX, 46 Wh | Asus Zenbook UX310UA-FC347T iGP i7-7500U, HD Graphics 620, 48 Wh | Dell XPS 13 i7-8550U i5-8550U, UHD Graphics 620, 60 Wh | Xiaomi Mi Notebook Air 13.3 2016 6200U, GeForce 940MX, 40 Wh | |
|---|---|---|---|---|---|---|
| Duración de Batería | 21% | -36% | -1% | 17% | -22% | |
| Reader / Idle (h) | 20 | 24.8 24% | 7.8 -61% | 16.1 -19% | 18.5 -7% | 12 -40% |
| H.264 (h) | 7.9 | 6.9 -13% | 7.1 -10% | |||
| WiFi v1.3 (h) | 7.1 | 9.5 34% | 5.6 -21% | 9.6 35% | 9.8 38% | 6.5 -8% |
| Load (h) | 2 | 2.1 5% | 1.5 -25% | 1.9 -5% | 2.4 20% | 1.4 -30% |
Pro
Contra
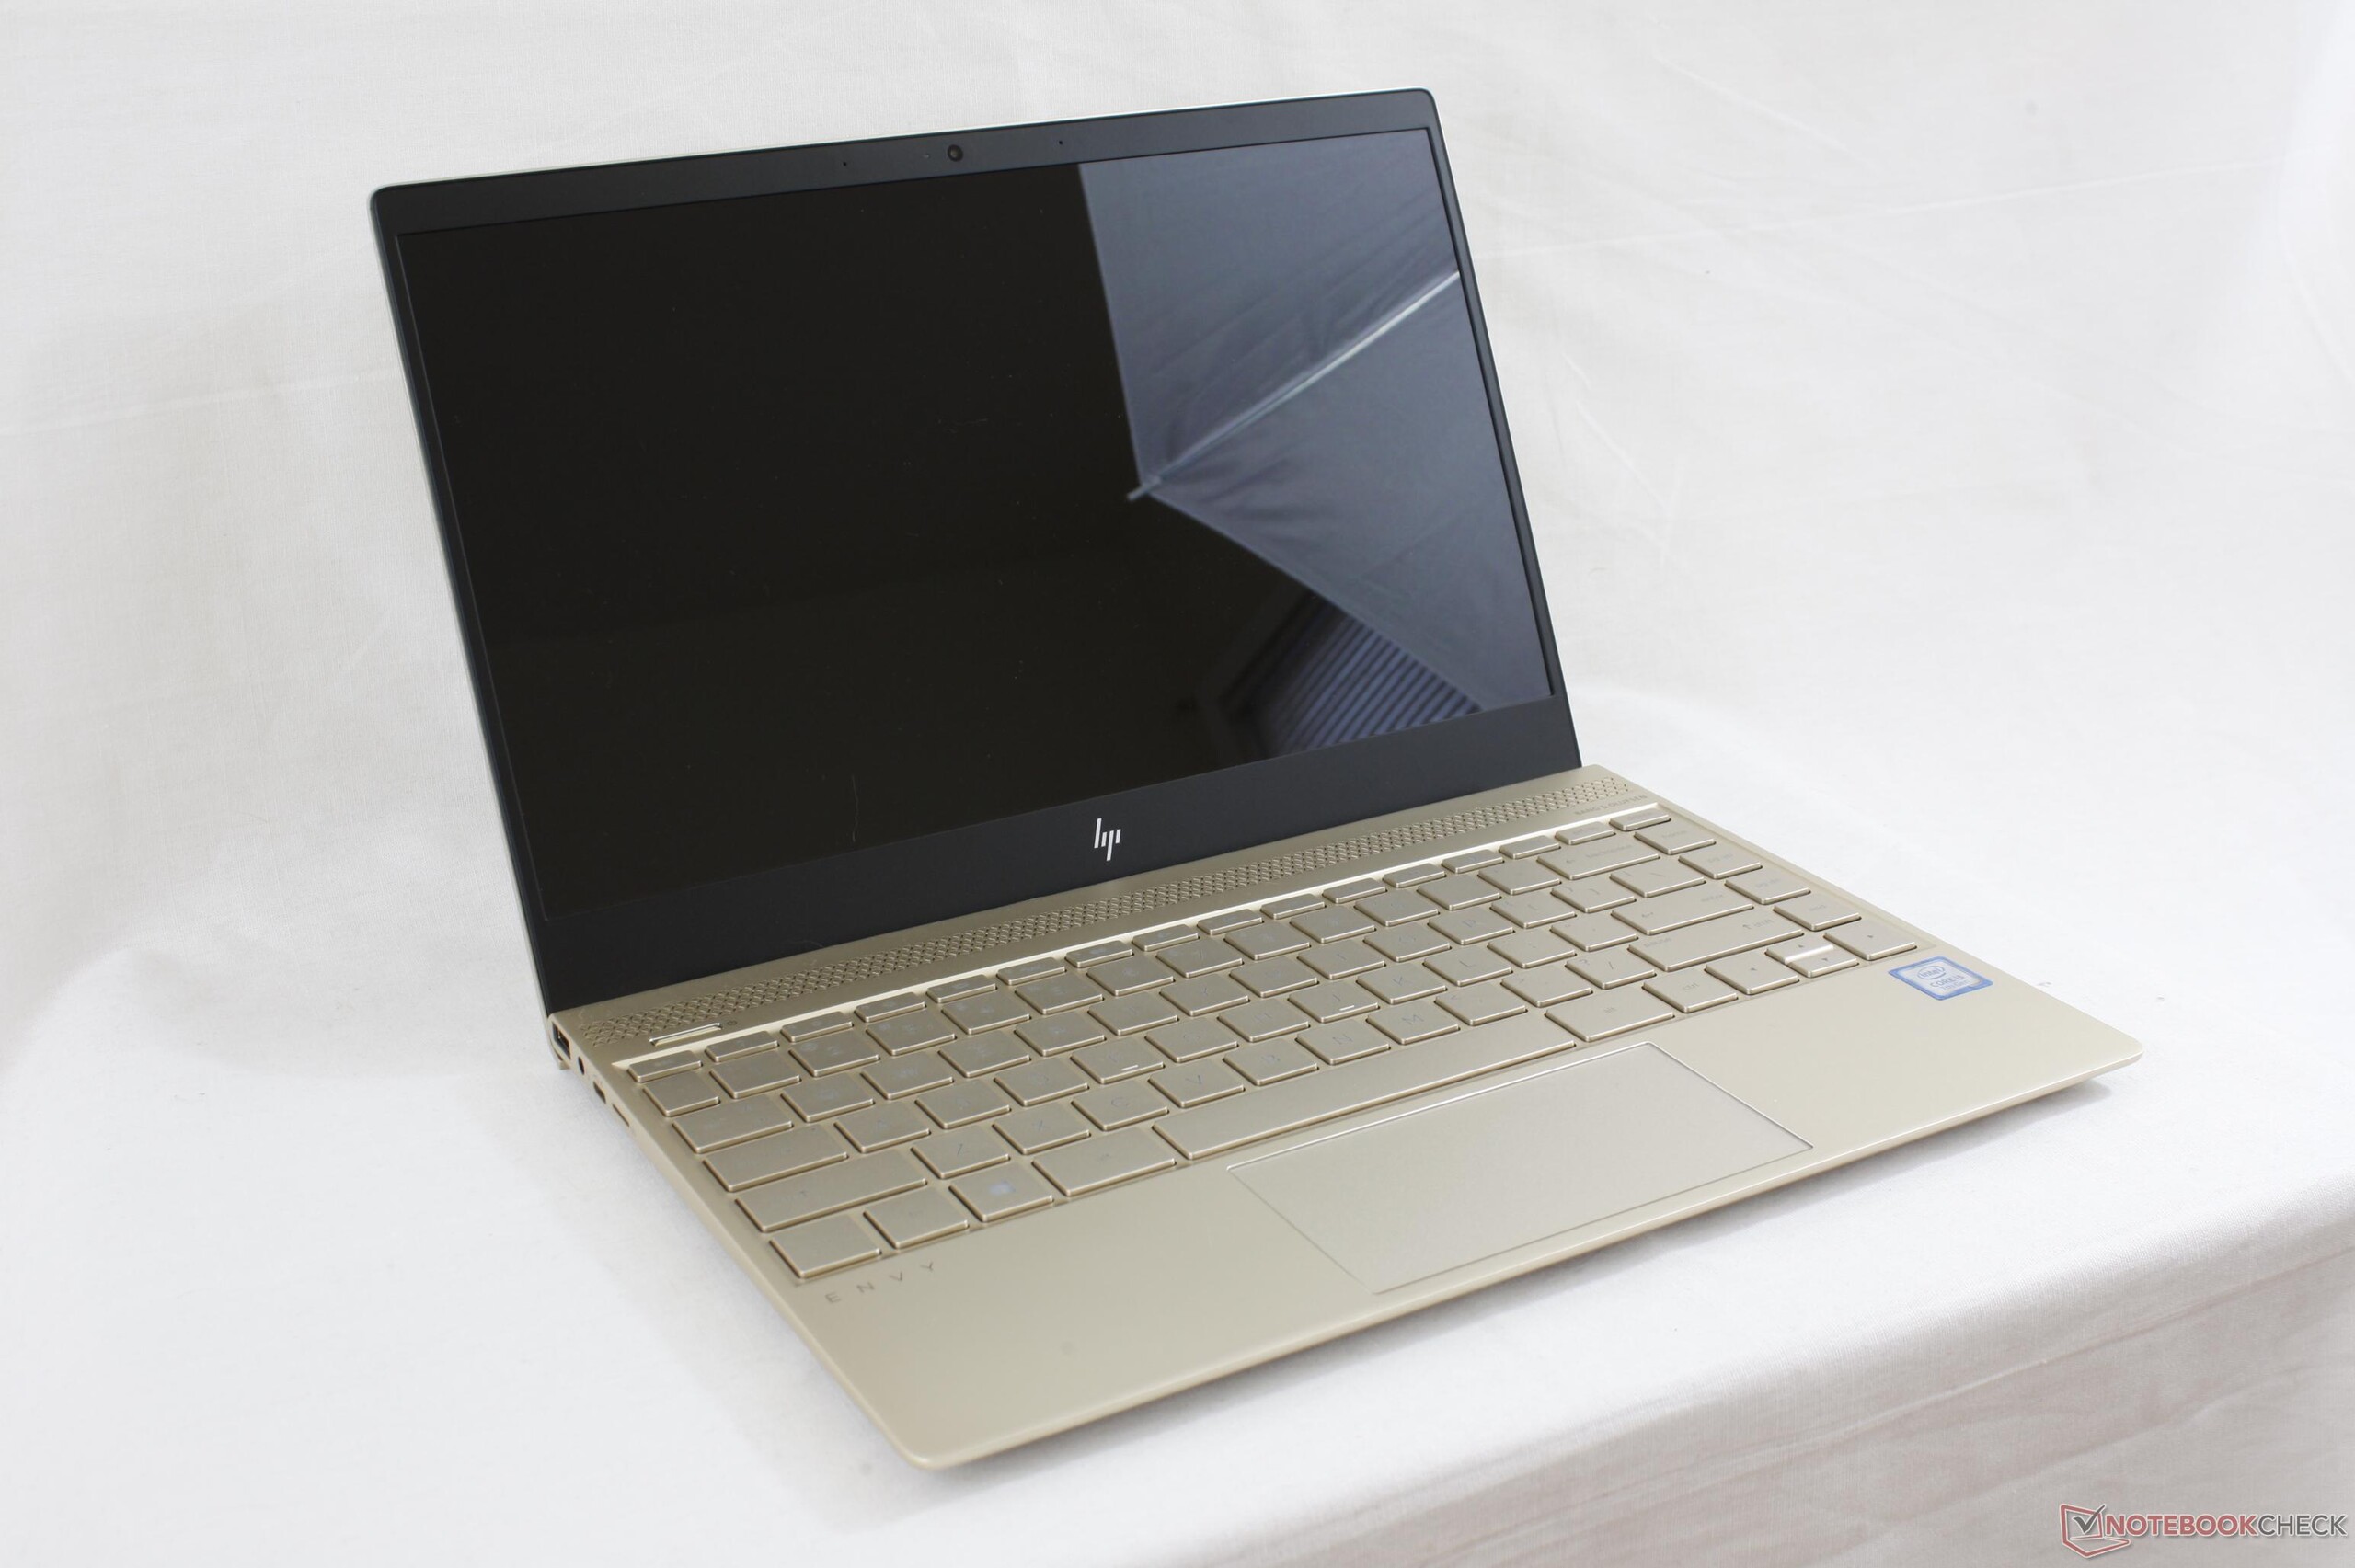
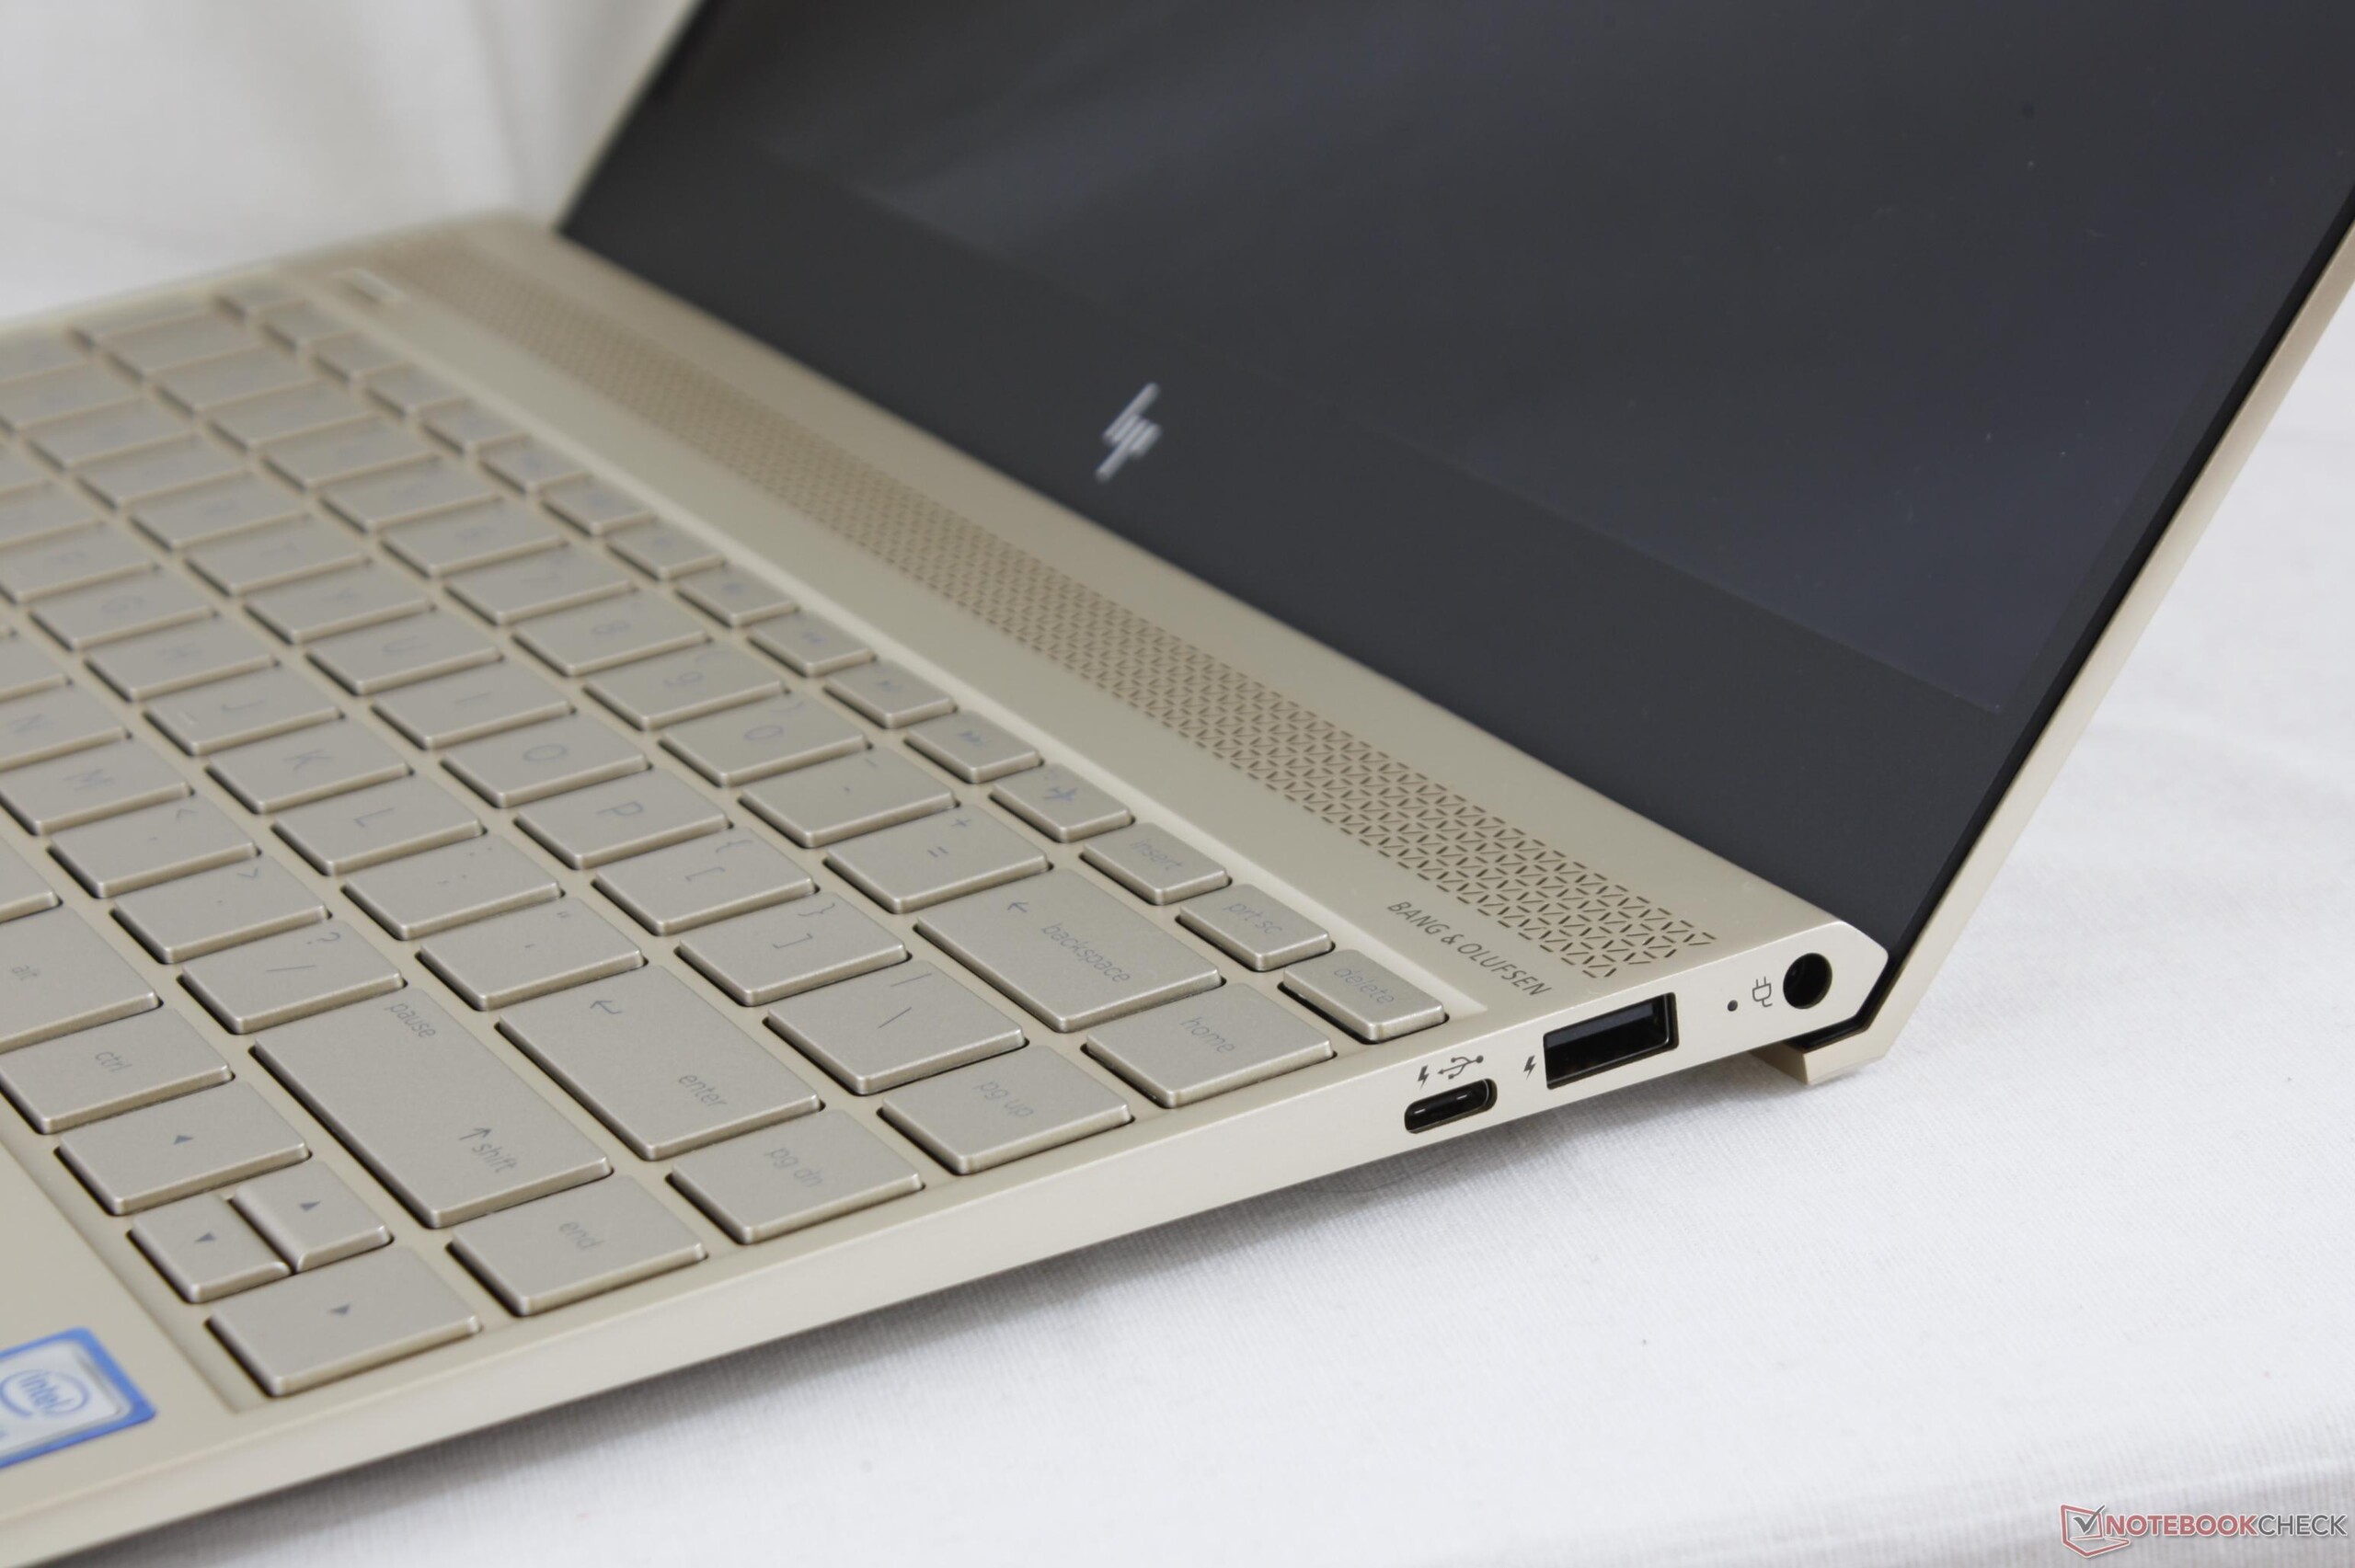
El HP Envy 13 es un atractivo Ultrabook 13.3" mainstream diseñado para competir con el Dell XPS 13 - también con su precio. El Envy no logra alcanzar tan alta meta.
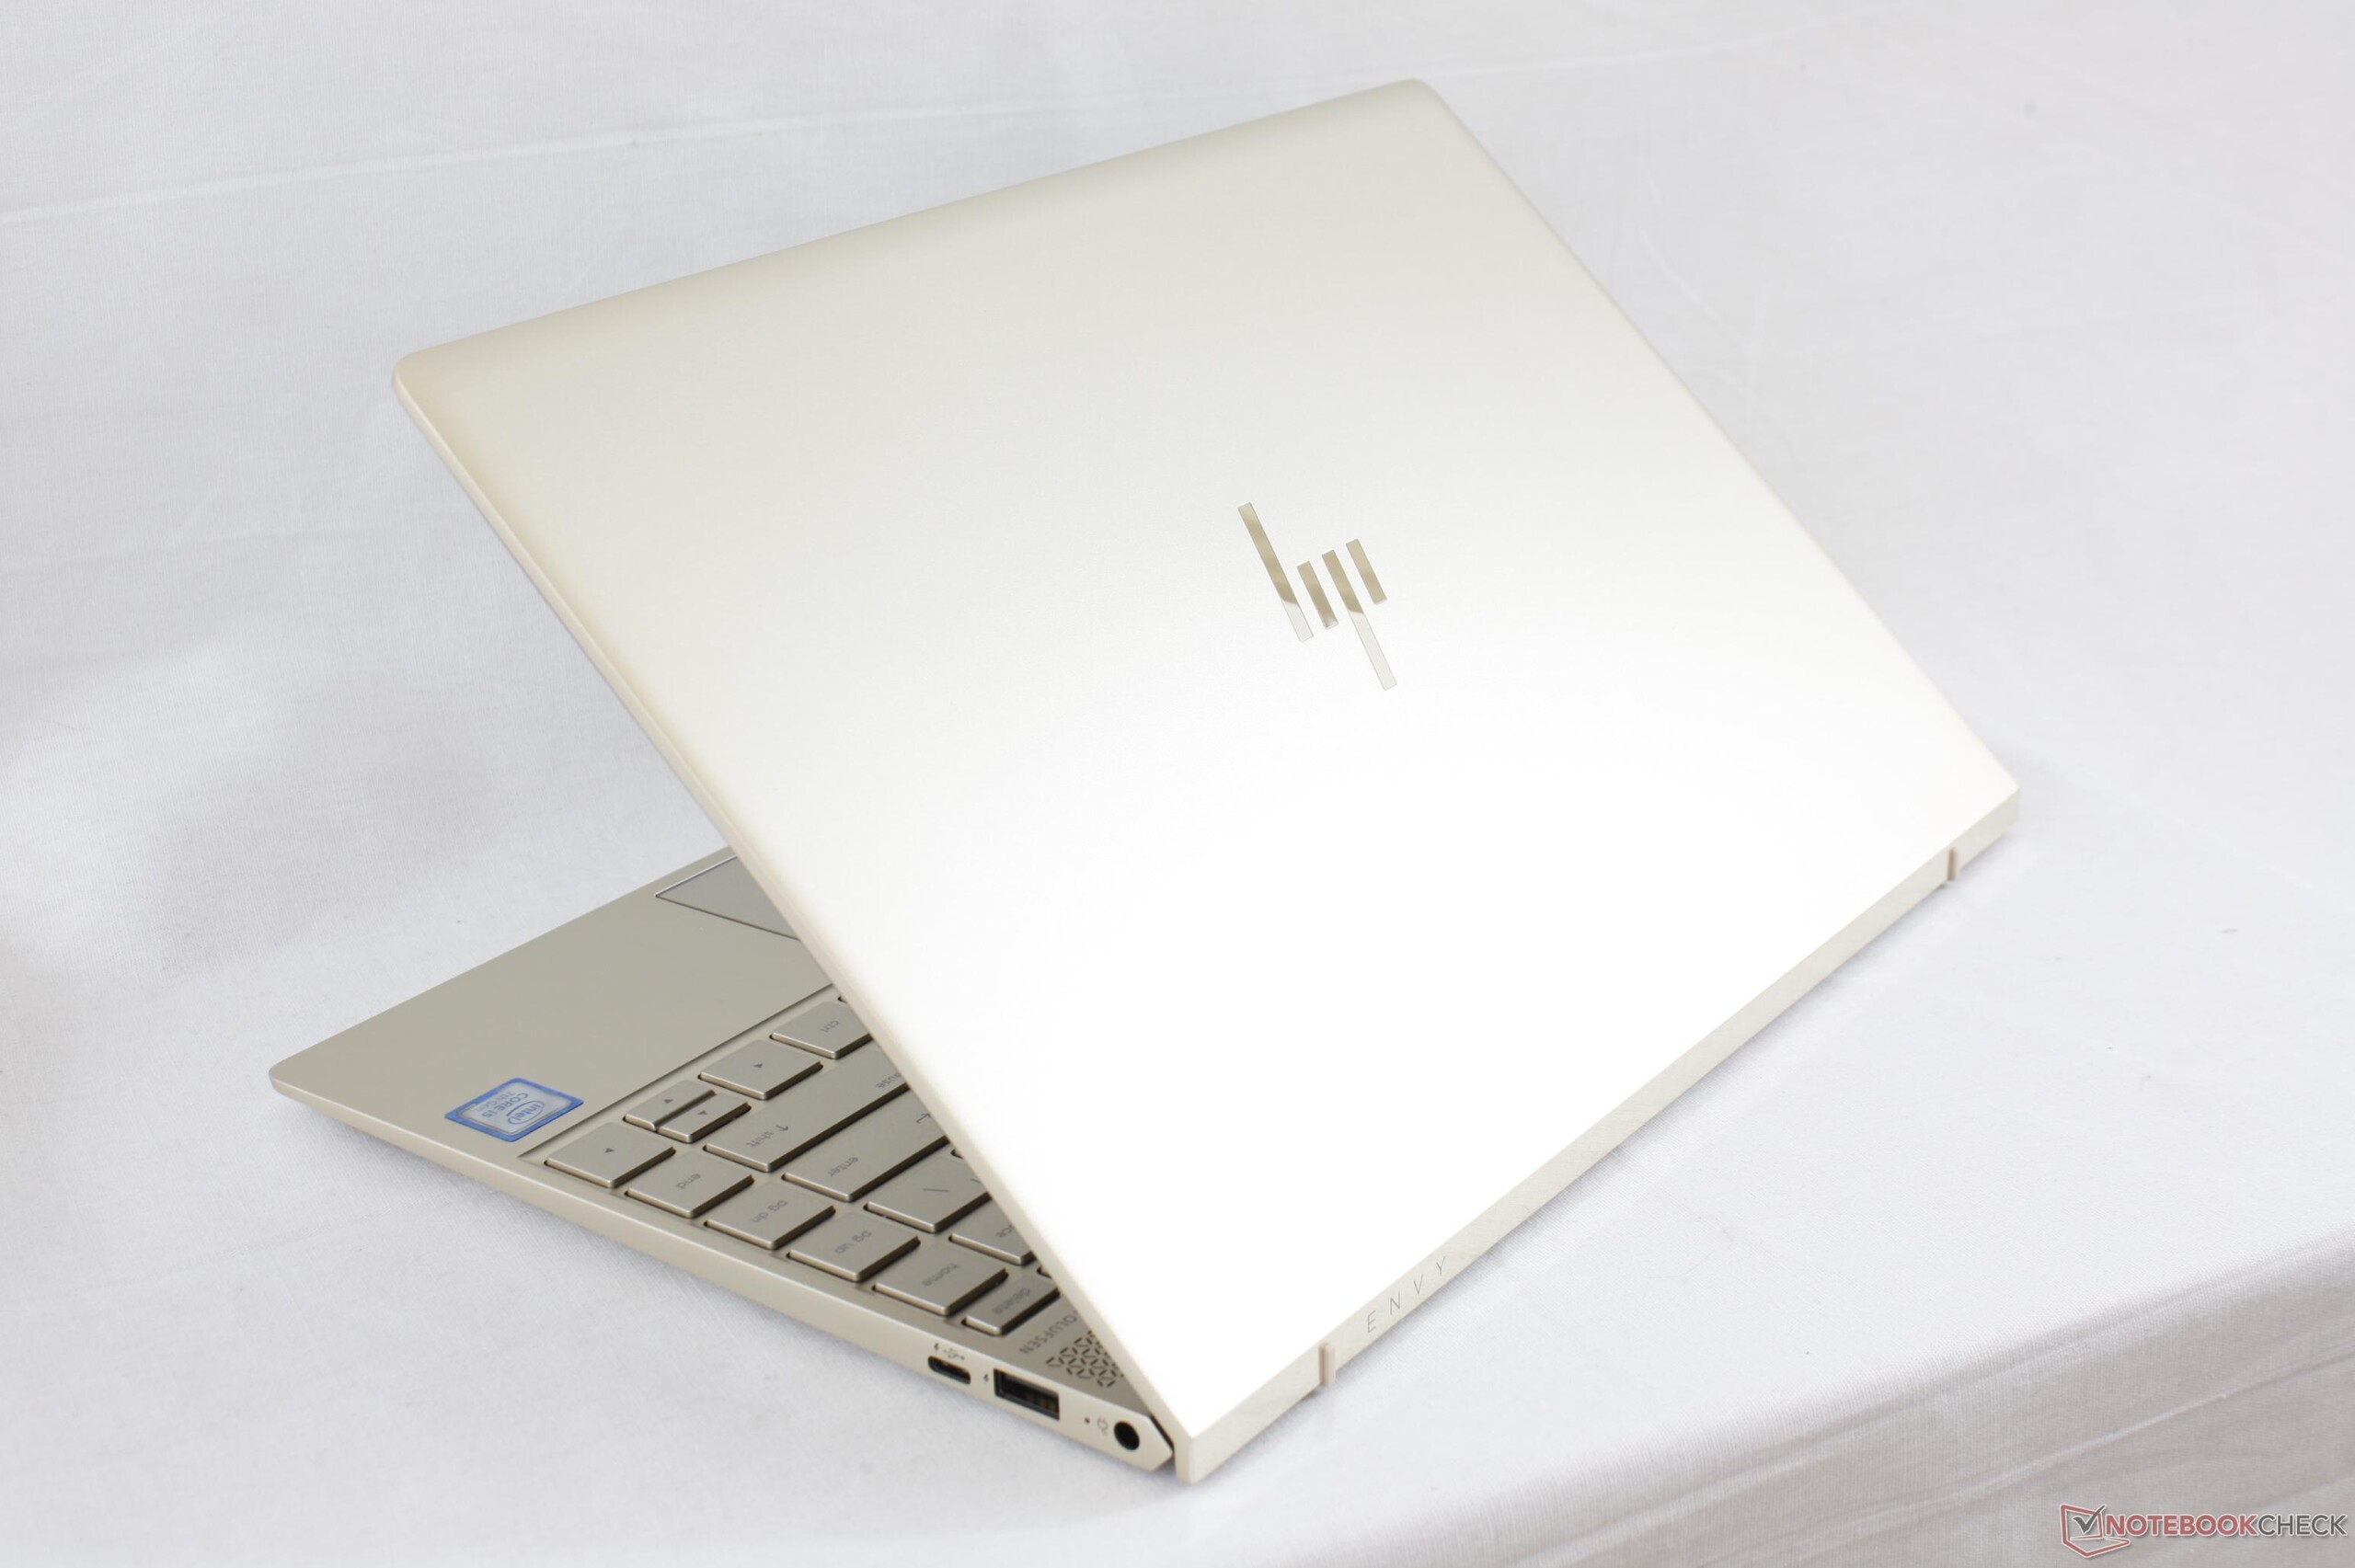
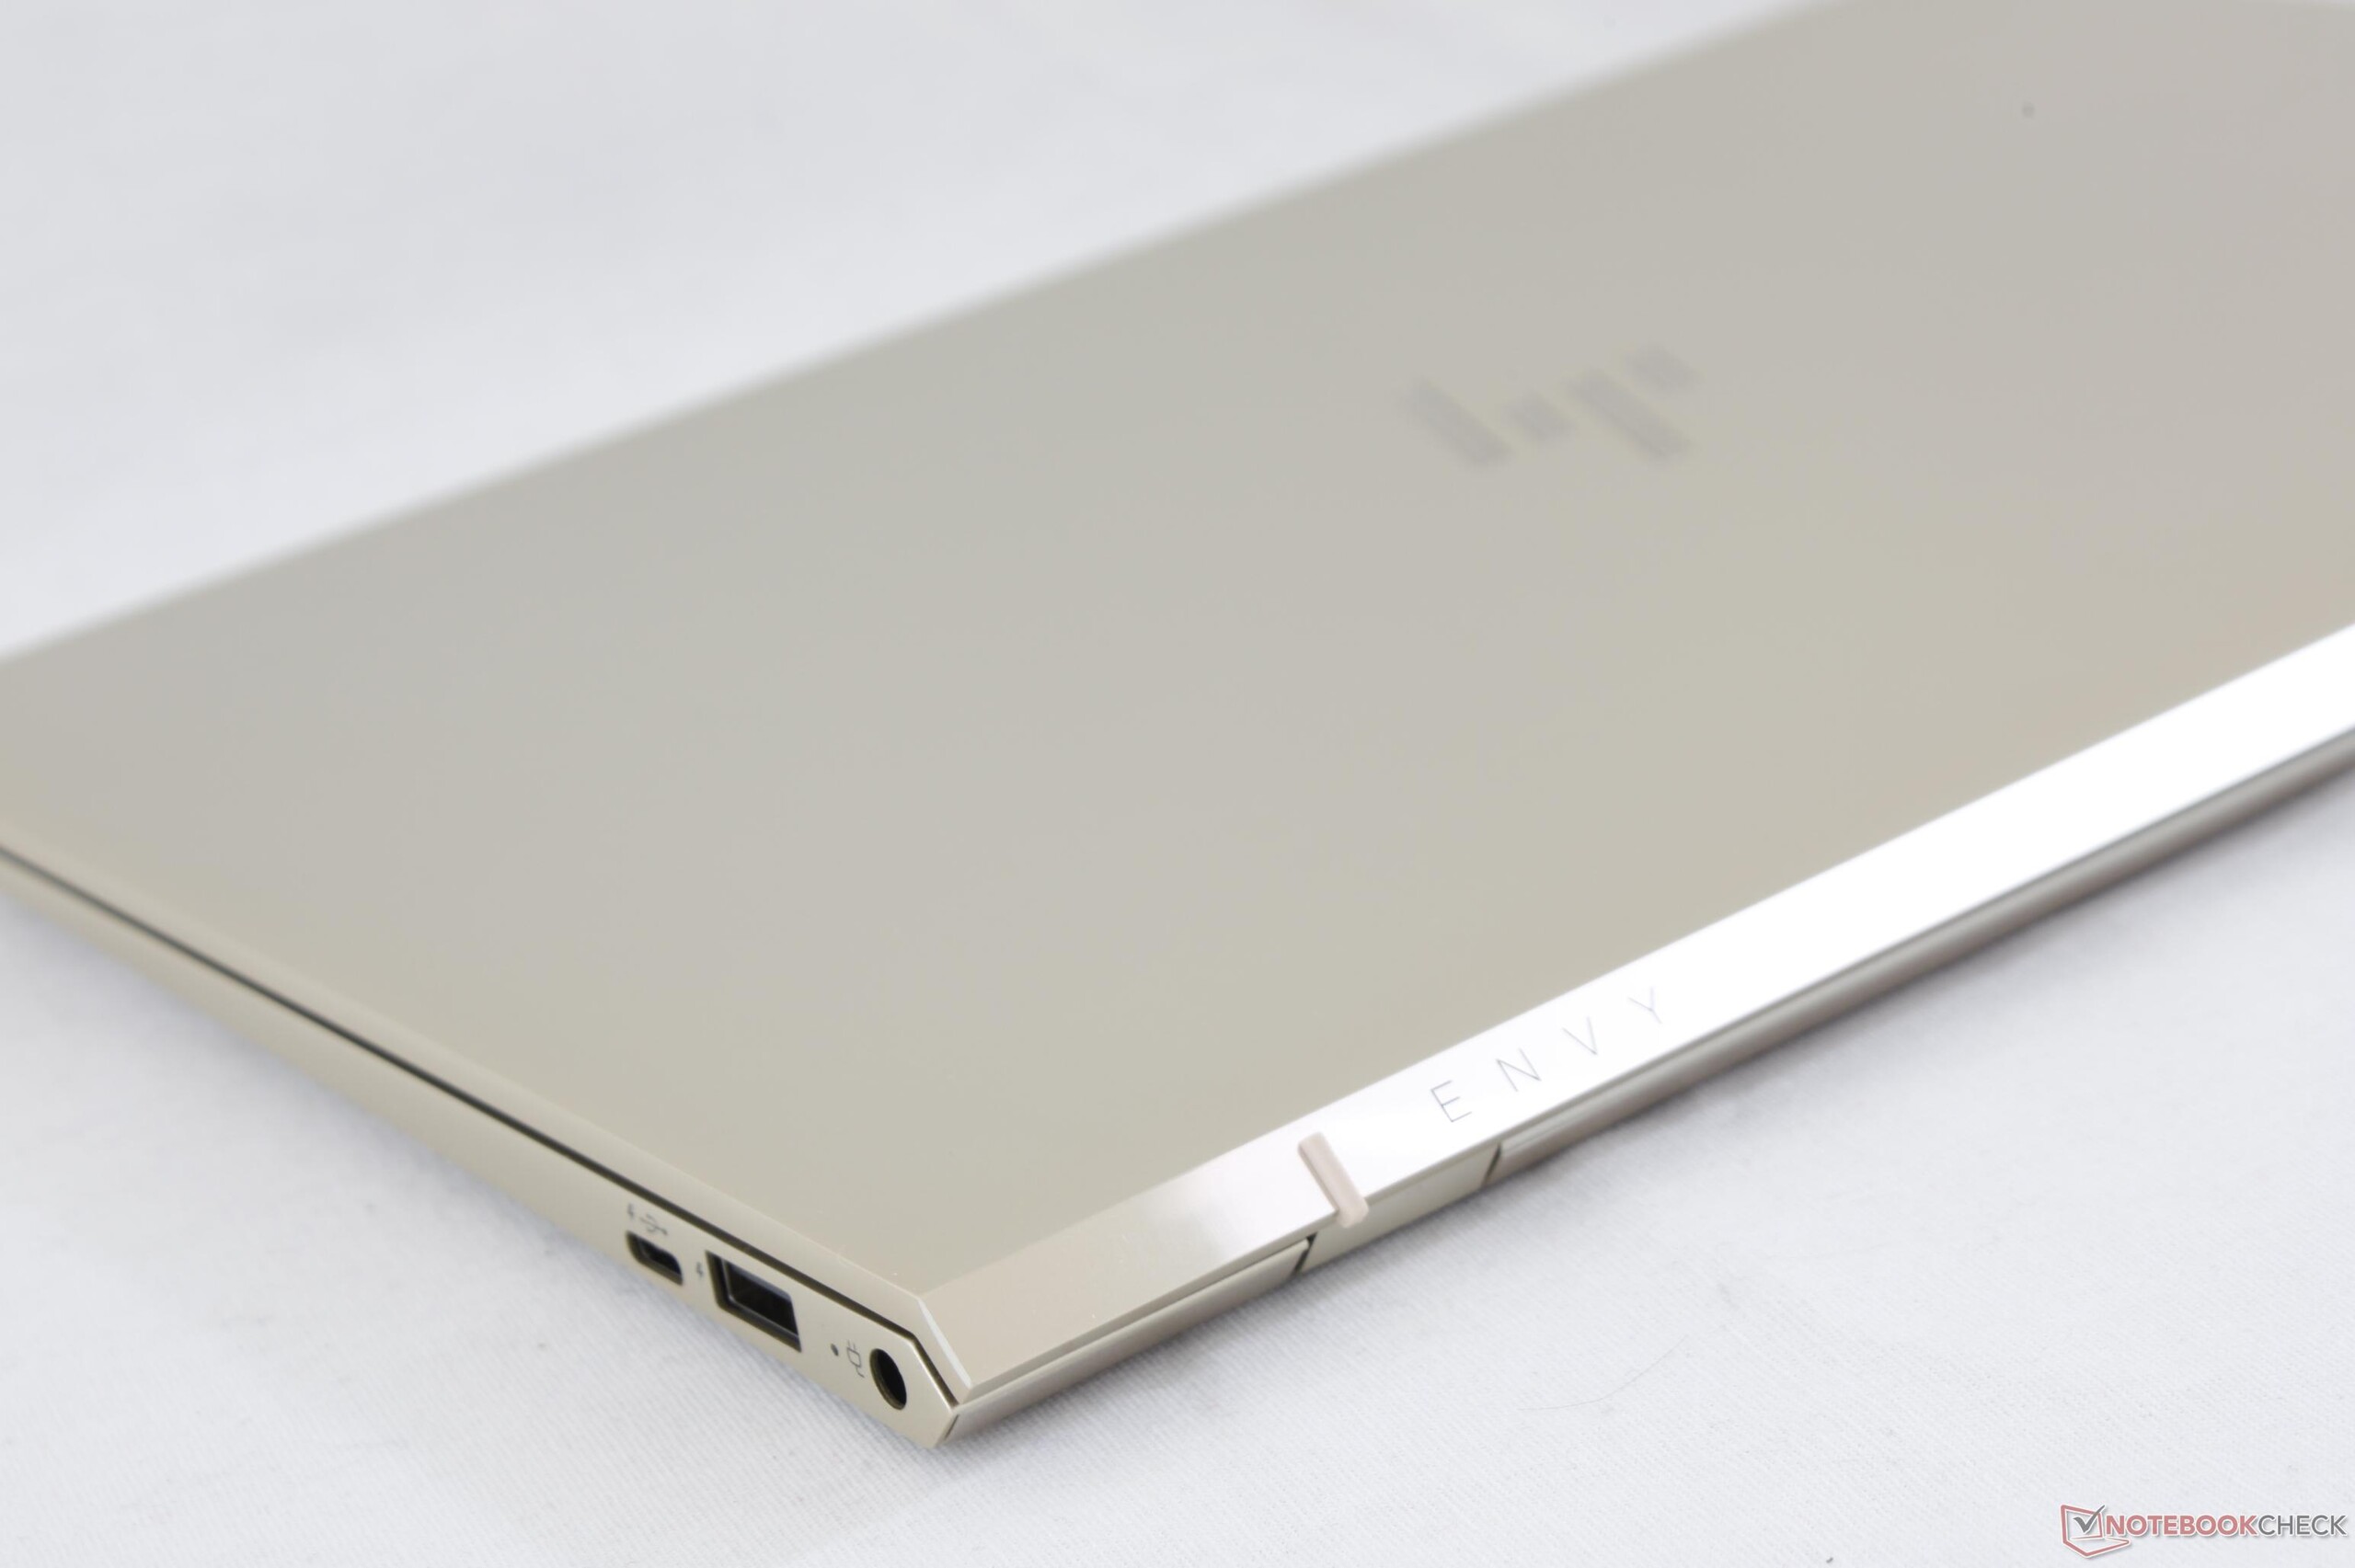
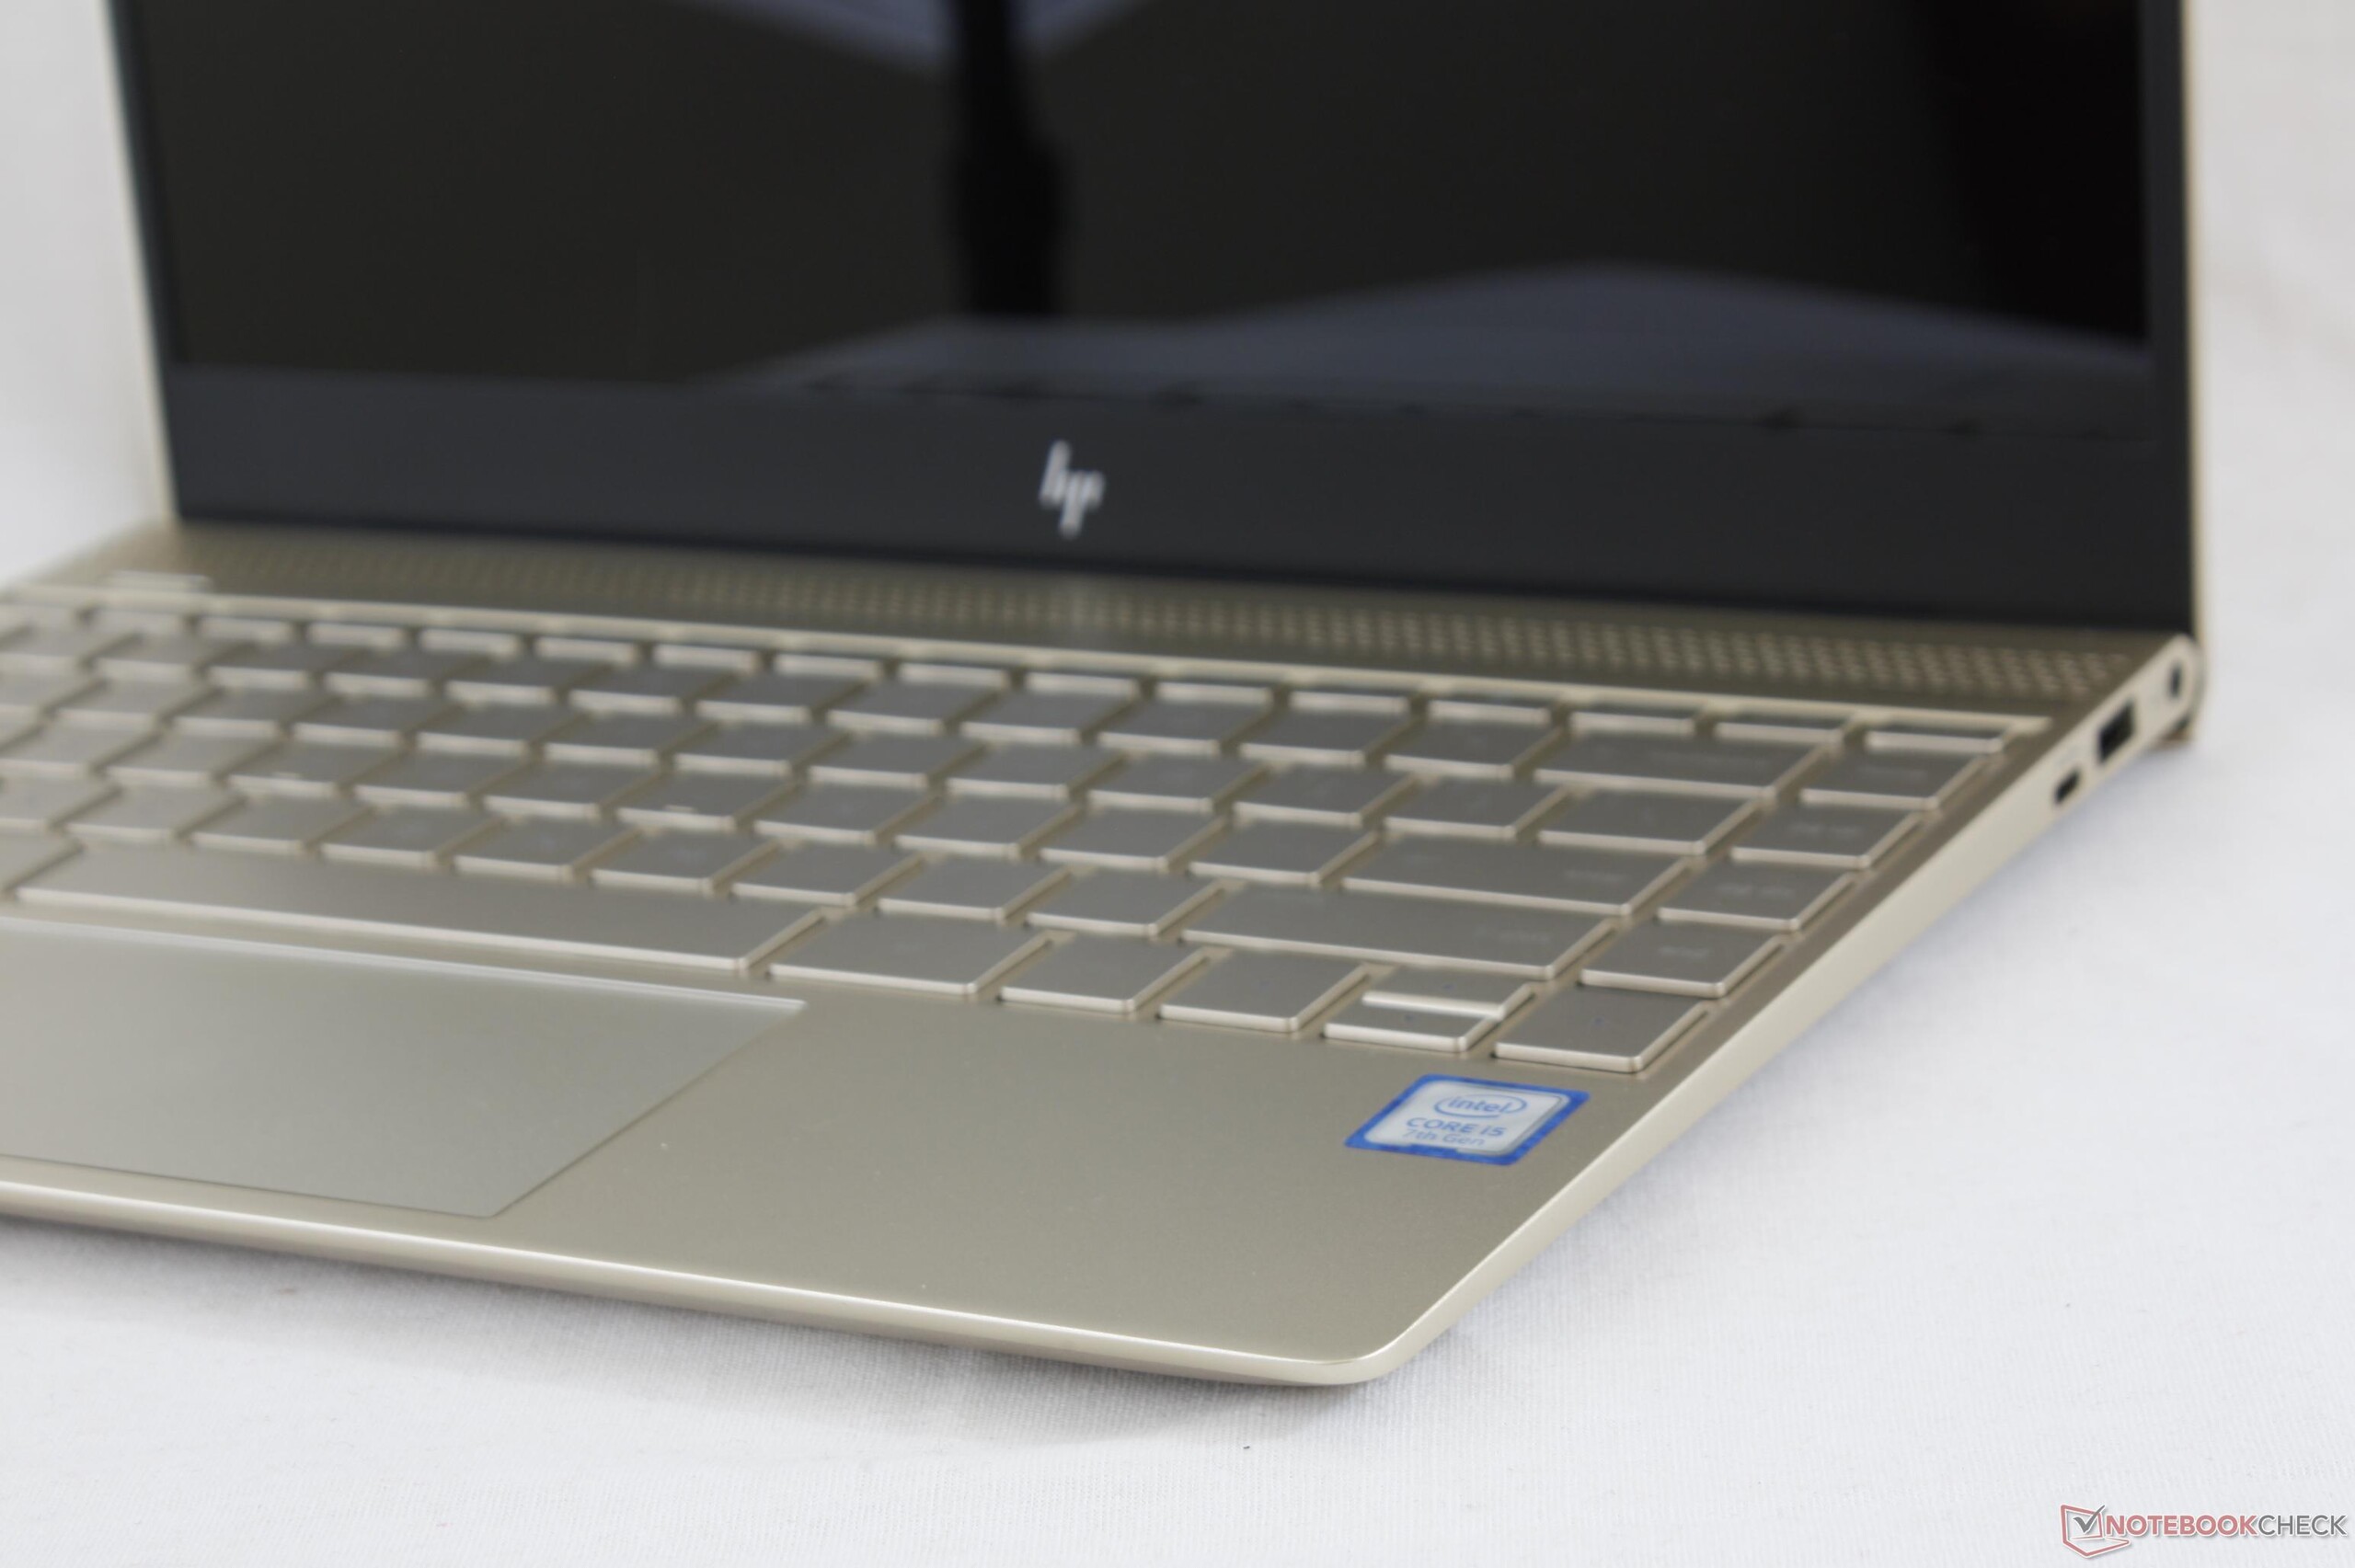
Hay algo que el XPS 13 no ofrece: una dGPU. Es una clara ventaja para el HP, ya que la MX150 va a ser un factor decisivo para muchos clientes. El Envy hace muchas cosas bien: la calidad de construcción es genial y el chasis - gracias a los delgados biseles - es muy compacto además de atractivo. El sistema de ventilación también es muy capaz y todo está bien en lo tocante a nivel de ruido y temperaturas. El display tiene sus puntos débiles, pero subjetivamente tiene muy buena pinta, es muy nítido, y ofrece un buen contraste.
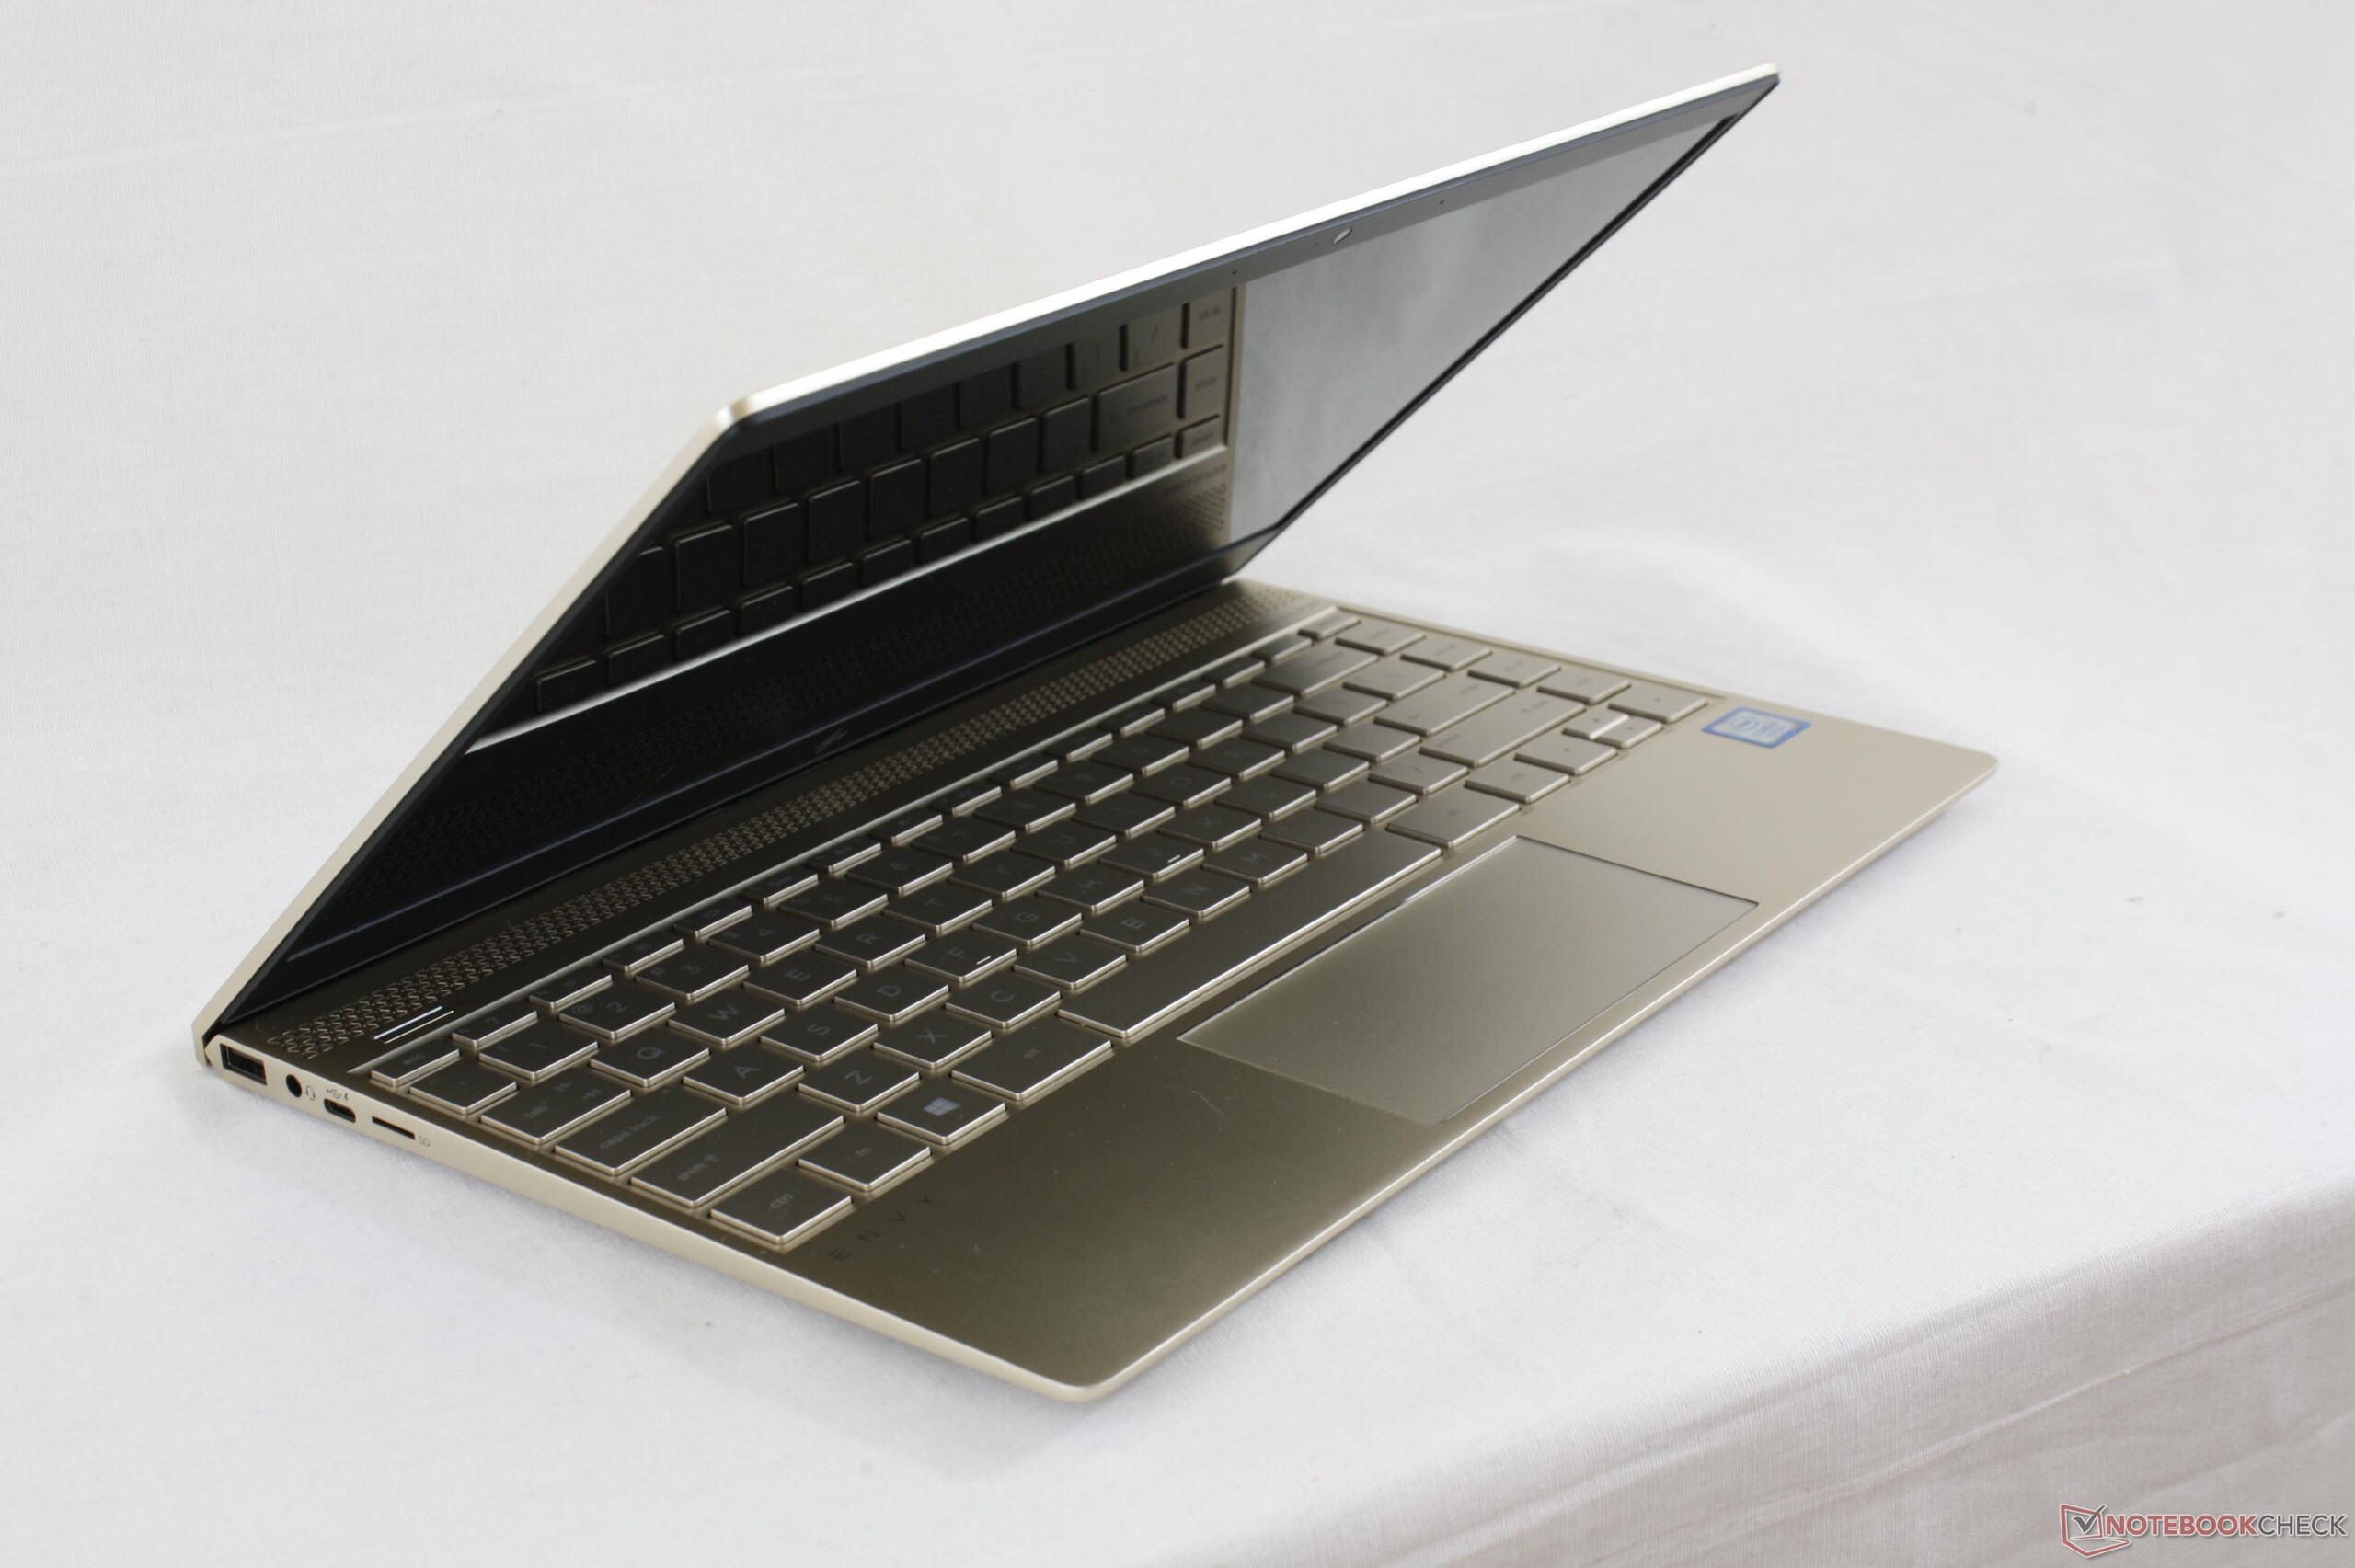
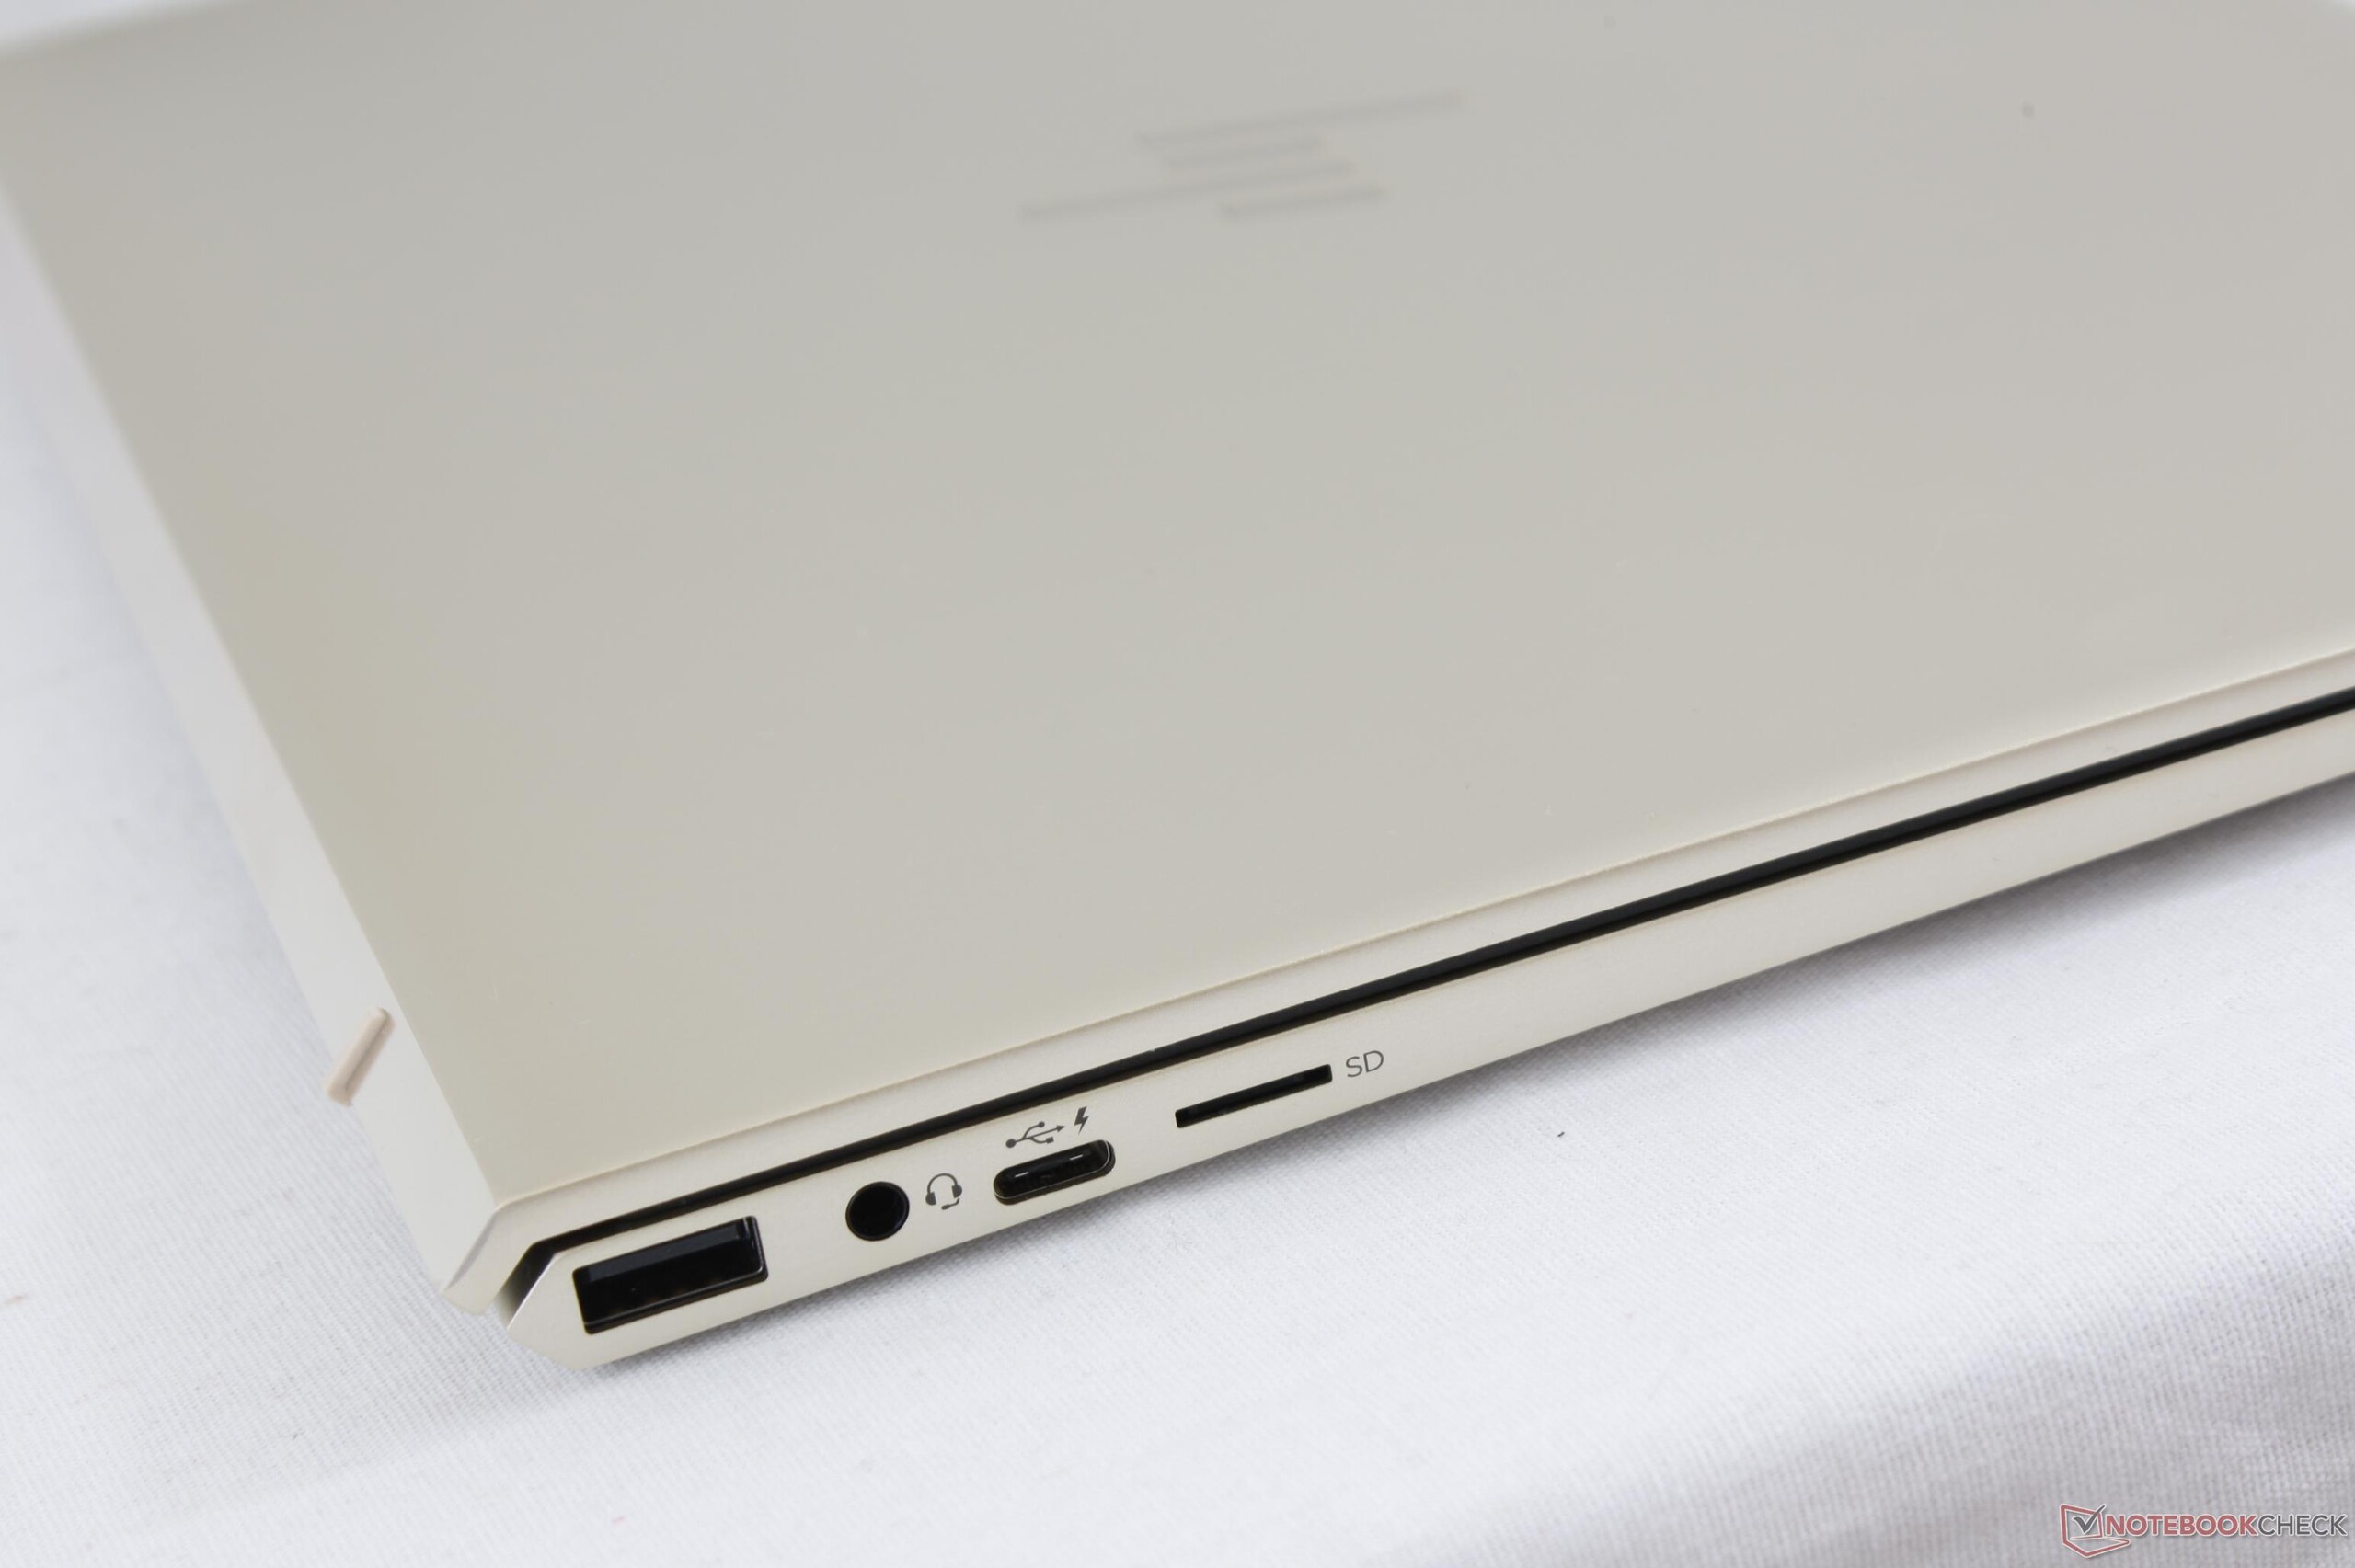
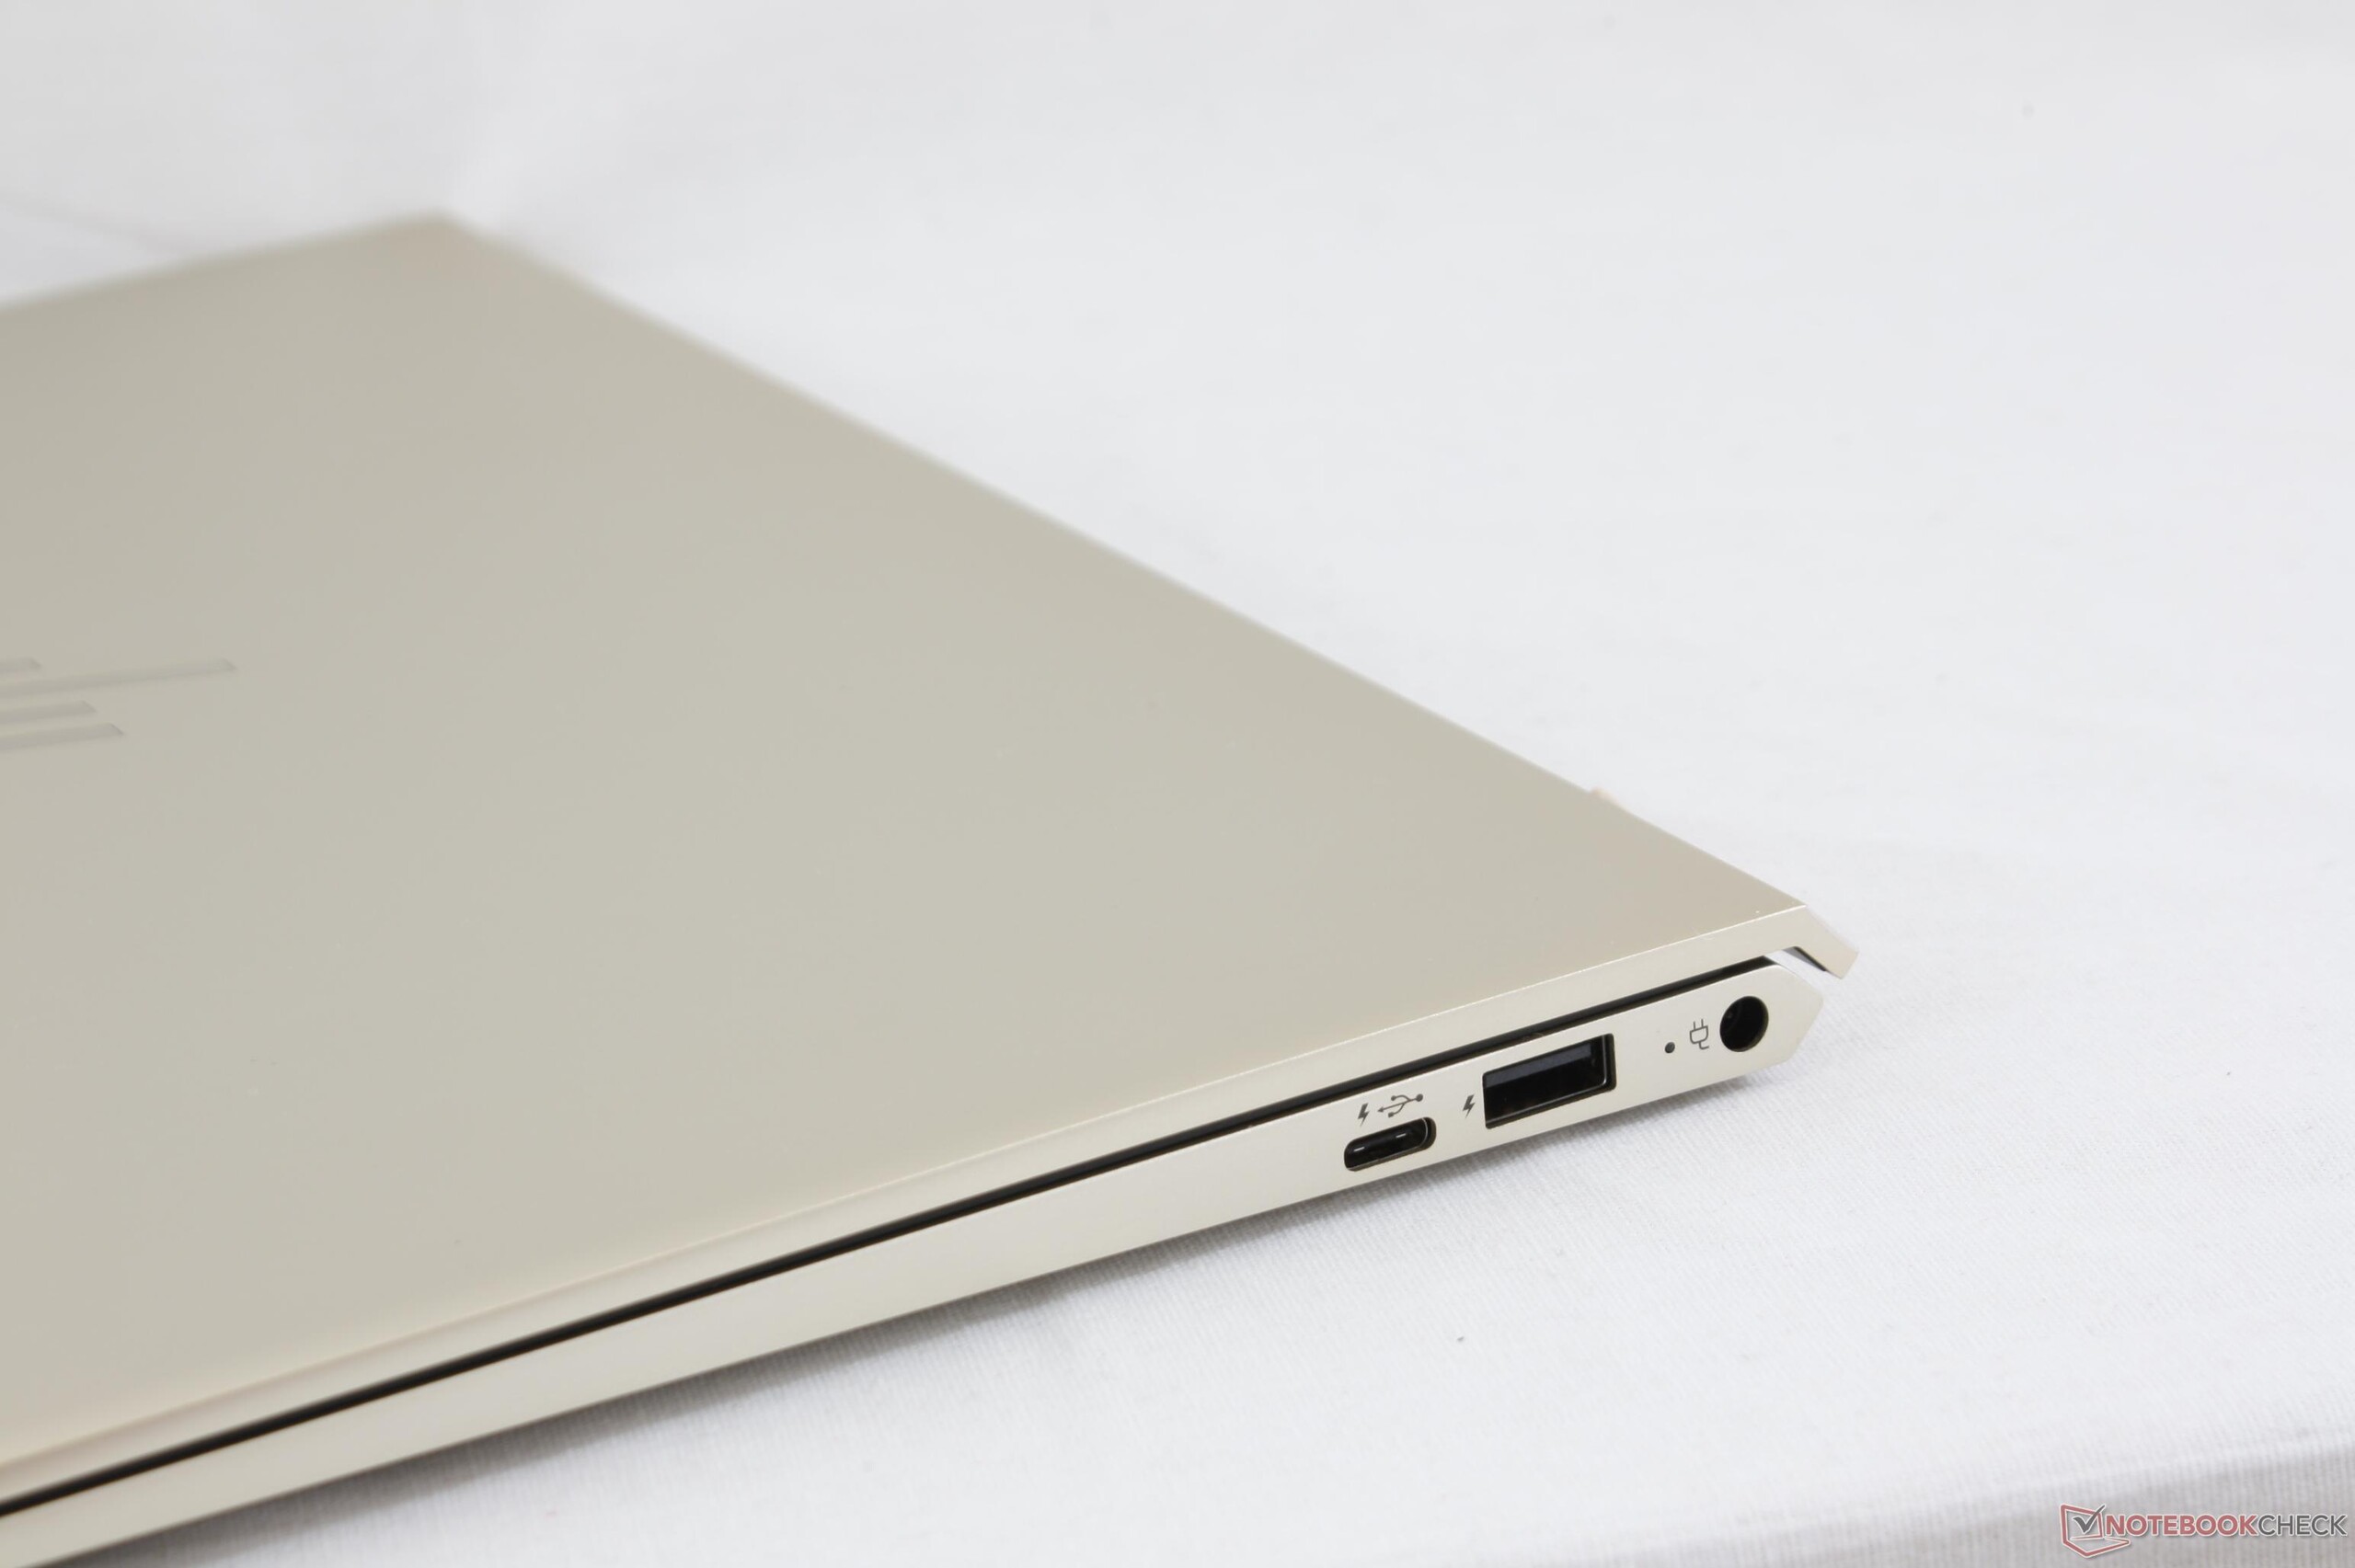
El brillo de display sin embargo no destaca de entre la competencia. Lo que empeora las cosas aquí es que no haya una opción de panel mate, lo que restringe algo la usabilidad en exteriores. La selección de puertos también es subpar: nos habría gustado que incluyera HDMI, una ranura SD de tamaño completo, y Thunderbolt 3. No quedamos muy satisfechos con el touchpad del Envy 13-ad065nr y con el actual tampoco, ya que el clickpad de vidrio repiquetea notablemente. Otro posible defecto del sistema de alto rendimiento es el hecho de que se dé ralentización térmica durante el test de estrés. La ralentización podría darse potencialmente también durante el uso regular.
A veces, el original es sencillamente mejor: no se nos ocurren motivos suficientes para recomendar el HP Envy 13 sobre el Dell XPS 13.
A pesar de estos defectos, el Envy 13 no es para nada un mal portátil. Aparte del precio ligeramente inferior y la dGPU, no encontramos muchos argumentos a favor del Envy. El Dell XPS es de mejor categoría y más aún en lo tocante a los puertos físicos, el brillo del display, y el aguante de batería. Nuestra configuración ya está desfasada además - ya hay un sucesor con Core i7-8550U a la venta. Por ello, no podemos recomendar esta versión en particular. Los usuarios interesados en el Envy 13 deberían buscar un modelo con los componentes hardware más recientes.
Ésta es una versión acortada del análisis original. Puedes leer el análisis completo en inglés aquí.
HP Envy 13-ad006ng
- 10/17/2017 v6 (old)
Benjamin Herzig
Price comparison
