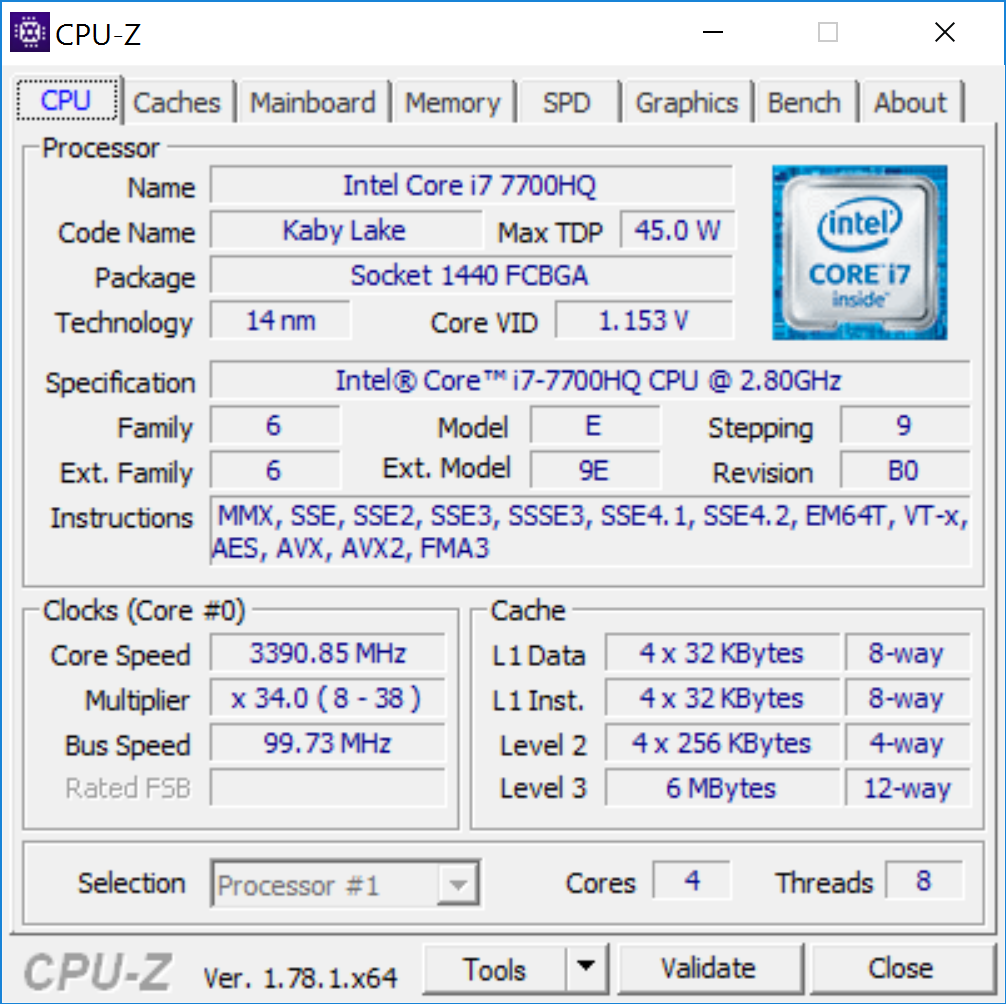
Breve análisis del HP Pavilion 15t-bc200 X7P44AV (7700HQ, UHD, GTX 1050)
| SD Card Reader | |
| average JPG Copy Test (av. of 3 runs) | |
| Dell XPS 15 9560 (i7-7700HQ, UHD) | |
| HP Pavilion 15t-X7P42AV | |
| HP Pavilion 15t-bc200 X7P44AV | |
| Lenovo ThinkPad E570-20H6S00000 | |
| Acer Aspire VN7-593G-73HP V15 Nitro BE | |
| maximum AS SSD Seq Read Test (1GB) | |
| Dell XPS 15 9560 (i7-7700HQ, UHD) | |
| HP Pavilion 15t-bc200 X7P44AV | |
| HP Pavilion 15t-X7P42AV | |
| Lenovo ThinkPad E570-20H6S00000 | |
| Acer Aspire VN7-593G-73HP V15 Nitro BE | |
| |||||||||||||||||||||||||
iluminación: 87 %
Brillo con batería: 259 cd/m²
Contraste: 508:1 (Negro: 0.51 cd/m²)
ΔE ColorChecker Calman: 3.9 | ∀{0.5-29.43 Ø4.71}
ΔE Greyscale Calman: 4.5 | ∀{0.09-98 Ø4.96}
94.1% sRGB (Calman 2D)
59.5% AdobeRGB 1998 (Argyll 1.6.3 3D)
64.8% AdobeRGB 1998 (Argyll 3D)
94.4% sRGB (Argyll 3D)
63% Display P3 (Argyll 3D)
Gamma: 2.43
CCT: 7257 K
| HP Pavilion 15t-bc200 X7P44AV LGD04D4, , 15.6", 3840x2160 | Dell XPS 15 9560 (i7-7700HQ, UHD) IGZO IPS, 15.6", 3840x2160 | HP Pavilion 15t-X7P42AV AU Optronics AUO41ED, IPS, 15.6", 1920x1080 | Acer Aspire VN7-593G-73HP V15 Nitro BE LG Display LP156WF6-SPP1, AH-IPS, Normally Black, Transmissive, 15.6", 1920x1080 | Lenovo ThinkPad E570-20H6S00000 AUO B156HAN04.4, IPS LED, 15.6", 1920x1080 | |
|---|---|---|---|---|---|
| Display | 34% | -40% | -3% | -39% | |
| Display P3 Coverage (%) | 63 | 89.7 42% | 38.03 -40% | 65.8 4% | 38.65 -39% |
| sRGB Coverage (%) | 94.4 | 100 6% | 56.5 -40% | 85.1 -10% | 58 -39% |
| AdobeRGB 1998 Coverage (%) | 64.8 | 100 54% | 39.29 -39% | 62.2 -4% | 39.94 -38% |
| Response Times | -73% | -28% | -36% | -25% | |
| Response Time Grey 50% / Grey 80% * (ms) | 30.4 ? | 57.2 ? -88% | 44.4 ? -46% | 41 ? -35% | 44.8 ? -47% |
| Response Time Black / White * (ms) | 24.8 ? | 39.2 ? -58% | 27.2 ? -10% | 34 ? -37% | 25.6 ? -3% |
| PWM Frequency (Hz) | 962 | ||||
| Screen | 19% | -36% | 12% | 6% | |
| Brightness middle (cd/m²) | 259 | 370.1 43% | 209.7 -19% | 322 24% | 242 -7% |
| Brightness (cd/m²) | 255 | 356 40% | 193 -24% | 297 16% | 243 -5% |
| Brightness Distribution (%) | 87 | 87 0% | 75 -14% | 86 -1% | 75 -14% |
| Black Level * (cd/m²) | 0.51 | 0.37 27% | 0.19 63% | 0.31 39% | 0.24 53% |
| Contrast (:1) | 508 | 1000 97% | 1104 117% | 1039 105% | 1008 98% |
| Colorchecker dE 2000 * | 3.9 | 5.3 -36% | 7.8 -100% | 4.73 -21% | 4.65 -19% |
| Colorchecker dE 2000 max. * | 6.9 | 9.9 -43% | 24.1 -249% | 12.37 -79% | 9.64 -40% |
| Greyscale dE 2000 * | 4.5 | 4.6 -2% | 7.3 -62% | 2.99 34% | 3.39 25% |
| Gamma | 2.43 91% | 2.31 95% | 2.39 92% | 2.32 95% | 2.7 81% |
| CCT | 7257 90% | 6284 103% | 5771 113% | 6905 94% | 6246 104% |
| Color Space (Percent of AdobeRGB 1998) (%) | 59.5 | 88.3 48% | 39.3 -34% | 56 -6% | 36.69 -38% |
| Color Space (Percent of sRGB) (%) | 100 | 56.5 | 85 | 57.66 | |
| Media total (Programa/Opciones) | -7% /
9% | -35% /
-36% | -9% /
2% | -19% /
-8% |
* ... más pequeño es mejor
Tiempos de respuesta del display
| ↔ Tiempo de respuesta de Negro a Blanco | ||
|---|---|---|
| 24.8 ms ... subida ↗ y bajada ↘ combinada | ↗ 10 ms subida | 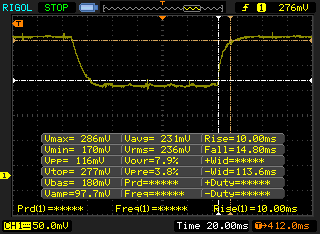 |
| ↘ 14.8 ms bajada | ||
| La pantalla mostró buenos tiempos de respuesta en nuestros tests pero podría ser demasiado lenta para los jugones competitivos. En comparación, todos los dispositivos de prueba van de ##min### (mínimo) a 240 (máximo) ms. » 58 % de todos los dispositivos son mejores. Eso quiere decir que el tiempo de respuesta es peor que la media (19.8 ms) de todos los dispositivos testados. | ||
| ↔ Tiempo de respuesta 50% Gris a 80% Gris | ||
| 30.4 ms ... subida ↗ y bajada ↘ combinada | ↗ 12.4 ms subida | 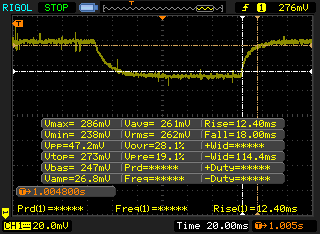 |
| ↘ 18 ms bajada | ||
| La pantalla mostró tiempos de respuesta lentos en nuestros tests y podría ser demasiado lenta para los jugones. En comparación, todos los dispositivos de prueba van de ##min### (mínimo) a 636 (máximo) ms. » 41 % de todos los dispositivos son mejores. Eso quiere decir que el tiempo de respuesta es similar al dispositivo testado medio (30.9 ms). | ||
Parpadeo de Pantalla / PWM (Pulse-Width Modulation)
| Parpadeo de Pantalla / PWM no detectado | 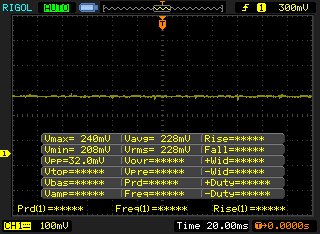 | ||
Comparación: 52 % de todos los dispositivos testados no usaron PWM para atenuar el display. Si se usó, medimos una media de 7748 (mínimo: 5 - máxmo: 343500) Hz. | |||
| Cinebench R11.5 - CPU Multi 64Bit | |
| Dell XPS 15 9560 (i7-7700HQ, UHD) | |
| HP Pavilion 15t-bc200 X7P44AV | |
| HP Pavilion 15t-X7P42AV | |
| wPrime 2.10 - 1024m | |
| HP Pavilion 15t-bc200 X7P44AV | |
| HP Pavilion 15t-X7P42AV | |
| Dell XPS 15 9560 (i7-7700HQ, UHD) | |
* ... más pequeño es mejor
| PCMark 8 | |
| Home Score Accelerated v2 | |
| HP Pavilion 15t-X7P42AV | |
| Dell XPS 15 9560 (i7-7700HQ, UHD) | |
| Lenovo ThinkPad E570-20H6S00000 | |
| HP Pavilion 15t-bc200 X7P44AV | |
| Work Score Accelerated v2 | |
| Lenovo ThinkPad E570-20H6S00000 | |
| Dell XPS 15 9560 (i7-7700HQ, UHD) | |
| HP Pavilion 15t-X7P42AV | |
| HP Pavilion 15t-bc200 X7P44AV | |
| Creative Score Accelerated v2 | |
| HP Pavilion 15t-X7P42AV | |
| Dell XPS 15 9560 (i7-7700HQ, UHD) | |
| HP Pavilion 15t-bc200 X7P44AV | |
| PCMark 8 Home Score Accelerated v2 | 3502 puntos | |
| PCMark 8 Creative Score Accelerated v2 | 5007 puntos | |
| PCMark 8 Work Score Accelerated v2 | 2351 puntos | |
ayuda | ||
| HP Pavilion 15t-bc200 X7P44AV Intel SSD 600p SSDPEKKW256G7 | Dell XPS 15 9560 (i7-7700HQ, UHD) Lite-On CX2-8B512-Q11 | HP Pavilion 15t-X7P42AV Samsung CM871a MZNTY128HDHP | Acer Aspire VN7-593G-73HP V15 Nitro BE Seagate Mobile HDD 1TB ST1000LM035 | Lenovo ThinkPad E570-20H6S00000 Toshiba THNSF5256GPUK | |
|---|---|---|---|---|---|
| CrystalDiskMark 3.0 | 75% | -20% | -92% | 14% | |
| Read Seq (MB/s) | 1115 | 1684 51% | 522 -53% | 120.9 -89% | 1140 2% |
| Write Seq (MB/s) | 311 | 1106 256% | 476.6 53% | 101.8 -67% | 468.1 51% |
| Read 512 (MB/s) | 706 | 977 38% | 399.7 -43% | 37.83 -95% | 759 8% |
| Write 512 (MB/s) | 472.3 | 1119 137% | 185.4 -61% | 84.4 -82% | 414 -12% |
| Read 4k (MB/s) | 31.97 | 45.14 41% | 33.12 4% | 0.473 -99% | 34.3 7% |
| Write 4k (MB/s) | 135.1 | 134.1 -1% | 89.8 -34% | 0.313 -100% | 123.4 -9% |
| Read 4k QD32 (MB/s) | 288.3 | 509 77% | 400.9 39% | 1.133 -100% | 530 84% |
| Write 4k QD32 (MB/s) | 405.5 | 398.1 -2% | 140.2 -65% | 0.274 -100% | 319.2 -21% |

| 3DMark 11 | |
| 1280x720 Performance GPU | |
| Acer Aspire VN7-593G-73HP V15 Nitro BE | |
| HP Pavilion 15t-bc200 X7P44AV | |
| HP Pavilion 15t-X7P42AV | |
| Lenovo ThinkPad E570-20H6S00000 | |
| 1280x720 Performance Combined | |
| Acer Aspire VN7-593G-73HP V15 Nitro BE | |
| HP Pavilion 15t-X7P42AV | |
| HP Pavilion 15t-bc200 X7P44AV | |
| Lenovo ThinkPad E570-20H6S00000 | |
| 3DMark 06 Standard Score | 27237 puntos | |
| 3DMark 11 Performance | 7735 puntos | |
| 3DMark Ice Storm Standard Score | 35025 puntos | |
| 3DMark Cloud Gate Standard Score | 15911 puntos | |
| 3DMark Fire Strike Score | 5373 puntos | |
ayuda | ||
| Doom - 3840x2160 High Preset AA:FX (ordenar por valor) | |
| HP Pavilion 15t-bc200 X7P44AV | |
| Dell XPS 15 9560 (i7-7700HQ, UHD) | |
| Rise of the Tomb Raider - 3840x2160 High Preset AA:FX AF:4x (ordenar por valor) | |
| HP Pavilion 15t-bc200 X7P44AV | |
| Dell XPS 15 9560 (i7-7700HQ, UHD) | |
| Batman: Arkham Knight - 3840x2160 High / On (Interactive Smoke & Paper Debris Off) AA:SM AF:8x (ordenar por valor) | |
| HP Pavilion 15t-bc200 X7P44AV | |
| Dell XPS 15 9560 (i7-7700HQ, UHD) | |
| bajo | medio | alto | ultra | 4K | |
|---|---|---|---|---|---|
| Batman: Arkham Knight (2015) | 16 | ||||
| Rise of the Tomb Raider (2016) | 14 | ||||
| Doom (2016) | 18 |
Ruido
| Ocioso |
| 32.3 / 32.3 / 32.3 dB(A) |
| Carga |
| 43.2 / 45.2 dB(A) |
 | ||
30 dB silencioso 40 dB(A) audible 50 dB(A) ruidosamente alto |
||
min: | ||
| HP Pavilion 15t-bc200 X7P44AV GeForce GTX 1050 Mobile, i7-7700HQ, Intel SSD 600p SSDPEKKW256G7 | Dell XPS 15 9560 (i7-7700HQ, UHD) GeForce GTX 1050 Mobile, i7-7700HQ, Lite-On CX2-8B512-Q11 | HP Pavilion 15t-X7P42AV GeForce GTX 1050 Mobile, i7-7700HQ, Samsung CM871a MZNTY128HDHP | Acer Aspire VN7-593G-73HP V15 Nitro BE GeForce GTX 1060 Mobile, i7-7700HQ, Seagate Mobile HDD 1TB ST1000LM035 | Lenovo ThinkPad E570-20H6S00000 GeForce GTX 950M, i5-7200U, Toshiba THNSF5256GPUK | |
|---|---|---|---|---|---|
| Noise | 2% | -2% | 2% | 10% | |
| apagado / medio ambiente * (dB) | 28.9 | 28.4 2% | 29.3 -1% | 30.4 -5% | 29 -0% |
| Idle Minimum * (dB) | 32.3 | 29 10% | 32.3 -0% | 30.9 4% | 29 10% |
| Idle Average * (dB) | 32.3 | 29 10% | 32.3 -0% | 30.9 4% | 29 10% |
| Idle Maximum * (dB) | 32.3 | 32.2 -0% | 32.4 -0% | 31.5 2% | 29 10% |
| Load Average * (dB) | 43.2 | 47.1 -9% | 44.4 -3% | 40.7 6% | 34.3 21% |
| Load Maximum * (dB) | 45.2 | 47.1 -4% | 49.2 -9% | 43.9 3% | 40.1 11% |
| Witcher 3 ultra * (dB) | 52 | 45.5 |
* ... más pequeño es mejor
(±) La temperatura máxima en la parte superior es de 42 °C / 108 F, frente a la media de 36.8 °C / 98 F, que oscila entre 21 y 71 °C para la clase Multimedia.
(+) El fondo se calienta hasta un máximo de 34.8 °C / 95 F, frente a la media de 39.1 °C / 102 F
(+) En reposo, la temperatura media de la parte superior es de 22.7 °C / 73# F, frente a la media del dispositivo de 31.3 °C / 88 F.
(±) El reposamanos y el touchpad pueden calentarse mucho al tacto con un máximo de 37.2 °C / 99 F.
(-) La temperatura media de la zona del reposamanos de dispositivos similares fue de 28.7 °C / 83.7 F (-8.5 °C / -15.3 F).
HP Pavilion 15t-bc200 X7P44AV análisis de audio
(±) | la sonoridad del altavoz es media pero buena (74.1 dB)
Graves 100 - 315 Hz
(-) | casi sin bajos - de media 19.5% inferior a la mediana
(±) | la linealidad de los graves es media (8.9% delta a frecuencia anterior)
Medios 400 - 2000 Hz
(±) | medias más altas - de media 5.6% más altas que la mediana
(±) | la linealidad de los medios es media (11% delta respecto a la frecuencia anterior)
Altos 2 - 16 kHz
(+) | máximos equilibrados - a sólo 3.4% de la mediana
(±) | la linealidad de los máximos es media (8.8% delta a frecuencia anterior)
Total 100 - 16.000 Hz
(-) | el sonido global no es lineal (32.1% de diferencia con la mediana)
En comparación con la misma clase
» 97% de todos los dispositivos probados de esta clase eran mejores, 1% similares, 2% peores
» El mejor tuvo un delta de 5%, la media fue 17%, el peor fue ###max##%
En comparación con todos los dispositivos probados
» 91% de todos los dispositivos probados eran mejores, 2% similares, 7% peores
» El mejor tuvo un delta de 4%, la media fue 23%, el peor fue ###max##%
Dell XPS 15 9560 (i7-7700HQ, UHD) análisis de audio
(-) | altavoces no muy altos (#70.9 dB)
Graves 100 - 315 Hz
(±) | lubina reducida - en promedio 12.9% inferior a la mediana
(±) | la linealidad de los graves es media (14.3% delta a frecuencia anterior)
Medios 400 - 2000 Hz
(+) | medios equilibrados - a sólo 3.5% de la mediana
(±) | la linealidad de los medios es media (8.9% delta respecto a la frecuencia anterior)
Altos 2 - 16 kHz
(+) | máximos equilibrados - a sólo 2.3% de la mediana
(±) | la linealidad de los máximos es media (7.3% delta a frecuencia anterior)
Total 100 - 16.000 Hz
(±) | la linealidad del sonido global es media (16.2% de diferencia con la mediana)
En comparación con la misma clase
» 41% de todos los dispositivos probados de esta clase eran mejores, 7% similares, 51% peores
» El mejor tuvo un delta de 5%, la media fue 17%, el peor fue ###max##%
En comparación con todos los dispositivos probados
» 26% de todos los dispositivos probados eran mejores, 6% similares, 68% peores
» El mejor tuvo un delta de 4%, la media fue 23%, el peor fue ###max##%
| Off / Standby | |
| Ocioso | |
| Carga |
|
Clave:
min: | |
| HP Pavilion 15t-bc200 X7P44AV i7-7700HQ, GeForce GTX 1050 Mobile, Intel SSD 600p SSDPEKKW256G7, , 3840x2160, 15.6" | Dell XPS 15 9560 (i7-7700HQ, UHD) i7-7700HQ, GeForce GTX 1050 Mobile, Lite-On CX2-8B512-Q11, IGZO IPS, 3840x2160, 15.6" | HP Pavilion 15t-X7P42AV i7-7700HQ, GeForce GTX 1050 Mobile, Samsung CM871a MZNTY128HDHP, IPS, 1920x1080, 15.6" | Acer Aspire VN7-593G-73HP V15 Nitro BE i7-7700HQ, GeForce GTX 1060 Mobile, Seagate Mobile HDD 1TB ST1000LM035, AH-IPS, Normally Black, Transmissive, 1920x1080, 15.6" | Lenovo ThinkPad E570-20H6S00000 i5-7200U, GeForce GTX 950M, Toshiba THNSF5256GPUK, IPS LED, 1920x1080, 15.6" | |
|---|---|---|---|---|---|
| Power Consumption | -11% | 19% | 7% | 54% | |
| Idle Minimum * (Watt) | 11.4 | 11.9 -4% | 8.29 27% | 7.2 37% | 2.8 75% |
| Idle Average * (Watt) | 14.3 | 17.1 -20% | 8.9 38% | 10.5 27% | 6.3 56% |
| Idle Maximum * (Watt) | 14.3 | 17.3 -21% | 10.2 29% | 16 -12% | 6.9 52% |
| Load Average * (Watt) | 82.7 | 94.7 -15% | 77.1 7% | 82 1% | 51.6 38% |
| Load Maximum * (Watt) | 131.1 | 122 7% | 136.6 -4% | 155 -18% | 69.7 47% |
| Witcher 3 ultra * (Watt) | 104.8 | 124 |
* ... más pequeño es mejor
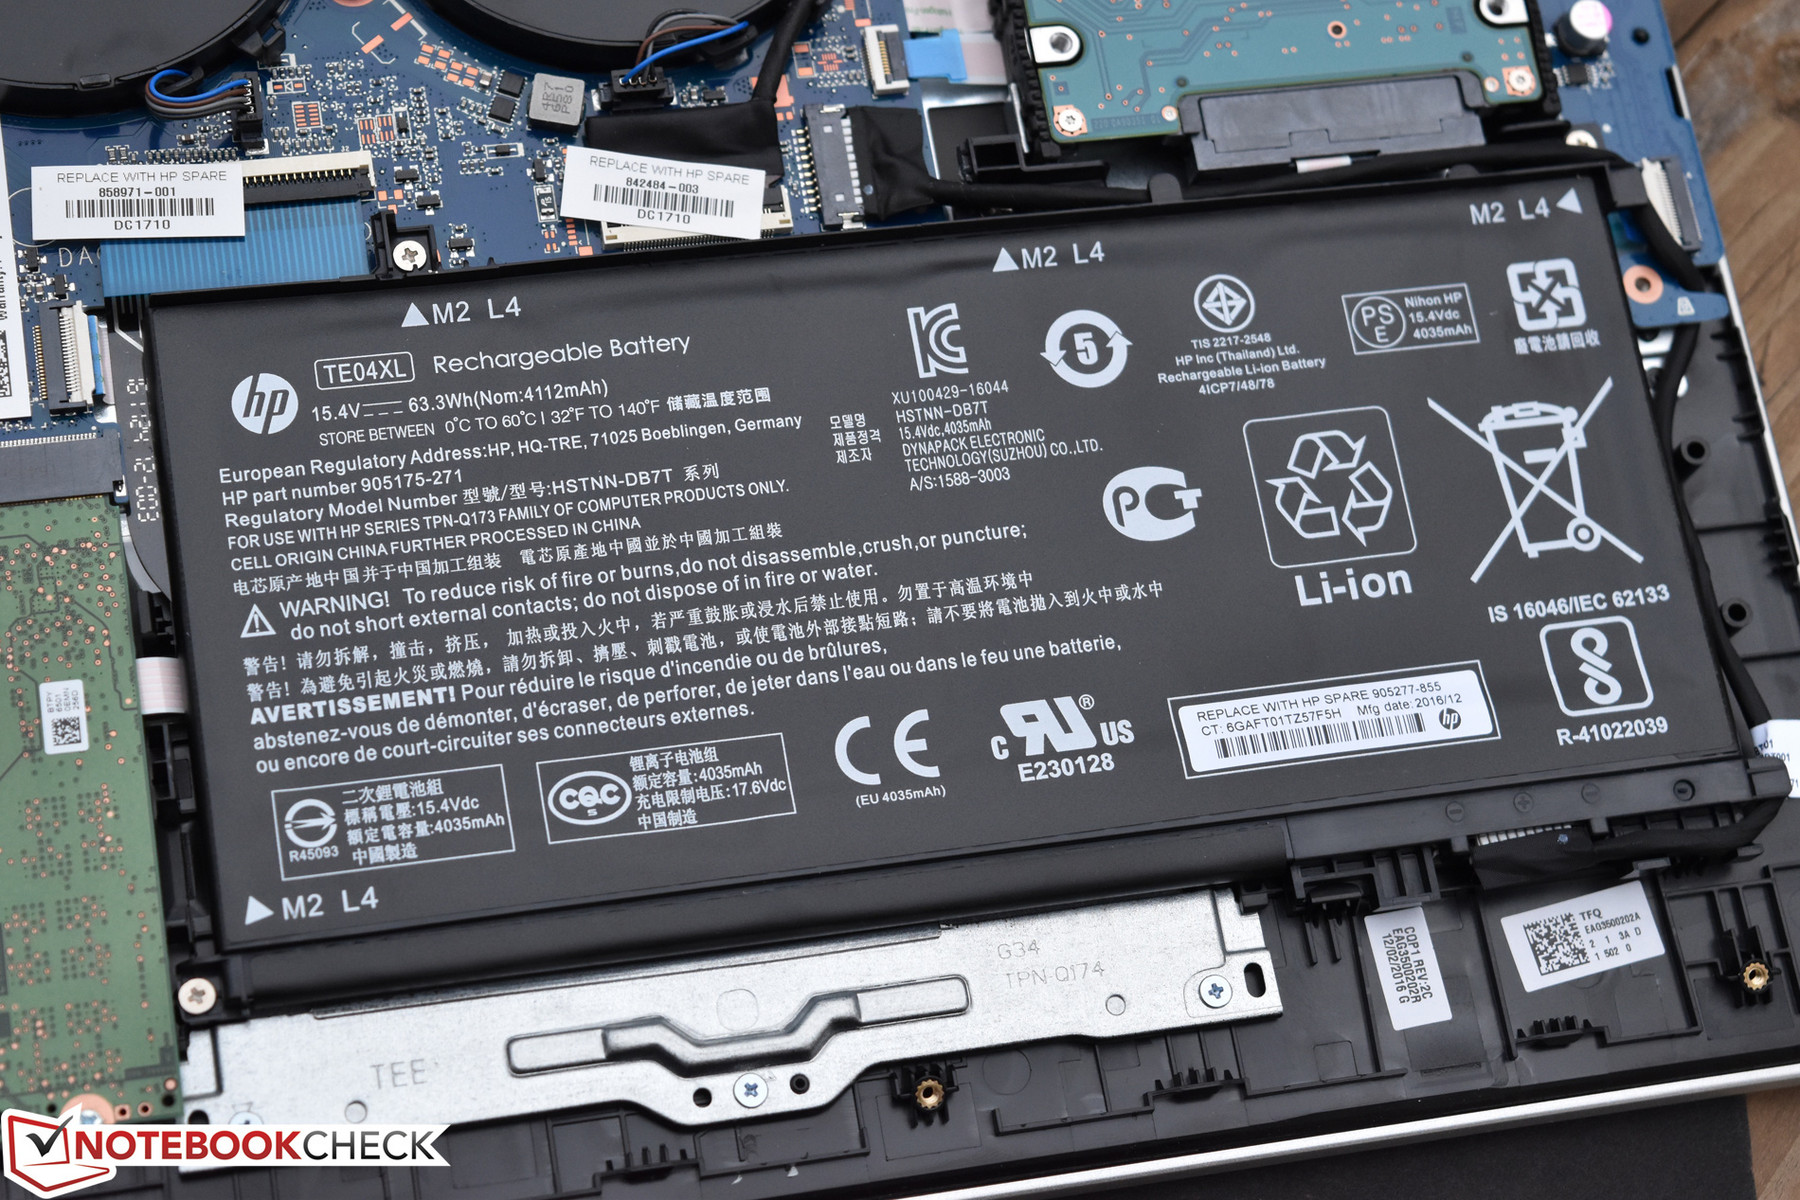
| HP Pavilion 15t-bc200 X7P44AV i7-7700HQ, GeForce GTX 1050 Mobile, 63.3 Wh | Dell XPS 15 9560 (i7-7700HQ, UHD) i7-7700HQ, GeForce GTX 1050 Mobile, 97 Wh | HP Pavilion 15t-X7P42AV i7-7700HQ, GeForce GTX 1050 Mobile, 63.3 Wh | Acer Aspire VN7-593G-73HP V15 Nitro BE i7-7700HQ, GeForce GTX 1060 Mobile, 69 Wh | Lenovo ThinkPad E570-20H6S00000 i5-7200U, GeForce GTX 950M, 41 Wh | |
|---|---|---|---|---|---|
| Duración de Batería | 41% | 48% | 28% | 59% | |
| Reader / Idle (h) | 9.2 | 13.9 51% | 16 74% | 8.4 -9% | 14.7 60% |
| WiFi v1.3 (h) | 4.5 | 7.2 60% | 6.5 44% | 6 33% | 7.7 71% |
| Load (h) | 1.5 | 1.7 13% | 1.9 27% | 2.4 60% | 2.2 47% |
Pro
Contra
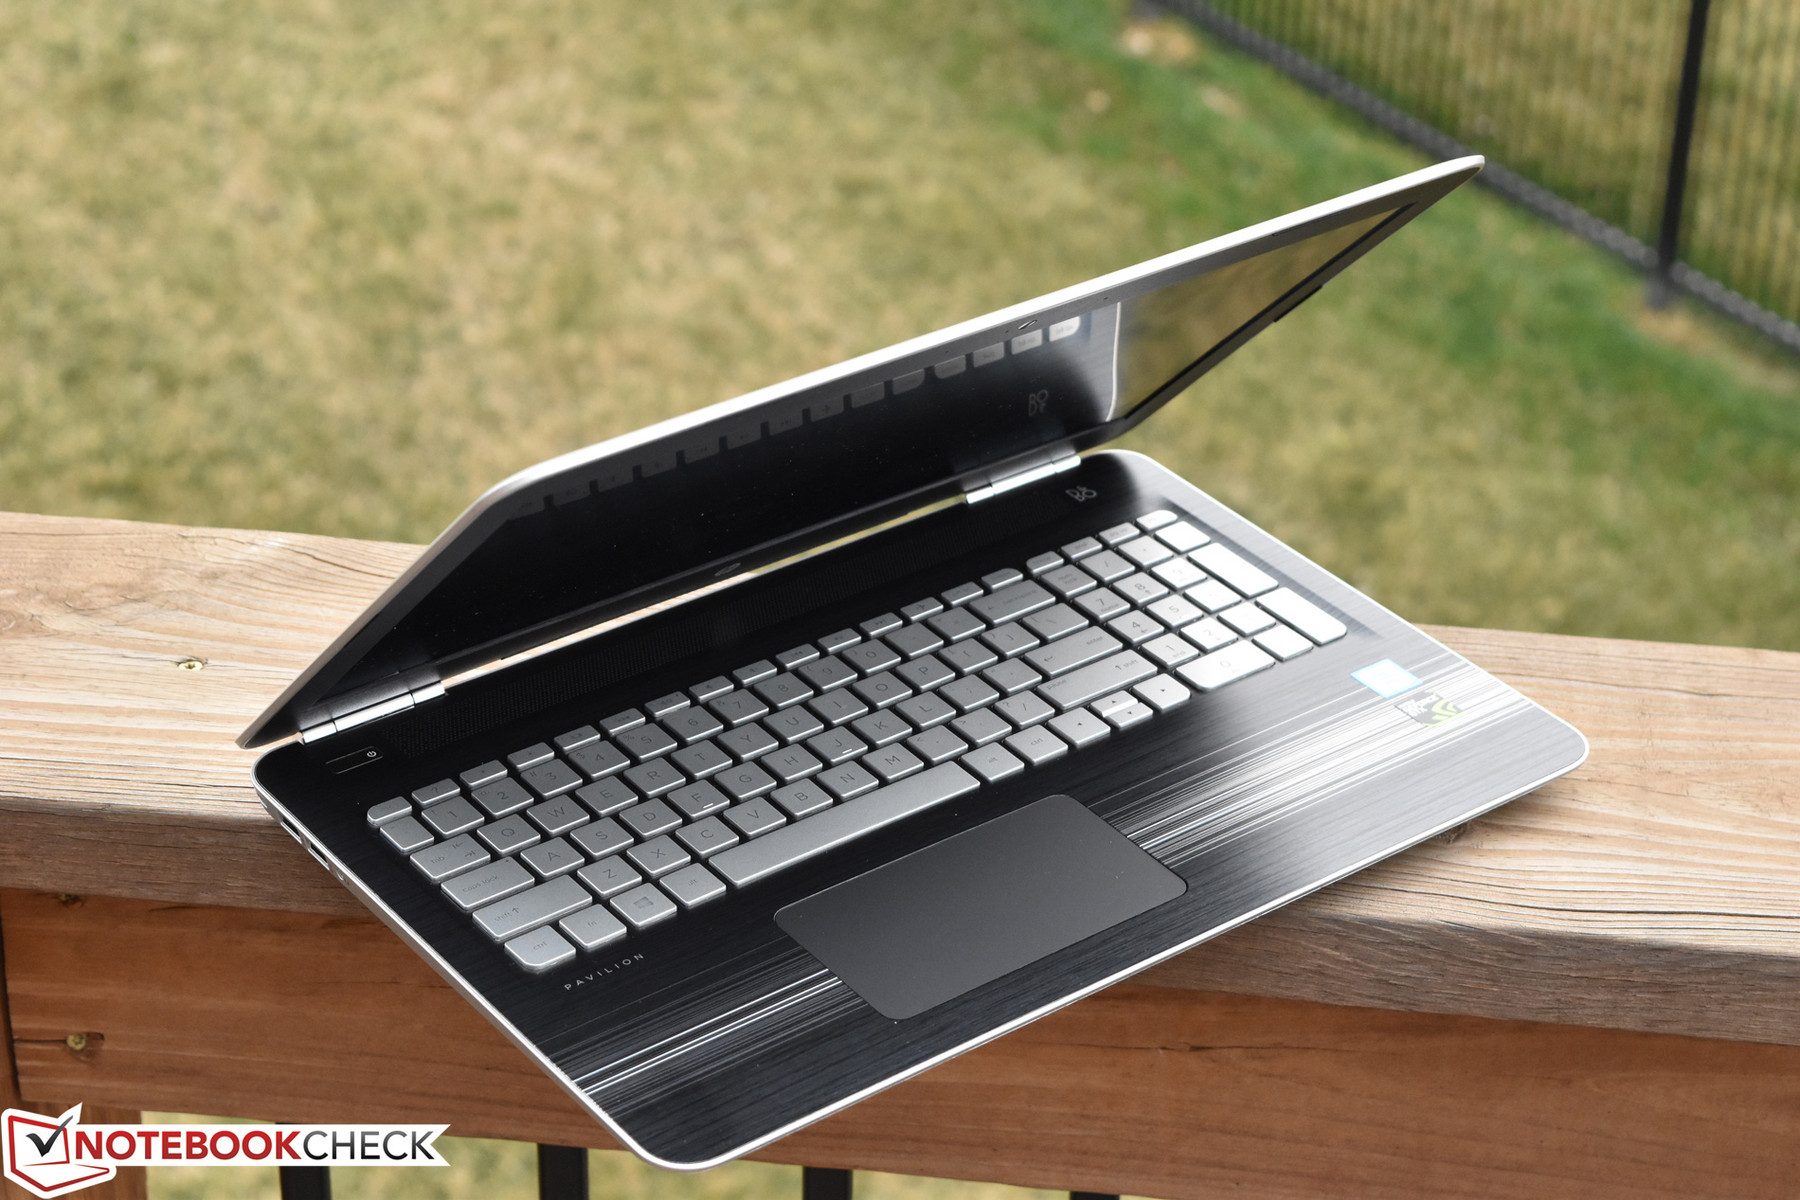

A pesar de su respetable rendimiento GPU (gracias a la GTX 1050) y buen rendimiento CPU en general, el HP Pavilion 15t que analizamos el año pasado tenía una buena ración de problemas—específicamente, limitaciones firmware desconcertantes que resultan en un rendimiento CPU inconsistente, cuelgues aleatorios durante el manejo, y una construcción plástica frágil. También traía un display mediocre con colores desvaídos y un brillo débil. Sin embargo, hasta cierto punto, algunos de esos problemas se podrían pasar por alto a la luz del precio relativamente asequible y el aceptable aguante de batería.
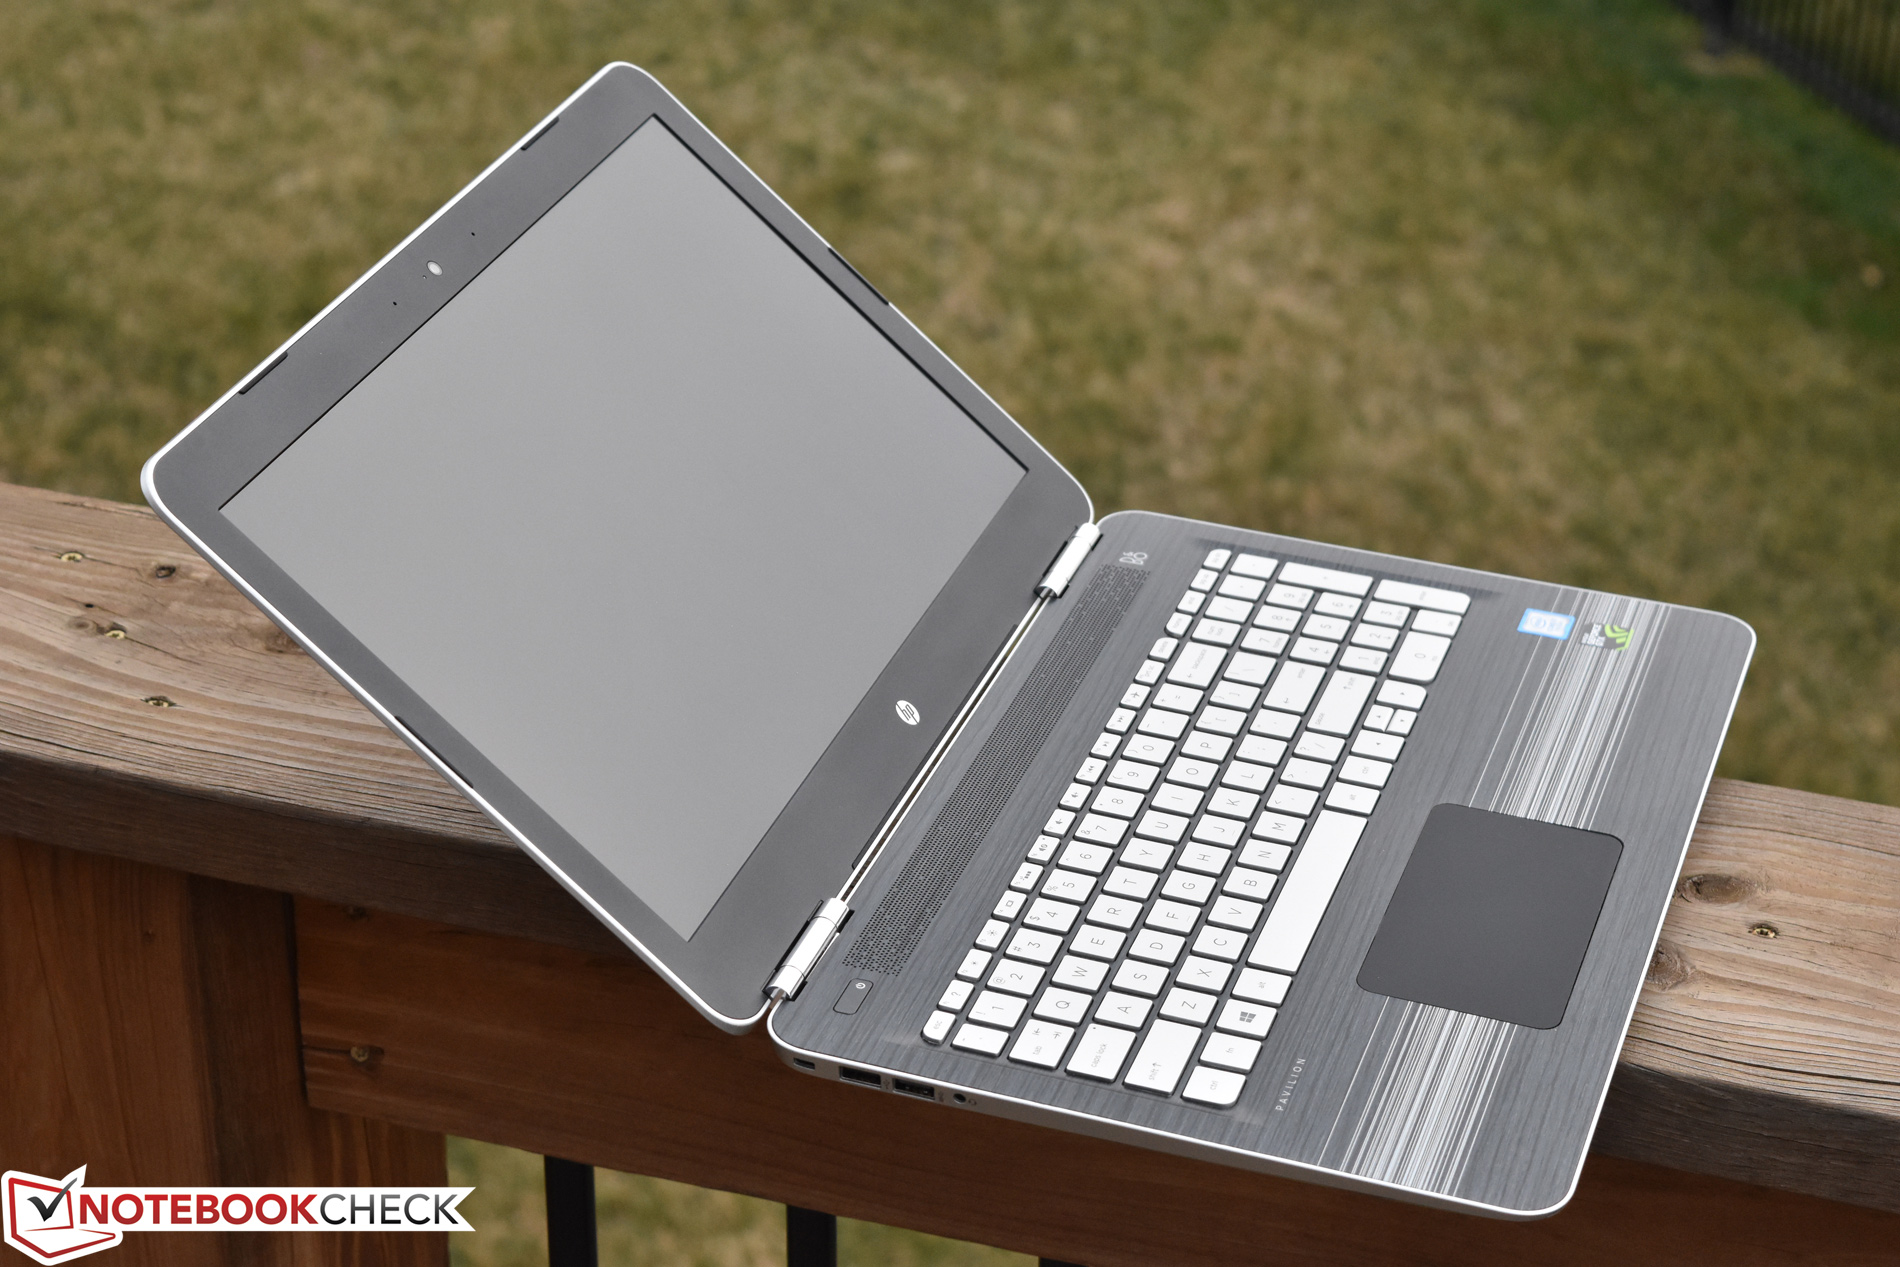
El Pavilion 15t de hoy aborda (mayormente) nuestras quejas sobre el display con un panel (falso-)UHD con unas saturación y reproducción de color geniales (con una precisión relativamente buena) y un brillo mejor. Es mucho más agradable de ver, aunque el brillo sigue siendo subpar y el contraste no es nada especial. Con todo, es una pantalla mucho mejor en general—toda una mejora. Por desgracia, su inclusión introduce dos nuevos negativos: aguante de batería reducido y un precio mucho más alto. Según nuestras pruebas, el aguante de batería se ha reducido en 2 horas a 4:30 (de 6:29 antes con el modelo FHD), y el aceptable precio de $800 se ha disparado a unos $1141 mucho menos atractivos. El precio más alto sitúa al Pavilion 15t en competeición directa con máquinas como Dell XPS 15 9560 (e incluso HP Spectre x360 15-bl002xx si el usuario no necesita una dGPU)—dispositivos indiscutiblemente superiores en comparación.
Los puntos fuertes del Pavilion 15t UHD son relativamente pocos comparado con otros dispositivos de su categoría y nivel de precio, y sus defectos son relativamente numerosos.
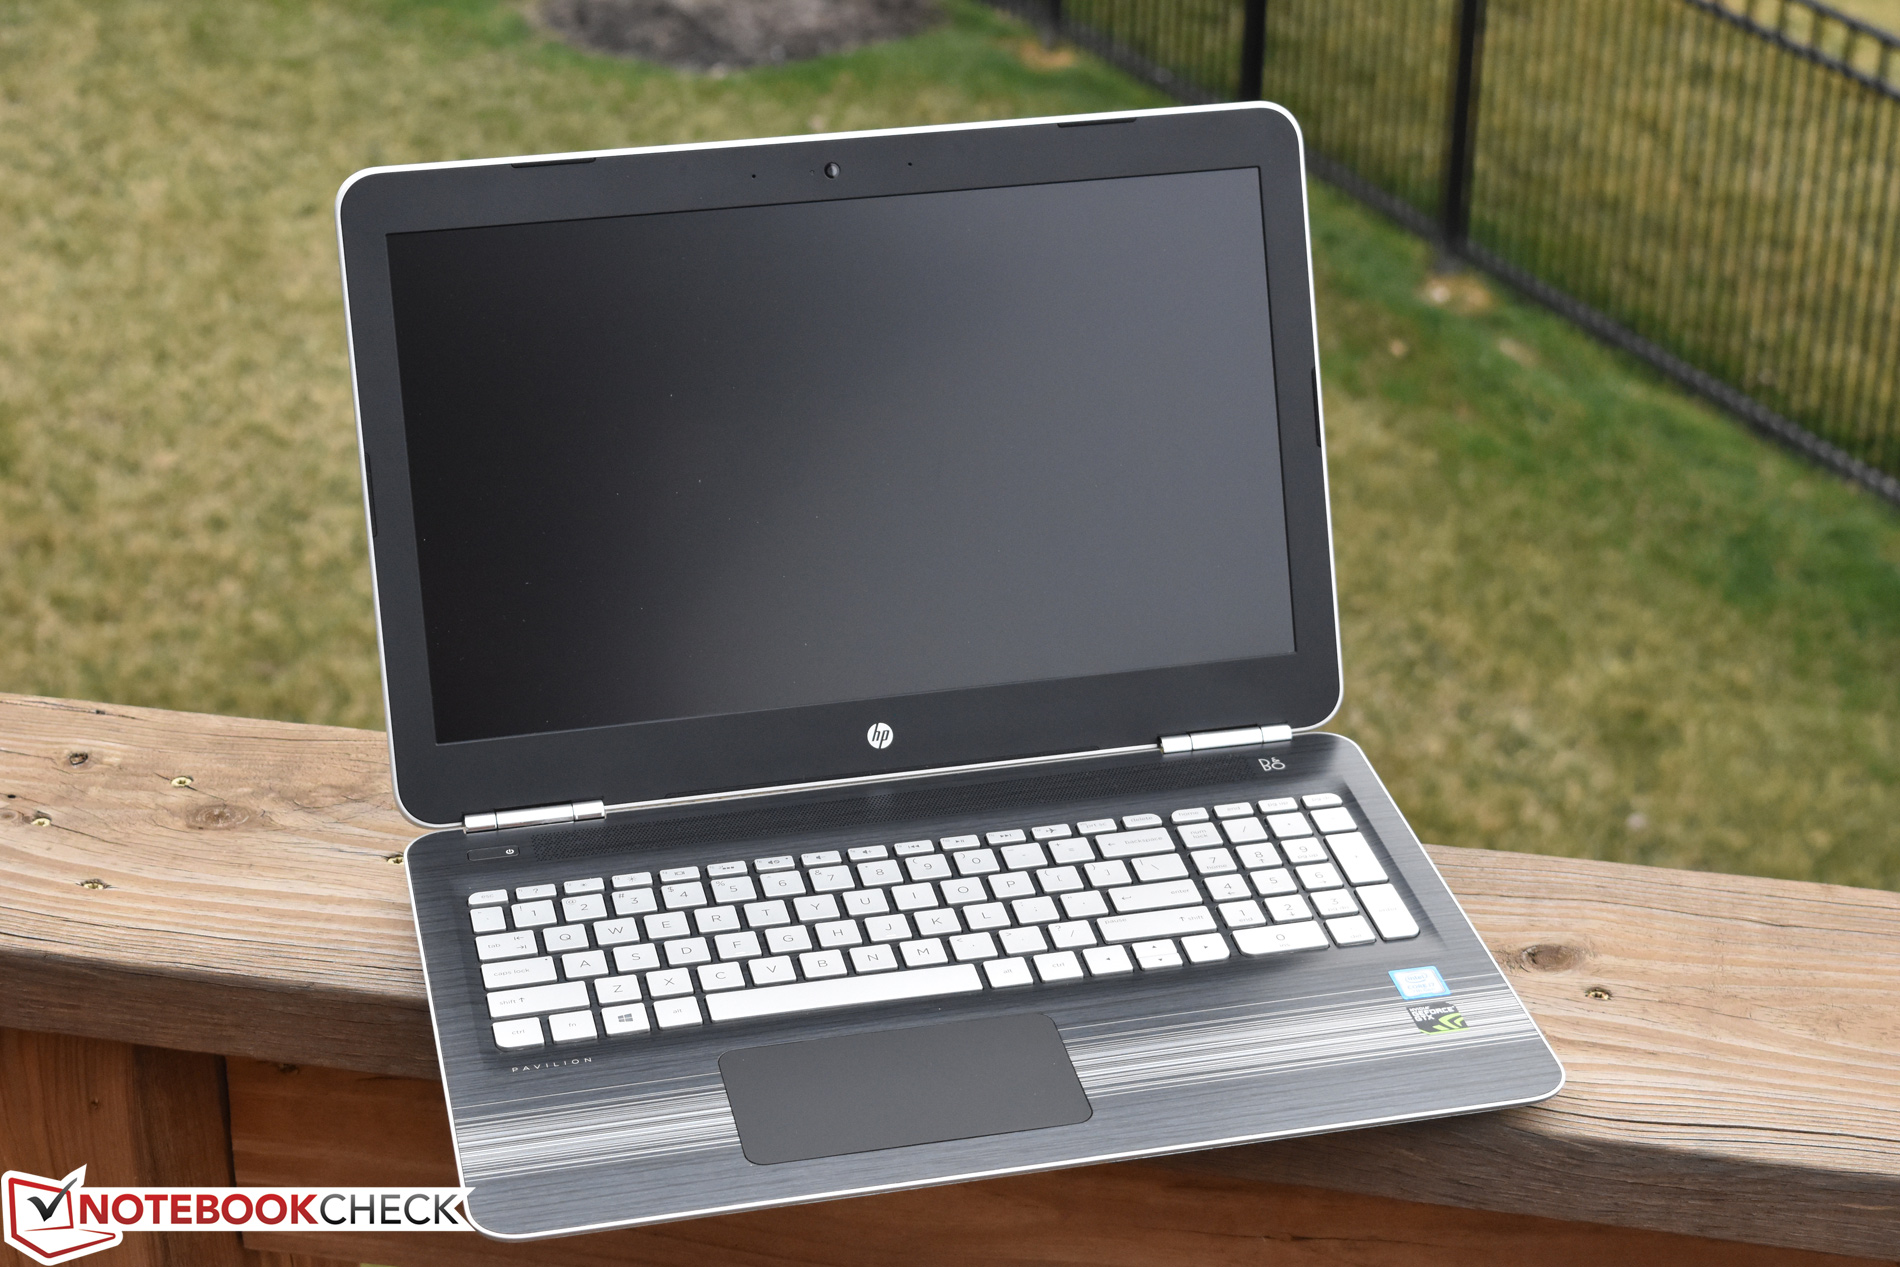
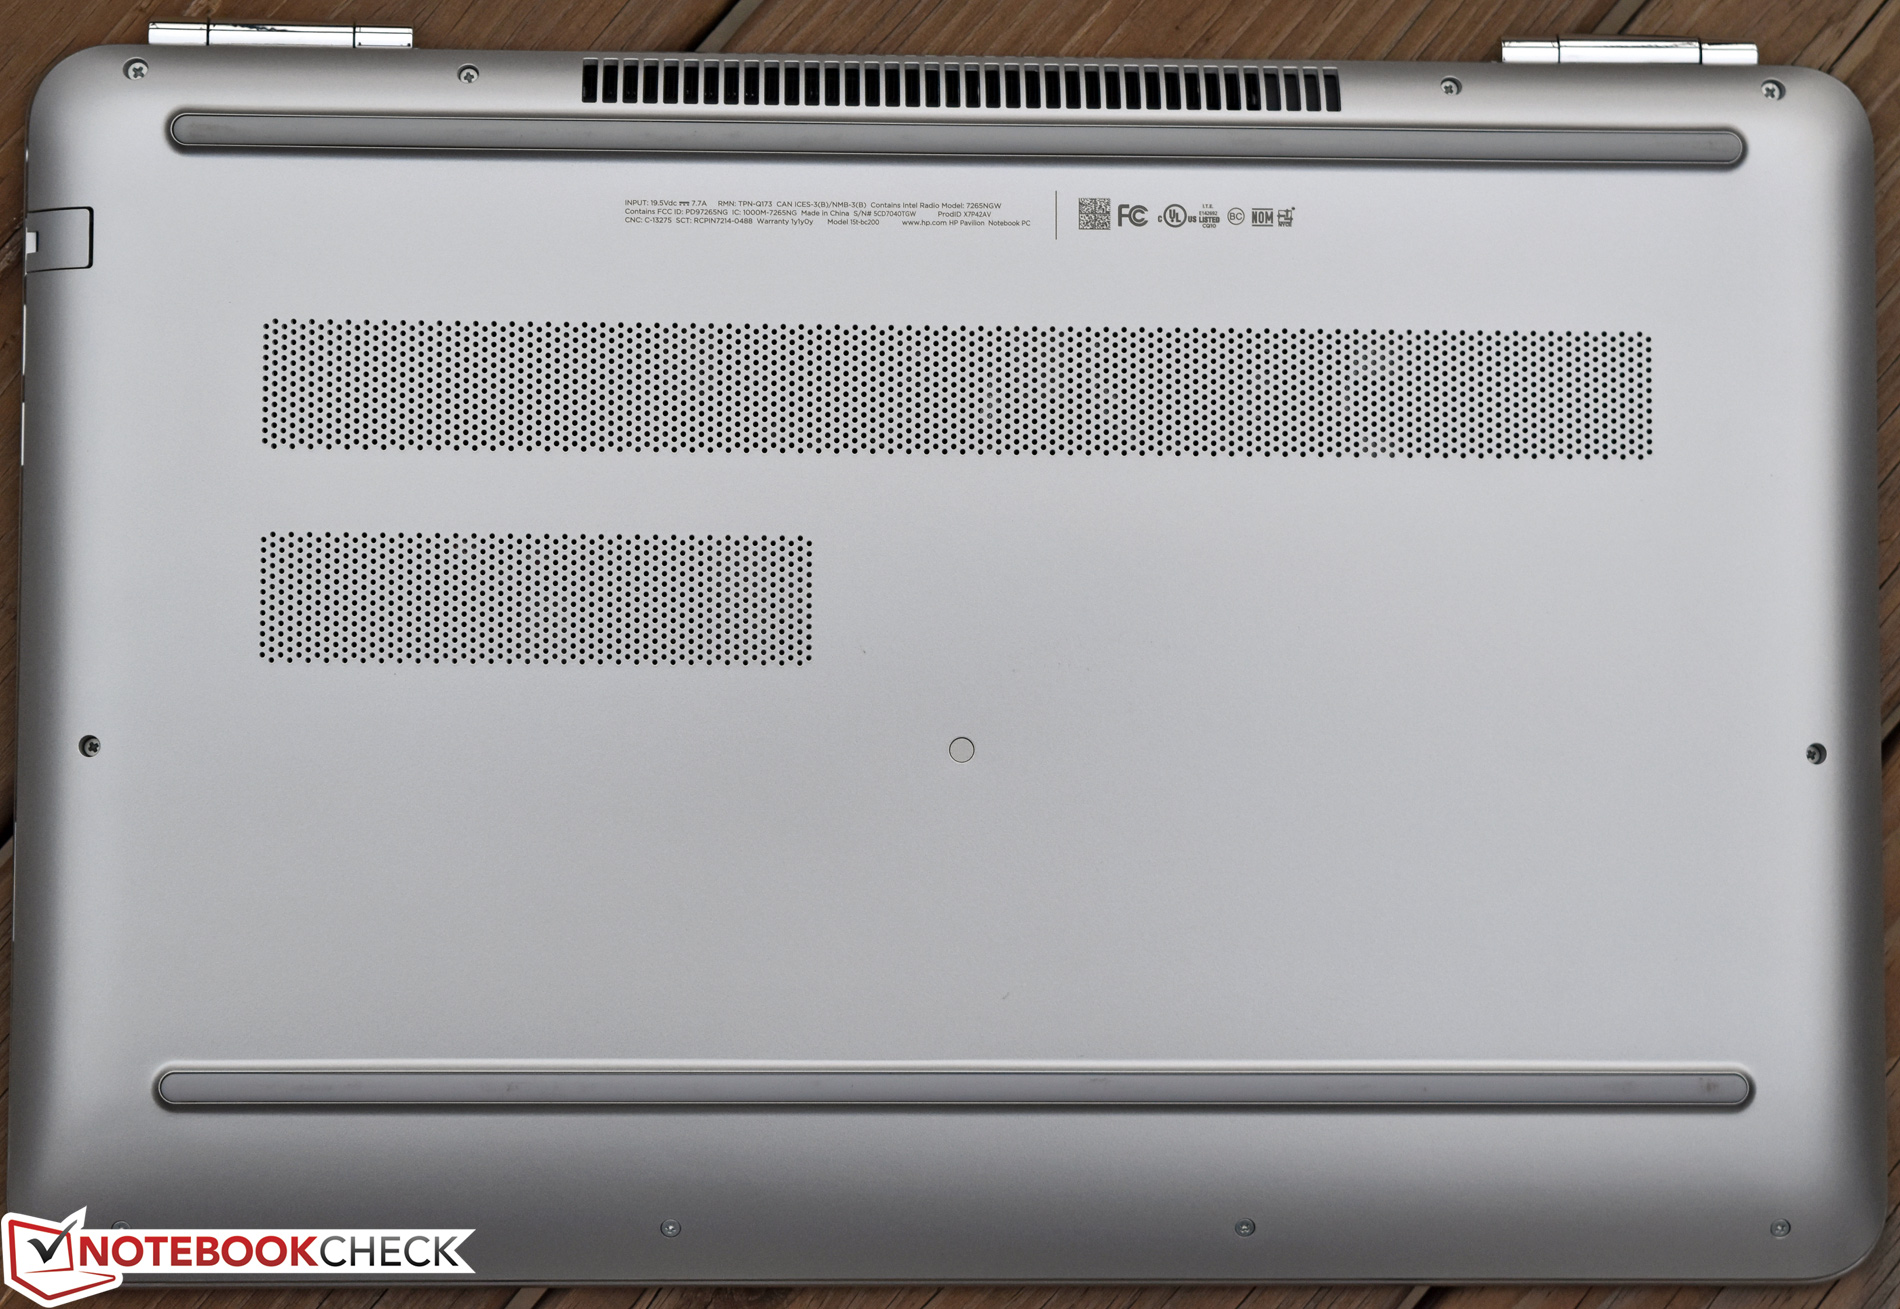
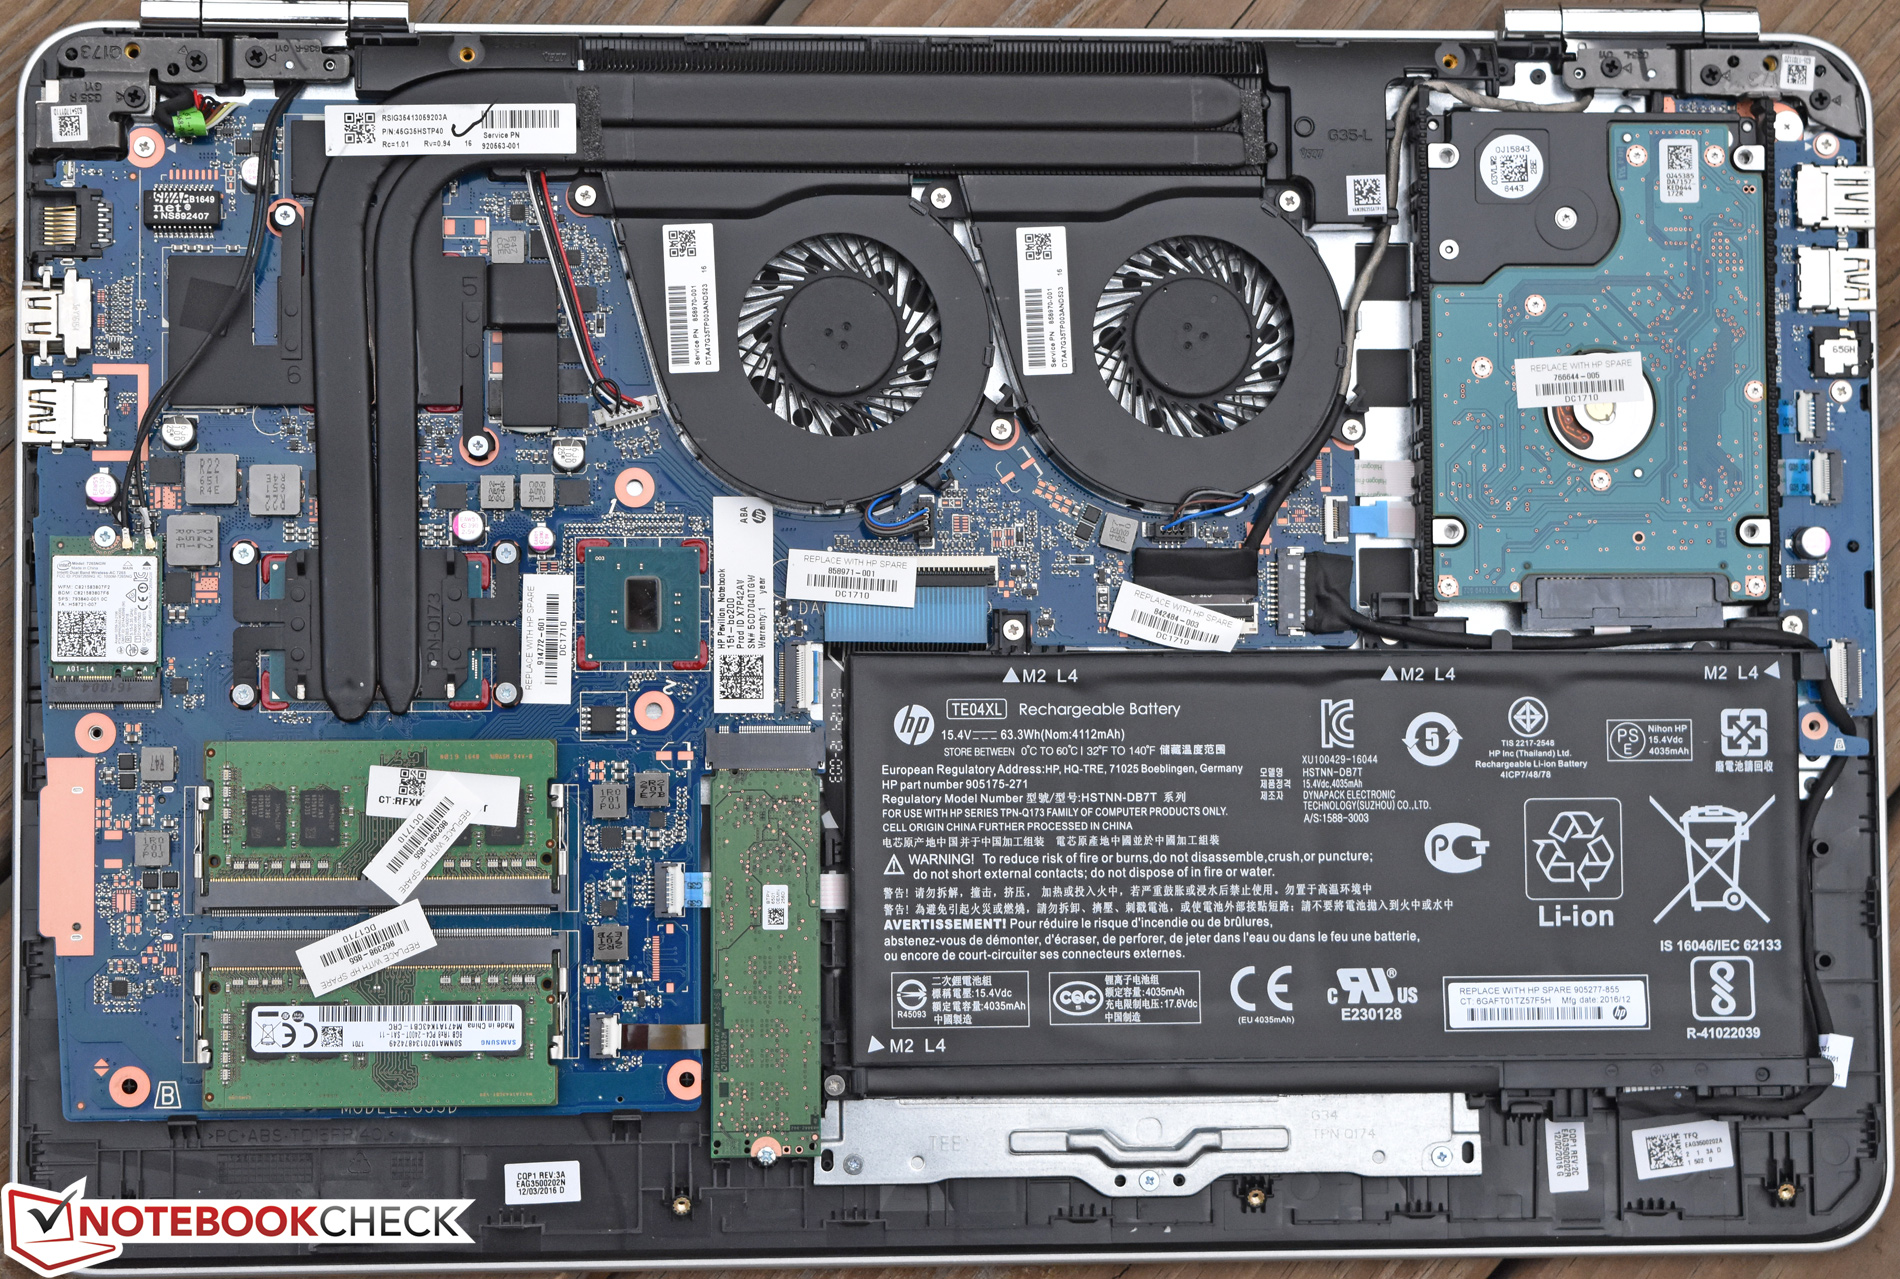
Lo que es más, el resto de defectos que listamos anteriormente sigue siendo válido para esta última configuración. La endeble construcción, las temperaturas desiguales, los dispositivos de entrada nada inspiradores, y el difícil mantenimiento son preocupaciones de peso —pero quizá la más importante de todas sea el rendimiento CPU inconsistente y los cuelgues aleatorios durante el manejo, que aún deben ser resueltos por HP con una actualización de la BIOS.
Por tanto, cuesta decidir para quién está pensado el Pavilion 15t UHD. Sus puntos fuertes son relativamente pocos comparado con otros dispositivos de su categoría y nivel de precio, y sus defectos son relativamente numerosos. Recomendaríamos buscar en otra parte; a este precio quizá un Dell XPS 15, HP Spectre, o Lenovo Yoga 720 irían mejor.
Ésta es una versión acortada del análisis original. Puedes leer el análisis completo en inglés aquí.
HP Pavilion 15t-bc200 X7P44AV
- 04/15/2017 v6 (old)
Steve Schardein
Price comparison
