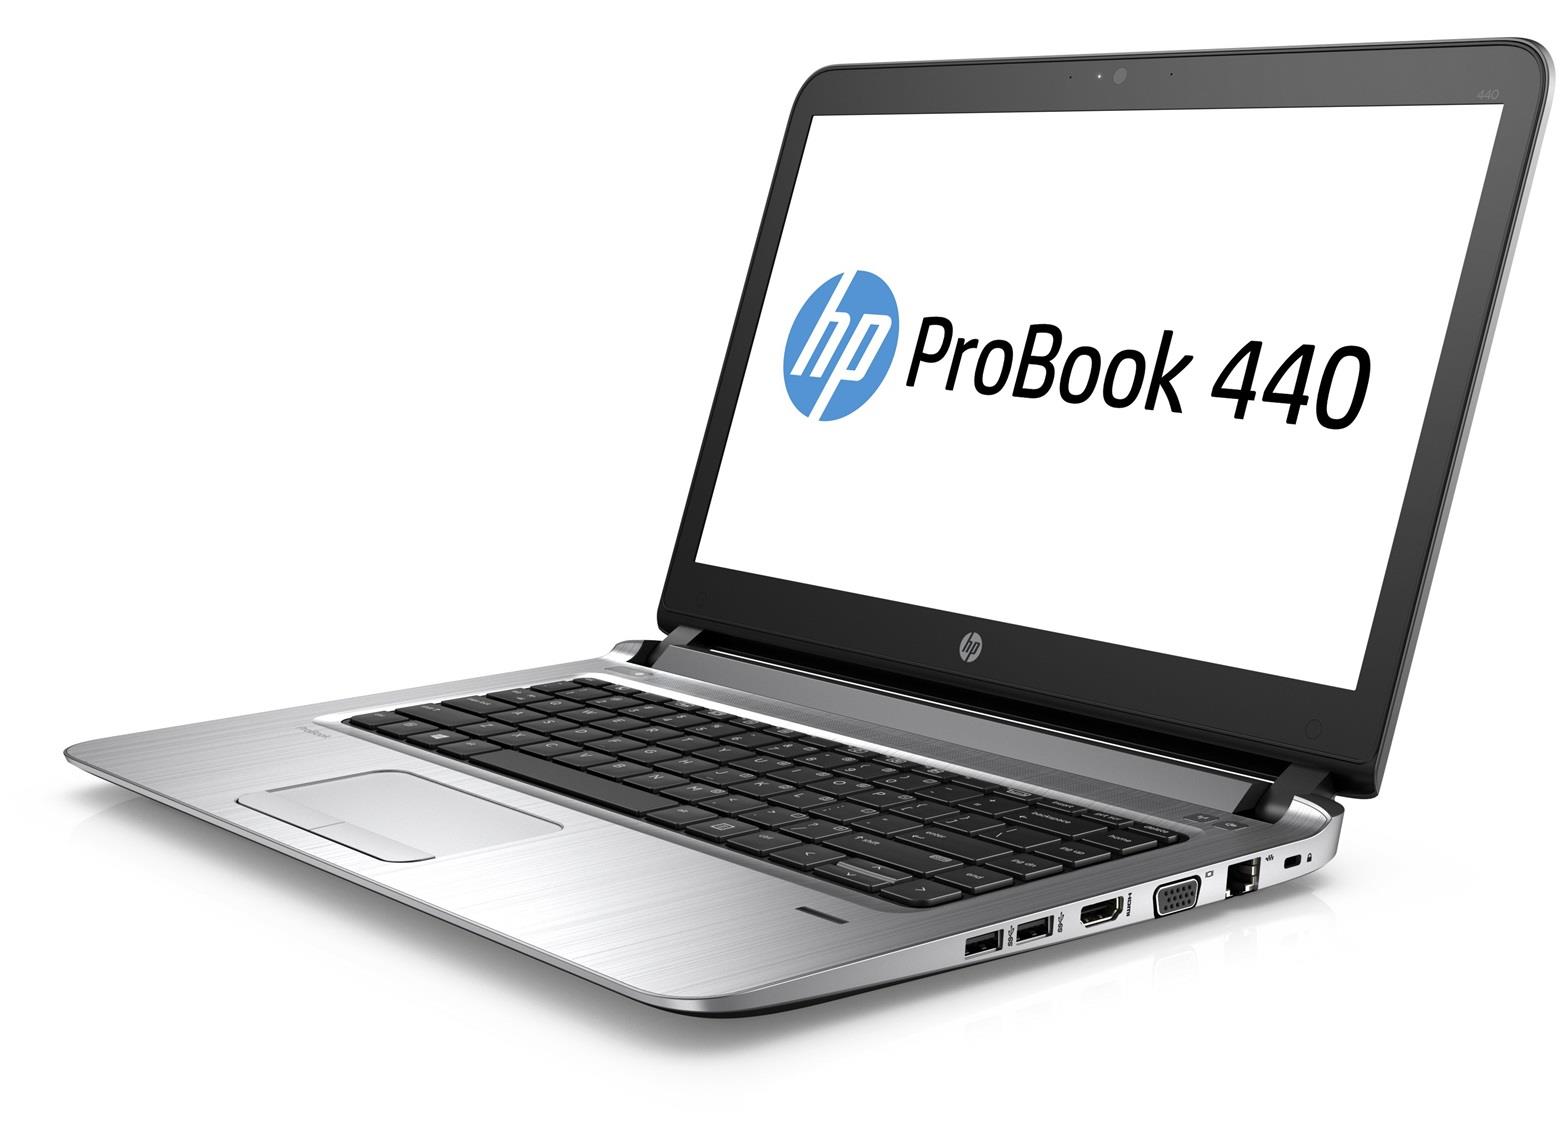
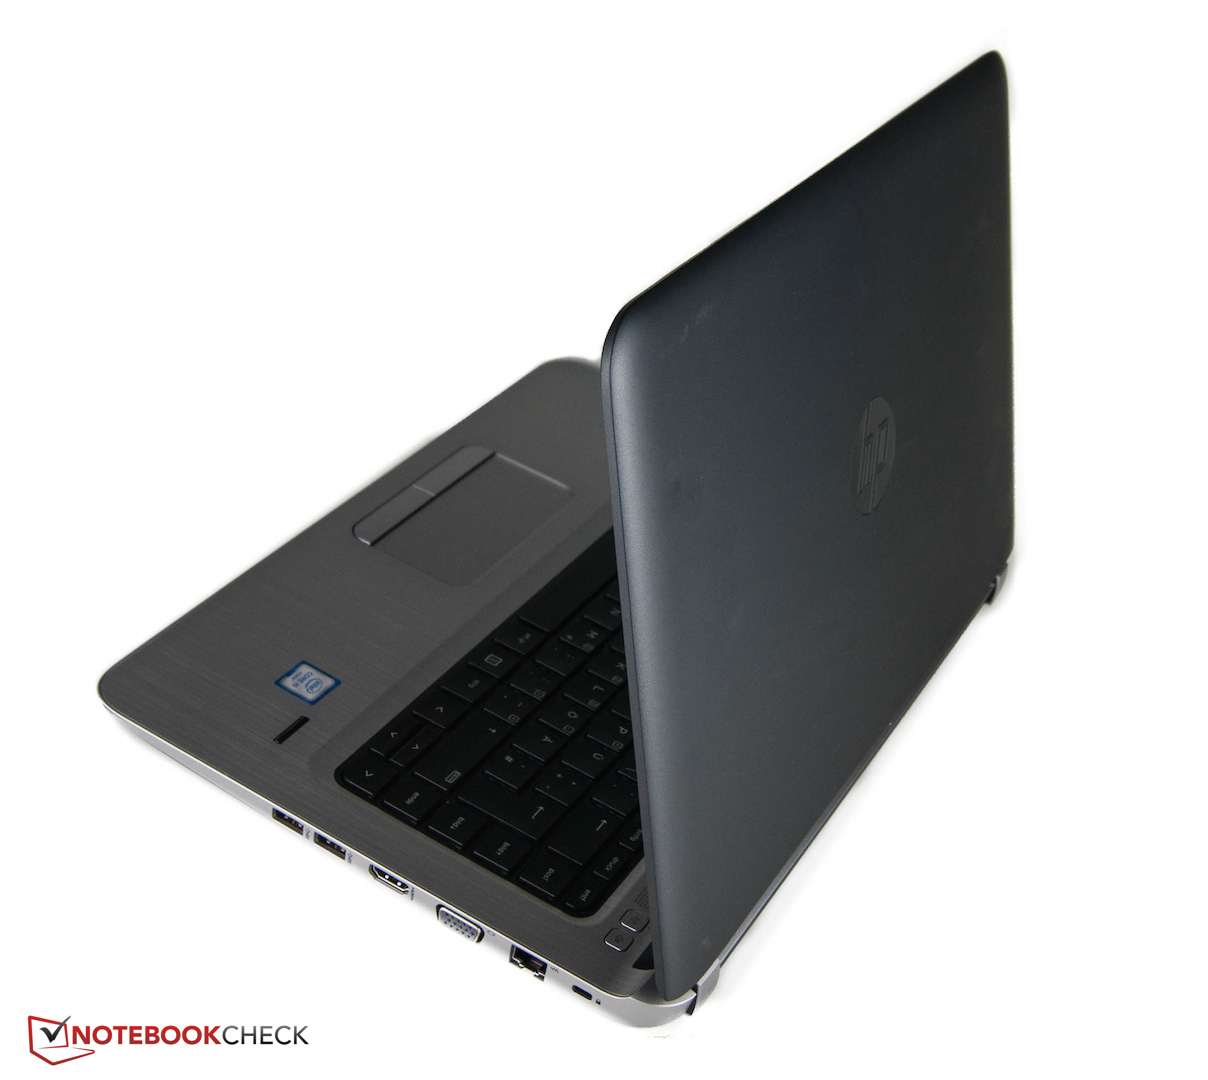
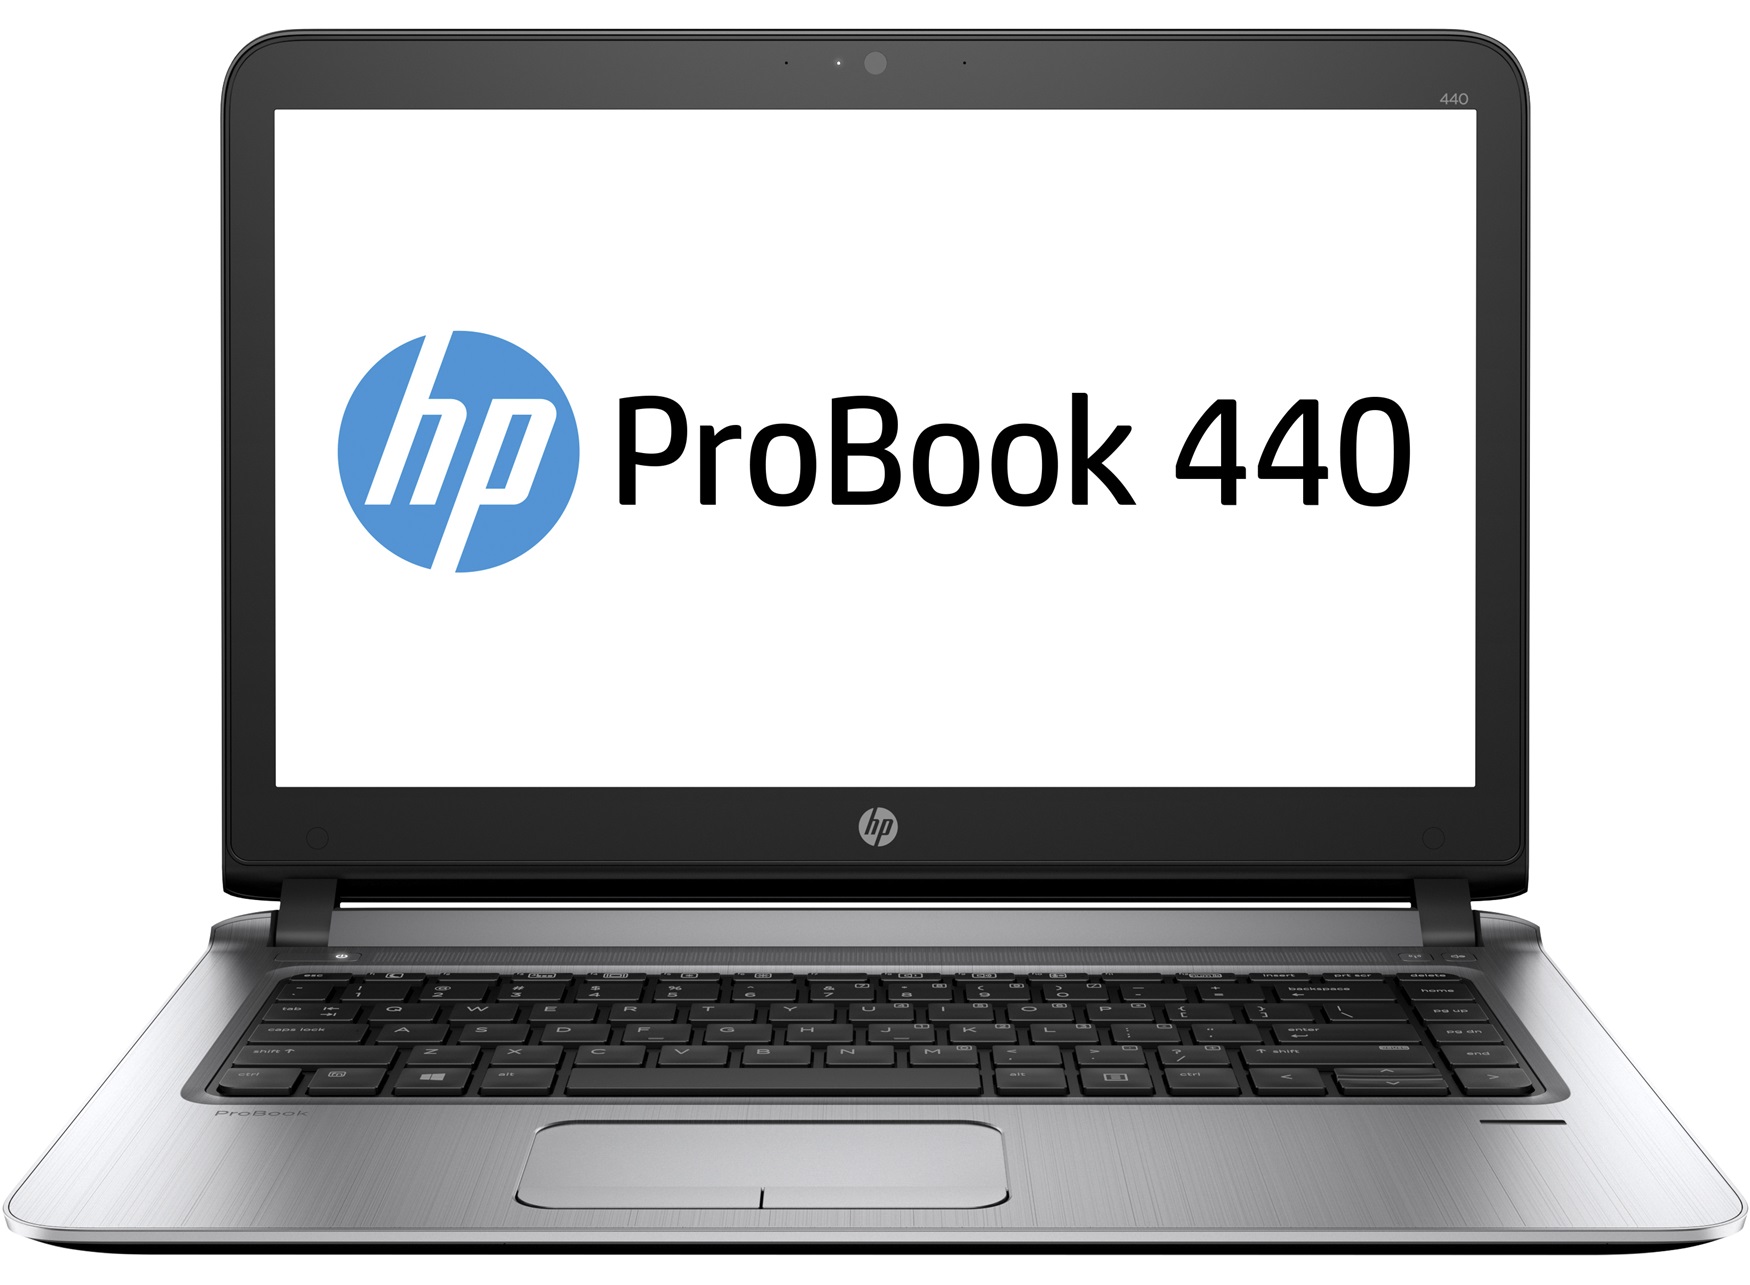
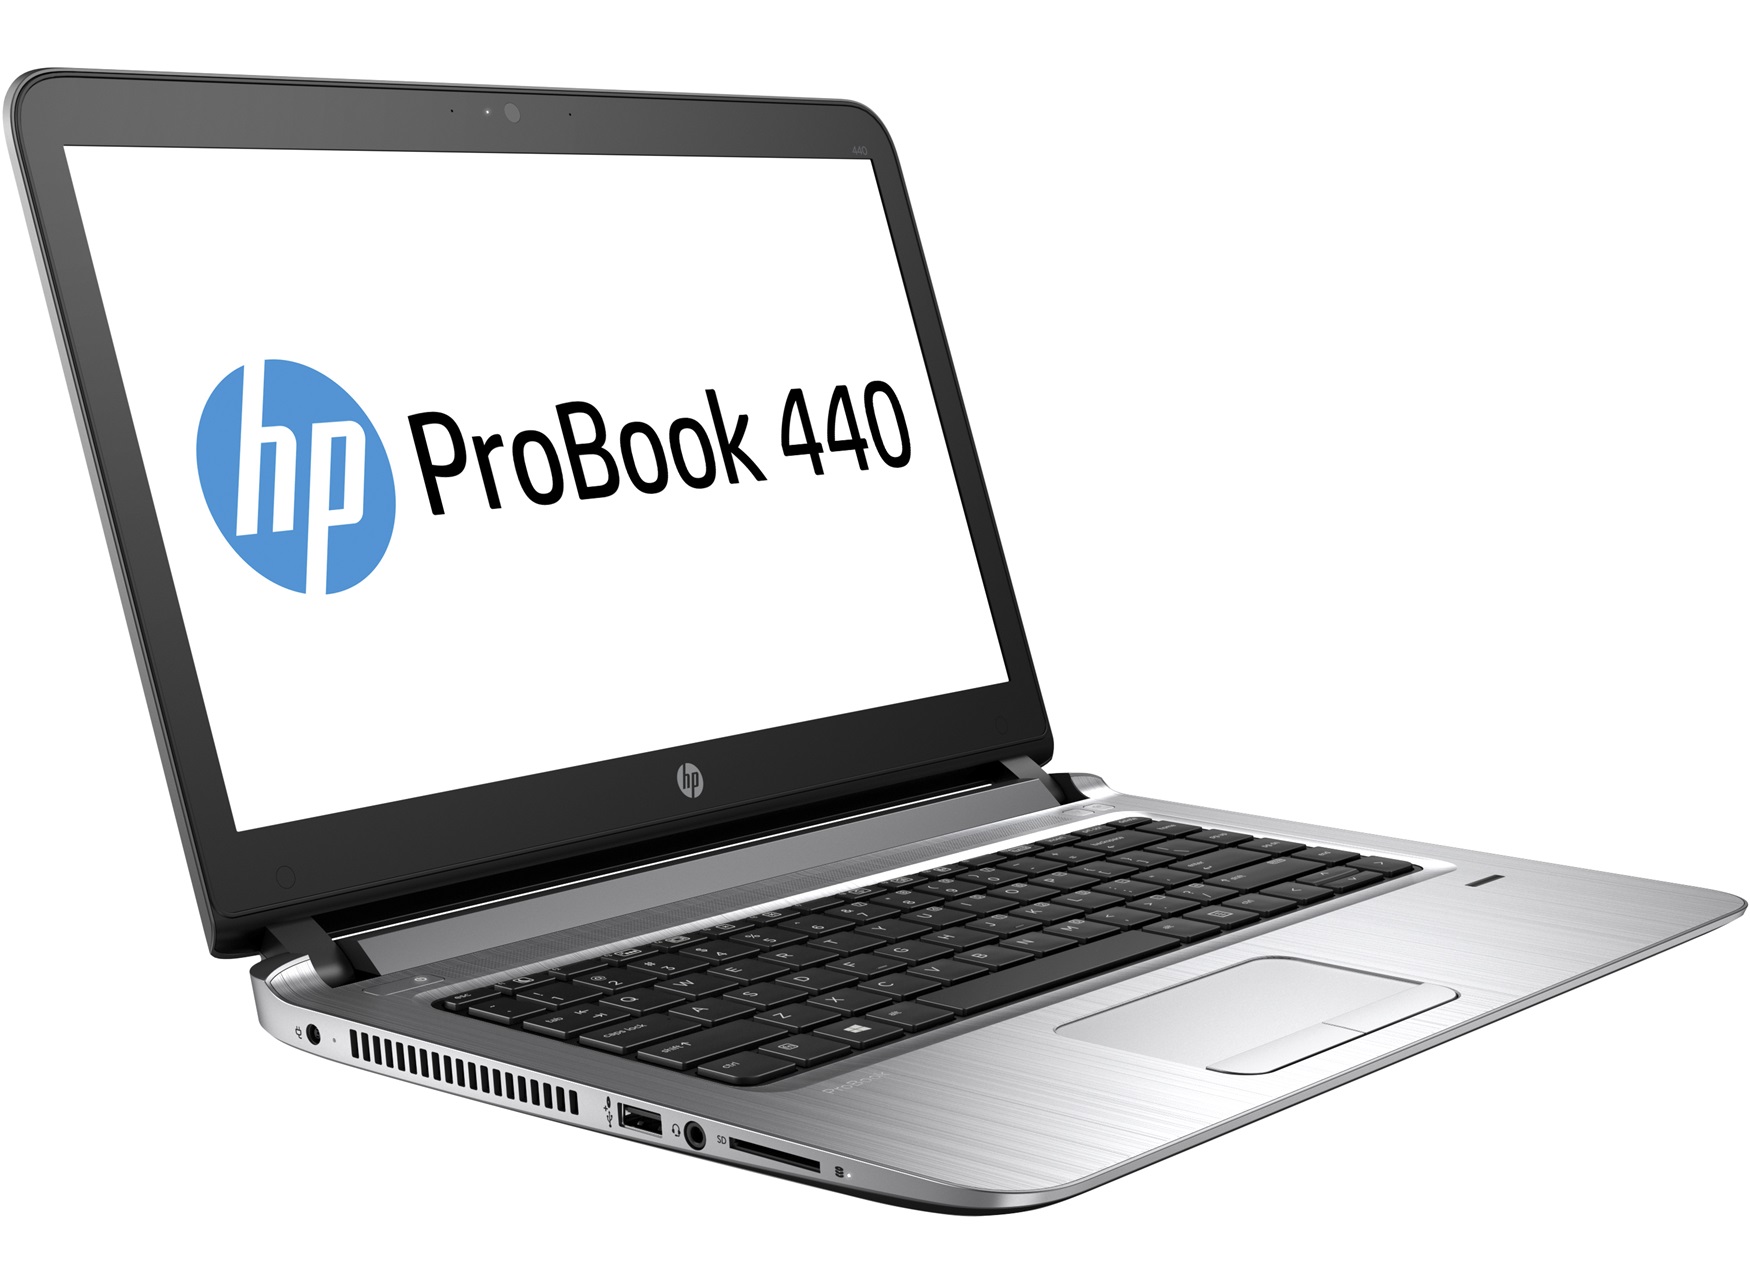
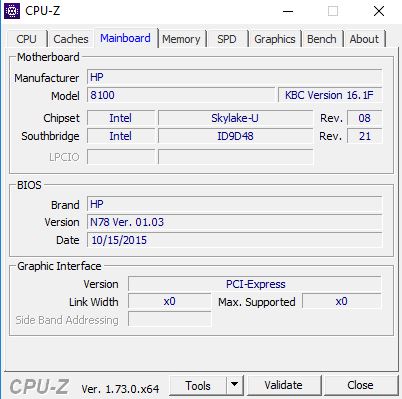
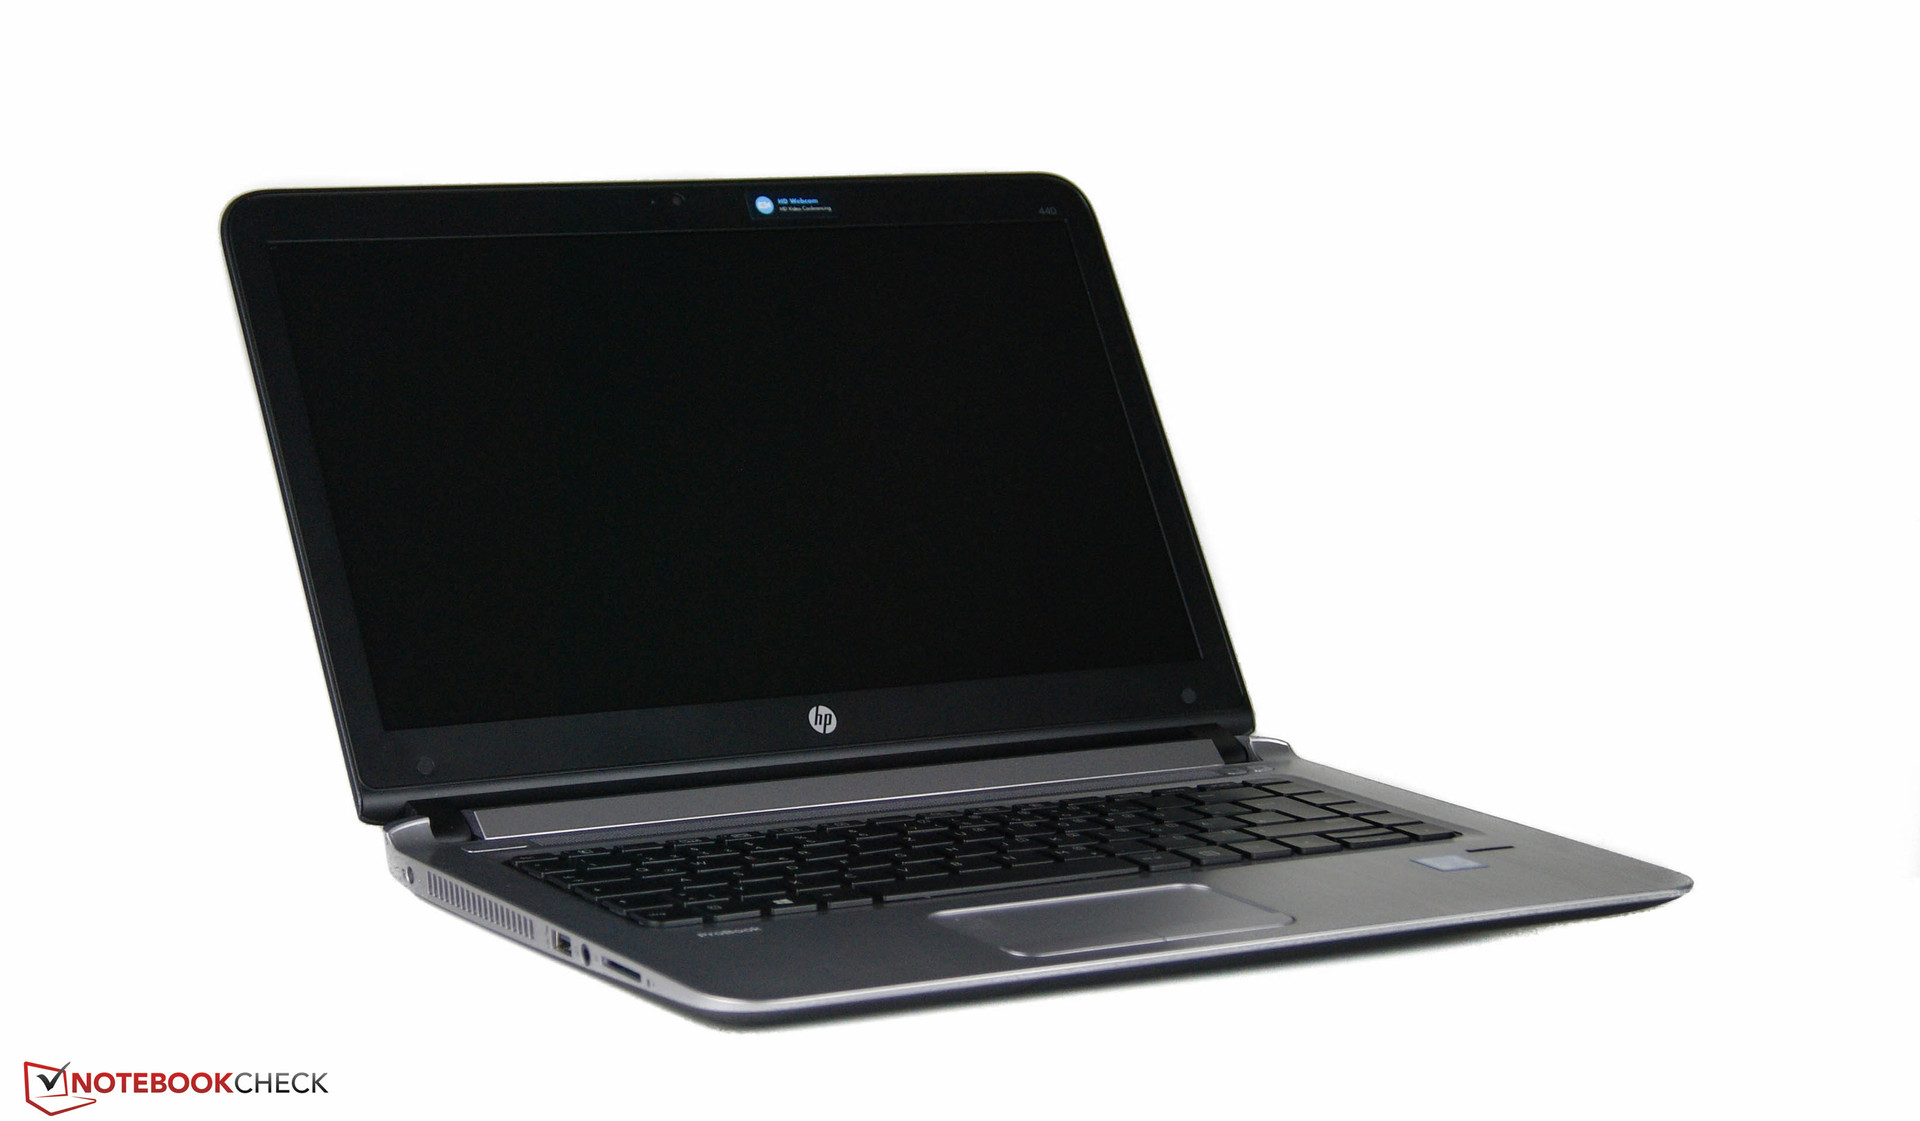
Breve análisis del HP ProBook 440 G3


| |||||||||||||||||||||||||
iluminación: 84 %
Brillo con batería: 244 cd/m²
Contraste: 492:1 (Negro: 0.5 cd/m²)
ΔE ColorChecker Calman: 8.6 | ∀{0.5-29.43 Ø4.72}
ΔE Greyscale Calman: 9.36 | ∀{0.09-98 Ø4.97}
59.1% sRGB (Argyll 1.6.3 3D)
37.8% AdobeRGB 1998 (Argyll 1.6.3 3D)
40.94% AdobeRGB 1998 (Argyll 3D)
59.1% sRGB (Argyll 3D)
39.6% Display P3 (Argyll 3D)
Gamma: 2.39
CCT: 11226 K
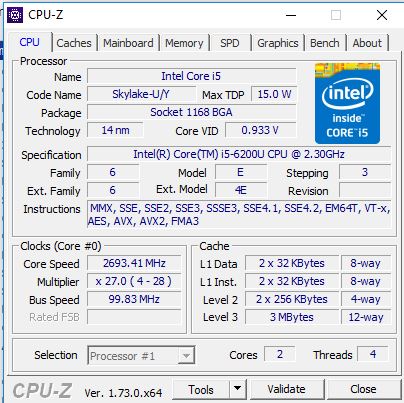
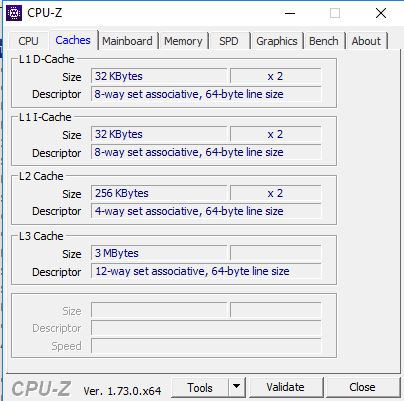
| HP ProBook 440 G3 HD Graphics 520, 6200U, Hitachi Travelstar Z7K500 HTS725050A7E630 | Lenovo ThinkPad E450 20DDS01E00 Radeon R7 M260, 5200U, Samsung CM871 MZ7LF192HCGS | Lenovo ThinkPad E460-20EUS00000 Radeon R7 M360, 6200U, Samsung CM871 MZ7LF192HCGS | Dell Latitude 3450-9723 HD Graphics 5500, 5200U, Toshiba MQ01ABD100 | Acer TravelMate P455-M-54204G50Makk HD Graphics 4400, 4200U, Seagate Momentus Thin ST500LT0 12-9WS142 | |
|---|---|---|---|---|---|
| Display | 2% | -1% | 64% | 30% | |
| Display P3 Coverage (%) | 39.6 | 40.37 2% | 39.1 -1% | 66.3 67% | 52.4 32% |
| sRGB Coverage (%) | 59.1 | 60.8 3% | 58.8 -1% | 93.4 58% | 75 27% |
| AdobeRGB 1998 Coverage (%) | 40.94 | 41.71 2% | 40.41 -1% | 67.9 66% | 53.8 31% |
| Response Times | 15% | ||||
| Response Time Grey 50% / Grey 80% * (ms) | 46 ? | 40 ? 13% | |||
| Response Time Black / White * (ms) | 27.6 ? | 23.2 ? 16% | |||
| PWM Frequency (Hz) | |||||
| Screen | -11% | 23% | 29% | -11% | |
| Brightness middle (cd/m²) | 246 | 218 -11% | 233 -5% | 303 23% | 195 -21% |
| Brightness (cd/m²) | 215 | 211 -2% | 221 3% | 273 27% | 201 -7% |
| Brightness Distribution (%) | 84 | 76 -10% | 88 5% | 83 -1% | 87 4% |
| Black Level * (cd/m²) | 0.5 | 0.53 -6% | 0.3 40% | 0.445 11% | 0.54 -8% |
| Contrast (:1) | 492 | 411 -16% | 777 58% | 681 38% | 361 -27% |
| Colorchecker dE 2000 * | 8.6 | 11.16 -30% | 4.43 48% | 3.94 54% | 11.16 -30% |
| Greyscale dE 2000 * | 9.36 | 12.58 -34% | 3.78 60% | 4.28 54% | 12.02 -28% |
| Gamma | 2.39 92% | 2.34 94% | 2.31 95% | 2.5 88% | 3.05 72% |
| CCT | 11226 58% | 14940 44% | 7171 91% | 7325 89% | 14187 46% |
| Color Space (Percent of AdobeRGB 1998) (%) | 37.8 | 39 3% | 37.3 -1% | 47.9 27% | |
| Color Space (Percent of sRGB) (%) | 59.1 | 61 3% | 58.7 -1% | ||
| Media total (Programa/Opciones) | -5% /
-8% | 12% /
17% | 47% /
40% | 10% /
0% |
* ... más pequeño es mejor
Tiempos de respuesta del display
| ↔ Tiempo de respuesta de Negro a Blanco | ||
|---|---|---|
| 27.6 ms ... subida ↗ y bajada ↘ combinada | ↗ 11.2 ms subida | 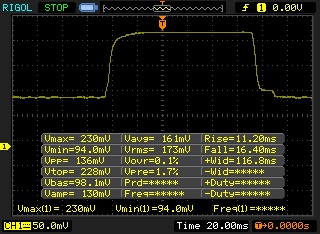 |
| ↘ 16.4 ms bajada | ||
| La pantalla mostró tiempos de respuesta relativamente lentos en nuestros tests pero podría ser demasiado lenta para los jugones. En comparación, todos los dispositivos de prueba van de ##min### (mínimo) a 240 (máximo) ms. » 70 % de todos los dispositivos son mejores. Eso quiere decir que el tiempo de respuesta es peor que la media (19.8 ms) de todos los dispositivos testados. | ||
| ↔ Tiempo de respuesta 50% Gris a 80% Gris | ||
| 46 ms ... subida ↗ y bajada ↘ combinada | ↗ 24 ms subida | 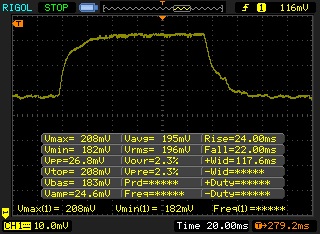 |
| ↘ 22 ms bajada | ||
| La pantalla mostró tiempos de respuesta lentos en nuestros tests y podría ser demasiado lenta para los jugones. En comparación, todos los dispositivos de prueba van de ##min### (mínimo) a 636 (máximo) ms. » 79 % de todos los dispositivos son mejores. Eso quiere decir que el tiempo de respuesta es peor que la media (31 ms) de todos los dispositivos testados. | ||
Parpadeo de Pantalla / PWM (Pulse-Width Modulation)
| Parpadeo de Pantalla / PWM no detectado | ||
Comparación: 52 % de todos los dispositivos testados no usaron PWM para atenuar el display. Si se usó, medimos una media de 7778 (mínimo: 5 - máxmo: 343500) Hz. | ||
| HP ProBook 440 G3 HD Graphics 520, 6200U, Hitachi Travelstar Z7K500 HTS725050A7E630 | HP ProBook 430 G3 P5T00ES HD Graphics 520, 6200U, Hitachi Travelstar Z7K500 HTS725050A7E630 | Lenovo ThinkPad E450 20DDS01E00 Radeon R7 M260, 5200U, Samsung CM871 MZ7LF192HCGS | Dell Latitude 3450-9723 HD Graphics 5500, 5200U, Toshiba MQ01ABD100 | Acer TravelMate P455-M-54204G50Makk HD Graphics 4400, 4200U, Seagate Momentus Thin ST500LT0 12-9WS142 | |
|---|---|---|---|---|---|
| PCMark 7 | |||||
| Score (Points) | 3022 | 2984 -1% | 4797 59% | 2856 -5% | 2344 -22% |
| PCMark 8 | 3% | 12% | -26% | ||
| Home Score Accelerated v2 (Points) | 2871 | 3043 6% | 3299 15% | 2028 -29% | |
| Creative Score Accelerated v2 (Points) | 3503 | 3390 -3% | |||
| Work Score Accelerated v2 (Points) | 3840 | 4106 7% | 4186 9% | 2973 -23% | |
| Media total (Programa/Opciones) | 1% /
2% | 36% /
28% | -5% /
-5% | -24% /
-25% |
| PCMark 7 Score | 3022 puntos | |
| PCMark 8 Home Score Accelerated v2 | 2871 puntos | |
| PCMark 8 Creative Score Accelerated v2 | 3503 puntos | |
| PCMark 8 Work Score Accelerated v2 | 3840 puntos | |
ayuda | ||
| HP ProBook 440 G3 HD Graphics 520, 6200U, Hitachi Travelstar Z7K500 HTS725050A7E630 | HP ProBook 430 G3 P5T00ES HD Graphics 520, 6200U, Hitachi Travelstar Z7K500 HTS725050A7E630 | Lenovo ThinkPad E450 20DDS01E00 Radeon R7 M260, 5200U, Samsung CM871 MZ7LF192HCGS | Dell Latitude 11 3150 HD Graphics (Bay Trail), N3540, Samsung SSD PM851 128 GB MZ7TE128HMGR | Acer TravelMate P455-M-54204G50Makk HD Graphics 4400, 4200U, Seagate Momentus Thin ST500LT0 12-9WS142 | |
|---|---|---|---|---|---|
| CrystalDiskMark 3.0 | -9% | 2271% | 2906% | -35% | |
| Read Seq (MB/s) | 124.8 | 94.8 -24% | 507 306% | 251.5 102% | 98.8 -21% |
| Write Seq (MB/s) | 123.6 | 93.5 -24% | 178.4 44% | 124.4 1% | 93.5 -24% |
| Read 512 (MB/s) | 42.34 | 39.56 -7% | 320.8 658% | 229.2 441% | 30.3 -28% |
| Write 512 (MB/s) | 61.9 | 53.8 -13% | 169.1 173% | 124.8 102% | 42.12 -32% |
| Read 4k (MB/s) | 0.559 | 0.57 2% | 19.49 3387% | 13.5 2315% | 0.351 -37% |
| Write 4k (MB/s) | 1.277 | 1.246 -2% | 37.27 2819% | 39.21 2970% | 0.648 -49% |
| Read 4k QD32 (MB/s) | 1.179 | 1.151 -2% | 96.1 8051% | 117.4 9858% | 0.768 -35% |
| Write 4k QD32 (MB/s) | 1.304 | 1.288 -1% | 36.91 2731% | 98.6 7461% | 0.621 -52% |

| 3DMark 11 Performance | 1238 puntos | |
| 3DMark Ice Storm Standard Score | 40501 puntos | |
| 3DMark Cloud Gate Standard Score | 4716 puntos | |
| 3DMark Fire Strike Score | 596 puntos | |
ayuda | ||
| Tomb Raider | |
| 1024x768 Low Preset (ordenar por valor) | |
| HP ProBook 440 G3 | |
| HP ProBook 430 G3 P5T00ES | |
| Lenovo ThinkPad E460-20EUS00000 | |
| Dell Latitude 3450-9723 | |
| Acer TravelMate P455-M-54204G50Makk | |
| Acer TravelMate P645-S-58HK | |
| 1366x768 Normal Preset AA:FX AF:4x (ordenar por valor) | |
| HP ProBook 440 G3 | |
| HP ProBook 430 G3 P5T00ES | |
| Lenovo ThinkPad E460-20EUS00000 | |
| Dell Latitude 3450-9723 | |
| Acer TravelMate P455-M-54204G50Makk | |
| Acer TravelMate P645-S-58HK | |
| FIFA 16 - 1280x720 Low Preset (ordenar por valor) | |
| HP ProBook 440 G3 | |
| HP ProBook 430 G3 P5T00ES | |
| BioShock Infinite | |
| 1280x720 Very Low Preset (ordenar por valor) | |
| HP ProBook 440 G3 | |
| 1366x768 Medium Preset (ordenar por valor) | |
| HP ProBook 440 G3 | |
| bajo | medio | alto | ultra | |
|---|---|---|---|---|
| Tomb Raider (2013) | 52.2 | 26.6 | 15.1 | 7.6 |
| BioShock Infinite (2013) | 32.7 | 19.35 | 15.45 | 4.73 |
| FIFA 16 (2015) | 29 |
| HP ProBook 440 G3 HD Graphics 520, 6200U, Hitachi Travelstar Z7K500 HTS725050A7E630 | Lenovo ThinkPad E450 20DDS01E00 Radeon R7 M260, 5200U, Samsung CM871 MZ7LF192HCGS | Dell Latitude 3450-9723 HD Graphics 5500, 5200U, Toshiba MQ01ABD100 | Acer TravelMate P455-M-54204G50Makk HD Graphics 4400, 4200U, Seagate Momentus Thin ST500LT0 12-9WS142 | Acer TravelMate P645-S-58HK HD Graphics 5500, 5200U, Kingston RBU-SNS8100S3256GD | |
|---|---|---|---|---|---|
| Noise | -14% | -11% | -2% | -3% | |
| Idle Minimum * (dB) | 29.7 | 29.6 -0% | 32.7 -10% | 30.5 -3% | 29.6 -0% |
| Idle Average * (dB) | 29.7 | 34.5 -16% | 32.7 -10% | 31.2 -5% | 29.6 -0% |
| Idle Maximum * (dB) | 29.7 | 34.8 -17% | 32.7 -10% | 31.2 -5% | 30.2 -2% |
| Load Average * (dB) | 32.7 | 40.3 -23% | 34.4 -5% | 32.5 1% | 35.6 -9% |
| Load Maximum * (dB) | 35.1 | 40.3 -15% | 41.9 -19% | 34.7 1% | 35.9 -2% |
* ... más pequeño es mejor
Ruido
| Ocioso |
| 29.7 / 29.7 / 29.7 dB(A) |
| HDD |
| 30.3 dB(A) |
| Carga |
| 32.7 / 35.1 dB(A) |
 | ||
30 dB silencioso 40 dB(A) audible 50 dB(A) ruidosamente alto |
||
min: | ||
(±) La temperatura máxima en la parte superior es de 41.4 °C / 107 F, frente a la media de 34.3 °C / 94 F, que oscila entre 21.2 y 62.5 °C para la clase Office.
(-) El fondo se calienta hasta un máximo de 50.2 °C / 122 F, frente a la media de 36.8 °C / 98 F
(+) En reposo, la temperatura media de la parte superior es de 30.6 °C / 87# F, frente a la media del dispositivo de 29.5 °C / 85 F.
(+) El reposamanos y el panel táctil están a una temperatura inferior a la de la piel, con un máximo de 29.9 °C / 85.8 F y, por tanto, son fríos al tacto.
(-) La temperatura media de la zona del reposamanos de dispositivos similares fue de 27.5 °C / 81.5 F (-2.4 °C / -4.3 F).
| HP ProBook 440 G3 HD Graphics 520, 6200U, Hitachi Travelstar Z7K500 HTS725050A7E630 | HP ProBook 430 G3 P5T00ES HD Graphics 520, 6200U, Hitachi Travelstar Z7K500 HTS725050A7E630 | Dell Latitude 3450-9723 HD Graphics 5500, 5200U, Toshiba MQ01ABD100 | Lenovo ThinkPad E450 20DCW048PB HD Graphics 5500, 5200U, Samsung SSD 850 EVO 250GB | |
|---|---|---|---|---|
| Power Consumption | 9% | -7% | -3% | |
| Idle Minimum * (Watt) | 5.2 | 4.7 10% | 6.1 -17% | 2.7 48% |
| Idle Average * (Watt) | 8.2 | 7.2 12% | 8.4 -2% | 8.7 -6% |
| Idle Maximum * (Watt) | 9 | 8.3 8% | 9.4 -4% | 15.8 -76% |
| Load Average * (Watt) | 28.8 | 26.4 8% | 32.2 -12% | 26.8 7% |
| Load Maximum * (Watt) | 34 | 32 6% | 33.6 1% | 30.4 11% |
* ... más pequeño es mejor
| Off / Standby | |
| Ocioso | |
| Carga |
|
Clave:
min: | |
| HP ProBook 440 G3 HD Graphics 520, 6200U, Hitachi Travelstar Z7K500 HTS725050A7E630 | HP ProBook 430 G3 P5T00ES HD Graphics 520, 6200U, Hitachi Travelstar Z7K500 HTS725050A7E630 | Dell Latitude 3450-9723 HD Graphics 5500, 5200U, Toshiba MQ01ABD100 | Acer TravelMate P455-M-54204G50Makk HD Graphics 4400, 4200U, Seagate Momentus Thin ST500LT0 12-9WS142 | Acer TravelMate P645-S-58HK HD Graphics 5500, 5200U, Kingston RBU-SNS8100S3256GD | |
|---|---|---|---|---|---|
| Duración de Batería | 9% | 65% | -22% | 67% | |
| Reader / Idle (h) | 9 | 7.5 -17% | 8.2 -9% | 19.1 112% | |
| H.264 (h) | 5.4 | 5.6 4% | 8.8 63% | ||
| WiFi v1.3 (h) | 4.9 | 6.3 29% | 8.1 65% | 8.9 82% | |
| Load (h) | 1.7 | 2 18% | 1.1 -35% | 1.9 12% | |
| WiFi (h) | 4.5 |
Pro
Contra
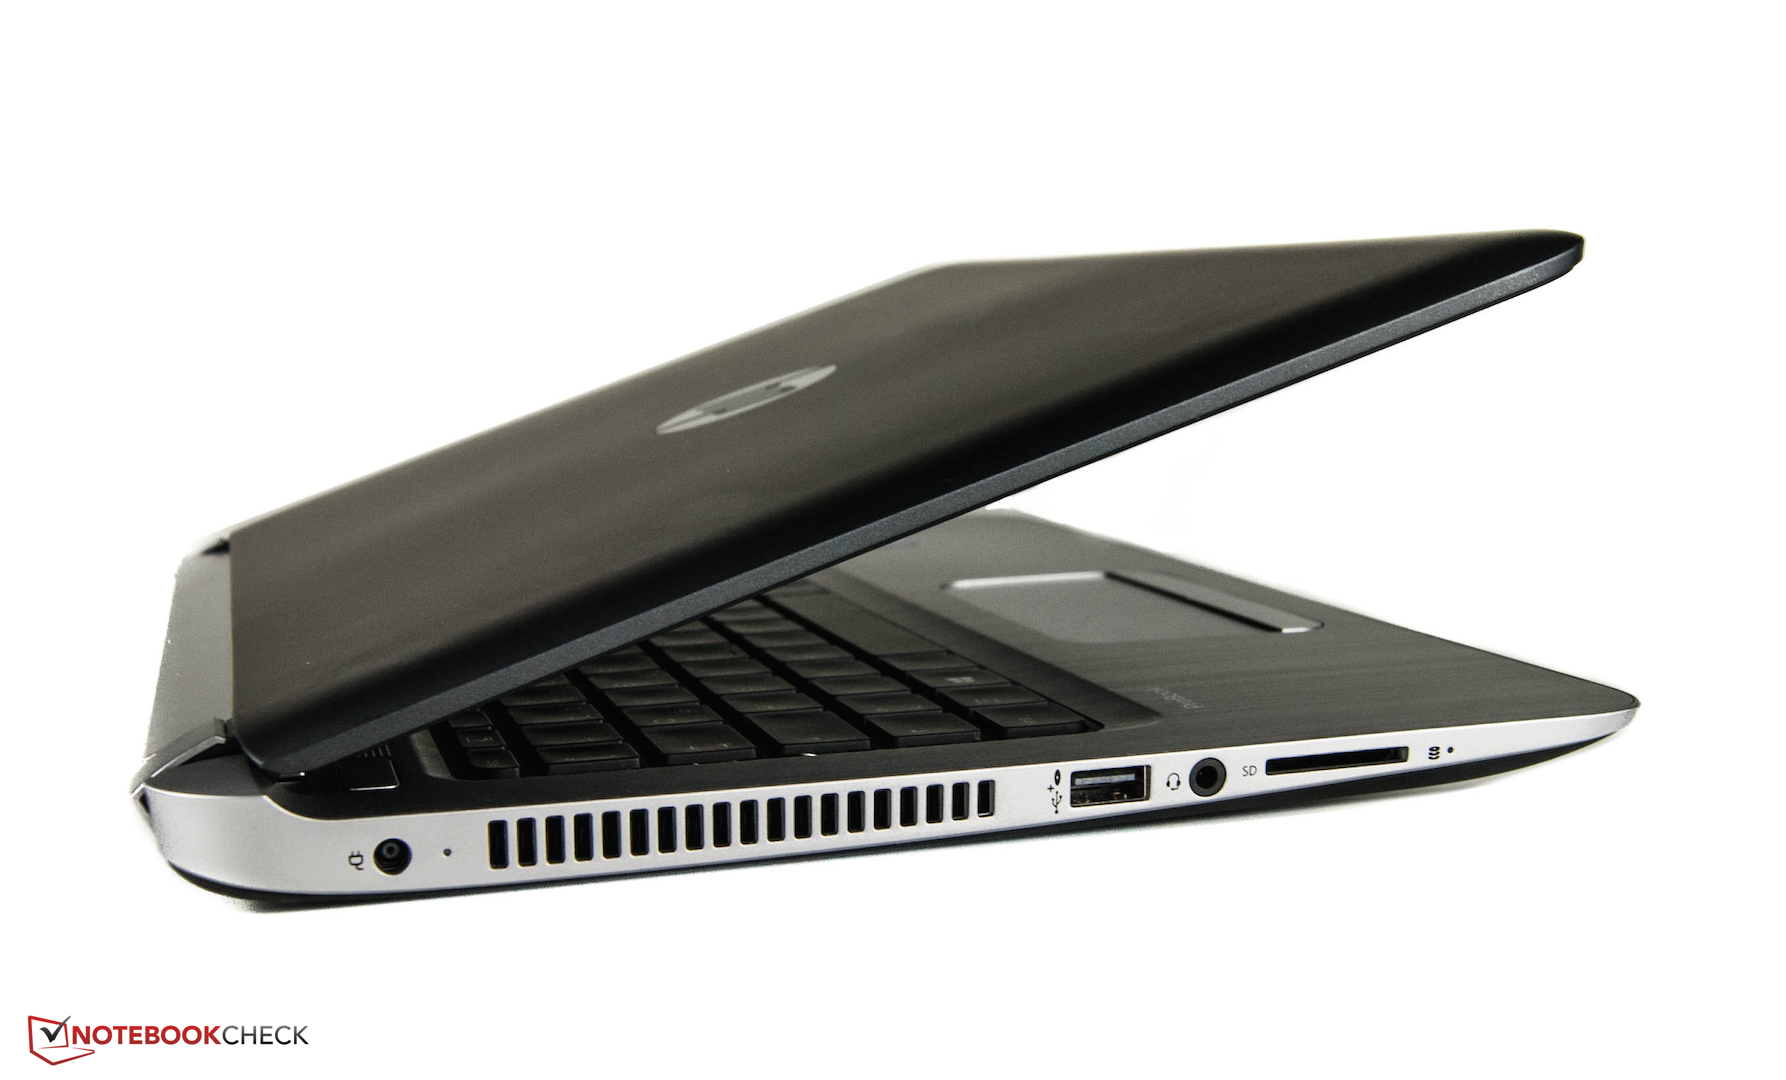
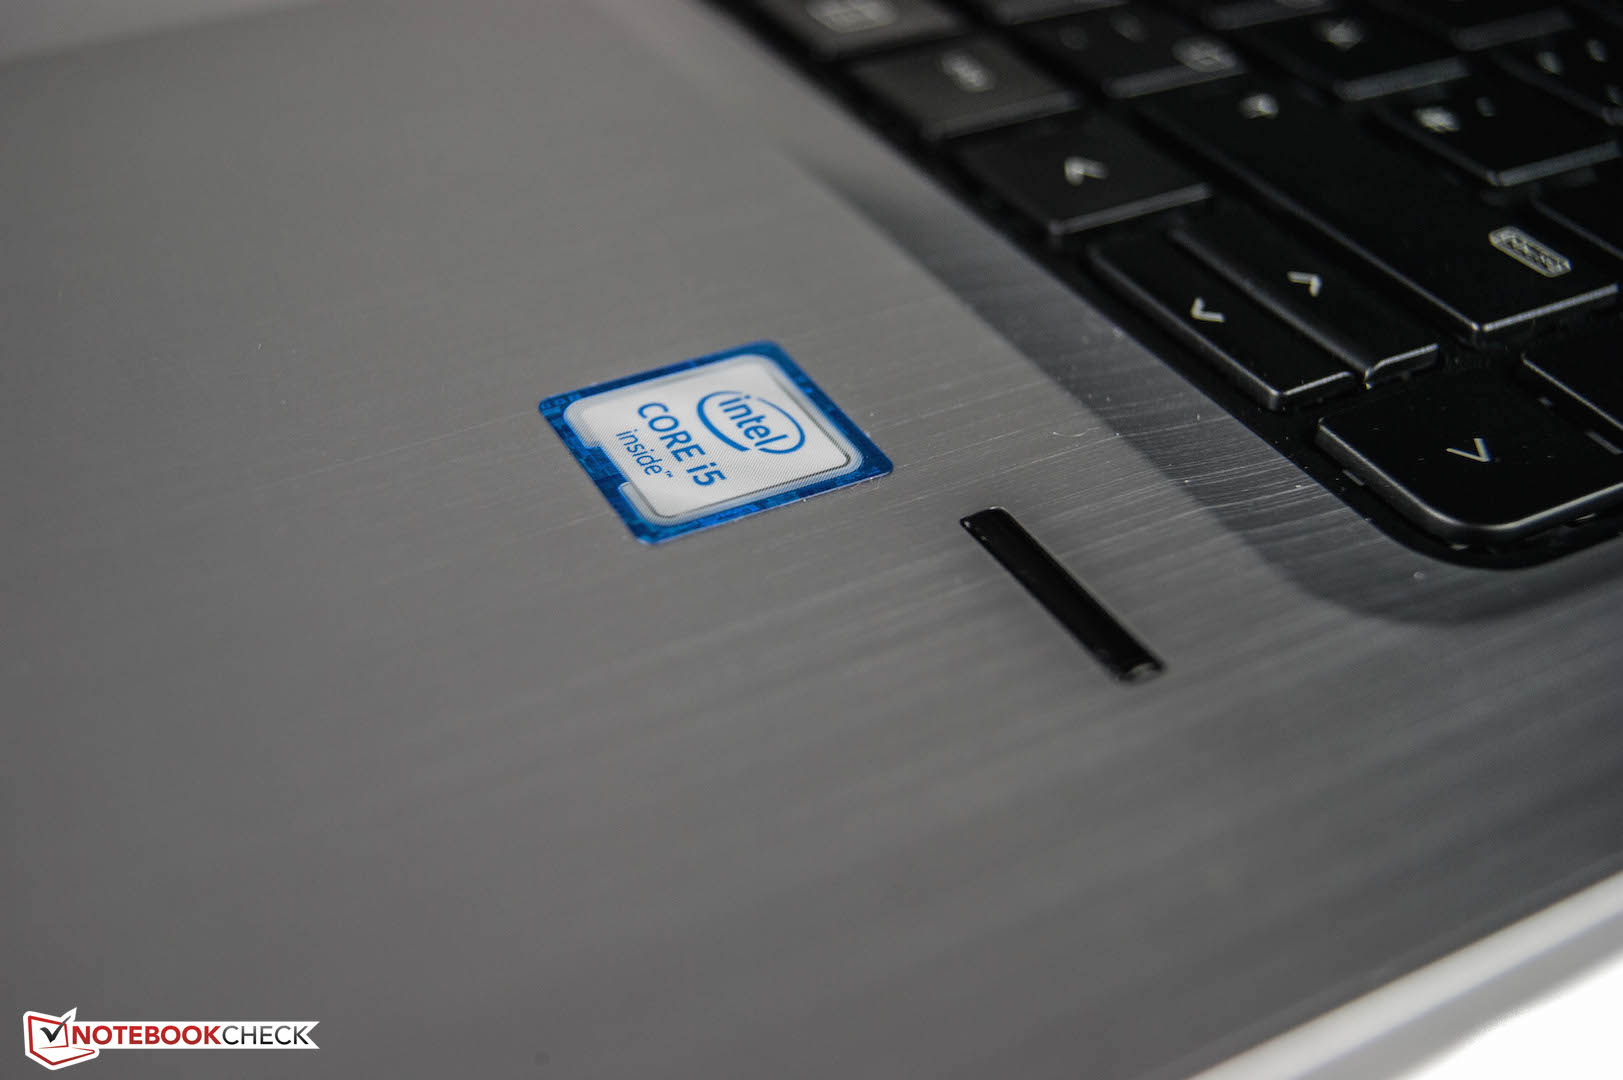
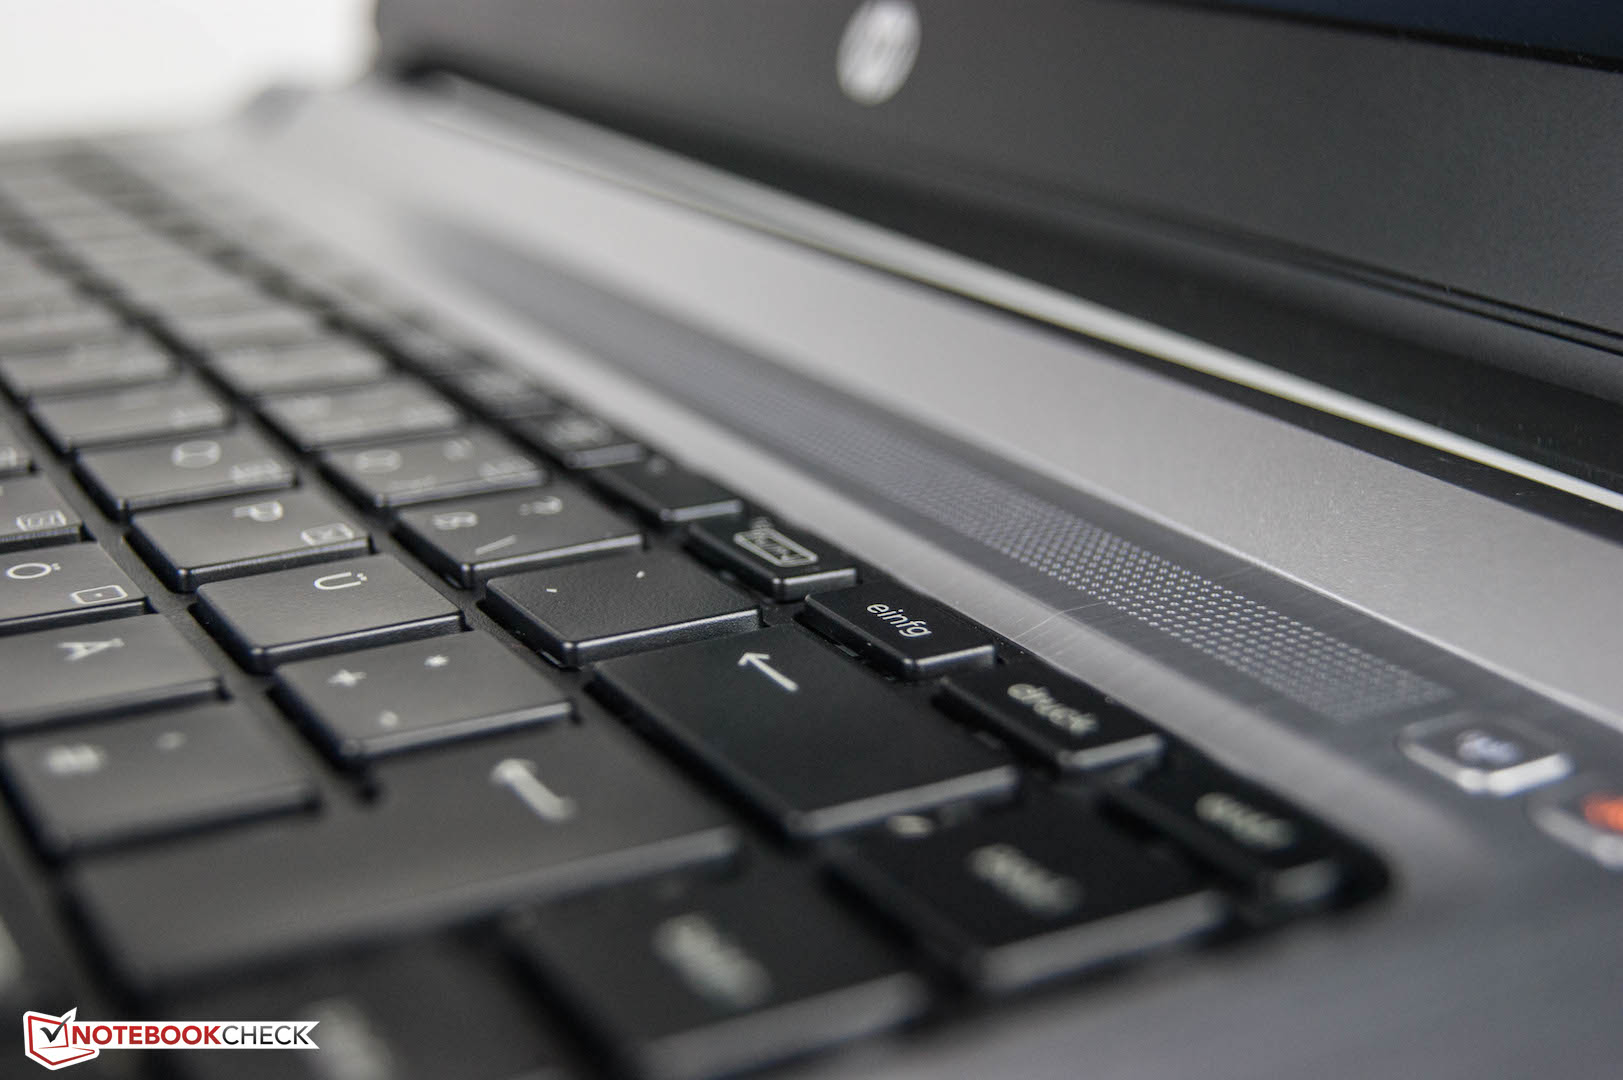
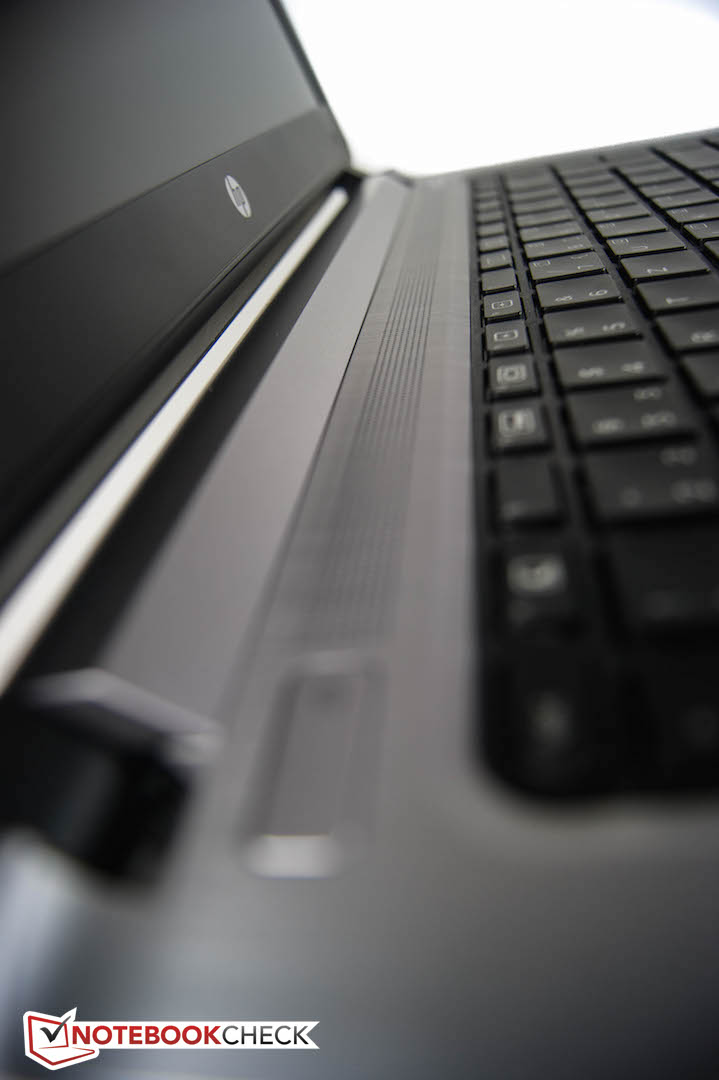
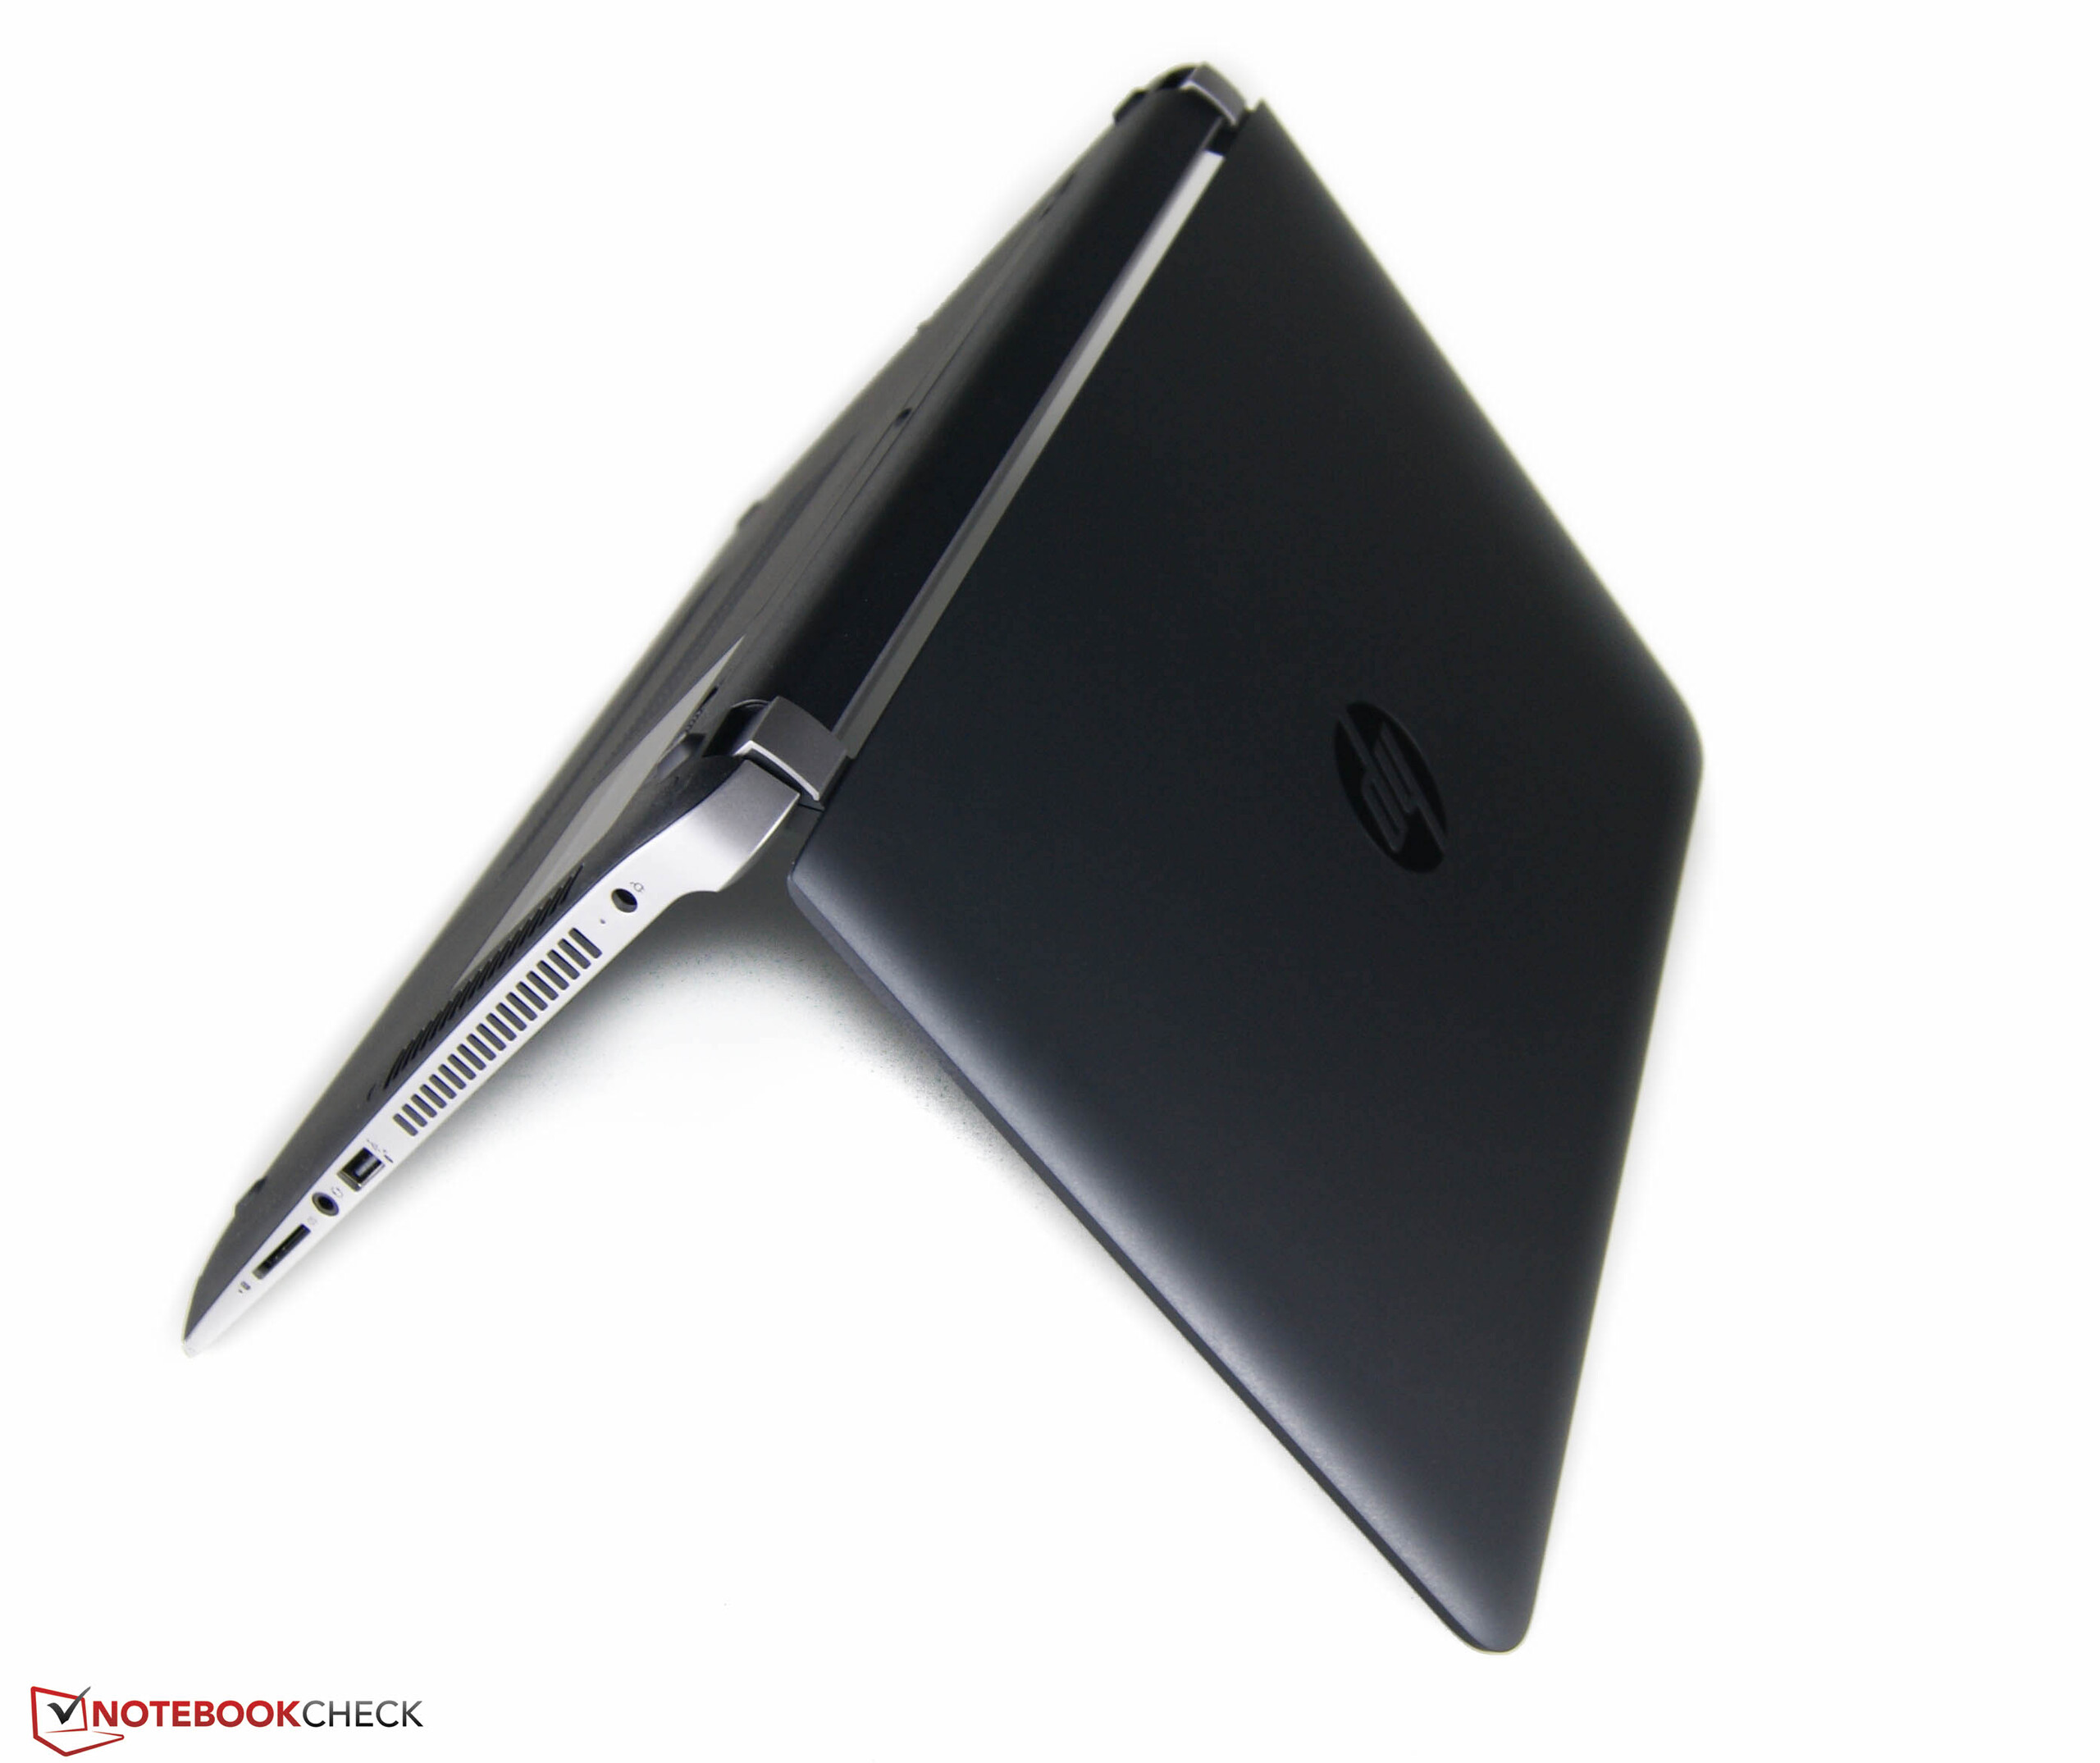
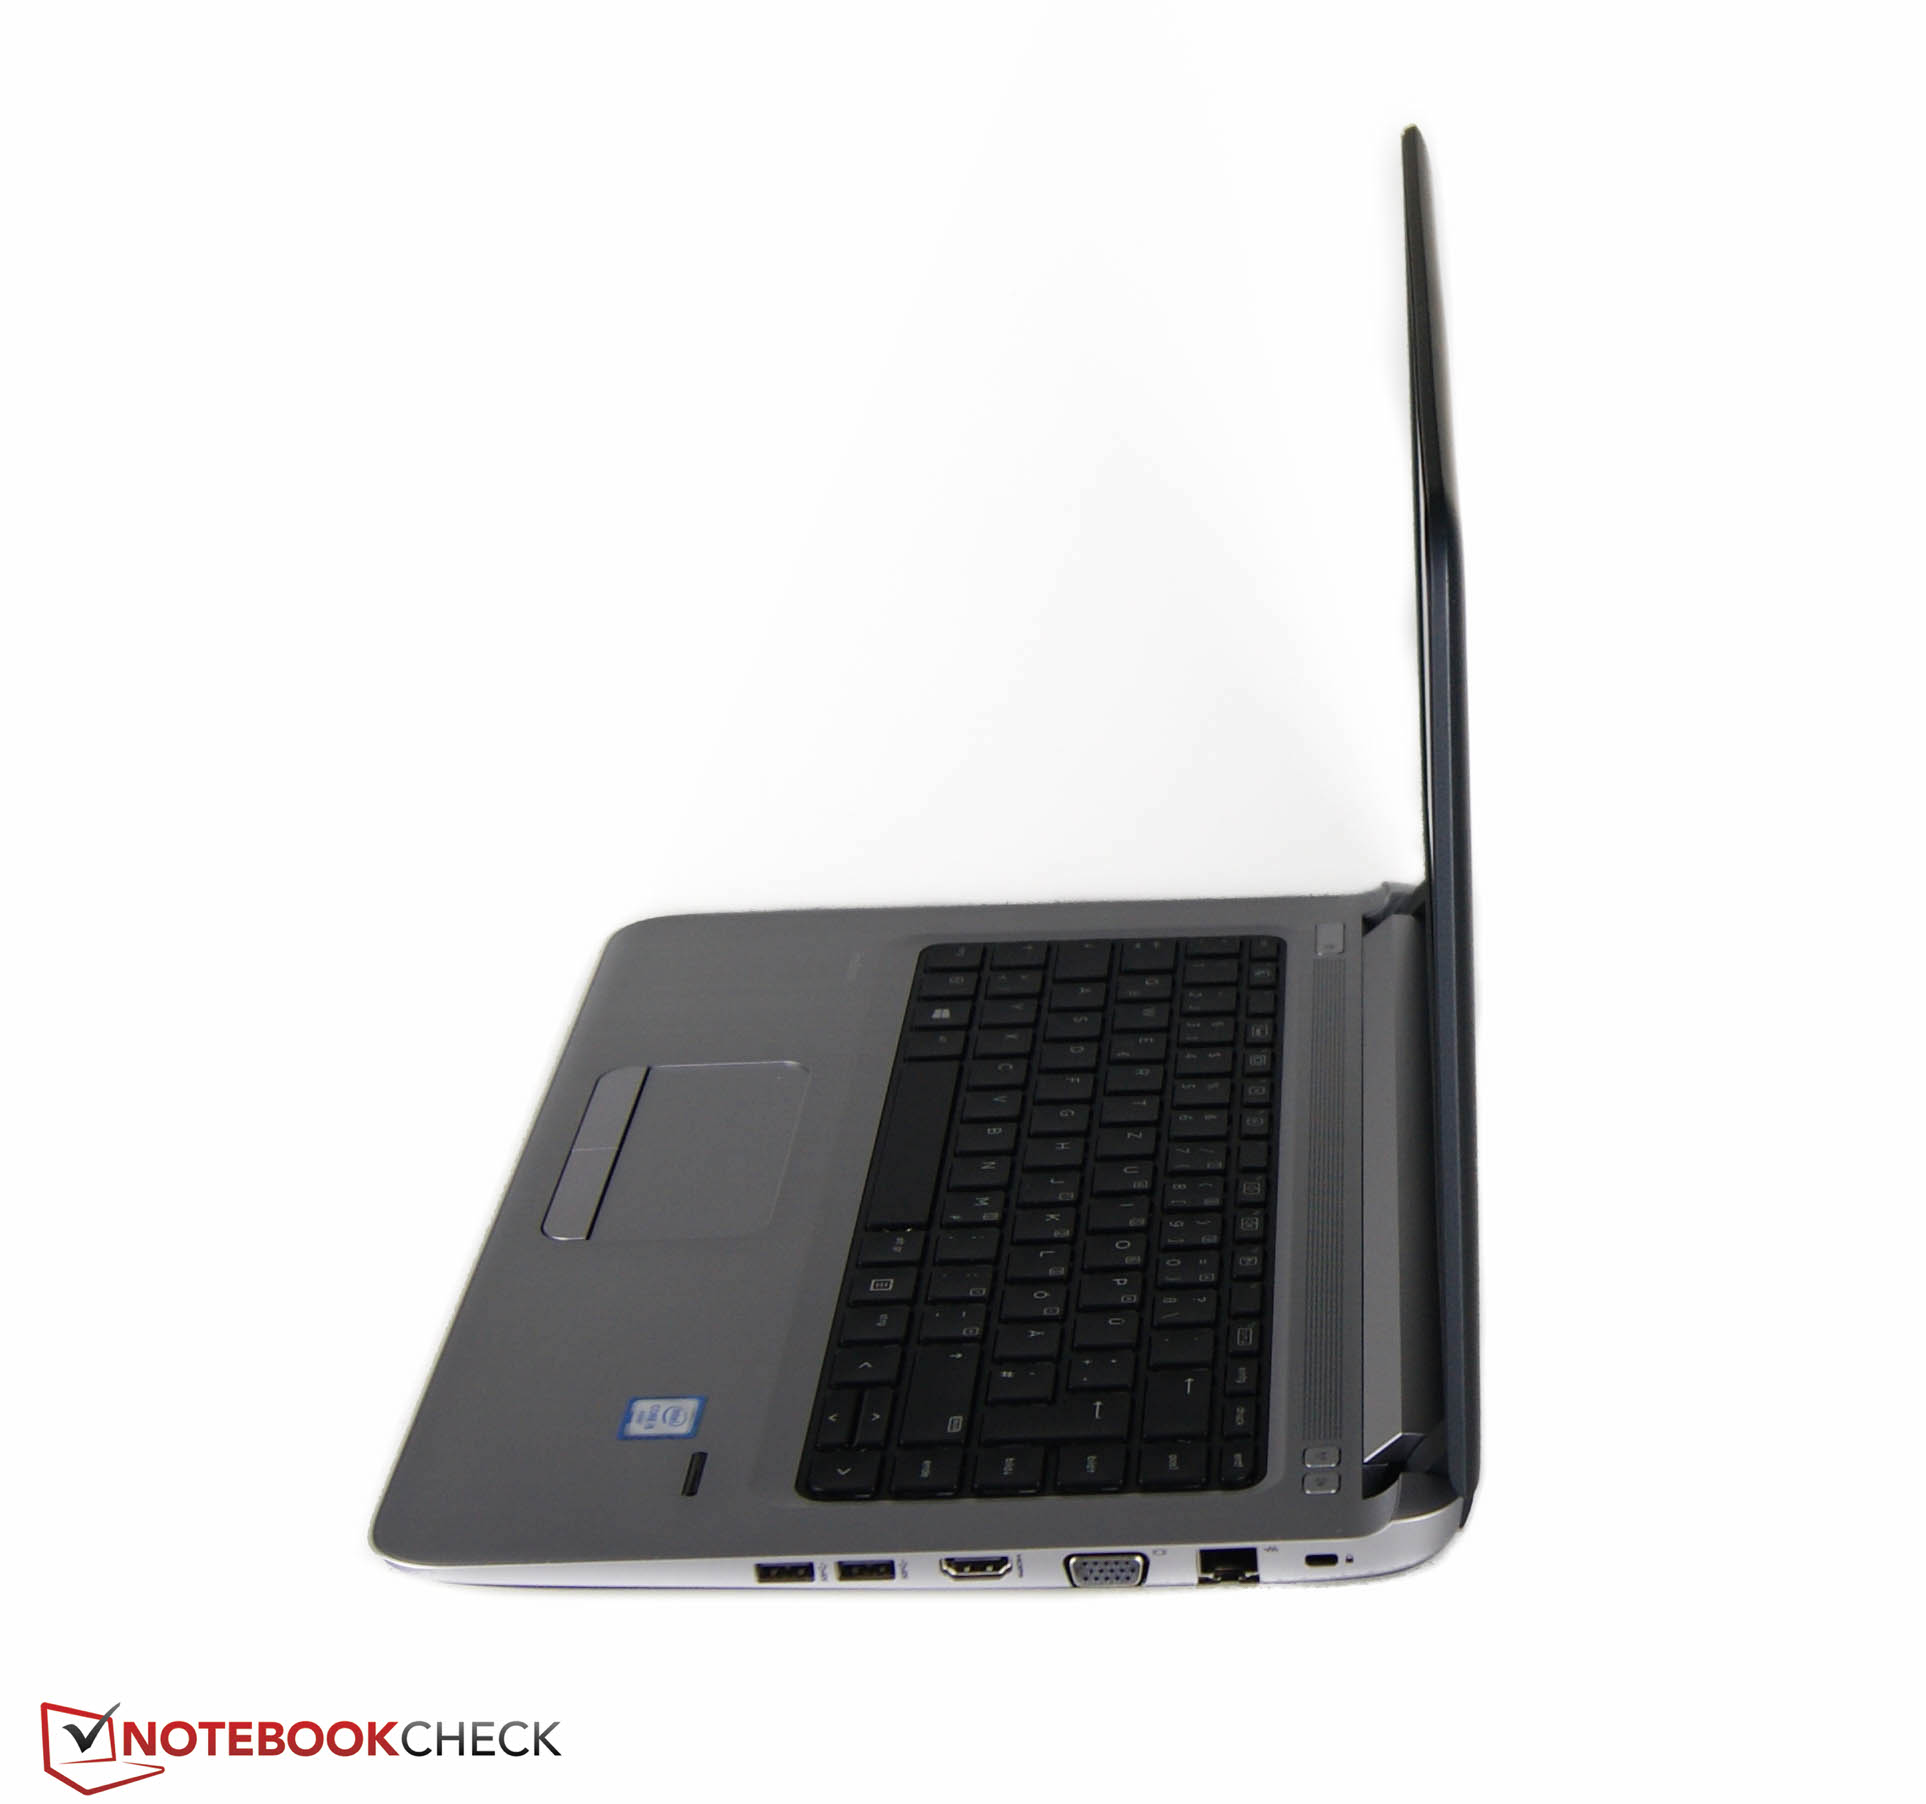
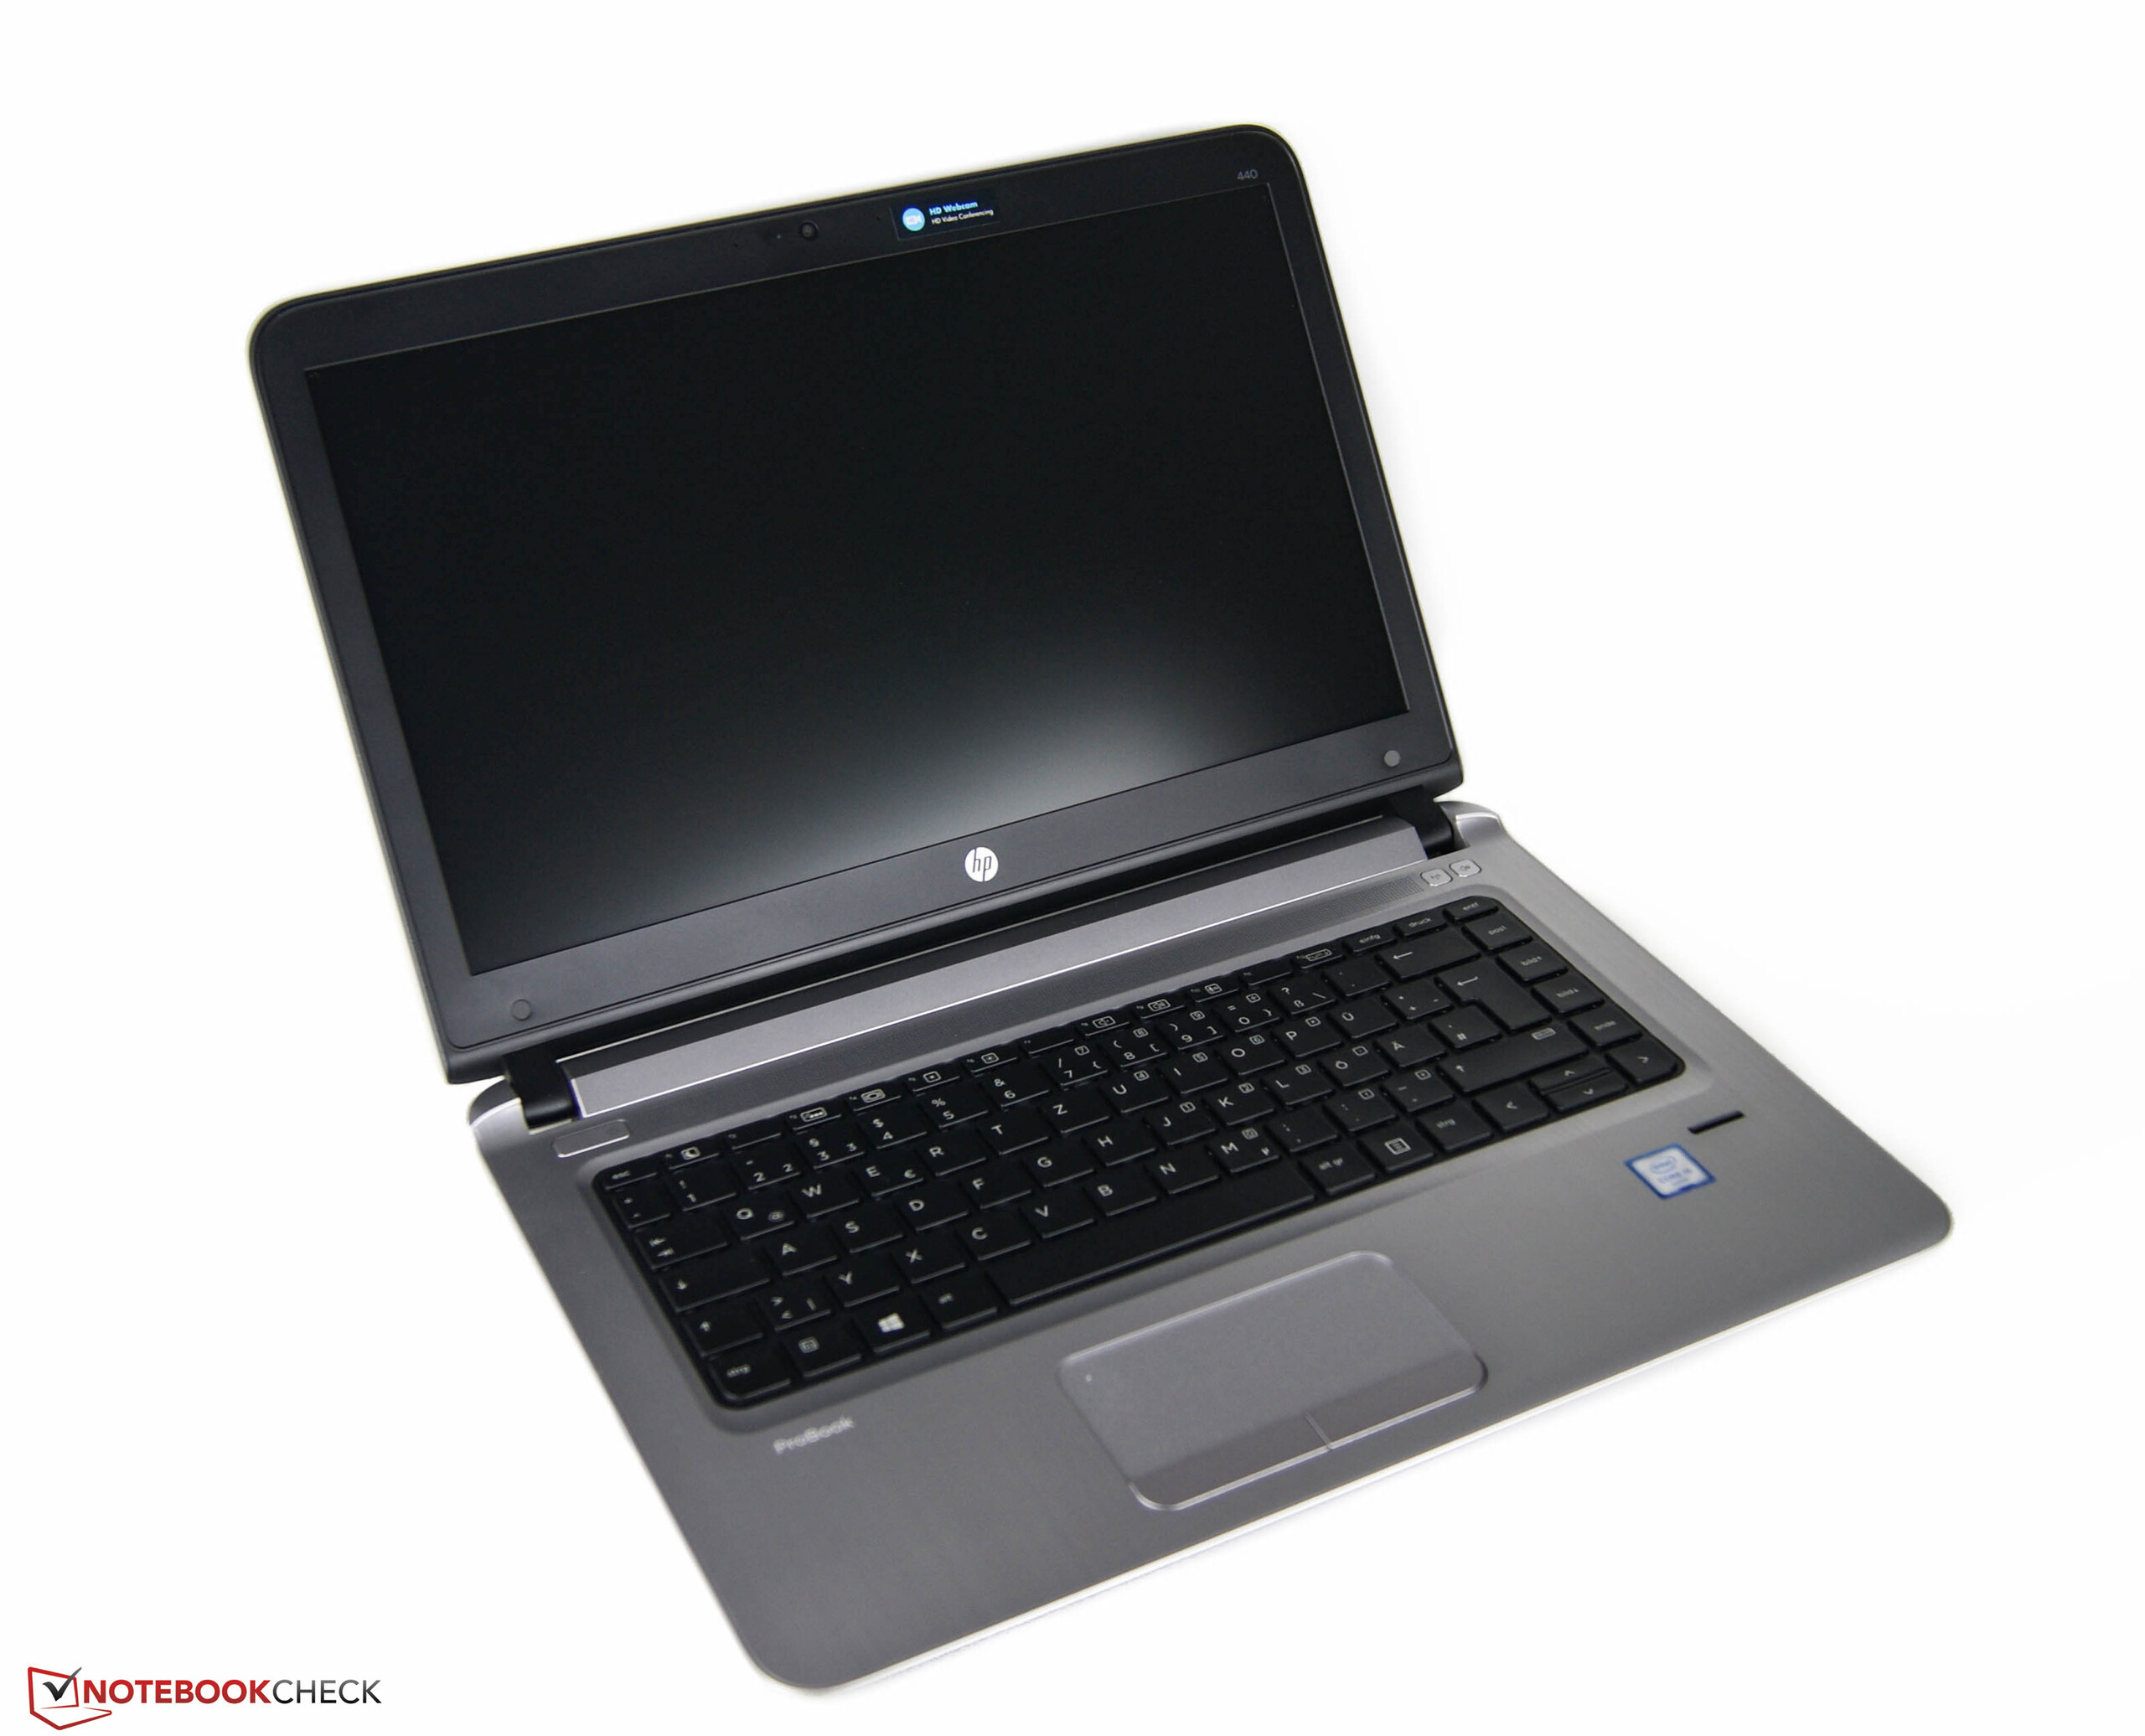
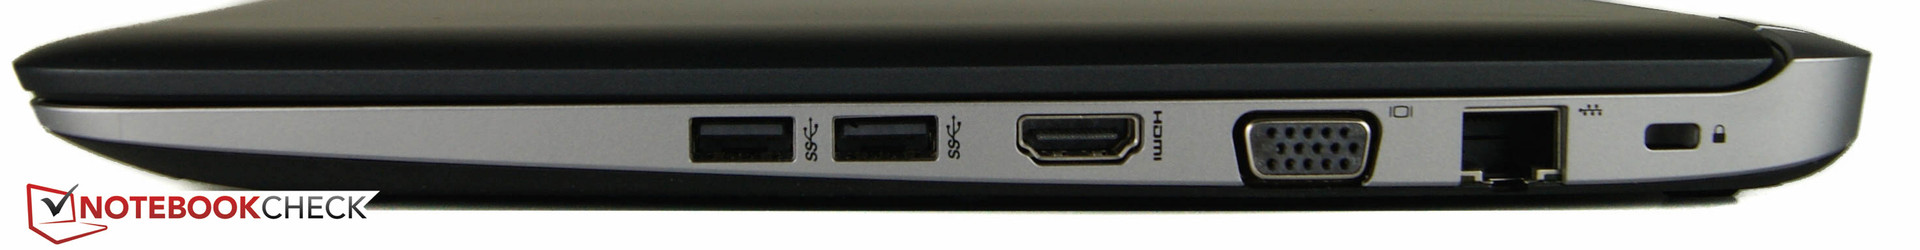
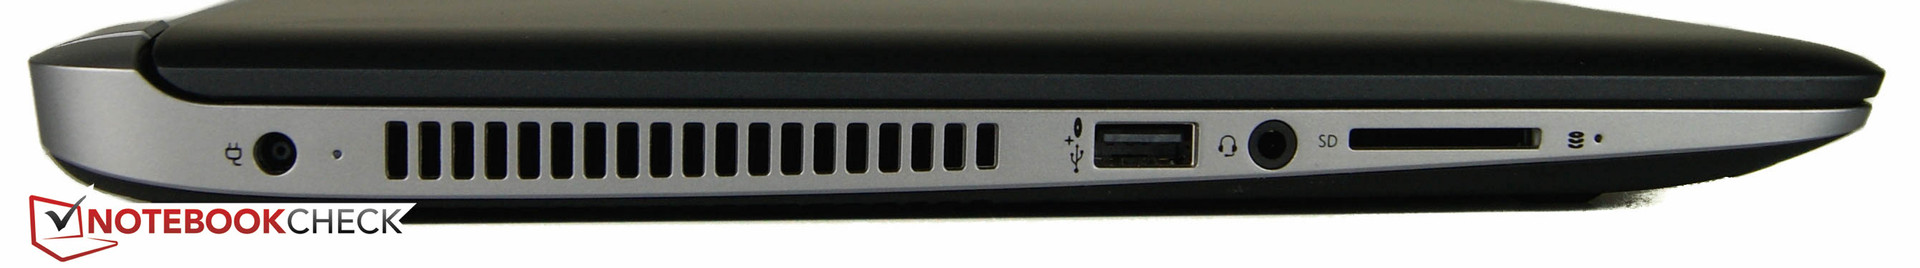
La entrada al mundo business puede tener éxito con el HP ProBook 440 G3. El aspecto del portátil hecho principalmente para la oficina es atractivo. El teclado chiclet incorporado convence hasta en uso permanente. El touchpad puede decirse que es "pequeño pero sólido". Los estándares de seguridad son particularmente importantes para el uso empersarial diario. El modelo de pruebas no es poca cosa con sus características básicas que incluyen soluciones software, TPM, bloqueo Kensington, y lector de huellas.
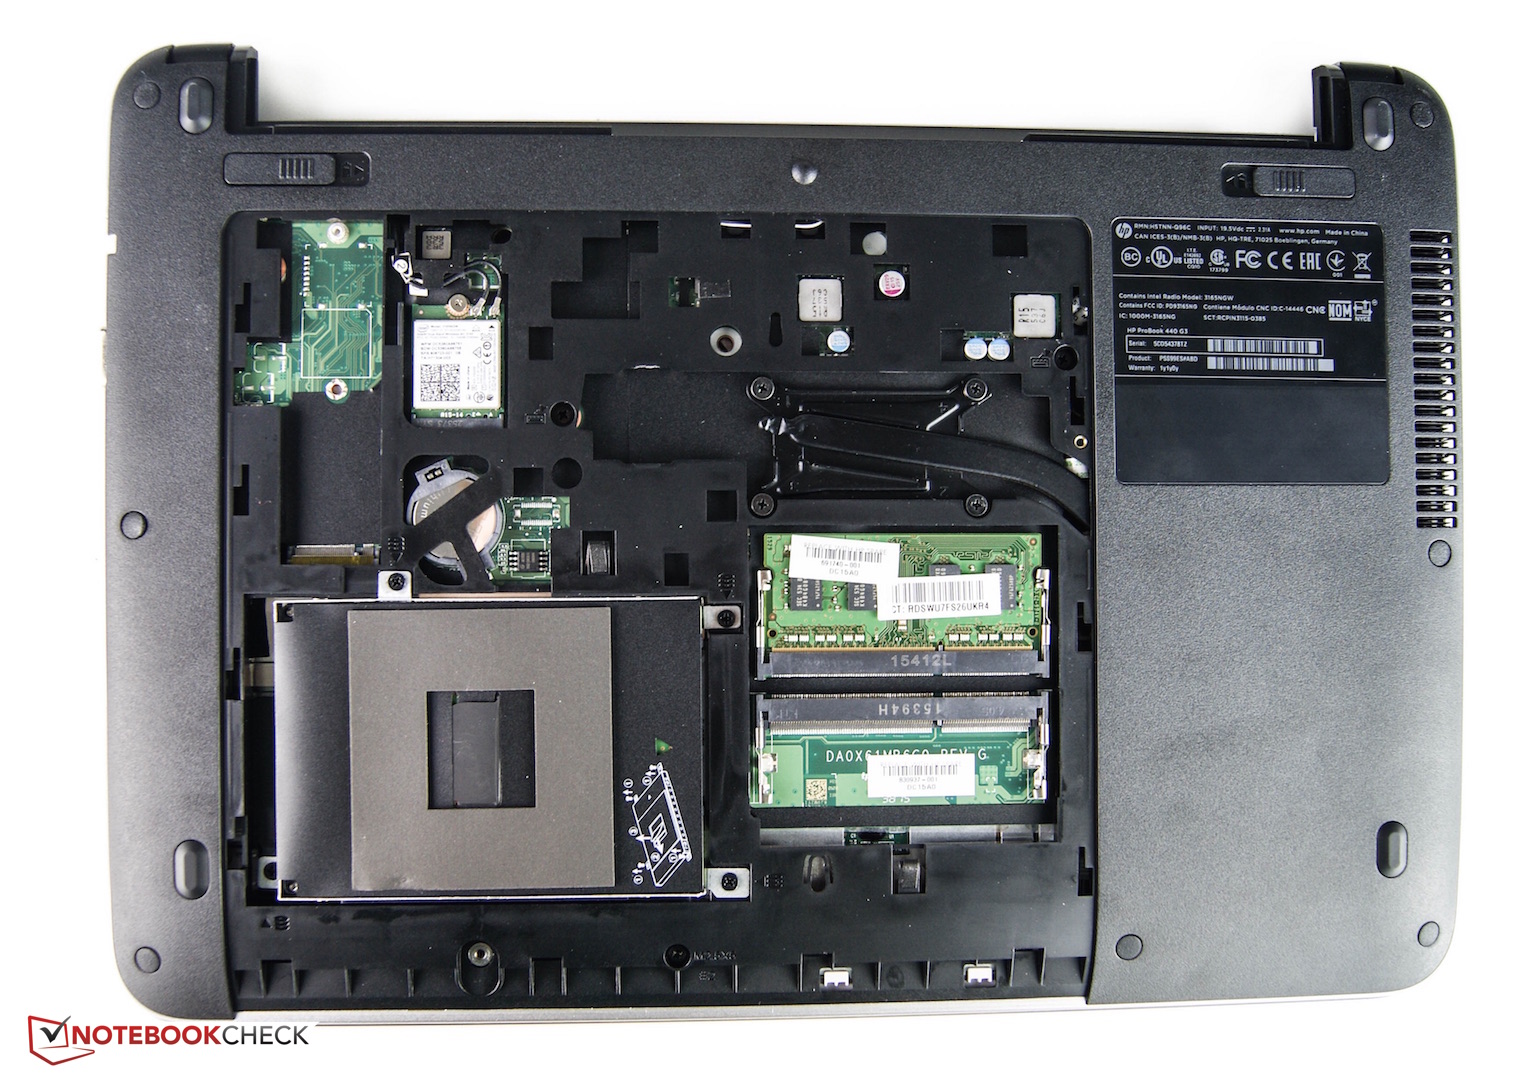
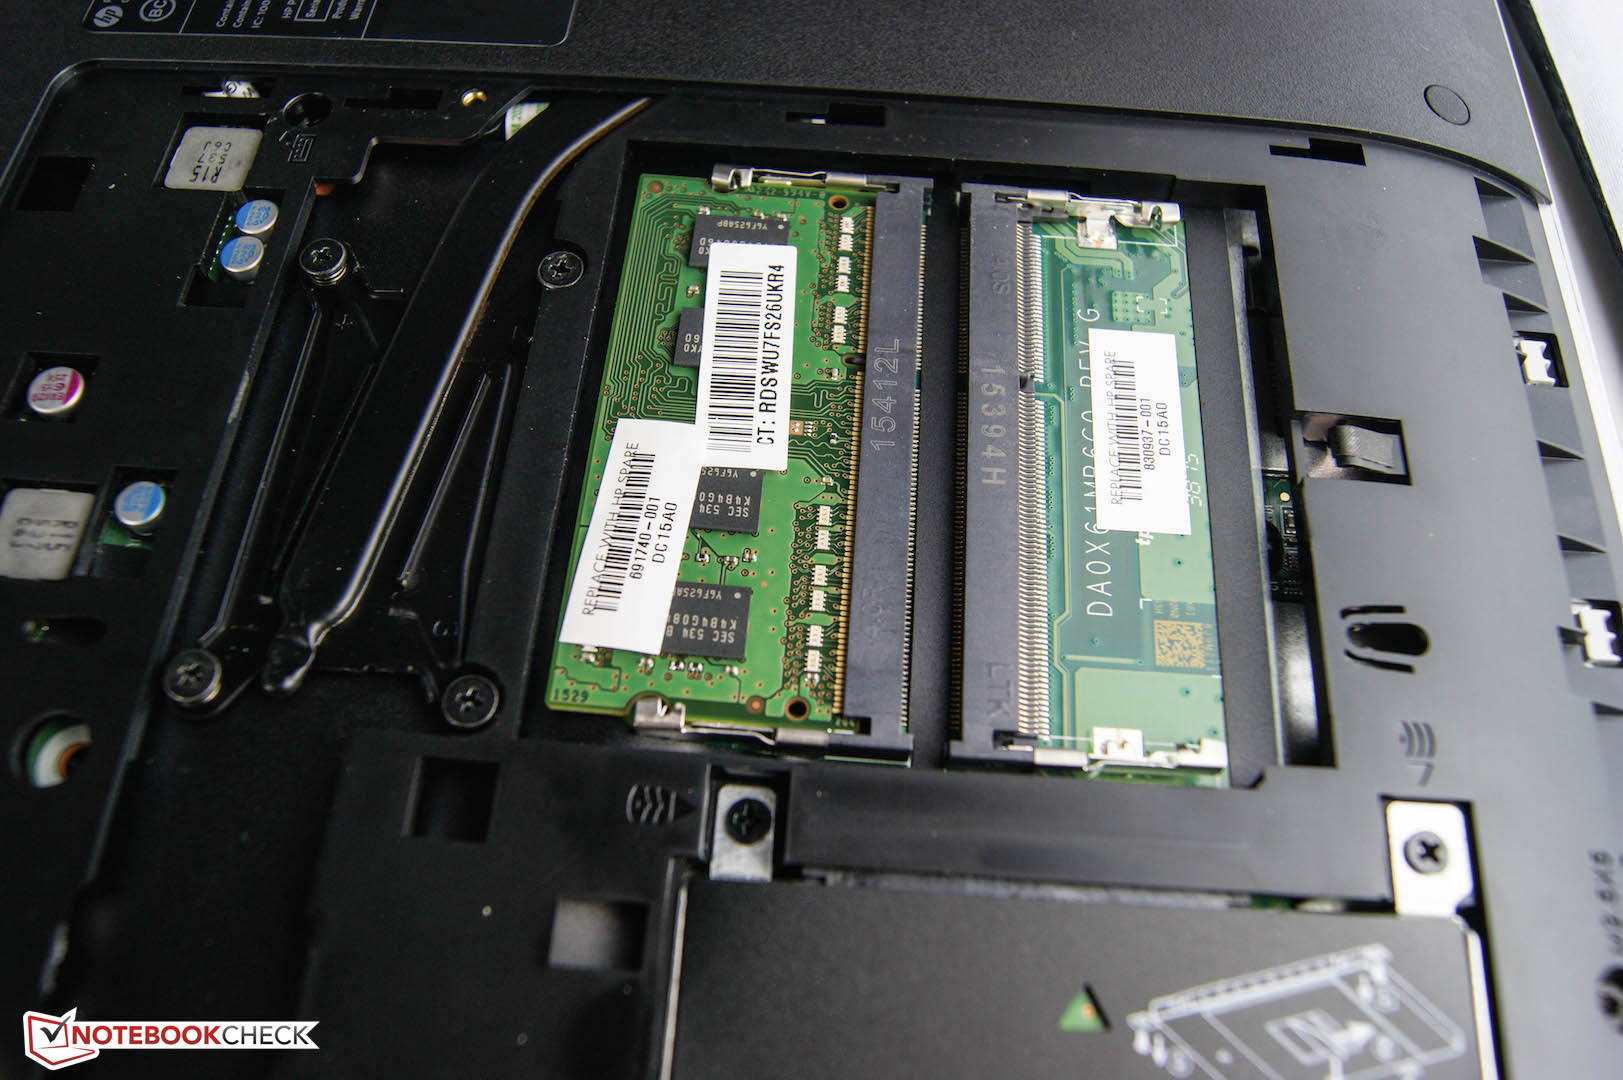
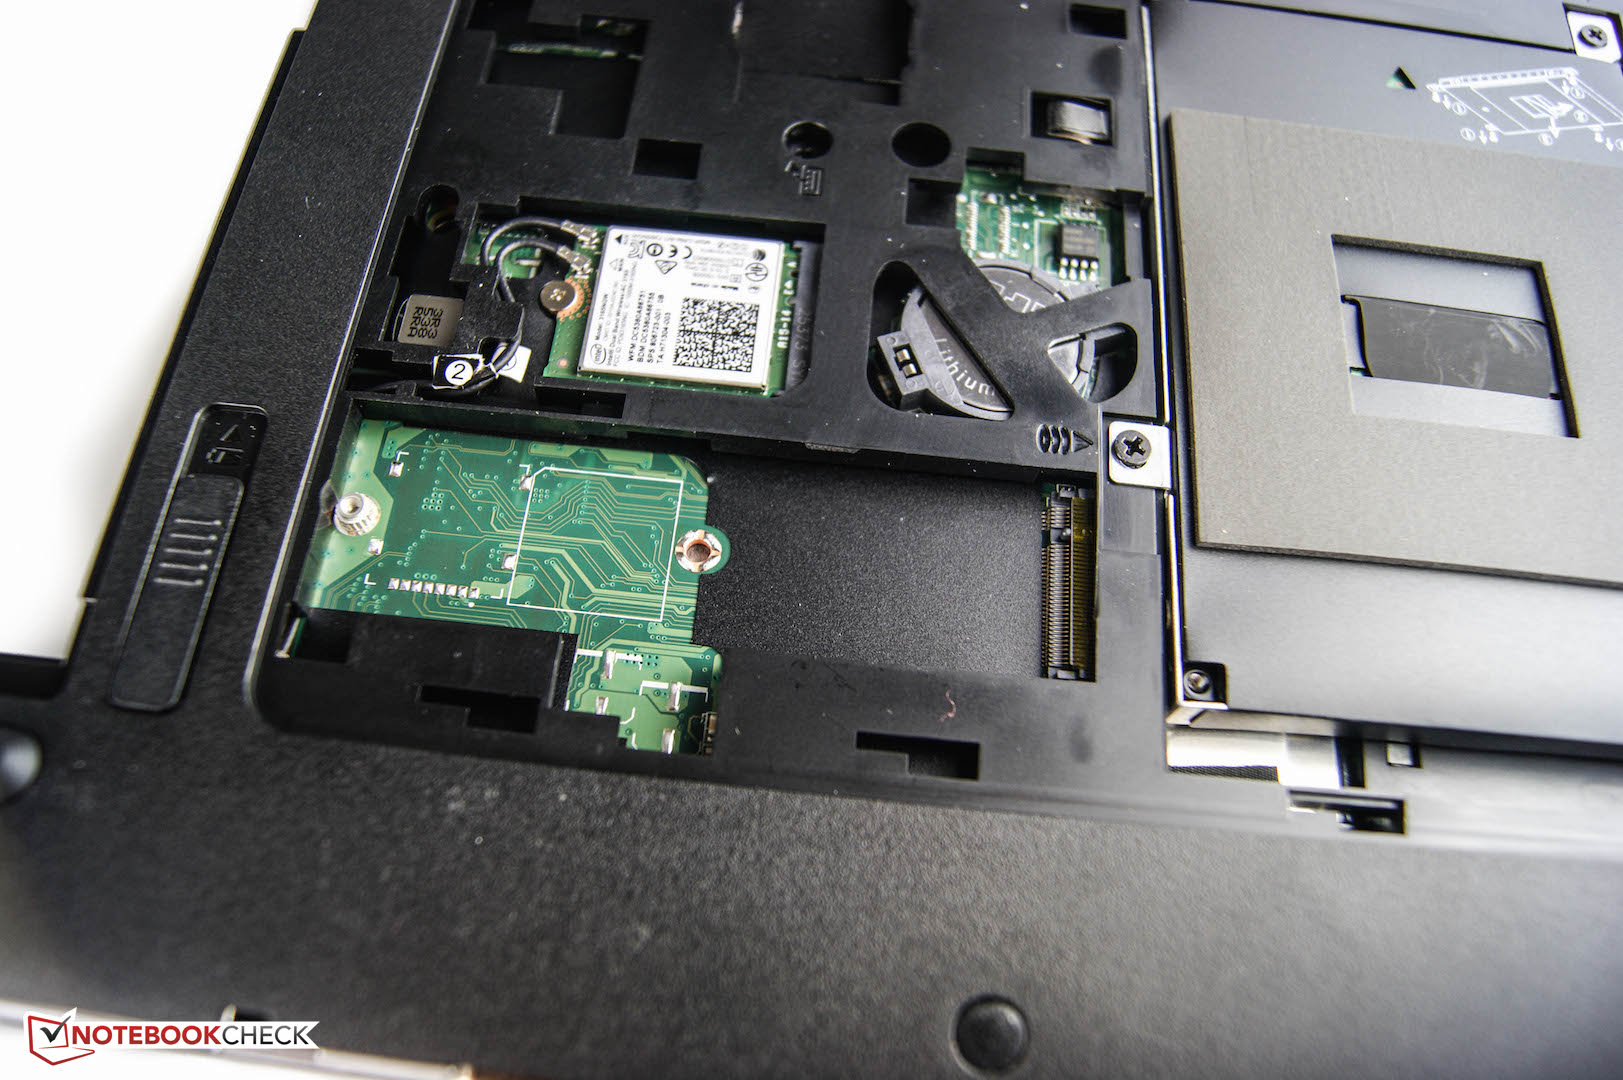
Como ya encontramos en la serie barata ProBook, el display rinde mal en brillo y ángulos de visión. Los competidores demuestran que se puede hacer de otra manera. Una nueva CPU Skylake dentro del portátil de 14" da rendimiento suficiente. El disco duro gira a 7200 RPM y ofrece valores de lectura y escritura decentes para su tipo. En general, el rendimiento está bien para su campo de aplicación. Incluso tiene algunas reservas de rendimiento.
Las emisiones están básicamente bien durante el uso normal. El calor es razonable y el ruido silencioso. La gestión de energía decepcionante es algo a criticar. La batería no basta para un día de trabajo. Los que necesiten un portátil para el uso móvil harán mejor en mirar en la competencia.
HP presenta un paquete nuevo y bueno como entrada a la categoría business. Por desgracia, display y duración de batería apenas han mejorado.
El precio de nuestro modelo es de sólo 620 Euros, muy barato para un dispositivo business. Los competidores elegidos también tendrían que tenerse en cuenta: Lenovo ThinkPad E450 y E460 vienen con SSDs más rápidos y gráficas dedicadas que prometen mejores rendimientos. El Dell Latitude 3450 brilla con un panel IPS de gama alta. El Acer TravelMate también dejó una buena impresión con un display brillante.
Ésta es una versión acortada del análisis original. Puedes leer el análisis completo en inglés aquí.
HP ProBook 440 G3
- 02/25/2016 v5 (old)
Nino Ricchizzi