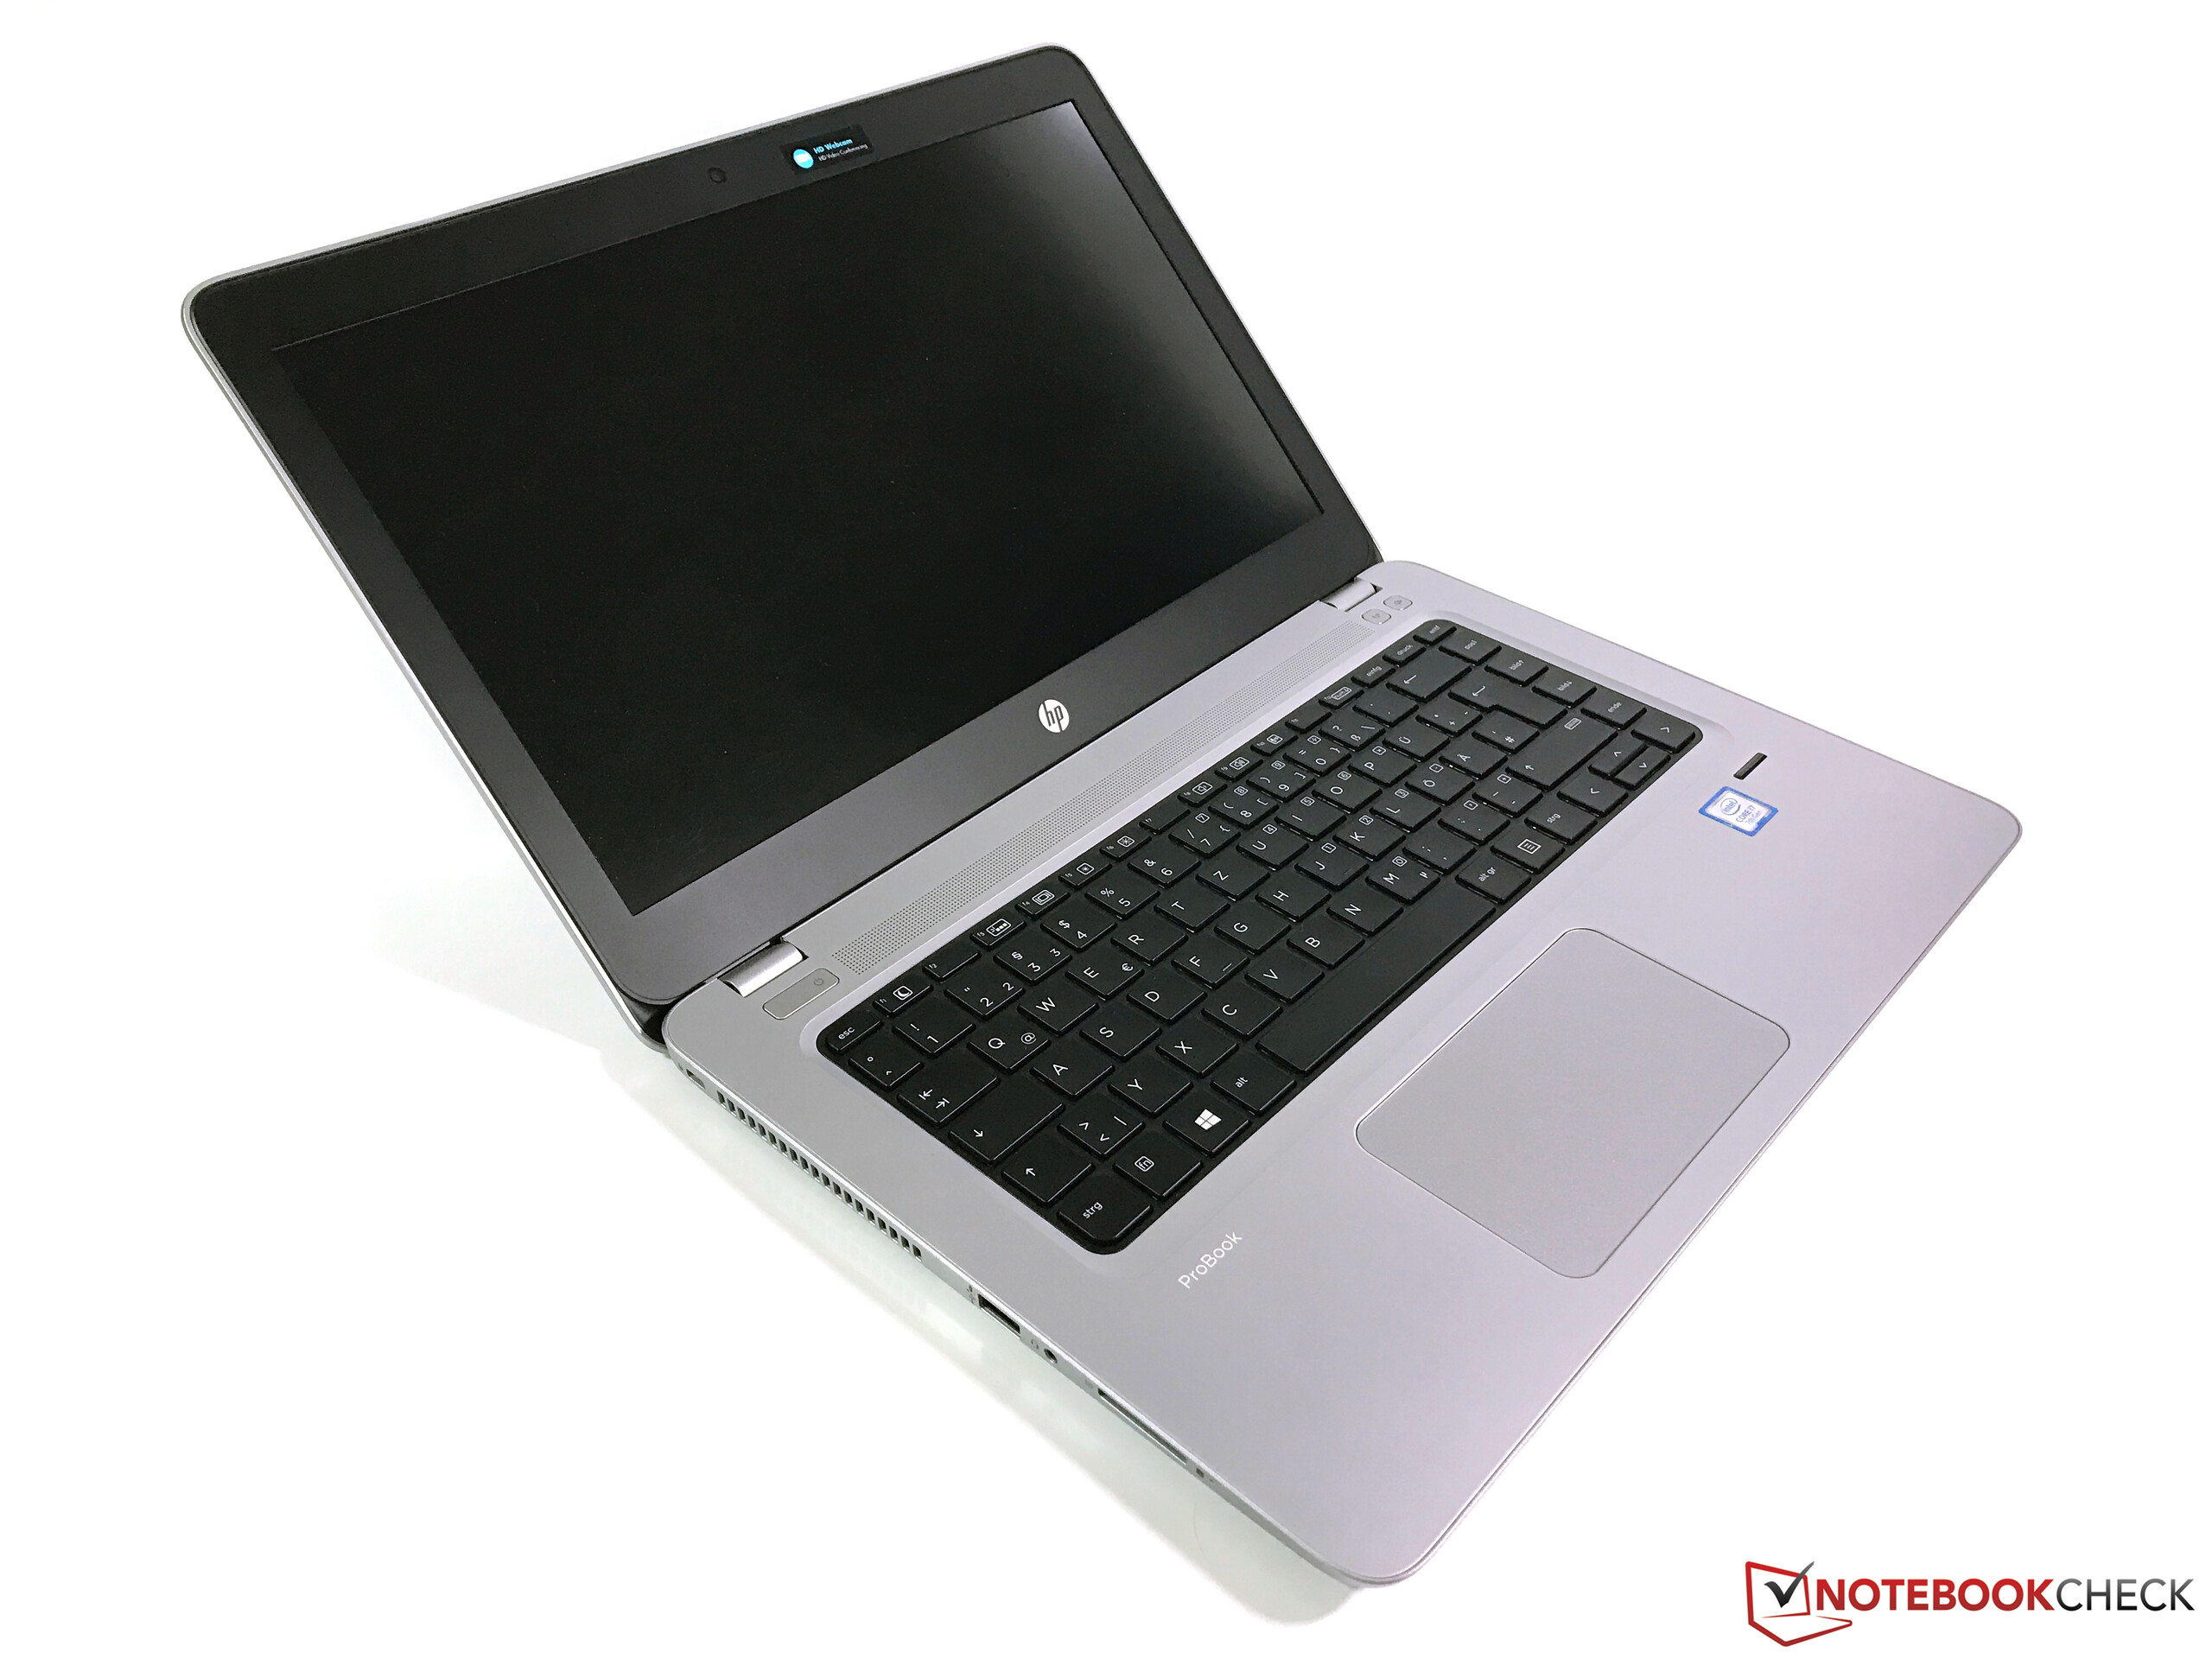
Breve análisis del HP ProBook 440 G4 (Core i7, Full-HD)
| SD Card Reader | |
| average JPG Copy Test (av. of 3 runs) | |
| Dell Latitude 14 E5470 | |
| HP ProBook 430 G4-Y8B47EA | |
| HP ProBook 440 G4-Y8B51EA | |
| HP ProBook 450 G4 Y8B60EA | |
| Lenovo ThinkPad E470-20H2S00400 | |
| Acer TravelMate X3 X349-M-7261 | |
| maximum AS SSD Seq Read Test (1GB) | |
| Dell Latitude 14 E5470 | |
| HP ProBook 450 G4 Y8B60EA | |
| HP ProBook 430 G4-Y8B47EA | |
| HP ProBook 440 G4-Y8B51EA | |
| Lenovo ThinkPad E470-20H2S00400 | |
| Acer TravelMate X3 X349-M-7261 | |
| Networking | |
| iperf Server (receive) TCP 1 m | |
| Lenovo ThinkPad E470-20H2S00400 | |
| HP ProBook 450 G4 Y8B60EA | |
| Acer TravelMate X3 X349-M-7261 (jseb) | |
| HP ProBook 440 G4-Y8B51EA | |
| HP ProBook 430 G4-Y8B47EA | |
| iperf Client (transmit) TCP 1 m | |
| Acer TravelMate X3 X349-M-7261 (jseb) | |
| HP ProBook 450 G4 Y8B60EA | |
| HP ProBook 440 G4-Y8B51EA | |
| Lenovo ThinkPad E470-20H2S00400 | |
| HP ProBook 430 G4-Y8B47EA | |
| |||||||||||||||||||||||||
iluminación: 83 %
Brillo con batería: 214 cd/m²
Contraste: 460:1 (Negro: 0.47 cd/m²)
ΔE ColorChecker Calman: 8.98 | ∀{0.5-29.43 Ø4.71}
ΔE Greyscale Calman: 9.61 | ∀{0.09-98 Ø4.96}
56.7% sRGB (Argyll 1.6.3 3D)
35.9% AdobeRGB 1998 (Argyll 1.6.3 3D)
38.85% AdobeRGB 1998 (Argyll 3D)
56.6% sRGB (Argyll 3D)
37.6% Display P3 (Argyll 3D)
Gamma: 2.63
CCT: 11265 K
| HP ProBook 440 G4-Y8B51EA AUO1E3D, , 1920x1080, 14" | Lenovo ThinkPad E470-20H2S00400 N140HCA-EAB, , 1920x1080, 14" | Dell Latitude 14 E5470 LG Philips LGD04B1 140WHU, , 1366x768, 14" | Acer TravelMate X3 X349-M-7261 AU Optronics B140HAN02.1, , 1920x1080, 14" | |
|---|---|---|---|---|
| Display | 9% | 7% | -2% | |
| Display P3 Coverage (%) | 37.6 | 41.23 10% | 40.06 7% | 36.97 -2% |
| sRGB Coverage (%) | 56.6 | 61.4 8% | 60.3 7% | 55.6 -2% |
| AdobeRGB 1998 Coverage (%) | 38.85 | 42.67 10% | 41.42 7% | 38.2 -2% |
| Response Times | -10% | -25% | -6% | |
| Response Time Grey 50% / Grey 80% * (ms) | 43.2 ? | 40.8 ? 6% | 56.8 ? -31% | 42 ? 3% |
| Response Time Black / White * (ms) | 24.4 ? | 30.4 ? -25% | 28.8 ? -18% | 28 ? -15% |
| PWM Frequency (Hz) | ||||
| Screen | 19% | -11% | 36% | |
| Brightness middle (cd/m²) | 216 | 244 13% | 229 6% | 230 6% |
| Brightness (cd/m²) | 203 | 231 14% | 207 2% | 226 11% |
| Brightness Distribution (%) | 83 | 89 7% | 80 -4% | 86 4% |
| Black Level * (cd/m²) | 0.47 | 0.37 21% | 0.69 -47% | 0.2 57% |
| Contrast (:1) | 460 | 659 43% | 332 -28% | 1150 150% |
| Colorchecker dE 2000 * | 8.98 | 6.41 29% | 10.16 -13% | 5.07 44% |
| Colorchecker dE 2000 max. * | 14.07 | 13.4 5% | 17.18 -22% | 10.07 28% |
| Greyscale dE 2000 * | 9.61 | 5.94 38% | 10.87 -13% | 3.64 62% |
| Gamma | 2.63 84% | 2.28 96% | 2.41 91% | 2.46 89% |
| CCT | 11265 58% | 6101 107% | 12881 50% | 6521 100% |
| Color Space (Percent of AdobeRGB 1998) (%) | 35.9 | 39.3 9% | 38.4 7% | 35 -3% |
| Color Space (Percent of sRGB) (%) | 56.7 | 61.1 8% | 60.4 7% | 55 -3% |
| Media total (Programa/Opciones) | 6% /
13% | -10% /
-9% | 9% /
23% |
* ... más pequeño es mejor
Tiempos de respuesta del display
| ↔ Tiempo de respuesta de Negro a Blanco | ||
|---|---|---|
| 24.4 ms ... subida ↗ y bajada ↘ combinada | ↗ 7.2 ms subida | 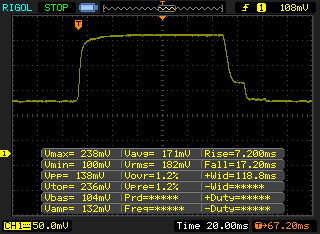 |
| ↘ 17.2 ms bajada | ||
| La pantalla mostró buenos tiempos de respuesta en nuestros tests pero podría ser demasiado lenta para los jugones competitivos. En comparación, todos los dispositivos de prueba van de ##min### (mínimo) a 240 (máximo) ms. » 58 % de todos los dispositivos son mejores. Eso quiere decir que el tiempo de respuesta es peor que la media (19.8 ms) de todos los dispositivos testados. | ||
| ↔ Tiempo de respuesta 50% Gris a 80% Gris | ||
| 43.2 ms ... subida ↗ y bajada ↘ combinada | ↗ 21.2 ms subida | 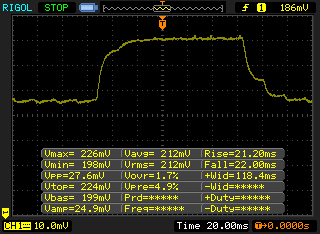 |
| ↘ 22 ms bajada | ||
| La pantalla mostró tiempos de respuesta lentos en nuestros tests y podría ser demasiado lenta para los jugones. En comparación, todos los dispositivos de prueba van de ##min### (mínimo) a 636 (máximo) ms. » 72 % de todos los dispositivos son mejores. Eso quiere decir que el tiempo de respuesta es peor que la media (31 ms) de todos los dispositivos testados. | ||
Parpadeo de Pantalla / PWM (Pulse-Width Modulation)
| Parpadeo de Pantalla / PWM no detectado | ||
Comparación: 52 % de todos los dispositivos testados no usaron PWM para atenuar el display. Si se usó, medimos una media de 7751 (mínimo: 5 - máxmo: 343500) Hz. | ||
| PCMark 7 Score | 5394 puntos | |
| PCMark 8 Home Score Accelerated v2 | 3614 puntos | |
| PCMark 8 Creative Score Accelerated v2 | 4554 puntos | |
| PCMark 8 Work Score Accelerated v2 | 4837 puntos | |
ayuda | ||
| HP ProBook 440 G4-Y8B51EA SanDisk SD8SNAT256G1002 | Lenovo ThinkPad E470-20H2S00400 SanDisk X400 SED 256GB, SATA (SD8TB8U-256G) | Dell Latitude 14 E5470 Liteon L8H-256V2G | Acer TravelMate X3 X349-M-7261 Liteonit CV3-8D512 | HP ProBook 430 G4-Y8B47EA SanDisk SD8SNAT256G1002 | |
|---|---|---|---|---|---|
| CrystalDiskMark 3.0 | 25% | 25% | 40% | 3% | |
| Read Seq (MB/s) | 491.2 | 476.5 -3% | 508 3% | 484.1 -1% | 505 3% |
| Write Seq (MB/s) | 322.2 | 458.7 42% | 360.6 12% | 449.8 40% | 328.9 2% |
| Read 512 (MB/s) | 310.1 | 346.4 12% | 374.1 21% | 399.1 29% | 313.6 1% |
| Write 512 (MB/s) | 276 | 291.1 5% | 300.2 9% | 355.1 29% | 301 9% |
| Read 4k (MB/s) | 19.57 | 35.15 80% | 31.98 63% | 33.44 71% | 21.69 11% |
| Write 4k (MB/s) | 77.8 | 78.8 1% | 93.1 20% | 67.5 -13% | 80.4 3% |
| Read 4k QD32 (MB/s) | 146.3 | 276 89% | 274.7 88% | 368.5 152% | 132.2 -10% |
| Write 4k QD32 (MB/s) | 241.4 | 178.3 -26% | 205.6 -15% | 280.6 16% | 258.8 7% |

| 3DMark 11 - 1280x720 Performance GPU | |
| Lenovo ThinkPad E470-20H2S00400 | |
| HP ProBook 440 G4-Y8B51EA | |
| HP ProBook 450 G4 Y8B60EA | |
| Acer TravelMate X3 X349-M-7261 | |
| HP ProBook 430 G4-Y8B47EA | |
| Dell Latitude 14 E5470 | |
| 3DMark 06 Standard Score | 12695 puntos | |
| 3DMark Vantage P Result | 8062 puntos | |
| 3DMark 11 Performance | 2342 puntos | |
| 3DMark Ice Storm Standard Score | 49921 puntos | |
| 3DMark Cloud Gate Standard Score | 7001 puntos | |
| 3DMark Fire Strike Score | 1444 puntos | |
ayuda | ||
| bajo | medio | alto | ultra | |
|---|---|---|---|---|
| Tomb Raider (2013) | 134.6 | 62.3 | 34.9 | 17.7 |
| BioShock Infinite (2013) | 97.3 | 52.8 | 42.9 | 14.6 |
| Metro: Last Light (2013) | 49.1 | 37.4 | 22.3 | 11.2 |
| Battlefield 4 (2013) | 66.6 | 46.4 | 30.9 | 11.9 |
| Thief (2014) | 46.9 | 27.5 | 21.5 | 10 |
| Dirt Rally (2015) | 156.1 | 58.7 | 31.1 | 13 |
| The Witcher 3 (2015) | 30.1 | 18.3 | 10.2 | |
| Batman: Arkham Knight (2015) | 28 | 24 | 11 | |
| Star Wars Battlefront (2015) | 54 | 32.5 | 14.8 | 12.5 |
| Rainbow Six Siege (2015) | 69.3 | 39.8 | 21.1 | 14 |
| Just Cause 3 (2015) | 38.3 | 29.5 | 15.9 | |
| Rise of the Tomb Raider (2016) | 34.9 | 20.1 | 10.9 | |
| Doom (2016) | 37.6 | 29.2 | 15 | |
| Deus Ex Mankind Divided (2016) | 22.4 | 15.3 | 7.9 | |
| Battlefield 1 (2016) | 45.5 | 29.7 | 13.4 | 12 |
| Titanfall 2 (2016) | 61.6 | 50.2 | 27.9 | 22.8 |
| Call of Duty Infinite Warfare (2016) | 28.2 | 25.6 | ||
| Dishonored 2 (2016) | 23.6 | 19.7 |
Ruido
| Ocioso |
| 29 / 29 / 29 dB(A) |
| HDD |
| 30.1 dB(A) |
| Carga |
| 37.4 / 39 dB(A) |
 | ||
30 dB silencioso 40 dB(A) audible 50 dB(A) ruidosamente alto |
||
min: | ||
| HP ProBook 440 G4-Y8B51EA NVIDIA GeForce 930MX, Intel Core i7-7500U | Lenovo ThinkPad E470-20H2S00400 NVIDIA GeForce 940MX, Intel Core i5-7200U | Dell Latitude 14 E5470 Intel HD Graphics 520, Intel Core i5-6300U | Acer TravelMate X3 X349-M-7261 Intel HD Graphics 520, Intel Core i7-6500U | HP ProBook 450 G4 Y8B60EA NVIDIA GeForce 930MX, Intel Core i7-7500U | HP ProBook 430 G4-Y8B47EA Intel HD Graphics 620, Intel Core i7-7500U | |
|---|---|---|---|---|---|---|
| Noise | 1% | 3% | -1% | -9% | 3% | |
| apagado / medio ambiente * (dB) | 29 | 29 -0% | 29.2 -1% | 31.15 -7% | 31.6 -9% | 29.1 -0% |
| Idle Minimum * (dB) | 29 | 29 -0% | 29.2 -1% | 31.5 -9% | 32.6 -12% | 29.1 -0% |
| Idle Average * (dB) | 29 | 29 -0% | 29.2 -1% | 31.5 -9% | 32.6 -12% | 29.1 -0% |
| Idle Maximum * (dB) | 29 | 29 -0% | 29.2 -1% | 31.5 -9% | 33 -14% | 29.1 -0% |
| Load Average * (dB) | 37.4 | 35.6 5% | 32.1 14% | 31.7 15% | 38.9 -4% | 33.4 11% |
| Load Maximum * (dB) | 39 | 38.5 1% | 36.8 6% | 34.1 13% | 38.9 -0% | 36 8% |
* ... más pequeño es mejor
(±) La temperatura máxima en la parte superior es de 41.5 °C / 107 F, frente a la media de 34.3 °C / 94 F, que oscila entre 21.2 y 62.5 °C para la clase Office.
(+) El fondo se calienta hasta un máximo de 38.1 °C / 101 F, frente a la media de 36.8 °C / 98 F
(+) En reposo, la temperatura media de la parte superior es de 26.5 °C / 80# F, frente a la media del dispositivo de 29.5 °C / 85 F.
(+) El reposamanos y el panel táctil están a una temperatura inferior a la de la piel, con un máximo de 26 °C / 78.8 F y, por tanto, son fríos al tacto.
(±) La temperatura media de la zona del reposamanos de dispositivos similares fue de 27.5 °C / 81.5 F (+1.5 °C / 2.7 F).
HP ProBook 440 G4-Y8B51EA análisis de audio
(+) | los altavoces pueden reproducir a un volumen relativamente alto (#83.6 dB)
Graves 100 - 315 Hz
(-) | casi sin bajos - de media 20% inferior a la mediana
(-) | los graves no son lineales (15.2% delta a la frecuencia anterior)
Medios 400 - 2000 Hz
(+) | medios equilibrados - a sólo 4.2% de la mediana
(±) | la linealidad de los medios es media (7.4% delta respecto a la frecuencia anterior)
Altos 2 - 16 kHz
(+) | máximos equilibrados - a sólo 3.6% de la mediana
(+) | los máximos son lineales (3% delta a la frecuencia anterior)
Total 100 - 16.000 Hz
(±) | la linealidad del sonido global es media (17% de diferencia con la mediana)
En comparación con la misma clase
» 24% de todos los dispositivos probados de esta clase eran mejores, 7% similares, 68% peores
» El mejor tuvo un delta de 7%, la media fue 21%, el peor fue ###max##%
En comparación con todos los dispositivos probados
» 31% de todos los dispositivos probados eran mejores, 8% similares, 61% peores
» El mejor tuvo un delta de 4%, la media fue 23%, el peor fue ###max##%
Lenovo ThinkPad E470-20H2S00400 análisis de audio
(+) | los altavoces pueden reproducir a un volumen relativamente alto (#84.8 dB)
Graves 100 - 315 Hz
(-) | casi sin bajos - de media 15.7% inferior a la mediana
(±) | la linealidad de los graves es media (11.2% delta a frecuencia anterior)
Medios 400 - 2000 Hz
(±) | medias más altas - de media 9% más altas que la mediana
(±) | la linealidad de los medios es media (11.1% delta respecto a la frecuencia anterior)
Altos 2 - 16 kHz
(±) | máximos más altos - de media 5.1% más altos que la mediana
(±) | la linealidad de los máximos es media (10.5% delta a frecuencia anterior)
Total 100 - 16.000 Hz
(±) | la linealidad del sonido global es media (23.8% de diferencia con la mediana)
En comparación con la misma clase
» 68% de todos los dispositivos probados de esta clase eran mejores, 8% similares, 23% peores
» El mejor tuvo un delta de 7%, la media fue 21%, el peor fue ###max##%
En comparación con todos los dispositivos probados
» 71% de todos los dispositivos probados eran mejores, 6% similares, 22% peores
» El mejor tuvo un delta de 4%, la media fue 23%, el peor fue ###max##%
| Off / Standby | |
| Ocioso | |
| Carga |
|
Clave:
min: | |
| HP ProBook 440 G4-Y8B51EA i7-7500U, GeForce 930MX, 1920x1080, 14" | Lenovo ThinkPad E470-20H2S00400 i5-7200U, GeForce 940MX, 1920x1080, 14" | Dell Latitude 14 E5470 6300U, HD Graphics 520, 1366x768, 14" | Acer TravelMate X3 X349-M-7261 6500U, HD Graphics 520, 1920x1080, 14" | |
|---|---|---|---|---|
| Power Consumption | -4% | 12% | -15% | |
| Idle Minimum * (Watt) | 3 | 2.7 10% | 3.5 -17% | 4.9 -63% |
| Idle Average * (Watt) | 5.4 | 5.5 -2% | 5.3 2% | 7.3 -35% |
| Idle Maximum * (Watt) | 6.3 | 6.5 -3% | 6 5% | 9.4 -49% |
| Load Average * (Watt) | 37.5 | 44.2 -18% | 26.3 30% | 26 31% |
| Load Maximum * (Watt) | 61.1 | 65.2 -7% | 36.6 40% | 36 41% |
* ... más pequeño es mejor
| HP ProBook 440 G4-Y8B51EA i7-7500U, GeForce 930MX, 48 Wh | Lenovo ThinkPad E470-20H2S00400 i5-7200U, GeForce 940MX, 45 Wh | Dell Latitude 14 E5470 6300U, HD Graphics 520, 62 Wh | Acer TravelMate X3 X349-M-7261 6500U, HD Graphics 520, 48.9 Wh | |
|---|---|---|---|---|
| Duración de Batería | -14% | 28% | -25% | |
| Reader / Idle (h) | 18.1 | 17.4 -4% | 21.7 20% | 11.3 -38% |
| H.264 (h) | 9.5 | 8.4 -12% | 10.8 14% | 6.7 -29% |
| WiFi v1.3 (h) | 6.9 | 5.4 -22% | 11.1 61% | 6.5 -6% |
| Load (h) | 2.5 | 2.1 -16% | 2.9 16% | 1.8 -28% |
Pro
Contra
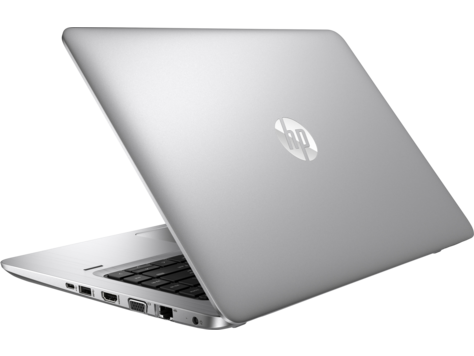
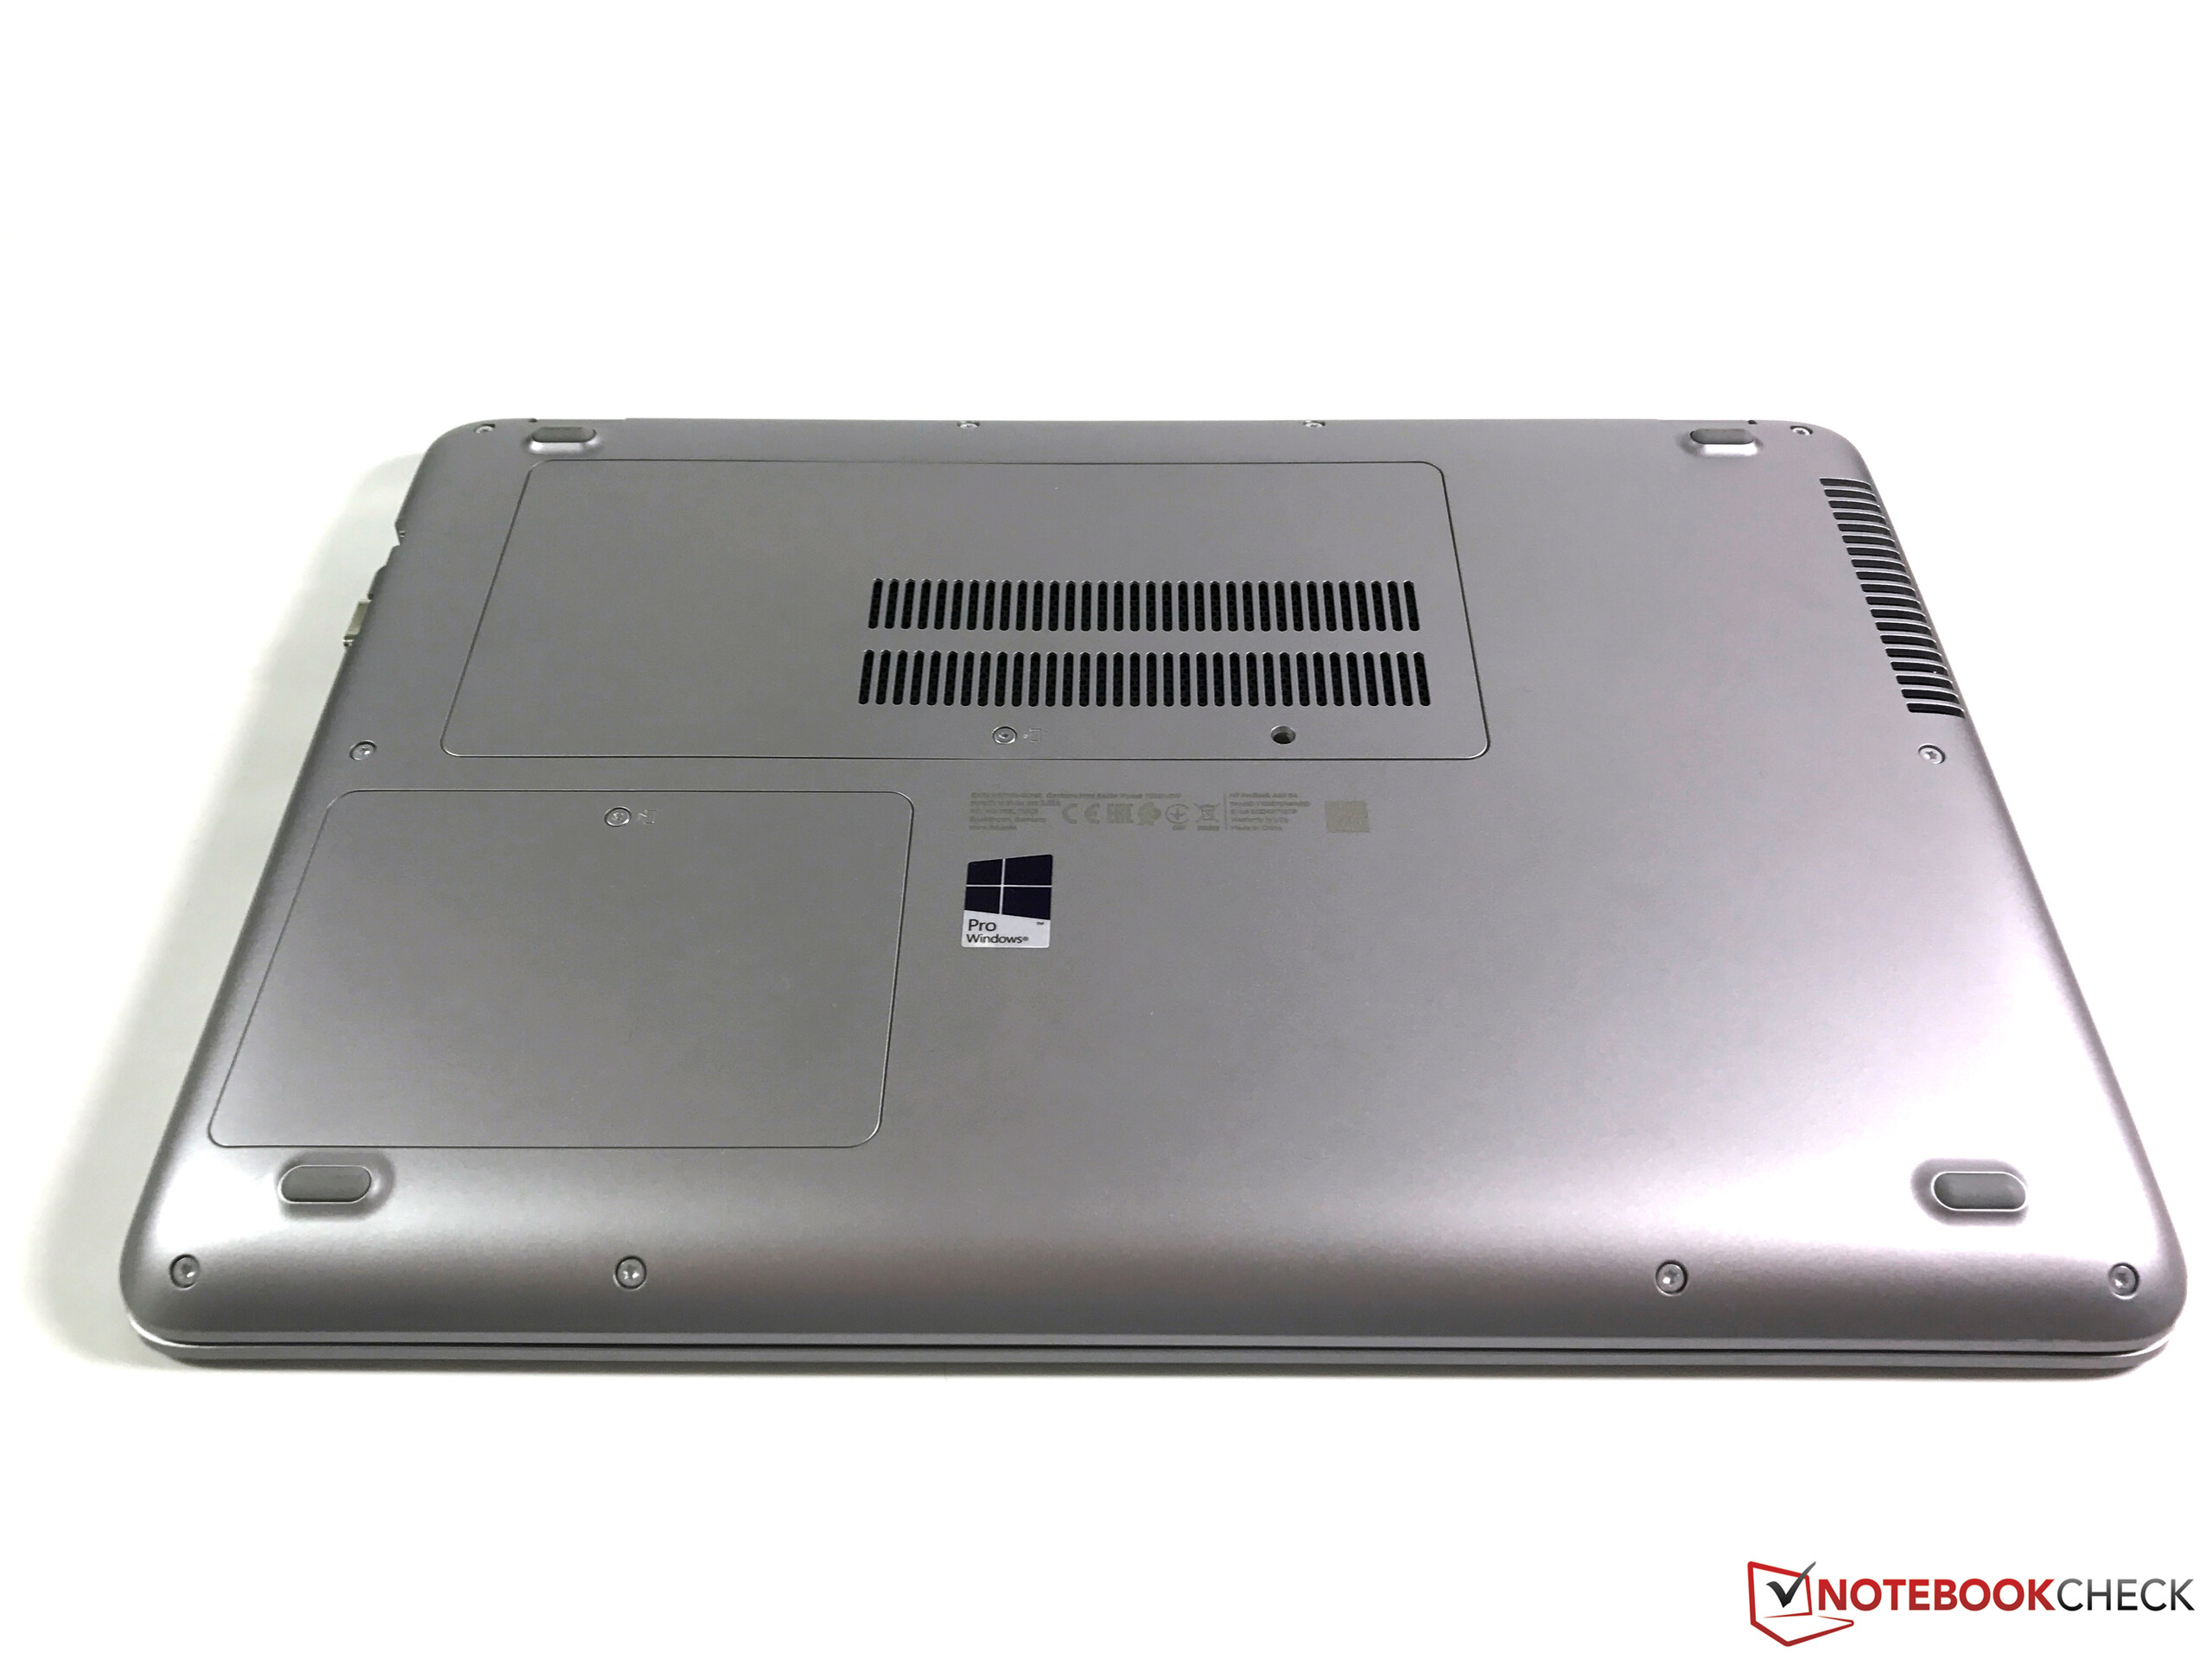
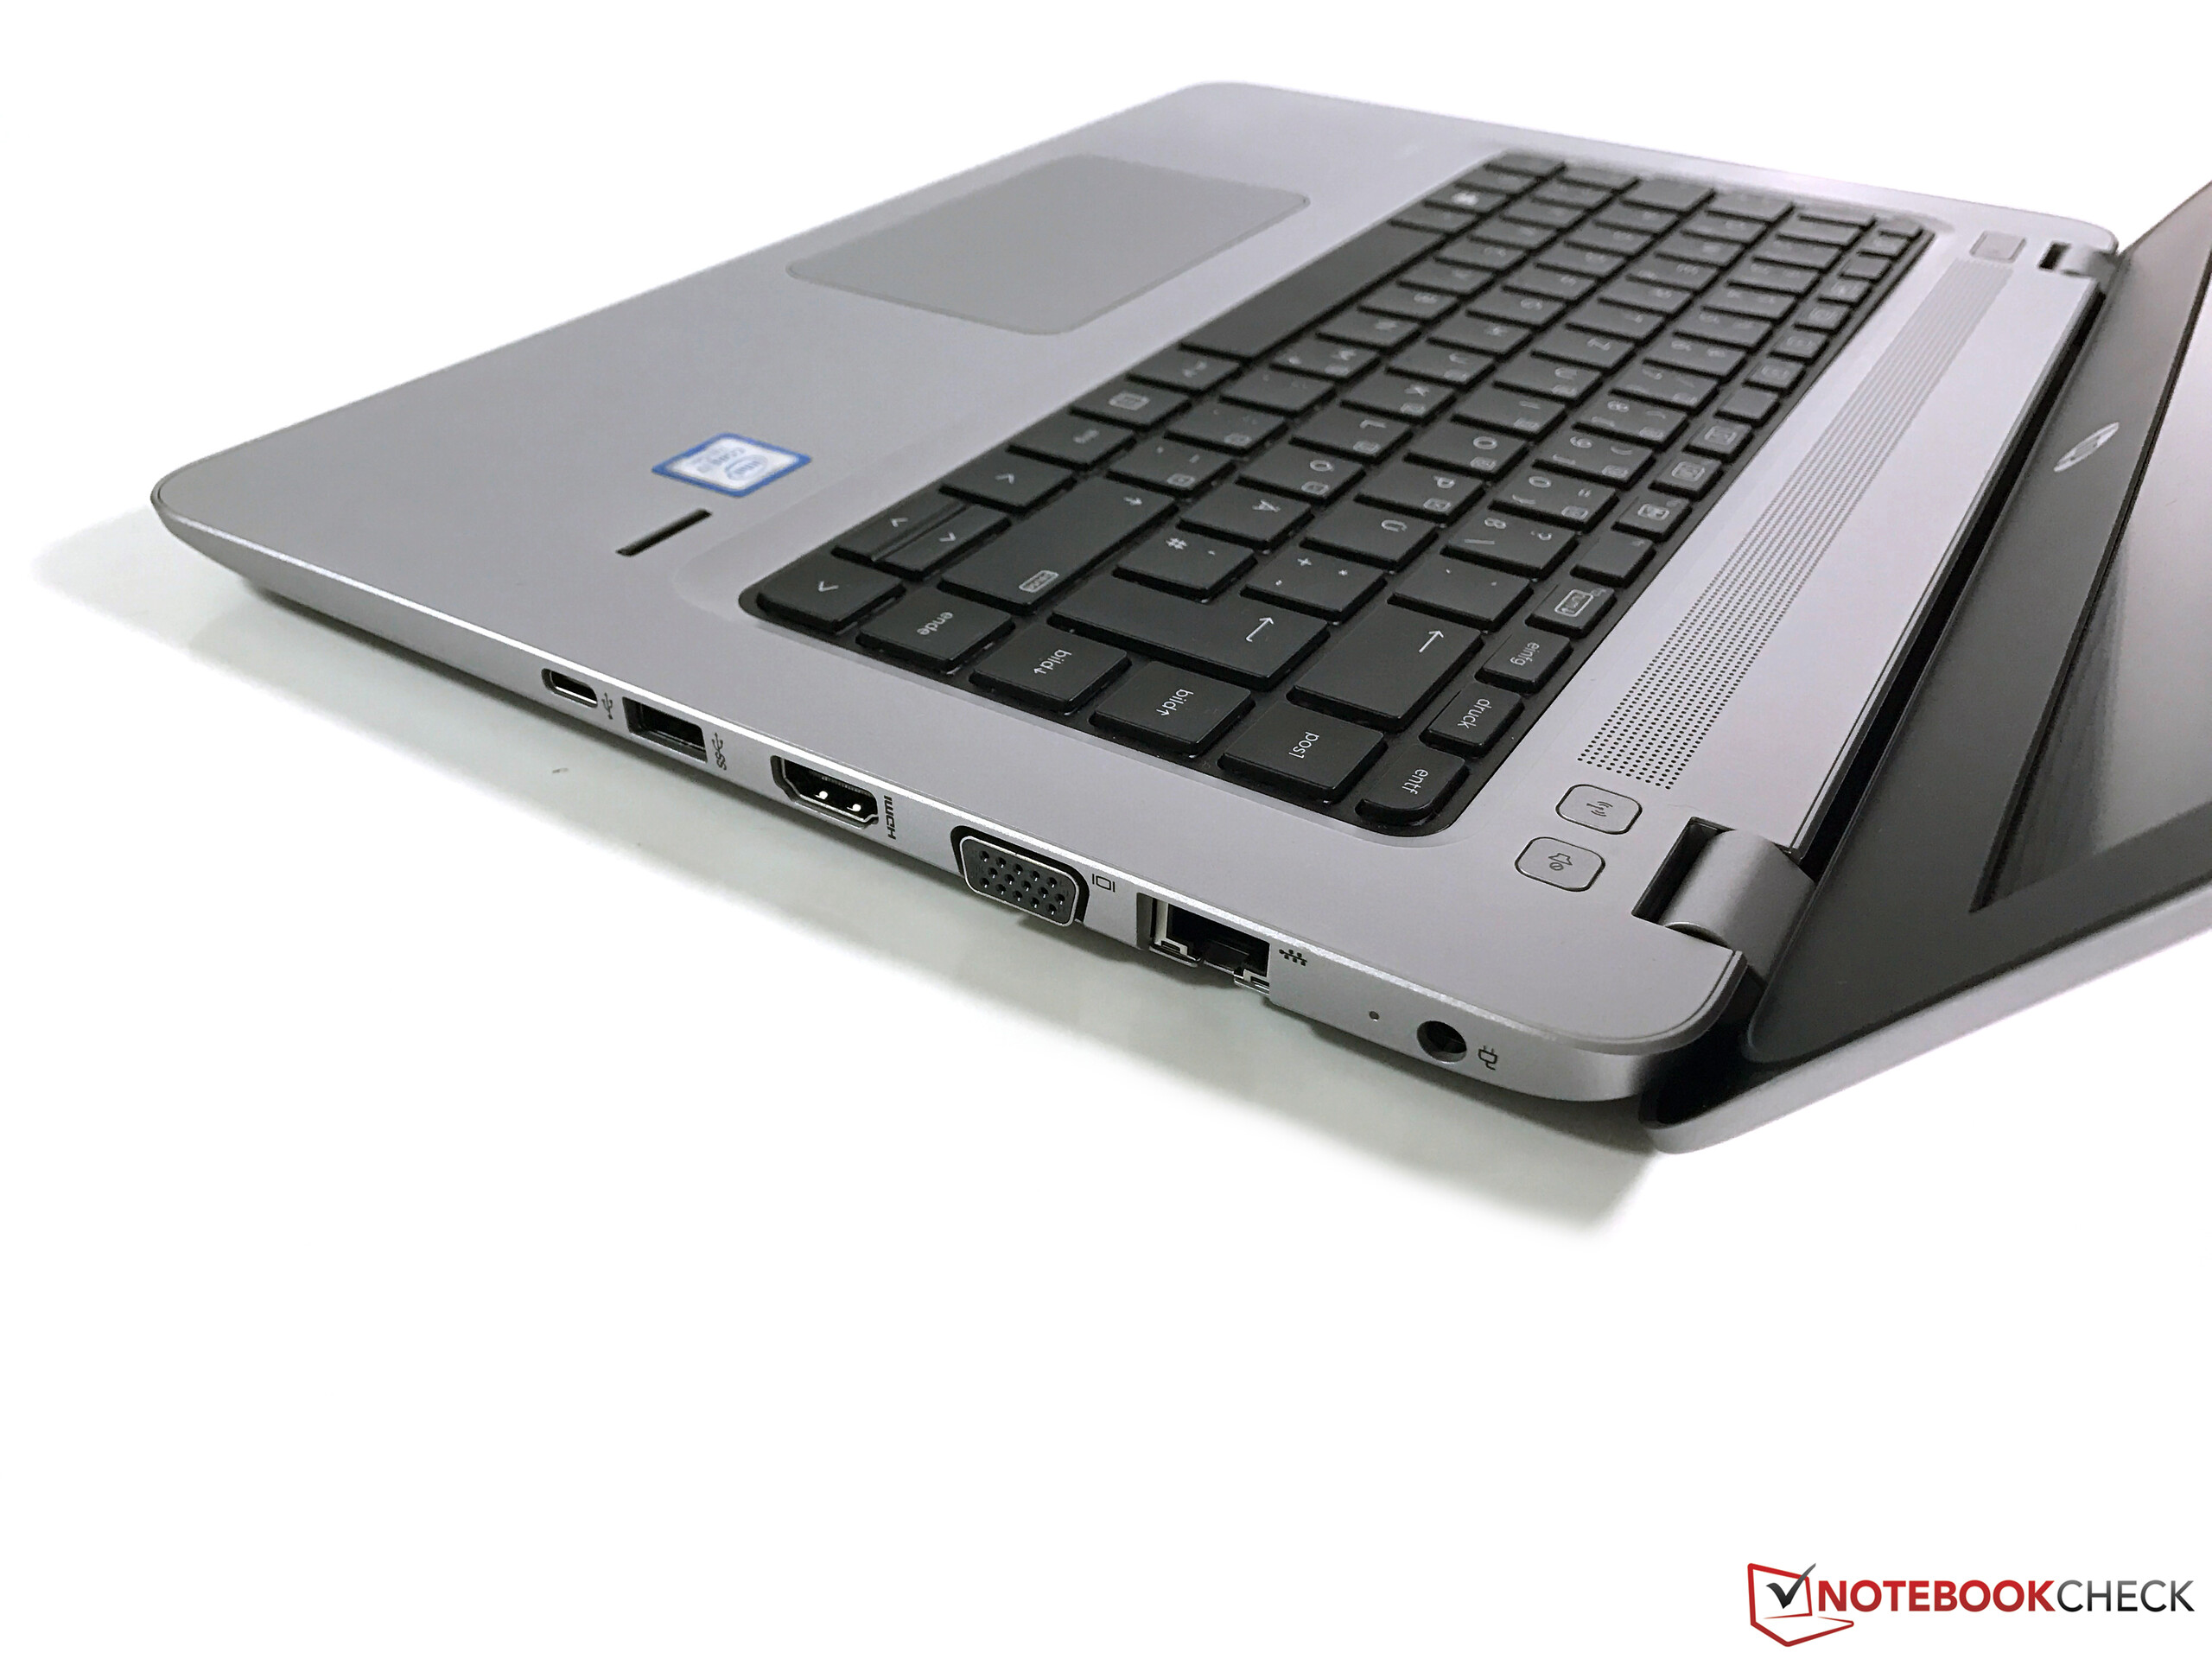
El HP ProBook 440 G4 se parece mucho a sus hermanos, lo que incluye aspectos positivos y negativos. Es una máquina business básica, por lo que tendrás que tolerar algunos sacrificios. Esto incluye características ausentes como el lector de SmartCard o el puerto de anclaje. El ProBook también queda por detrás de productos más caros como los propios EliteBooks de HP en calidad de carcasa y variedad de puertos.
Sin embargo, el mayor problema del ProBook 440 G4 es la pantalla. Nuestro modelo de pruebas ya viene equipado con la "mejor" pantalla que puede tener este sistema, pero seguimos decepcionados. No entendemos por qué HP ni siquiera ofrece un panel IPS como opción, y también hemos visto mejores paneles TN en el pasado.
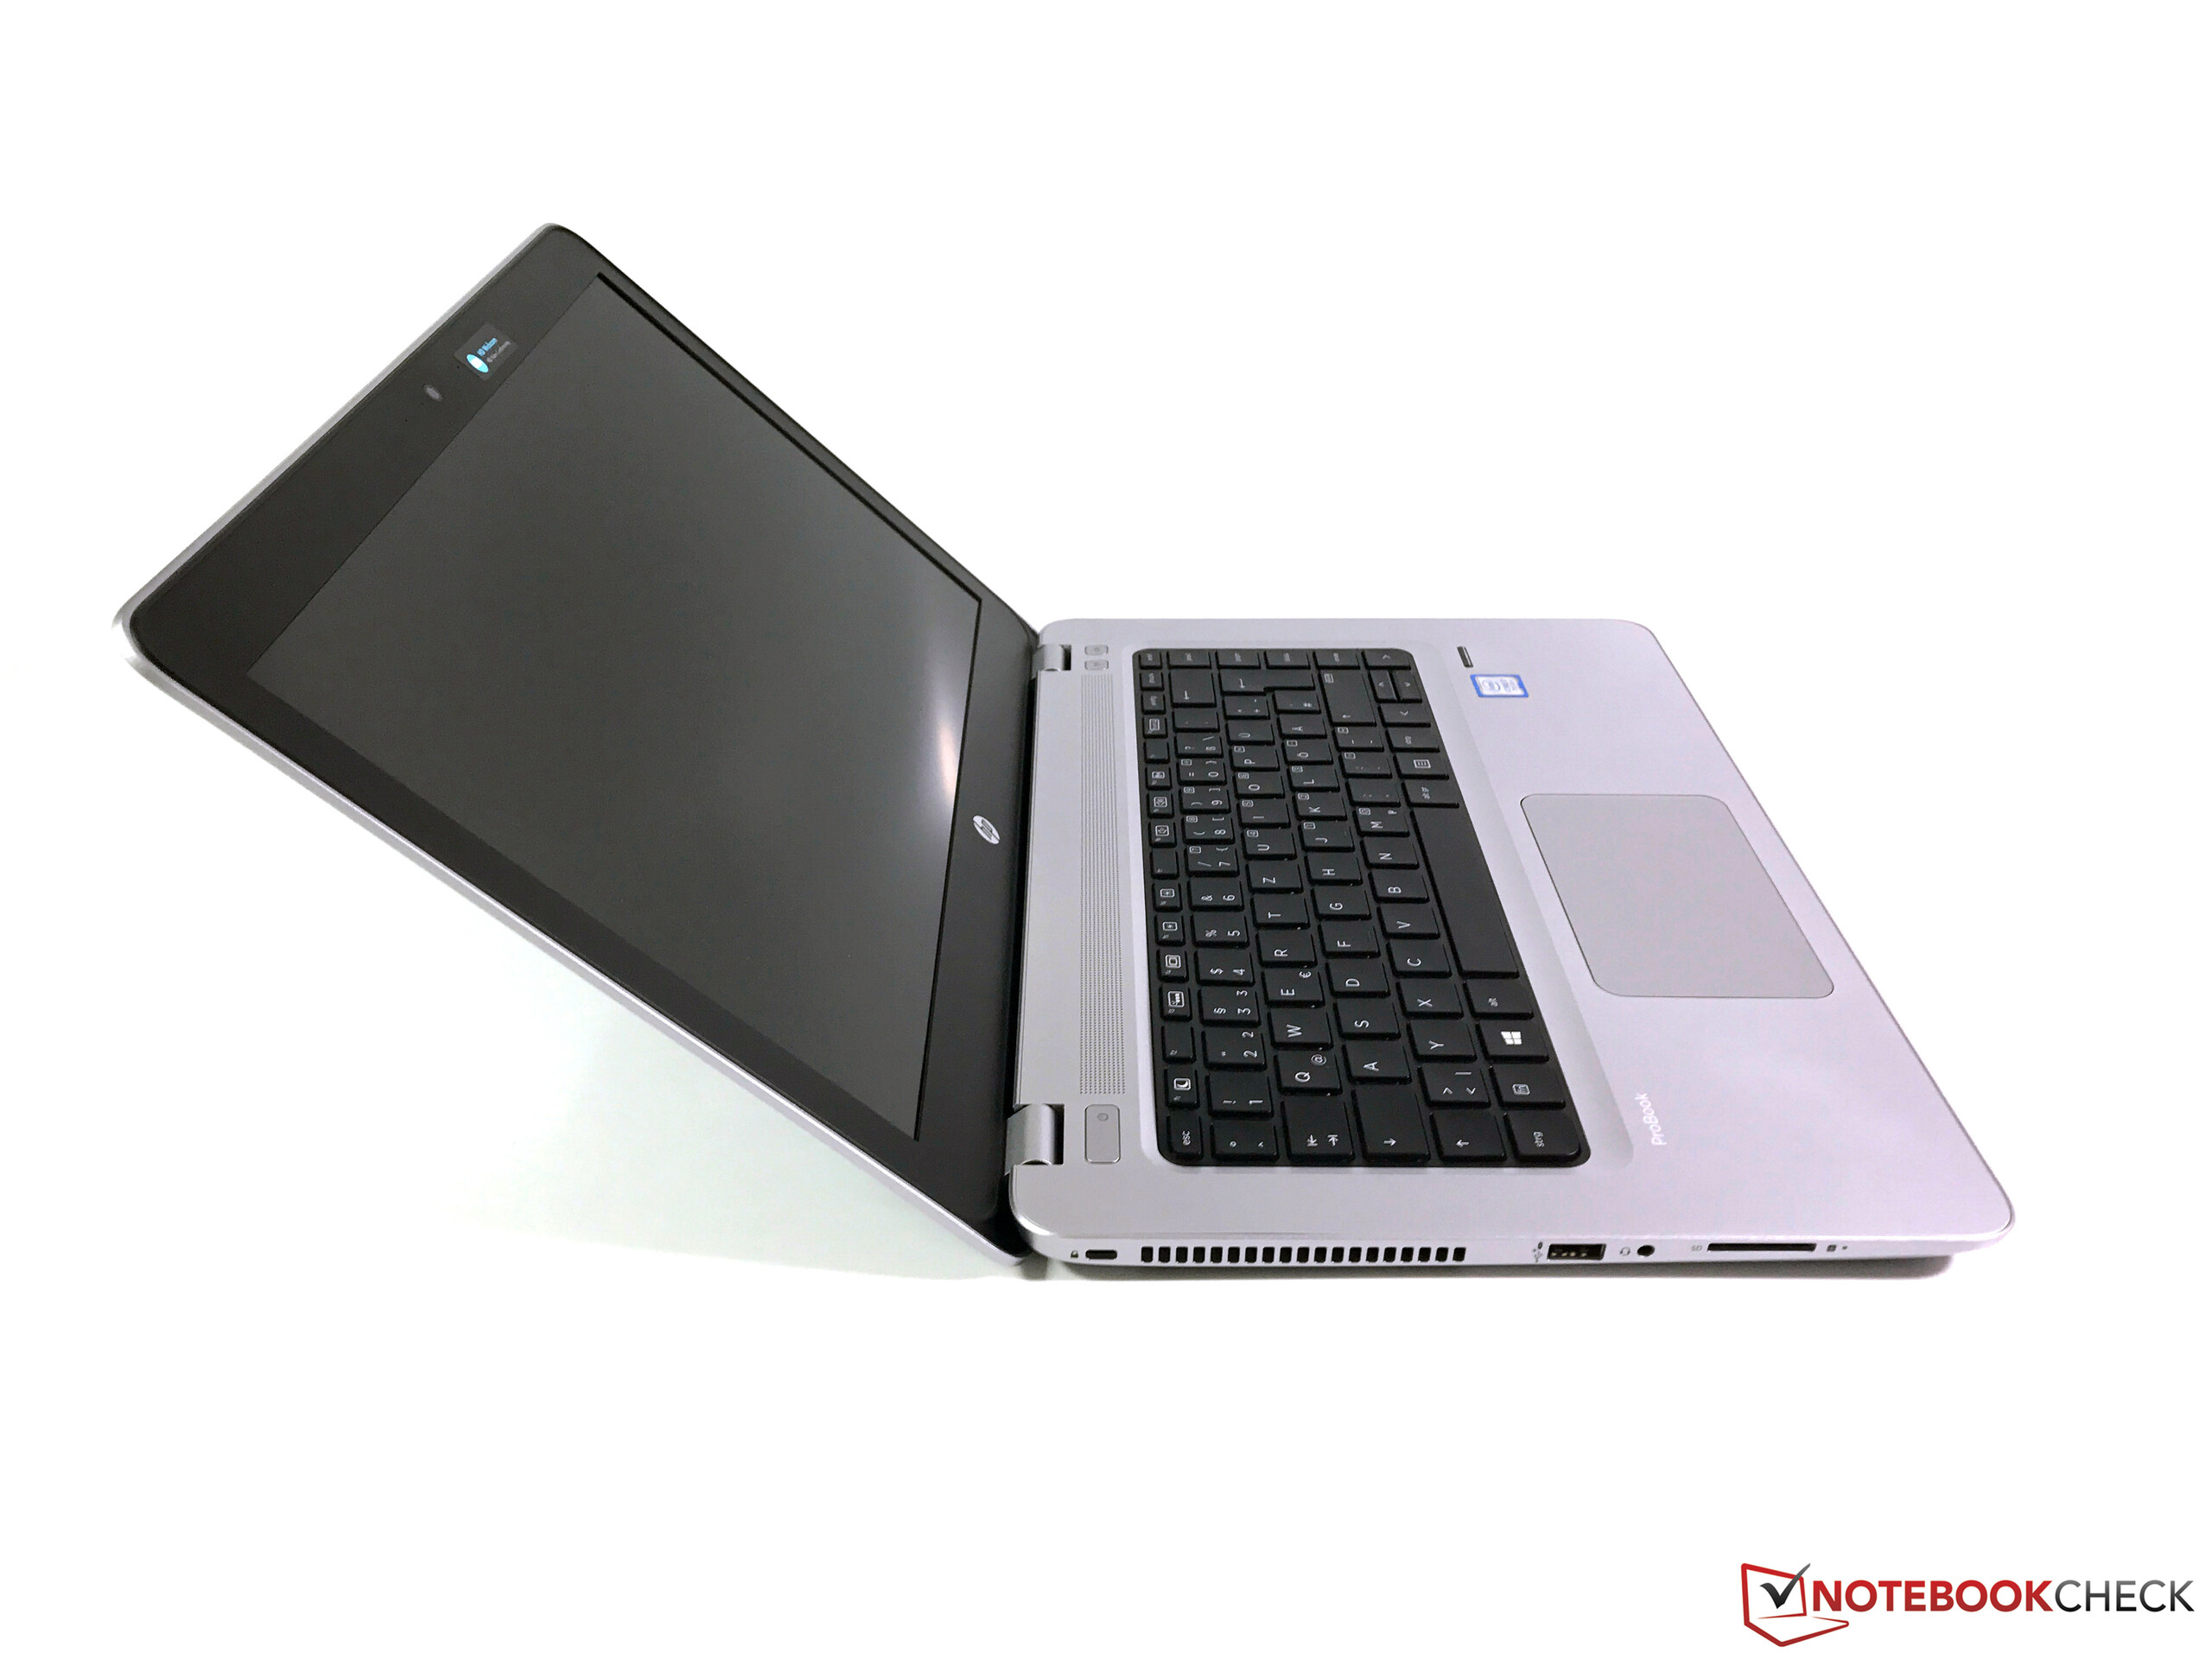
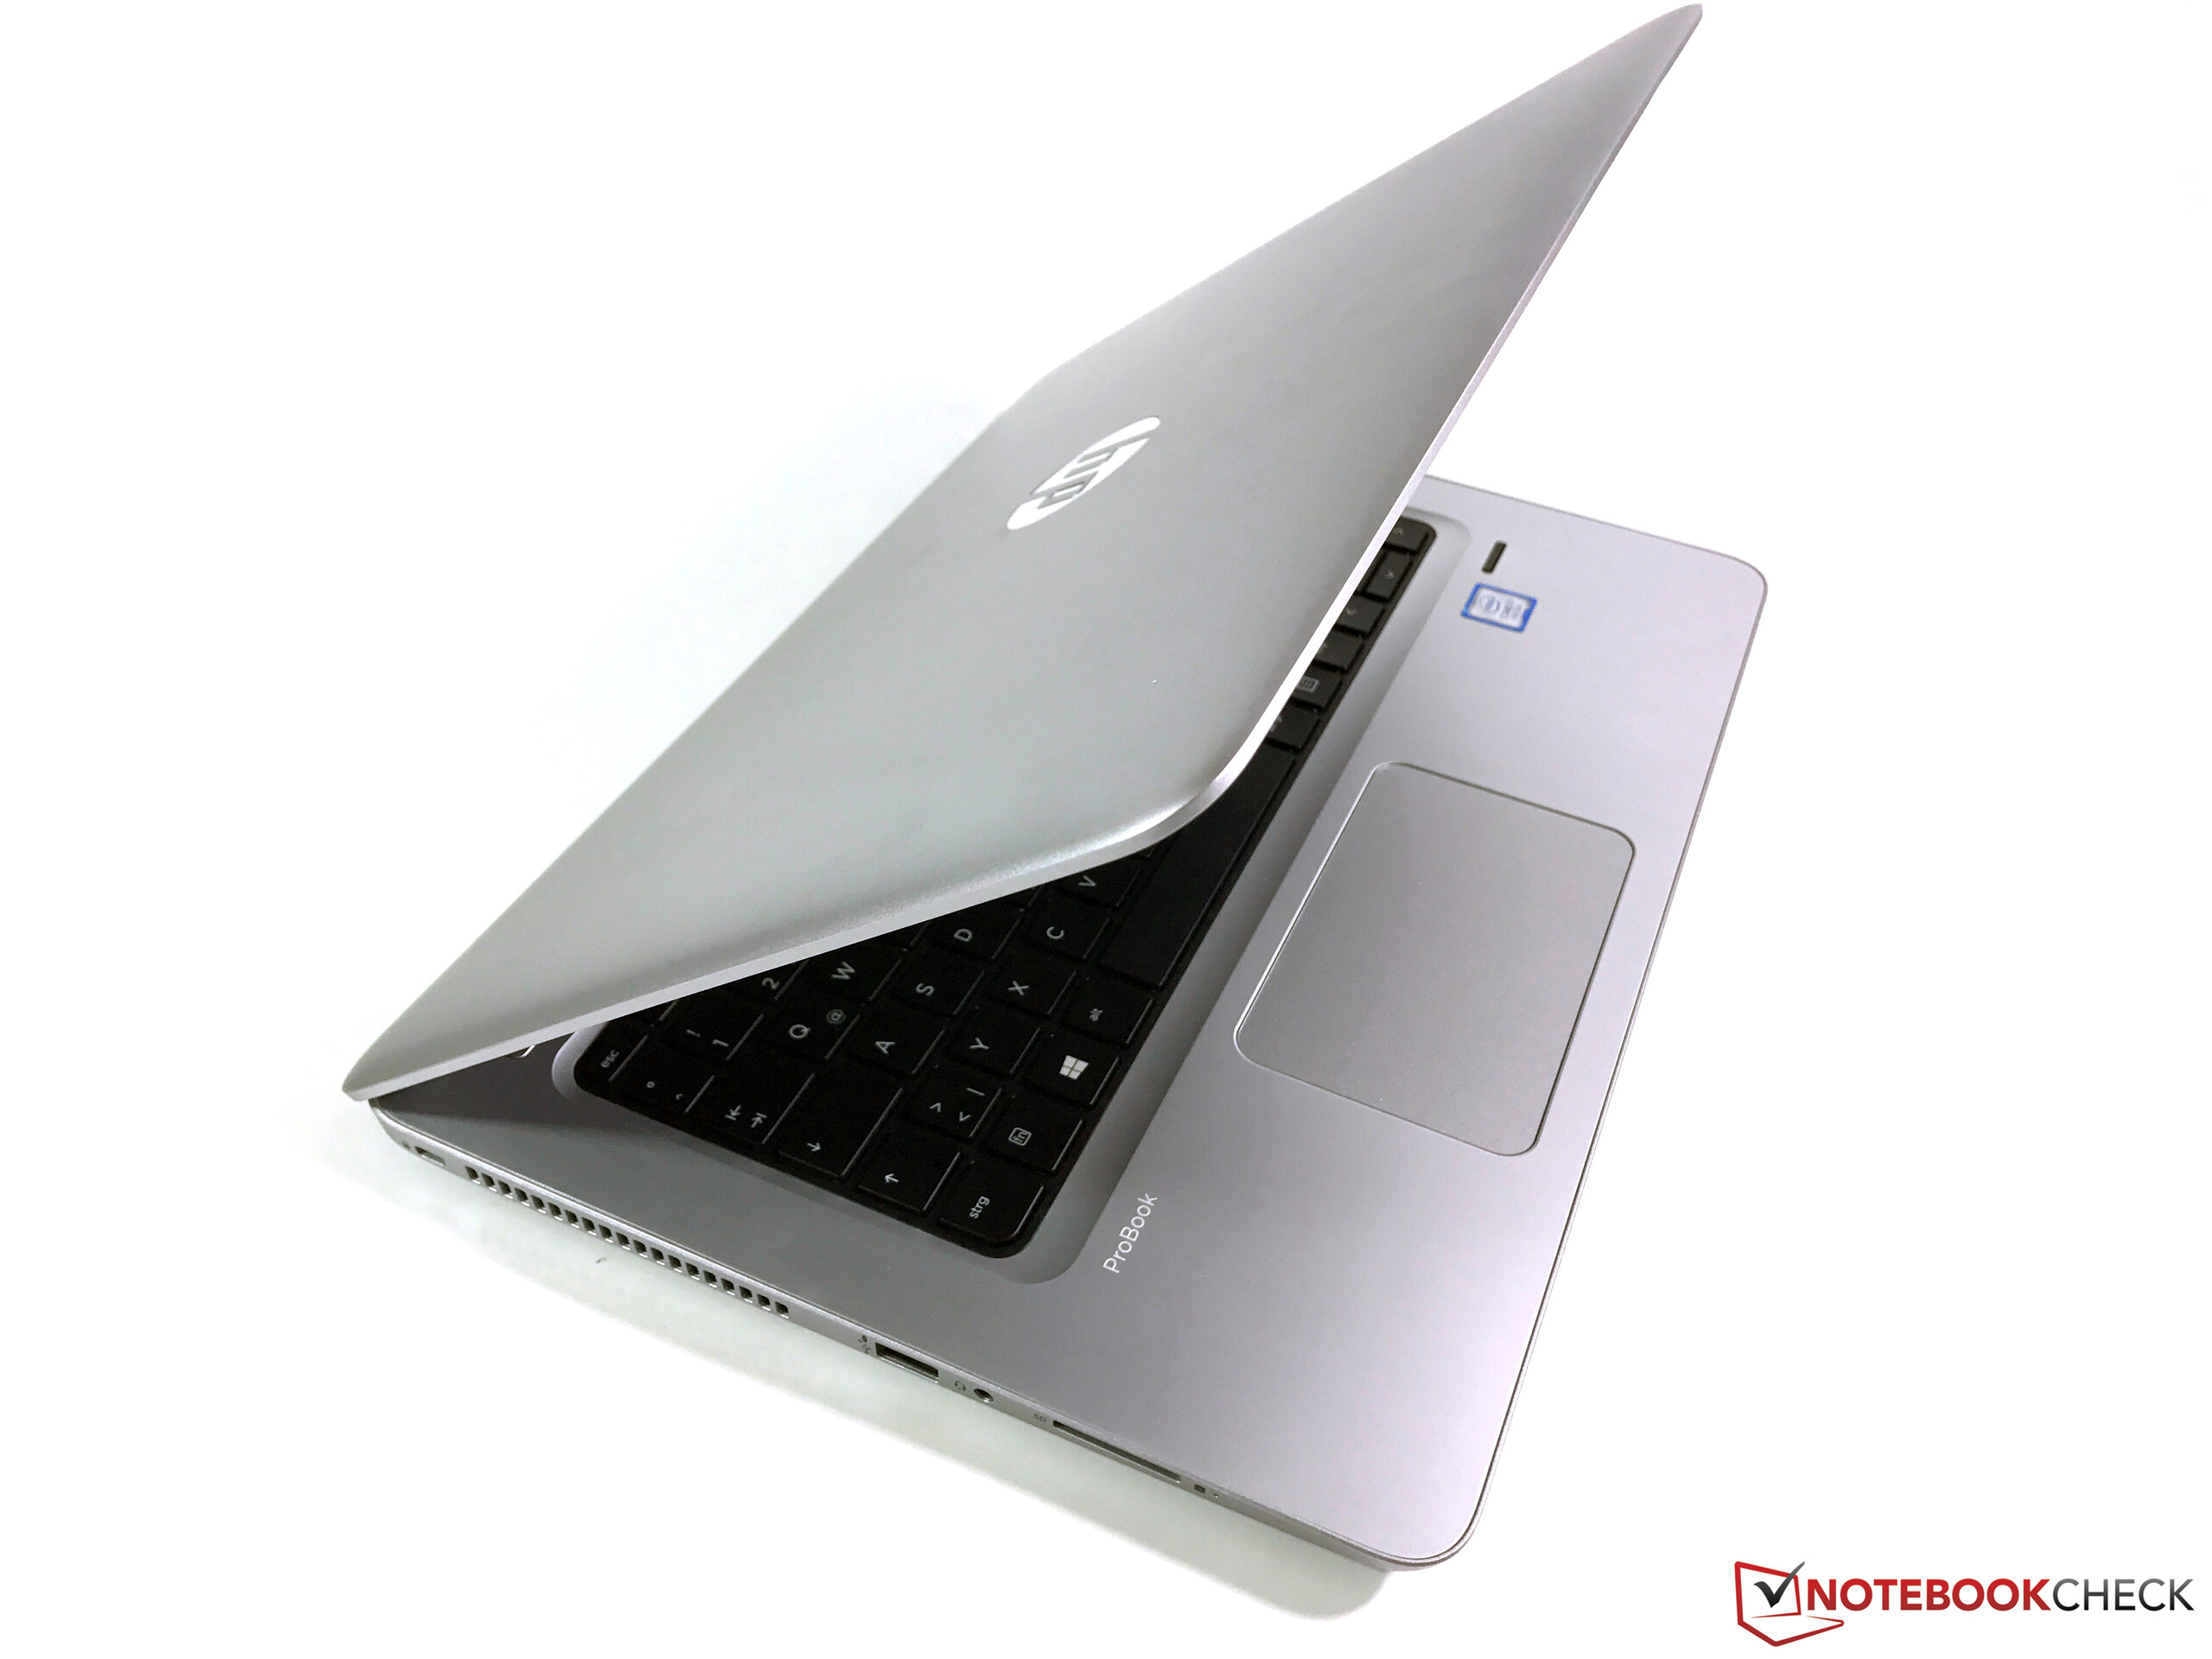
El HP ProBook 440 G4 es rápido, ofrece un buen chasis, y un teclado cómodo, pero cuesta justificar el display cuando cuesta más de 1,000 Euros.
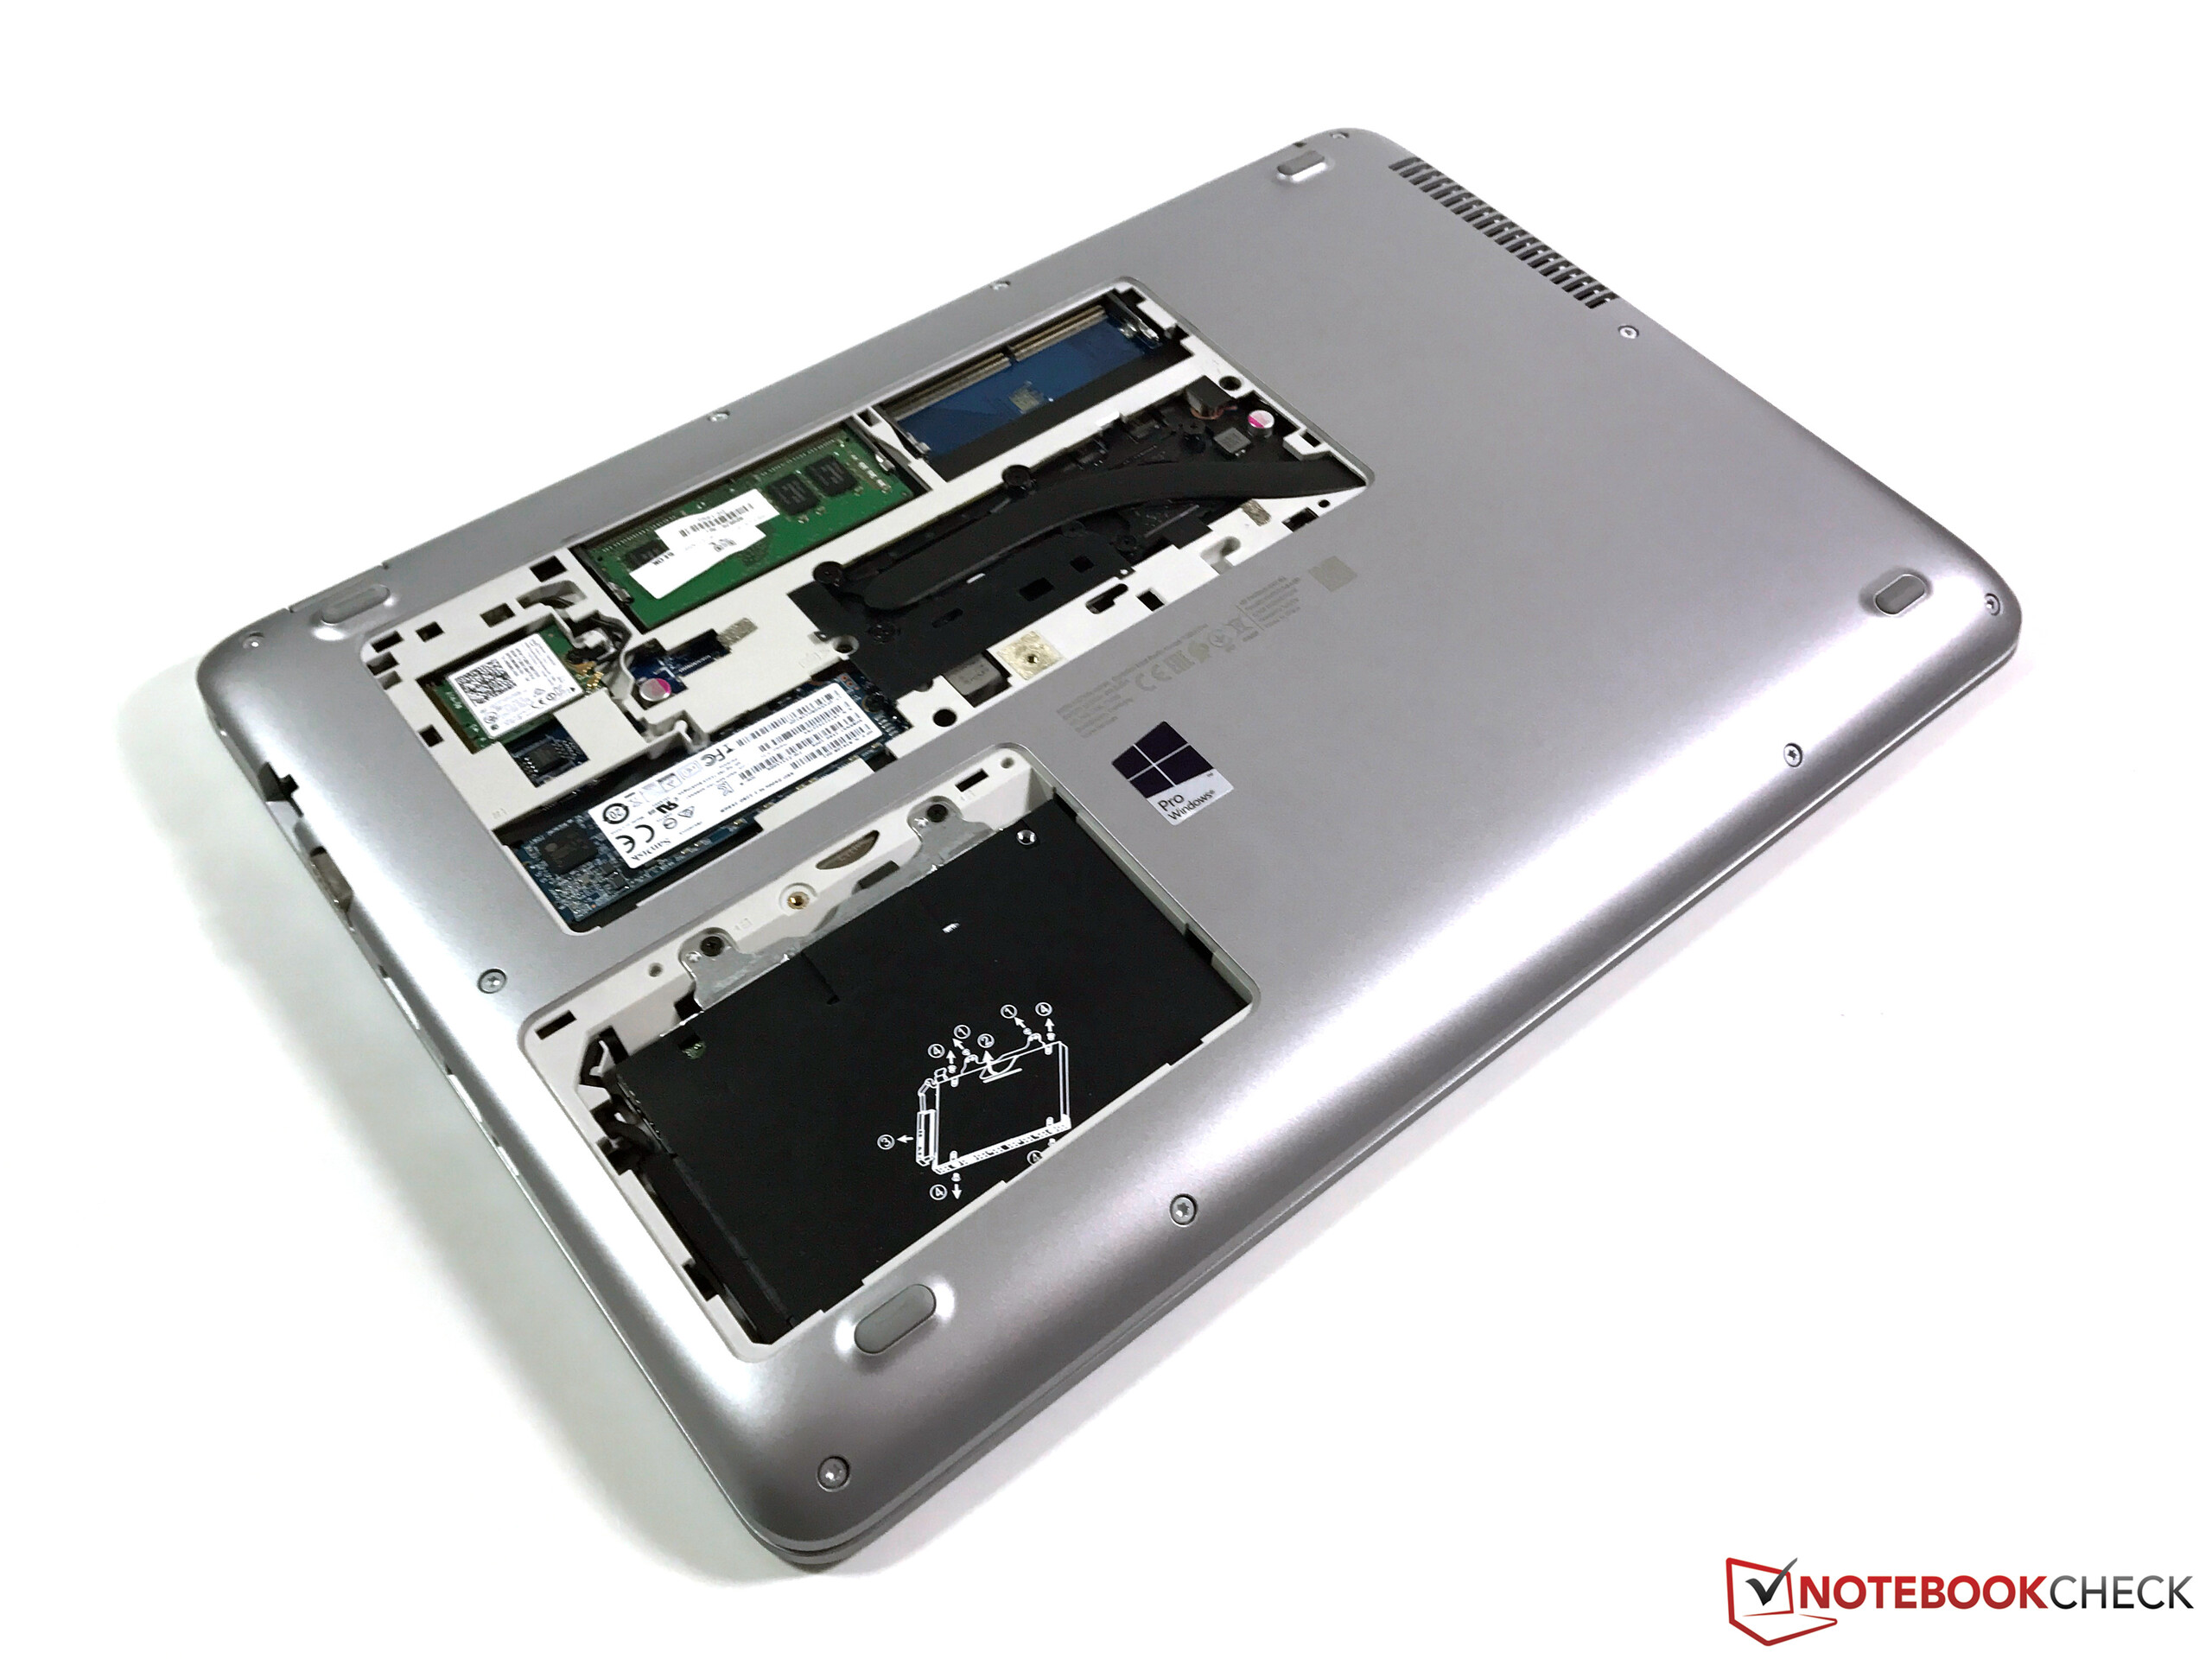
El rendimiento del ProBook 440 G4 actualizado no decepciona, ya que el sistema puede con muchas aplicaciones gracias a los veloces procesador y SSD. Otra cosa es si te beneficias de la GPU dedicada. Obviamente es más potente que el adaptador integrado, pero se nota principalmente al jugar. Puedes elegir un modelo con Core i5 y gráfica integrada si quieres ahorrar dinero. Sigue costando recomendar la versión de 14" del ProBook para todos los usuarios debido a su decepcionante display.
Ésta es una versión acortada del análisis original. Puedes leer el análisis completo en inglés aquí.
HP ProBook 440 G4-Y8B51EA
- 01/12/2017 v6 (old)
Andreas Osthoff
Price comparison
