Breve análisis del Lenovo X62
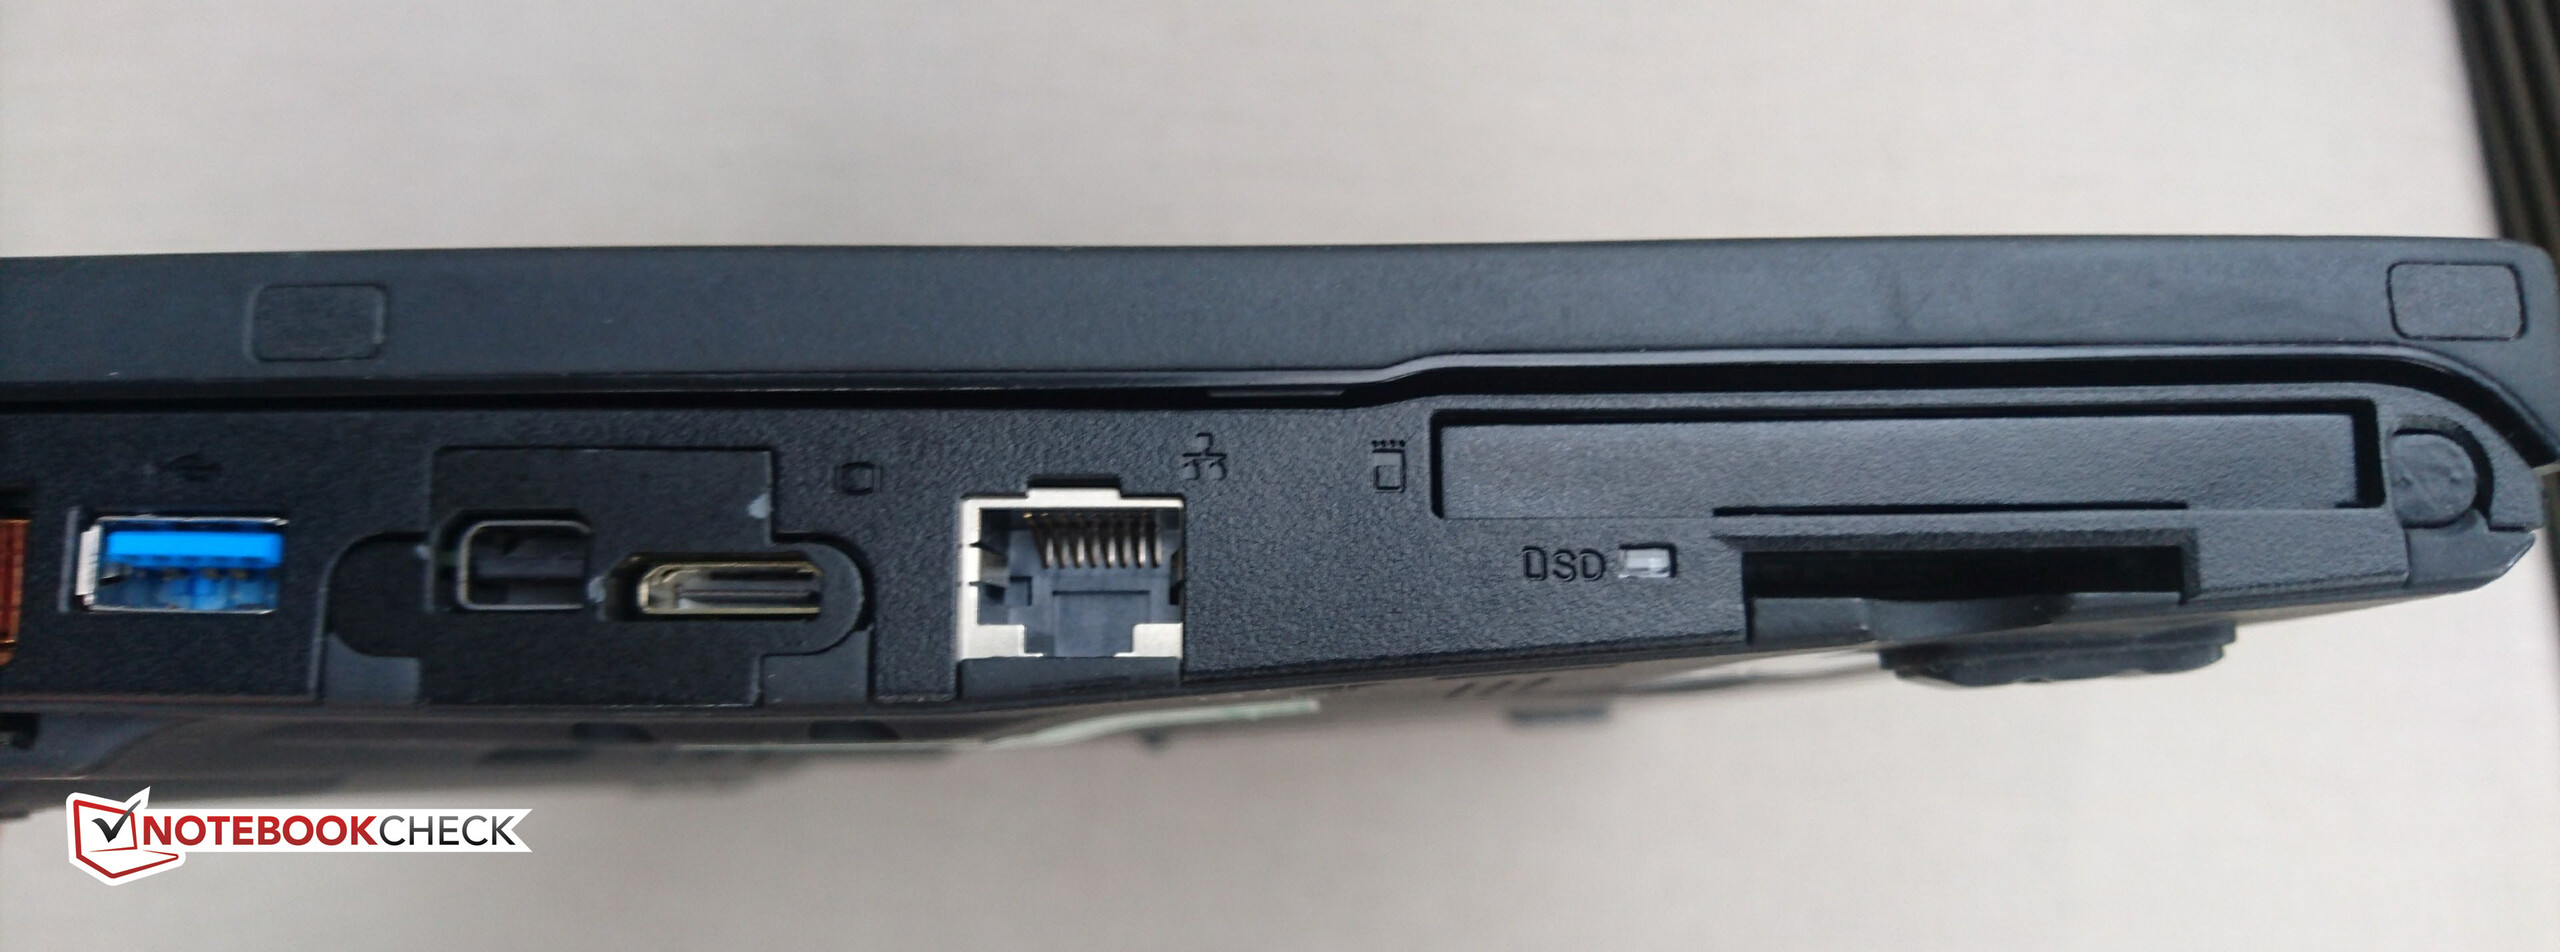


| SD Card Reader | |
| average JPG Copy Test (av. of 3 runs) | |
| Dell Latitude 7280 | |
| Lenovo ThinkPad X270-20HMS00T00 | |
| Lenovo ThinkPad 13-20J2S00G00 | |
| Lenovo ThinkPad X62 | |
| maximum AS SSD Seq Read Test (1GB) | |
| Dell Latitude 7280 | |
| Lenovo ThinkPad X270-20HMS00T00 | |
| Lenovo ThinkPad 13-20J2S00G00 | |
| Lenovo ThinkPad X62 | |
| Networking | |
| iperf3 transmit AX12 | |
| Dell Latitude 7280 | |
| Lenovo ThinkPad X270-20HMS00T00 | |
| Lenovo ThinkPad X62 | |
| Lenovo ThinkPad 13-20J2S00G00 | |
| iperf3 receive AX12 | |
| Lenovo ThinkPad X270-20HMS00T00 | |
| Lenovo ThinkPad 13-20J2S00G00 | |
| Dell Latitude 7280 | |
| Lenovo ThinkPad X62 | |
| |||||||||||||||||||||||||
iluminación: 88 %
Contraste: 306:1 (Negro: 0.55 cd/m²)
ΔE ColorChecker Calman: 6.1 | ∀{0.5-29.43 Ø4.73}
ΔE Greyscale Calman: 0.7 | ∀{0.09-98 Ø4.97}
54.2% sRGB (Argyll 1.6.3 3D)
35% AdobeRGB 1998 (Argyll 1.6.3 3D)
37.95% AdobeRGB 1998 (Argyll 3D)
54.3% sRGB (Argyll 3D)
36.63% Display P3 (Argyll 3D)
Gamma: 2.19
| Lenovo ThinkPad X62 IPS Flexview HV121P01-100, , 12.1", 1400x1050 | Dell XPS 13-9343 SHP1421, IPS, 13.3", 3200x1800 | Lenovo ThinkPad X270-20HMS00T00 Innolux N125HCE-GN1, IPS LED, 12.5", 1920x1080 | Dell Latitude 7280 AUO236D , IPS, 12.5", 1920x1080 | Lenovo ThinkPad 13-20J2S00G00 LP133WF2-SPL78, IPS, LED, 13.3", 1920x1080 | Apple MacBook 12 (Early 2016) 1.1 GHz APPA027, IPS, 12", 2304x1440 | |
|---|---|---|---|---|---|---|
| Display | 88% | 22% | 21% | 10% | 79% | |
| Display P3 Coverage (%) | 36.63 | 72 97% | 44.6 22% 44.6 22% | 44.41 21% | 40.16 10% | 66.8 82% |
| sRGB Coverage (%) | 54.3 | 96 77% | 65.9 21% 65.9 21% | 65.4 20% | 60 10% | 95.4 76% |
| AdobeRGB 1998 Coverage (%) | 37.95 | 71.6 89% | 46.11 22% 46.11 22% | 45.9 21% | 41.54 9% | 68 79% |
| Response Times | 19% | 24% | 24% | 18% | ||
| Response Time Grey 50% / Grey 80% * (ms) | 59.6 ? | 40.8 ? 32% | 32.4 ? 46% | 43.6 ? 27% | 41.2 ? 31% | |
| Response Time Black / White * (ms) | 32 ? | 30.4 ? 5% | 31.2 ? 2% | 25.2 ? 21% | 30.4 ? 5% | |
| PWM Frequency (Hz) | 26040 ? | 30860 ? | ||||
| Screen | 51% | -19% | -12% | 3% | 69% | |
| Brightness middle (cd/m²) | 168.3 | 367.3 118% | 283 68% | 310.4 84% | 306 82% | 387 130% |
| Brightness (cd/m²) | 157 | 372 137% | 281 79% | 301 92% | 307 96% | 358 128% |
| Brightness Distribution (%) | 88 | 77 -12% | 94 7% | 88 0% | 89 1% | 88 0% |
| Black Level * (cd/m²) | 0.55 | 0.178 68% | 0.25 55% | 0.32 42% | 0.36 35% | 0.47 15% |
| Contrast (:1) | 306 | 2063 574% | 1132 270% | 970 217% | 850 178% | 823 169% |
| Colorchecker dE 2000 * | 6.1 | 5.92 3% | 6.1 -0% | 5.9 3% | 5.1 16% | 1.6 74% |
| Colorchecker dE 2000 max. * | 30.5 | 15.4 50% | 21 31% | 13.3 56% | 4 87% | |
| Greyscale dE 2000 * | 0.7 | 4.79 -584% | 6 -757% | 5.1 -629% | 3.9 -457% | 1 -43% |
| Gamma | 2.19 100% | 2.42 91% | 2.05 107% | 2.33 94% | 2.17 101% | 2.26 97% |
| Color Space (Percent of AdobeRGB 1998) (%) | 35 | 63 80% | 42.26 21% | 42 20% | 38.24 9% | 61.6 76% |
| Color Space (Percent of sRGB) (%) | 54.2 | 96.4 78% | 65.43 21% | 65 20% | 59.75 10% | 82.2 52% |
| CCT | 7013 93% | 6832 95% | 6816 95% | 6829 95% | 6680 97% | |
| Media total (Programa/Opciones) | 70% /
60% | 7% /
-1% | 11% /
-1% | 12% /
7% | 55% /
64% |
* ... más pequeño es mejor
Tiempos de respuesta del display
| ↔ Tiempo de respuesta de Negro a Blanco | ||
|---|---|---|
| 32 ms ... subida ↗ y bajada ↘ combinada | ↗ 18 ms subida | 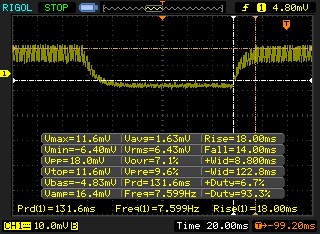 |
| ↘ 14 ms bajada | ||
| La pantalla mostró tiempos de respuesta lentos en nuestros tests y podría ser demasiado lenta para los jugones. En comparación, todos los dispositivos de prueba van de ##min### (mínimo) a 240 (máximo) ms. » 86 % de todos los dispositivos son mejores. Eso quiere decir que el tiempo de respuesta es peor que la media (19.9 ms) de todos los dispositivos testados. | ||
| ↔ Tiempo de respuesta 50% Gris a 80% Gris | ||
| 59.6 ms ... subida ↗ y bajada ↘ combinada | ↗ 16.8 ms subida | 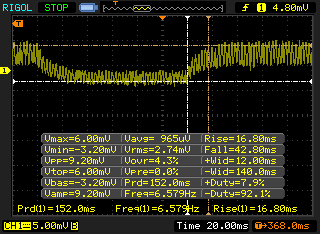 |
| ↘ 42.8 ms bajada | ||
| La pantalla mostró tiempos de respuesta lentos en nuestros tests y podría ser demasiado lenta para los jugones. En comparación, todos los dispositivos de prueba van de ##min### (mínimo) a 636 (máximo) ms. » 96 % de todos los dispositivos son mejores. Eso quiere decir que el tiempo de respuesta es peor que la media (31.1 ms) de todos los dispositivos testados. | ||
Parpadeo de Pantalla / PWM (Pulse-Width Modulation)
| Parpadeo de Pantalla / PWM no detectado | ≤ 100 % de brillo | 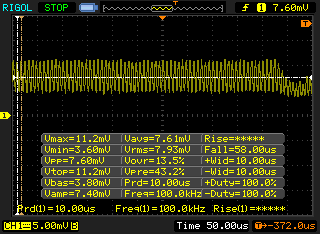 | |
| ≤ 168.3 cd/m² brillo | |||
Comparación: 52 % de todos los dispositivos testados no usaron PWM para atenuar el display. Si se usó, medimos una media de 7798 (mínimo: 5 - máxmo: 343500) Hz. | |||
| Cinebench R10 | |
| Rendering Multiple CPUs 32Bit | |
| Lenovo ThinkPad 13-20J2S00G00 | |
| Lenovo ThinkPad X62 | |
| Apple MacBook 12 (Early 2016) 1.1 GHz | |
| Dell XPS 13-9343 | |
| Rendering Single 32Bit | |
| Lenovo ThinkPad 13-20J2S00G00 | |
| Lenovo ThinkPad X62 | |
| Apple MacBook 12 (Early 2016) 1.1 GHz | |
| Dell XPS 13-9343 | |
| wPrime 2.10 - 1024m | |
| Apple MacBook 12 (Early 2016) 1.1 GHz | |
| Dell XPS 13-9343 | |
| Dell Latitude 7280 | |
* ... más pequeño es mejor
| PCMark 7 Score | 4729 puntos | |
| PCMark 8 Home Score Accelerated v2 | 2928 puntos | |
| PCMark 8 Creative Score Accelerated v2 | 3349 puntos | |
| PCMark 8 Work Score Accelerated v2 | 3748 puntos | |
ayuda | ||
| Lenovo ThinkPad X62 | Dell XPS 13-9343 Lite-On IT L8T-256L9G | Apple MacBook 12 (Early 2016) 1.3 GHz Apple SSD AP0256 | Lenovo ThinkPad X270-20HMS00T00 Toshiba NVMe THNSF5512GPUK | Dell Latitude 7280 SanDisk X400 M.2 2280 256GB | Lenovo ThinkPad 13-20J2S00G00 Toshiba NVMe THNSF5512GPUK | |
|---|---|---|---|---|---|---|
| CrystalDiskMark 3.0 | 129% | 134% | 258% | 100% | 236% | |
| Read Seq (MB/s) | 512 | 489.6 -4% | 821 60% | 1190 132% | 470.8 -8% | 1143 123% |
| Write Seq (MB/s) | 154.4 | 424.2 175% | 660 327% | 985 538% | 477.4 209% | 653 323% |
| Read 512 (MB/s) | 462.1 | 371.9 -20% | 672 45% | 858 86% | 370.1 -20% | 629 36% |
| Write 512 (MB/s) | 144.6 | 395.5 174% | 737 410% | 528 265% | 323.2 124% | 518 258% |
| Read 4k (MB/s) | 11.43 | 34.76 204% | 16.28 42% | 35.27 209% | 30.23 164% | 31.96 180% |
| Write 4k (MB/s) | 34.1 | 79.3 133% | 24.87 -27% | 124.5 265% | 59.5 74% | 138.5 306% |
| Read 4k QD32 (MB/s) | 107.1 | 354 231% | 271.9 154% | 495.3 362% | 344.4 222% | 578 440% |
| Write 4k QD32 (MB/s) | 137.7 | 326.3 137% | 223.9 63% | 418.3 204% | 183 33% | 443.1 222% |

| 3DMark | |
| 1280x720 Cloud Gate Standard Graphics | |
| Dell Latitude 7280 | |
| Lenovo ThinkPad X62 | |
| Apple MacBook 12 (Early 2016) 1.3 GHz | |
| Lenovo ThinkPad X270-20HMS00T00 | |
| 1920x1080 Fire Strike Graphics | |
| Dell Latitude 7280 | |
| Apple MacBook 12 (Early 2016) 1.3 GHz | |
| Lenovo ThinkPad X270-20HMS00T00 | |
| Lenovo ThinkPad X62 | |
| 3DMark 06 Standard Score | 7382 puntos | |
| 3DMark 11 Performance | 1220 puntos | |
| 3DMark Cloud Gate Standard Score | 4912 puntos | |
| 3DMark Fire Strike Score | 729 puntos | |
ayuda | ||
Ruido
| Ocioso |
| 31.8 / 31.8 / 31.8 dB(A) |
| Carga |
| 34.1 / 40.8 dB(A) |
 | ||
30 dB silencioso 40 dB(A) audible 50 dB(A) ruidosamente alto |
||
min: | ||
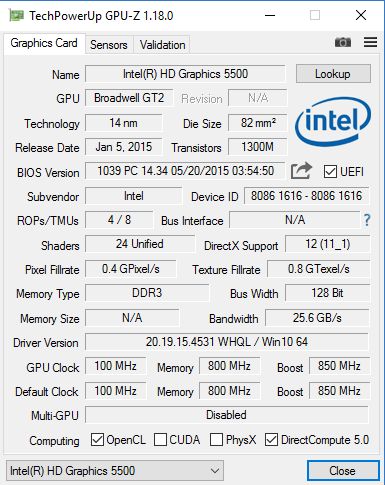
| Lenovo ThinkPad X62 HD Graphics 5500, 5200U | Dell XPS 13-9343 HD Graphics 5500, 5200U, Lite-On IT L8T-256L9G | Lenovo ThinkPad X270-20HMS00T00 HD Graphics 620, i5-7200U, Toshiba NVMe THNSF5512GPUK | Dell Latitude 7280 HD Graphics 620, i7-7600U, SanDisk X400 M.2 2280 256GB | Lenovo ThinkPad 13-20J2S00G00 HD Graphics 620, i7-7500U, Toshiba NVMe THNSF5512GPUK | |
|---|---|---|---|---|---|
| Noise | -1% | 5% | 8% | 9% | |
| apagado / medio ambiente * (dB) | 28.8 | 29 -1% | 29.4 -2% | 29.1 -1% | |
| Idle Minimum * (dB) | 31.8 | 30.2 5% | 29 9% | 29.4 8% | 29.1 8% |
| Idle Average * (dB) | 31.8 | 30.3 5% | 29 9% | 29.4 8% | 29.1 8% |
| Idle Maximum * (dB) | 31.8 | 30.4 4% | 30.4 4% | 30 6% | 29.1 8% |
| Load Average * (dB) | 34.1 | 34.4 -1% | 34.1 -0% | 30.6 10% | 31.9 6% |
| Witcher 3 ultra * (dB) | 37.45 | ||||
| Load Maximum * (dB) | 40.8 | 48 -18% | 37.6 8% | 32.7 20% | 31.9 22% |
* ... más pequeño es mejor
(+) La temperatura máxima en la parte superior es de 39.4 °C / 103 F, frente a la media de 36.9 °C / 98 F, que oscila entre 24.7 y 57 °C para la clase .
(±) El fondo se calienta hasta un máximo de 44.2 °C / 112 F, frente a la media de 38.5 °C / 101 F
(+) En reposo, la temperatura media de la parte superior es de 29.5 °C / 85# F, frente a la media del dispositivo de 31.9 °C / 89 F.
(±) El reposamanos y el touchpad pueden calentarse mucho al tacto con un máximo de 39.4 °C / 102.9 F.
(-) La temperatura media de la zona del reposamanos de dispositivos similares fue de 29.6 °C / 85.3 F (-9.8 °C / -17.6 F).
Lenovo ThinkPad X62 análisis de audio
(-) | altavoces no muy altos (#52 dB)
Graves 100 - 315 Hz
(-) | casi sin bajos - de media 26.8% inferior a la mediana
(+) | el bajo es lineal (4.3% delta a la frecuencia anterior)
Medios 400 - 2000 Hz
(±) | medias más altas - de media 7.9% más altas que la mediana
(-) | los medios no son lineales (16% delta respecto a la frecuencia anterior)
Altos 2 - 16 kHz
(±) | máximos más altos - de media 9.5% más altos que la mediana
(+) | los máximos son lineales (6.2% delta a la frecuencia anterior)
Total 100 - 16.000 Hz
(-) | el sonido global no es lineal (39.9% de diferencia con la mediana)
En comparación con la misma clase
» 95% de todos los dispositivos probados de esta clase eran mejores, 0% similares, 5% peores
» El mejor tuvo un delta de 4%, la media fue 24%, el peor fue ###max##%
En comparación con todos los dispositivos probados
» 95% de todos los dispositivos probados eran mejores, 0% similares, 5% peores
» El mejor tuvo un delta de 4%, la media fue 24%, el peor fue ###max##%
Lenovo ThinkPad X270-20HMS00T00 análisis de audio
(-) | altavoces no muy altos (#66.8 dB)
Graves 100 - 315 Hz
(-) | casi sin bajos - de media 18.8% inferior a la mediana
(±) | la linealidad de los graves es media (11.1% delta a frecuencia anterior)
Medios 400 - 2000 Hz
(+) | medios equilibrados - a sólo 1.5% de la mediana
(+) | los medios son lineales (5.4% delta a la frecuencia anterior)
Altos 2 - 16 kHz
(+) | máximos equilibrados - a sólo 3.1% de la mediana
(+) | los máximos son lineales (6.4% delta a la frecuencia anterior)
Total 100 - 16.000 Hz
(±) | la linealidad del sonido global es media (22.3% de diferencia con la mediana)
En comparación con la misma clase
» 59% de todos los dispositivos probados de esta clase eran mejores, 9% similares, 33% peores
» El mejor tuvo un delta de 7%, la media fue 21%, el peor fue ###max##%
En comparación con todos los dispositivos probados
» 65% de todos los dispositivos probados eran mejores, 6% similares, 29% peores
» El mejor tuvo un delta de 4%, la media fue 24%, el peor fue ###max##%
| Off / Standby | |
| Ocioso | |
| Carga |
|
Clave:
min: | |
| Lenovo ThinkPad X62 5200U, HD Graphics 5500, , , 1400x1050, 12.1" | Lenovo ThinkPad 13-20J2S00G00 i7-7500U, HD Graphics 620, Toshiba NVMe THNSF5512GPUK, IPS, LED, 1920x1080, 13.3" | Lenovo ThinkPad X220T 4298-2YG 2620M, HD Graphics 3000, Seagate Momentus Thin ST320LT000-9VL142, , 1366x768, 12.5" | |
|---|---|---|---|
| Power Consumption | 32% | -32% | |
| Idle Minimum * (Watt) | 9.09 | 3.16 65% | 7.4 19% |
| Idle Average * (Watt) | 13.9 | 5.9 58% | 12.2 12% |
| Idle Maximum * (Watt) | 13.99 | 6.5 54% | 13.2 6% |
| Load Average * (Watt) | 23.8 | 30.6 -29% | 53.1 -123% |
| Load Maximum * (Watt) | 39.7 | 35.8 10% | 68.3 -72% |
* ... más pequeño es mejor
| Lenovo ThinkPad X62 5200U, HD Graphics 5500, Wh | Dell XPS 13-9343 5200U, HD Graphics 5500, 52 Wh | Apple MacBook 12 (Early 2016) 1.3 GHz 6Y75, HD Graphics 515, 41.4 Wh | Lenovo ThinkPad X270-20HMS00T00 i5-7200U, HD Graphics 620, 46 Wh | Dell Latitude 7280 i7-7600U, HD Graphics 620, 60 Wh | Lenovo ThinkPad 13-20J2S00G00 i7-7500U, HD Graphics 620, 42 Wh | |
|---|---|---|---|---|---|---|
| Duración de Batería | 393% | 289% | 445% | 732% | 376% | |
| Reader / Idle (h) | 1.9 | 15.2 700% | 17.1 800% | 25.9 1263% | 15.1 695% | |
| WiFi (h) | 2.3 | 9.7 322% | ||||
| Load (h) | 0.9 | 2.3 156% | 3.5 289% | 1.7 89% | 2.7 200% | 1.4 56% |
| WiFi v1.3 (h) | 9.2 | 5.4 | 11.4 | 7.9 |
Pro
Contra

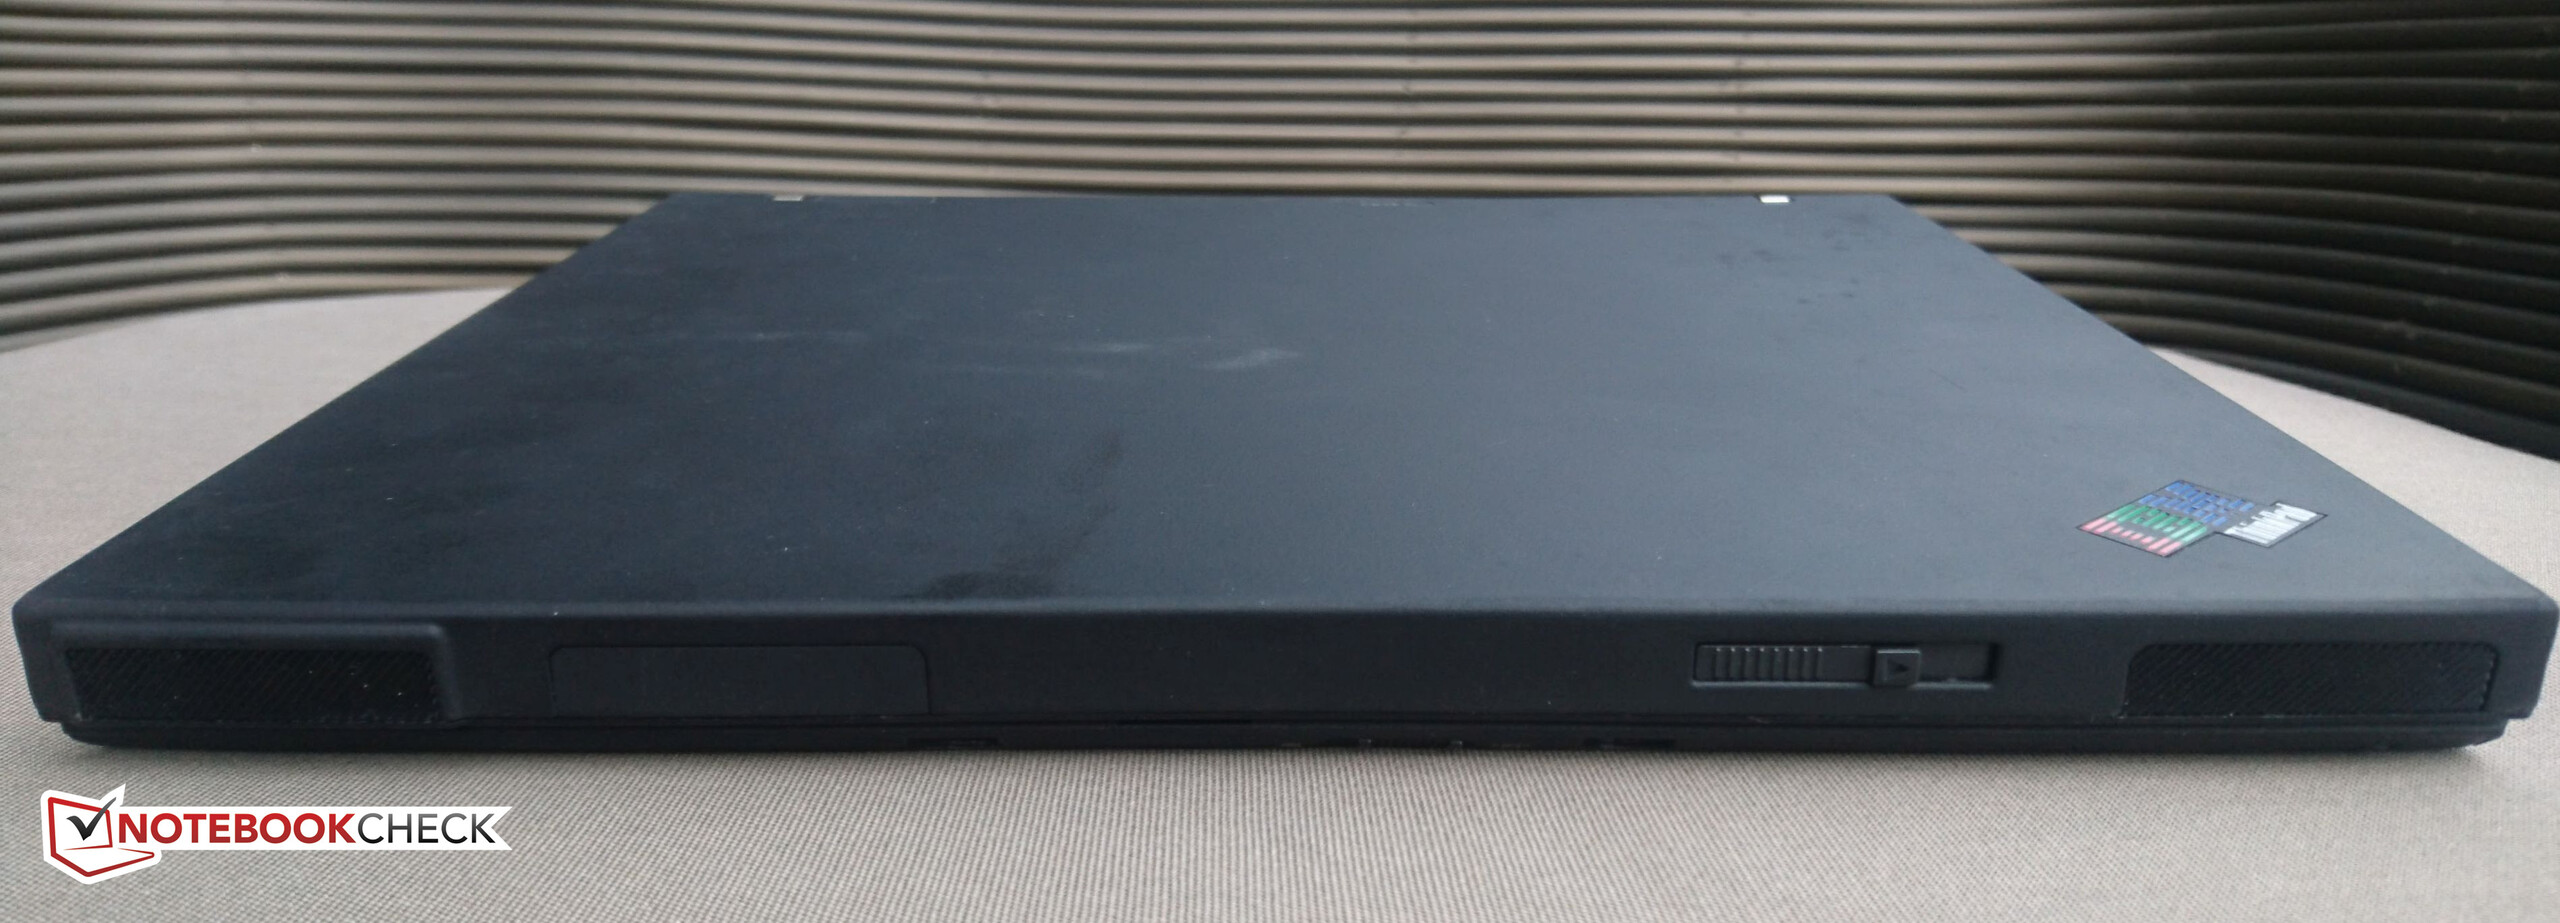
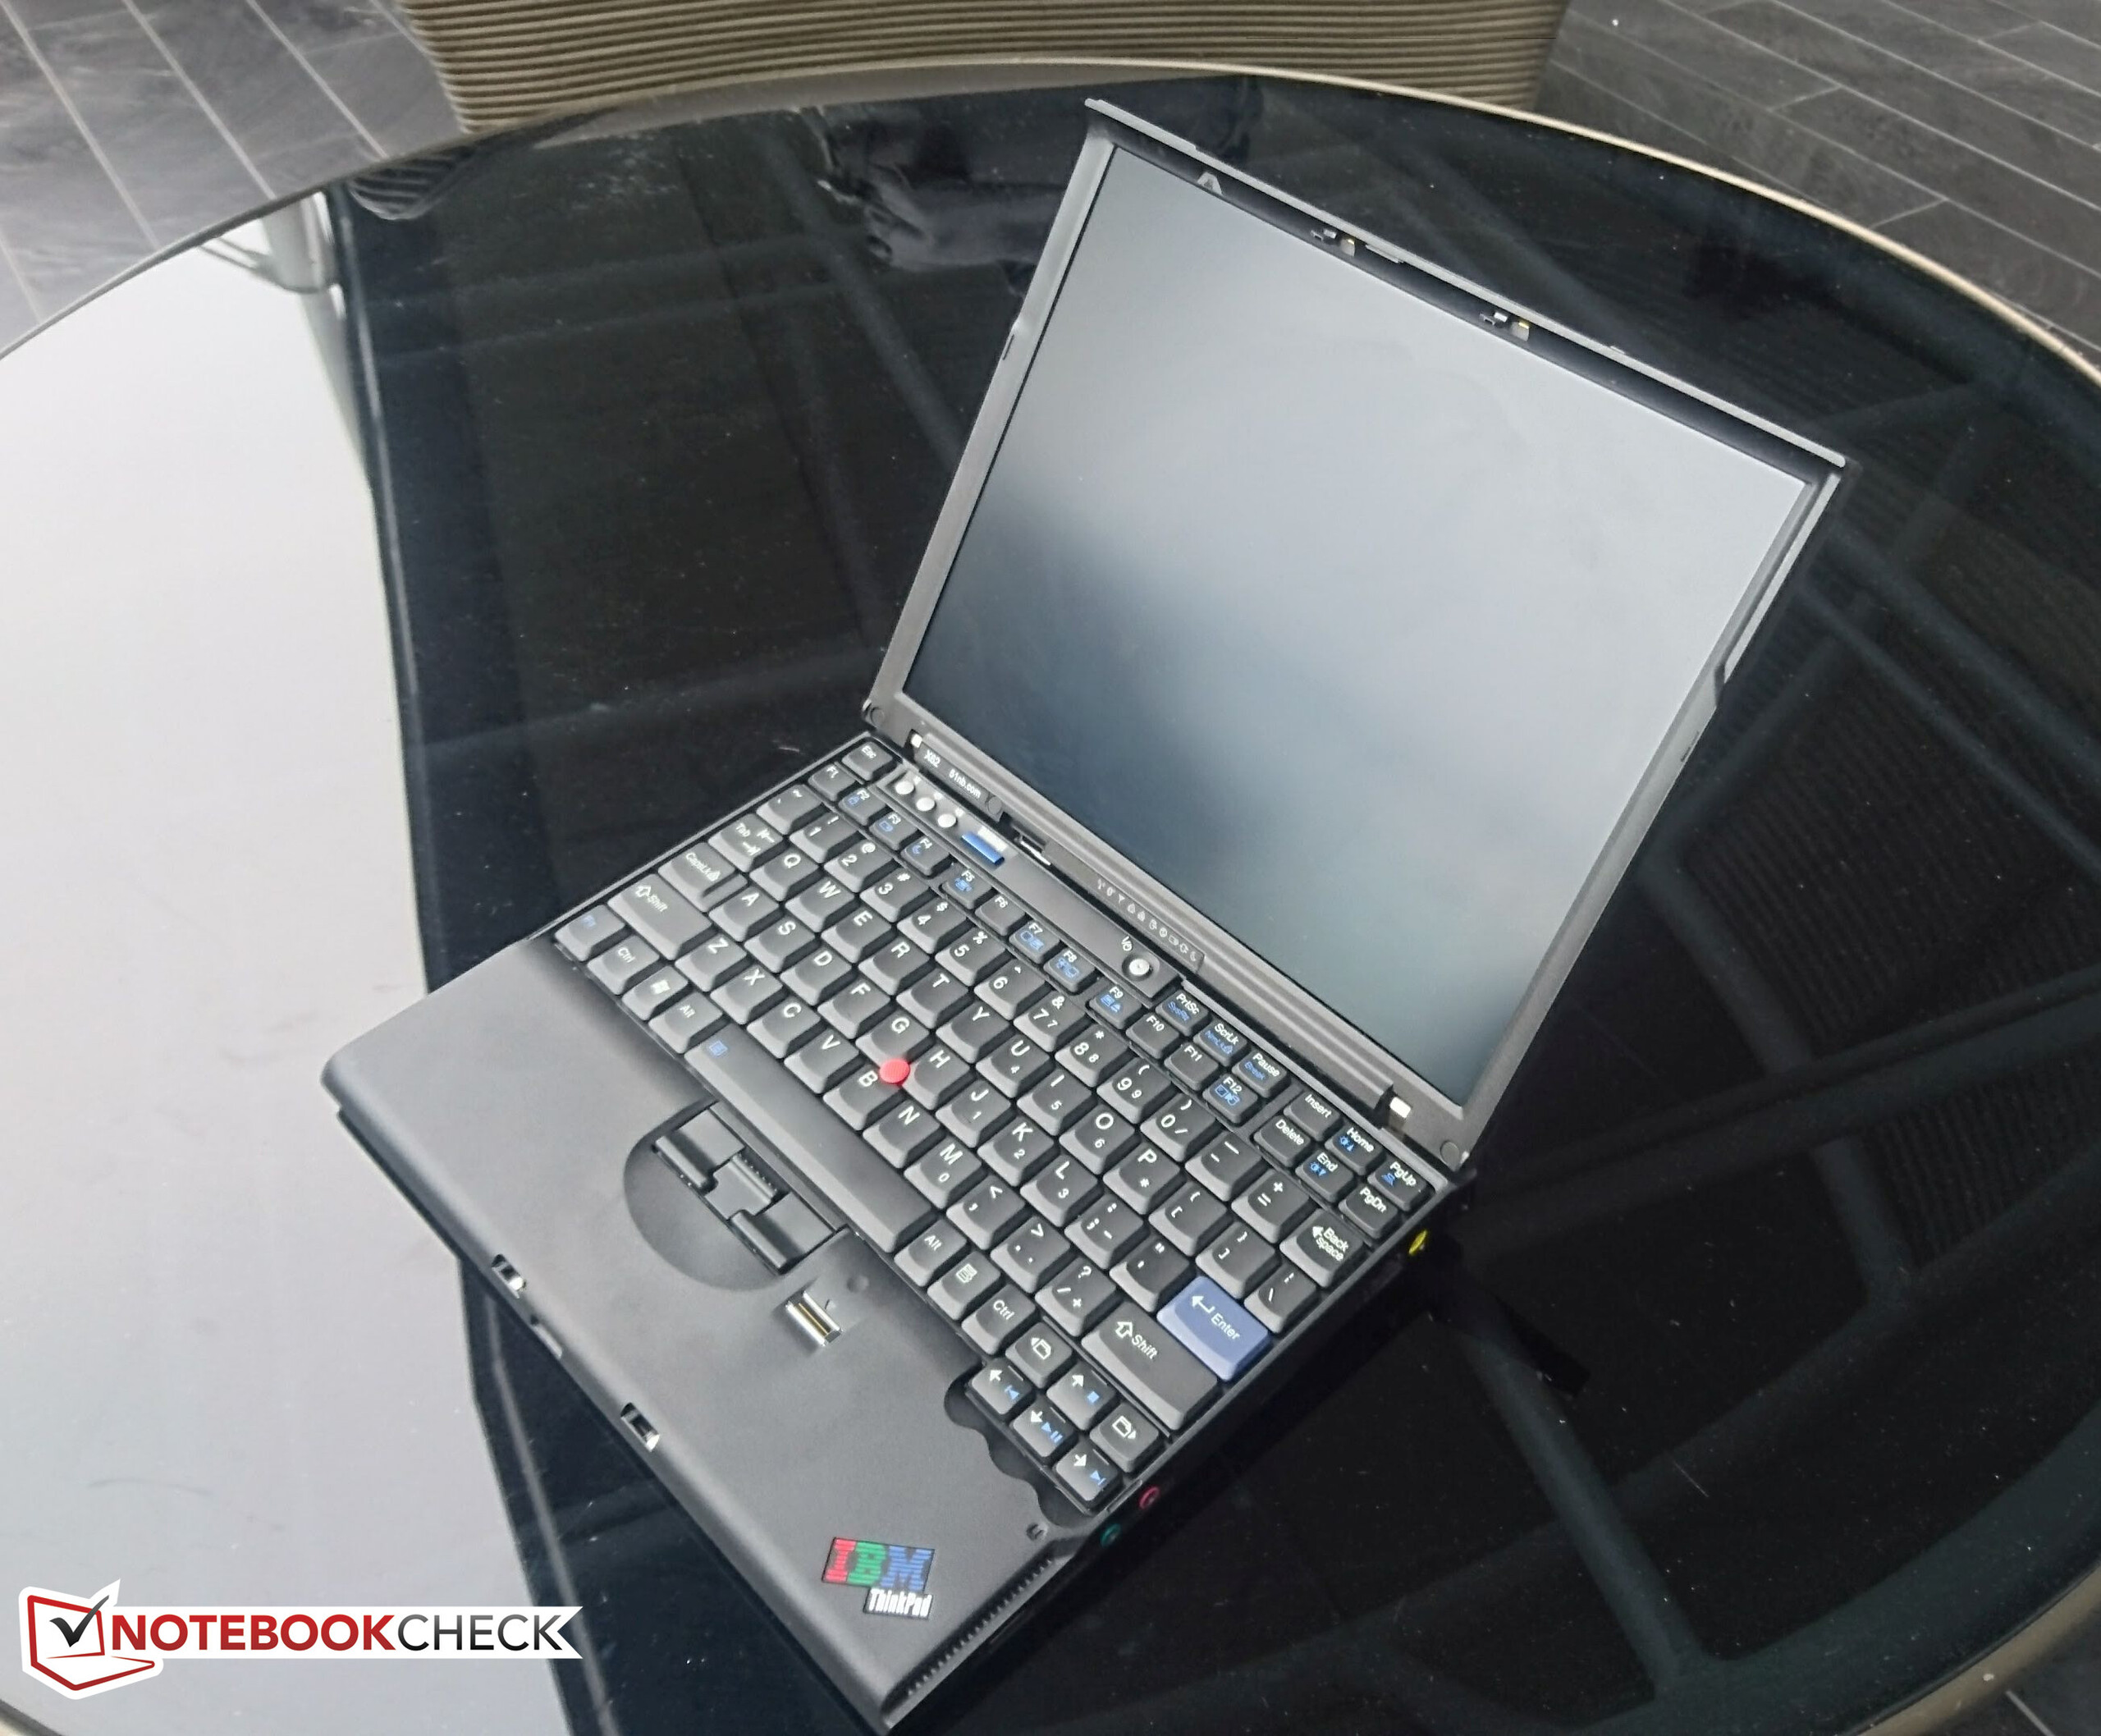
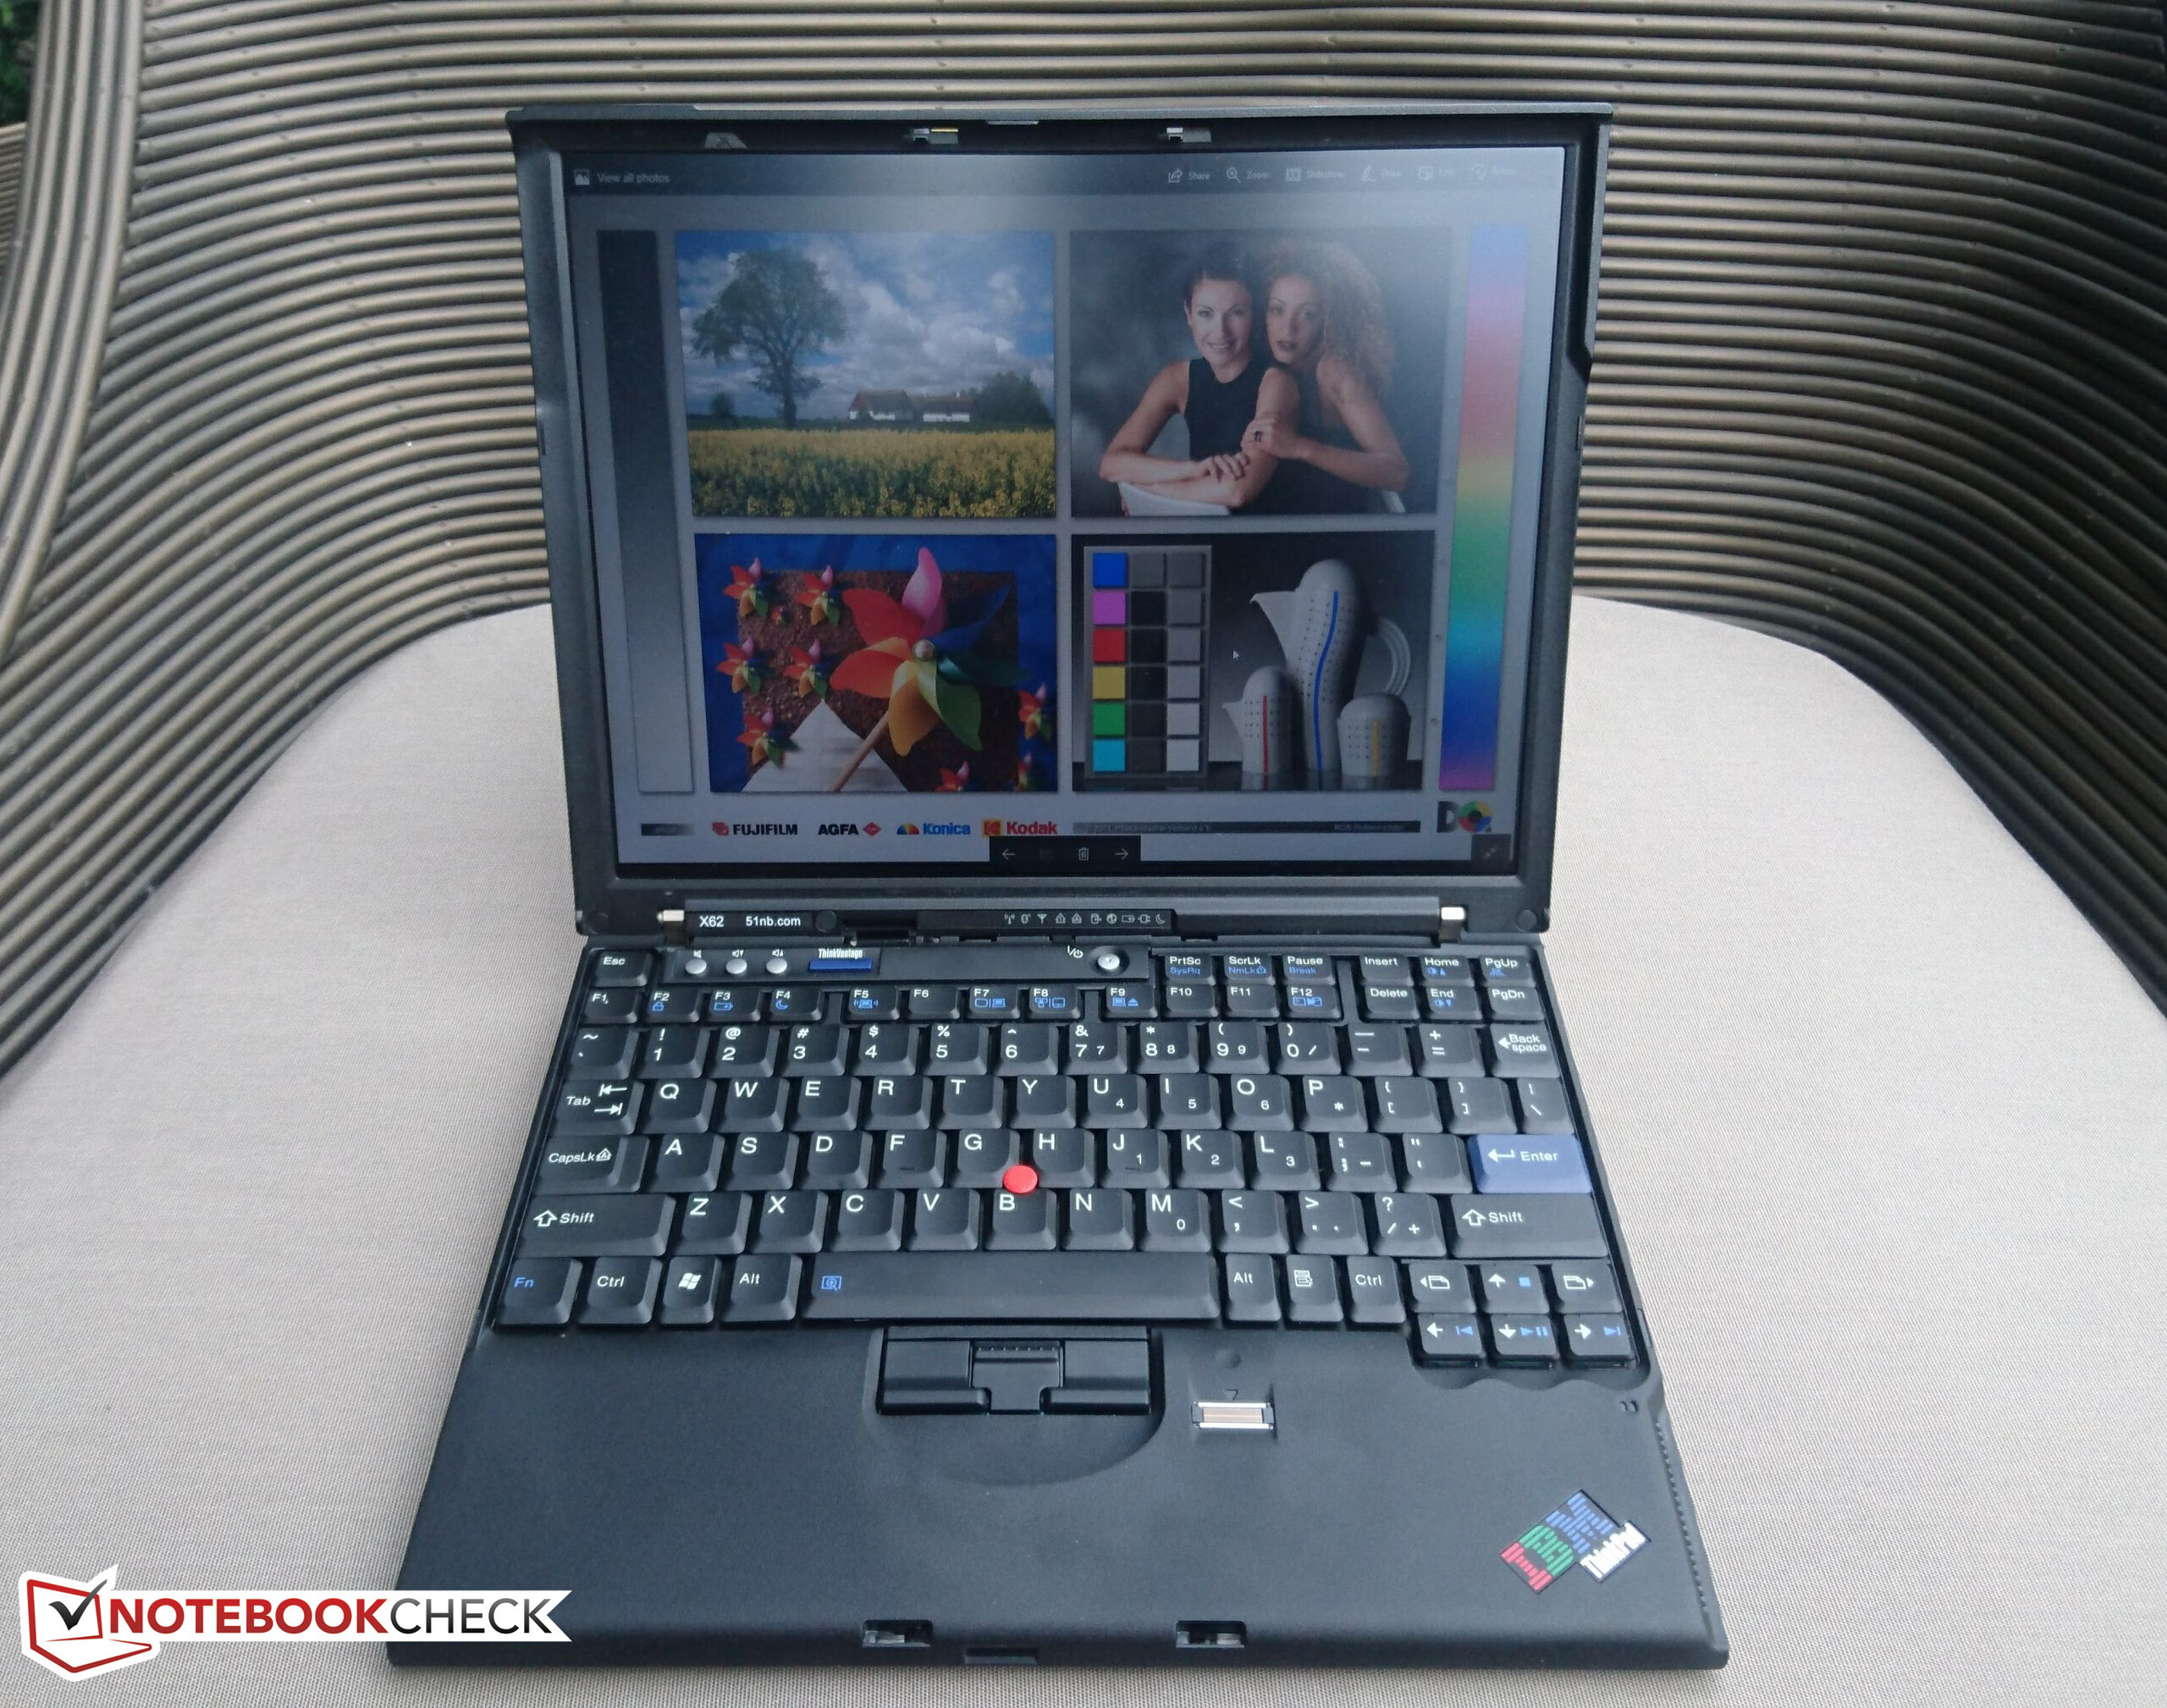
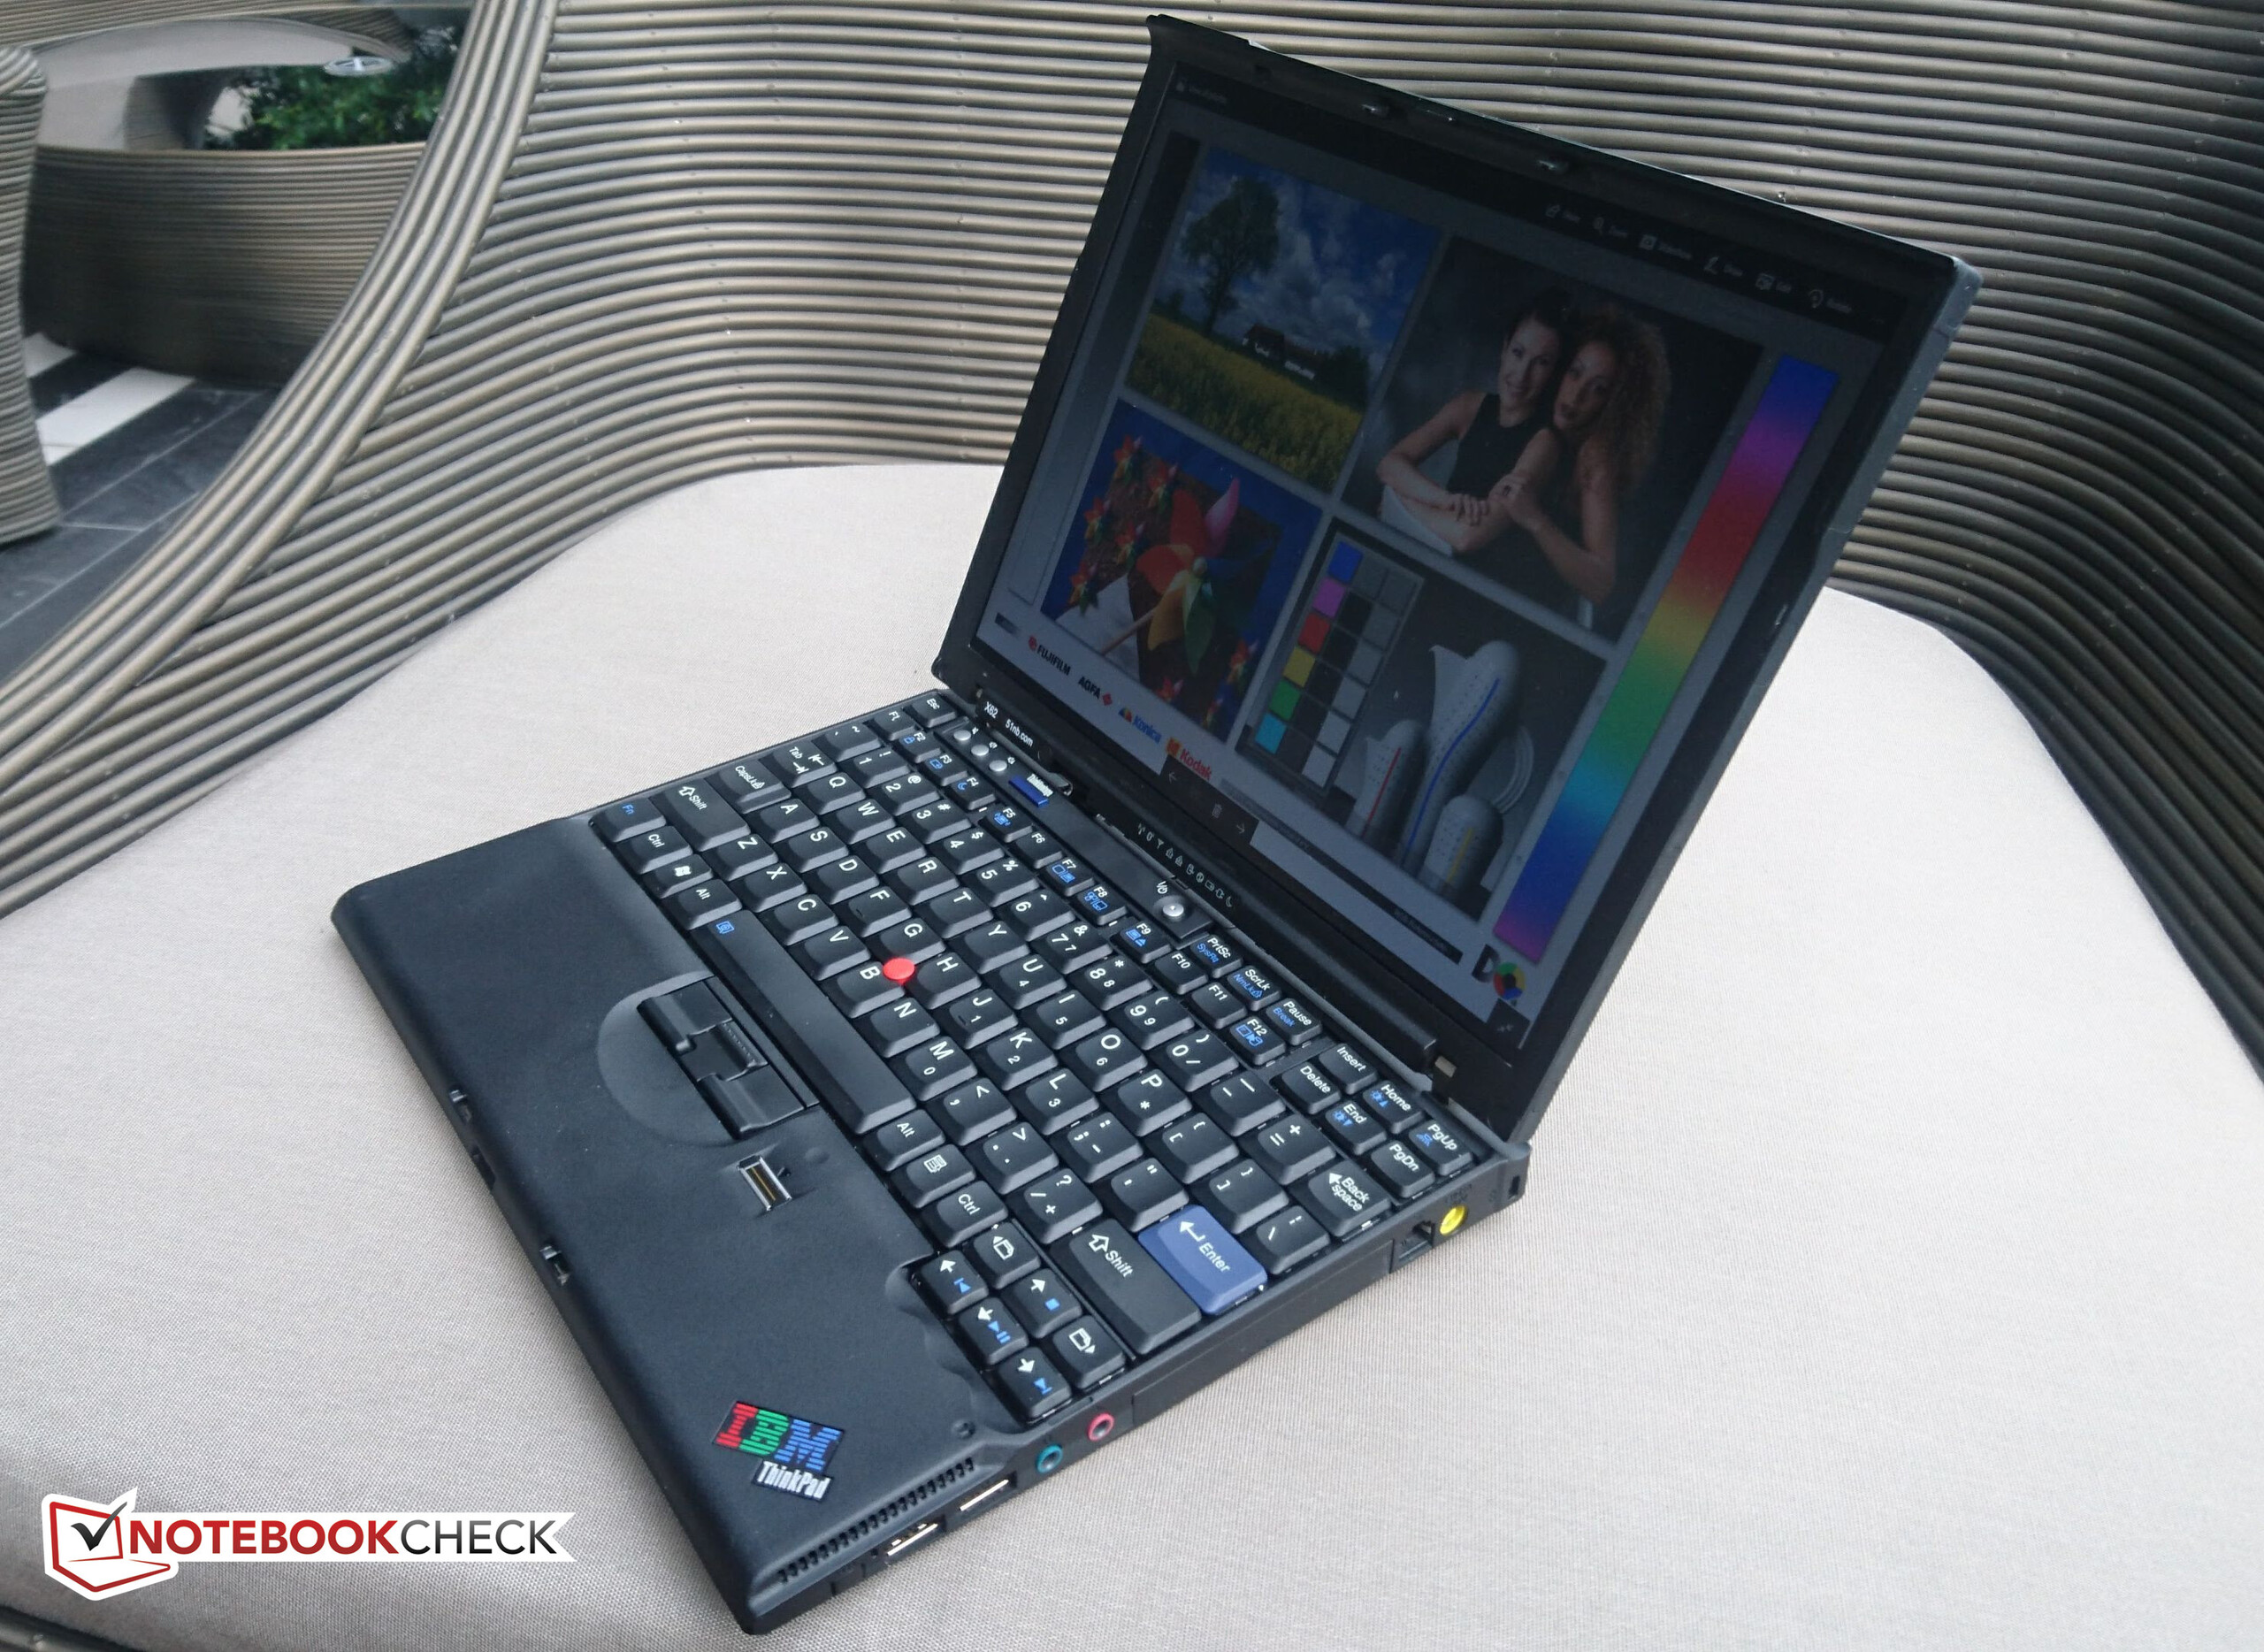
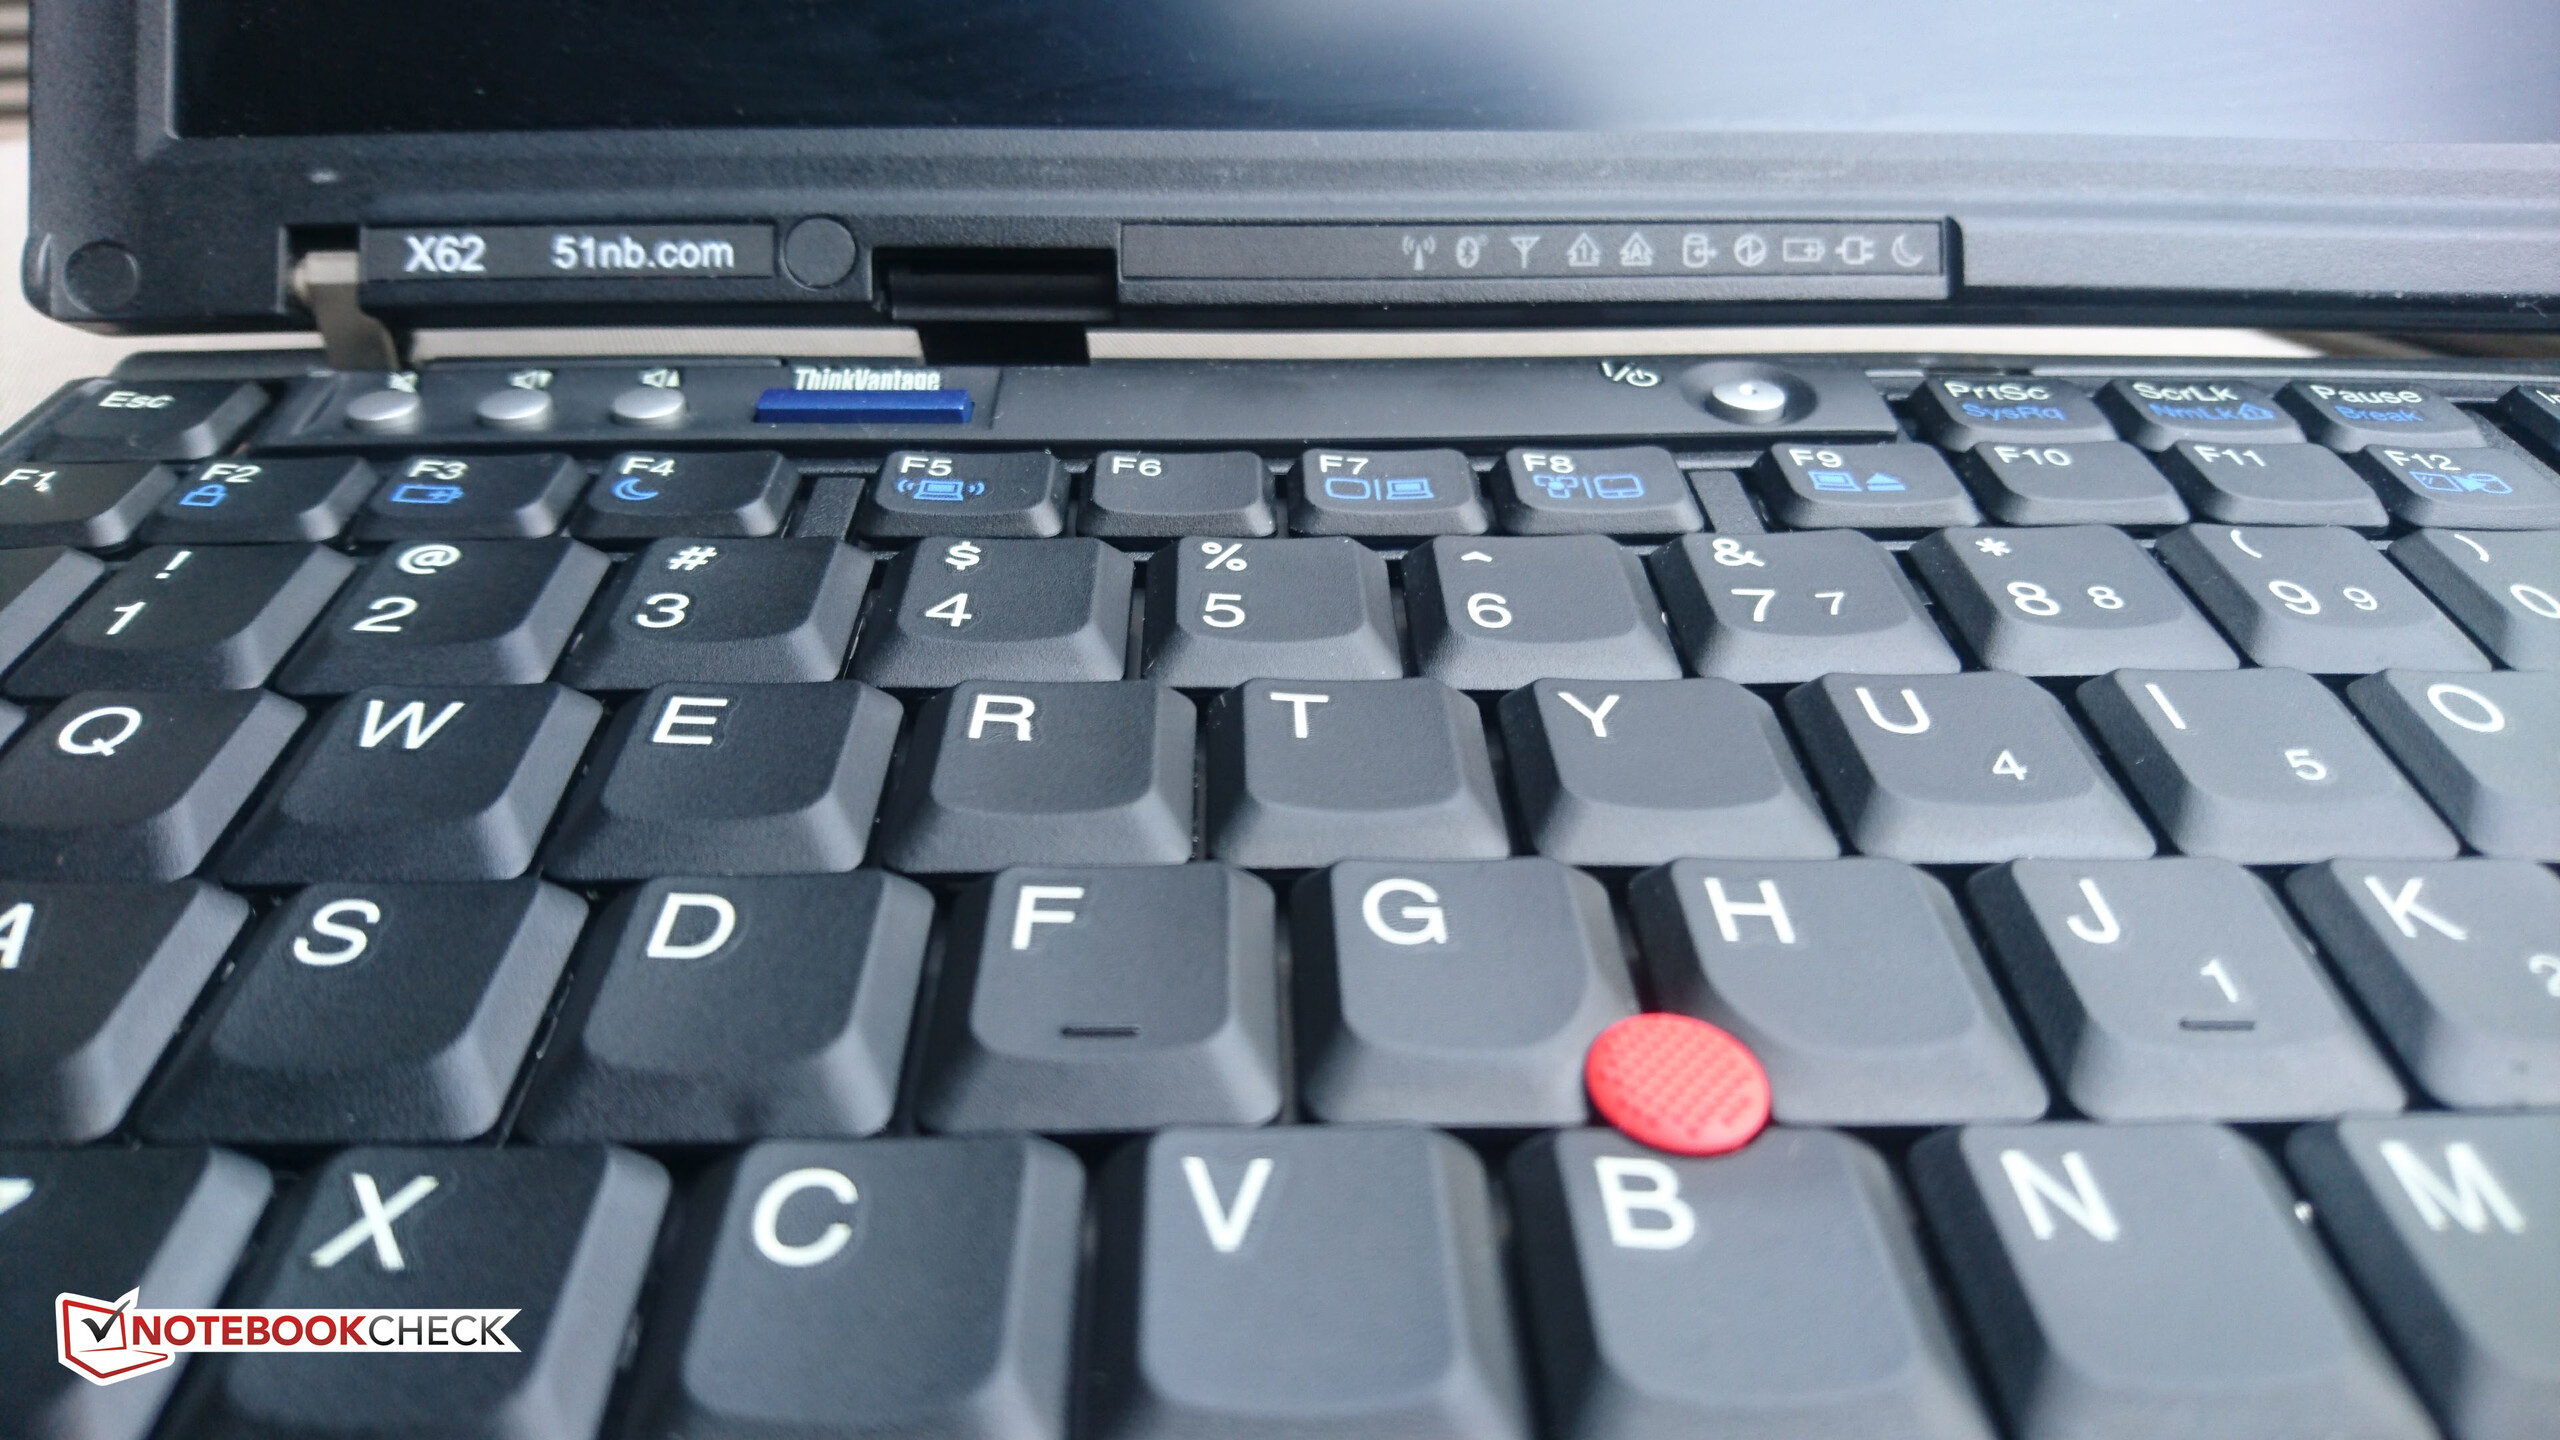
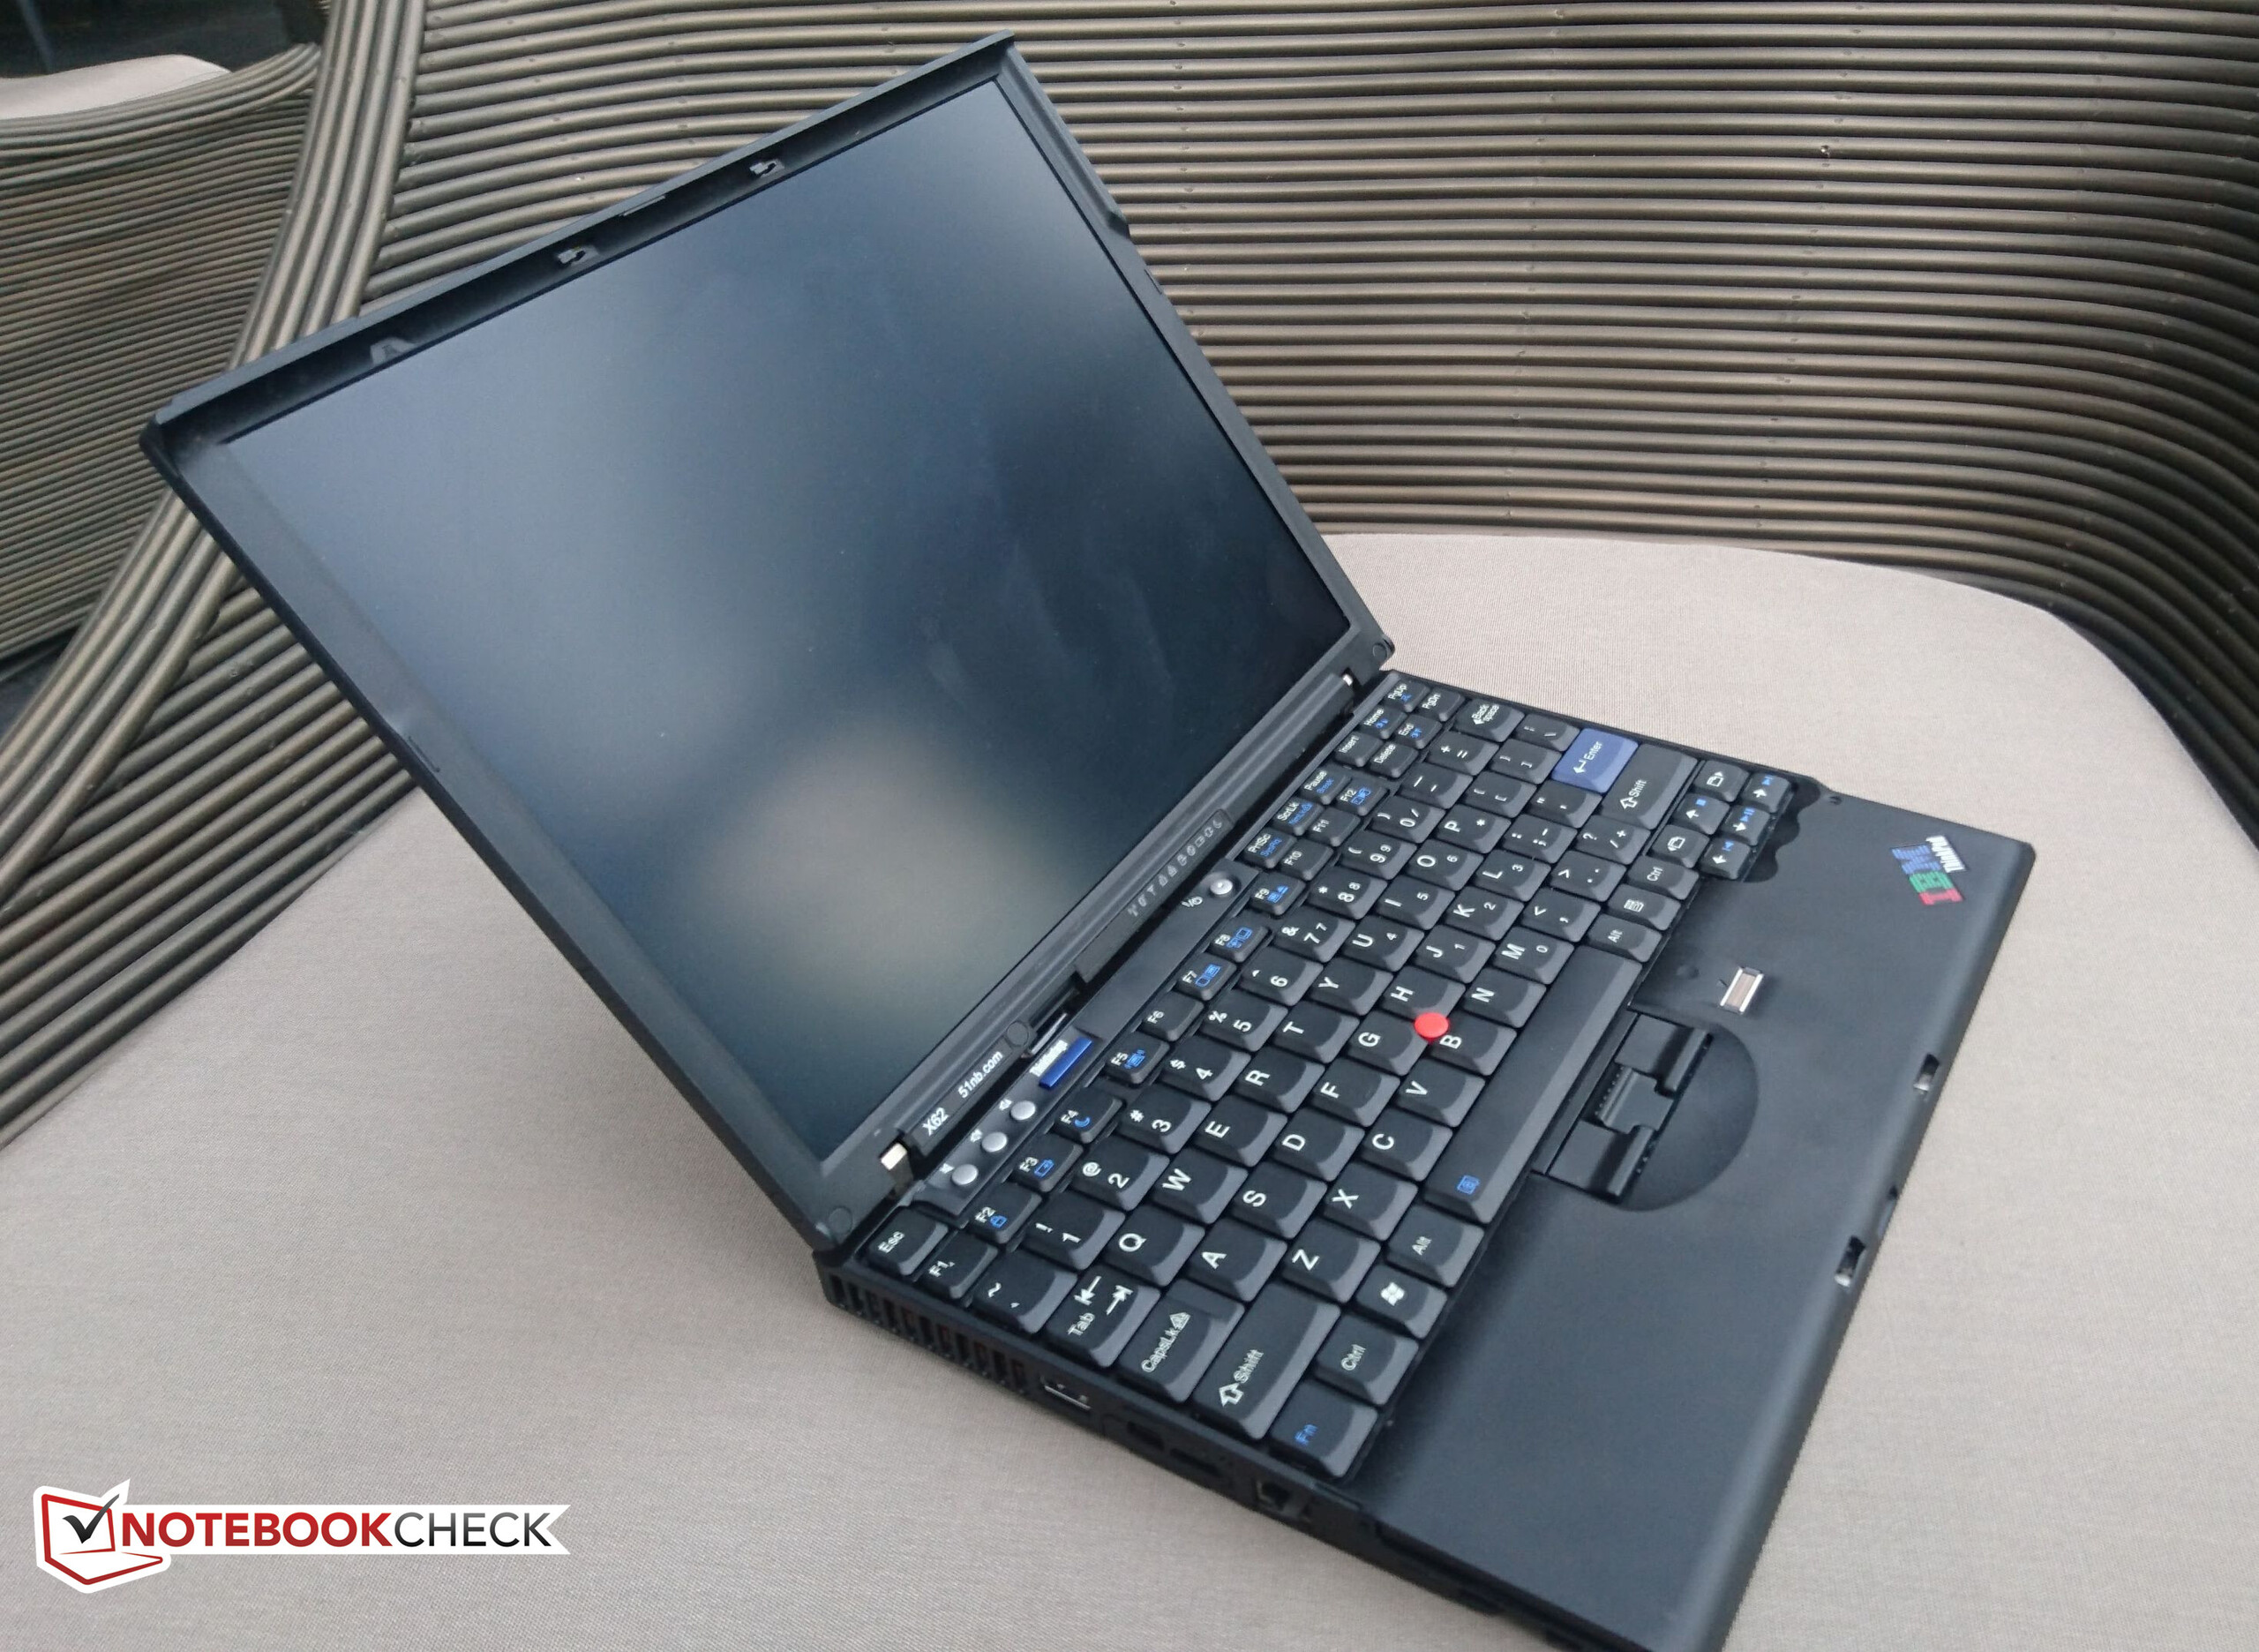
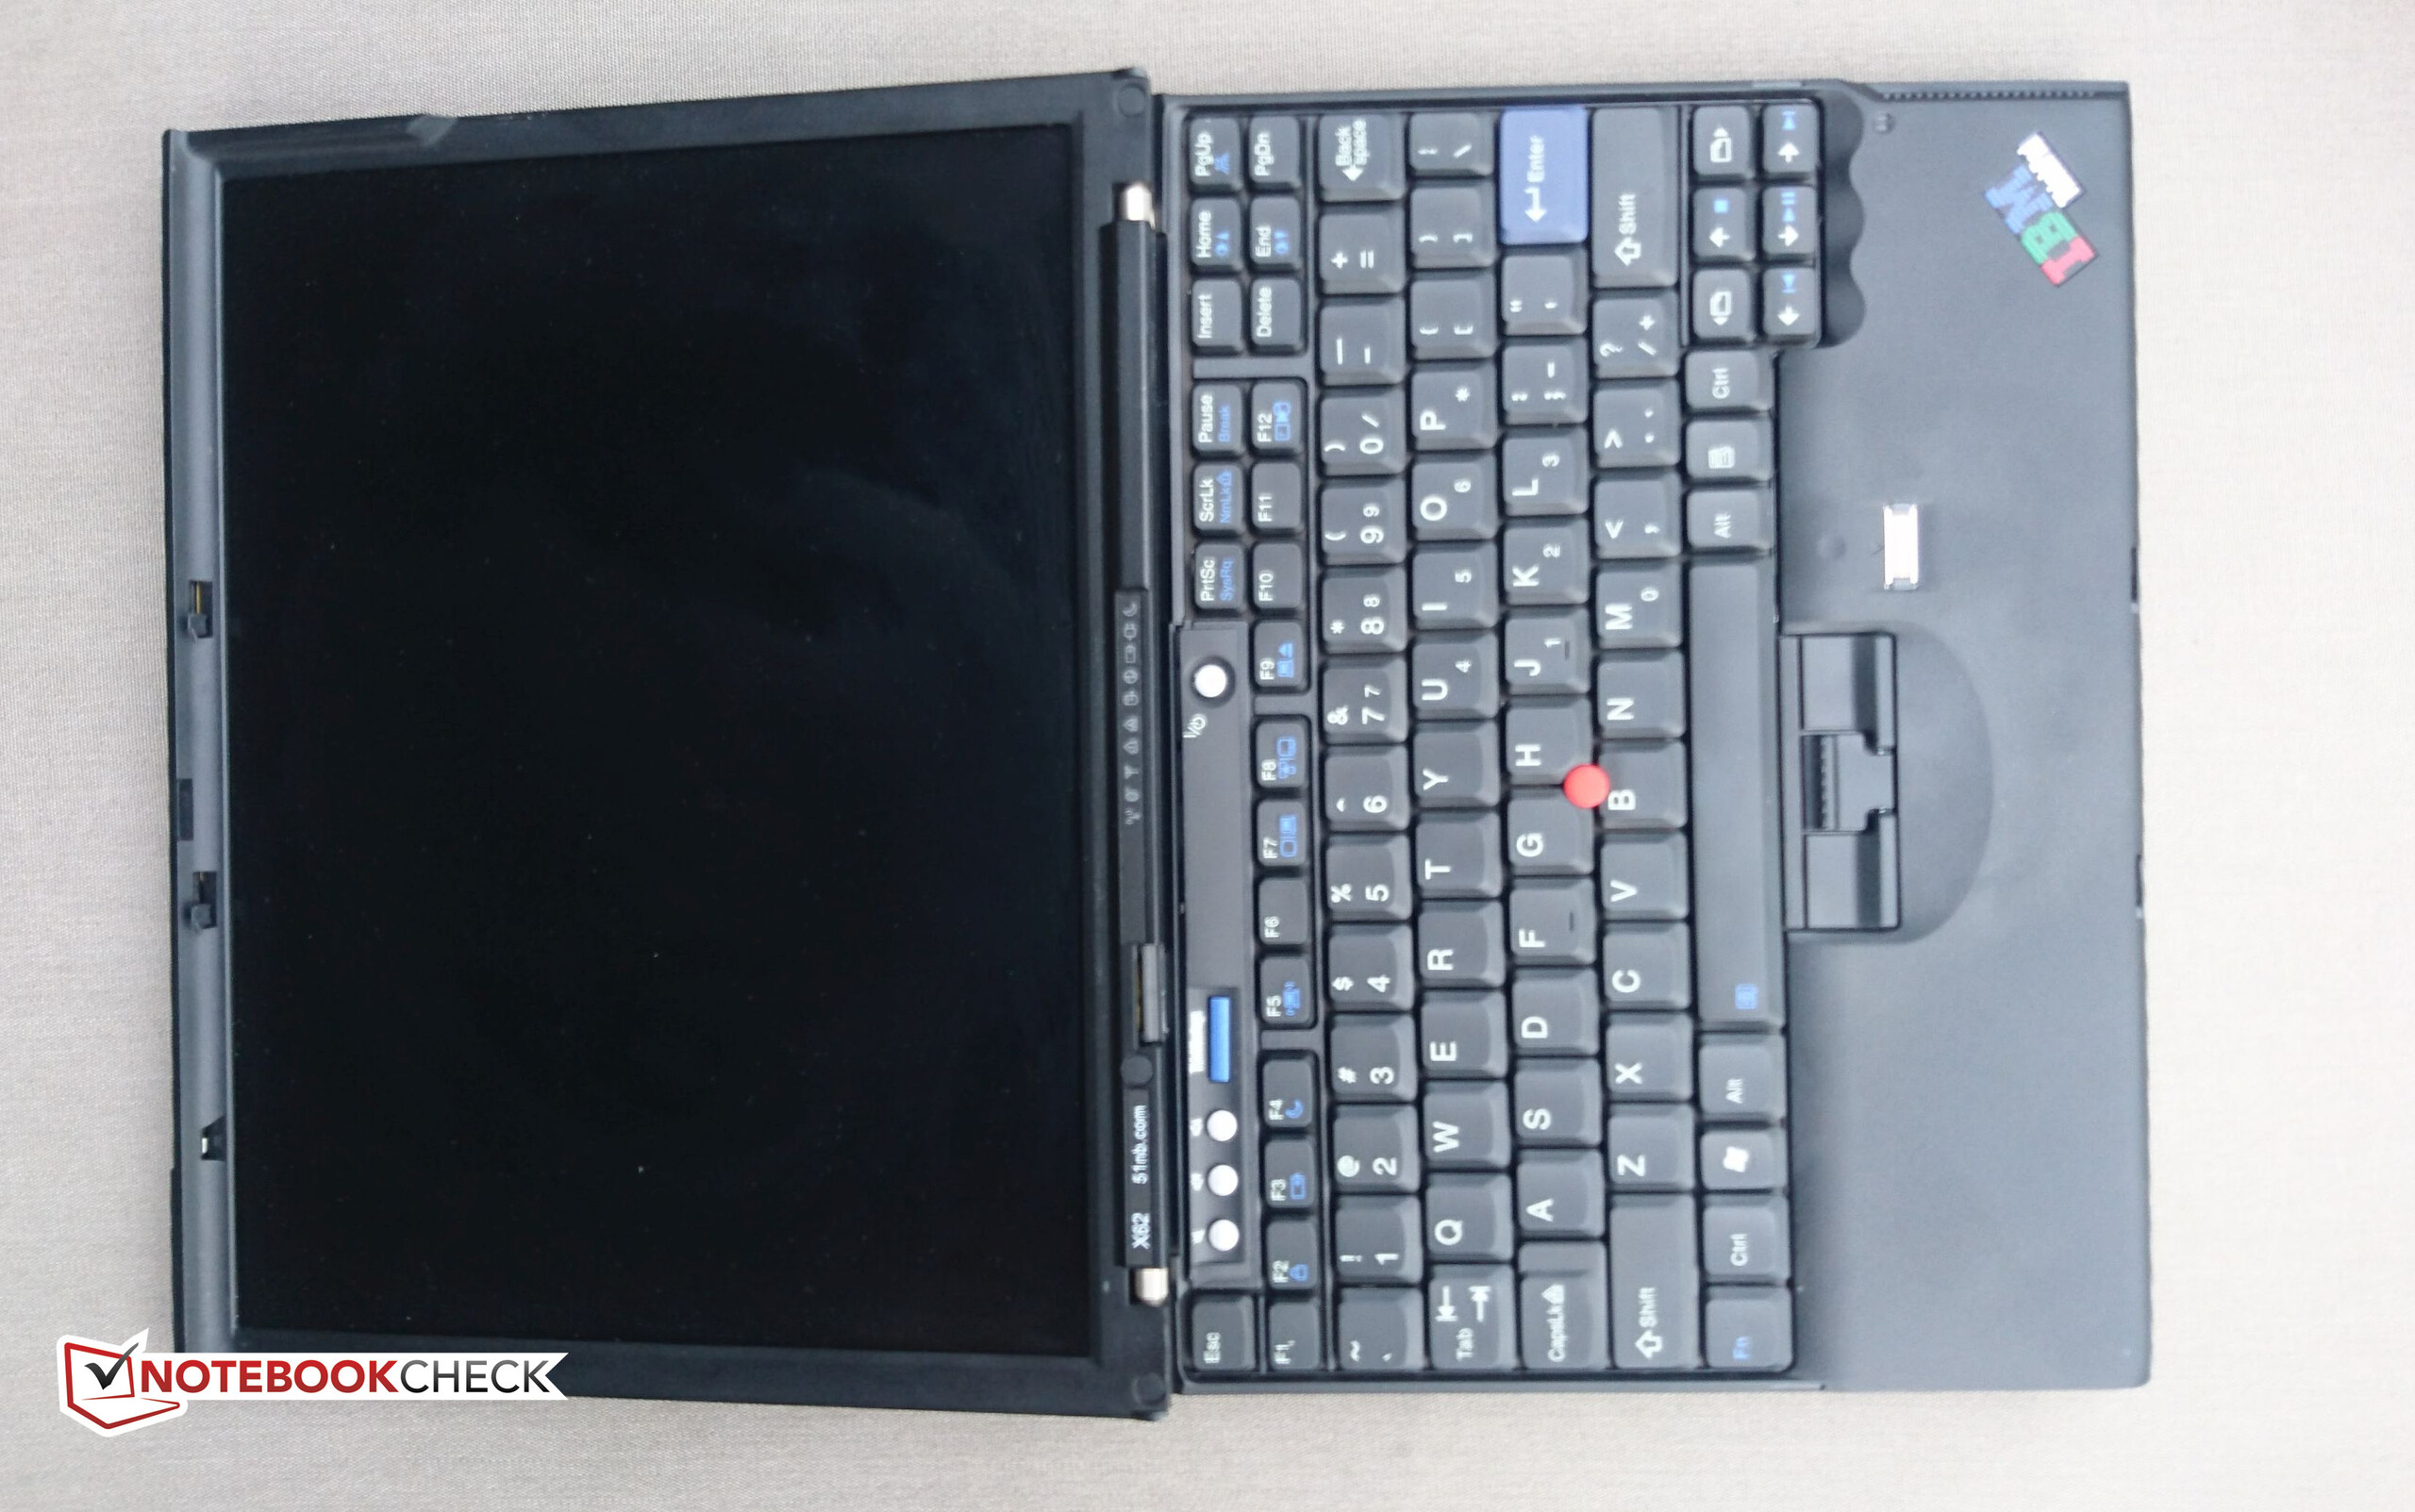
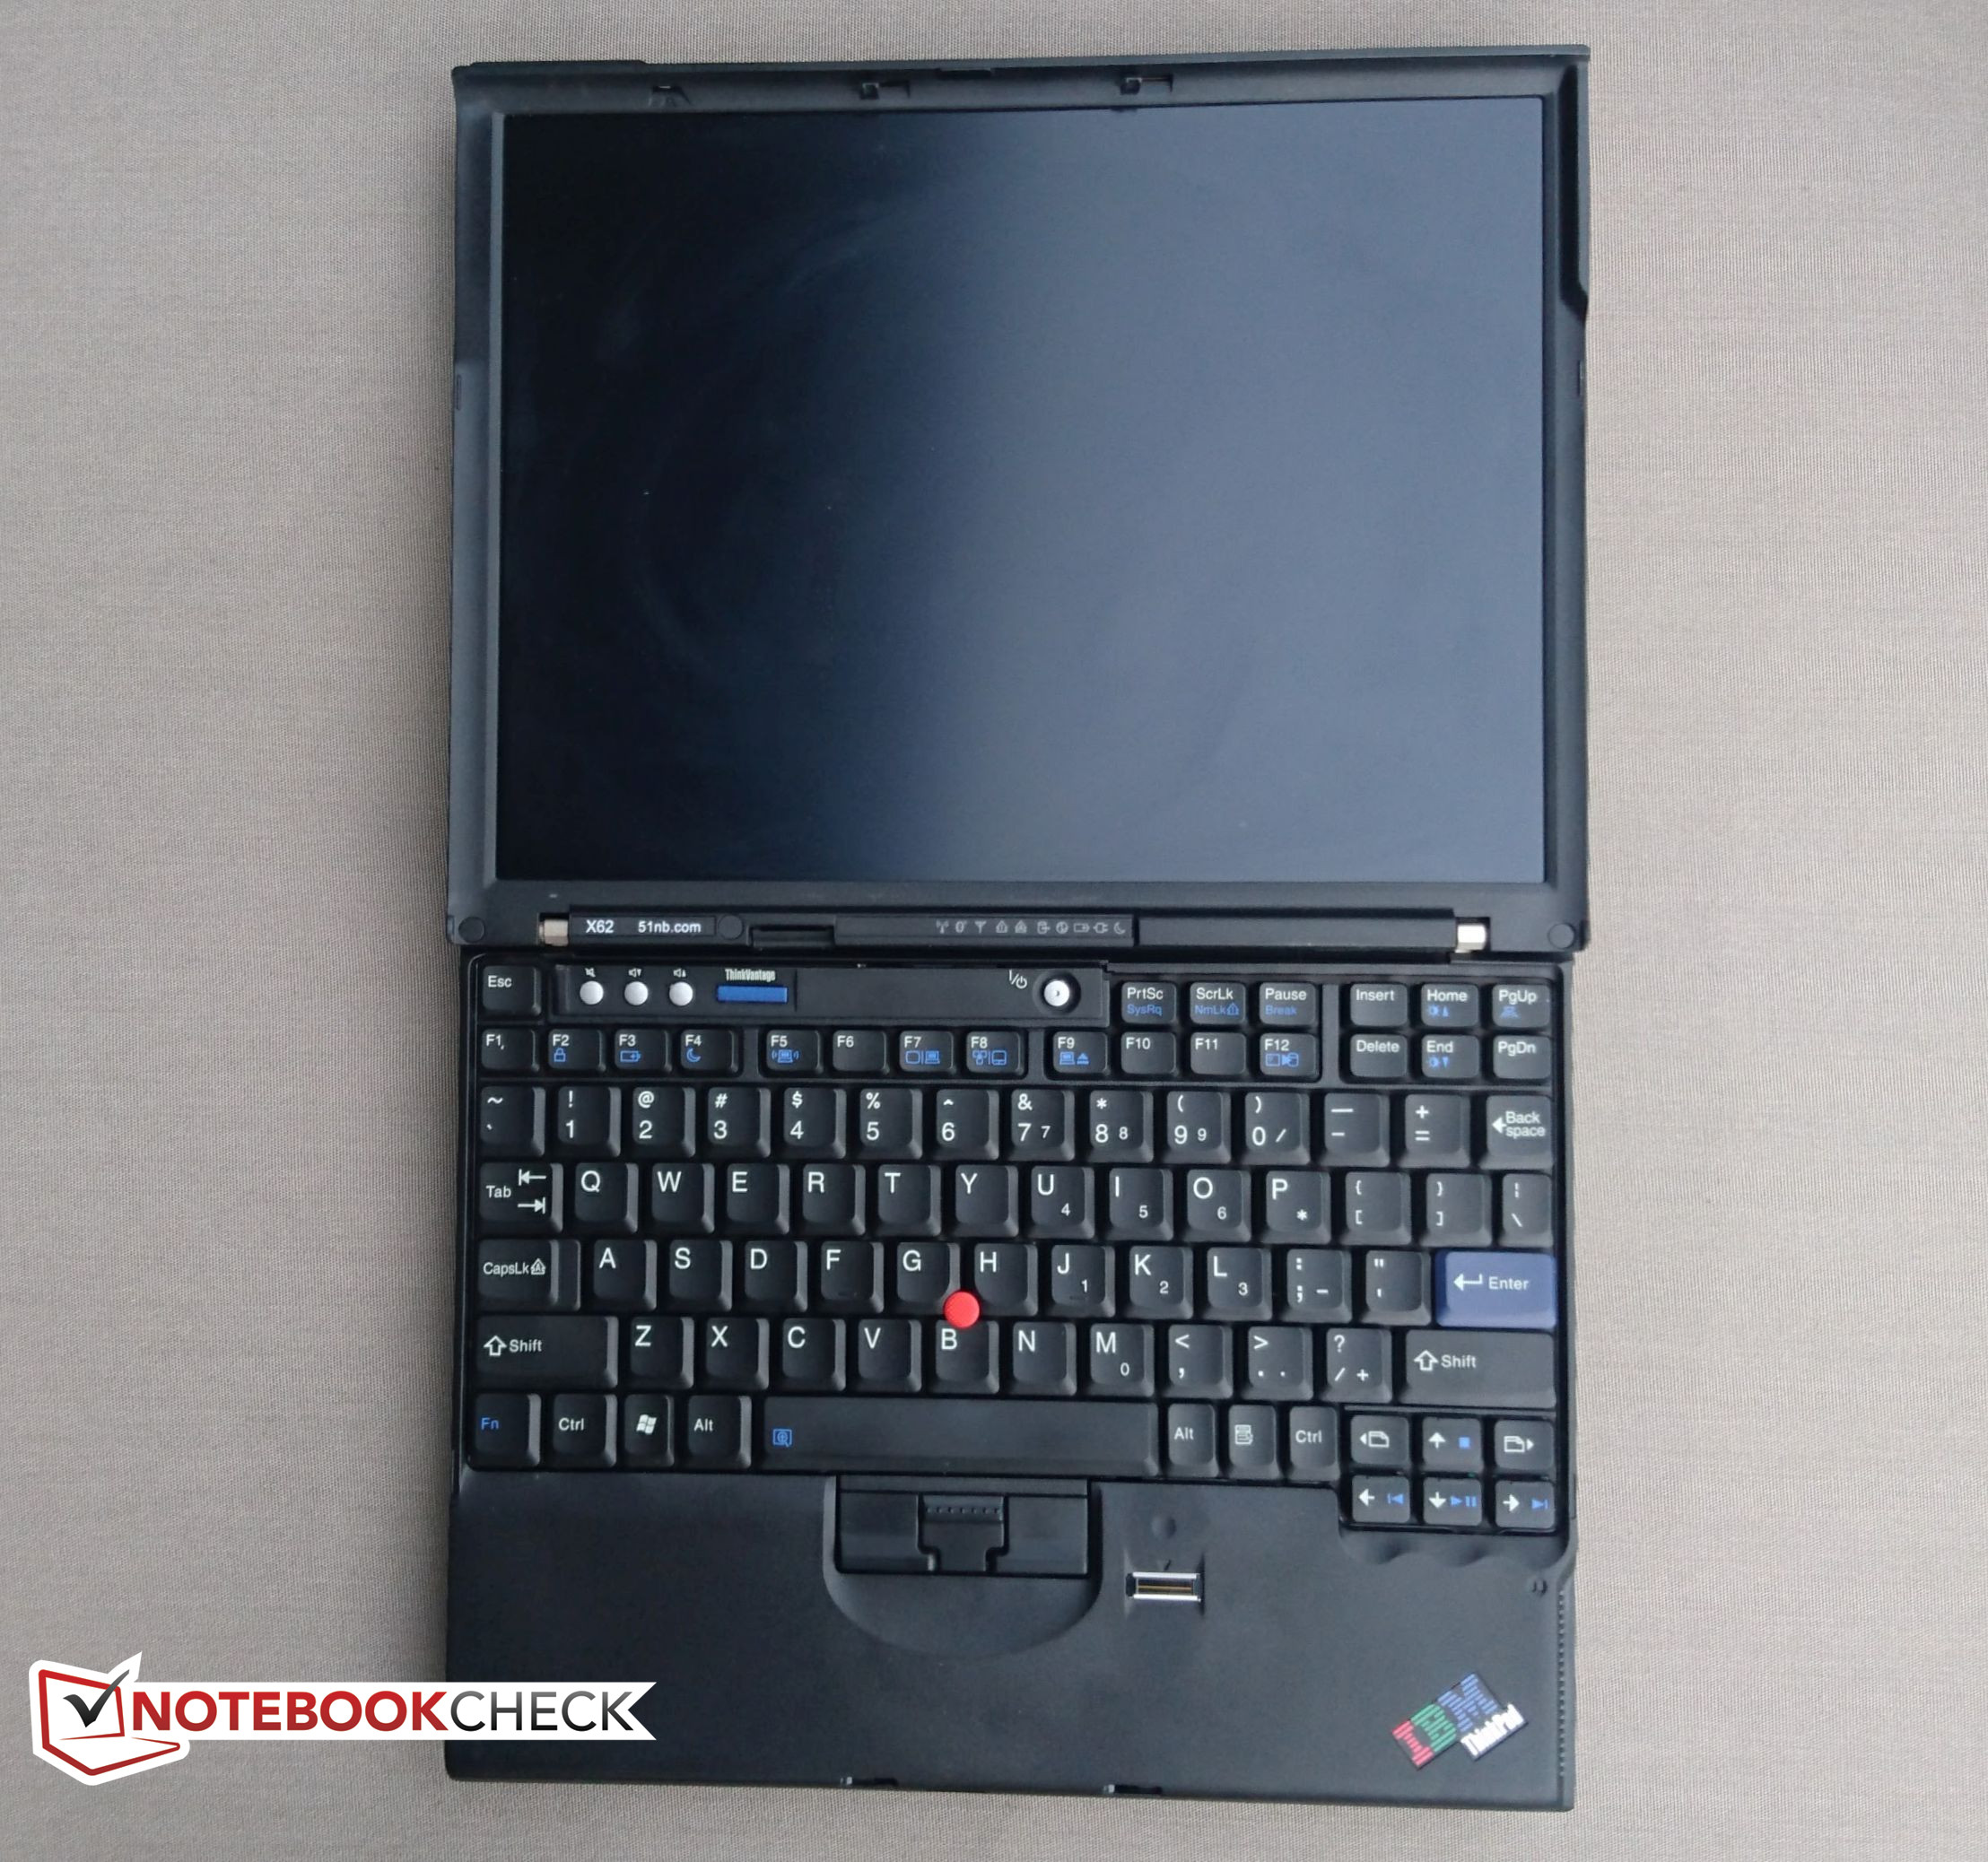
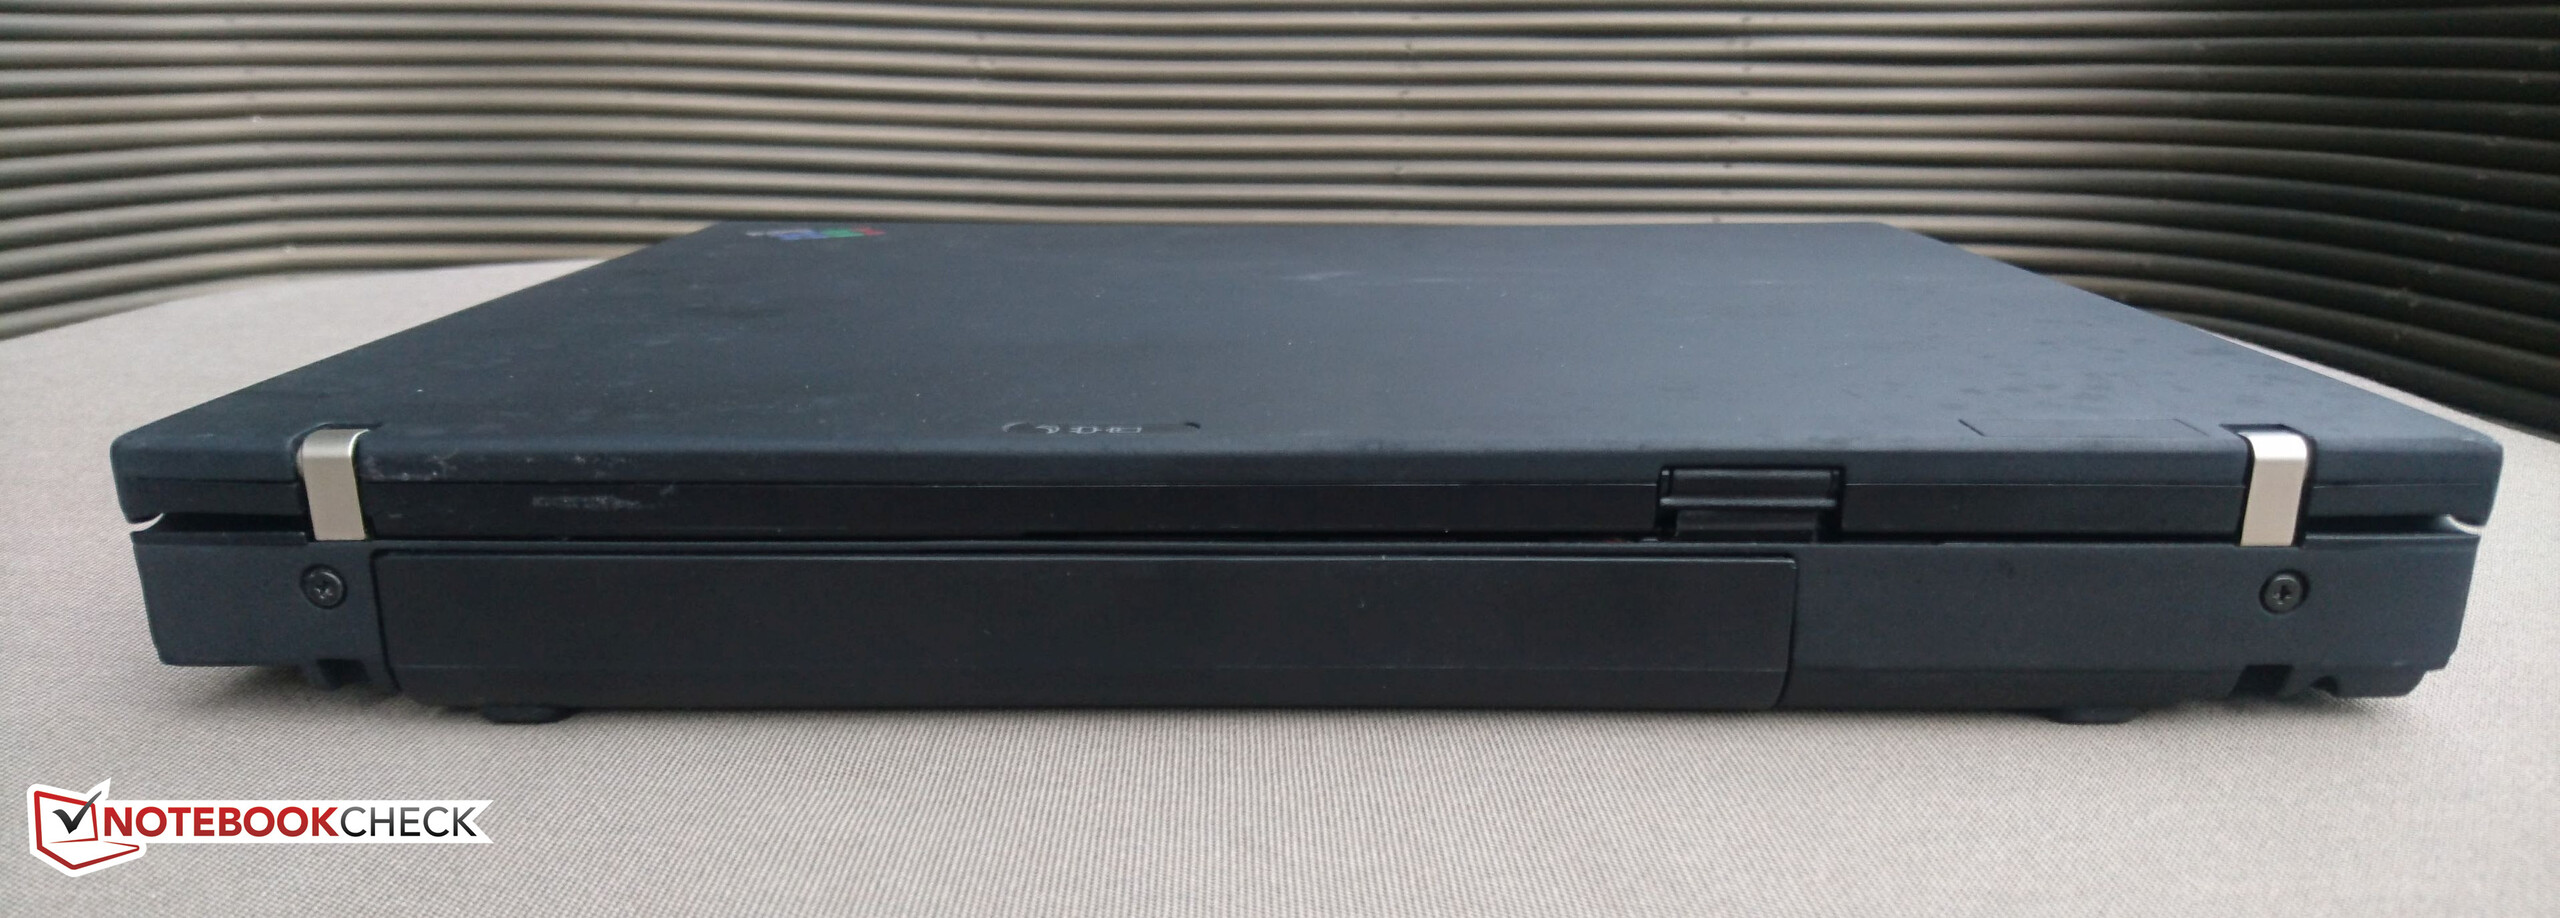
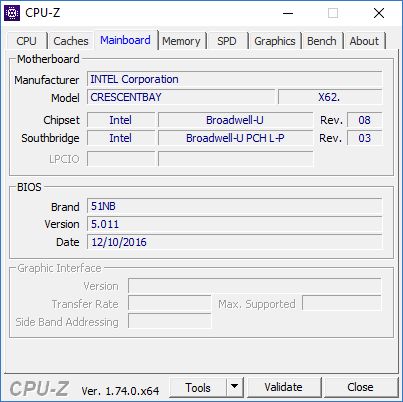
El X62 toma el sólido chasis compacto de un X61 de 2007 e intenta modernizarlo en una efectiva mula de carga para el mundo moderno. En su mayor parte podemos decir que el X62 que nos prestaron 51nb tiene éxito en esta meta: el chásis es ThinkPad clásico en su apogeo, el teclado no muestra flexión alguna y es una gozada para escribir, y el rendimiento de la CPU ULV Broadwell está a la par con o supera a portátiles con especificaciones similares. Sin embargo, el display—si bien tiene una resolución excelente de 1400 x 1050 en un display 12.1"—es muy tenue incluso para los estándares ThinkPad. Si bien existe la opción de comprar un kit de mejora de retroiluminación LED, son US$50 a sumar al coste inicial del X62. El hecho de que el display tenga que mantenerse en el brillo máximo casi todo el tiempo daña al aguante de batería de la máquina, lo que implica que hará falta una batería de 8 celdas 75WHr si no mejoras la retroiluminación.
El X62 es un ultraportable absolútamente único que logra posicionarse mayormente con éxito como un sinsentido mezcla de nostalgia y modernidad con sólo unos pocos deslices. No es un portátil para cualquiera, empero, y para alcanzar su potencial sigue necesitando la mejora post-compra de un kit de retroiluminación LED.
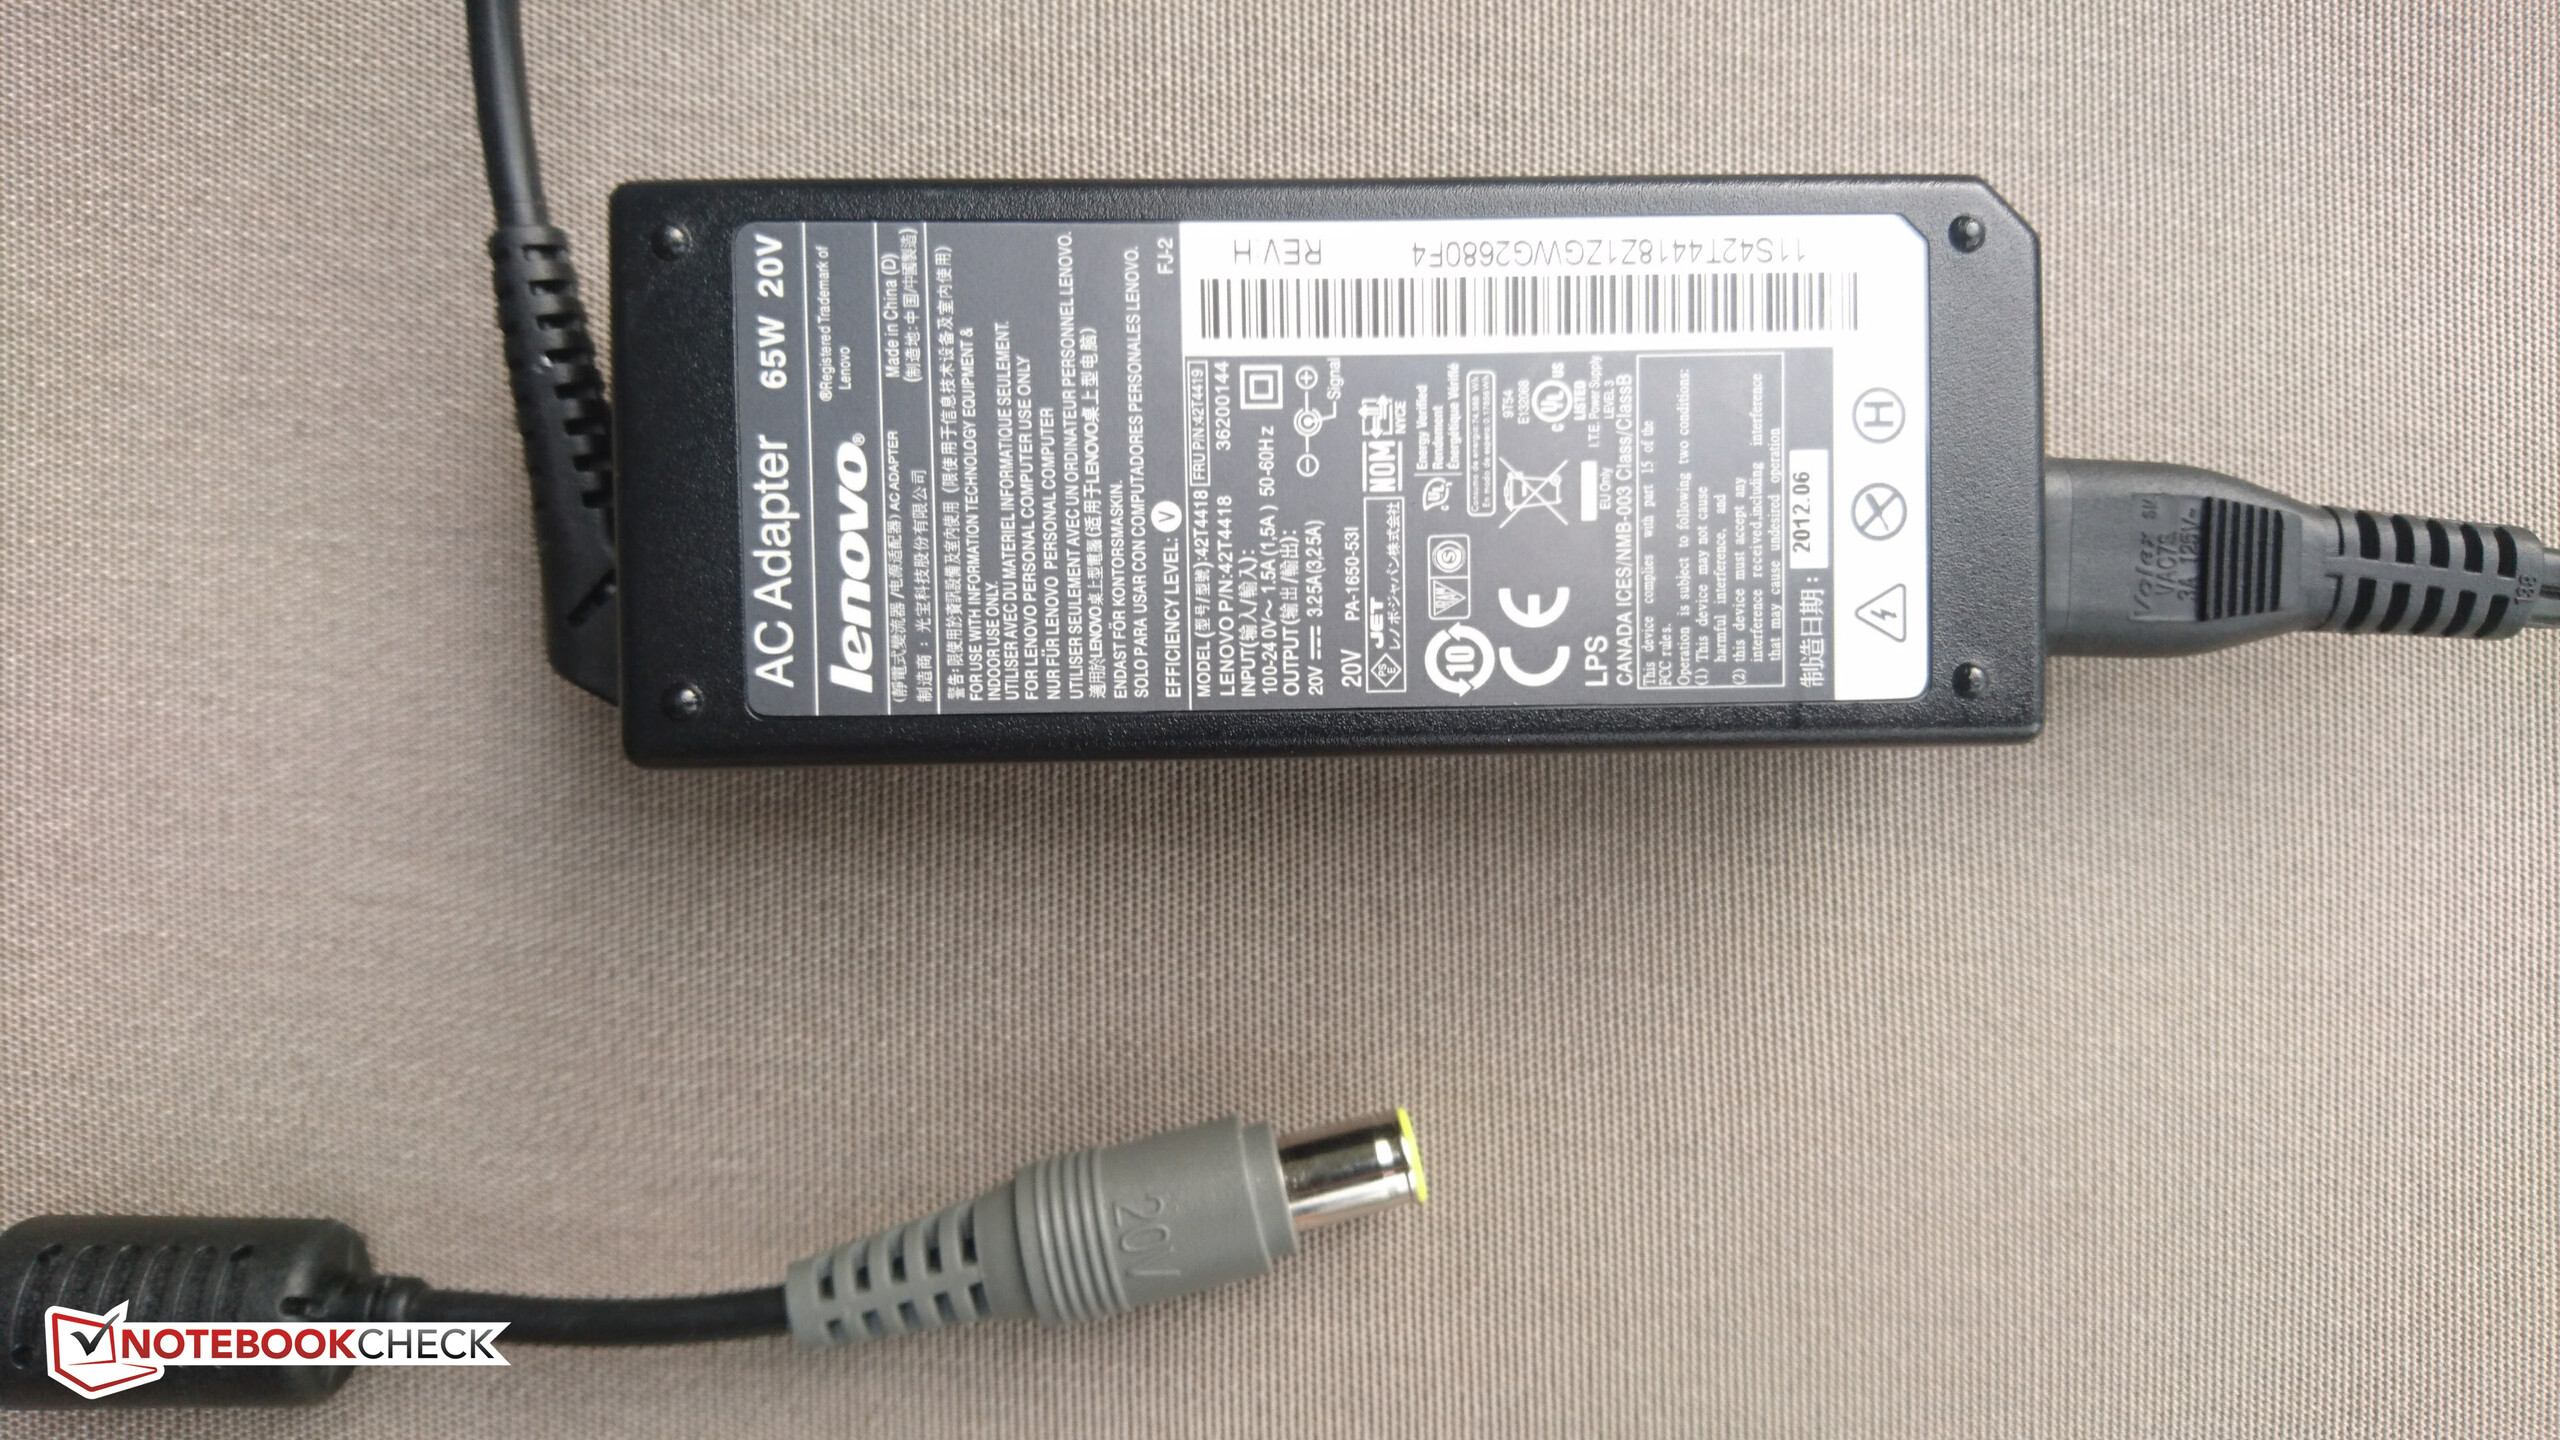
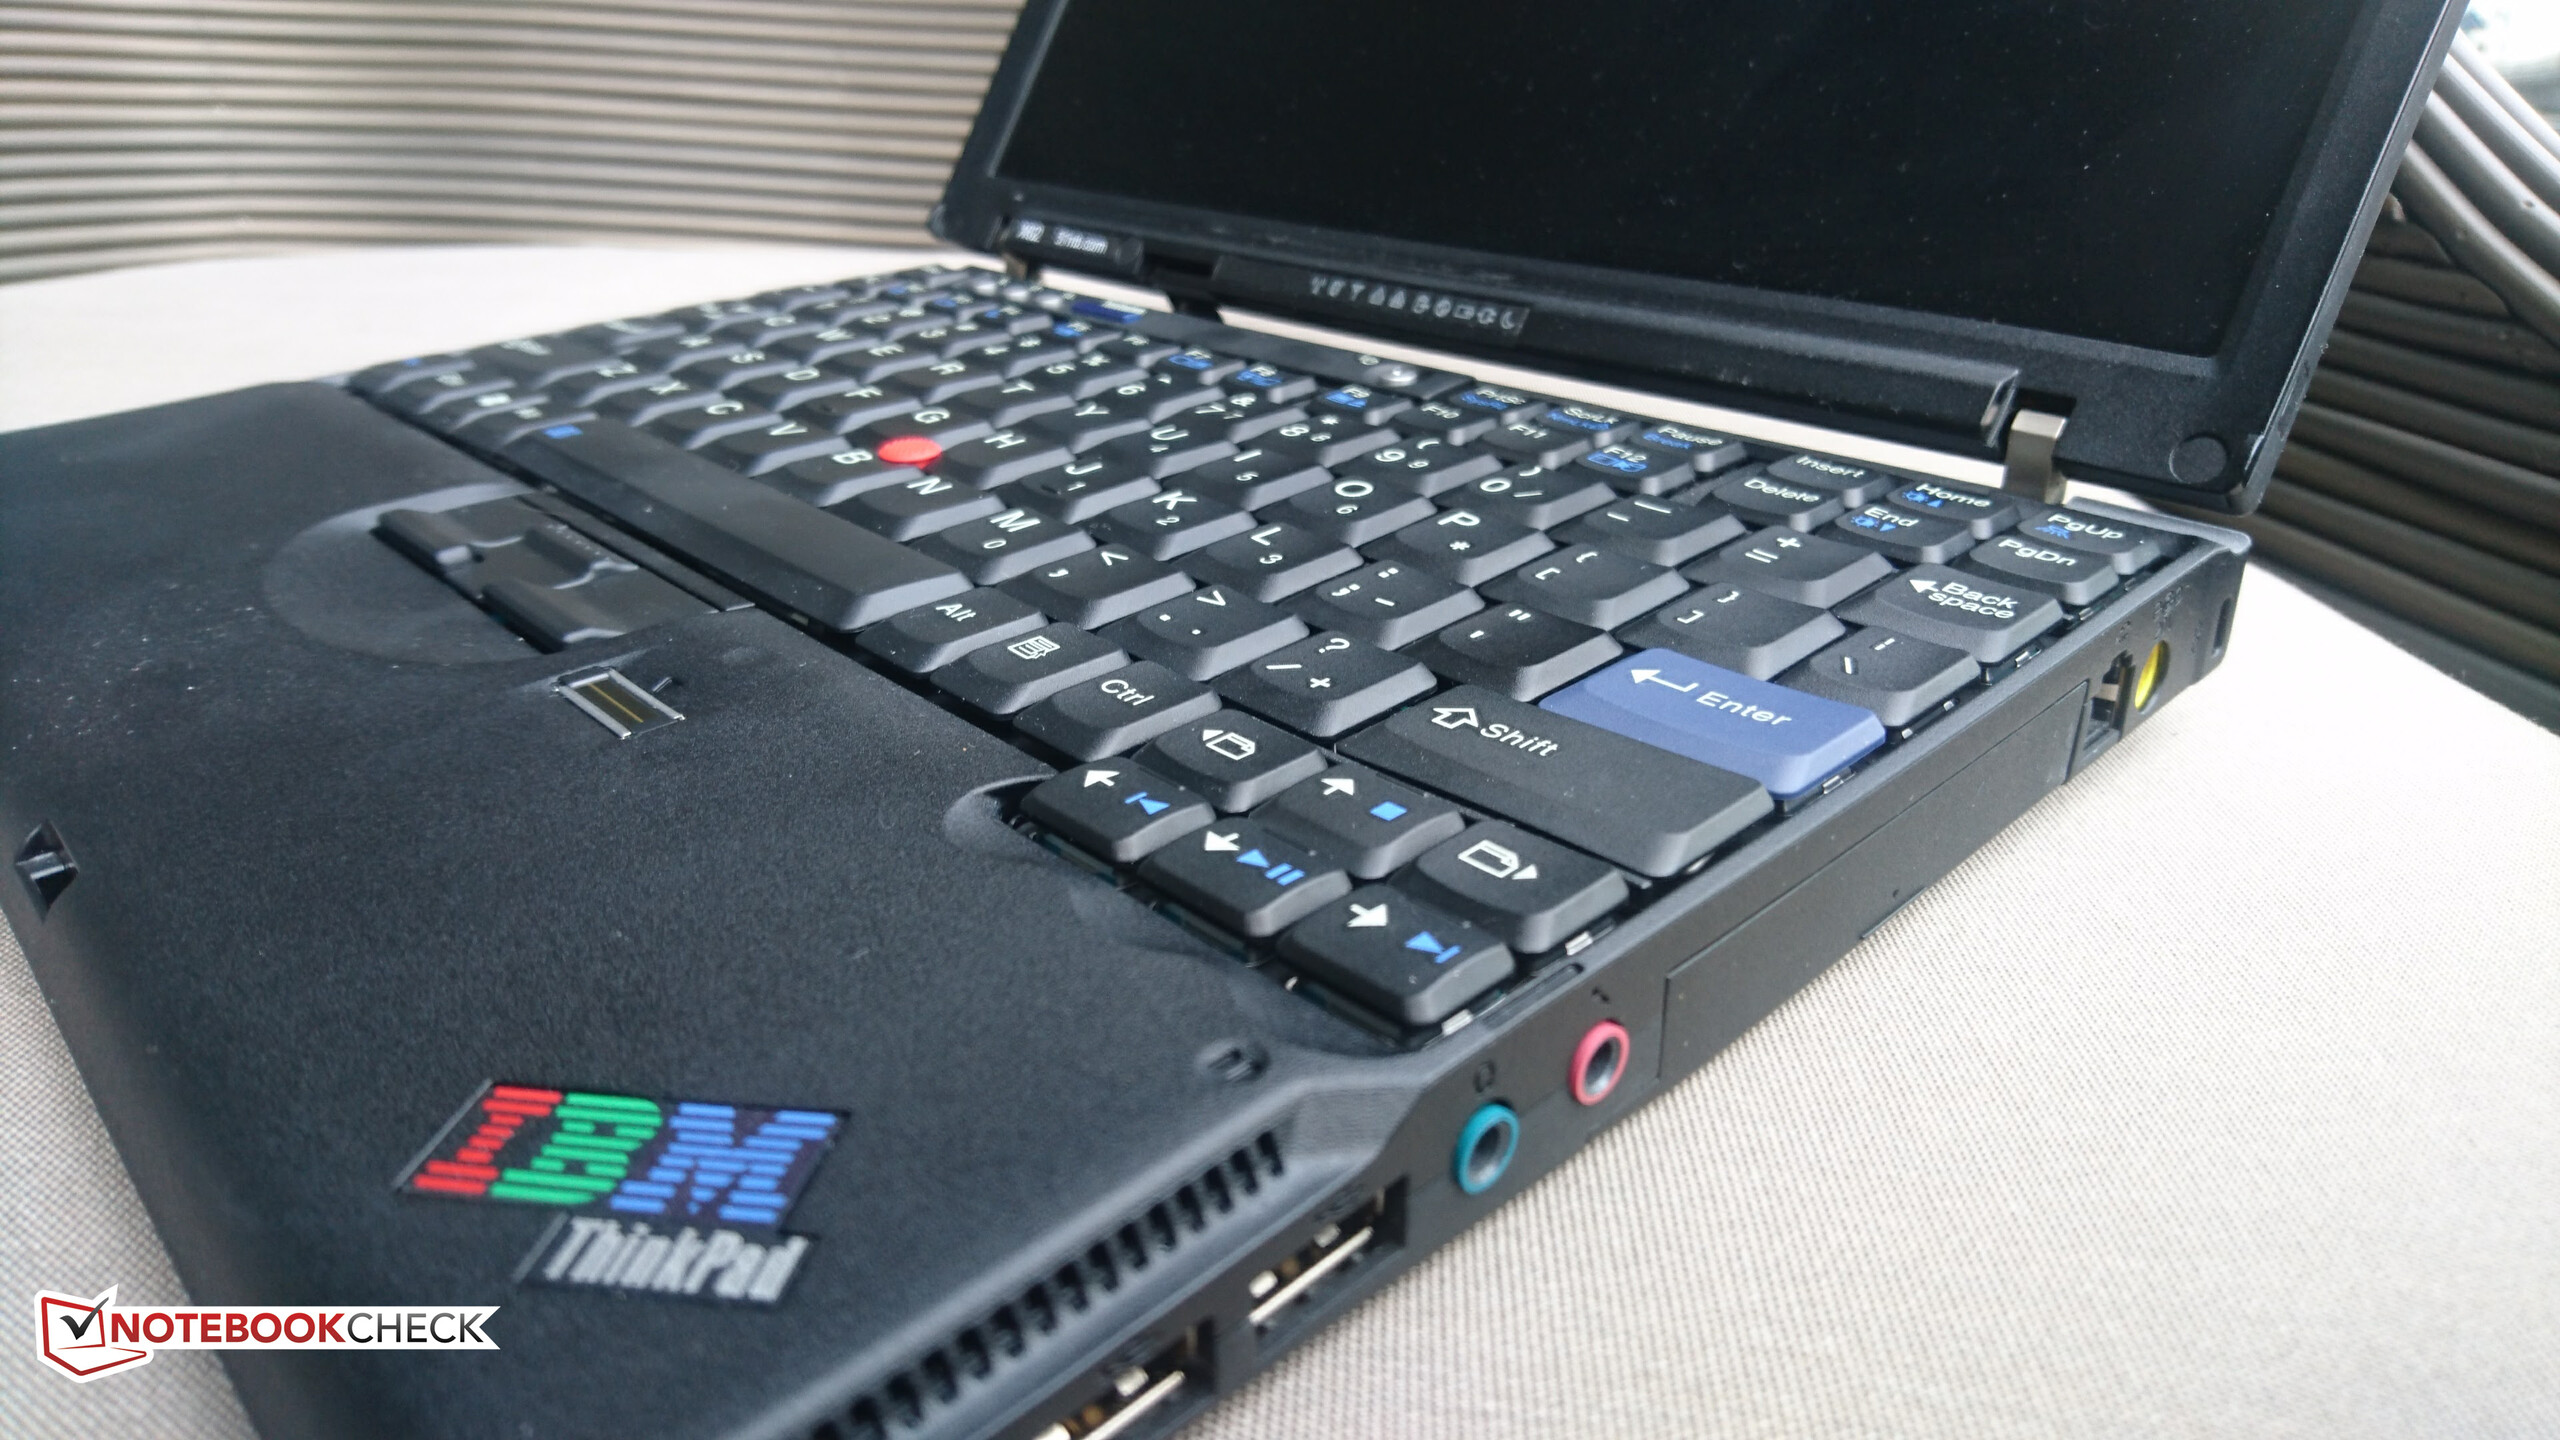
El X62 es una carta de amor a los días de los clásicos ThinkPads, ThinkLights, y displays 4:3. La naturaleza bricolaje del kit, más la casi necesidad de una mejora a retroiluminación LED implican que es un portátil principalmente para los aficionados y los que estén cómodos trasteando más que para el usuario medio. Sin embargo, creemos que está bien, ya que se fabricarán muy pocos de estos portátiles y ya son una especie de objeto de coleccionista. El bare-bones X62 (sin RAM, HDD, batería, o adaptador) ya cuesta la nada despreciable suma de US$750 para el modelo base i5. Para futuras iteraciones del X62, nos gustaría ver el módulo de retroiluminación LED instalado de serie así como que la unidad trajera batería y adaptador de corriente.
Si te interesa comprar un X62 o cualquier otra de las creaciones de 51nb, puedes ver su página web en inglés aquí para ponerte en contacto con ellos.
Ésta es una versión acortada del análisis original. Puedes leer el análisis completo en inglés aquí.
Price comparison
