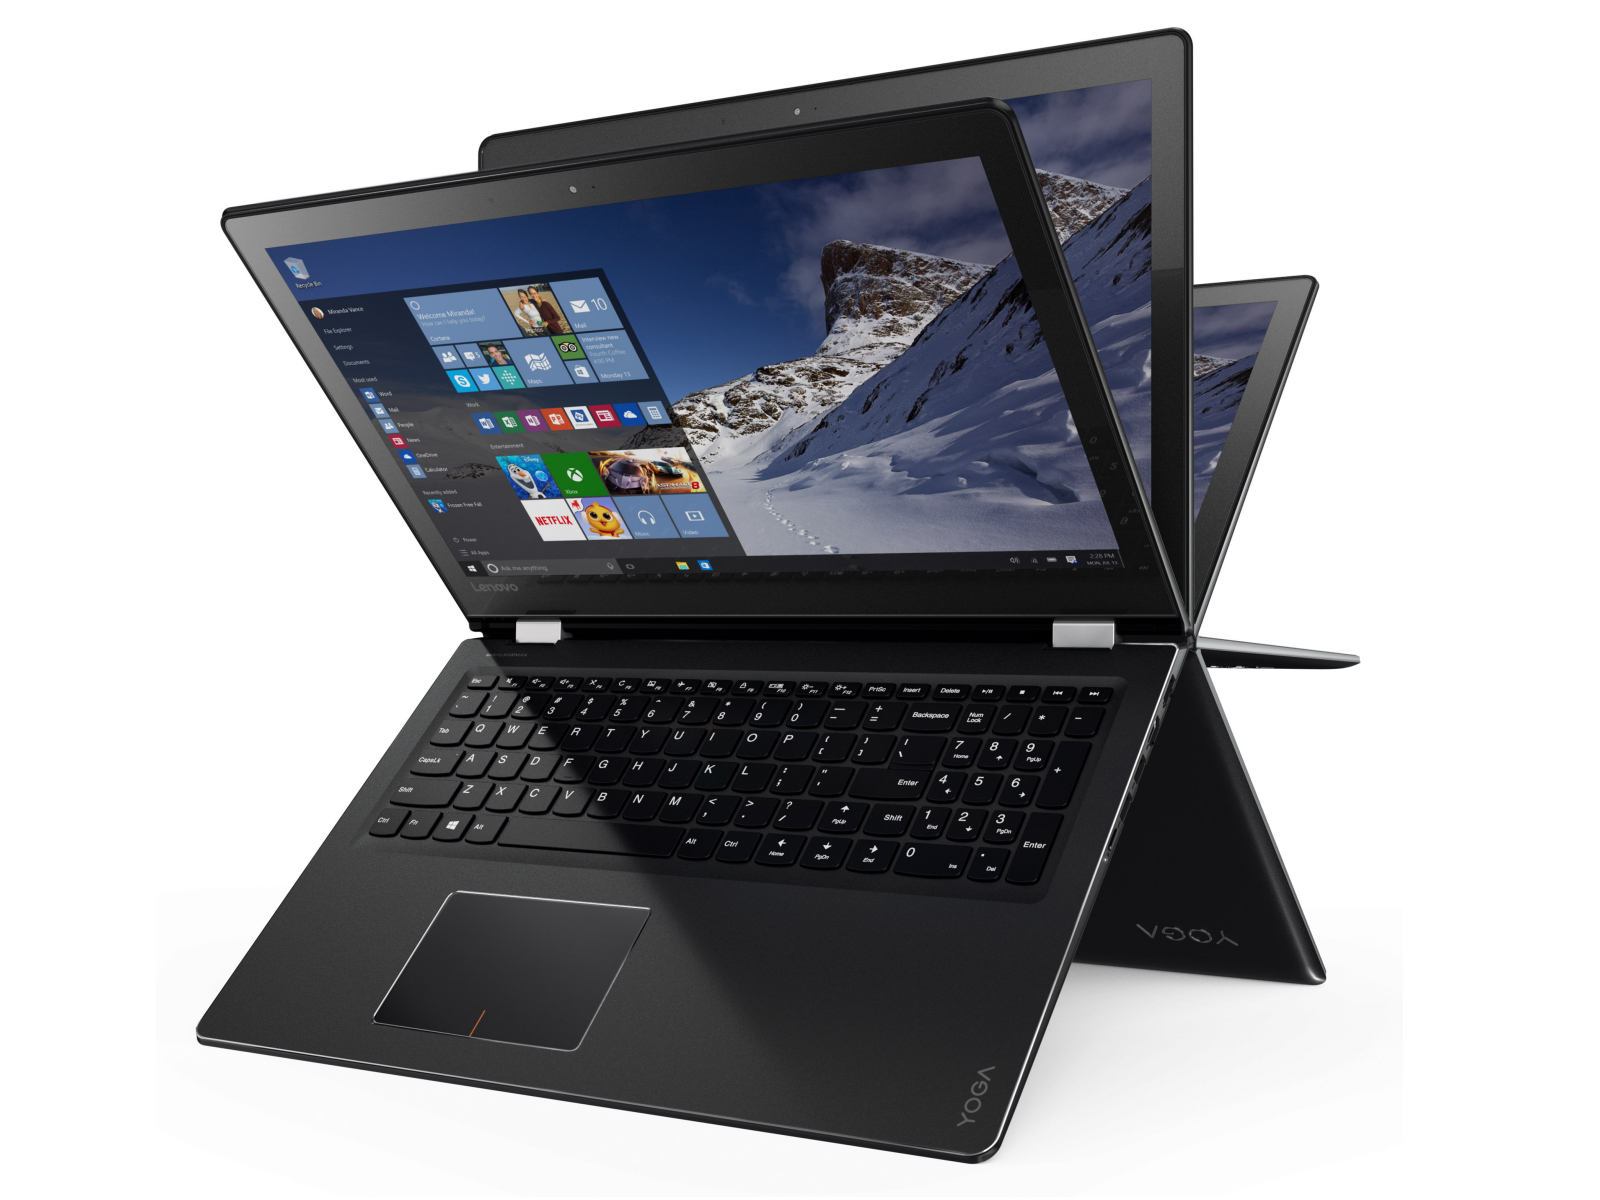
Breve análisis del Lenovo Yoga 510-15IKB
| SD Card Reader | |
| average JPG Copy Test (av. of 3 runs) | |
| HP Pavilion 15-bk001ng x360 | |
| Lenovo Yoga 510-15IKB 80VC000XGE | |
| Lenovo Yoga 510-15ISK | |
| Dell Inspiron 15 5568 | |
| maximum AS SSD Seq Read Test (1GB) | |
| Lenovo Yoga 510-15IKB 80VC000XGE | |
| HP Pavilion 15-bk001ng x360 | |
| Lenovo Yoga 510-15ISK | |
| Dell Inspiron 15 5568 | |
| Networking | |
| iperf Server (receive) TCP 1 m | |
| Dell Inspiron 15 5568 | |
| Lenovo Yoga 510-15IKB 80VC000XGE (jseb) | |
| iperf Client (transmit) TCP 1 m | |
| Dell Inspiron 15 5568 | |
| Lenovo Yoga 510-15IKB 80VC000XGE (jseb) | |
| |||||||||||||||||||||||||
iluminación: 78 %
Brillo con batería: 236 cd/m²
Contraste: 1311:1 (Negro: 0.18 cd/m²)
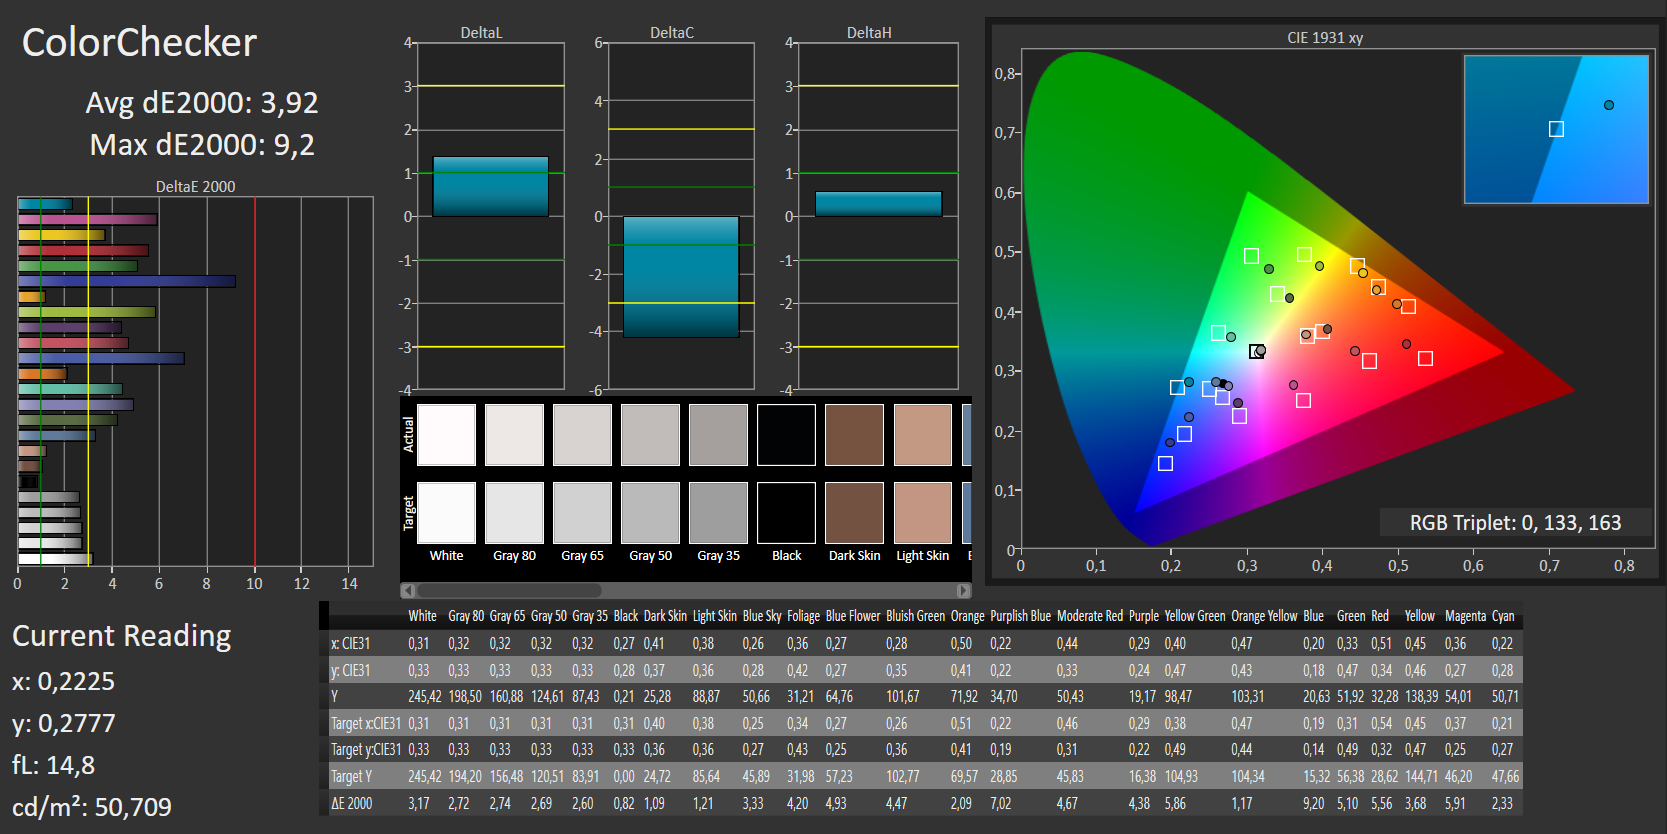
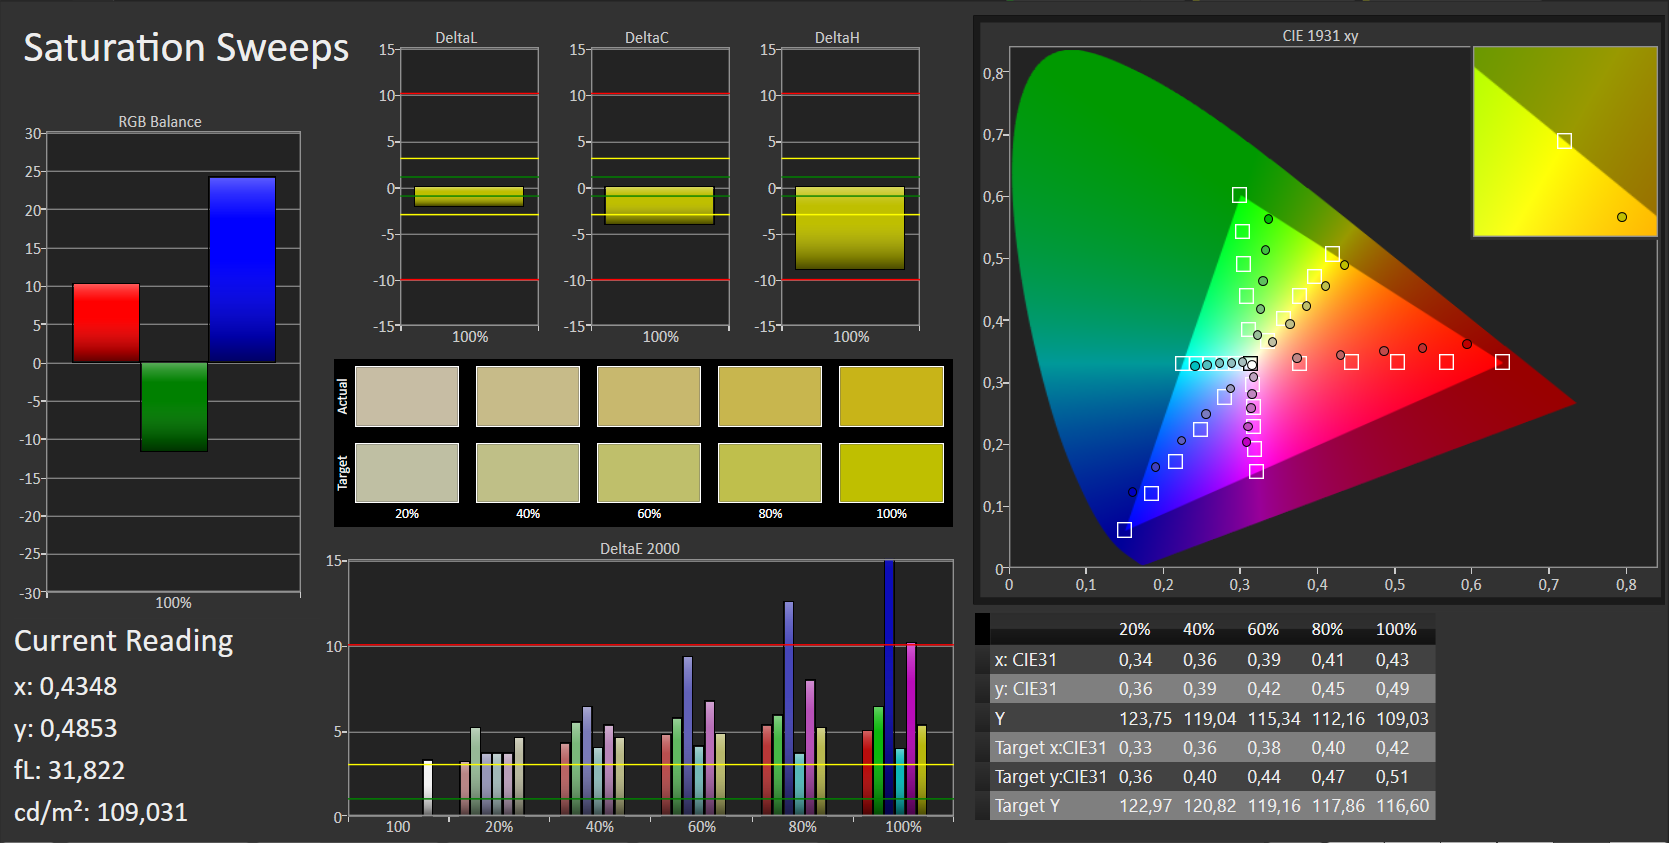
ΔE ColorChecker Calman: 3.92 | ∀{0.5-29.43 Ø4.73}
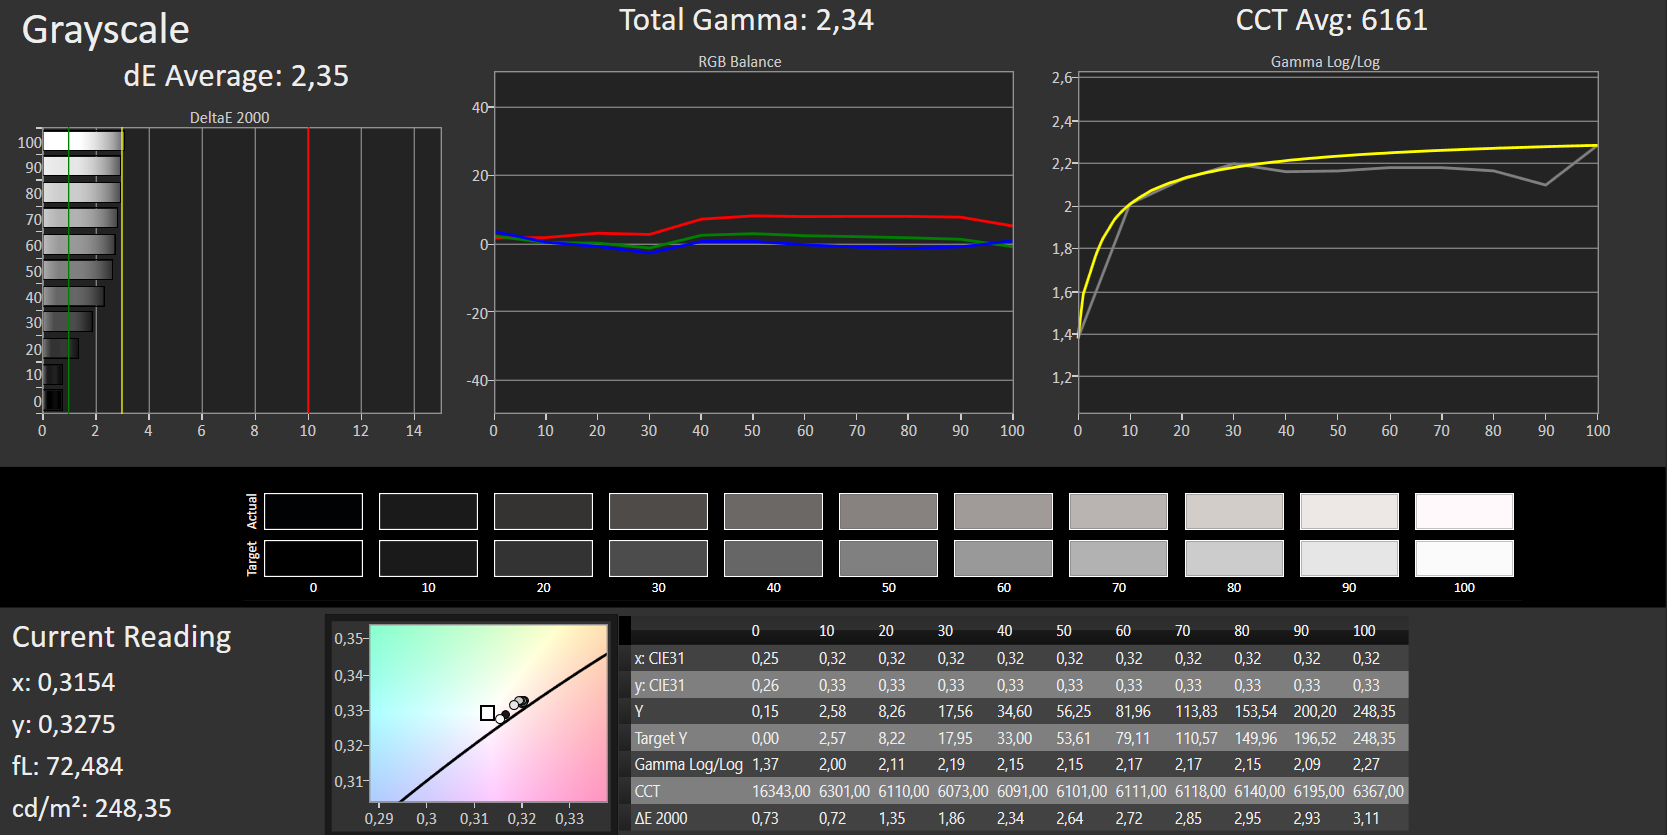
ΔE Greyscale Calman: 2.35 | ∀{0.09-98 Ø4.97}
63% sRGB (Argyll 1.6.3 3D)
40% AdobeRGB 1998 (Argyll 1.6.3 3D)
43.32% AdobeRGB 1998 (Argyll 3D)
62.9% sRGB (Argyll 3D)
41.92% Display P3 (Argyll 3D)
Gamma: 2.34
CCT: 6161 K
| Lenovo Yoga 510-15IKB 80VC000XGE IPS, 1920x1080, 15.6" | Lenovo Yoga 510-15ISK IPS, 1920x1080, 15.6" | HP Pavilion 15-bk001ng x360 IPS, 1920x1080, 15.6" | Dell Inspiron 15 5568 IPS, 1920x1080, 15.6" | |
|---|---|---|---|---|
| Display | 2% | 0% | -9% | |
| Display P3 Coverage (%) | 41.92 | 42.58 2% | 41.84 0% | 38.04 -9% |
| sRGB Coverage (%) | 62.9 | 63.9 2% | 62.7 0% | 57.1 -9% |
| AdobeRGB 1998 Coverage (%) | 43.32 | 43.99 2% | 43.25 0% | 39.3 -9% |
| Response Times | 0% | 29% | 18% | |
| Response Time Grey 50% / Grey 80% * (ms) | 53 ? | 43.2 ? 18% | 30.8 ? 42% | 42 ? 21% |
| Response Time Black / White * (ms) | 26 ? | 30.8 ? -18% | 22 ? 15% | 22 ? 15% |
| PWM Frequency (Hz) | 50 ? | 200 ? | ||
| Screen | -7% | -6% | -12% | |
| Brightness middle (cd/m²) | 236 | 254 8% | 225 -5% | 266 13% |
| Brightness (cd/m²) | 212 | 230 8% | 210 -1% | 249 17% |
| Brightness Distribution (%) | 78 | 86 10% | 85 9% | 85 9% |
| Black Level * (cd/m²) | 0.18 | 0.26 -44% | 0.22 -22% | 0.26 -44% |
| Contrast (:1) | 1311 | 977 -25% | 1023 -22% | 1023 -22% |
| Colorchecker dE 2000 * | 3.92 | 4.23 -8% | 4.13 -5% | 4.98 -27% |
| Colorchecker dE 2000 max. * | 9.2 | 9.5 -3% | 9.36 -2% | 11.82 -28% |
| Greyscale dE 2000 * | 2.35 | 2.87 -22% | 2.53 -8% | 2.68 -14% |
| Gamma | 2.34 94% | 2.35 94% | 2.6 85% | 2.27 97% |
| CCT | 6161 106% | 5965 109% | 6360 102% | 6583 99% |
| Color Space (Percent of AdobeRGB 1998) (%) | 40 | 40.35 1% | 39.8 -1% | 36 -10% |
| Color Space (Percent of sRGB) (%) | 63 | 63.48 1% | 62.5 -1% | 57 -10% |
| Media total (Programa/Opciones) | -2% /
-5% | 8% /
-0% | -1% /
-7% |
* ... más pequeño es mejor
Parpadeo de Pantalla / PWM (Pulse-Width Modulation)
| Parpadeo de Pantalla / PWM detectado | 50 Hz | ≤ 50 % de brillo | 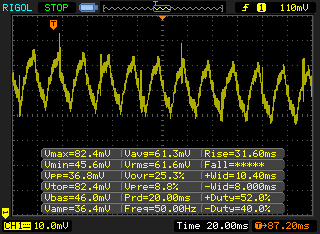 |
La retroiluminación del display parpadea a 50 Hz (seguramente usa PWM - Pulse-Width Modulation) a un brillo del 50 % e inferior. Sobre este nivel de brillo no debería darse parpadeo / PWM. La frecuencia de 50 Hz es bajísima, por lo que el parpadeo puede causar fatiga visual y cefaleas cuando se usa mucho tiempo. Comparación: 52 % de todos los dispositivos testados no usaron PWM para atenuar el display. Si se usó, medimos una media de 7784 (mínimo: 5 - máxmo: 343500) Hz. | |||
Tiempos de respuesta del display
| ↔ Tiempo de respuesta de Negro a Blanco | ||
|---|---|---|
| 26 ms ... subida ↗ y bajada ↘ combinada | ↗ 6 ms subida | 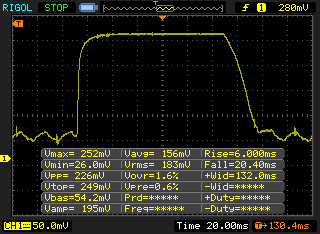 |
| ↘ 20 ms bajada | ||
| La pantalla mostró tiempos de respuesta relativamente lentos en nuestros tests pero podría ser demasiado lenta para los jugones. En comparación, todos los dispositivos de prueba van de ##min### (mínimo) a 240 (máximo) ms. » 62 % de todos los dispositivos son mejores. Eso quiere decir que el tiempo de respuesta es peor que la media (19.9 ms) de todos los dispositivos testados. | ||
| ↔ Tiempo de respuesta 50% Gris a 80% Gris | ||
| 53 ms ... subida ↗ y bajada ↘ combinada | ↗ 19 ms subida | 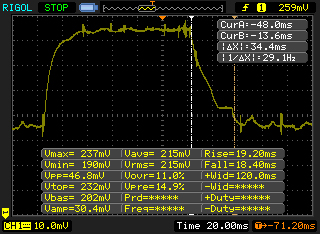 |
| ↘ 34 ms bajada | ||
| La pantalla mostró tiempos de respuesta lentos en nuestros tests y podría ser demasiado lenta para los jugones. En comparación, todos los dispositivos de prueba van de ##min### (mínimo) a 636 (máximo) ms. » 90 % de todos los dispositivos son mejores. Eso quiere decir que el tiempo de respuesta es peor que la media (31.1 ms) de todos los dispositivos testados. | ||
| Geekbench 3 | |
| 32 Bit Single-Core Score | |
| Lenovo Yoga 510-15IKB 80VC000XGE | |
| Lenovo Yoga 510-15ISK | |
| 32 Bit Multi-Core Score | |
| Lenovo Yoga 510-15IKB 80VC000XGE | |
| Lenovo Yoga 510-15ISK | |
| Geekbench 4.0 | |
| 64 Bit Single-Core Score | |
| Lenovo Yoga 510-15IKB 80VC000XGE | |
| 64 Bit Multi-Core Score | |
| Lenovo Yoga 510-15IKB 80VC000XGE | |
| JetStream 1.1 - 1.1 Total | |
| Lenovo Yoga 510-15IKB 80VC000XGE | |
| Dell Inspiron 15 5568 | |
| Lenovo Yoga 510-15ISK | |
| PCMark 8 Home Score Accelerated v2 | 3694 puntos | |
ayuda | ||
| PCMark 8 - Home Score Accelerated v2 | |
| Lenovo Yoga 510-15IKB 80VC000XGE | |
| Lenovo Yoga 510-15ISK | |
| Dell Inspiron 15 5568 | |
| HP Pavilion 15-bk001ng x360 | |

| Lenovo Yoga 510-15IKB 80VC000XGE Samsung MZYTY256HDHP | Lenovo Yoga 510-15ISK Liteonit CV3-DE256 | HP Pavilion 15-bk001ng x360 WDC Slim WD10SPCX-21KHST0 | Dell Inspiron 15 5568 Toshiba THNSNK256GCS8 | |
|---|---|---|---|---|
| CrystalDiskMark 3.0 | -13% | -92% | -25% | |
| Read Seq (MB/s) | 529 | 487 -8% | 106.9 -80% | 458.6 -13% |
| Write Seq (MB/s) | 508 | 450.7 -11% | 106 -79% | 270 -47% |
| Read 512 (MB/s) | 409.8 | 384.5 -6% | 33.01 -92% | 397.4 -3% |
| Write 512 (MB/s) | 316.5 | 356.3 13% | 51.2 -84% | 242 -24% |
| Read 4k (MB/s) | 36.01 | 27.05 -25% | 0.373 -99% | 19.88 -45% |
| Write 4k (MB/s) | 106.7 | 63.7 -40% | 1.097 -99% | 86.7 -19% |
| Read 4k QD32 (MB/s) | 384.8 | 281.5 -27% | 1.029 -100% | 275.3 -28% |
| Write 4k QD32 (MB/s) | 237.3 | 232 -2% | 1.055 -100% | 197.6 -17% |
| 3DMark 11 Performance | 2267 puntos | |
ayuda | ||
| bajo | medio | alto | ultra | |
|---|---|---|---|---|
| Crysis 3 (2013) | 29.9 | 18.3 | 13.7 | 5.2 |
| BioShock Infinite (2013) | 72.2 | 40.8 | 32.2 | 9.8 |
| Sims 4 (2014) | 137.5 | 49.9 | 21.7 | 18.6 |
| Middle-earth: Shadow of Mordor (2014) | 33.3 | 20.9 | 11.1 | 7.3 |
| Alien: Isolation (2014) | 50.1 | 37.6 | 18 | 14.7 |
| F1 2014 (2014) | 100 | 75 | 44 | 25 |
| GTA V (2015) | 50.5 | 45.2 | 10.7 | |
| The Witcher 3 (2015) | 20.7 | 13.4 | 6.7 | |
| Metal Gear Solid V (2015) | 43.9 | 30.2 | 12.4 | |
| Call of Duty: Black Ops 3 (2015) | 43.3 | 23.6 | 12.3 | |
| Star Wars Battlefront (2015) | 36.2 | 24.4 | 11.1 | |
| Hitman 2016 (2016) | 28 | 20.6 | 10.6 | |
| Need for Speed 2016 (2016) | 26.6 | 23 | 14.1 | |
| Ashes of the Singularity (2016) | 14.7 | 5.1 | ||
| Doom (2016) | 23.3 | 13.3 | 7.9 | |
| Mirror's Edge Catalyst (2016) | 27.7 | 19.6 | 7.9 | |
| No Man's Sky (2016) | 19.8 | 15.7 | 8.6 | |
| Deus Ex Mankind Divided (2016) | 14.5 | 10.6 | 5.4 | |
| FIFA 17 (2016) | 83.8 | 70.3 | 36.1 | 34.1 |
| Mafia 3 (2016) | 11.7 | 7.4 | 3.8 | |
| Battlefield 1 (2016) | 30 | 20.6 | 10.1 | |
| Farming Simulator 17 (2016) | 95.8 | 62.6 | 24 | 10 |
| Titanfall 2 (2016) | 40.8 | 30.6 | 12.5 | |
| Call of Duty Infinite Warfare (2016) | 29.1 | 26.1 | 14.7 |
| Star Wars Battlefront - 1024x768 Low Preset | |
| HP Envy 15-w103ng x360 | |
| Asus X302UV-FN016T | |
| Lenovo Yoga 510-15IKB 80VC000XGE | |
| Lenovo Yoga 510-15ISK | |
| Lenovo Ideapad 500-15ISK 80NT005WGE | |
| Lenovo ThinkPad E460-20EUS00000 | |
| F1 2014 - 1920x1080 High Preset | |
| Lenovo Ideapad 310-15ISK | |
| Lenovo Yoga 510-15IKB 80VC000XGE | |
| Asus F555LJ-XX110H | |
| GTA V - 1366x768 Normal/Off AF:4x | |
| Lenovo Ideapad 310-15ISK | |
| Lenovo Yoga 510-15IKB 80VC000XGE | |
Ruido
| Ocioso |
| 30.2 / 30.2 / 31 dB(A) |
| Carga |
| 38 / 38.6 dB(A) |
 | ||
30 dB silencioso 40 dB(A) audible 50 dB(A) ruidosamente alto |
||
min: | ||
(±) La temperatura máxima en la parte superior es de 42.9 °C / 109 F, frente a la media de 36.8 °C / 98 F, que oscila entre 21 y 71 °C para la clase Multimedia.
(±) El fondo se calienta hasta un máximo de 44.6 °C / 112 F, frente a la media de 39.1 °C / 102 F
(+) En reposo, la temperatura media de la parte superior es de 25 °C / 77# F, frente a la media del dispositivo de 31.3 °C / 88 F.
(+) El reposamanos y el panel táctil están a una temperatura inferior a la de la piel, con un máximo de 28.6 °C / 83.5 F y, por tanto, son fríos al tacto.
(±) La temperatura media de la zona del reposamanos de dispositivos similares fue de 28.7 °C / 83.7 F (+0.1 °C / 0.2 F).
Lenovo Yoga 510-15IKB 80VC000XGE análisis de audio
(±) | la sonoridad del altavoz es media pero buena (72 dB)
Graves 100 - 315 Hz
(-) | casi sin bajos - de media 25.5% inferior a la mediana
(±) | la linealidad de los graves es media (11.2% delta a frecuencia anterior)
Medios 400 - 2000 Hz
(+) | medios equilibrados - a sólo 2% de la mediana
(±) | la linealidad de los medios es media (7.5% delta respecto a la frecuencia anterior)
Altos 2 - 16 kHz
(+) | máximos equilibrados - a sólo 0.7% de la mediana
(+) | los máximos son lineales (2.3% delta a la frecuencia anterior)
Total 100 - 16.000 Hz
(±) | la linealidad del sonido global es media (19.5% de diferencia con la mediana)
En comparación con la misma clase
» 64% de todos los dispositivos probados de esta clase eran mejores, 7% similares, 29% peores
» El mejor tuvo un delta de 5%, la media fue 17%, el peor fue ###max##%
En comparación con todos los dispositivos probados
» 48% de todos los dispositivos probados eran mejores, 7% similares, 44% peores
» El mejor tuvo un delta de 4%, la media fue 24%, el peor fue ###max##%
Apple MacBook 12 (Early 2016) 1.1 GHz análisis de audio
(+) | los altavoces pueden reproducir a un volumen relativamente alto (#83.6 dB)
Graves 100 - 315 Hz
(±) | lubina reducida - en promedio 11.3% inferior a la mediana
(±) | la linealidad de los graves es media (14.2% delta a frecuencia anterior)
Medios 400 - 2000 Hz
(+) | medios equilibrados - a sólo 2.4% de la mediana
(+) | los medios son lineales (5.5% delta a la frecuencia anterior)
Altos 2 - 16 kHz
(+) | máximos equilibrados - a sólo 2% de la mediana
(+) | los máximos son lineales (4.5% delta a la frecuencia anterior)
Total 100 - 16.000 Hz
(+) | el sonido global es lineal (10.2% de diferencia con la mediana)
En comparación con la misma clase
» 7% de todos los dispositivos probados de esta clase eran mejores, 2% similares, 91% peores
» El mejor tuvo un delta de 5%, la media fue 18%, el peor fue ###max##%
En comparación con todos los dispositivos probados
» 5% de todos los dispositivos probados eran mejores, 1% similares, 94% peores
» El mejor tuvo un delta de 4%, la media fue 24%, el peor fue ###max##%
| Off / Standby | |
| Ocioso | |
| Carga |
|
Clave:
min: | |
| Battery Runtime - WiFi Websurfing | |
| HP Pavilion 15-bk001ng x360 | |
| Lenovo Yoga 510-15ISK | |
| Lenovo Yoga 510-15IKB 80VC000XGE | |
| Dell Inspiron 15 5568 | |
Pro
Contra
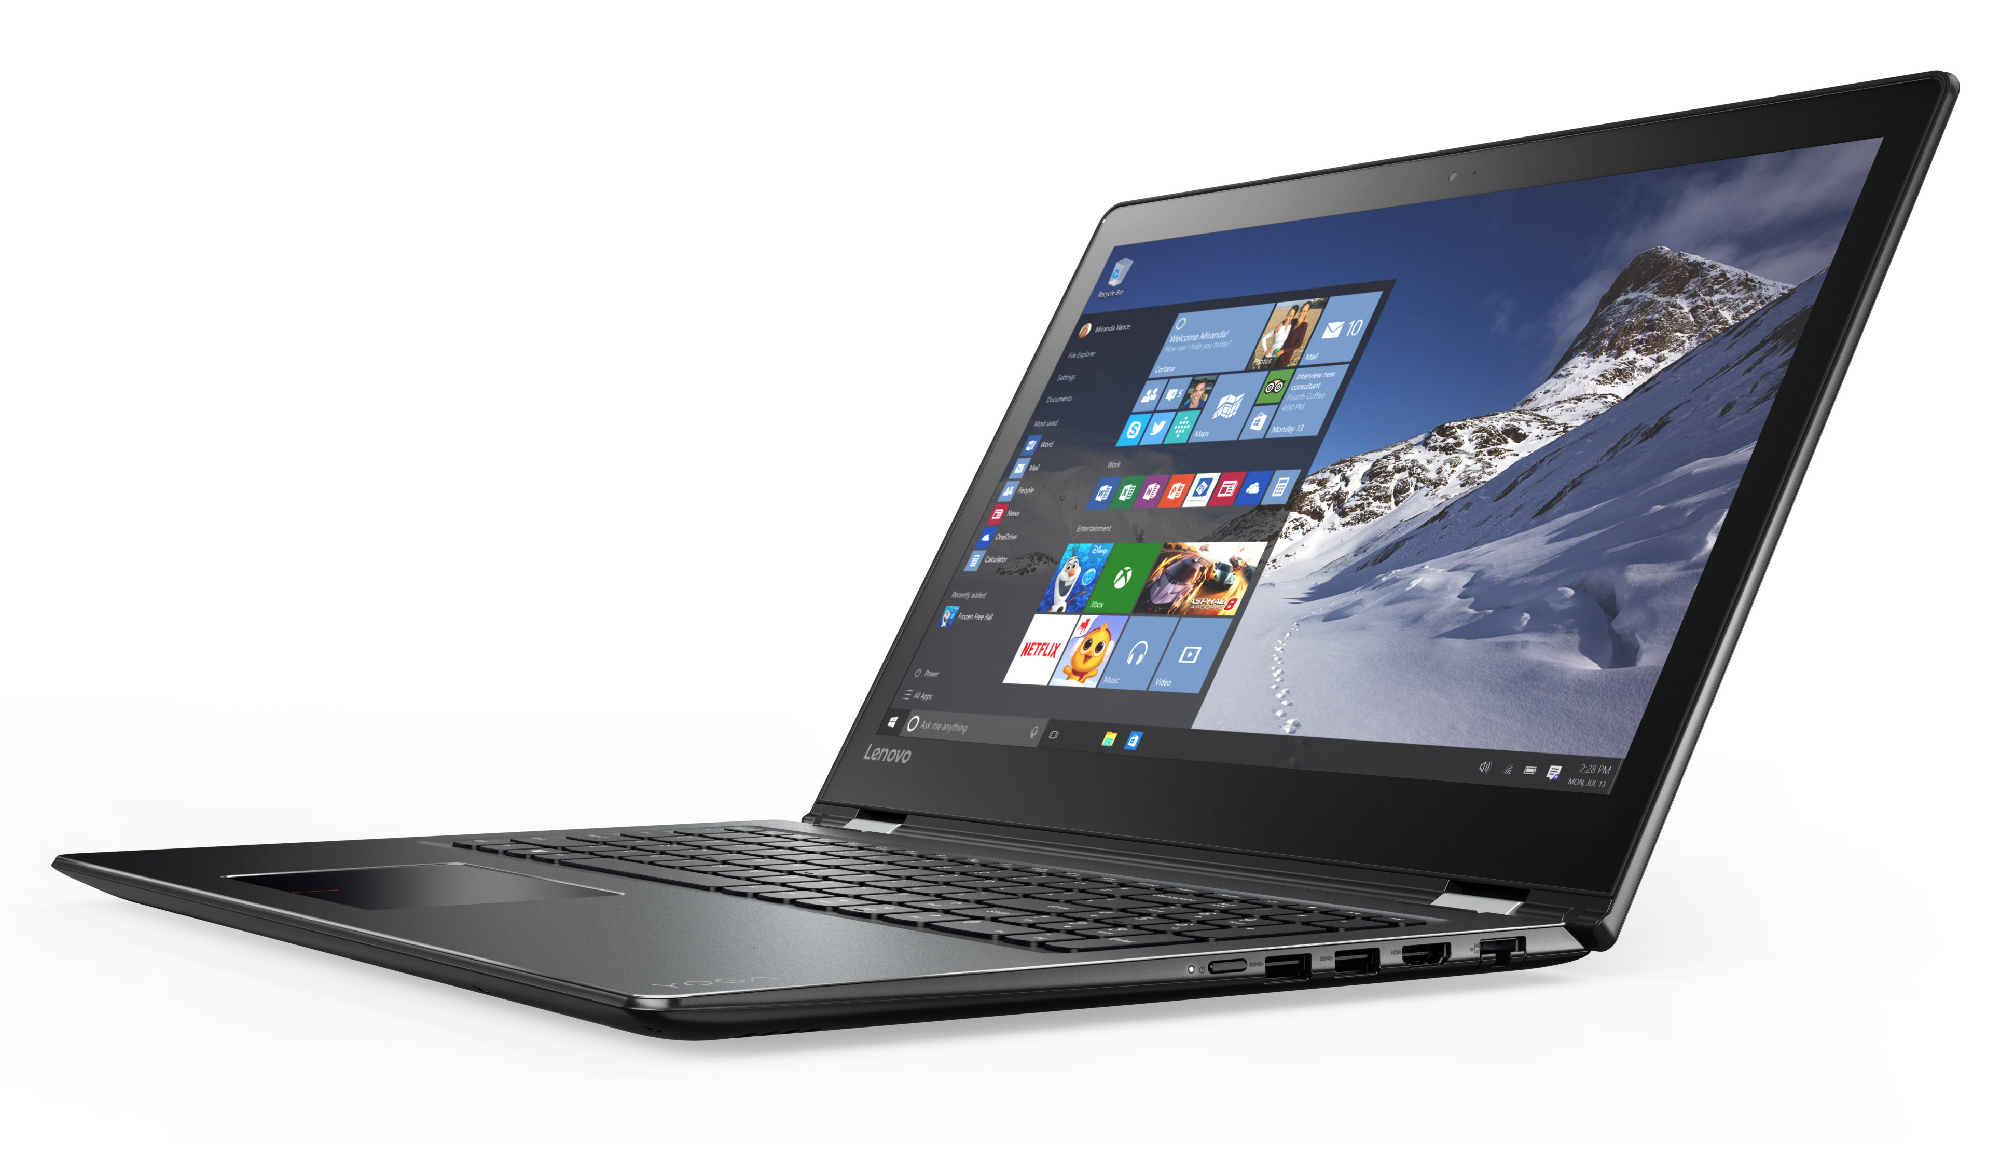
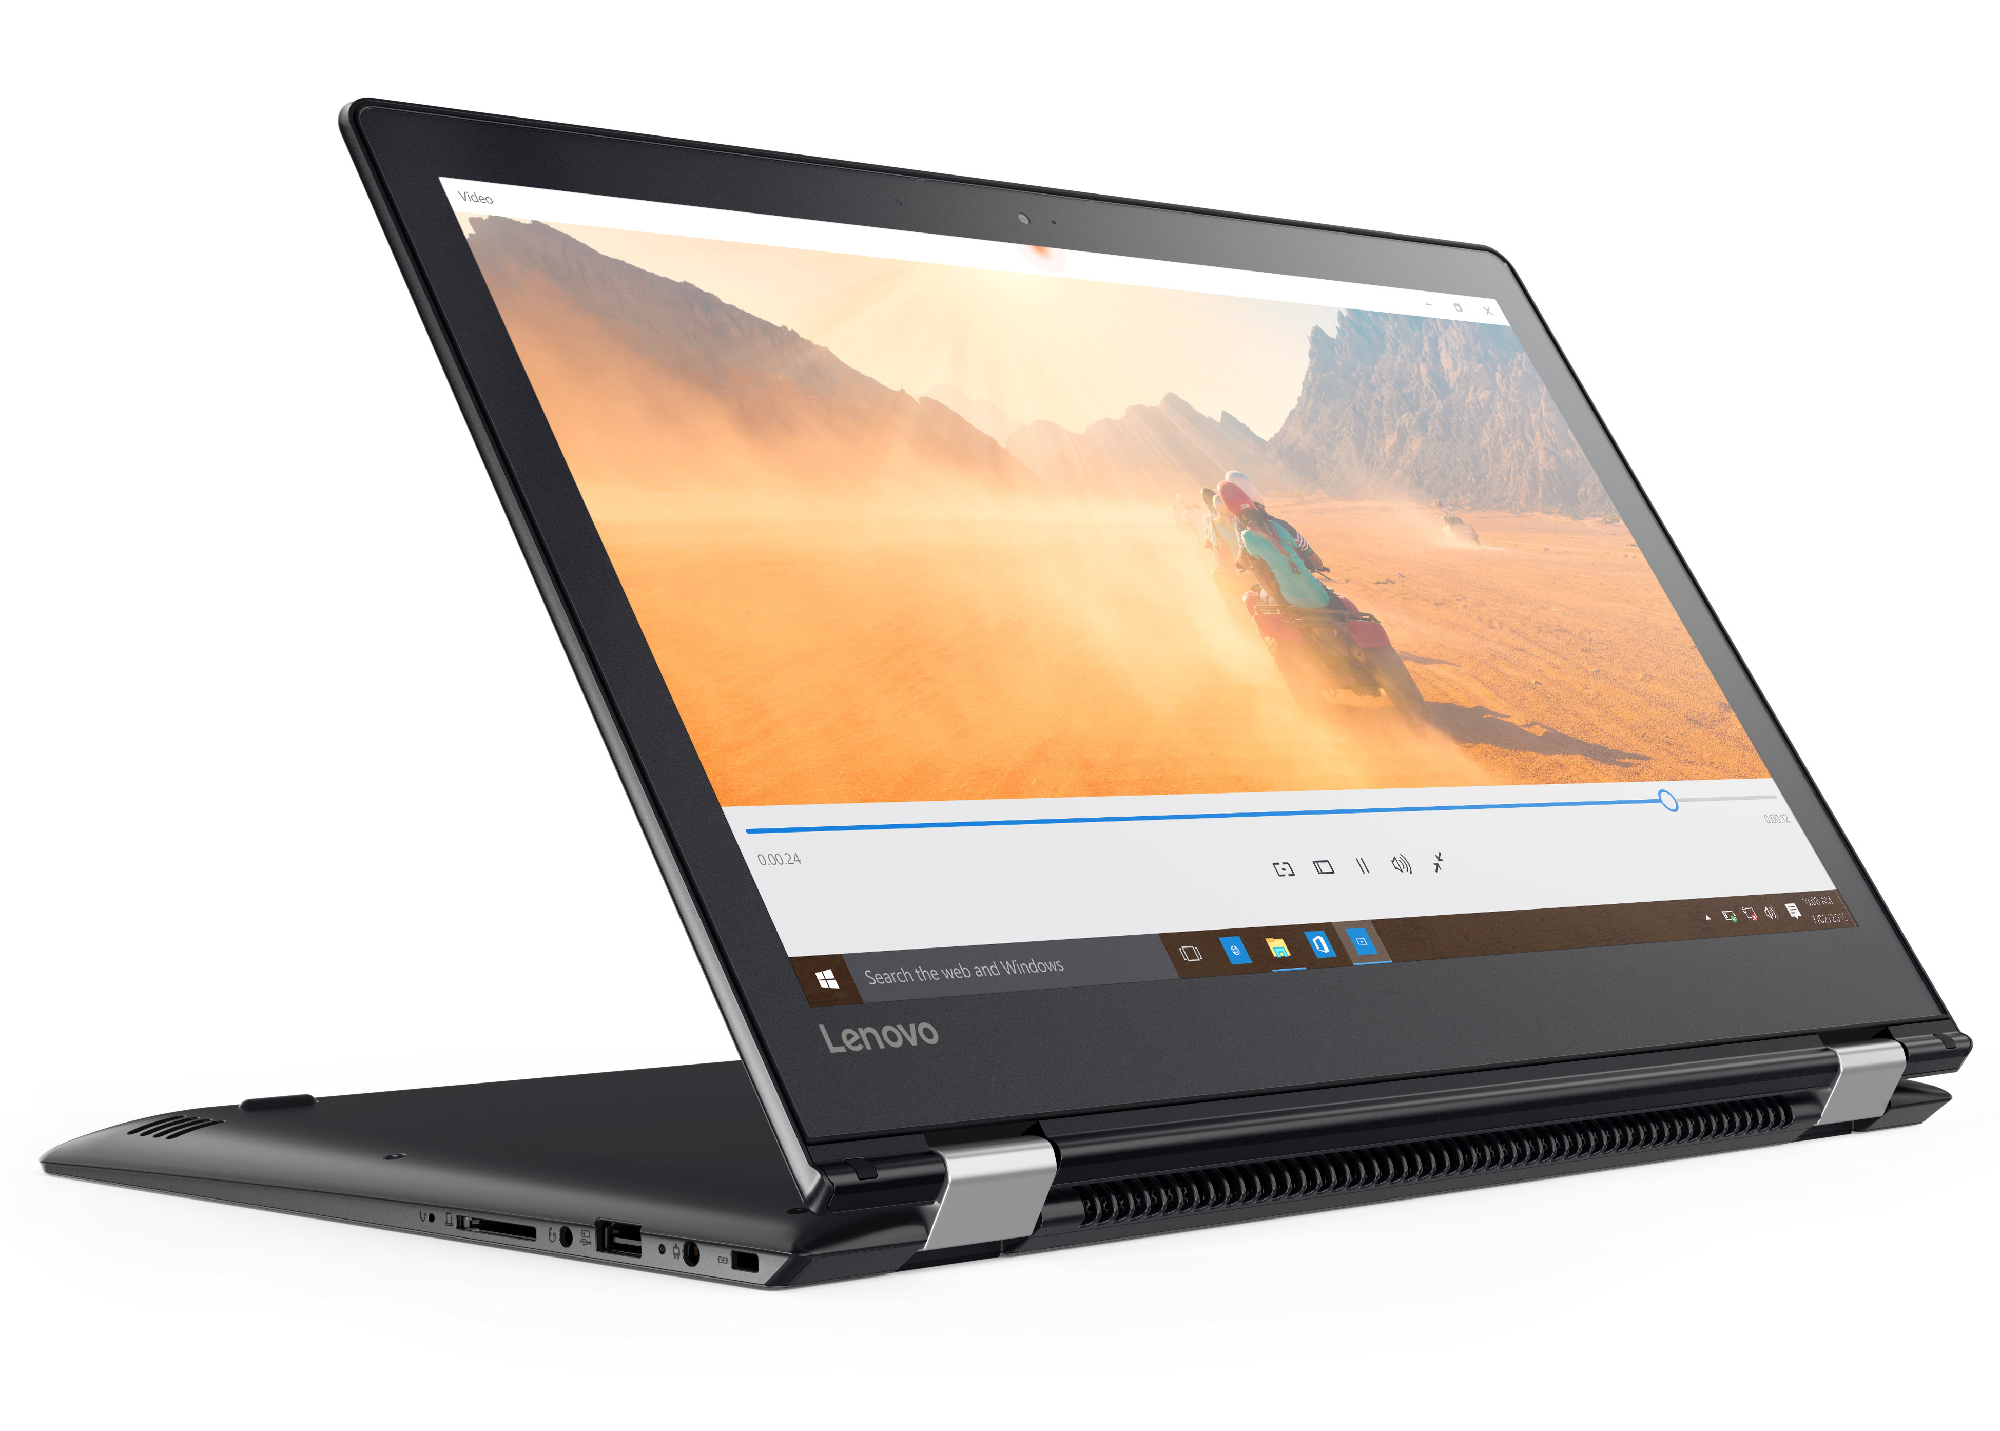
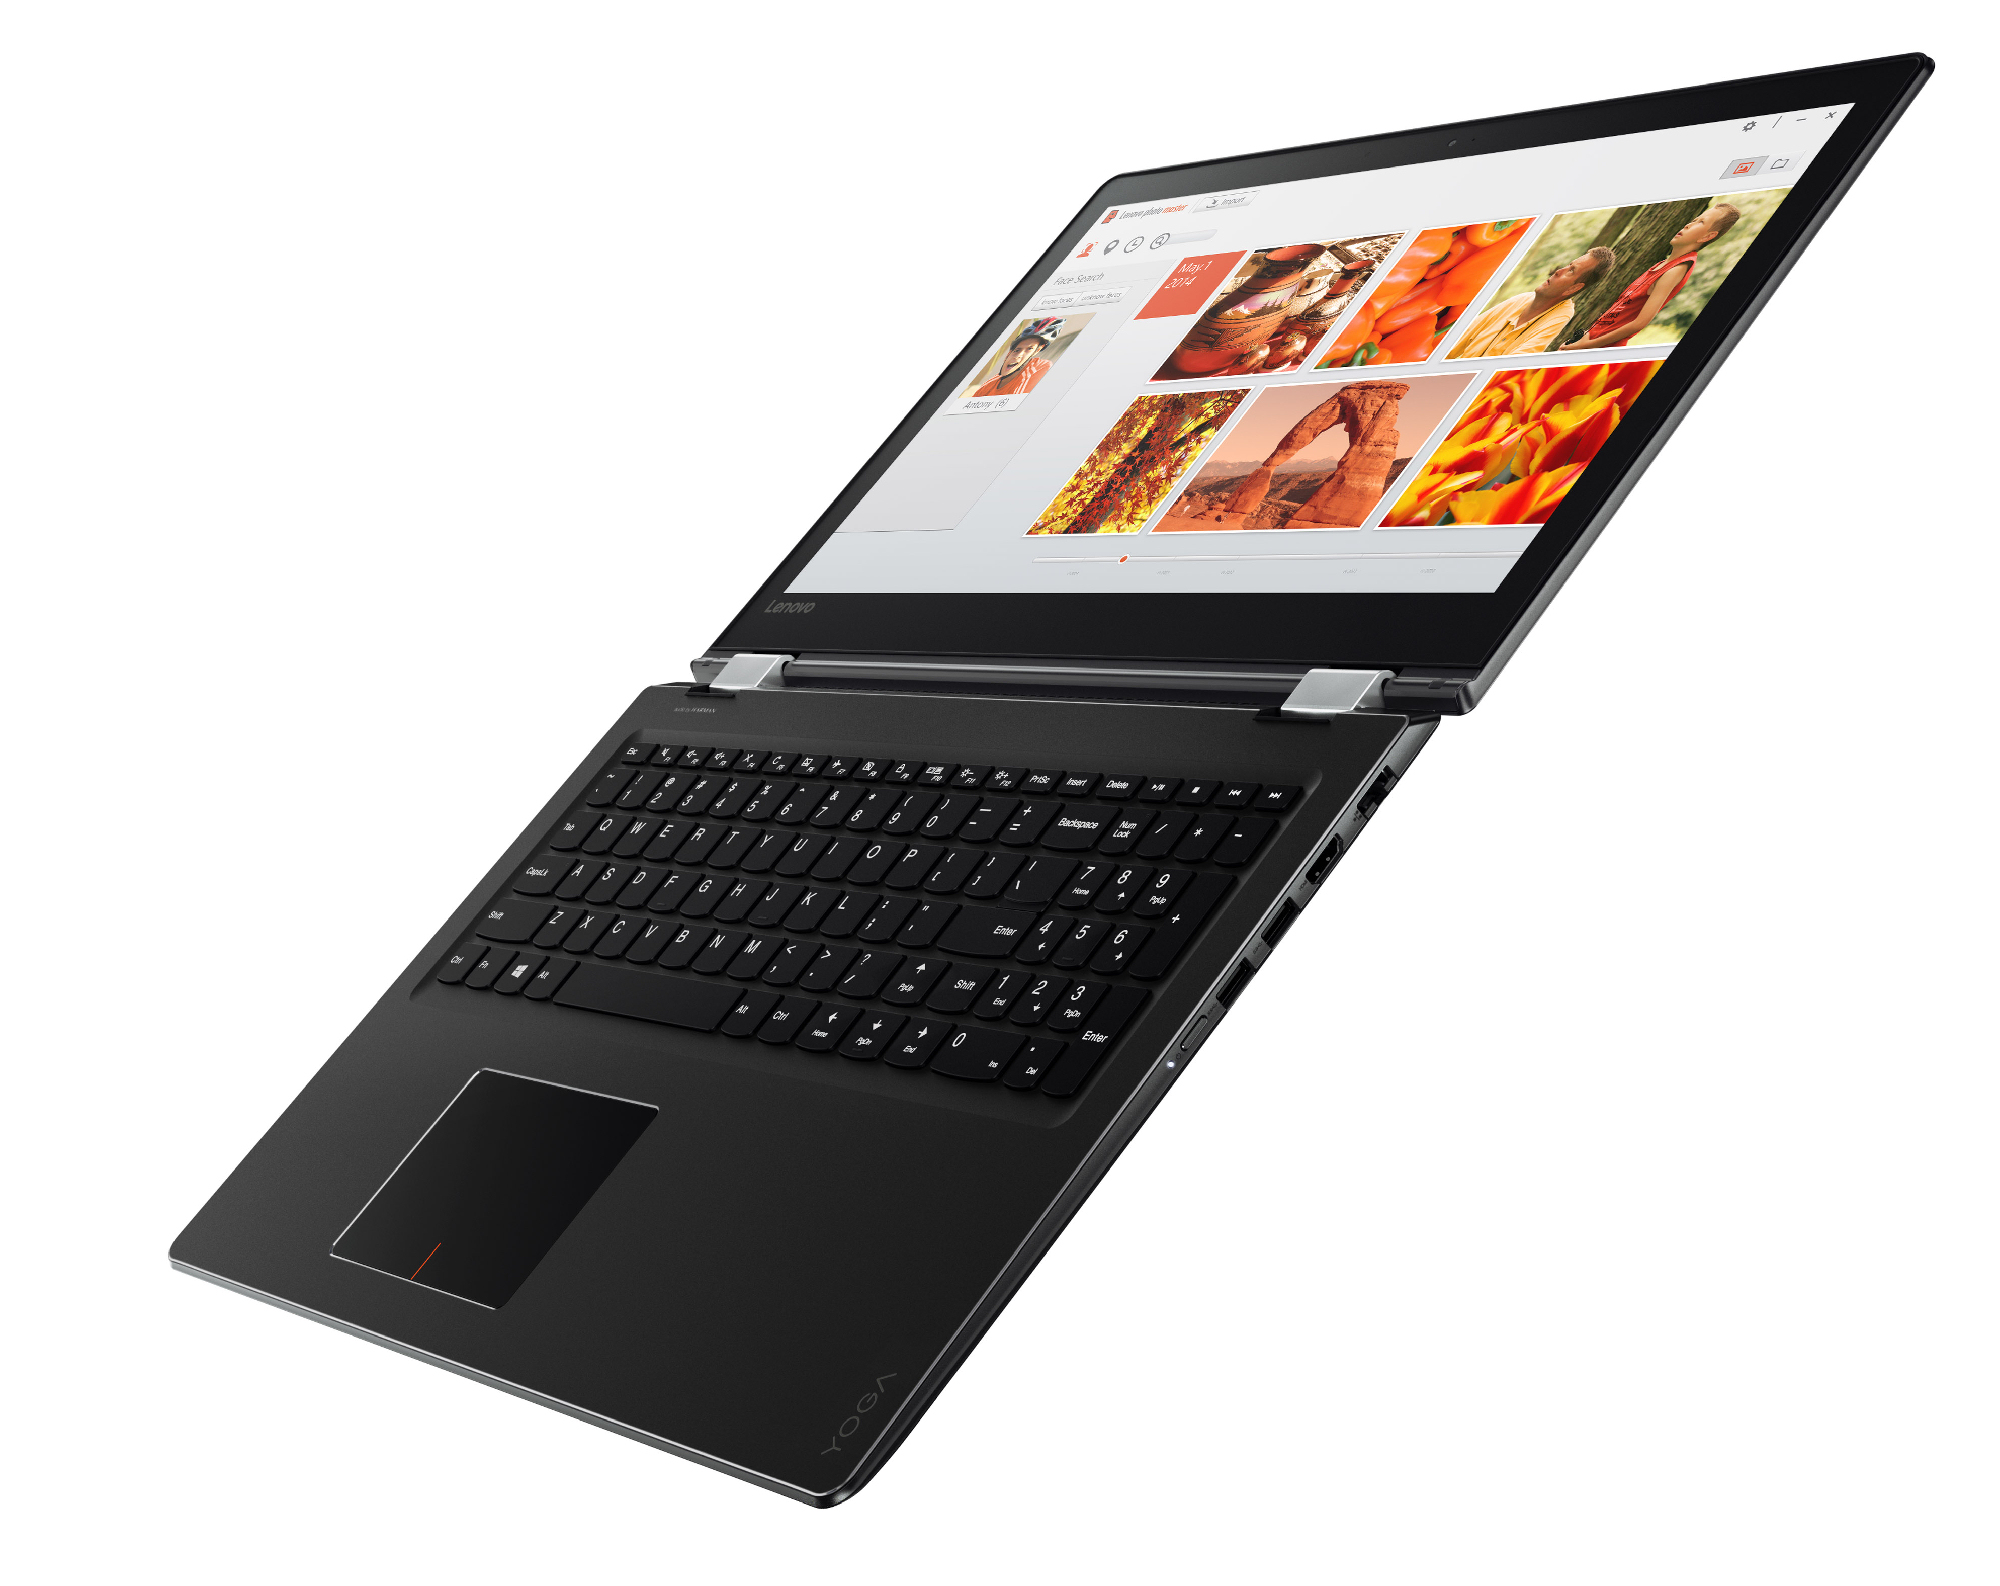
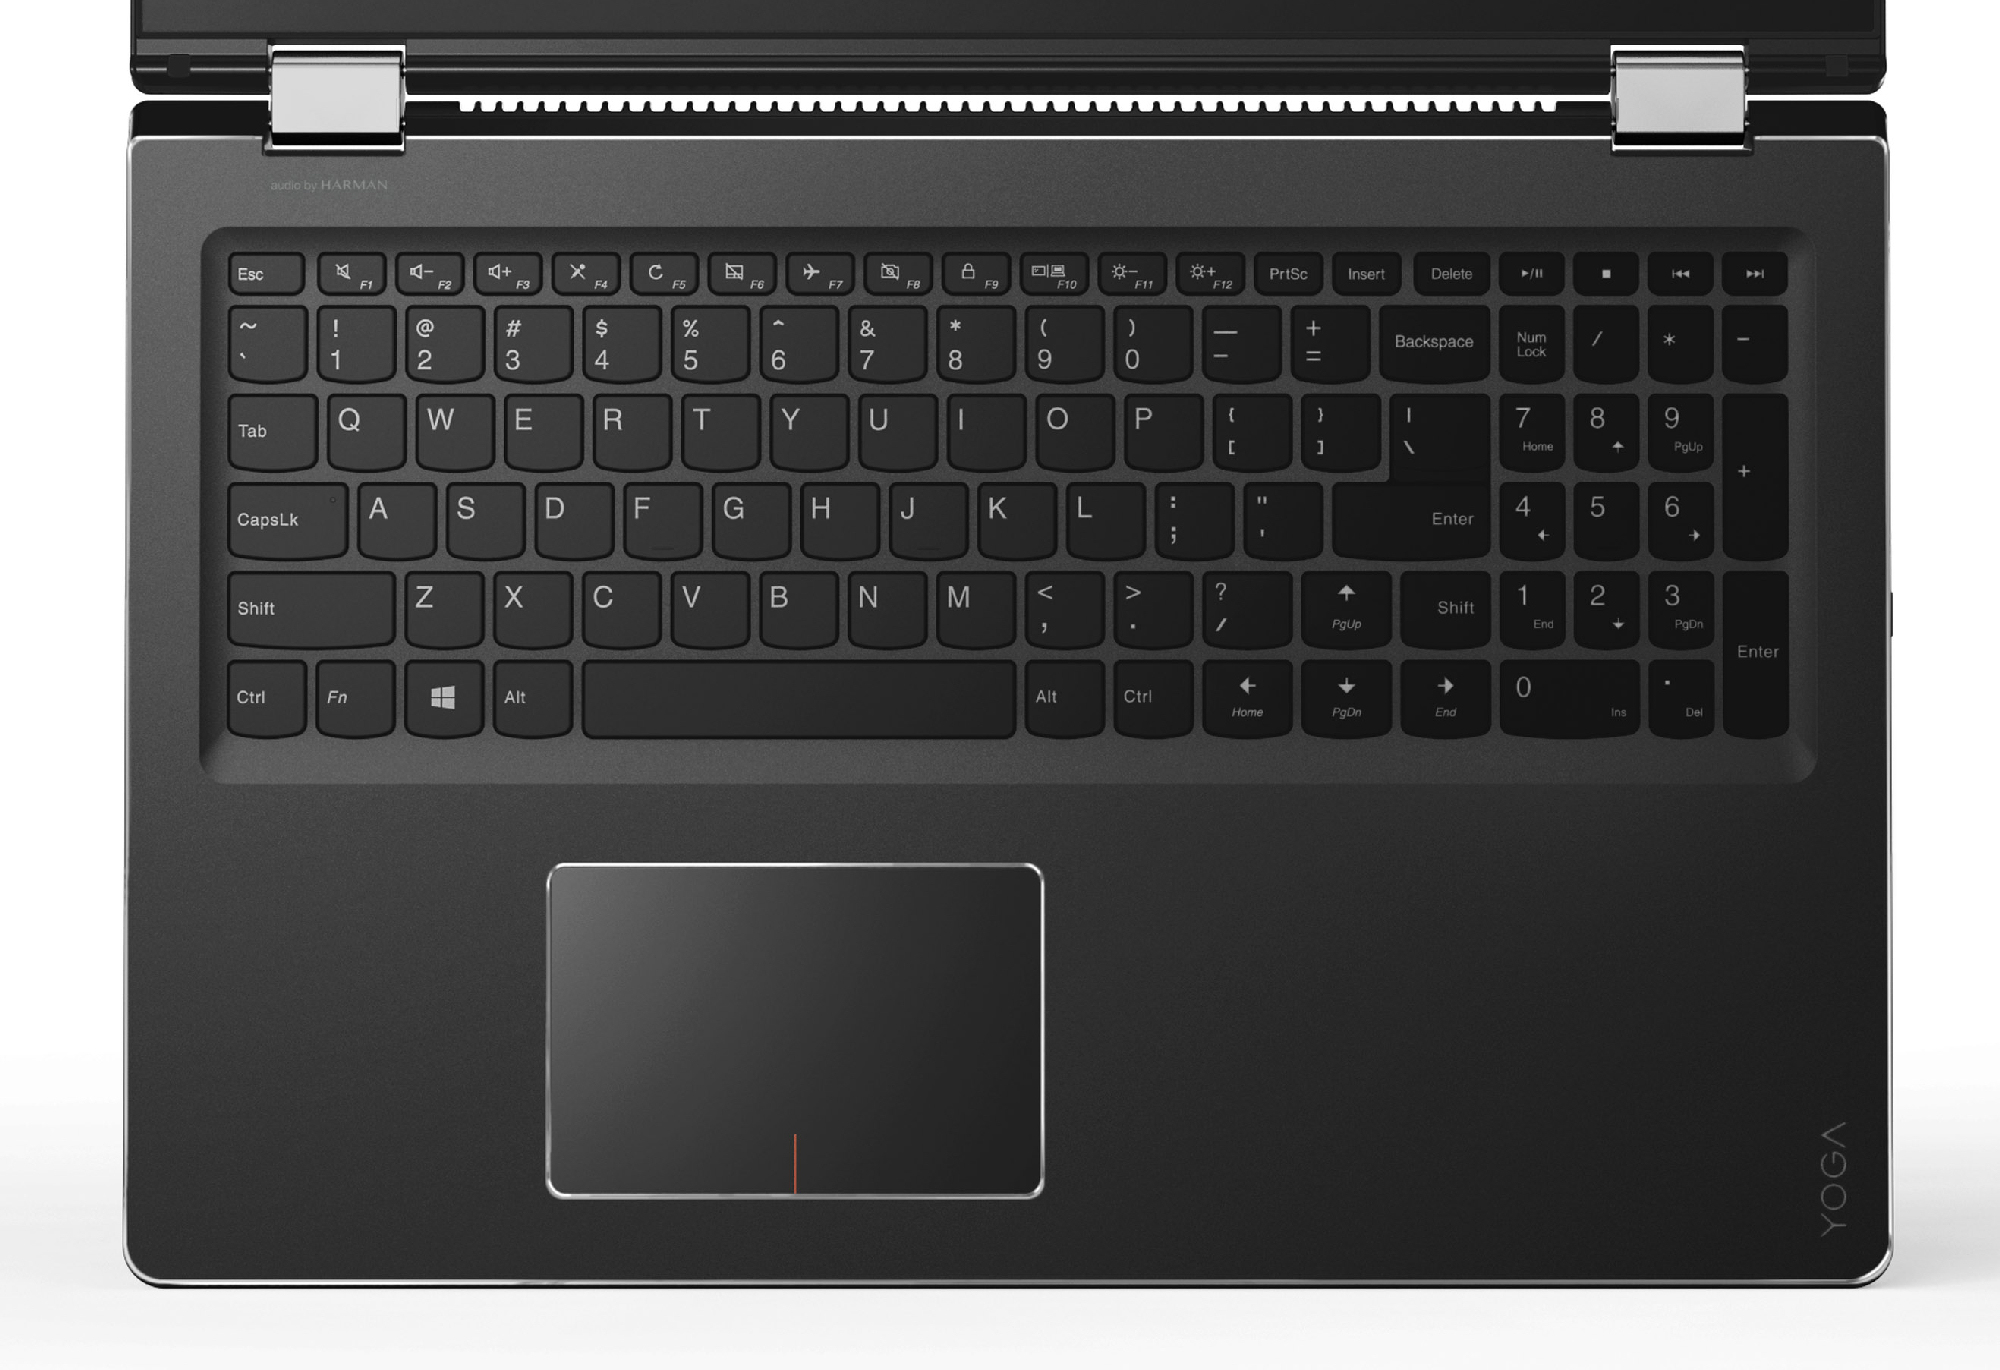
El convertible Lenovo de 15.6" trae un procesador Kaby Lake a la última que ofrece suficiente potencia de cálculo para todo tipo de usos. La GPU Radeon permite jugar limitadamente. La justificación de la GPU dedicada es dudosa ya que no es particularmente potente y puede ser un mero truco. La GPU integrada lo habría hecho igual de bien. Lo que es más, la GPU Nvidia rival ofrece claramente más rendimiento de juego por el mismo precio, en este caso casi 800 Euros.
En general, el portátil va a diario en silencio y no se calienta demasiado. El SSD garantiza un sistema rápido. Puedes configurar un modelo con más capacidad de disco, pero esto implica cambiarlo tú mismo sacando el panel inferior, ya que no hay escotilla de mantenimiento. El teclado chcilet es suficiente. El aguante de la batería es adecuado. El display Full HD IPS integrado nos agrada con su alto contraste, decentes ángulos de visión, y una reprocucción normal del color. Por desgracia, el brillo del display es demasiado bajo.
Lenovo ofrece un sólido convertible 2-en-1 de 15.6" en el Yoga 510-15IKB, si bien no está libre de defectos.
Ésta es una versión acortada del análisis original. Puedes leer el análisis completo en inglés aquí.
Lenovo Yoga 510-15IKB 80VC000XGE
- 11/09/2016 v5.1 (old)
Sascha Mölck