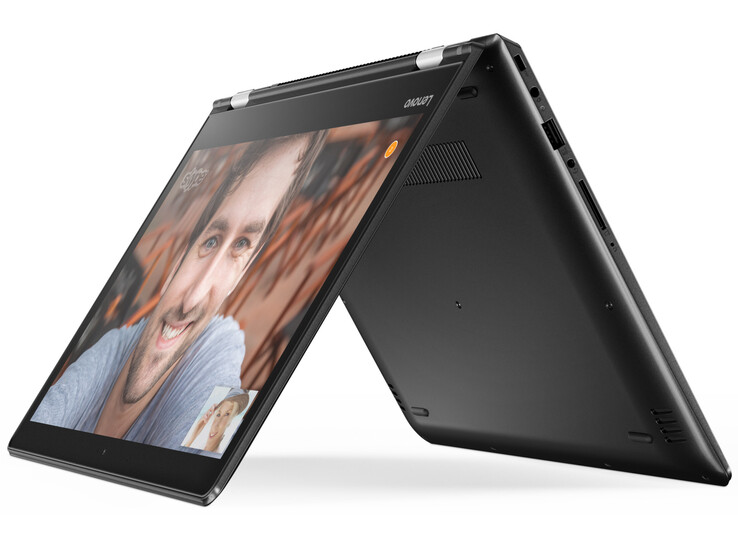
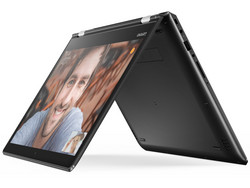
Breve análisis del Convertible Lenovo Yoga 510-14AST (A9-9410, HD)
Top 10 Análisis
» Top 10 Portátiles Multimedia
» Top 10 Portátiles de Juego
» Top 10 Portátiles de Juego ligeros
» Top 10 Portátiles Asequibles de Oficina/Empresa
» Top 10 Portátiles de Juego Ligeros
» Top 10 Portátiles de Oficina/Empresa Premium
» Top 10 Estaciones de Trabajo
» Top 10 Subportátiles
» Top 10 Ultrabooks
» Top 10 Convertibles
» Top 10 Tablets
» Top 10 Tablets Windows
» Top 10 Tablets de menos de 250 Euros
» Top 10 Phablets (>5.5")
» Top 10 Smartphones
» Top 10 Smartphones (≤5")
» Top 10 Smartphones de menos de 300 Euros
» Top 10 Smartphones de menos de 120 Euros
» Top 10 Portátiles de menos de 1000 Euros
» Top 10 Portátiles de menos de 500 Euros
» Top 10 Portátiles de menos de 300 Euros
» Los Mejores Displays de Portátiles Analizados por Notebookcheck
| SD Card Reader | |
| average JPG Copy Test (av. of 3 runs) | |
| HP Pavilion x360 13-u102ng | |
| Lenovo Yoga 510-14AST | |
| Lenovo Yoga 510-14IKB | |
| maximum AS SSD Seq Read Test (1GB) | |
| HP Pavilion x360 13-u102ng | |
| Lenovo Yoga 510-14AST | |
| Lenovo Yoga 510-14IKB | |
| Networking | |
| iperf3 transmit AX12 | |
| Acer Spin 5 SP513-51 | |
| Lenovo Yoga 510-14AST | |
| iperf3 receive AX12 | |
| Acer Spin 5 SP513-51 | |
| Lenovo Yoga 510-14AST | |
| |||||||||||||||||||||||||
iluminación: 88 %
Brillo con batería: 242 cd/m²
Contraste: 390:1 (Negro: 0.62 cd/m²)
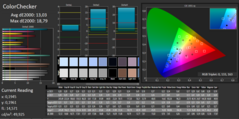
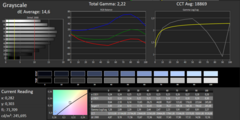
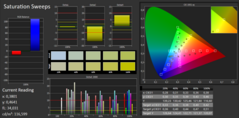
ΔE ColorChecker Calman: 13.03 | ∀{0.5-29.43 Ø4.76}
ΔE Greyscale Calman: 14.6 | ∀{0.09-98 Ø5}
52% sRGB (Argyll 1.6.3 3D)
33% AdobeRGB 1998 (Argyll 1.6.3 3D)
35.28% AdobeRGB 1998 (Argyll 3D)
51.4% sRGB (Argyll 3D)
34.15% Display P3 (Argyll 3D)
Gamma: 2.22
CCT: 18869 K
| Lenovo Yoga 510-14AST TN LED, 1366x768, 14" | Lenovo Yoga 510-14IKB IPS, 1920x1080, 14" | HP Pavilion x360 13-u102ng IPS, 1920x1080, 13.3" | Acer Spin 5 SP513-51 IPS LED, 1920x1080, 13.3" | |
|---|---|---|---|---|
| Display | 22% | 15% | 17% | |
| Display P3 Coverage (%) | 34.15 | 41.78 22% | 39.43 15% | 39.99 17% |
| sRGB Coverage (%) | 51.4 | 62.9 22% | 59.1 15% | 59.5 16% |
| AdobeRGB 1998 Coverage (%) | 35.28 | 43.17 22% | 40.76 16% | 41.32 17% |
| Response Times | -5% | 30% | 14% | |
| Response Time Grey 50% / Grey 80% * (ms) | 70 ? | 53 ? 24% | 38 ? 46% | 56 ? 20% |
| Response Time Black / White * (ms) | 29 ? | 39 ? -34% | 25 ? 14% | 27 ? 7% |
| PWM Frequency (Hz) | 350 ? | |||
| Screen | 37% | 39% | 49% | |
| Brightness middle (cd/m²) | 242 | 243 0% | 277 14% | 245 1% |
| Brightness (cd/m²) | 224 | 248 11% | 263 17% | 233 4% |
| Brightness Distribution (%) | 88 | 91 3% | 88 0% | 87 -1% |
| Black Level * (cd/m²) | 0.62 | 0.32 48% | 0.31 50% | 0.21 66% |
| Contrast (:1) | 390 | 759 95% | 894 129% | 1167 199% |
| Colorchecker dE 2000 * | 13.03 | 5.44 58% | 5.57 57% | 4.2 68% |
| Colorchecker dE 2000 max. * | 18.79 | 9.73 48% | 13.6 28% | 8.75 53% |
| Greyscale dE 2000 * | 14.6 | 4.74 68% | 4.56 69% | 3.94 73% |
| Gamma | 2.22 99% | 2.38 92% | 2.28 96% | 2.66 83% |
| CCT | 18869 34% | 7799 83% | 6648 98% | 6096 107% |
| Color Space (Percent of AdobeRGB 1998) (%) | 33 | 39.6 20% | 38 15% | 38 15% |
| Color Space (Percent of sRGB) (%) | 52 | 62.5 20% | 59 13% | 59 13% |
| Media total (Programa/Opciones) | 18% /
28% | 28% /
33% | 27% /
38% |
* ... más pequeño es mejor
Parpadeo de Pantalla / PWM (Pulse-Width Modulation)
| Parpadeo de Pantalla / PWM no detectado | ||
Comparación: 53 % de todos los dispositivos testados no usaron PWM para atenuar el display. Si se usó, medimos una media de 8013 (mínimo: 5 - máxmo: 343500) Hz. | ||
Tiempos de respuesta del display
| ↔ Tiempo de respuesta de Negro a Blanco | ||
|---|---|---|
| 29 ms ... subida ↗ y bajada ↘ combinada | ↗ 23 ms subida | |
| ↘ 6 ms bajada | ||
| La pantalla mostró tiempos de respuesta relativamente lentos en nuestros tests pero podría ser demasiado lenta para los jugones. En comparación, todos los dispositivos de prueba van de ##min### (mínimo) a 240 (máximo) ms. » 76 % de todos los dispositivos son mejores. Eso quiere decir que el tiempo de respuesta es peor que la media (20.1 ms) de todos los dispositivos testados. | ||
| ↔ Tiempo de respuesta 50% Gris a 80% Gris | ||
| 70 ms ... subida ↗ y bajada ↘ combinada | ↗ 32 ms subida | |
| ↘ 38 ms bajada | ||
| La pantalla mostró tiempos de respuesta lentos en nuestros tests y podría ser demasiado lenta para los jugones. En comparación, todos los dispositivos de prueba van de ##min### (mínimo) a 636 (máximo) ms. » 99 % de todos los dispositivos son mejores. Eso quiere decir que el tiempo de respuesta es peor que la media (31.4 ms) de todos los dispositivos testados. | ||
| Cinebench R11.5 | |
| CPU Multi 64Bit | |
| HP Pavilion x360 13-u102ng | |
| HP Pavilion x2 12-b000ng | |
| Acer Aspire ES1-332-P91H | |
| Medion Akoya S4217T MD98599 | |
| Lenovo M30-70 | |
| Lenovo Yoga 510-14AST | |
| HP 250 G5 Y1V08UT | |
| CPU Single 64Bit | |
| HP Pavilion x360 13-u102ng | |
| HP Pavilion x2 12-b000ng | |
| Lenovo Yoga 510-14AST | |
| Medion Akoya S4217T MD98599 | |
| Lenovo M30-70 | |
| Acer Aspire ES1-332-P91H | |
| HP 250 G5 Y1V08UT | |
| Geekbench 3 | |
| 32 Bit Single-Core Score | |
| HP Pavilion x360 13-u102ng | |
| HP Pavilion x2 12-b000ng | |
| Lenovo Yoga 510-14AST | |
| Lenovo B50-70 MCC2GGE | |
| Acer Aspire ES1-332-P91H | |
| 32 Bit Multi-Core Score | |
| HP Pavilion x360 13-u102ng | |
| HP Pavilion x2 12-b000ng | |
| Acer Aspire ES1-332-P91H | |
| Lenovo B50-70 MCC2GGE | |
| Lenovo Yoga 510-14AST | |
| Geekbench 4.0 | |
| 64 Bit Single-Core Score | |
| HP Pavilion x360 13-u102ng | |
| Lenovo Yoga 510-14AST | |
| Acer Aspire ES1-332-P91H | |
| 64 Bit Multi-Core Score | |
| HP Pavilion x360 13-u102ng | |
| Acer Aspire ES1-332-P91H | |
| Lenovo Yoga 510-14AST | |
| PCMark 7 Score | 3814 puntos | |
| PCMark 8 Home Score Accelerated v2 | 2670 puntos | |
| PCMark 8 Creative Score Accelerated v2 | 2898 puntos | |
| PCMark 8 Work Score Accelerated v2 | 3728 puntos | |
ayuda | ||
| PCMark 8 | |
| Home Score Accelerated v2 | |
| Lenovo Yoga 510-14IKB | |
| HP Pavilion x360 13-u102ng | |
| Acer Spin 5 SP513-51 | |
| Lenovo Yoga 510-14AST | |
| Work Score Accelerated v2 | |
| Acer Spin 5 SP513-51 | |
| HP Pavilion x360 13-u102ng | |
| Lenovo Yoga 510-14AST | |
| Lenovo Yoga 510-14AST | Lenovo Yoga 510-14IKB Samsung MZYTY256HDHP | HP Pavilion x360 13-u102ng HGST Travelstar 5K1000 HTS541010A7E630 | |
|---|---|---|---|
| CrystalDiskMark 3.0 | 61% | -87% | |
| Read Seq (MB/s) | 434.6 | 518 19% | 104.8 -76% |
| Write Seq (MB/s) | 207.7 | 476.5 129% | 91 -56% |
| Read 512 (MB/s) | 356.3 | 408 15% | 20.67 -94% |
| Write 512 (MB/s) | 195.6 | 274.5 40% | 45.05 -77% |
| Read 4k (MB/s) | 26.71 | 35.66 34% | 0.215 -99% |
| Write 4k (MB/s) | 56.8 | 106.7 88% | 1.037 -98% |
| Read 4k QD32 (MB/s) | 176.3 | 368.7 109% | 0.968 -99% |
| Write 4k QD32 (MB/s) | 163.3 | 246.3 51% | 1.09 -99% |
| 3DMark 06 Standard Score | 5141 puntos | |
| 3DMark Vantage P Result | 3346 puntos | |
| 3DMark 11 Performance | 1199 puntos | |
| 3DMark Ice Storm Standard Score | 36896 puntos | |
| 3DMark Cloud Gate Standard Score | 3010 puntos | |
| 3DMark Fire Strike Score | 712 puntos | |
| 3DMark Fire Strike Extreme Score | 344 puntos | |
| 3DMark Time Spy Score | 274 puntos | |
ayuda | ||
| 3DMark 11 - 1280x720 Performance GPU | |
| Lenovo Yoga 510-14IKB | |
| HP Pavilion x360 13-u102ng | |
| Acer Spin 5 SP513-51 | |
| Lenovo Yoga 510-14AST | |
| 3DMark | |
| 1280x720 Cloud Gate Standard Graphics | |
| HP Pavilion x360 13-u102ng | |
| Acer Spin 5 SP513-51 | |
| Lenovo Yoga 510-14IKB | |
| Lenovo Yoga 510-14AST | |
| 1920x1080 Fire Strike Graphics | |
| Lenovo Yoga 510-14IKB | |
| Lenovo Yoga 510-14AST | |
| HP Pavilion x360 13-u102ng | |
| Acer Spin 5 SP513-51 | |
| bajo | medio | alto | ultra | |
|---|---|---|---|---|
| World of Warcraft (2005) | 82.6 | 43.7 | ||
| Deus Ex Human Revolution (2011) | 62.4 | 29 | ||
| The Elder Scrolls V: Skyrim (2011) | 32.7 | 22.2 | 15.4 | |
| Diablo III (2012) | 59.6 | 41.8 | 33.6 | |
| Counter-Strike: GO (2012) | 39.2 | 28.5 | 25 | |
| Dead Space 3 (2013) | 63.9 | 31 | 26.6 | |
| Tomb Raider (2013) | 51.9 | 25.7 | 18.2 | |
| BioShock Infinite (2013) | 43.5 | 26.9 | 22.2 | |
| X-Plane 10.25 (2013) | 31.7 | 17.7 | 9.6 | |
| GRID: Autosport (2014) | 65.1 | 29.7 | ||
| Risen 3: Titan Lords (2014) | 20.9 | 12.9 | ||
| Sims 4 (2014) | 111.9 | 34.3 | ||
| Middle-earth: Shadow of Mordor (2014) | 22.3 | 13.8 | ||
| F1 2014 (2014) | 39 | 30 | ||
| Dragon Age: Inquisition (2014) | 19.3 | 14.8 | ||
| Dirt Rally (2015) | 59.7 | 22 | ||
| Metal Gear Solid V (2015) | 34.1 | 24.9 | ||
| Dota 2 Reborn (2015) | 33.1 | 23.2 | ||
| World of Warships (2015) | 37.7 | 28.8 | ||
| Rainbow Six Siege (2015) | 26.9 | 21.6 | ||
| Rise of the Tomb Raider (2016) | 16.1 | 10.4 | ||
| The Division (2016) | 18.2 | 11.3 | ||
| Civilization 6 (2016) | 29.4 | 12.1 | ||
| Farming Simulator 17 (2016) | 53.4 | 36.1 | ||
| Resident Evil 7 (2017) | 28.6 | 13.2 | ||
| For Honor (2017) | 19.9 | 7.3 | ||
| Ghost Recon Wildlands (2017) | 10.9 | 5.2 |
| BioShock Infinite - 1280x720 Very Low Preset | |
| Lenovo Yoga 510-14AST | |
| Acer Spin 5 SP513-51 | |
| Lenovo Yoga 510-14IKB | |
| HP Pavilion x360 13-u102ng | |
| Acer Aspire ES1-332-P91H | |
| Tomb Raider - 1024x768 Low Preset | |
| HP Pavilion x360 13-u102ng | |
| Lenovo Yoga 510-14AST | |
| Acer Aspire ES1-332-P91H | |
| GRID: Autosport - 1024x768 Ultra Low Preset | |
| Lenovo Yoga 510-14AST | |
| Acer Aspire ES1-332-P91H | |
Ruido
| Ocioso |
| 30.4 / 30.4 / 30.4 dB(A) |
| Carga |
| 31.3 / 33.3 dB(A) |
 | ||
30 dB silencioso 40 dB(A) audible 50 dB(A) ruidosamente alto |
||
min: | ||
| Lenovo Yoga 510-14AST A9-9410, Radeon R5 (Stoney Ridge) | Lenovo Yoga 510-14IKB i5-7200U, Radeon R5 M430 | HP Pavilion x360 13-u102ng i5-7200U, HD Graphics 620 | Acer Spin 5 SP513-51 6100U, HD Graphics 520 | |
|---|---|---|---|---|
| Noise | -5% | -5% | -2% | |
| apagado / medio ambiente * (dB) | 30.4 | 29 5% | 30.5 -0% | 30.5 -0% |
| Idle Minimum * (dB) | 30.4 | 29 5% | 31.3 -3% | 30.5 -0% |
| Idle Average * (dB) | 30.4 | 29 5% | 31.3 -3% | 30.5 -0% |
| Idle Maximum * (dB) | 30.4 | 29 5% | 31.6 -4% | 30.6 -1% |
| Load Average * (dB) | 31.3 | 37.3 -19% | 34.2 -9% | 31 1% |
| Load Maximum * (dB) | 33.3 | 43.1 -29% | 37.3 -12% | 36.8 -11% |
* ... más pequeño es mejor
(+) La temperatura máxima en la parte superior es de 34.5 °C / 94 F, frente a la media de 35.3 °C / 96 F, que oscila entre 19.6 y 60 °C para la clase Convertible.
(+) El fondo se calienta hasta un máximo de 39 °C / 102 F, frente a la media de 36.8 °C / 98 F
(+) En reposo, la temperatura media de la parte superior es de 27.1 °C / 81# F, frente a la media del dispositivo de 30.3 °C / 87 F.
(+) El reposamanos y el panel táctil están a una temperatura inferior a la de la piel, con un máximo de 26.3 °C / 79.3 F y, por tanto, son fríos al tacto.
(±) La temperatura media de la zona del reposamanos de dispositivos similares fue de 27.9 °C / 82.2 F (+1.6 °C / 2.9 F).
| Lenovo Yoga 510-14AST A9-9410, Radeon R5 (Stoney Ridge) | Lenovo Yoga 510-14IKB i5-7200U, Radeon R5 M430 | HP Pavilion x360 13-u102ng i5-7200U, HD Graphics 620 | Acer Spin 5 SP513-51 6100U, HD Graphics 520 | |
|---|---|---|---|---|
| Heat | -6% | 10% | -0% | |
| Maximum Upper Side * (°C) | 34.5 | 40.1 -16% | 34.6 -0% | 38.3 -11% |
| Maximum Bottom * (°C) | 39 | 46.1 -18% | 36.4 7% | 42.5 -9% |
| Idle Upper Side * (°C) | 30.8 | 28.5 7% | 26.6 14% | 28.7 7% |
| Idle Bottom * (°C) | 33.4 | 31.6 5% | 27.7 17% | 29.4 12% |
* ... más pequeño es mejor
Lenovo Yoga 510-14AST análisis de audio
(-) | altavoces no muy altos (#65 dB)
Graves 100 - 315 Hz
(-) | casi sin bajos - de media 24.3% inferior a la mediana
(±) | la linealidad de los graves es media (11.4% delta a frecuencia anterior)
Medios 400 - 2000 Hz
(+) | medios equilibrados - a sólo 2.6% de la mediana
(±) | la linealidad de los medios es media (8.2% delta respecto a la frecuencia anterior)
Altos 2 - 16 kHz
(+) | máximos equilibrados - a sólo 2.1% de la mediana
(±) | la linealidad de los máximos es media (8.1% delta a frecuencia anterior)
Total 100 - 16.000 Hz
(±) | la linealidad del sonido global es media (21.8% de diferencia con la mediana)
En comparación con la misma clase
» 61% de todos los dispositivos probados de esta clase eran mejores, 8% similares, 31% peores
» El mejor tuvo un delta de 6%, la media fue 20%, el peor fue ###max##%
En comparación con todos los dispositivos probados
» 62% de todos los dispositivos probados eran mejores, 7% similares, 31% peores
» El mejor tuvo un delta de 4%, la media fue 24%, el peor fue ###max##%
Apple MacBook 12 (Early 2016) 1.1 GHz análisis de audio
(+) | los altavoces pueden reproducir a un volumen relativamente alto (#83.6 dB)
Graves 100 - 315 Hz
(±) | lubina reducida - en promedio 11.3% inferior a la mediana
(±) | la linealidad de los graves es media (14.2% delta a frecuencia anterior)
Medios 400 - 2000 Hz
(+) | medios equilibrados - a sólo 2.4% de la mediana
(+) | los medios son lineales (5.5% delta a la frecuencia anterior)
Altos 2 - 16 kHz
(+) | máximos equilibrados - a sólo 2% de la mediana
(+) | los máximos son lineales (4.5% delta a la frecuencia anterior)
Total 100 - 16.000 Hz
(+) | el sonido global es lineal (10.2% de diferencia con la mediana)
En comparación con la misma clase
» 7% de todos los dispositivos probados de esta clase eran mejores, 2% similares, 91% peores
» El mejor tuvo un delta de 5%, la media fue 18%, el peor fue ###max##%
En comparación con todos los dispositivos probados
» 4% de todos los dispositivos probados eran mejores, 1% similares, 94% peores
» El mejor tuvo un delta de 4%, la media fue 24%, el peor fue ###max##%
| Off / Standby | |
| Ocioso | |
| Carga |
|
Clave:
min: | |
| Lenovo Yoga 510-14AST A9-9410, Radeon R5 (Stoney Ridge) | Lenovo Yoga 510-14IKB i5-7200U, Radeon R5 M430 | HP Pavilion x360 13-u102ng i5-7200U, HD Graphics 620 | Acer Spin 5 SP513-51 6100U, HD Graphics 520 | |
|---|---|---|---|---|
| Power Consumption | -40% | -17% | -1% | |
| Idle Minimum * (Watt) | 3.9 | 3.9 -0% | 4.7 -21% | 4.1 -5% |
| Idle Average * (Watt) | 7.4 | 7.1 4% | 7.2 3% | 6.8 8% |
| Idle Maximum * (Watt) | 9.4 | 7.7 18% | 7.9 16% | 7.9 16% |
| Load Average * (Watt) | 19.2 | 33.4 -74% | 30 -56% | 20.4 -6% |
| Load Maximum * (Watt) | 22.5 | 55.9 -148% | 29 -29% | 26.8 -19% |
* ... más pequeño es mejor
| Lenovo Yoga 510-14AST A9-9410, Radeon R5 (Stoney Ridge), 35 Wh | Lenovo Yoga 510-14IKB i5-7200U, Radeon R5 M430, 35 Wh | HP Pavilion x360 13-u102ng i5-7200U, HD Graphics 620, 41 Wh | Acer Spin 5 SP513-51 6100U, HD Graphics 520, 45 Wh | |
|---|---|---|---|---|
| Duración de Batería | -4% | -14% | 16% | |
| Reader / Idle (h) | 14.1 | 12 -15% | 9.3 -34% | 12.5 -11% |
| H.264 (h) | 5.1 | 5.3 4% | ||
| WiFi v1.3 (h) | 5.4 | 6.2 15% | 5.4 0% | 7.7 43% |
| Load (h) | 1.9 | 1.7 -11% | 1.4 -26% | 2.2 16% |
Pro
Contra
Con el Yoga 510-14AST, Lenovo ofrece la versión asequible del Yoga 510-15IKB que hemos testado ya. Costando unos 500 Euros, el Yoga 510-14AST es unos buenos 400 Euros más barato que el modelo hermano que testamos. La nueva APU Stoney Bridge causó una buena impresión: La CPU tiene potencia suficiente para el uso previsto (oficina, Internet), y la GPU compite con la Intel HD Graphics 520 y renderiza fluidamente algún juego que otro.
El Yoga sigue quedo toda la carga y se calienta moderadamente como mucho. Un SSD asegura un sistema veloz. Los usuarios que necesiten más capacidad de almacenamiento de los 128 GB del SSD pueden cambiarlo por un modelo de más capacidad. Hay que sacar la bandeja inferior del portátil para ello. El teclado instalado es atractivo en general, e incluso permite sesiones de mecanografiado frecuentes. El aguante de batería es corto.
La pantalla es decepcionante. Los responsables de Lenovo parecen creer que un panel TN dependiente del ángulo de visión es una buena elección para un convertible.
Lo que es más, encima es un modelo oscuro de poco contraste que sólo ofrece una mala reproducción de color de fábrica. Lenovo disminuye el atractivo del dispositivo considerablemente con esta pantalla. Una pena ya que Lenovo ha creado un dispositivo realmente redondo que podría haber encontrado compradores. Aparentemente no se puede elegir otro modelo. Todas las versiones del 14AST disponibles a fecha de prueba venían con esta pantalla inferior - incomprensible.
Los usuarios que quieran un panel de ángulo de visión estable tendrá que optar por un modelo Intel Yoga. El Yoga 510-14IKB 80VB0081GE cuesta 50 Euros más y trae un procesador Core i3-7100U mucho más potente y una pantalla Full HD IPS de ángulo de visión estable. Por ello casi no hay motivos para elegir el modelo AMD.
Ésta es una versión acortada del análisis original. Puedes leer el análisis completo en inglés aquí.
Lenovo Yoga 510-14AST
- 03/23/2017 v6 (old)
Sascha Mölck


