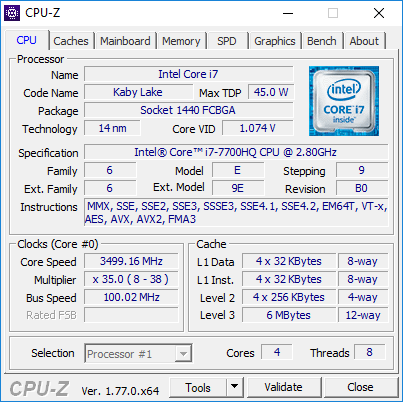
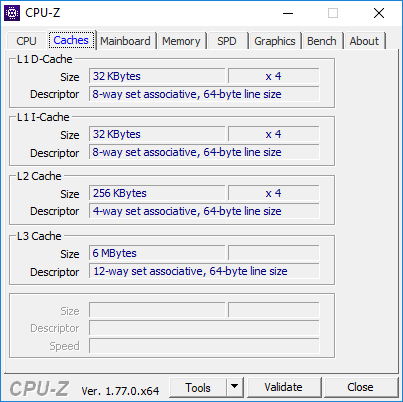
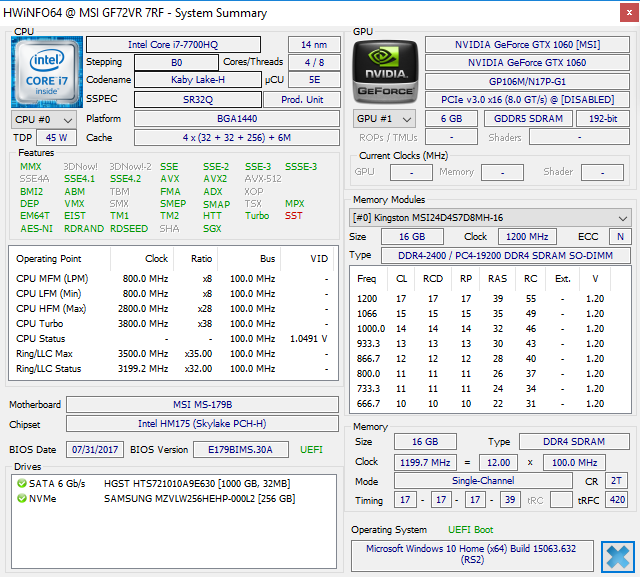
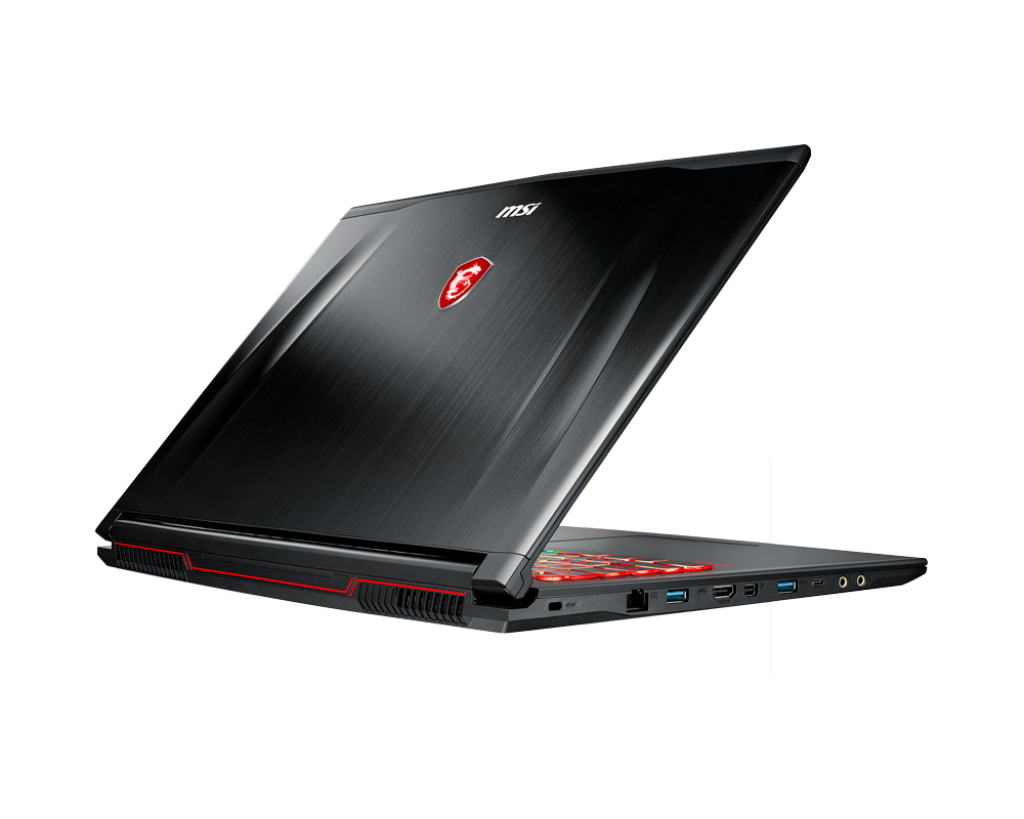
Breve análisis del MSI GF72VR 7RF (7700HQ, GTX 1060, 120 Hz)
| |||||||||||||||||||||||||
iluminación: 92 %
Brillo con batería: 329.2 cd/m²
Contraste: 823:1 (Negro: 0.4 cd/m²)
ΔE ColorChecker Calman: 6.4 | ∀{0.5-29.43 Ø4.72}
ΔE Greyscale Calman: 9.2 | ∀{0.09-98 Ø4.97}
92% sRGB (Argyll 1.6.3 3D)
76% AdobeRGB 1998 (Argyll 1.6.3 3D)
85.6% AdobeRGB 1998 (Argyll 3D)
99.8% sRGB (Argyll 3D)
90.8% Display P3 (Argyll 3D)
Gamma: 2.18
CCT: 10484 K
| MSI GF72VR 7RF Chi Mei CMN1747, TN LED, 17.3", 1920x1080 | MSI GE72VR-6RF16H21 N173HHE-G32 (CMN1747), TN LED, 17.3", 1920x1080 | MSI GS73VR 7RF AU Optronics AUO109B, IPS, 17.3", 3840x2160 | Asus GL702VM-GC102D LG Philips LP173WF4-SPF3, IPS, 17.3", 1920x1080 | Acer Aspire 7 A717-71G-72VY LG Philips LGD056D / LP173WF4-SPF5, IPS, 17.3", 1920x1080 | Acer Aspire V17 Nitro BE VN7-793-738J AU Optronics B173ZAN01.0, IPS, 17.3", 3840x2160 | HP Omen 17-w100ng LG Philips LGD046E, IPS, 17.3", 1920x1080 | Nexoc G739 CMN1738, IPS, 17.3", 1920x1080 | Asus Strix GL702VSK AU Optronics AUO119D, IPS, 17.3", 1920x1080 | |
|---|---|---|---|---|---|---|---|---|---|
| Display | -1% | -18% | -24% | -23% | 3% | -22% | -19% | -24% | |
| Display P3 Coverage (%) | 90.8 | 90.2 -1% | 64.2 -29% | 65.1 -28% | 66.2 -27% | 85.4 -6% | 67.2 -26% | 66.7 -27% | 61.3 -32% |
| sRGB Coverage (%) | 99.8 | 99.8 0% | 96.8 -3% | 83.5 -16% | 85.2 -15% | 100 0% | 86.6 -13% | 91 -9% | 86.7 -13% |
| AdobeRGB 1998 Coverage (%) | 85.6 | 83.9 -2% | 66.4 -22% | 61.1 -29% | 62.3 -27% | 97.8 14% | 63.3 -26% | 66.4 -22% | 62.3 -27% |
| Response Times | 11% | -81% | -70% | -83% | -67% | -71% | -103% | -47% | |
| Response Time Grey 50% / Grey 80% * (ms) | 24.4 ? | 28 ? -15% | 38 ? -56% | 38 ? -56% | 41 ? -68% | 29 ? -19% | 35 ? -43% | 45 ? -84% | 21.2 ? 13% |
| Response Time Black / White * (ms) | 12.6 ? | 8 ? 37% | 26 ? -106% | 23 ? -83% | 25 ? -98% | 27 ? -114% | 25 ? -98% | 28 ? -122% | 26 ? -106% |
| PWM Frequency (Hz) | 25000 ? | 125000 ? | 450 ? | ||||||
| Screen | 18% | 11% | -7% | 1% | 20% | 13% | 19% | 22% | |
| Brightness middle (cd/m²) | 329.2 | 270 -18% | 371.1 13% | 326 -1% | 382 16% | 380 15% | 342 4% | 312 -5% | 316.5 -4% |
| Brightness (cd/m²) | 318 | 254 -20% | 343 8% | 312 -2% | 357 12% | 336 6% | 331 4% | 304 -4% | 306 -4% |
| Brightness Distribution (%) | 92 | 86 -7% | 86 -7% | 91 -1% | 86 -7% | 81 -12% | 84 -9% | 85 -8% | 93 1% |
| Black Level * (cd/m²) | 0.4 | 0.26 35% | 0.42 -5% | 0.5 -25% | 0.38 5% | 0.32 20% | 0.32 20% | 0.23 43% | 0.21 48% |
| Contrast (:1) | 823 | 1038 26% | 884 7% | 652 -21% | 1005 22% | 1188 44% | 1069 30% | 1357 65% | 1507 83% |
| Colorchecker dE 2000 * | 6.4 | 3.33 48% | 4.5 30% | 6.3 2% | 6.9 -8% | 5.32 17% | 4.35 32% | 4.19 35% | 4.2 34% |
| Colorchecker dE 2000 max. * | 11.7 | 6.07 48% | 9.7 17% | 11.69 -0% | 13.14 -12% | 7.63 35% | 9.24 21% | 8.7 26% | 7.1 39% |
| Greyscale dE 2000 * | 9.2 | 3.46 62% | 3.1 66% | 7.37 20% | 8.22 11% | 4.9 47% | 3.73 59% | 3.72 60% | 3.9 58% |
| Gamma | 2.18 101% | 2.13 103% | 2.17 101% | 2.37 93% | 2.39 92% | 2.61 84% | 2.23 99% | 2.29 96% | 2.19 100% |
| CCT | 10484 62% | 7419 88% | 7120 91% | 7116 91% | 7580 86% | 6558 99% | 6801 96% | 7104 91% | 7242 90% |
| Color Space (Percent of AdobeRGB 1998) (%) | 76 | 75 -1% | 61 -20% | 55 -28% | 56 -26% | 87.2 15% | 57 -25% | 59 -22% | 56 -26% |
| Color Space (Percent of sRGB) (%) | 92 | 100 9% | 97 5% | 83 -10% | 85 -8% | 100 9% | 86 -7% | 91 -1% | 86 -7% |
| Media total (Programa/Opciones) | 9% /
13% | -29% /
-7% | -34% /
-19% | -35% /
-15% | -15% /
5% | -27% /
-5% | -34% /
-5% | -16% /
4% |
* ... más pequeño es mejor
Tiempos de respuesta del display
| ↔ Tiempo de respuesta de Negro a Blanco | ||
|---|---|---|
| 12.6 ms ... subida ↗ y bajada ↘ combinada | ↗ 11.2 ms subida | 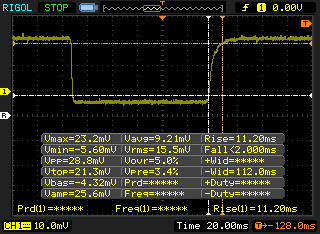 |
| ↘ 1.4 ms bajada | ||
| La pantalla mostró buenos tiempos de respuesta en nuestros tests pero podría ser demasiado lenta para los jugones competitivos. En comparación, todos los dispositivos de prueba van de ##min### (mínimo) a 240 (máximo) ms. » 33 % de todos los dispositivos son mejores. Esto quiere decir que el tiempo de respuesta medido es mejor que la media (19.9 ms) de todos los dispositivos testados. | ||
| ↔ Tiempo de respuesta 50% Gris a 80% Gris | ||
| 24.4 ms ... subida ↗ y bajada ↘ combinada | ↗ 15.2 ms subida | 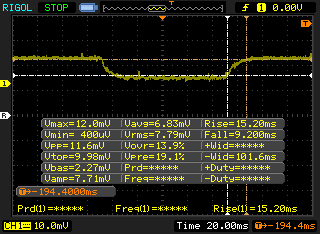 |
| ↘ 9.2 ms bajada | ||
| La pantalla mostró buenos tiempos de respuesta en nuestros tests pero podría ser demasiado lenta para los jugones competitivos. En comparación, todos los dispositivos de prueba van de ##min### (mínimo) a 636 (máximo) ms. » 35 % de todos los dispositivos son mejores. Esto quiere decir que el tiempo de respuesta medido es mejor que la media (31.1 ms) de todos los dispositivos testados. | ||
Parpadeo de Pantalla / PWM (Pulse-Width Modulation)
| Parpadeo de Pantalla / PWM detectado | 25000 Hz | ≤ 20 % de brillo | 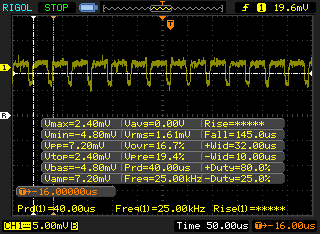 |
La retroiluminación del display parpadea a 25000 Hz (seguramente usa PWM - Pulse-Width Modulation) a un brillo del 20 % e inferior. Sobre este nivel de brillo no debería darse parpadeo / PWM. La frecuencia de 25000 Hz es bastante alta, por lo que la mayoría de gente sensible al parpadeo no debería ver parpadeo o tener fatiga visual. Comparación: 52 % de todos los dispositivos testados no usaron PWM para atenuar el display. Si se usó, medimos una media de 7784 (mínimo: 5 - máxmo: 343500) Hz. | |||
| Cinebench R10 | |
| Rendering Multiple CPUs 32Bit | |
| MSI GF72VR 7RF | |
| Acer Aspire V17 Nitro BE VN7-793-738J | |
| Asus Strix GL702VSK | |
| Asus GL702VM-GC102D | |
| MSI GE72VR-6RF16H21 | |
| HP Omen 17-w100ng | |
| Rendering Single 32Bit | |
| MSI GF72VR 7RF | |
| Acer Aspire V17 Nitro BE VN7-793-738J | |
| Asus Strix GL702VSK | |
| Asus GL702VM-GC102D | |
| HP Omen 17-w100ng | |
| MSI GE72VR-6RF16H21 | |
| wPrime 2.10 - 1024m | |
| MSI GS73VR 7RF | |
| Asus Strix GL702VSK | |
* ... más pequeño es mejor
| PCMark 8 Home Score Accelerated v2 | 4002 puntos | |
| PCMark 8 Creative Score Accelerated v2 | 5117 puntos | |
| PCMark 8 Work Score Accelerated v2 | 5015 puntos | |
| PCMark 10 Score | 4456 puntos | |
ayuda | ||
| MSI GF72VR 7RF Samsung PM961 MZVLW256HEHP | MSI GE72VR-6RF16H21 Toshiba HG6 THNSNJ256G8NY | MSI GS73VR 7RF Samsung SM961 MZVKW512HMJP m.2 PCI-e | Acer Aspire V17 Nitro BE VN7-793-738J Intel SSD 600p SSDPEKKW512G7 | HP Omen 17-w100ng SanDisk Z400s SD8SNAT-128G | Nexoc G739 Samsung PM961 MZVLW256HEHP | |
|---|---|---|---|---|---|---|
| AS SSD | -77% | -743% | -24% | -113% | 15% | |
| Copy Game MB/s (MB/s) | 361.5 | 816 | 159.8 | 1084 | ||
| Copy Program MB/s (MB/s) | 193.4 | 336 | 80.6 | 474 | ||
| Copy ISO MB/s (MB/s) | 392.9 | 1092 | 233.4 | 1613 | ||
| Score Total (Points) | 2635 | 826 -69% | 1852 -30% | 1678 -36% | 537 -80% | 3031 15% |
| Score Write (Points) | 575 | 249 -57% | 104 -82% | 677 18% | 236 -59% | 651 13% |
| Score Read (Points) | 1405 | 380 -73% | 1232 -12% | 692 -51% | 206 -85% | 1619 15% |
| Access Time Write * (ms) | 0.03 | 0.044 -47% | 2.38 -7833% | 0.035 -17% | 0.162 -440% | 0.023 23% |
| Access Time Read * (ms) | 0.053 | 0.177 -234% | 0.04 25% | 0.075 -42% | 0.14 -164% | 0.042 21% |
| 4K-64 Write (MB/s) | 359.7 | 132.7 -63% | 67.9 -81% | 516 43% | 155 -57% | 386.2 7% |
| 4K-64 Read (MB/s) | 1122 | 310.9 -72% | 901 -20% | 503 -55% | 137.4 -88% | 1309 17% |
| 4K Write (MB/s) | 126.1 | 72.4 -43% | 1.6 -99% | 104.8 -17% | 64.2 -49% | 148.5 18% |
| 4K Read (MB/s) | 48.49 | 19.64 -59% | 47.9 -1% | 29.75 -39% | 17.76 -63% | 47.68 -2% |
| Seq Write (MB/s) | 897 | 444 -51% | 349.6 -61% | 566 -37% | 166.7 -81% | 1164 30% |
| Seq Read (MB/s) | 2337 | 491.4 -79% | 2826 21% | 1590 -32% | 507 -78% | 2628 12% |
* ... más pequeño es mejor

| 3DMark | |
| 1280x720 Cloud Gate Standard Graphics | |
| Asus GL702VM-GC102D | |
| HP Omen 17-w100ng | |
| MSI GF72VR 7RF | |
| Asus Strix GL702VSK | |
| Acer Aspire 7 A717-71G-72VY | |
| MSI GE72VR-6RF16H21 | |
| Nexoc G739 | |
| MSI GS73VR 7RF | |
| 1920x1080 Fire Strike Graphics | |
| Asus Strix GL702VSK | |
| MSI GE72VR-6RF16H21 | |
| Acer Aspire V17 Nitro BE VN7-793-738J | |
| Acer Aspire 7 A717-71G-72VY | |
| MSI GS73VR 7RF | |
| HP Omen 17-w100ng | |
| Asus GL702VM-GC102D | |
| MSI GF72VR 7RF | |
| Nexoc G739 | |
| 1920x1080 Ice Storm Extreme Graphics | |
| Asus GL702VM-GC102D | |
| HP Omen 17-w100ng | |
| MSI GF72VR 7RF | |
| Asus Strix GL702VSK | |
| MSI GE72VR-6RF16H21 | |
| MSI GS73VR 7RF | |
| 3DMark 06 Standard Score | 25625 puntos | |
| 3DMark 11 Performance | 11656 puntos | |
| 3DMark Ice Storm Standard Score | 105718 puntos | |
| 3DMark Cloud Gate Standard Score | 24325 puntos | |
| 3DMark Fire Strike Score | 9356 puntos | |
| 3DMark Fire Strike Extreme Score | 4905 puntos | |
ayuda | ||
| The Witcher 3 - 1920x1080 Ultra Graphics & Postprocessing (HBAO+) (ordenar por valor) | |
| MSI GF72VR 7RF | |
| MSI GE72VR-6RF16H21 | |
| MSI GS73VR 7RF | |
| Acer Aspire 7 A717-71G-72VY | |
| Nexoc G739 | |
| Asus Strix GL702VSK | |
| Rocket League - 1920x1080 High Quality AA:High FX (ordenar por valor) | |
| MSI GF72VR 7RF | |
| Acer Aspire V17 Nitro BE VN7-793-738J | |
| Dirt 4 - 1920x1080 Ultra Preset AA:4xMS AF:16x (ordenar por valor) | |
| MSI GF72VR 7RF | |
| Acer Aspire V17 Nitro BE VN7-793-738J | |
| F1 2017 - 1920x1080 Ultra High Preset AA:T AF:16x (ordenar por valor) | |
| MSI GF72VR 7RF | |
| Ark Survival Evolved - 1920x1080 Epic Preset (100 % Resolution Scale) (ordenar por valor) | |
| MSI GF72VR 7RF | |
| Metro: Last Light - 1920x1080 Very High (DX11) AF:16x (ordenar por valor) | |
| MSI GF72VR 7RF | |
| MSI GS73VR 7RF | |
| Asus Strix GL702VSK | |
| Batman: Arkham Knight - 1920x1080 High / On AA:SM AF:16x (ordenar por valor) | |
| MSI GF72VR 7RF | |
| Ashes of the Singularity - 1920x1080 high (ordenar por valor) | |
| MSI GF72VR 7RF | |
| MSI GS73VR 7RF | |
| Asus GL702VM-GC102D | |
| Asus Strix GL702VSK | |
| BioShock Infinite - 1920x1080 Ultra Preset, DX11 (DDOF) (ordenar por valor) | |
| MSI GF72VR 7RF | |
| MSI GE72VR-6RF16H21 | |
| MSI GS73VR 7RF | |
| Asus GL702VM-GC102D | |
| Acer Aspire V17 Nitro BE VN7-793-738J | |
| HP Omen 17-w100ng | |
| Nexoc G739 | |
| Asus Strix GL702VSK | |
| Thief - 1920x1080 Very High Preset AA:FXAA & High SS AF:8x (ordenar por valor) | |
| MSI GF72VR 7RF | |
| MSI GS73VR 7RF | |
| Asus Strix GL702VSK | |
| Fallout 4 - 1920x1080 Ultra Preset AA:T AF:16x (ordenar por valor) | |
| MSI GF72VR 7RF | |
| MSI GS73VR 7RF | |
| Asus Strix GL702VSK | |
| Hitman 2016 - 1920x1080 Ultra / On AA:SM AF:16x (ordenar por valor) | |
| MSI GF72VR 7RF | |
| MSI GS73VR 7RF | |
| bajo | medio | alto | ultra | |
|---|---|---|---|---|
| BioShock Infinite (2013) | 82 | |||
| Metro: Last Light (2013) | 71 | |||
| Thief (2014) | 67 | |||
| The Witcher 3 (2015) | 37 | |||
| Batman: Arkham Knight (2015) | 53 | |||
| Fallout 4 (2015) | 66 | |||
| Hitman 2016 (2016) | 46 | |||
| Ashes of the Singularity (2016) | 43 | |||
| Rocket League (2017) | 181 | |||
| Dirt 4 (2017) | 67 | |||
| F1 2017 (2017) | 76 | |||
| Ark Survival Evolved (2017) | 30 |
Ruido
| Ocioso |
| 31.4 / 31.4 / 32.6 dB(A) |
| Carga |
| 39.4 / 52 dB(A) |
 | ||
30 dB silencioso 40 dB(A) audible 50 dB(A) ruidosamente alto |
||
min: | ||
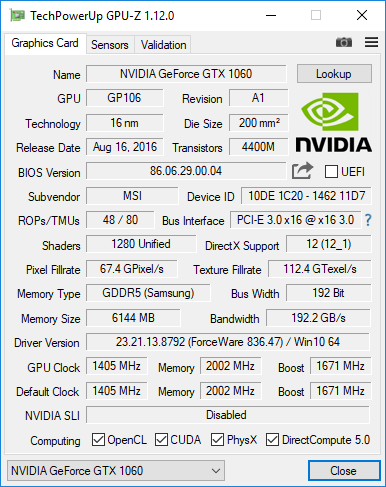
| MSI GF72VR 7RF GeForce GTX 1060 Mobile, i7-7700HQ, Samsung PM961 MZVLW256HEHP | MSI GE72VR-6RF16H21 GeForce GTX 1060 Mobile, 6700HQ, Toshiba HG6 THNSNJ256G8NY | MSI GS73VR 7RF GeForce GTX 1060 Mobile, i7-7700HQ, Samsung SM961 MZVKW512HMJP m.2 PCI-e | Asus GL702VM-GC102D GeForce GTX 1060 Mobile, 6700HQ, HGST Travelstar 7K1000 HTS721010A9E630 | Acer Aspire 7 A717-71G-72VY GeForce GTX 1060 Mobile, i7-7700HQ, Toshiba MQ01ABD100 | Acer Aspire V17 Nitro BE VN7-793-738J GeForce GTX 1060 Mobile, i7-7700HQ, Intel SSD 600p SSDPEKKW512G7 | HP Omen 17-w100ng GeForce GTX 1060 Mobile, 6300HQ, SanDisk Z400s SD8SNAT-128G | Nexoc G739 GeForce GTX 1050 Ti Mobile, i7-7700HQ, Samsung PM961 MZVLW256HEHP | Asus Strix GL702VSK GeForce GTX 1070 Mobile, i7-7700HQ, HGST Travelstar 7K1000 HTS721010A9E630 | |
|---|---|---|---|---|---|---|---|---|---|
| Noise | -7% | 2% | 0% | 5% | 2% | -11% | -6% | 3% | |
| apagado / medio ambiente * (dB) | 28.1 | 31 -10% | 28.1 -0% | 30.5 -9% | 30.1 -7% | 30.8 -10% | 31 -10% | 30 -7% | 28.6 -2% |
| Idle Minimum * (dB) | 31.4 | 34 -8% | 30.8 2% | 31.4 -0% | 31.4 -0% | 31.4 -0% | 35 -11% | 31 1% | 30.6 3% |
| Idle Average * (dB) | 31.4 | 35 -11% | 30.8 2% | 31.4 -0% | 31.4 -0% | 31.4 -0% | 36 -15% | 32 -2% | 30.6 3% |
| Idle Maximum * (dB) | 32.6 | 36 -10% | 30.9 5% | 31.5 3% | 31.7 3% | 31.4 4% | 37 -13% | 38 -17% | 30.6 6% |
| Load Average * (dB) | 39.4 | 40 -2% | 42.2 -7% | 40.9 -4% | 35.2 11% | 38.6 2% | 44 -12% | 44 -12% | 39.8 -1% |
| Witcher 3 ultra * (dB) | 45.3 | 44.4 2% | 39.9 12% | ||||||
| Load Maximum * (dB) | 52 | 51 2% | 48.6 7% | 46.2 11% | 43.5 16% | 44.3 15% | 54 -4% | 50 4% | 48 8% |
* ... más pequeño es mejor
(-) La temperatura máxima en la parte superior es de 52.2 °C / 126 F, frente a la media de 40.4 °C / 105 F, que oscila entre 21.2 y 68.8 °C para la clase Gaming.
(-) El fondo se calienta hasta un máximo de 50 °C / 122 F, frente a la media de 43.2 °C / 110 F
(+) En reposo, la temperatura media de la parte superior es de 28.6 °C / 83# F, frente a la media del dispositivo de 33.9 °C / 93 F.
(+) Jugando a The Witcher 3, la temperatura media de la parte superior es de 31.8 °C / 89 F, frente a la media del dispositivo de 33.9 °C / 93 F.
(-) El reposamanos y el touchpad pueden calentarse mucho al tacto con un máximo de 43 °C / 109.4 F.
(-) La temperatura media de la zona del reposamanos de dispositivos similares fue de 28.8 °C / 83.8 F (-14.2 °C / -25.6 F).
MSI GF72VR 7RF análisis de audio
(+) | los altavoces pueden reproducir a un volumen relativamente alto (#90.7 dB)
Graves 100 - 315 Hz
(-) | casi sin bajos - de media 20.2% inferior a la mediana
(±) | la linealidad de los graves es media (9.1% delta a frecuencia anterior)
Medios 400 - 2000 Hz
(±) | medias más altas - de media 8.4% más altas que la mediana
(±) | la linealidad de los medios es media (7.4% delta respecto a la frecuencia anterior)
Altos 2 - 16 kHz
(+) | máximos equilibrados - a sólo 3.9% de la mediana
(+) | los máximos son lineales (4.5% delta a la frecuencia anterior)
Total 100 - 16.000 Hz
(±) | la linealidad del sonido global es media (22.3% de diferencia con la mediana)
En comparación con la misma clase
» 80% de todos los dispositivos probados de esta clase eran mejores, 6% similares, 14% peores
» El mejor tuvo un delta de 6%, la media fue 18%, el peor fue ###max##%
En comparación con todos los dispositivos probados
» 65% de todos los dispositivos probados eran mejores, 6% similares, 29% peores
» El mejor tuvo un delta de 4%, la media fue 24%, el peor fue ###max##%
Acer Aspire V17 Nitro BE VN7-793-738J análisis de audio
(±) | la sonoridad del altavoz es media pero buena (72 dB)
Graves 100 - 315 Hz
(±) | lubina reducida - en promedio 5.7% inferior a la mediana
(+) | el bajo es lineal (5% delta a la frecuencia anterior)
Medios 400 - 2000 Hz
(+) | medios equilibrados - a sólo 4.4% de la mediana
(+) | los medios son lineales (6% delta a la frecuencia anterior)
Altos 2 - 16 kHz
(+) | máximos equilibrados - a sólo 3% de la mediana
(±) | la linealidad de los máximos es media (7.2% delta a frecuencia anterior)
Total 100 - 16.000 Hz
(+) | el sonido global es lineal (12.5% de diferencia con la mediana)
En comparación con la misma clase
» 15% de todos los dispositivos probados de esta clase eran mejores, 3% similares, 81% peores
» El mejor tuvo un delta de 6%, la media fue 18%, el peor fue ###max##%
En comparación con todos los dispositivos probados
» 11% de todos los dispositivos probados eran mejores, 2% similares, 87% peores
» El mejor tuvo un delta de 4%, la media fue 24%, el peor fue ###max##%
| Off / Standby | |
| Ocioso | |
| Carga |
|
Clave:
min: | |
| MSI GF72VR 7RF i7-7700HQ, GeForce GTX 1060 Mobile, Samsung PM961 MZVLW256HEHP, TN LED, 1920x1080, 17.3" | MSI GE72VR-6RF16H21 6700HQ, GeForce GTX 1060 Mobile, Toshiba HG6 THNSNJ256G8NY, TN LED, 1920x1080, 17.3" | MSI GS73VR 7RF i7-7700HQ, GeForce GTX 1060 Mobile, Samsung SM961 MZVKW512HMJP m.2 PCI-e, IPS, 3840x2160, 17.3" | Asus GL702VM-GC102D 6700HQ, GeForce GTX 1060 Mobile, HGST Travelstar 7K1000 HTS721010A9E630, IPS, 1920x1080, 17.3" | Acer Aspire 7 A717-71G-72VY i7-7700HQ, GeForce GTX 1060 Mobile, Toshiba MQ01ABD100, IPS, 1920x1080, 17.3" | Acer Aspire V17 Nitro BE VN7-793-738J i7-7700HQ, GeForce GTX 1060 Mobile, Intel SSD 600p SSDPEKKW512G7, IPS, 3840x2160, 17.3" | HP Omen 17-w100ng 6300HQ, GeForce GTX 1060 Mobile, SanDisk Z400s SD8SNAT-128G, IPS, 1920x1080, 17.3" | Nexoc G739 i7-7700HQ, GeForce GTX 1050 Ti Mobile, Samsung PM961 MZVLW256HEHP, IPS, 1920x1080, 17.3" | Asus Strix GL702VSK i7-7700HQ, GeForce GTX 1070 Mobile, HGST Travelstar 7K1000 HTS721010A9E630, IPS, 1920x1080, 17.3" | |
|---|---|---|---|---|---|---|---|---|---|
| Power Consumption | 0% | -2% | 2% | 26% | 6% | -3% | 17% | -28% | |
| Idle Minimum * (Watt) | 15.7 | 13 17% | 14.2 10% | 15.6 1% | 7 55% | 10.5 33% | 17 -8% | 7 55% | 20.9 -33% |
| Idle Average * (Watt) | 21.4 | 20 7% | 23.5 -10% | 20.2 6% | 12.3 43% | 20.5 4% | 22 -3% | 14 35% | 22.9 -7% |
| Idle Maximum * (Watt) | 21.9 | 26 -19% | 23.8 -9% | 21.4 2% | 14.2 35% | 22 -0% | 29 -32% | 23 -5% | 23.1 -5% |
| Load Average * (Watt) | 83.9 | 83 1% | 90.9 -8% | 90 -7% | 72.6 13% | 91 -8% | 72 14% | 82 2% | 147.2 -75% |
| Witcher 3 ultra * (Watt) | 130.2 | 116 11% | 125 4% | ||||||
| Load Maximum * (Watt) | 159.6 | 169 -6% | 171.6 -8% | 147 8% | 153 4% | 155 3% | 141 12% | 163 -2% | 188.1 -18% |
* ... más pequeño es mejor
| MSI GF72VR 7RF i7-7700HQ, GeForce GTX 1060 Mobile, 43 Wh | MSI GE72VR-6RF16H21 6700HQ, GeForce GTX 1060 Mobile, 51 Wh | MSI GS73VR 7RF i7-7700HQ, GeForce GTX 1060 Mobile, 65 Wh | Asus GL702VM-GC102D 6700HQ, GeForce GTX 1060 Mobile, 76 Wh | Acer Aspire 7 A717-71G-72VY i7-7700HQ, GeForce GTX 1060 Mobile, 48 Wh | Acer Aspire V17 Nitro BE VN7-793-738J i7-7700HQ, GeForce GTX 1060 Mobile, 69 Wh | HP Omen 17-w100ng 6300HQ, GeForce GTX 1060 Mobile, 95.8 Wh | Nexoc G739 i7-7700HQ, GeForce GTX 1050 Ti Mobile, 62 Wh | Asus Strix GL702VSK i7-7700HQ, GeForce GTX 1070 Mobile, 76 Wh | |
|---|---|---|---|---|---|---|---|---|---|
| Duración de Batería | -1% | 30% | 88% | 125% | 92% | 188% | 167% | 64% | |
| Reader / Idle (h) | 3.4 | 3.3 -3% | 5 47% | 5.9 74% | 9.2 171% | 9.1 168% | 10.2 200% | 5.1 50% | |
| WiFi v1.3 (h) | 2.4 | 2.4 0% | 2.7 13% | 4.2 75% | 5.6 133% | 4.6 92% | 6.1 154% | 4.8 100% | 3.4 42% |
| Load (h) | 0.7 | 0.7 0% | 0.9 29% | 1.5 114% | 1.2 71% | 2.4 243% | 2.1 200% | 1.4 100% |
Pro
Contra

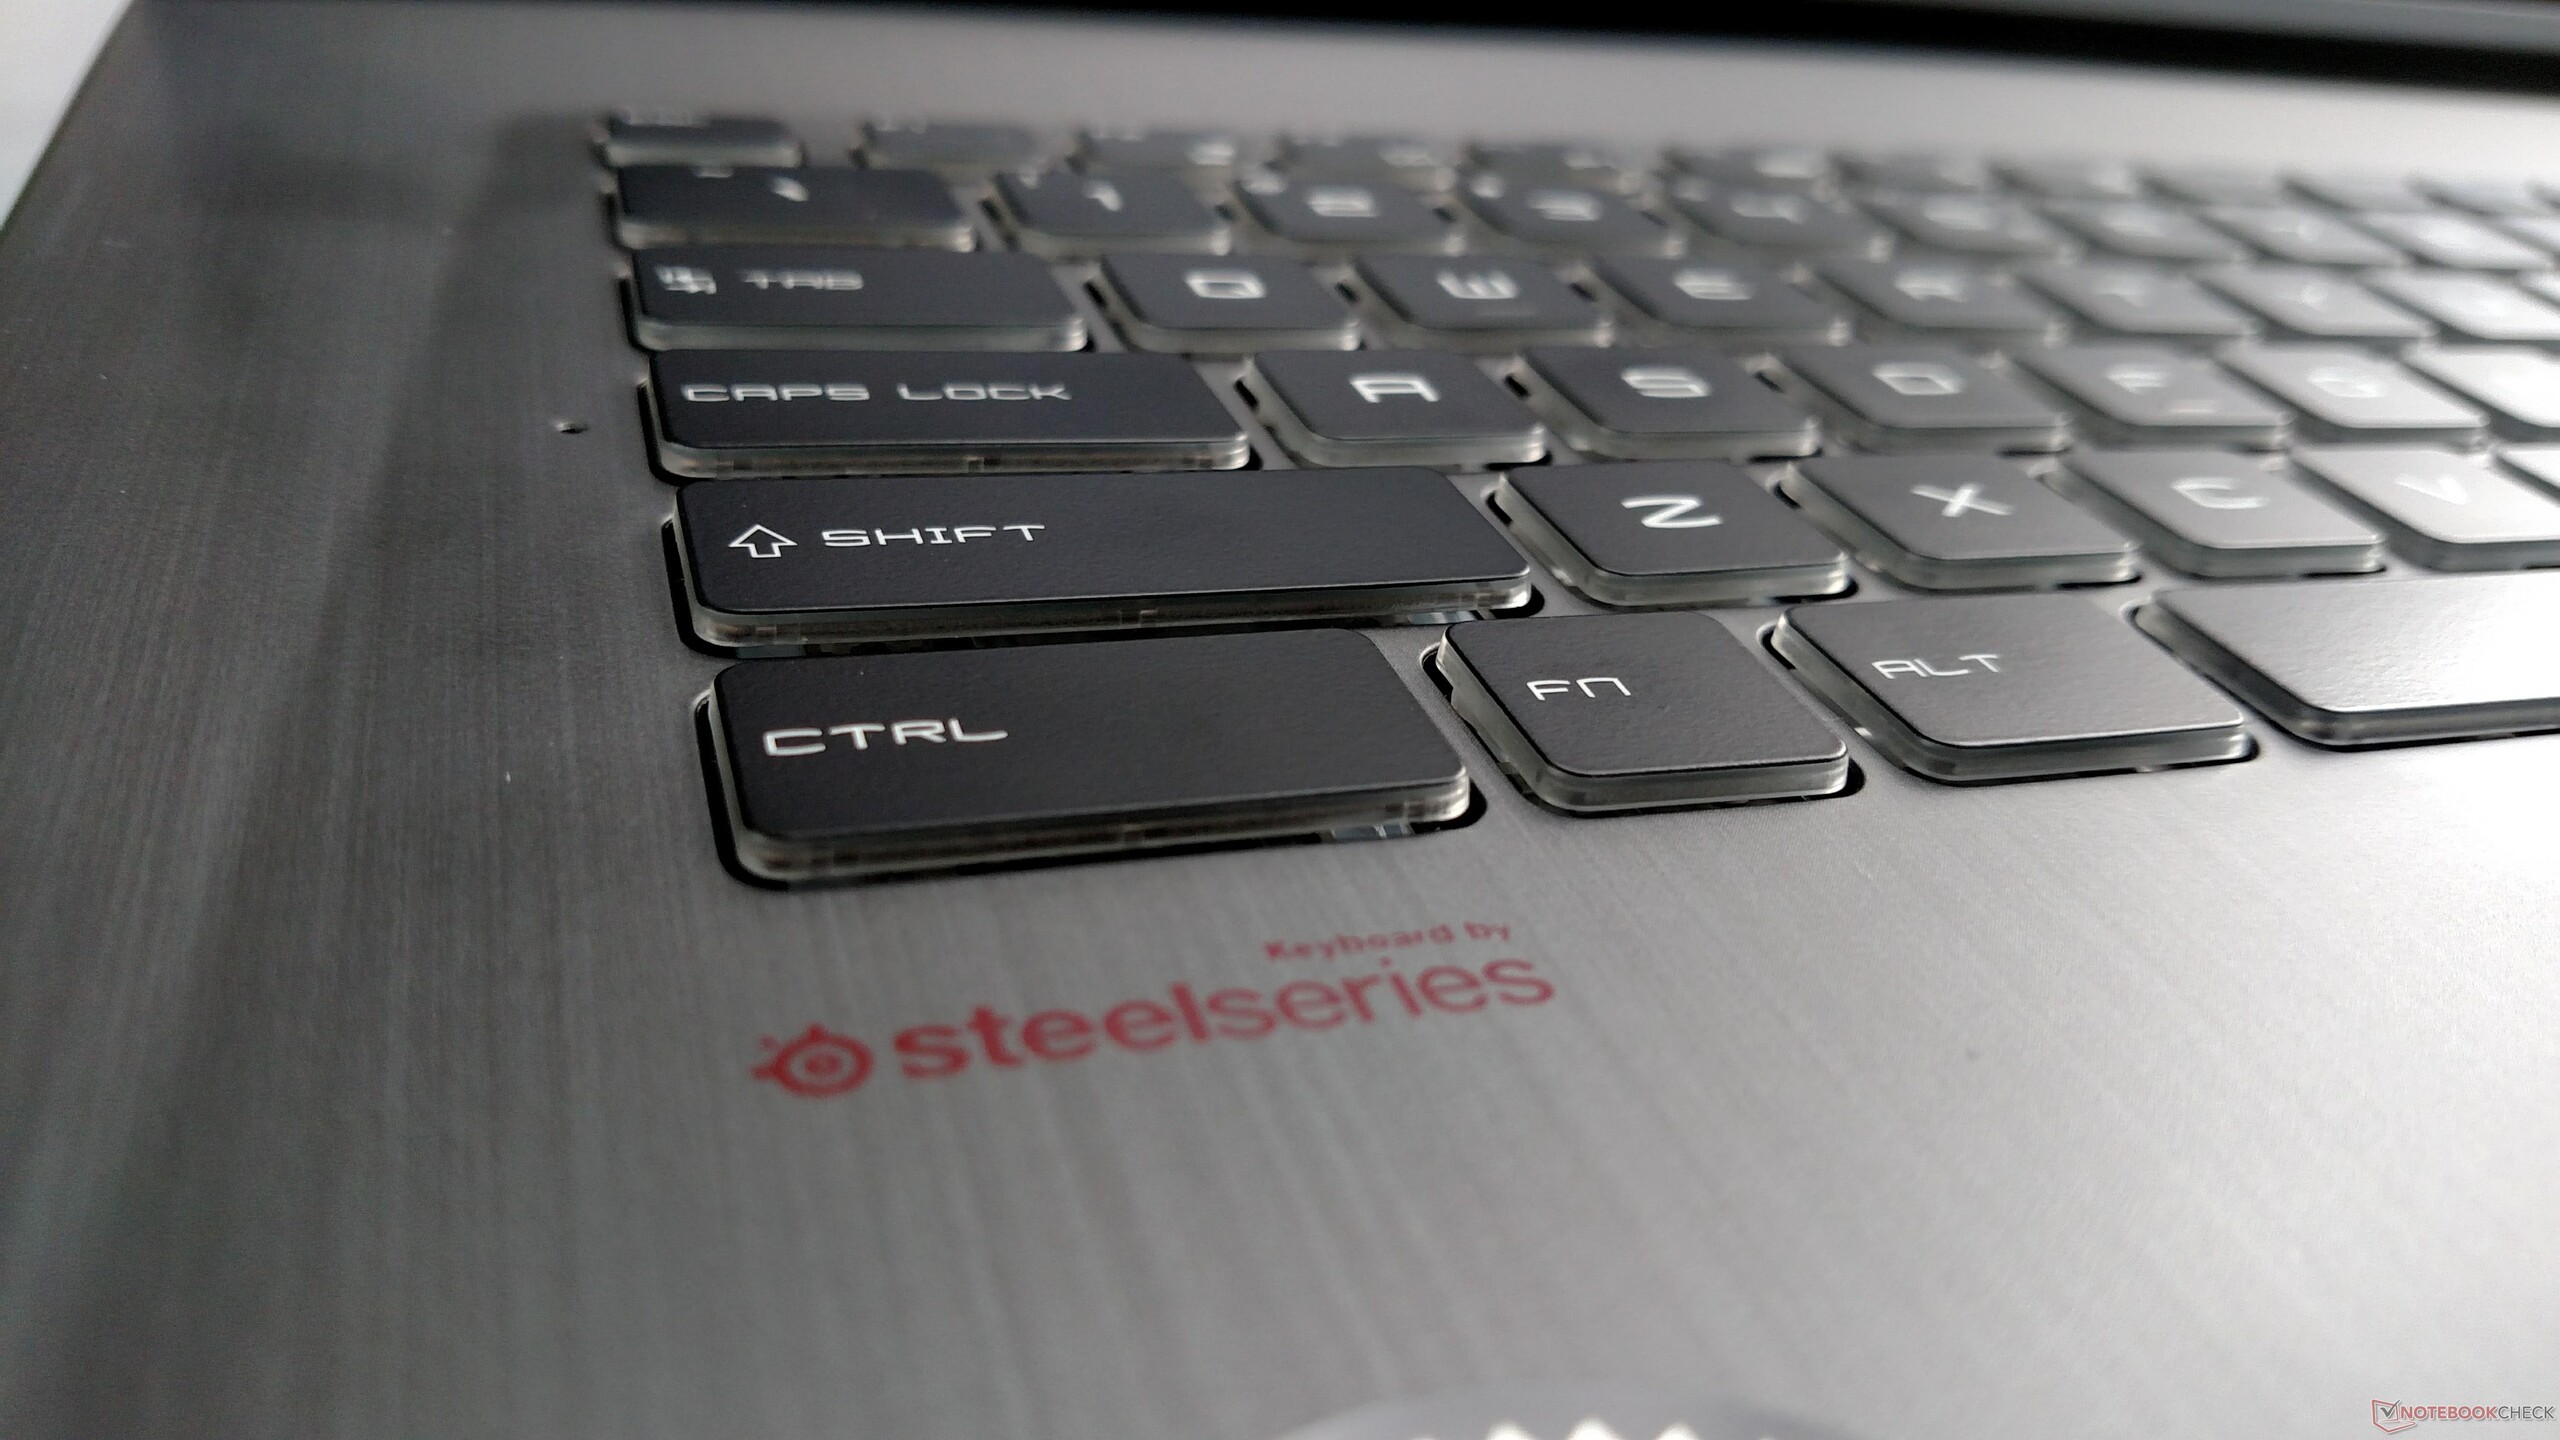
El GF72VR es el último esfuerzo de MSI de ofrecer una opción más a los consumidores que busquen una máquina gaming potente pero asequible. Por desgracia, el portátil falla más que acierta. Si bien el teclado es excelente, el display es colorido y rico, y la inclusión de una tasa de refresco elevada es más que bienvenida, hay varios otros defectos que impiden despegar al portátil.
El principal componente yace en la gestión térmica. La robusta solución de ventilación resulta en ventiladores ruidosos y molestos. Los componentes internos se mantienen relativamente frescos al coste de altísimos niveles de ruido, un sacrificio que muchos pueden no querer hacer. Ni siquiera el Fan Boost logra mucho; mientras que el aumento en ruido de ventilador es drástico, las mejoras de temperatura y rendimiento son escasas. Los altavoces también son anémicos, pero la calidad de sonido puede corregirse fácilmente con un par de auriculares de calidad.
Con todo, el GF72VR solidifica aún más la el enfoque "espaguetti" de MSI a los portátiles gaming; el fabricante parece estar tirando todo contra la pared para ver qué se queda pegado. Si bien no es un mal portátil per sé, el GF72VR hace demasiados sacrificios cuando se lo compara con otras ofertas domésticas de MSI, GP72VR y GE72VR.
La presentación del GF72VR confunde aún más el ya confuso catálogo de MSI y puede crear más competencia interna para la competencia. El dispositivo no hace mucho para sobresalir de la multitud y seguramente lo pasarán por alto a favor de portátiles con conjuntos más amplios de características, muchos de los cuales los hace el propio MSI.
Ésta es una versión acortada del análisis original. Puedes leer el análisis completo en inglés aquí.
MSI GF72VR 7RF
- 10/20/2017 v6 (old)
Sam Medley
Price comparison
