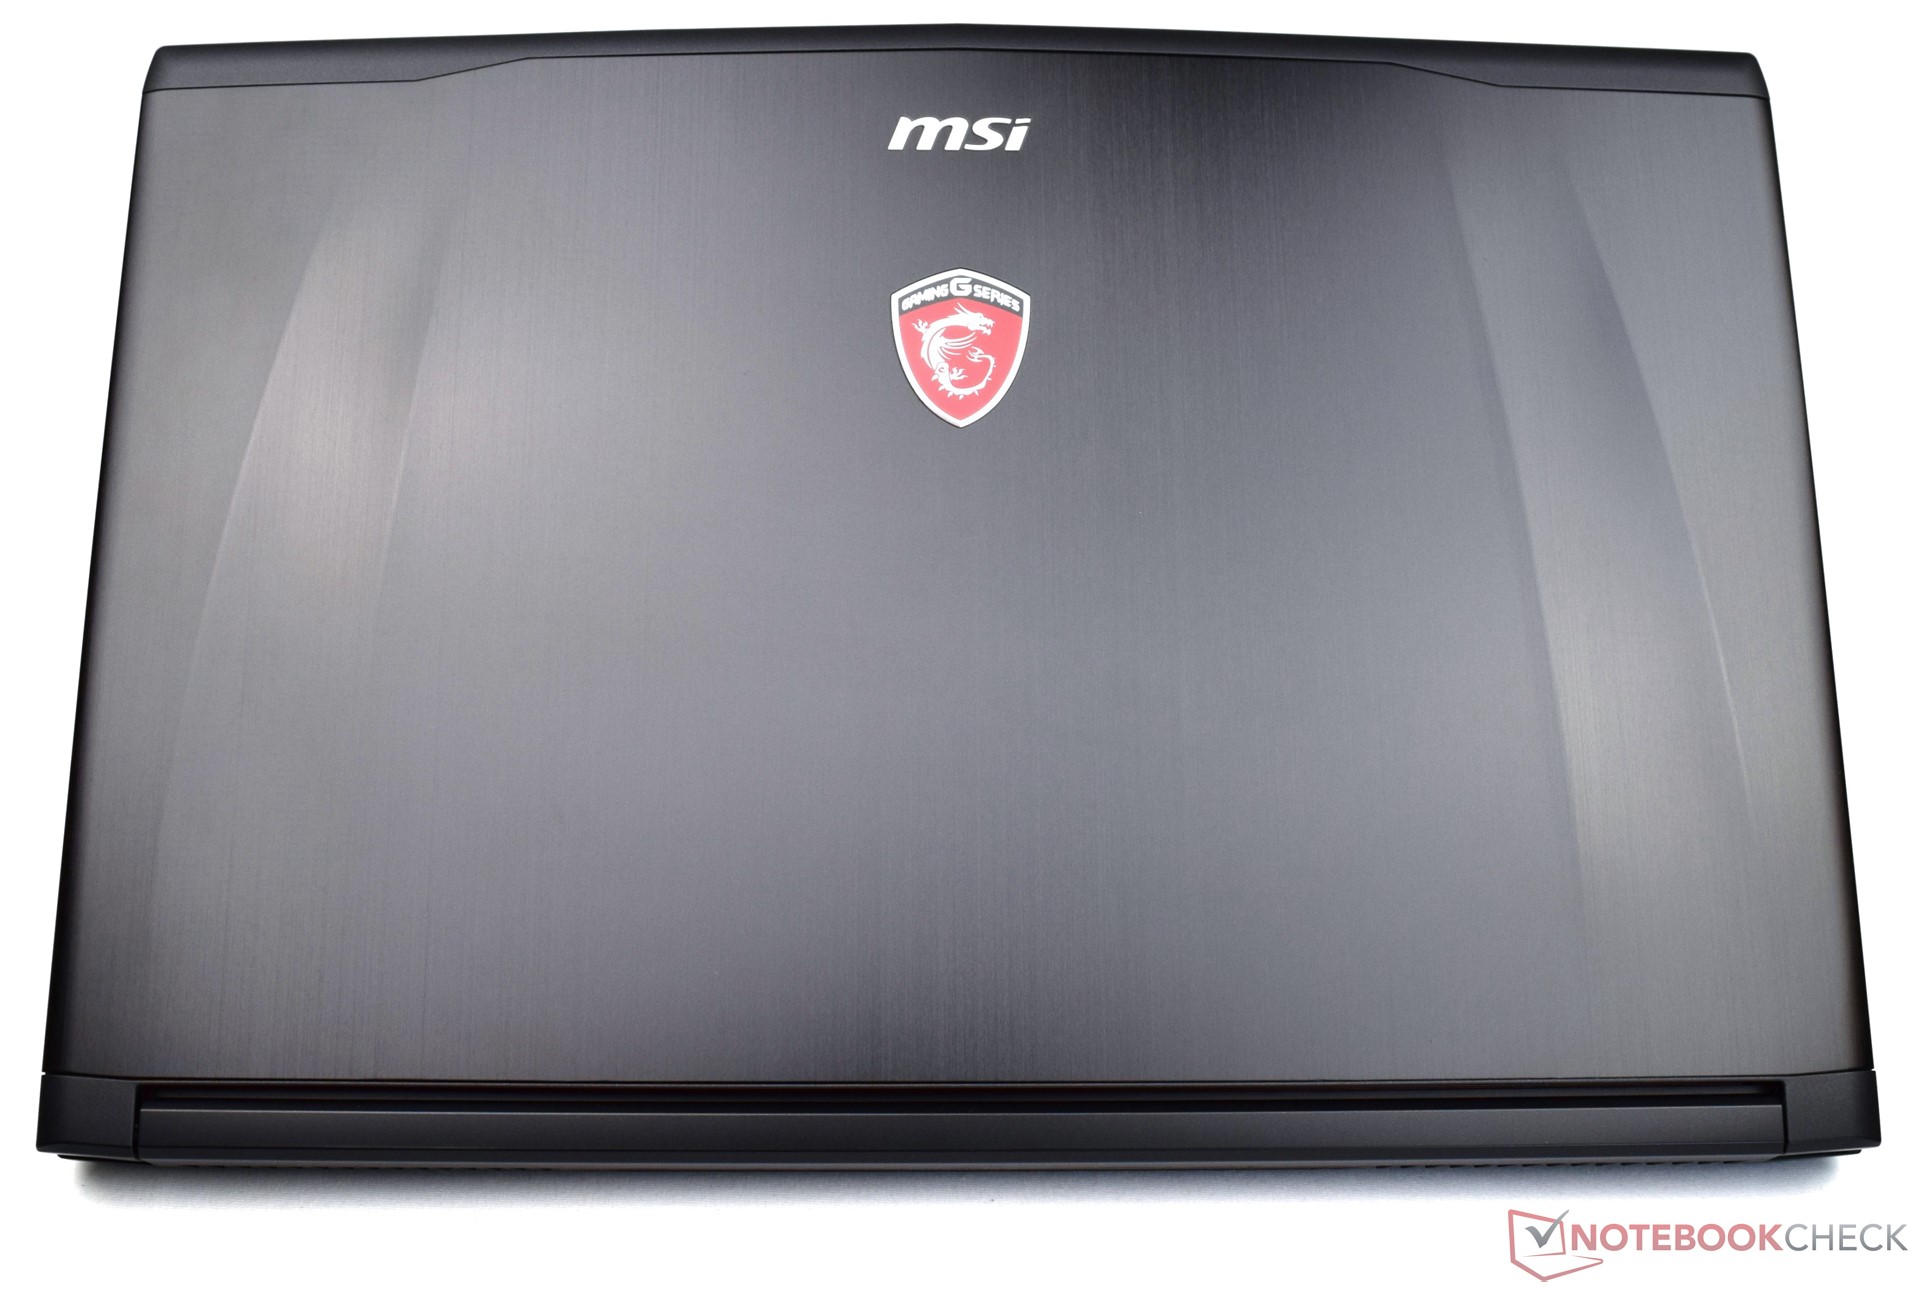
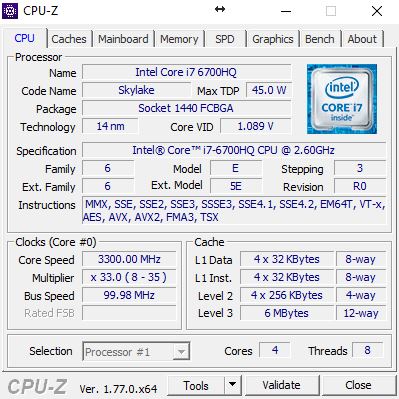
Breve análisis del MSI GE72VR 6RF Apache Pro


| SD Card Reader | |
| average JPG Copy Test (av. of 3 runs) | |
| Acer Predator 17 G9-793-77LG | |
| Aorus X7 v6 | |
| HP Omen 17-w110ng | |
| Asus GL702VM-GC102D | |
| Medion Erazer X7849 MD 60292 | |
| MSI GS73VR 6RF | |
| MSI GE72VR-6RF16H21 | |
| maximum AS SSD Seq Read Test (1GB) | |
| Acer Predator 17 G9-793-77LG | |
| HP Omen 17-w110ng | |
| Aorus X7 v6 | |
| Medion Erazer X7849 MD 60292 | |
| Asus GL702VM-GC102D | |
| MSI GS73VR 6RF | |
| MSI GE72VR-6RF16H21 | |
| Networking | |
| iperf3 transmit AX12 | |
| Aorus X7 v6 | |
| HP Omen 17-w110ng | |
| MSI GE72VR-6RF16H21 | |
| iperf3 receive AX12 | |
| HP Omen 17-w110ng | |
| Aorus X7 v6 | |
| MSI GE72VR-6RF16H21 | |
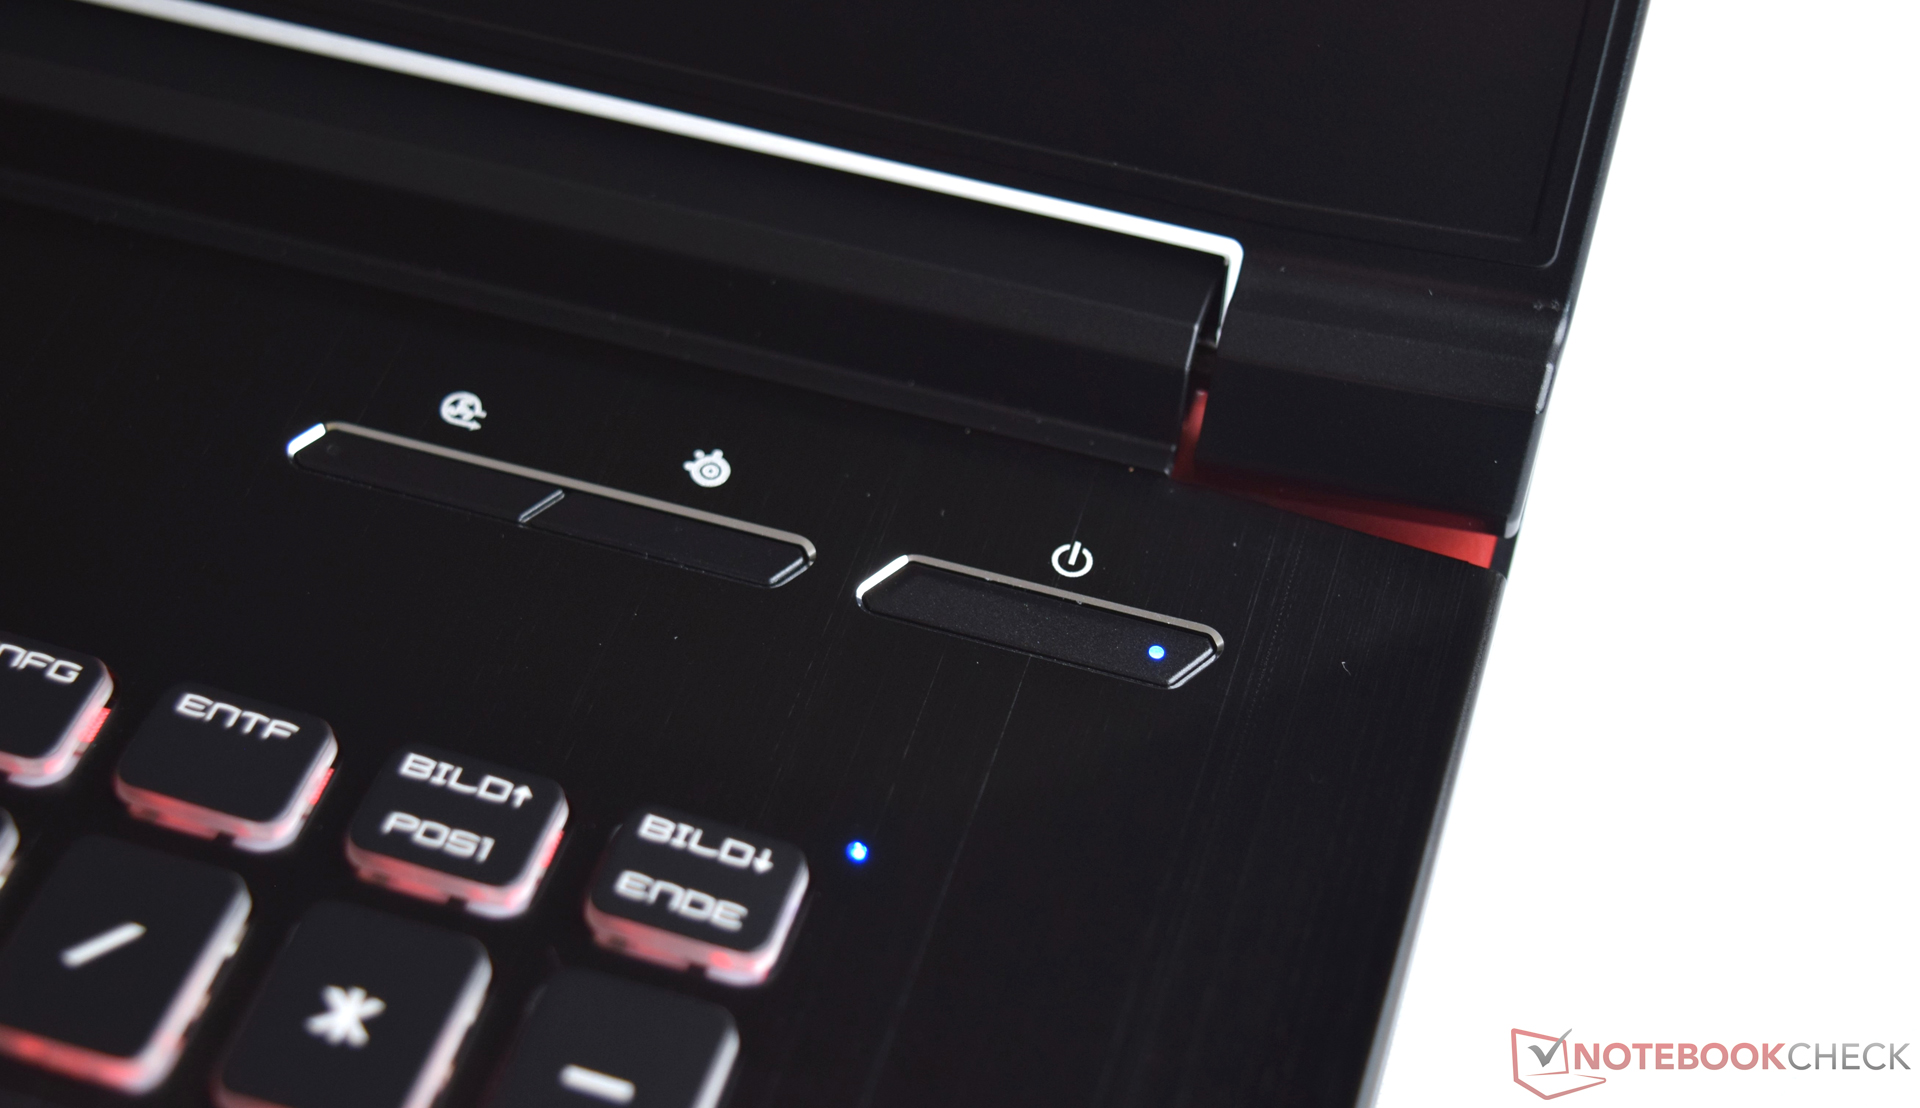
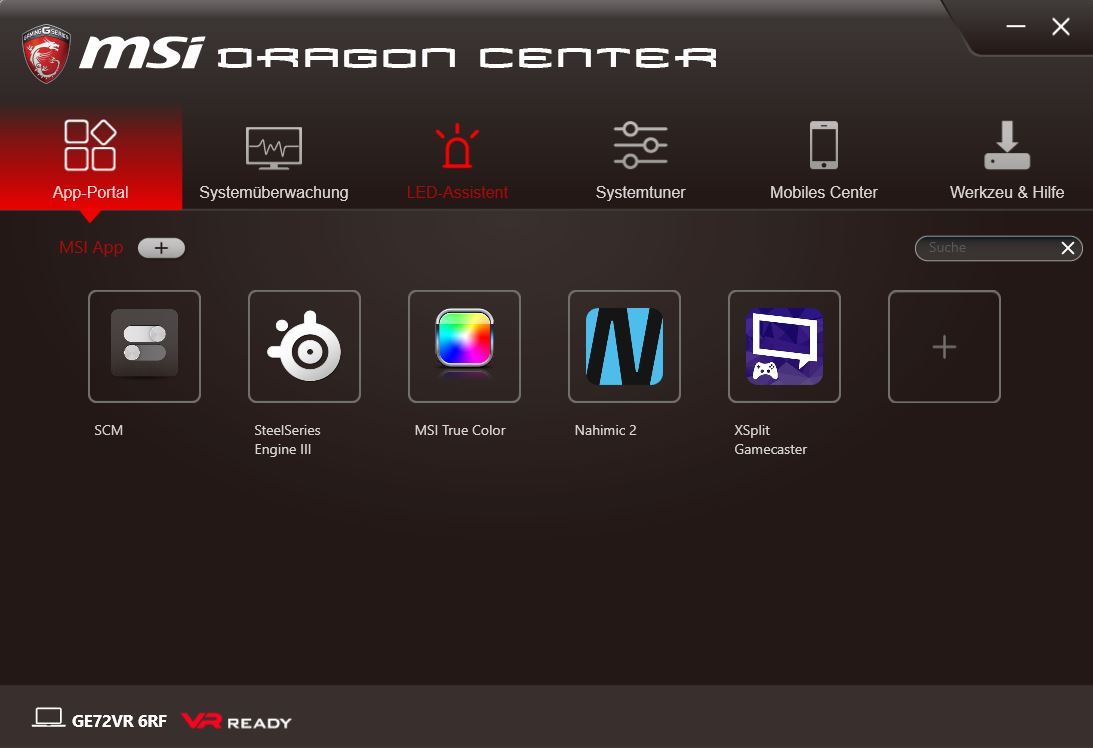
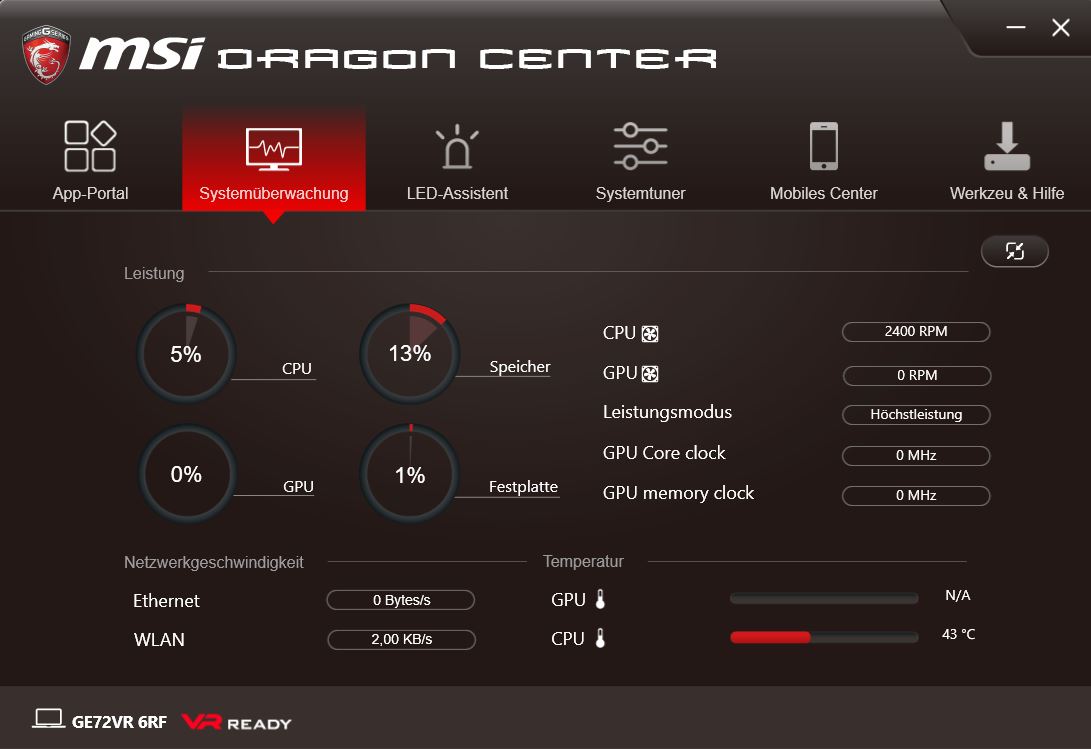
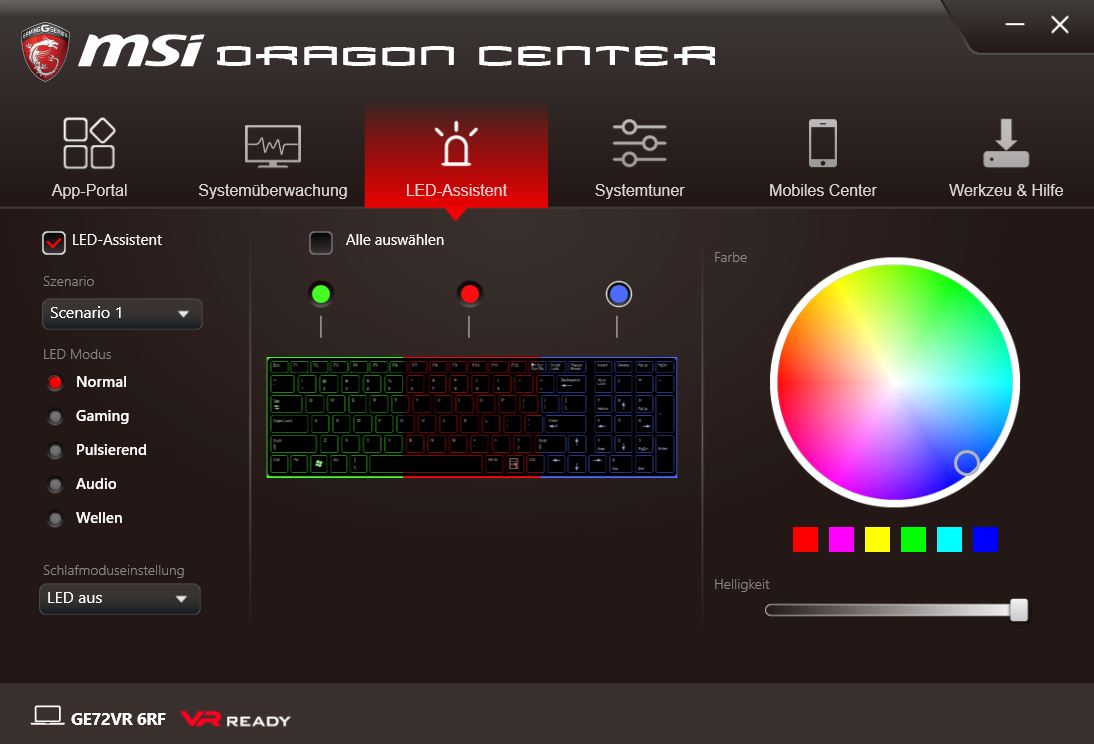
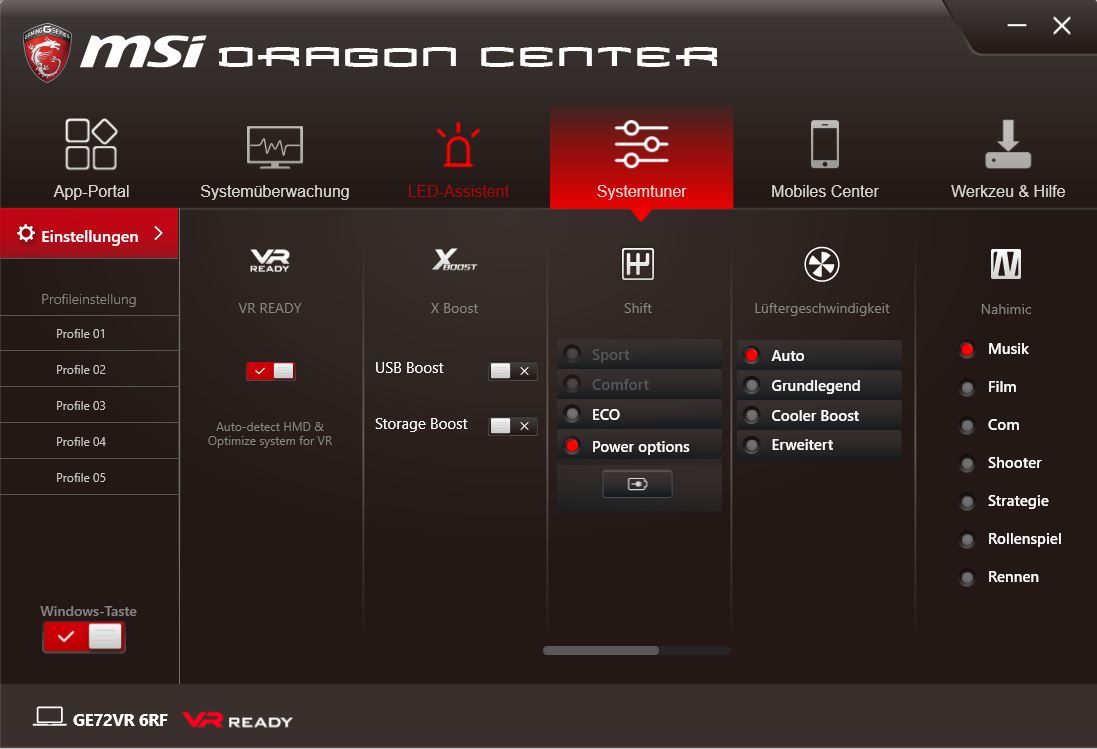
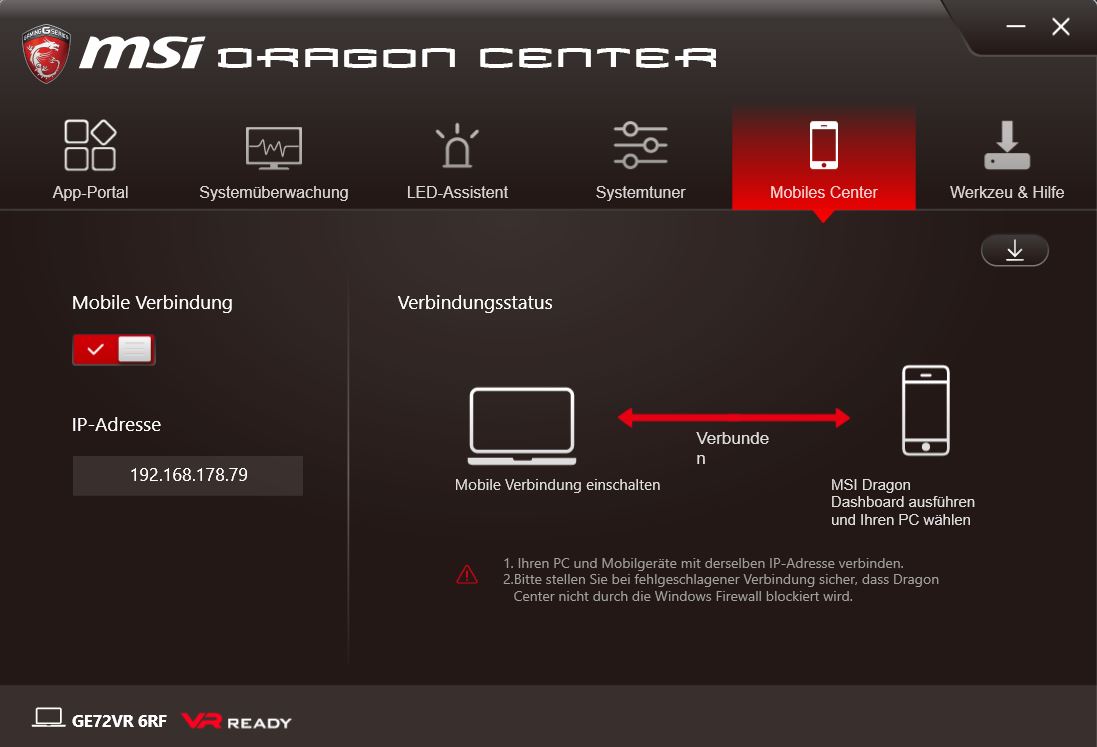
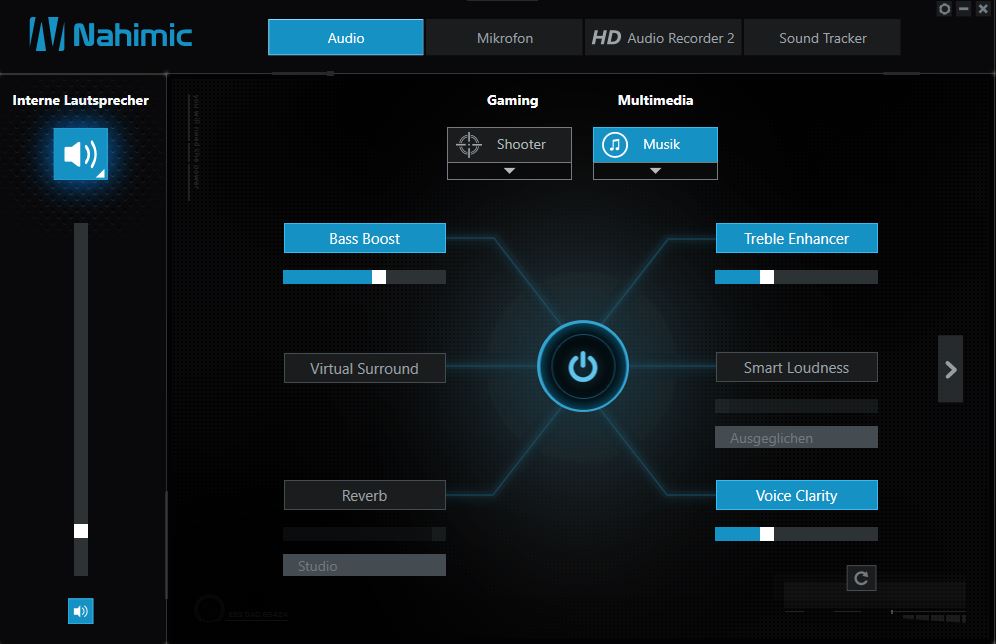
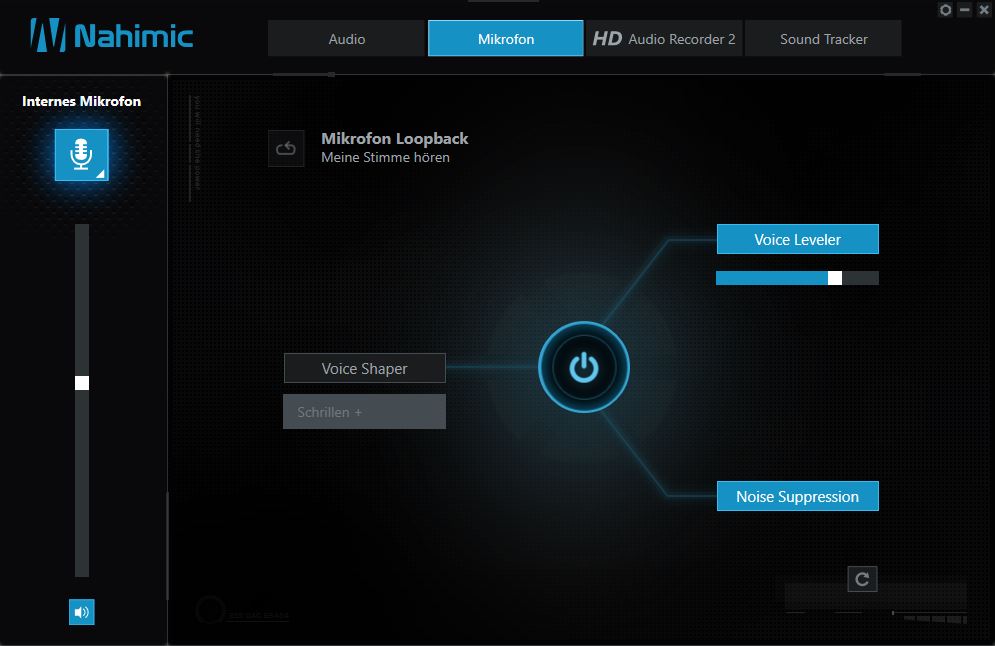
MSI Dragon Center

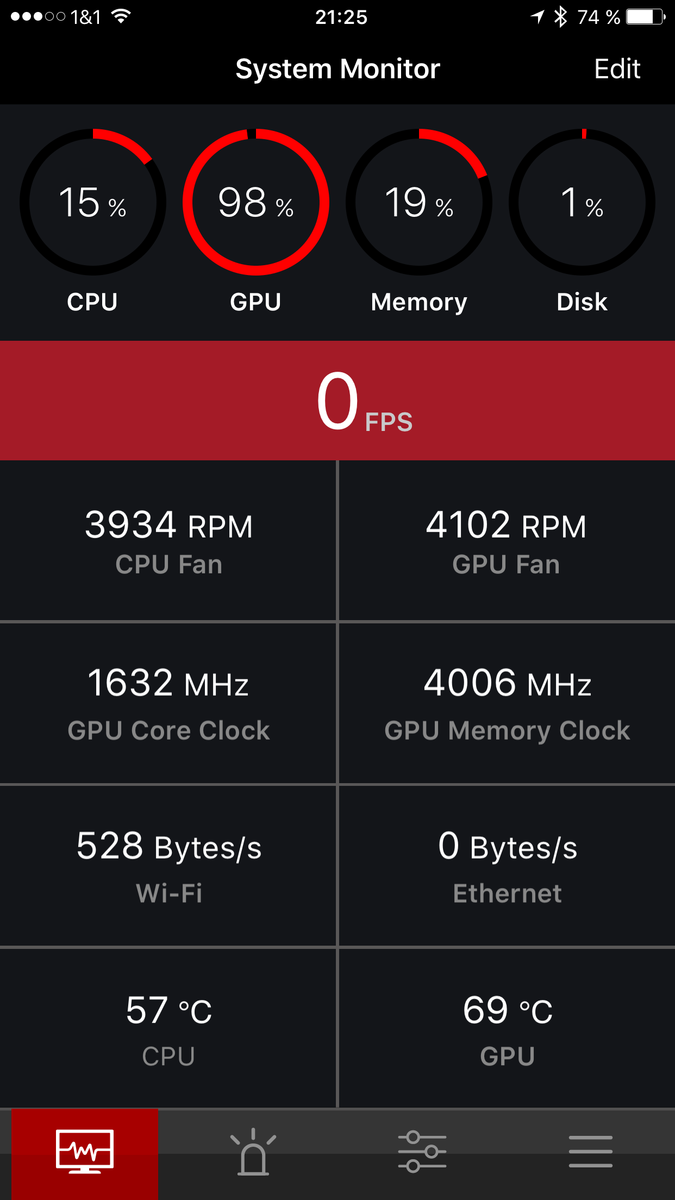
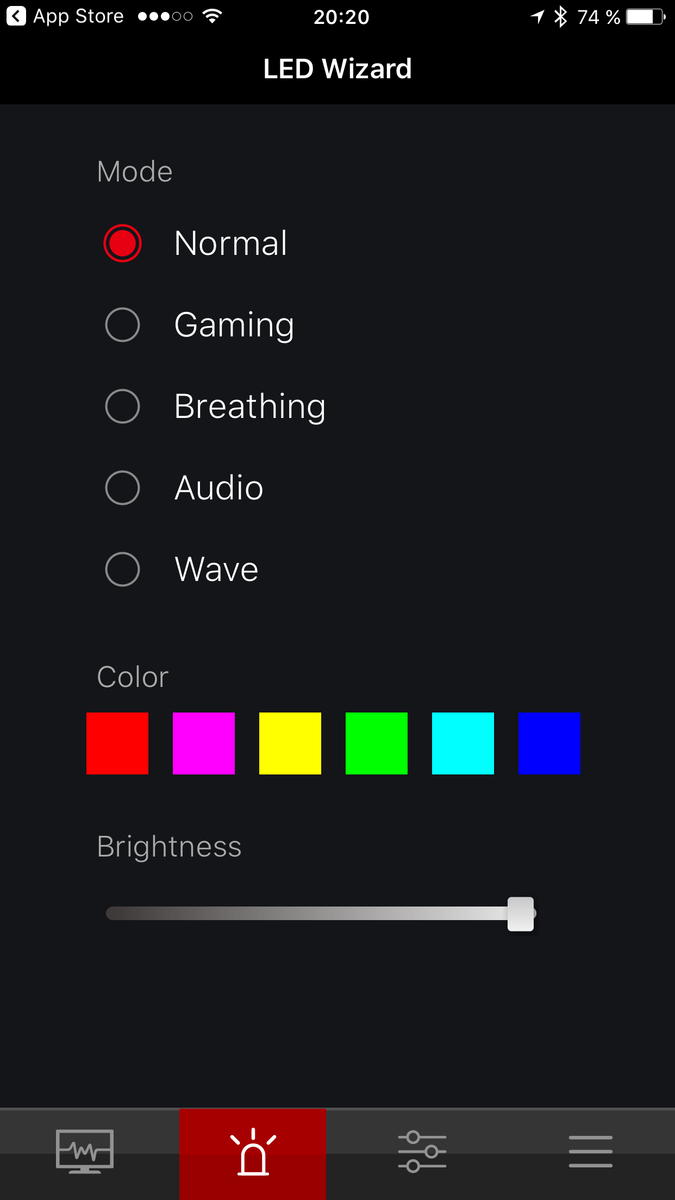
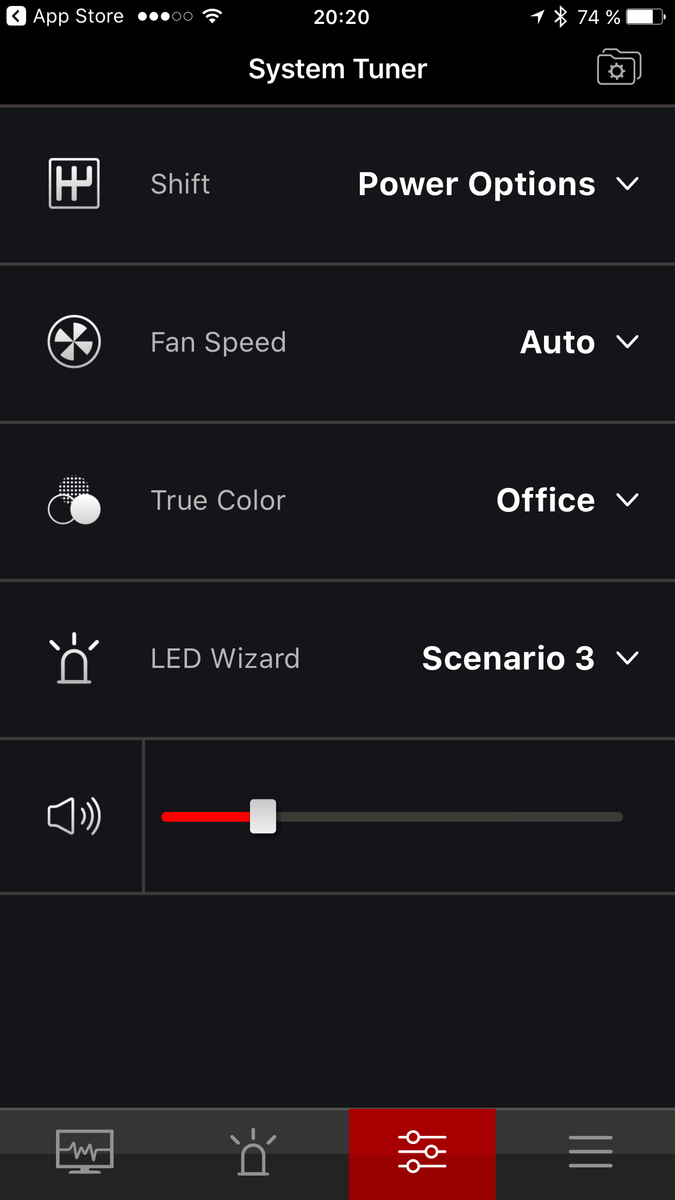
MSI Dragon Dashboard
| |||||||||||||||||||||||||
iluminación: 86 %
Brillo con batería: 270 cd/m²
Contraste: 1038:1 (Negro: 0.26 cd/m²)
ΔE ColorChecker Calman: 3.33 | ∀{0.5-29.43 Ø4.73}
ΔE Greyscale Calman: 3.46 | ∀{0.09-98 Ø4.97}
100% sRGB (Argyll 1.6.3 3D)
75% AdobeRGB 1998 (Argyll 1.6.3 3D)
83.9% AdobeRGB 1998 (Argyll 3D)
99.8% sRGB (Argyll 3D)
90.2% Display P3 (Argyll 3D)
Gamma: 2.13
CCT: 7419 K
| MSI GE72VR-6RF16H21 N173HHE-G32 (CMN1747), 1920x1080 | Asus GL702VM-GC102D LG Philips LP173WF4-SPF3, 1920x1080 | MSI GS73VR 6RF 1920x1080 | Medion Erazer X7849 MD 60292 LP173WF4-SPD1, 1920x1080 | HP Omen 17-w110ng LG Philips LGD046E, 1920x1080 | Acer Predator 17 G9-793-77LG AU Optronics B173ZAN01.0 (AUO109B), 3840x2160 | Aorus X7 v6 B173QTN01.0 (AUO1096), 2560x1440 | |
|---|---|---|---|---|---|---|---|
| Display | -24% | 0% | -23% | 5% | -25% | ||
| Display P3 Coverage (%) | 90.2 | 65.1 -28% | 90 0% | 66.6 -26% | 86.9 -4% | 60.9 -32% | |
| sRGB Coverage (%) | 99.8 | 83.5 -16% | 99.9 0% | 84.1 -16% | 100 0% | 84.2 -16% | |
| AdobeRGB 1998 Coverage (%) | 83.9 | 61.1 -27% | 83.6 0% | 61.5 -27% | 99.4 18% | 61.2 -27% | |
| Response Times | -112% | -10% | -96% | -116% | -116% | -18% | |
| Response Time Grey 50% / Grey 80% * (ms) | 28 ? | 38 ? -36% | 28 ? -0% | 29 ? -4% | 37 ? -32% | 37 ? -32% | 31 ? -11% |
| Response Time Black / White * (ms) | 8 ? | 23 ? -188% | 9.6 ? -20% | 23 ? -188% | 24 ? -200% | 24 ? -200% | 10 ? -25% |
| PWM Frequency (Hz) | |||||||
| Screen | -42% | 8% | -24% | -7% | 6% | -44% | |
| Brightness middle (cd/m²) | 270 | 326 21% | 337.2 25% | 390 44% | 362 34% | 336 24% | 343 27% |
| Brightness (cd/m²) | 254 | 312 23% | 315 24% | 355 40% | 342 35% | 320 26% | 312 23% |
| Brightness Distribution (%) | 86 | 91 6% | 86 0% | 79 -8% | 87 1% | 88 2% | 80 -7% |
| Black Level * (cd/m²) | 0.26 | 0.5 -92% | 0.308 -18% | 0.39 -50% | 0.31 -19% | 0.25 4% | 0.5 -92% |
| Contrast (:1) | 1038 | 652 -37% | 1095 5% | 1000 -4% | 1168 13% | 1344 29% | 686 -34% |
| Colorchecker dE 2000 * | 3.33 | 6.3 -89% | 2.96 11% | 5.9 -77% | 4.5 -35% | 3.61 -8% | 7.33 -120% |
| Colorchecker dE 2000 max. * | 6.07 | 11.69 -93% | 5.45 10% | 9.89 -63% | 9.31 -53% | 6.02 1% | 10.79 -78% |
| Greyscale dE 2000 * | 3.46 | 7.37 -113% | 2.57 26% | 6.17 -78% | 3.48 -1% | 4.78 -38% | 7.6 -120% |
| Gamma | 2.13 103% | 2.37 93% | 2.25 98% | 2.24 98% | 2.23 99% | 2.32 95% | 2.19 100% |
| CCT | 7419 88% | 7116 91% | 7114 91% | 6955 93% | 6144 106% | 6185 105% | 9024 72% |
| Color Space (Percent of AdobeRGB 1998) (%) | 75 | 55 -27% | 74.3 -1% | 55 -27% | 55 -27% | 88 17% | 55 -27% |
| Color Space (Percent of sRGB) (%) | 100 | 83 -17% | 100 0% | 84 -16% | 84 -16% | 100 0% | 84 -16% |
| Media total (Programa/Opciones) | -59% /
-48% | -1% /
4% | -60% /
-36% | -49% /
-25% | -35% /
-11% | -29% /
-37% |
* ... más pequeño es mejor
Tiempos de respuesta del display
| ↔ Tiempo de respuesta de Negro a Blanco | ||
|---|---|---|
| 8 ms ... subida ↗ y bajada ↘ combinada | ↗ 5 ms subida | 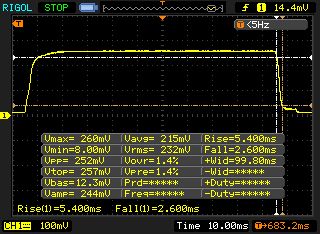 |
| ↘ 3 ms bajada | ||
| La pantalla mostró tiempos de respuesta rápidos en nuestros tests y debería ser adecuada para juegos. En comparación, todos los dispositivos de prueba van de ##min### (mínimo) a 240 (máximo) ms. » 22 % de todos los dispositivos son mejores. Esto quiere decir que el tiempo de respuesta medido es mejor que la media (19.9 ms) de todos los dispositivos testados. | ||
| ↔ Tiempo de respuesta 50% Gris a 80% Gris | ||
| 28 ms ... subida ↗ y bajada ↘ combinada | ↗ 12 ms subida | 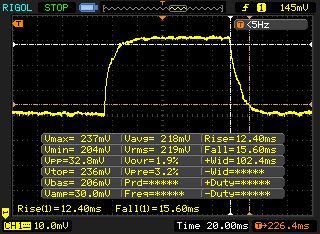 |
| ↘ 16 ms bajada | ||
| La pantalla mostró tiempos de respuesta relativamente lentos en nuestros tests pero podría ser demasiado lenta para los jugones. En comparación, todos los dispositivos de prueba van de ##min### (mínimo) a 636 (máximo) ms. » 38 % de todos los dispositivos son mejores. Eso quiere decir que el tiempo de respuesta es similar al dispositivo testado medio (31.1 ms). | ||
Parpadeo de Pantalla / PWM (Pulse-Width Modulation)
| Parpadeo de Pantalla / PWM no detectado | 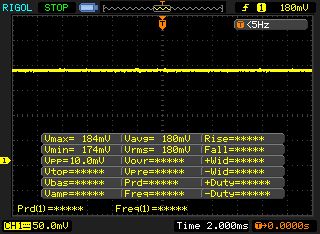 | ||
Comparación: 52 % de todos los dispositivos testados no usaron PWM para atenuar el display. Si se usó, medimos una media de 7784 (mínimo: 5 - máxmo: 343500) Hz. | |||
| Cinebench R11.5 | |
| CPU Single 64Bit | |
| Aorus X7 v6 | |
| HP Omen 17-w110ng | |
| MSI GE72VR-6RF16H21 | |
| MSI GS73VR 6RF | |
| Asus GL702VM-GC102D | |
| CPU Multi 64Bit | |
| Aorus X7 v6 | |
| HP Omen 17-w110ng | |
| Asus GL702VM-GC102D | |
| MSI GS73VR 6RF | |
| MSI GE72VR-6RF16H21 | |
| Cinebench R10 | |
| Rendering Single CPUs 64Bit | |
| HP Omen 17-w110ng | |
| MSI GE72VR-6RF16H21 | |
| Rendering Multiple CPUs 64Bit | |
| HP Omen 17-w110ng | |
| MSI GE72VR-6RF16H21 | |
| JetStream 1.1 - 1.1 Total | |
| HP Omen 17-w110ng | |
| Medion Erazer X7849 MD 60292 | |
| Asus GL702VM-GC102D | |
| MSI GS73VR 6RF | |
| MSI GE72VR-6RF16H21 | |
| Octane V2 - Total Score | |
| Medion Erazer X7849 MD 60292 | |
| HP Omen 17-w110ng | |
| Asus GL702VM-GC102D | |
| MSI GS73VR 6RF | |
| MSI GE72VR-6RF16H21 | |
| Mozilla Kraken 1.1 - Total | |
| MSI GE72VR-6RF16H21 | |
| Asus GL702VM-GC102D | |
| HP Omen 17-w110ng | |
| Medion Erazer X7849 MD 60292 | |
* ... más pequeño es mejor
| PCMark 7 - Score | |
| Aorus X7 v6 | |
| MSI GE72VR-6RF16H21 | |
| HP Omen 17-w110ng | |
| Asus GL702VM-GC102D | |
| PCMark 8 | |
| Home Score Accelerated v2 | |
| HP Omen 17-w110ng | |
| Asus GL702VM-GC102D | |
| Medion Erazer X7849 MD 60292 | |
| Medion Erazer X7849 MD 60292 | |
| Acer Predator 17 G9-793-77LG | |
| MSI GS73VR 6RF | |
| MSI GE72VR-6RF16H21 | |
| Creative Score Accelerated v2 | |
| HP Omen 17-w110ng | |
| Asus GL702VM-GC102D | |
| MSI GS73VR 6RF | |
| MSI GE72VR-6RF16H21 | |
| Acer Predator 17 G9-793-77LG | |
| Work Score Accelerated v2 | |
| HP Omen 17-w110ng | |
| Medion Erazer X7849 MD 60292 | |
| MSI GE72VR-6RF16H21 | |
| Asus GL702VM-GC102D | |
| MSI GS73VR 6RF | |
| Storage Score v2 | |
| HP Omen 17-w110ng | |
| Medion Erazer X7849 MD 60292 | |
| MSI GE72VR-6RF16H21 | |
| MSI GS73VR 6RF | |
| PCMark Vantage Result | 20205 puntos | |
| PCMark 7 Score | 5809 puntos | |
| PCMark 8 Home Score Accelerated v2 | 3985 puntos | |
| PCMark 8 Creative Score Accelerated v2 | 4933 puntos | |
| PCMark 8 Work Score Accelerated v2 | 4831 puntos | |
ayuda | ||
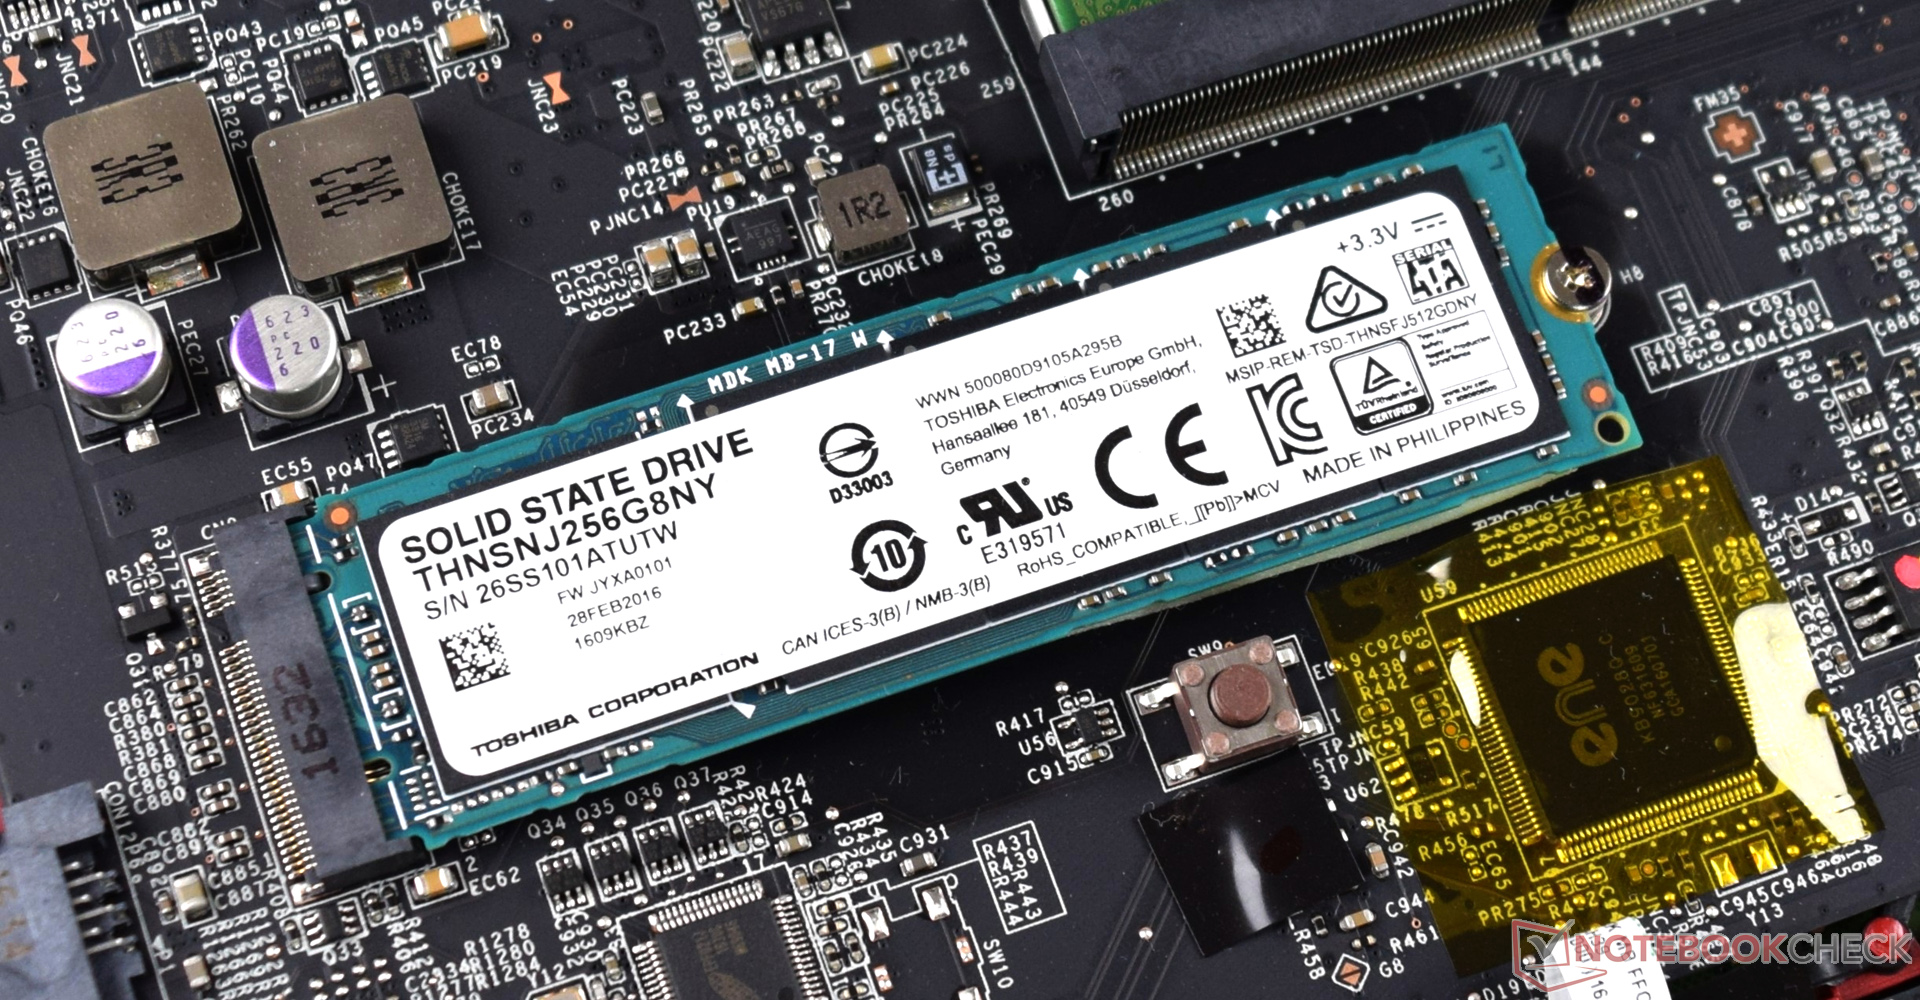
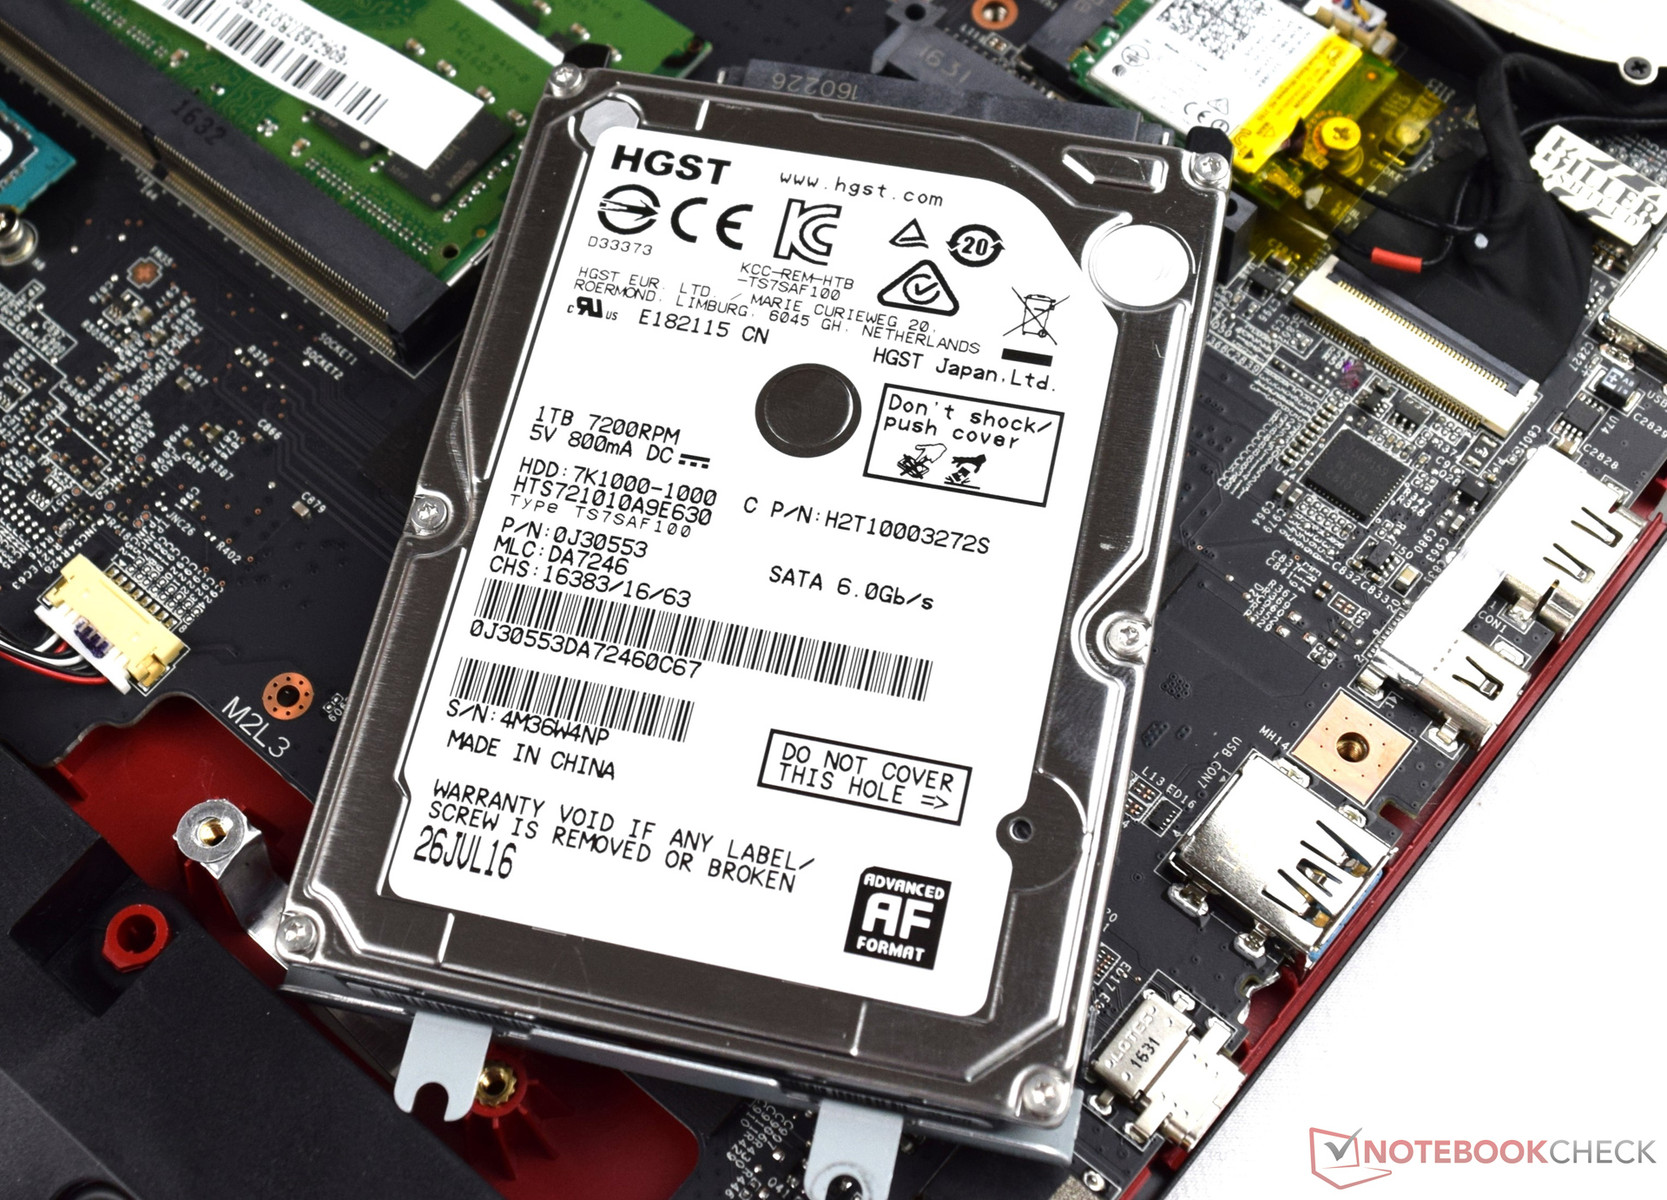
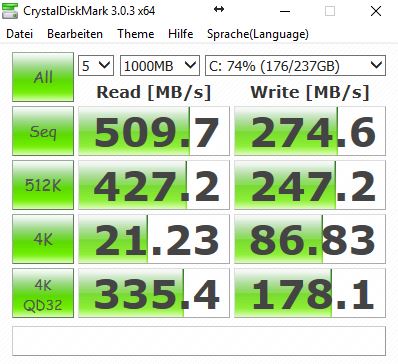
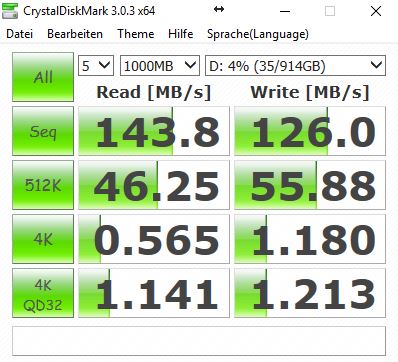
| MSI GE72VR-6RF16H21 Toshiba HG6 THNSNJ256G8NY | Asus GL702VM-GC102D HGST Travelstar 7K1000 HTS721010A9E630 | MSI GS73VR 6RF SanDisk SD8SN8U1T001122 | Medion Erazer X7849 MD 60292 Samsung SSD PM871 MZNLN512HCJH | HP Omen 17-w110ng Samsung PM951 NVMe MZVLV256 | Aorus X7 v6 Toshiba NVMe THNSN5512GPU7 | |
|---|---|---|---|---|---|---|
| CrystalDiskMark 3.0 | -86% | -18% | 35% | 65% | 197% | |
| Read Seq (MB/s) | 510 | 134.6 -74% | 334.3 -34% | 513 1% | 1156 127% | 1499 194% |
| Write Seq (MB/s) | 274.6 | 130.6 -52% | 319 16% | 483.7 76% | 294.9 7% | 1411 414% |
| Read 512 (MB/s) | 427.2 | 44.85 -90% | 242.3 -43% | 452.4 6% | 616 44% | 966 126% |
| Write 512 (MB/s) | 247.2 | 63.3 -74% | 254.4 3% | 404.2 64% | 294.7 19% | 1103 346% |
| Read 4k (MB/s) | 21.23 | 0.602 -97% | 20.3 -4% | 37.48 77% | 42.7 101% | 44.33 109% |
| Write 4k (MB/s) | 86.8 | 1.146 -99% | 42.51 -51% | 91.4 5% | 153.3 77% | 155.5 79% |
| Read 4k QD32 (MB/s) | 335.4 | 1.106 -100% | 251.6 -25% | 364.4 9% | 600 79% | 696 108% |
| Write 4k QD32 (MB/s) | 178.1 | 1.186 -99% | 167.1 -6% | 250.9 41% | 295.3 66% | 531 198% |

| 3DMark 11 - 1280x720 Performance GPU | |
| Aorus X7 v6 | |
| Acer Predator 17 G9-793-77LG | |
| Medion Erazer X7849 MD 60292 | |
| HP Omen 17-w110ng | |
| MSI GE72VR-6RF16H21 | |
| MSI GS73VR 6RF | |
| Asus GL702VM-GC102D | |
| 3DMark - 1920x1080 Fire Strike Graphics | |
| Aorus X7 v6 | |
| Medion Erazer X7849 MD 60292 | |
| HP Omen 17-w110ng | |
| Acer Predator 17 G9-793-77LG | |
| MSI GE72VR-6RF16H21 | |
| MSI GS73VR 6RF | |
| Asus GL702VM-GC102D | |
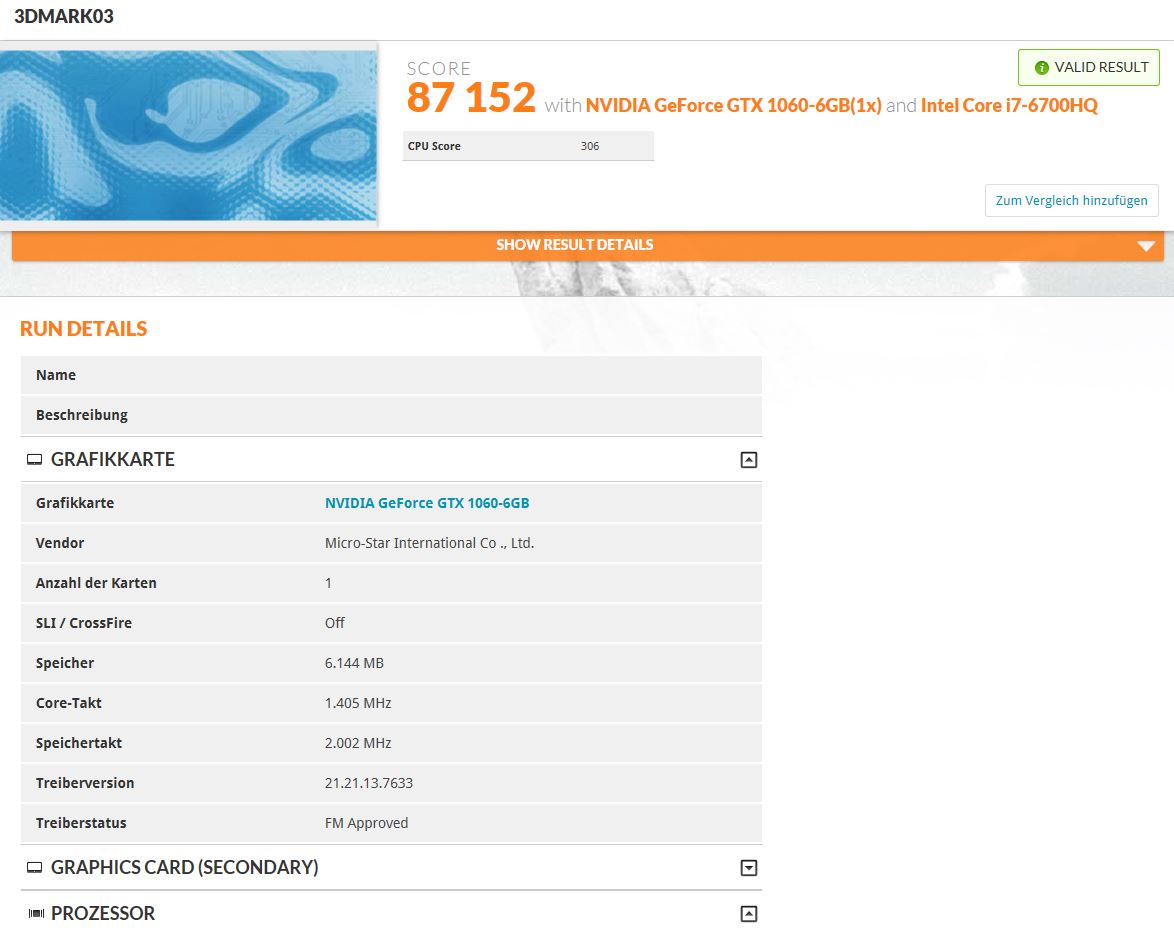
| 3DMark 03 Standard | 87152 puntos | |
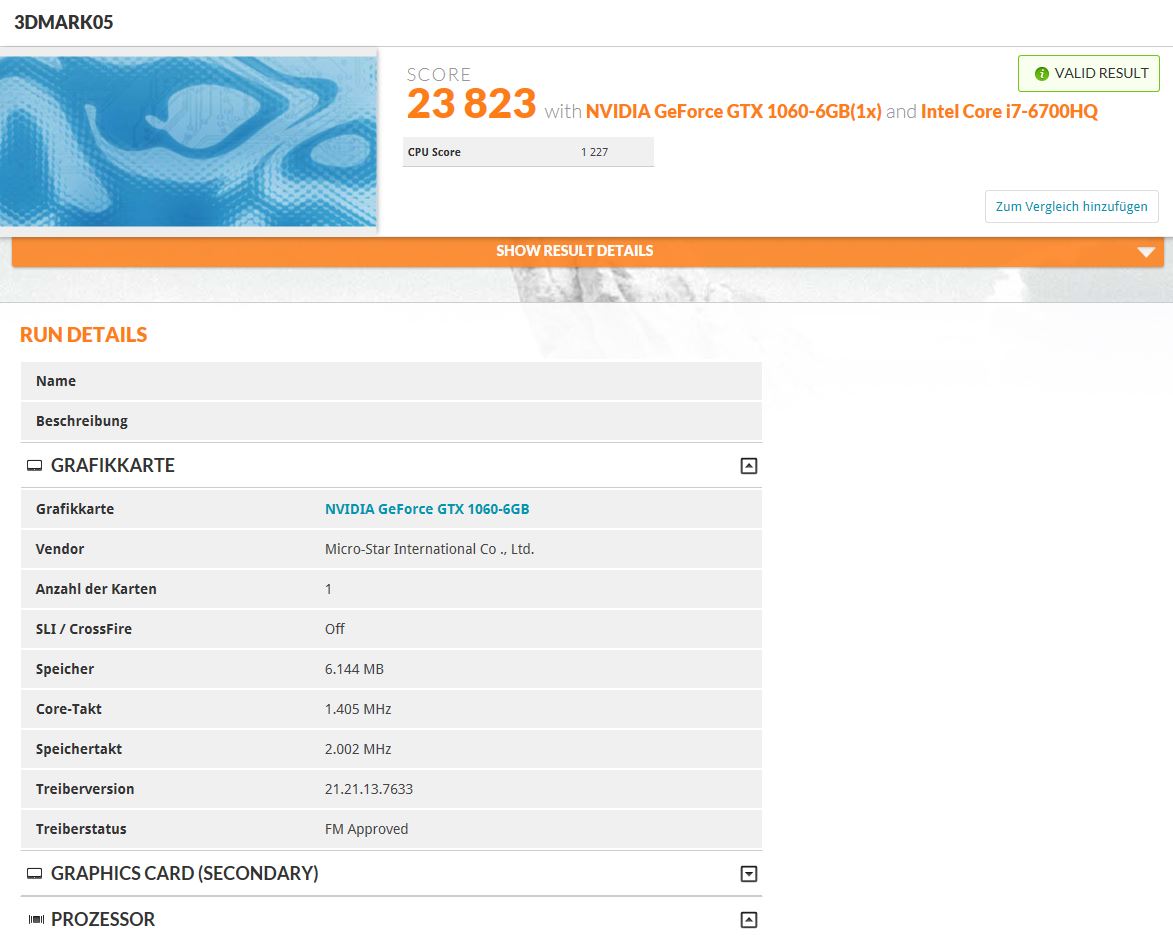
| 3DMark 05 Standard | 23823 puntos | |
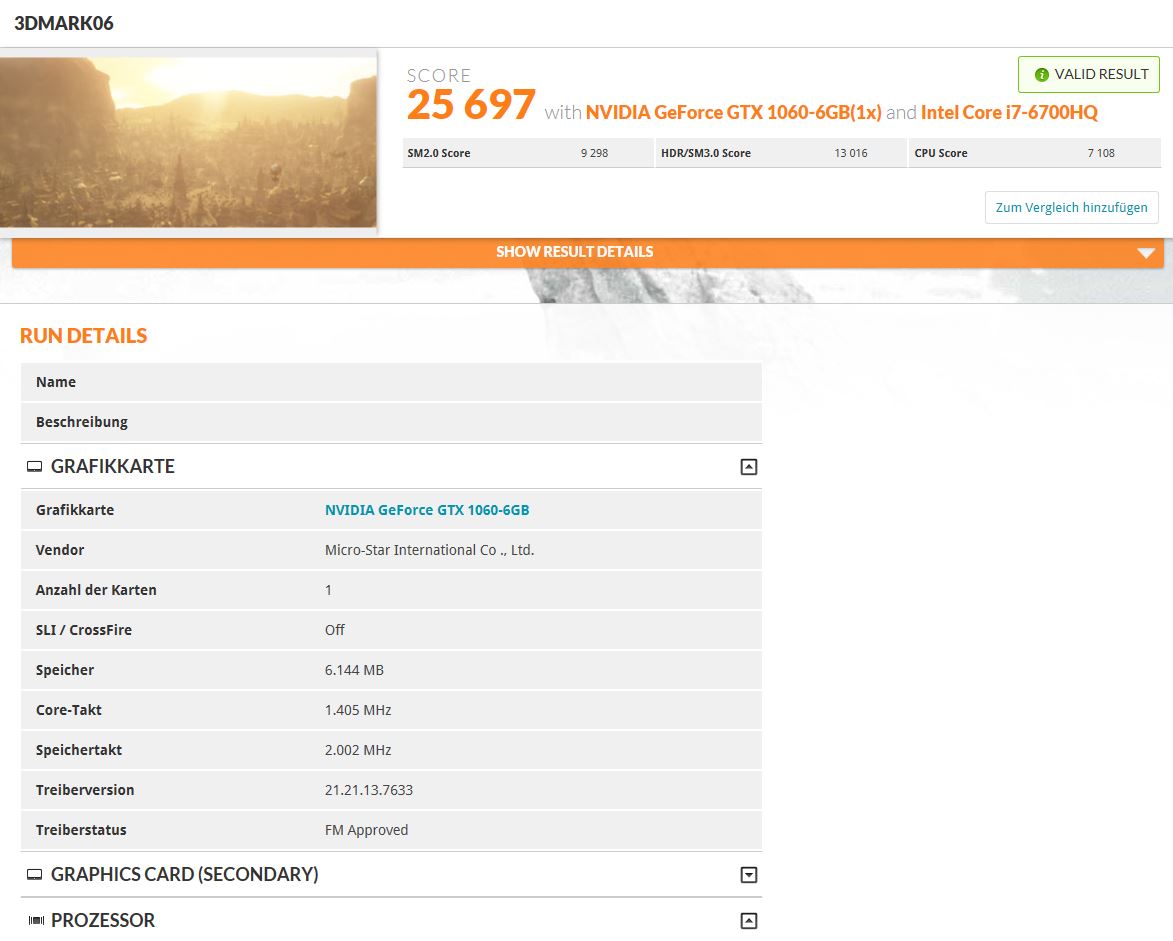
| 3DMark 06 Standard Score | 25697 puntos | |
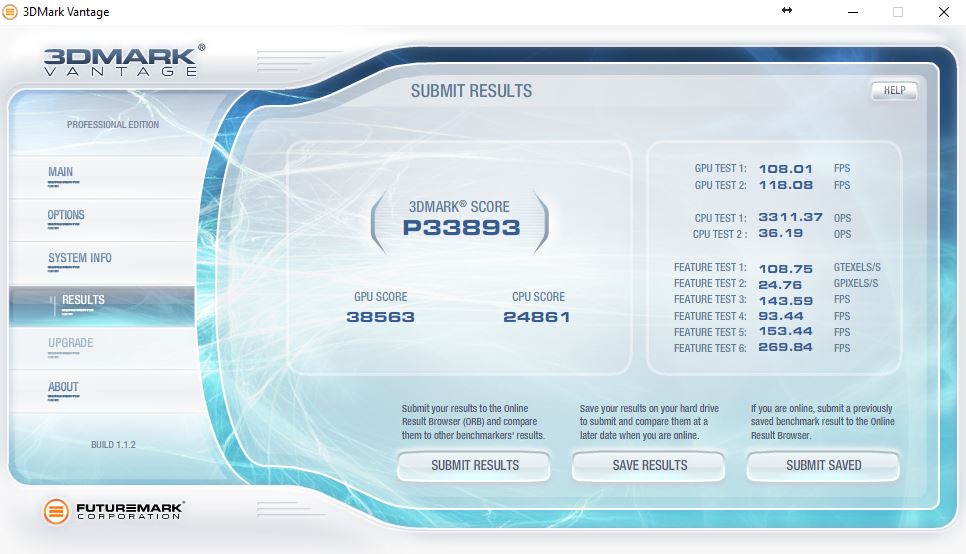
| 3DMark Vantage P Result | 33893 puntos | |
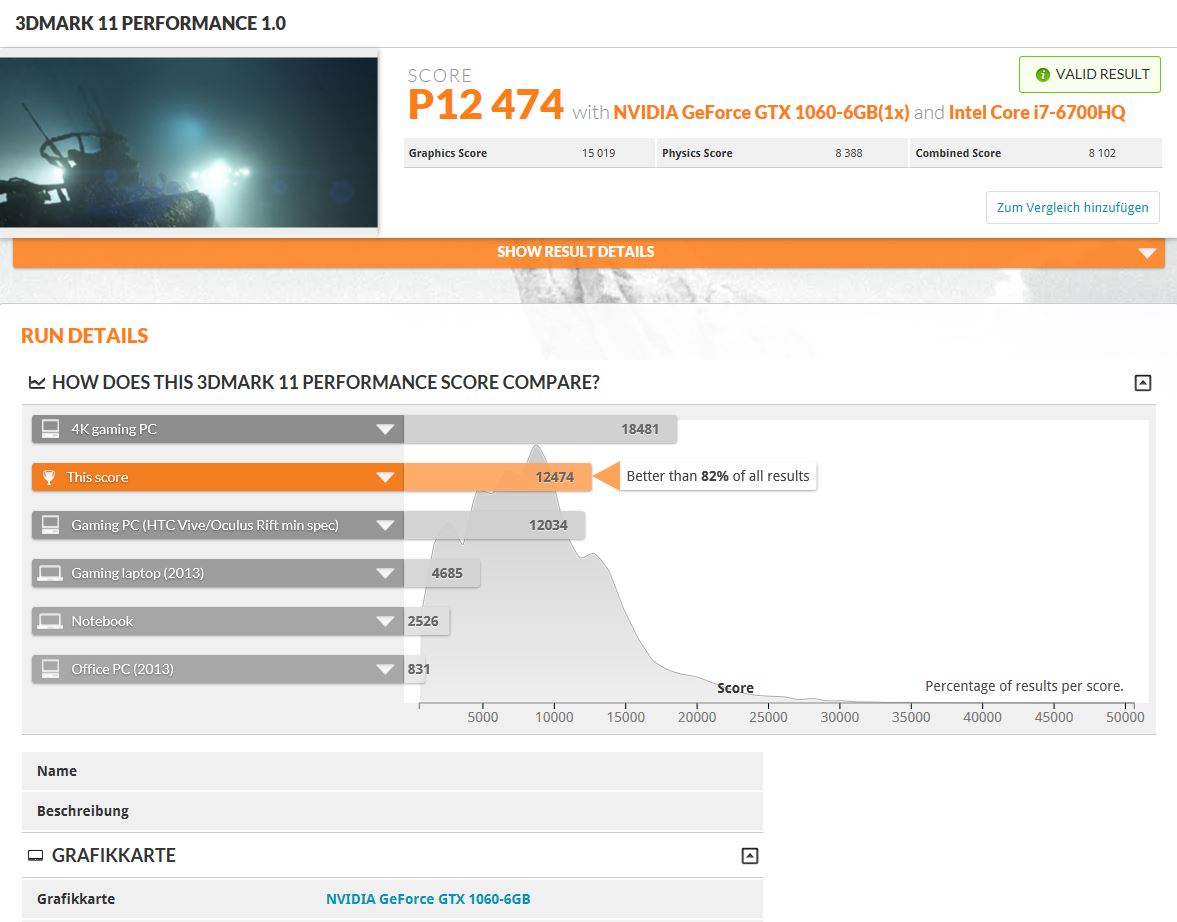
| 3DMark 11 Performance | 12474 puntos | |
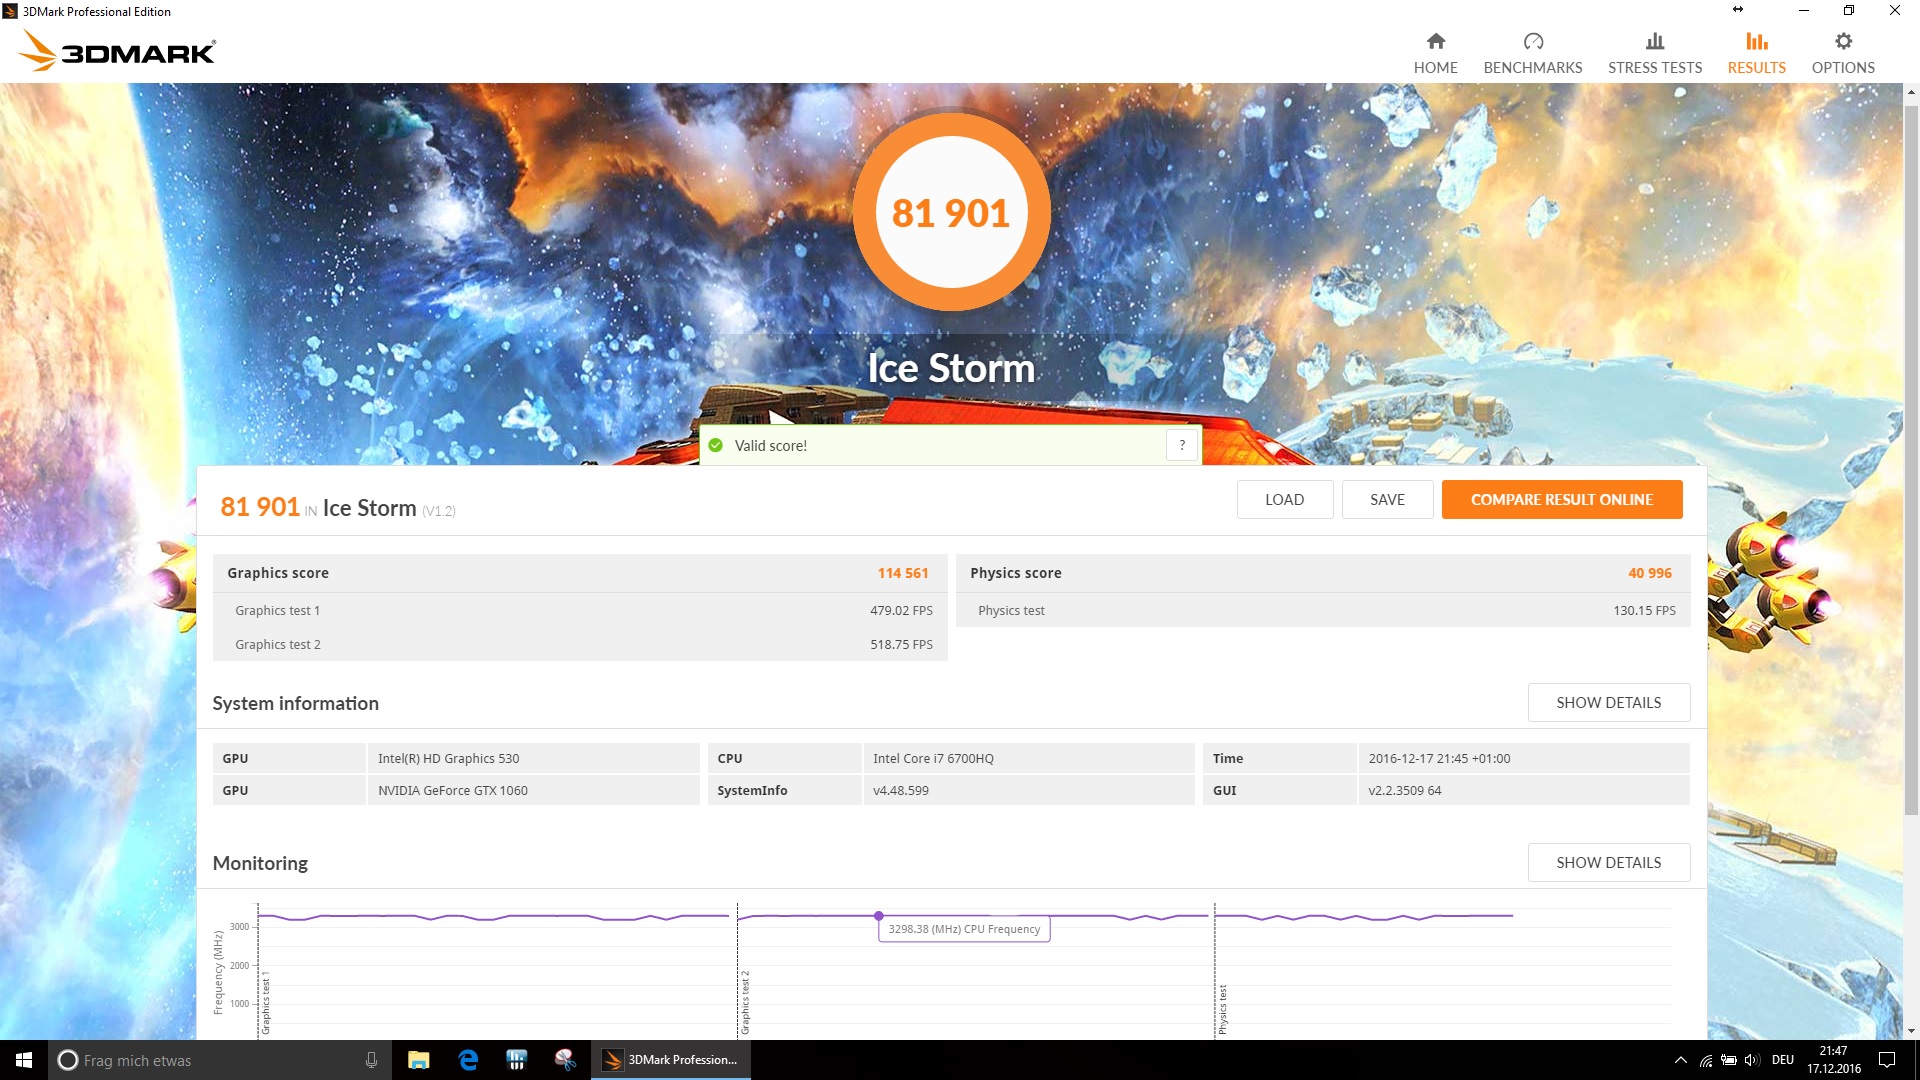
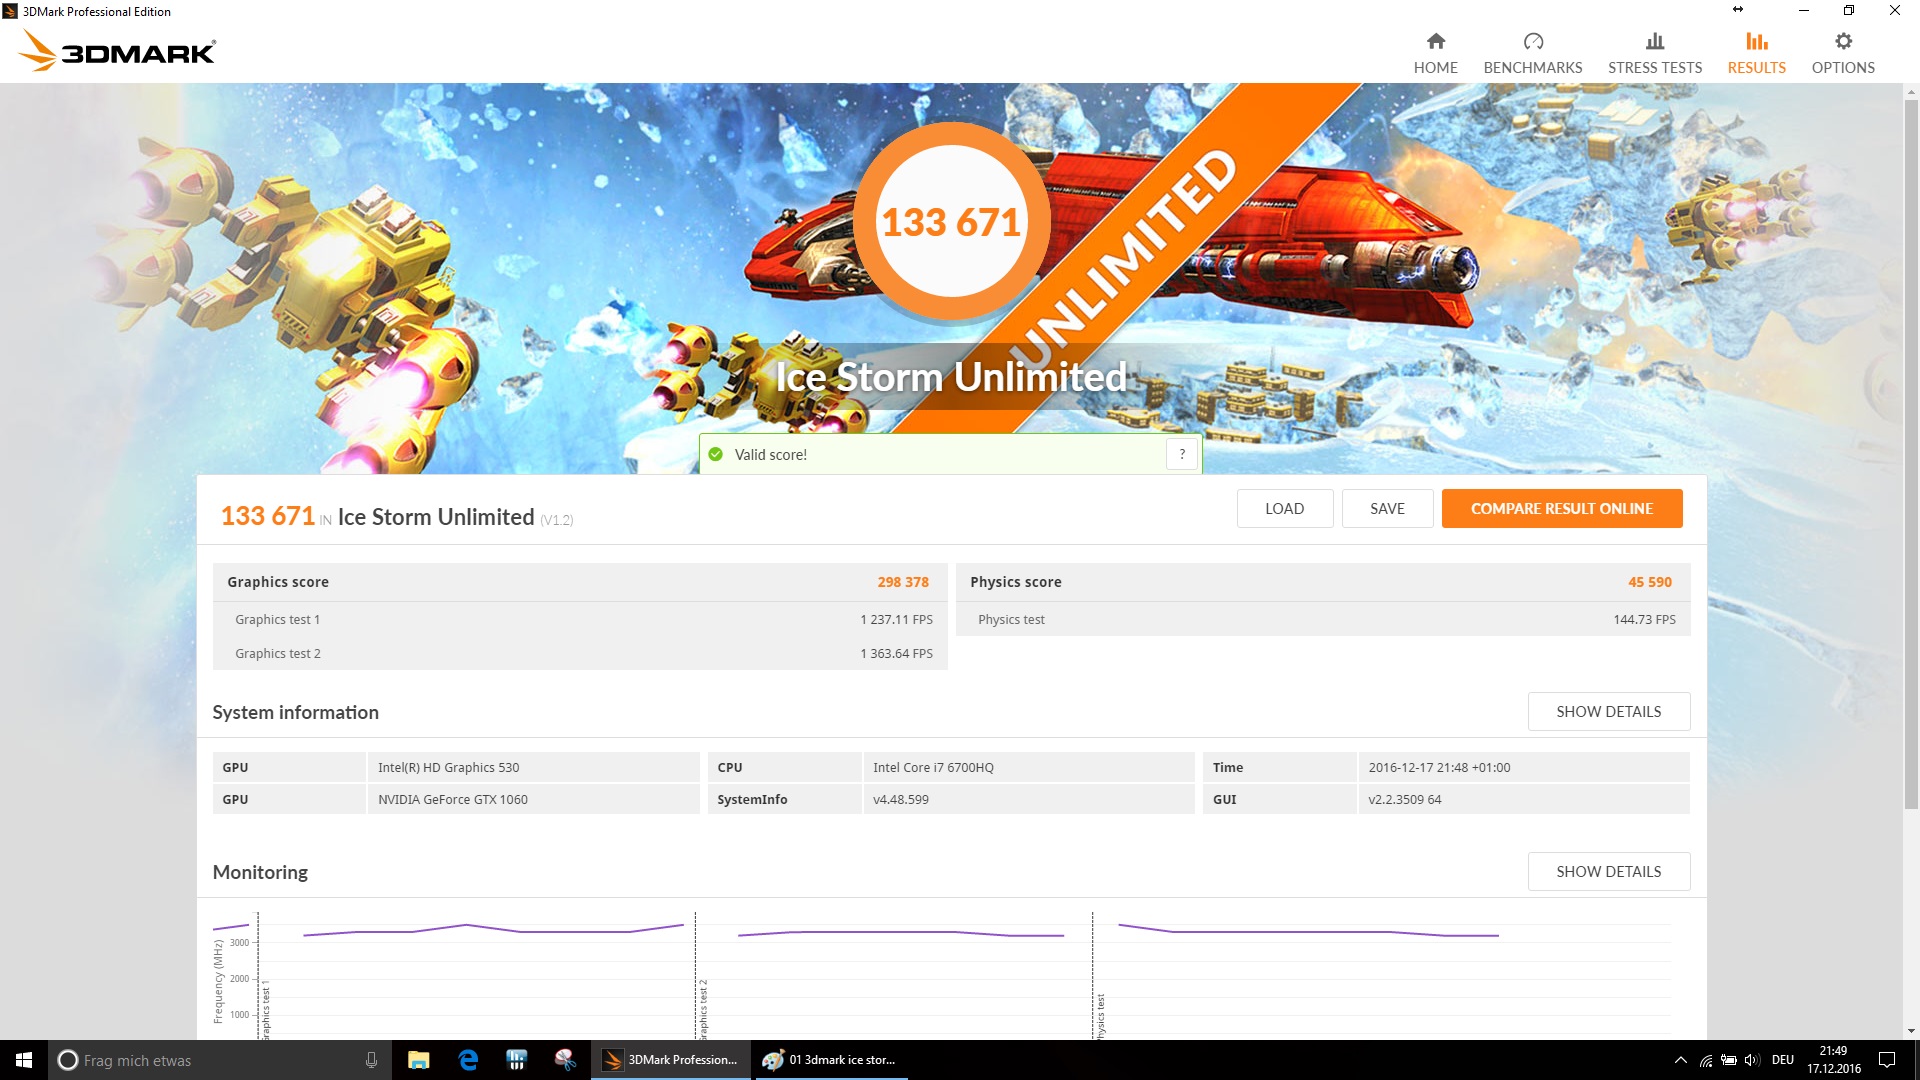
| 3DMark Ice Storm Standard Score | 81901 puntos | |
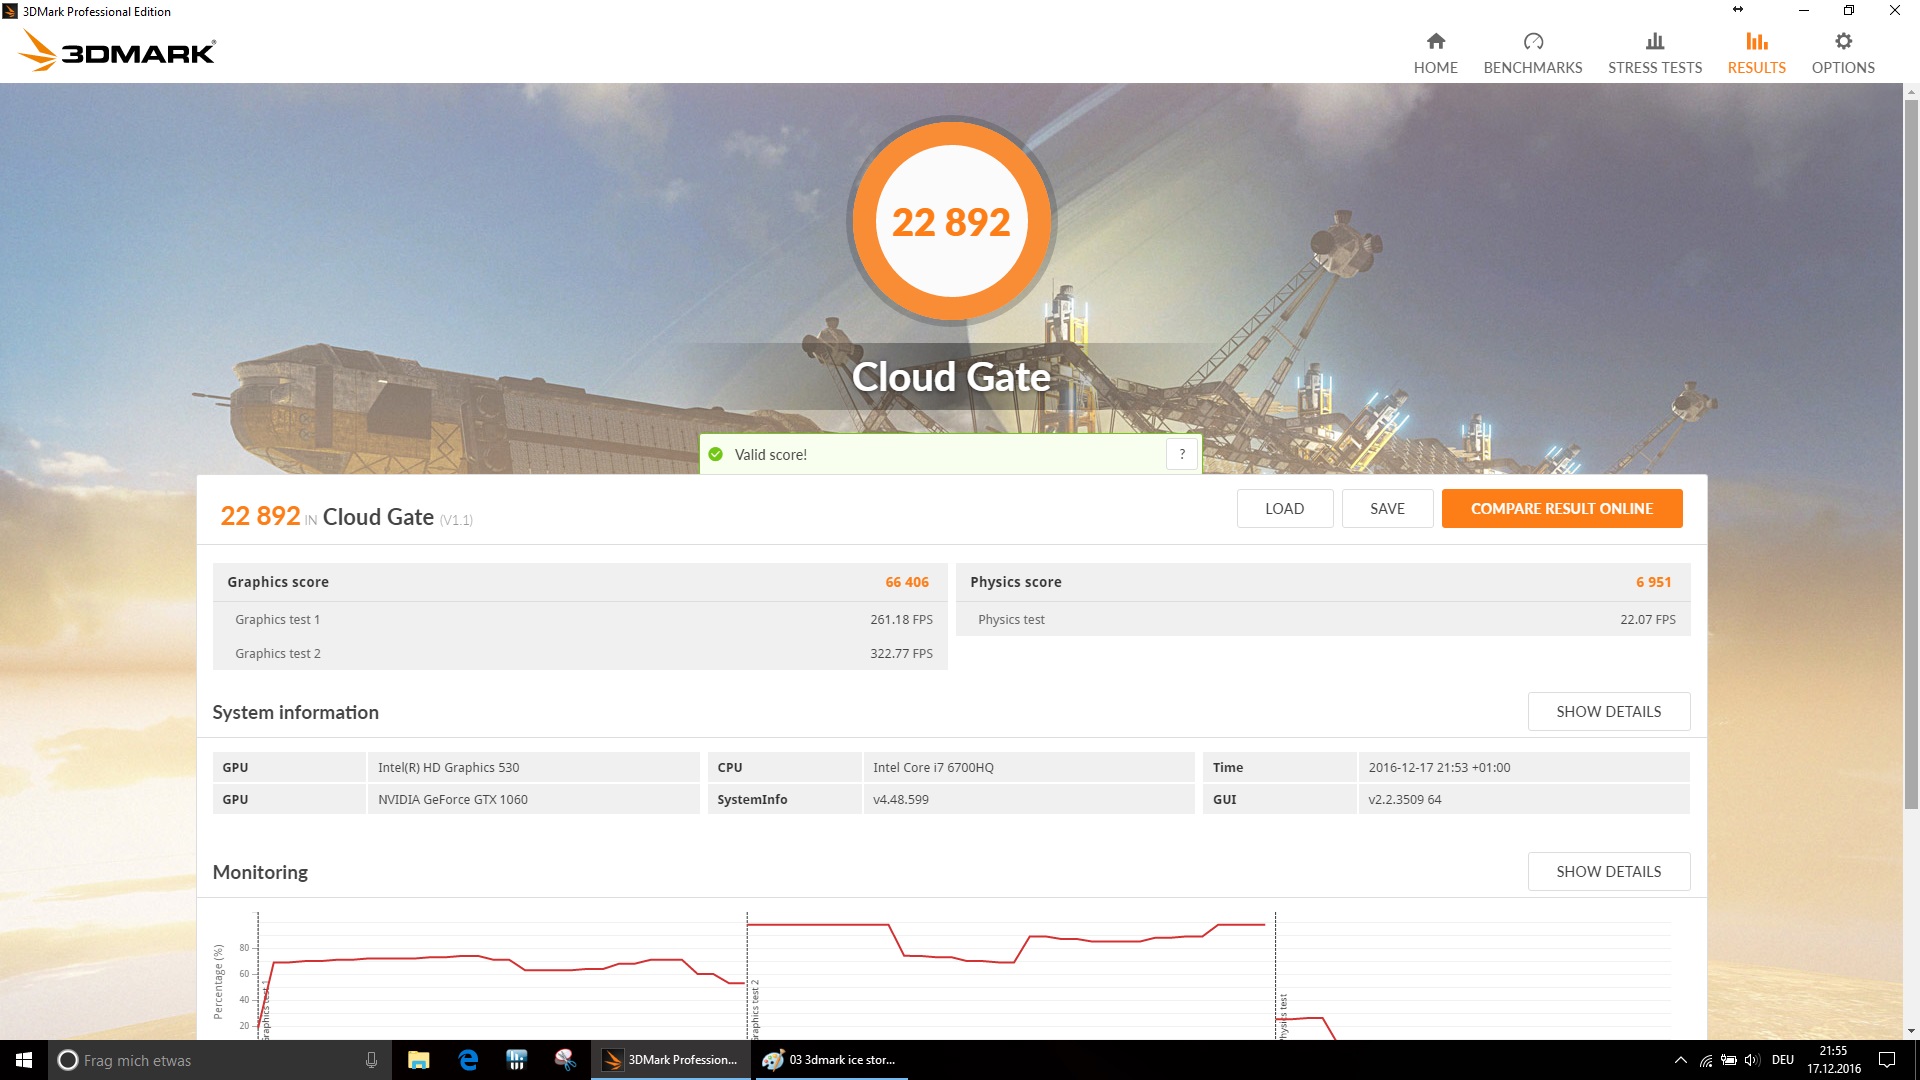
| 3DMark Cloud Gate Standard Score | 22892 puntos | |
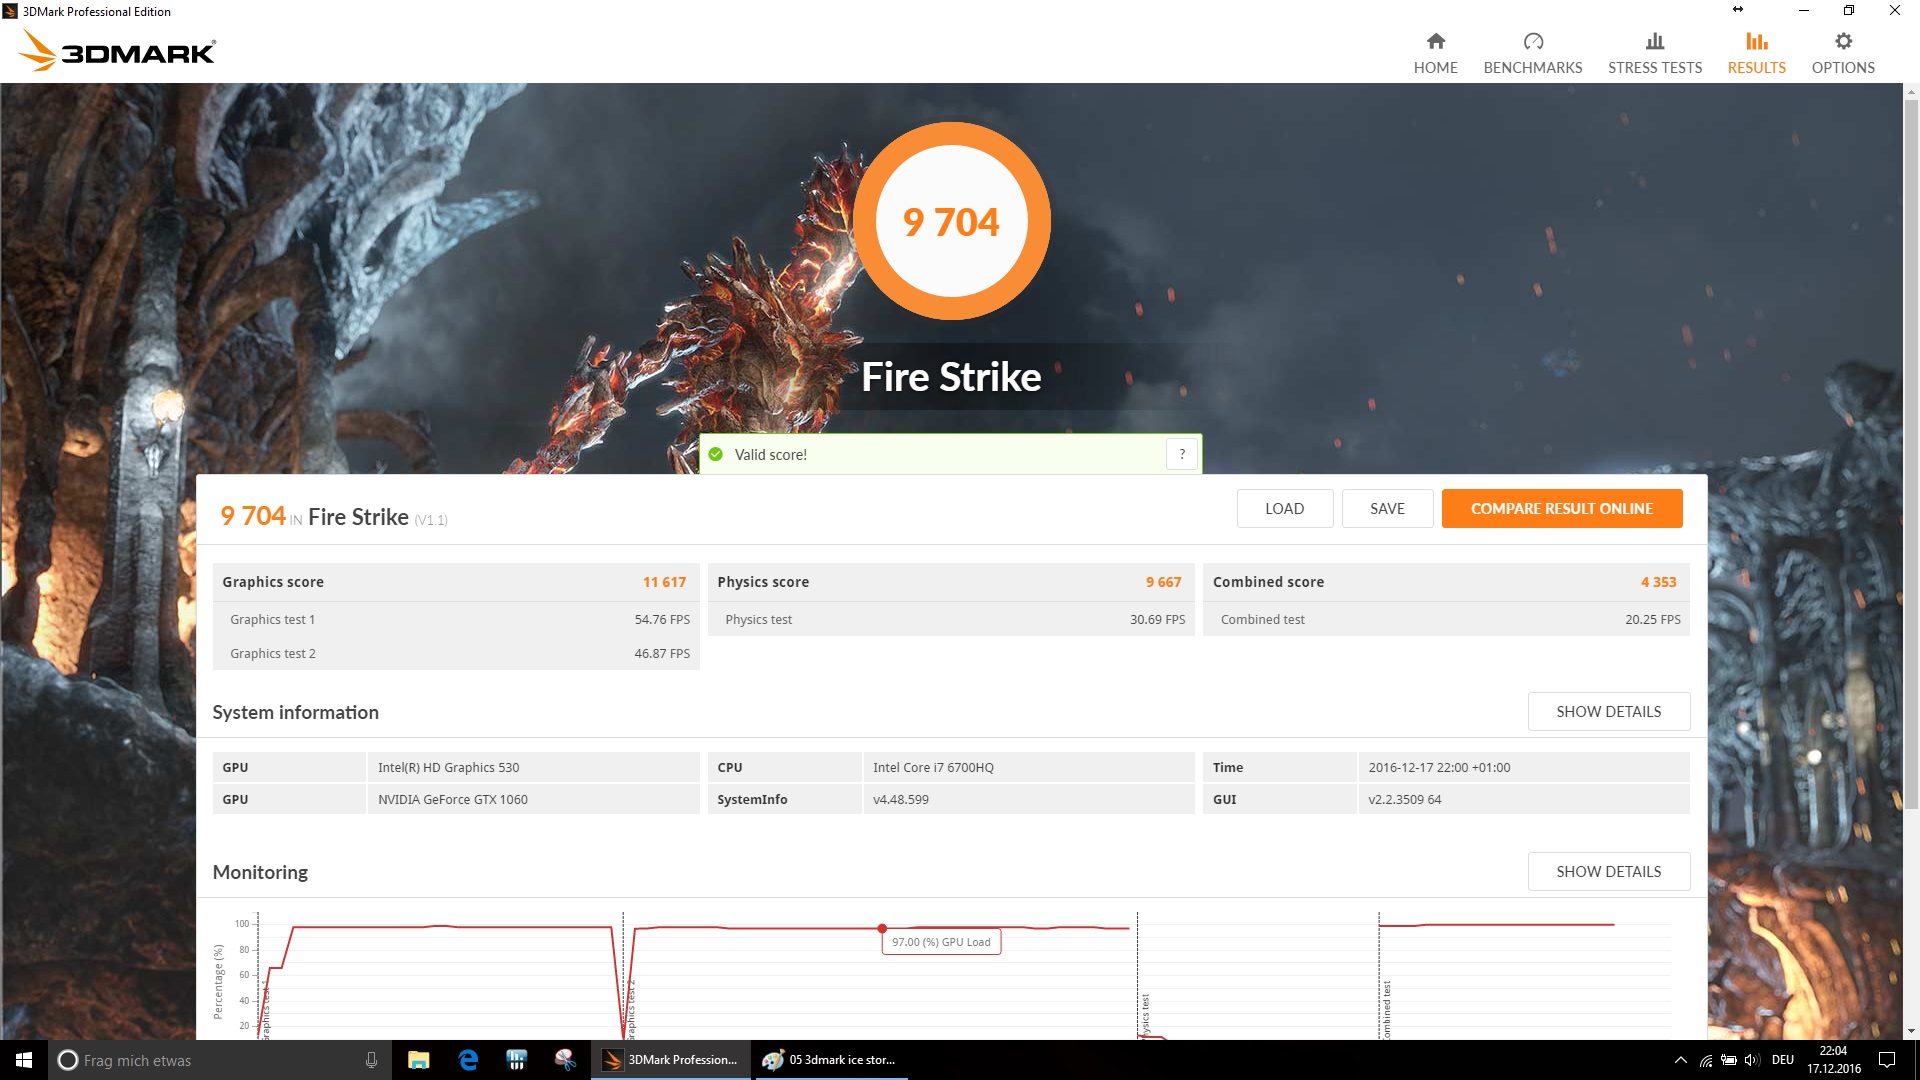
| 3DMark Fire Strike Score | 9704 puntos | |
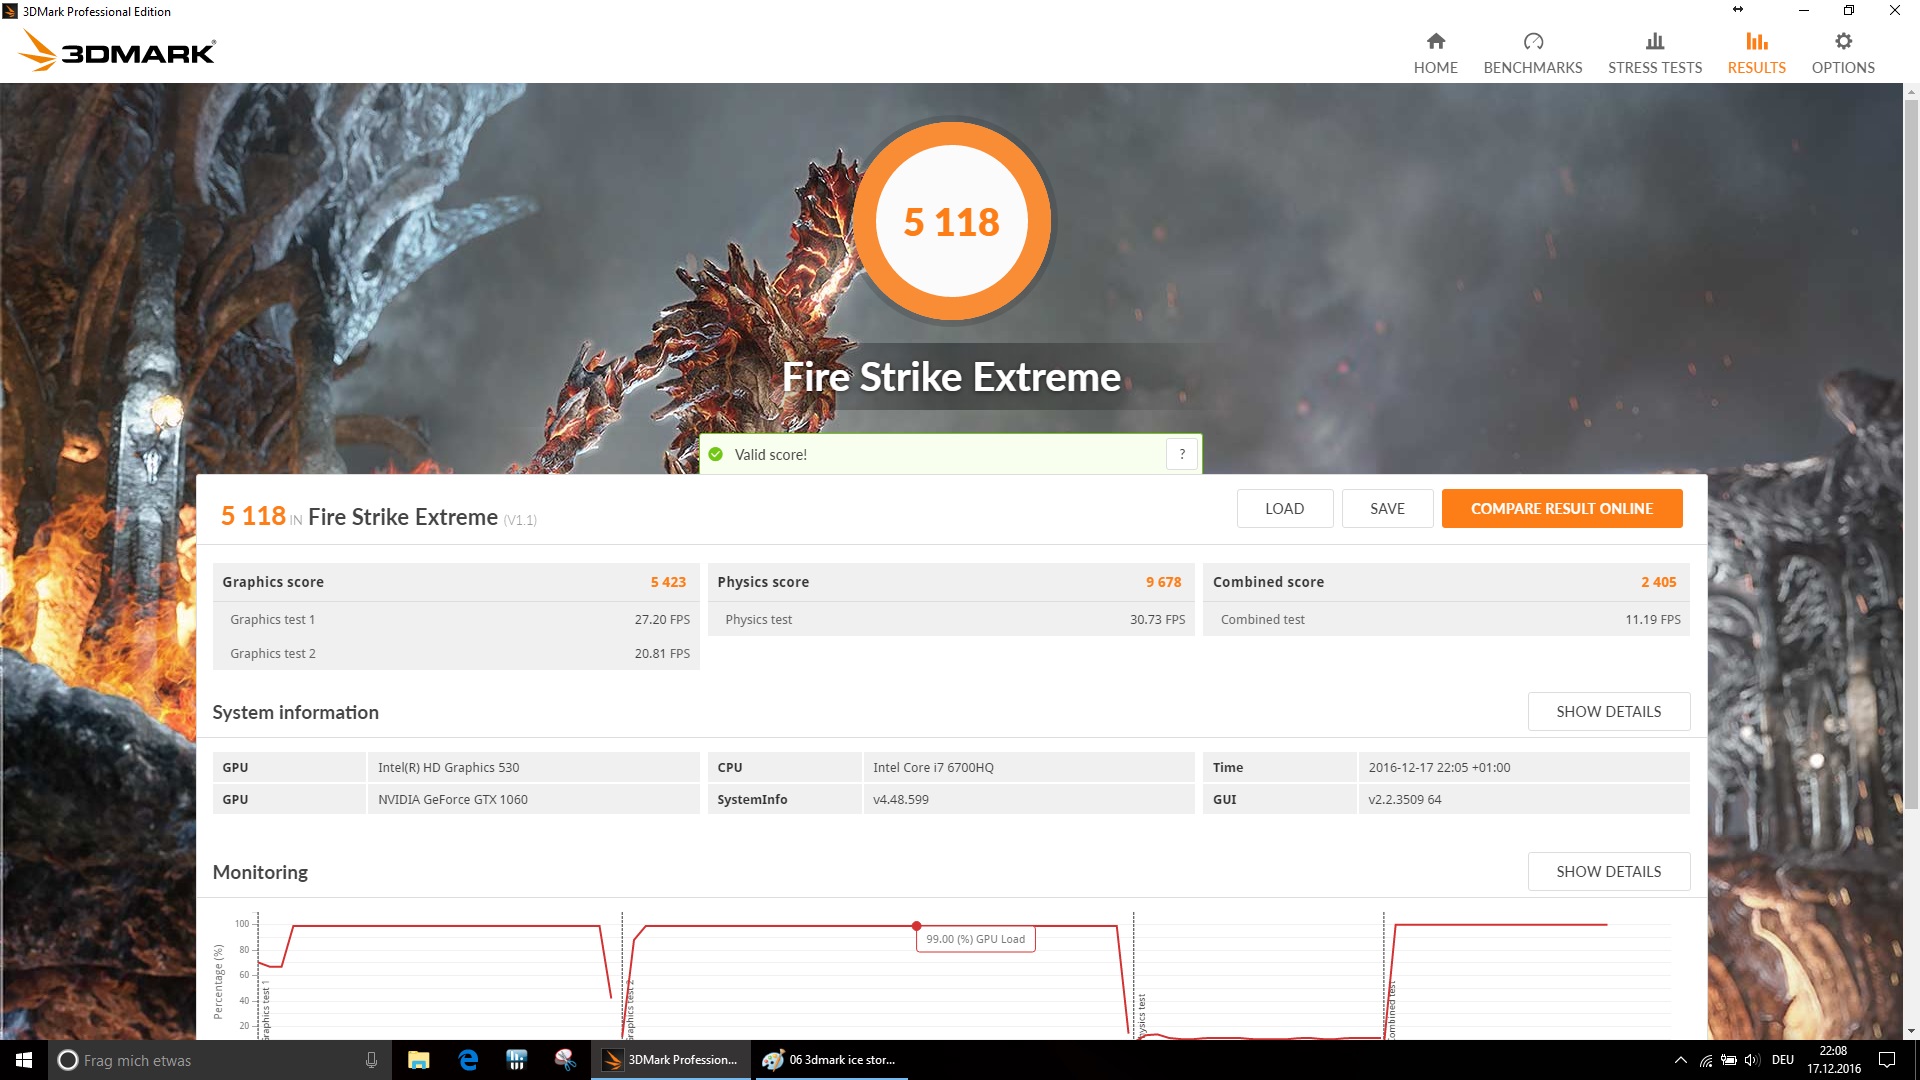
| 3DMark Fire Strike Extreme Score | 5118 puntos | |
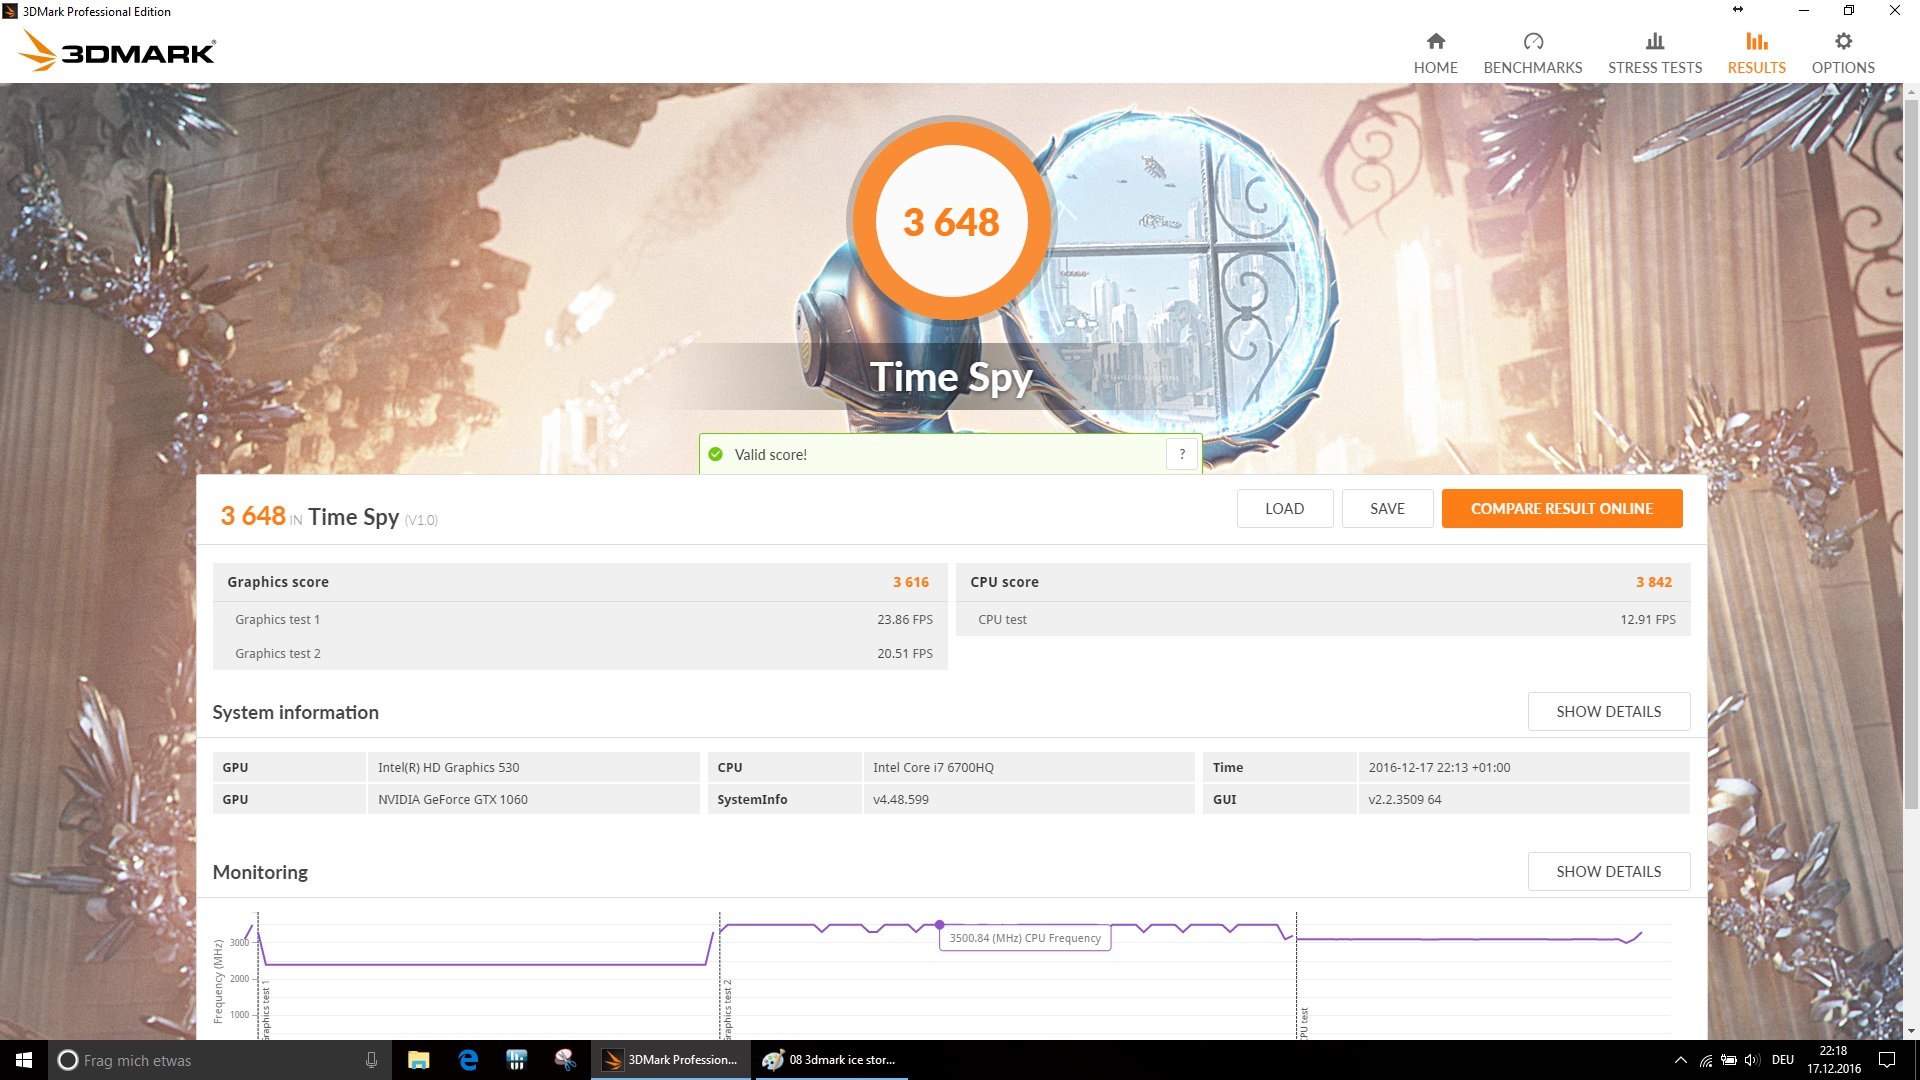
| 3DMark Time Spy Score | 3648 puntos | |
ayuda | ||
| Rise of the Tomb Raider | |
| 1920x1080 High Preset AA:FX AF:4x | |
| Aorus X7 v6 | |
| Acer Predator 17 G9-793-77LG | |
| HP Omen 17-w110ng | |
| Medion Erazer X7849 MD 60292 | |
| MSI GS73VR 6RF | |
| MSI GE72VR-6RF16H21 | |
| 1920x1080 Very High Preset AA:FX AF:16x | |
| Aorus X7 v6 | |
| HP Omen 17-w110ng | |
| Acer Predator 17 G9-793-77LG | |
| Medion Erazer X7849 MD 60292 | |
| MSI GS73VR 6RF | |
| MSI GE72VR-6RF16H21 | |
| Deus Ex Mankind Divided | |
| 1920x1080 High Preset AF:4x | |
| Aorus X7 v6 | |
| Medion Erazer X7849 MD 60292 | |
| MSI GE72VR-6RF16H21 | |
| Asus GL702VM-GC102D | |
| 1920x1080 Ultra Preset AA:2xMS AF:8x | |
| Aorus X7 v6 | |
| Medion Erazer X7849 MD 60292 | |
| MSI GE72VR-6RF16H21 | |
| Asus GL702VM-GC102D | |
| BioShock Infinite | |
| 1366x768 High Preset | |
| Asus GL702VM-GC102D | |
| HP Omen 17-w110ng | |
| MSI GE72VR-6RF16H21 | |
| MSI GS73VR 6RF | |
| 1920x1080 Ultra Preset, DX11 (DDOF) | |
| HP Omen 17-w110ng | |
| MSI GS73VR 6RF | |
| Asus GL702VM-GC102D | |
| MSI GE72VR-6RF16H21 | |
| The Witcher 3 | |
| 1920x1080 High Graphics & Postprocessing (Nvidia HairWorks Off) | |
| Acer Predator 17 G9-793-77LG | |
| HP Omen 17-w110ng | |
| MSI GE72VR-6RF16H21 | |
| 1920x1080 Ultra Graphics & Postprocessing (HBAO+) | |
| Acer Predator 17 G9-793-77LG | |
| HP Omen 17-w110ng | |
| MSI GE72VR-6RF16H21 | |
| bajo | medio | alto | ultra | 4K | |
|---|---|---|---|---|---|
| BioShock Infinite (2013) | 181.3 | 175.9 | 159.5 | 98 | |
| The Witcher 3 (2015) | 177 | 135.9 | 66.2 | 37.2 | 24.7 |
| Rise of the Tomb Raider (2016) | 180 | 132.4 | 71.3 | 58.8 | 23.7 |
| Deus Ex Mankind Divided (2016) | 113.9 | 100.3 | 57.1 | 30.1 |
Ruido
| Ocioso |
| 34 / 35 / 36 dB(A) |
| DVD |
| 41 / dB(A) |
| Carga |
| 40 / 51 dB(A) |
 | ||
30 dB silencioso 40 dB(A) audible 50 dB(A) ruidosamente alto |
||
min: | ||
| MSI GE72VR-6RF16H21 6700HQ, GeForce GTX 1060 Mobile | Asus GL702VM-GC102D 6700HQ, GeForce GTX 1060 Mobile | MSI GS73VR 6RF 6700HQ, GeForce GTX 1060 Mobile | Medion Erazer X7849 MD 60292 6820HK, GeForce GTX 1070 Mobile | HP Omen 17-w110ng 6700HQ, GeForce GTX 1070 Mobile | Acer Predator 17 G9-793-77LG 6700HQ, GeForce GTX 1070 Mobile | Aorus X7 v6 6820HK, GeForce GTX 1070 Mobile | |
|---|---|---|---|---|---|---|---|
| Noise | 7% | 2% | 0% | -1% | -2% | -3% | |
| apagado / medio ambiente * (dB) | 31 | 30.5 2% | 28.4 8% | 31.2 -1% | 30 3% | 31 -0% | 30 3% |
| Idle Minimum * (dB) | 34 | 31.4 8% | 31.9 6% | 31.2 8% | 33 3% | 33 3% | 33 3% |
| Idle Average * (dB) | 35 | 31.4 10% | 32 9% | 32.6 7% | 34 3% | 34 3% | 35 -0% |
| Idle Maximum * (dB) | 36 | 31.5 12% | 34 6% | 34.75 3% | 35 3% | 40 -11% | 40 -11% |
| Load Average * (dB) | 40 | 40.9 -2% | 47 -18% | 47.8 -19% | 45 -13% | 44 -10% | 43 -8% |
| Load Maximum * (dB) | 51 | 46.2 9% | 49.4 3% | 49.7 3% | 52 -2% | 50 2% | 54 -6% |
* ... más pequeño es mejor
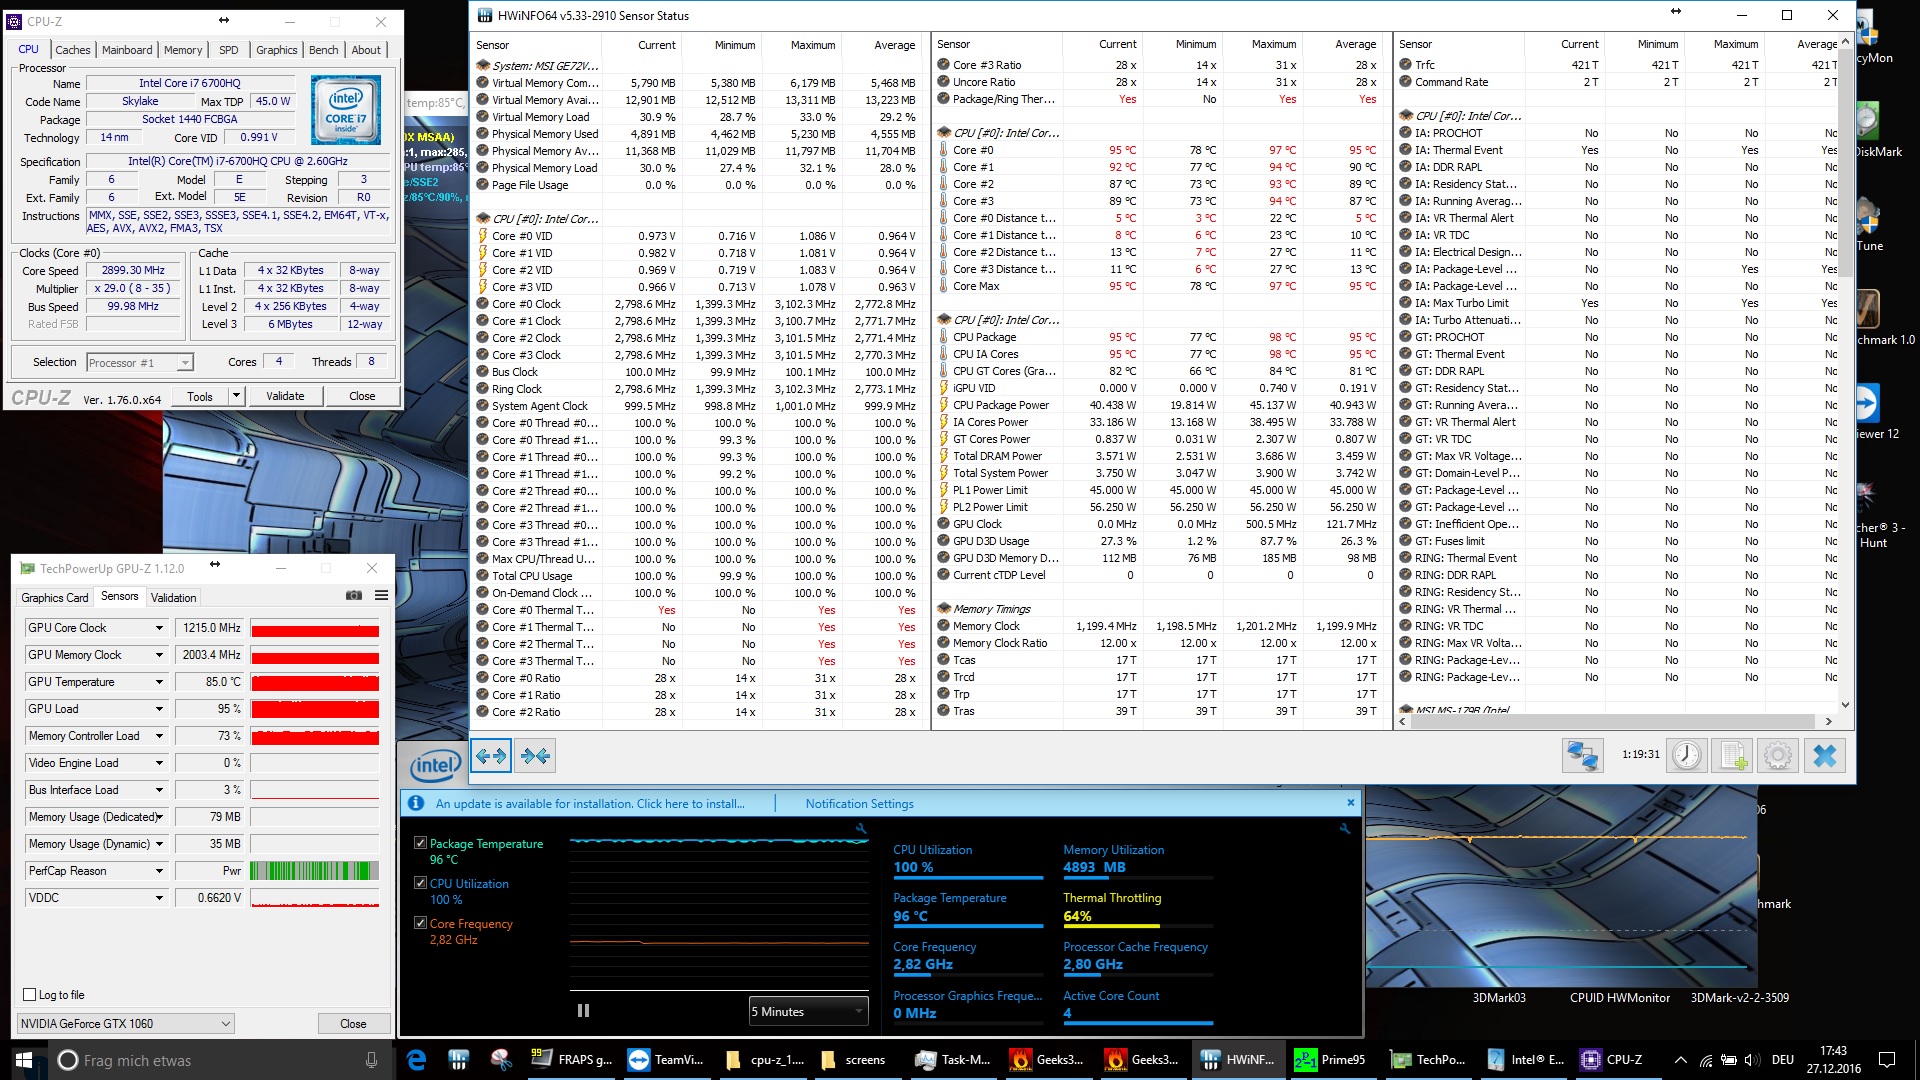
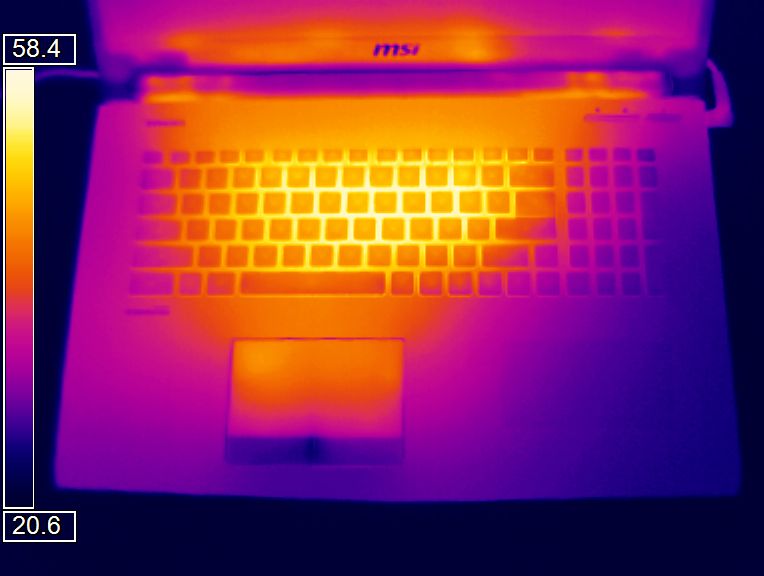
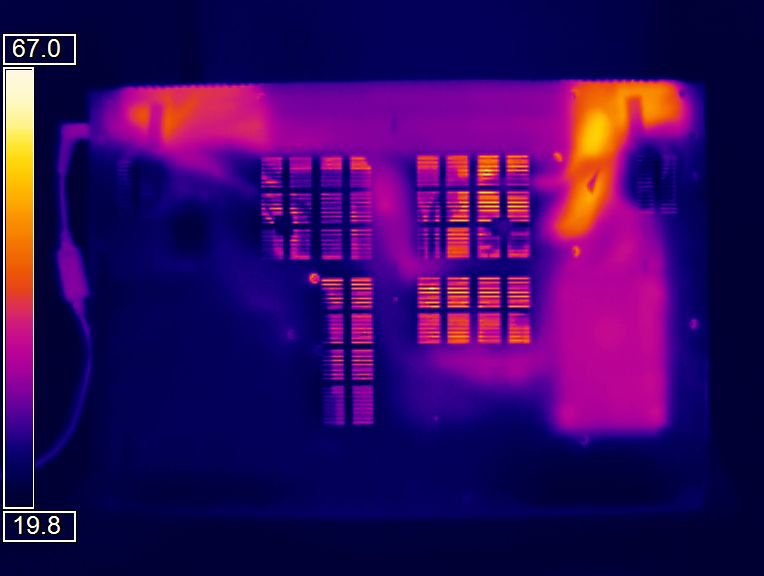
(-) La temperatura máxima en la parte superior es de 48.8 °C / 120 F, frente a la media de 40.4 °C / 105 F, que oscila entre 21.2 y 68.8 °C para la clase Gaming.
(-) El fondo se calienta hasta un máximo de 48.2 °C / 119 F, frente a la media de 43.2 °C / 110 F
(+) En reposo, la temperatura media de la parte superior es de 24.5 °C / 76# F, frente a la media del dispositivo de 33.9 °C / 93 F.
(-) El reposamanos y el touchpad pueden calentarse mucho al tacto con un máximo de 41.6 °C / 106.9 F.
(-) La temperatura media de la zona del reposamanos de dispositivos similares fue de 28.8 °C / 83.8 F (-12.8 °C / -23.1 F).
| MSI GE72VR-6RF16H21 6700HQ, GeForce GTX 1060 Mobile | Asus GL702VM-GC102D 6700HQ, GeForce GTX 1060 Mobile | MSI GS73VR 6RF 6700HQ, GeForce GTX 1060 Mobile | Medion Erazer X7849 MD 60292 6820HK, GeForce GTX 1070 Mobile | HP Omen 17-w110ng 6700HQ, GeForce GTX 1070 Mobile | Acer Predator 17 G9-793-77LG 6700HQ, GeForce GTX 1070 Mobile | Aorus X7 v6 6820HK, GeForce GTX 1070 Mobile | |
|---|---|---|---|---|---|---|---|
| Heat | -5% | -4% | -2% | 1% | 4% | 0% | |
| Maximum Upper Side * (°C) | 48.8 | 53.1 -9% | 50.8 -4% | 53.3 -9% | 45 8% | 42.6 13% | 47.5 3% |
| Maximum Bottom * (°C) | 48.2 | 44.9 7% | 60 -24% | 50 -4% | 54.3 -13% | 44.9 7% | 54.5 -13% |
| Idle Upper Side * (°C) | 30.1 | 32.9 -9% | 27.4 9% | 30.3 -1% | 29.6 2% | 33.1 -10% | 28.6 5% |
| Idle Bottom * (°C) | 30.4 | 33.4 -10% | 28.8 5% | 28 8% | 28.6 6% | 28.9 5% | 28.8 5% |
* ... más pequeño es mejor
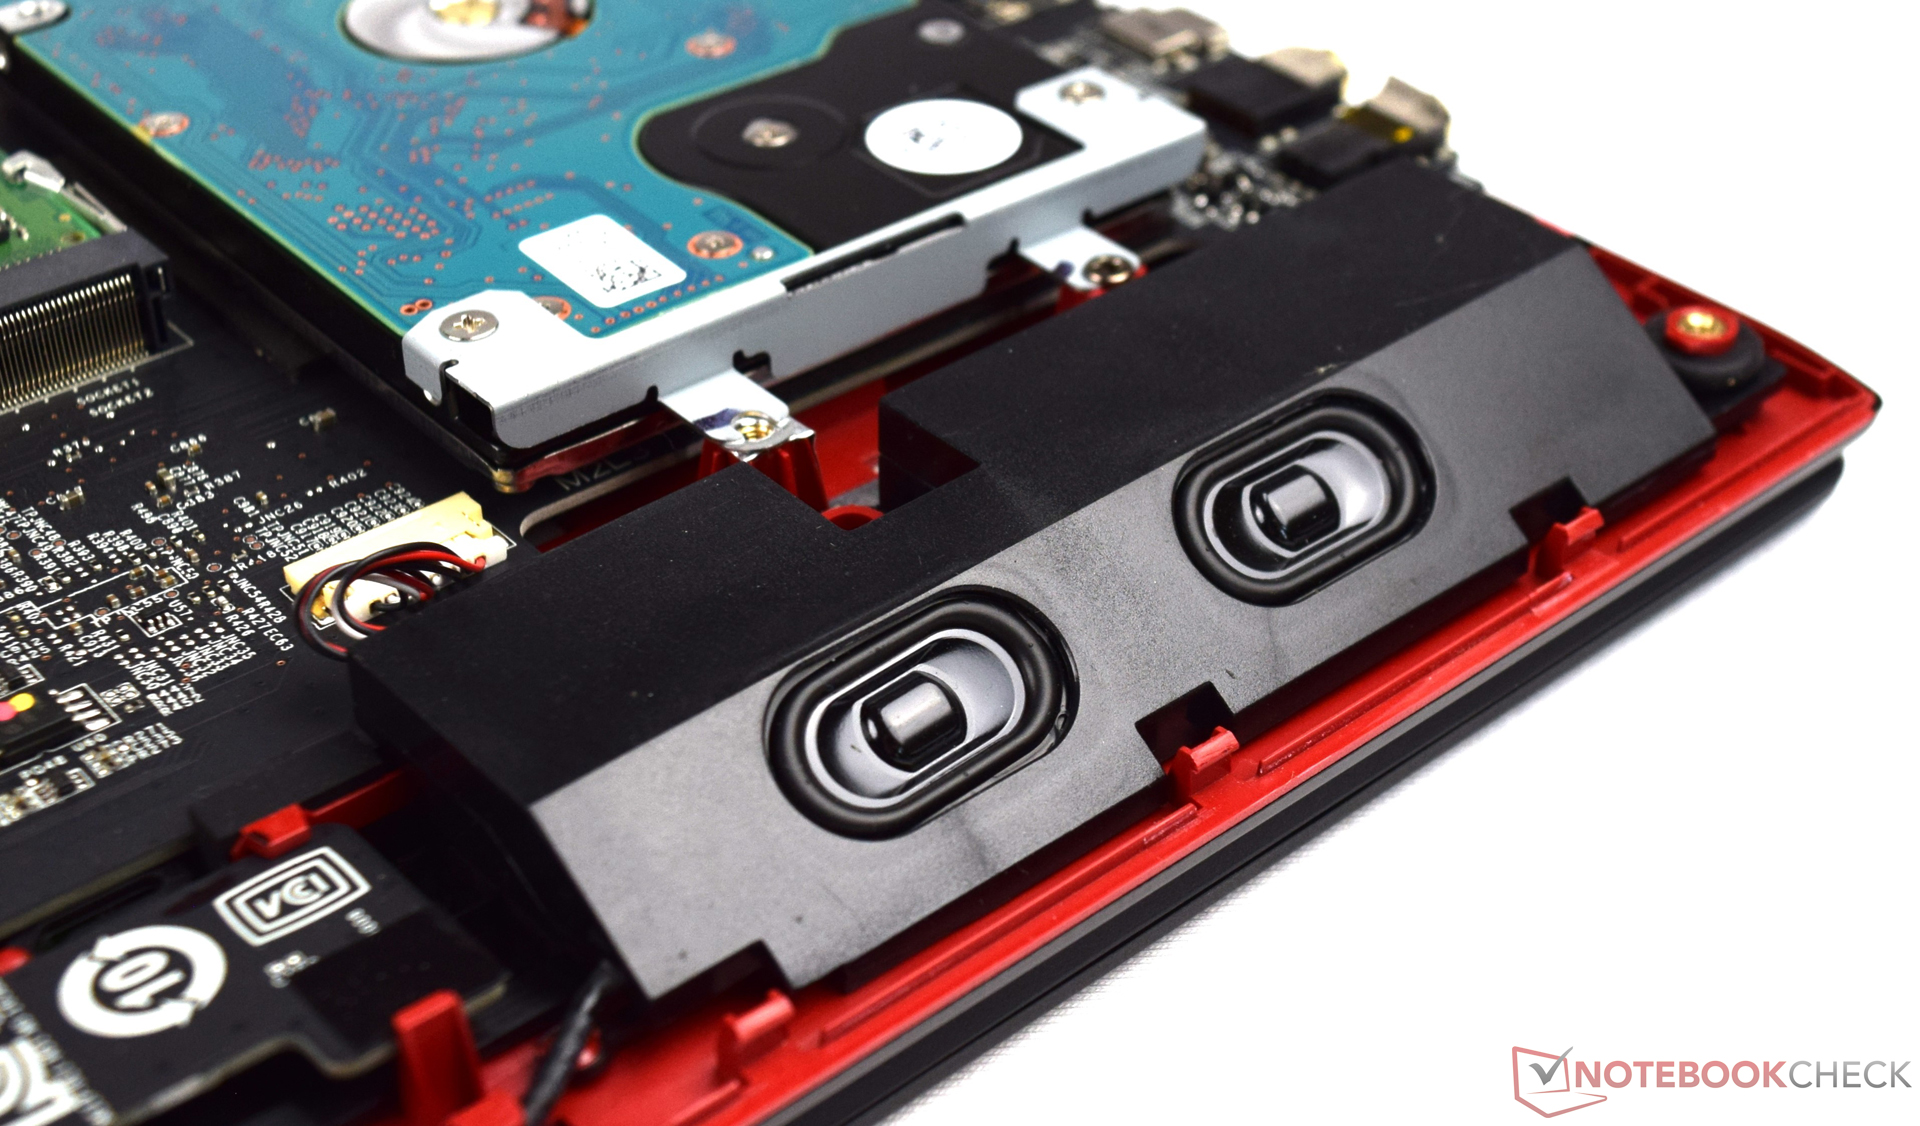
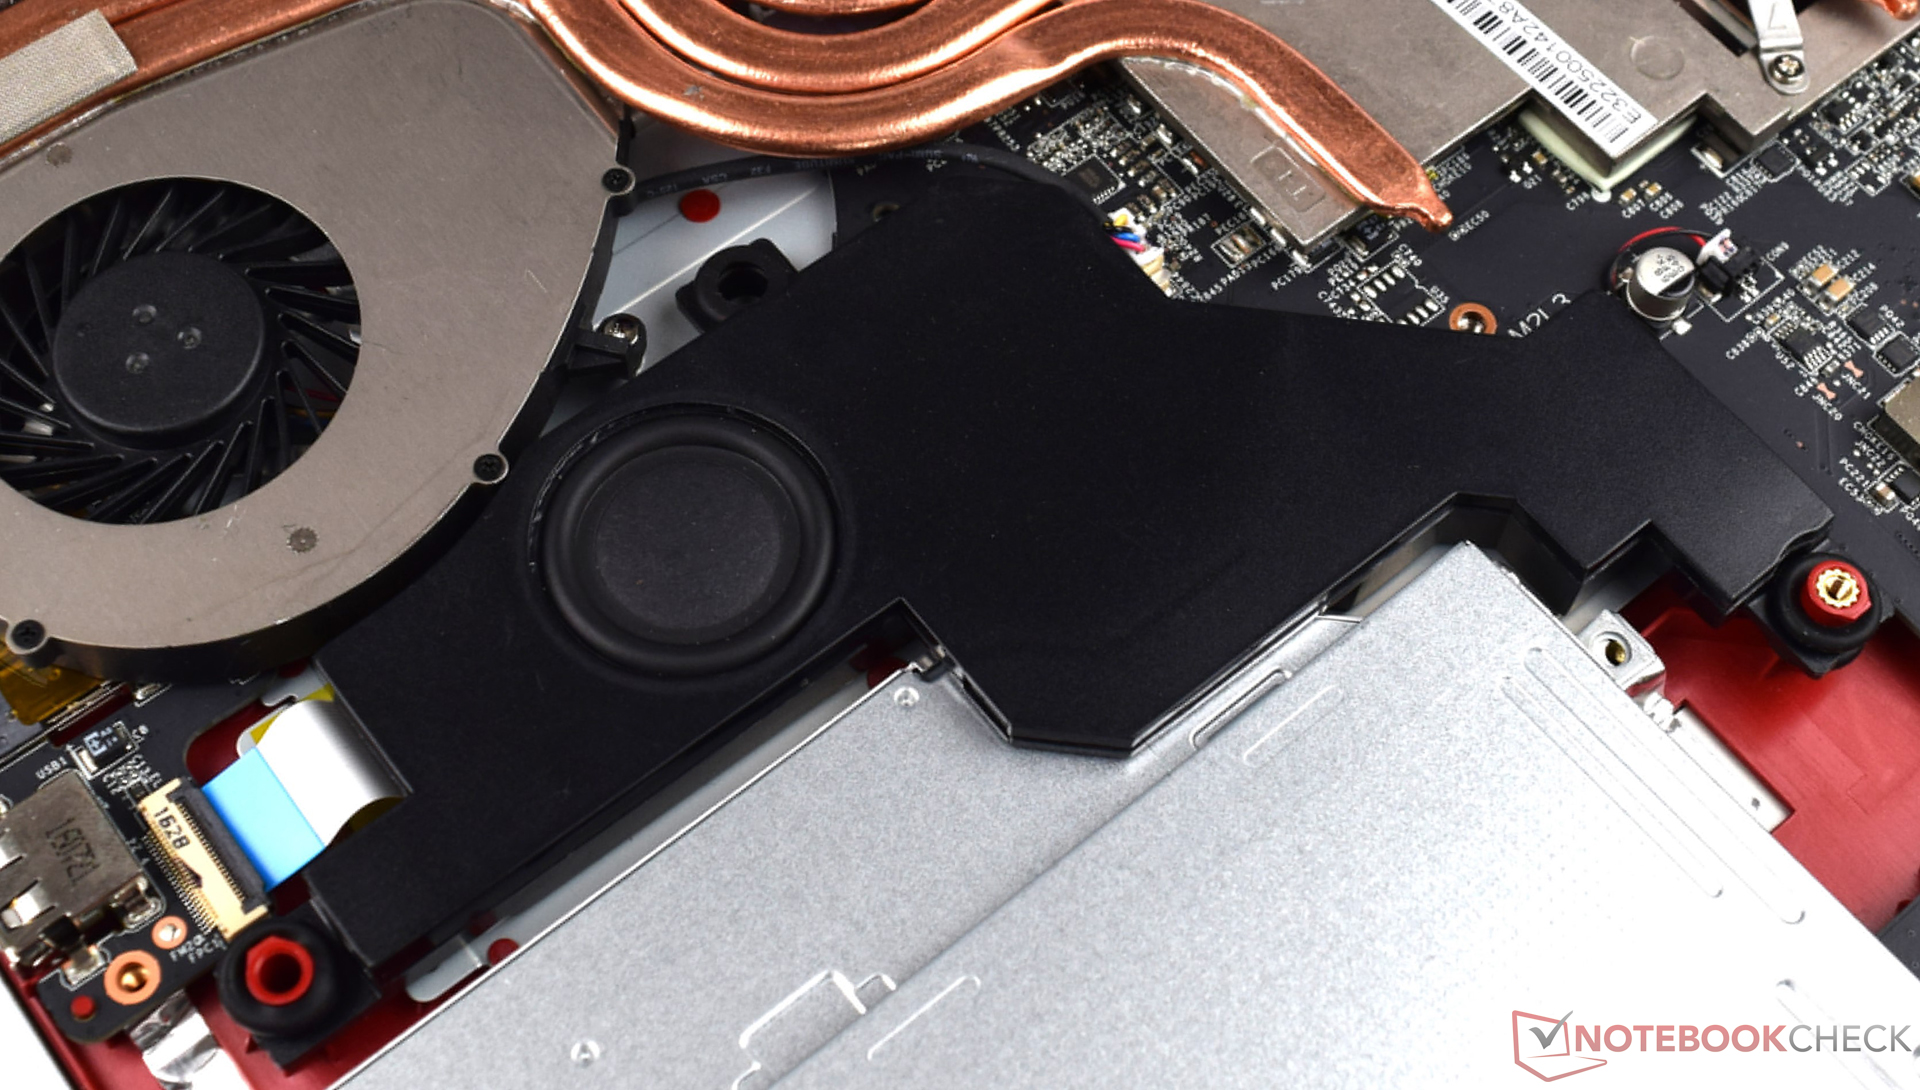
MSI GE72VR-6RF16H21 análisis de audio
(+) | los altavoces pueden reproducir a un volumen relativamente alto (#92 dB)
Graves 100 - 315 Hz
(±) | lubina reducida - en promedio 14.4% inferior a la mediana
(±) | la linealidad de los graves es media (9.3% delta a frecuencia anterior)
Medios 400 - 2000 Hz
(+) | medios equilibrados - a sólo 2.6% de la mediana
(+) | los medios son lineales (3.3% delta a la frecuencia anterior)
Altos 2 - 16 kHz
(+) | máximos equilibrados - a sólo 3.1% de la mediana
(+) | los máximos son lineales (6.5% delta a la frecuencia anterior)
Total 100 - 16.000 Hz
(+) | el sonido global es lineal (12.2% de diferencia con la mediana)
En comparación con la misma clase
» 13% de todos los dispositivos probados de esta clase eran mejores, 4% similares, 83% peores
» El mejor tuvo un delta de 6%, la media fue 18%, el peor fue ###max##%
En comparación con todos los dispositivos probados
» 10% de todos los dispositivos probados eran mejores, 2% similares, 88% peores
» El mejor tuvo un delta de 4%, la media fue 24%, el peor fue ###max##%
HP Omen 17-w110ng análisis de audio
(+) | los altavoces pueden reproducir a un volumen relativamente alto (#85 dB)
Graves 100 - 315 Hz
(-) | casi sin bajos - de media 22.3% inferior a la mediana
(±) | la linealidad de los graves es media (13.2% delta a frecuencia anterior)
Medios 400 - 2000 Hz
(+) | medios equilibrados - a sólo 2.7% de la mediana
(+) | los medios son lineales (4.9% delta a la frecuencia anterior)
Altos 2 - 16 kHz
(±) | máximos más altos - de media 5.9% más altos que la mediana
(+) | los máximos son lineales (5.3% delta a la frecuencia anterior)
Total 100 - 16.000 Hz
(±) | la linealidad del sonido global es media (18.5% de diferencia con la mediana)
En comparación con la misma clase
» 60% de todos los dispositivos probados de esta clase eran mejores, 8% similares, 32% peores
» El mejor tuvo un delta de 6%, la media fue 18%, el peor fue ###max##%
En comparación con todos los dispositivos probados
» 41% de todos los dispositivos probados eran mejores, 8% similares, 51% peores
» El mejor tuvo un delta de 4%, la media fue 24%, el peor fue ###max##%
| Off / Standby | |
| Ocioso | |
| Carga |
|
Clave:
min: | |
| MSI GE72VR-6RF16H21 6700HQ, GeForce GTX 1060 Mobile | Asus GL702VM-GC102D 6700HQ, GeForce GTX 1060 Mobile | MSI GS73VR 6RF 6700HQ, GeForce GTX 1060 Mobile | Medion Erazer X7849 MD 60292 6820HK, GeForce GTX 1070 Mobile | HP Omen 17-w110ng 6700HQ, GeForce GTX 1070 Mobile | Acer Predator 17 G9-793-77LG 6700HQ, GeForce GTX 1070 Mobile | Aorus X7 v6 6820HK, GeForce GTX 1070 Mobile | |
|---|---|---|---|---|---|---|---|
| Power Consumption | 0% | -40% | -10% | -22% | -60% | -62% | |
| Idle Minimum * (Watt) | 13 | 15.6 -20% | 22.6 -74% | 14 -8% | 19 -46% | 25 -92% | 29 -123% |
| Idle Average * (Watt) | 20 | 20.2 -1% | 32.7 -64% | 20 -0% | 25 -25% | 35 -75% | 31 -55% |
| Idle Maximum * (Watt) | 26 | 21.4 18% | 32.8 -26% | 23.8 8% | 31 -19% | 46 -77% | 38 -46% |
| Load Average * (Watt) | 83 | 90 -8% | 114.7 -38% | 103 -24% | 90 -8% | 103 -24% | 111 -34% |
| Load Maximum * (Watt) | 169 | 147 13% | 167.9 1% | 212 -25% | 193 -14% | 223 -32% | 253 -50% |
* ... más pequeño es mejor

| MSI GE72VR-6RF16H21 51 Wh | Asus GL702VM-GC102D 76 Wh | MSI GS73VR 6RF 65 Wh | Medion Erazer X7849 MD 60292 60 Wh | HP Omen 17-w110ng 95 Wh | Acer Predator 17 G9-793-77LG 88 Wh | Aorus X7 v6 94 Wh | |
|---|---|---|---|---|---|---|---|
| Duración de Batería | 90% | 62% | -4% | 108% | 64% | 25% | |
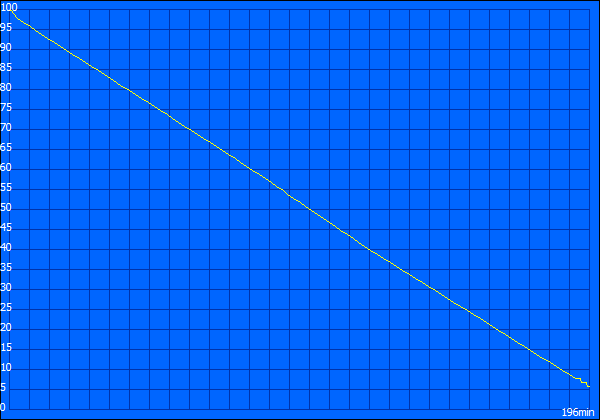
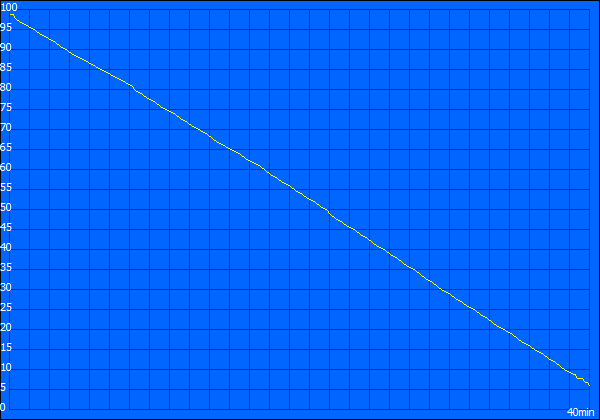
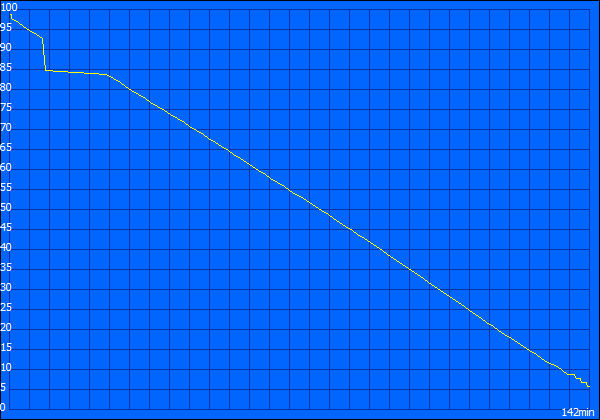
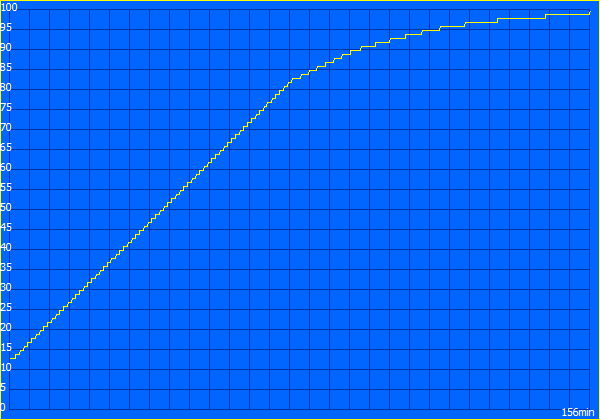
| Reader / Idle (h) | 3.3 | 5.9 79% | 5.9 79% | 2.7 -18% | 7.2 118% | 4.6 39% | |
| H.264 (h) | 2.3 | 4.4 91% | 3.9 70% | ||||
| WiFi v1.3 (h) | 2.4 | 4.2 75% | 3.6 50% | 1.5 -37% | 4.1 71% | 3.3 38% | 3 25% |
| Load (h) | 0.7 | 1.5 114% | 1.1 57% | 1 43% | 1.9 171% | 1.5 114% |
Pro
Contra

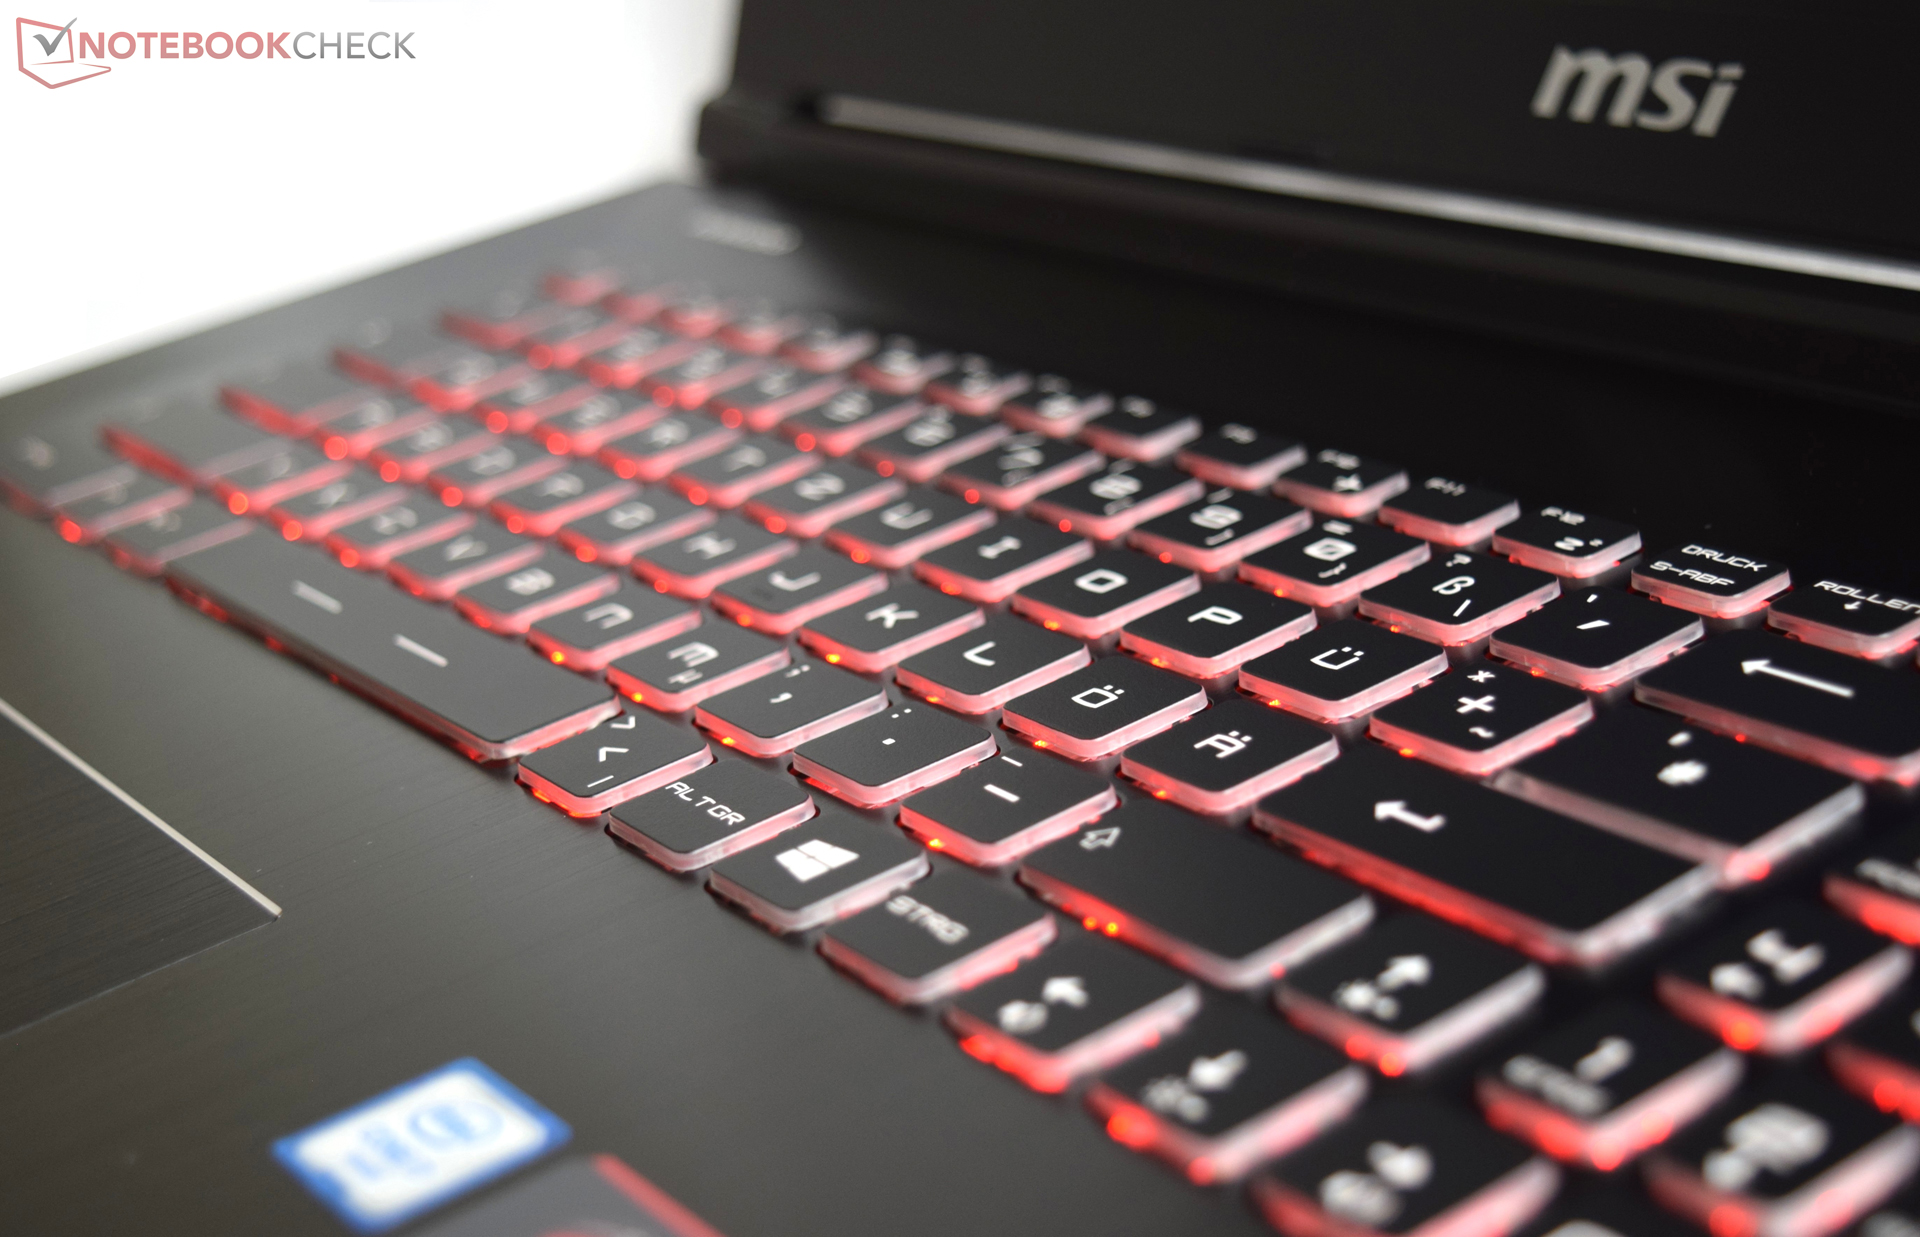
MSI ofrece muchos buenos dispositivos de gama alta. Sin embargo, no todos están dispuestos a gastarse 2,000 Euros en un portátil. Con el GE72VR, el fabricante abastece a la clase media-alta y cobra 1,750 Euros por la configuración de pruebas. Sin embargo, nuestro modelo de pruebas no gana en términos de precio-rendimiento, ya que el HP Omen (Pascal) tiene una GPU bastante más rápida con la GeForce GTX 1070 y está en la misma categoría de precios que el GE72VR. El portátil de 17" puede puntuar particularmente con su elegante y esbelto diseño y su buena calidad de construcción. Tampoco deberías desdeñar el display 120-Hz, ya que es una característica única y rinde muy bien a pesar de la tecnología TN. Trucos como el teclado iluminado y el Dragon Center de MSI son buenos y deberían mantenerse.
Los que compren el GE72VR se llevarán un portátil gaming sólido con rendimiento suficiente para los juegos actuales. Detalles y buenas características completan el paquete. Además, los jugones encontrarán atractivo el display 120 Hz.
Aparte de las impresiones positivas, también hay algunas quejas. Por ejemplo, la superficie de entrada ligeramente pequeña del touchpad dificulta más el control multitáctil (ej. zoom). Además, tenemos que criticar el pobre aguante de batería. Quizá el fabricante se replantee la capacidad de la batería en futuros dispositivos y, así, creará un uso más verástil.
Ésta es una versión acortada del análisis original. Puedes leer el análisis completo en inglés aquí.
MSI GE72VR-6RF16H21
- 12/29/2016 v6 (old)
Sebastian Bade