Breve análisis del MSI GT62VR 7RE Dominator Pro
| SD Card Reader | |
| average JPG Copy Test (av. of 3 runs) | |
| MSI GT62VR 7RE-223 | |
| MSI GT62VR-6RE16H21 | |
| Acer Predator 15 G9-593-765Q | |
| Schenker XMG P507 PRO | |
| maximum AS SSD Seq Read Test (1GB) | |
| MSI GT62VR 7RE-223 | |
| MSI GT62VR-6RE16H21 | |
| Acer Predator 15 G9-593-765Q | |
| Schenker XMG P507 PRO | |
| Networking | |
| iperf3 transmit AX12 | |
| Acer Predator 15 G9-593-765Q | |
| MSI GT62VR 7RE-223 | |
| Alienware 15 R3 | |
| Schenker XMG P507 PRO | |
| iperf3 receive AX12 | |
| Alienware 15 R3 | |
| Schenker XMG P507 PRO | |
| Acer Predator 15 G9-593-765Q | |
| MSI GT62VR 7RE-223 | |
| |||||||||||||||||||||||||
iluminación: 85 %
Brillo con batería: 310 cd/m²
Contraste: 1033:1 (Negro: 0.3 cd/m²)
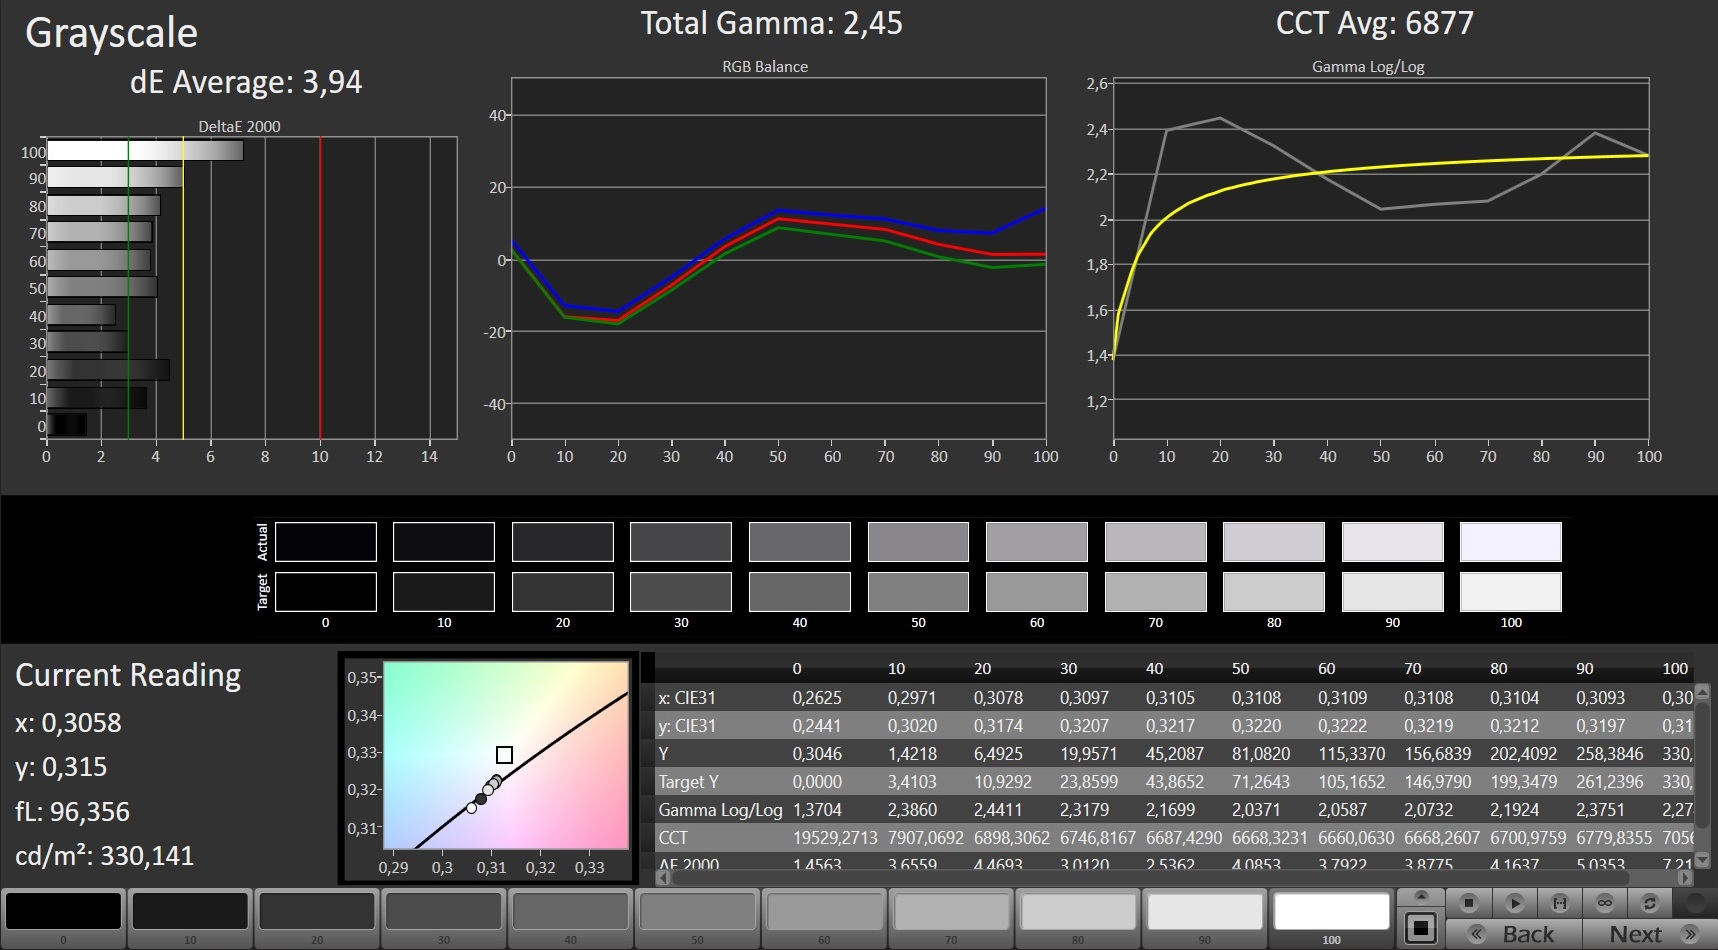
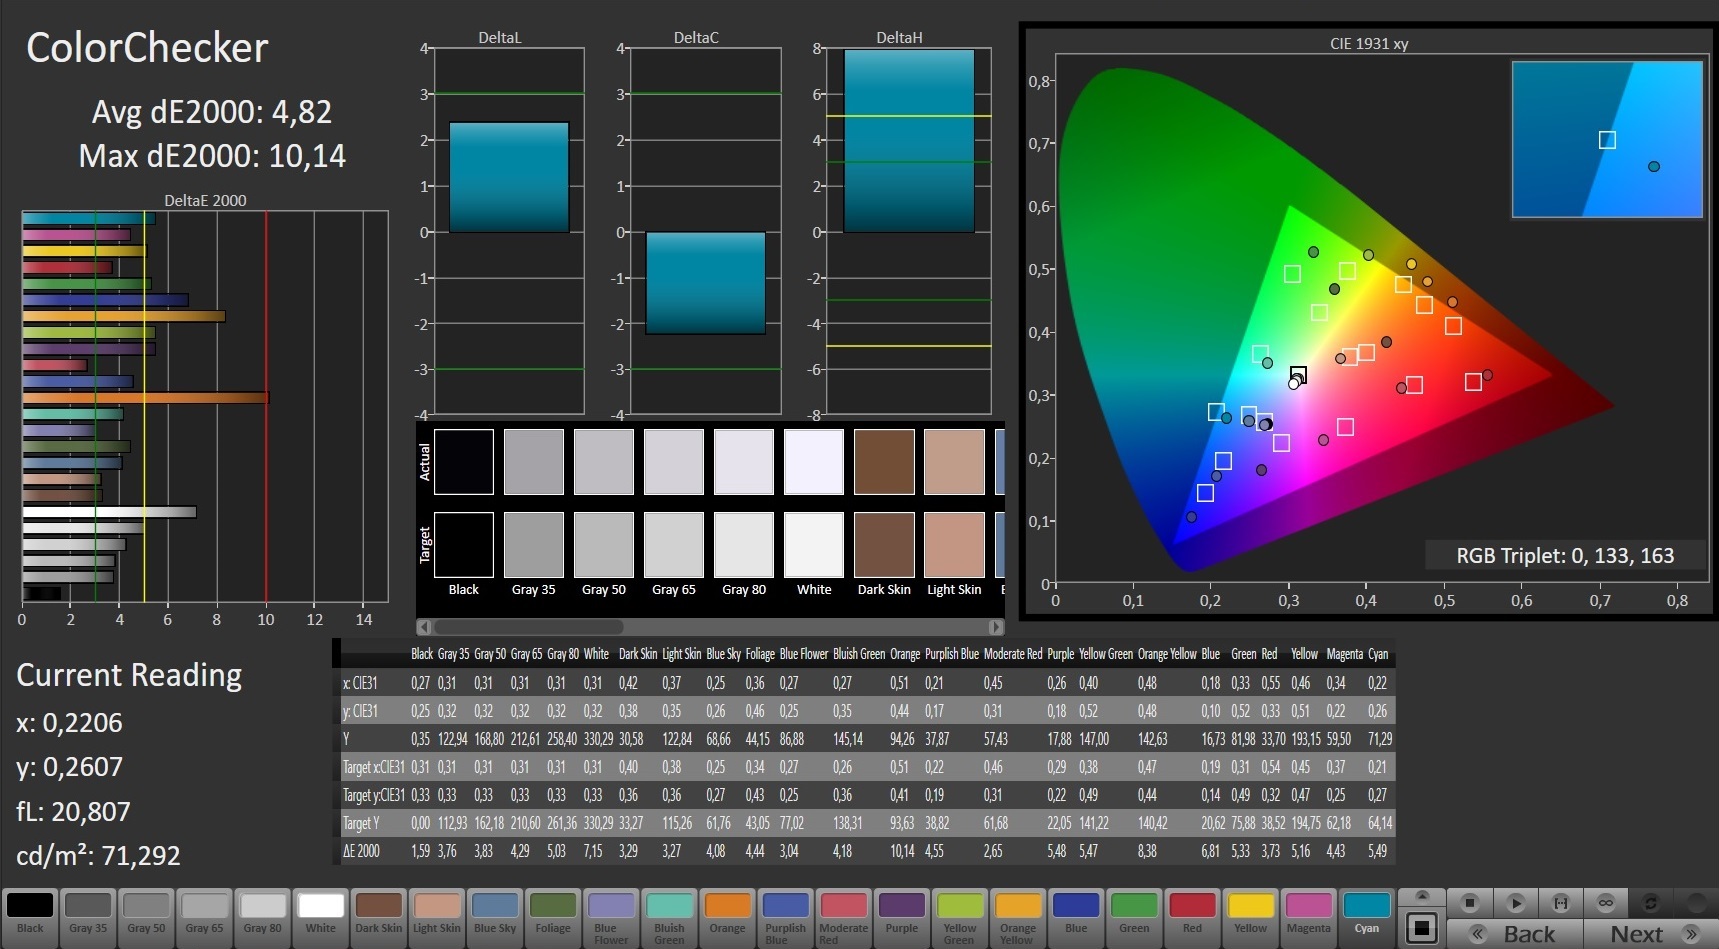
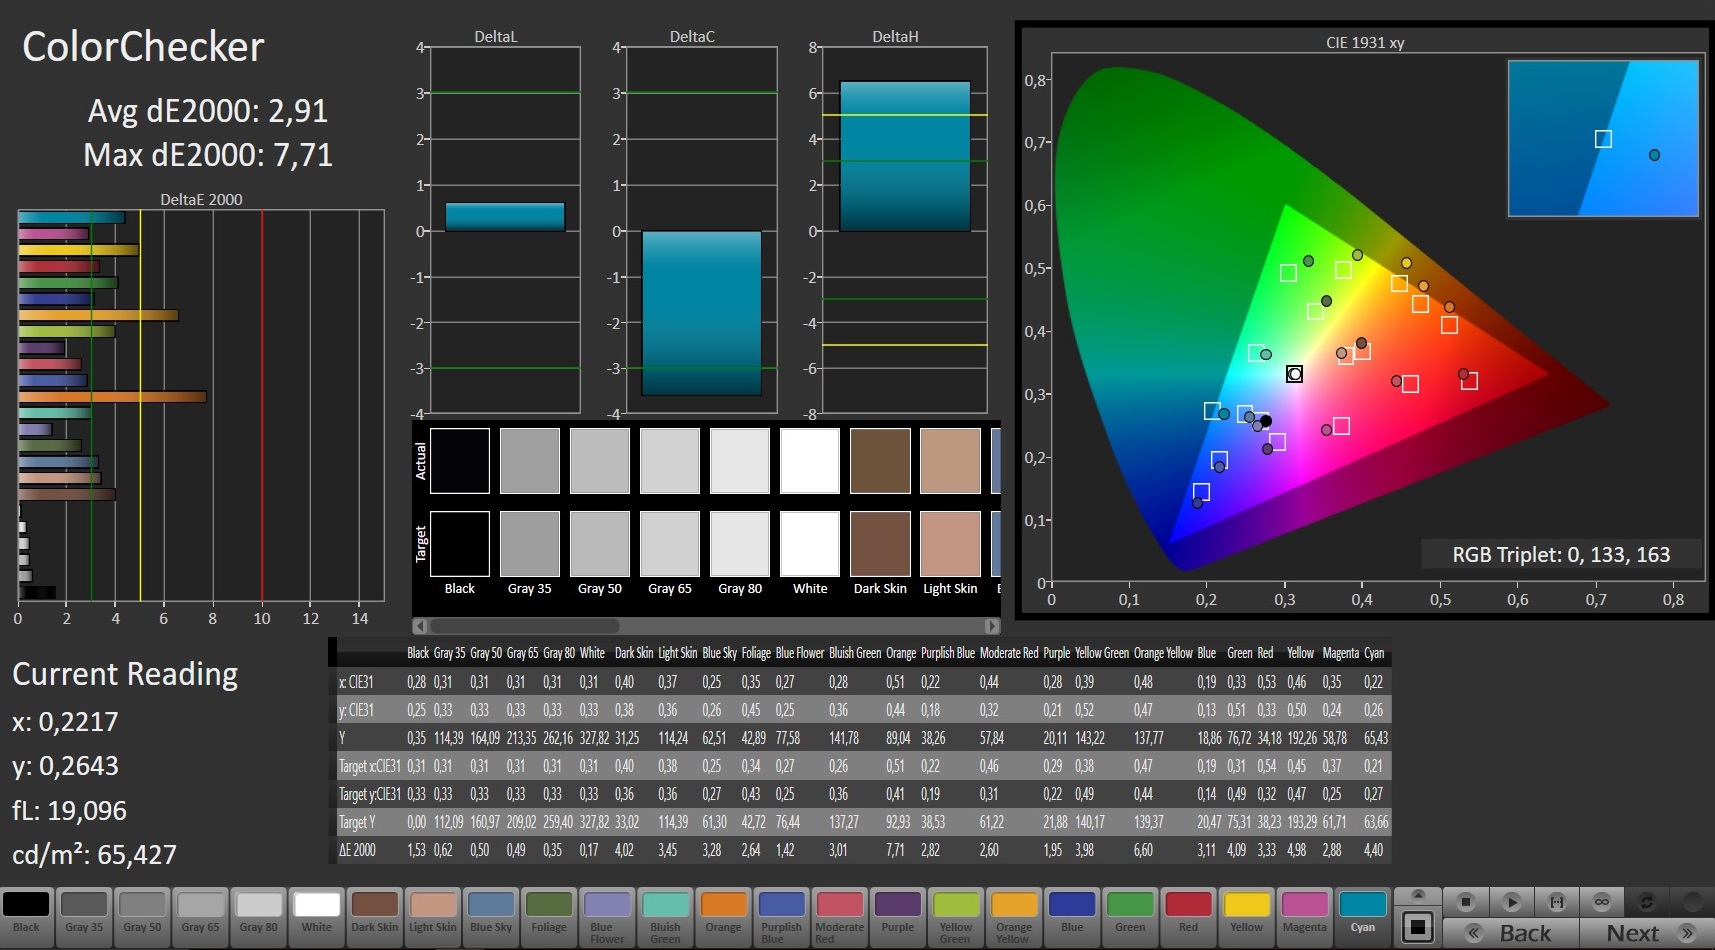
ΔE ColorChecker Calman: 4.82 | ∀{0.5-29.43 Ø4.72}
ΔE Greyscale Calman: 3.94 | ∀{0.09-98 Ø4.97}
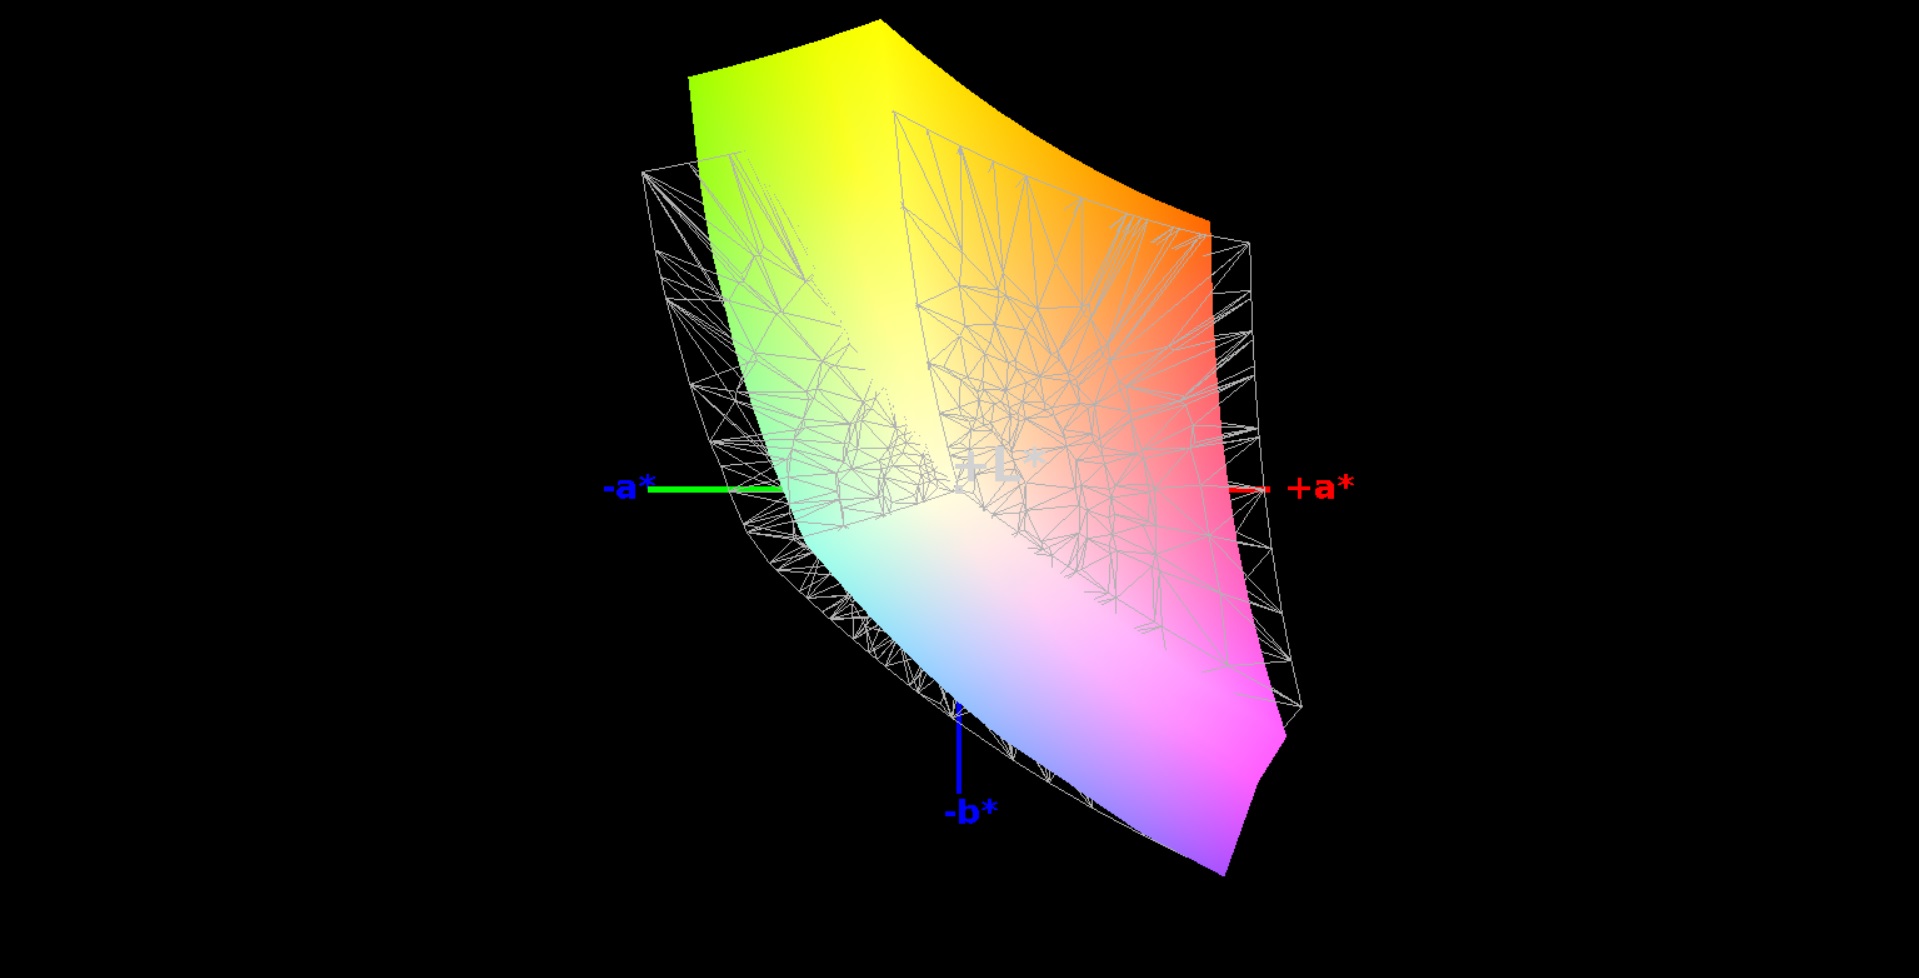
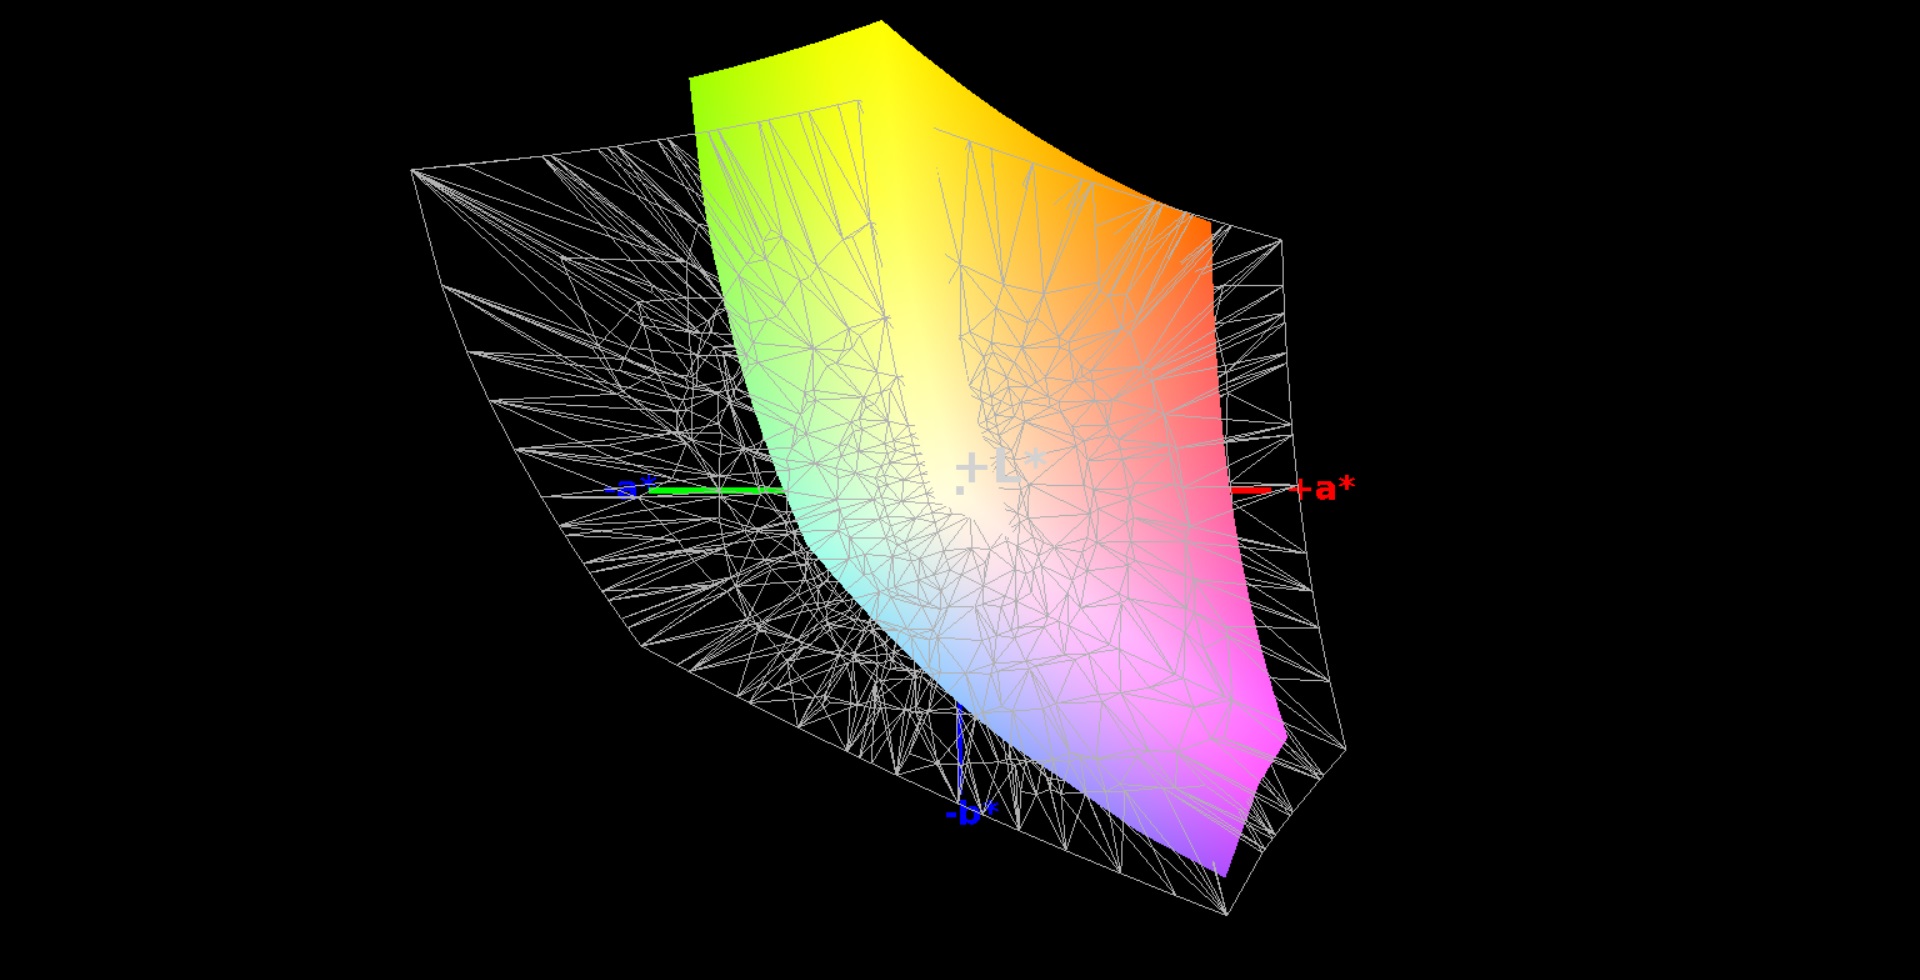
83% sRGB (Argyll 1.6.3 3D)
54% AdobeRGB 1998 (Argyll 1.6.3 3D)
60.8% AdobeRGB 1998 (Argyll 3D)
83.1% sRGB (Argyll 3D)
63.9% Display P3 (Argyll 3D)
Gamma: 2.45
CCT: 6877 K
| MSI GT62VR 7RE-223 LG Philips LP156WF6 (LGD046F), 1920x1080 | MSI GT62VR-6RE16H21 LG Philips LP156WF6 (LGD046F), 1920x1080 | Alienware 15 R3 HPJGK_B156HTN (AUO51ED), 1920x1080 | Schenker XMG P507 PRO AUO B156HTN05.2 (AUO52ED), 1920x1080 | Acer Predator 15 G9-593-765Q LG Philips LP156WF6-SPP1 (LGD04D5), 1920x1080 | |
|---|---|---|---|---|---|
| Display | 2% | 7% | 6% | 1% | |
| Display P3 Coverage (%) | 63.9 | 64.6 1% | 66 3% | 66.4 4% | 63.6 0% |
| sRGB Coverage (%) | 83.1 | 84.6 2% | 90.5 9% | 88.9 7% | 83.9 1% |
| AdobeRGB 1998 Coverage (%) | 60.8 | 61.8 2% | 66.2 9% | 65.1 7% | 61.3 1% |
| Response Times | 10% | 42% | 44% | 3% | |
| Response Time Grey 50% / Grey 80% * (ms) | 37 ? | 34 ? 8% | 25 ? 32% | 24 ? 35% | 35 ? 5% |
| Response Time Black / White * (ms) | 25 ? | 22 ? 12% | 12 ? 52% | 12 ? 52% | 25 ? -0% |
| PWM Frequency (Hz) | |||||
| Screen | 7% | -31% | -37% | 4% | |
| Brightness middle (cd/m²) | 310 | 273 -12% | 386 25% | 357 15% | 273 -12% |
| Brightness (cd/m²) | 311 | 278 -11% | 382 23% | 365 17% | 267 -14% |
| Brightness Distribution (%) | 85 | 88 4% | 93 9% | 85 0% | 83 -2% |
| Black Level * (cd/m²) | 0.3 | 0.27 10% | 0.39 -30% | 0.5 -67% | 0.27 10% |
| Contrast (:1) | 1033 | 1011 -2% | 990 -4% | 714 -31% | 1011 -2% |
| Colorchecker dE 2000 * | 4.82 | 3.67 24% | 10.2 -112% | 9.93 -106% | 3.77 22% |
| Colorchecker dE 2000 max. * | 10.14 | 8.33 18% | 15.81 -56% | 14.87 -47% | 10.64 -5% |
| Greyscale dE 2000 * | 3.94 | 2.73 31% | 11.28 -186% | 10.32 -162% | 2.48 37% |
| Gamma | 2.45 90% | 2.49 88% | 2.23 99% | 2.11 104% | 2.37 93% |
| CCT | 6877 95% | 7029 92% | 11383 57% | 10096 64% | 6854 95% |
| Color Space (Percent of AdobeRGB 1998) (%) | 54 | 55 2% | 59 9% | 58 7% | 55 2% |
| Color Space (Percent of sRGB) (%) | 83 | 84 1% | 90 8% | 89 7% | 84 1% |
| Media total (Programa/Opciones) | 6% /
6% | 6% /
-14% | 4% /
-17% | 3% /
3% |
* ... más pequeño es mejor
Tiempos de respuesta del display
| ↔ Tiempo de respuesta de Negro a Blanco | ||
|---|---|---|
| 25 ms ... subida ↗ y bajada ↘ combinada | ↗ 4 ms subida | 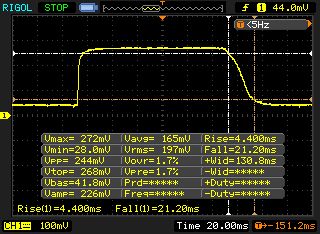 |
| ↘ 21 ms bajada | ||
| La pantalla mostró tiempos de respuesta relativamente lentos en nuestros tests pero podría ser demasiado lenta para los jugones. En comparación, todos los dispositivos de prueba van de ##min### (mínimo) a 240 (máximo) ms. » 59 % de todos los dispositivos son mejores. Eso quiere decir que el tiempo de respuesta es peor que la media (19.8 ms) de todos los dispositivos testados. | ||
| ↔ Tiempo de respuesta 50% Gris a 80% Gris | ||
| 37 ms ... subida ↗ y bajada ↘ combinada | ↗ 16 ms subida | 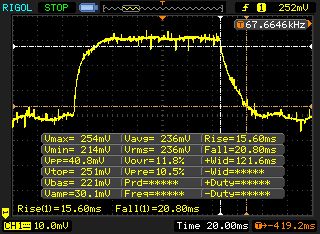 |
| ↘ 21 ms bajada | ||
| La pantalla mostró tiempos de respuesta lentos en nuestros tests y podría ser demasiado lenta para los jugones. En comparación, todos los dispositivos de prueba van de ##min### (mínimo) a 636 (máximo) ms. » 53 % de todos los dispositivos son mejores. Eso quiere decir que el tiempo de respuesta es peor que la media (31 ms) de todos los dispositivos testados. | ||
Parpadeo de Pantalla / PWM (Pulse-Width Modulation)
| Parpadeo de Pantalla / PWM no detectado | 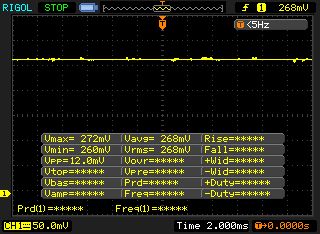 | ||
Comparación: 52 % de todos los dispositivos testados no usaron PWM para atenuar el display. Si se usó, medimos una media de 7763 (mínimo: 5 - máxmo: 343500) Hz. | |||
| Cinebench R10 | |
| Rendering Multiple CPUs 32Bit | |
| MSI GT62VR 7RE-223 | |
| Rendering Single 32Bit | |
| MSI GT62VR 7RE-223 | |
| Geekbench 4.0 | |
| 64 Bit Single-Core Score | |
| MSI GT62VR 7RE-223 | |
| 64 Bit Multi-Core Score | |
| MSI GT62VR 7RE-223 | |
| Geekbench 3 | |
| 32 Bit Single-Core Score | |
| MSI GT62VR 7RE-223 | |
| 32 Bit Multi-Core Score | |
| MSI GT62VR 7RE-223 | |
| JetStream 1.1 - 1.1 Total | |
| MSI GT62VR 7RE-223 | |
| Octane V2 - Total Score | |
| MSI GT62VR 7RE-223 | |
| Mozilla Kraken 1.1 - Total | |
| MSI GT62VR 7RE-223 | |
* ... más pequeño es mejor
| PCMark 8 | |
| Home Score Accelerated v2 | |
| MSI GT62VR 7RE-223 | |
| Alienware 15 R3 | |
| Acer Predator 15 G9-593-765Q | |
| MSI GT62VR-6RE16H21 | |
| Schenker XMG P507 PRO | |
| Work Score Accelerated v2 | |
| MSI GT62VR 7RE-223 | |
| Alienware 15 R3 | |
| Schenker XMG P507 PRO | |
| Acer Predator 15 G9-593-765Q | |
| MSI GT62VR-6RE16H21 | |
| PCMark 7 - Score | |
| Alienware 15 R3 | |
| MSI GT62VR 7RE-223 | |
| Acer Predator 15 G9-593-765Q | |
| Schenker XMG P507 PRO | |
| MSI GT62VR-6RE16H21 | |
| PCMark 7 Score | 6831 puntos | |
| PCMark 8 Home Score Accelerated v2 | 5011 puntos | |
| PCMark 8 Creative Score Accelerated v2 | 7738 puntos | |
| PCMark 8 Work Score Accelerated v2 | 5406 puntos | |
ayuda | ||

| MSI GT62VR 7RE-223 Samsung SSD PM871a MZNLN256HMHQ | MSI GT62VR-6RE16H21 Toshiba HG6 THNSNJ256G8NY | Alienware 15 R3 | Schenker XMG P507 PRO Samsung SSD 960 Evo 500GB m.2 NVMe | Acer Predator 15 G9-593-765Q LiteOn CV1-8B512 | |
|---|---|---|---|---|---|
| CrystalDiskMark 3.0 | -4% | 44% | 152% | -7% | |
| Read Seq (MB/s) | 521 | 523 0% | 1123 116% | 1718 230% | 517 -1% |
| Write Seq (MB/s) | 422.8 | 485.5 15% | 429.2 2% | 1635 287% | 449.7 6% |
| Read 512 (MB/s) | 462 | 444.7 -4% | 833 80% | 873 89% | 355.3 -23% |
| Write 512 (MB/s) | 286.9 | 471.2 64% | 428.1 49% | 1216 324% | 433.7 51% |
| Read 4k (MB/s) | 38.55 | 21.86 -43% | 37.8 -2% | 59.1 53% | 27.69 -28% |
| Write 4k (MB/s) | 122.8 | 98.8 -20% | 122.9 0% | 177.5 45% | 72.9 -41% |
| Read 4k QD32 (MB/s) | 388.4 | 350.3 -10% | 542 40% | 668 72% | 290.9 -25% |
| Write 4k QD32 (MB/s) | 257.9 | 162.2 -37% | 429.8 67% | 546 112% | 273.8 6% |
| 3DMark - 1920x1080 Fire Strike Graphics | |
| Alienware 15 R3 | |
| MSI GT62VR 7RE-223 | |
| Acer Predator 15 G9-593-765Q | |
| MSI GT62VR-6RE16H21 | |
| Schenker XMG P507 PRO | |
| 3DMark 11 - 1280x720 Performance GPU | |
| Alienware 15 R3 | |
| MSI GT62VR 7RE-223 | |
| Acer Predator 15 G9-593-765Q | |
| MSI GT62VR-6RE16H21 | |
| Schenker XMG P507 PRO | |
| 3DMark 06 Standard Score | 30759 puntos | |
| 3DMark 11 Performance | 15359 puntos | |
| 3DMark Ice Storm Standard Score | 123515 puntos | |
| 3DMark Cloud Gate Standard Score | 26786 puntos | |
| 3DMark Fire Strike Score | 13768 puntos | |
| 3DMark Fire Strike Extreme Score | 7445 puntos | |
| 3DMark Time Spy Score | 5114 puntos | |
ayuda | ||
| BioShock Infinite - 1920x1080 Ultra Preset, DX11 (DDOF) | |
| MSI GT62VR 7RE-223 | |
| MSI GT62VR-6RE16H21 | |
| Gigabyte P55W v6 | |
| Battlefield 4 - 1920x1080 Ultra Preset AA:4x MS | |
| MSI GT62VR 7RE-223 | |
| MSI GT62VR-6RE16H21 | |
| Battlefield 1 - 1920x1080 Ultra Preset AA:T | |
| Alienware 15 R3 | |
| MSI GT62VR 7RE-223 | |
| Deus Ex Mankind Divided - 1920x1080 Ultra Preset AA:2xMS AF:8x | |
| MSI GT62VR 7RE-223 | |
| Acer Predator 15 G9-593-765Q | |
| Gigabyte P55W v6 | |
| Resident Evil 7 - 1920x1080 Very High / On AA:FXAA+T | |
| MSI GT62VR 7RE-223 | |
| Alienware 15 R3 | |
| bajo | medio | alto | ultra | |
|---|---|---|---|---|
| Tomb Raider (2013) | 413.3 | 372.6 | 361.6 | 206.2 |
| BioShock Infinite (2013) | 208.2 | 186.6 | 186.2 | 130.6 |
| Battlefield 4 (2013) | 194.4 | 184.7 | 181.9 | 139.2 |
| Deus Ex Mankind Divided (2016) | 97.6 | 92.2 | 75.3 | 43.6 |
| Battlefield 1 (2016) | 144.7 | 128.3 | 110.8 | 104.5 |
| Civilization 6 (2016) | 70 | 57.2 | 49.7 | 49.5 |
| Titanfall 2 (2016) | 143.8 | 143.5 | 129.8 | 121 |
| Resident Evil 7 (2017) | 368.8 | 274.8 | 204.3 | 162.3 |
Ruido
| Ocioso |
| 34 / 35 / 36 dB(A) |
| Carga |
| 40 / 46 dB(A) |
 | ||
30 dB silencioso 40 dB(A) audible 50 dB(A) ruidosamente alto |
||
min: | ||
| MSI GT62VR 7RE-223 i7-7700HQ, GeForce GTX 1070 Mobile | MSI GT62VR-6RE16H21 6700HQ, GeForce GTX 1070 Mobile | Alienware 15 R3 i7-7700HQ, GeForce GTX 1070 Mobile | Schenker XMG P507 PRO i7-7700HQ, GeForce GTX 1070 Mobile | Acer Predator 15 G9-593-765Q 6700HQ, GeForce GTX 1070 Mobile | Gigabyte P55W v6 6700HQ, GeForce GTX 1060 Mobile | |
|---|---|---|---|---|---|---|
| Noise | 3% | -5% | -8% | -2% | -5% | |
| apagado / medio ambiente * (dB) | 30 | 30 -0% | 30 -0% | 31 -3% | 30 -0% | 31 -3% |
| Idle Minimum * (dB) | 34 | 32 6% | 31 9% | 33 3% | 31 9% | 35 -3% |
| Idle Average * (dB) | 35 | 33 6% | 32 9% | 34 3% | 35 -0% | 36 -3% |
| Idle Maximum * (dB) | 36 | 34 6% | 42 -17% | 44 -22% | 38 -6% | 37 -3% |
| Load Average * (dB) | 40 | 40 -0% | 49 -23% | 46 -15% | 43 -8% | 41 -2% |
| Load Maximum * (dB) | 46 | 46 -0% | 50 -9% | 52 -13% | 49 -7% | 52 -13% |
* ... más pequeño es mejor
(±) La temperatura máxima en la parte superior es de 40.6 °C / 105 F, frente a la media de 40.4 °C / 105 F, que oscila entre 21.2 y 68.8 °C para la clase Gaming.
(-) El fondo se calienta hasta un máximo de 48.4 °C / 119 F, frente a la media de 43.2 °C / 110 F
(+) En reposo, la temperatura media de la parte superior es de 25 °C / 77# F, frente a la media del dispositivo de 33.9 °C / 93 F.
(+) Los reposamanos y el panel táctil alcanzan como máximo la temperatura de la piel (34.7 °C / 94.5 F) y, por tanto, no están calientes.
(-) La temperatura media de la zona del reposamanos de dispositivos similares fue de 28.8 °C / 83.8 F (-5.9 °C / -10.7 F).
| MSI GT62VR 7RE-223 i7-7700HQ, GeForce GTX 1070 Mobile | MSI GT62VR-6RE16H21 6700HQ, GeForce GTX 1070 Mobile | Alienware 15 R3 i7-7700HQ, GeForce GTX 1070 Mobile | Schenker XMG P507 PRO i7-7700HQ, GeForce GTX 1070 Mobile | Acer Predator 15 G9-593-765Q 6700HQ, GeForce GTX 1070 Mobile | Gigabyte P55W v6 6700HQ, GeForce GTX 1060 Mobile | |
|---|---|---|---|---|---|---|
| Heat | -8% | -25% | -24% | 4% | -17% | |
| Maximum Upper Side * (°C) | 40.6 | 44 -8% | 46 -13% | 49.2 -21% | 40.5 -0% | 47.7 -17% |
| Maximum Bottom * (°C) | 48.4 | 53.1 -10% | 51.8 -7% | 62 -28% | 42 13% | 51.2 -6% |
| Idle Upper Side * (°C) | 26.8 | 28.8 -7% | 36.5 -36% | 32.4 -21% | 28.2 -5% | 32.1 -20% |
| Idle Bottom * (°C) | 26.4 | 28.2 -7% | 38.2 -45% | 33 -25% | 24.3 8% | 32.8 -24% |
* ... más pequeño es mejor
MSI GT62VR 7RE-223 análisis de audio
(+) | los altavoces pueden reproducir a un volumen relativamente alto (#83 dB)
Graves 100 - 315 Hz
(±) | lubina reducida - en promedio 13.6% inferior a la mediana
(±) | la linealidad de los graves es media (10.1% delta a frecuencia anterior)
Medios 400 - 2000 Hz
(±) | medias más altas - de media 5% más altas que la mediana
(+) | los medios son lineales (5.4% delta a la frecuencia anterior)
Altos 2 - 16 kHz
(+) | máximos equilibrados - a sólo 2.7% de la mediana
(±) | la linealidad de los máximos es media (8.6% delta a frecuencia anterior)
Total 100 - 16.000 Hz
(±) | la linealidad del sonido global es media (15.6% de diferencia con la mediana)
En comparación con la misma clase
» 36% de todos los dispositivos probados de esta clase eran mejores, 6% similares, 58% peores
» El mejor tuvo un delta de 6%, la media fue 18%, el peor fue ###max##%
En comparación con todos los dispositivos probados
» 23% de todos los dispositivos probados eran mejores, 5% similares, 72% peores
» El mejor tuvo un delta de 4%, la media fue 24%, el peor fue ###max##%
Alienware 15 R3 análisis de audio
(+) | los altavoces pueden reproducir a un volumen relativamente alto (#82 dB)
Graves 100 - 315 Hz
(-) | casi sin bajos - de media 19.1% inferior a la mediana
(±) | la linealidad de los graves es media (10.4% delta a frecuencia anterior)
Medios 400 - 2000 Hz
(±) | medias más altas - de media 6.7% más altas que la mediana
(±) | la linealidad de los medios es media (7.5% delta respecto a la frecuencia anterior)
Altos 2 - 16 kHz
(+) | máximos equilibrados - a sólo 3.6% de la mediana
(+) | los máximos son lineales (5.2% delta a la frecuencia anterior)
Total 100 - 16.000 Hz
(±) | la linealidad del sonido global es media (21.6% de diferencia con la mediana)
En comparación con la misma clase
» 77% de todos los dispositivos probados de esta clase eran mejores, 5% similares, 18% peores
» El mejor tuvo un delta de 6%, la media fue 18%, el peor fue ###max##%
En comparación con todos los dispositivos probados
» 61% de todos los dispositivos probados eran mejores, 7% similares, 32% peores
» El mejor tuvo un delta de 4%, la media fue 24%, el peor fue ###max##%
| Off / Standby | |
| Ocioso | |
| Carga |
|
Clave:
min: | |
| MSI GT62VR 7RE-223 i7-7700HQ, GeForce GTX 1070 Mobile | MSI GT62VR-6RE16H21 6700HQ, GeForce GTX 1070 Mobile | Alienware 15 R3 i7-7700HQ, GeForce GTX 1070 Mobile | Schenker XMG P507 PRO i7-7700HQ, GeForce GTX 1070 Mobile | Acer Predator 15 G9-593-765Q 6700HQ, GeForce GTX 1070 Mobile | Gigabyte P55W v6 6700HQ, GeForce GTX 1060 Mobile | |
|---|---|---|---|---|---|---|
| Power Consumption | -9% | 1% | 12% | 0% | 35% | |
| Idle Minimum * (Watt) | 20 | 20 -0% | 19 5% | 14 30% | 18 10% | 8 60% |
| Idle Average * (Watt) | 24 | 26 -8% | 23 4% | 18 25% | 24 -0% | 13 46% |
| Idle Maximum * (Watt) | 29 | 32 -10% | 29 -0% | 24 17% | 29 -0% | 17 41% |
| Load Average * (Watt) | 82 | 100 -22% | 85 -4% | 87 -6% | 86 -5% | 71 13% |
| Load Maximum * (Watt) | 193 | 202 -5% | 192 1% | 201 -4% | 201 -4% | 165 15% |
* ... más pequeño es mejor
| MSI GT62VR 7RE-223 i7-7700HQ, GeForce GTX 1070 Mobile, 75 Wh | MSI GT62VR-6RE16H21 6700HQ, GeForce GTX 1070 Mobile, 75.24 Wh | Alienware 15 R3 i7-7700HQ, GeForce GTX 1070 Mobile, 99 Wh | Schenker XMG P507 PRO i7-7700HQ, GeForce GTX 1070 Mobile, 60 Wh | Acer Predator 15 G9-593-765Q 6700HQ, GeForce GTX 1070 Mobile, Wh | Gigabyte P55W v6 6700HQ, GeForce GTX 1060 Mobile, 63 Wh | |
|---|---|---|---|---|---|---|
| Duración de Batería | -7% | 5% | -17% | 18% | 35% | |
| Reader / Idle (h) | 6.3 | 5 -21% | 6.4 2% | 10.2 62% | ||
| H.264 (h) | 4.2 | 4.4 5% | 3.6 -14% | 5 19% | 5.6 33% | |
| WiFi v1.3 (h) | 4.1 | 4.1 0% | 4.4 7% | 3.3 -20% | 4.8 17% | 5.9 44% |
| Load (h) | 1.6 | 1.6 0% | 1.7 6% | 1.9 19% | 1.6 0% |
Pro
Contra
La combinación de quad core Kaby Lake y GeForce GTX 1070 puede ejecutar con fluidez todos los juegos actuales en Full HD con ajustes altos o máximos. Pro: A pesar del potente hardware, el aumento de temperatura es meramente moderado. La escasa ganancia de rendimiento lleva principalmente a resultados de pruebas ligeramente mejores, pero no se nota subjetivamente.
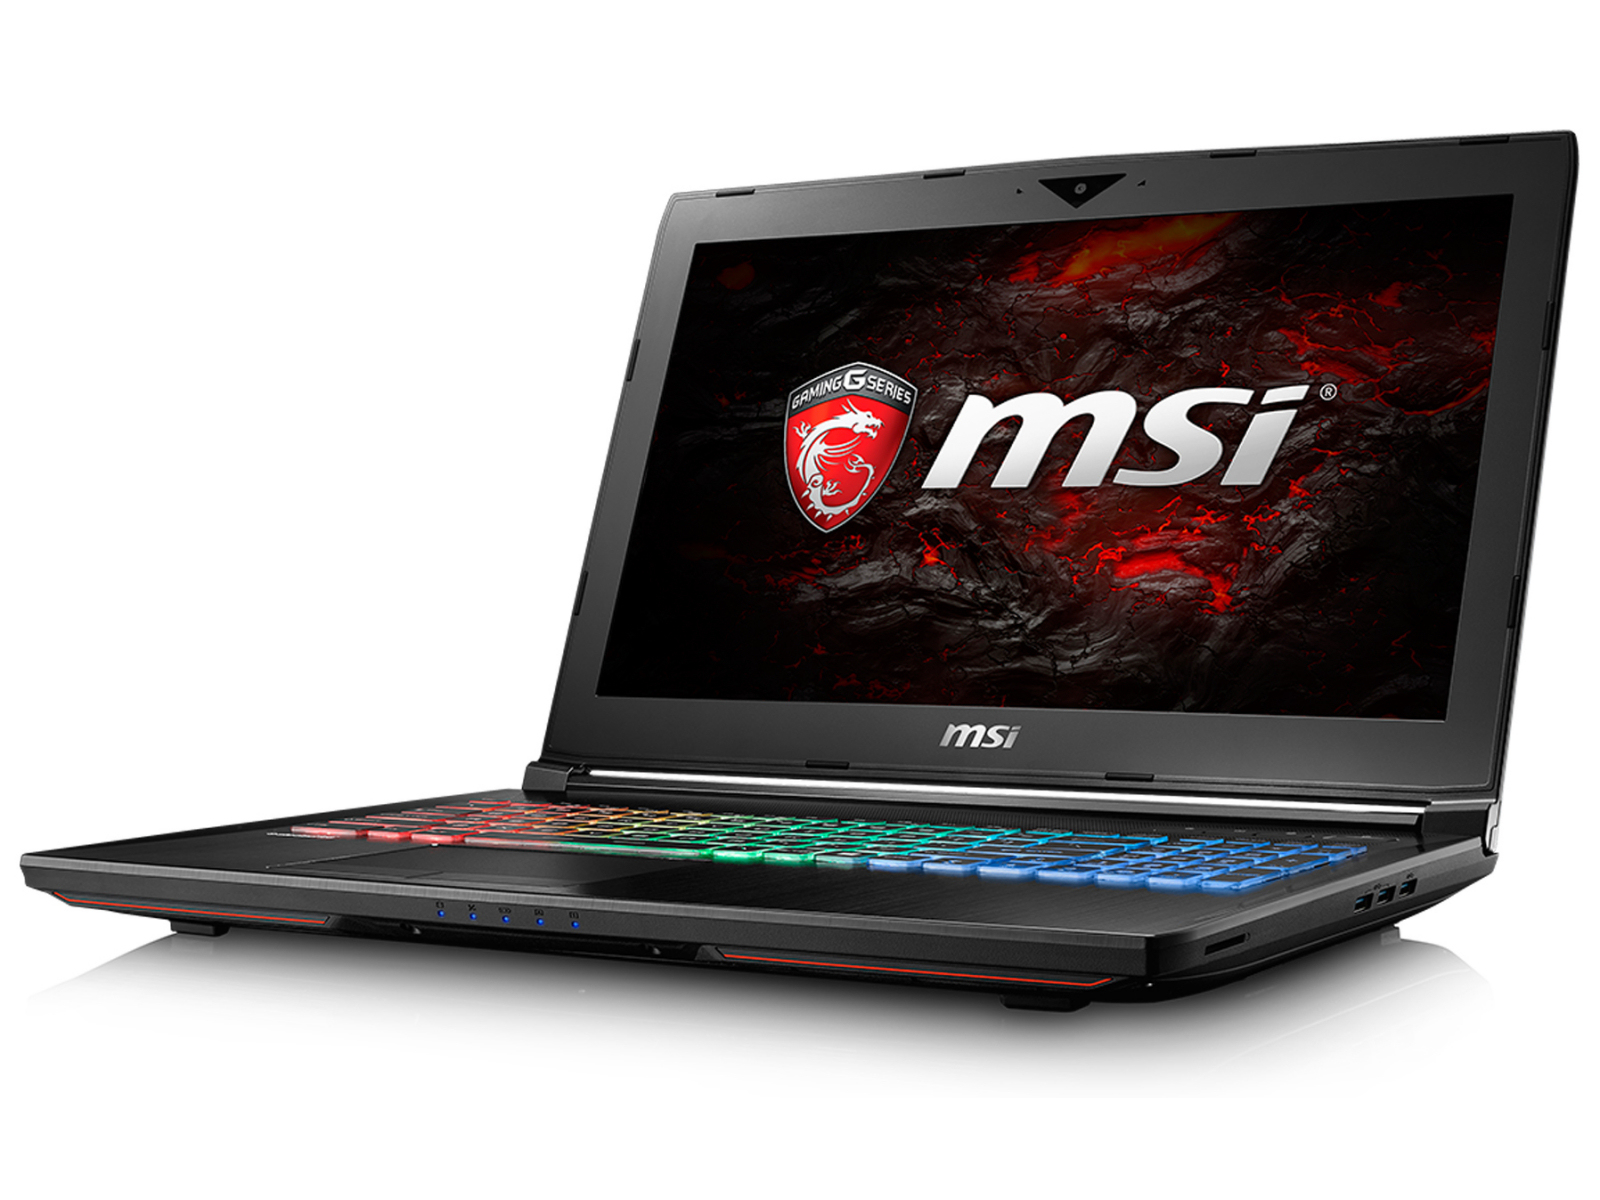
MSI ofrece un portátil gaming bien hecho con el GT62VR 7RE.
Un veloz SSD SATA III asegura un sistema rápido. Si el rendimiento del SSD no te basta, puedes sustituirlo por un modelo PCIe/NVMe más rápido. También es posible cambiar el HDD de 2.5" existente. Dado que el orendador no tiene escotilla de mantenimiento, tendrás que sacar la parte inferior en ambos casos.
El display mate Full HD IPS funciona a una frecuencia de 60 Hz. Es brillante, rico en contraste, y su ángulo de visión es estable. La tecnología Nvidia G-Sync asegura secuencias de imagen fluidas.
Ésta es una versión acortada del análisis original. Puedes leer el análisis completo en inglés aquí.
MSI GT62VR 7RE-223
- 02/14/2017 v6 (old)
Sascha Mölck