Breve análisis del Acer Predator 15 G9-593
| SD Card Reader | |
| average JPG Copy Test (av. of 3 runs) | |
| MSI GT62VR-6RE16H21 | |
| Aorus X5 v6 | |
| Acer Predator 15 G9-593-765Q | |
| Schenker XMG P507 | |
| Asus Strix GL502VS-FY032T | |
| maximum AS SSD Seq Read Test (1GB) | |
| MSI GT62VR-6RE16H21 | |
| Aorus X5 v6 | |
| Acer Predator 15 G9-593-765Q | |
| Schenker XMG P507 | |
| Asus Strix GL502VS-FY032T | |
| Networking | |
| iperf3 transmit AX12 | |
| MSI GT73VR 6RF | |
| Acer Predator 15 G9-593-765Q | |
| Razer Blade (2016) | |
| EVGA SC17 GTX 1070 | |
| iperf3 receive AX12 | |
| Acer Predator 15 G9-593-765Q | |
| MSI GT73VR 6RF | |
| EVGA SC17 GTX 1070 | |
| Razer Blade (2016) | |
| |||||||||||||||||||||||||
iluminación: 83 %
Brillo con batería: 273 cd/m²
Contraste: 1011:1 (Negro: 0.27 cd/m²)
ΔE ColorChecker Calman: 3.77 | ∀{0.5-29.43 Ø4.72}
ΔE Greyscale Calman: 2.48 | ∀{0.09-98 Ø4.97}
84% sRGB (Argyll 1.6.3 3D)
55% AdobeRGB 1998 (Argyll 1.6.3 3D)
61.3% AdobeRGB 1998 (Argyll 3D)
83.9% sRGB (Argyll 3D)
63.6% Display P3 (Argyll 3D)
Gamma: 2.37
CCT: 6854 K
| Acer Predator 15 G9-593-765Q LG Philips LP156WF6-SPP1 (LGD04D5), , 1920x1080, 15.6" | MSI GT62VR-6RE16H21 LG Philips LP156WF6 (LGD046F), , 1920x1080, 15.6" | Asus Strix GL502VS-FY032T LG Philips LP156WF6-SPB6 (LGD046F), , 1920x1080, 15.6" | Schenker XMG P507 LG Philips LP156WF6 (LGD046F), , 1920x1080, 15.6" | Aorus X5 v6 2880x1620, 15.6" | Acer Predator 15 G9-592-7925 LG Philips LP156WF6-SPP1 (LGD04D5), , 1920x1080, 15.6" | |
|---|---|---|---|---|---|---|
| Display | 1% | -0% | 0% | 1% | -2% | |
| Display P3 Coverage (%) | 63.6 | 64.6 2% | 64.5 1% | 64.5 1% | 62.5 -2% | 63 -1% |
| sRGB Coverage (%) | 83.9 | 84.6 1% | 83.1 -1% | 83.4 -1% | 86.2 3% | 82.2 -2% |
| AdobeRGB 1998 Coverage (%) | 61.3 | 61.8 1% | 60.8 -1% | 61 0% | 62.5 2% | 60.1 -2% |
| Response Times | 8% | -1% | 3% | -13% | -10% | |
| Response Time Grey 50% / Grey 80% * (ms) | 35 ? | 34 ? 3% | 38 ? -9% | 36 ? -3% | 34 ? 3% | 43 ? -23% |
| Response Time Black / White * (ms) | 25 ? | 22 ? 12% | 23 ? 8% | 23 ? 8% | 32 ? -28% | 24 ? 4% |
| PWM Frequency (Hz) | 198.4 | |||||
| Screen | 3% | -8% | -10% | -9% | -11% | |
| Brightness middle (cd/m²) | 273 | 273 0% | 315 15% | 288 5% | 280.4 3% | 302 11% |
| Brightness (cd/m²) | 267 | 278 4% | 290 9% | 292 9% | 271 1% | 287 7% |
| Brightness Distribution (%) | 83 | 88 6% | 85 2% | 87 5% | 83 0% | 91 10% |
| Black Level * (cd/m²) | 0.27 | 0.27 -0% | 0.32 -19% | 0.3 -11% | 0.249 8% | 0.36 -33% |
| Contrast (:1) | 1011 | 1011 0% | 984 -3% | 960 -5% | 1126 11% | 839 -17% |
| Colorchecker dE 2000 * | 3.77 | 3.67 3% | 4.88 -29% | 5.1 -35% | 4.94 -31% | 4.93 -31% |
| Colorchecker dE 2000 max. * | 10.64 | 8.33 22% | 8.88 17% | 9.44 11% | 8.13 24% | 12.34 -16% |
| Greyscale dE 2000 * | 2.48 | 2.73 -10% | 4.17 -68% | 4.43 -79% | 5.13 -107% | 3.47 -40% |
| Gamma | 2.37 93% | 2.49 88% | 2.53 87% | 2.46 89% | 2.26 97% | 2.16 102% |
| CCT | 6854 95% | 7029 92% | 6683 97% | 6687 97% | 7433 87% | 6622 98% |
| Color Space (Percent of AdobeRGB 1998) (%) | 55 | 55 0% | 55 0% | 55 0% | 55.9 2% | 54 -2% |
| Color Space (Percent of sRGB) (%) | 84 | 84 0% | 83 -1% | 83 -1% | 85.9 2% | 82 -2% |
| Media total (Programa/Opciones) | 4% /
3% | -3% /
-5% | -2% /
-6% | -7% /
-7% | -8% /
-9% |
* ... más pequeño es mejor
Tiempos de respuesta del display
| ↔ Tiempo de respuesta de Negro a Blanco | ||
|---|---|---|
| 25 ms ... subida ↗ y bajada ↘ combinada | ↗ 5 ms subida | 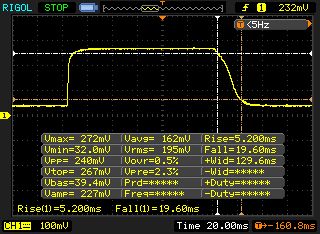 |
| ↘ 20 ms bajada | ||
| La pantalla mostró tiempos de respuesta relativamente lentos en nuestros tests pero podría ser demasiado lenta para los jugones. En comparación, todos los dispositivos de prueba van de ##min### (mínimo) a 240 (máximo) ms. » 59 % de todos los dispositivos son mejores. Eso quiere decir que el tiempo de respuesta es peor que la media (19.9 ms) de todos los dispositivos testados. | ||
| ↔ Tiempo de respuesta 50% Gris a 80% Gris | ||
| 35 ms ... subida ↗ y bajada ↘ combinada | ↗ 14 ms subida | 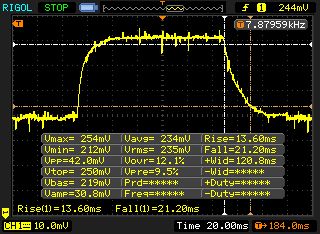 |
| ↘ 21 ms bajada | ||
| La pantalla mostró tiempos de respuesta lentos en nuestros tests y podría ser demasiado lenta para los jugones. En comparación, todos los dispositivos de prueba van de ##min### (mínimo) a 636 (máximo) ms. » 49 % de todos los dispositivos son mejores. Eso quiere decir que el tiempo de respuesta es peor que la media (31.1 ms) de todos los dispositivos testados. | ||
Parpadeo de Pantalla / PWM (Pulse-Width Modulation)
| Parpadeo de Pantalla / PWM no detectado | 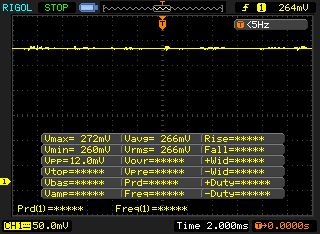 | ||
Comparación: 52 % de todos los dispositivos testados no usaron PWM para atenuar el display. Si se usó, medimos una media de 7784 (mínimo: 5 - máxmo: 343500) Hz. | |||
| PCMark 7 - Score | |
| Acer Predator 15 G9-593-765Q | |
| Schenker XMG P507 | |
| Acer Predator 15 G9-592-7925 | |
| MSI GT62VR-6RE16H21 | |
| PCMark 8 | |
| Home Score Accelerated v2 | |
| Aorus X5 v6 | |
| Acer Predator 15 G9-593-765Q | |
| Asus Strix GL502VS-FY032T | |
| MSI GT62VR-6RE16H21 | |
| Work Score Accelerated v2 | |
| Acer Predator 15 G9-593-765Q | |
| Aorus X5 v6 | |
| Asus Strix GL502VS-FY032T | |
| MSI GT62VR-6RE16H21 | |
| PCMark 7 Score | 6520 puntos | |
| PCMark 8 Home Score Accelerated v2 | 4692 puntos | |
| PCMark 8 Creative Score Accelerated v2 | 7680 puntos | |
| PCMark 8 Work Score Accelerated v2 | 5088 puntos | |
ayuda | ||
| Acer Predator 15 G9-593-765Q LiteOn CV1-8B512 | MSI GT62VR-6RE16H21 Toshiba HG6 THNSNJ256G8NY | Asus Strix GL502VS-FY032T SanDisk SD8SNAT256G1002 | Schenker XMG P507 Samsung SM951 MZVPV256HDGL m.2 PCI-e | Aorus X5 v6 Samsung SM951 MZVPV256 m.2 | Acer Predator 15 G9-592-7925 Samsung SSD PM871 MZNLN512HCJH | |
|---|---|---|---|---|---|---|
| CrystalDiskMark 3.0 | 5% | -20% | 150% | 141% | 13% | |
| Read Seq (MB/s) | 517 | 523 1% | 485.4 -6% | 1857 259% | 1565 203% | 510 -1% |
| Write Seq (MB/s) | 449.7 | 485.5 8% | 312.4 -31% | 1240 176% | 1275 184% | 455.3 1% |
| Read 512 (MB/s) | 355.3 | 444.7 25% | 294.8 -17% | 971 173% | 990 179% | 415.9 17% |
| Write 512 (MB/s) | 433.7 | 471.2 9% | 287.8 -34% | 1239 186% | 1221 182% | 422.3 -3% |
| Read 4k (MB/s) | 27.69 | 21.86 -21% | 21.44 -23% | 54.1 95% | 53 91% | 32.46 17% |
| Write 4k (MB/s) | 72.9 | 98.8 36% | 75.7 4% | 167.4 130% | 158.8 118% | 92.5 27% |
| Read 4k QD32 (MB/s) | 290.9 | 350.3 20% | 149.4 -49% | 695 139% | 688 137% | 358.6 23% |
| Write 4k QD32 (MB/s) | 273.8 | 162.2 -41% | 256.3 -6% | 386.8 41% | 358.7 31% | 329.1 20% |

| 3DMark 11 - 1280x720 Performance GPU | |
| MSI GT73VR 6RF | |
| Aorus X5 v6 | |
| Acer Predator 15 G9-593-765Q | |
| MSI GT62VR-6RE16H21 | |
| Asus Strix GL502VS-FY032T | |
| Schenker XMG P507 | |
| Acer Predator 15 G9-592-7925 | |
| 3DMark | |
| 1920x1080 Fire Strike Graphics | |
| MSI GT73VR 6RF | |
| Aorus X5 v6 | |
| Acer Predator 15 G9-593-765Q | |
| MSI GT62VR-6RE16H21 | |
| Asus Strix GL502VS-FY032T | |
| Schenker XMG P507 | |
| Acer Predator 15 G9-592-7925 | |
| 2560x1440 Time Spy Graphics | |
| Acer Predator 15 G9-593-765Q | |
| MSI GT62VR-6RE16H21 | |
| Schenker XMG P507 | |
| 3DMark 11 Performance | 15768 puntos | |
| 3DMark Ice Storm Standard Score | 118595 puntos | |
| 3DMark Cloud Gate Standard Score | 24262 puntos | |
| 3DMark Fire Strike Score | 12973 puntos | |
| 3DMark Time Spy Score | 5013 puntos | |
ayuda | ||
| The Witcher 3 - 1920x1080 Ultra Graphics & Postprocessing (HBAO+) | |
| Acer Predator 15 G9-593-765Q | |
| MSI GT62VR-6RE16H21 | |
| Asus Strix GL502VS-FY032T | |
| Schenker XMG P507 | |
| Rise of the Tomb Raider - 1920x1080 Very High Preset AA:FX AF:16x | |
| Aorus X5 v6 | |
| Acer Predator 15 G9-593-765Q | |
| Asus Strix GL502VS-FY032T | |
| MSI GT62VR-6RE16H21 | |
| Schenker XMG P507 | |
| bajo | medio | alto | ultra | |
|---|---|---|---|---|
| The Witcher 3 (2015) | 110.8 | 60 | ||
| Rise of the Tomb Raider (2016) | 116.2 | 96.7 | ||
| Deus Ex Mankind Divided (2016) | 81.3 | 43.2 | ||
| Call of Duty Infinite Warfare (2016) | 120.3 | 116.1 |
Ruido
| Ocioso |
| 31 / 35 / 38 dB(A) |
| HDD |
| 34 dB(A) |
| Carga |
| 43 / 49 dB(A) |
 | ||
30 dB silencioso 40 dB(A) audible 50 dB(A) ruidosamente alto |
||
min: | ||
| Acer Predator 15 G9-593-765Q 6700HQ, GeForce GTX 1070 Mobile | Acer Predator 15 G9-592-7925 6700HQ, GeForce GTX 970M | MSI GT62VR-6RE16H21 6700HQ, GeForce GTX 1070 Mobile | Asus Strix GL502VS-FY032T 6700HQ, GeForce GTX 1070 Mobile | Schenker XMG P507 6700HQ, GeForce GTX 1060 Mobile | Aorus X5 v6 6820HK, GeForce GTX 1070 Mobile | |
|---|---|---|---|---|---|---|
| Noise | 5% | 5% | 3% | 0% | -7% | |
| apagado / medio ambiente * (dB) | 30 | 30 -0% | 30 -0% | 30 -0% | 29.3 2% | |
| Idle Minimum * (dB) | 31 | 31 -0% | 32 -3% | 32 -3% | 31 -0% | 33.4 -8% |
| Idle Average * (dB) | 35 | 32 9% | 33 6% | 33 6% | 32 9% | 35.2 -1% |
| Idle Maximum * (dB) | 38 | 36 5% | 34 11% | 34 11% | 38 -0% | 35.2 7% |
| Load Average * (dB) | 43 | 40 7% | 40 7% | 39 9% | 46 -7% | 53.3 -24% |
| Load Maximum * (dB) | 49 | 47 4% | 46 6% | 51 -4% | 49 -0% | 57.6 -18% |
* ... más pequeño es mejor
(±) La temperatura máxima en la parte superior es de 40.5 °C / 105 F, frente a la media de 40.4 °C / 105 F, que oscila entre 21.2 y 68.8 °C para la clase Gaming.
(±) El fondo se calienta hasta un máximo de 42 °C / 108 F, frente a la media de 43.2 °C / 110 F
(+) En reposo, la temperatura media de la parte superior es de 25.6 °C / 78# F, frente a la media del dispositivo de 33.9 °C / 93 F.
(+) El reposamanos y el panel táctil están a una temperatura inferior a la de la piel, con un máximo de 29.9 °C / 85.8 F y, por tanto, son fríos al tacto.
(±) La temperatura media de la zona del reposamanos de dispositivos similares fue de 28.8 °C / 83.8 F (-1.1 °C / -2 F).
| Acer Predator 15 G9-593-765Q 6700HQ, GeForce GTX 1070 Mobile | Acer Predator 15 G9-592-7925 6700HQ, GeForce GTX 970M | MSI GT62VR-6RE16H21 6700HQ, GeForce GTX 1070 Mobile | Asus Strix GL502VS-FY032T 6700HQ, GeForce GTX 1070 Mobile | Schenker XMG P507 6700HQ, GeForce GTX 1060 Mobile | Aorus X5 v6 6820HK, GeForce GTX 1070 Mobile | |
|---|---|---|---|---|---|---|
| Heat | 3% | -13% | -19% | -21% | -39% | |
| Maximum Upper Side * (°C) | 40.5 | 42.6 -5% | 44 -9% | 48 -19% | 49.3 -22% | 57 -41% |
| Maximum Bottom * (°C) | 42 | 38.7 8% | 53.1 -26% | 46.8 -11% | 52.7 -25% | 54 -29% |
| Idle Upper Side * (°C) | 28.2 | 27.2 4% | 28.8 -2% | 33.7 -20% | 32.6 -16% | 36.2 -28% |
| Idle Bottom * (°C) | 24.3 | 22.8 6% | 28.2 -16% | 30.5 -26% | 29.5 -21% | 38 -56% |
* ... más pequeño es mejor
Acer Predator 15 G9-593-765Q análisis de audio
(+) | los altavoces pueden reproducir a un volumen relativamente alto (#90 dB)
Graves 100 - 315 Hz
(-) | casi sin bajos - de media 16.8% inferior a la mediana
(±) | la linealidad de los graves es media (8.2% delta a frecuencia anterior)
Medios 400 - 2000 Hz
(+) | medios equilibrados - a sólo 2.7% de la mediana
(+) | los medios son lineales (4.9% delta a la frecuencia anterior)
Altos 2 - 16 kHz
(+) | máximos equilibrados - a sólo 2.6% de la mediana
(+) | los máximos son lineales (3.1% delta a la frecuencia anterior)
Total 100 - 16.000 Hz
(+) | el sonido global es lineal (13% de diferencia con la mediana)
En comparación con la misma clase
» 18% de todos los dispositivos probados de esta clase eran mejores, 3% similares, 79% peores
» El mejor tuvo un delta de 6%, la media fue 18%, el peor fue ###max##%
En comparación con todos los dispositivos probados
» 13% de todos los dispositivos probados eran mejores, 2% similares, 85% peores
» El mejor tuvo un delta de 4%, la media fue 24%, el peor fue ###max##%
MSI GT62VR-6RE16H21 análisis de audio
(±) | la sonoridad del altavoz es media pero buena (79 dB)
Graves 100 - 315 Hz
(±) | lubina reducida - en promedio 11.3% inferior a la mediana
(±) | la linealidad de los graves es media (11.4% delta a frecuencia anterior)
Medios 400 - 2000 Hz
(±) | medias más altas - de media 8.3% más altas que la mediana
(+) | los medios son lineales (5.7% delta a la frecuencia anterior)
Altos 2 - 16 kHz
(+) | máximos equilibrados - a sólo 4.3% de la mediana
(±) | la linealidad de los máximos es media (11% delta a frecuencia anterior)
Total 100 - 16.000 Hz
(±) | la linealidad del sonido global es media (20.5% de diferencia con la mediana)
En comparación con la misma clase
» 73% de todos los dispositivos probados de esta clase eran mejores, 5% similares, 22% peores
» El mejor tuvo un delta de 6%, la media fue 18%, el peor fue ###max##%
En comparación con todos los dispositivos probados
» 54% de todos los dispositivos probados eran mejores, 8% similares, 38% peores
» El mejor tuvo un delta de 4%, la media fue 24%, el peor fue ###max##%
| Off / Standby | |
| Ocioso | |
| Carga |
|
Clave:
min: | |
| Acer Predator 15 G9-593-765Q 6700HQ, GeForce GTX 1070 Mobile | MSI GT62VR-6RE16H21 6700HQ, GeForce GTX 1070 Mobile | Asus Strix GL502VS-FY032T 6700HQ, GeForce GTX 1070 Mobile | Schenker XMG P507 6700HQ, GeForce GTX 1060 Mobile | Aorus X5 v6 6820HK, GeForce GTX 1070 Mobile | Acer Predator 15 G9-592-7925 6700HQ, GeForce GTX 970M | |
|---|---|---|---|---|---|---|
| Power Consumption | -9% | -0% | 24% | -34% | 19% | |
| Idle Minimum * (Watt) | 18 | 20 -11% | 20 -11% | 11 39% | 25 -39% | 12 33% |
| Idle Average * (Watt) | 24 | 26 -8% | 24 -0% | 16 33% | 28.9 -20% | 16 33% |
| Idle Maximum * (Watt) | 29 | 32 -10% | 29 -0% | 21 28% | 30.1 -4% | 22 24% |
| Load Average * (Watt) | 86 | 100 -16% | 86 -0% | 80 7% | 167.3 -95% | 96 -12% |
| Load Maximum * (Watt) | 201 | 202 -0% | 183 9% | 174 13% | 222.6 -11% | 166 17% |
* ... más pequeño es mejor
| Acer Predator 15 G9-593-765Q 6700HQ, GeForce GTX 1070 Mobile | MSI GT62VR-6RE16H21 6700HQ, GeForce GTX 1070 Mobile | Asus Strix GL502VS-FY032T 6700HQ, GeForce GTX 1070 Mobile | Schenker XMG P507 6700HQ, GeForce GTX 1060 Mobile | Aorus X5 v6 6820HK, GeForce GTX 1070 Mobile | Acer Predator 15 G9-592-7925 6700HQ, GeForce GTX 970M | |
|---|---|---|---|---|---|---|
| Duración de Batería | -16% | -39% | 4% | -24% | 65% | |
| H.264 (h) | 5 | |||||
| WiFi v1.3 (h) | 4.8 | 4.1 -15% | 3.3 -31% | 4.6 -4% | 3 -37% | 7.9 65% |
| Load (h) | 1.9 | 1.6 -16% | 1 -47% | 2.1 11% | 1.7 -11% |
Pro
Contra
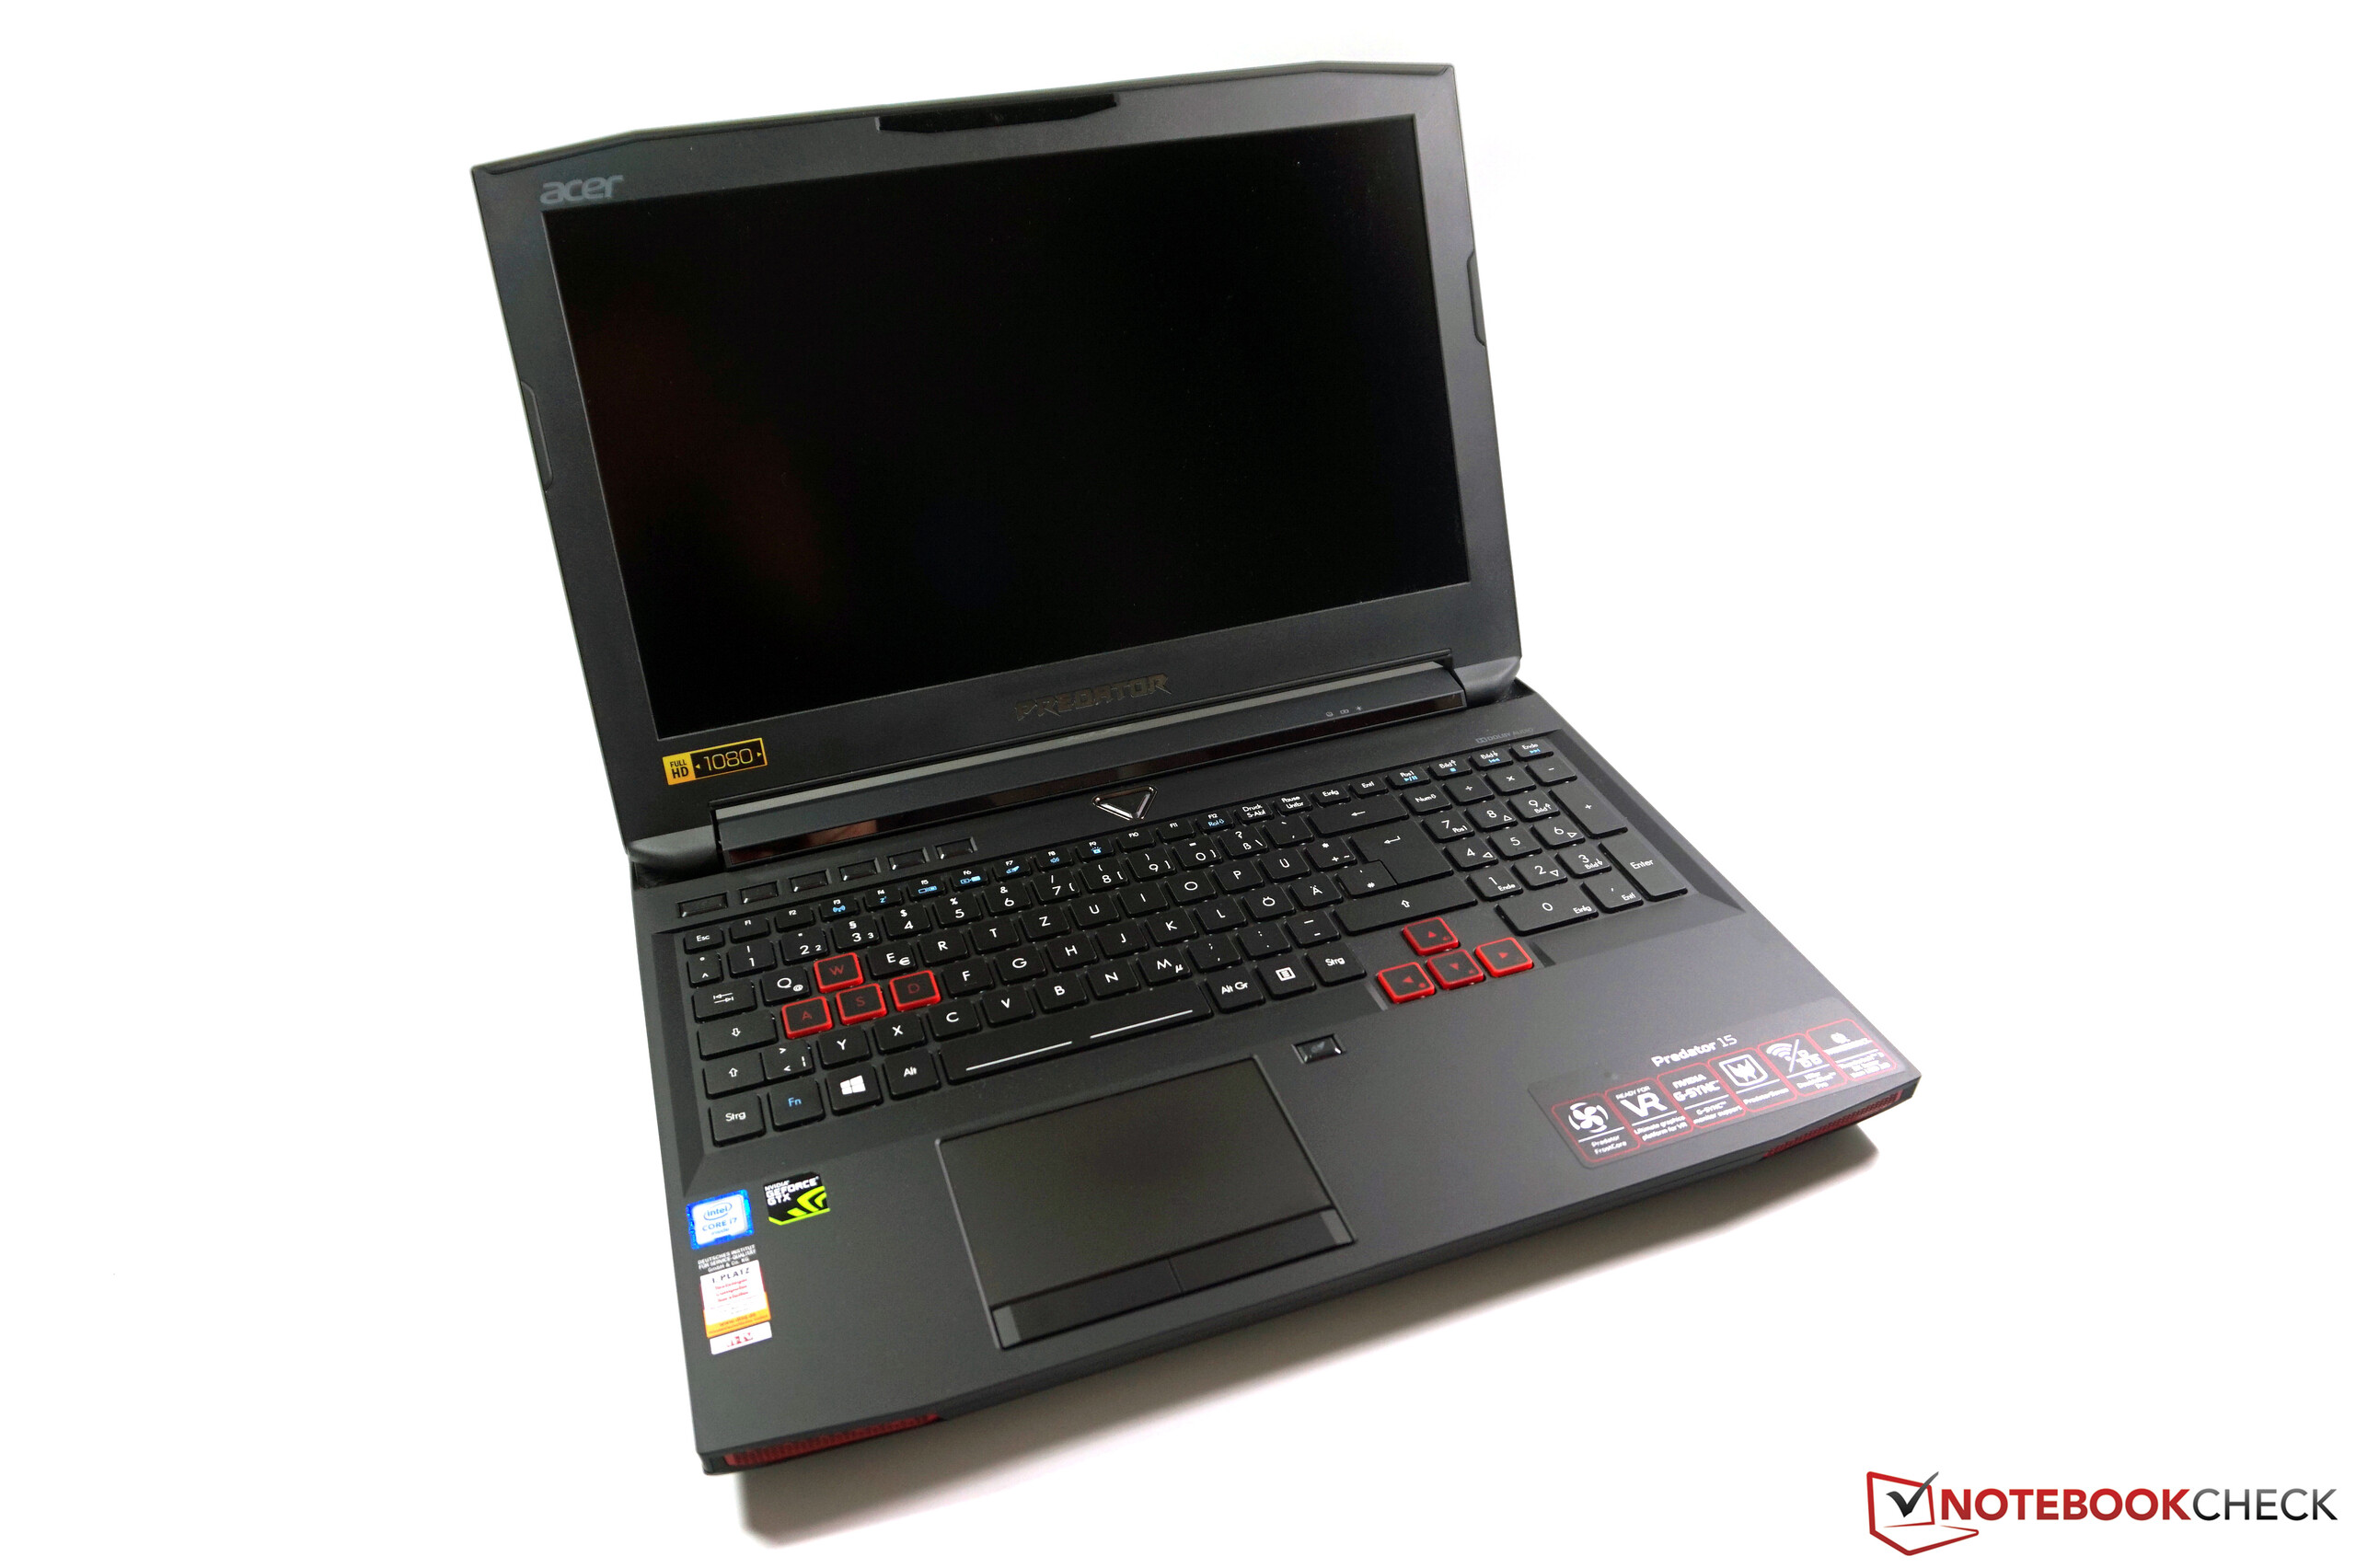
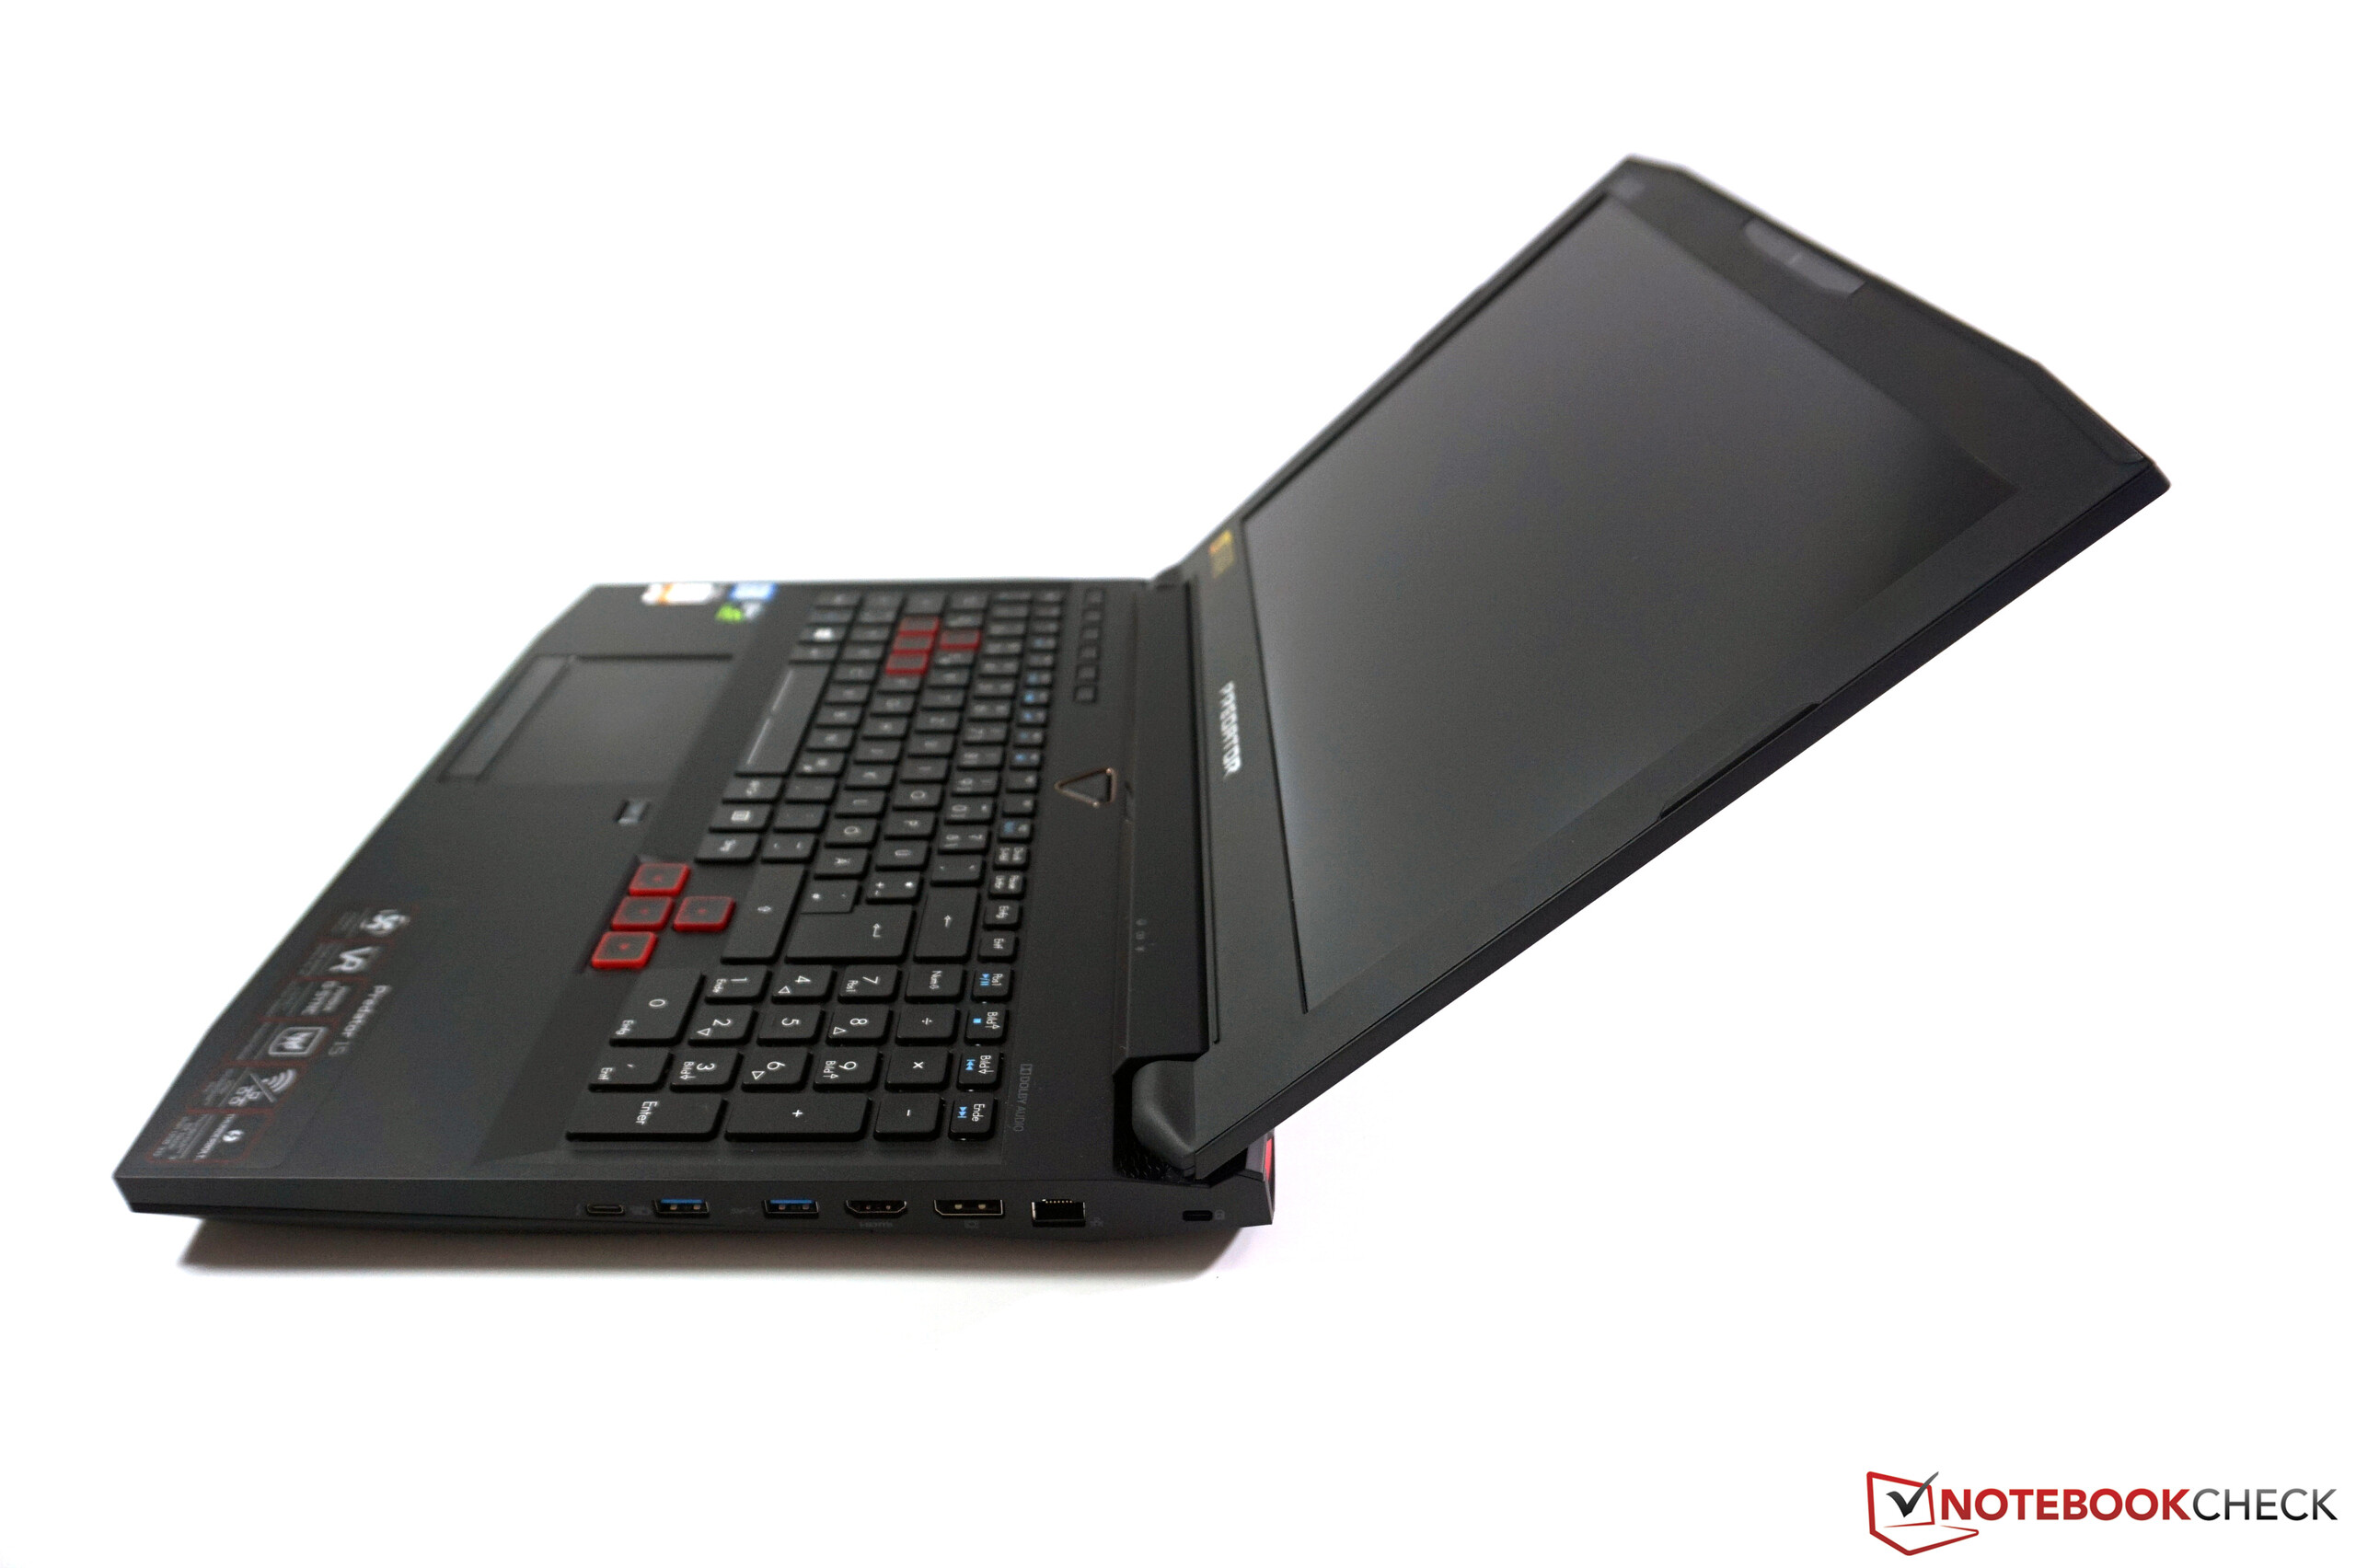
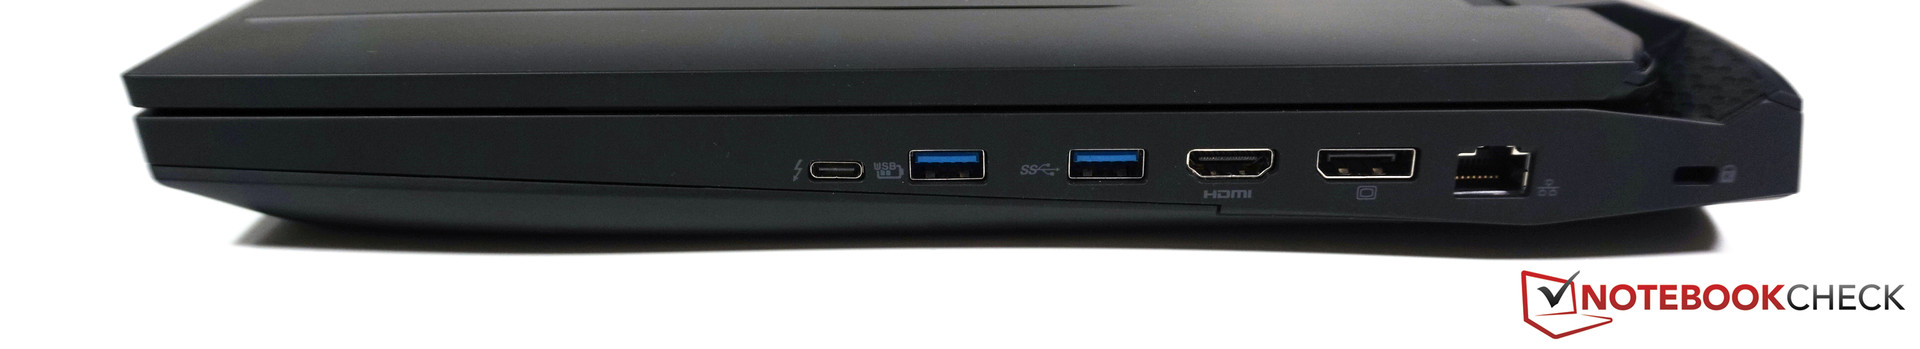
El nuevo Acer Predator 15 G9-593 es una evolución decente de los dos modelos anteriores – al menos en términos de componentes. Asegura un rendimiento suficiente con la nueva GeForce GTX 1070, el buen display IPS por fin soporta G-Sync y los puertos también están al día. El aguante de batería ahora es menor que el anterior, pero a nuestro parecer no es un gran defecto.
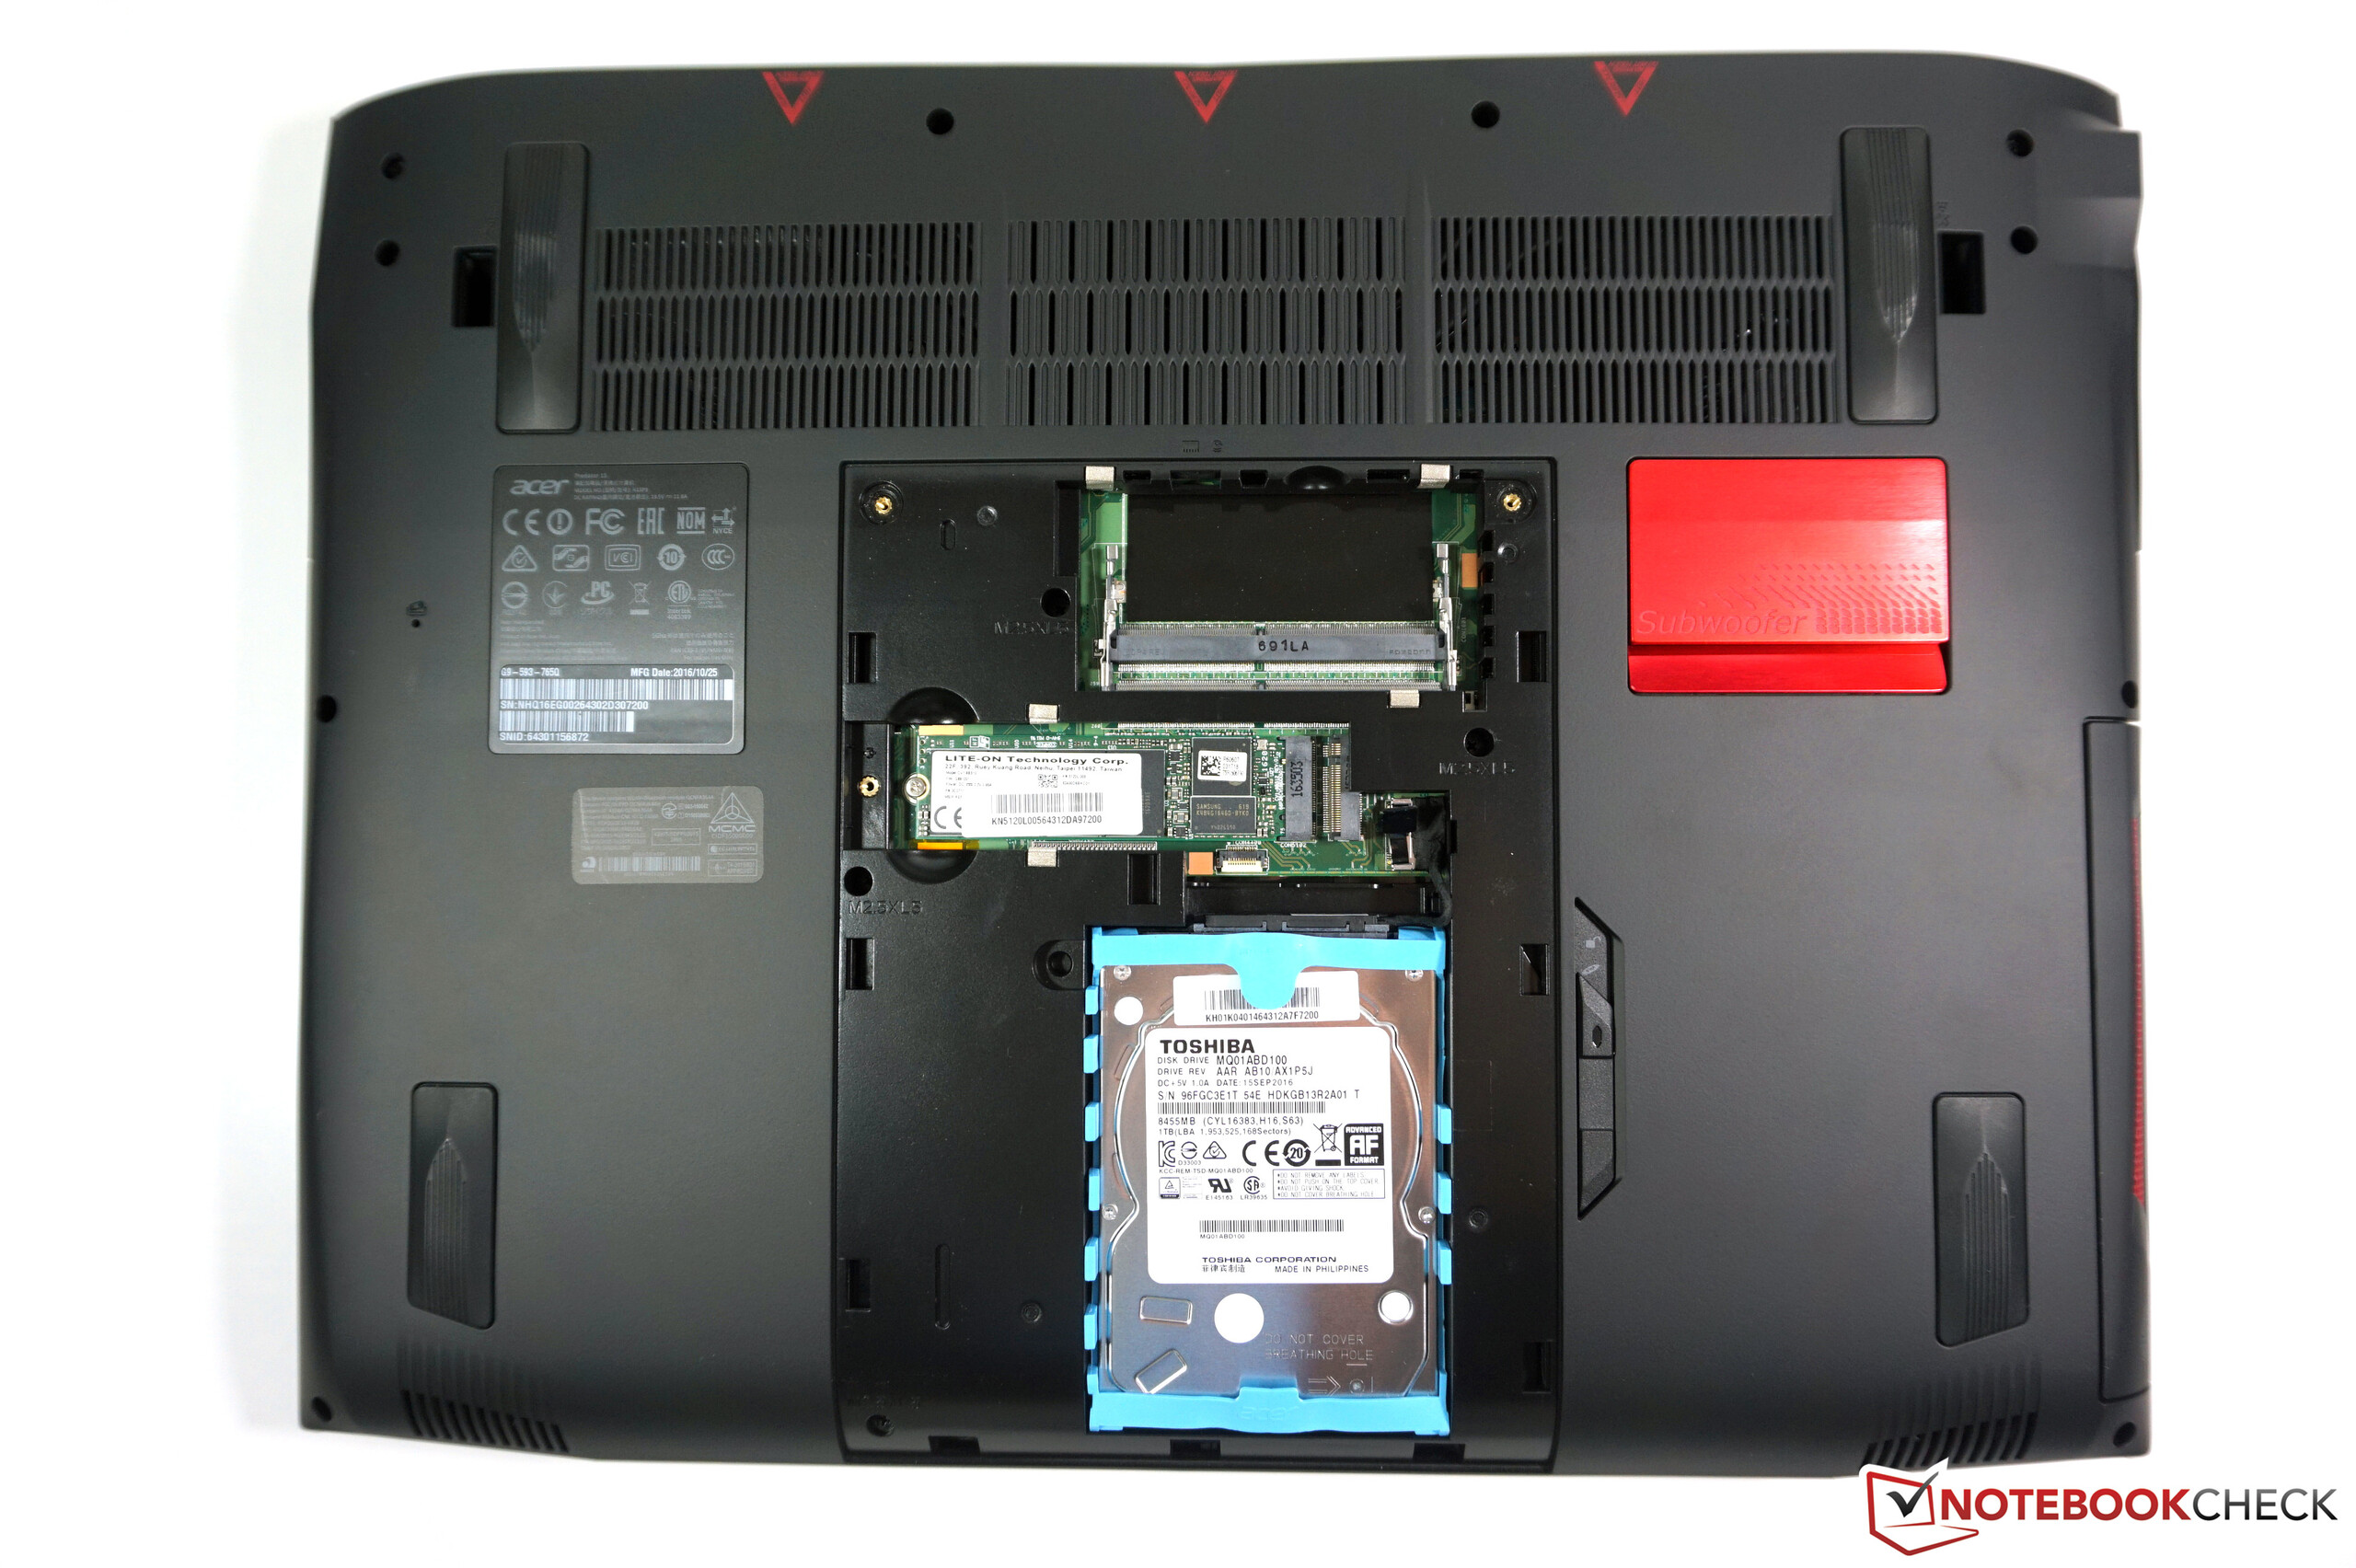
Acer podría mejorar el sistema de sonido. Las mediciones no son tan malas y los módulos también logran un volumen máximo bueno, pero el sonido resultante por desgracia no convence mucho con la falta de graves. Otra pequeña crítica va al SSD, ya que Acer sigue usando discos SATA-III. El fabricante podría también pensarse pantallas de más resolución en las próximas iteraciones visto el aumento de rendimiento GPU.
Mucho rendimiento, bajas temperaturas, buen display, y decentes dispositivos de entrada – si no te molesta el diseño y planeas usar tu portátil gaming de forma estacionaria la mayor parte del tiempo, el Predator 15 G9-593 es una buena elección.
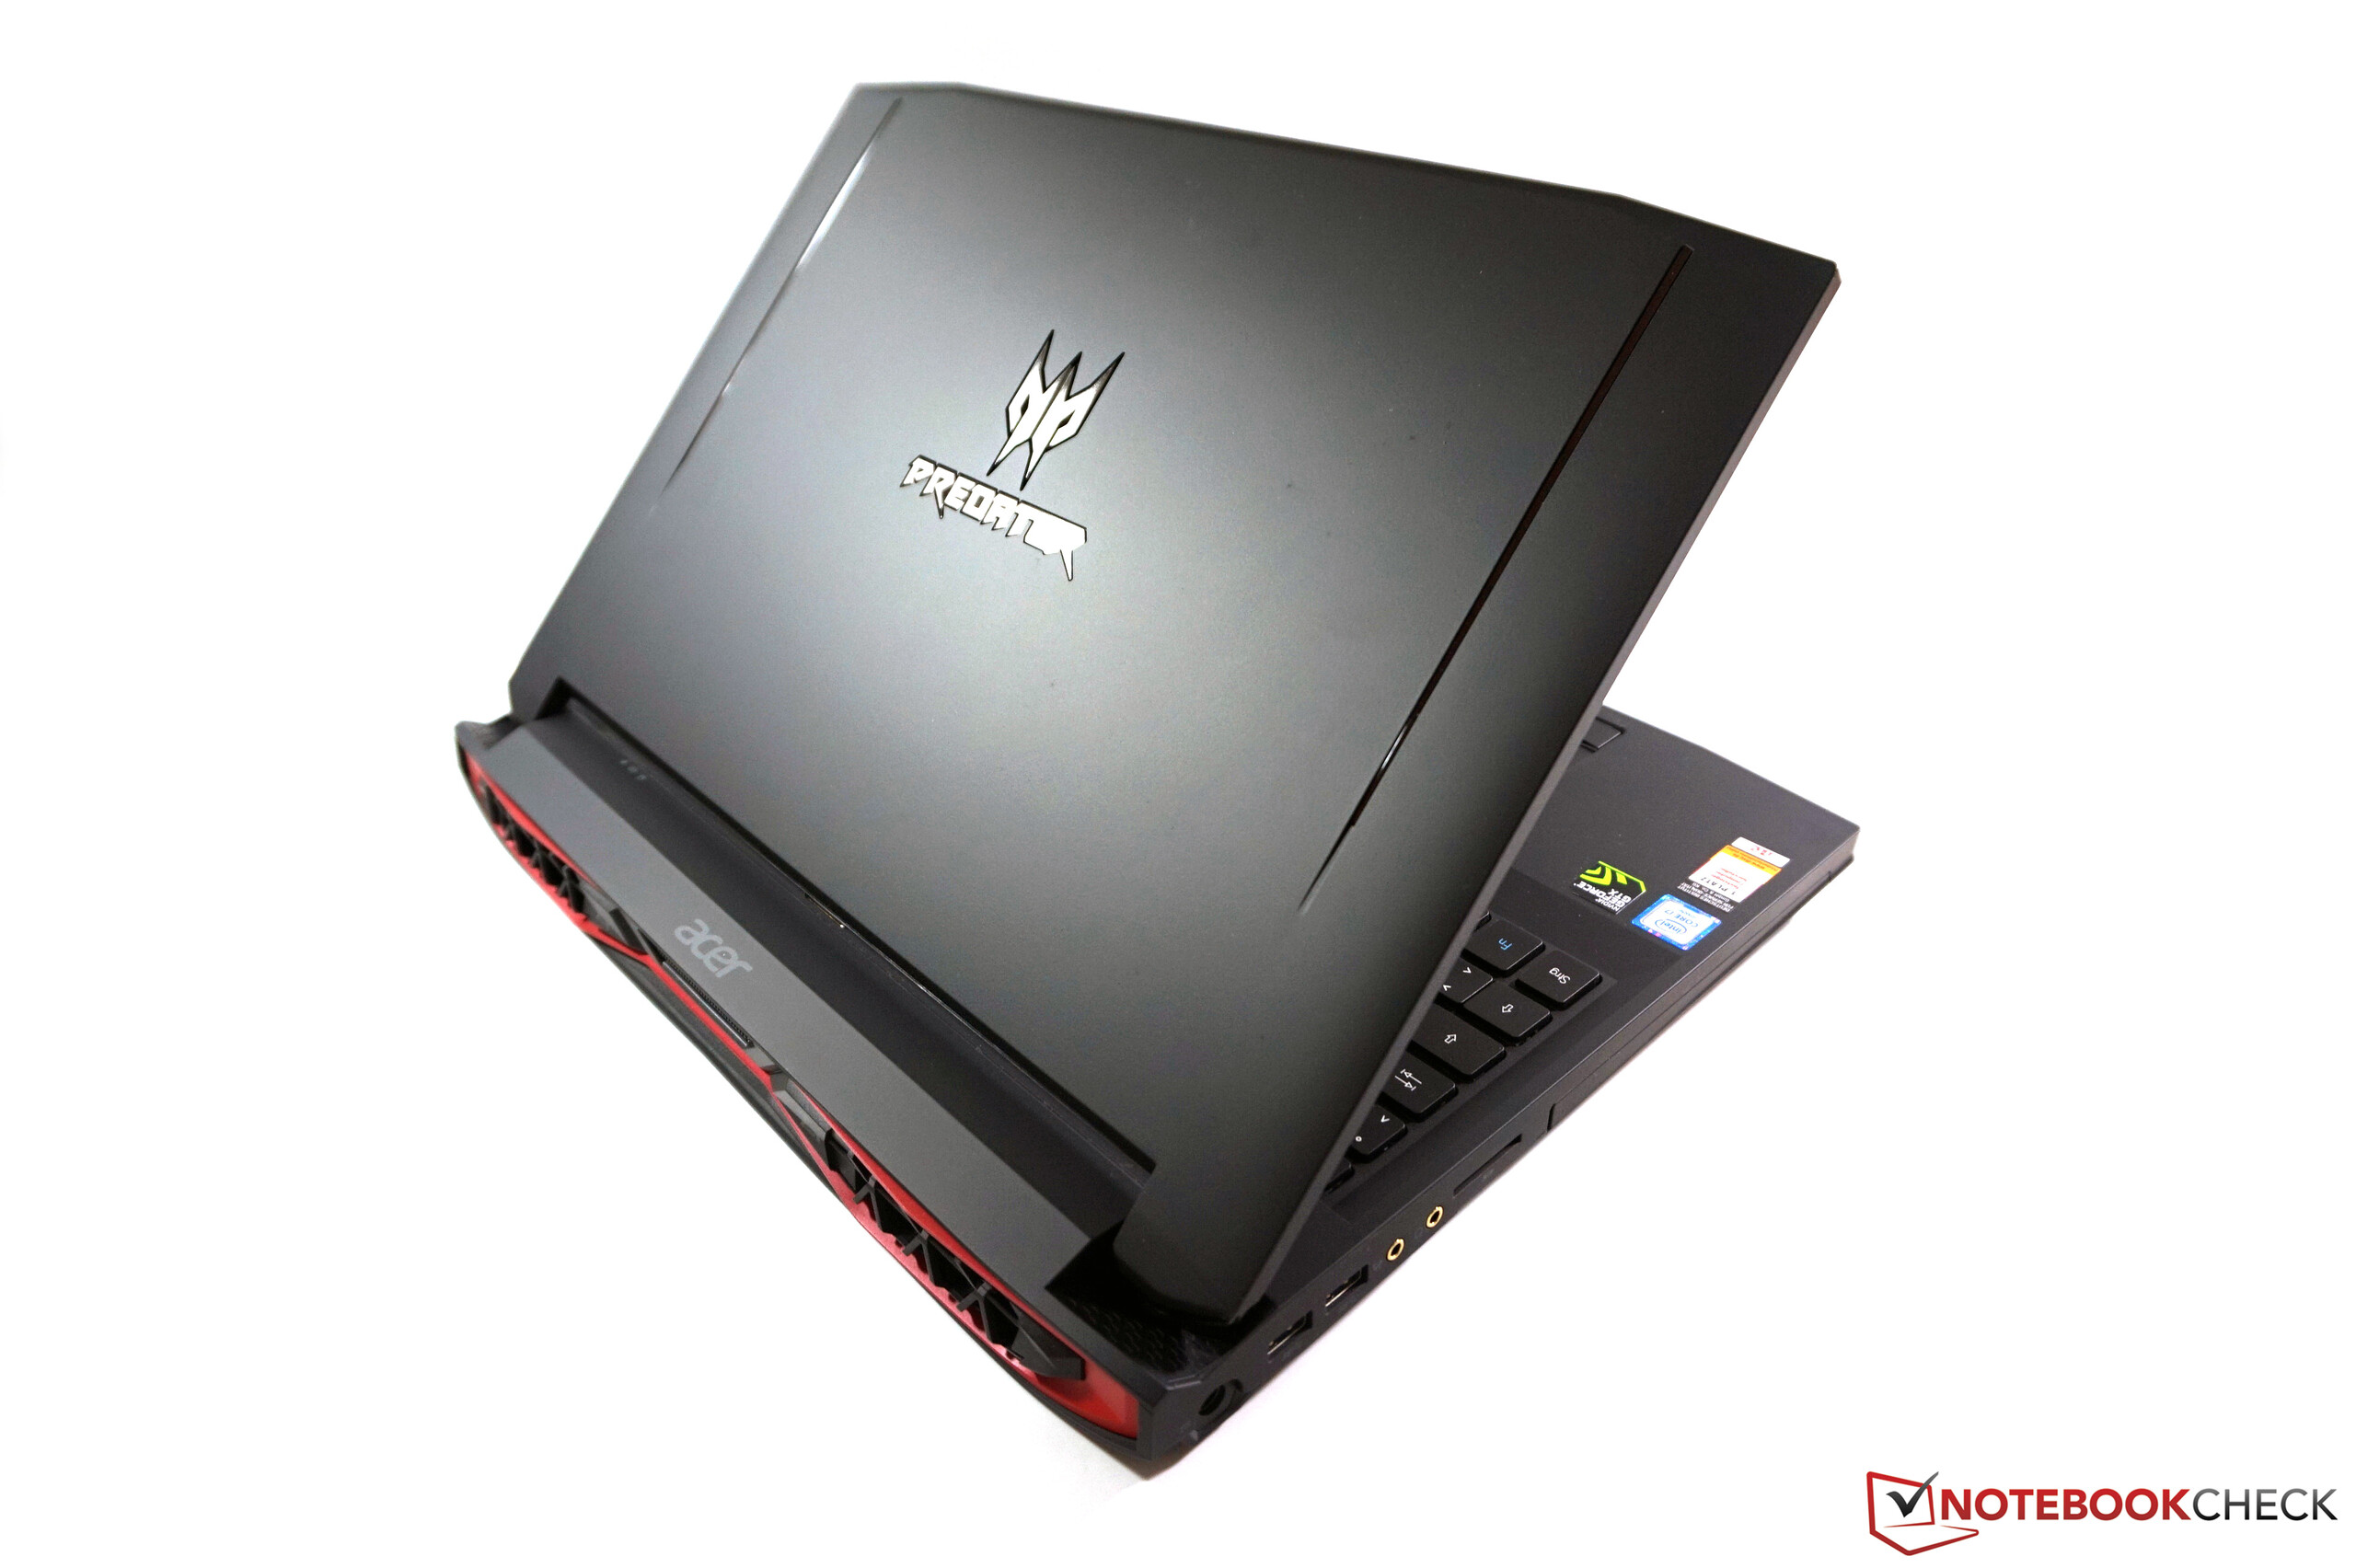
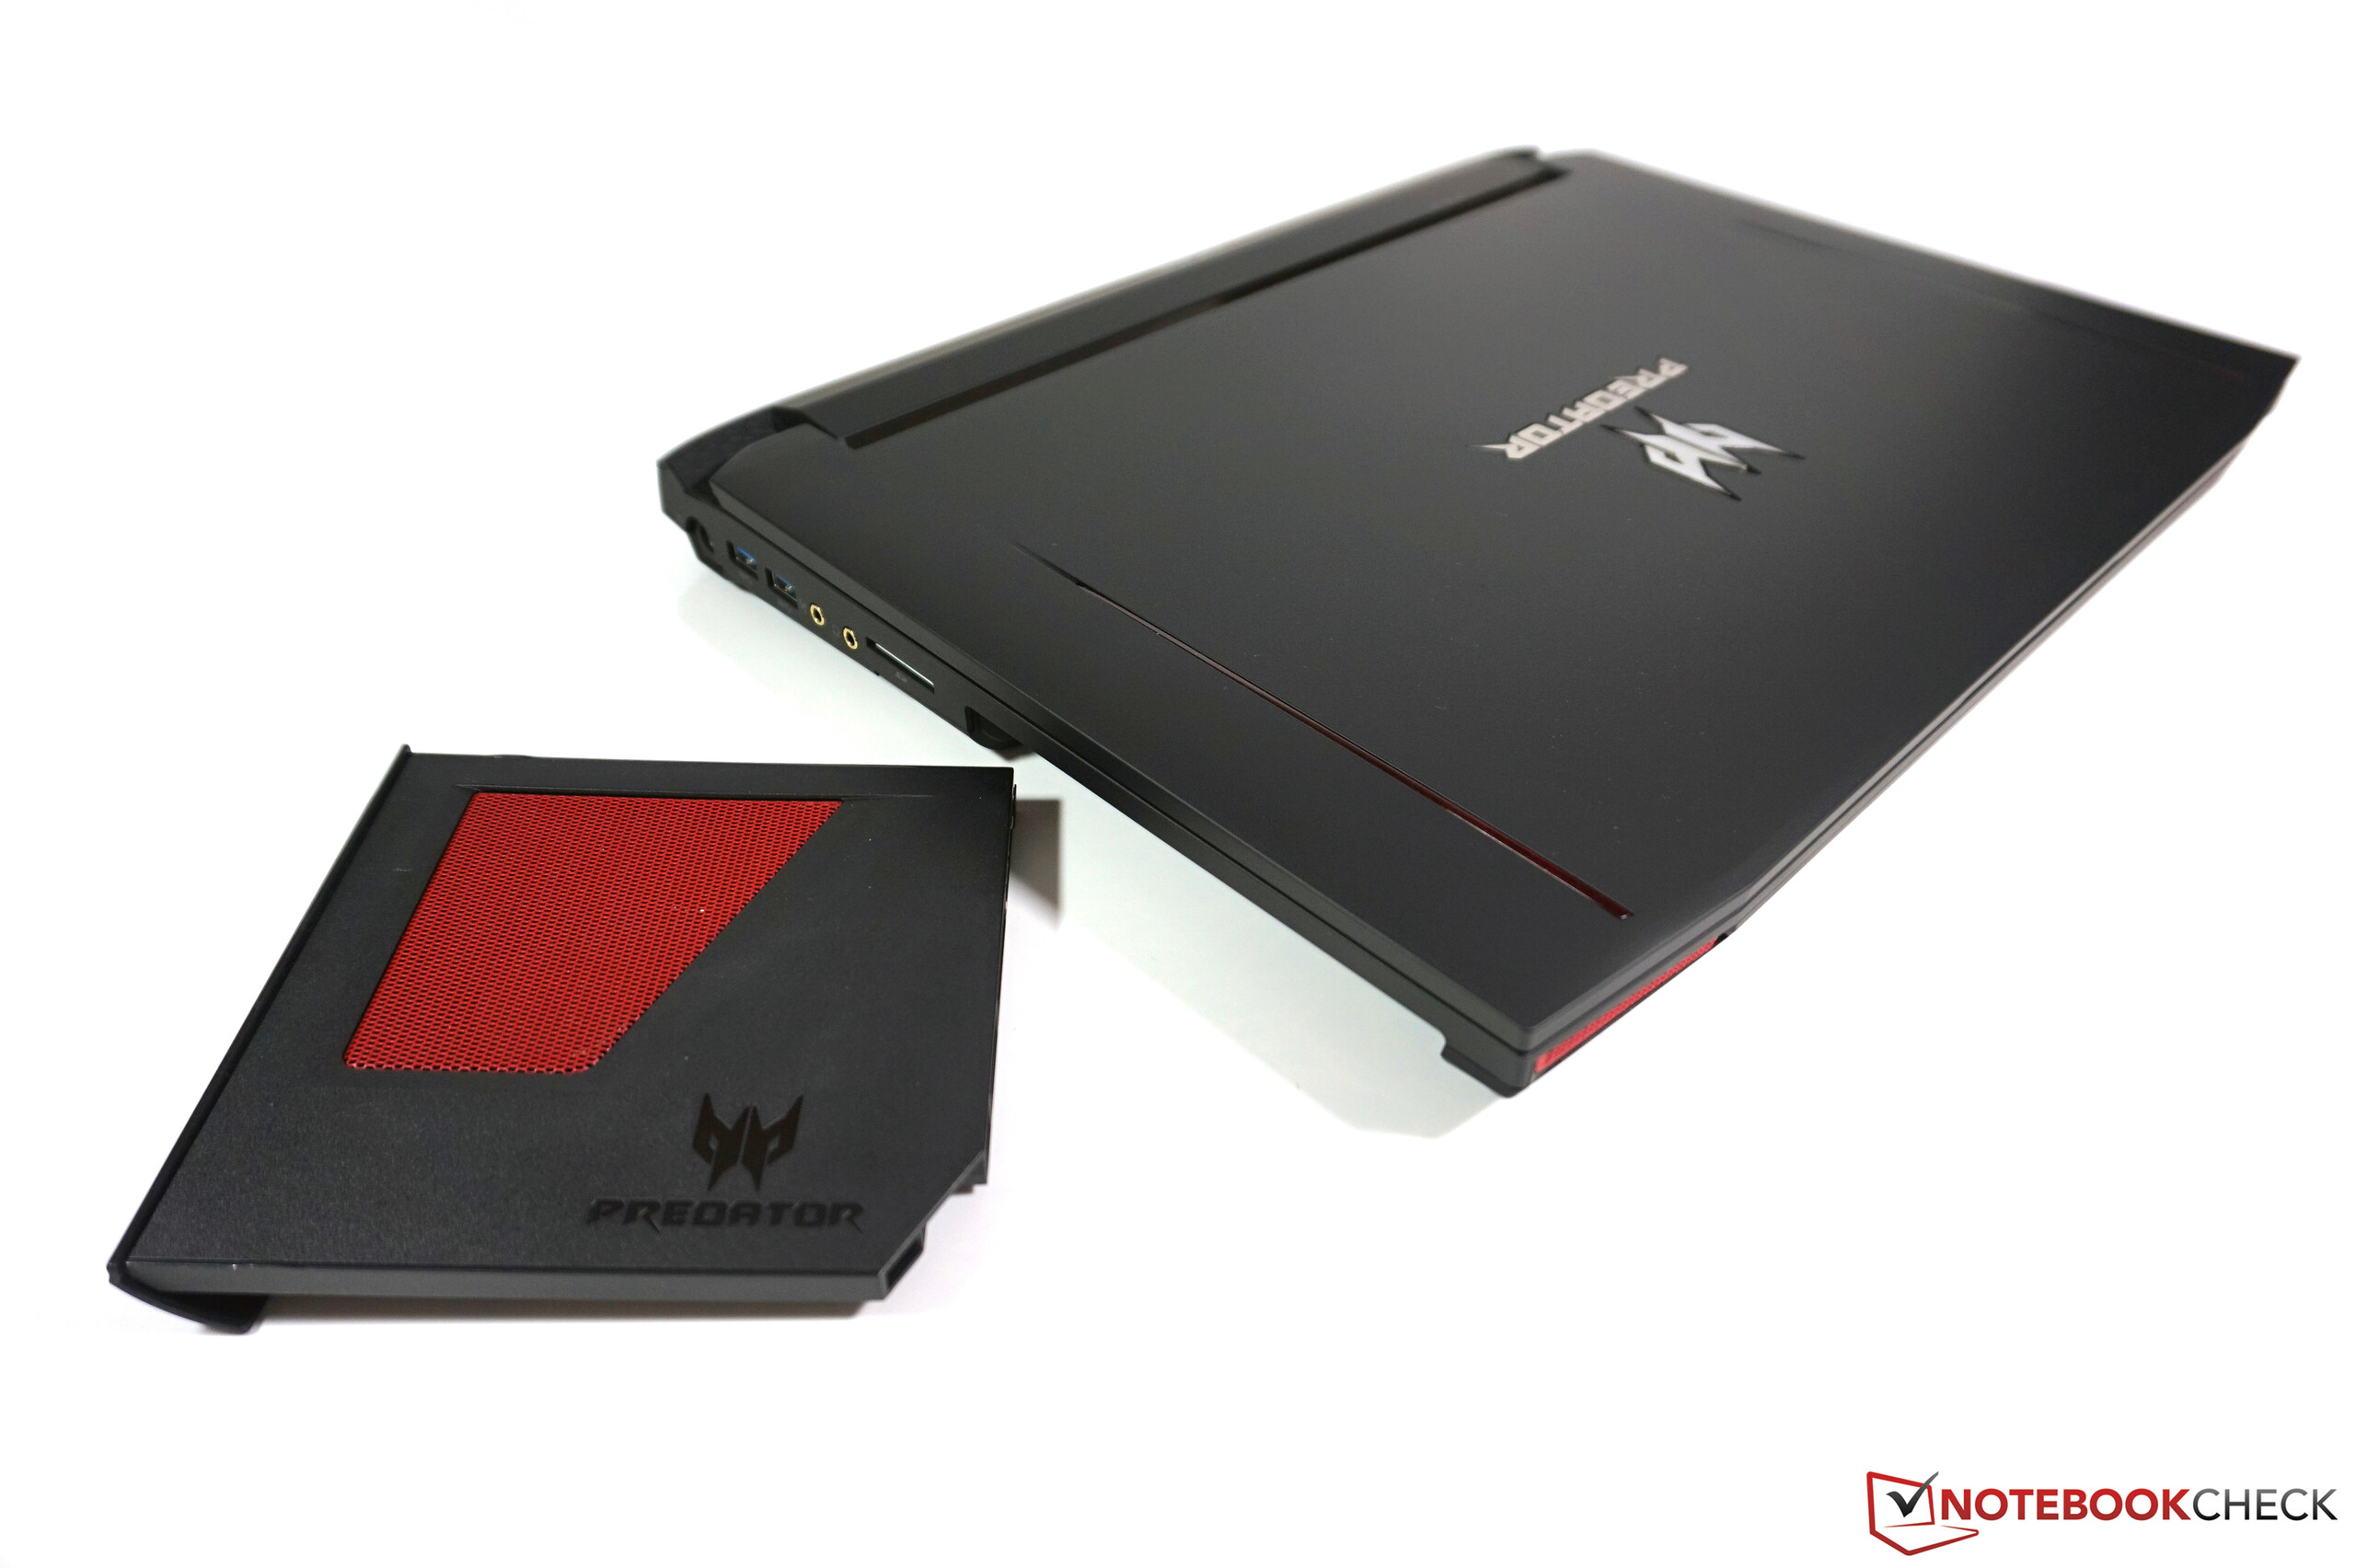
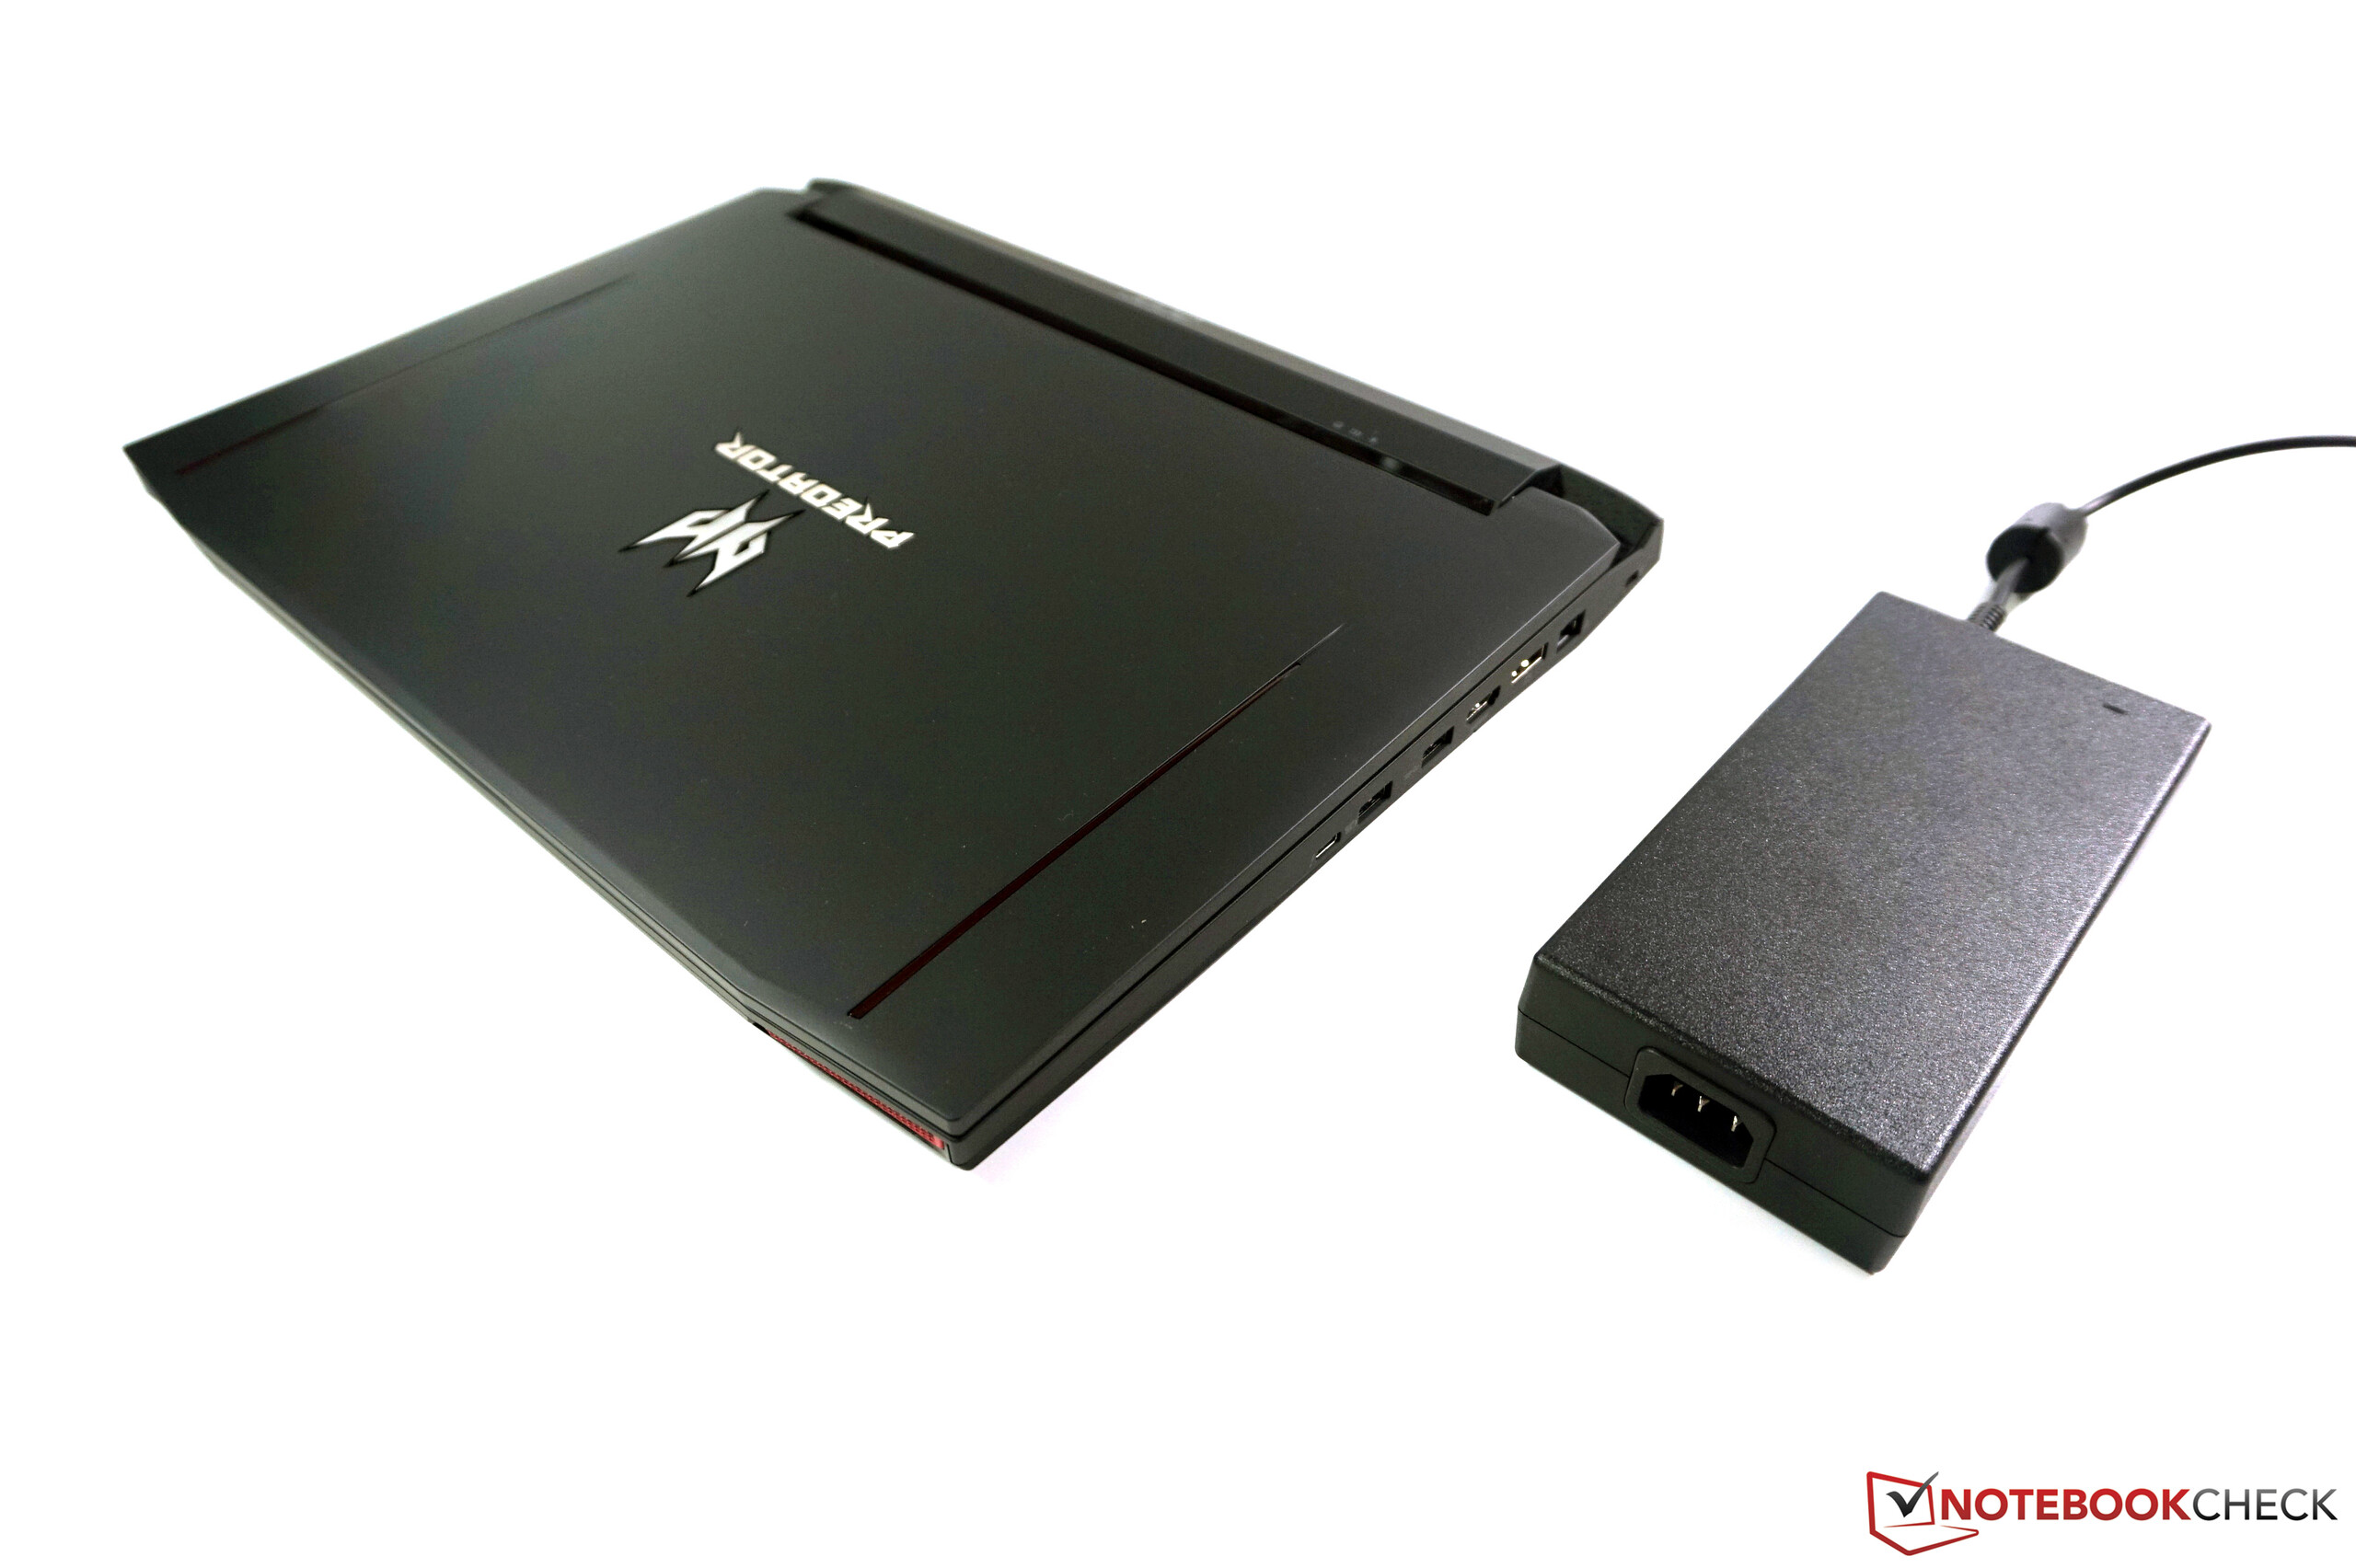
Excepto por el diseño – donde las opiniones diferirán – la carcasa es muy voluminosa y pesada, hasta para un portátil gaming. Luego está el Frost Core, que asegura un reposamanos fresco durante el juego, pero su ventilador es un poco molesto en la práctica. Si no estás jugando, deberías quitarlo. Cont odo, empero, hay pequeños puntos de crítica, y definitivamente tenemos una impresión positiva tras el análisis. El Predator 15 G9-593 es un buen portátil gaming, aunque nuestro modelo de pruebas con el gran SSD no es una ganga dentro de la comparativa.
Ésta es una versión acortada del análisis original. Puedes leer el análisis completo en inglés aquí.
Acer Predator 15 G9-593-765Q
- 12/10/2016 v6 (old)
Andreas Osthoff
Price comparison
