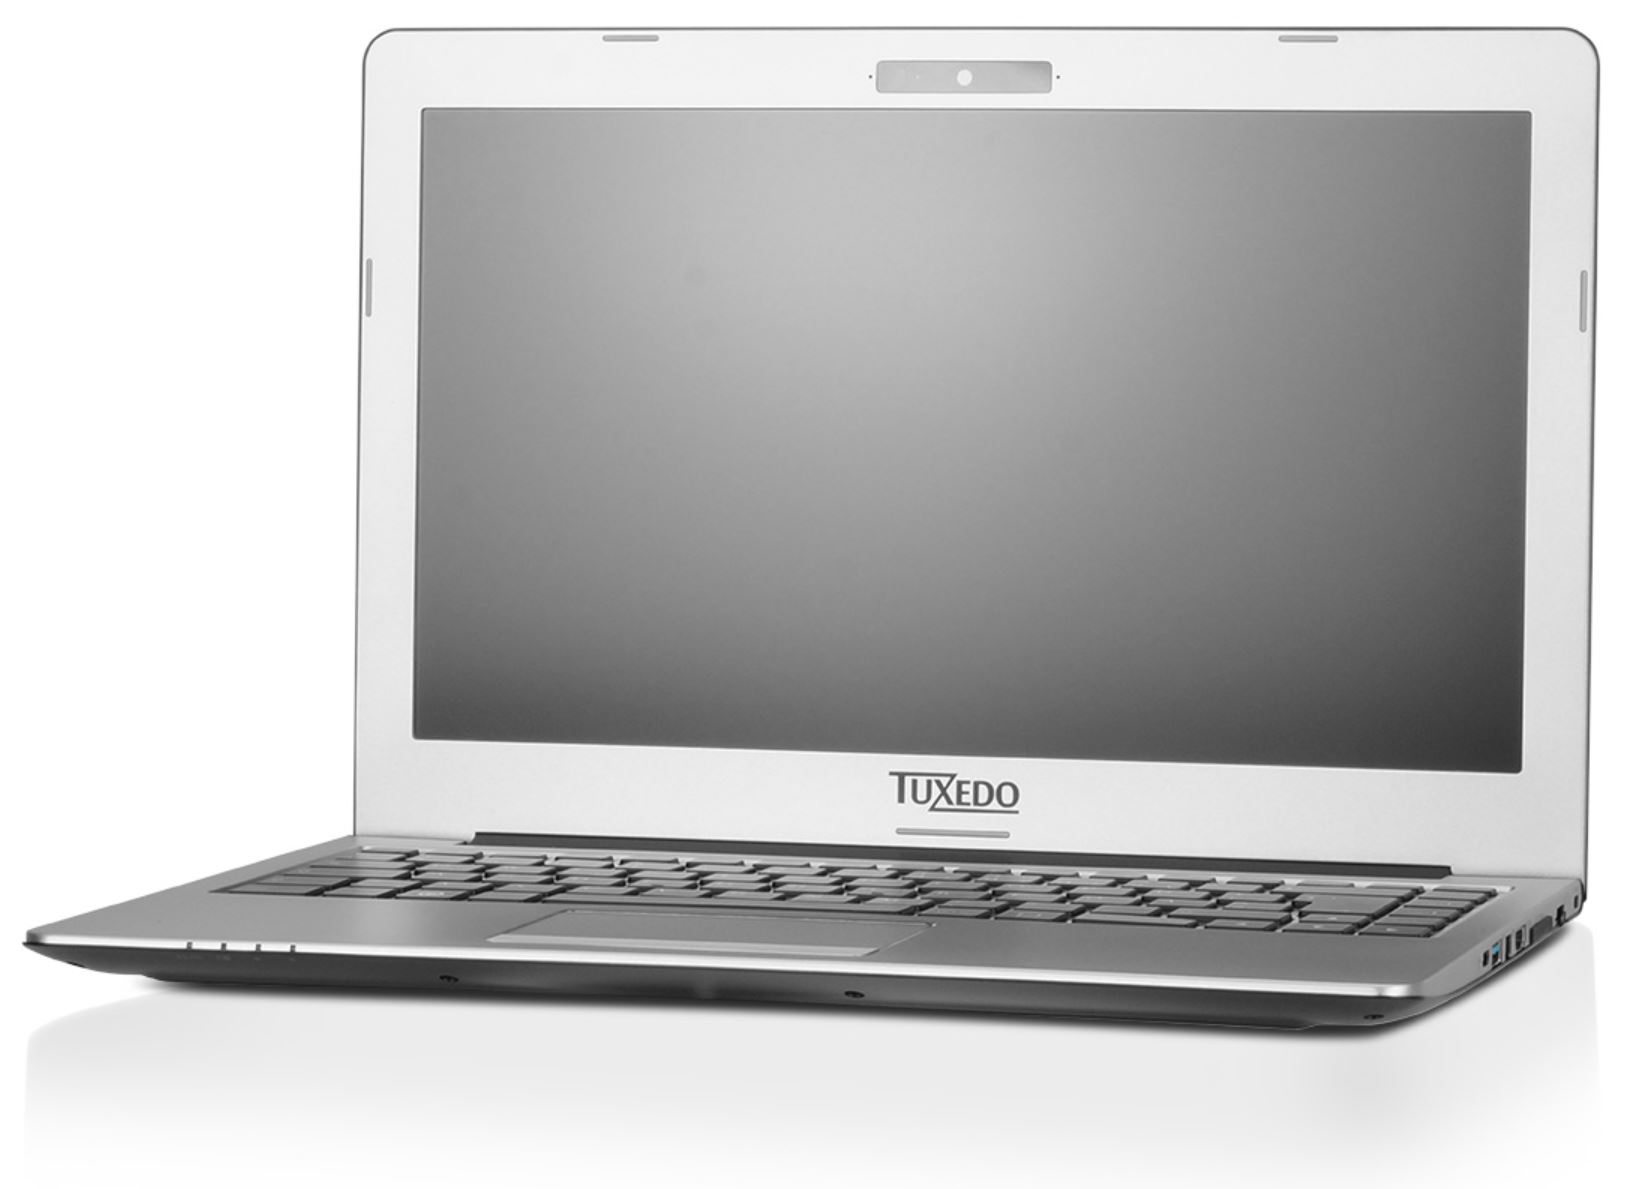
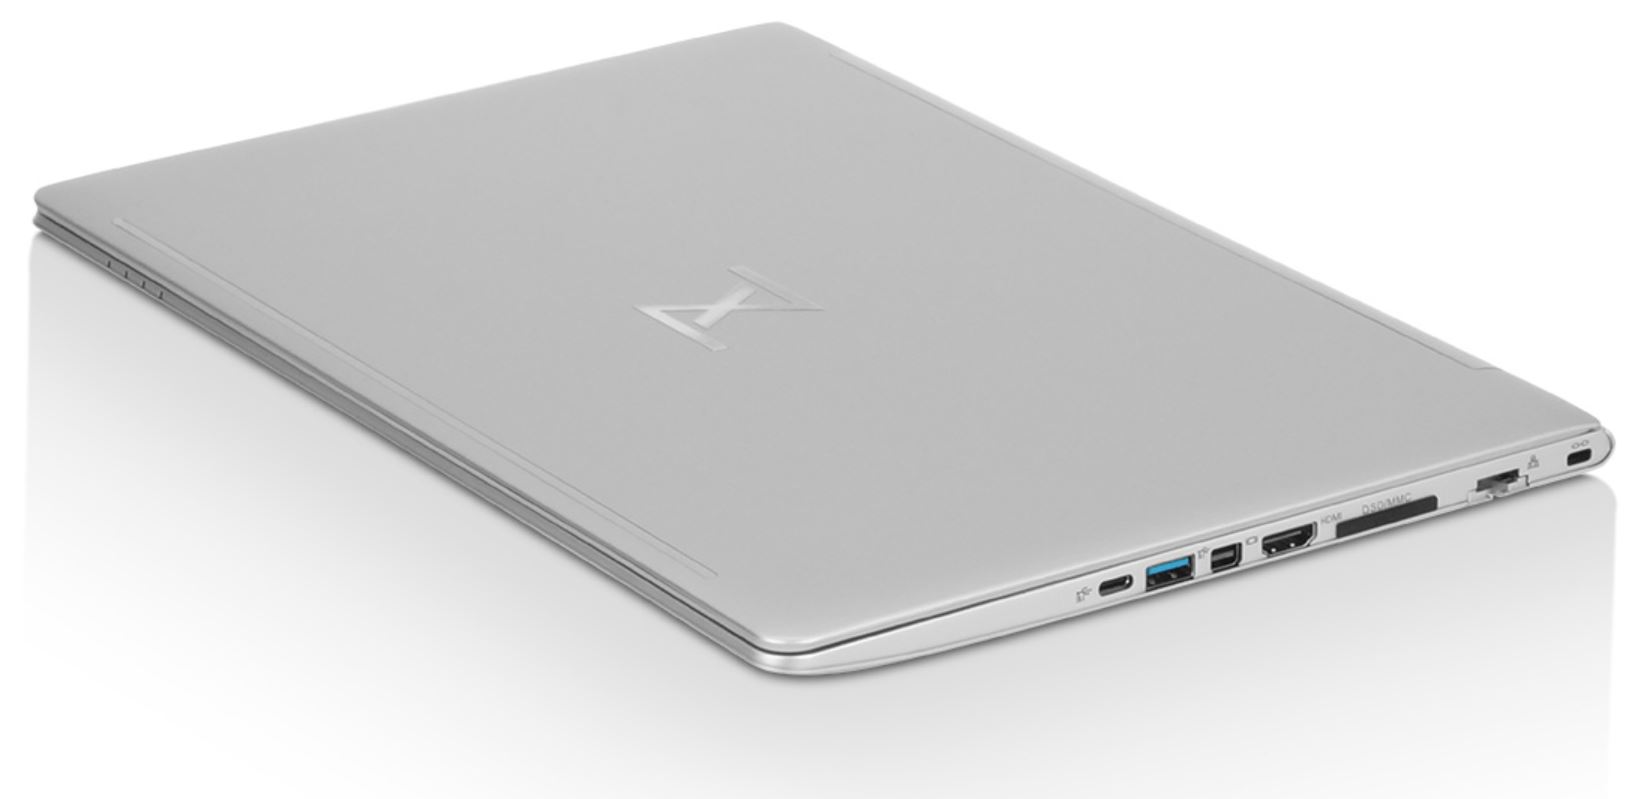
Breve análisis del Tuxedo InfinityBook Pro 13 2017 (i7-8550U, 500 GB, 32 GB, FHD)
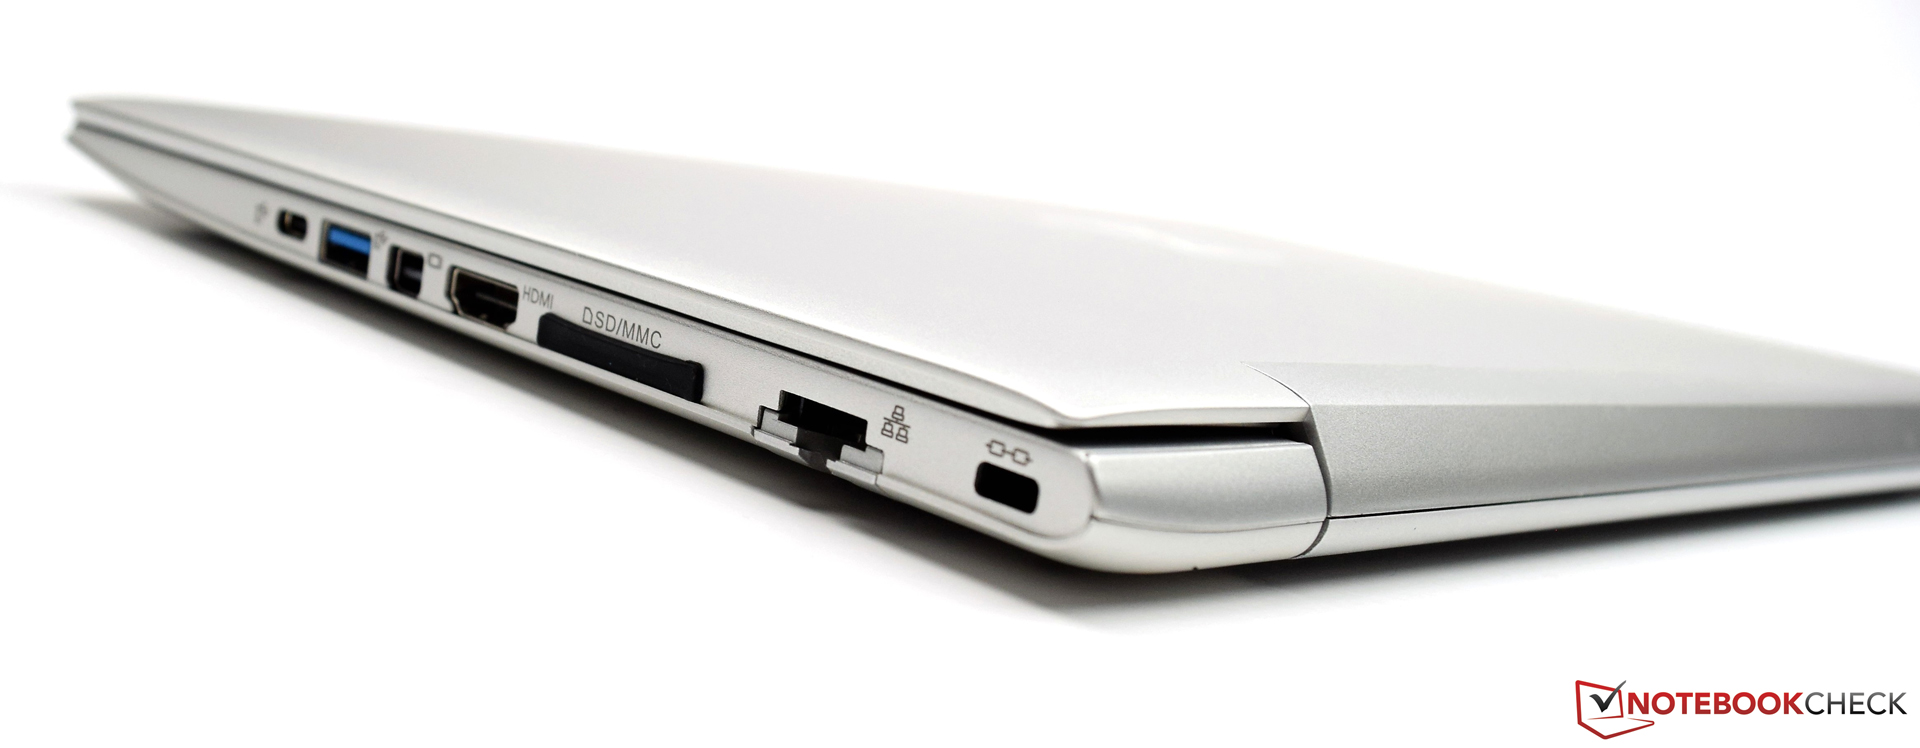
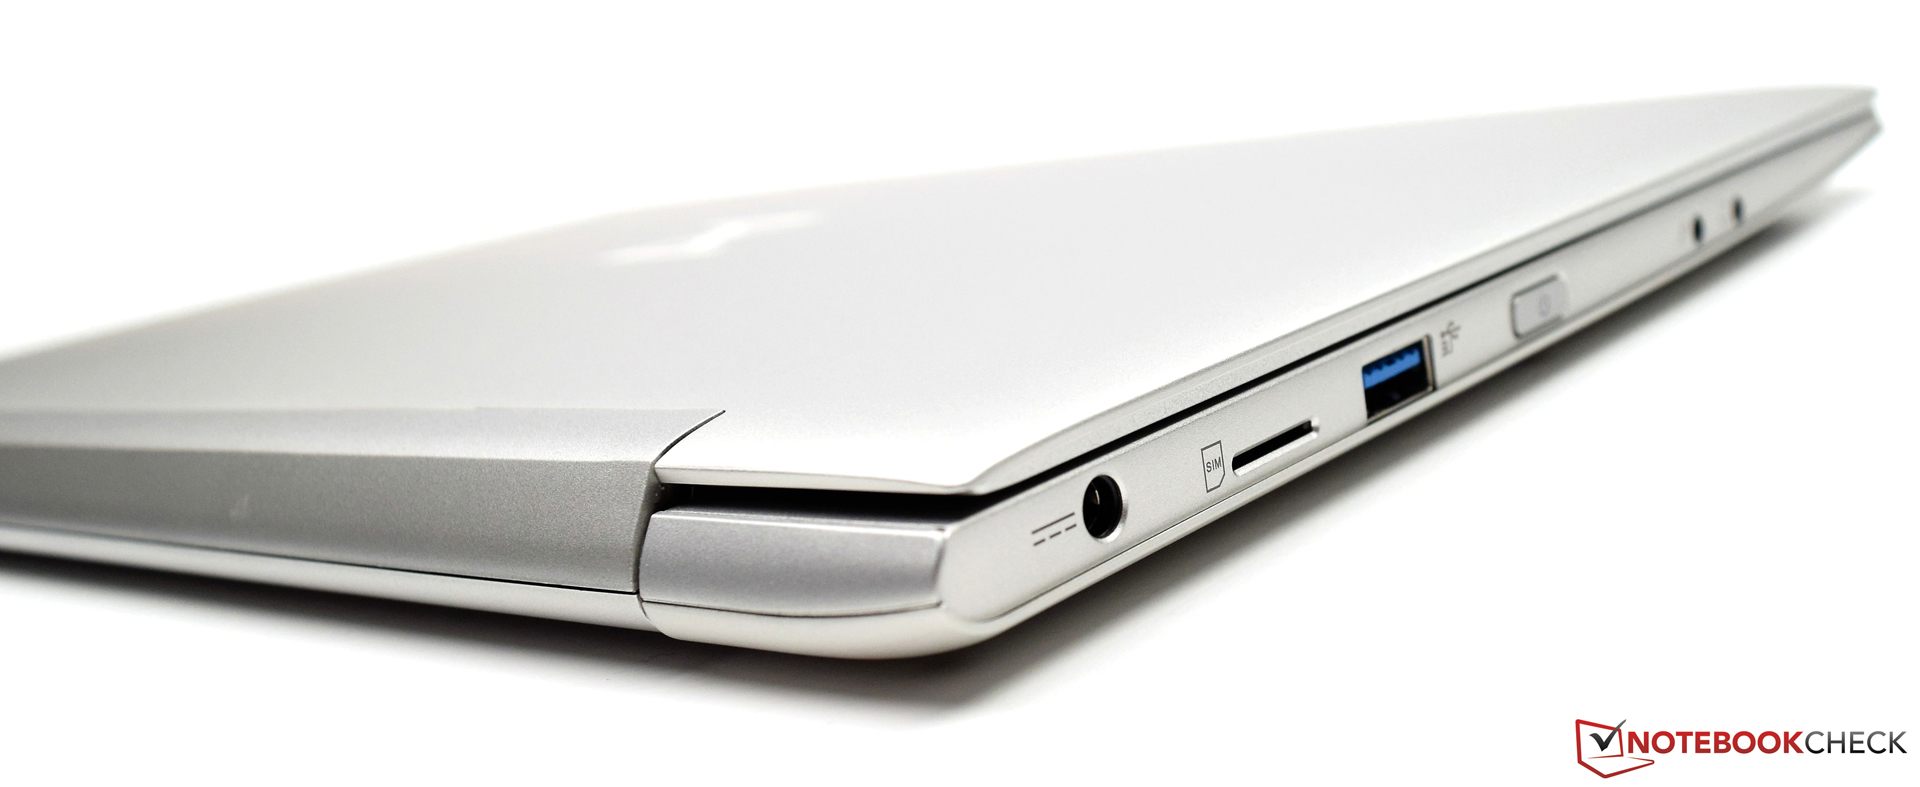
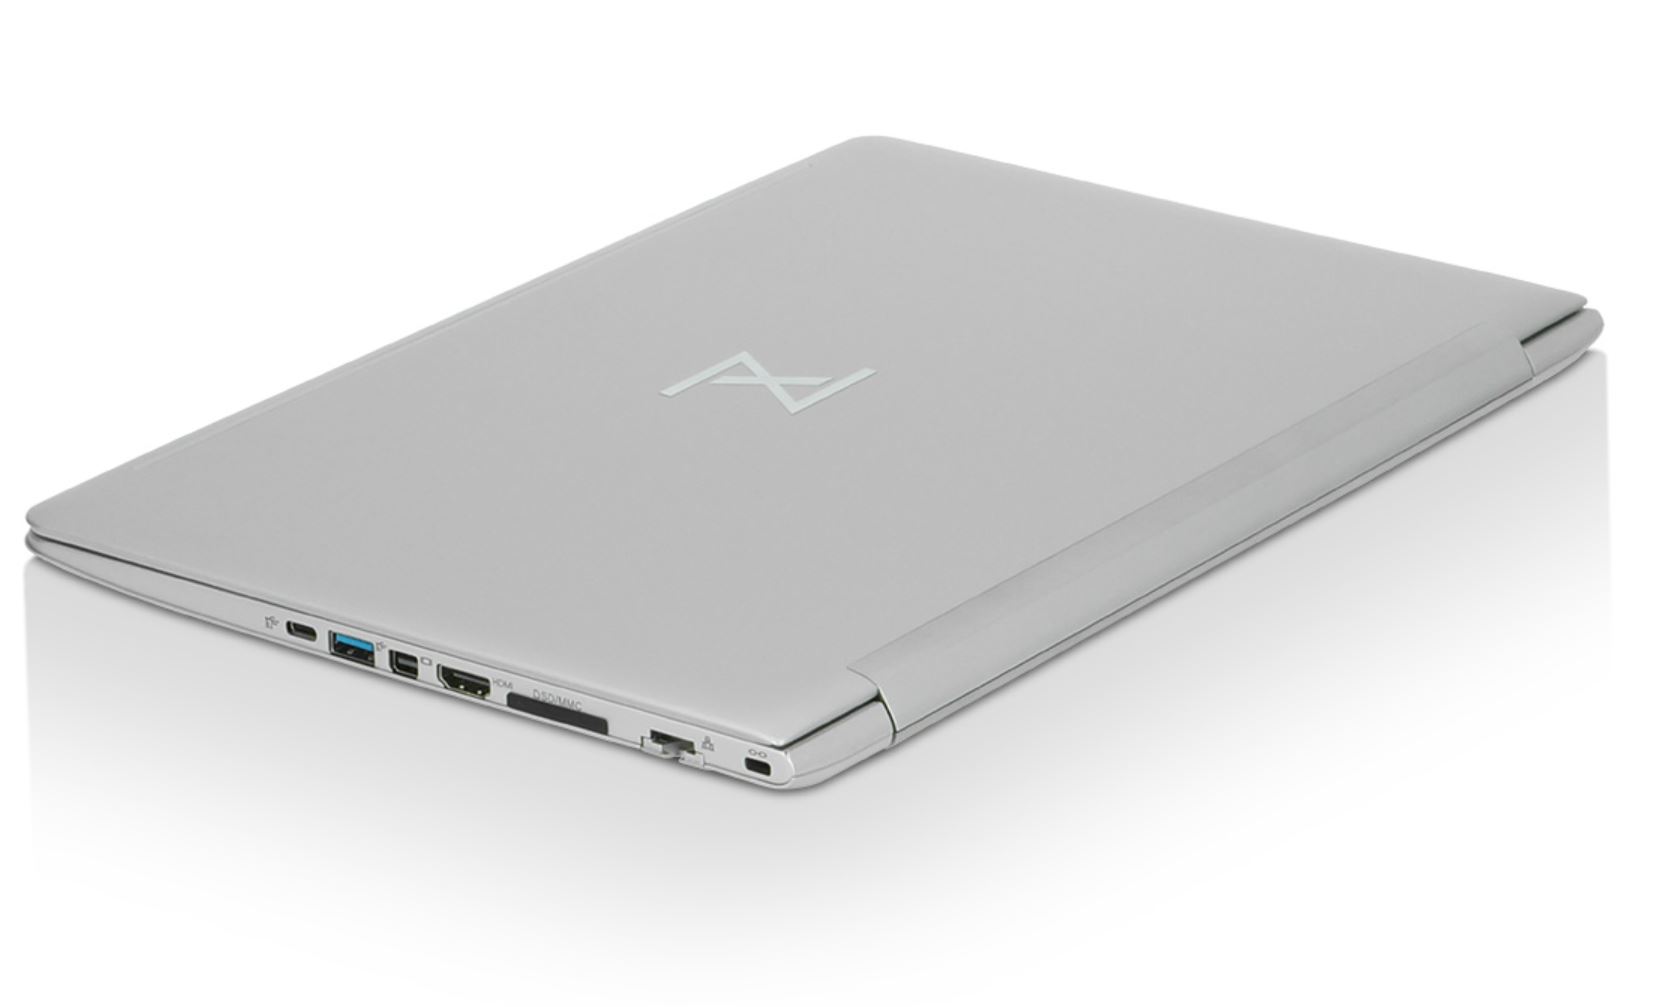
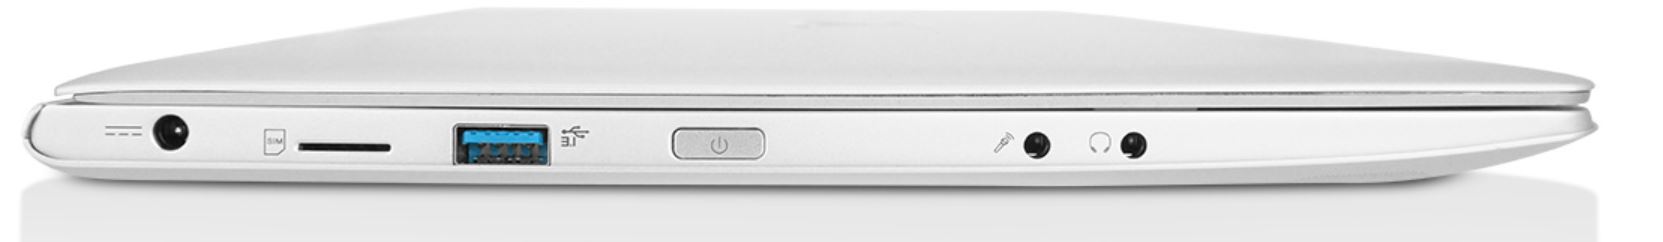
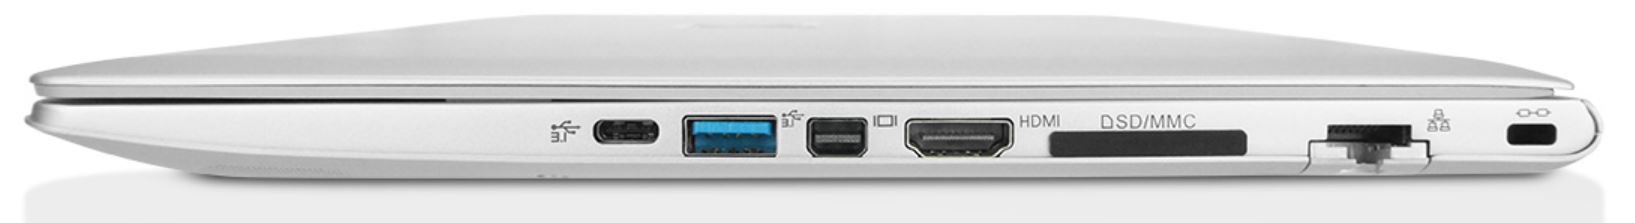
Connections
| SD Card Reader | |
| average JPG Copy Test (av. of 3 runs) | |
| Dell XPS 13 i7-8550U | |
| Tuxedo InfinityBook Pro 13 2017 (Toshiba Exceria Pro SDXC 64 GB UHS-II) | |
| Tuxedo InfinityBook Pro 13 N130BU (Toshiba Exceria Pro SDXC 64 GB UHS-II) | |
| HP Envy 13-ad006ng (Toshiba Exceria Pro SDXC 64 GB UHS-II) | |
| Tuxedo InfinityBook 13 v2 (Toshiba Exceria Pro SDXC 64 GB UHS-II) | |
| maximum AS SSD Seq Read Test (1GB) | |
| Dell XPS 13 i7-8550U | |
| Tuxedo InfinityBook Pro 13 N130BU (Toshiba Exceria Pro SDXC 64 GB UHS-II) | |
| Tuxedo InfinityBook Pro 13 2017 (Toshiba Exceria Pro SDXC 64 GB UHS-II) | |
| HP Envy 13-ad006ng (Toshiba Exceria Pro SDXC 64 GB UHS-II) | |
| Tuxedo InfinityBook 13 v2 (Toshiba Exceria Pro SDXC 64 GB UHS-II) | |
| Networking | |
| iperf3 transmit AX12 | |
| HP Envy 13-ad006ng | |
| HP Spectre 13-v131ng | |
| Tuxedo InfinityBook Pro 13 N130BU | |
| Dell XPS 13 i7-8550U | |
| Tuxedo InfinityBook Pro 13 2017 | |
| iperf3 receive AX12 | |
| Tuxedo InfinityBook Pro 13 2017 | |
| Dell XPS 13 i7-8550U | |
| HP Envy 13-ad006ng | |
| Tuxedo InfinityBook Pro 13 N130BU | |
| HP Spectre 13-v131ng | |
| |||||||||||||||||||||||||
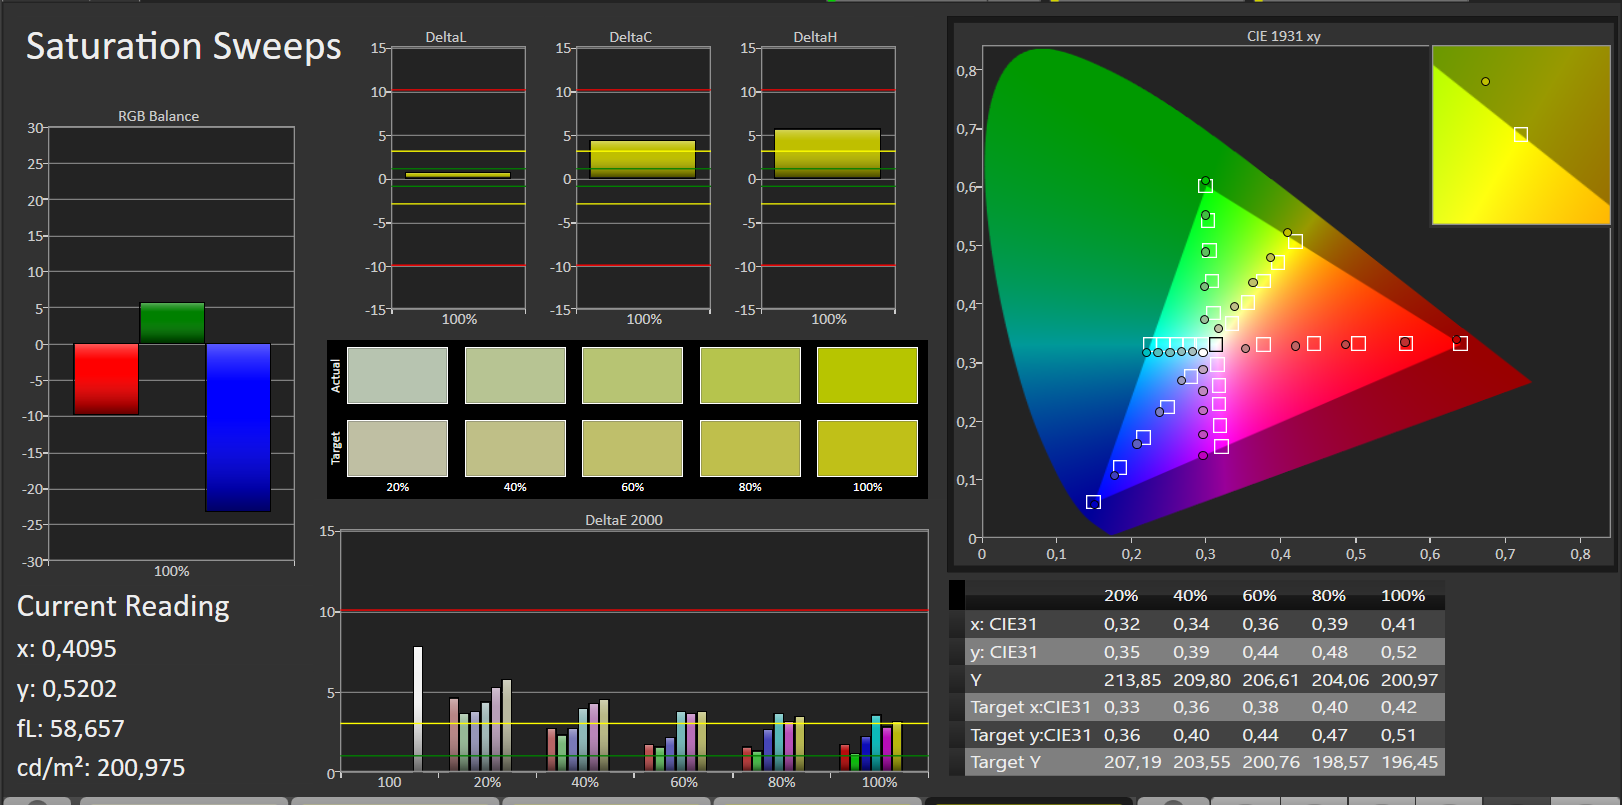
iluminación: 81 %
Brillo con batería: 417 cd/m²
Contraste: 1150:1 (Negro: 0.36 cd/m²)
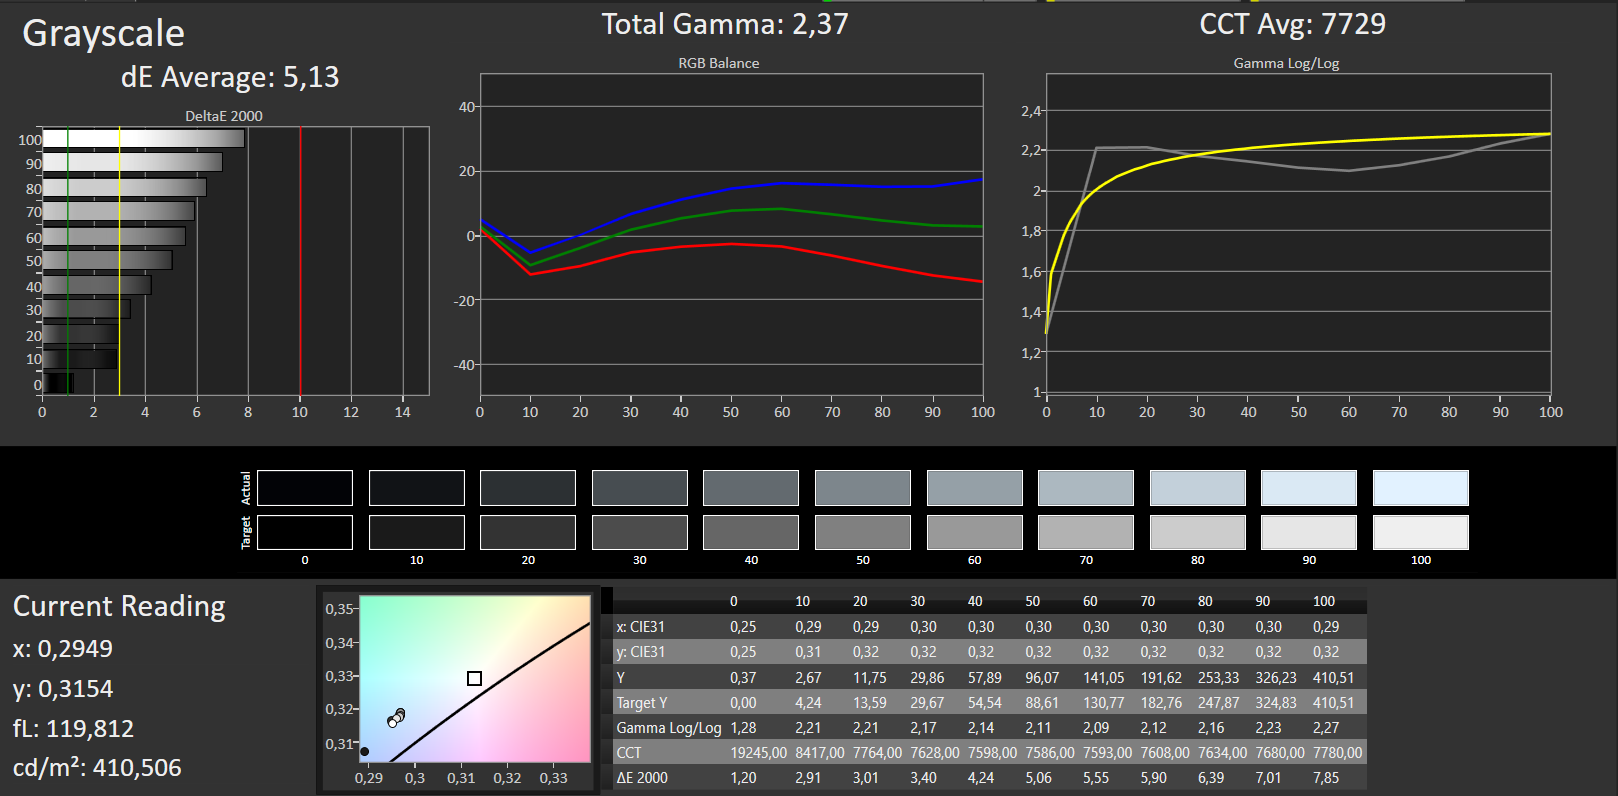
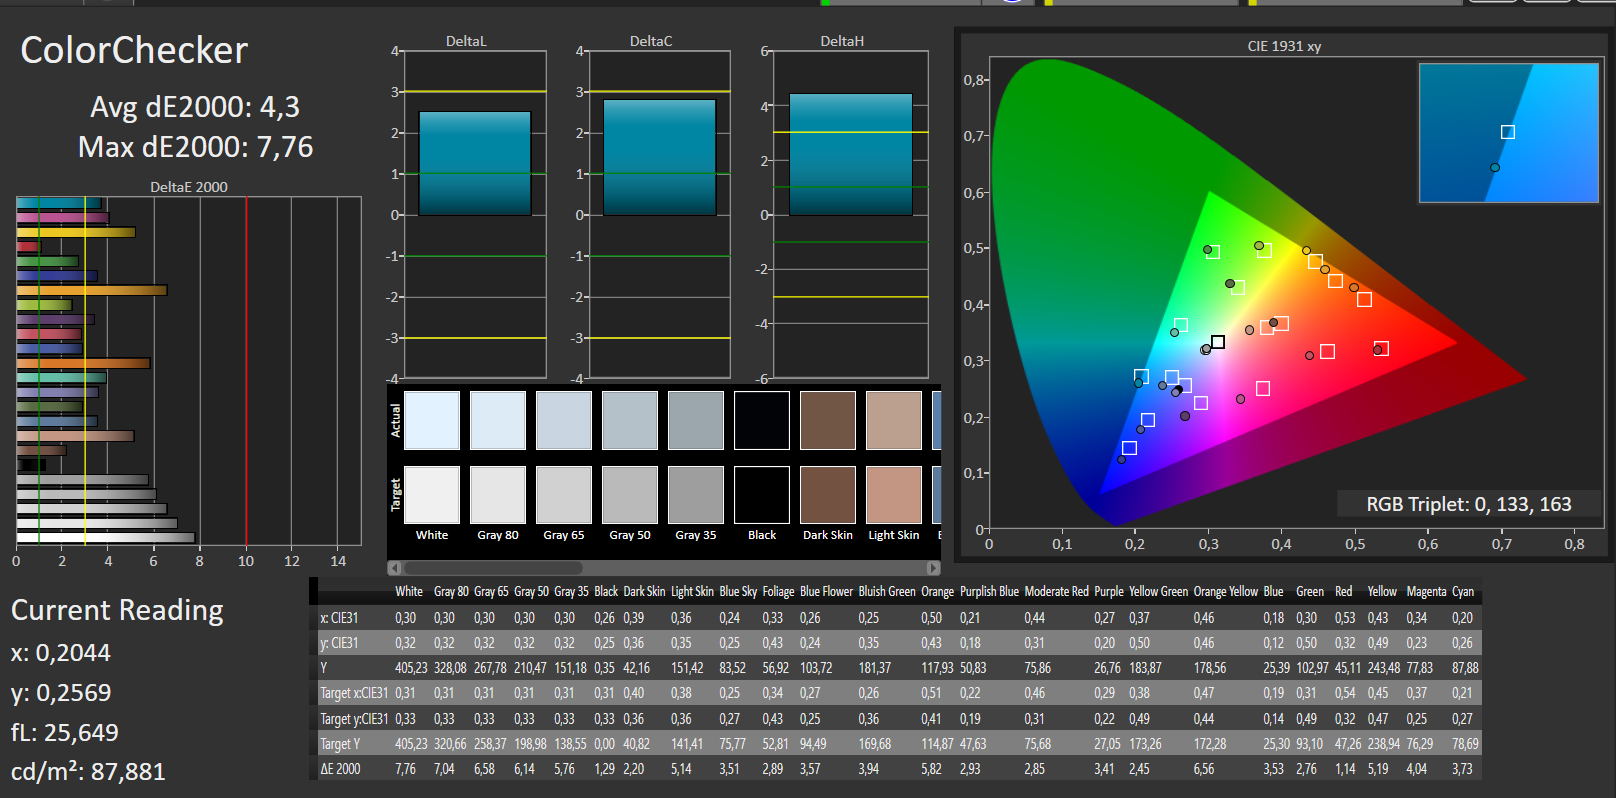
ΔE ColorChecker Calman: 4.3 | ∀{0.5-29.43 Ø4.73}
ΔE Greyscale Calman: 5.13 | ∀{0.09-98 Ø4.97}
99% sRGB (Argyll 1.6.3 3D)
64% AdobeRGB 1998 (Argyll 1.6.3 3D)
69.6% AdobeRGB 1998 (Argyll 3D)
98.9% sRGB (Argyll 3D)
67.8% Display P3 (Argyll 3D)
Gamma: 2.37
CCT: 7729 K
| Tuxedo InfinityBook Pro 13 2017 LC133LF2L01, IGZO TFT-LCD, 1920x1080, 13.3" | Tuxedo InfinityBook Pro 13 N130BU LC133LF2L01 , 1920x1080, 13.3" | Tuxedo InfinityBook 13 v2 Chi Mei N133HSE-EA3, 1920x1080, 13.3" | HP Envy 13-ad006ng BOE070E, 1920x1080, 13.3" | Dell XPS 13 i7-8550U ID: Sharp SHP144A, Name: LQ133Z1, 3200x1800, 13.3" | HP Spectre 13-v131ng CMN1374, 1920x1080, 13.3" | |
|---|---|---|---|---|---|---|
| Display | 1% | -12% | -8% | -6% | -7% | |
| Display P3 Coverage (%) | 67.8 | 69.3 2% | 68.3 1% | 66.8 -1% | 63.6 -6% | 64.6 -5% |
| sRGB Coverage (%) | 98.9 | 97.8 -1% | 67 -32% | 86.3 -13% | 93 -6% | 88.8 -10% |
| AdobeRGB 1998 Coverage (%) | 69.6 | 70.6 1% | 67 -4% | 63.1 -9% | 65.4 -6% | 64.8 -7% |
| Response Times | 11% | 25% | 5% | 24% | 5% | |
| Response Time Grey 50% / Grey 80% * (ms) | 48 ? | 41 ? 15% | 34 ? 29% | 48 ? -0% | 35.6 ? 26% | 46 ? 4% |
| Response Time Black / White * (ms) | 35 ? | 33 ? 6% | 27.6 ? 21% | 32 ? 9% | 27.2 ? 22% | 33 ? 6% |
| PWM Frequency (Hz) | 1000 ? | 1000 | 200 ? | 1000 ? | 19690 ? | |
| Screen | 1% | -6% | -10% | -2% | -8% | |
| Brightness middle (cd/m²) | 414 | 471 14% | 357 -14% | 281 -32% | 386.1 -7% | 404 -2% |
| Brightness (cd/m²) | 370 | 427 15% | 355 -4% | 264 -29% | 357 -4% | 382 3% |
| Brightness Distribution (%) | 81 | 82 1% | 90 11% | 83 2% | 83 2% | 91 12% |
| Black Level * (cd/m²) | 0.36 | 0.44 -22% | 0.34 6% | 0.23 36% | 0.33 8% | 0.35 3% |
| Contrast (:1) | 1150 | 1070 -7% | 1050 -9% | 1222 6% | 1170 2% | 1154 0% |
| Colorchecker dE 2000 * | 4.3 | 4.12 4% | 5.4 -26% | 4.83 -12% | 4.2 2% | 5.37 -25% |
| Colorchecker dE 2000 max. * | 7.76 | 7.95 -2% | 7.81 -1% | 8.89 -15% | 7.6 2% | 9.46 -22% |
| Greyscale dE 2000 * | 5.13 | 4.49 12% | 5.59 -9% | 6.63 -29% | 5.7 -11% | 6.44 -26% |
| Gamma | 2.37 93% | 2.33 94% | 2.14 103% | 1.85 119% | 2.28 96% | 2.52 87% |
| CCT | 7729 84% | 7196 90% | 5839 111% | 6794 96% | 7336 89% | 6738 96% |
| Color Space (Percent of AdobeRGB 1998) (%) | 64 | 64 0% | 59.45 -7% | 56 -12% | 59 -8% | 58 -9% |
| Color Space (Percent of sRGB) (%) | 99 | 98 -1% | 91.32 -8% | 86 -13% | 92.2 -7% | 89 -10% |
| Media total (Programa/Opciones) | 4% /
2% | 2% /
-3% | -4% /
-7% | 5% /
1% | -3% /
-6% |
* ... más pequeño es mejor
Tiempos de respuesta del display
| ↔ Tiempo de respuesta de Negro a Blanco | ||
|---|---|---|
| 35 ms ... subida ↗ y bajada ↘ combinada | ↗ 21 ms subida | 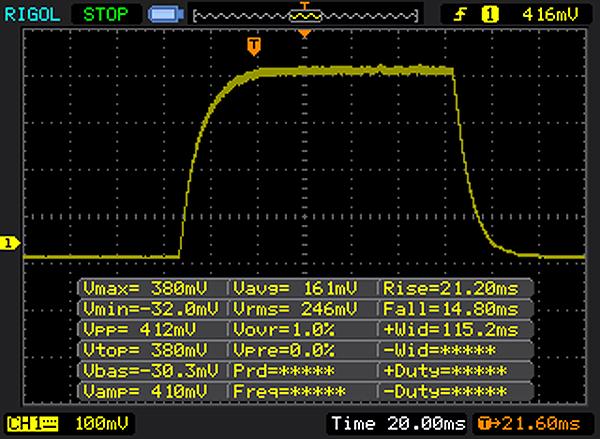 |
| ↘ 14 ms bajada | ||
| La pantalla mostró tiempos de respuesta lentos en nuestros tests y podría ser demasiado lenta para los jugones. En comparación, todos los dispositivos de prueba van de ##min### (mínimo) a 240 (máximo) ms. » 92 % de todos los dispositivos son mejores. Eso quiere decir que el tiempo de respuesta es peor que la media (19.9 ms) de todos los dispositivos testados. | ||
| ↔ Tiempo de respuesta 50% Gris a 80% Gris | ||
| 48 ms ... subida ↗ y bajada ↘ combinada | ↗ 25 ms subida | 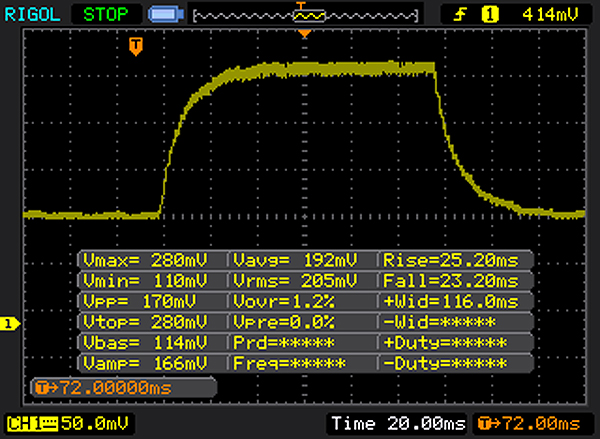 |
| ↘ 23 ms bajada | ||
| La pantalla mostró tiempos de respuesta lentos en nuestros tests y podría ser demasiado lenta para los jugones. En comparación, todos los dispositivos de prueba van de ##min### (mínimo) a 636 (máximo) ms. » 82 % de todos los dispositivos son mejores. Eso quiere decir que el tiempo de respuesta es peor que la media (31.1 ms) de todos los dispositivos testados. | ||
Parpadeo de Pantalla / PWM (Pulse-Width Modulation)
| Parpadeo de Pantalla / PWM detectado | 1000 Hz | ≤ 20 % de brillo | 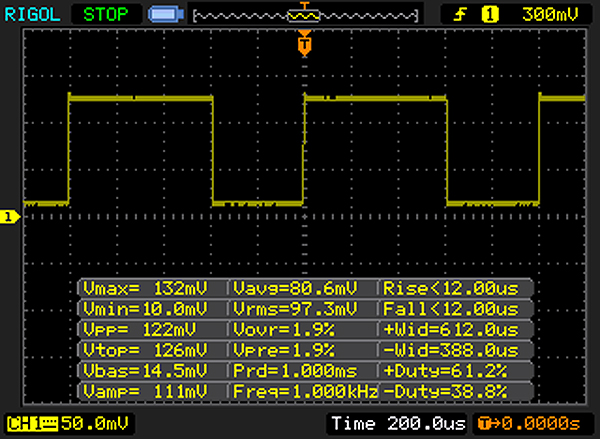 |
La retroiluminación del display parpadea a 1000 Hz (seguramente usa PWM - Pulse-Width Modulation) a un brillo del 20 % e inferior. Sobre este nivel de brillo no debería darse parpadeo / PWM. La frecuencia de 1000 Hz es bastante alta, por lo que la mayoría de gente sensible al parpadeo no debería ver parpadeo o tener fatiga visual. Comparación: 52 % de todos los dispositivos testados no usaron PWM para atenuar el display. Si se usó, medimos una media de 7801 (mínimo: 5 - máxmo: 343500) Hz. | |||
| Cinebench R15 | |
| CPU Single 64Bit | |
| Dell XPS 13 i7-8550U | |
| Tuxedo InfinityBook Pro 13 2017 | |
| HP Envy 13-ad006ng | |
| Tuxedo InfinityBook Pro 13 N130BU | |
| HP Spectre 13-v131ng | |
| Tuxedo InfinityBook 13 v2 | |
| CPU Multi 64Bit | |
| Dell XPS 13 i7-8550U | |
| Tuxedo InfinityBook Pro 13 2017 | |
| HP Envy 13-ad006ng | |
| Tuxedo InfinityBook 13 v2 | |
| HP Spectre 13-v131ng | |
| Tuxedo InfinityBook Pro 13 N130BU | |
| JetStream 1.1 - 1.1 Total | |
| Tuxedo InfinityBook Pro 13 2017 | |
| Tuxedo InfinityBook Pro 13 N130BU | |
| HP Spectre 13-v131ng | |
| Tuxedo InfinityBook 13 v2 | |
| HP Envy 13-ad006ng | |
| PCMark 8 - Home Score Accelerated v2 | |
| Tuxedo InfinityBook Pro 13 2017 | |
| HP Spectre 13-v131ng | |
| HP Envy 13-ad006ng | |
| Tuxedo InfinityBook Pro 13 N130BU | |
| Dell XPS 13 i7-8550U | |
| Tuxedo InfinityBook 13 v2 | |
| PCMark 8 Home Score Accelerated v2 | 4017 puntos | |
ayuda | ||
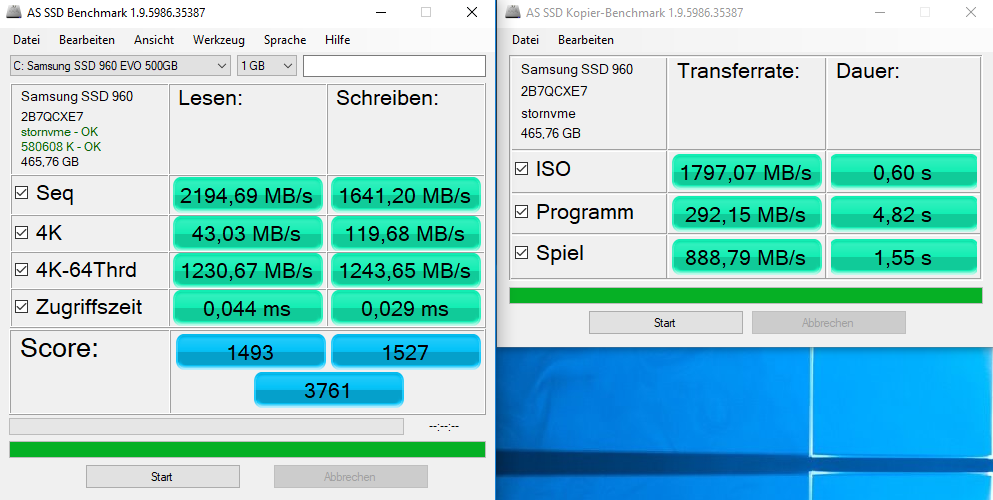
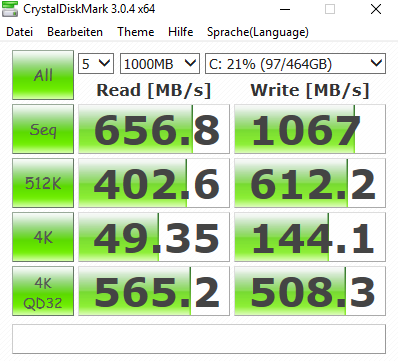
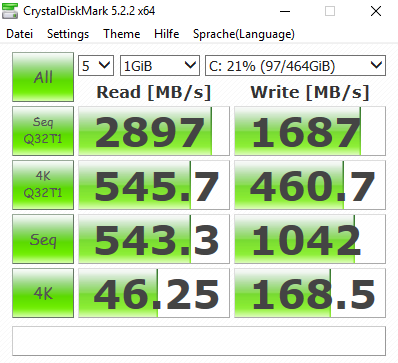
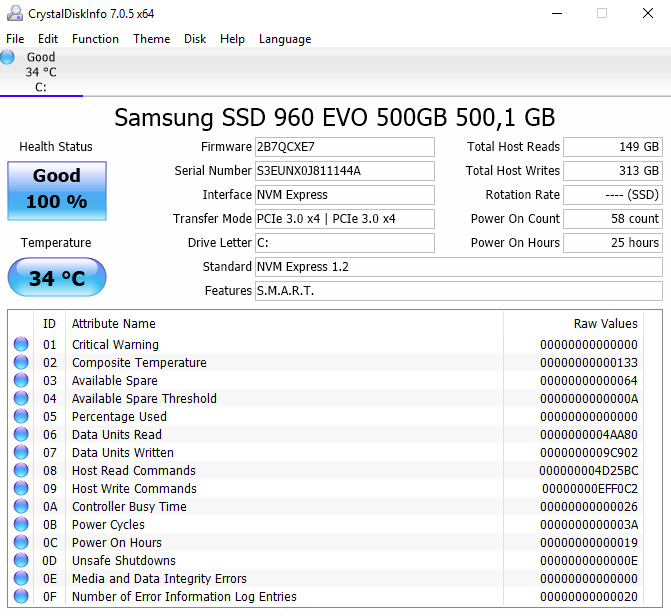
| Tuxedo InfinityBook Pro 13 2017 Samsung SSD 960 Evo 500GB m.2 NVMe | Tuxedo InfinityBook Pro 13 N130BU 2x Samsung SM961 MZVPW256HEGL NVMe (RAID 0) | Tuxedo InfinityBook 13 v2 Samsung SSD 950 Pro 256GB m.2 NVMe | HP Envy 13-ad006ng Toshiba NVMe THNSN5256GPUK | Dell XPS 13 i7-8550U Toshiba XG5 KXG50ZNV256G | HP Spectre 13-v131ng Samsung PM961 NVMe MZVLW512HMJP | |
|---|---|---|---|---|---|---|
| AS SSD | -62% | -22% | -96% | -66% | -3% | |
| Seq Read (MB/s) | 2195 | 1922 -12% | 2011 -8% | 1369 -38% | 1277 -42% | 1325 -40% |
| Seq Write (MB/s) | 1641 | 1180 -28% | 909 -45% | 247.8 -85% | 249.2 -85% | 1190 -27% |
| 4K Read (MB/s) | 43.03 | 24.06 -44% | 46.73 9% | 31.22 -27% | 28.17 -35% | 56.4 31% |
| 4K Write (MB/s) | 119.7 | 51.6 -57% | 115.6 -3% | 89.4 -25% | 101.7 -15% | 134.4 12% |
| 4K-64 Read (MB/s) | 1231 | 1816 48% | 703 -43% | 616 -50% | 423.6 -66% | 1465 19% |
| 4K-64 Write (MB/s) | 1244 | 605 -51% | 300 -76% | 66.7 -95% | 325.1 -74% | 862 -31% |
| Access Time Read * (ms) | 0.044 | 0.077 -75% | 0.045 -2% | 0.233 -430% | 0.102 -132% | 0.042 5% |
| Access Time Write * (ms) | 0.029 | 0.109 -276% | 0.032 -10% | 0.034 -17% | 0.051 -76% | 0.026 10% |
* ... más pequeño es mejor

| 3DMark 11 - 1280x720 Performance GPU | |
| HP Envy 13-ad006ng | |
| Dell XPS 13 i7-8550U | |
| HP Spectre 13-v131ng | |
| Tuxedo InfinityBook Pro 13 2017 | |
| Tuxedo InfinityBook 13 v2 | |
| 3DMark 06 Standard Score | 12051 puntos | |
| 3DMark 11 Performance | 1732 puntos | |
ayuda | ||
| bajo | medio | alto | ultra | |
|---|---|---|---|---|
| BioShock Infinite (2013) | 68.7 | 30.9 | 26.4 | 9.6 |
| Tuxedo InfinityBook Pro 13 2017 UHD Graphics 620, i5-8550U, Samsung SSD 960 Evo 500GB m.2 NVMe | Tuxedo InfinityBook Pro 13 N130BU HD Graphics 620, i7-7500U, 2x Samsung SM961 MZVPW256HEGL NVMe (RAID 0) | Tuxedo InfinityBook 13 v2 HD Graphics 520, 6500U, Samsung SSD 950 Pro 256GB m.2 NVMe | HP Envy 13-ad006ng GeForce MX150, i7-7500U, Toshiba NVMe THNSN5256GPUK | Dell XPS 13 i7-8550U UHD Graphics 620, i5-8550U, Toshiba XG5 KXG50ZNV256G | HP Spectre 13-v131ng HD Graphics 620, i7-7500U, Samsung PM961 NVMe MZVLW512HMJP | |
|---|---|---|---|---|---|---|
| Noise | -6% | -7% | -5% | 4% | -10% | |
| apagado / medio ambiente * (dB) | 30.1 | 30.8 -2% | 29 4% | 30.5 -1% | 27.9 7% | 30.4 -1% |
| Idle Minimum * (dB) | 30.1 | 31 -3% | 29 4% | 30.5 -1% | 27.9 7% | 30.4 -1% |
| Idle Average * (dB) | 30.1 | 31 -3% | 29 4% | 30.5 -1% | 27.9 7% | 30.4 -1% |
| Idle Maximum * (dB) | 30.7 | 31 -1% | 29 6% | 30.5 1% | 27.9 9% | 30.4 1% |
| Load Average * (dB) | 31 | 34.9 -13% | 34.6 -12% | 37.3 -20% | 30.8 1% | 40 -29% |
| Load Maximum * (dB) | 31 | 34.9 -13% | 46.1 -49% | 34.2 -10% | 33.1 -7% | 40 -29% |
| Witcher 3 ultra * (dB) | 37.3 |
* ... más pequeño es mejor
Ruido
| Ocioso |
| 30.1 / 30.1 / 30.7 dB(A) |
| Carga |
| 31 / 31 dB(A) |
 | ||
30 dB silencioso 40 dB(A) audible 50 dB(A) ruidosamente alto |
||
min: | ||
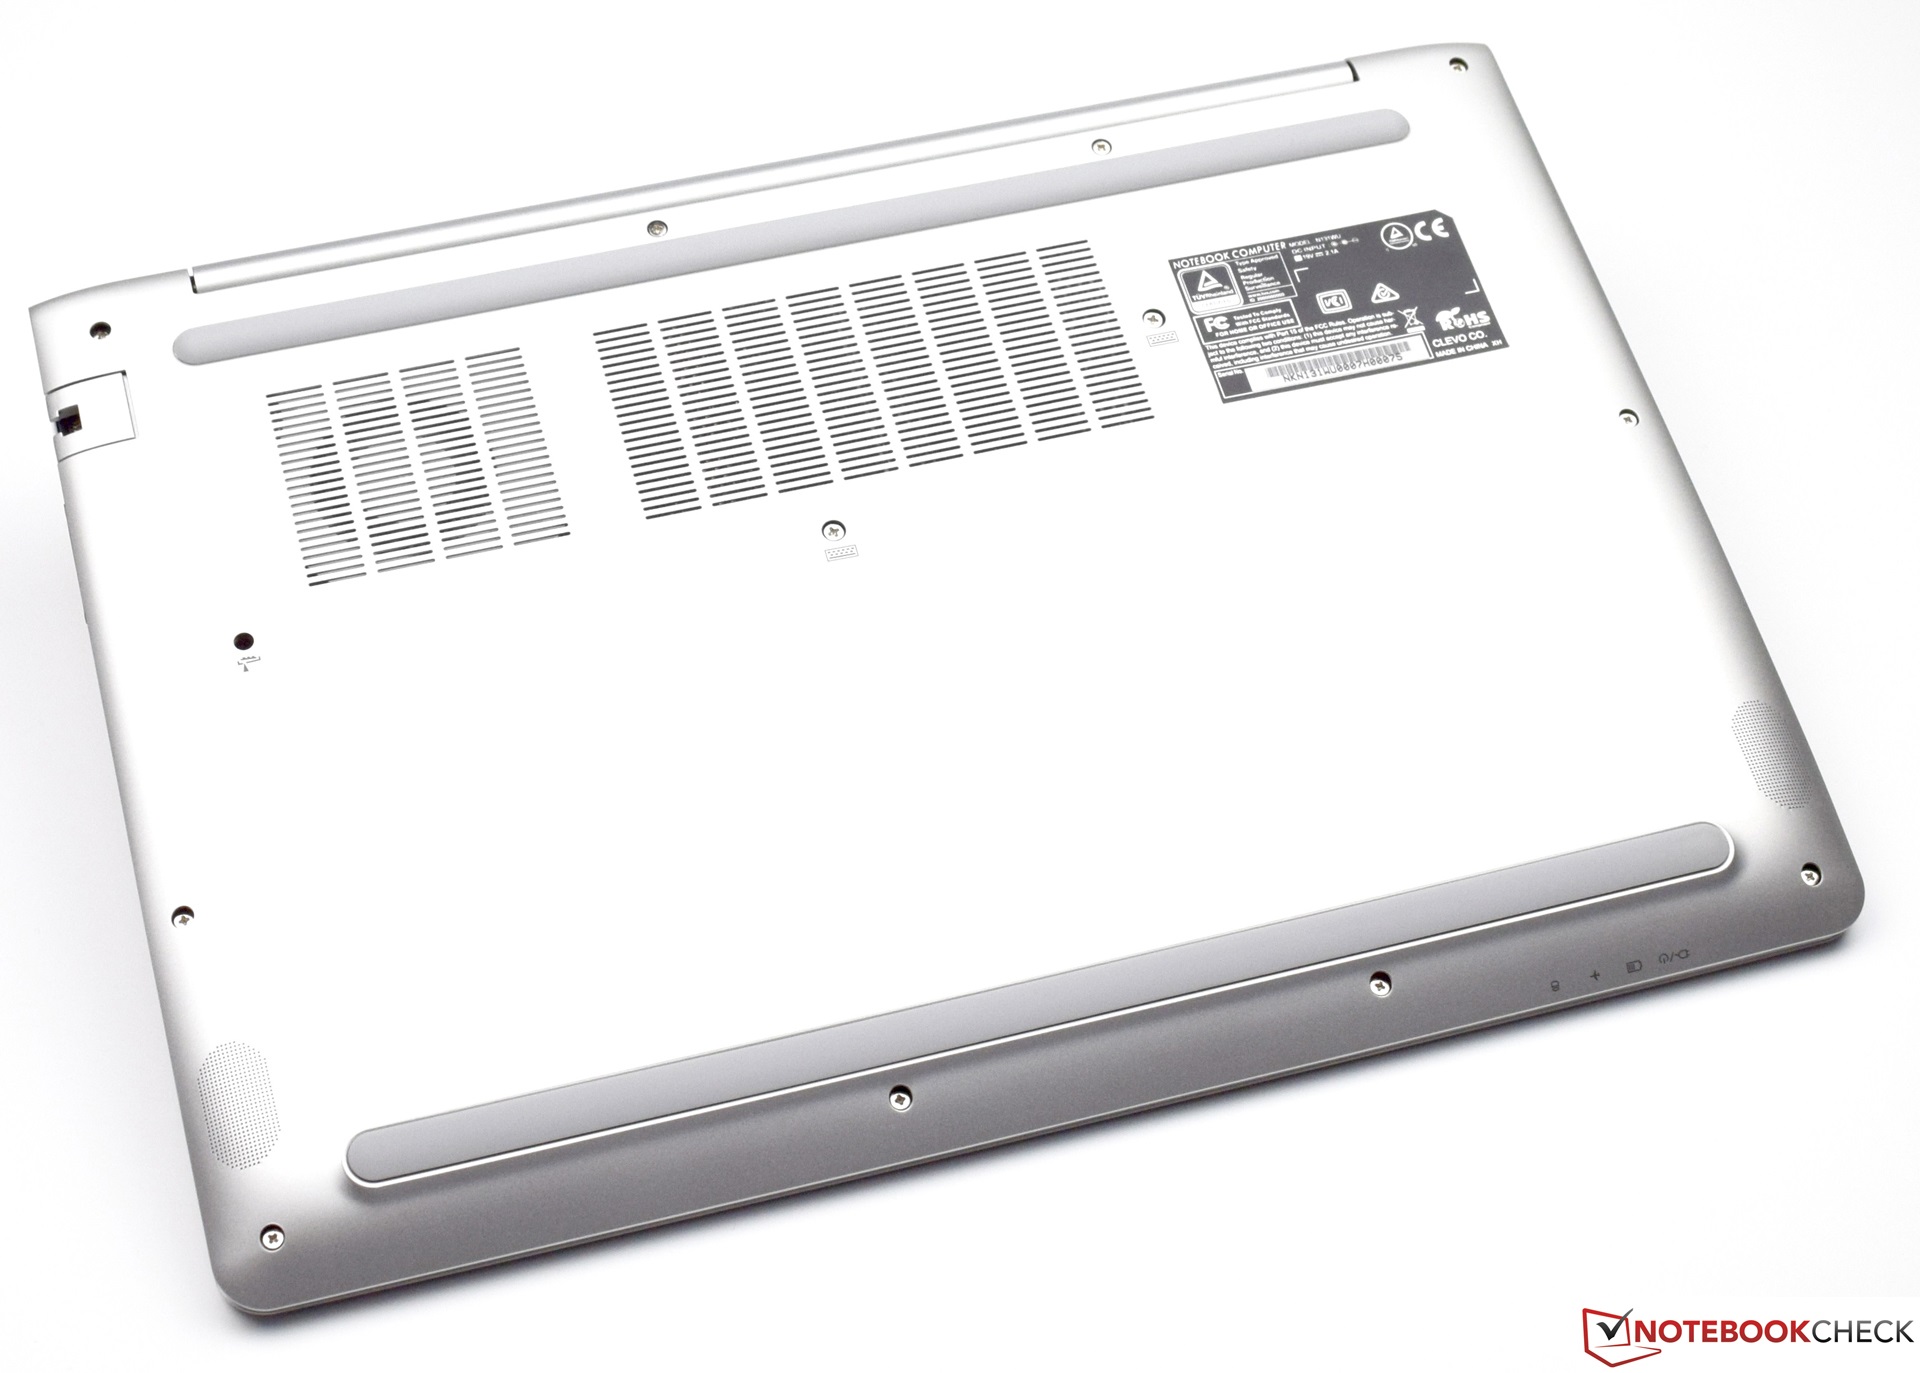
(±) La temperatura máxima en la parte superior es de 42.3 °C / 108 F, frente a la media de 35.9 °C / 97 F, que oscila entre 21.4 y 59 °C para la clase Subnotebook.
(-) El fondo se calienta hasta un máximo de 50.4 °C / 123 F, frente a la media de 39.2 °C / 103 F
(+) En reposo, la temperatura media de la parte superior es de 25.6 °C / 78# F, frente a la media del dispositivo de 30.8 °C / 87 F.
(+) El reposamanos y el panel táctil están a una temperatura inferior a la de la piel, con un máximo de 30.1 °C / 86.2 F y, por tanto, son fríos al tacto.
(±) La temperatura media de la zona del reposamanos de dispositivos similares fue de 28.2 °C / 82.8 F (-1.9 °C / -3.4 F).
| Tuxedo InfinityBook Pro 13 2017 UHD Graphics 620, i5-8550U, Samsung SSD 960 Evo 500GB m.2 NVMe | Tuxedo InfinityBook Pro 13 N130BU HD Graphics 620, i7-7500U, 2x Samsung SM961 MZVPW256HEGL NVMe (RAID 0) | Tuxedo InfinityBook 13 v2 HD Graphics 520, 6500U, Samsung SSD 950 Pro 256GB m.2 NVMe | HP Envy 13-ad006ng GeForce MX150, i7-7500U, Toshiba NVMe THNSN5256GPUK | Dell XPS 13 i7-8550U UHD Graphics 620, i5-8550U, Toshiba XG5 KXG50ZNV256G | HP Spectre 13-v131ng HD Graphics 620, i7-7500U, Samsung PM961 NVMe MZVLW512HMJP | |
|---|---|---|---|---|---|---|
| Heat | 7% | -5% | 17% | -4% | -1% | |
| Maximum Upper Side * (°C) | 42.3 | 41.7 1% | 39.6 6% | 41.6 2% | 49 -16% | 54.2 -28% |
| Maximum Bottom * (°C) | 50.4 | 44.4 12% | 42.3 16% | 33.4 34% | 54 -7% | 37.7 25% |
| Idle Upper Side * (°C) | 27.4 | 26.1 5% | 33.7 -23% | 23.1 16% | 26.6 3% | 29 -6% |
| Idle Bottom * (°C) | 29.2 | 26.6 9% | 34.4 -18% | 24.1 17% | 28.2 3% | 27.6 5% |
* ... más pequeño es mejor
Tuxedo InfinityBook Pro 13 2017 análisis de audio
(-) | altavoces no muy altos (#63.2 dB)
Graves 100 - 315 Hz
(±) | lubina reducida - en promedio 12.1% inferior a la mediana
(+) | el bajo es lineal (6.1% delta a la frecuencia anterior)
Medios 400 - 2000 Hz
(±) | medias más altas - de media 8.2% más altas que la mediana
(±) | la linealidad de los medios es media (12% delta respecto a la frecuencia anterior)
Altos 2 - 16 kHz
(+) | máximos equilibrados - a sólo 3.6% de la mediana
(±) | la linealidad de los máximos es media (8.4% delta a frecuencia anterior)
Total 100 - 16.000 Hz
(-) | el sonido global no es lineal (30.6% de diferencia con la mediana)
En comparación con la misma clase
» 93% de todos los dispositivos probados de esta clase eran mejores, 1% similares, 6% peores
» El mejor tuvo un delta de 5%, la media fue 18%, el peor fue ###max##%
En comparación con todos los dispositivos probados
» 89% de todos los dispositivos probados eran mejores, 3% similares, 8% peores
» El mejor tuvo un delta de 4%, la media fue 24%, el peor fue ###max##%
Dell XPS 13 i7-8550U análisis de audio
(-) | altavoces no muy altos (#66.8 dB)
Graves 100 - 315 Hz
(+) | buen bajo - sólo 4.5% lejos de la mediana
(±) | la linealidad de los graves es media (8.2% delta a frecuencia anterior)
Medios 400 - 2000 Hz
(±) | medias más altas - de media 5% más altas que la mediana
(+) | los medios son lineales (5.8% delta a la frecuencia anterior)
Altos 2 - 16 kHz
(+) | máximos equilibrados - a sólo 3% de la mediana
(±) | la linealidad de los máximos es media (14.5% delta a frecuencia anterior)
Total 100 - 16.000 Hz
(±) | la linealidad del sonido global es media (17.2% de diferencia con la mediana)
En comparación con la misma clase
» 44% de todos los dispositivos probados de esta clase eran mejores, 9% similares, 47% peores
» El mejor tuvo un delta de 5%, la media fue 18%, el peor fue ###max##%
En comparación con todos los dispositivos probados
» 32% de todos los dispositivos probados eran mejores, 8% similares, 60% peores
» El mejor tuvo un delta de 4%, la media fue 24%, el peor fue ###max##%
| Off / Standby | |
| Ocioso | |
| Carga |
|
Clave:
min: | |
| Tuxedo InfinityBook Pro 13 2017 UHD Graphics 620, i5-8550U, Samsung SSD 960 Evo 500GB m.2 NVMe | Tuxedo InfinityBook Pro 13 N130BU HD Graphics 620, i7-7500U, 2x Samsung SM961 MZVPW256HEGL NVMe (RAID 0) | Tuxedo InfinityBook 13 v2 HD Graphics 520, 6500U, Samsung SSD 950 Pro 256GB m.2 NVMe | HP Envy 13-ad006ng GeForce MX150, i7-7500U, Toshiba NVMe THNSN5256GPUK | Dell XPS 13 i7-8550U UHD Graphics 620, i5-8550U, Toshiba XG5 KXG50ZNV256G | HP Spectre 13-v131ng HD Graphics 620, i7-7500U, Samsung PM961 NVMe MZVLW512HMJP | |
|---|---|---|---|---|---|---|
| Power Consumption | 13% | -10% | 7% | 11% | 14% | |
| Idle Minimum * (Watt) | 4.5 | 2.8 38% | 6 -33% | 2.8 38% | 4.1 9% | 3.6 20% |
| Idle Average * (Watt) | 8.2 | 6.4 22% | 10.3 -26% | 5.8 29% | 5.8 29% | 6.4 22% |
| Idle Maximum * (Watt) | 10.6 | 10.5 1% | 11 -4% | 7.7 27% | 6 43% | 9.2 13% |
| Load Average * (Watt) | 36.1 | 30 17% | 31.2 14% | 48 -33% | 42.5 -18% | 34 6% |
| Load Maximum * (Watt) | 38 | 42 -11% | 38.4 -1% | 48 -26% | 41.4 -9% | 34.4 9% |
| Witcher 3 ultra * (Watt) | 35 |
* ... más pequeño es mejor
| Tuxedo InfinityBook Pro 13 2017 i5-8550U, UHD Graphics 620, 36 Wh | Tuxedo InfinityBook Pro 13 N130BU i7-7500U, HD Graphics 620, 36 Wh | Tuxedo InfinityBook 13 v2 6500U, HD Graphics 520, 45 Wh | HP Envy 13-ad006ng i7-7500U, GeForce MX150, 51 Wh | Dell XPS 13 i7-8550U i5-8550U, UHD Graphics 620, 60 Wh | HP Spectre 13-v131ng i7-7500U, HD Graphics 620, 38 Wh | |
|---|---|---|---|---|---|---|
| Battery Runtime | ||||||
| WiFi Websurfing (h) | 4.6 | 7.5 63% | 5.6 22% | 7.1 54% | 9.8 113% | 6.6 43% |
Pro
Contra

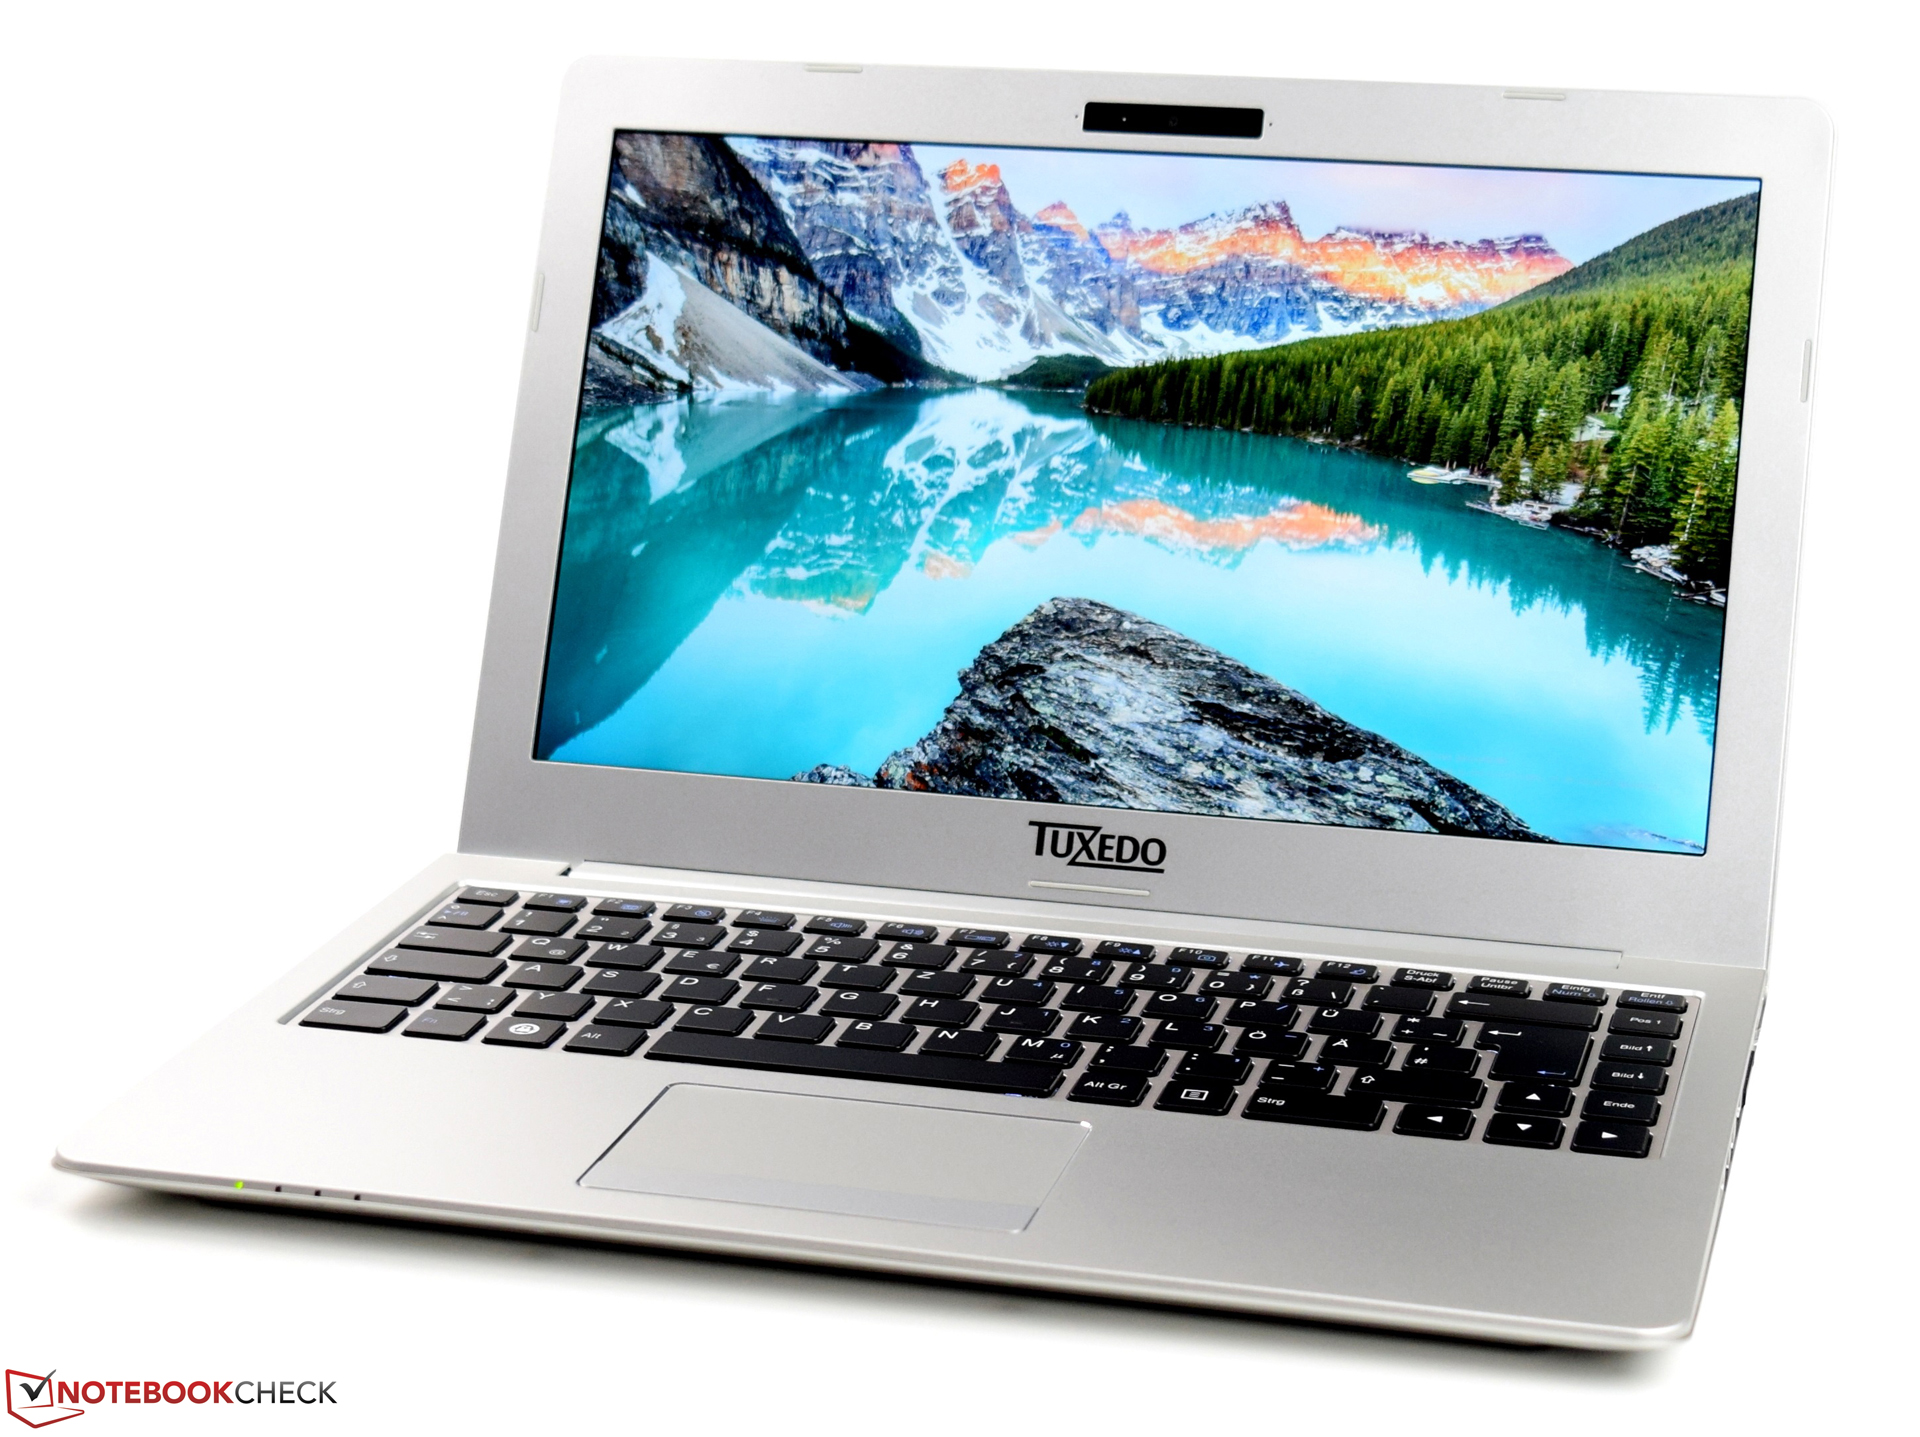
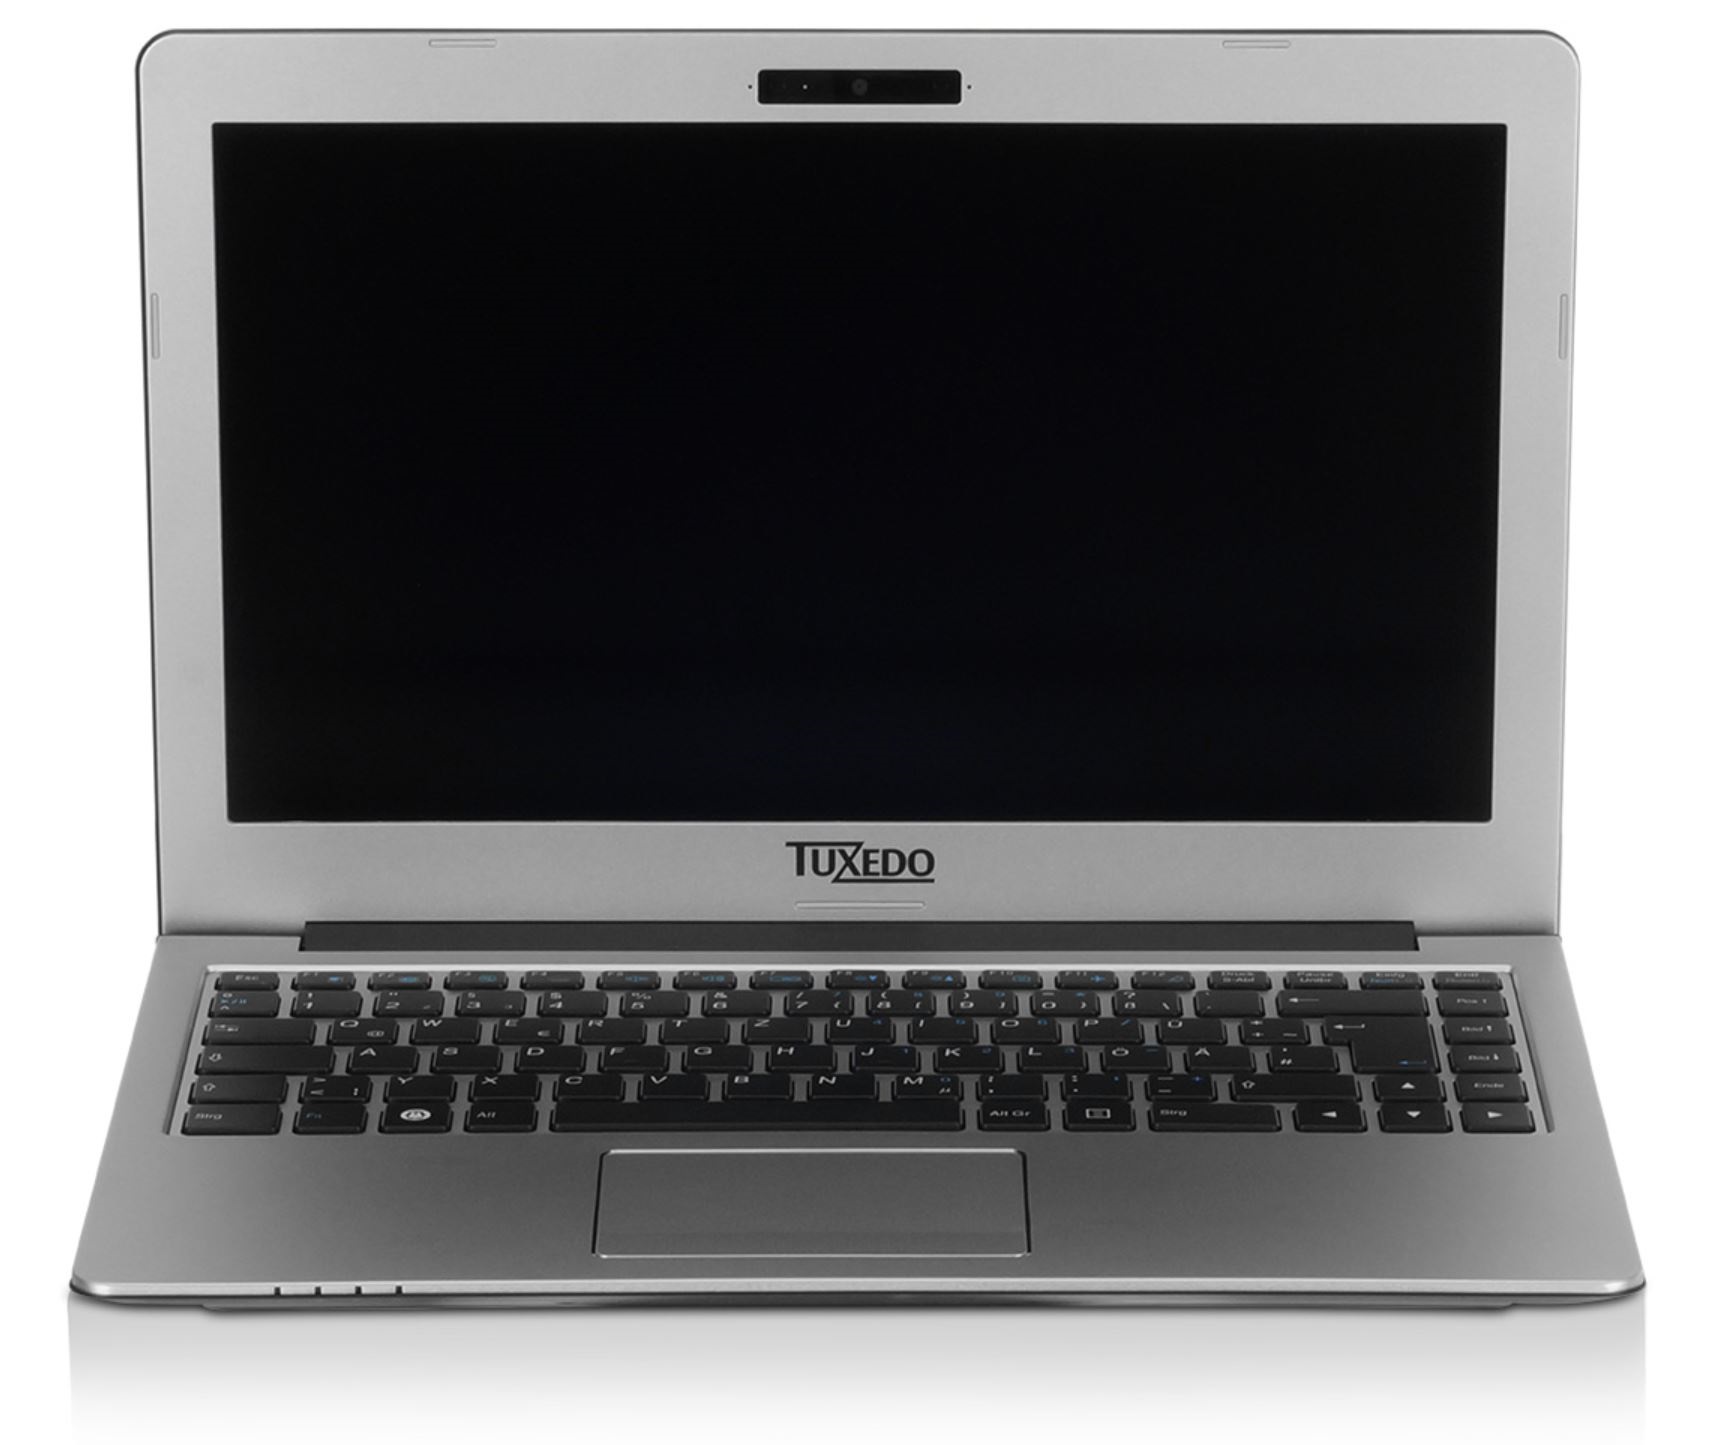
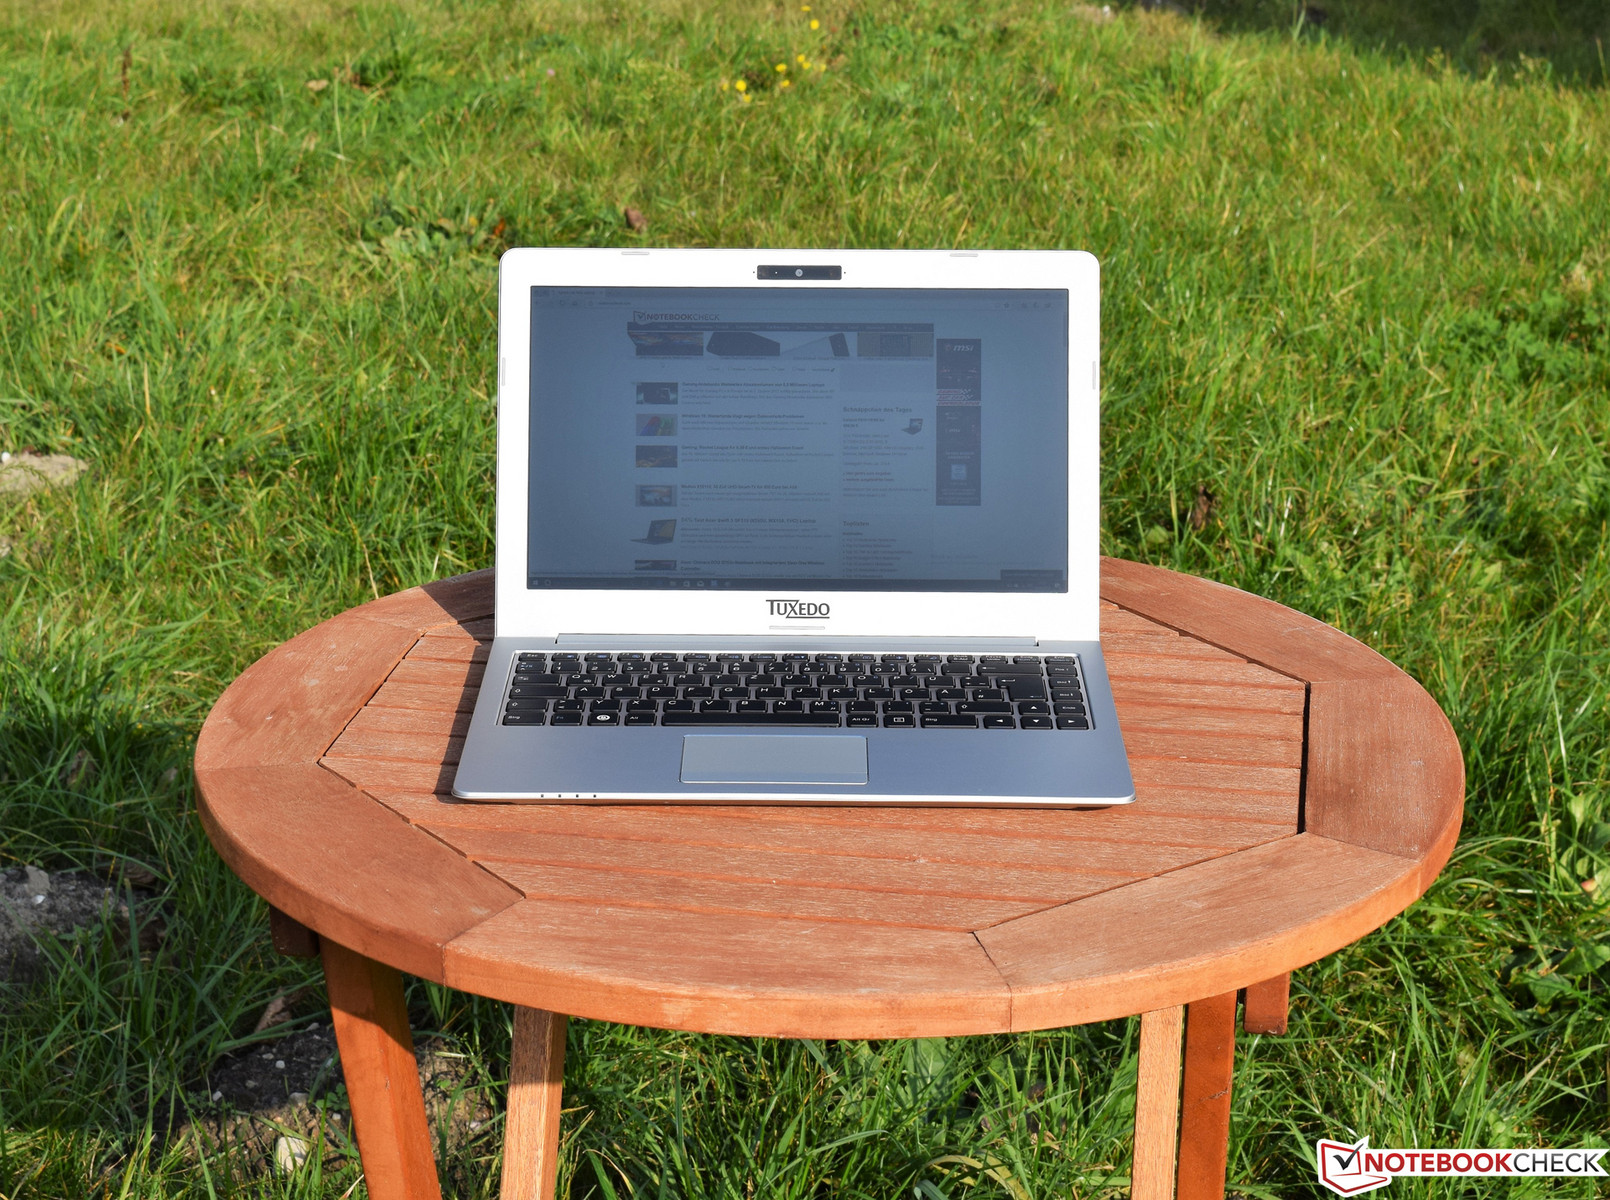
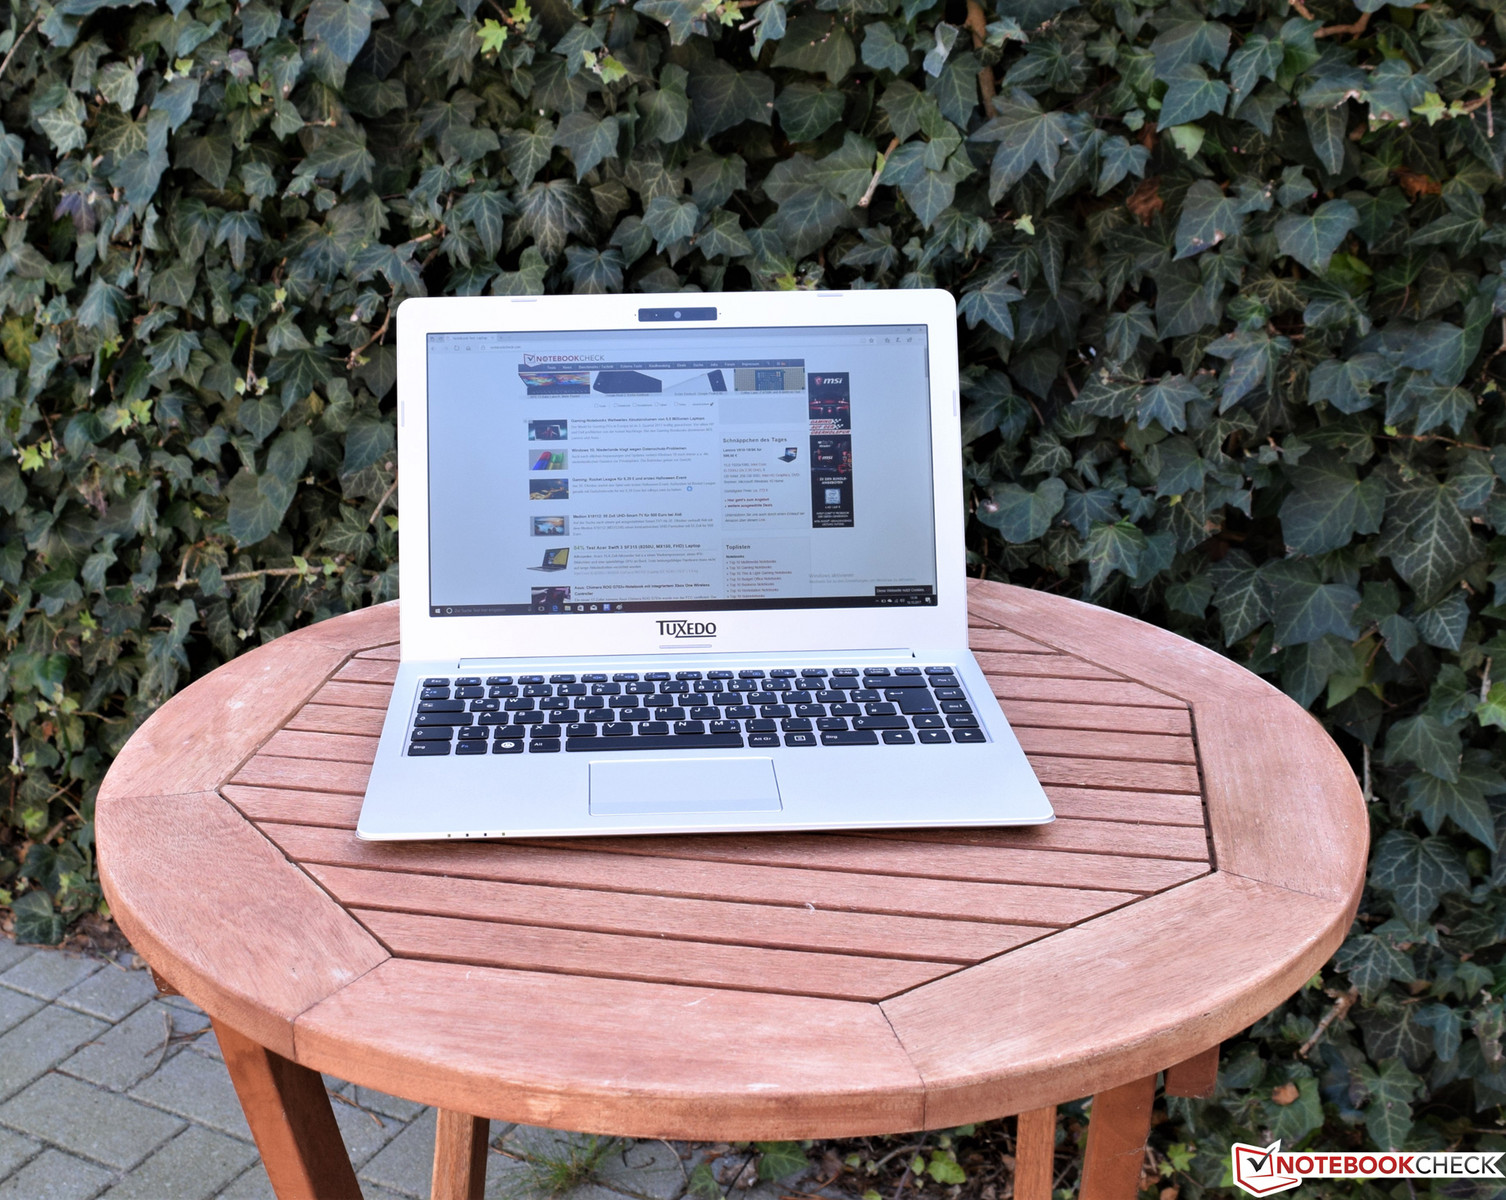
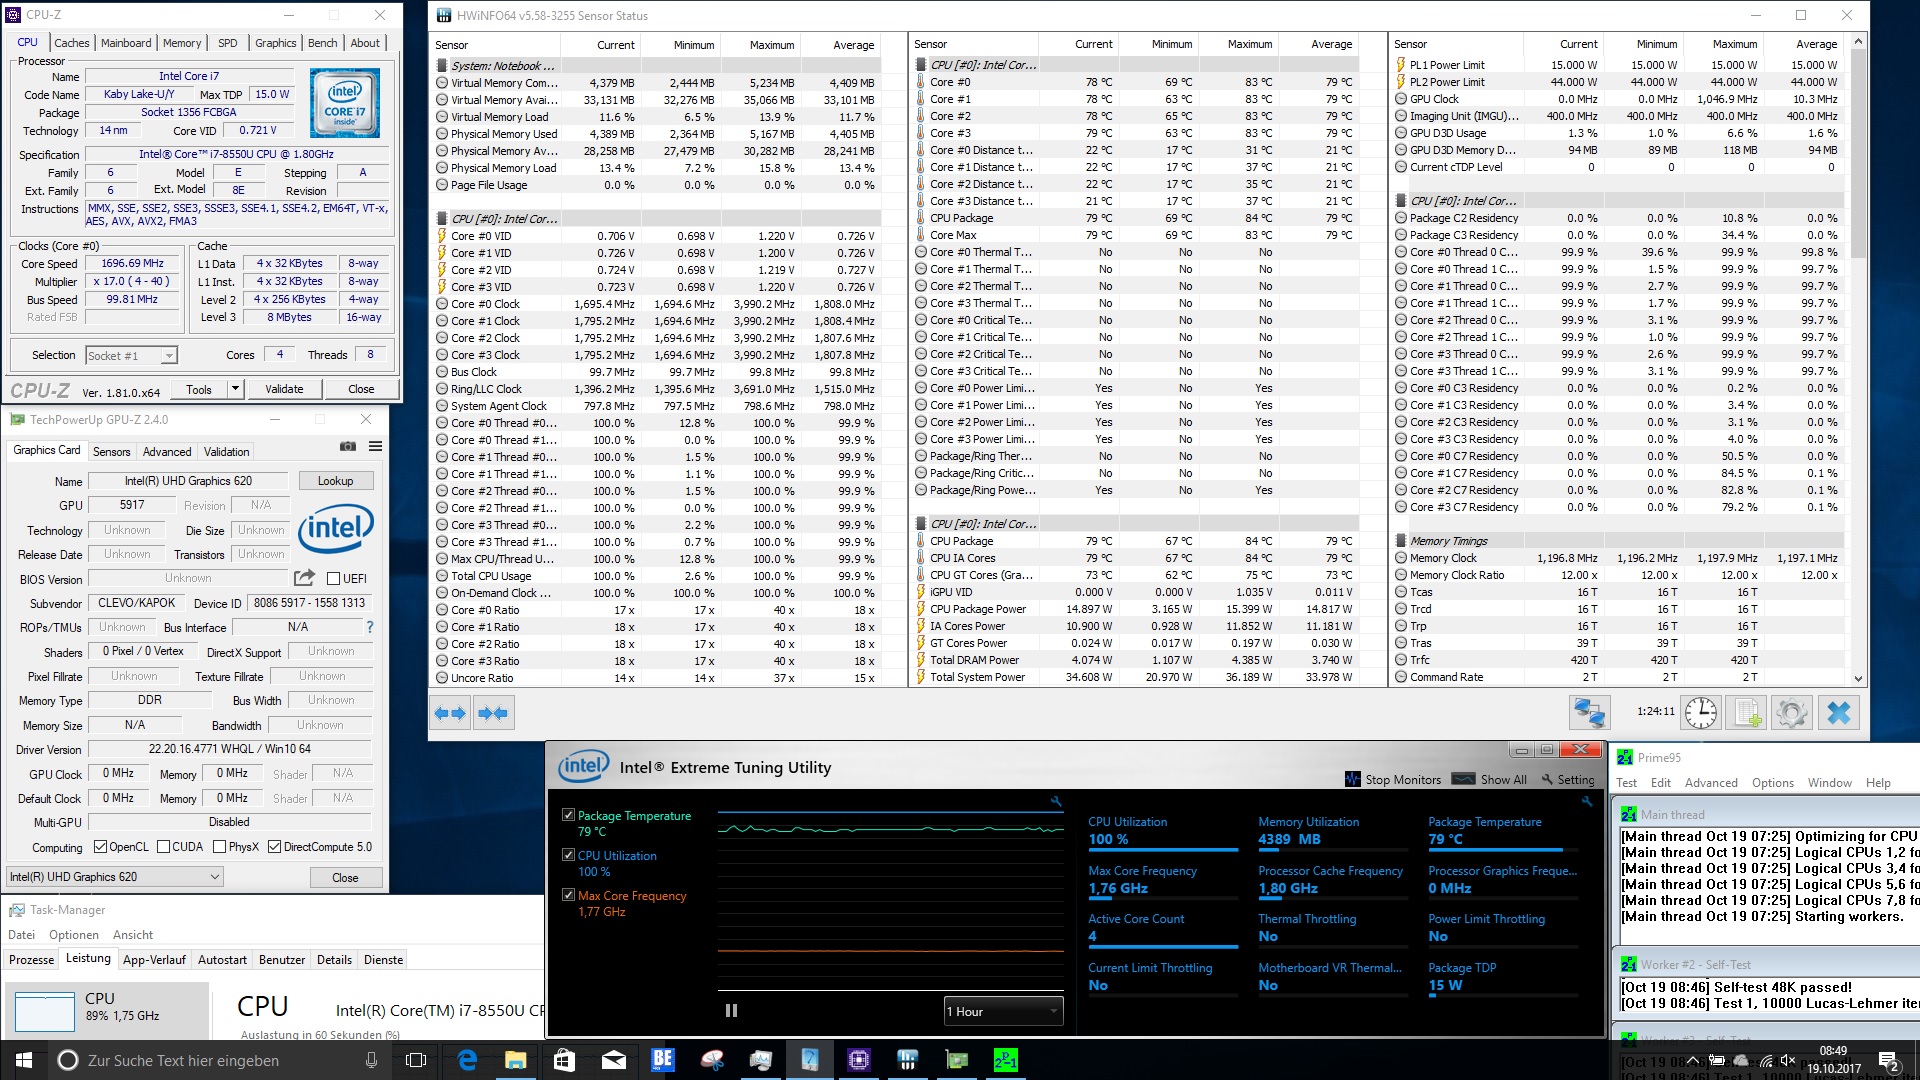
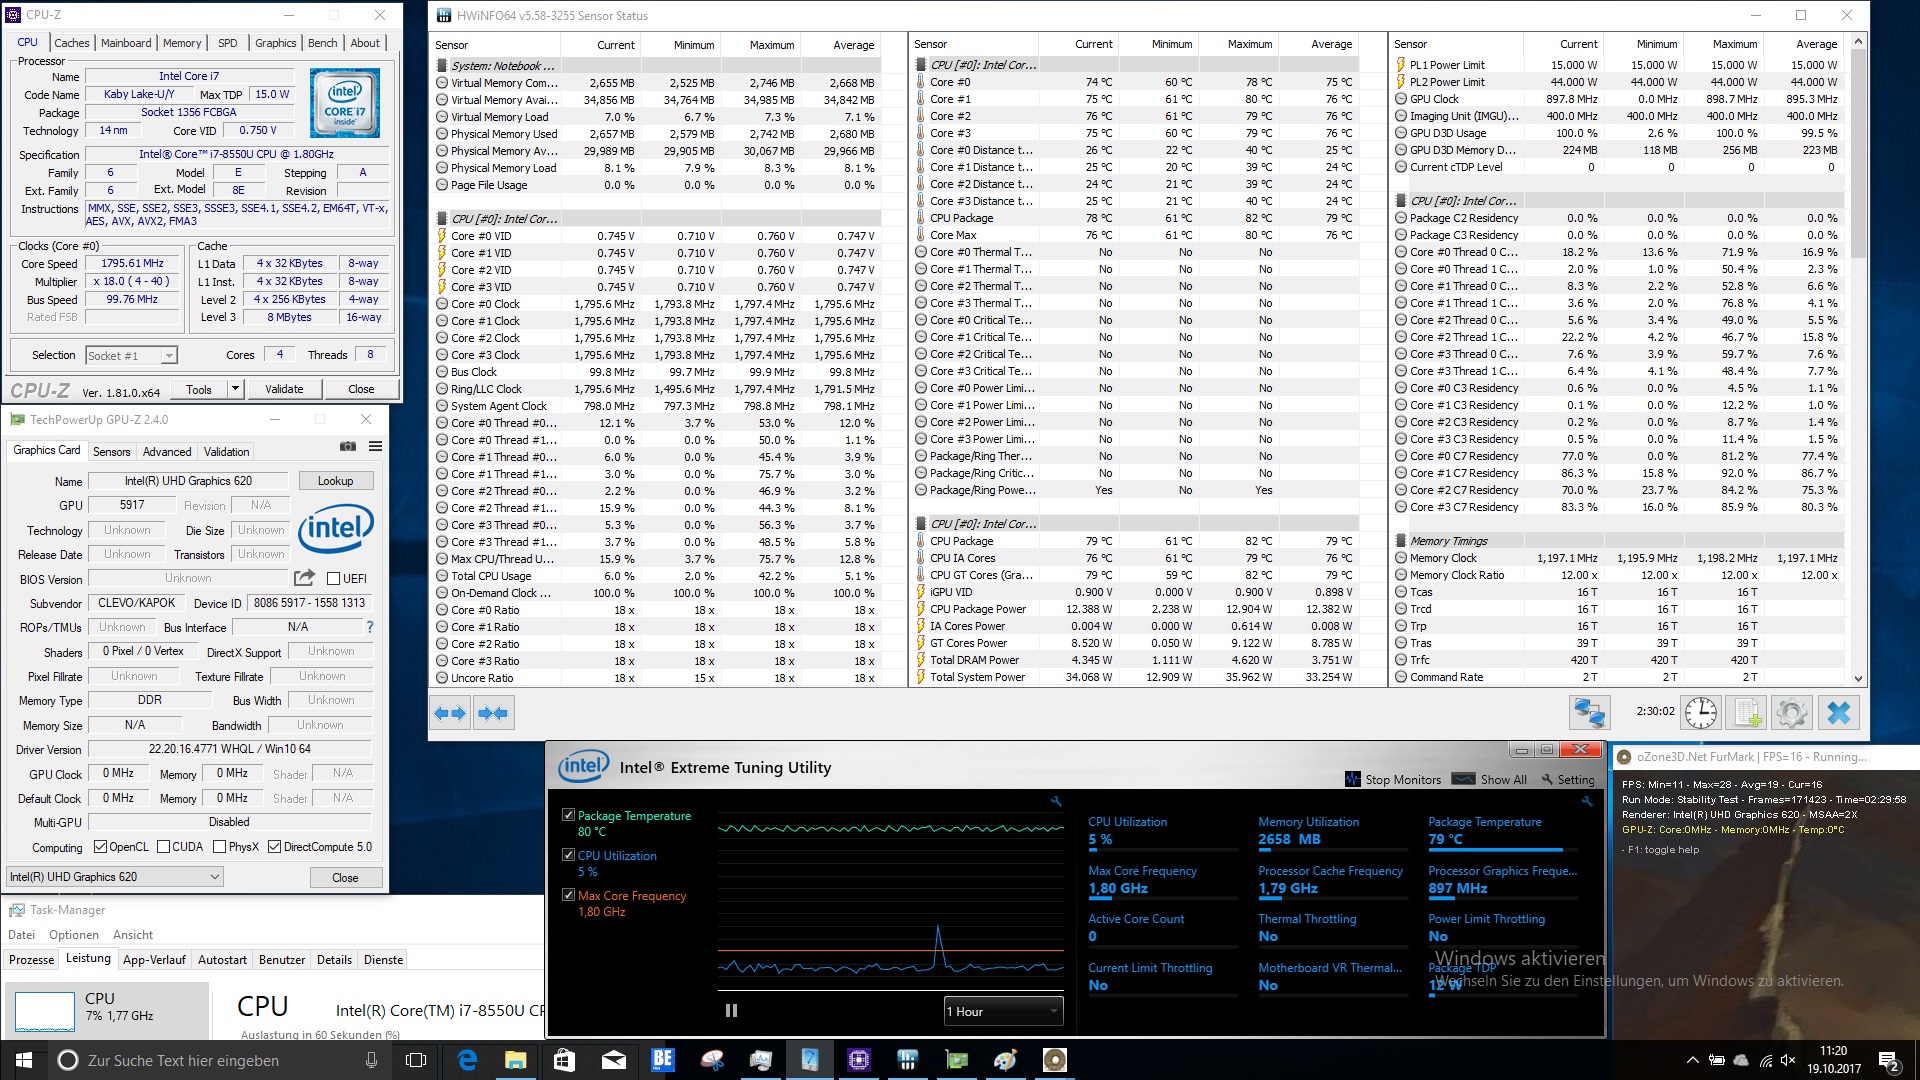
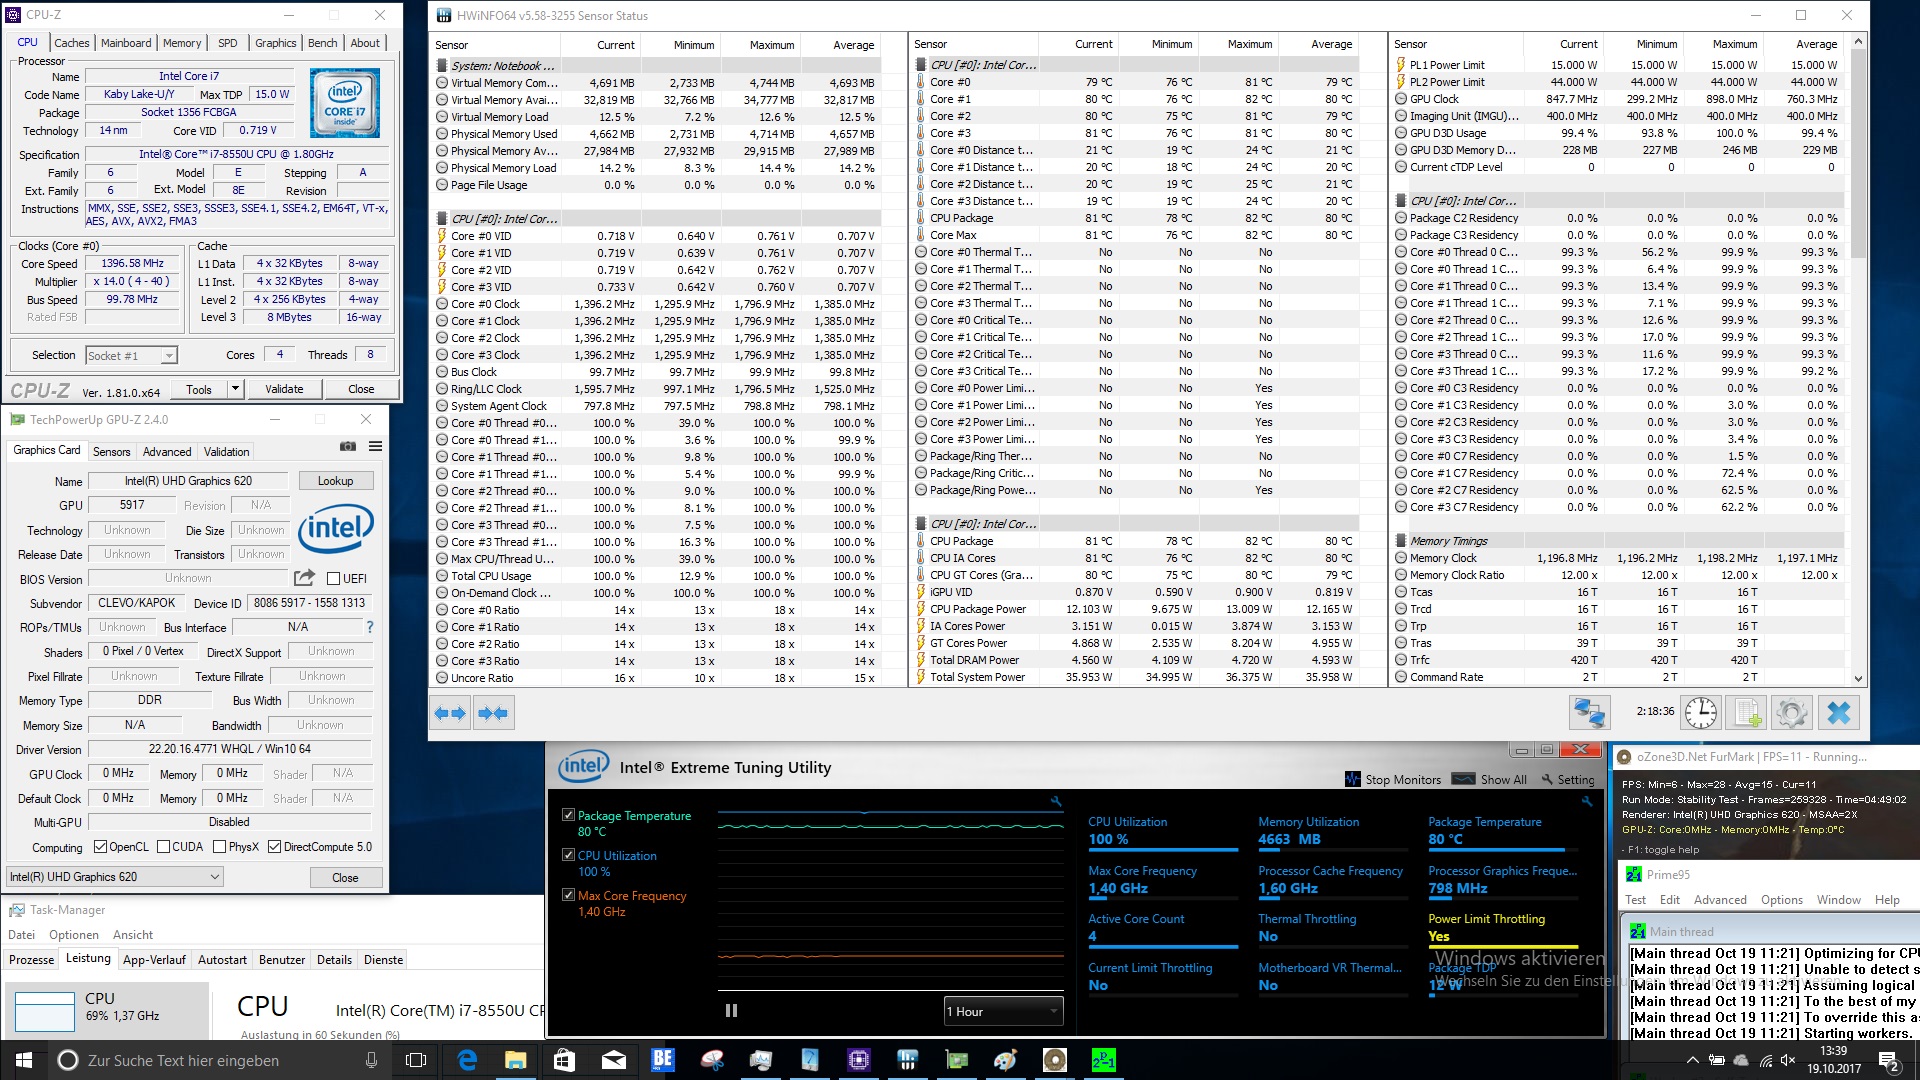
El Tuxedo InfinityBook Pro 13 2017 es un subportátil elegante y robusto. El fabricante ha hecho mantenimiento al producto y ha retirado los Core-i de 7ª generación. La octava ofrece un decente aumento de rendimiento, asegurando una alta velocidad. Por un precio inicial moderado de 999 Euros los clientes se llevan una bestia de carga muy buena y silenciosa que también está bien construida. Nuestro modelo de pruebas con la máxima RAM y almacenamiento muy rápido cuesta 1450 Euros.
El Tuxedo InfinityBook Pro 13 2017 nos convence con alta velocidad y opciones de configuración versátiles. Los fans de Linux quedarán contentos con el dispositivo por mucho tiempo, ya que el Tuxedo InfinityBook Pro 13 2017 puede con las distribuciones de Linux más comunes.
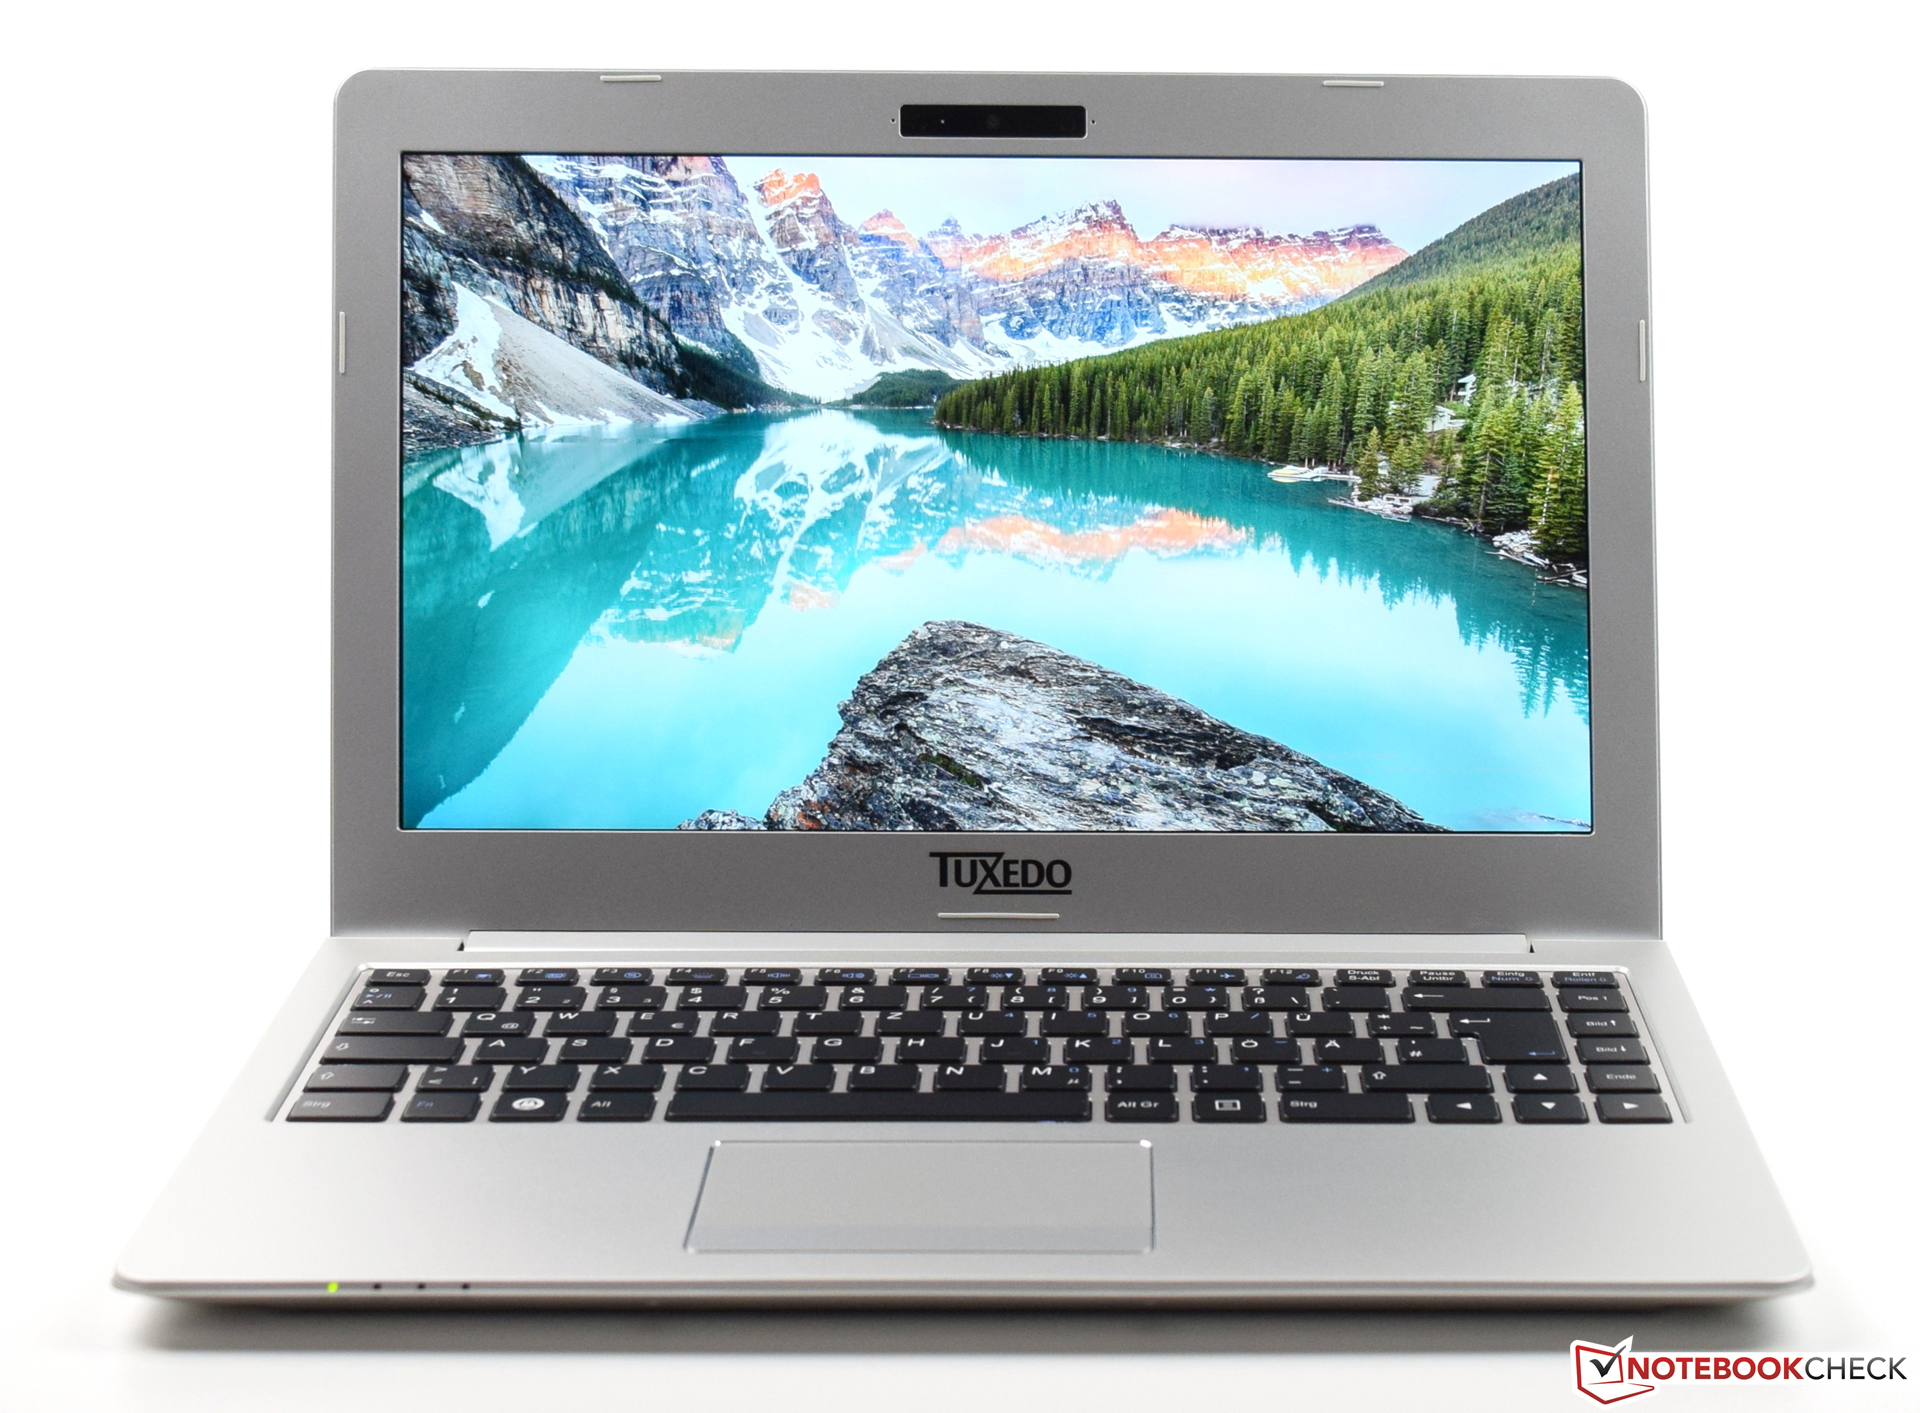
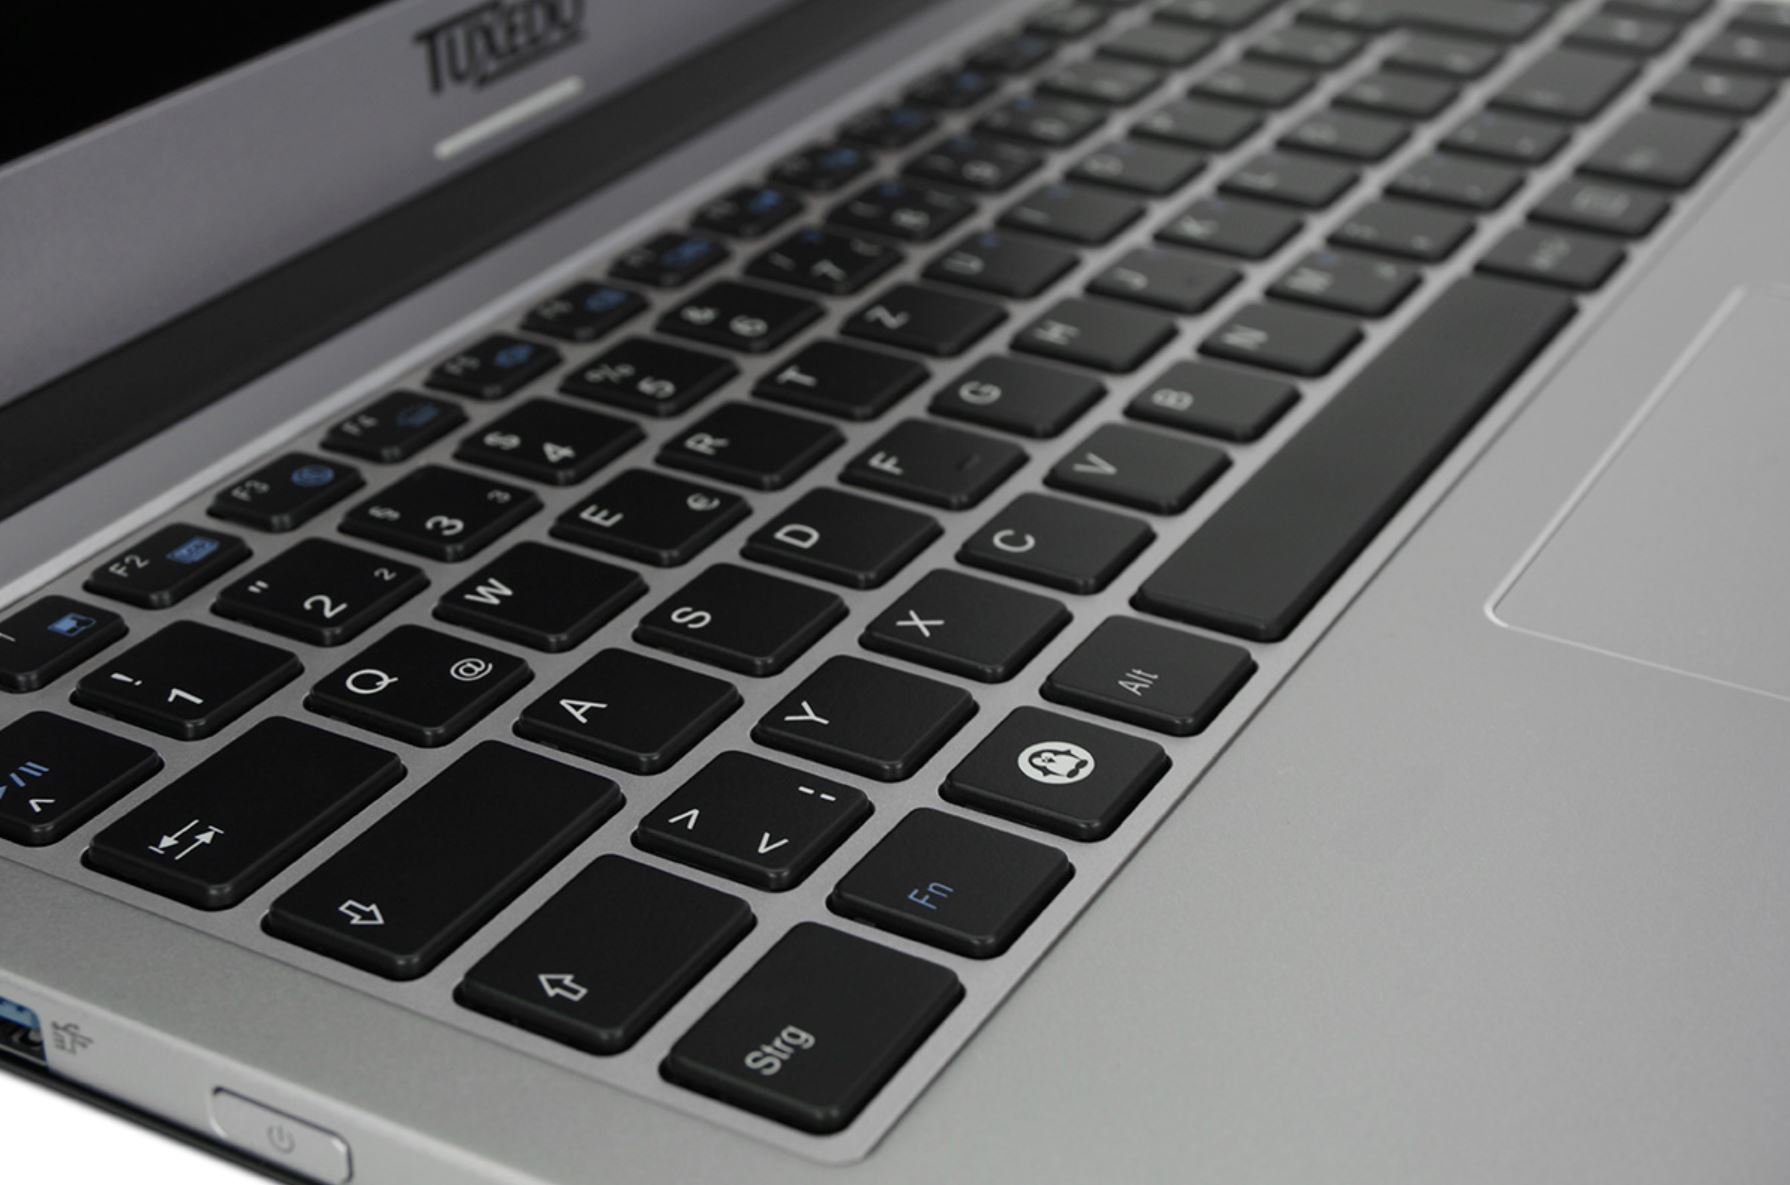
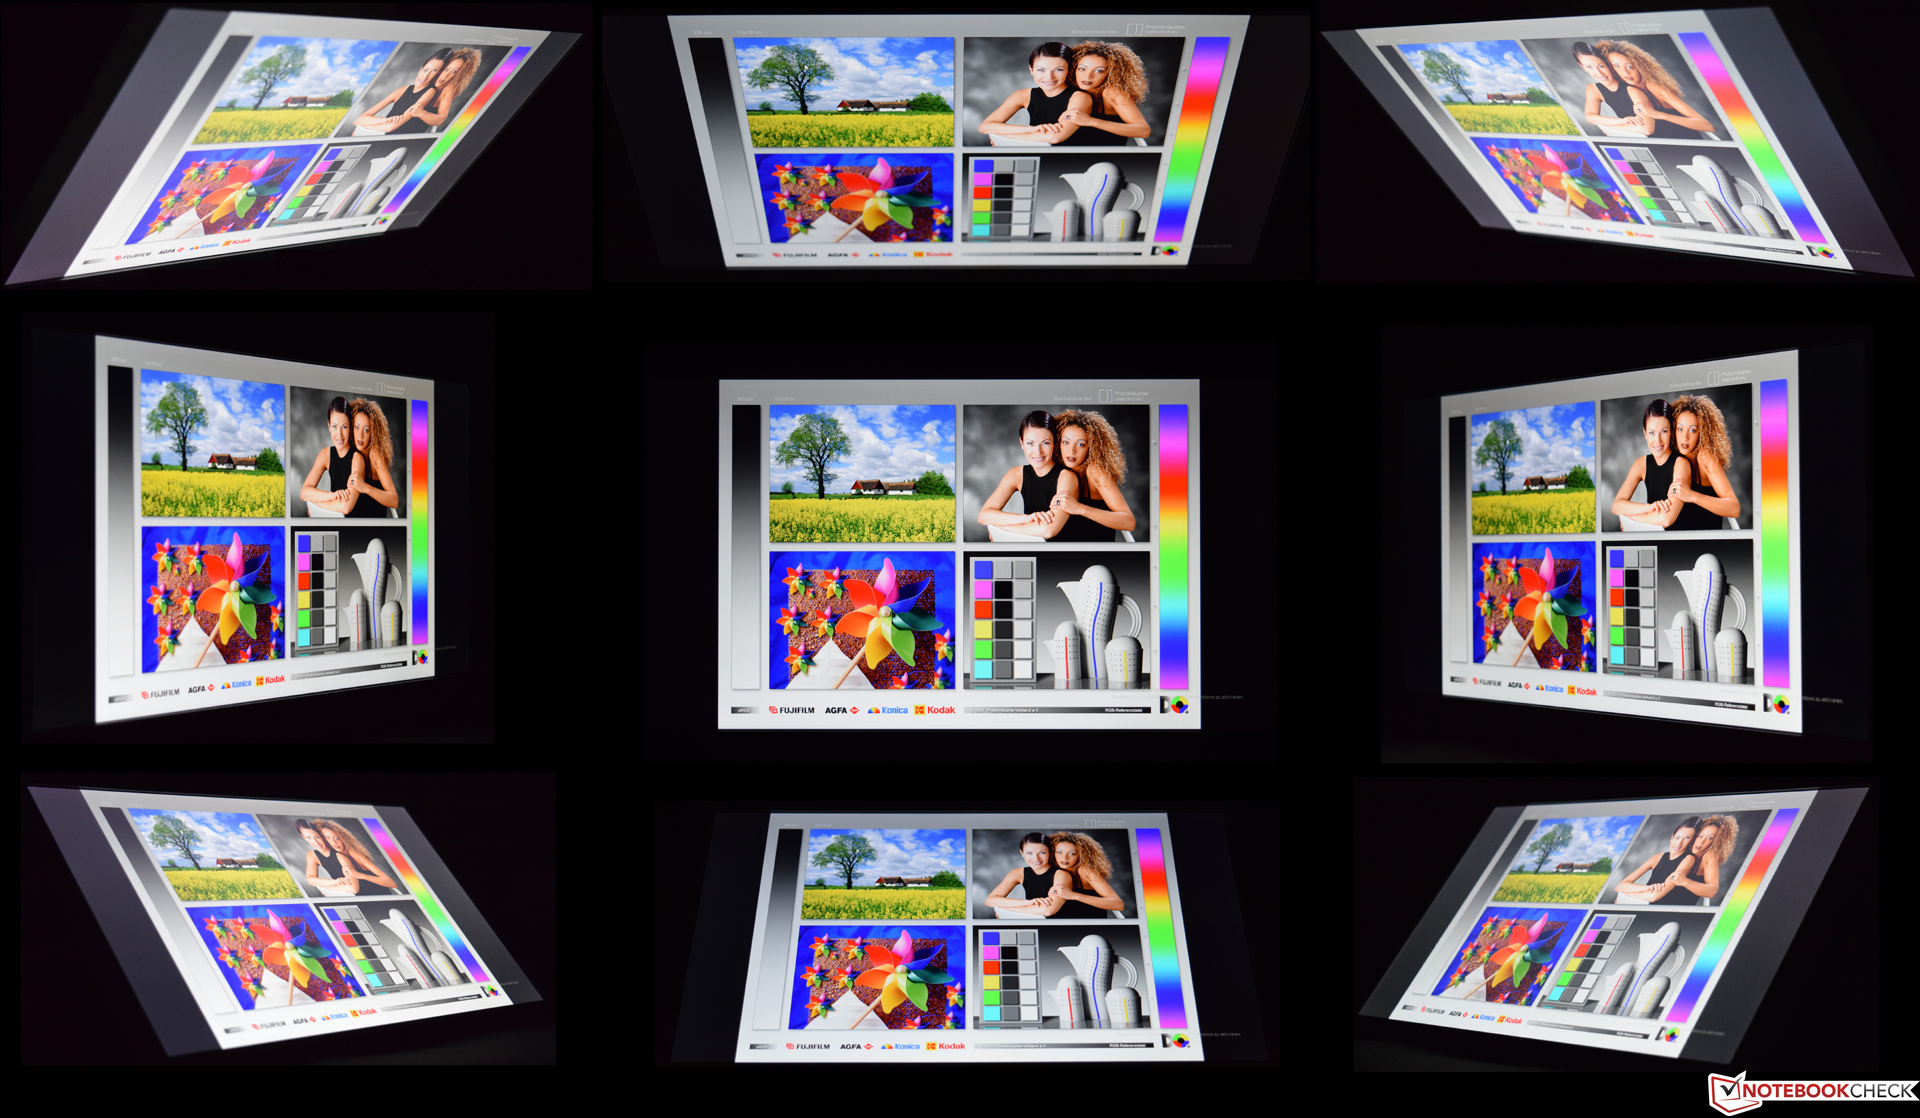
También recordamos el buent eclado que ofrece una buena experiencia de mecanografiado. Aunque el Tuxedo InfinityBook Pro 13 2017 puntúe con un display de ángulo de visión estable, los resultados de las mediciones están en la media y restan puntos. Vemos posibilidad de ponerse al día en touchpad y altavoces, que no encajan en el concepto general tal cual están.
Ésta es una versión acortada del análisis original. Puedes leer el análisis completo en inglés aquí.
Tuxedo InfinityBook Pro 13 2017
- 10/25/2017 v6 (old)
Sebastian Bade