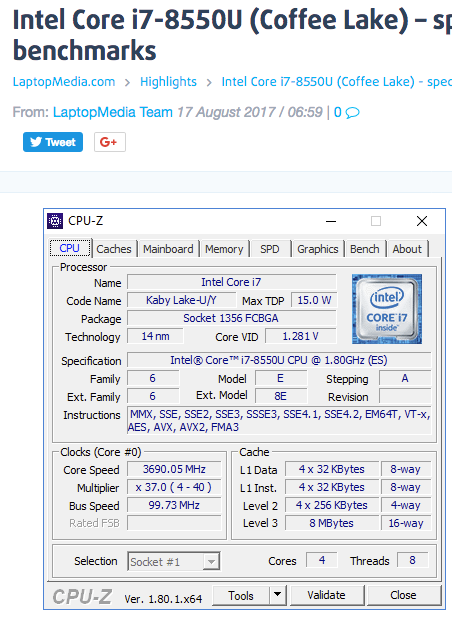
Análisis para el Intel Core i7-8550U procesador
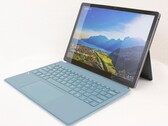
Análisis del convertible KUU LeBook 12.6 2-en-1: Una alternativa más barata al Microsoft Surface Pro
Hay muchas tabletas con Windows 10 entre las que elegir más allá de las de Microsoft. La KUU LeBook es quizás la que más se acerca en términos de diseño visual y rendimiento a la vez que cuesta potencialmente cientos de dólares menos, pero falla en algunas áreas.
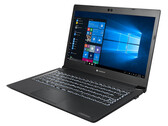
Intel Core i7-8550U, UHD Graphics 620, 12.6", 859 gReview de portátiles Dynabook Portégé A30-E: Gran pantalla, maletín inestable
El portátil de negocios Dynabook de 13,3 pulgadas satisface con una pantalla IPS brillante y rica en contrastes, una pantalla NVMe SSD y una larga duración de la batería. Sin embargo, el caso debería ser más estable.
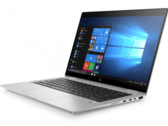
Intel Core i7-8550U, UHD Graphics 620, 13.3", 1.2 kgReview del portátil HP EliteBook x360 1030 G3: Un convertible extremadamente brillante con pantalla táctil mate y funciones de privacidad
HP es uno de los pocos fabricantes de equipos originales que vende portátiles de empresa con pantallas opcionales brillantes. El EliteBook x360 1030 G3 es uno de estos dispositivos, que tiene una pantalla opcional de 700 cd/m². Siga leyendo para averiguar si la pantalla puede estar a la altura de su facturación y cómo afecta la duración de la batería. Examinaremos el filtro de privacidad Sure View que HP también incorpora.
Intel Core i7-8550U, UHD Graphics 620, 13.3", 1.3 kgReview del Lenovo IdeaPad 330-17IKB (i7-8550U, GeForce MX150)
El IdeaPad 330 17 no abre ninguna brecha, pero nos parece un poco caro para las especificaciones. La GPU GeForce MX150 no compensa la lentitud del disco duro de 1 TB ni la mala calibración de la pantalla de 900p TN para justificar el precio de venta de 900 dólares.
Intel Core i7-8550U, NVIDIA GeForce MX150, 17.3", 2.8 kgReview del Tuxedo Book BU1307 (Core i7-8550U, UHD 620)
El Tuxedo Book BU1307 es un portátil móvil con características personalizables y buenas opciones de mantenimiento. El sistema también está especialmente adaptado a Linux, mientras que el fabricante también ofrece un amplio soporte. Siga leyendo para saber qué esperar de este potente portátil Linux de 13,3 pulgadas.
Intel Core i7-8550U, UHD Graphics 620, 13.3", 1.4 kgSamsung Notebook 9 NP930QAA: Intel UHD Graphics 620, 13.30", 1 kg
análise » Review del Convertible Samsung Notebook 9 Pen NP930QAA (i7-8550U)
Acer TravelMate X3410-M-866T: Intel UHD Graphics 620, 14.00", 1.7 kg
análise » Review del Acer TravelMate X3410 (i7-8550U, 16 GB RAM, 512 GB SSD)
Lenovo ThinkPad X1 Carbon 2018-20KGS5DU00: Intel UHD Graphics 620, 14.00", 1.1 kg
análise » Review del Lenovo ThinkPad X1 Carbon 2018 (matte WQHD, i7)
Acer TravelMate X3410-M-50DD: NVIDIA GeForce MX130, 14.00", 1.7 kg
análise » Review del Acer TravelMate X3410 (i7, MX130, FHD)
Toshiba Portege X30T-E-109: Intel UHD Graphics 620, 13.30", 1.4 kg
análise » Review del Toshiba Portege X30T-E (i7-8550U, UHD620)
Asus VivoBook S15 S530UN-BQ097T: NVIDIA GeForce MX150, 15.60", 1.8 kg
análise » Review del Asus VivoBook S15 S530UN (i7, FHD, MX150)
Acer Switch 7 BE SW713-51GNP: NVIDIA GeForce MX150, 13.50", 1.6 kg
análise » Review del Convertible Acer Switch 7 Black Edition (i7-8550U, MX150)
Lenovo Yoga C930-13IKB 81C4: Intel UHD Graphics 620, 13.90", 1.4 kg
análise » Review del Convertible Lenovo Yoga C930-13IKB (i7-8550U, FHD)
HP Pavilion 14-ce0002ng: NVIDIA GeForce MX150, 14.00", 1.7 kg
análise » Review del HP Pavilion 14 (i7-8550U, MX150)
HP Envy 13-ah0003ng: NVIDIA GeForce MX150, 13.30", 1.2 kg
análise » Review del HP Envy 13t (i7-8550U, MX150, SSD, FHD)
Schenker Slim 14 M18: Intel UHD Graphics 620, 14.00", 1.4 kg
análise » Review del Schenker Slim 14 M18 (Clevo N141WU, i7-8550U, UHD620)
Getac S410: Intel UHD Graphics 620, 14.00", 3.2 kg
análise » Review del Getac S410 (i5-8550U) Rugged
Zotac ZBOX-CI660 Nano: Intel UHD Graphics 620, 1.1 kg
análise » Review del Mini PC Zotac ZBOX-CI660 Nano (i7-8550U)
Dell Latitude 15 3590-K8JP: AMD Radeon 530, 15.60", 2.1 kg
análise » Review del Dell Latitude 15 3590 (i7-8550U, Radeon 530)
Asus ZenBook S UX391U: Intel UHD Graphics 620, 13.30", 1 kg
análise » Review del Asus ZenBook S UX391U (Core i7, FHD)
MSI Prestige PS42 8RB-059: NVIDIA GeForce MX150, 14.00", 1.2 kg
análise » Review del MSI PS42 8RB Prestige (i7-8550U, GeForce MX150)
Lenovo IdeaPad Flex-1570 81CA000RUS: NVIDIA GeForce MX130, 15.60", 2 kg
análise » Review del Convertible Lenovo Flex 5 15 (i7-8550U, GeForce MX130)
Acer TravelMate 2410-G2-MG-82E6: NVIDIA GeForce MX130, 14.00", 1.8 kg
análise » Review del Acer TravelMate P2410 (i7-8550U, MX130)
Huawei MateBook X Pro, i7: NVIDIA GeForce MX150, 13.90", 1.3 kg
análise » Review del Huawei MateBook X Pro (i7-8550U, MX150)
LG Gram 15Z980-B.AA78B: Intel UHD Graphics 620, 15.60", 1.1 kg
análise » Review del LG Gram 15Z980 (i7-8550U, Full-HD)
Lenovo Yoga 730-13IKB: Intel UHD Graphics 620, 13.30", 1.2 kg
análise » Review del Convertible Lenovo Yoga 730-13IKB (i7-8550U, 4K)
Asus VivoBook 15 X570UD: NVIDIA GeForce GTX 1050 Mobile, 15.60", 1.9 kg
análise » Review del Asus VivoBook 15 K570UD (i7-8550U. GTX 1050)
Lenovo Yoga 730-15IKB: NVIDIA GeForce GTX 1050 Mobile, 15.60", 1.9 kg
análise » Review del Convertible Lenovo Yoga 730-15IKB (i7-8550U, GTX 1050, SSD, 4K)
Lenovo IdeaPad 530s-14IKB: NVIDIA GeForce MX150, 14.00", 1.5 kg
análise » Review del Lenovo IdeaPad 530s-14IKB (i7-8550U, MX150, WQHD, IPS)
HP Spectre x360 15-ch011nr: NVIDIA GeForce MX150, 15.60", 2.1 kg
análise » Review del Convertible HP Spectre x360 15 2018 (i7-8550U, GeForce MX150)
Lenovo ThinkPad P52s-20LB000HGE: NVIDIA Quadro P500, 15.60", 2.2 kg
análise » Review de la estación de trabajo Lenovo ThinkPad P52s (i7-8550U, Full HD)
Asus VivoBook 15 F510UF-ES71: NVIDIA GeForce MX130, 15.60", 1.6 kg
análise » Review del portátil Asus VivoBook 15 F510UF (i7-8550U, GeForce MX130)
HP EliteBook 840 G5-3JX61EA: Intel UHD Graphics 620, 14.00", 1.5 kg
análise » Review del portátil HP EliteBook 840 G5 (i7-8550U, SSD, FHD)
HP EliteBook 830 G5-3JX74EA: Intel UHD Graphics 620, 13.30", 1.3 kg
análise » Revisión del ordenador portátil HP EliteBook 830 G5 (i7, FHD, SureView)
Dell XPS 13 9370 i7 UHD: Intel UHD Graphics 620, 13.30", 1.2 kg
análise » Revisión del portátil Dell XPS 13 9370 (i7-8550U, 4K UHD)
Lenovo ThinkPad T580-20LAS01H00: NVIDIA GeForce MX150, 15.60", 2.1 kg
análise » Análisis del portátil Lenovo ThinkPad T580 (i7-8550U, MX150, UHD)
Acer Nitro 5 Spin NP515-51-86CX: NVIDIA GeForce GTX 1050 Mobile, 15.60", 2.2 kg
análise » Análisis del Convertible Acer Nitro 5 Spin NP515 (i7-8550U, GTX 1050)
Asus ZenBook Flip 15 UX561UD: NVIDIA GeForce GTX 1050 Mobile, 15.60", 2.1 kg
análise » Análisis del Convertible Asus ZenBook Flip 15 (i7-8550U, GTX 1050, 4K, SSD, HDD)
Lenovo ThinkPad T480-20L6S01V00: NVIDIA GeForce MX150, 14.00", 1.8 kg
análise » Análisis del Lenovo ThinkPad T480 (i7-8550U, MX150, FHD)
Lenovo ThinkPad T480s-20L8S02E00: NVIDIA GeForce MX150, 14.00", 1.3 kg
análise » Análisis completo del Lenovo ThinkPad T480s (i7-8550U, MX150 Max-Q)
Asus Zenbook UX430UN: NVIDIA GeForce MX150, 14.00", 1.3 kg
análise » Análisis del Asus ZenBook UX430UN (i7-8550U, GeForce MX150)
Lenovo ThinkPad X1 Yoga 2018-20LES01W00: Intel UHD Graphics 620, 14.00", 1.4 kg
análise » Análisis del Convertible Lenovo ThinkPad X1 Yoga 2018 (i7-8550U, HDR WQHD)
Lenovo ThinkPad X380 Yoga 20LJS02W00: Intel UHD Graphics 620, 13.30", 1.4 kg
análise » Análisis completo del Convertible Lenovo ThinkPad X380 Yoga (i7-8550U, FHD)
HP Spectre x360 13-ae048ng: Intel UHD Graphics 620, 13.30", 1.3 kg
análise » Análisis del HP Spectre x360 13t (i7-8550U, FHD, SSD)
Asus VivoBook S410UQ-NH74: NVIDIA GeForce 940MX, 14.00", 1.3 kg
análise » Análisis del Asus VivoBook S14 S410UQ (i7-8550U, 940MX, Full HD)
Samsung Notebook 9 NP900X5T-X01US : NVIDIA GeForce MX150, 15.00", 1.3 kg
análise » Análisis del Samsung Notebook 9 NP900X5T (i7-8550U, GeForce MX150)
Asus VivoBook Pro 17 N705UD-EH76: NVIDIA GeForce GTX 1050 Mobile, 17.30", 2.3 kg
análise » Análisis del Asus VivoBook Pro 17 N705UD (i7-8550U, GTX 1050)
Lenovo ThinkPad E580-20KS001RGE: AMD Radeon RX 550 (Laptop), 15.60", 2.1 kg
análise » Análisis del Lenovo ThinkPad E580 (i7-8550U, RX 550)
Asus ZenBook 13 UX331UN: NVIDIA GeForce MX150, 13.30", 1.1 kg
análise » Análisis del ASUS ZenBook 13 UX331UN (i7-8550, GeForce MX150, SSD, FHD)
HP Spectre 13-af033ng: Intel UHD Graphics 620, 13.30", 1.1 kg
análise » Análisis del HP Spectre 13-af033 (i7-8550U, FHD)
Lenovo Miix 520-12IKB 20M3000LGE: Intel UHD Graphics 620, 12.20", 1.3 kg
análise » Análisis del Convertible Lenovo Miix 520-12IKB (i7-8550U, SSD, WUXGA)
HP Spectre x360 13t-ae000: Intel UHD Graphics 620, 13.30", 1.3 kg
análise » Análisis completo del Convertible HP Spectre x360 13t-ae000 (i7-8550U, 4K UHD)
Schenker Slim 15 L17: Intel UHD Graphics 620, 15.60", 2 kg
análise » Análisis del Schenker Slim 15 L17 (Clevo N751WU, i7-8550U, FHD)
Asus ZenBook 13 UX331UN: NVIDIA GeForce MX150, 13.30", 1.1 kg
análise » Análisis del Asus ZenBook 13 UX331UN (i7-8550U, MX150)
Lenovo Yoga 720-13IKB: Intel UHD Graphics 620, 13.30", 1.3 kg
análise » Análisis del Convertible Lenovo Yoga 720-13IKB (i7-8550U, SSD, FHD)
Acer Spin 5 SP515-51GN-80A3: NVIDIA GeForce GTX 1050 Mobile, 15.60", 2.3 kg
análise » Breve análisis del Convertible Acer Spin 5 SP515-51GN (i7-8550U, GTX 1050, 8 GB)
Razer Blade Stealth QHD i7-8550U: Intel UHD Graphics 620, 13.30", 1.4 kg
análise » Breve análisis del portátil Razer Blade Stealth (QHD i7-8550U)
HP Spectre x360 15t-bl100: NVIDIA GeForce MX150, 15.60", 2 kg
análise » Breve análisis del convertible HP Spectre x360 15t-bl100 (i7-8550U, MX150)
Dell Inspiron 15 7570: NVIDIA GeForce 940MX, 15.60", 2 kg
análise » Breve análisis del Dell Inspiron 15 7570 (i7-8550U, 940MX)
Dell Inspiron 17-7773-0043: NVIDIA GeForce MX150, 17.30", 2.9 kg
análise » Breve análisis del convertible Dell Inspiron 17 7773 (i7-8550U, 16 GB, 17" Touch)
Lenovo Yoga 920-13IKB-80Y7: Intel UHD Graphics 620, 13.90", 1.4 kg
análise » Análisis completo del Convertible Lenovo Yoga 920-13IKB (i7-8550U, FHD)
Acer Aspire 5 A517-51G-80L: NVIDIA GeForce MX150, 17.30", 2.9 kg
análise » Breve análisis del portátil Acer Aspire 5 A517-51G (i7-8550U, MX 150, Full-HD)
Tuxedo InfinityBook Pro 13 2017: Intel UHD Graphics 620, 13.30", 1.5 kg
análise » Breve análisis del Tuxedo InfinityBook Pro 13 2017 (i7-8550U, 500 GB, 32 GB, FHD)
Dell XPS 13 i7-8550U: Intel UHD Graphics 620, 13.30", 1.3 kg
análise » Breve análisis del portátil Dell XPS 13 (i7-8550U, QHD)
Lenovo ThinkPad T480-20L6S01V00: NVIDIA GeForce MX150, 14.00", 1.8 kg
análise externo » Lenovo ThinkPad T480-20L6S01V00
Kuu LeBook 12.6 Core i7-8550U: Intel UHD Graphics 620, 12.60", 0.9 kg
análise externo » Kuu LeBook 12.6 Core i7-8550U
Lenovo Thinkpad T480-20L5000BMH: NVIDIA GeForce MX150, 15.00", 1.7 kg
análise externo » Lenovo Thinkpad T480-20L5000BMH
LG Gram 15Z980-B.AA78B: Intel UHD Graphics 620, 15.60", 1.1 kg
análise externo » LG Gram 15Z980-B.AA78B
Medion Akoya P6685-MD61087: NVIDIA GeForce MX150, 15.60", 2.1 kg
análise externo » Medion Akoya P6685-MD61087
HP ZBook x2 G4-4QH82EA: NVIDIA Quadro M620, 14.00", 2.2 kg
análise externo » HP ZBook x2 G4-4QH82EA
MSI PS42 8M-072ES: Intel UHD Graphics 620, 14.00", 1.2 kg
análise externo » MSI PS42 8M-072ES
Lenovo ThinkPad T480s-20L7001LMH: Intel UHD Graphics 620, 14.00", 1.3 kg
análise externo » Lenovo ThinkPad T480s-20L7001LMH
HP EliteBook 840 G5 3JX05EA: Intel UHD Graphics 620, 14.00", 1.6 kg
análise externo » HP EliteBook 840 G5 3JX05EA
Asus UX410UA-GV426: Intel UHD Graphics 620, 14.00", 1.4 kg
análise externo » Asus UX410UA-GV426
Acer Aspire 5 A517-51G-87A7: NVIDIA GeForce MX130, 17.30", 3 kg
análise externo » Acer Aspire 5 A517-51G-87A7
Acer Aspire 3 A315-53G-888K: NVIDIA GeForce MX130, 15.60", 2.1 kg
análise externo » Acer Aspire 3 A315-53G-888K
Asus ZenBook UX430UA-GV595: Intel UHD Graphics 620, 14.00", 1.3 kg
análise externo » Asus ZenBook UX430UA-GV595
HP EliteBook x360 1040 G5 5DF84EA: Intel UHD Graphics 620, 14.00", 1.4 kg
análise externo » HP EliteBook x360 1040 G5 5DF84EA
Medion Akoya P6687-MD61007: NVIDIA GeForce MX150, 15.60", 2.5 kg
análise externo » Medion Akoya P6687-MD61007
Lenovo Ideapad 330-15IKBR-81DE01P2SP: Intel UHD Graphics 620, 15.60", 2.2 kg
análise externo » Lenovo Ideapad 330-15IKBR-81DE01P2SP
Dell Inspiron 13 5370-MRFG2: AMD Radeon 530, 13.30", 1.4 kg
análise externo » Dell Inspiron 13 5370-MRFG2
HP EliteBook x360 1040 G5-5SR13EAABD: Intel UHD Graphics 620, 14.00", 1.4 kg
análise externo » HP EliteBook x360 1040 G5-5SR13EAABD
Acer Spin 5 SP515-51GN-80A3: NVIDIA GeForce GTX 1050 Mobile, 15.60", 2.3 kg
análise externo » Acer Spin 5 SP515-51GN-80A3
Toshiba Portege X30T-E-109: Intel UHD Graphics 620, 13.30", 1.4 kg
análise externo » Toshiba Portege X30T-E-109
HP Pavilion 14-ce0014ns: NVIDIA GeForce MX150, 14.00", 1.6 kg
análise externo » HP Pavilion 14-ce0014ns
MSI PS42 8RB-206NL: NVIDIA GeForce MX150, 14.00", 1.2 kg
análise externo » MSI PS42 8RB-206NL
Toshiba Portege Z30-E-12L: Intel UHD Graphics 620, 13.30", 1.2 kg
análise externo » Toshiba Portege Z30-E-12L
HP Pavilion x360 14-cd0014ns: NVIDIA GeForce MX130, 14.00", 1.6 kg
análise externo » HP Pavilion x360 14-cd0014ns
Acer Swift 3 SF313-51-873X: Intel UHD Graphics 620, 13.30", 1.2 kg
análise externo » Acer Swift 3 SF313-51-873X
MSI PS42 8RC-029ES: NVIDIA GeForce GTX 1050 Mobile, 14.00", 1.2 kg
análise externo » MSI PS42 8RC-029ES
MSI PS42 8RB-606XES: NVIDIA GeForce MX150, 14.00", 1.2 kg
análise externo » MSI PS42 8RB-606XES
HP Envy 13-ah0006ns: NVIDIA GeForce MX150, 13.30", 1.3 kg
análise externo » HP Envy 13-ah0006ns
Huawei MateBook D 14-53010CQK: NVIDIA GeForce MX150, 14.00", 1.5 kg
análise externo » Huawei MateBook D 14-53010CQK
Asus Vivobook A510UN-EJ521T: NVIDIA GeForce MX150, 15.60", 1.7 kg
análise externo » Asus Vivobook A510UN-EJ521T
Asus VivoBook S13 S330UA-EY034T: Intel UHD Graphics 620, 13.30", 1.2 kg
análise externo » Asus VivoBook S13 S330UA-EY034T
Asus VivoBook 15 X512UF-BQ135T: NVIDIA GeForce MX130, 15.60", 1.8 kg
análise externo » Asus VivoBook 15 X512UF-BQ135T
Lenovo Yoga 730-15IKB-81CU0056PB: Intel UHD Graphics 620, 15.60", 1.9 kg
análise externo » Lenovo Yoga 730-15IKB-81CU0056PB
Acer Switch 7 BE SW713-51GNP-81DA: NVIDIA GeForce MX150, 13.50", 1.2 kg
análise externo » Acer Switch 7 BE SW713-51GNP-81DA
HP Envy 13-ah0005ns: Intel UHD Graphics 620, 13.30", 1.3 kg
análise externo » HP Envy 13-ah0005ns
Lenovo Yoga 730-15IKBR-81CU003WSP: NVIDIA GeForce GTX 1050 Mobile, 15.60", 1.9 kg
análise externo » Lenovo Yoga 730-15IKBR-81CU003WSP
MSI PS42 8RC-001ES: NVIDIA GeForce GTX 1050 Mobile, 14.00", 1.2 kg
análise externo » MSI PS42 8RC-001ES
Lenovo IdeaPad Flex 5 15-1570-81CA001QUS: Intel UHD Graphics 620, 15.60", 2 kg
análise externo » Lenovo Flex 5 15-1570-81CA001QUS
HP EliteBook x360 1030 G3-4QY22EA: Intel UHD Graphics 620, 13.30", 1.3 kg
análise externo » HP EliteBook x360 1030 G3-4QY22EA
Dell XPS 13 9370-1CNW5: Intel UHD Graphics 620, 13.30", 1.3 kg
análise externo » Dell XPS 13 9370-1CNW5
Asus ZenBook S UX391UA-EG007R: Intel UHD Graphics 620, 13.30", 1 kg
análise externo » Asus ZenBook S UX391UA-EG007R
Lenovo ThinkPad X1 Carbon G6-20KH003BMD: Intel UHD Graphics 620, 14.00", 1.1 kg
análise externo » Lenovo ThinkPad X1 Carbon G6-20KH003BMD
Lenovo ThinkPad X1 Yoga-20LD002MMD: Intel UHD Graphics 620, 14.00", 1.4 kg
análise externo » Lenovo ThinkPad X1 Yoga-20LD002MMD
Lenovo Yoga 730-13IKB-81CT0075SP: Intel UHD Graphics 620, 13.30", 1.2 kg
análise externo » Lenovo Yoga 730-13IKB-81CT0075SP
Lenovo Ideapad 530s-14IKBR-81EU00C5SP: Intel UHD Graphics 620, 14.00", 1.6 kg
análise externo » Lenovo Ideapad 530s-14IKBR-81EU00C5SP
HP Pavilion 15-bc404ns: NVIDIA GeForce GTX 1050 Mobile, 15.60", 2.2 kg
análise externo » HP Pavilion 15-bc404ns
Lenovo Yoga C930-13IKB-81C4008TPB : Intel UHD Graphics 620, 13.90", 1.4 kg
análise externo » Lenovo Yoga C930-13IKB-81C4008TPB
Lenovo Yoga 530-14IKB-81EK00WEGE: NVIDIA GeForce MX130, 14.00", 1.7 kg
análise externo » Lenovo Yoga 530-14IKB-81EK00WEGE
HP Envy 13-ah0007ns: Intel UHD Graphics 620, 13.30", 1.3 kg
análise externo » HP Envy 13-ah0007ns
Acer Switch 7 SW713-51GNP-89JD: NVIDIA GeForce MX150, 13.50", 1.6 kg
análise externo » Acer Switch 7 SW713-51GNP-89JD
Asus ZenBook S UX391UA-ET013R: Intel UHD Graphics 620, 13.30", 1 kg
análise externo » Asus ZenBook S UX391UA-ET013R
HP Pavilion 14-CE0000NS: NVIDIA GeForce MX150, 14.00", 1.7 kg
análise externo » HP Pavilion 14-CE0000NS
Toshiba Portege X30-E-11F: Intel UHD Graphics 620, 13.30", 1.1 kg
análise externo » Toshiba Portege X30-E-11F
Acer Spin 5 SP513-52N-85LZ: Intel UHD Graphics 620, 13.30", 1.5 kg
análise externo » Acer Spin 5 SP513-52N-85LZ
Honor MagicBook VLT-W60A: NVIDIA GeForce MX150, 14.00", 1.5 kg
análise externo » Honor MagicBook VLT-W60A
Acer Spin 5 SP513-52NP-870E: Intel UHD Graphics 620, 13.30", 1.5 kg
análise externo » Acer Spin 5 SP513-52NP-870E
Dell Inspiron 15 7572: NVIDIA GeForce MX150, 15.60", 2 kg
análise externo » Dell Inspiron 15 7572
Acer Swift 5 SF514-52TP-812J: Intel UHD Graphics 620, 14.00", 1 kg
análise externo » Acer Swift 5 SF514-52TP-812J
Dell Vostro 14 5471-5MPNF: AMD Radeon 530, 14.00", 1.7 kg
análise externo » Dell Vostro 14 5471-5MPNF
Asus VivoBook S15 S510UF-BR452T: NVIDIA GeForce MX130, 14.00", 1.7 kg
análise externo » Asus VivoBook S15 S510UF-BR452T
Asus ZenBook UX430UA-GV362T: Intel UHD Graphics 620, 14.00", 1.3 kg
análise externo » Asus ZenBook UX430UA-GV362T
HP 15-da0077ns: NVIDIA GeForce MX130, 15.60", 2.1 kg
análise externo » HP 15-da0077ns
Asus VivoBook S15 S510UN-BQ121T: NVIDIA GeForce MX150, 15.60", 1.5 kg
análise externo » Asus VivoBook S15 S510UN-BQ121T
MSI PS42 8RC-072ES: NVIDIA GeForce GTX 1050 Max-Q, 14.00", 1.2 kg
análise externo » MSI PS42 8RC-072ES
Lenovo Yoga 920-13IKBR-80Y7005YSP: Intel UHD Graphics 620, 13.90", 1.4 kg
análise externo » Lenovo Yoga 920-13IKBR-80Y7005YSP
Asus K540UA-GQ676T: Intel UHD Graphics 620, 15.60", 2 kg
análise externo » Asus K540UA-GQ676T
Lenovo Yoga 730-13IKB-81CT0080GE: Intel UHD Graphics 620, 13.30", 1.1 kg
análise externo » Lenovo Yoga 730-13IKB-81CT0080GE
Dell Inspiron 15 5570-37HG8: AMD Radeon 530, 15.60", 2.3 kg
análise externo » Dell Inspiron 15 5570-37HG8
Lenovo Yoga C930-13IKB-81C4002WMH: Intel UHD Graphics 620, 13.90", 1.4 kg
análise externo » Lenovo Yoga C930-13IKB-81C4002WMH
Lenovo Yoga C930-13IKB-81C4003UGE: Intel UHD Graphics 620, 13.90", 1.4 kg
análise externo » Lenovo Yoga C930-13IKB-81C4003UGE
HP Spectre x360 13-ae015nd: Intel UHD Graphics 620, 13.30", 1.3 kg
análise externo » HP Spectre x360 13-ae015nd
Lenovo ThinkPad T580-20LAS01H00: NVIDIA GeForce MX150, 15.60", 2.1 kg
análise externo » Lenovo ThinkPad T580-20LAS01H00
Lenovo Yoga C930-13IKB-81EQ000HGE: Intel UHD Graphics 620, 13.90", 1.4 kg
análise externo » Lenovo Yoga C930-13IKB-81EQ000HGE
Lenovo Yoga C930-13IKB 81C4: Intel UHD Graphics 620, 13.90", 1.4 kg
análise externo » Lenovo Yoga C930-13IKB 81C4
Asus Pro P5440UF-XB74: NVIDIA GeForce MX130, 14.00", 1.2 kg
análise externo » Asus Pro P5440UF-XB74
Lenovo Ideapad 720S-13IKB-81BV005AGE: Intel UHD Graphics 620, 13.30", 1.1 kg
análise externo » Lenovo Ideapad 720S-13IKB-81BV005AGE
Lenovo ThinkPad X1 Carbon 2018-20KGS03800: Intel UHD Graphics 620, 14.00"
análise externo » Lenovo ThinkPad X1 Carbon 2018-20KGS03800
Lenovo Yoga 530-14IKBR-81EK00FXSP: Intel UHD Graphics 620, 14.00", 1.7 kg
análise externo » Lenovo Yoga 530-14IKBR-81EK00FXSP
Lenovo Yoga 730-15IKB-81CU003EMH: NVIDIA GeForce GTX 1050 Mobile, 15.60", 1.9 kg
análise externo » Lenovo Yoga 730-15IKB-81CU003EMH
Lenovo Ideapad 720s-14IKBR-81BD003RSP: NVIDIA GeForce MX150, 14.00", 1.6 kg
análise externo » Lenovo Ideapad 720s-14IKBR-81BD003RSP
Asus ZenBook S UX391UA-ET012T: Intel UHD Graphics 620, 13.30", 1 kg
análise externo » Asus ZenBook S UX391UA-ET012T
Asus Zenbook UX331UA-EG029T: Intel UHD Graphics 620, 13.30", 1.1 kg
análise externo » Asus Zenbook UX331UA-EG029T
Lenovo Ideapad 520S-14IKBR-81BL007VSP: Intel UHD Graphics 620, 14.00", 1.7 kg
análise externo » Lenovo Ideapad 520S-14IKBR-81BL007VSP
HP Pavilion 14-ce0012ns: NVIDIA GeForce MX150, 14.00", 1.6 kg
análise externo » HP Pavilion 14-ce0012ns
Medion Erazer P6689-MD61021: NVIDIA GeForce GTX 1050 Mobile, 15.60", 2.3 kg
análise externo » Medion Erazer P6689-MD61021
Acer Nitro 5 Spin NP515-51-86CX: NVIDIA GeForce GTX 1050 Mobile, 15.60", 2.2 kg
análise externo » Acer Nitro 5 Spin NP515-51-86CX
Asus VivoBook Pro 17 N705UD-EH76: NVIDIA GeForce GTX 1050 Mobile, 17.30", 2.3 kg
análise externo » Asus VivoBook Pro 17 N705UD-EH76
HP Envy 13-ah0003ng: NVIDIA GeForce MX150, 13.30", 1.2 kg
análise externo » HP Envy 13-ah0003ng
Lenovo Ideapad 330S-15IKB-81F5009JMX: AMD Radeon RX 540, 15.60", 1.9 kg
análise externo » Lenovo Ideapad 330S-15IKB-81F5009JMX
Lenovo ThinkPad X1 Carbon G6-20KG003BGE: Intel UHD Graphics 620, 14.00", 1.1 kg
análise externo » Lenovo ThinkPad X1 Carbon G6-20KG003BGE
Asus VivoBook S15 S530UN-BQ353T: NVIDIA GeForce MX150, 15.60", 1.8 kg
análise externo » Asus VivoBook S15 S530UN-BQ353T
Asus Zenbook S UX391UA-EG047T: Intel UHD Graphics 620, 13.30", 1.1 kg
análise externo » Asus Zenbook S UX391UA-EG047T
HP Spectre x360 13-ae046ng: Intel UHD Graphics 620, 13.30", 1.3 kg
análise externo » HP Spectre x360 13-ae046ng
Lenovo ThinkPad P52s-20LB000PMH: Intel UHD Graphics 620, 15.60", 2 kg
análise externo » Lenovo ThinkPad P52s-20LB000PMH
Asus Zenbook 13 UX331UN-90NB0GY1-M00230: NVIDIA GeForce MX150, 13.30", 1.1 kg
análise externo » Asus Zenbook 13 UX331UN-90NB0GY1-M00230
Asus VivoBook 15 X570UD: NVIDIA GeForce GTX 1050 Mobile, 15.60", 1.9 kg
análise externo » Asus VivoBook 15 X570UD
MSI Prestige PS42 8RB-059: NVIDIA GeForce MX150, 14.00", 1.2 kg
análise externo » MSI Prestige PS42 8RB-059
HP ZBook 14u G5-2ZB99EA: AMD Radeon Pro WX 3100, 14.00", 1.6 kg
análise externo » HP ZBook 14u G5-2ZB99EA
Asus Zenbook S UX391UA-EG007T: Intel UHD Graphics 620, 13.30", 1 kg
análise externo » Asus Zenbook S UX391UA-EG007T
Lenovo Yoga 530-14IKB-81EK00G9MH: Intel UHD Graphics 620, 14.00", 1.7 kg
análise externo » Lenovo Yoga 530-14IKB-81EK00G9MH
HP Pavilion 15-cs0007NS: NVIDIA GeForce MX150, 15.60", 1.9 kg
análise externo » HP Pavilion 15-CS0007NS
MSI PS42 8RB-021ES: NVIDIA GeForce MX150, 14.00", 1.2 kg
análise externo » MSI PS42 8RB-021ES
Toshiba Tecra X40-E-10U: Intel UHD Graphics 620, 14.00", 1.3 kg
análise externo » Toshiba Tecra X40-E-10U
Lenovo Ideapad 520S-14IKBR-81BL007PSP: Intel UHD Graphics 620, 14.00", 1.7 kg
análise externo » Lenovo Ideapad 520S-14IKBR-81BL007PSP
Medion Akoya P6687-MD6100: NVIDIA GeForce MX150, 15.60", 2.1 kg
análise externo » Medion Akoya P6687-MD6100
Asus K406UA-BM230T: Intel UHD Graphics 620, 14.00", 1.2 kg
análise externo » Asus K406UA-BM230T
Asus ZenBook Flip 15 UX561UD-E2029T: NVIDIA GeForce GTX 1050 Mobile, 15.60", 2.1 kg
análise externo » Asus ZenBook Flip 15 UX561UD-E2029T
Acer Swift 3 SF315-52G-8376: NVIDIA GeForce MX150, 15.60", 1.8 kg
análise externo » Acer Swift 3 SF315-52G-8376
Dell Inspiron 15 3576: AMD Radeon 520, 15.60", 2.1 kg
análise externo » Dell Inspiron 15 3576
Lenovo Yoga 730-13IKB: Intel UHD Graphics 620, 13.30", 1.2 kg
análise externo » Lenovo Yoga 730-13IKB
HP Envy 13-ah0001ng: Intel UHD Graphics 620, 13.30", 1.3 kg
análise externo » HP Envy 13-ah0001ng
Lenovo ThinkPad T480s-20L7001NGE: Intel UHD Graphics 620, 14.00", 1.4 kg
análise externo » Lenovo ThinkPad T480s-20L7001NGE
HP EliteBook 840 G5-3JX09EA: Intel UHD Graphics 620, 14.00", 1.5 kg
análise externo » HP EliteBook 840 G5-3JX09EA
Lenovo ThinkPad P52s-20LB000HGE: NVIDIA Quadro P500, 15.60", 2.2 kg
análise externo » Lenovo ThinkPad P52s-20LB000HGE
Sony Vaio S11-VJS1121: Intel UHD Graphics 620, 13.30", 0.9 kg
análise externo » Sony Vaio S11-VJS1121
Sony Vaio S13-VJS132X0511S: Intel UHD Graphics 620, 13.30", 1.1 kg
análise externo » Sony Vaio S13-VJS132X0511S
MSI Prestige PS42 8RB-073: NVIDIA GeForce MX150, 14.10", 1.2 kg
análise externo » MSI Prestige PS42 8RB-073
LG Gram 14Z980-A.AAS7U1: Intel UHD Graphics 620, 14.00", 1 kg
análise externo » LG Gram 14Z980-A.AAS7U1
Asus VivoBook Flip 14 TP412UA-EC115T: Intel UHD Graphics 620, 14.10", 1.5 kg
análise externo » Asus VivoBook Flip 14 TP412UA-EC115T
Acer Swift 5 SF514 15.6 inch: Intel UHD Graphics 620, 15.60", 1 kg
análise externo » Acer Swift 5 SF514 15.6 inch
Toshiba Portege X30-E-11U: Intel UHD Graphics 620, 13.30", 1.1 kg
análise externo » Toshiba Portege X30-E-11U
HP Spectre 13-af005nl: Intel UHD Graphics 620, 13.30", 1.1 kg
análise externo » HP Spectre 13-af005nl
HP Spectre 13-AF000NS: Intel UHD Graphics 620, 13.30", 1.1 kg
análise externo » HP Spectre 13-AF000NS
HP Pavilion 15-ck007ns: NVIDIA GeForce 940MX, 15.60", 1.9 kg
análise externo » HP Pavilion 15-ck007ns
Acer Swift 3 SF314-52-74JS: NVIDIA GeForce MX150, 15.60", 2.1 kg
análise externo » Acer Swift 3 SF314-52-74JS
Lenovo Yoga 730-15IKB: NVIDIA GeForce GTX 1050 Mobile, 15.60", 1.9 kg
análise externo » Lenovo Yoga 730-15IKB
Asus Zenbook S UX391UA-EG022T: Intel UHD Graphics 620, 13.30", 1.1 kg
análise externo » Asus Zenbook S UX391UA-EG022T
HP Pavilion 14-ce0015ns: NVIDIA GeForce MX130, 14.00", 1.6 kg
análise externo » HP Pavilion 14-ce0015ns
Lenovo ThinkPad X1 Carbon 2018-20KHCTO1WW: Intel UHD Graphics 620, 14.00", 1.2 kg
análise externo » Lenovo ThinkPad X1 Carbon 2018-20KHCTO1WW
Acer Swift 5 SF514-52T-831Y: Intel UHD Graphics 620, 14.00", 1 kg
análise externo » Acer Swift 5 SF514-52T-831Y
Lenovo ThinkPad E580-20KS001RGE: AMD Radeon RX 550 (Laptop), 15.60", 2.1 kg
análise externo » Lenovo ThinkPad E580-20KS001RGE
HP ZBook 15u G5 2ZC05EA: AMD Radeon Pro WX 3100, 15.60", 1.9 kg
análise externo » HP ZBook 15u G5 2ZC05EA
Asus ZenBook S UX391U: Intel UHD Graphics 620, 13.30", 1 kg
análise externo » Asus ZenBook S UX391U
HP EliteBook 830 G5-3JX74EA: Intel UHD Graphics 620, 13.30", 1.3 kg
análise externo » HP EliteBook 830 G5-3JX74EA
Lenovo ThinkPad X1 Carbon 2018-20KH0039MC: Intel UHD Graphics 620, 14.00", 1.1 kg
análise externo » Lenovo ThinkPad X1 Carbon 2018-20KH0039MC
Asus ZenBook Pro 14 UX480FD: NVIDIA GeForce MX150, 14.00", 1.6 kg
análise externo » Asus ZenBook Pro 14 UX480FD
Lenovo Ideapad 520S-14IKB-81BL0080SP: Intel UHD Graphics 620, 14.00", 1.7 kg
análise externo » Lenovo Ideapad 520S-14IKB-81BL0080SP
Acer Aspire 5 A515-51G-8907: NVIDIA GeForce MX130, 15.60", 2.2 kg
análise externo » Acer Aspire 5 A515-51G-8907
HP 15-bs116ns: AMD Radeon 530, 15.60", 2.1 kg
análise externo » HP 15-bs116ns
HP ENVY 13-ad113ns: Intel UHD Graphics 620, 13.30", 1.3 kg
análise externo » HP ENVY 13-ad113ns
HP EliteBook 840 G5-3JY07ES: AMD Radeon RX 540, 14.00", 1.5 kg
análise externo » HP EliteBook 840 G5-3JY07ES
HP EliteBook 850 G5-3RS15UT: AMD Radeon RX 540, 15.60", 1.8 kg
análise externo » HP EliteBook 850 G5-3RS15UT
Asus ZenBook Flip UX561UD-BO033T: NVIDIA GeForce GTX 1050 Mobile, 15.60", 2.1 kg
análise externo » Asus ZenBook Flip UX561UD-BO033T
HP Spectre 13-af090tu: Intel UHD Graphics 620, 13.30", 1.1 kg
análise externo » HP Spectre 13-af090tu
Lenovo Ideapad 530S-15IKB: NVIDIA GeForce MX150, 15.60", 2 kg
análise externo » Lenovo Ideapad 530S-15IKB
Acer Aspire 5 A515-51G-83LX: NVIDIA GeForce MX150, 15.60", 2.2 kg
análise externo » Acer Aspire 5 A515-51G-83LX
Asus VivoBook S15 S510UQ-BQ702T: NVIDIA GeForce 940MX, 15.60", 1.7 kg
análise externo » Asus VivoBook S15 S510UQ-BQ702T
Acer Aspire 5 A517-51G-8433: NVIDIA GeForce MX150, 17.30", 2.9 kg
análise externo » Acer Aspire 5 A517-51G-8433
Lenovo Ideapad 720S-13IKB-81BV0058GE: Intel UHD Graphics 620, 13.30", 1.1 kg
análise externo » Lenovo Ideapad 720S-13IKB-81BV0058GE
Lenovo ThinkPad X1 Carbon G6-20KH006MGE: Intel UHD Graphics 620, 14.00", 1.1 kg
análise externo » Lenovo ThinkPad X1 Carbon G6-20KH006MGE
Lenovo Thinkpad E580-20KS001QMH: Intel UHD Graphics 620, 15.60", 2.1 kg
análise externo » Lenovo Thinkpad E580-20KS001QMH
Asus ZenBook UX430UAR PURE14: Intel UHD Graphics 620, 14.00", 1.3 kg
análise externo » Asus ZenBook UX430UAR PURE14
HP EliteBook 840 G5-3JX61EA: Intel UHD Graphics 620, 14.00", 1.5 kg
análise externo » HP EliteBook 840 G5-3JX61EA
Dell Inspiron 15 5579-9689: Intel UHD Graphics 620, 15.60", 2.1 kg
análise externo » Dell Inspiron 15-5579-9689
Lenovo ThinkPad T480s-20L8S02E00: NVIDIA GeForce MX150, 14.00", 1.3 kg
análise externo » Lenovo ThinkPad T480s-20L8S02E00
HP Pavilion 14-bf108ns: NVIDIA GeForce 940MX, 14.00", 1.5 kg
análise externo » HP Pavilion 14-bf108ns
Huawei Matebook D 15 2018: NVIDIA GeForce MX150, 15.60", 1.9 kg
análise externo » Huawei Matebook D 2018
Asus Zenbook 13 UX331UAL-EG020TS: Intel UHD Graphics 620, 13.30", 1 kg
análise externo » Asus Zenbook 13 UX331UAL-EG020TS
Asus ZenBook Flip 15 UX561UD: NVIDIA GeForce GTX 1050 Mobile, 15.60", 2.1 kg
análise externo » Asus ZenBook Flip 15 UX561UD
Lenovo Ideapad 320-15IKBR-80XL03MDSP: NVIDIA GeForce MX150, 15.60", 2.2 kg
análise externo » Lenovo Ideapad 320-15IKBR-80XL03MDSP
Lenovo ThinkPad X280-20KF001HMC: Intel UHD Graphics 620, 12.50", 1.3 kg
análise externo » Lenovo ThinkPad X280-20KF001HMC
Asus FX570UD: NVIDIA GeForce GTX 1050 Mobile, 15.60", 2 kg
análise externo » Asus FX570UD
Acer Swift 5 SF514-52T-82WQ: Intel UHD Graphics 620, 14.00", 1 kg
análise externo » Acer Swift 5 SF514-52T-82WQ
HP Envy 13-ad109ns: NVIDIA GeForce MX150, 13.30", 1.4 kg
análise externo » HP Envy 13-ad109ns
Lenovo ThinkPad T480-20L5000AMC: Intel UHD Graphics 620, 14.00", 1.7 kg
análise externo » Lenovo ThinkPad T480-20L5000AMC
Lenovo Yoga 920 Vibes Edition: Intel UHD Graphics 620, 13.90", 1.4 kg
análise externo » Lenovo Yoga 920 Vibes Edition
Asus FX570: NVIDIA GeForce GTX 1050 Mobile, 15.60", 1.9 kg
análise externo » Asus FX570
HP Spectre x360 13-ae010tu: Intel UHD Graphics 620, 13.30", 1.3 kg
análise externo » HP Spectre x360 13-ae010tu
Lenovo V330-15IKB-81AX00CCUK: Intel UHD Graphics 620, 15.60", 1.8 kg
análise externo » Lenovo V330-15IKB-81AX00CCUK
HP ProBook 450 G5-3KZ00EA: NVIDIA GeForce 930MX, 15.60", 2 kg
análise externo » HP ProBook 450 G5-3KZ00EA
Dell XPS 13 9370 i7 UHD: Intel UHD Graphics 620, 13.30", 1.2 kg
análise externo » Dell XPS 13 9370 i7 UHD
Lenovo ThinkPad X280-20KF001GGE: Intel UHD Graphics 620, 12.50", 1.1 kg
análise externo » Lenovo ThinkPad X280-20KF001GGE
Dell Inspiron 17 5770-0364: AMD Radeon 530, 17.30", 2.7 kg
análise externo » Dell Inspiron 17 5770-0364
Lenovo Yoga 730-15: NVIDIA GeForce GTX 1050 Mobile, 15.60", 1.9 kg
análise externo » Lenovo Yoga 730-15
Acer Spin 5 SP513-52N-862L: Intel UHD Graphics 620, 13.30", 1.5 kg
análise externo » Acer Spin 5 SP513-52N-862L
HP ProBook 470 G5-2TT74UT: NVIDIA GeForce 930MX, 17.30", 2.5 kg
análise externo » HP ProBook 470 G5-2TT74UT
Asus VivoBook Pro 17 N705UD-GC106T: NVIDIA GeForce GTX 1050 Mobile, 17.30", 2.4 kg
análise externo » Asus VivoBook Pro 17 N705UD-GC106T
Asus ZenBook Flip S UX370UA-C4217T: Intel UHD Graphics 620, 13.30", 1.1 kg
análise externo » Asus ZenBook Flip S UX370UA-C4217T
Lenovo ThinkPad X1 Carbon G6-20KG0039GE: Intel UHD Graphics 620, 14.00", 1.1 kg
análise externo » Lenovo ThinkPad X1 Carbon G6-20KG0039GE
Lenovo ThinkPad E480-20KN001NGE: AMD Radeon RX 550 (Laptop), 14.00", 1.8 kg
análise externo » Lenovo ThinkPad E480-20KN001NGE
HP Spectre 13-af033ng: Intel UHD Graphics 620, 13.30", 1.1 kg
análise externo » HP Spectre 13-af033ng
LG Gram 15Z980-A.AAS7U1: Intel UHD Graphics 620, 15.60", 1.1 kg
análise externo » LG Gram 15Z980-A.AAS7U1
Asus ZenBook 13 UX331UN: NVIDIA GeForce MX150, 13.30", 1.1 kg
análise externo » Asus ZenBook 13 UX331UA
Asus ZenBook UX430UN-GV038T: NVIDIA GeForce MX150, 14.00", 1.3 kg
análise externo » Asus ZenBook UX430UN-GV038T
Lenovo ThinkPad X1 Carbon 2018-20KGS03900: Intel UHD Graphics 620, 14.00", 1.1 kg
análise externo » Lenovo ThinkPad X1 Carbon 2018-20KGS03900
Asus ZenBook Flip 14 UX461UN-E1033T: NVIDIA GeForce MX150, 14.00", 1.5 kg
análise externo » Asus ZenBook Flip 14 UX461UN-E1033T
Lenovo Thinkpad X1 Tablet Gen. 3 (2018): Intel UHD Graphics 620, 13.00", 1.3 kg
análise externo » Lenovo Thinkpad X1 Tablet Gen. 3 (2018)
Lenovo ThinkPad X1 Yoga 2018-20LES01W00: Intel UHD Graphics 620, 14.00", 1.4 kg
análise externo » Lenovo ThinkPad X1 Yoga 2018-20LES01W00
Samsung Notebook 9 NP900X5T-X01US : NVIDIA GeForce MX150, 15.00", 1.3 kg
análise externo » Samsung Notebook 9 NP900X5T-X01US
HP Envy x360 15-bp180nz: Intel UHD Graphics 620, 15.60", 2.1 kg
análise externo » HP Envy x360 15-bp180nz
Asus ZenBook Flip 14 UX461UA-E1112T: Intel UHD Graphics 620, 14.00", 1.4 kg
análise externo » Asus ZenBook Flip 14 UX461UA-E1112T
Acer Swift 5 SF514-52T-8673: Intel UHD Graphics 620, 14.00", 1 kg
análise externo » Acer Swift 5 SF514-52T-8673
Acer Nitro 5 Spin NP515-51-81PH: NVIDIA GeForce GTX 1050 Mobile, 15.60", 2.2 kg
análise externo » Acer Nitro 5 Spin NP515-51-81PH
Asus VivoBook S14 S410UN-EB229T: NVIDIA GeForce MX150, 14.00", 1.3 kg
análise externo » Asus VivoBook S14 S410UN-EB229T
Huawei MateBook X Pro, i7: NVIDIA GeForce MX150, 13.90", 1.3 kg
análise externo » Huawei MateBook X Pro, i7
Lenovo Miix 520-12IKB 20M3000LGE: Intel UHD Graphics 620, 12.20", 1.3 kg
análise externo » Lenovo Miix 520-12IKB 20M3000LGE
HP Pavilion 14-ba140ns x360: NVIDIA GeForce 940MX, 14.00", 1.6 kg
análise externo » HP Pavilion 14-ba140ns x360
HP Spectre 13-af030nd: Intel UHD Graphics 620, 13.30", 1.1 kg
análise externo » HP Spectre 13-af030nd
Lenovo Yoga 520-14IKBR-81C8005HMH: Intel UHD Graphics 620, 14.00", 1.7 kg
análise externo » Lenovo Yoga 520-14IKBR-81C8005HMH
Dell Inspiron 15 5570-5441: AMD Radeon 530, 15.60", 2.3 kg
análise externo » Dell Inspiron 15 5570-5441
Lenovo Yoga 920-13IKB-80Y7003MX: Intel UHD Graphics 620, 13.90", 1.4 kg
análise externo » Lenovo Yoga 920-13IKB-80Y7003MX
Medion Erazer P6689-MD60911: NVIDIA GeForce GTX 1050 Mobile, 15.60", 2.4 kg
análise externo » Medion Erazer P6689-MD60911
HP Spectre 13-af008nc : Intel UHD Graphics 620, 13.30", 1.1 kg
análise externo » HP Spectre 13-af008nc
Lenovo Ideapad 520-15IKBR-81BF004GSP: Intel UHD Graphics 620, 15.60", 2.2 kg
análise externo » Lenovo Ideapad 520-15IKBR-81BF004GSP
Samsung Notebook 9 Pro NP940X3N-K01US: Intel UHD Graphics 620, 13.30", 1.3 kg
análise externo » Samsung Notebook 9 Pro NP940X3N-K01US
Asus Zenbook UX430UN: NVIDIA GeForce MX150, 14.00", 1.3 kg
análise externo » Asus Zenbook UX430UN
Dell XPS 13 9370, i7-8550U: Intel UHD Graphics 620, 13.30", 1.2 kg
análise externo » Dell XPS 13 9370, i7-8550U
Dell Inspiron 13 5379-9658: Intel UHD Graphics 620, 13.30", 1.7 kg
análise externo » Dell Inspiron 13 5379-9658
Dell Inspiron 15 5579: Intel UHD Graphics 620, 15.60", 2.1 kg
análise externo » Dell Inspiron 15 5579
Dell Inspiron 13 7373-0866: Intel UHD Graphics 620, 13.30", 1.5 kg
análise externo » Dell Inspiron 13 7373-0866
HP Spectre x360 13-ae041ng: Intel UHD Graphics 620, 13.30", 1.3 kg
análise externo » HP Spectre x360 13-ae041ng
Asus ZenBook 13 UX331UN: NVIDIA GeForce MX150, 13.30", 1.1 kg
análise externo » Asus ZenBook 13 UX331UN
Asus ZenBook Flip S UX370UA-C4184T: Intel UHD Graphics 620, 13.30", 1.1 kg
análise externo » Asus ZenBook Flip S UX370UA-C4184T
Asus ZenBook UX430UA-GV266T: Intel UHD Graphics 620, 14.00", 1.3 kg
análise externo » Asus ZenBook UX430UA-GV266T
Lenovo Yoga 920 13-80Y70066US: Intel UHD Graphics 620, 13.90", 1.4 kg
análise externo » Lenovo Yoga 920 14-80Y70066US
HP Pavilion 15-cc108ng: NVIDIA GeForce 940MX, 15.60", 1.8 kg
análise externo » HP Pavilion 15-cc108ng
Dell Inspiron 17-7773-0043: NVIDIA GeForce MX150, 17.30", 2.9 kg
análise externo » Dell Inspiron 17-7773-0043
HP Envy 17-ae120nd: NVIDIA GeForce MX150, 17.30", 3 kg
análise externo » HP Envy 17-ae120nd
HP Pavilion 15-ck094nd: NVIDIA GeForce MX150, 15.60", 2 kg
análise externo » HP Pavilion 15-ck094nd
HP Spectre 13-Af008Ur: Intel UHD Graphics 620, 13.30", 1.1 kg
análise externo » HP Spectre 13-Af008Ur
HP ProBook 430 G5: Intel UHD Graphics 620, 13.30", 1.4 kg
análise externo » HP ProBook 430 G5
Lenovo Yoga 920-13-80Y70058CK: Intel UHD Graphics 620, 13.90", 1.4 kg
análise externo » Lenovo Yoga 920-13-80Y70058CK
Lenovo Yoga 920-13-80Y7007RMX: Intel UHD Graphics 620, 13.90", 1.4 kg
análise externo » Lenovo Yoga 920-13-80Y7007RMX
HP Envy 13t-1YU00AV: Intel UHD Graphics 620, 13.30", 1.3 kg
análise externo » HP Envy 13t-1YU00AV
Asus ZenBook UX430UA-DH74: Intel UHD Graphics 620, 14.00", 1.3 kg
análise externo » Asus ZenBook UX430UA-DH74
HP Spectre 13-af006nf: Intel UHD Graphics 620, 13.30", 1.1 kg
análise externo » HP Spectre 13-af006nf
Acer Aspire Spin 5 SP515-51GN-82SS: NVIDIA GeForce GTX 1050 Mobile, 15.60", 2.3 kg
análise externo » Acer Aspire Spin 5 SP515-51GN-82SS
Razer Blade Stealth QHD i7-8550U: Intel UHD Graphics 620, 13.30", 1.4 kg
análise externo » Razer Blade Stealth QHD i7-8550U
Acer Aspire 5 A517-51G-80L: NVIDIA GeForce MX150, 17.30", 2.9 kg
análise externo » Acer Aspire 5 A517-51G-80L
HP Spectre x360 15t-bl100: NVIDIA GeForce MX150, 15.60", 2 kg
análise externo » HP Spectre x360 15t-bl100
Lenovo IdeaPad 320-15IKB-81BG000BSB: NVIDIA GeForce MX150, 15.60", 2.2 kg
análise externo » Lenovo IdeaPad 320-15IKB-81BG000BSB
HP ProBook 470 G5: NVIDIA GeForce 930MX, 17.30", 2.5 kg
análise externo » HP ProBook 470 G5
Acer Spin 5 SP513-52N-856S: Intel UHD Graphics 620, 13.30", 1.6 kg
análise externo » Acer Spin 5 SP513-52N-856S
HP Spectre 13-ae006no x360: Intel UHD Graphics 620, 13.30", 1.3 kg
análise externo » HP Spectre 13-ae006no x360
Dell Inspiron 13 7373: Intel UHD Graphics 620, 13.30", 1.5 kg
análise externo » Dell Inspiron 13 7373
Dell XPS 13 9360R MMH8D: Intel UHD Graphics 620, 13.30", 1.2 kg
análise externo » Dell XPS 13 9360R MMH8D
HP Spectre 13-ae001ns x360: Intel UHD Graphics 620, 13.30", 1.3 kg
análise externo » HP Spectre 13-ae001ns x360
Asus VivoBook S15 S510UN, i7 8550U: NVIDIA GeForce MX150, 15.60", 1.7 kg
análise externo » Asus VivoBook S15 S510UN, i7 8550U
HP Spectre 13-af002ng: Intel UHD Graphics 620, 13.30", 1.1 kg
análise externo » HP Spectre 13-af002ng
HP Envy 13-ad142ng: NVIDIA GeForce MX150, 13.30", 1.3 kg
análise externo » HP Envy 13-ad142ng
HP Spectre x360 13-ae010nd: Intel UHD Graphics 620, 13.30", 1.3 kg
análise externo » HP Spectre x360 13-ae010nd
Dell XPS 13 9360 CNX93R02: Intel UHD Graphics 620, 13.30", 1.2 kg
análise externo » Dell XPS 13 9360 CNX93R02
Dell XPS 13 9360-5563: Intel UHD Graphics 620, 13.30", 1.3 kg
análise externo » Dell XPS 13 9360-5563
Acer Swift 3 SF314-52G-89SL: NVIDIA GeForce MX150, 14.00", 1.6 kg
análise externo » Acer Swift 3 SF314-52G-89SL
Asus ZenBook 3 Deluxe UX490UAR-BE087T: Intel UHD Graphics 620, 14.00", 1.2 kg
análise externo » Asus ZenBook 3 Deluxe UX490UAR-BE087T
Dell XPS 13 i7-8550U: Intel UHD Graphics 620, 13.30", 1.3 kg
análise externo » Dell XPS 13 i7-8550U
Lenovo Ideapad 720-81C70002RK: AMD Radeon RX 560 (Laptop), 15.60", 2.1 kg
análise externo » Lenovo Ideapad 720-81C70002RK
Dell Xps 13 9360-9962: Intel UHD Graphics 620, 13.30", 1.2 kg
análise externo » Dell Xps 13 9360-9962
Xiaomi Mi Notebook Pro i7: NVIDIA GeForce MX150, 15.60", 2 kg
análise externo » Xiaomi Mi Notebook Pro i7
Dell Inspiron 15 7570: NVIDIA GeForce 940MX, 15.60", 2 kg
análise externo » Dell Inspiron 15-7570
Lenovo Yoga 920-13IKB-80Y7: Intel UHD Graphics 620, 13.90", 1.4 kg
análise externo » Lenovo Yoga 920-13IKB-80Y7
Lenovo Yoga 920-13IKB-80Y70035GE: Intel UHD Graphics 620, 13.90", 1.4 kg
análise externo » Lenovo Yoga 920-13IKB-80Y70035GE
Acer Nitro 5 Spin: NVIDIA GeForce GTX 1050 Mobile, 15.60", 2.2 kg
análise externo » Acer Nitro 5 Spin
Acer Switch 7 BE SW713-51GNP: NVIDIA GeForce MX150, 13.50", 1.6 kg
análise externo » Acer Switch 7 BE SW713-51GNP
Asus ZenBook 13 UX331UN: NVIDIA GeForce MX150, 13.50", 1.1 kg
análise externo » Asus ZenBook 13 UX331UN
Acer Switch 7 Black Edition: NVIDIA GeForce MX150, 13.50", 1.6 kg
análise externo » Acer Switch 7 Black Edition
Asus ZenBook Flip 14 UX461UN: NVIDIA GeForce MX150, 14.00", 1.5 kg
análise externo » Asus ZenBook Flip 14 UX461UN
Lenovo Yoga 730-13IKB: Intel UHD Graphics 620, 13.30", 1.2 kg
» YouTuber instala un teclado mecánico en su portátil Lenovo de 13 pulgadas después de que el original fallara dos veces