Breve análisis del convertible Panasonic Toughbook CF-33 (i5-7200U, QHD)
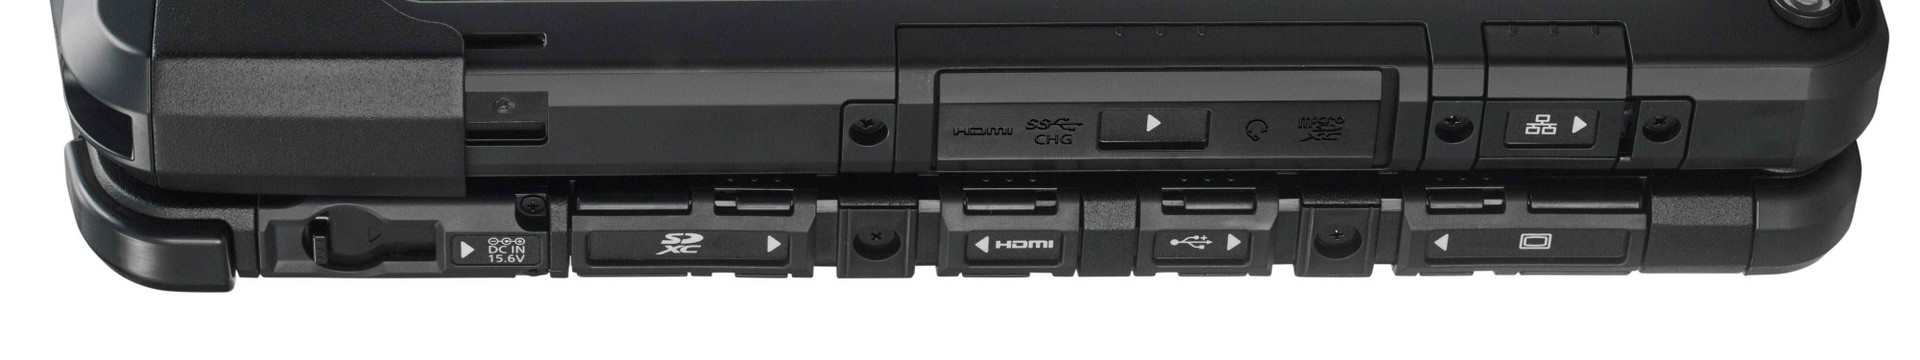
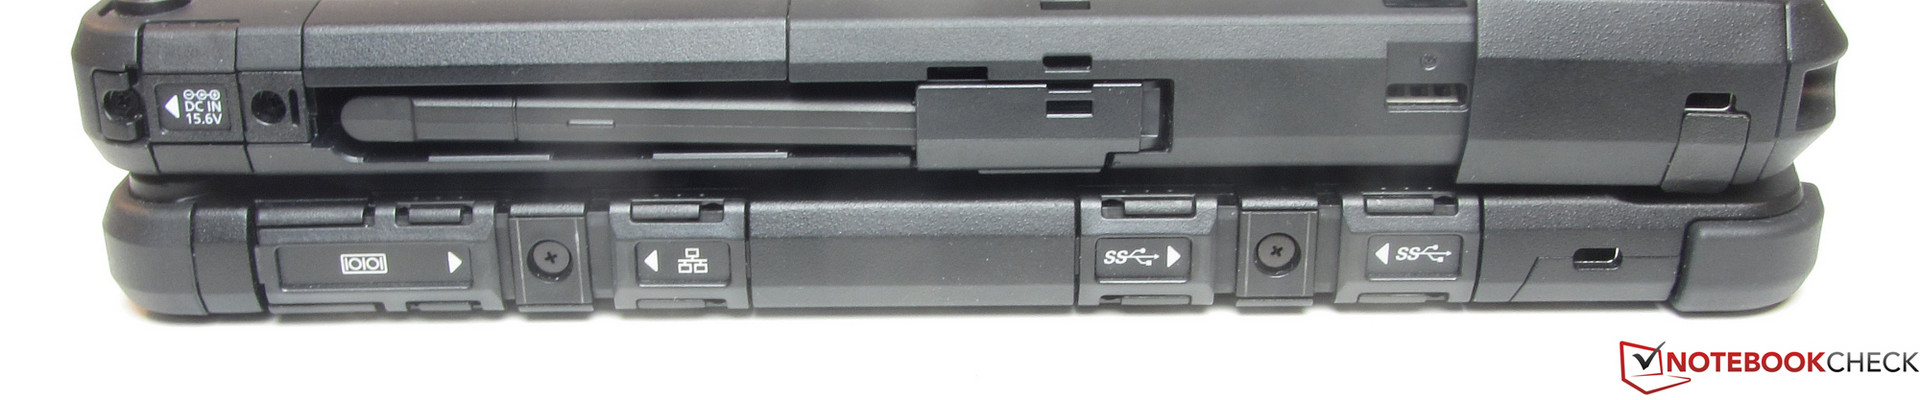
Connections
| SD Card Reader | |
| average JPG Copy Test (av. of 3 runs) | |
| Dell Latitude 14 Rugged 5414 (Toshiba Exceria Pro SDXC 64 GB UHS-II) | |
| Dell Latitude 14 7414 Rugged Extreme (Toshiba Exceria Pro SDXC 64 GB UHS-II) | |
| Panasonic Toughbook CF-33 (Toshiba Exceria Pro SDXC 64 GB UHS-II) | |
| maximum AS SSD Seq Read Test (1GB) | |
| Dell Latitude 14 7414 Rugged Extreme (Toshiba Exceria Pro SDXC 64 GB UHS-II) | |
| Dell Latitude 14 Rugged 5414 (Toshiba Exceria Pro SDXC 64 GB UHS-II) | |
| Panasonic Toughbook CF-33 (Toshiba Exceria Pro SDXC 64 GB UHS-II) | |
| Bullman Dirtbook S12 Touch | |
| |||||||||||||||||||||||||
iluminación: 89 %
Brillo con batería: 571 cd/m²
Contraste: 5191:1 (Negro: 0.11 cd/m²)
ΔE ColorChecker Calman: 22.7 | ∀{0.5-29.43 Ø4.71}
ΔE Greyscale Calman: 13.6 | ∀{0.09-98 Ø4.96}
67.02% sRGB (Argyll 1.6.3 3D)
42.5% AdobeRGB 1998 (Argyll 1.6.3 3D)
45.71% AdobeRGB 1998 (Argyll 3D)
66.7% sRGB (Argyll 3D)
44.24% Display P3 (Argyll 3D)
Gamma: 5.51
CCT: 6998 K
| Panasonic Toughbook CF-33 IPS, 2160x1440, 12" | Dell Latitude 14 7414 Rugged Extreme IPS, 1366x768, 14" | Dell Latitude 14 Rugged 5414 IPS, 1920x1080, 14" | Bullman Dirtbook S12 Touch IPS, 1280x800, 12.1" | |
|---|---|---|---|---|
| Display | -16% | -16% | -20% | |
| Display P3 Coverage (%) | 44.24 | 37.22 -16% | 37.23 -16% | 35.53 -20% |
| sRGB Coverage (%) | 66.7 | 55.8 -16% | 55.2 -17% | 53.2 -20% |
| AdobeRGB 1998 Coverage (%) | 45.71 | 38.49 -16% | 38.48 -16% | 36.71 -20% |
| Response Times | -18% | -44% | ||
| Response Time Grey 50% / Grey 80% * (ms) | 30 ? | 43 ? -43% | 49 ? -63% | |
| Response Time Black / White * (ms) | 29 ? | 27 ? 7% | 36 ? -24% | |
| PWM Frequency (Hz) | 685 | 200 ? | 198 ? | |
| Screen | -42% | -67% | -37% | |
| Brightness middle (cd/m²) | 571 | 493 -14% | 1152 102% | 310 -46% |
| Brightness (cd/m²) | 555 | 456 -18% | 1067 92% | 285 -49% |
| Brightness Distribution (%) | 89 | 81 -9% | 86 -3% | 85 -4% |
| Black Level * (cd/m²) | 0.11 | 0.53 -382% | 1.08 -882% | 0.38 -245% |
| Contrast (:1) | 5191 | 930 -82% | 1067 -79% | 816 -84% |
| Colorchecker dE 2000 * | 22.7 | 11.08 51% | 10.04 56% | 5.81 74% |
| Colorchecker dE 2000 max. * | 34.14 | 15.11 56% | 19.43 43% | |
| Greyscale dE 2000 * | 13.6 | 11.99 12% | 10.47 23% | 4.68 66% |
| Gamma | 5.51 40% | 4.03 55% | 2.42 91% | 2.44 90% |
| CCT | 6998 93% | 10872 60% | 5576 117% | 5764 113% |
| Color Space (Percent of AdobeRGB 1998) (%) | 42.5 | 36 -15% | 35 -18% | 33.7 -21% |
| Color Space (Percent of sRGB) (%) | 67.02 | 56 -16% | 63 -6% | 53 -21% |
| Media total (Programa/Opciones) | -25% /
-33% | -42% /
-54% | -29% /
-33% |
* ... más pequeño es mejor
Parpadeo de Pantalla / PWM (Pulse-Width Modulation)
| Parpadeo de Pantalla / PWM detectado | 685 Hz | 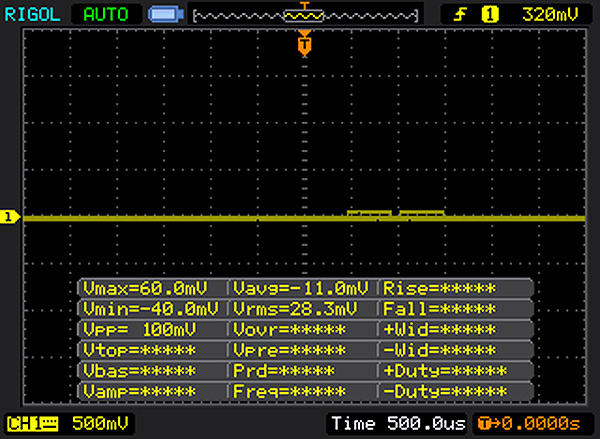 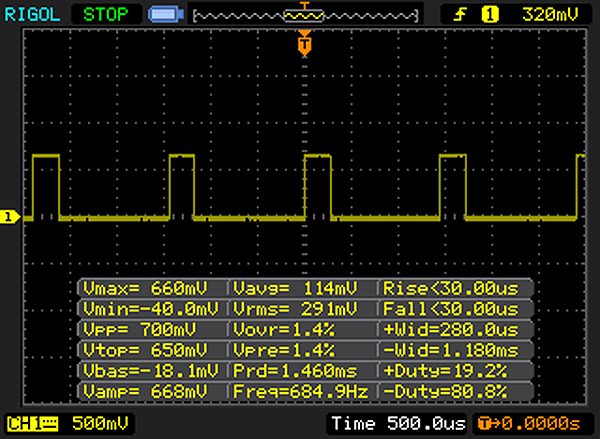 | |
La retroiluminación del display parpadea a 685 Hz (seguramente usa PWM - Pulse-Width Modulation) . La frecuencia de 685 Hz es bastante alta, por lo que la mayoría de gente sensible al parpadeo no debería ver parpadeo o tener fatiga visual. Comparación: 52 % de todos los dispositivos testados no usaron PWM para atenuar el display. Si se usó, medimos una media de 7754 (mínimo: 5 - máxmo: 343500) Hz. | |||
Tiempos de respuesta del display
| ↔ Tiempo de respuesta de Negro a Blanco | ||
|---|---|---|
| 29 ms ... subida ↗ y bajada ↘ combinada | ↗ 11 ms subida | 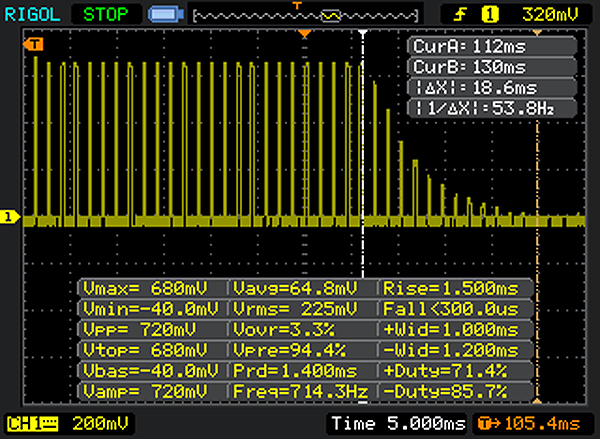 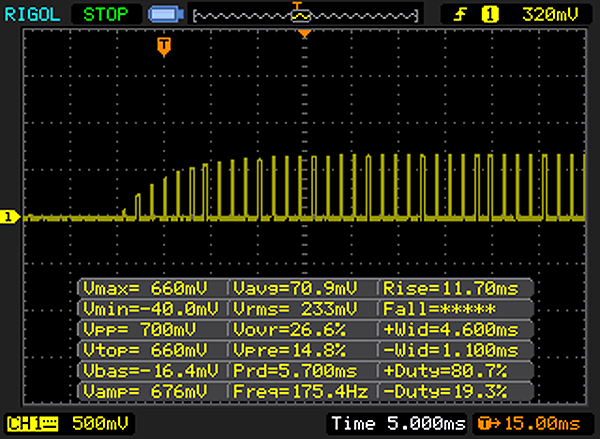 |
| ↘ 18 ms bajada | ||
| La pantalla mostró tiempos de respuesta relativamente lentos en nuestros tests pero podría ser demasiado lenta para los jugones. En comparación, todos los dispositivos de prueba van de ##min### (mínimo) a 240 (máximo) ms. » 77 % de todos los dispositivos son mejores. Eso quiere decir que el tiempo de respuesta es peor que la media (19.8 ms) de todos los dispositivos testados. | ||
| ↔ Tiempo de respuesta 50% Gris a 80% Gris | ||
| 30 ms ... subida ↗ y bajada ↘ combinada | ↗ 11 ms subida | 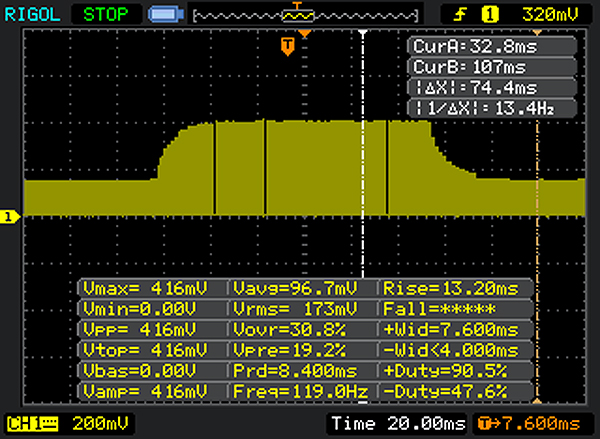 |
| ↘ 19 ms bajada | ||
| La pantalla mostró tiempos de respuesta lentos en nuestros tests y podría ser demasiado lenta para los jugones. En comparación, todos los dispositivos de prueba van de ##min### (mínimo) a 636 (máximo) ms. » 40 % de todos los dispositivos son mejores. Eso quiere decir que el tiempo de respuesta es similar al dispositivo testado medio (31 ms). | ||
| Cinebench R15 | |
| CPU Single 64Bit | |
| Panasonic Toughbook CF-33 | |
| Dell Latitude 14 Rugged 5414 | |
| Dell Latitude 14 7414 Rugged Extreme | |
| Bullman Dirtbook S12 Touch | |
| CPU Multi 64Bit | |
| Panasonic Toughbook CF-33 | |
| Dell Latitude 14 7414 Rugged Extreme | |
| Dell Latitude 14 Rugged 5414 | |
| Bullman Dirtbook S12 Touch | |
| Cinebench R10 | |
| Rendering Multiple CPUs 32Bit | |
| Panasonic Toughbook CF-33 | |
| Dell Latitude 14 7414 Rugged Extreme | |
| Dell Latitude 14 Rugged 5414 | |
| Bullman Dirtbook S12 Touch | |
| Rendering Single 32Bit | |
| Panasonic Toughbook CF-33 | |
| Dell Latitude 14 Rugged 5414 | |
| Dell Latitude 14 7414 Rugged Extreme | |
| Bullman Dirtbook S12 Touch | |
| Geekbench 3 | |
| 32 Bit Multi-Core Score | |
| Panasonic Toughbook CF-33 | |
| Dell Latitude 14 7414 Rugged Extreme | |
| Dell Latitude 14 Rugged 5414 | |
| Bullman Dirtbook S12 Touch | |
| 32 Bit Single-Core Score | |
| Panasonic Toughbook CF-33 | |
| Dell Latitude 14 7414 Rugged Extreme | |
| Dell Latitude 14 Rugged 5414 | |
| Bullman Dirtbook S12 Touch | |
| Geekbench 4.0 | |
| 64 Bit Multi-Core Score | |
| Panasonic Toughbook CF-33 | |
| Dell Latitude 14 7414 Rugged Extreme | |
| Dell Latitude 14 Rugged 5414 | |
| 64 Bit Single-Core Score | |
| Panasonic Toughbook CF-33 | |
| Dell Latitude 14 Rugged 5414 | |
| Dell Latitude 14 7414 Rugged Extreme | |
| Geekbench 4.4 | |
| 64 Bit Multi-Core Score | |
| Panasonic Toughbook CF-33 | |
| Dell Latitude 14 7414 Rugged Extreme | |
| 64 Bit Single-Core Score | |
| Panasonic Toughbook CF-33 | |
| Dell Latitude 14 7414 Rugged Extreme | |
| JetStream 1.1 - 1.1 Total | |
| Panasonic Toughbook CF-33 (Edge 41) | |
| Dell Latitude 14 Rugged 5414 (Edge 38) | |
| Dell Latitude 14 7414 Rugged Extreme (Edge 40) | |
| PCMark 8 Home Score Accelerated v2 | 3518 puntos | |
| PCMark 8 Creative Score Accelerated v2 | 4671 puntos | |
| PCMark 8 Work Score Accelerated v2 | 4495 puntos | |
| PCMark 10 Score | 3329 puntos | |
ayuda | ||
| PCMark 8 | |
| Home Score Accelerated v2 | |
| Dell Latitude 14 7414 Rugged Extreme | |
| Panasonic Toughbook CF-33 | |
| Dell Latitude 14 Rugged 5414 | |
| Bullman Dirtbook S12 Touch | |
| Work Score Accelerated v2 | |
| Dell Latitude 14 Rugged 5414 | |
| Panasonic Toughbook CF-33 | |
| Bullman Dirtbook S12 Touch | |

| Panasonic Toughbook CF-33 Toshiba SG5 256GB THNSNK256GVN8 | Dell Latitude 14 7414 Rugged Extreme Liteonit CV3-8D128 | Dell Latitude 14 Rugged 5414 Liteonit CV3-8D128 | Bullman Dirtbook S12 Touch Samsung SSD 850 EVO 250GB | |
|---|---|---|---|---|
| CrystalDiskMark 3.0 | -19% | -12% | -9% | |
| Read Seq (MB/s) | 470 | 474.3 1% | 487.7 4% | 278.3 -41% |
| Write Seq (MB/s) | 264.2 | 207.4 -21% | 316.7 20% | 267 1% |
| Read 512 (MB/s) | 403.2 | 265.2 -34% | 351 -13% | 267.3 -34% |
| Write 512 (MB/s) | 265.5 | 167.2 -37% | 185.8 -30% | 264.2 0% |
| Read 4k (MB/s) | 25.11 | 26.98 7% | 27.72 10% | 39.21 56% |
| Write 4k (MB/s) | 93.2 | 60.1 -36% | 62.5 -33% | 79.4 -15% |
| Read 4k QD32 (MB/s) | 384.7 | 304.5 -21% | 267.8 -30% | 214.7 -44% |
| Write 4k QD32 (MB/s) | 200.9 | 176.1 -12% | 158.2 -21% | 205.5 2% |
| 3DMark 11 Performance | 1733 puntos | |
| 3DMark Cloud Gate Standard Score | 6511 puntos | |
| 3DMark Fire Strike Score | 930 puntos | |
ayuda | ||
| 3DMark 11 - 1280x720 Performance GPU | |
| Dell Latitude 14 Rugged 5414 | |
| Panasonic Toughbook CF-33 | |
| Dell Latitude 14 7414 Rugged Extreme | |
| Bullman Dirtbook S12 Touch | |
| bajo | medio | alto | ultra | |
|---|---|---|---|---|
| BioShock Infinite (2013) | 45.2 | 29.6 | 25.4 | 8.9 |
Ruido
| Ocioso |
| 30.3 / 30.3 / 30.5 dB(A) |
| Carga |
| 30.5 / 36.6 dB(A) |
 | ||
30 dB silencioso 40 dB(A) audible 50 dB(A) ruidosamente alto |
||
min: | ||
(+) La temperatura máxima en la parte superior es de 35.1 °C / 95 F, frente a la media de 35.4 °C / 96 F, que oscila entre 19.6 y 60 °C para la clase Convertible.
(+) El fondo se calienta hasta un máximo de 30.9 °C / 88 F, frente a la media de 36.9 °C / 98 F
(+) En reposo, la temperatura media de la parte superior es de 24.8 °C / 77# F, frente a la media del dispositivo de 30.3 °C / 87 F.
(+) El reposamanos y el panel táctil están a una temperatura inferior a la de la piel, con un máximo de 29.3 °C / 84.7 F y, por tanto, son fríos al tacto.
(±) La temperatura media de la zona del reposamanos de dispositivos similares fue de 28 °C / 82.4 F (-1.3 °C / -2.3 F).
Panasonic Toughbook CF-33 análisis de audio
(-) | altavoces no muy altos (#69.5 dB)
Graves 100 - 315 Hz
(-) | casi sin bajos - de media 30.4% inferior a la mediana
(+) | el bajo es lineal (5.4% delta a la frecuencia anterior)
Medios 400 - 2000 Hz
(±) | medias más altas - de media 7% más altas que la mediana
(±) | la linealidad de los medios es media (11.8% delta respecto a la frecuencia anterior)
Altos 2 - 16 kHz
(+) | máximos equilibrados - a sólo 4.4% de la mediana
(+) | los máximos son lineales (4.2% delta a la frecuencia anterior)
Total 100 - 16.000 Hz
(-) | el sonido global no es lineal (31.3% de diferencia con la mediana)
En comparación con la misma clase
» 90% de todos los dispositivos probados de esta clase eran mejores, 3% similares, 7% peores
» El mejor tuvo un delta de 6%, la media fue 20%, el peor fue ###max##%
En comparación con todos los dispositivos probados
» 90% de todos los dispositivos probados eran mejores, 2% similares, 8% peores
» El mejor tuvo un delta de 4%, la media fue 23%, el peor fue ###max##%
Apple MacBook 12 (Early 2016) 1.1 GHz análisis de audio
(+) | los altavoces pueden reproducir a un volumen relativamente alto (#83.6 dB)
Graves 100 - 315 Hz
(±) | lubina reducida - en promedio 11.3% inferior a la mediana
(±) | la linealidad de los graves es media (14.2% delta a frecuencia anterior)
Medios 400 - 2000 Hz
(+) | medios equilibrados - a sólo 2.4% de la mediana
(+) | los medios son lineales (5.5% delta a la frecuencia anterior)
Altos 2 - 16 kHz
(+) | máximos equilibrados - a sólo 2% de la mediana
(+) | los máximos son lineales (4.5% delta a la frecuencia anterior)
Total 100 - 16.000 Hz
(+) | el sonido global es lineal (10.2% de diferencia con la mediana)
En comparación con la misma clase
» 7% de todos los dispositivos probados de esta clase eran mejores, 2% similares, 90% peores
» El mejor tuvo un delta de 5%, la media fue 18%, el peor fue ###max##%
En comparación con todos los dispositivos probados
» 5% de todos los dispositivos probados eran mejores, 1% similares, 94% peores
» El mejor tuvo un delta de 4%, la media fue 23%, el peor fue ###max##%
| Off / Standby | |
| Ocioso | |
| Carga |
|
Clave:
min: | |
| Battery Runtime - WiFi Websurfing | |
| Dell Latitude 14 7414 Rugged Extreme | |
| Dell Latitude 14 Rugged 5414 | |
| Panasonic Toughbook CF-33 | |
| Bullman Dirtbook S12 Touch | |
Pro
Contra
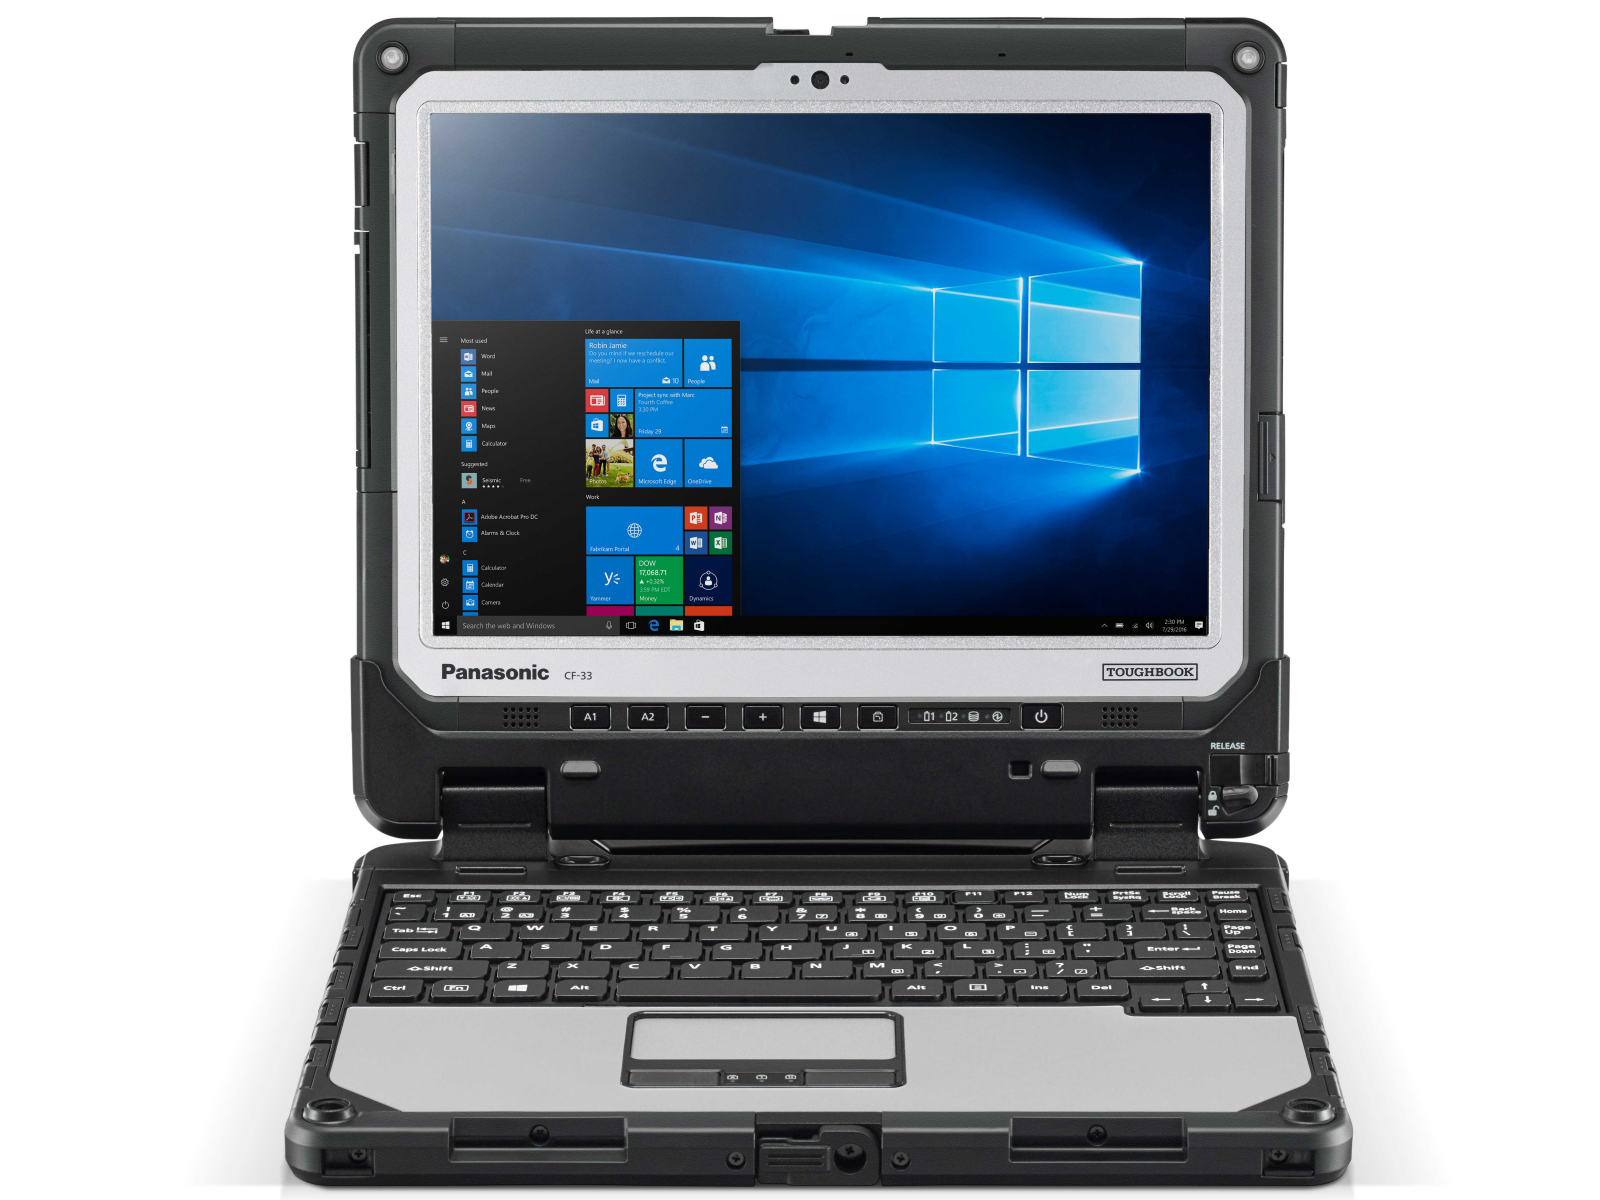
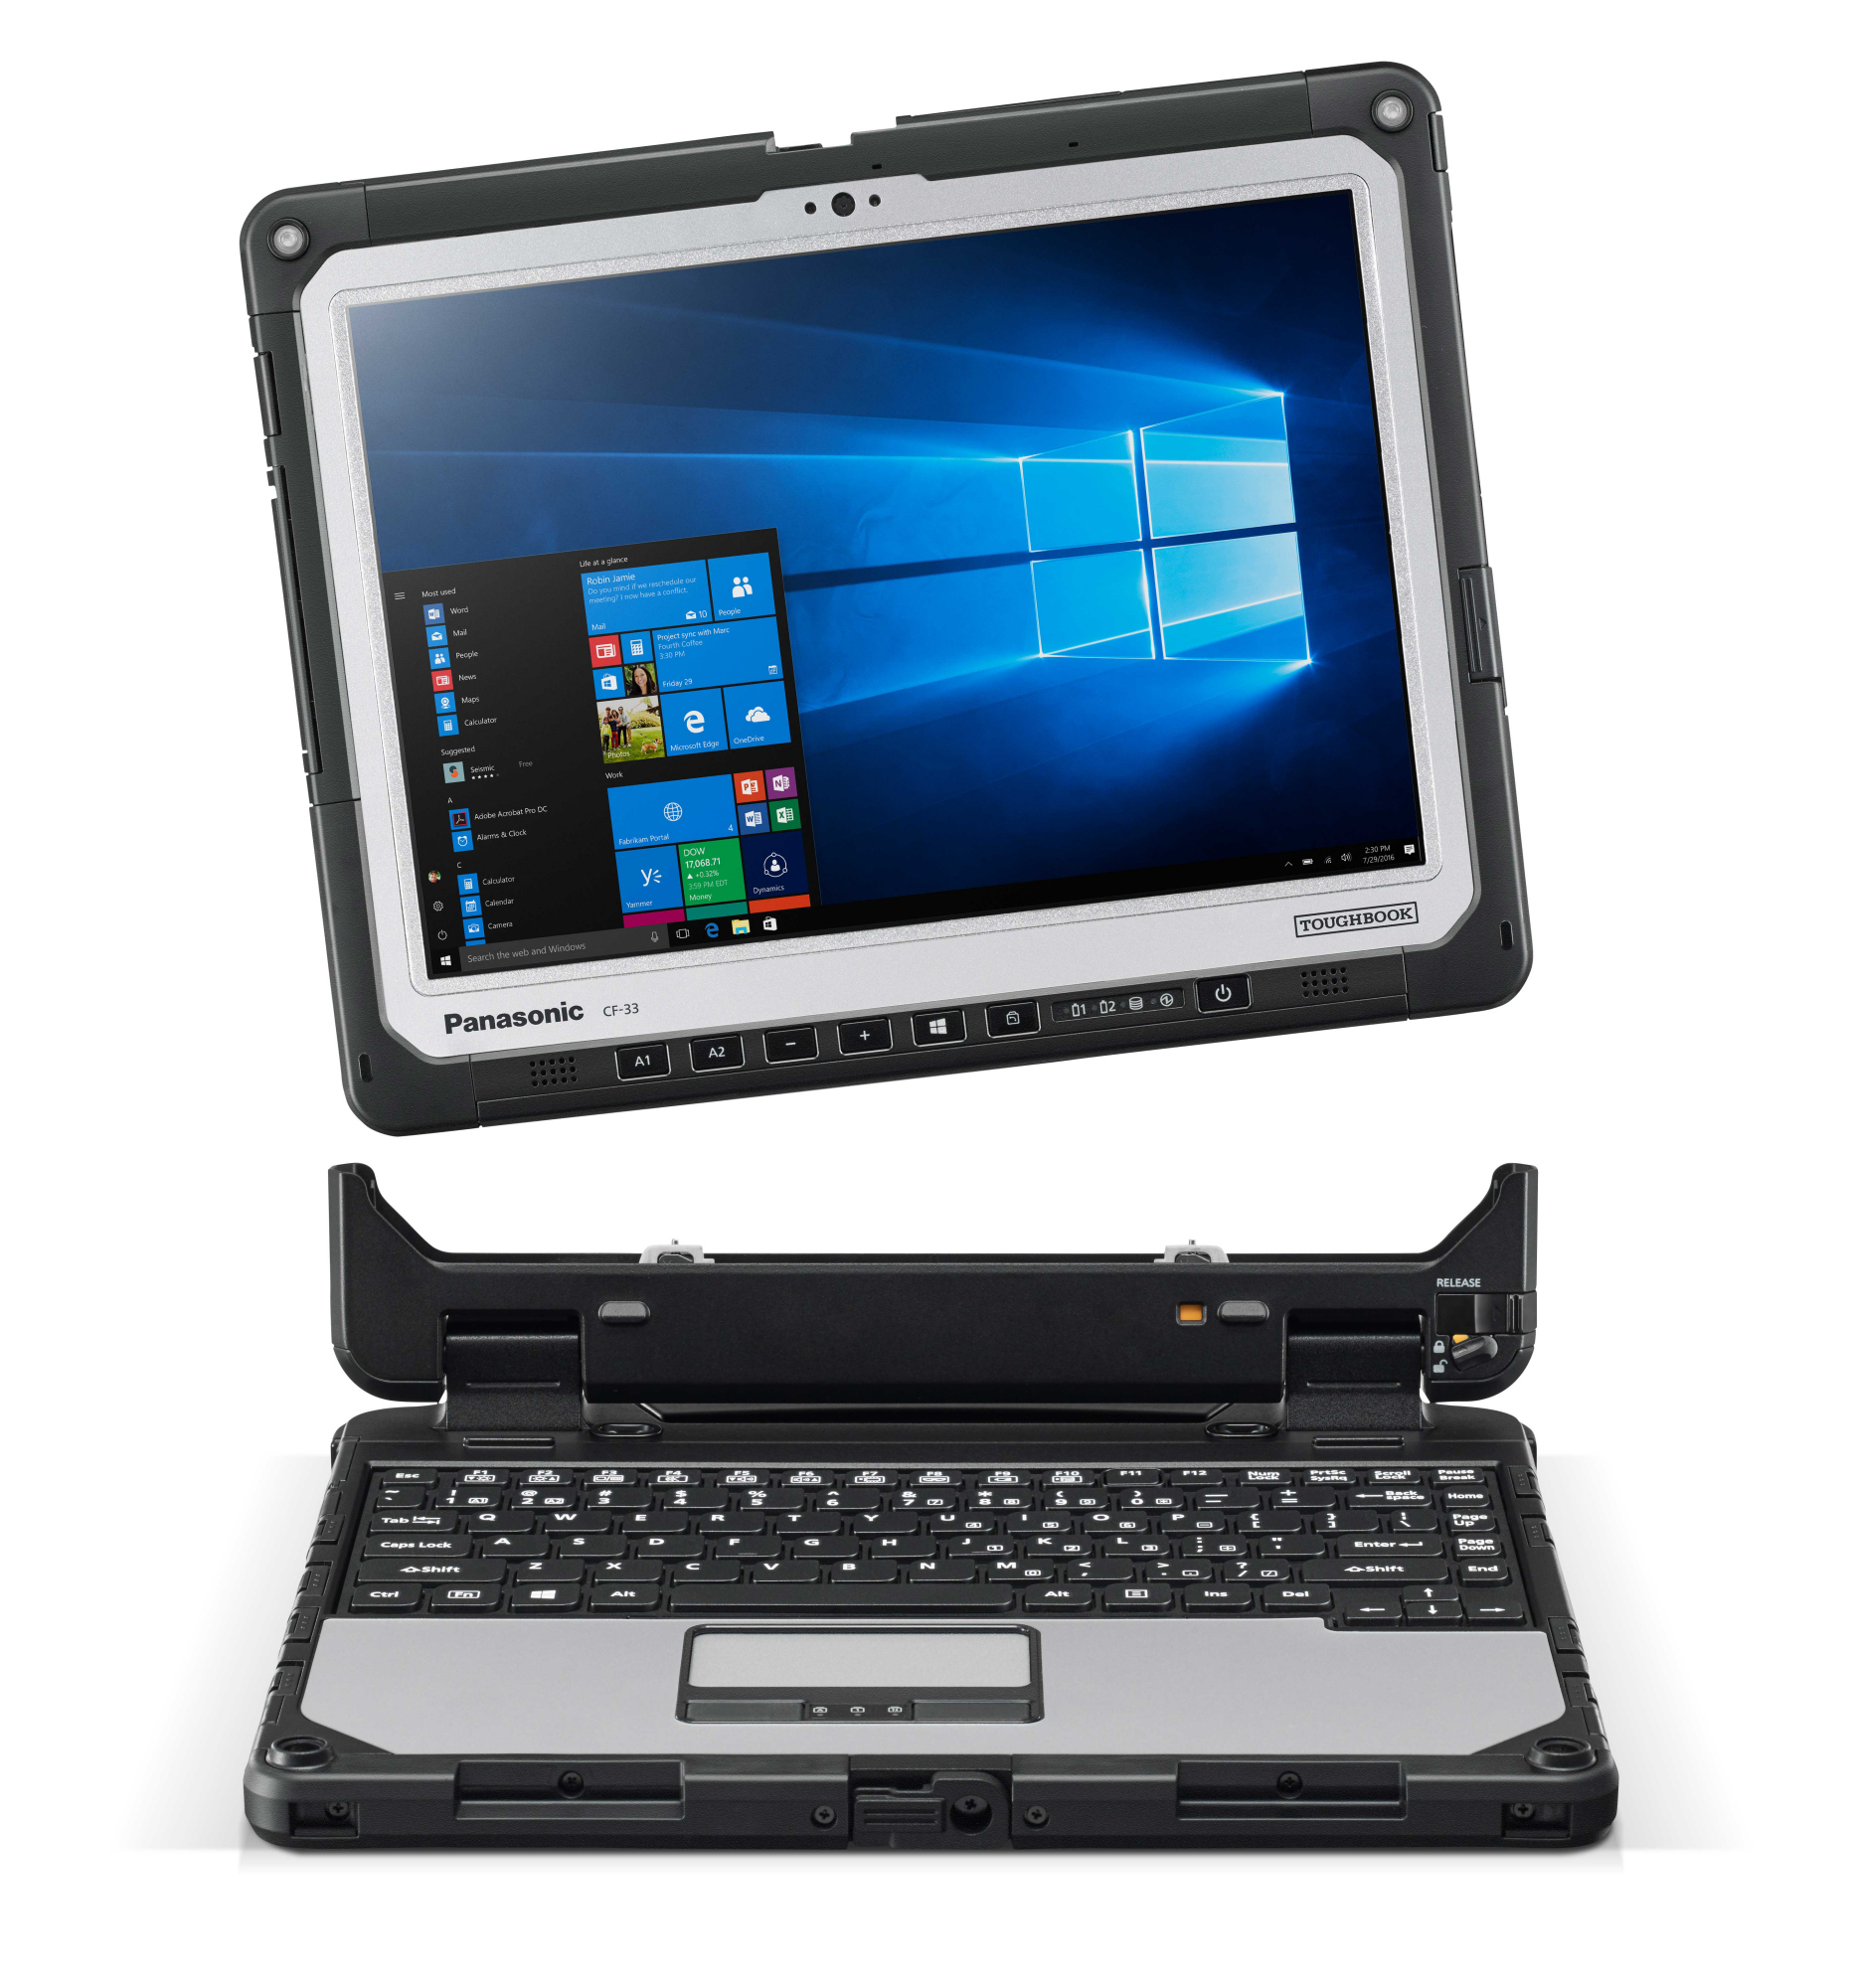
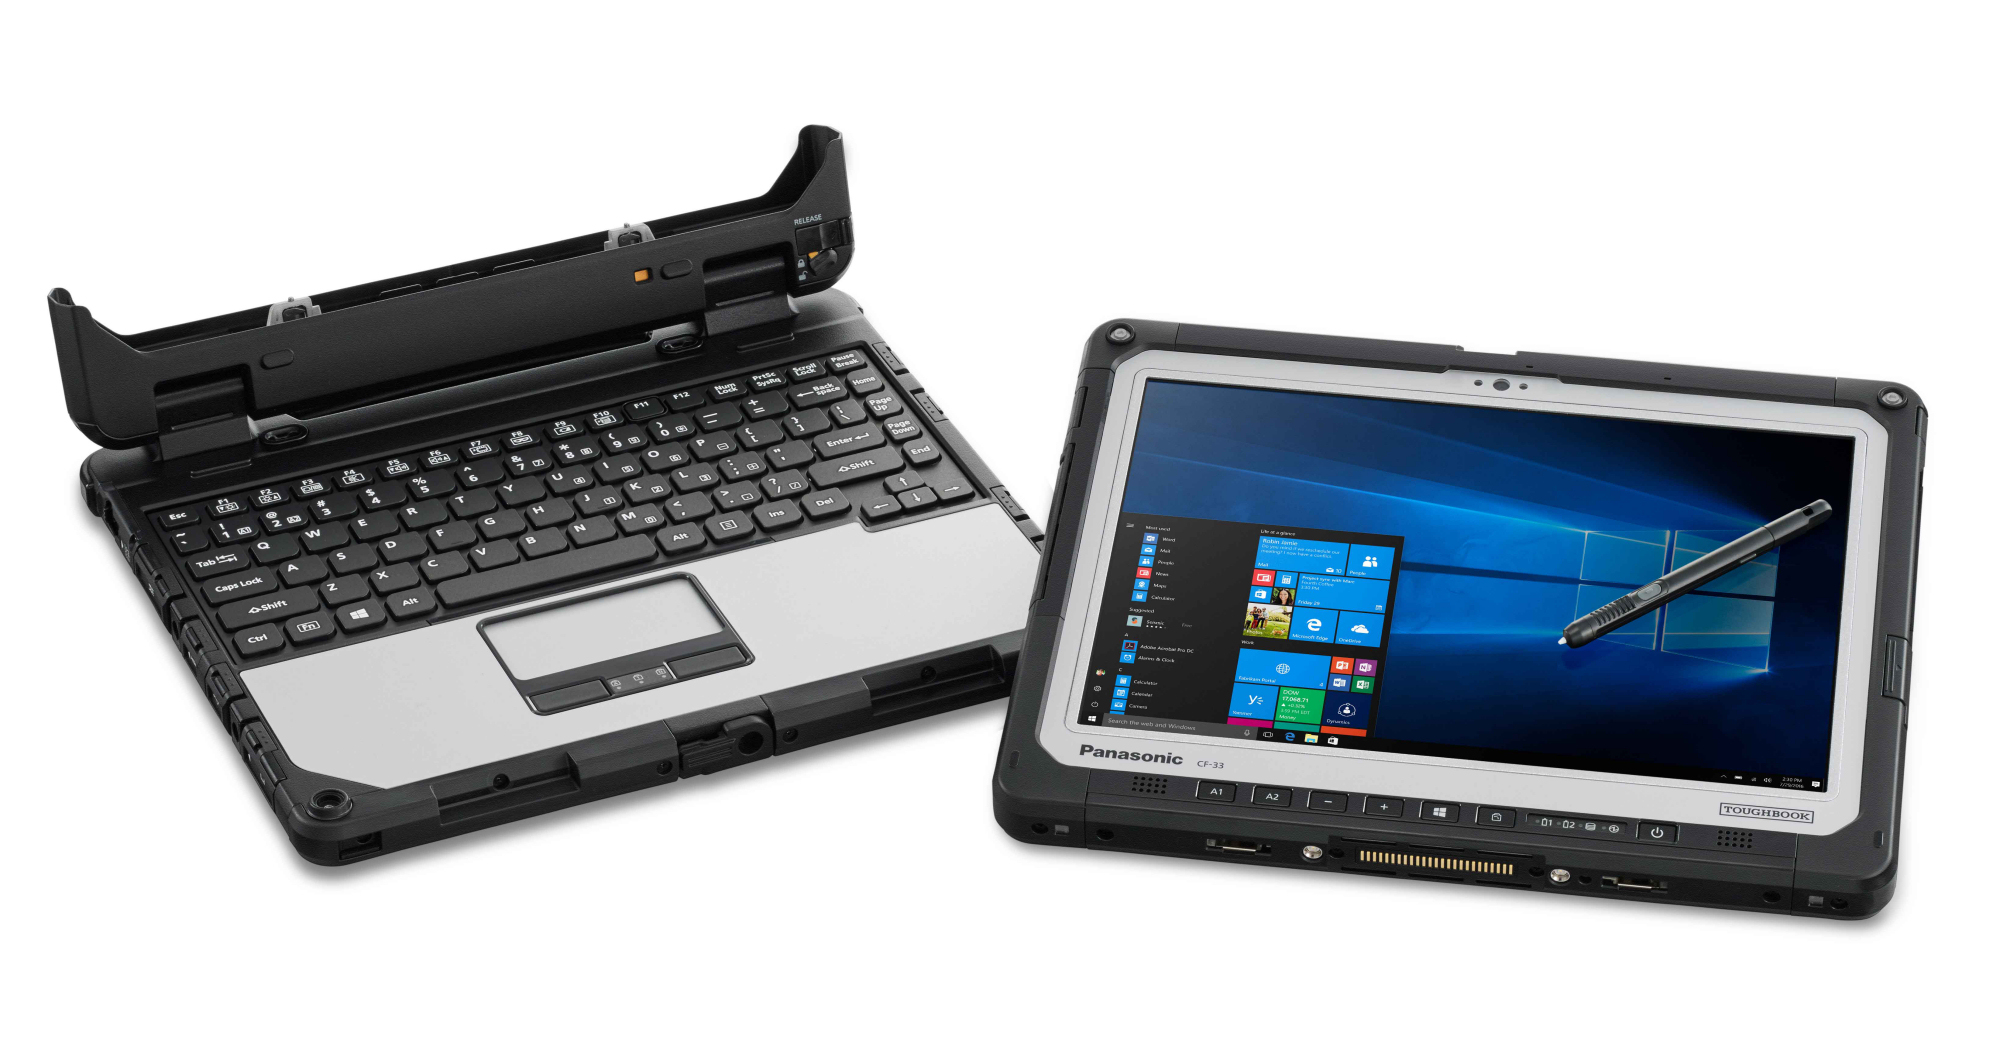
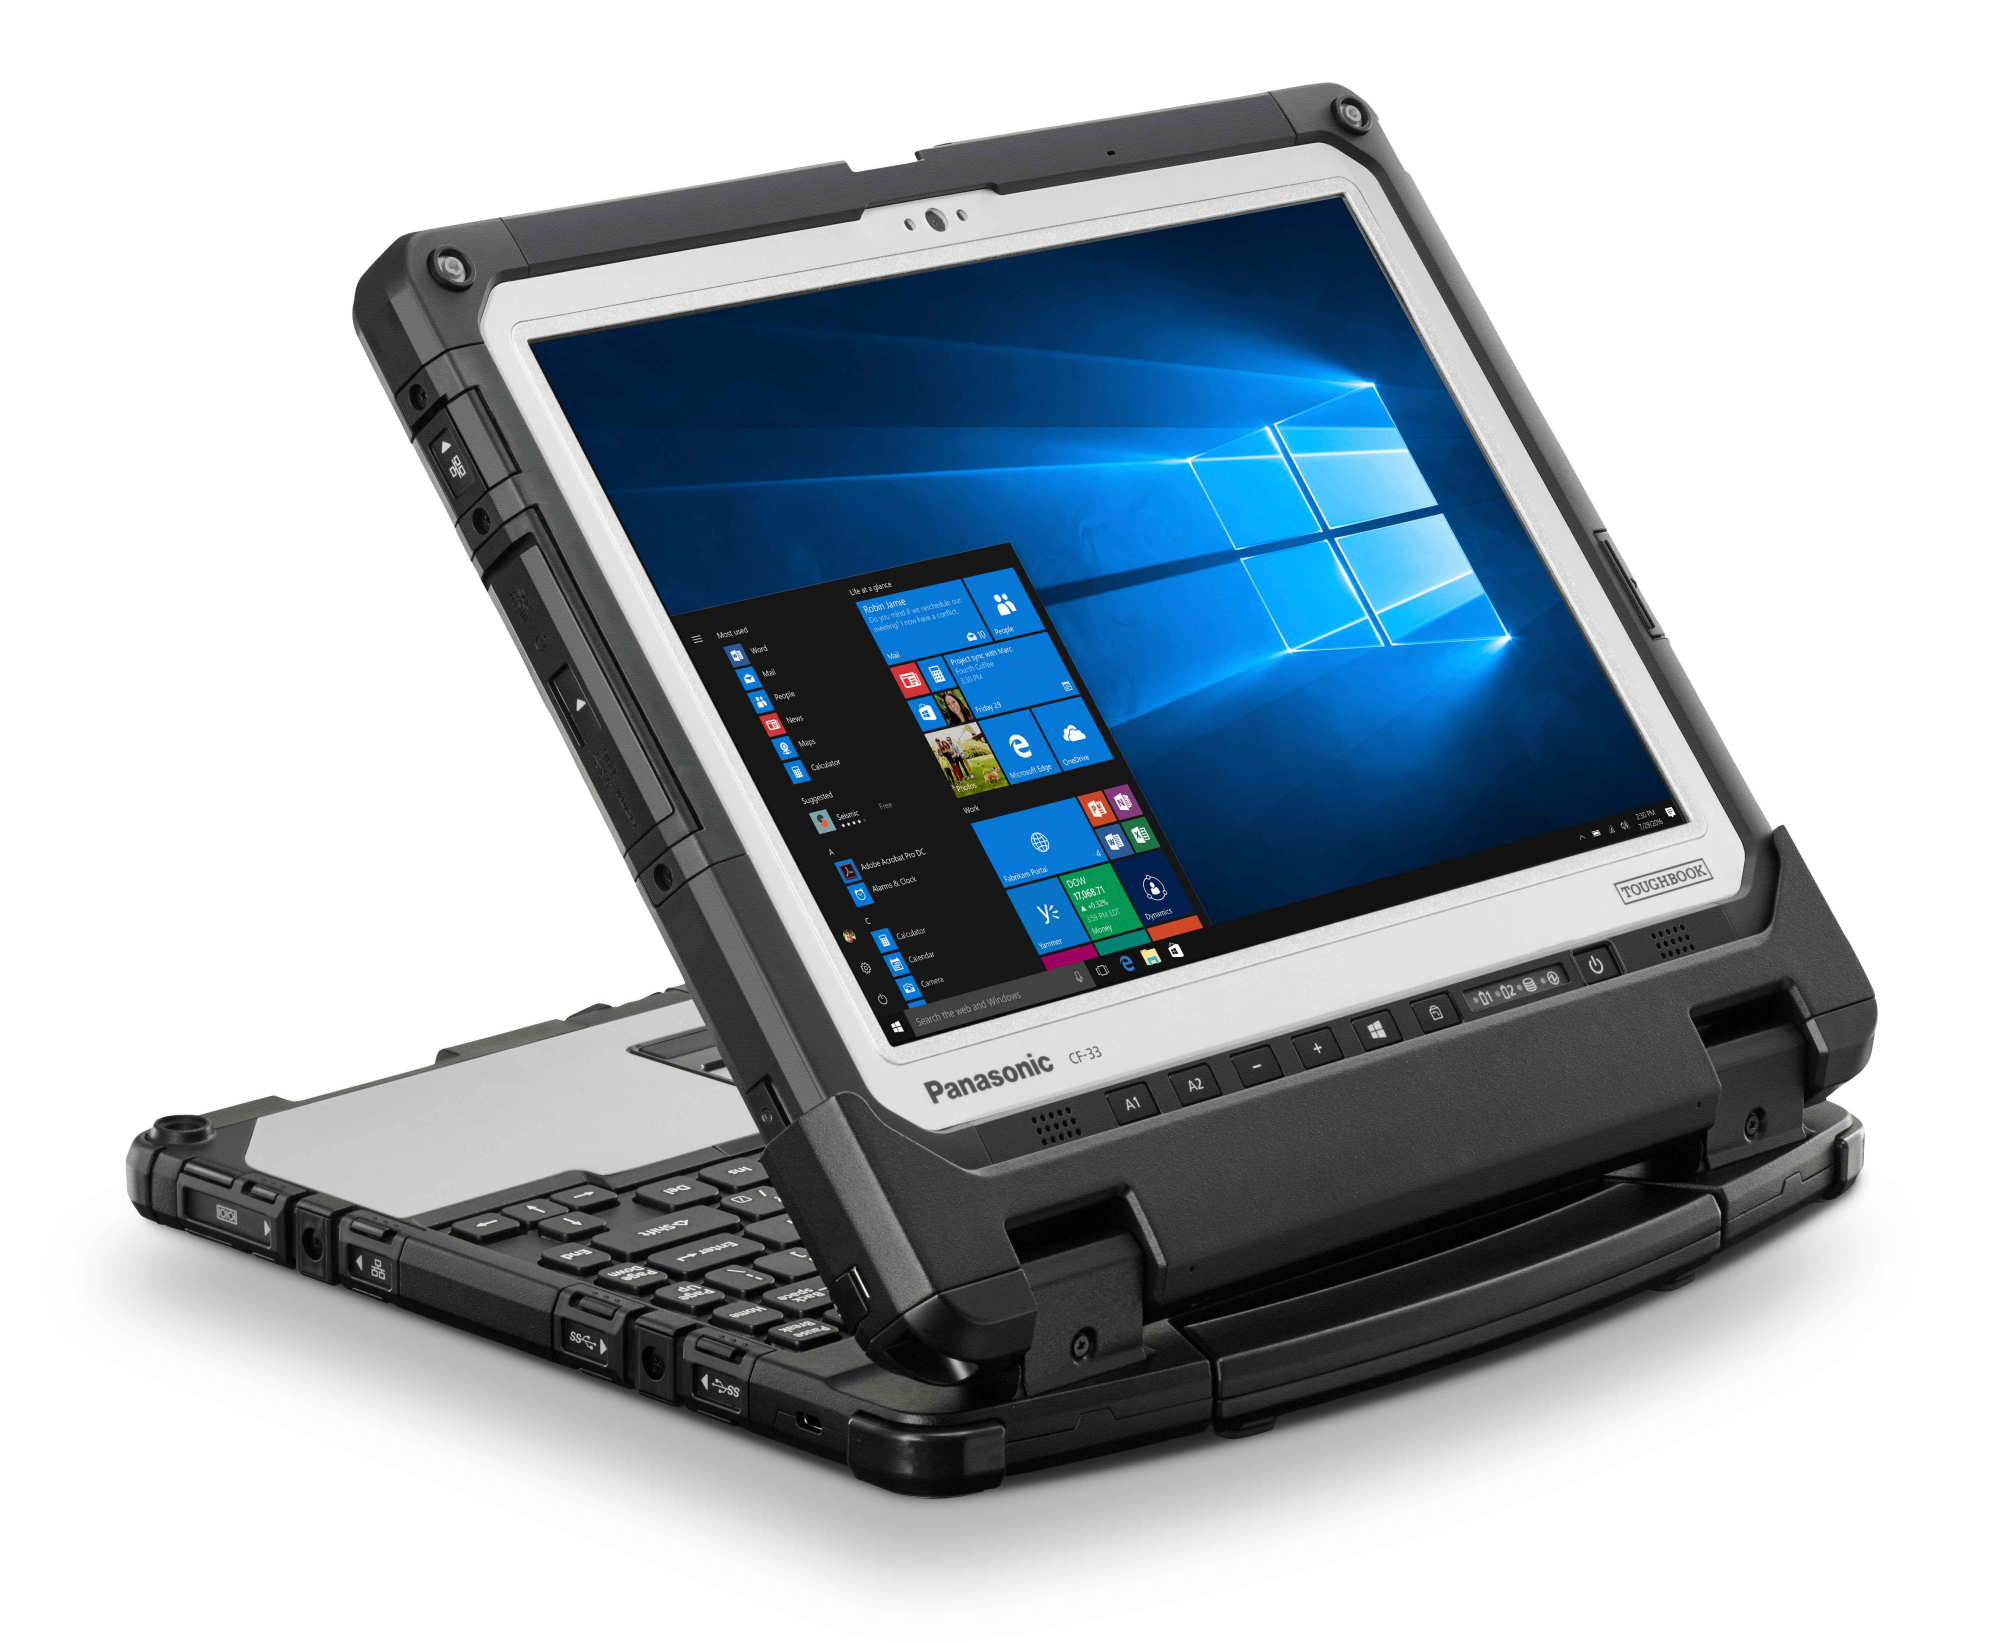
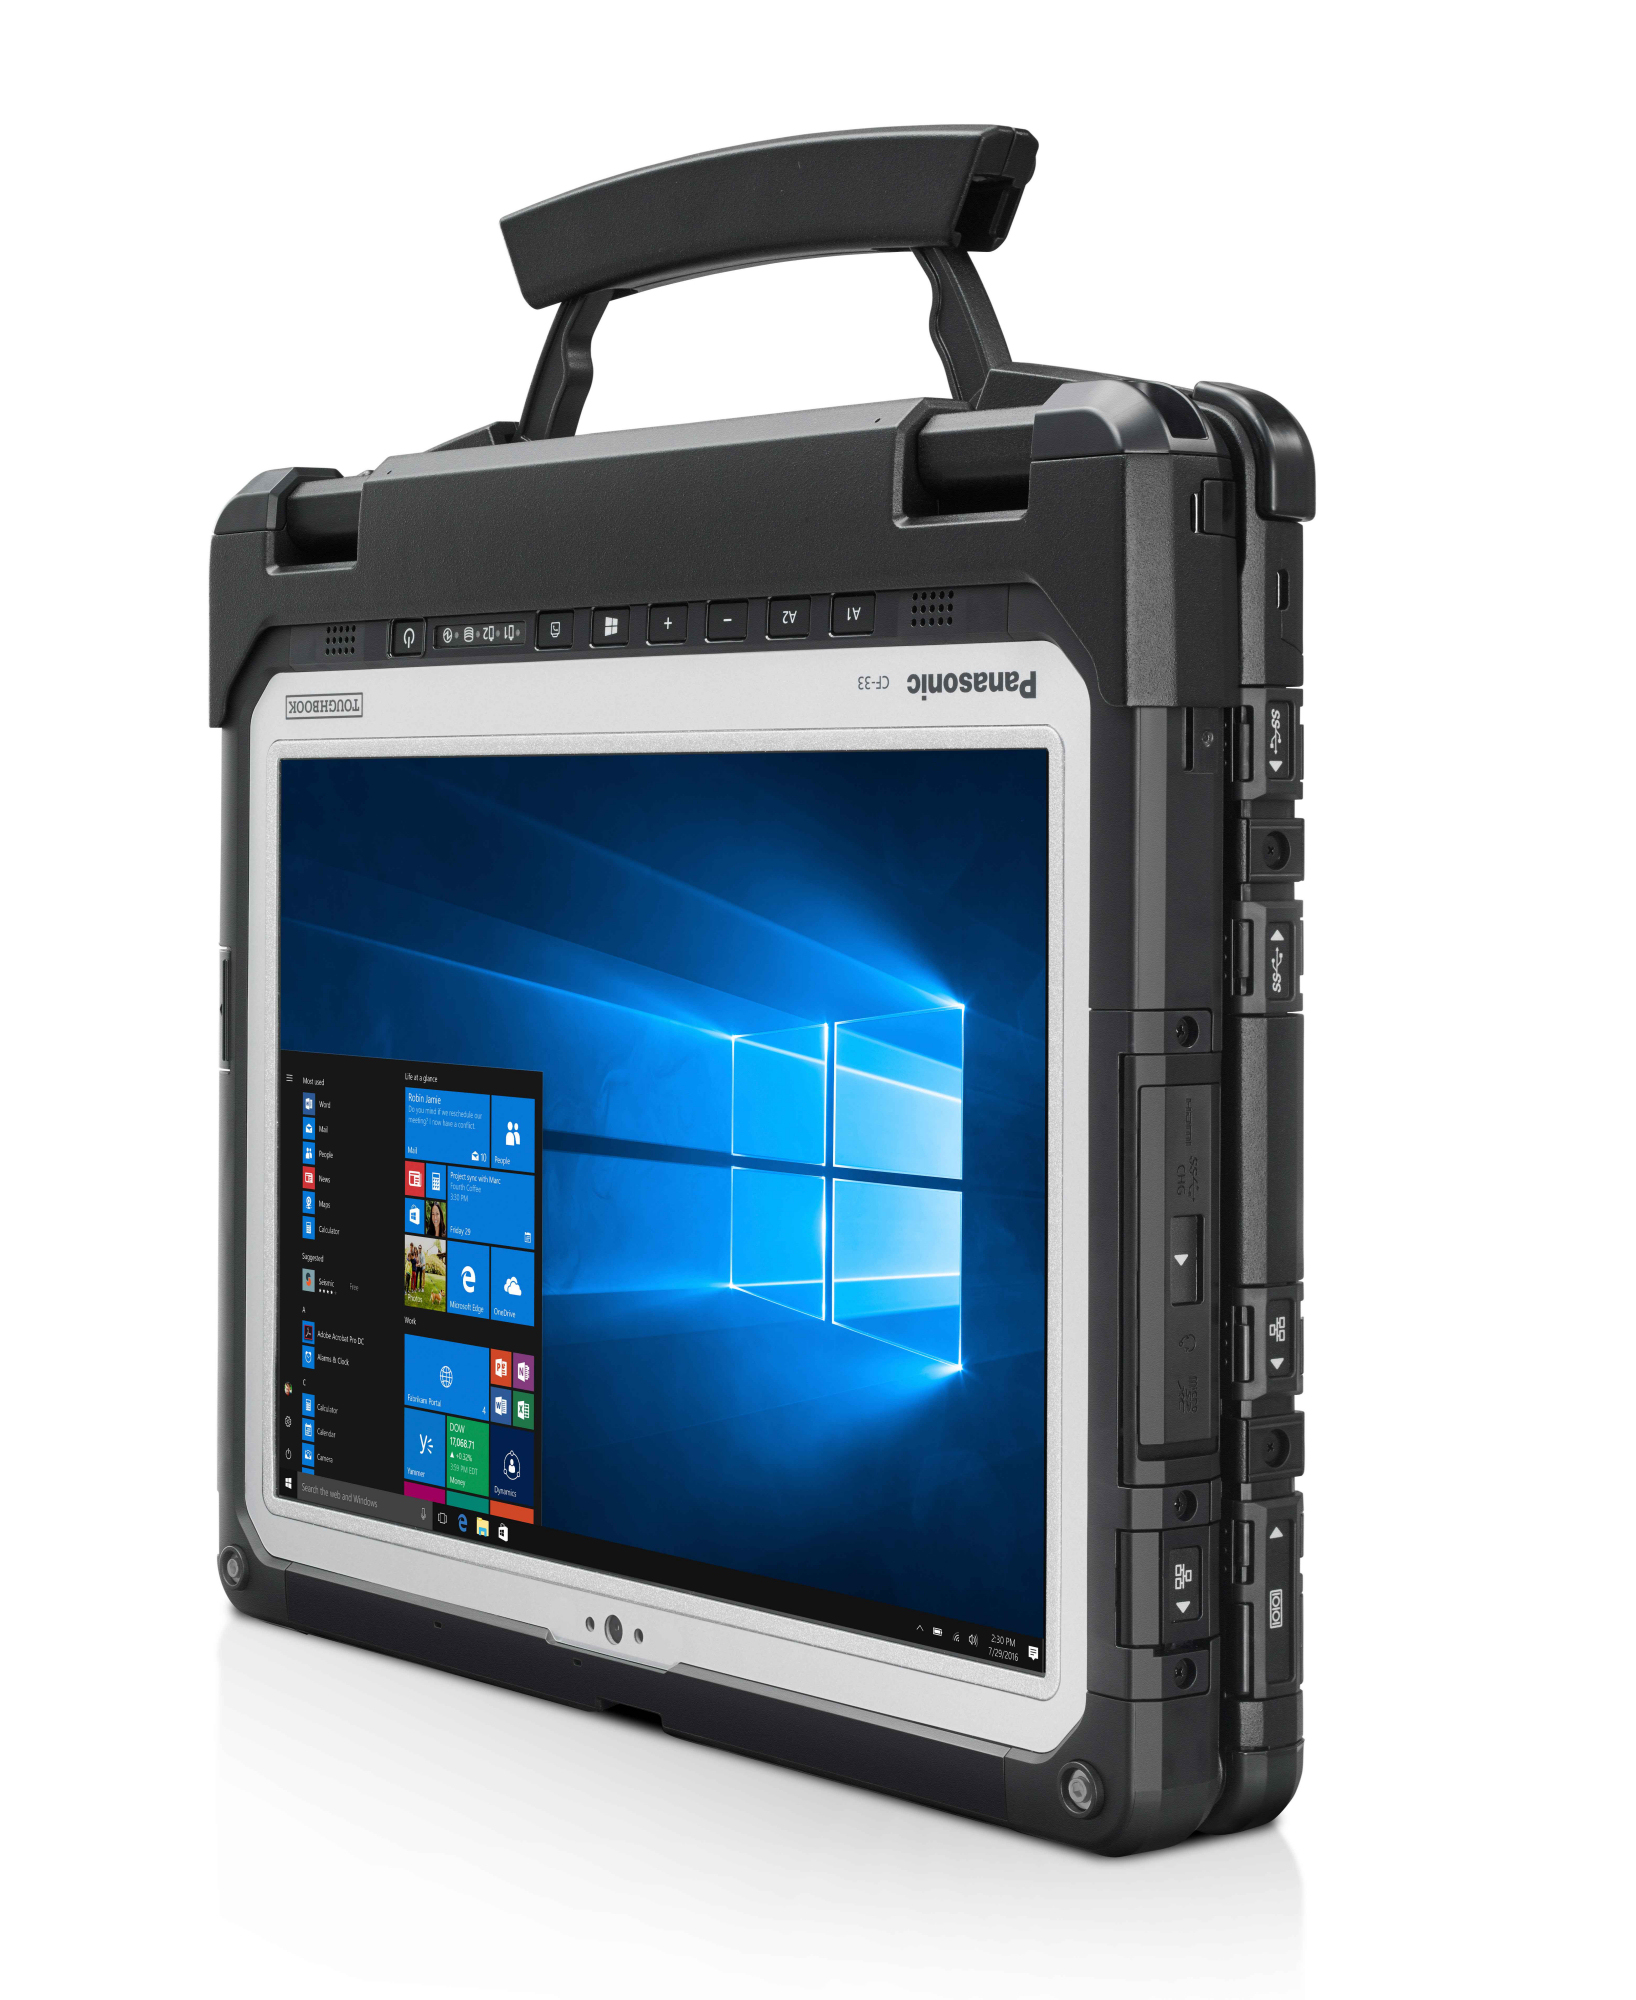
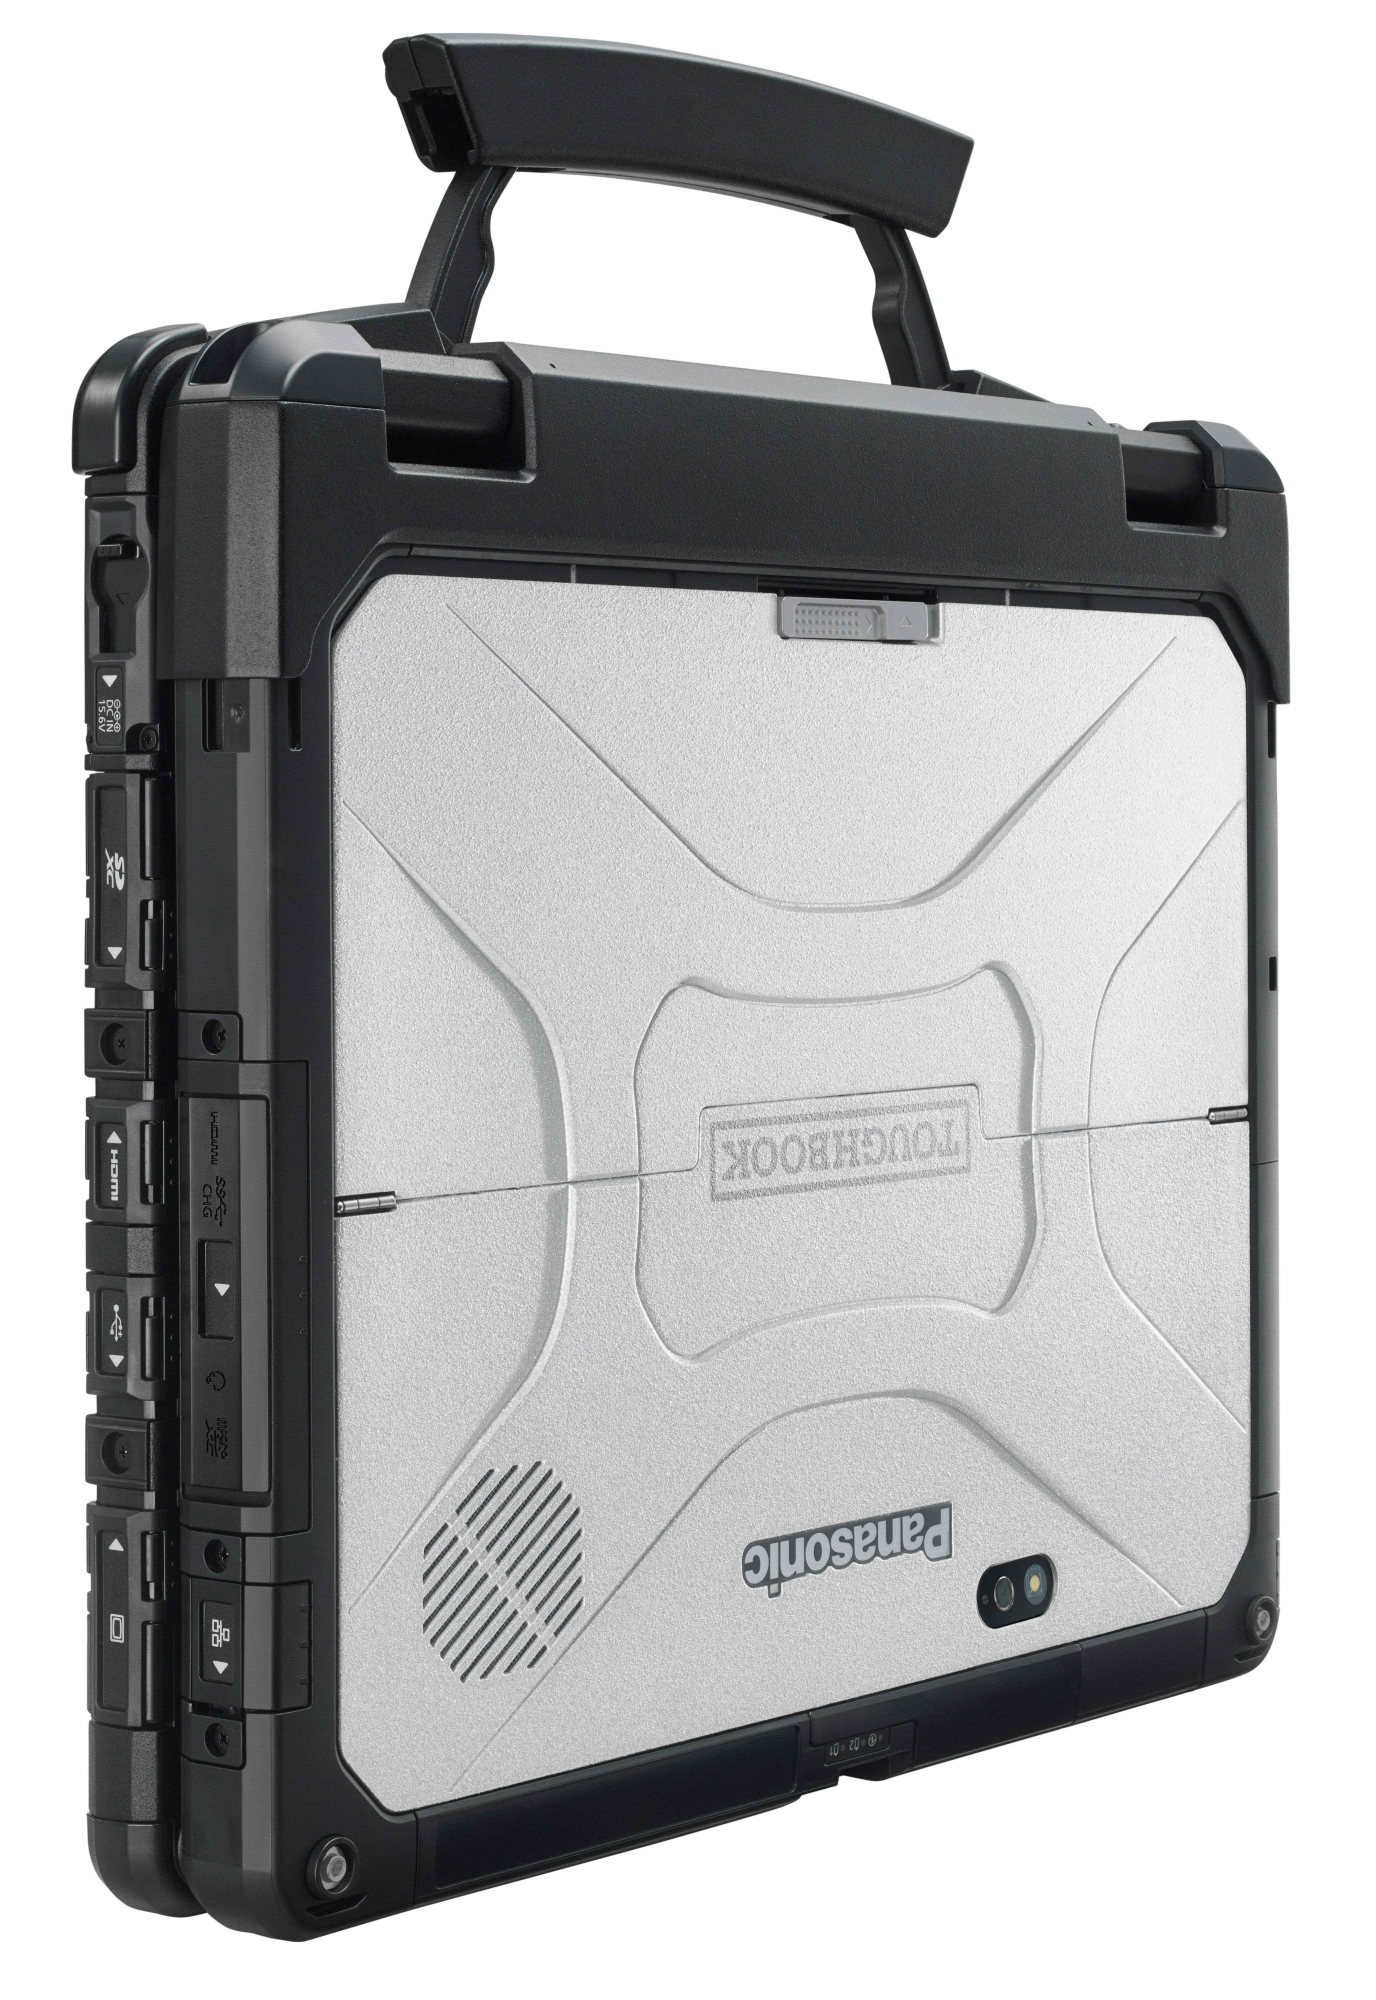
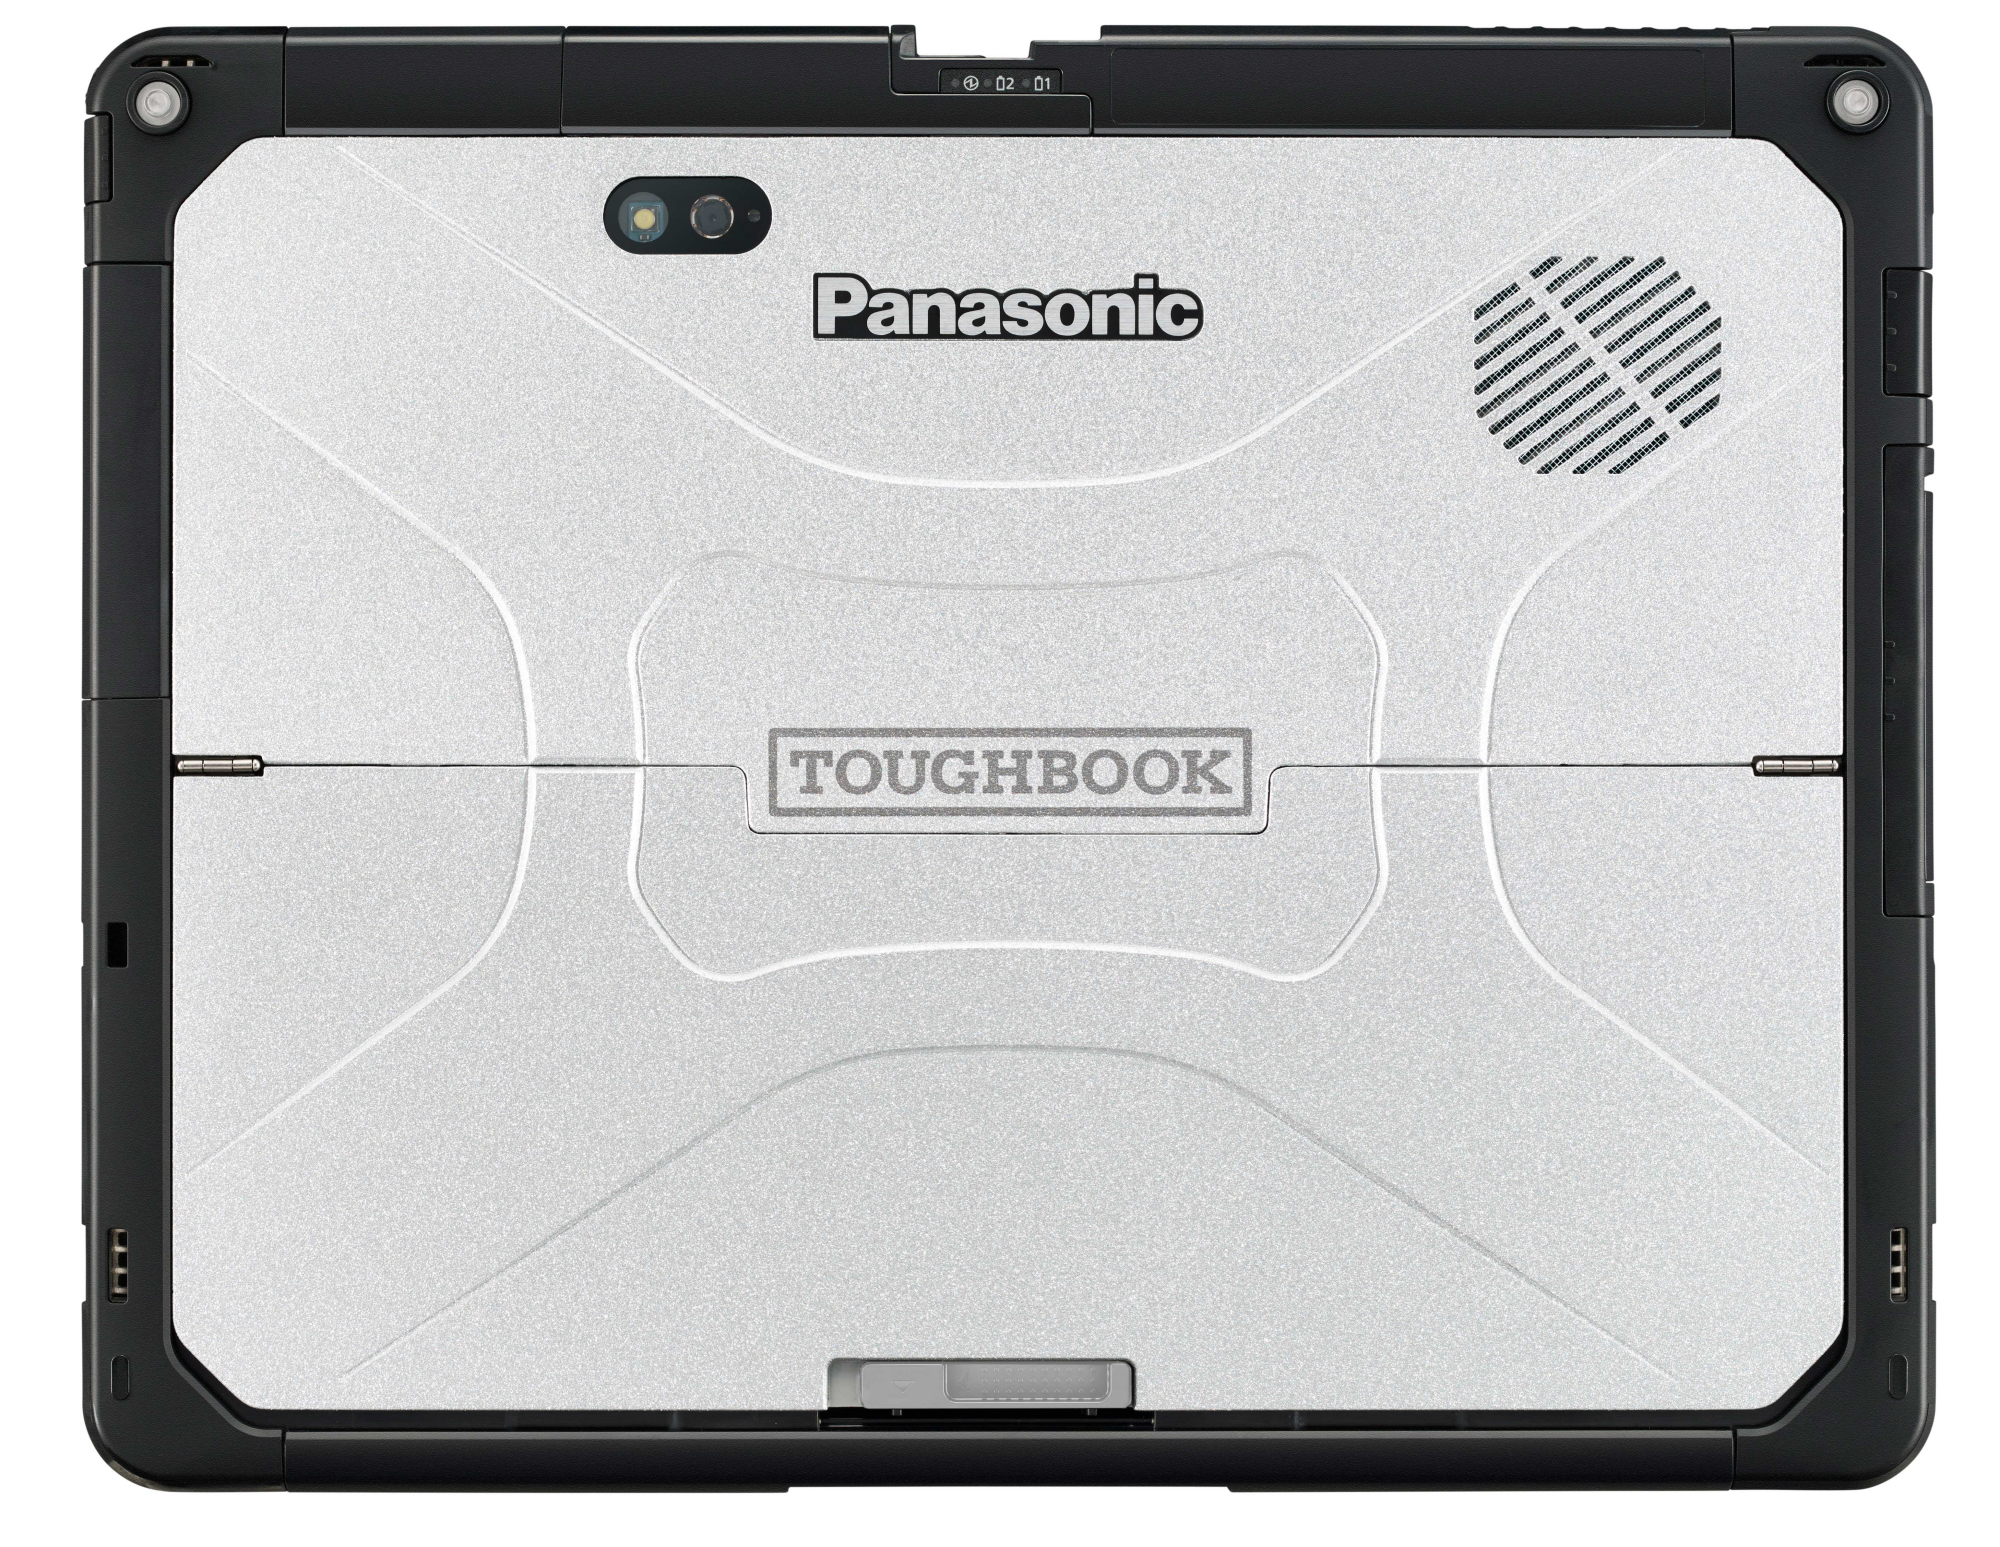
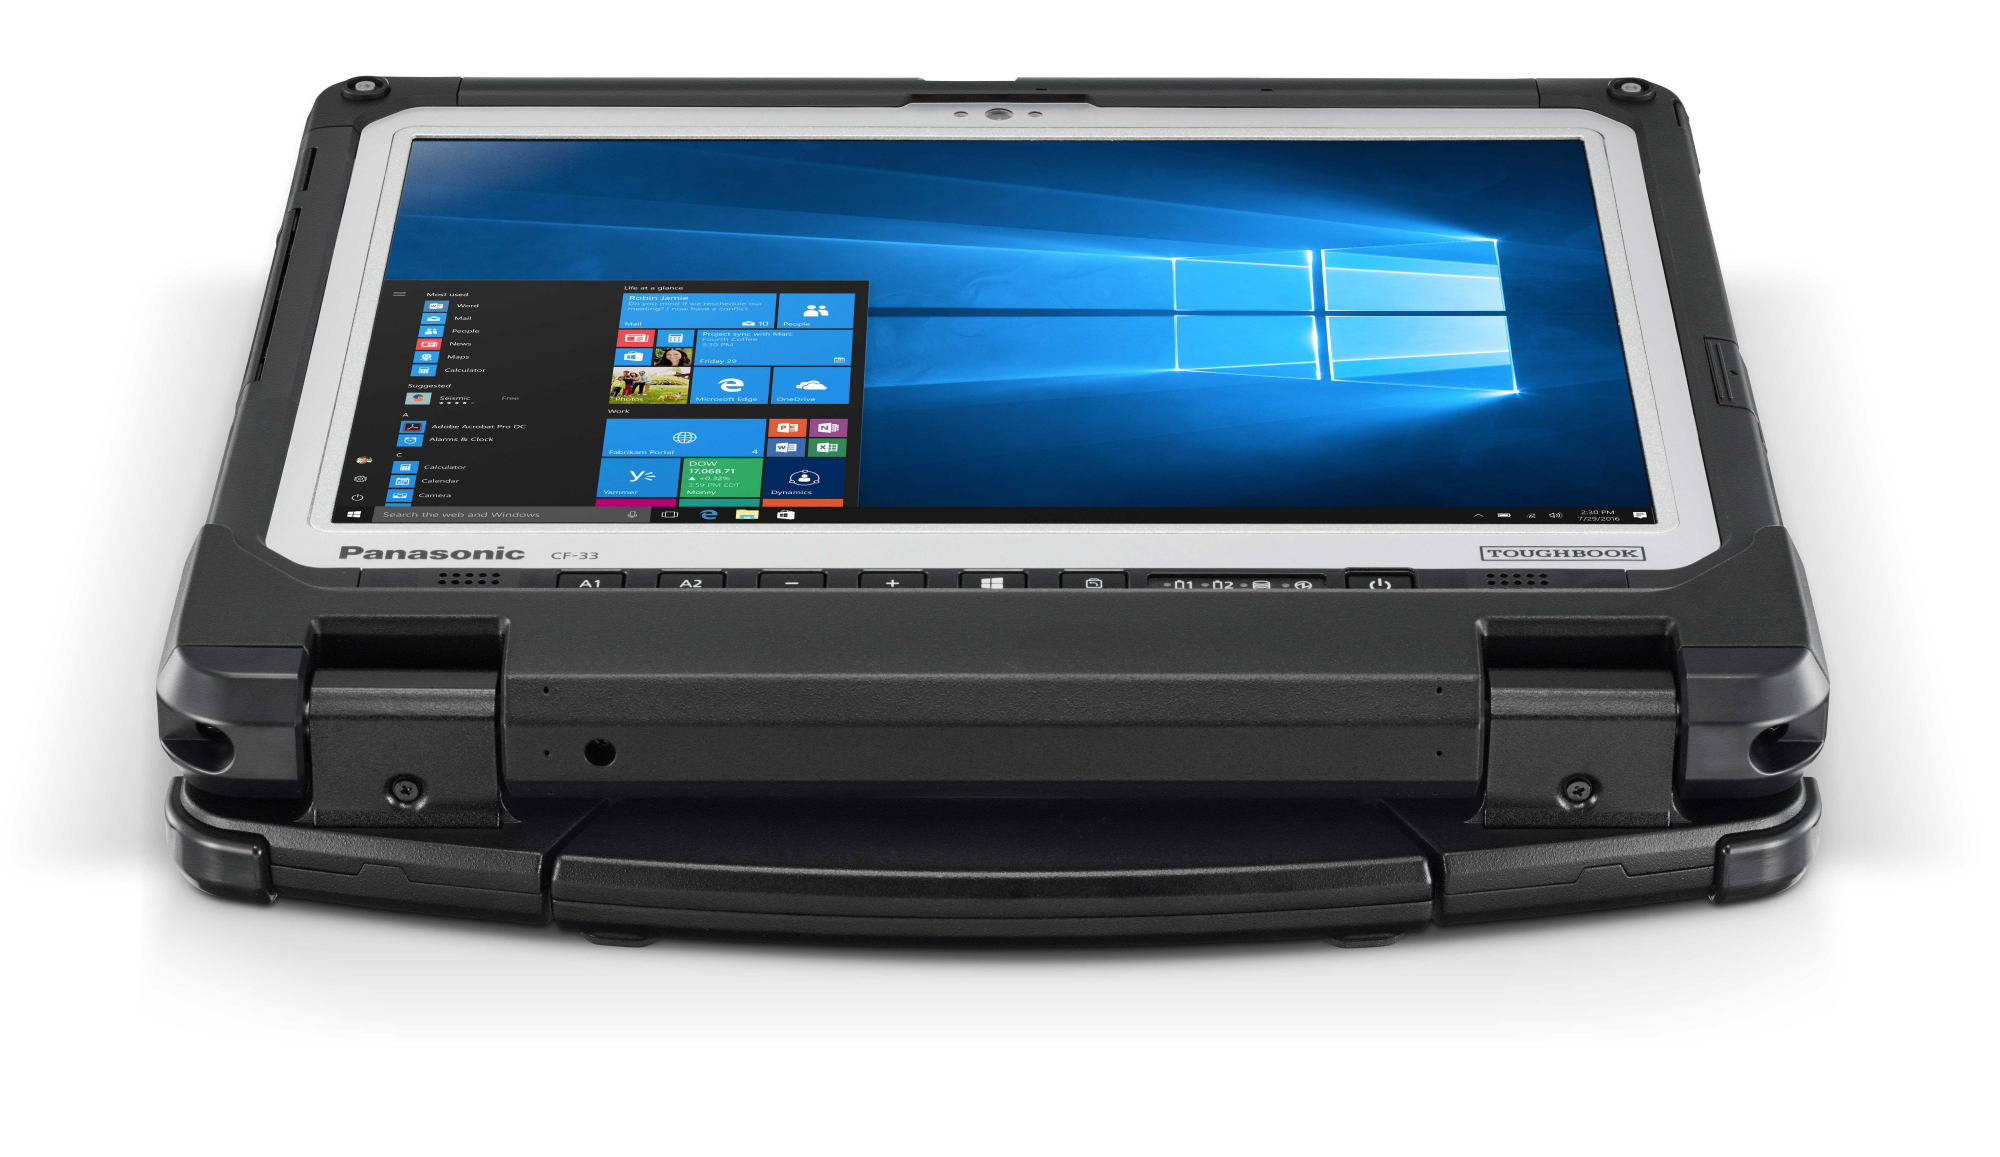
Con el Toughbook CF-33, Panasonic ofrece un desmontable de 12" para situaciones extremas. La robusta carcasa protege el equipo del polvo, la humedad y las caídas. No obstante, el dispositivo muestra un peso relativamente bajo en la balanza.
El procesador Core i5 incorporado ofrece suficiente potencia de computación para todas las aplicaciones habituales. Sobre todo, el dispositivo funciona silenciosamente y apenas se calienta. El SSD asegura un sistema rápido.
El Panasonic Toughbook CF-33 está bien equipado para su uso previsto.
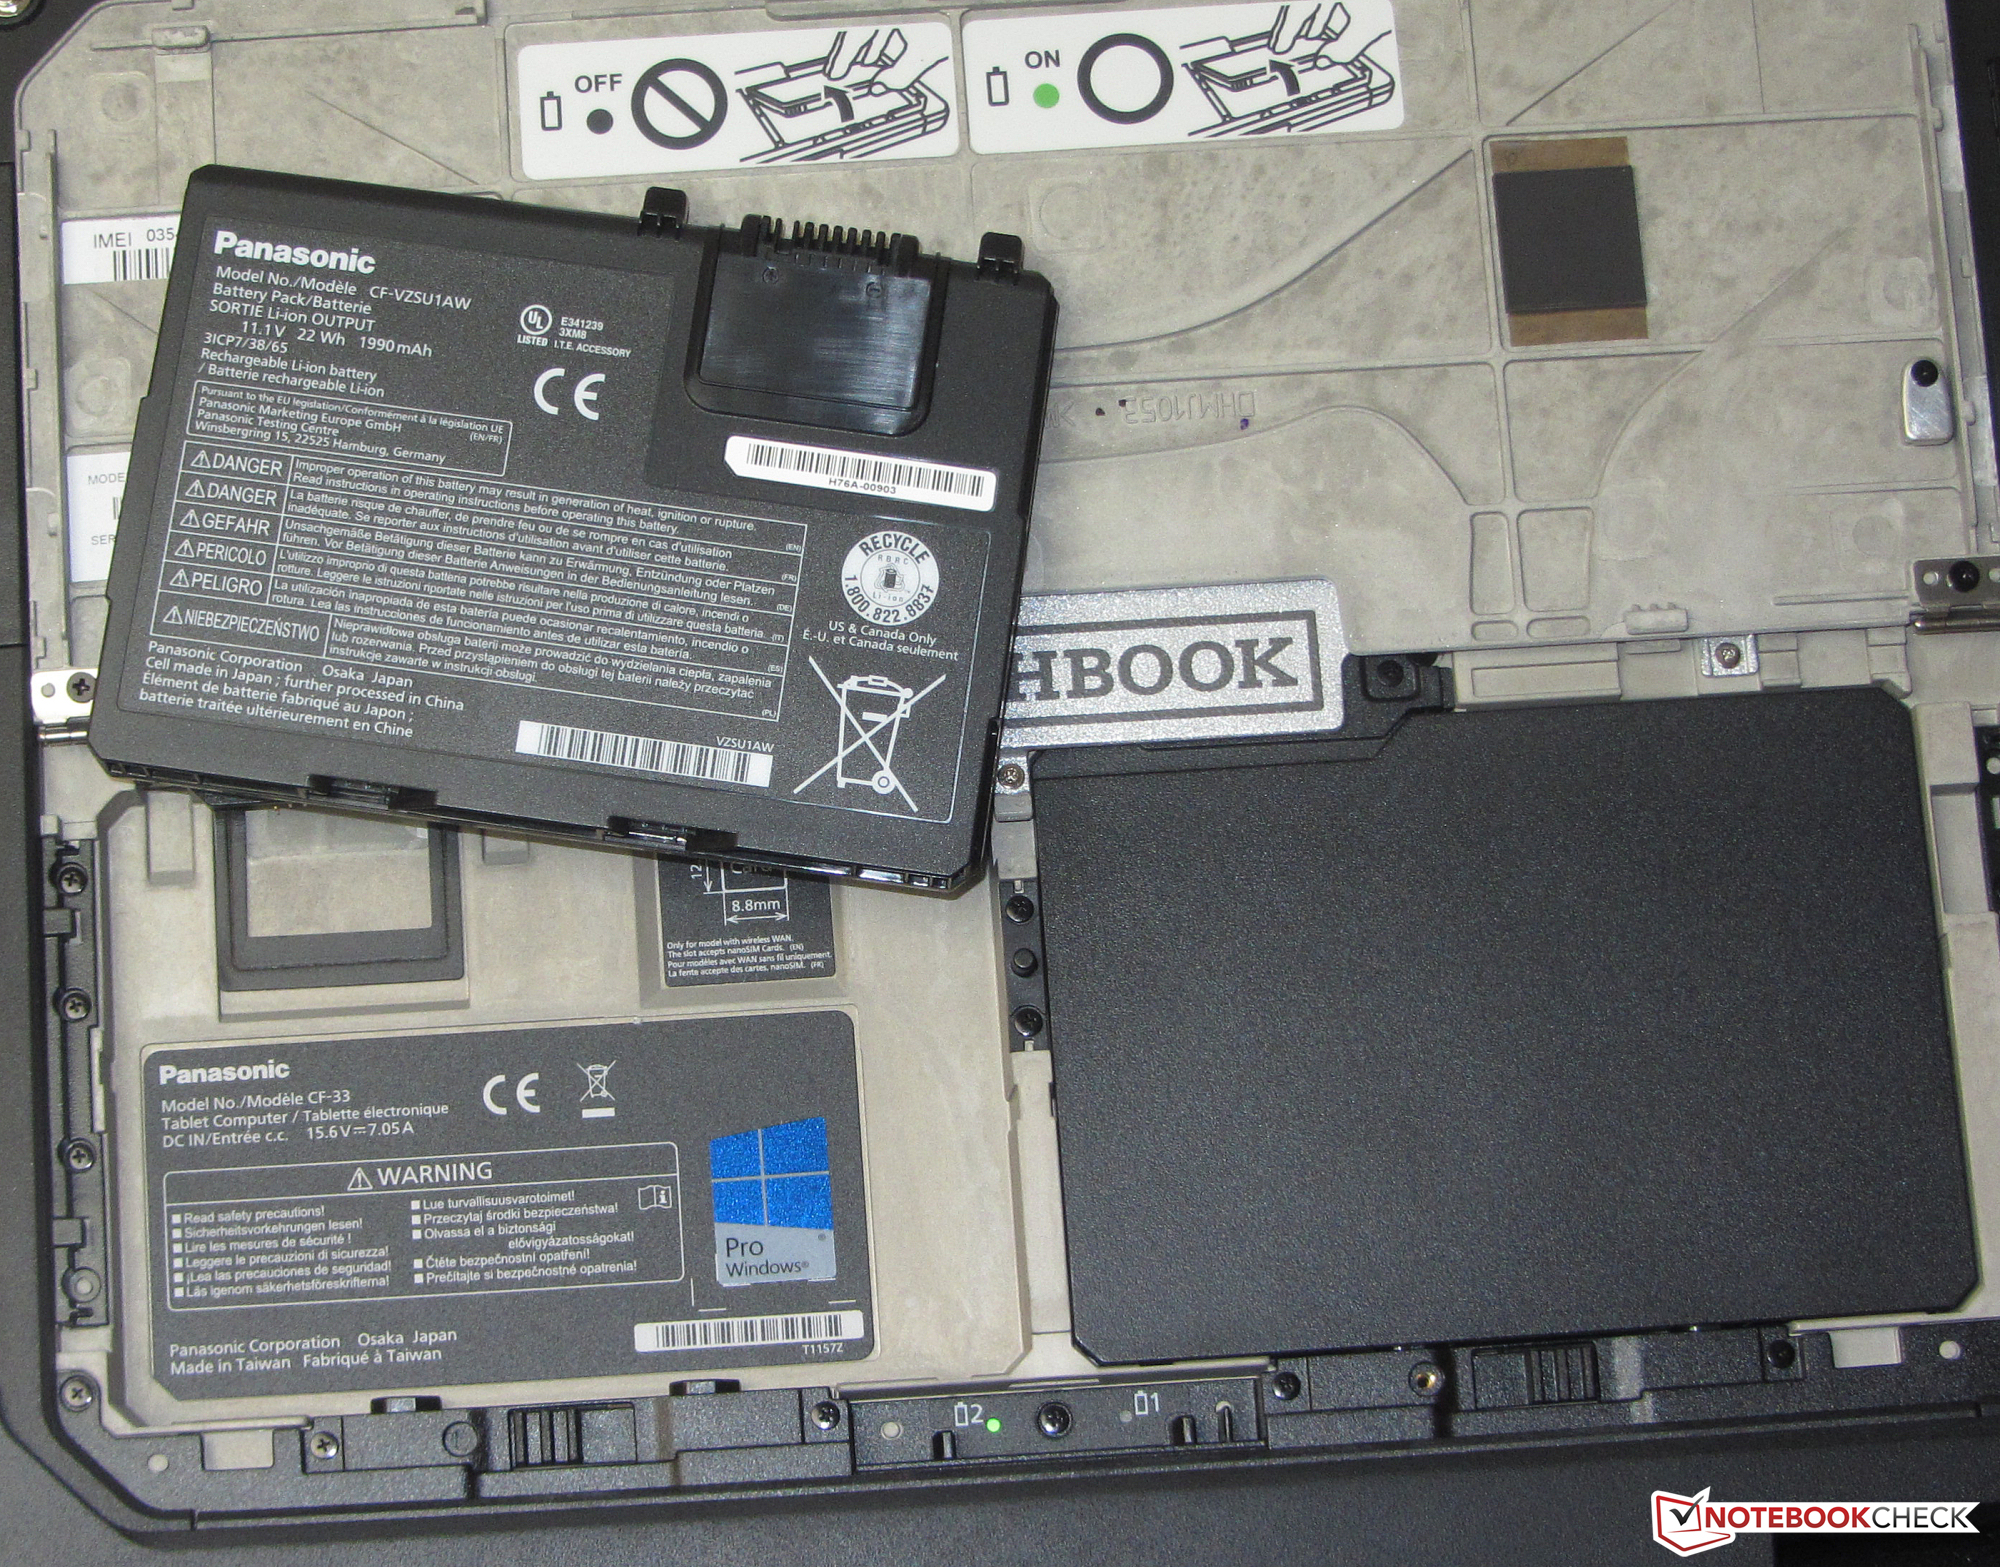
El teclado nos dejó una buena impresión. Sin embargo, nos falta retroiluminación, que está disponible de manera opcional. El dispositivo ofrece un buen aguante de batería, que incluso se puede aumentar aún más con baterías de gran capacidad, tambien opcionales. La pantalla táctil brillante y de alto contraste tiene ángulos de visión estables y también nos dejó una buena impresión en todo momento. Se puede usar con los dedos y con el lápiz incluido.
Ésta es una versión acortada del análisis original. Puedes leer el análisis completo en inglés aquí.
Panasonic Toughbook CF-33
- 12/15/2017 v6 (old)
Sascha Mölck