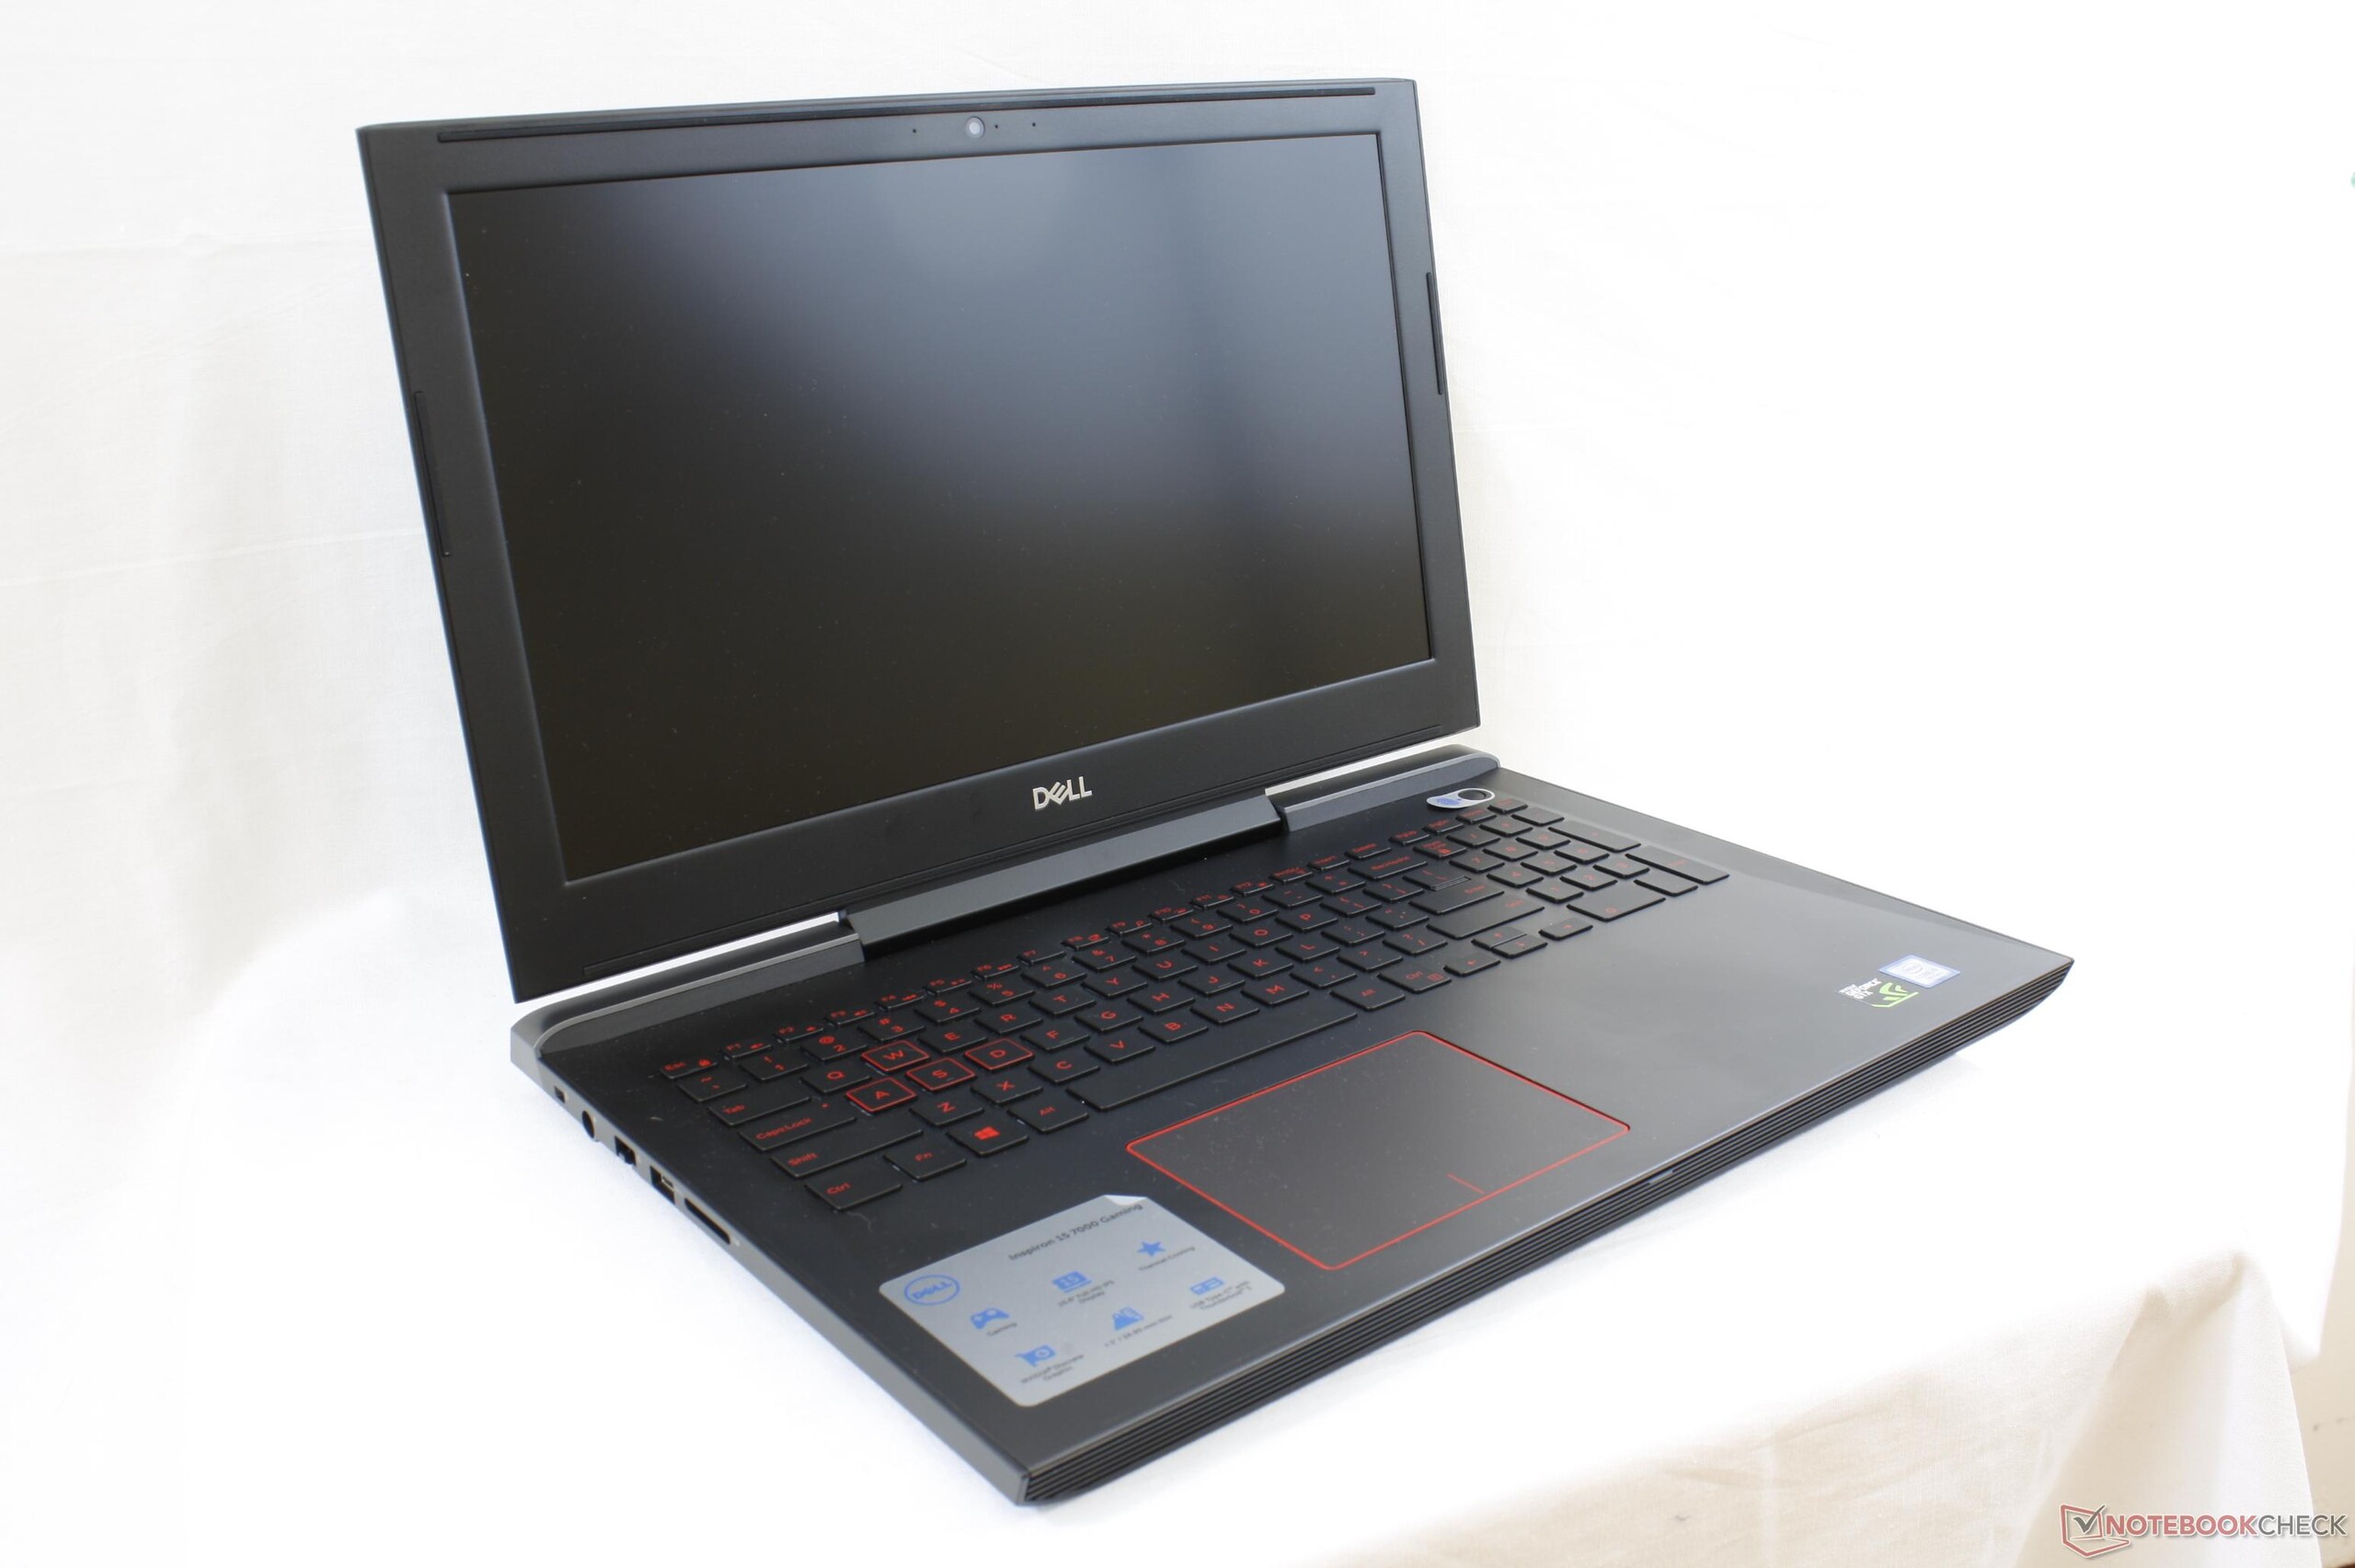
Breve análisis del portátil Dell Inspiron 15 7000 7577 (i5-7300HQ, GTX 1060 Max-Q)
| SD Card Reader | |
| average JPG Copy Test (av. of 3 runs) | |
| Dell XPS 15 9560 (i7-7700HQ, UHD) | |
| Dell Inspiron 15 7000 7577 | |
| Dell Inspiron 15 7000 7567 | |
| maximum AS SSD Seq Read Test (1GB) | |
| Dell XPS 15 9560 (i7-7700HQ, UHD) | |
| Dell Inspiron 15 7000 7577 | |
| Dell Inspiron 15 7000 7567 | |
| Networking | |
| iperf3 transmit AX12 | |
| Dell XPS 15 9560 (i7-7700HQ, UHD) | |
| Dell Inspiron 15 7000 7577 | |
| Dell Inspiron 15 7000 7567 (jseb) | |
| iperf3 receive AX12 | |
| Dell Inspiron 15 7000 7577 | |
| Dell XPS 15 9560 (i7-7700HQ, UHD) | |
| Dell Inspiron 15 7000 7567 (jseb) | |
| |||||||||||||||||||||||||
iluminación: 91 %
Brillo con batería: 235.4 cd/m²
Contraste: 841:1 (Negro: 0.28 cd/m²)
ΔE ColorChecker Calman: 5.6 | ∀{0.5-29.43 Ø4.73}
ΔE Greyscale Calman: 3.6 | ∀{0.09-98 Ø4.97}
55.4% sRGB (Argyll 1.6.3 3D)
35.2% AdobeRGB 1998 (Argyll 1.6.3 3D)
38.32% AdobeRGB 1998 (Argyll 3D)
55.6% sRGB (Argyll 3D)
37.07% Display P3 (Argyll 3D)
Gamma: 2.23
CCT: 7214 K
| Dell Inspiron 15 7000 7577 ID: LG Philips LGD053F, Name: 156WF6, Dell P/N: 4XK13, IPS, 15.6", 1920x1080 | Dell Inspiron 15 7000 7567 AU Optronics AUO38ED B156HTN 28H80, TN, 15.6", 1920x1080 | Acer Nitro 5 AN515-51-788E LG Philips LP156WF6-SPK6, IPS, 15.6", 1920x1080 | HP Omen 15-ce002ng AUO42ED, IPS, 15.6", 1920x1080 | Lenovo Legion Y520-15IKBN-80WK001KUS LP156WF6-SPK3, IPS, 15.6", 1920x1080 | |
|---|---|---|---|---|---|
| Display | -2% | 12% | 72% | ||
| Display P3 Coverage (%) | 37.07 | 36.42 -2% | 41.7 12% | 65.8 78% | |
| sRGB Coverage (%) | 55.6 | 54.9 -1% | 62.2 12% | 90.9 63% | |
| AdobeRGB 1998 Coverage (%) | 38.32 | 37.62 -2% | 43.17 13% | 66.5 74% | |
| Response Times | -16% | 11% | -17% | -48% | |
| Response Time Grey 50% / Grey 80% * (ms) | 35.6 ? | 36 ? -1% | 35 ? 2% | 43.2 ? -21% | 58.8 ? -65% |
| Response Time Black / White * (ms) | 27.6 ? | 36 ? -30% | 22 ? 20% | 31.2 ? -13% | 36 ? -30% |
| PWM Frequency (Hz) | 21550 ? | ||||
| Screen | -61% | 9% | 36% | -13% | |
| Brightness middle (cd/m²) | 235.4 | 246 5% | 276 17% | 304 29% | 239 2% |
| Brightness (cd/m²) | 223 | 235 5% | 265 19% | 289 30% | 244 9% |
| Brightness Distribution (%) | 91 | 75 -18% | 91 0% | 86 -5% | 88 -3% |
| Black Level * (cd/m²) | 0.28 | 0.55 -96% | 0.25 11% | 0.26 7% | 0.35 -25% |
| Contrast (:1) | 841 | 447 -47% | 1104 31% | 1169 39% | 683 -19% |
| Colorchecker dE 2000 * | 5.6 | 10.97 -96% | 5.06 10% | 3.46 38% | 7.3 -30% |
| Colorchecker dE 2000 max. * | 20.3 | 10.13 50% | 7.72 62% | 24.7 -22% | |
| Greyscale dE 2000 * | 3.6 | 14.25 -296% | 6.25 -74% | 2.46 32% | 4.9 -36% |
| Gamma | 2.23 99% | 1.83 120% | 1.76 125% | 2.38 92% | 2.19 100% |
| CCT | 7214 90% | 11200 58% | 6873 95% | 6915 94% | 7332 89% |
| Color Space (Percent of AdobeRGB 1998) (%) | 35.2 | 35 -1% | 40 14% | 59 68% | 35 -1% |
| Color Space (Percent of sRGB) (%) | 55.4 | 55 -1% | 62 12% | 91 64% | 55 -1% |
| Media total (Programa/Opciones) | -26% /
-42% | 11% /
10% | 30% /
36% | -31% /
-18% |
* ... más pequeño es mejor
Tiempos de respuesta del display
| ↔ Tiempo de respuesta de Negro a Blanco | ||
|---|---|---|
| 27.6 ms ... subida ↗ y bajada ↘ combinada | ↗ 15.6 ms subida | 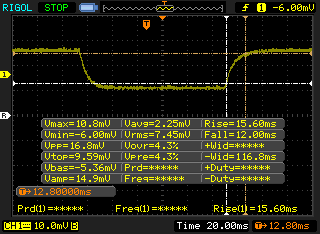 |
| ↘ 12 ms bajada | ||
| La pantalla mostró tiempos de respuesta relativamente lentos en nuestros tests pero podría ser demasiado lenta para los jugones. En comparación, todos los dispositivos de prueba van de ##min### (mínimo) a 240 (máximo) ms. » 70 % de todos los dispositivos son mejores. Eso quiere decir que el tiempo de respuesta es peor que la media (19.9 ms) de todos los dispositivos testados. | ||
| ↔ Tiempo de respuesta 50% Gris a 80% Gris | ||
| 35.6 ms ... subida ↗ y bajada ↘ combinada | ↗ 20 ms subida | 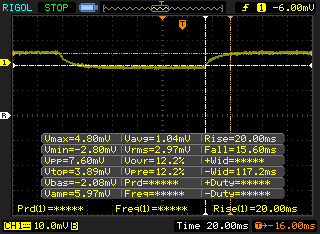 |
| ↘ 15.6 ms bajada | ||
| La pantalla mostró tiempos de respuesta lentos en nuestros tests y podría ser demasiado lenta para los jugones. En comparación, todos los dispositivos de prueba van de ##min### (mínimo) a 636 (máximo) ms. » 50 % de todos los dispositivos son mejores. Eso quiere decir que el tiempo de respuesta es peor que la media (31.1 ms) de todos los dispositivos testados. | ||
Parpadeo de Pantalla / PWM (Pulse-Width Modulation)
| Parpadeo de Pantalla / PWM no detectado | 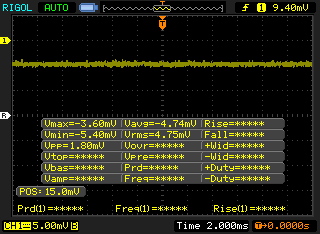 | ||
Comparación: 52 % de todos los dispositivos testados no usaron PWM para atenuar el display. Si se usó, medimos una media de 7794 (mínimo: 5 - máxmo: 343500) Hz. | |||
| Cinebench R15 | |
| CPU Single 64Bit | |
| Lenovo Yoga 920-13IKB-80Y7 | |
| Razer Blade Pro RZ09-0220 | |
| Asus GL702ZC-GC104T | |
| Apple MacBook Pro 15 2016 (2.6 GHz, 450) | |
| HP Omen 17-w100ng | |
| Dell Inspiron 15 7000 7577 | |
| Dell Inspiron 15 7000 7567 Gaming (Core i5-7300HQ, GTX 1050) | |
| Lenovo IdeaPad Y50 | |
| CPU Multi 64Bit | |
| Asus GL702ZC-GC104T | |
| Razer Blade Pro RZ09-0220 | |
| Apple MacBook Pro 15 2016 (2.6 GHz, 450) | |
| Lenovo Yoga 920-13IKB-80Y7 | |
| Dell Inspiron 15 7000 7567 Gaming (Core i5-7300HQ, GTX 1050) | |
| Dell Inspiron 15 7000 7577 | |
| Lenovo IdeaPad Y50 | |
| HP Omen 17-w100ng | |
| Cinebench R11.5 | |
| CPU Single 64Bit | |
| Lenovo Yoga 920-13IKB-80Y7 | |
| Razer Blade Pro RZ09-0220 | |
| Asus GL702ZC-GC104T | |
| Apple MacBook Pro 15 2016 (2.6 GHz, 450) | |
| Dell Inspiron 15 7000 7577 | |
| HP Omen 17-w100ng | |
| Dell Inspiron 15 7000 7567 Gaming (Core i5-7300HQ, GTX 1050) | |
| Lenovo IdeaPad Y50 | |
| CPU Multi 64Bit | |
| Asus GL702ZC-GC104T | |
| Apple MacBook Pro 15 2016 (2.6 GHz, 450) | |
| Razer Blade Pro RZ09-0220 | |
| Lenovo Yoga 920-13IKB-80Y7 | |
| Dell Inspiron 15 7000 7577 | |
| Dell Inspiron 15 7000 7567 Gaming (Core i5-7300HQ, GTX 1050) | |
| HP Omen 17-w100ng | |
| Lenovo IdeaPad Y50 | |
| Cinebench R10 | |
| Rendering Multiple CPUs 32Bit | |
| Asus GL702ZC-GC104T | |
| Razer Blade Pro RZ09-0220 | |
| Dell Inspiron 15 7000 7577 | |
| Dell Inspiron 15 7000 7567 Gaming (Core i5-7300HQ, GTX 1050) | |
| HP Omen 17-w100ng | |
| Lenovo Yoga 920-13IKB-80Y7 | |
| Lenovo IdeaPad Y50 | |
| Rendering Single 32Bit | |
| Lenovo Yoga 920-13IKB-80Y7 | |
| Razer Blade Pro RZ09-0220 | |
| Dell Inspiron 15 7000 7577 | |
| Dell Inspiron 15 7000 7567 Gaming (Core i5-7300HQ, GTX 1050) | |
| Lenovo IdeaPad Y50 | |
| HP Omen 17-w100ng | |
| Asus GL702ZC-GC104T | |
| wPrime 2.10 - 1024m | |
| Lenovo Yoga 920-13IKB-80Y7 | |
| Dell Inspiron 15 7000 7567 Gaming (Core i5-7300HQ, GTX 1050) | |
| Dell Inspiron 15 7000 7577 | |
| Lenovo IdeaPad Y50 | |
| Razer Blade Pro RZ09-0220 | |
* ... más pequeño es mejor
| PCMark 8 | |
| Home Score Accelerated v2 | |
| Acer Nitro 5 AN515-51-788E | |
| Dell Inspiron 15 7000 7567 | |
| Dell Inspiron 15 7000 7577 | |
| Dell Inspiron 15 7000 7567 Gaming (Core i5-7300HQ, GTX 1050) | |
| Dell XPS 15 9560 (i7-7700HQ, UHD) | |
| Work Score Accelerated v2 | |
| Acer Nitro 5 AN515-51-788E | |
| Dell Inspiron 15 7000 7567 | |
| Dell Inspiron 15 7000 7577 | |
| Dell Inspiron 15 7000 7567 Gaming (Core i5-7300HQ, GTX 1050) | |
| Dell XPS 15 9560 (i7-7700HQ, UHD) | |
| Creative Score Accelerated v2 | |
| Acer Nitro 5 AN515-51-788E | |
| Dell XPS 15 9560 (i7-7700HQ, UHD) | |
| Dell Inspiron 15 7000 7577 | |
| Dell Inspiron 15 7000 7567 Gaming (Core i5-7300HQ, GTX 1050) | |
| PCMark 10 - Score | |
| Acer Nitro 5 AN515-51-788E | |
| Dell Inspiron 15 7000 7577 | |
| Dell Inspiron 15 7000 7567 Gaming (Core i5-7300HQ, GTX 1050) | |
| PCMark 8 Home Score Accelerated v2 | 3759 puntos | |
| PCMark 8 Creative Score Accelerated v2 | 4723 puntos | |
| PCMark 8 Work Score Accelerated v2 | 4856 puntos | |
| PCMark 10 Score | 4406 puntos | |
ayuda | ||
| Dell Inspiron 15 7000 7577 Samsung PM961 MZVLW256HEHP | Dell Inspiron 15 7000 7567 Intel SSDSCKKF256H6 | Gigabyte Sabre 15G Liteonit CV3-8D128 | Lenovo Legion Y520-15IKBN-80WK001KUS Samsung PM961 MZVLW256HEHP | HP Omen 17-w100ng SanDisk Z400s SD8SNAT-128G | |
|---|---|---|---|---|---|
| AS SSD | -56% | -64% | 41% | -94% | |
| Copy Game MB/s (MB/s) | 382.5 | 286.2 -25% | 323.5 -15% | 1115 192% | 159.8 -58% |
| Copy Program MB/s (MB/s) | 274.8 | 224 -18% | 195.3 -29% | 502 83% | 80.6 -71% |
| Copy ISO MB/s (MB/s) | 814 | 425.4 -48% | 446.8 -45% | 1912 135% | 233.4 -71% |
| Score Total (Points) | 2405 | 734 -69% | 752 -69% | 2617 9% | 537 -78% |
| Score Write (Points) | 594 | 227 -62% | 234 -61% | 807 36% | 236 -60% |
| Score Read (Points) | 1241 | 332 -73% | 337 -73% | 1232 -1% | 206 -83% |
| Access Time Write * (ms) | 0.037 | 0.057 -54% | 0.073 -97% | 0.027 27% | 0.162 -338% |
| Access Time Read * (ms) | 0.058 | 0.094 -62% | 0.141 -143% | 0.065 -12% | 0.14 -141% |
| 4K-64 Write (MB/s) | 375.8 | 118.3 -69% | 132.2 -65% | 529 41% | 155 -59% |
| 4K-64 Read (MB/s) | 929 | 258.6 -72% | 257 -72% | 919 -1% | 137.4 -85% |
| 4K Write (MB/s) | 100.2 | 66.6 -34% | 53.8 -46% | 139.4 39% | 64.2 -36% |
| 4K Read (MB/s) | 46.95 | 25.16 -46% | 28.3 -40% | 48.57 3% | 17.76 -62% |
| Seq Write (MB/s) | 1181 | 416.1 -65% | 479.8 -59% | 1392 18% | 166.7 -86% |
| Seq Read (MB/s) | 2652 | 481.6 -82% | 516 -81% | 2649 0% | 507 -81% |
* ... más pequeño es mejor

| 3DMark | |
| 1920x1080 Fire Strike Graphics | |
| Asus G701VIK-BA049T | |
| Alienware 15 R3 Max-Q | |
| Aorus X5 v7 | |
| Gigabyte Aero 15X | |
| AMD Radeon RX 480 8 GB Reference | |
| Razer Blade Pro RZ09-0220 | |
| HP Omen 15-ce002ng | |
| Dell Inspiron 15 7000 7577 | |
| EVGA SC17 | |
| Lenovo Legion Y520-15IKBN-80WK001KUS | |
| Asus GL503VD-DB74 | |
| Acer Swift 3 SF315-51G-57E5 | |
| Fire Strike Extreme Graphics | |
| Alienware 15 R3 Max-Q | |
| Gigabyte Aero 15X | |
| AMD Radeon RX 480 8 GB Reference | |
| Razer Blade Pro RZ09-0220 | |
| Dell Inspiron 15 7000 7577 | |
| EVGA SC17 | |
| Lenovo Legion Y520-15IKBN-80WK001KUS | |
| Asus GL503VD-DB74 | |
| 3DMark 11 | |
| 1280x720 Performance GPU | |
| Asus G701VIK-BA049T | |
| Alienware 15 R3 Max-Q | |
| Aorus X5 v7 | |
| Gigabyte Aero 15X | |
| AMD Radeon RX 480 8 GB Reference | |
| Razer Blade Pro RZ09-0220 | |
| HP Omen 15-ce002ng | |
| Dell Inspiron 15 7000 7577 | |
| EVGA SC17 | |
| Asus GL503VD-DB74 | |
| Acer Swift 3 SF315-51G-57E5 | |
| 1280x720 Performance Combined | |
| Asus G701VIK-BA049T | |
| AMD Radeon RX 480 8 GB Reference | |
| Aorus X5 v7 | |
| Alienware 15 R3 Max-Q | |
| EVGA SC17 | |
| Gigabyte Aero 15X | |
| Razer Blade Pro RZ09-0220 | |
| HP Omen 15-ce002ng | |
| Asus GL503VD-DB74 | |
| Dell Inspiron 15 7000 7577 | |
| Acer Swift 3 SF315-51G-57E5 | |
| 3DMark 11 Performance | 10176 puntos | |
| 3DMark Ice Storm Standard Score | 96790 puntos | |
| 3DMark Cloud Gate Standard Score | 17325 puntos | |
| 3DMark Fire Strike Score | 8292 puntos | |
| 3DMark Fire Strike Extreme Score | 4467 puntos | |
ayuda | ||
| The Witcher 3 - 1920x1080 Ultra Graphics & Postprocessing (HBAO+) | |
| MSI GE73VR 7RF Raider | |
| Nvidia GeForce GTX 1060 Founders Edition 6 GB | |
| Razer Blade Pro RZ09-0220 | |
| Lenovo Legion Y520-15IKBN-80WK001KUS | |
| Dell Inspiron 15 7000 7577 | |
| HP Omen 15-ce002ng | |
| Gigabyte Sabre 15G | |
| BioShock Infinite - 1920x1080 Ultra Preset, DX11 (DDOF) | |
| MSI GE73VR 7RF Raider | |
| Razer Blade Pro RZ09-0220 | |
| Dell Inspiron 15 7000 7577 | |
| Lenovo Legion Y520-15IKBN-80WK001KUS | |
| Asus Strix GL502VT-DS74 | |
| Gigabyte Sabre 15G | |
| MSI GL72 6QF | |
| bajo | medio | alto | ultra | |
|---|---|---|---|---|
| Guild Wars 2 (2012) | 45.7 | |||
| BioShock Infinite (2013) | 95.3 | |||
| Metro: Last Light (2013) | 64.3 | |||
| Thief (2014) | 64.6 | |||
| The Witcher 3 (2015) | 73.4 | 35.2 | ||
| Batman: Arkham Knight (2015) | 74 | 49 | ||
| Metal Gear Solid V (2015) | 60 | |||
| Fallout 4 (2015) | 73.9 | 61.3 | ||
| Rise of the Tomb Raider (2016) | 67.5 | 55.4 | ||
| Overwatch (2016) | 98.4 | |||
| Mafia 3 (2016) | 36.2 | |||
| Prey (2017) | 97.1 | |||
| Dirt 4 (2017) | 118 | 87.1 | 46.5 | |
| F1 2017 (2017) | 94 | 77 | 56 | |
| Middle-earth: Shadow of War (2017) | 84 | 65 | 48 |
Ruido
| Ocioso |
| 28 / 28 / 28 dB(A) |
| Carga |
| 30.3 / 46.5 dB(A) |
 | ||
30 dB silencioso 40 dB(A) audible 50 dB(A) ruidosamente alto |
||
min: | ||
| Dell Inspiron 15 7000 7577 GeForce GTX 1060 Max-Q, i5-7300HQ, Samsung PM961 MZVLW256HEHP | Dell Inspiron 15 7000 7567 Gaming (Core i5-7300HQ, GTX 1050) GeForce GTX 1050 Mobile, i5-7300HQ, Toshiba MQ02ABD100H | Gigabyte Sabre 15G GeForce GTX 1050 Mobile, i7-7700HQ, Liteonit CV3-8D128 | Lenovo Legion Y520-15IKBN-80WK001KUS GeForce GTX 1050 Ti Mobile, i7-7700HQ, Samsung PM961 MZVLW256HEHP | Asus Strix GL502VT-DS74 GeForce GTX 970M, 6700HQ, Lite-On CV1-8B128 | HP Omen 15-ce002ng GeForce GTX 1060 Max-Q, i7-7700HQ, Samsung PM961 MZVLW256HEHP | |
|---|---|---|---|---|---|---|
| Noise | -12% | -21% | -7% | -12% | -16% | |
| apagado / medio ambiente * (dB) | 28 | 28 -0% | 28.2 -1% | 27.7 1% | 28.7 -2% | 30 -7% |
| Idle Minimum * (dB) | 28 | 31.6 -13% | 33 -18% | 30.5 -9% | 31 -11% | 30 -7% |
| Idle Average * (dB) | 28 | 31.8 -14% | 33.3 -19% | 30.5 -9% | 31 -11% | 33 -18% |
| Idle Maximum * (dB) | 28 | 31.8 -14% | 34.7 -24% | 30.6 -9% | 32 -14% | 37 -32% |
| Load Average * (dB) | 30.3 | 36.3 -20% | 44.5 -47% | 40 -32% | 40.7 -34% | 41 -35% |
| Witcher 3 ultra * (dB) | 39.5 | 46.3 -17% | 49.2 -25% | 40 -1% | 42 -6% | |
| Load Maximum * (dB) | 46.5 | 49 -5% | 52.8 -14% | 42.6 8% | 47.6 -2% | 50 -8% |
* ... más pequeño es mejor
(±) La temperatura máxima en la parte superior es de 44 °C / 111 F, frente a la media de 40.4 °C / 105 F, que oscila entre 21.2 y 68.8 °C para la clase Gaming.
(±) El fondo se calienta hasta un máximo de 43.8 °C / 111 F, frente a la media de 43.2 °C / 110 F
(+) En reposo, la temperatura media de la parte superior es de 24.7 °C / 76# F, frente a la media del dispositivo de 33.9 °C / 93 F.
(+) Jugando a The Witcher 3, la temperatura media de la parte superior es de 27.9 °C / 82 F, frente a la media del dispositivo de 33.9 °C / 93 F.
(+) El reposamanos y el panel táctil están a una temperatura inferior a la de la piel, con un máximo de 29.8 °C / 85.6 F y, por tanto, son fríos al tacto.
(±) La temperatura media de la zona del reposamanos de dispositivos similares fue de 28.8 °C / 83.8 F (-1 °C / -1.8 F).
Dell Inspiron 15 7000 7577 análisis de audio
(±) | la sonoridad del altavoz es media pero buena (80.9 dB)
Graves 100 - 315 Hz
(±) | lubina reducida - en promedio 13% inferior a la mediana
(+) | el bajo es lineal (6.8% delta a la frecuencia anterior)
Medios 400 - 2000 Hz
(+) | medios equilibrados - a sólo 2.7% de la mediana
(+) | los medios son lineales (5.3% delta a la frecuencia anterior)
Altos 2 - 16 kHz
(±) | máximos más altos - de media 8% más altos que la mediana
(±) | la linealidad de los máximos es media (10.6% delta a frecuencia anterior)
Total 100 - 16.000 Hz
(±) | la linealidad del sonido global es media (18.9% de diferencia con la mediana)
En comparación con la misma clase
» 63% de todos los dispositivos probados de esta clase eran mejores, 8% similares, 29% peores
» El mejor tuvo un delta de 6%, la media fue 18%, el peor fue ###max##%
En comparación con todos los dispositivos probados
» 44% de todos los dispositivos probados eran mejores, 8% similares, 48% peores
» El mejor tuvo un delta de 4%, la media fue 24%, el peor fue ###max##%
Apple MacBook 12 (Early 2016) 1.1 GHz análisis de audio
(+) | los altavoces pueden reproducir a un volumen relativamente alto (#83.6 dB)
Graves 100 - 315 Hz
(±) | lubina reducida - en promedio 11.3% inferior a la mediana
(±) | la linealidad de los graves es media (14.2% delta a frecuencia anterior)
Medios 400 - 2000 Hz
(+) | medios equilibrados - a sólo 2.4% de la mediana
(+) | los medios son lineales (5.5% delta a la frecuencia anterior)
Altos 2 - 16 kHz
(+) | máximos equilibrados - a sólo 2% de la mediana
(+) | los máximos son lineales (4.5% delta a la frecuencia anterior)
Total 100 - 16.000 Hz
(+) | el sonido global es lineal (10.2% de diferencia con la mediana)
En comparación con la misma clase
» 7% de todos los dispositivos probados de esta clase eran mejores, 2% similares, 91% peores
» El mejor tuvo un delta de 5%, la media fue 18%, el peor fue ###max##%
En comparación con todos los dispositivos probados
» 5% de todos los dispositivos probados eran mejores, 1% similares, 94% peores
» El mejor tuvo un delta de 4%, la media fue 24%, el peor fue ###max##%
| Off / Standby | |
| Ocioso | |
| Carga |
|
Clave:
min: | |
| Dell Inspiron 15 7000 7577 i5-7300HQ, GeForce GTX 1060 Max-Q, Samsung PM961 MZVLW256HEHP, IPS, 1920x1080, 15.6" | Dell Inspiron 15 7000 7567 i7-7700HQ, GeForce GTX 1050 Ti Mobile, Intel SSDSCKKF256H6, TN, 1920x1080, 15.6" | Gigabyte Sabre 15G i7-7700HQ, GeForce GTX 1050 Mobile, Liteonit CV3-8D128, IPS, 1920x1080, 15.6" | MSI GF62VR 7RF-877 i7-7700HQ, GeForce GTX 1060 Mobile, Intel SSD 600p SSDPEKKW256G7, TN LED, 1920x1080, 15.6" | Asus Strix GL502VY-DS71 6700HQ, GeForce GTX 980M, SanDisk SD8SN8U1T001122, IPS, 1920x1080, 15.6" | |
|---|---|---|---|---|---|
| Power Consumption | 1% | -19% | -85% | -144% | |
| Idle Minimum * (Watt) | 7.1 | 4.4 38% | 8 -13% | 16.2 -128% | 20.6 -190% |
| Idle Average * (Watt) | 7.6 | 6.8 11% | 10.9 -43% | 18.2 -139% | 22.1 -191% |
| Idle Maximum * (Watt) | 8.6 | 8.3 3% | 11 -28% | 18.9 -120% | 22.5 -162% |
| Load Average * (Watt) | 59.5 | 81 -36% | 76.7 -29% | 82.7 -39% | 130.6 -119% |
| Witcher 3 ultra * (Watt) | 89 | 94.9 -7% | 125.7 -41% | ||
| Load Maximum * (Watt) | 112.8 | 127 -13% | 106.4 6% | 162.3 -44% | 177.2 -57% |
* ... más pequeño es mejor
| Dell Inspiron 15 7000 7577 i5-7300HQ, GeForce GTX 1060 Max-Q, 56 Wh | Dell Inspiron 15 7000 7567 i7-7700HQ, GeForce GTX 1050 Ti Mobile, 74 Wh | Gigabyte Sabre 15G i7-7700HQ, GeForce GTX 1050 Mobile, 47 Wh | Lenovo Legion Y520-15IKBN-80WK001KUS i7-7700HQ, GeForce GTX 1050 Ti Mobile, 45 Wh | Asus Strix GL502VT-DS74 6700HQ, GeForce GTX 970M, 64 Wh | MSI GF62VR 7RF-877 i7-7700HQ, GeForce GTX 1060 Mobile, 41 Wh | |
|---|---|---|---|---|---|---|
| Duración de Batería | 39% | -27% | -38% | -23% | -68% | |
| Reader / Idle (h) | 11 | 19.6 78% | 8.2 -25% | 8.5 -23% | 9.7 -12% | 2.8 -75% |
| WiFi v1.3 (h) | 6.9 | 10.4 51% | 4.4 -36% | 4 -42% | 5.9 -14% | 1.9 -72% |
| Load (h) | 1.6 | 1.4 -13% | 1.3 -19% | 0.8 -50% | 0.9 -44% | 0.7 -56% |
Pro
Contra
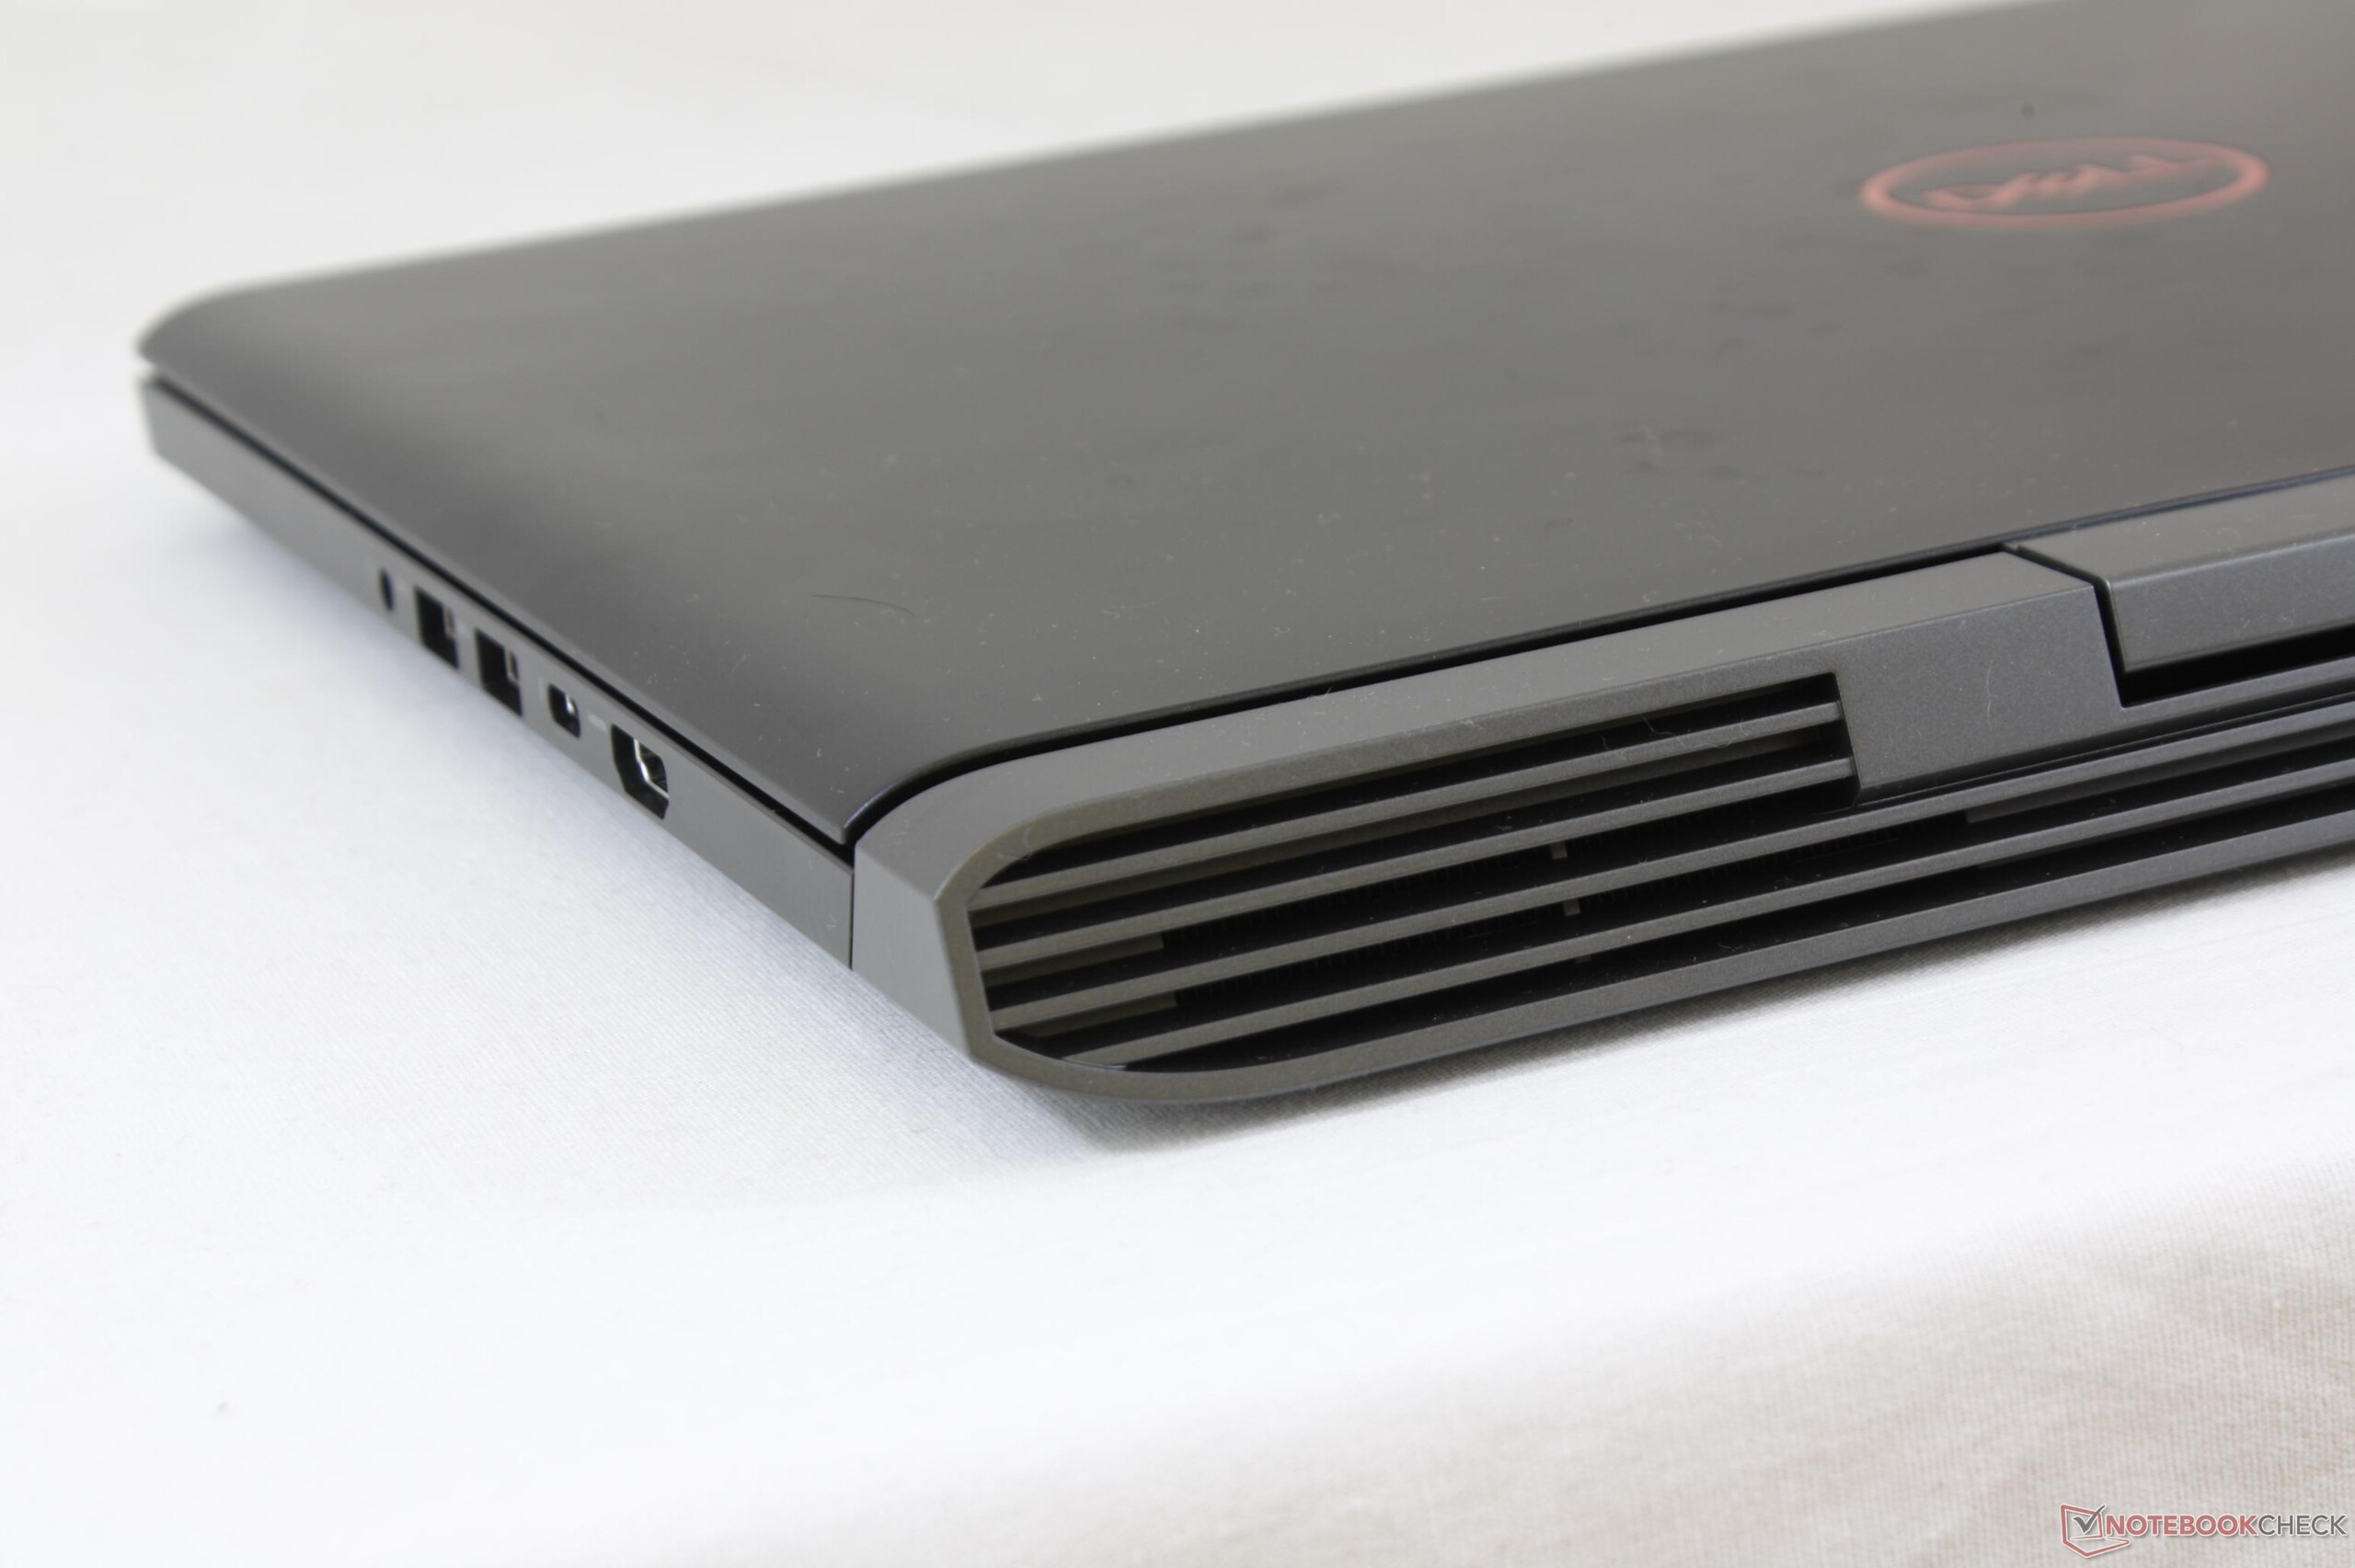
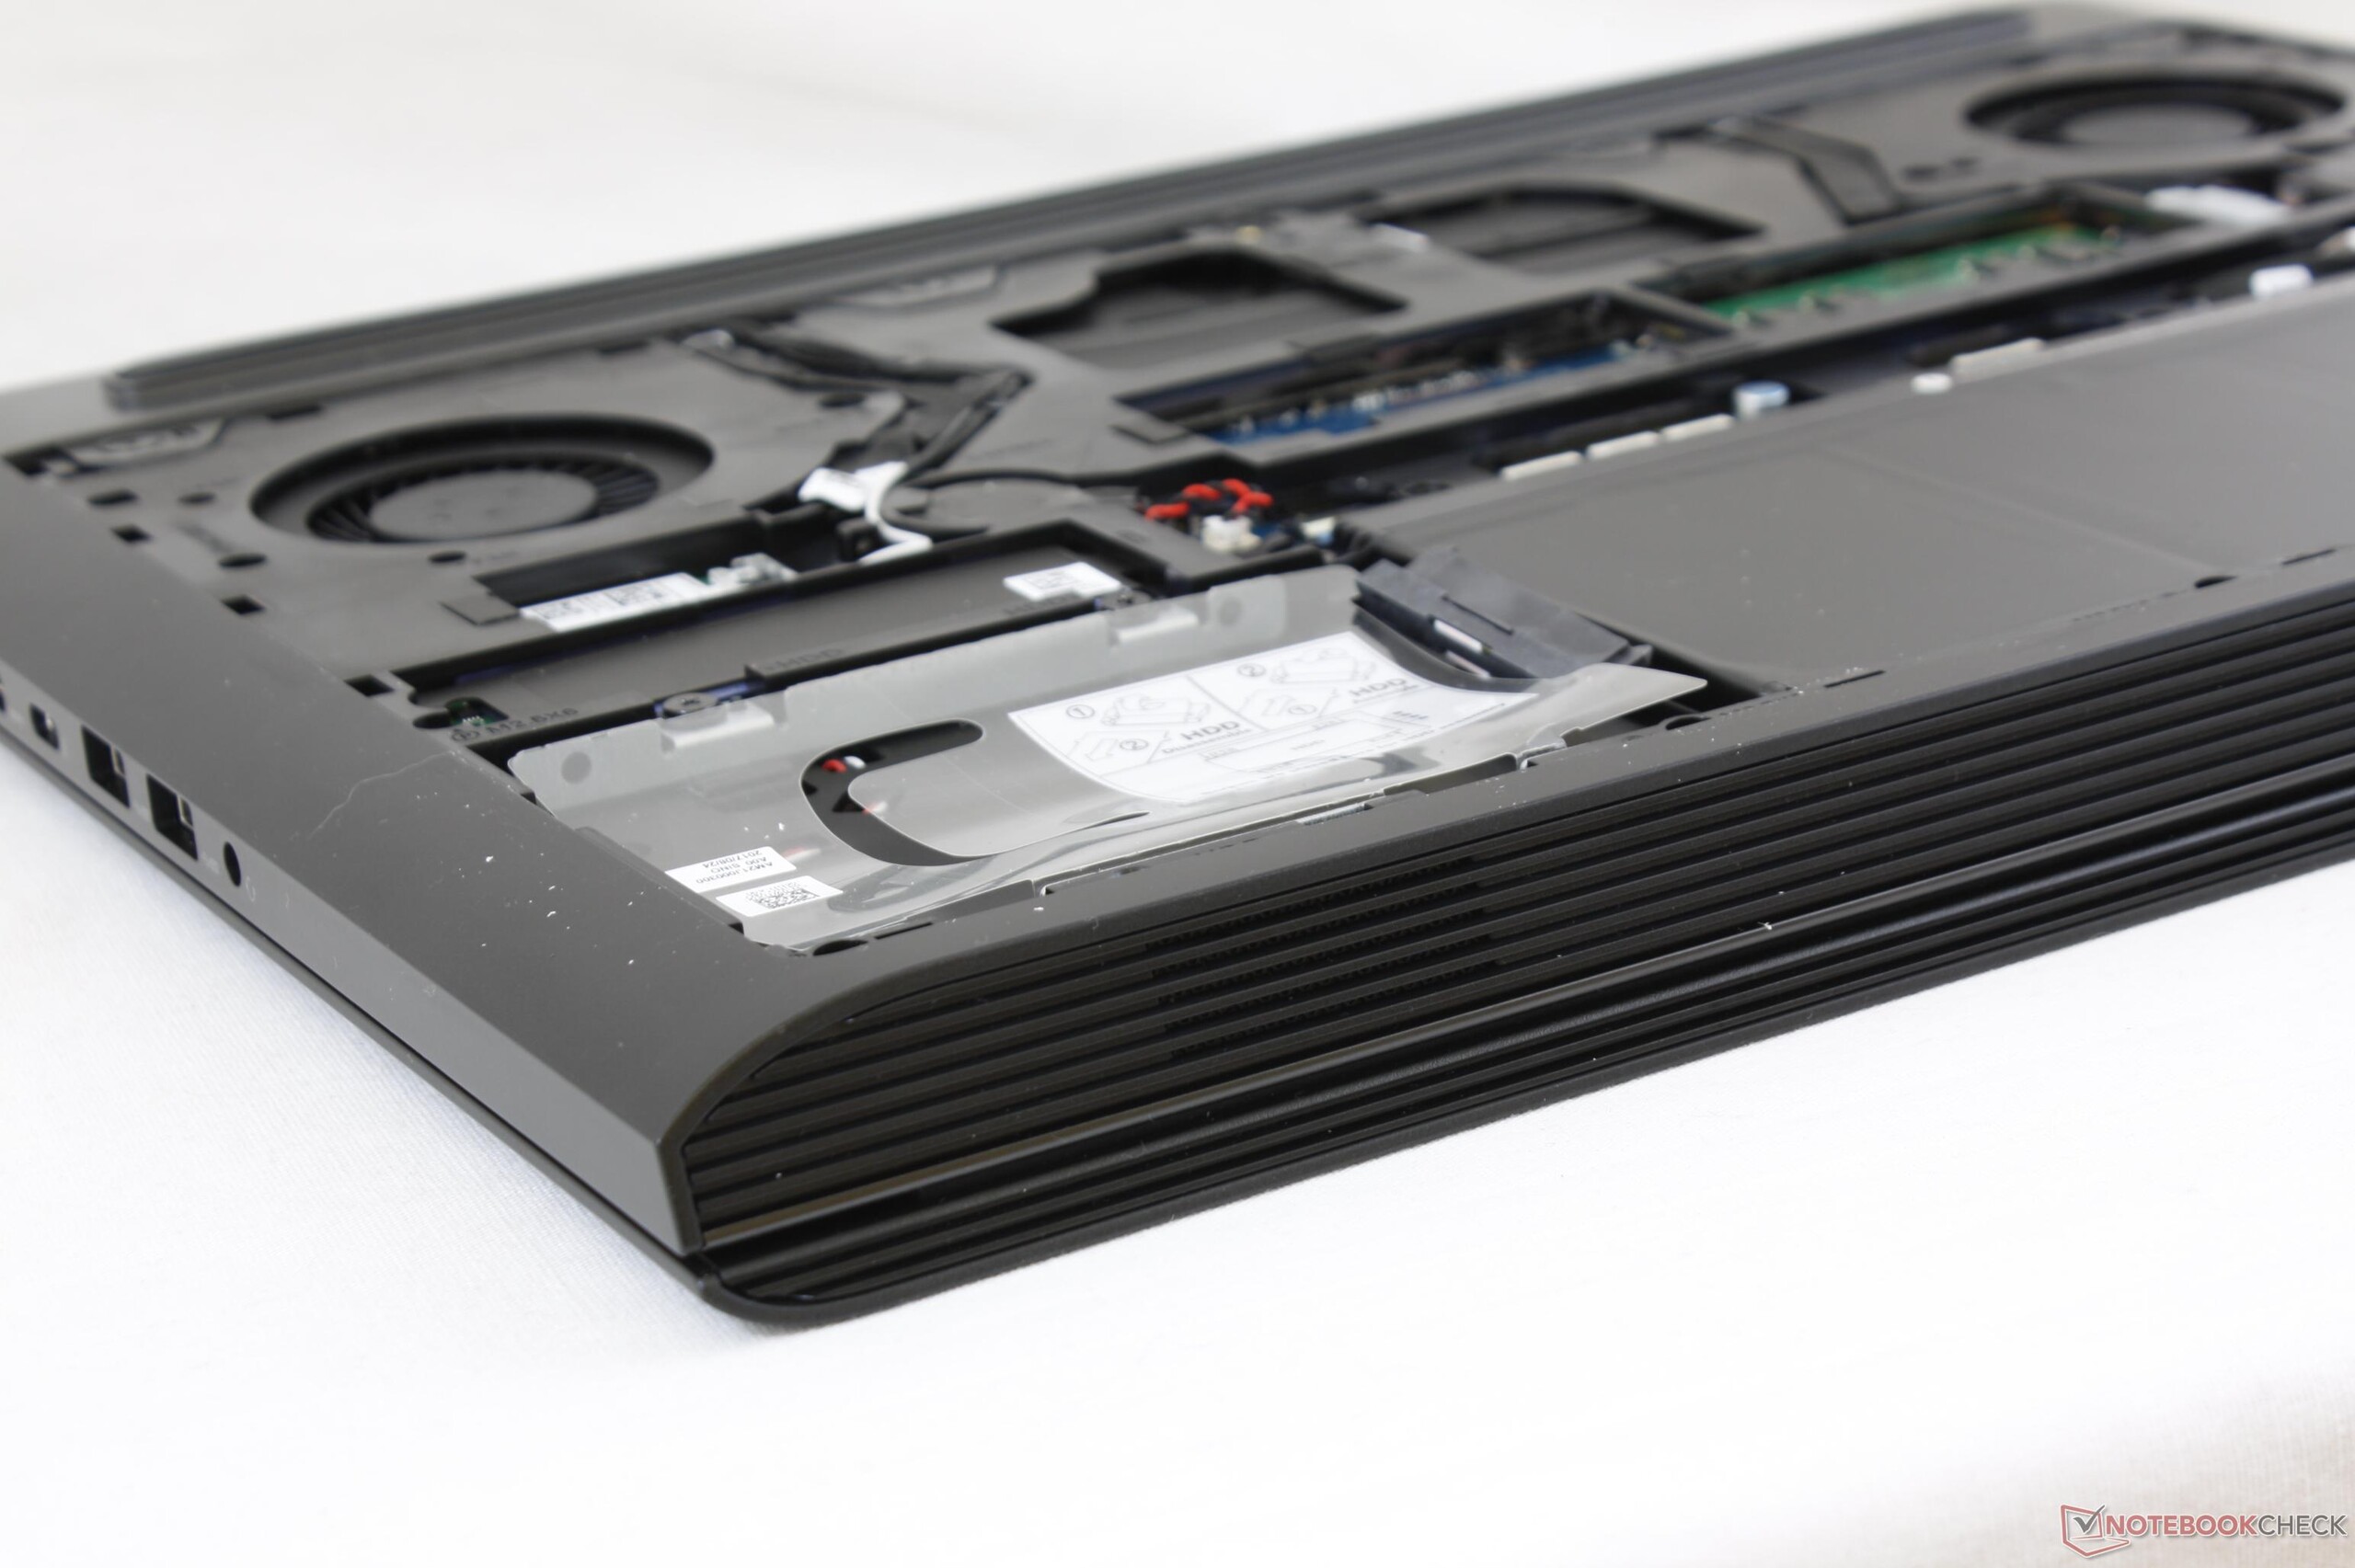
El Inspiron 7577 es un sistema gaming increíble por el precio, todo gracias a su base sólida, interiores accesibles y la GPU GTX 1060 Max-Q. El cambio de GPU solo ha hecho que la máquina funcione de forma más silenciosa, rápida y eficiente que todas las configuraciones del Inspiron 7567. No todos los días un sucesor inmediato ofrece un aumento del 35 al 70% en el rendimiento de gráficos con un consumo de energía de 5 a 10% y todavía logran tener ventiladores mas silenciosos cuando juegan.
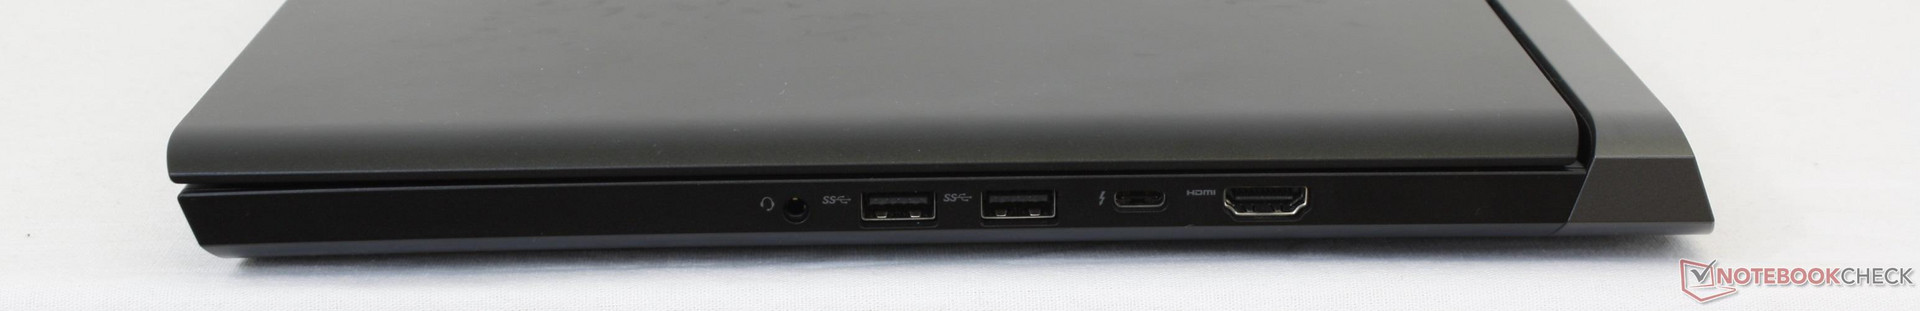
Cuando se compara con competidores como el Omen 15 (7700HQ, GTX 1060 Max-Q) o el MSI GF62VR (7700HQ, GTX 1060), el Dell fácilmente supera a ambos en general. El consumo de energía es más bajo que el MSI en aproximadamente un 40% para una reducción muy pequeña del 5 al 10% en el rendimiento de los gráficos. A su vez, el ruido del ventilador se reduce significativamente y la batería aguanta varias horas más. El sistema incluso logra ser más silencioso que el Omen 15 a pesar de tener la misma GPU Max-Q y las mismas puntuaciones de rendimiento en 3D. Inclúyele un Thunderbolt 3 y el bajo precio inicial de $900 USD y el Inspiron 7577 se ha convertido rápidamente en nuestro portátil favorito para juegos por menos de $1000 USD.
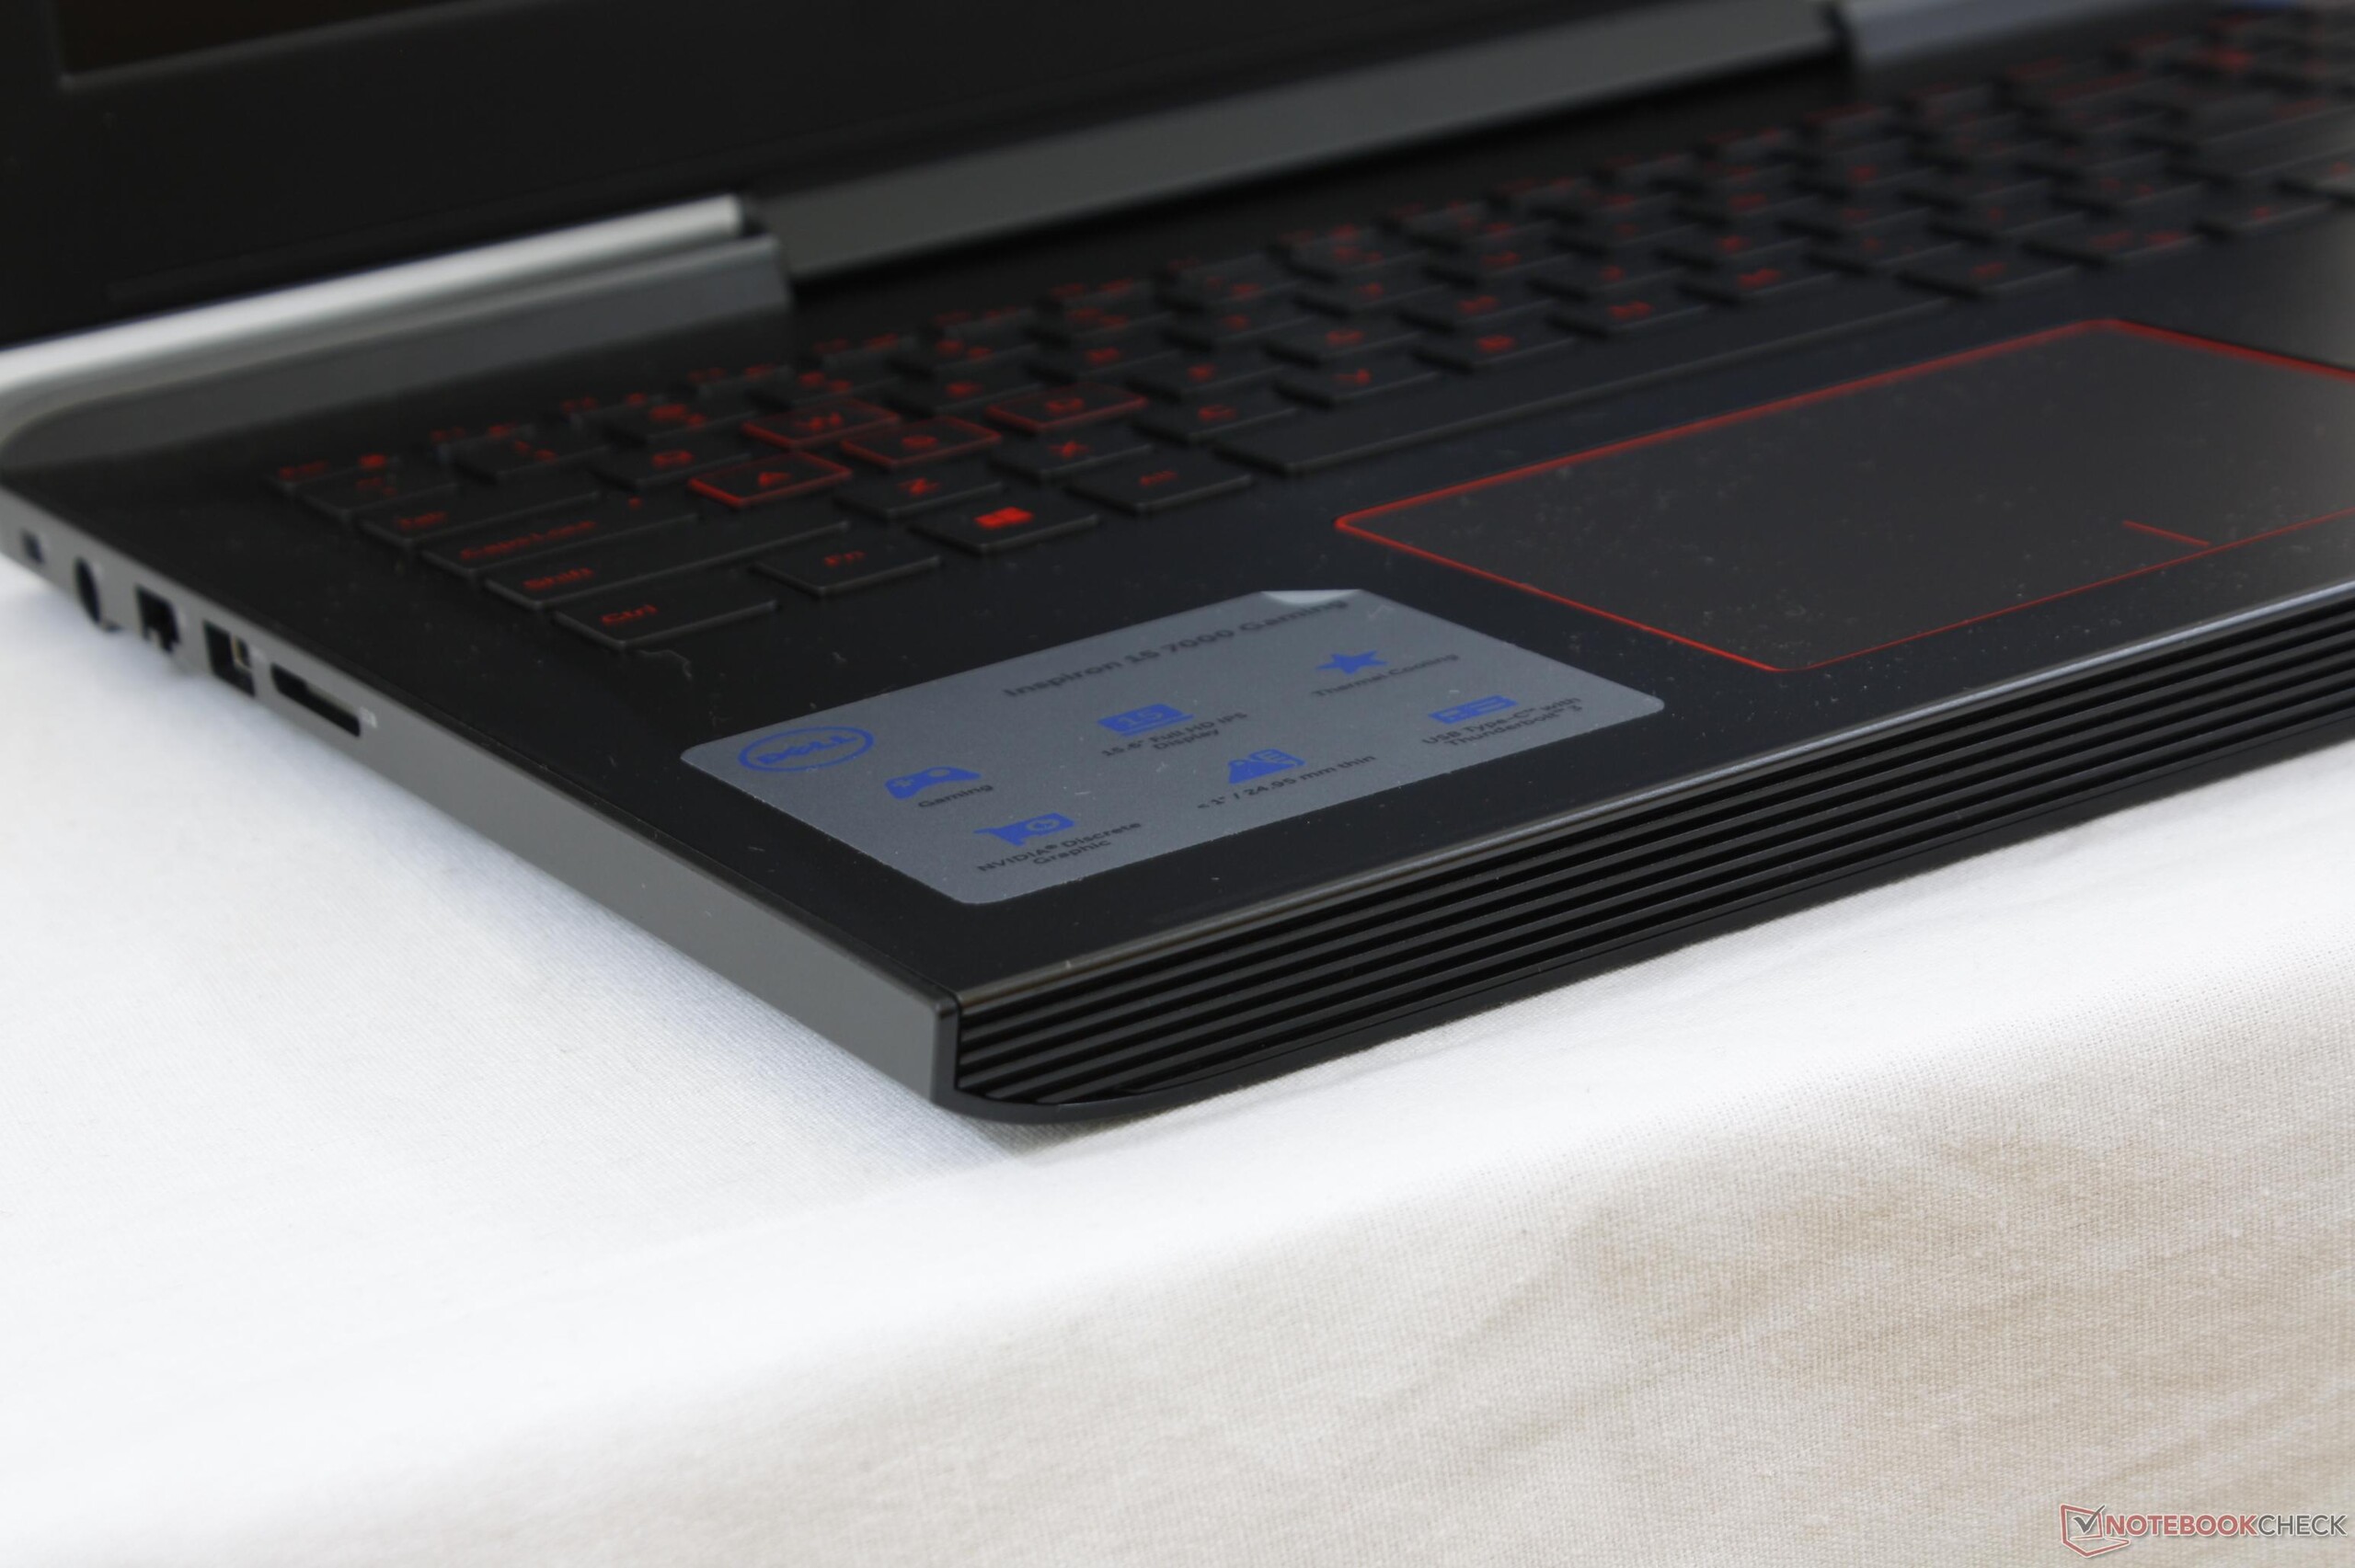
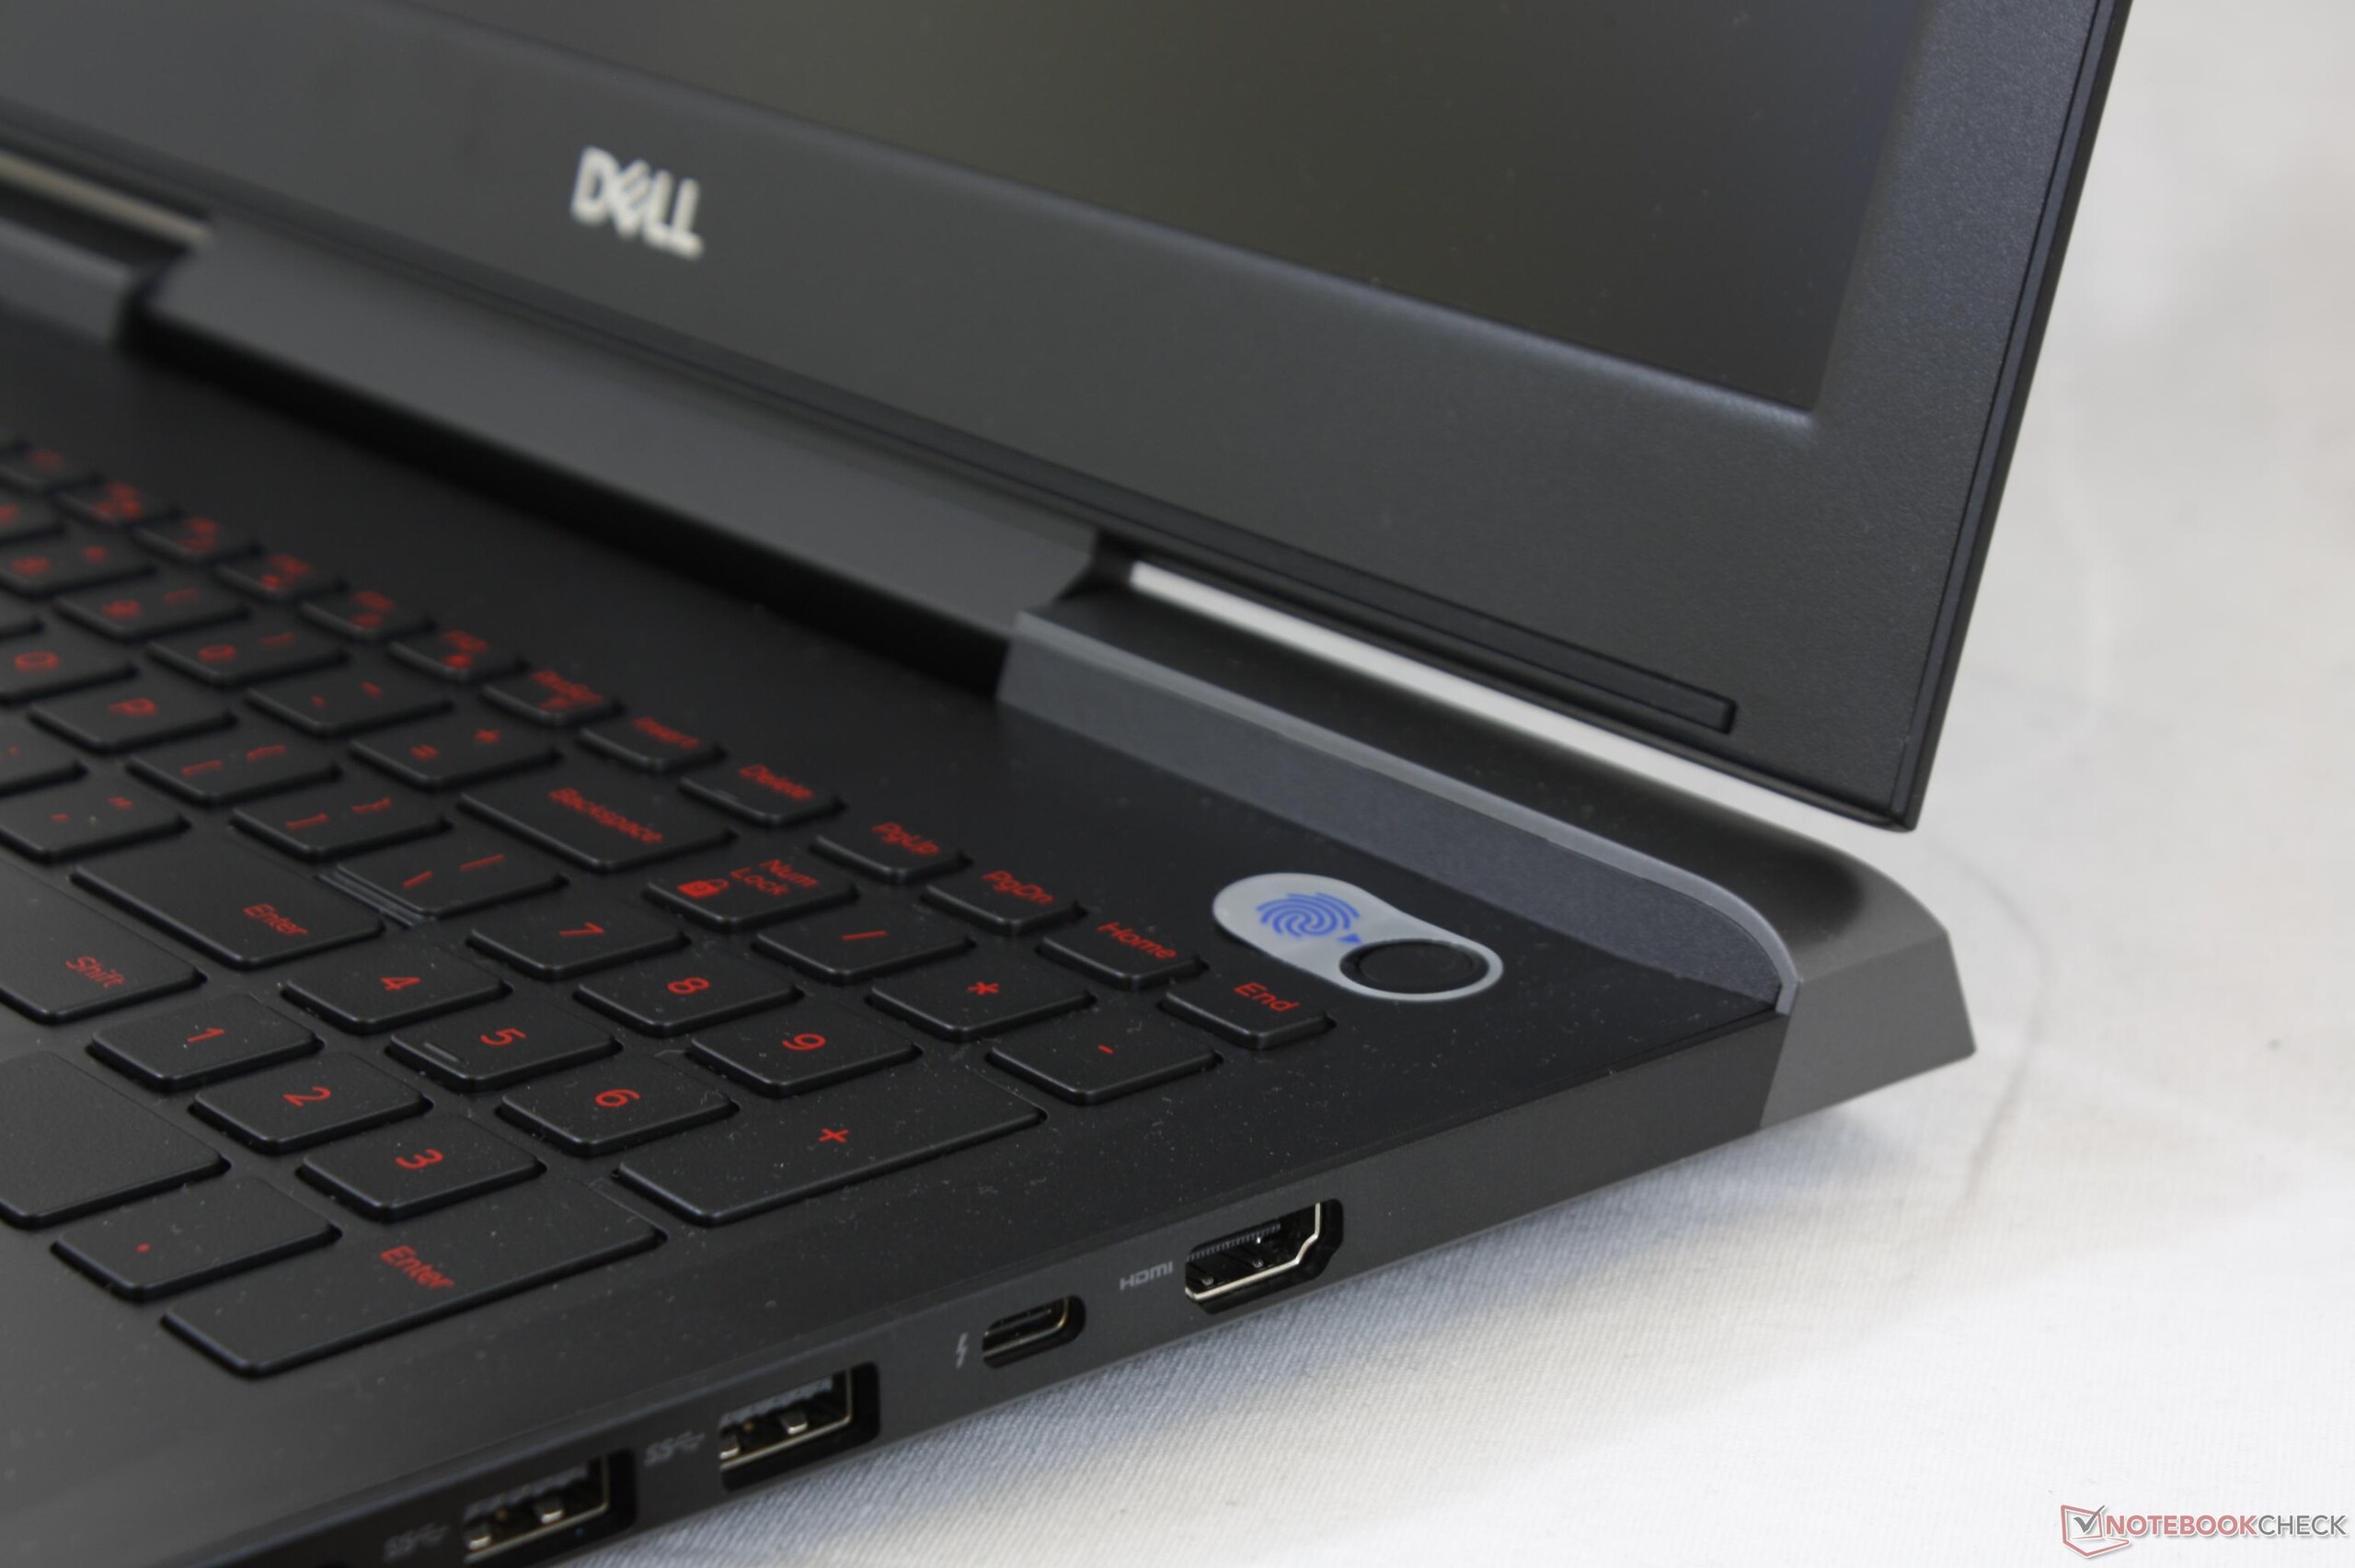
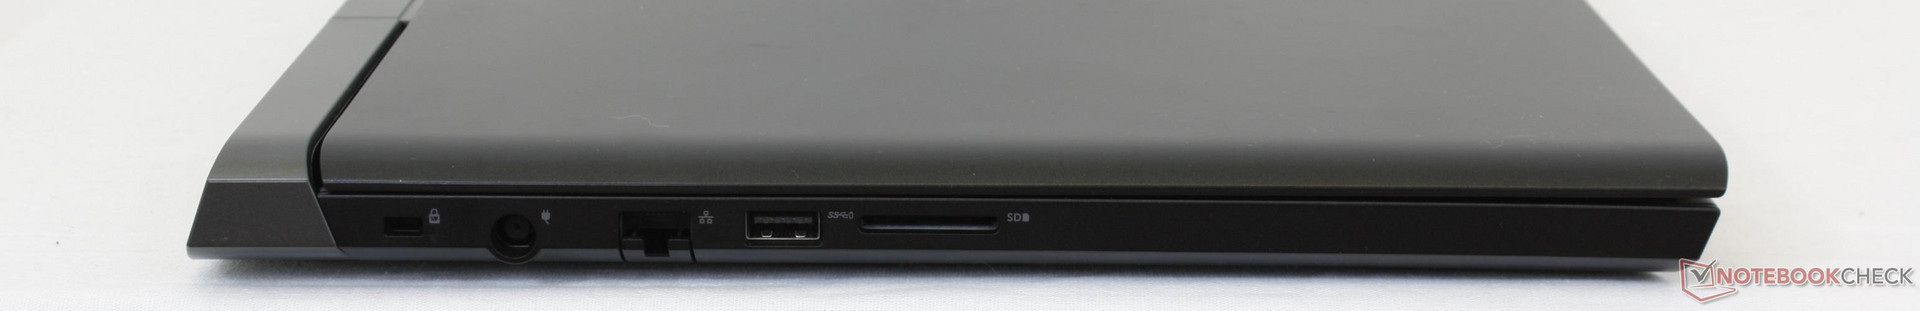
Algunos inconvenientes clave separan al Inspiron 7577 de modelos más costosos como el Alienware 15 o el Aorus X5. En primer lugar, a la pantalla de 1080p le faltan características. Los colores no concuerdan con los paneles de los sistemas antes mencionados, donde es posible >90% de la cobertura de sRGB. Tan nítidos como son en Dell, los colores simplemente no son tan profundos como podrían haber sido. Con gusto hubiéramos renunciado al panel 4K UHD en la configuración superior de Inspiron 7577 a cambio de que trajera G-Sync, tiempos de respuesta de visualización más rápidos, colores más precisos y una luz de fondo de pantalla más brillante para la serie. En segundo lugar, las teclas del teclado son más suaves de lo esperado para un portátil gaming de 15". Ya sabemos que Dell puede hacerlo mejor que esto, como lo demuestran los teclados superiores de las series Latitude y XPS, por lo que no hay motivo para que el Inspiron no reciba un tratamiento similar. Otras quejas más pequeñas como la falta de iluminación RGB por tecla, un lector de tarjeta SD muy lento, altavoces más débiles y un peso relativamente alto son menos cruciales para la experiencia de juego en comparación con la comodidad, la pantalla, el ruido y el rendimiento del teclado.
El Inspiron 7577 es el mejor portátil para juegos para usuarios con un presupuesto ajustado. Es sorprendentemente silencioso y duradero con un rendimiento de gráficos sólido que va más allá de su precio inicial. La pantalla y el teclado son los dos aspectos que se sienten "de bajo presupuesto" en esta oferta convencional que por lo demás es excepcional.
Ésta es una versión acortada del análisis original. Puedes leer el análisis completo en inglés aquí.
Dell Inspiron 15 7000 7577
- 01/03/2018 v6 (old)
Allen Ngo
Price comparison
