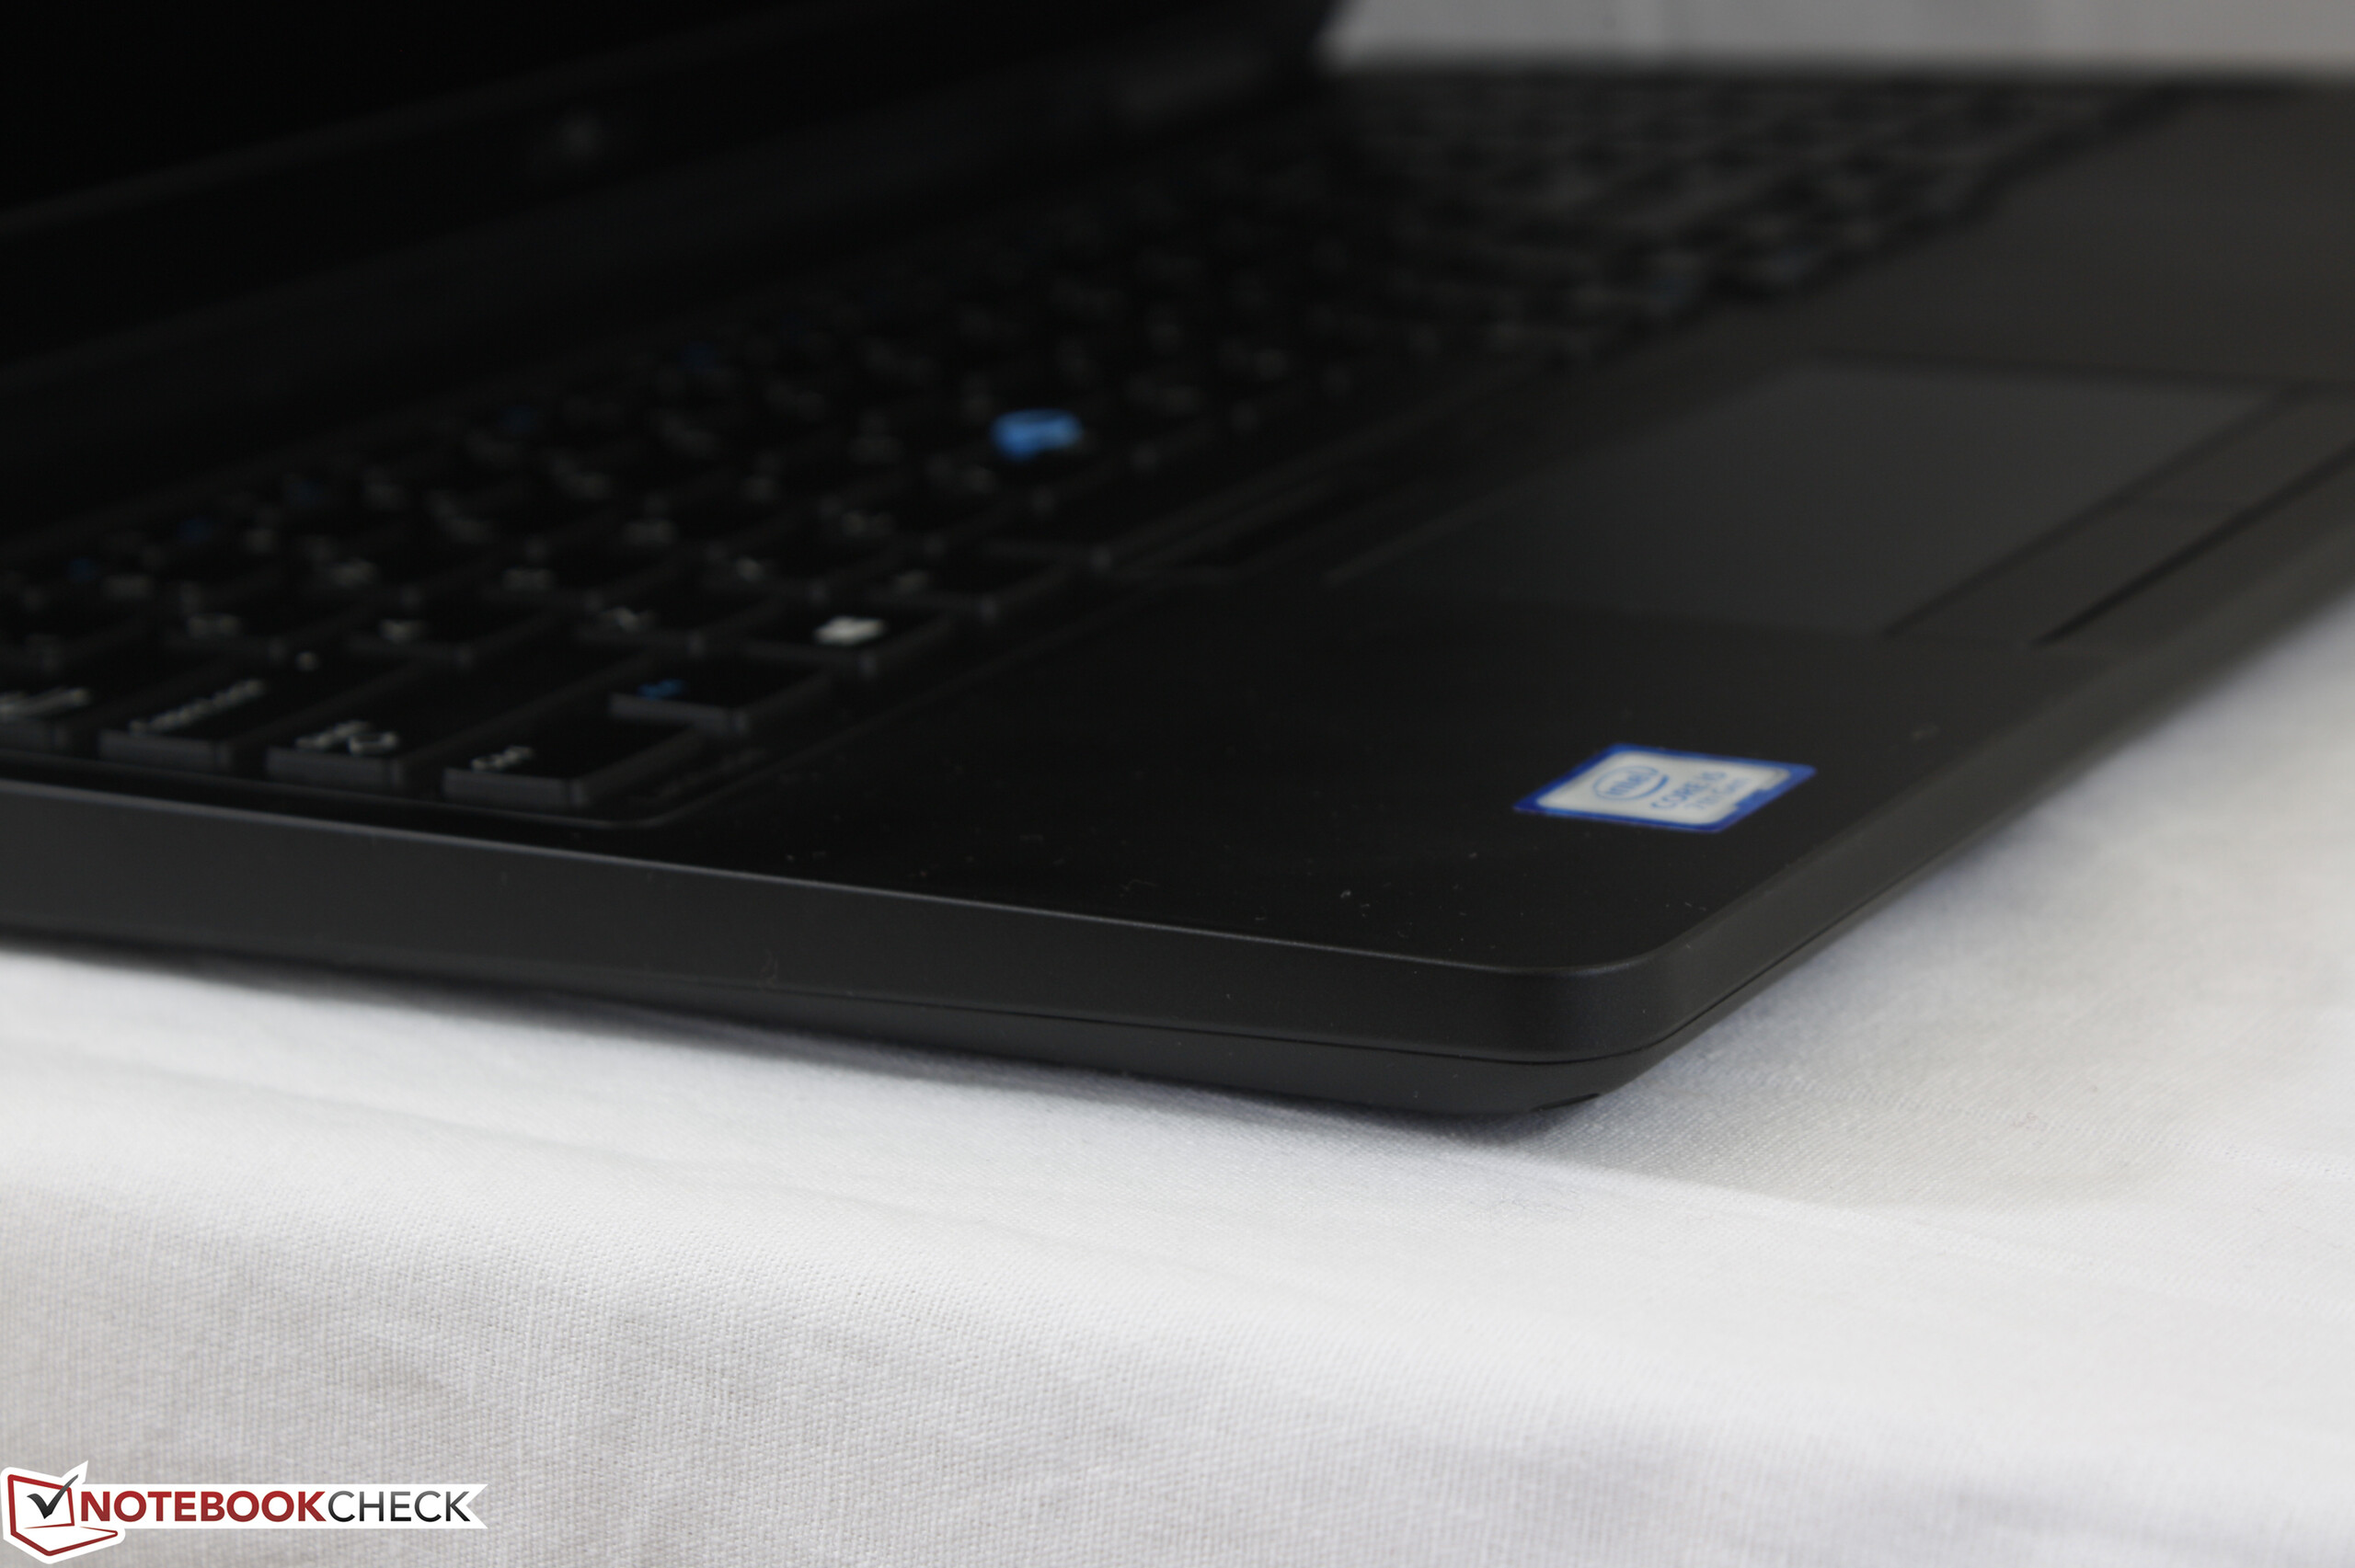
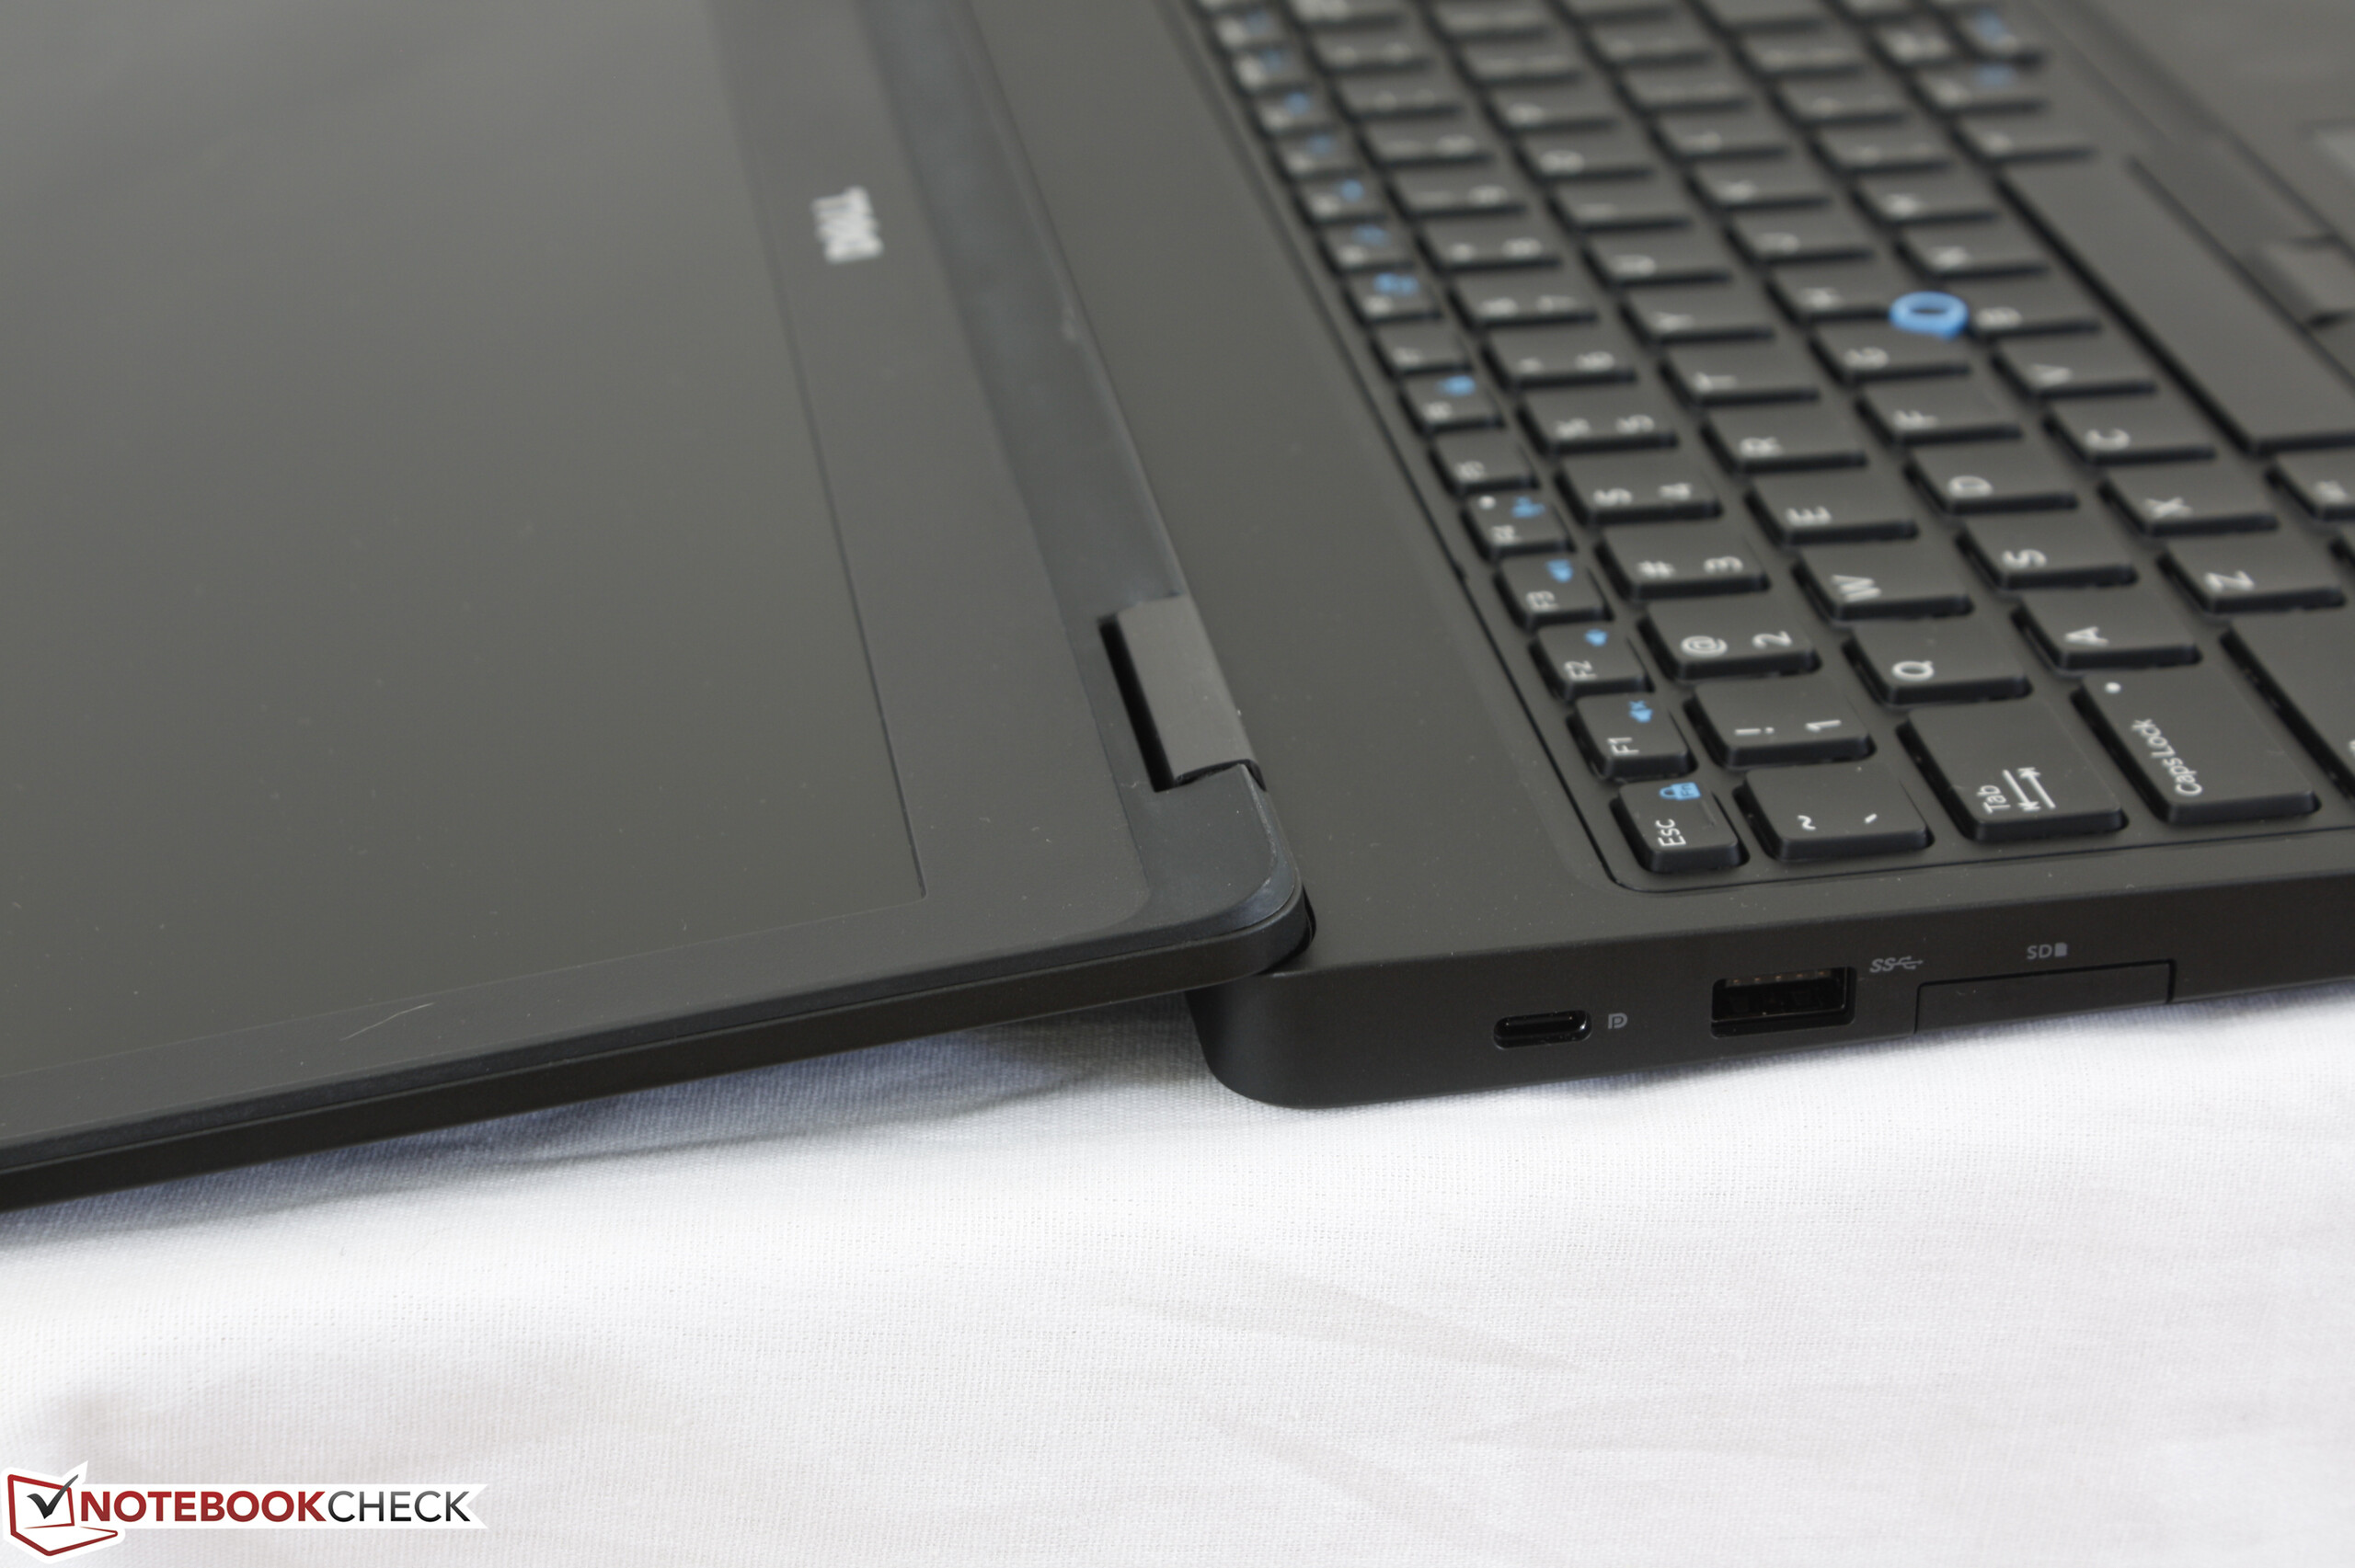
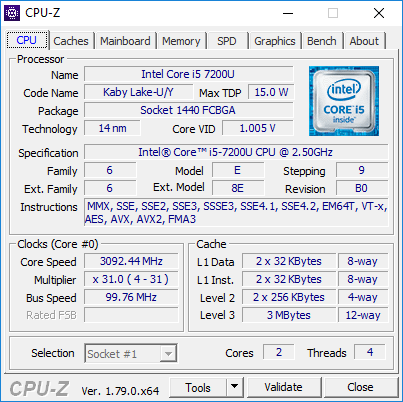
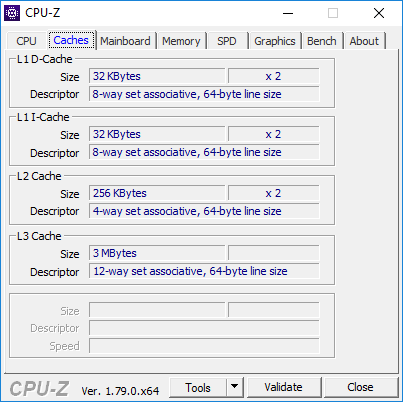
Breve análisis del portátil Dell Latitude 5580 (i5-7200U, HD)


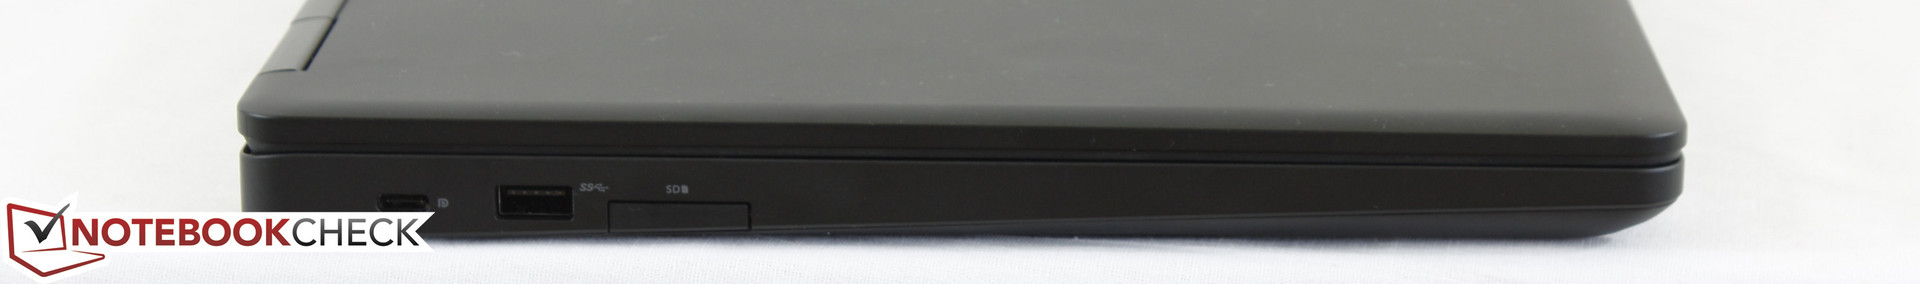
| SD Card Reader | |
| average JPG Copy Test (av. of 3 runs) | |
| Dell XPS 15 9560 (i7-7700HQ, UHD) | |
| Dell Latitude 5580 | |
| Lenovo ThinkPad T570-20H90002GE | |
| maximum AS SSD Seq Read Test (1GB) | |
| Dell Latitude 5580 | |
| Dell XPS 15 9560 (i7-7700HQ, UHD) | |
| Lenovo ThinkPad T570-20H90002GE | |
| Networking | |
| iperf3 transmit AX12 | |
| Asus AsusPro P4540UQ-FY0056R | |
| Lenovo ThinkPad T570-20H90002GE | |
| Dell Latitude 5580 | |
| iperf3 receive AX12 | |
| Dell Latitude 5580 | |
| Lenovo ThinkPad T570-20H90002GE | |
| Asus AsusPro P4540UQ-FY0056R | |
| |||||||||||||||||||||||||
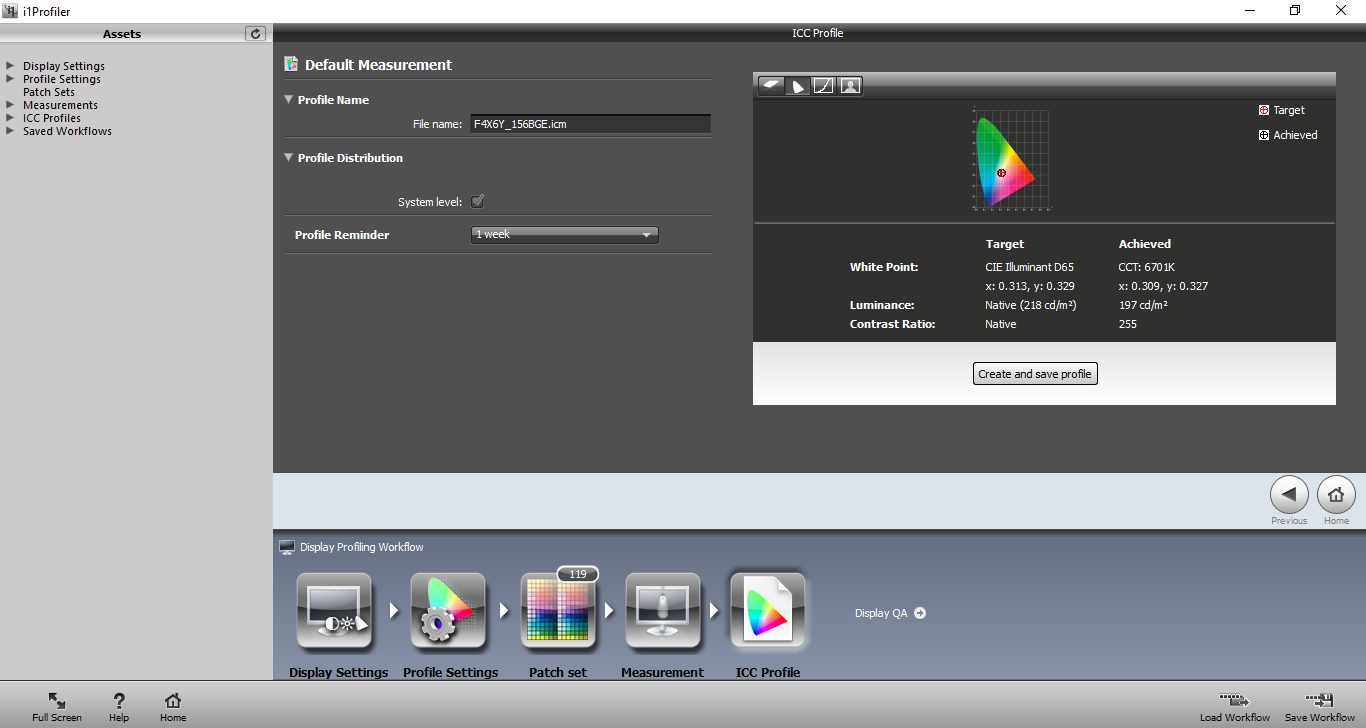
iluminación: 83 %
Brillo con batería: 238 cd/m²
Contraste: 449:1 (Negro: 0.53 cd/m²)
ΔE ColorChecker Calman: 10.8 | ∀{0.5-29.43 Ø4.73}
ΔE Greyscale Calman: 12.1 | ∀{0.09-98 Ø4.97}
59.9% sRGB (Argyll 1.6.3 3D)
38.3% AdobeRGB 1998 (Argyll 1.6.3 3D)
41.5% AdobeRGB 1998 (Argyll 3D)
60% sRGB (Argyll 3D)
40.13% Display P3 (Argyll 3D)
Gamma: 2.25
CCT: 14344 K
| Dell Latitude 5580 TN LED, 15.6", 1366x768 | Lenovo ThinkPad T570-20H90002GE N156HCA-EAA, IPS, 15.6", 1920x1080 | Asus AsusPro P4540UQ-FY0056R LG Philips LP156WF6-SPB6, IPS, 15.6", 1920x1080 | Toshiba Satellite Pro R50-C-16V Toshiba, TN LED, 15.6", 1366x768 | HP Probook 650 G3 Z2W44ET AU Optronics, TN LED, 15.6", 1920x1080 | |
|---|---|---|---|---|---|
| Display | 10% | 48% | 1% | 37% | |
| Display P3 Coverage (%) | 40.13 | 44.08 10% | 63.3 58% | 40.6 1% | 55.2 38% |
| sRGB Coverage (%) | 60 | 65.6 9% | 83.6 39% | 61.2 2% | 81.1 35% |
| AdobeRGB 1998 Coverage (%) | 41.5 | 45.66 10% | 61.1 47% | 41.95 1% | 57 37% |
| Response Times | -5% | -13% | -58% | -9% | |
| Response Time Grey 50% / Grey 80% * (ms) | 30 ? | 41.6 ? -39% | 38 ? -27% | 68 ? -127% | 38 ? -27% |
| Response Time Black / White * (ms) | 29.6 ? | 20.8 ? 30% | 29 ? 2% | 26 ? 12% | 27 ? 9% |
| PWM Frequency (Hz) | 201.6 ? | 26040 ? | 21000 ? | 217 ? | 200 ? |
| Screen | 44% | 52% | 5% | 22% | |
| Brightness middle (cd/m²) | 238 | 262 10% | 276 16% | 226 -5% | 351 47% |
| Brightness (cd/m²) | 216 | 245 13% | 283 31% | 217 0% | 345 60% |
| Brightness Distribution (%) | 83 | 89 7% | 85 2% | 91 10% | 95 14% |
| Black Level * (cd/m²) | 0.53 | 0.24 55% | 0.27 49% | 0.58 -9% | 0.65 -23% |
| Contrast (:1) | 449 | 1092 143% | 1022 128% | 390 -13% | 540 20% |
| Colorchecker dE 2000 * | 10.8 | 4.5 58% | 3.92 64% | 9.84 9% | 11.02 -2% |
| Colorchecker dE 2000 max. * | 29.3 | 10.5 64% | 9.13 69% | 16.77 43% | 17.68 40% |
| Greyscale dE 2000 * | 12.1 | 3.5 71% | 2.6 79% | 11.1 8% | 13.14 -9% |
| Gamma | 2.25 98% | 2.32 95% | 2.53 87% | 2.35 94% | 2.7 81% |
| CCT | 14344 45% | 6524 100% | 6561 99% | 11979 54% | 16626 39% |
| Color Space (Percent of AdobeRGB 1998) (%) | 38.3 | 42.04 10% | 54.5 42% | 39 2% | 52 36% |
| Color Space (Percent of sRGB) (%) | 59.9 | 65.4 9% | 83.7 40% | 61 2% | 81 35% |
| Media total (Programa/Opciones) | 16% /
31% | 29% /
43% | -17% /
-4% | 17% /
21% |
* ... más pequeño es mejor
Tiempos de respuesta del display
| ↔ Tiempo de respuesta de Negro a Blanco | ||
|---|---|---|
| 29.6 ms ... subida ↗ y bajada ↘ combinada | ↗ 21.2 ms subida | 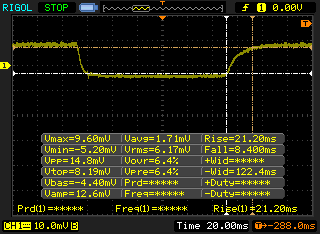 |
| ↘ 8.4 ms bajada | ||
| La pantalla mostró tiempos de respuesta relativamente lentos en nuestros tests pero podría ser demasiado lenta para los jugones. En comparación, todos los dispositivos de prueba van de ##min### (mínimo) a 240 (máximo) ms. » 79 % de todos los dispositivos son mejores. Eso quiere decir que el tiempo de respuesta es peor que la media (19.9 ms) de todos los dispositivos testados. | ||
| ↔ Tiempo de respuesta 50% Gris a 80% Gris | ||
| 30 ms ... subida ↗ y bajada ↘ combinada | ↗ 19.2 ms subida | 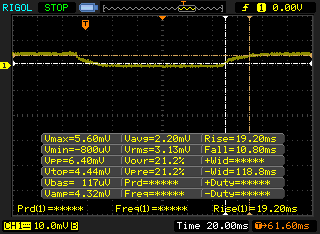 |
| ↘ 10.8 ms bajada | ||
| La pantalla mostró tiempos de respuesta lentos en nuestros tests y podría ser demasiado lenta para los jugones. En comparación, todos los dispositivos de prueba van de ##min### (mínimo) a 636 (máximo) ms. » 40 % de todos los dispositivos son mejores. Eso quiere decir que el tiempo de respuesta es similar al dispositivo testado medio (31.1 ms). | ||
Parpadeo de Pantalla / PWM (Pulse-Width Modulation)
| Parpadeo de Pantalla / PWM detectado | 201.6 Hz | ≤ 99 % de brillo | 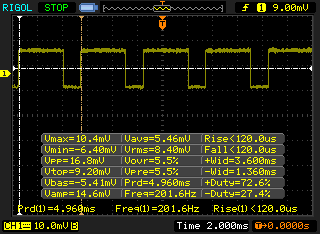 |
La retroiluminación del display parpadea a 201.6 Hz (seguramente usa PWM - Pulse-Width Modulation) a un brillo del 99 % e inferior. Sobre este nivel de brillo no debería darse parpadeo / PWM. La frecuencia de 201.6 Hz es relativamente baja, por lo que la gente sensible debería ver parpadeos y padecer fatiga visual por la pantalla (usado al brillo indicado a continuación). Comparación: 52 % de todos los dispositivos testados no usaron PWM para atenuar el display. Si se usó, medimos una media de 7784 (mínimo: 5 - máxmo: 343500) Hz. | |||
| wPrime 2.10 - 1024m | |
| Lenovo Thinkpad 13-20J1001BUS | |
| Dell Latitude 7480 | |
| Dell Latitude 5580 | |
| Lenovo ThinkPad T470s-20HF0012US | |
| Apple MacBook Pro 15 2016 (2.7 GHz, 455) | |
* ... más pequeño es mejor
| PCMark 8 Home Score Accelerated v2 | 3345 puntos | |
| PCMark 8 Creative Score Accelerated v2 | 3942 puntos | |
| PCMark 8 Work Score Accelerated v2 | 4390 puntos | |
ayuda | ||
| Dell Latitude 5580 Seagate ST500LM021-1KJ15 | Lenovo ThinkPad T570-20H90002GE Samsung PM961 MZVLW256HEHP | Asus AsusPro P4540UQ-FY0056R SK Hynix HFS256G39TND-N210A | Toshiba Satellite Pro R50-C-16V TOSHIBA MQ01ABD075 | HP ProBook 650 G3 Z2N47EA Samsung SSD 850 EVO 250GB | |
|---|---|---|---|---|---|
| CrystalDiskMark 3.0 | 16541% | 10100% | -30% | 7088% | |
| Read Seq (MB/s) | 132.3 | 1318 896% | 498.4 277% | 96.5 -27% | 506 282% |
| Write Seq (MB/s) | 131.1 | 1166 789% | 257.1 96% | 77.9 -41% | 475.2 262% |
| Read 512 (MB/s) | 27.04 | 933 3350% | 309.3 1044% | 20.82 -23% | 435.9 1512% |
| Write 512 (MB/s) | 56.6 | 860 1419% | 264.2 367% | 19.83 -65% | 367.2 549% |
| Read 4k (MB/s) | 0.459 | 56.6 12231% | 30.6 6567% | 0.342 -25% | 41.78 9002% |
| Write 4k (MB/s) | 0.812 | 130.6 15984% | 77.3 9420% | 0.836 3% | 86.1 10503% |
| Read 4k QD32 (MB/s) | 1.1 | 510 46264% | 357.4 32391% | 0.595 -46% | 263.2 23827% |
| Write 4k QD32 (MB/s) | 0.828 | 426.4 51398% | 254.5 30637% | 0.706 -15% | 90 10770% |

| 3DMark 11 | |
| 1280x720 Performance GPU | |
| Dell Latitude 12 5285 2-in-1 | |
| Lenovo ThinkPad T470s-20HF0012US | |
| Dell Latitude 5480 N005L548014EMEA | |
| Lenovo Miix 510 Pro 80U10006GE | |
| Dell Latitude 5580 | |
| Toshiba Portege Z20t-C-121 | |
| Asus Vivobook F556UQ-XO626D | |
| Asus PU551LA-XO359G | |
| Acer Aspire One Cloudbook 14 AO1-431-C6QM | |
| 1280x720 Performance Combined | |
| Dell Latitude 5480 N005L548014EMEA | |
| Lenovo ThinkPad T470s-20HF0012US | |
| Dell Latitude 12 5285 2-in-1 | |
| Lenovo Miix 510 Pro 80U10006GE | |
| Asus Vivobook F556UQ-XO626D | |
| Dell Latitude 5580 | |
| Asus PU551LA-XO359G | |
| Toshiba Portege Z20t-C-121 | |
| Acer Aspire One Cloudbook 14 AO1-431-C6QM | |
| 3DMark | |
| 1280x720 Cloud Gate Standard Graphics | |
| Dell Latitude 12 5285 2-in-1 | |
| Dell Latitude 5480 N005L548014EMEA | |
| Lenovo ThinkPad T470s-20HF0012US | |
| Lenovo Miix 510 Pro 80U10006GE | |
| Dell Latitude 5580 | |
| Asus Vivobook F556UQ-XO626D | |
| Acer Aspire One Cloudbook 14 AO1-431-C6QM | |
| 1920x1080 Fire Strike Graphics | |
| Dell Latitude 12 5285 2-in-1 | |
| Dell Latitude 5480 N005L548014EMEA | |
| Lenovo ThinkPad T470s-20HF0012US | |
| Dell Latitude 5580 | |
| Asus PU551LA-XO359G | |
| Asus Vivobook F556UQ-XO626D | |
| Acer Aspire One Cloudbook 14 AO1-431-C6QM | |
| 1280x720 Ice Storm Standard Graphics | |
| Dell Latitude 5480 N005L548014EMEA | |
| Lenovo ThinkPad T470s-20HF0012US | |
| Asus Vivobook F556UQ-XO626D | |
| Asus PU551LA-XO359G | |
| Dell Latitude 5580 | |
| Acer Aspire One Cloudbook 14 AO1-431-C6QM | |
| Dell Latitude 12 5285 2-in-1 | |
| 1920x1080 Ice Storm Extreme Graphics | |
| Dell Latitude 5480 N005L548014EMEA | |
| Dell Latitude 12 5285 2-in-1 | |
| Dell Latitude 5580 | |
| Asus PU551LA-XO359G | |
| Asus Vivobook F556UQ-XO626D | |
| 3DMark 11 Performance | 1354 puntos | |
| 3DMark Ice Storm Standard Score | 47545 puntos | |
| 3DMark Cloud Gate Standard Score | 5273 puntos | |
| 3DMark Fire Strike Score | 621 puntos | |
ayuda | ||
| bajo | medio | alto | ultra | |
|---|---|---|---|---|
| BioShock Infinite (2013) | 52 | 29 | ||
| Rise of the Tomb Raider (2016) | 19.1 | 11.2 |
Ruido
| Ocioso |
| 32.6 / 32.6 / 32.8 dB(A) |
| HDD |
| 33.2 dB(A) |
| Carga |
| 33.5 / 34.7 dB(A) |
 | ||
30 dB silencioso 40 dB(A) audible 50 dB(A) ruidosamente alto |
||
min: | ||
| Dell Latitude 5580 HD Graphics 620, i5-7200U, Seagate ST500LM021-1KJ15 | Lenovo ThinkPad T570-20H90002GE HD Graphics 620, i5-7200U, Samsung PM961 MZVLW256HEHP | Asus AsusPro P4540UQ-FY0056R GeForce 940MX, i5-7200U, SK Hynix HFS256G39TND-N210A | Toshiba Satellite Pro R50-C-16V HD Graphics 520, 6006U, TOSHIBA MQ01ABD075 | HP ProBook 650 G3 Z2N47EA HD Graphics 620, i5-7200U, Samsung SSD 850 EVO 250GB | |
|---|---|---|---|---|---|
| Noise | 1% | 0% | 2% | -7% | |
| apagado / medio ambiente * (dB) | 28.2 | 29.3 -4% | 30.3 -7% | 30.4 -8% | |
| Idle Minimum * (dB) | 32.6 | 29.3 10% | 30.3 7% | 31.8 2% | 32.5 -0% |
| Idle Average * (dB) | 32.6 | 29.3 10% | 30.3 7% | 31.8 2% | 33.1 -2% |
| Idle Maximum * (dB) | 32.8 | 31.2 5% | 30.3 8% | 31.8 3% | 33.7 -3% |
| Load Average * (dB) | 33.5 | 35.1 -5% | 35.4 -6% | 31.9 5% | 37 -10% |
| Load Maximum * (dB) | 34.7 | 38.7 -12% | 37.2 -7% | 31.8 8% | 42.5 -22% |
* ... más pequeño es mejor
(+) La temperatura máxima en la parte superior es de 36.2 °C / 97 F, frente a la media de 34.3 °C / 94 F, que oscila entre 21.2 y 62.5 °C para la clase Office.
(-) El fondo se calienta hasta un máximo de 45.6 °C / 114 F, frente a la media de 36.8 °C / 98 F
(+) En reposo, la temperatura media de la parte superior es de 25 °C / 77# F, frente a la media del dispositivo de 29.5 °C / 85 F.
(+) El reposamanos y el panel táctil están a una temperatura inferior a la de la piel, con un máximo de 27.2 °C / 81 F y, por tanto, son fríos al tacto.
(±) La temperatura media de la zona del reposamanos de dispositivos similares fue de 27.5 °C / 81.5 F (+0.3 °C / 0.5 F).
Dell Latitude 5580 análisis de audio
(-) | altavoces no muy altos (#70.2 dB)
Graves 100 - 315 Hz
(±) | lubina reducida - en promedio 12.5% inferior a la mediana
(±) | la linealidad de los graves es media (10.4% delta a frecuencia anterior)
Medios 400 - 2000 Hz
(+) | medios equilibrados - a sólo 4.6% de la mediana
(±) | la linealidad de los medios es media (8.9% delta respecto a la frecuencia anterior)
Altos 2 - 16 kHz
(±) | máximos más altos - de media 5.1% más altos que la mediana
(±) | la linealidad de los máximos es media (9.9% delta a frecuencia anterior)
Total 100 - 16.000 Hz
(±) | la linealidad del sonido global es media (24.6% de diferencia con la mediana)
En comparación con la misma clase
» 73% de todos los dispositivos probados de esta clase eran mejores, 7% similares, 21% peores
» El mejor tuvo un delta de 7%, la media fue 21%, el peor fue ###max##%
En comparación con todos los dispositivos probados
» 75% de todos los dispositivos probados eran mejores, 5% similares, 20% peores
» El mejor tuvo un delta de 4%, la media fue 24%, el peor fue ###max##%
Apple MacBook 12 (Early 2016) 1.1 GHz análisis de audio
(+) | los altavoces pueden reproducir a un volumen relativamente alto (#83.6 dB)
Graves 100 - 315 Hz
(±) | lubina reducida - en promedio 11.3% inferior a la mediana
(±) | la linealidad de los graves es media (14.2% delta a frecuencia anterior)
Medios 400 - 2000 Hz
(+) | medios equilibrados - a sólo 2.4% de la mediana
(+) | los medios son lineales (5.5% delta a la frecuencia anterior)
Altos 2 - 16 kHz
(+) | máximos equilibrados - a sólo 2% de la mediana
(+) | los máximos son lineales (4.5% delta a la frecuencia anterior)
Total 100 - 16.000 Hz
(+) | el sonido global es lineal (10.2% de diferencia con la mediana)
En comparación con la misma clase
» 7% de todos los dispositivos probados de esta clase eran mejores, 2% similares, 91% peores
» El mejor tuvo un delta de 5%, la media fue 18%, el peor fue ###max##%
En comparación con todos los dispositivos probados
» 5% de todos los dispositivos probados eran mejores, 1% similares, 94% peores
» El mejor tuvo un delta de 4%, la media fue 24%, el peor fue ###max##%
| Off / Standby | |
| Ocioso | |
| Carga |
|
Clave:
min: | |
| Dell Latitude 5580 i5-7200U, HD Graphics 620, Seagate ST500LM021-1KJ15, TN LED, 1366x768, 15.6" | Lenovo ThinkPad T570-20H90002GE i5-7200U, HD Graphics 620, Samsung PM961 MZVLW256HEHP, IPS, 1920x1080, 15.6" | Asus AsusPro P4540UQ-FY0056R i5-7200U, GeForce 940MX, SK Hynix HFS256G39TND-N210A, IPS, 1920x1080, 15.6" | Toshiba Satellite Pro R50-C-16V 6006U, HD Graphics 520, TOSHIBA MQ01ABD075, TN LED, 1366x768, 15.6" | HP ProBook 650 G3 Z2N47EA i5-7200U, HD Graphics 620, Samsung SSD 850 EVO 250GB, podświetlanie diodami LED, 1920x1080, 15.6" | |
|---|---|---|---|---|---|
| Power Consumption | -18% | -54% | -16% | -40% | |
| Idle Minimum * (Watt) | 3.5 | 3.6 -3% | 4.9 -40% | 6 -71% | 7 -100% |
| Idle Average * (Watt) | 6 | 7.7 -28% | 8.1 -35% | 8.7 -45% | 9.2 -53% |
| Idle Maximum * (Watt) | 7.3 | 8.2 -12% | 9.4 -29% | 9.2 -26% | 10.3 -41% |
| Load Average * (Watt) | 30.8 | 30.8 -0% | 50 -62% | 18.6 40% | 25.8 16% |
| Load Maximum * (Watt) | 31 | 46.1 -49% | 63.7 -105% | 23.8 23% | 37.5 -21% |
* ... más pequeño es mejor
| Dell Latitude 5580 i5-7200U, HD Graphics 620, 68 Wh | Lenovo ThinkPad T570-20H90002GE i5-7200U, HD Graphics 620, 56 Wh | Asus AsusPro P4540UQ-FY0056R i5-7200U, GeForce 940MX, 72 Wh | Toshiba Satellite Pro R50-C-16V 6006U, HD Graphics 520, 44 Wh | HP Probook 650 G3 Z2W44ET i5-7200U, HD Graphics 620, 48 Wh | |
|---|---|---|---|---|---|
| Duración de Batería | 9% | -1% | -49% | -9% | |
| Reader / Idle (h) | 18.4 | 19.5 6% | 12.8 -30% | ||
| WiFi v1.3 (h) | 11.6 | 7.6 -34% | 11.5 -1% | 5.9 -49% | 7.8 -33% |
| Load (h) | 2.2 | 3.4 55% | 3 36% |
Pro
Contra
No hay nada particularmente especial acerca del Latitude 5580 que no hayamos mencionado ya en nuestros análisis del E5550/E5570. Su larga duración de batería, sencillo mantenimiento, variadas opciones de configuración, certificación Linux y cómodo teclado le convierten en un portátil de negocios muy versátil para la mayor parte de consumidores.
El precio es una de las mejores características del 5580. Configuraciones básicas como la que probamos comienzan en unos 700$, características más valorables como Smart Card, Thunderbolt 3, WWAN, NFC y un lector de huellas elevan el precio base a más de 1000$. Además, recomendamos evitar la horrible pantalla HD e invertir en un panel FullHD, pero la configuración con pantalla Full HD comienza en 1100$. Configuraciones con CPU de gama alta comienzan en 1000$ e incluyen solo 4 GB de RAM, la ya mencionada pantalla HD y no incluye SSD. Prepárate a pagar mucho más de lo que cuesta la configuración básica para sacar más partido al chasis del Latitude 5580.
Nos gustaría probar una configuración más potente del Latitude 5580 en el futuro cercano para conseguir una mejor imagen de lo que la gama puede ofrecer. Una CPU de gama alta dobla el TDP de una CPU de gama U y el panel FHD asegurará una mejor experiencia. Averiguar como estos componentes afectarían a la duración de batería, ruido del ventilador y rendimiento se merecen sin duda otro vistazo.
Evita las configuraciones más básicas ya que incluyen una pantalla HD por debajo del a media y carecen de la mayoría de las características. Tanto un panel HD y un puerto Thunderbolt 3 son vitales para mejorar la experiencia de usuario y maquillar la ausencia de un puerto E-port.
Ésta es una versión acortada del análisis original. Puedes leer el análisis completo en inglés aquí.
Dell Latitude 5580
- 05/11/2017 v6 (old)
Allen Ngo
Price comparison
