Breve análisis del portátil Acer Aspire 3 A315-21 (A6-9220, Radeon R4)
| SD Card Reader | |
| average JPG Copy Test (av. of 3 runs) | |
| Acer Aspire 3 A315-51-55E4 (Toshiba Exceria Pro SDXC 64 GB UHS-II) | |
| Acer Aspire 3 A315-21-651Y (Toshiba Exceria Pro SDXC 64 GB UHS-II) | |
| HP 15-ba077ng (Toshiba Exceria Pro SDXC 64 GB UHS-II) | |
| Lenovo IdeaPad V110-15IKB 80TH001SGE (Toshiba Exceria Pro SDXC 64 GB UHS-II) | |
| HP 250 G5 SP X0N33EA | |
| HP 250 G5 Y1V08UT (Toshiba Exceria Pro SDXC 64 GB UHS-II) | |
| Toshiba Satellite Pro R50-C-16V (Toshiba Exceria Pro SDXC 64 GB UHS-II) | |
| maximum AS SSD Seq Read Test (1GB) | |
| Acer Aspire 3 A315-51-55E4 (Toshiba Exceria Pro SDXC 64 GB UHS-II) | |
| Acer Aspire 3 A315-21-651Y (Toshiba Exceria Pro SDXC 64 GB UHS-II) | |
| HP 15-ba077ng (Toshiba Exceria Pro SDXC 64 GB UHS-II) | |
| Lenovo IdeaPad V110-15IKB 80TH001SGE (Toshiba Exceria Pro SDXC 64 GB UHS-II) | |
| HP 250 G5 Y1V08UT (Toshiba Exceria Pro SDXC 64 GB UHS-II) | |
| Toshiba Satellite Pro R50-C-16V (Toshiba Exceria Pro SDXC 64 GB UHS-II) | |
| |||||||||||||||||||||||||
iluminación: 88 %
Brillo con batería: 223 cd/m²
Contraste: 474:1 (Negro: 0.47 cd/m²)
ΔE ColorChecker Calman: 10.72 | ∀{0.5-29.43 Ø4.71}
ΔE Greyscale Calman: 11.81 | ∀{0.09-98 Ø4.96}
59% sRGB (Argyll 1.6.3 3D)
38% AdobeRGB 1998 (Argyll 1.6.3 3D)
40.81% AdobeRGB 1998 (Argyll 3D)
59.2% sRGB (Argyll 3D)
39.48% Display P3 (Argyll 3D)
Gamma: 2.32
CCT: 13530 K
| Acer Aspire 3 A315-21-651Y TN LED, 1366x768, 15.6" | Lenovo IdeaPad V110-15IKB 80TH001SGE TN LED, 1366x768, 15.6" | Toshiba Satellite Pro R50-C-16V TN LED, 1366x768, 15.6" | HP 250 G5 SP X0N33EA TN, 1920x1080, 15.6" | HP 250 G5 Y1V08UT TN LED, 1366x768, 15.6" | HP 15-ba077ng TN LED, 1920x1080, 15.6" | Acer Aspire 3 A315-51-55E4 TN LED, 1920x1080, 15.6" | |
|---|---|---|---|---|---|---|---|
| Display | -1% | 3% | -8% | -10% | 1% | -9% | |
| Display P3 Coverage (%) | 39.48 | 38.91 -1% | 40.6 3% | 36.51 -8% | 35.43 -10% | 39.98 1% | 35.97 -9% |
| sRGB Coverage (%) | 59.2 | 58.6 -1% | 61.2 3% | 55 -7% | 53.3 -10% | 60.2 2% | 54.1 -9% |
| AdobeRGB 1998 Coverage (%) | 40.81 | 40.2 -1% | 41.95 3% | 37.72 -8% | 36.6 -10% | 41.31 1% | 37.17 -9% |
| Response Times | 17% | -30% | 9% | -10% | 6% | 27% | |
| Response Time Grey 50% / Grey 80% * (ms) | 48 ? | 39 ? 19% | 68 ? -42% | 40 ? 17% | 42.4 ? 12% | 42 ? 12% | 44 ? 8% |
| Response Time Black / White * (ms) | 22 ? | 19 ? 14% | 26 ? -18% | 22 ? -0% | 28.8 ? -31% | 22 ? -0% | 12 ? 45% |
| PWM Frequency (Hz) | 25000 ? | 10000 ? | 217 ? | 50 ? | |||
| Screen | -2% | -1% | -4% | -19% | -10% | 22% | |
| Brightness middle (cd/m²) | 223 | 243 9% | 226 1% | 219 -2% | 199.8 -10% | 209 -6% | 241 8% |
| Brightness (cd/m²) | 220 | 233 6% | 217 -1% | 222 1% | 199 -10% | 200 -9% | 229 4% |
| Brightness Distribution (%) | 88 | 75 -15% | 91 3% | 85 -3% | 85 -3% | 88 0% | 87 -1% |
| Black Level * (cd/m²) | 0.47 | 0.45 4% | 0.58 -23% | 0.39 17% | 0.712 -51% | 0.56 -19% | 0.46 2% |
| Contrast (:1) | 474 | 540 14% | 390 -18% | 562 19% | 281 -41% | 373 -21% | 524 11% |
| Colorchecker dE 2000 * | 10.72 | 11.69 -9% | 9.84 8% | 12.67 -18% | 13.24 -24% | 12.21 -14% | 3.4 68% |
| Colorchecker dE 2000 max. * | 17.7 | 20.08 -13% | 16.77 5% | 20.99 -19% | 21.52 -22% | 20.66 -17% | 7.61 57% |
| Greyscale dE 2000 * | 11.81 | 13.12 -11% | 11.1 6% | 13.82 -17% | 13.33 -13% | 13.48 -14% | 1.7 86% |
| Gamma | 2.32 95% | 2.24 98% | 2.35 94% | 2.63 84% | 1.69 130% | 2.34 94% | 2.36 93% |
| CCT | 13530 48% | 16905 38% | 11979 54% | 15633 42% | 15879 41% | 15364 42% | 6750 96% |
| Color Space (Percent of AdobeRGB 1998) (%) | 38 | 37 -3% | 39 3% | 35 -8% | 33.8 -11% | 38 0% | 34 -11% |
| Color Space (Percent of sRGB) (%) | 59 | 59 0% | 61 3% | 55 -7% | 53.4 -9% | 60 2% | 54 -8% |
| Media total (Programa/Opciones) | 5% /
1% | -9% /
-4% | -1% /
-3% | -13% /
-16% | -1% /
-5% | 13% /
16% |
* ... más pequeño es mejor
Parpadeo de Pantalla / PWM (Pulse-Width Modulation)
| Parpadeo de Pantalla / PWM detectado | 25000 Hz | ≤ 20 % de brillo | 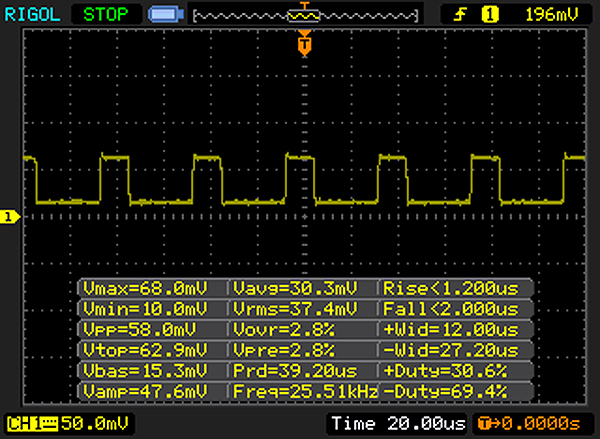 |
La retroiluminación del display parpadea a 25000 Hz (seguramente usa PWM - Pulse-Width Modulation) a un brillo del 20 % e inferior. Sobre este nivel de brillo no debería darse parpadeo / PWM. La frecuencia de 25000 Hz es bastante alta, por lo que la mayoría de gente sensible al parpadeo no debería ver parpadeo o tener fatiga visual. Comparación: 52 % de todos los dispositivos testados no usaron PWM para atenuar el display. Si se usó, medimos una media de 7757 (mínimo: 5 - máxmo: 343500) Hz. | |||
Tiempos de respuesta del display
| ↔ Tiempo de respuesta de Negro a Blanco | ||
|---|---|---|
| 22 ms ... subida ↗ y bajada ↘ combinada | ↗ 18 ms subida | 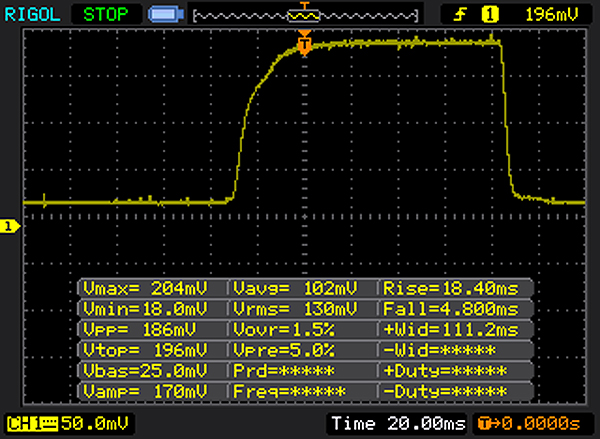 |
| ↘ 4 ms bajada | ||
| La pantalla mostró buenos tiempos de respuesta en nuestros tests pero podría ser demasiado lenta para los jugones competitivos. En comparación, todos los dispositivos de prueba van de ##min### (mínimo) a 240 (máximo) ms. » 49 % de todos los dispositivos son mejores. Eso quiere decir que el tiempo de respuesta es peor que la media (19.8 ms) de todos los dispositivos testados. | ||
| ↔ Tiempo de respuesta 50% Gris a 80% Gris | ||
| 48 ms ... subida ↗ y bajada ↘ combinada | ↗ 26 ms subida | 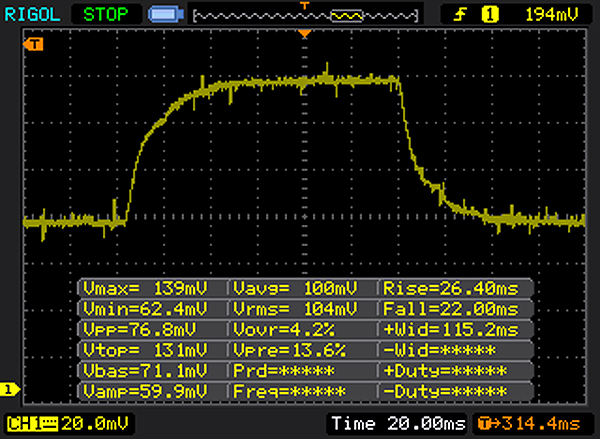 |
| ↘ 22 ms bajada | ||
| La pantalla mostró tiempos de respuesta lentos en nuestros tests y podría ser demasiado lenta para los jugones. En comparación, todos los dispositivos de prueba van de ##min### (mínimo) a 636 (máximo) ms. » 82 % de todos los dispositivos son mejores. Eso quiere decir que el tiempo de respuesta es peor que la media (31 ms) de todos los dispositivos testados. | ||
| Geekbench 4.4 | |
| 64 Bit Multi-Core Score | |
| Lenovo IdeaPad V110-15IKB 80TH001SGE | |
| HP 350 G1 F7Z01EA | |
| Acer Aspire 3 A315-21-651Y | |
| 64 Bit Single-Core Score | |
| Lenovo IdeaPad V110-15IKB 80TH001SGE | |
| HP 350 G1 F7Z01EA | |
| Acer Aspire 3 A315-21-651Y | |
| PCMark 7 Score | 3558 puntos | |
| PCMark 8 Home Score Accelerated v2 | 2337 puntos | |
| PCMark 8 Creative Score Accelerated v2 | 2320 puntos | |
| PCMark 8 Work Score Accelerated v2 | 3483 puntos | |
| PCMark 10 Score | 1821 puntos | |
ayuda | ||
| PCMark 8 - Home Score Accelerated v2 | |
| HP 250 G5 SP X0N33EA | |
| Lenovo IdeaPad V110-15IKB 80TH001SGE | |
| Toshiba Satellite Pro R50-C-16V | |
| HP 15-ba077ng | |
| Acer Aspire 3 A315-21-651Y | |
| HP 250 G5 Y1V08UT | |
| 3DMark 06 Standard Score | 3886 puntos | |
| 3DMark Vantage P Result | 2542 puntos | |
| 3DMark 11 Performance | 984 puntos | |
| 3DMark Ice Storm Standard Score | 30989 puntos | |
| 3DMark Cloud Gate Standard Score | 2458 puntos | |
| 3DMark Fire Strike Score | 545 puntos | |
| 3DMark Fire Strike Extreme Score | 273 puntos | |
| 3DMark Time Spy Score | 215 puntos | |
ayuda | ||
| bajo | medio | alto | ultra | |
|---|---|---|---|---|
| Deus Ex Human Revolution (2011) | 47.7 | 21.9 | ||
| The Elder Scrolls V: Skyrim (2011) | 25.7 | 16.5 | 11.3 | |
| Anno 2070 (2011) | 53.8 | 23.7 | 15.5 | |
| Diablo III (2012) | 44.8 | 31.9 | 27.7 | |
| Counter-Strike: GO (2012) | 29.7 | 21.9 | 17.8 | |
| Dead Space 3 (2013) | 45.5 | 22.9 | 19.5 | |
| Tomb Raider (2013) | 39.4 | 19.9 | 13.2 | |
| BioShock Infinite (2013) | 34.6 | 20.8 | 17 | |
| GRID: Autosport (2014) | 57 | 24.5 | ||
| Sims 4 (2014) | 90 | 28.8 | ||
| F1 2014 (2014) | 30 | 26 | ||
| Dragon Age: Inquisition (2014) | 15.1 | 10.9 | ||
| Battlefield Hardline (2015) | 15.1 | 12 | ||
| Dirt Rally (2015) | 48.8 | 16.2 | ||
| Metal Gear Solid V (2015) | 26 | 17.9 | ||
| Dota 2 Reborn (2015) | 32.4 | 20.3 | ||
| World of Warships (2015) | 30 | 22.1 | ||
| Overwatch (2016) | 20.7 | 16.9 | ||
| Farming Simulator 17 (2016) | 38 | 24.8 | ||
| Rocket League (2017) | 31.3 | |||
| Team Fortress 2 (2017) | 23 | 22.6 | ||
| Middle-earth: Shadow of War (2017) | 15 |
Ruido
| Ocioso |
| 30.4 / 31.6 / 31.6 dB(A) |
| HDD |
| 31 dB(A) |
| Carga |
| 31.9 / 31.9 dB(A) |
 | ||
30 dB silencioso 40 dB(A) audible 50 dB(A) ruidosamente alto |
||
min: | ||
(+) La temperatura máxima en la parte superior es de 30.5 °C / 87 F, frente a la media de 34.3 °C / 94 F, que oscila entre 21.2 y 62.5 °C para la clase Office.
(+) El fondo se calienta hasta un máximo de 33 °C / 91 F, frente a la media de 36.8 °C / 98 F
(+) En reposo, la temperatura media de la parte superior es de 25.8 °C / 78# F, frente a la media del dispositivo de 29.5 °C / 85 F.
(+) El reposamanos y el panel táctil están a una temperatura inferior a la de la piel, con un máximo de 24 °C / 75.2 F y, por tanto, son fríos al tacto.
(+) La temperatura media de la zona del reposamanos de dispositivos similares fue de 27.5 °C / 81.5 F (+3.5 °C / 6.3 F).
Acer Aspire 3 A315-21-651Y análisis de audio
(-) | altavoces no muy altos (#71.9 dB)
Graves 100 - 315 Hz
(-) | casi sin bajos - de media 22.4% inferior a la mediana
(±) | la linealidad de los graves es media (8.6% delta a frecuencia anterior)
Medios 400 - 2000 Hz
(±) | medias más altas - de media 6.5% más altas que la mediana
(±) | la linealidad de los medios es media (13.1% delta respecto a la frecuencia anterior)
Altos 2 - 16 kHz
(+) | máximos equilibrados - a sólo 4% de la mediana
(+) | los máximos son lineales (6.8% delta a la frecuencia anterior)
Total 100 - 16.000 Hz
(±) | la linealidad del sonido global es media (27.8% de diferencia con la mediana)
En comparación con la misma clase
» 87% de todos los dispositivos probados de esta clase eran mejores, 4% similares, 10% peores
» El mejor tuvo un delta de 7%, la media fue 21%, el peor fue ###max##%
En comparación con todos los dispositivos probados
» 85% de todos los dispositivos probados eran mejores, 3% similares, 13% peores
» El mejor tuvo un delta de 4%, la media fue 23%, el peor fue ###max##%
Apple MacBook 12 (Early 2016) 1.1 GHz análisis de audio
(+) | los altavoces pueden reproducir a un volumen relativamente alto (#83.6 dB)
Graves 100 - 315 Hz
(±) | lubina reducida - en promedio 11.3% inferior a la mediana
(±) | la linealidad de los graves es media (14.2% delta a frecuencia anterior)
Medios 400 - 2000 Hz
(+) | medios equilibrados - a sólo 2.4% de la mediana
(+) | los medios son lineales (5.5% delta a la frecuencia anterior)
Altos 2 - 16 kHz
(+) | máximos equilibrados - a sólo 2% de la mediana
(+) | los máximos son lineales (4.5% delta a la frecuencia anterior)
Total 100 - 16.000 Hz
(+) | el sonido global es lineal (10.2% de diferencia con la mediana)
En comparación con la misma clase
» 7% de todos los dispositivos probados de esta clase eran mejores, 2% similares, 90% peores
» El mejor tuvo un delta de 5%, la media fue 18%, el peor fue ###max##%
En comparación con todos los dispositivos probados
» 5% de todos los dispositivos probados eran mejores, 1% similares, 94% peores
» El mejor tuvo un delta de 4%, la media fue 23%, el peor fue ###max##%
| Off / Standby | |
| Ocioso | |
| Carga |
|
Clave:
min: | |
Pro
Contra
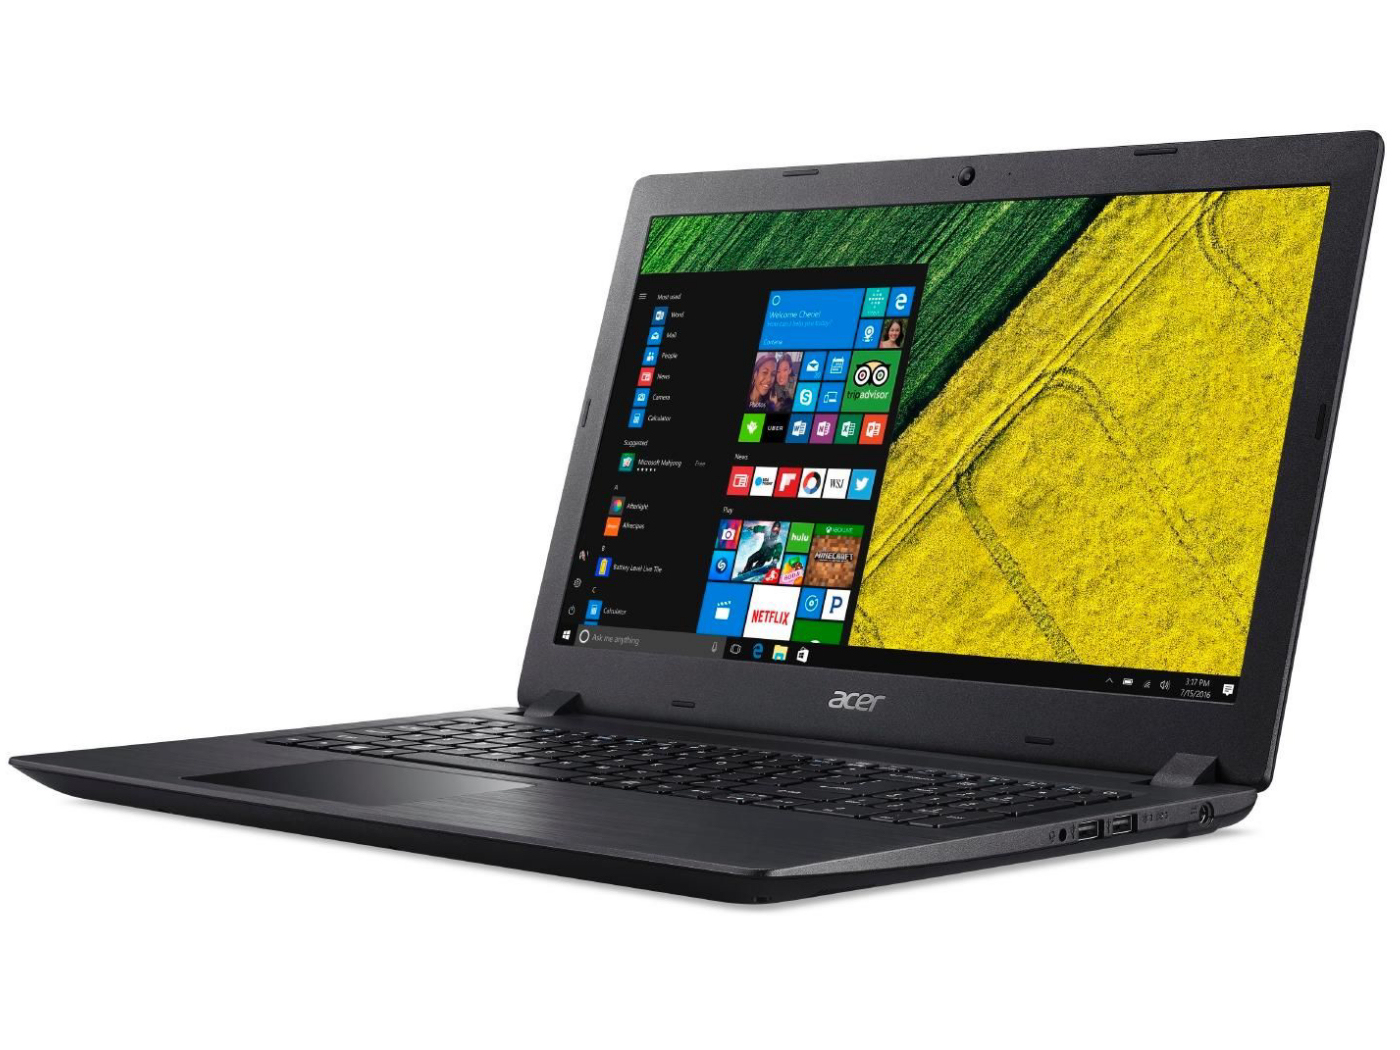
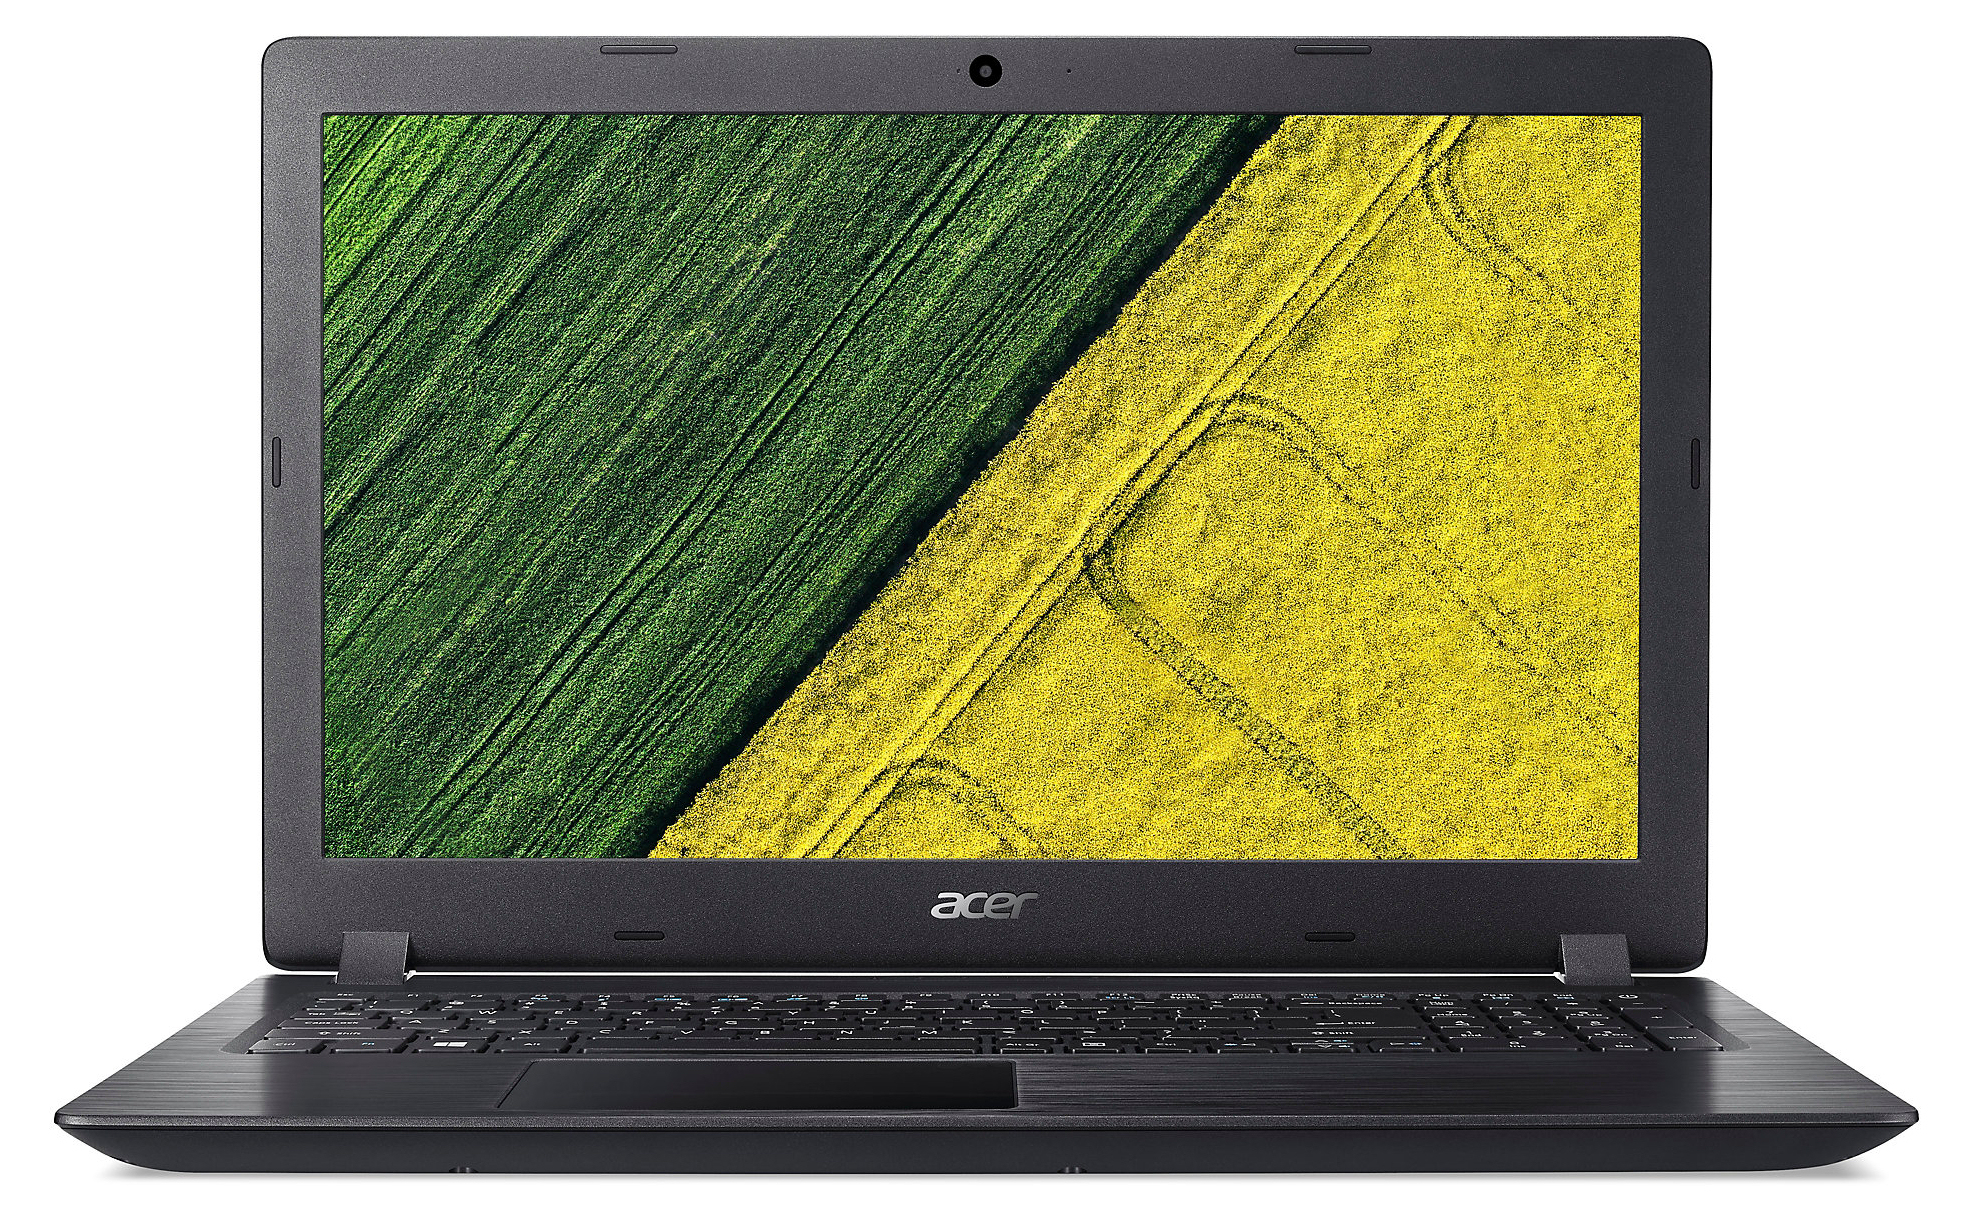
El Acer Aspire 3 A315-21-651Y es un portátil de oficina simple de 15.6" para usar en casa. La APU tiene suficiente potencia de rendimiento para manejar aplicaciones relacionadas con la oficina e Internet. El portátil apenas se recalienta. También podría funcionar silenciosamente bajo cada nivel de carga, pero el insatisfactorio control del ventilador lo arruina todo.
El Aspire 3 A315-21 es un portátil de oficina simple que puede manejar fácilmente las tareas cotidianas.
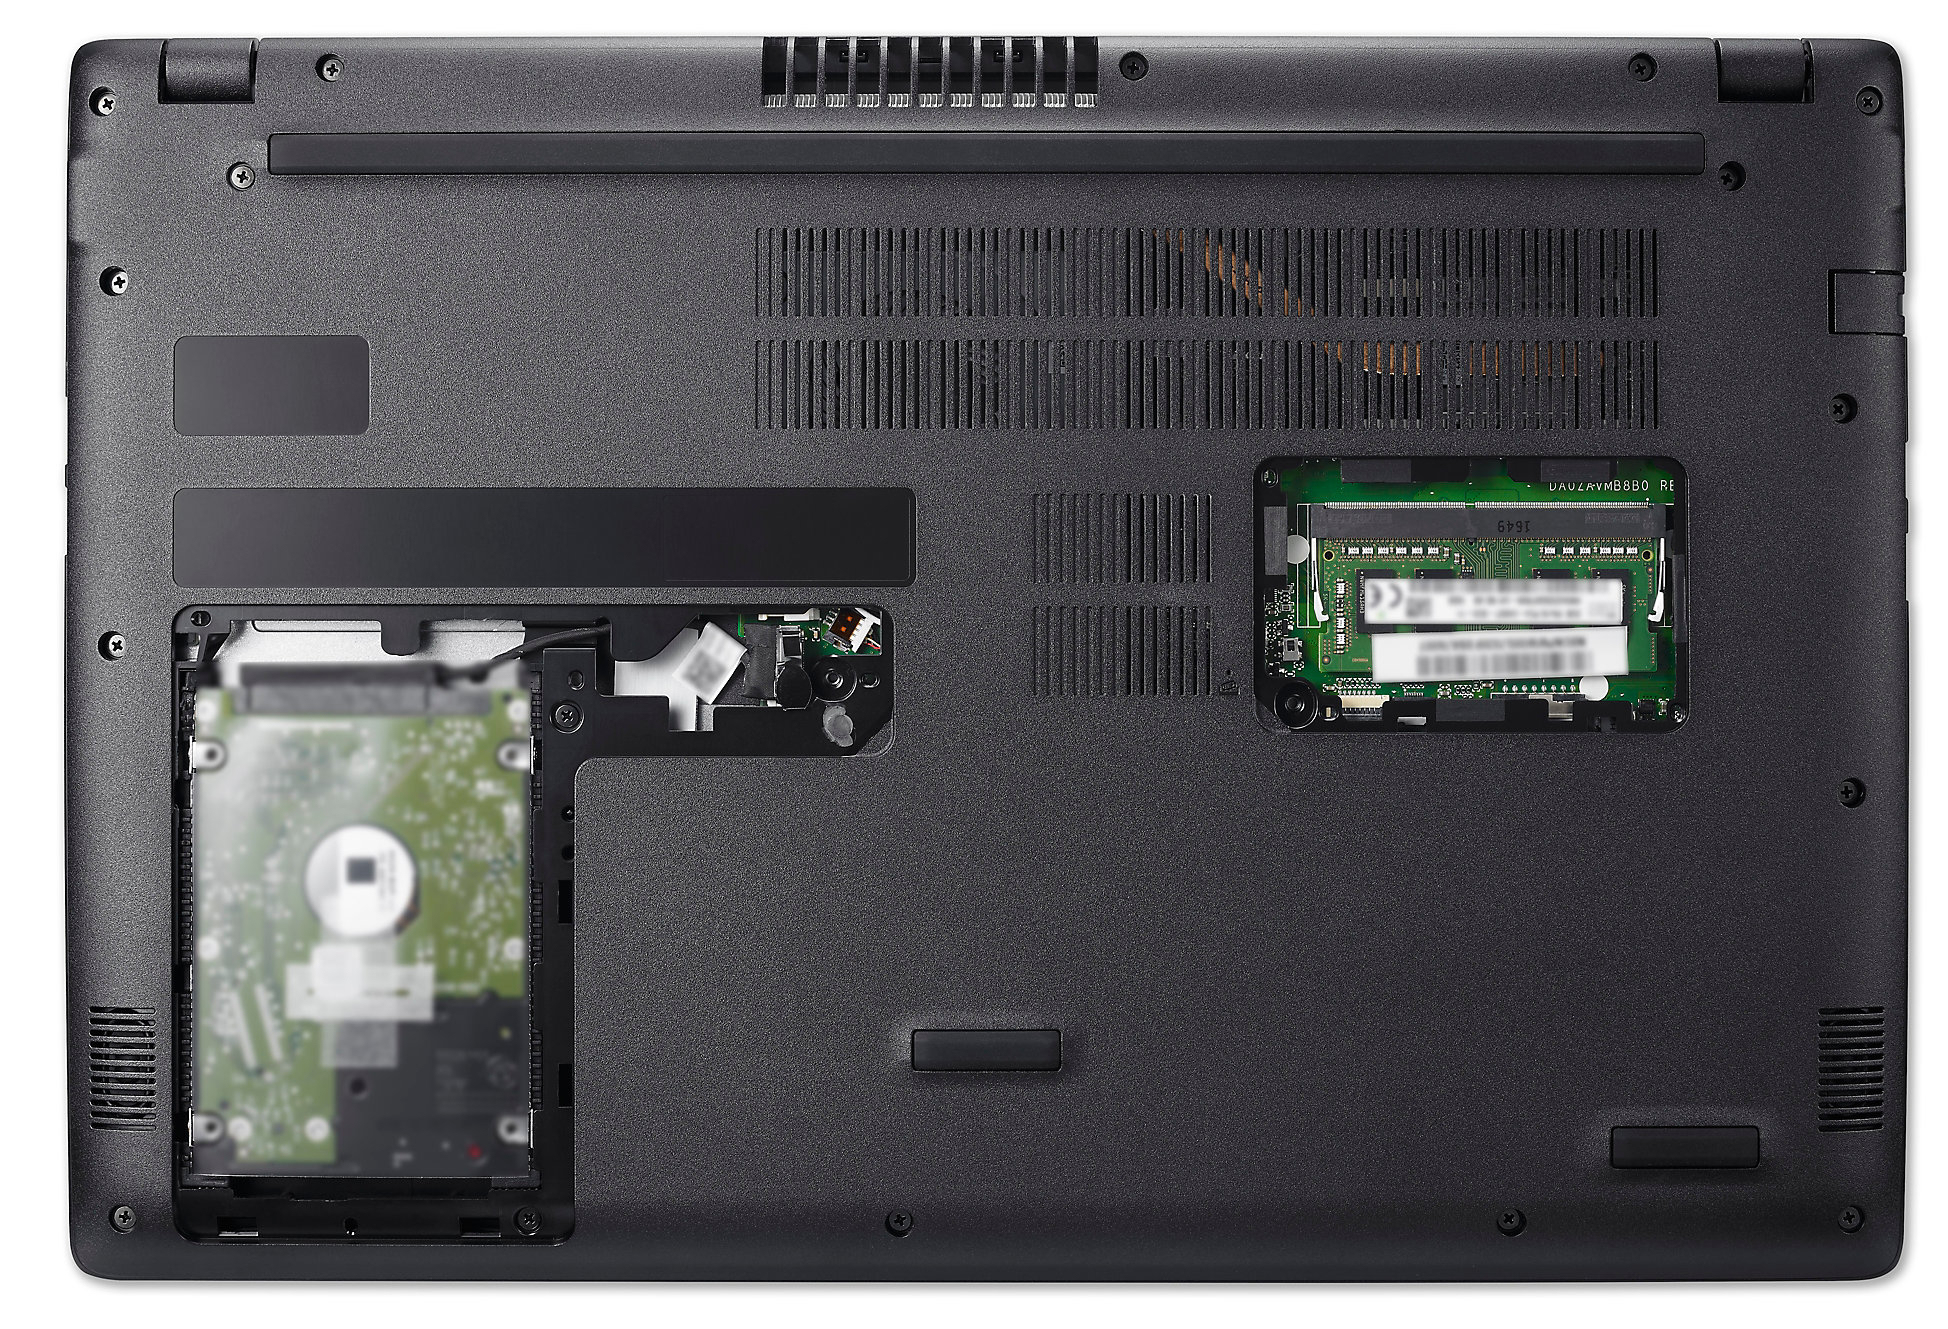
El SSD permite que el sistema funcione rápidamente. No hay escasez de espacio de almacenamiento, dado que el SSD viene acompañado de un disco duro de 1 TB y 2,5". El teclado es razonablemente bueno y cumple todos los requisitos para el uso doméstico. La pantalla mate de 15.6" no ganará ningún premio. Es oscura, tiene poco contraste y no proporciona ángulos de visión estables.
En nuestra opinión, el precio de Aspire es su mayor problema. A partir de la fecha de publicación de este análisis, el dispositivo aparece a la venta por poco menos de 500 euros en varios motores de búsqueda de precios. Algunos de los modelos de la serie Aspire 3 A315-51, estructuralmente idéntica, basada en Intel, tienen un precio similar. Las CPU Intel en esas máquinas son sustancialmente más poderosas que la APU AMD. Además, esos modelos ofrecen un mejor aguante de la batería.
Ésta es una versión acortada del análisis original. Puedes leer el análisis completo en inglés aquí.
Acer Aspire 3 A315-21-651Y
- 11/02/2017 v6 (old)
Sascha Mölck