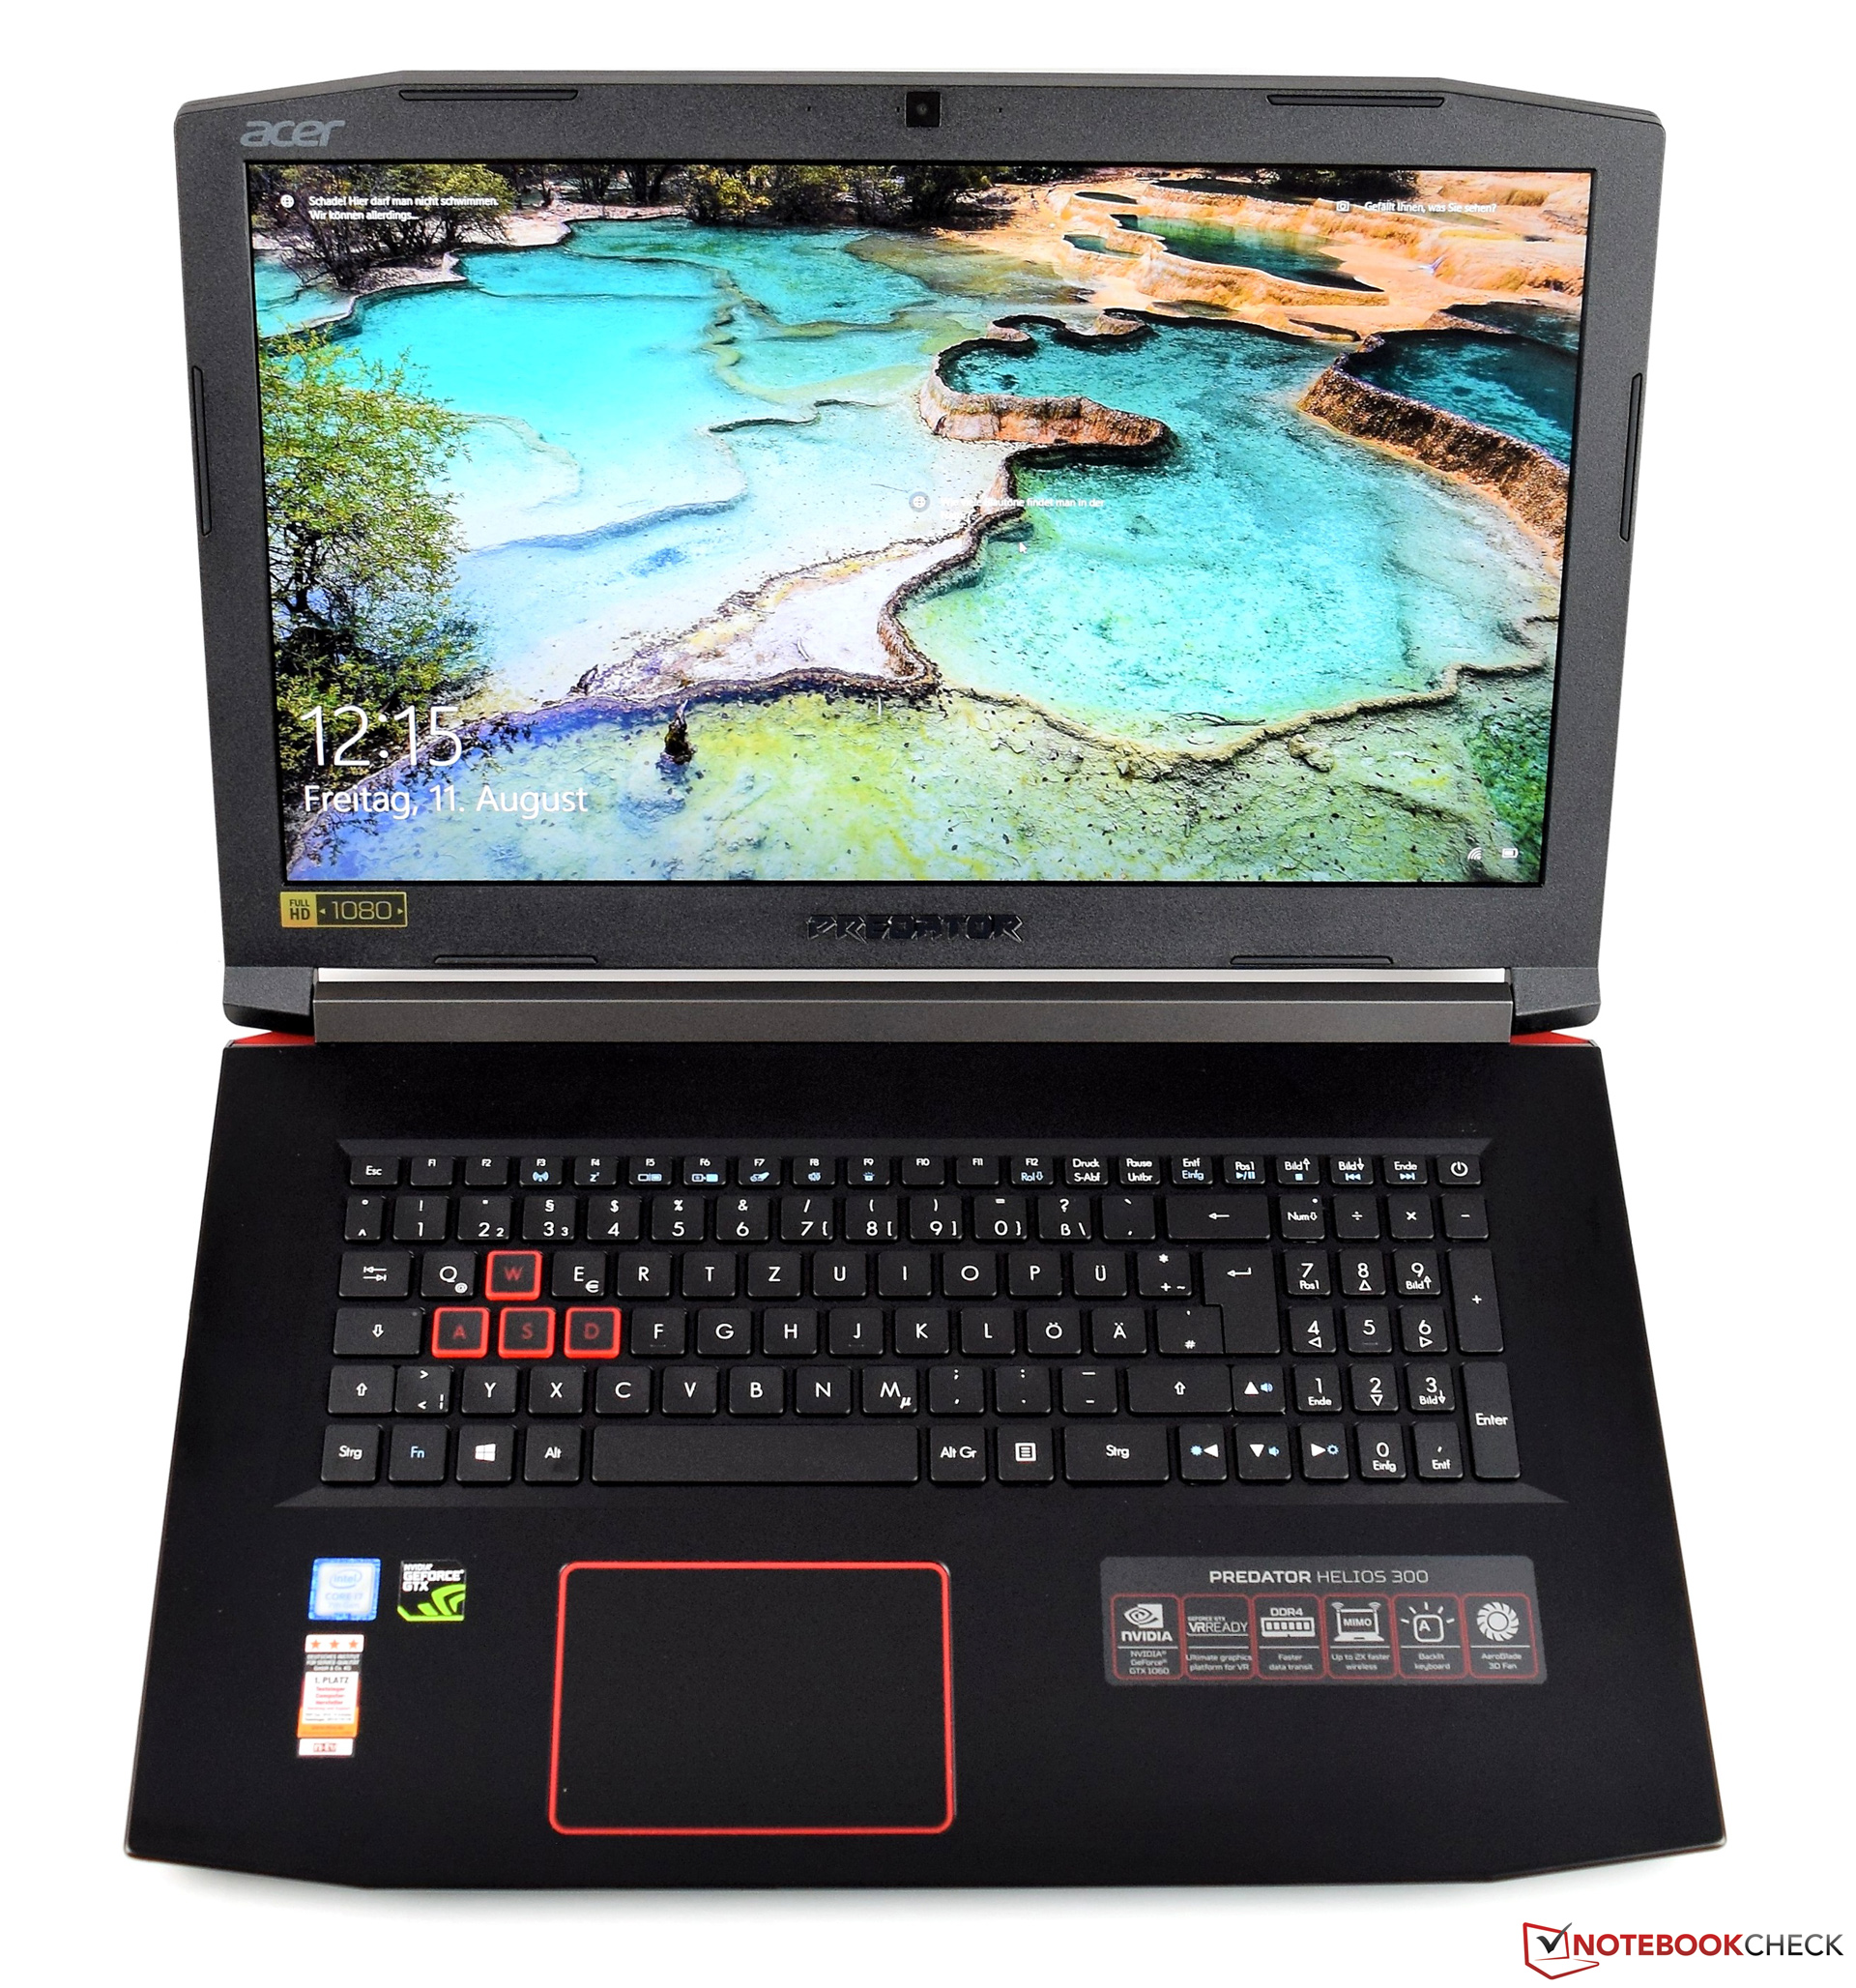
Breve análisis del portátil Acer Predator Helios 300 (7700HQ, GTX 1060, full-HD)
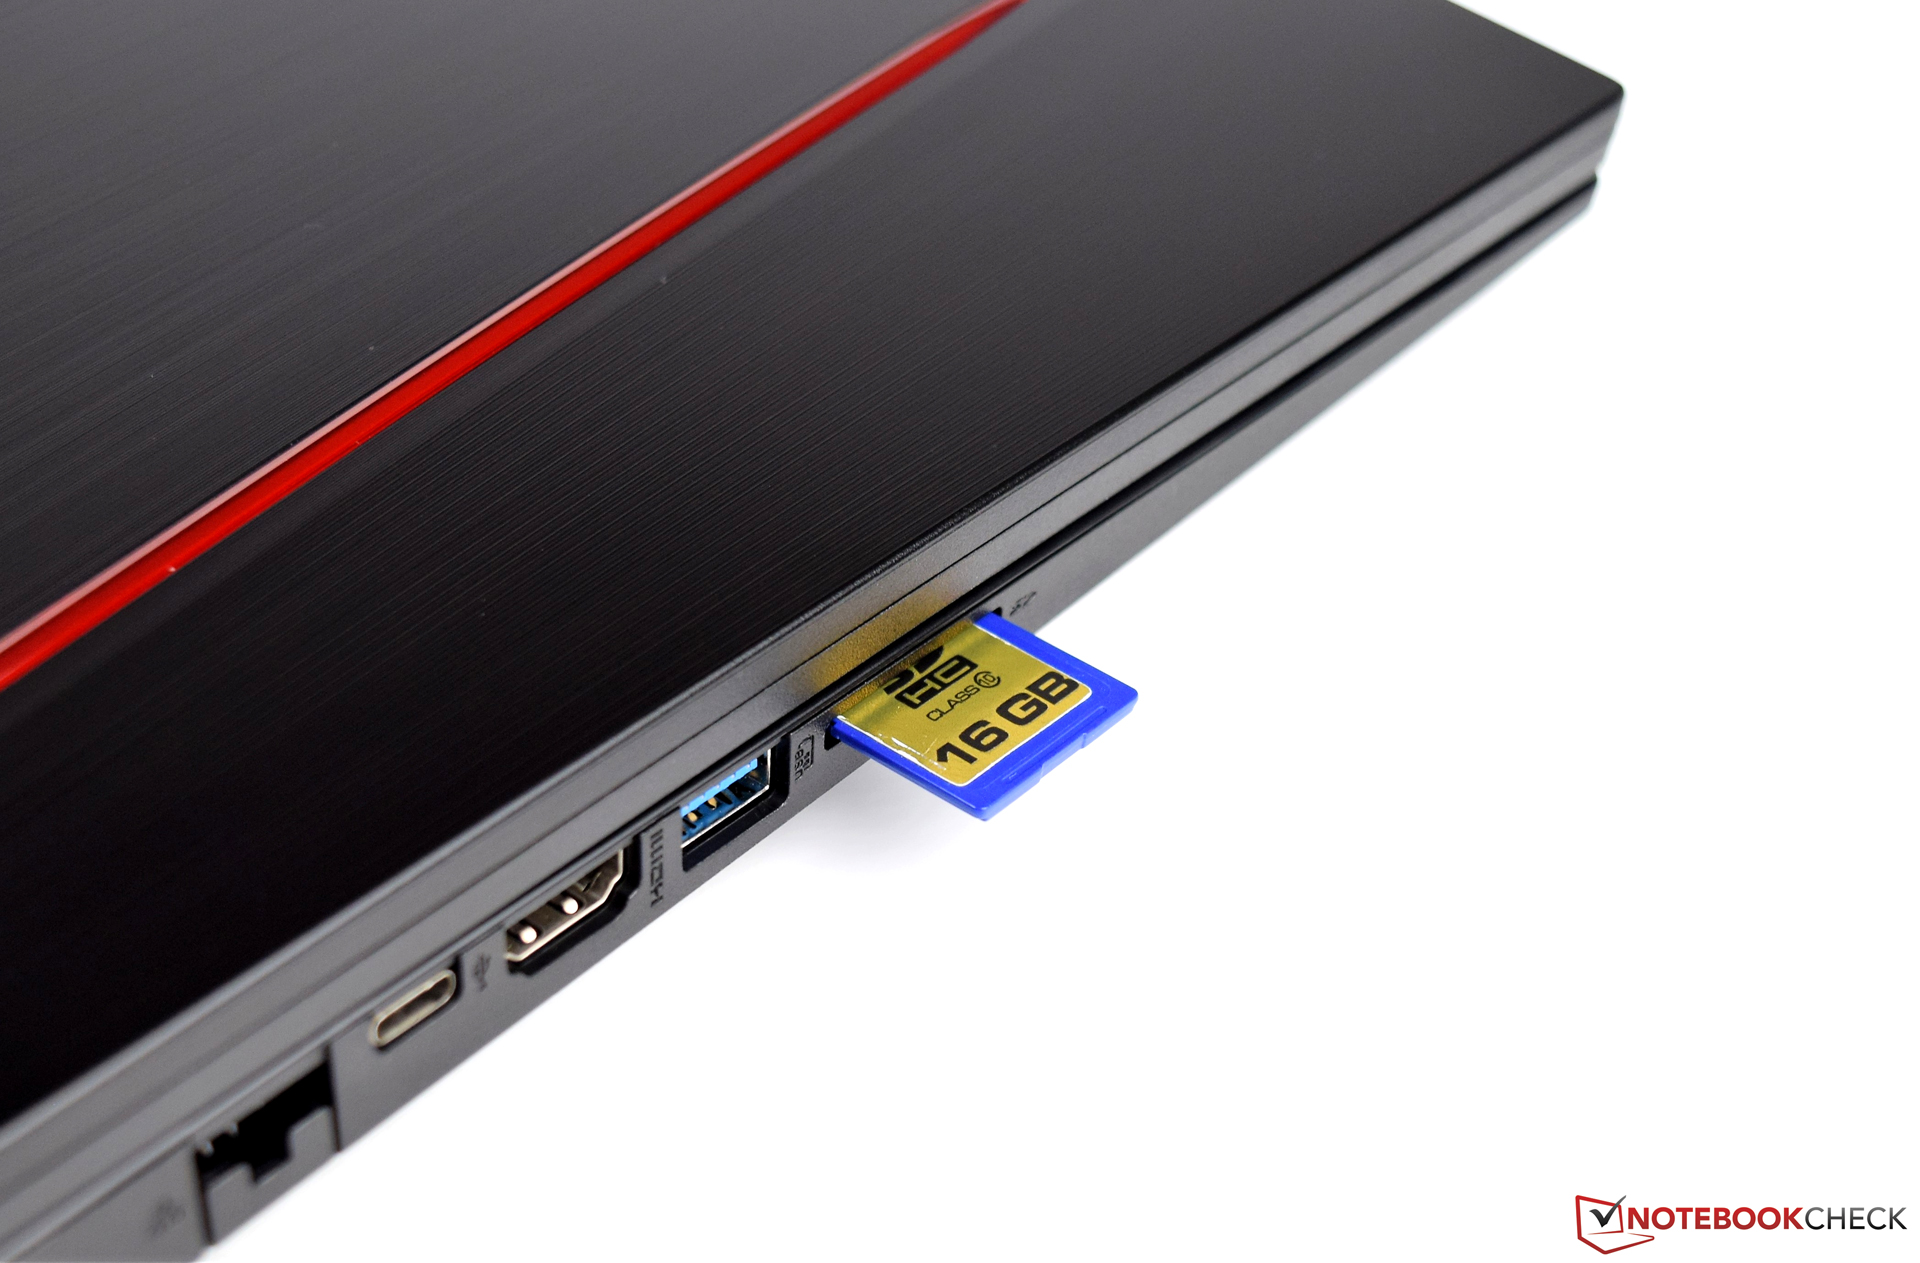
| SD Card Reader | |
| average JPG Copy Test (av. of 3 runs) | |
| Acer Predator Helios 300 (Toshiba Exceria Pro SDXC 64 GB UHS-II) | |
| Gigabyte P57X v7 (Toshiba Exceria Pro SDXC 64 GB UHS-II) | |
| Nexoc G739 (Toshiba Exceria Pro SDXC 64 GB UHS-II) | |
| HP Omen 17-an014ng (Toshiba Exceria Pro SDXC 64 GB UHS-II) | |
| Asus GL753VE-DS74 (Toshiba Exceria Pro SDXC 64 GB UHS-II) | |
| Acer Aspire V17 Nitro BE VN7-793-738J (Toshiba Exceria Pro SDXC 64 GB UHS-II) | |
| MSI GE72VR-6RF16H21 (Toshiba Exceria Pro SDXC 64 GB UHS-II) | |
| maximum AS SSD Seq Read Test (1GB) | |
| Asus GL753VE-DS74 (Toshiba Exceria Pro SDXC 64 GB UHS-II) | |
| Gigabyte P57X v7 (Toshiba Exceria Pro SDXC 64 GB UHS-II) | |
| Nexoc G739 (Toshiba Exceria Pro SDXC 64 GB UHS-II) | |
| HP Omen 17-an014ng (Toshiba Exceria Pro SDXC 64 GB UHS-II) | |
| Acer Predator Helios 300 (Toshiba Exceria Pro SDXC 64 GB UHS-II) | |
| Acer Aspire V17 Nitro BE VN7-793-738J (Toshiba Exceria Pro SDXC 64 GB UHS-II) | |
| MSI GE72VR-6RF16H21 (Toshiba Exceria Pro SDXC 64 GB UHS-II) | |
| |||||||||||||||||||||||||
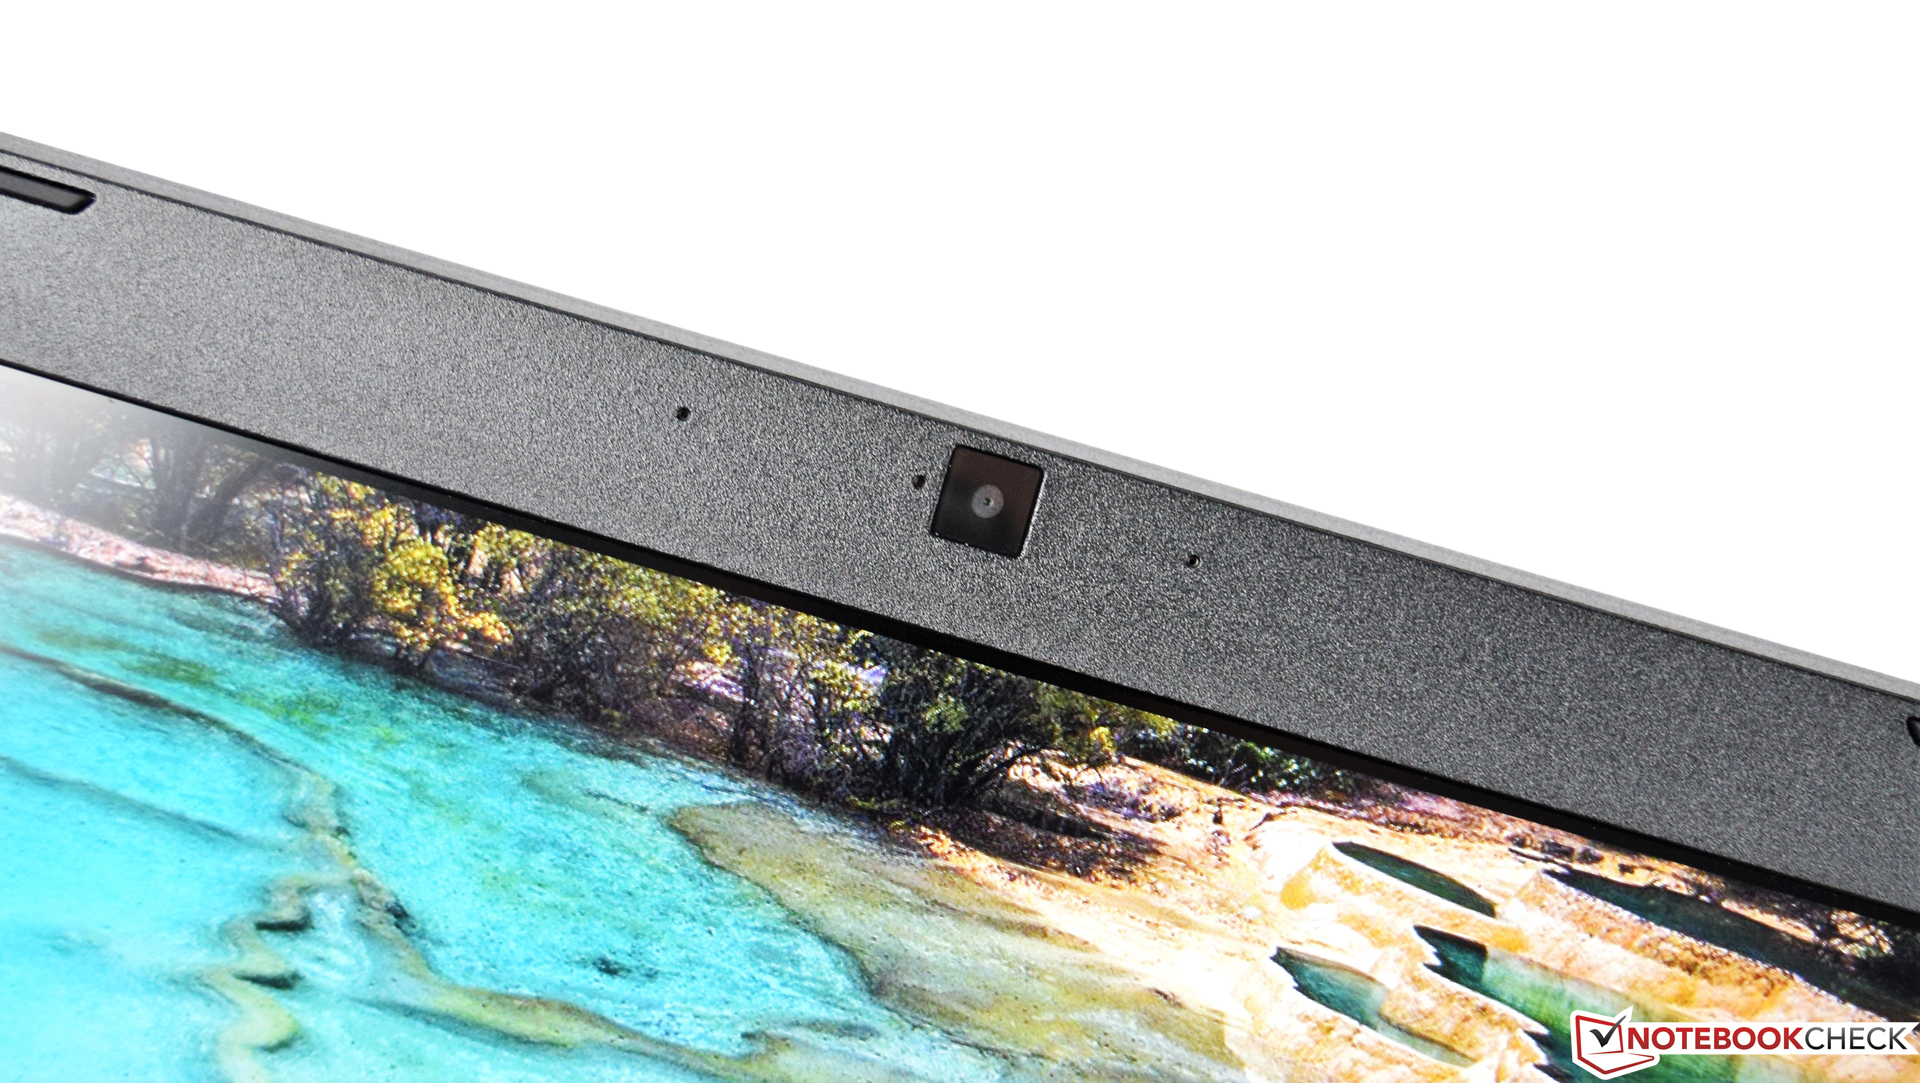
iluminación: 93 %
Brillo con batería: 384 cd/m²
Contraste: 1097:1 (Negro: 0.35 cd/m²)
ΔE ColorChecker Calman: 4.81 | ∀{0.5-29.43 Ø4.71}
ΔE Greyscale Calman: 5.33 | ∀{0.09-98 Ø4.96}
86% sRGB (Argyll 1.6.3 3D)
56% AdobeRGB 1998 (Argyll 1.6.3 3D)
62.8% AdobeRGB 1998 (Argyll 3D)
85.8% sRGB (Argyll 3D)
66.8% Display P3 (Argyll 3D)
Gamma: 2.45
CCT: 7137 K
| Acer Predator Helios 300 LG LP173WF4-SPF5 (LGD056D), 1920x1080, 17.3" | Acer Aspire V17 Nitro BE VN7-793-738J AU Optronics B173ZAN01.0, 3840x2160, 17.3" | Asus GL753VE-DS74 LG Philips LP173WF4-SPF3, 1920x1080, 17.3" | MSI GE72VR-6RF16H21 N173HHE-G32 (CMN1747), 1920x1080, 17.3" | HP Omen 17-an014ng AUO149D, 1920x1080, 17.3" | Gigabyte P57X v7 SHP145E, 3840x2160, 17.3" | Nexoc G739 CMN1738, 1920x1080, 17.3" | |
|---|---|---|---|---|---|---|---|
| Display | 34% | 28% | 3% | 35% | 4% | ||
| Display P3 Coverage (%) | 66.8 | 85.4 28% | 90.2 35% | 64.6 -3% | 87.8 31% | 66.7 0% | |
| sRGB Coverage (%) | 85.8 | 100 17% | 99.8 16% | 92.9 8% | 100 17% | 91 6% | |
| AdobeRGB 1998 Coverage (%) | 62.8 | 97.8 56% | 83.9 34% | 66.1 5% | 98.9 57% | 66.4 6% | |
| Response Times | -8% | -5% | 41% | -39% | -94% | -33% | |
| Response Time Grey 50% / Grey 80% * (ms) | 36 ? | 29 ? 19% | 36 ? -0% | 28 ? 22% | 45.2 ? -26% | 55.6 ? -54% | 45 ? -25% |
| Response Time Black / White * (ms) | 20 ? | 27 ? -35% | 22 ? -10% | 8 ? 60% | 30.4 ? -52% | 46.8 ? -134% | 28 ? -40% |
| PWM Frequency (Hz) | 119000 ? | 1000 ? | 450 ? | ||||
| Screen | 7% | 2% | 10% | 6% | 5% | 7% | |
| Brightness middle (cd/m²) | 384 | 380 -1% | 366 -5% | 270 -30% | 314 -18% | 441.3 15% | 312 -19% |
| Brightness (cd/m²) | 373 | 336 -10% | 348 -7% | 254 -32% | 309 -17% | 408 9% | 304 -18% |
| Brightness Distribution (%) | 93 | 81 -13% | 90 -3% | 86 -8% | 88 -5% | 86 -8% | 85 -9% |
| Black Level * (cd/m²) | 0.35 | 0.32 9% | 0.35 -0% | 0.26 26% | 0.34 3% | 0.44 -26% | 0.23 34% |
| Contrast (:1) | 1097 | 1188 8% | 1046 -5% | 1038 -5% | 924 -16% | 1003 -9% | 1357 24% |
| Colorchecker dE 2000 * | 4.81 | 5.32 -11% | 4.4 9% | 3.33 31% | 3.19 34% | 5.1 -6% | 4.19 13% |
| Colorchecker dE 2000 max. * | 8.69 | 7.63 12% | 9.7 -12% | 6.07 30% | 6.1 30% | 9.8 -13% | 8.7 -0% |
| Greyscale dE 2000 * | 5.33 | 4.9 8% | 3 44% | 3.46 35% | 3.49 35% | 4.3 19% | 3.72 30% |
| Gamma | 2.45 90% | 2.61 84% | 2.1 105% | 2.13 103% | 2.34 94% | 2.08 106% | 2.29 96% |
| CCT | 7137 91% | 6558 99% | 6362 102% | 7419 88% | 7261 90% | 7345 88% | 7104 91% |
| Color Space (Percent of AdobeRGB 1998) (%) | 56 | 87.2 56% | 56 0% | 75 34% | 60 7% | 87 55% | 59 5% |
| Color Space (Percent of sRGB) (%) | 86 | 100 16% | 86 0% | 100 16% | 93 8% | 100 16% | 91 6% |
| Media total (Programa/Opciones) | 11% /
11% | -2% /
1% | 26% /
18% | -10% /
-0% | -18% /
-2% | -7% /
1% |
* ... más pequeño es mejor
Tiempos de respuesta del display
| ↔ Tiempo de respuesta de Negro a Blanco | ||
|---|---|---|
| 20 ms ... subida ↗ y bajada ↘ combinada | ↗ 8.4 ms subida | 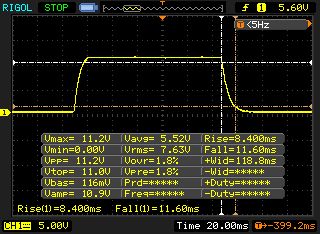 |
| ↘ 11.6 ms bajada | ||
| La pantalla mostró buenos tiempos de respuesta en nuestros tests pero podría ser demasiado lenta para los jugones competitivos. En comparación, todos los dispositivos de prueba van de ##min### (mínimo) a 240 (máximo) ms. » 44 % de todos los dispositivos son mejores. Eso quiere decir que el tiempo de respuesta es similar al dispositivo testado medio (19.8 ms). | ||
| ↔ Tiempo de respuesta 50% Gris a 80% Gris | ||
| 36 ms ... subida ↗ y bajada ↘ combinada | ↗ 18 ms subida | 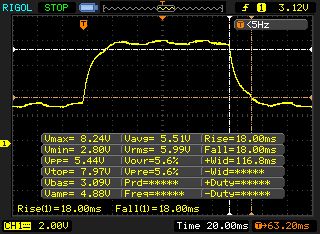 |
| ↘ 18 ms bajada | ||
| La pantalla mostró tiempos de respuesta lentos en nuestros tests y podría ser demasiado lenta para los jugones. En comparación, todos los dispositivos de prueba van de ##min### (mínimo) a 636 (máximo) ms. » 51 % de todos los dispositivos son mejores. Eso quiere decir que el tiempo de respuesta es peor que la media (31 ms) de todos los dispositivos testados. | ||
Parpadeo de Pantalla / PWM (Pulse-Width Modulation)
| Parpadeo de Pantalla / PWM detectado | 119000 Hz | ≤ 85 % de brillo | 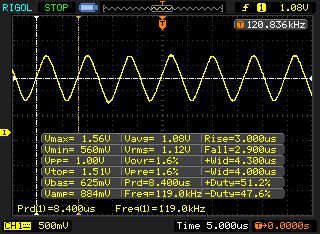 |
La retroiluminación del display parpadea a 119000 Hz (seguramente usa PWM - Pulse-Width Modulation) a un brillo del 85 % e inferior. Sobre este nivel de brillo no debería darse parpadeo / PWM. La frecuencia de 119000 Hz es bastante alta, por lo que la mayoría de gente sensible al parpadeo no debería ver parpadeo o tener fatiga visual. Comparación: 52 % de todos los dispositivos testados no usaron PWM para atenuar el display. Si se usó, medimos una media de 7757 (mínimo: 5 - máxmo: 343500) Hz. | |||
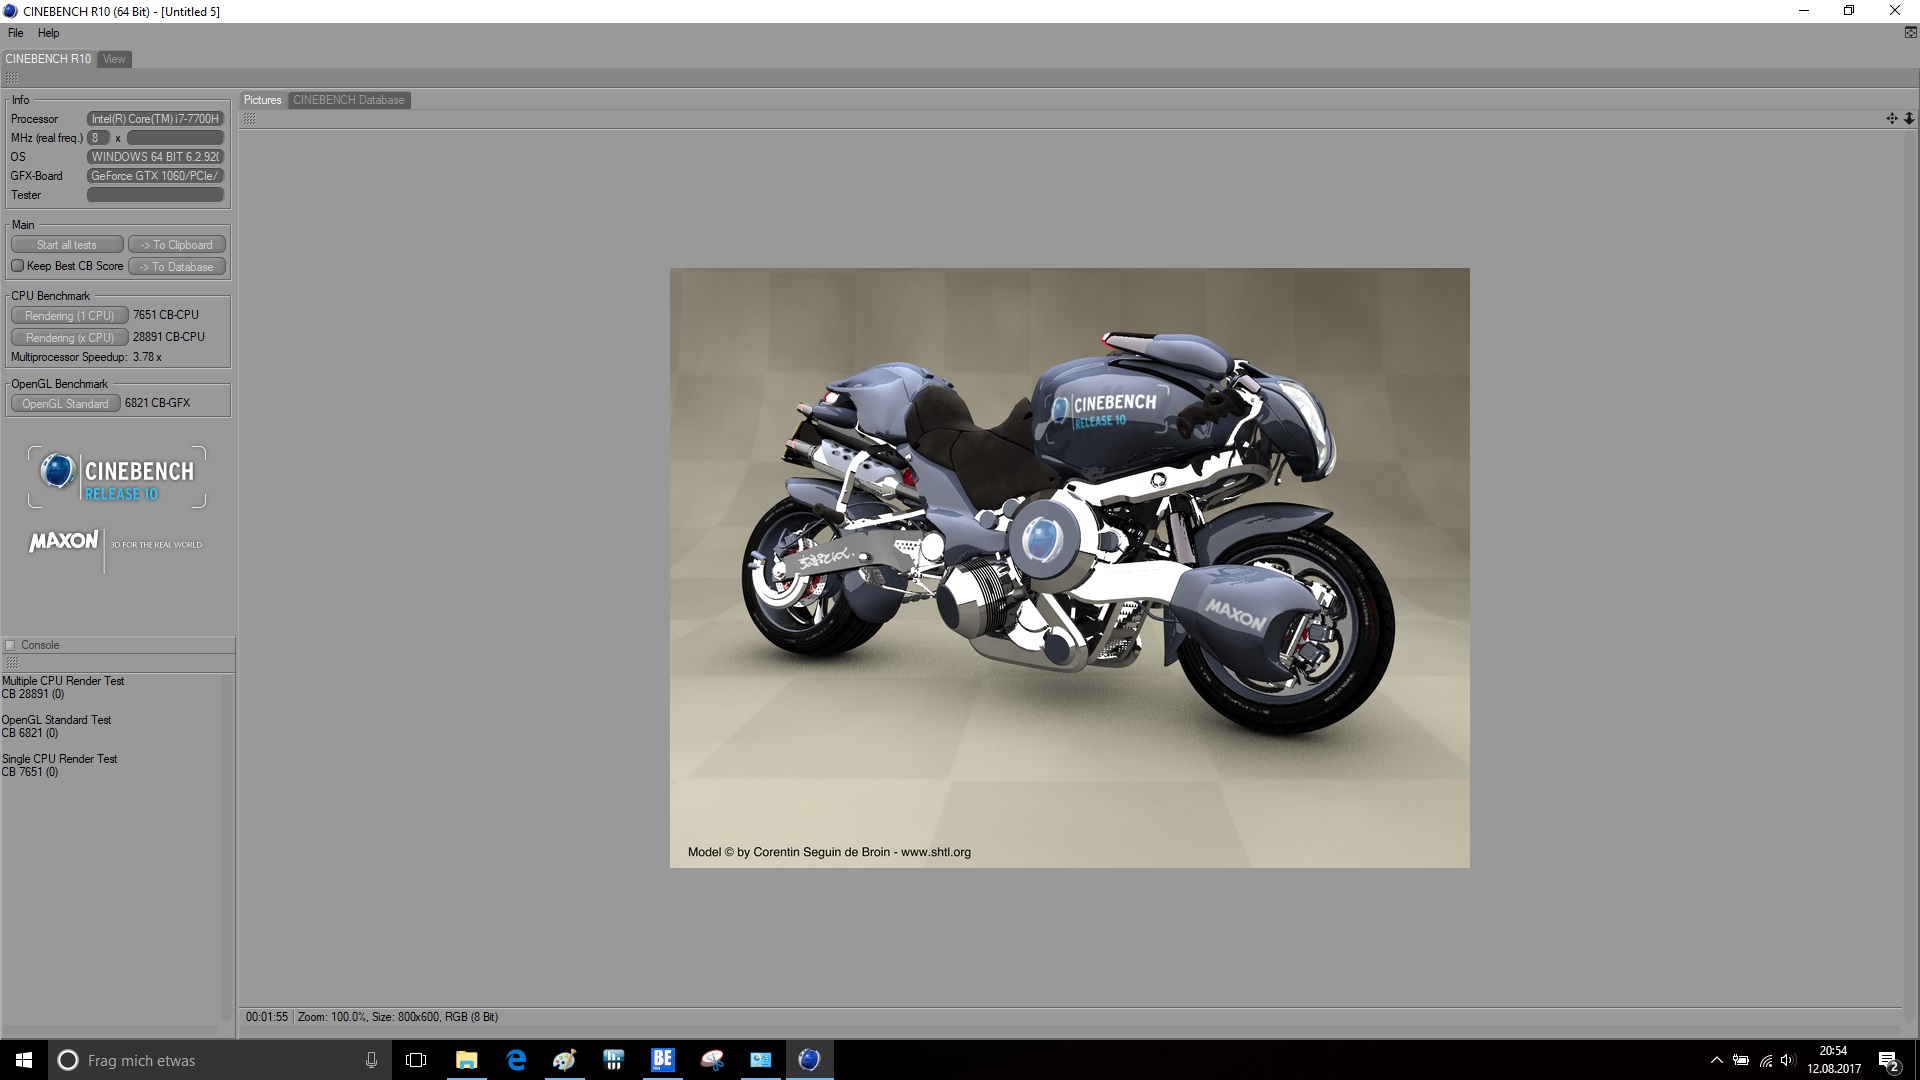
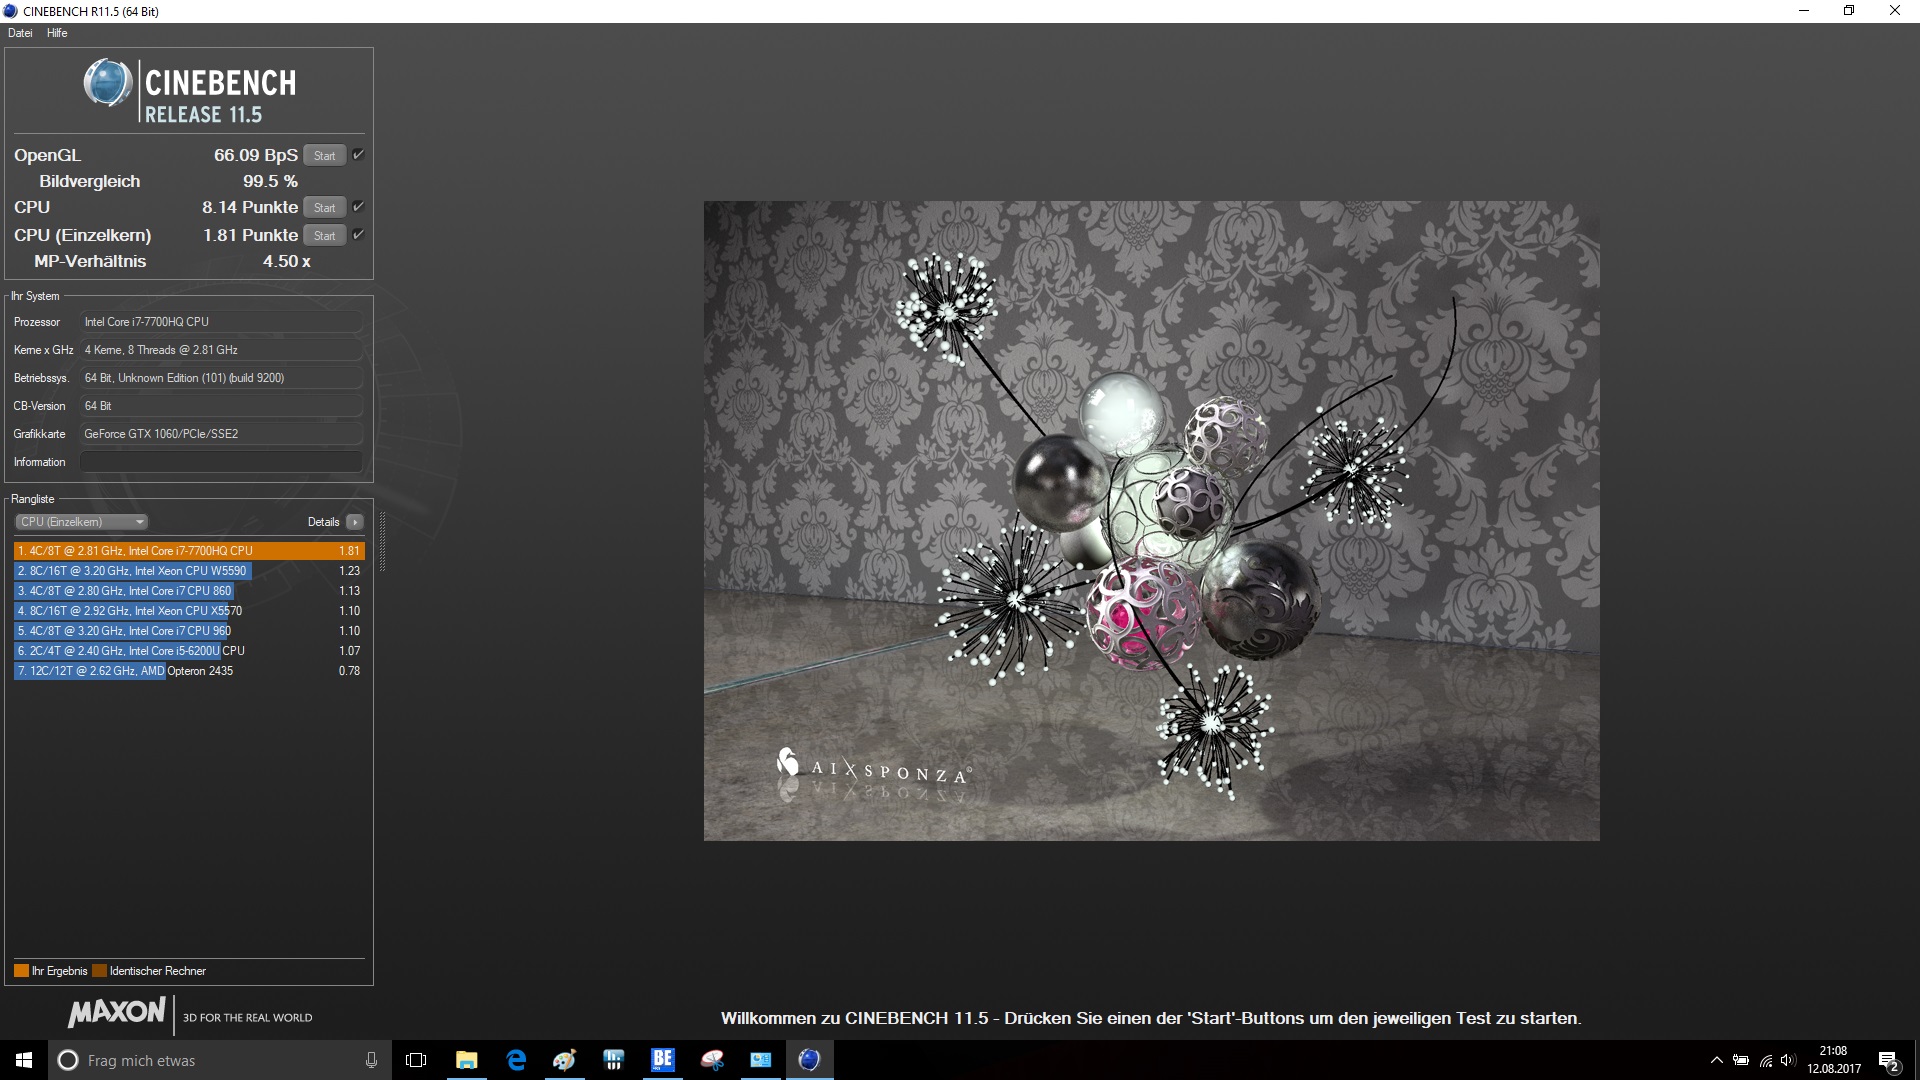
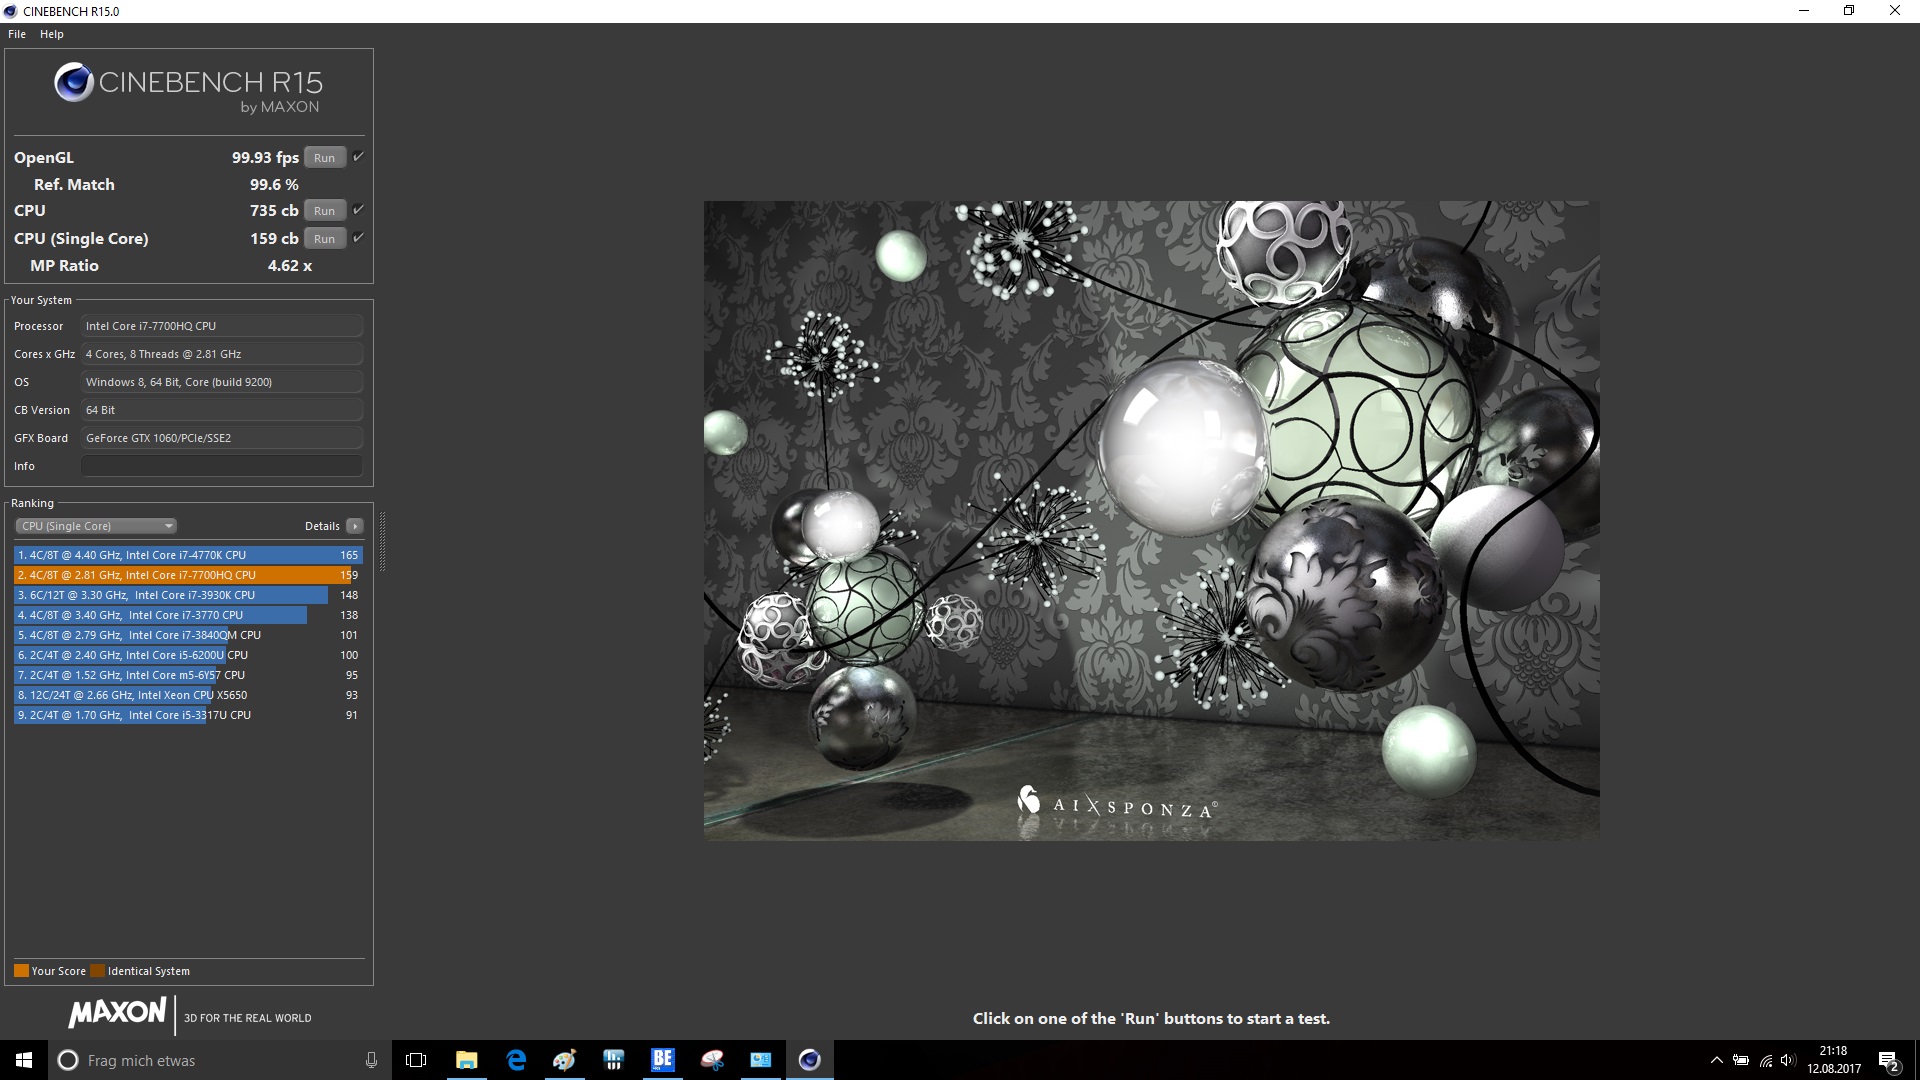
| Cinebench R11.5 | |
| CPU Single 64Bit | |
| Nexoc G739 | |
| Acer Predator Helios 300 | |
| Gigabyte P57X v7 | |
| Asus GL753VE-DS74 | |
| MSI GE72VR-6RF16H21 | |
| CPU Multi 64Bit | |
| Nexoc G739 | |
| Acer Predator Helios 300 | |
| Asus GL753VE-DS74 | |
| Gigabyte P57X v7 | |
| MSI GE72VR-6RF16H21 | |
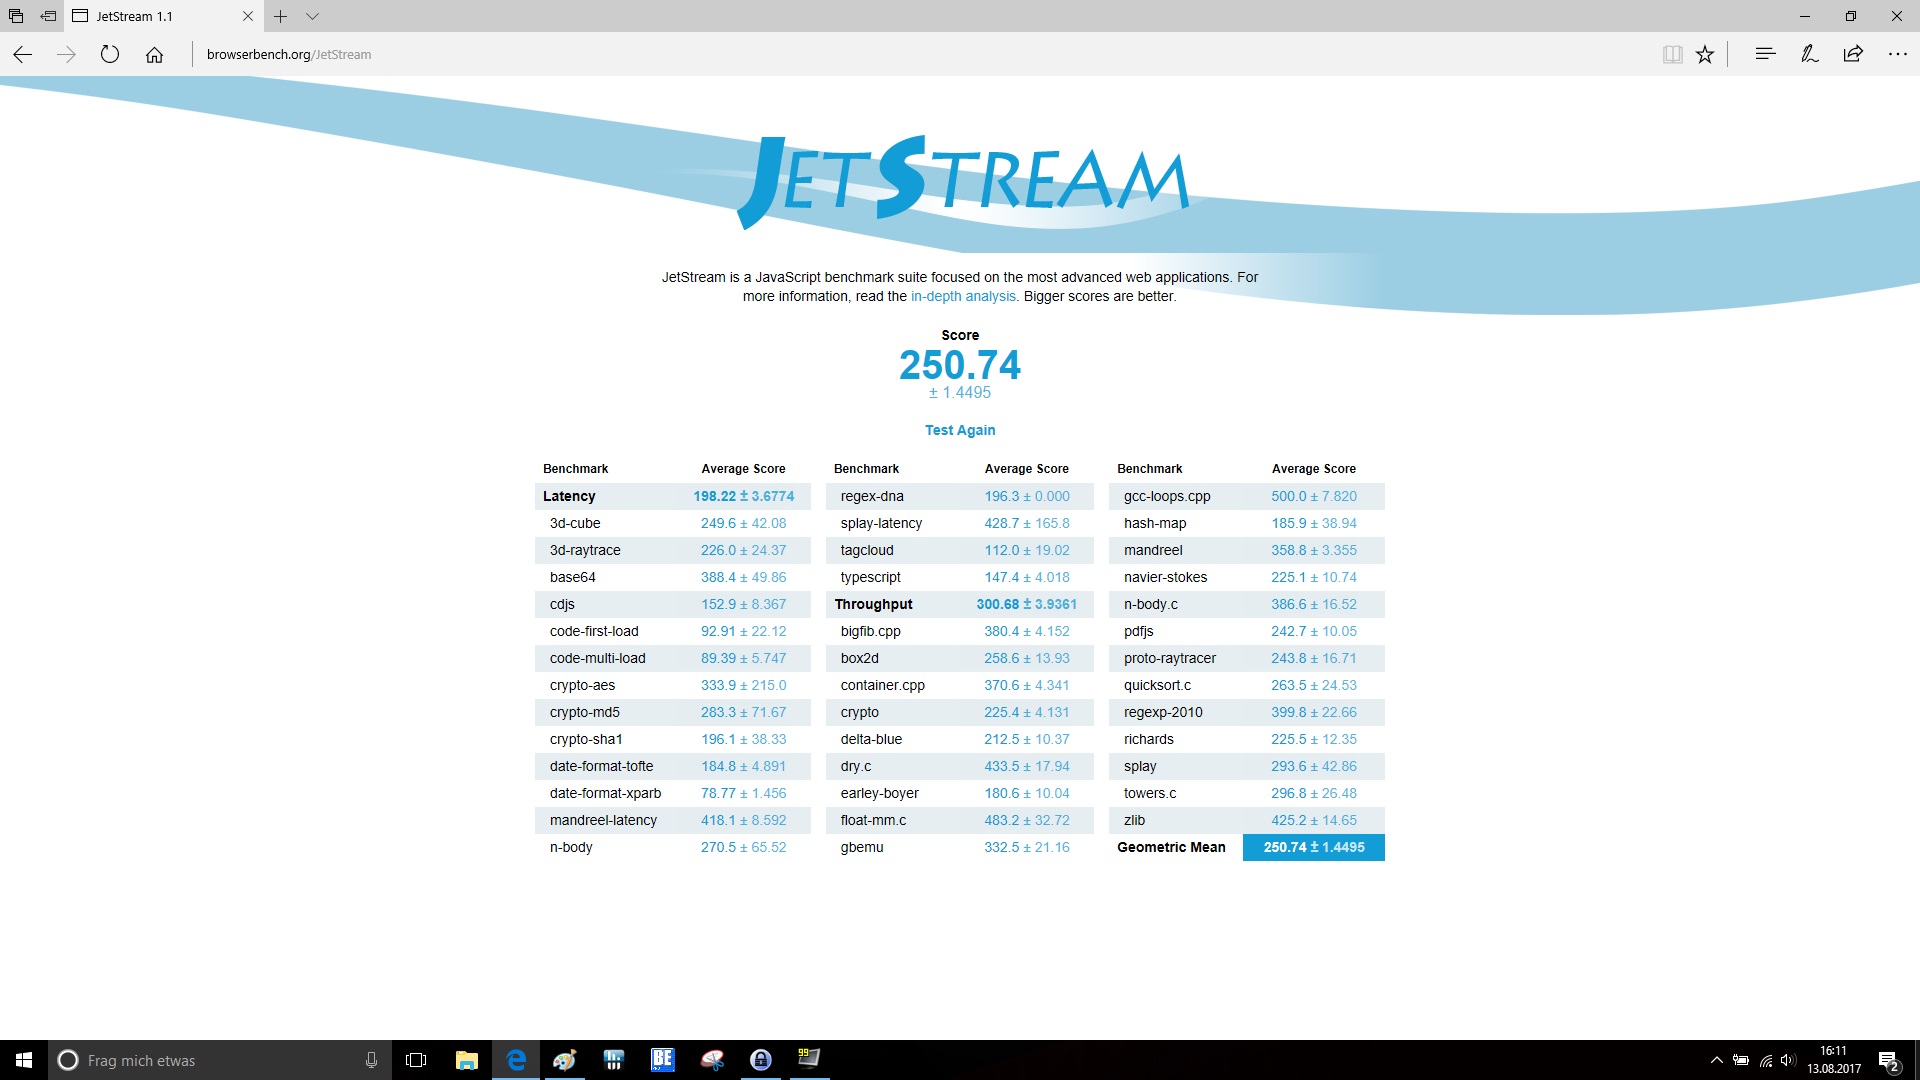
| JetStream 1.1 - 1.1 Total | |
| Acer Aspire V17 Nitro BE VN7-793-738J | |
| Nexoc G739 | |
| Asus GL753VE-DS74 | |
| Acer Predator Helios 300 | |
| HP Omen 17-an014ng | |
| MSI GE72VR-6RF16H21 | |
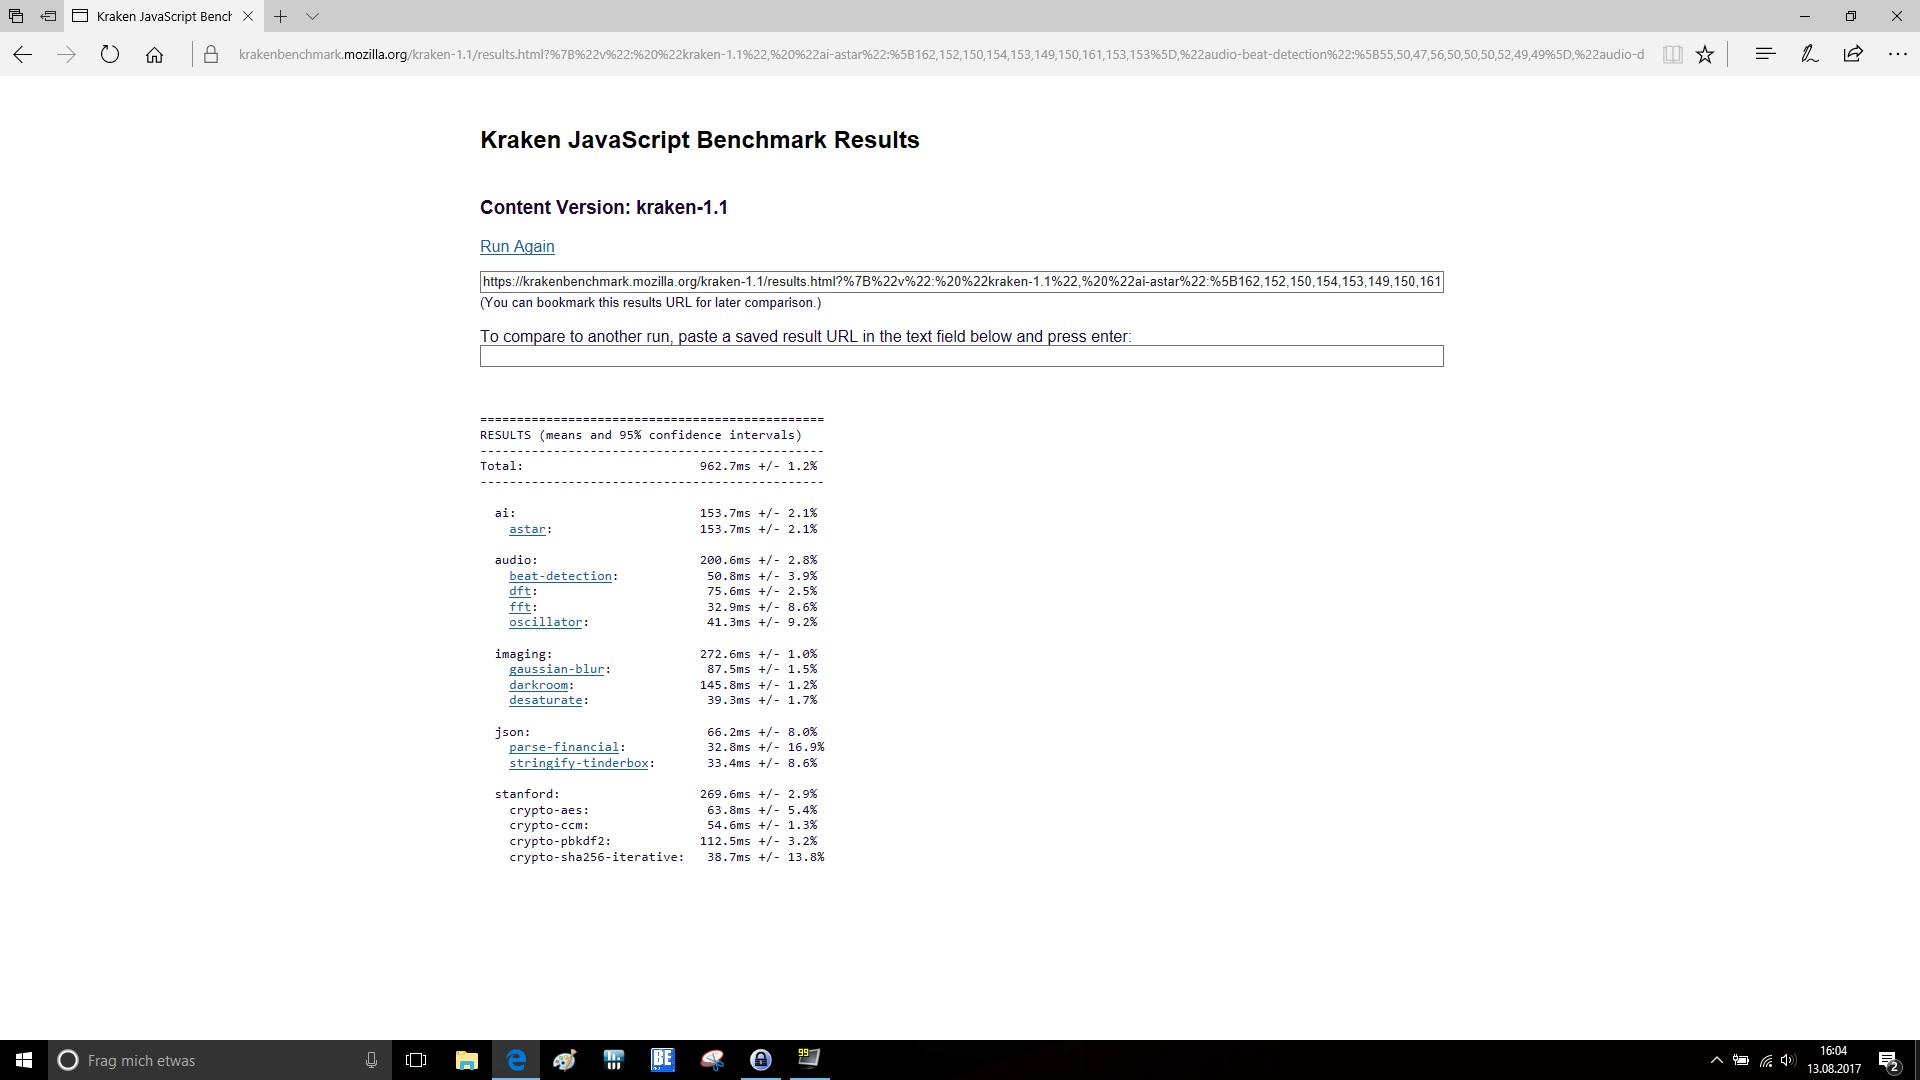
| Mozilla Kraken 1.1 - Total | |
| MSI GE72VR-6RF16H21 | |
| HP Omen 17-an014ng | |
| Acer Predator Helios 300 | |
| Asus GL753VE-DS74 | |
| Nexoc G739 | |
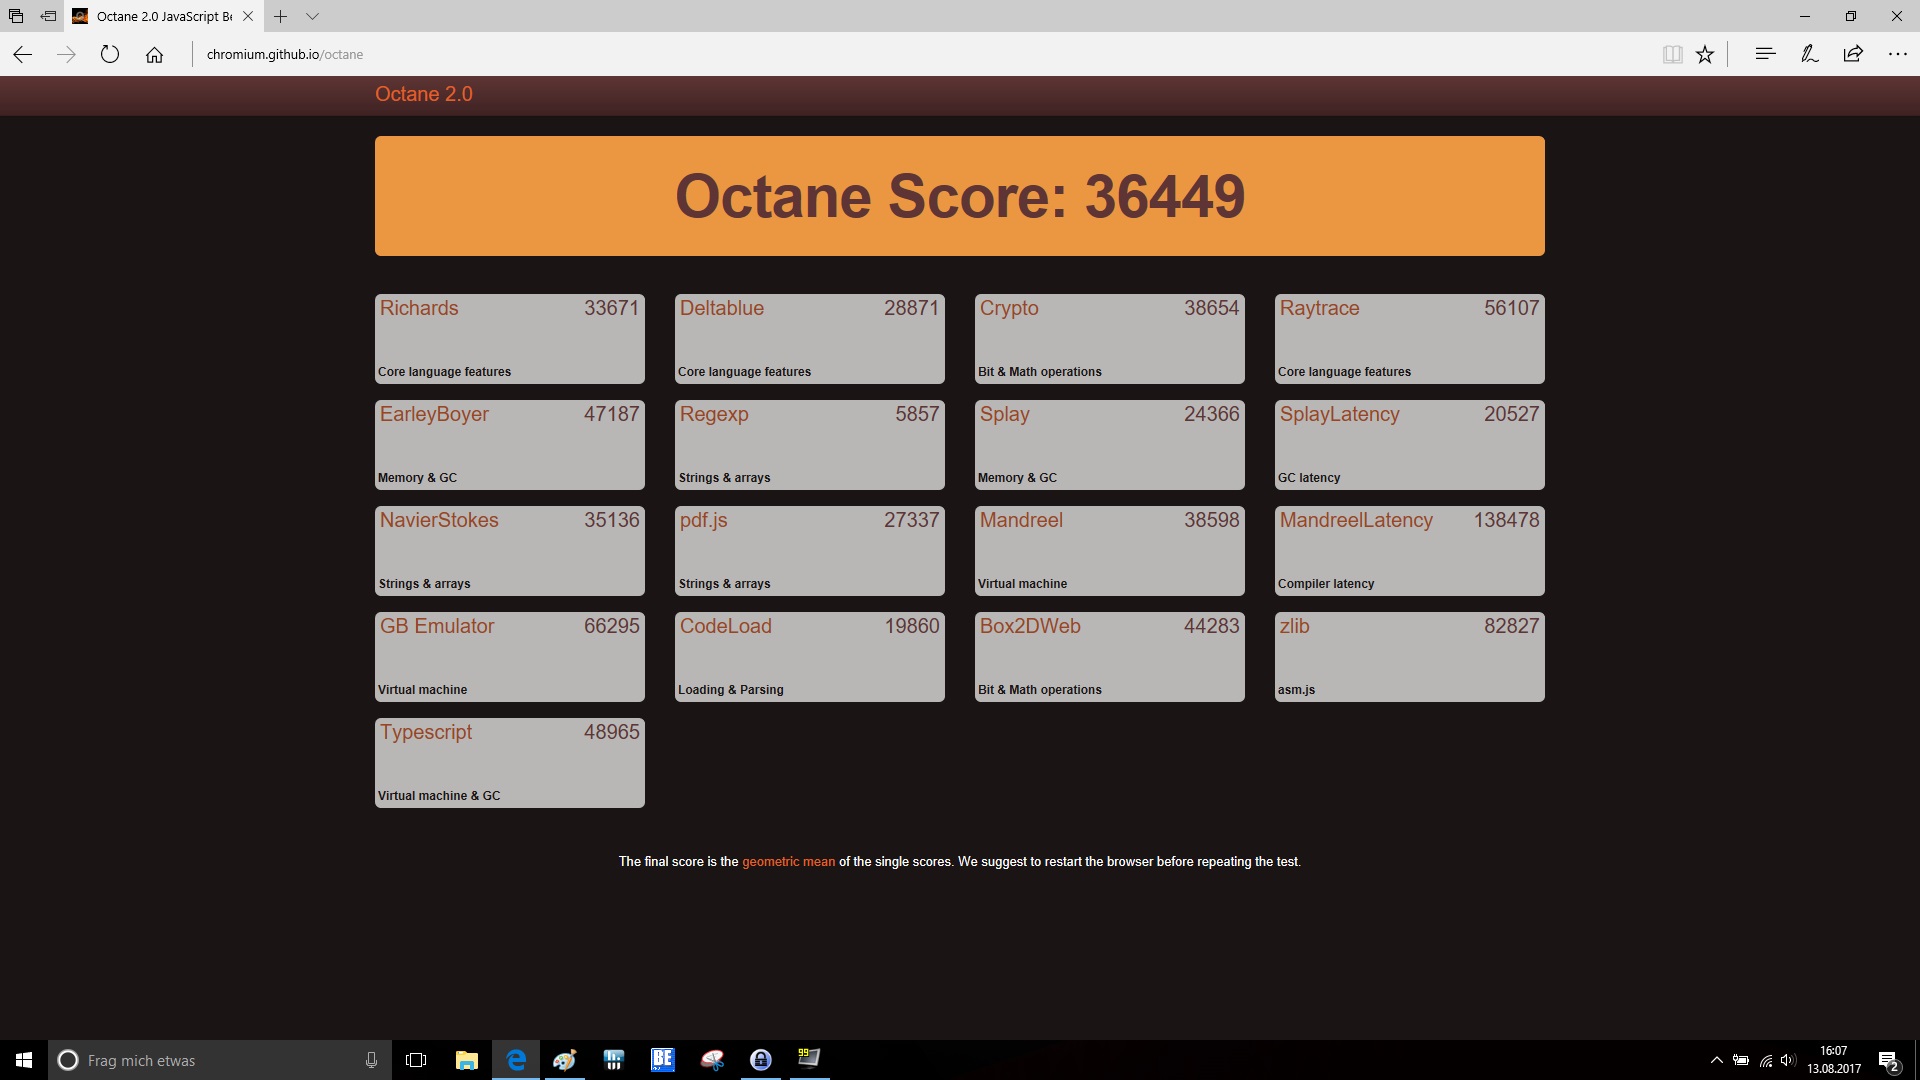
| Octane V2 - Total Score | |
| Nexoc G739 | |
| Asus GL753VE-DS74 | |
| Acer Predator Helios 300 | |
| HP Omen 17-an014ng | |
| MSI GE72VR-6RF16H21 | |
* ... más pequeño es mejor

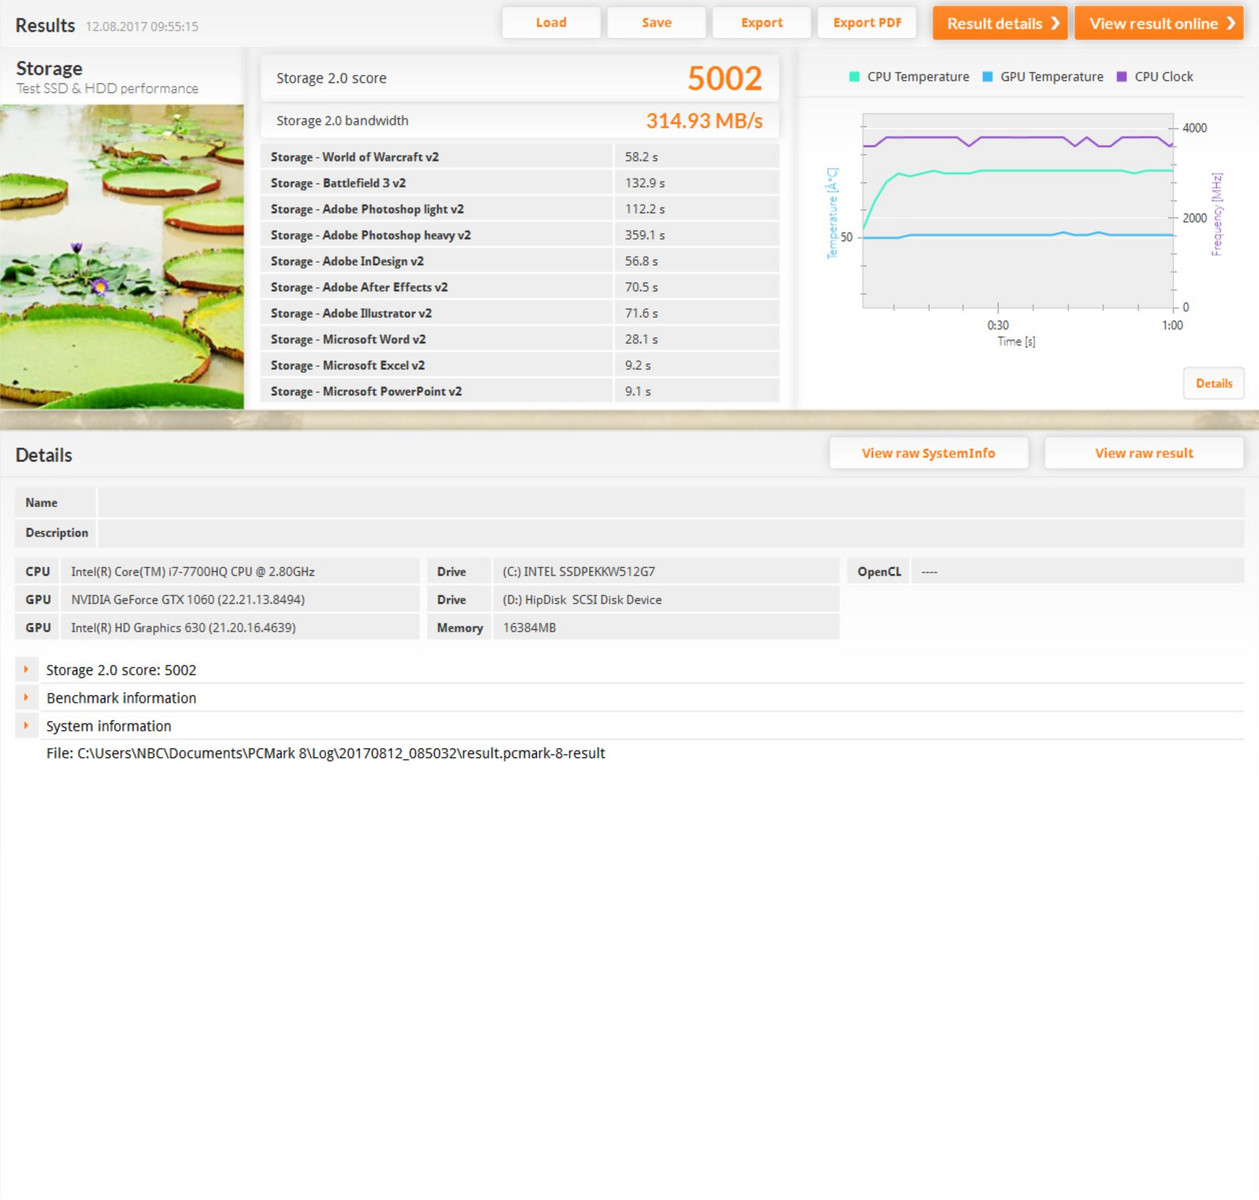
| PCMark 8 Home Score Accelerated v2 | 4874 puntos | |
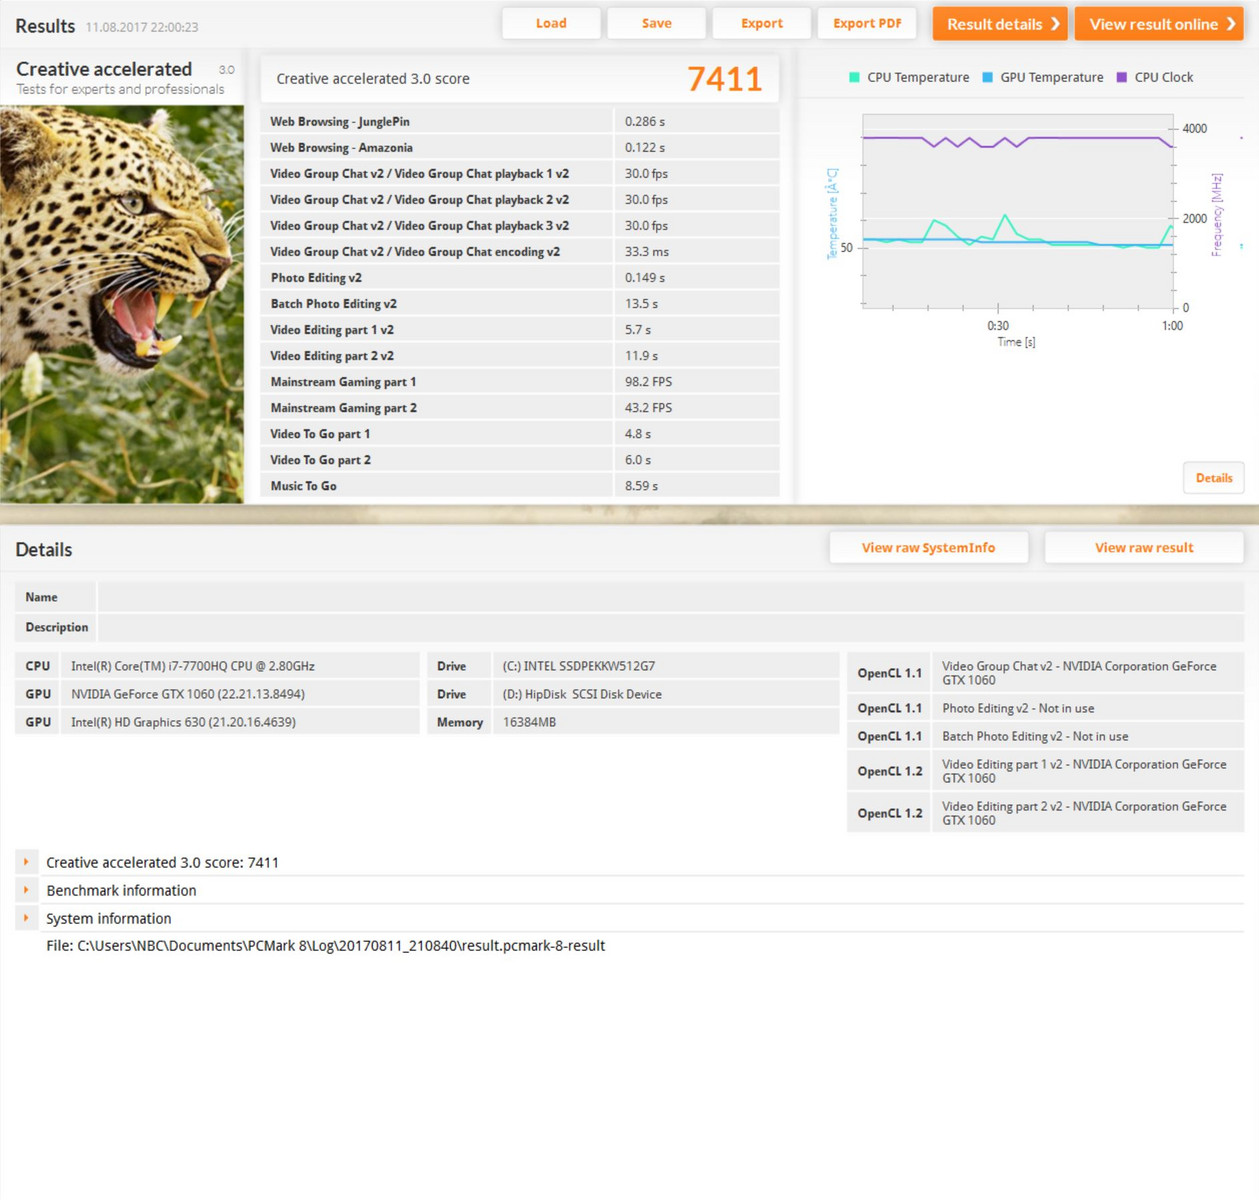
| PCMark 8 Creative Score Accelerated v2 | 7411 puntos | |
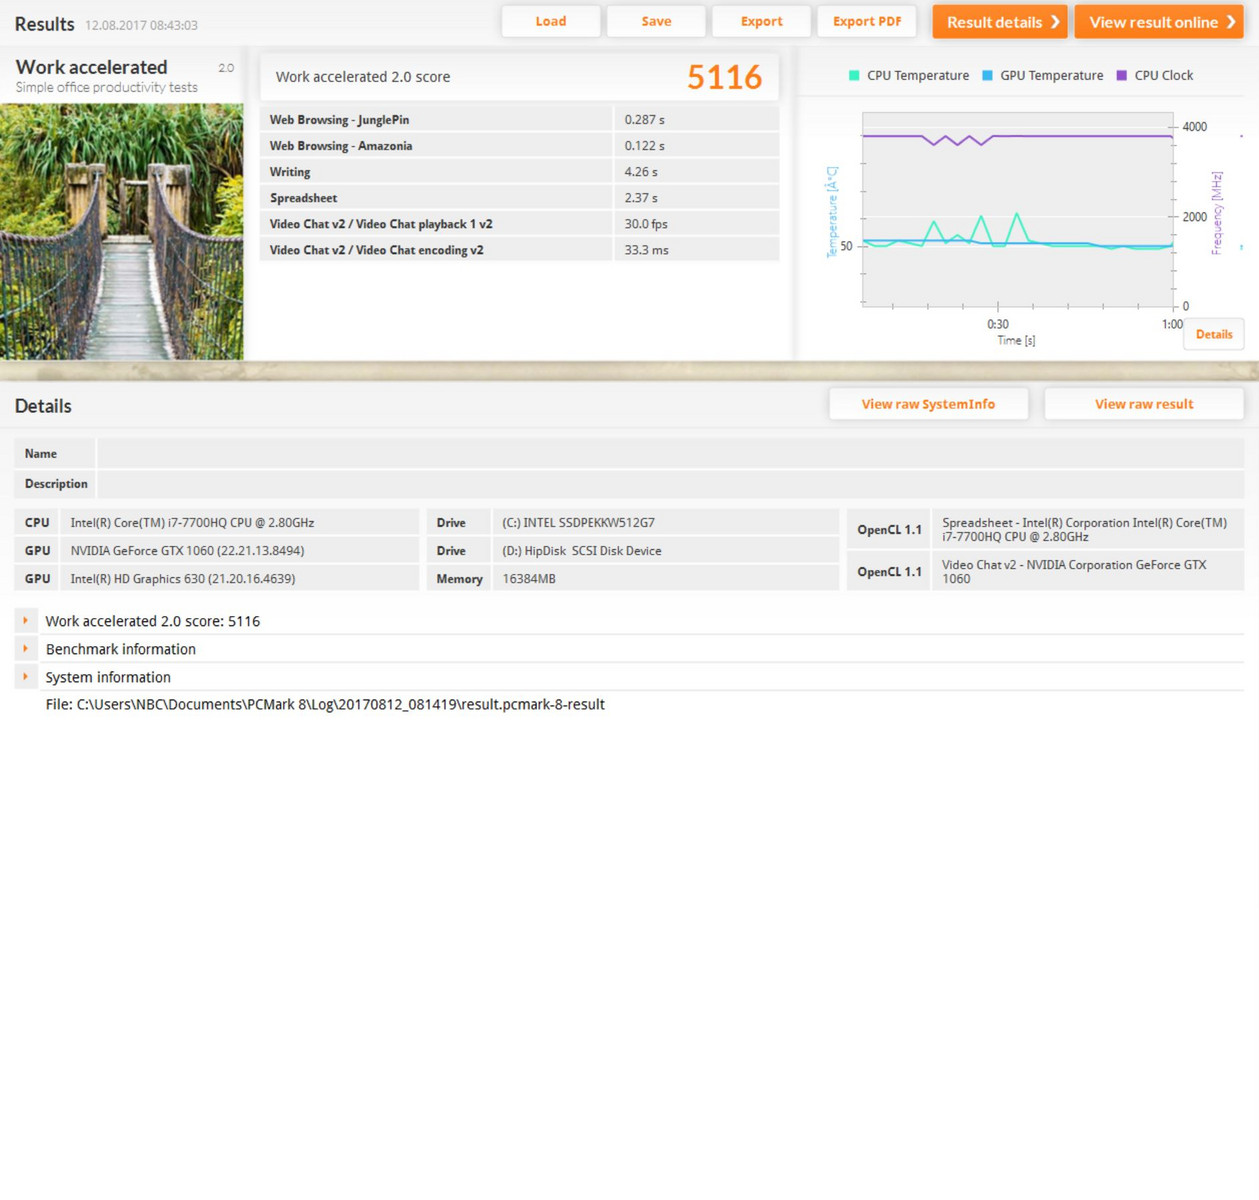
| PCMark 8 Work Score Accelerated v2 | 5116 puntos | |
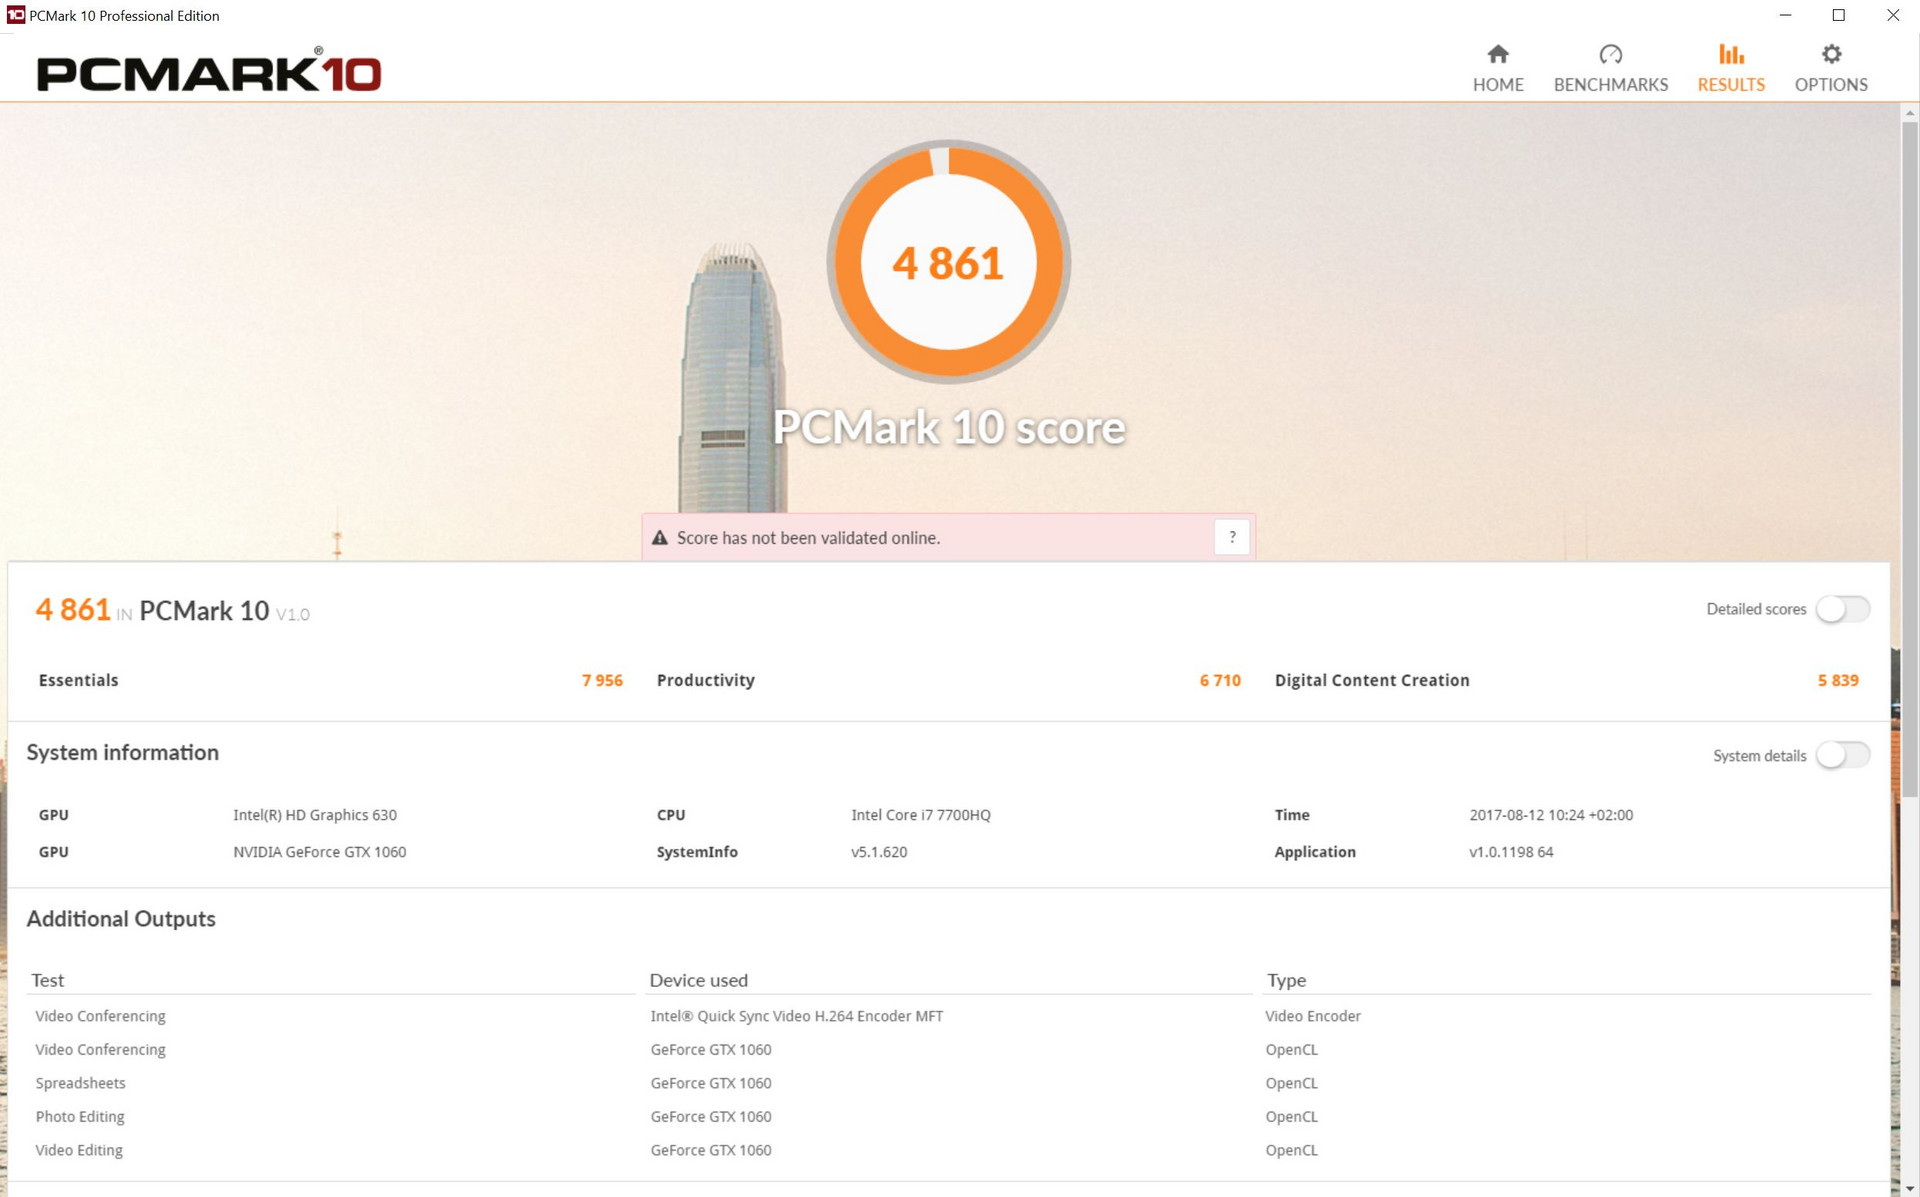
| PCMark 10 Score | 4861 puntos | |
ayuda | ||
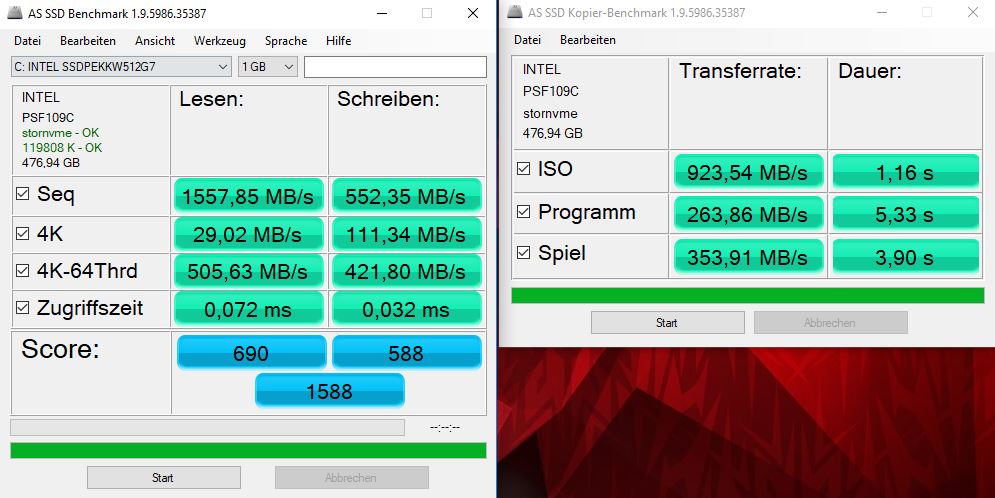
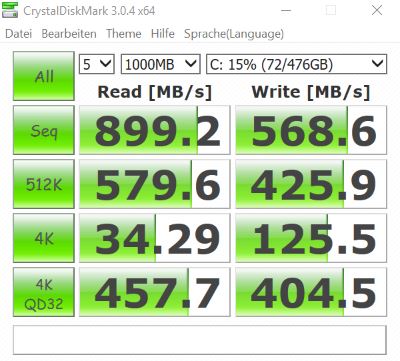
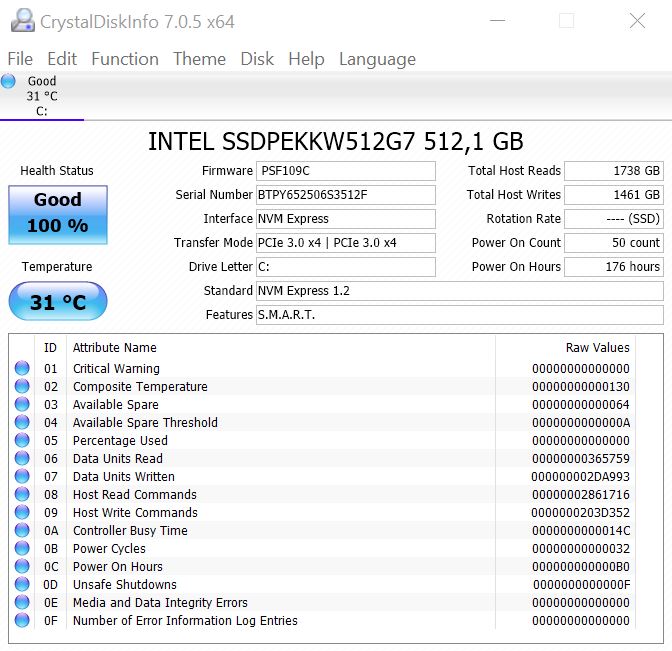
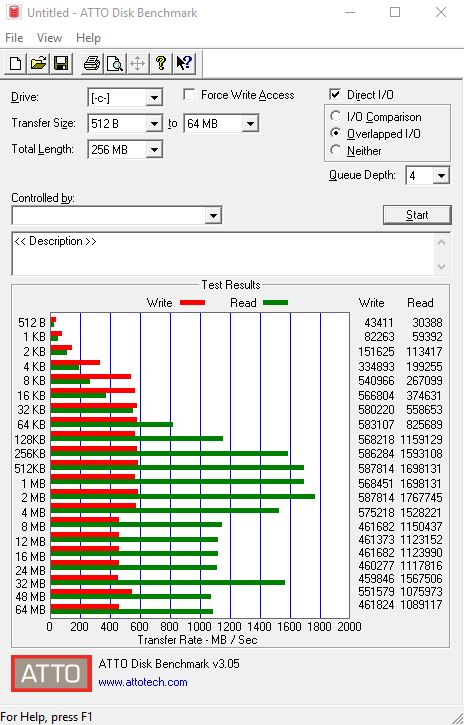
| Acer Predator Helios 300 Intel SSD 600p SSDPEKKW512G7 | Acer Aspire V17 Nitro BE VN7-793-738J Intel SSD 600p SSDPEKKW512G7 | Asus GL753VE-DS74 Intel SSD 600p SSDPEKKW512G7 | MSI GE72VR-6RF16H21 Toshiba HG6 THNSNJ256G8NY | HP Omen 17-an014ng Samsung PM961 MZVLW256HEHP | Gigabyte P57X v7 Transcend MTS800 256GB M.2 (TS256GMTS800) | Nexoc G739 Samsung PM961 MZVLW256HEHP | |
|---|---|---|---|---|---|---|---|
| CrystalDiskMark 3.0 | -3% | -21% | -39% | 66% | -36% | 64% | |
| Read Seq (MB/s) | 899 | 880 -2% | 1049 17% | 510 -43% | 1736 93% | 517 -42% | 1666 85% |
| Write Seq (MB/s) | 569 | 581 2% | 584 3% | 274.6 -52% | 1212 113% | 305.7 -46% | 1192 109% |
| Read 512 (MB/s) | 580 | 725 25% | 583 1% | 427.2 -26% | 1044 80% | 315 -46% | 857 48% |
| Write 512 (MB/s) | 425.9 | 429.3 1% | 458 8% | 247.2 -42% | 854 101% | 306.1 -28% | 827 94% |
| Read 4k (MB/s) | 34.29 | 10.46 -69% | 14.1 -59% | 21.23 -38% | 59.1 72% | 26.04 -24% | 60.7 77% |
| Write 4k (MB/s) | 125.5 | 123.4 -2% | 108 -14% | 86.8 -31% | 144.9 15% | 82.3 -34% | 154.5 23% |
| Read 4k QD32 (MB/s) | 457.7 | 459.2 0% | 57.8 -87% | 335.4 -27% | 582 27% | 281.3 -39% | 636 39% |
| Write 4k QD32 (MB/s) | 404.5 | 496.9 23% | 264 -35% | 178.1 -56% | 523 29% | 296 -27% | 544 34% |

| 3DMark | |
| 1280x720 Cloud Gate Standard Graphics | |
| HP Omen 17-an014ng | |
| Acer Predator Helios 300 | |
| Gigabyte P57X v7 | |
| MSI GE72VR-6RF16H21 | |
| Nexoc G739 | |
| Asus GL753VE-DS74 | |
| 1920x1080 Fire Strike Graphics | |
| HP Omen 17-an014ng | |
| Gigabyte P57X v7 | |
| Acer Predator Helios 300 | |
| MSI GE72VR-6RF16H21 | |
| Acer Aspire V17 Nitro BE VN7-793-738J | |
| Nexoc G739 | |
| Asus GL753VE-DS74 | |
| 3DMark 11 - 1280x720 Performance GPU | |
| Gigabyte P57X v7 | |
| HP Omen 17-an014ng | |
| Acer Predator Helios 300 | |
| MSI GE72VR-6RF16H21 | |
| Acer Aspire V17 Nitro BE VN7-793-738J | |
| Nexoc G739 | |
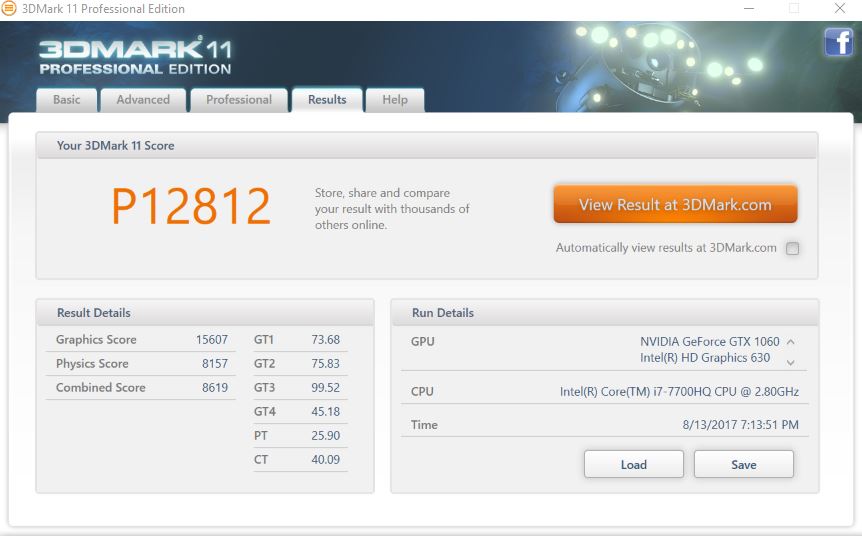
| 3DMark 11 Performance | 12812 puntos | |
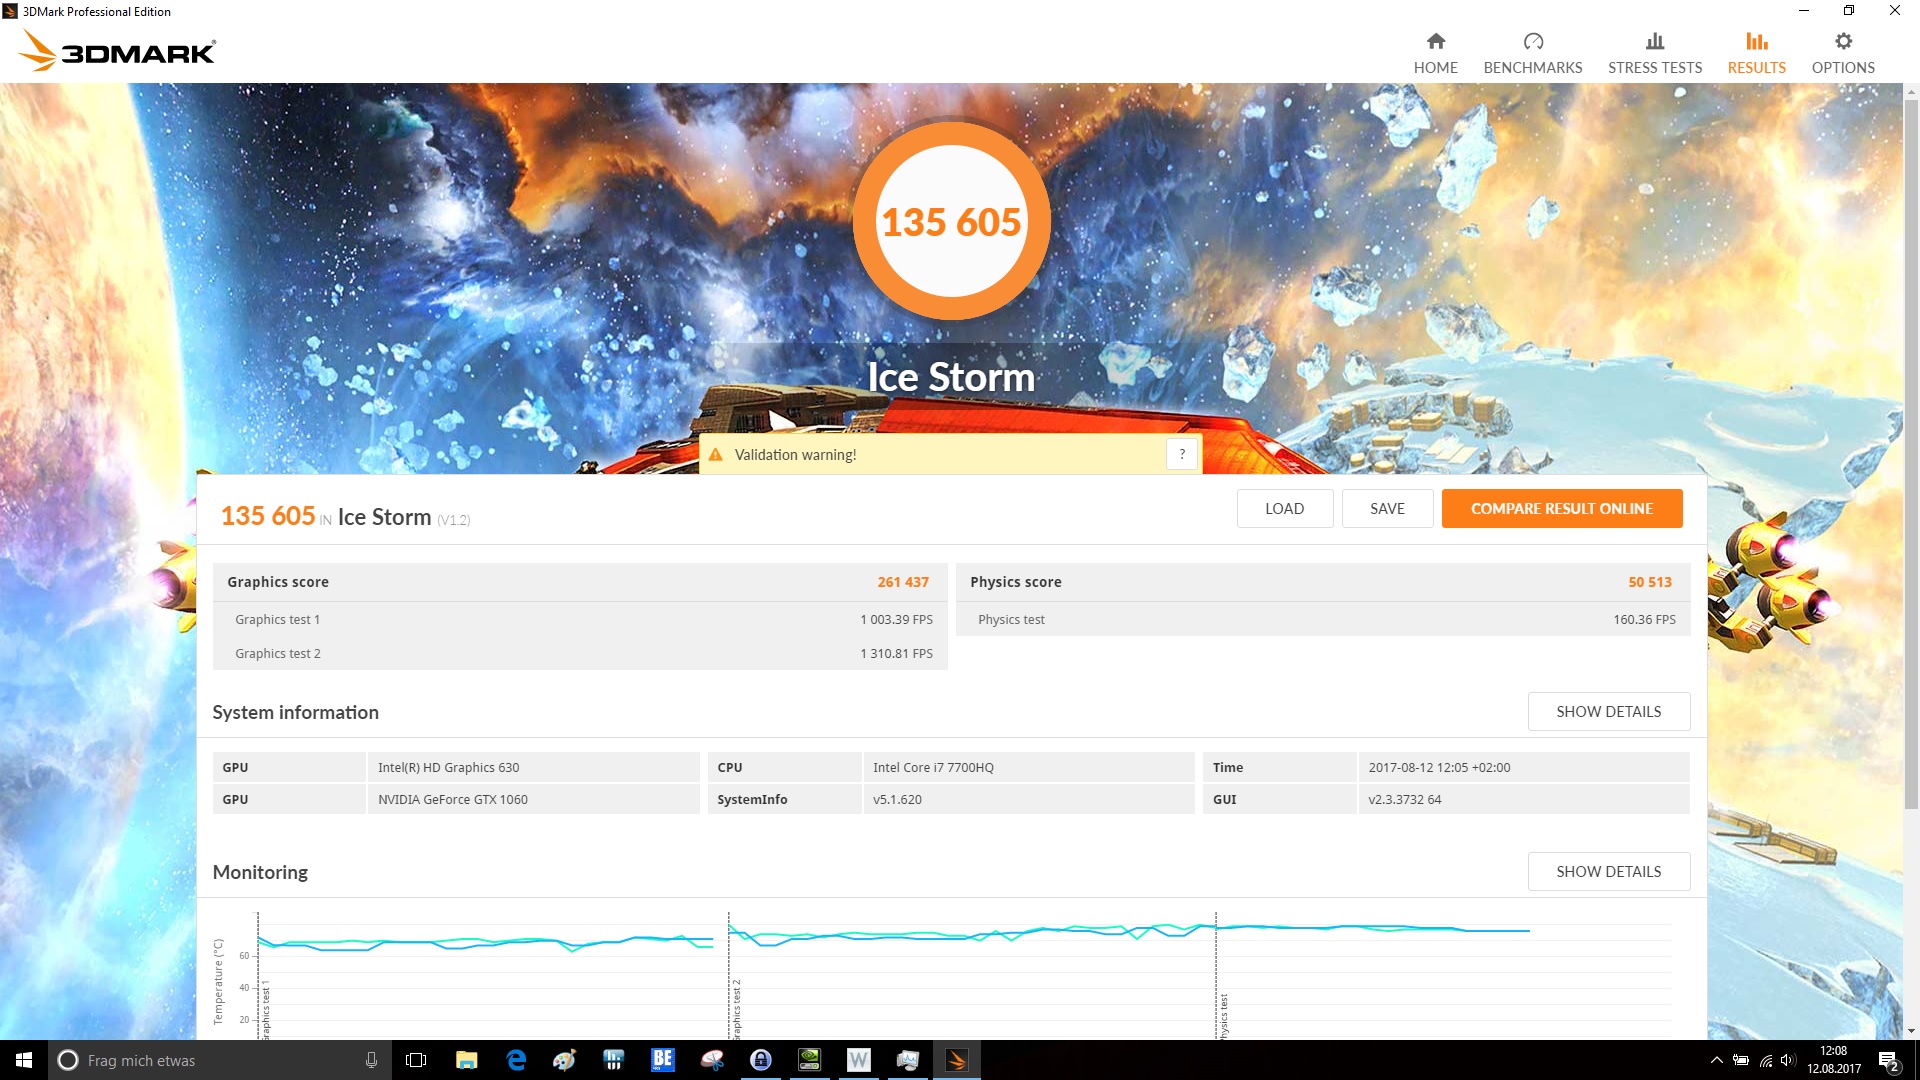
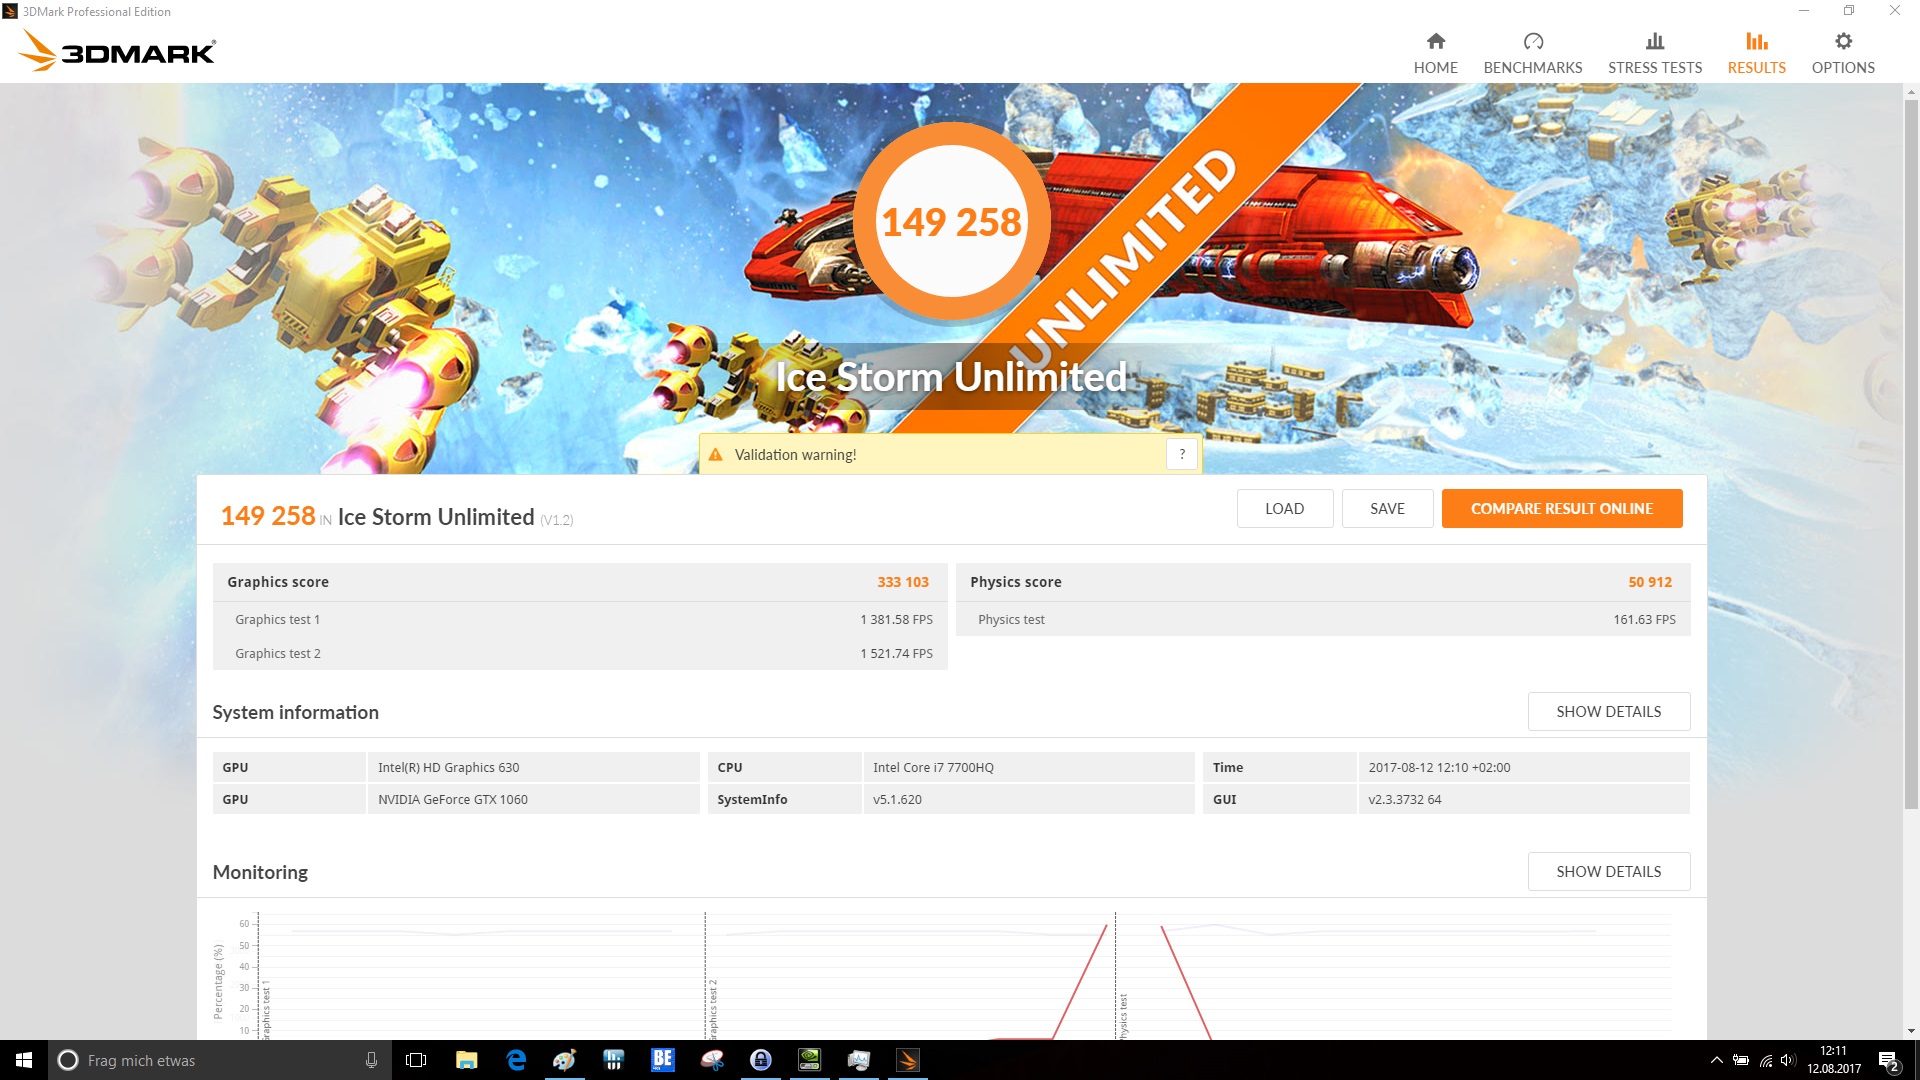
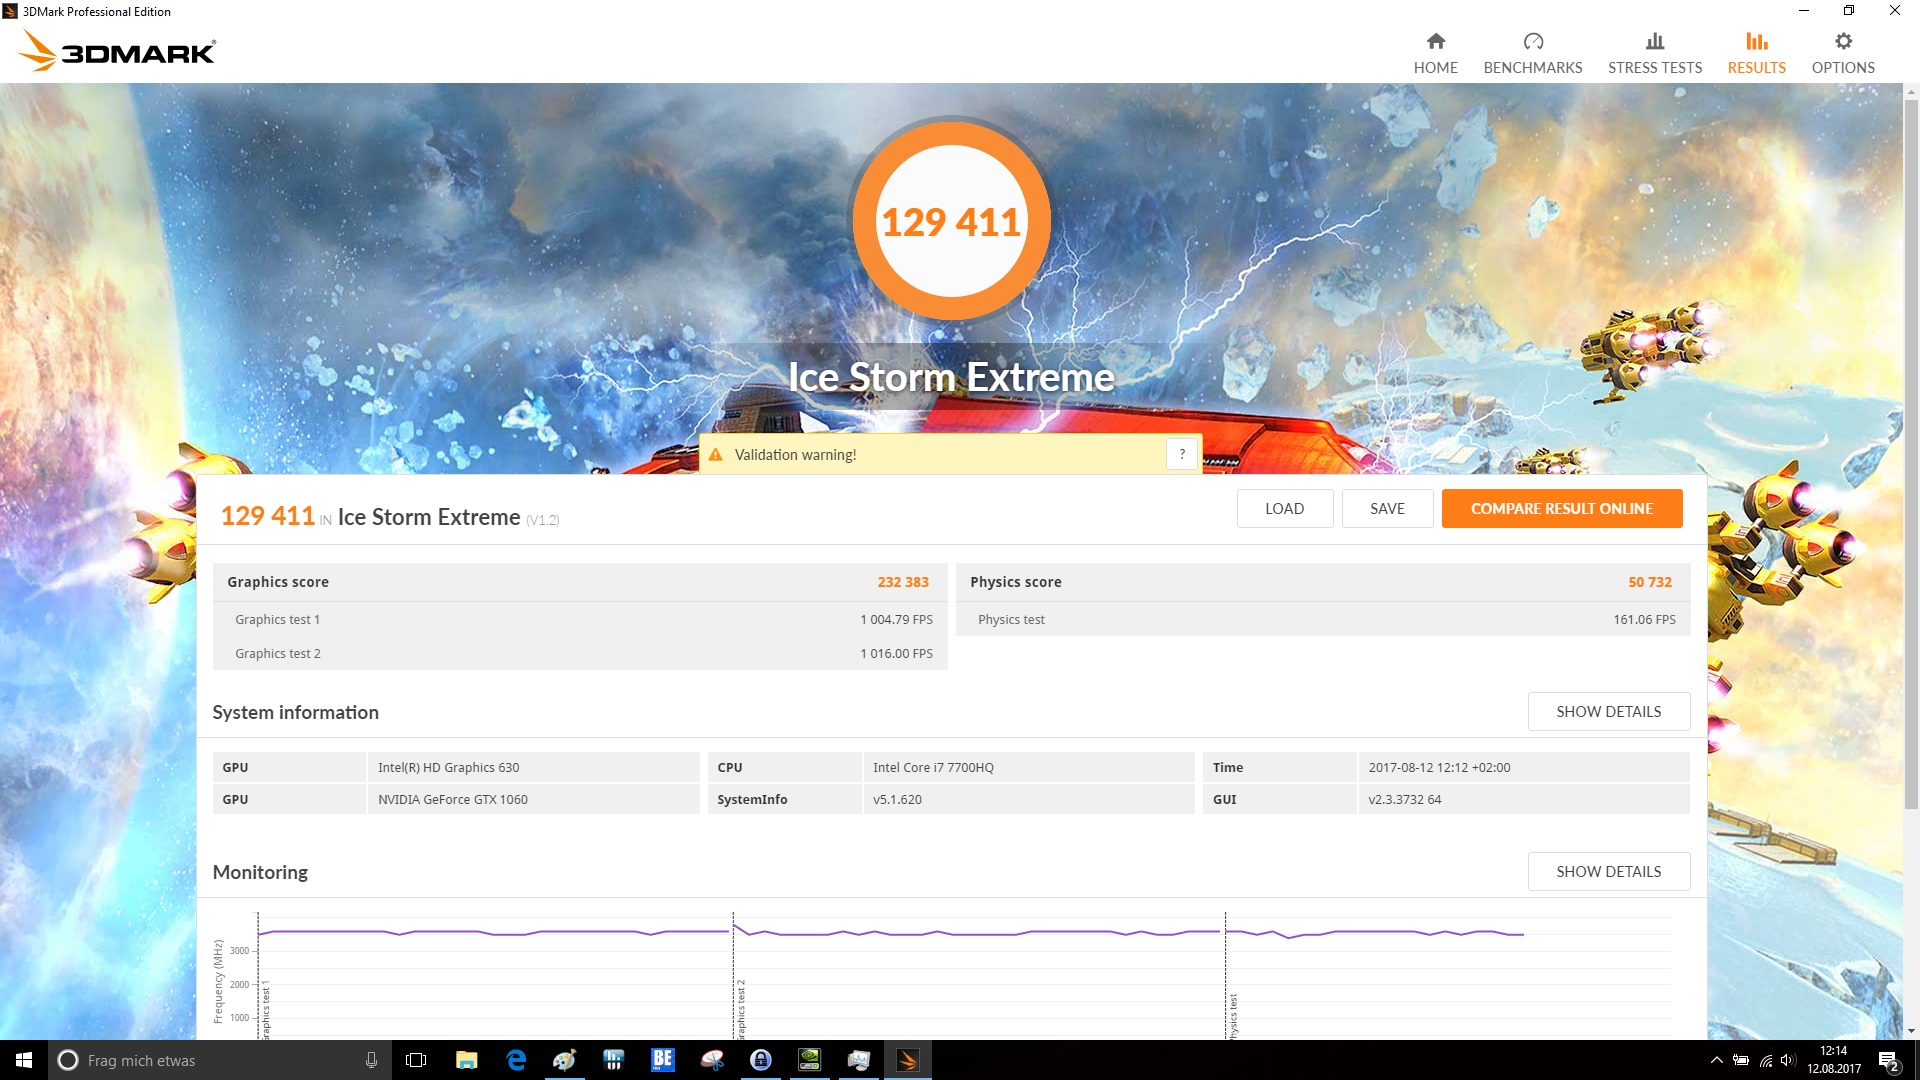
| 3DMark Ice Storm Standard Score | 135605 puntos | |
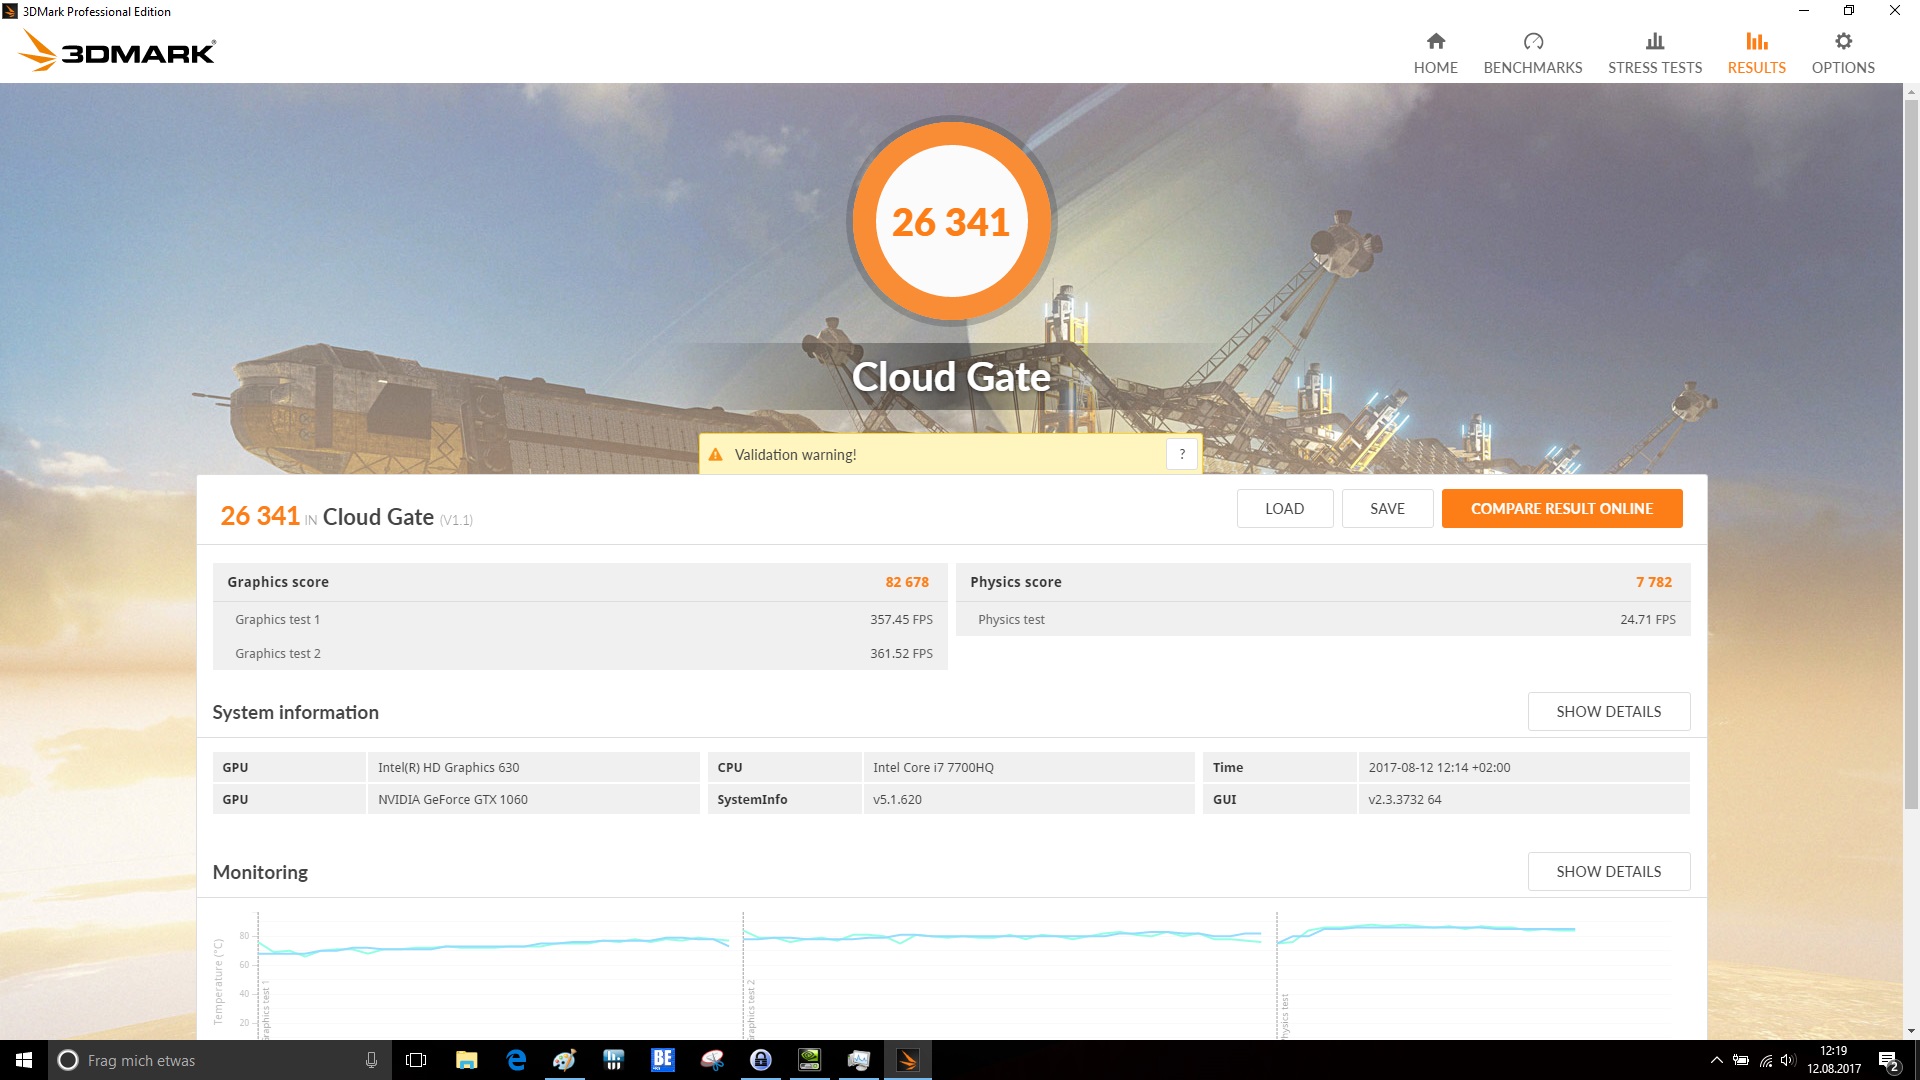
| 3DMark Cloud Gate Standard Score | 26341 puntos | |
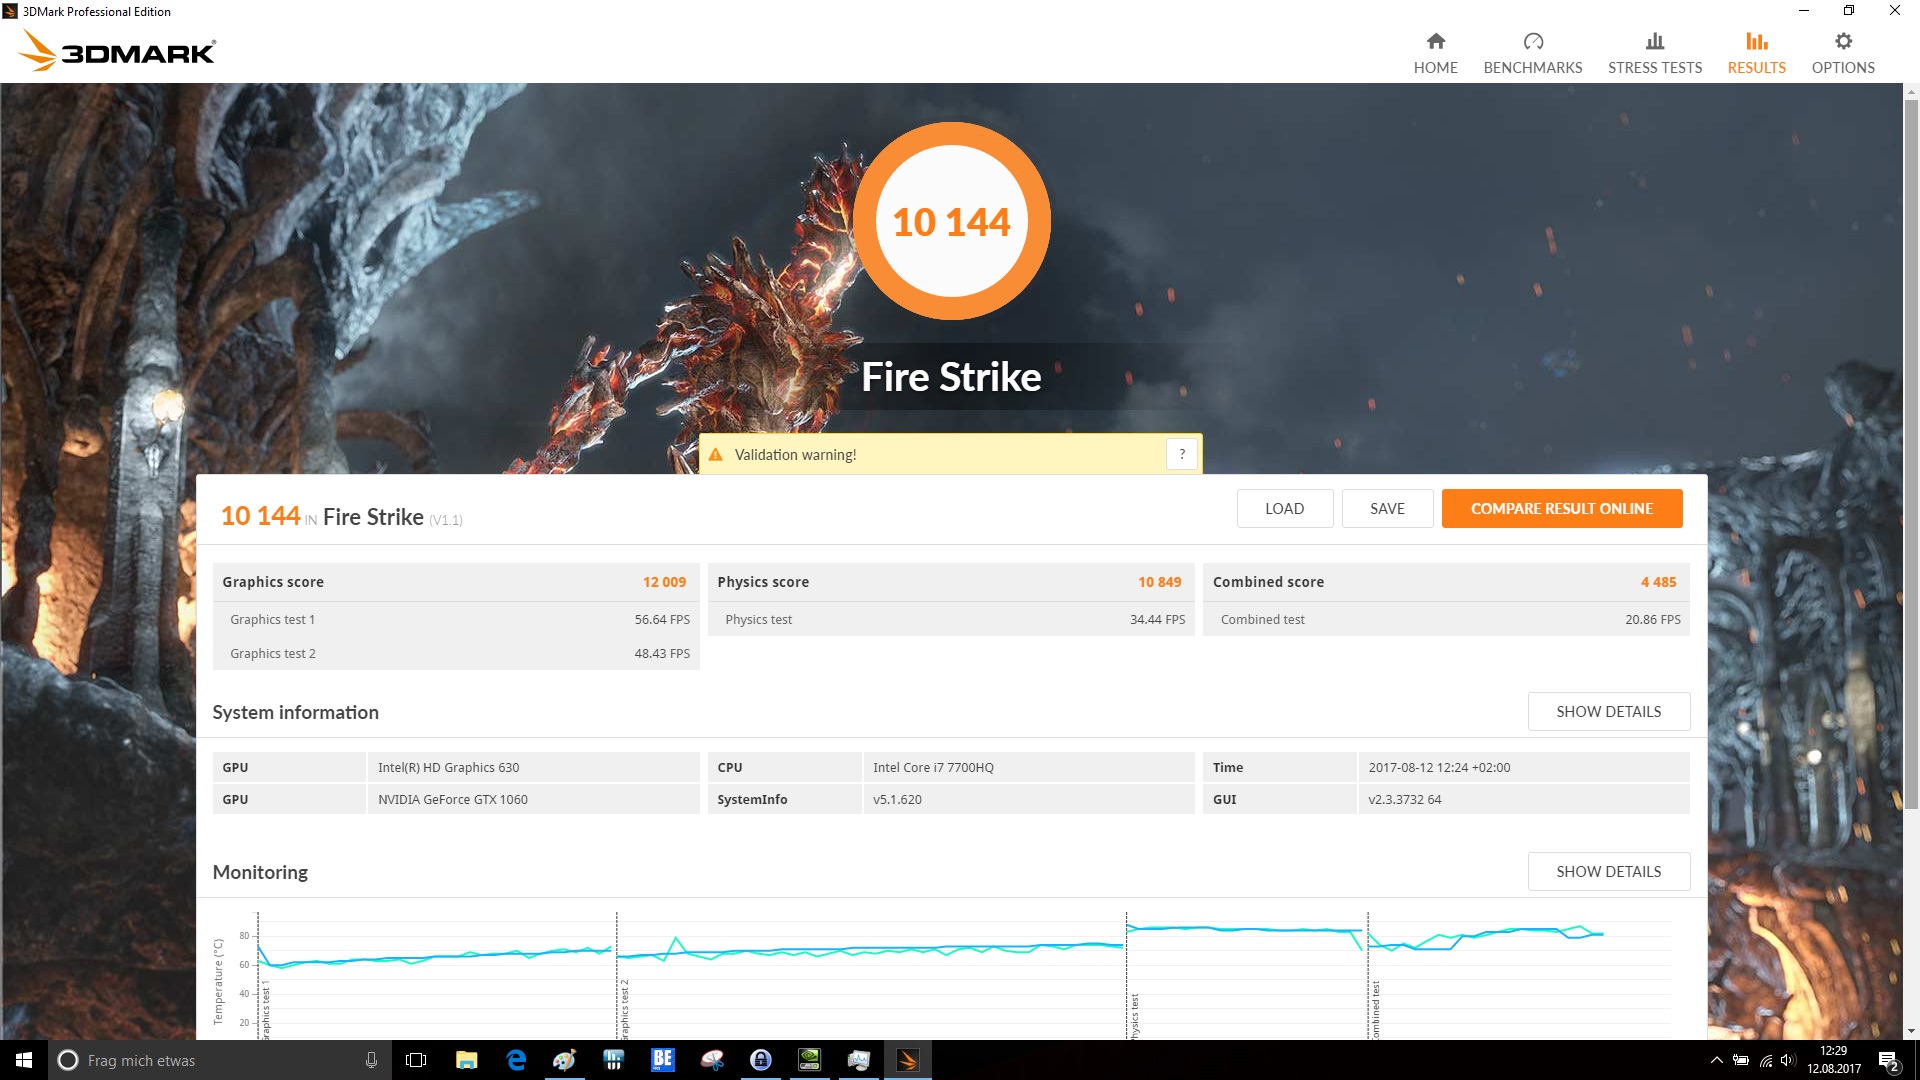
| 3DMark Fire Strike Score | 10144 puntos | |
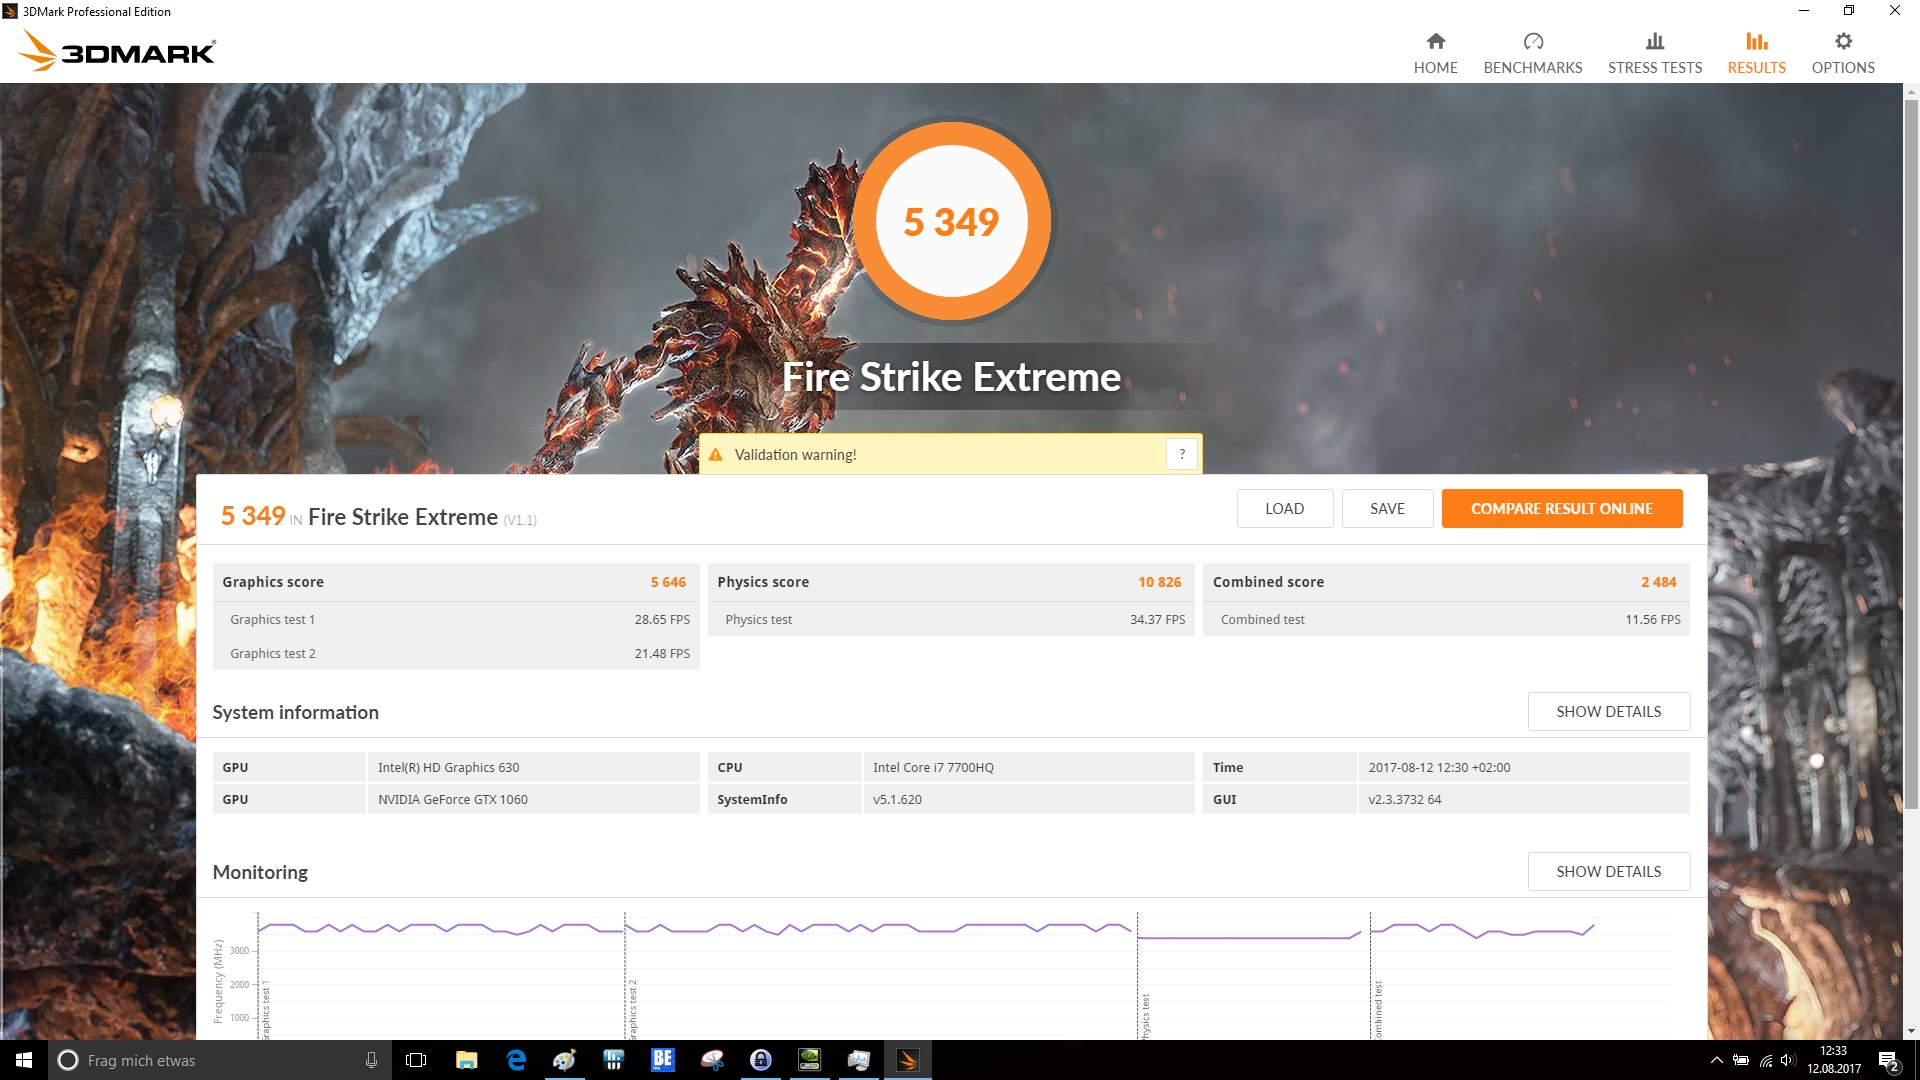
| 3DMark Fire Strike Extreme Score | 5349 puntos | |
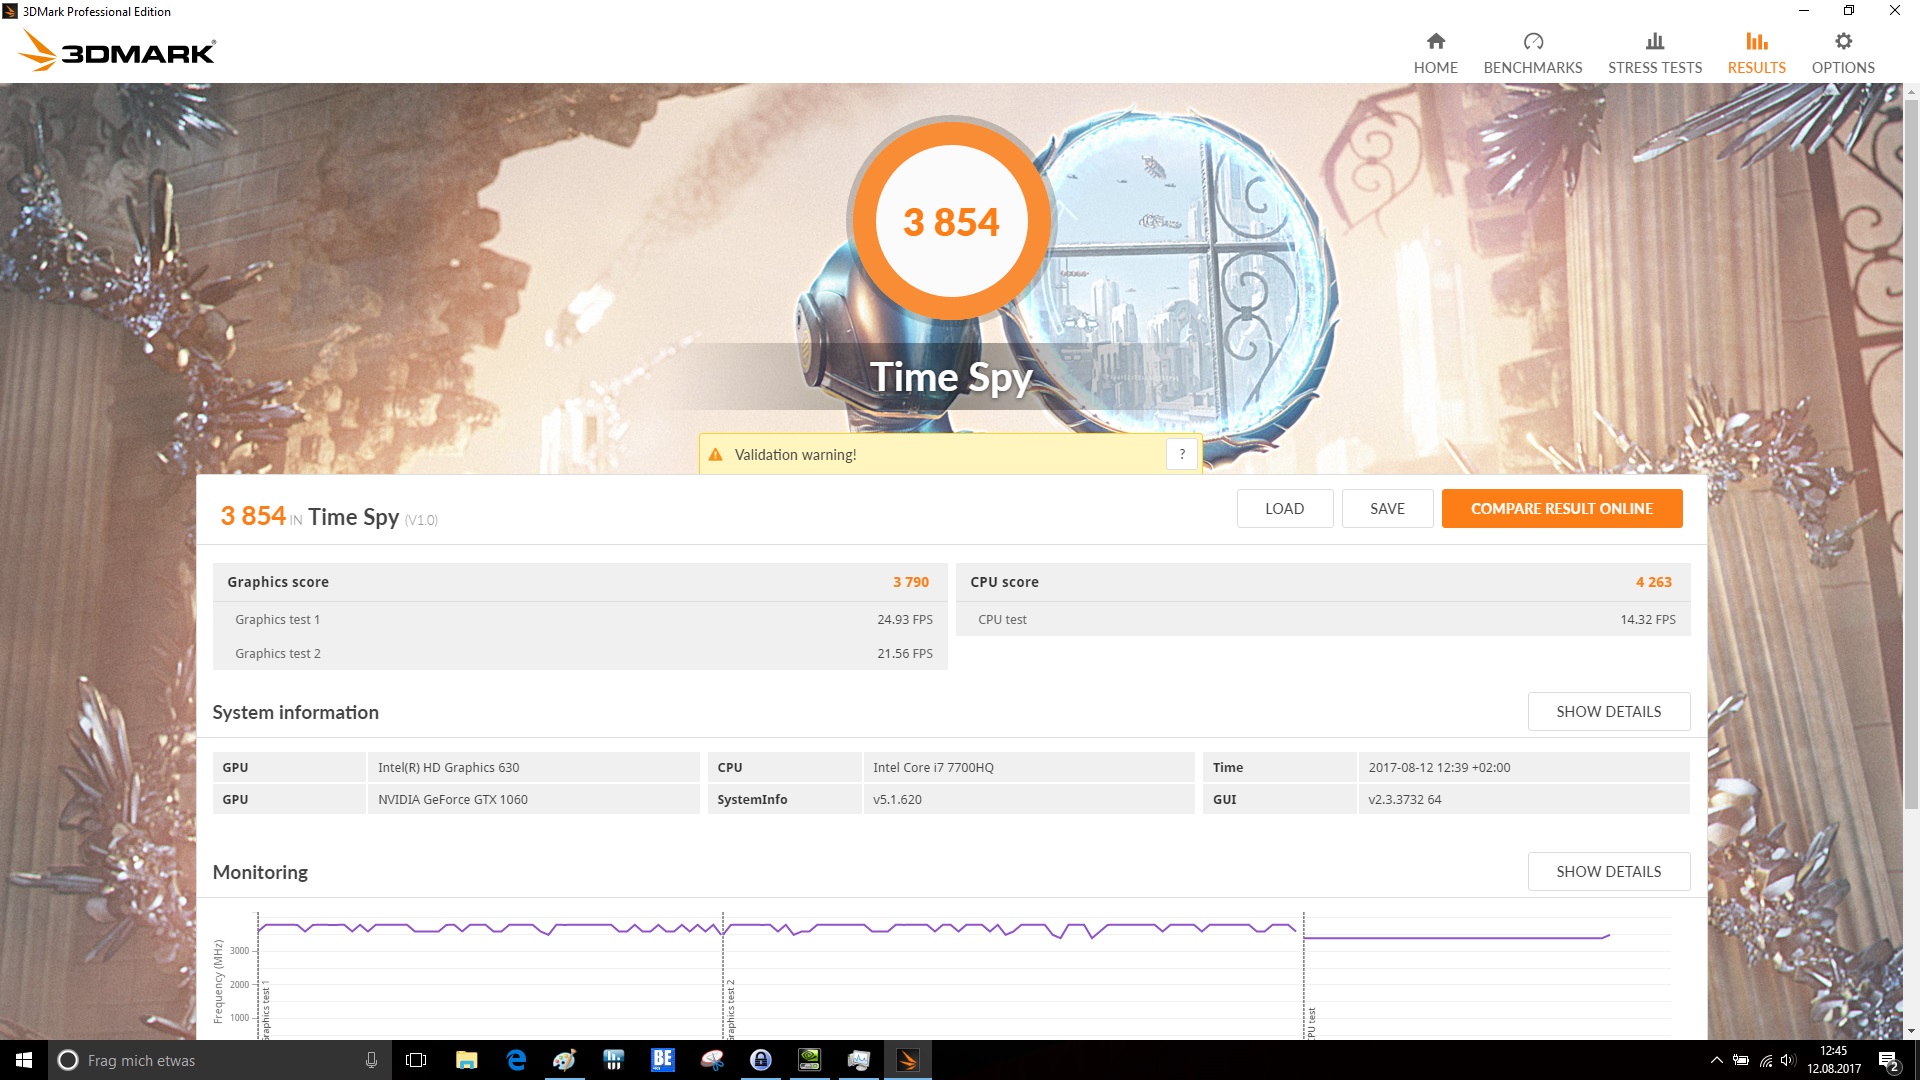
| 3DMark Time Spy Score | 3854 puntos | |
ayuda | ||
| The Witcher 3 - 1920x1080 Ultra Graphics & Postprocessing (HBAO+) | |
| HP Omen 17-an014ng | |
| Acer Predator Helios 300 | |
| MSI GE72VR-6RF16H21 | |
| Asus GL753VE-DS74 | |
| Nexoc G739 | |
| BioShock Infinite - 1920x1080 Ultra Preset, DX11 (DDOF) | |
| Gigabyte P57X v7 | |
| Acer Aspire V17 Nitro BE VN7-793-738J | |
| MSI GE72VR-6RF16H21 | |
| Asus GL753VE-DS74 | |
| Acer Predator Helios 300 | |
| Nexoc G739 | |
| Ghost Recon Wildlands - 1920x1080 Ultra Preset AA:T AF:16x | |
| Acer Predator Helios 300 | |
| Acer Aspire V17 Nitro BE VN7-793-738J | |
| Battlefield 1 - 1920x1080 Ultra Preset AA:T | |
| Acer Predator Helios 300 | |
| Nexoc G739 | |
| Far Cry Primal - 1920x1080 Ultra Preset AA:SM | |
| Acer Predator Helios 300 | |
| Acer Predator Helios 300 | |
| Acer Aspire V17 Nitro BE VN7-793-738J | |
| Deus Ex Mankind Divided - 1920x1080 Ultra Preset AA:2xMS AF:8x | |
| Acer Predator Helios 300 | |
| MSI GE72VR-6RF16H21 | |
| For Honor - 1920x1080 Extreme Preset AA:T AF:16x | |
| Acer Predator Helios 300 | |
| Acer Aspire V17 Nitro BE VN7-793-738J | |
| Nexoc G739 | |
| bajo | medio | alto | ultra | 4K | |
|---|---|---|---|---|---|
| BioShock Infinite (2013) | 255.5 | 204.6 | 194.7 | 87.5 | |
| Battlefield 4 (2013) | 199.9 | 198.6 | 195.9 | 106 | 49.8 |
| The Witcher 3 (2015) | 198.3 | 135 | 71.7 | 38.9 | 26.1 |
| Rise of the Tomb Raider (2016) | 203.1 | 135.3 | 77.8 | 65.7 | 27.2 |
| Far Cry Primal (2016) | 122 | 92 | 82 | 62 | 26 |
| The Division (2016) | 217.3 | 146.3 | 73.3 | 57.4 | 26.9 |
| Deus Ex Mankind Divided (2016) | 140.4 | 109.1 | 59.9 | 31.2 | 19.1 |
| Battlefield 1 (2016) | 177.8 | 142.5 | 93.2 | 83.6 | 32.8 |
| For Honor (2017) | 226 | 107.1 | 101.1 | 72.3 | 30.2 |
| Ghost Recon Wildlands (2017) | 140 | 73.6 | 67.2 | 38.4 | 25.3 |
| Mass Effect Andromeda (2017) | 131.4 | 85.7 | 59.3 | 53.8 | 21.5 |
Ruido
| Ocioso |
| 31 / 32 / 33 dB(A) |
| Carga |
| 44 / 50 dB(A) |
 | ||
30 dB silencioso 40 dB(A) audible 50 dB(A) ruidosamente alto |
||
min: | ||
| Acer Predator Helios 300 i7-7700HQ, GeForce GTX 1060 Mobile | Acer Aspire V17 Nitro BE VN7-793-738J i7-7700HQ, GeForce GTX 1060 Mobile | Asus GL753VE-DS74 i7-7700HQ, GeForce GTX 1050 Ti Mobile | MSI GE72VR-6RF16H21 6700HQ, GeForce GTX 1060 Mobile | HP Omen 17-an014ng i7-7700HQ, GeForce GTX 1070 Mobile | Gigabyte P57X v7 i7-7700HQ, GeForce GTX 1070 Mobile | Nexoc G739 i7-7700HQ, GeForce GTX 1050 Ti Mobile | |
|---|---|---|---|---|---|---|---|
| Noise | 5% | 0% | -4% | -6% | 1% | -2% | |
| apagado / medio ambiente * (dB) | 31 | 30.8 1% | 29.1 6% | 31 -0% | 30 3% | 29 6% | 30 3% |
| Idle Minimum * (dB) | 31 | 31.4 -1% | 33.3 -7% | 34 -10% | 30 3% | 30.4 2% | 31 -0% |
| Idle Average * (dB) | 32 | 31.4 2% | 33.3 -4% | 35 -9% | 37 -16% | 32.1 -0% | 32 -0% |
| Idle Maximum * (dB) | 33 | 31.4 5% | 33.4 -1% | 36 -9% | 39 -18% | 32.1 3% | 38 -15% |
| Load Average * (dB) | 44 | 38.6 12% | 42.6 3% | 40 9% | 44 -0% | 45.6 -4% | 44 -0% |
| Witcher 3 ultra * (dB) | 46 | 46.8 -2% | 47 -2% | ||||
| Load Maximum * (dB) | 50 | 44.3 11% | 46.8 6% | 51 -2% | 55 -10% | 51.5 -3% | 50 -0% |
* ... más pequeño es mejor
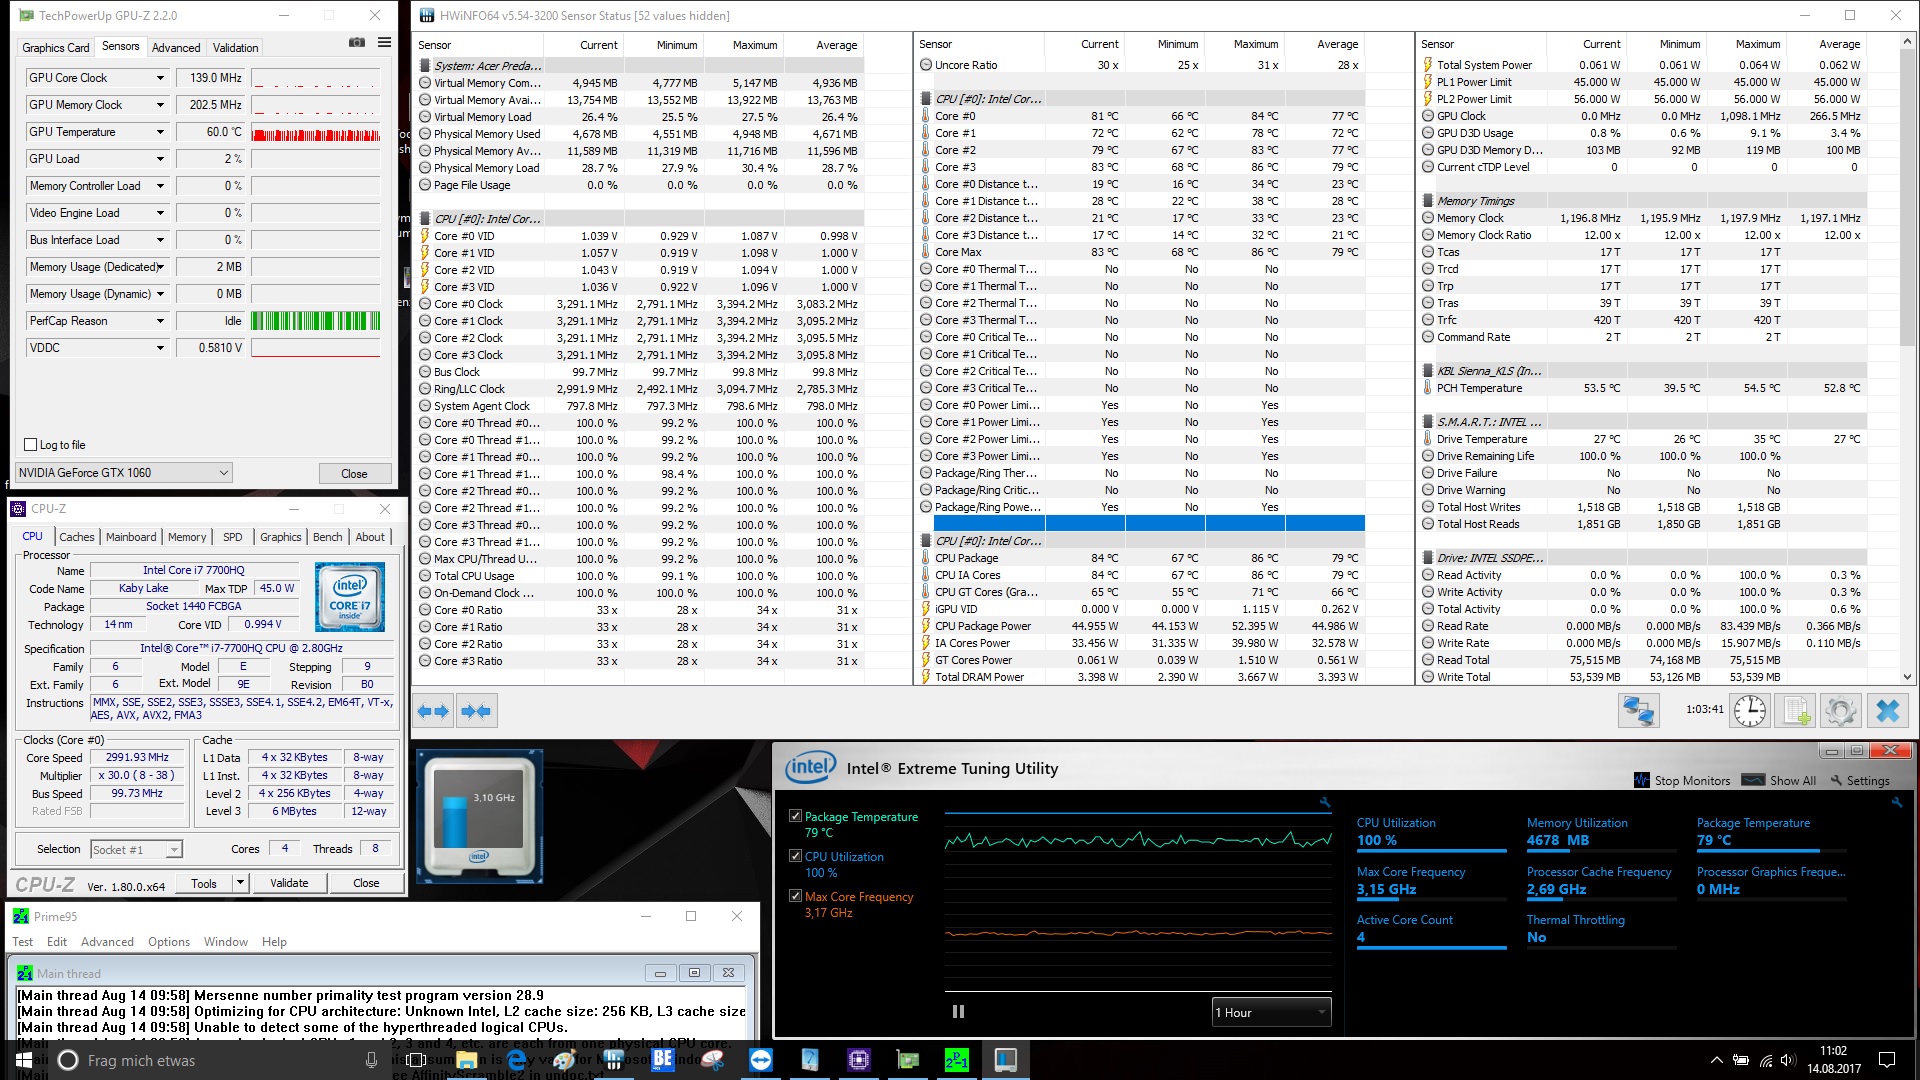
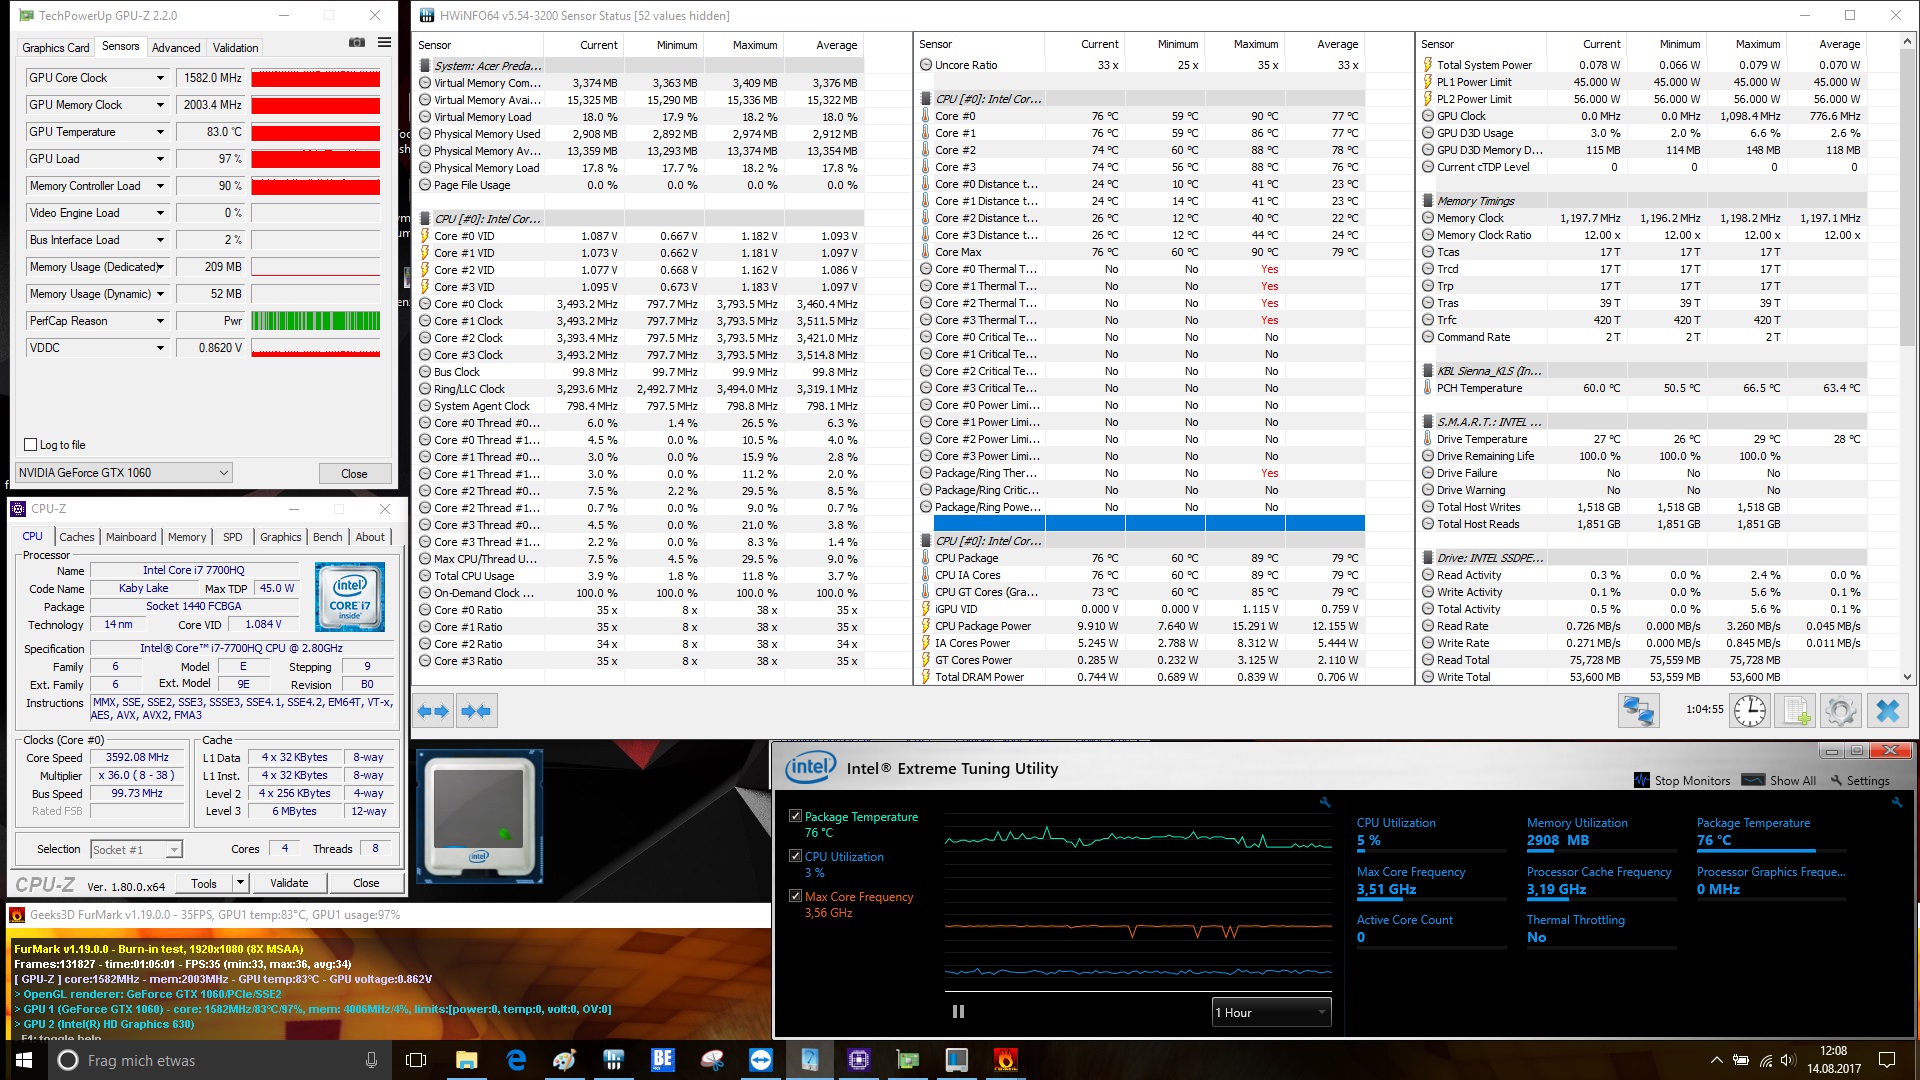
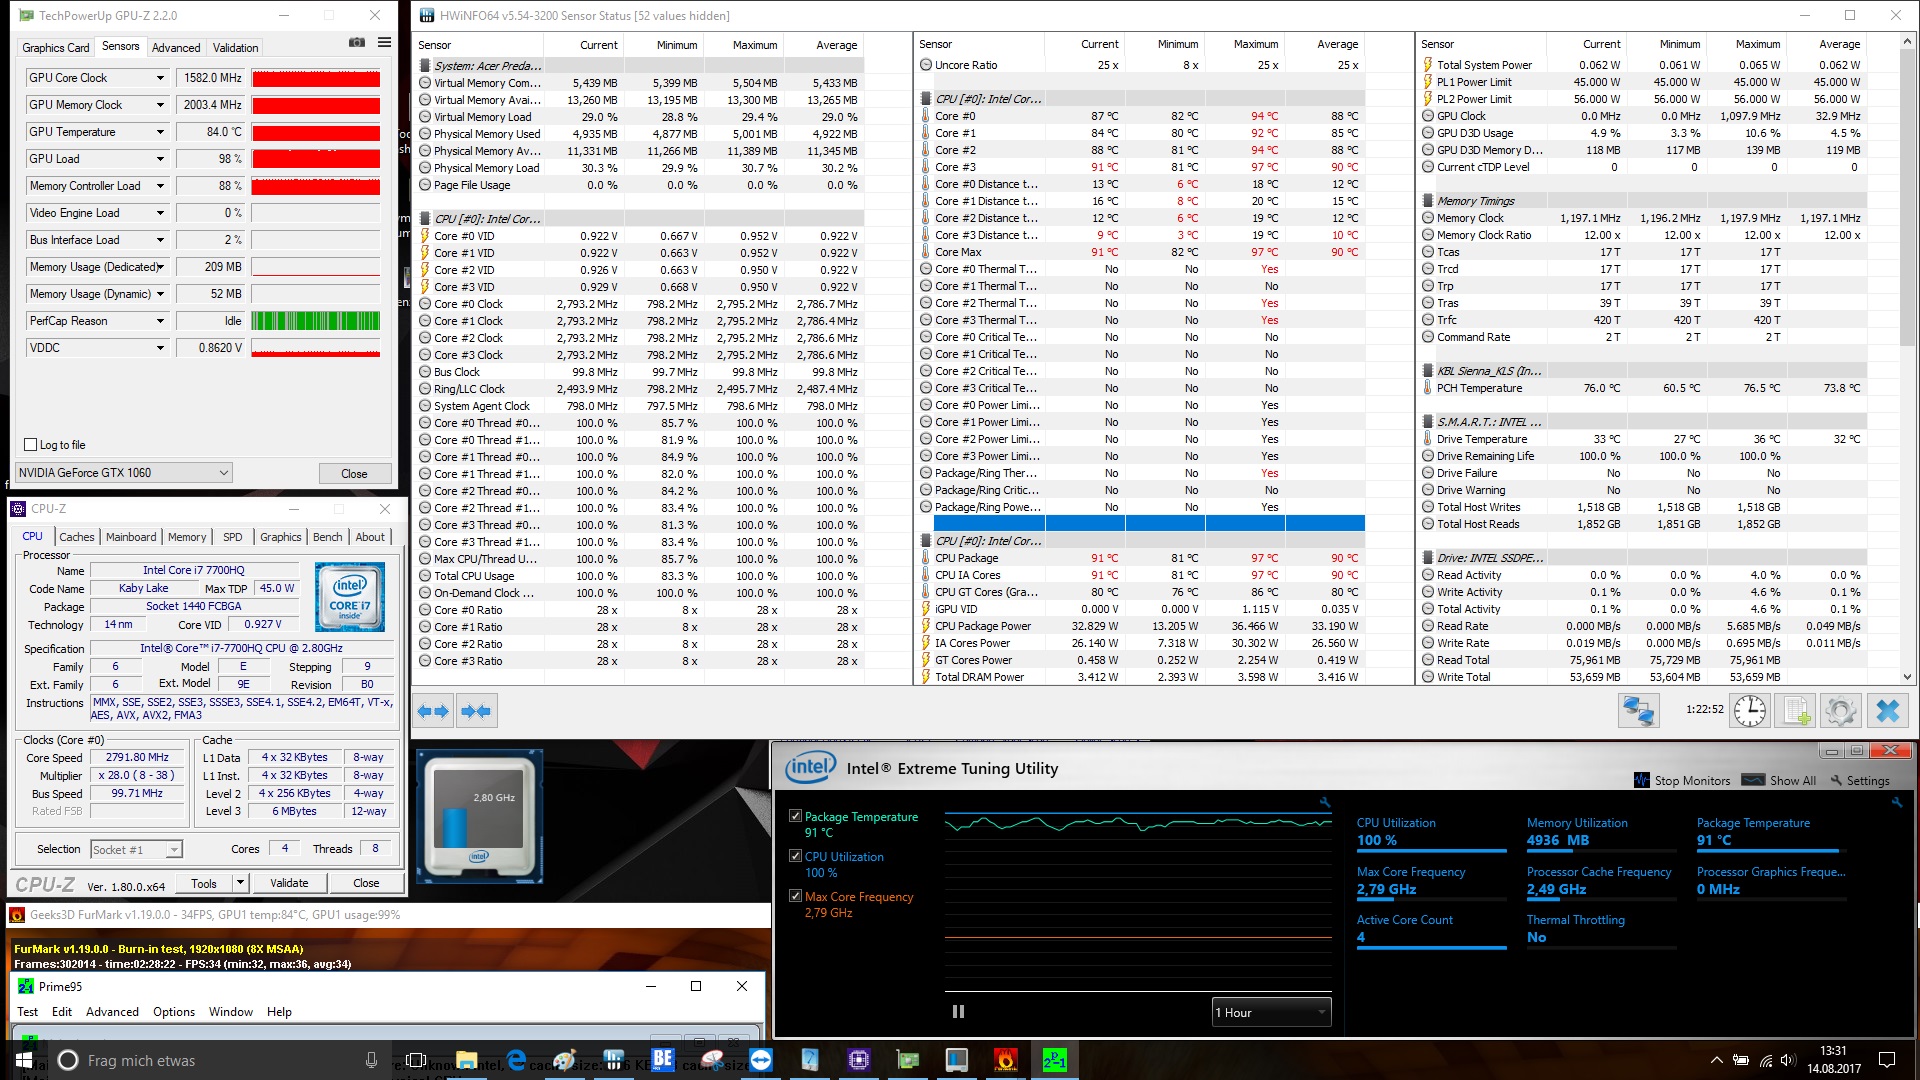
(-) La temperatura máxima en la parte superior es de 57 °C / 135 F, frente a la media de 40.4 °C / 105 F, que oscila entre 21.2 y 68.8 °C para la clase Gaming.
(-) El fondo se calienta hasta un máximo de 59 °C / 138 F, frente a la media de 43.2 °C / 110 F
(+) En reposo, la temperatura media de la parte superior es de 30.6 °C / 87# F, frente a la media del dispositivo de 33.9 °C / 93 F.
(-) Jugando a The Witcher 3, la temperatura media de la parte superior es de 42.2 °C / 108 F, frente a la media del dispositivo de 33.9 °C / 93 F.
(+) Los reposamanos y el panel táctil alcanzan como máximo la temperatura de la piel (35 °C / 95 F) y, por tanto, no están calientes.
(-) La temperatura media de la zona del reposamanos de dispositivos similares fue de 28.8 °C / 83.8 F (-6.2 °C / -11.2 F).
| Acer Predator Helios 300 i7-7700HQ, GeForce GTX 1060 Mobile | Acer Aspire V17 Nitro BE VN7-793-738J i7-7700HQ, GeForce GTX 1060 Mobile | Asus GL753VE-DS74 i7-7700HQ, GeForce GTX 1050 Ti Mobile | MSI GE72VR-6RF16H21 6700HQ, GeForce GTX 1060 Mobile | HP Omen 17-an014ng i7-7700HQ, GeForce GTX 1070 Mobile | Gigabyte P57X v7 i7-7700HQ, GeForce GTX 1070 Mobile | Nexoc G739 i7-7700HQ, GeForce GTX 1050 Ti Mobile | |
|---|---|---|---|---|---|---|---|
| Heat | 9% | 35% | 13% | 2% | 10% | 15% | |
| Maximum Upper Side * (°C) | 57 | 56 2% | 35.8 37% | 48.8 14% | 48 16% | 51.2 10% | 50.6 11% |
| Maximum Bottom * (°C) | 59 | 48.7 17% | 36.4 38% | 48.2 18% | 54 8% | 56.8 4% | 50.8 14% |
| Idle Upper Side * (°C) | 36 | 30.9 14% | 22.2 38% | 30.1 16% | 35 3% | 29.2 19% | 28.7 20% |
| Idle Bottom * (°C) | 31 | 30.6 1% | 22.2 28% | 30.4 2% | 37 -19% | 29.2 6% | 27.1 13% |
* ... más pequeño es mejor
Acer Predator Helios 300 análisis de audio
(±) | la sonoridad del altavoz es media pero buena (81 dB)
Graves 100 - 315 Hz
(-) | casi sin bajos - de media 15.1% inferior a la mediana
(-) | los graves no son lineales (18.3% delta a la frecuencia anterior)
Medios 400 - 2000 Hz
(±) | medias más altas - de media 8.2% más altas que la mediana
(+) | los medios son lineales (5.3% delta a la frecuencia anterior)
Altos 2 - 16 kHz
(+) | máximos equilibrados - a sólo 1.8% de la mediana
(+) | los máximos son lineales (6.6% delta a la frecuencia anterior)
Total 100 - 16.000 Hz
(±) | la linealidad del sonido global es media (19.1% de diferencia con la mediana)
En comparación con la misma clase
» 64% de todos los dispositivos probados de esta clase eran mejores, 7% similares, 28% peores
» El mejor tuvo un delta de 6%, la media fue 18%, el peor fue ###max##%
En comparación con todos los dispositivos probados
» 46% de todos los dispositivos probados eran mejores, 7% similares, 47% peores
» El mejor tuvo un delta de 4%, la media fue 23%, el peor fue ###max##%
Acer Aspire V17 Nitro BE VN7-793-738J análisis de audio
(±) | la sonoridad del altavoz es media pero buena (72 dB)
Graves 100 - 315 Hz
(±) | lubina reducida - en promedio 5.7% inferior a la mediana
(+) | el bajo es lineal (5% delta a la frecuencia anterior)
Medios 400 - 2000 Hz
(+) | medios equilibrados - a sólo 4.4% de la mediana
(+) | los medios son lineales (6% delta a la frecuencia anterior)
Altos 2 - 16 kHz
(+) | máximos equilibrados - a sólo 3% de la mediana
(±) | la linealidad de los máximos es media (7.2% delta a frecuencia anterior)
Total 100 - 16.000 Hz
(+) | el sonido global es lineal (12.5% de diferencia con la mediana)
En comparación con la misma clase
» 15% de todos los dispositivos probados de esta clase eran mejores, 3% similares, 81% peores
» El mejor tuvo un delta de 6%, la media fue 18%, el peor fue ###max##%
En comparación con todos los dispositivos probados
» 11% de todos los dispositivos probados eran mejores, 2% similares, 87% peores
» El mejor tuvo un delta de 4%, la media fue 23%, el peor fue ###max##%
| Off / Standby | |
| Ocioso | |
| Carga |
|
Clave:
min: | |
| Acer Predator Helios 300 i7-7700HQ, GeForce GTX 1060 Mobile | Acer Aspire V17 Nitro BE VN7-793-738J i7-7700HQ, GeForce GTX 1060 Mobile | Asus GL753VE-DS74 i7-7700HQ, GeForce GTX 1050 Ti Mobile | MSI GE72VR-6RF16H21 6700HQ, GeForce GTX 1060 Mobile | HP Omen 17-an014ng i7-7700HQ, GeForce GTX 1070 Mobile | Gigabyte P57X v7 i7-7700HQ, GeForce GTX 1070 Mobile | Nexoc G739 i7-7700HQ, GeForce GTX 1050 Ti Mobile | |
|---|---|---|---|---|---|---|---|
| Power Consumption | -25% | 16% | -35% | -79% | -79% | -5% | |
| Idle Minimum * (Watt) | 7 | 10.5 -50% | 7.5 -7% | 13 -86% | 22 -214% | 15.7 -124% | 7 -0% |
| Idle Average * (Watt) | 13 | 20.5 -58% | 11.3 13% | 20 -54% | 28 -115% | 23.4 -80% | 14 -8% |
| Idle Maximum * (Watt) | 20 | 22 -10% | 11.8 41% | 26 -30% | 35 -75% | 23.5 -18% | 23 -15% |
| Load Average * (Watt) | 81 | 91 -12% | 82.1 -1% | 83 -2% | 93 -15% | 184.6 -128% | 82 -1% |
| Witcher 3 ultra * (Watt) | 127 | 96.3 24% | 157 -24% | ||||
| Load Maximum * (Watt) | 162 | 155 4% | 116.6 28% | 169 -4% | 208 -28% | 233.1 -44% | 163 -1% |
* ... más pequeño es mejor
| Acer Predator Helios 300 i7-7700HQ, GeForce GTX 1060 Mobile, 48 Wh | Acer Aspire V17 Nitro BE VN7-793-738J i7-7700HQ, GeForce GTX 1060 Mobile, 69 Wh | Asus GL753VE-DS74 i7-7700HQ, GeForce GTX 1050 Ti Mobile, 48 Wh | MSI GE72VR-6RF16H21 6700HQ, GeForce GTX 1060 Mobile, 51 Wh | HP Omen 17-an014ng i7-7700HQ, GeForce GTX 1070 Mobile, 86 Wh | Gigabyte P57X v7 i7-7700HQ, GeForce GTX 1070 Mobile, 75.81 Wh | Nexoc G739 i7-7700HQ, GeForce GTX 1050 Ti Mobile, 62 Wh | |
|---|---|---|---|---|---|---|---|
| Duración de Batería | -2% | -14% | -48% | 0% | -8% | 38% | |
| Reader / Idle (h) | 10.2 | 8.7 -15% | 3.3 -68% | 5.8 -43% | 4.3 -58% | 10.2 0% | |
| H.264 (h) | 4.7 | 2.3 -51% | 4.3 -9% | 5.4 15% | |||
| WiFi v1.3 (h) | 4.7 | 4.6 -2% | 3.9 -17% | 2.4 -49% | 4.5 -4% | 2.6 -45% | 4.8 2% |
| Load (h) | 0.9 | 0.8 -11% | 0.7 -22% | 1.4 56% | 1.6 78% | 2.1 133% |
Pro
Contra
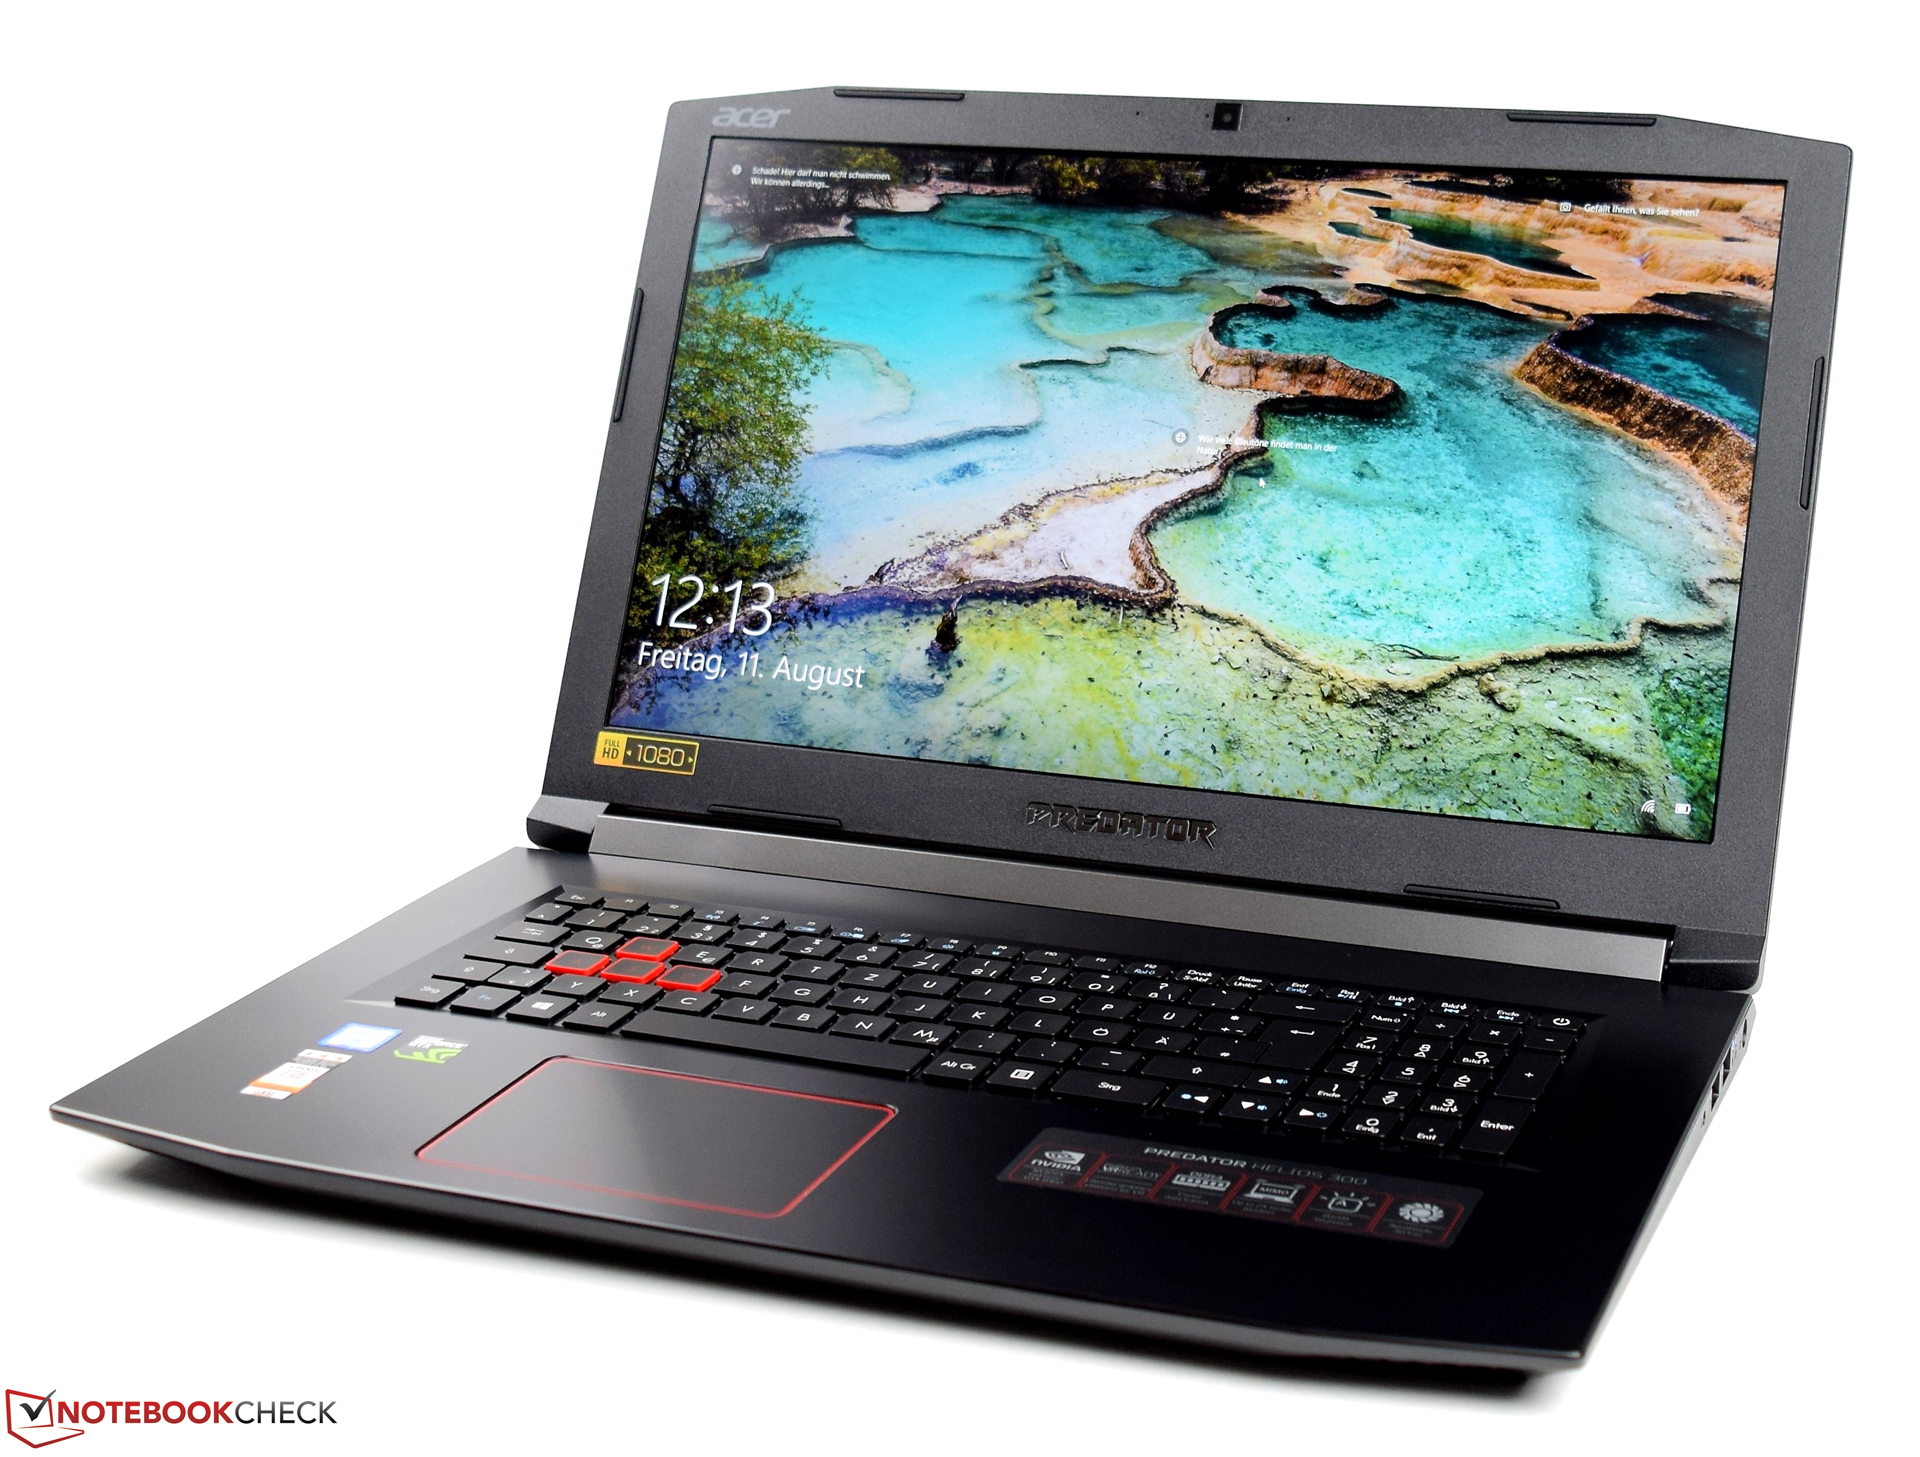
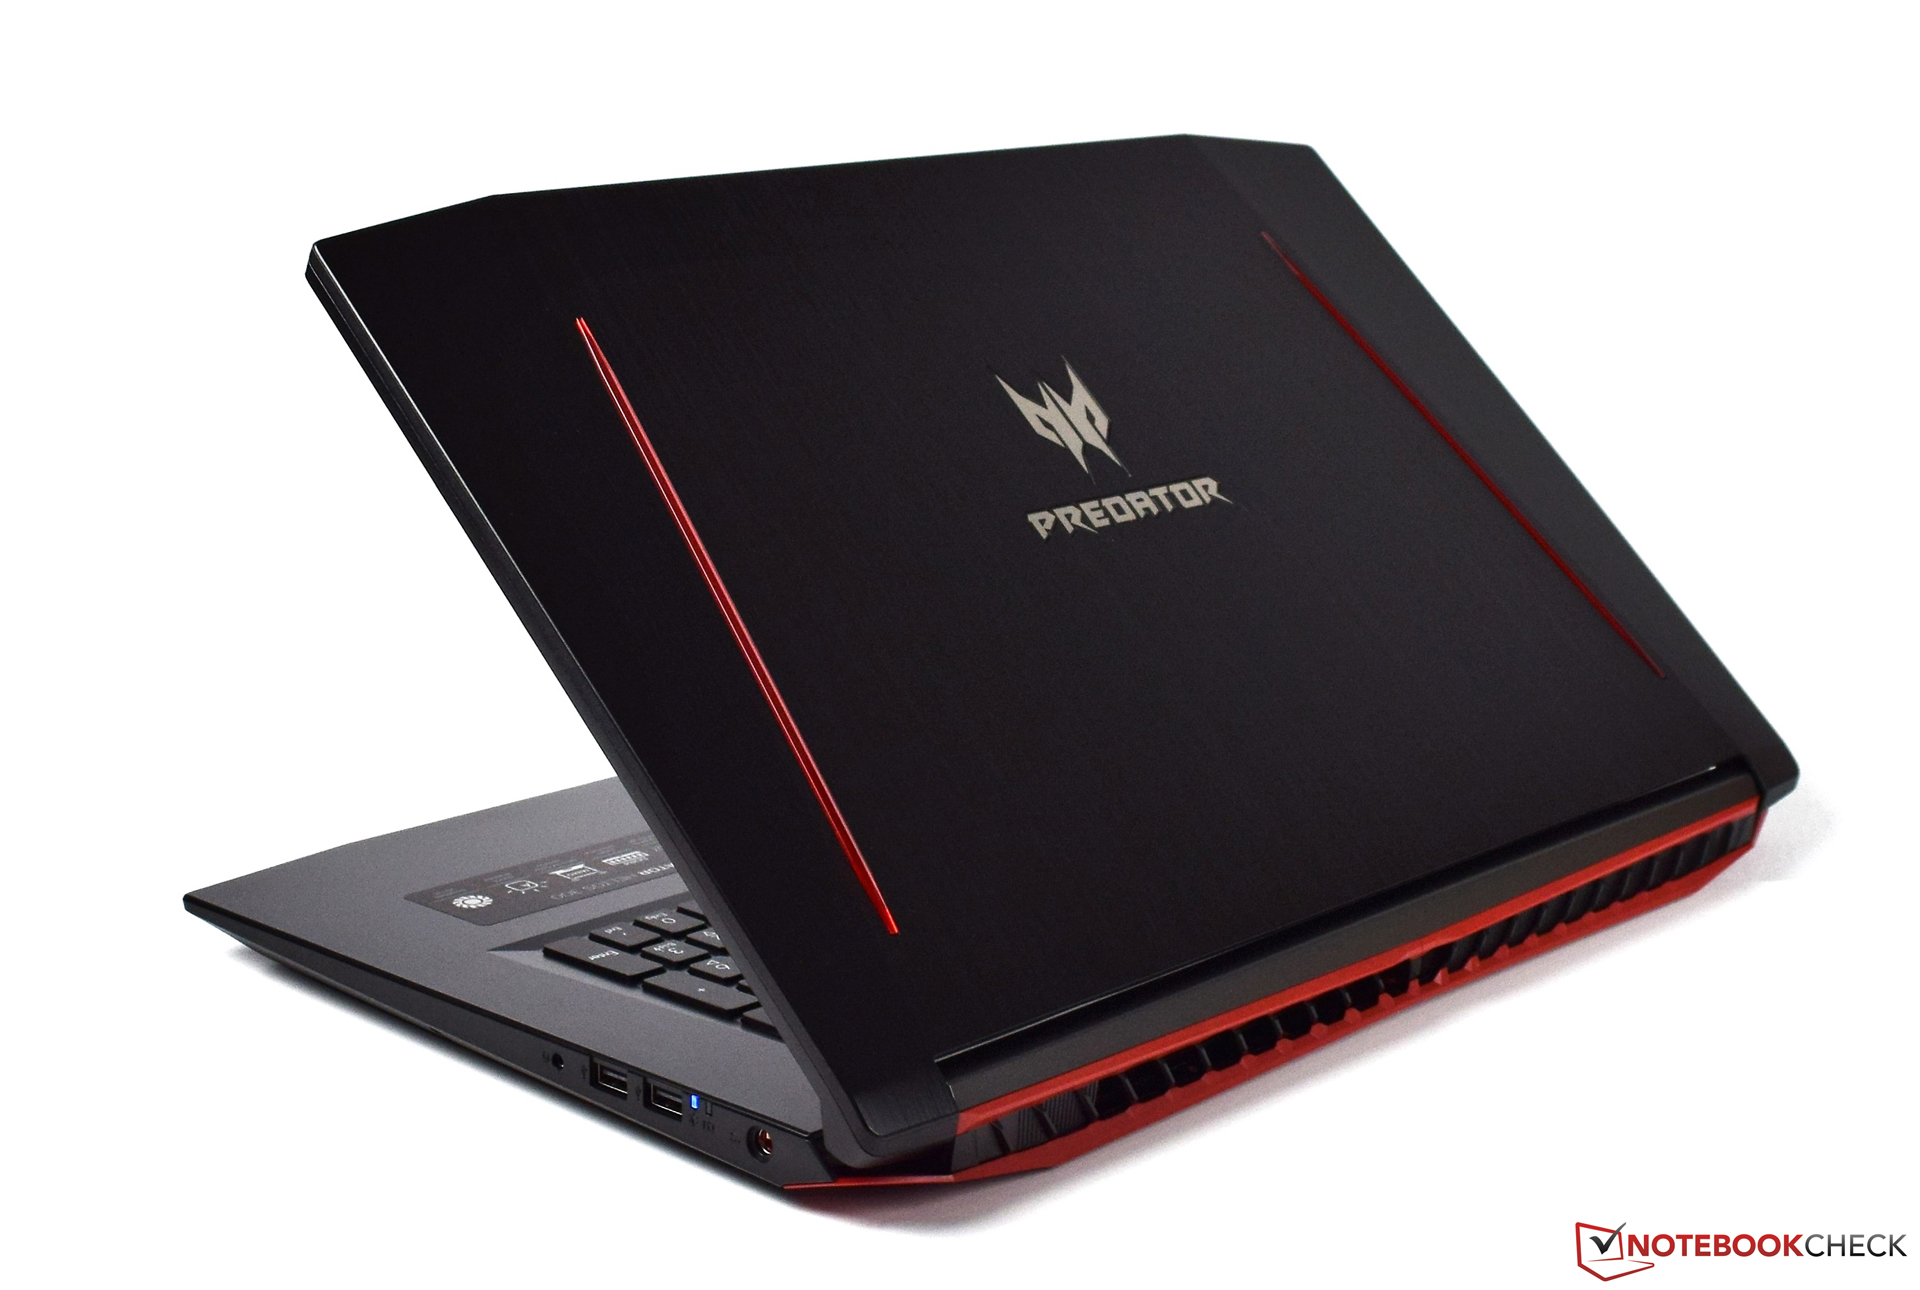
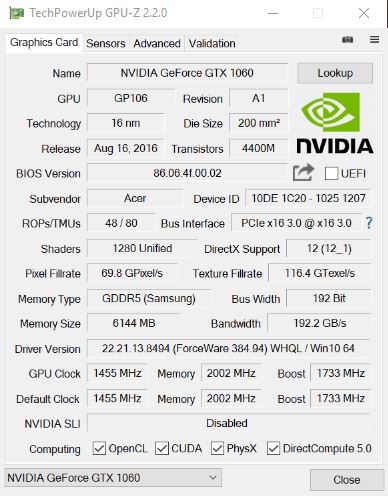
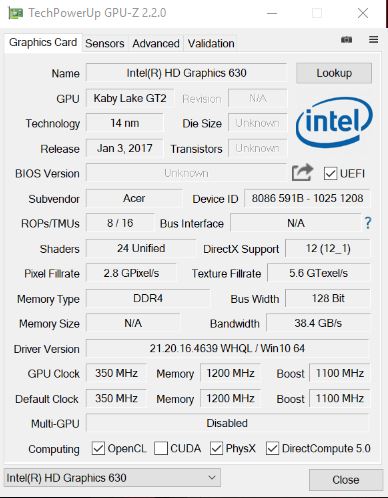
El Acer Predator Helios 300 es un gran dispositivo básico para gaming. El dispositivo de 17" está equipado con un Intel Core i7-7700HQ rápido y la Nvidia GeForce GTX 1060 es una base sólida para jugar juegos actuales en la resolución nativa de 1080p. Los fps siguen siendo buenos incluso con los detalles máximos. El modelo de $1800 también está equipado con 16 GB de RAM DDR4, así como una rápida SSD NVMe de 512 GB. El Acer Predator Helios cumple con todos los requisitos para un portátil gaming.
El Acer Predator Helios 300 ofrece un rendimiento sólido en juegos para su precio. Aun así, el fabricante ha perdido algunos puntos con el sistema de sonido, que no es aceptable para un portátil gaming.
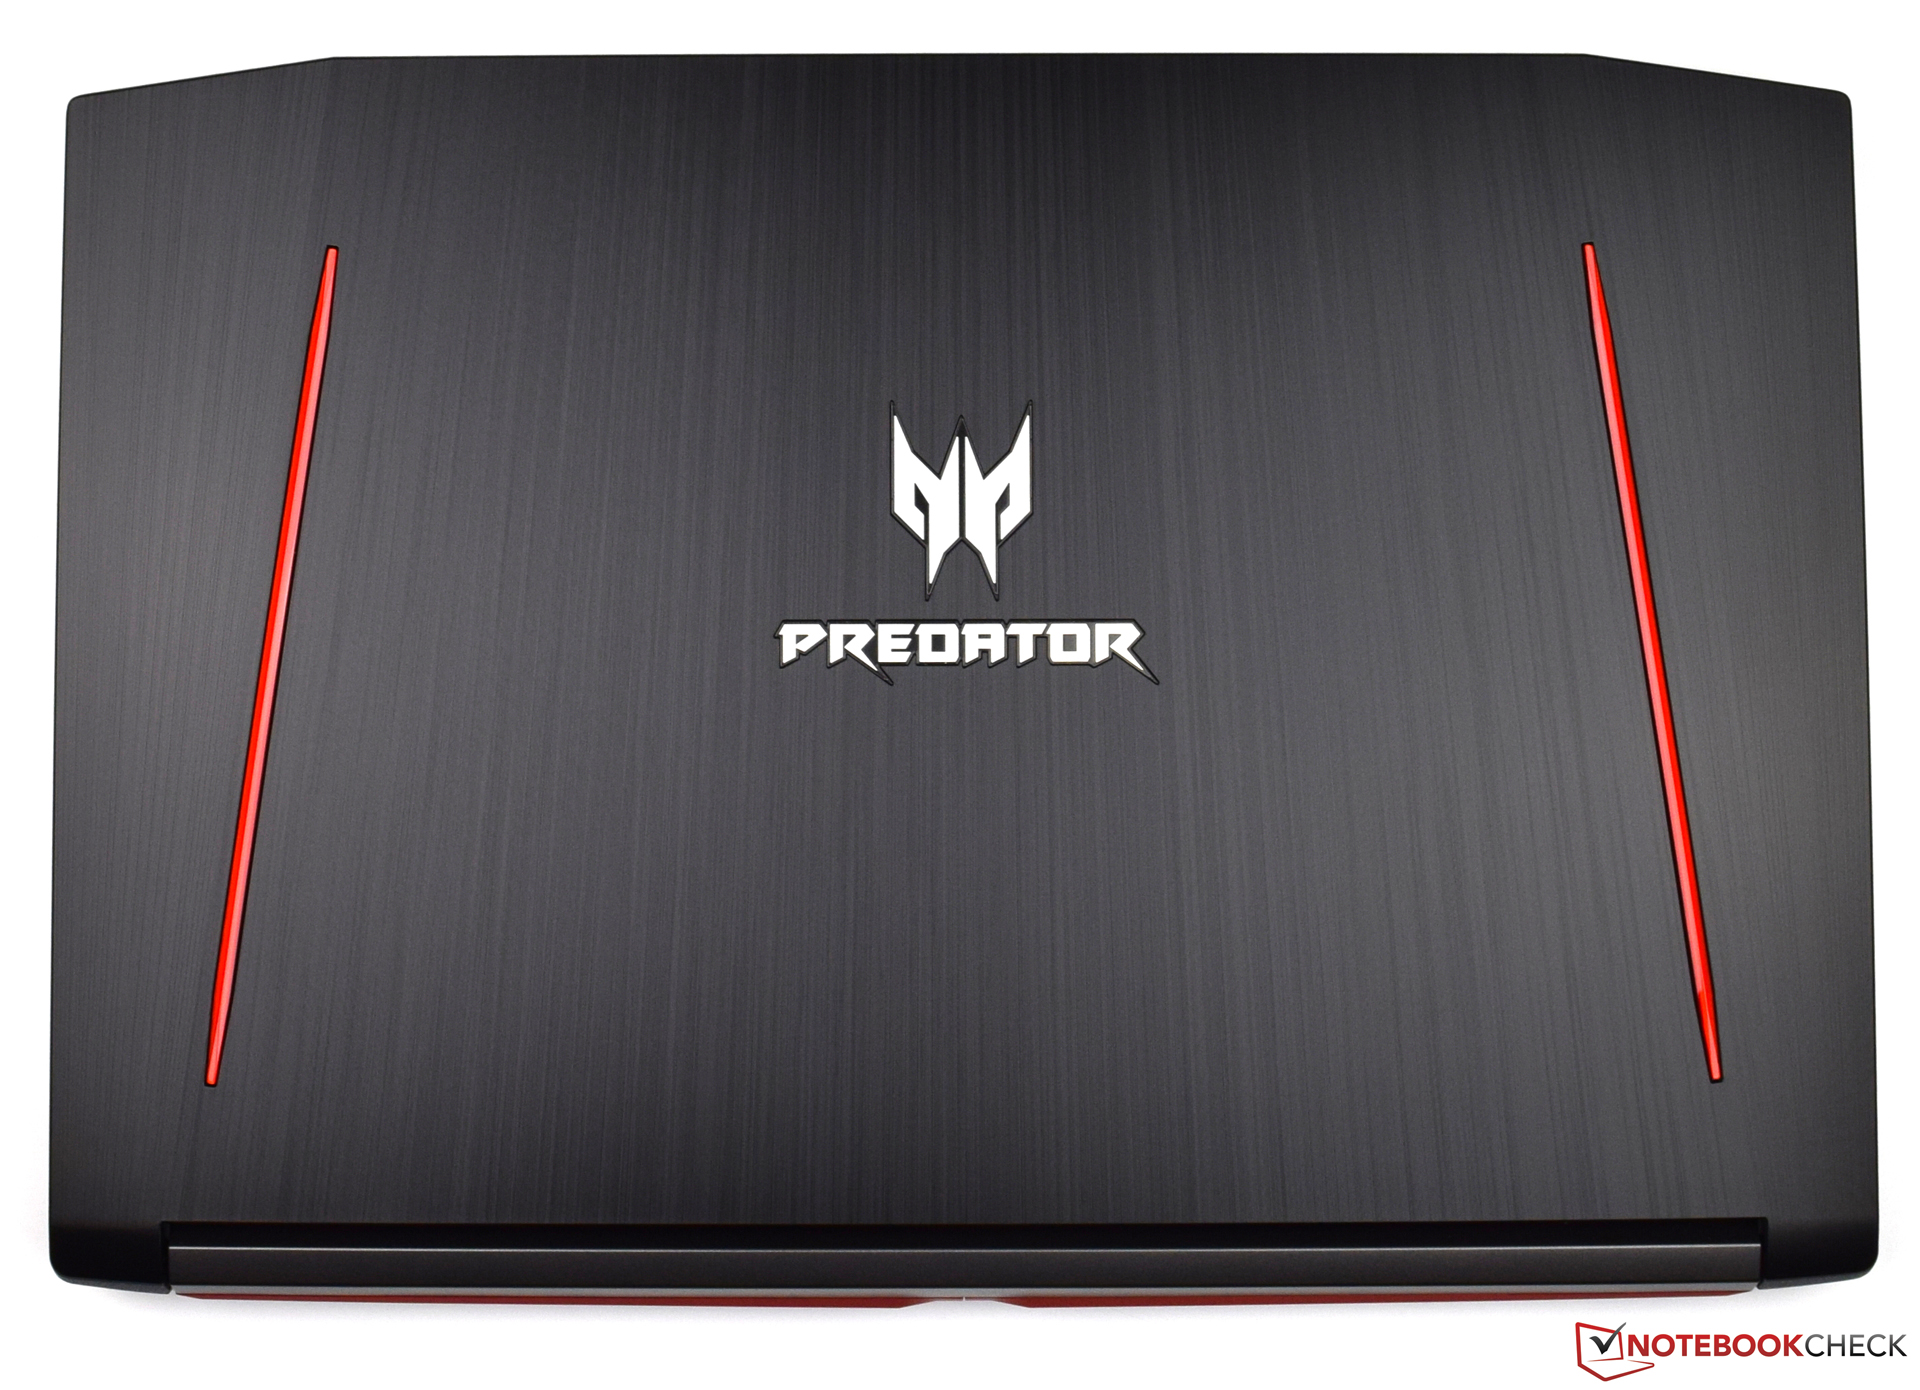
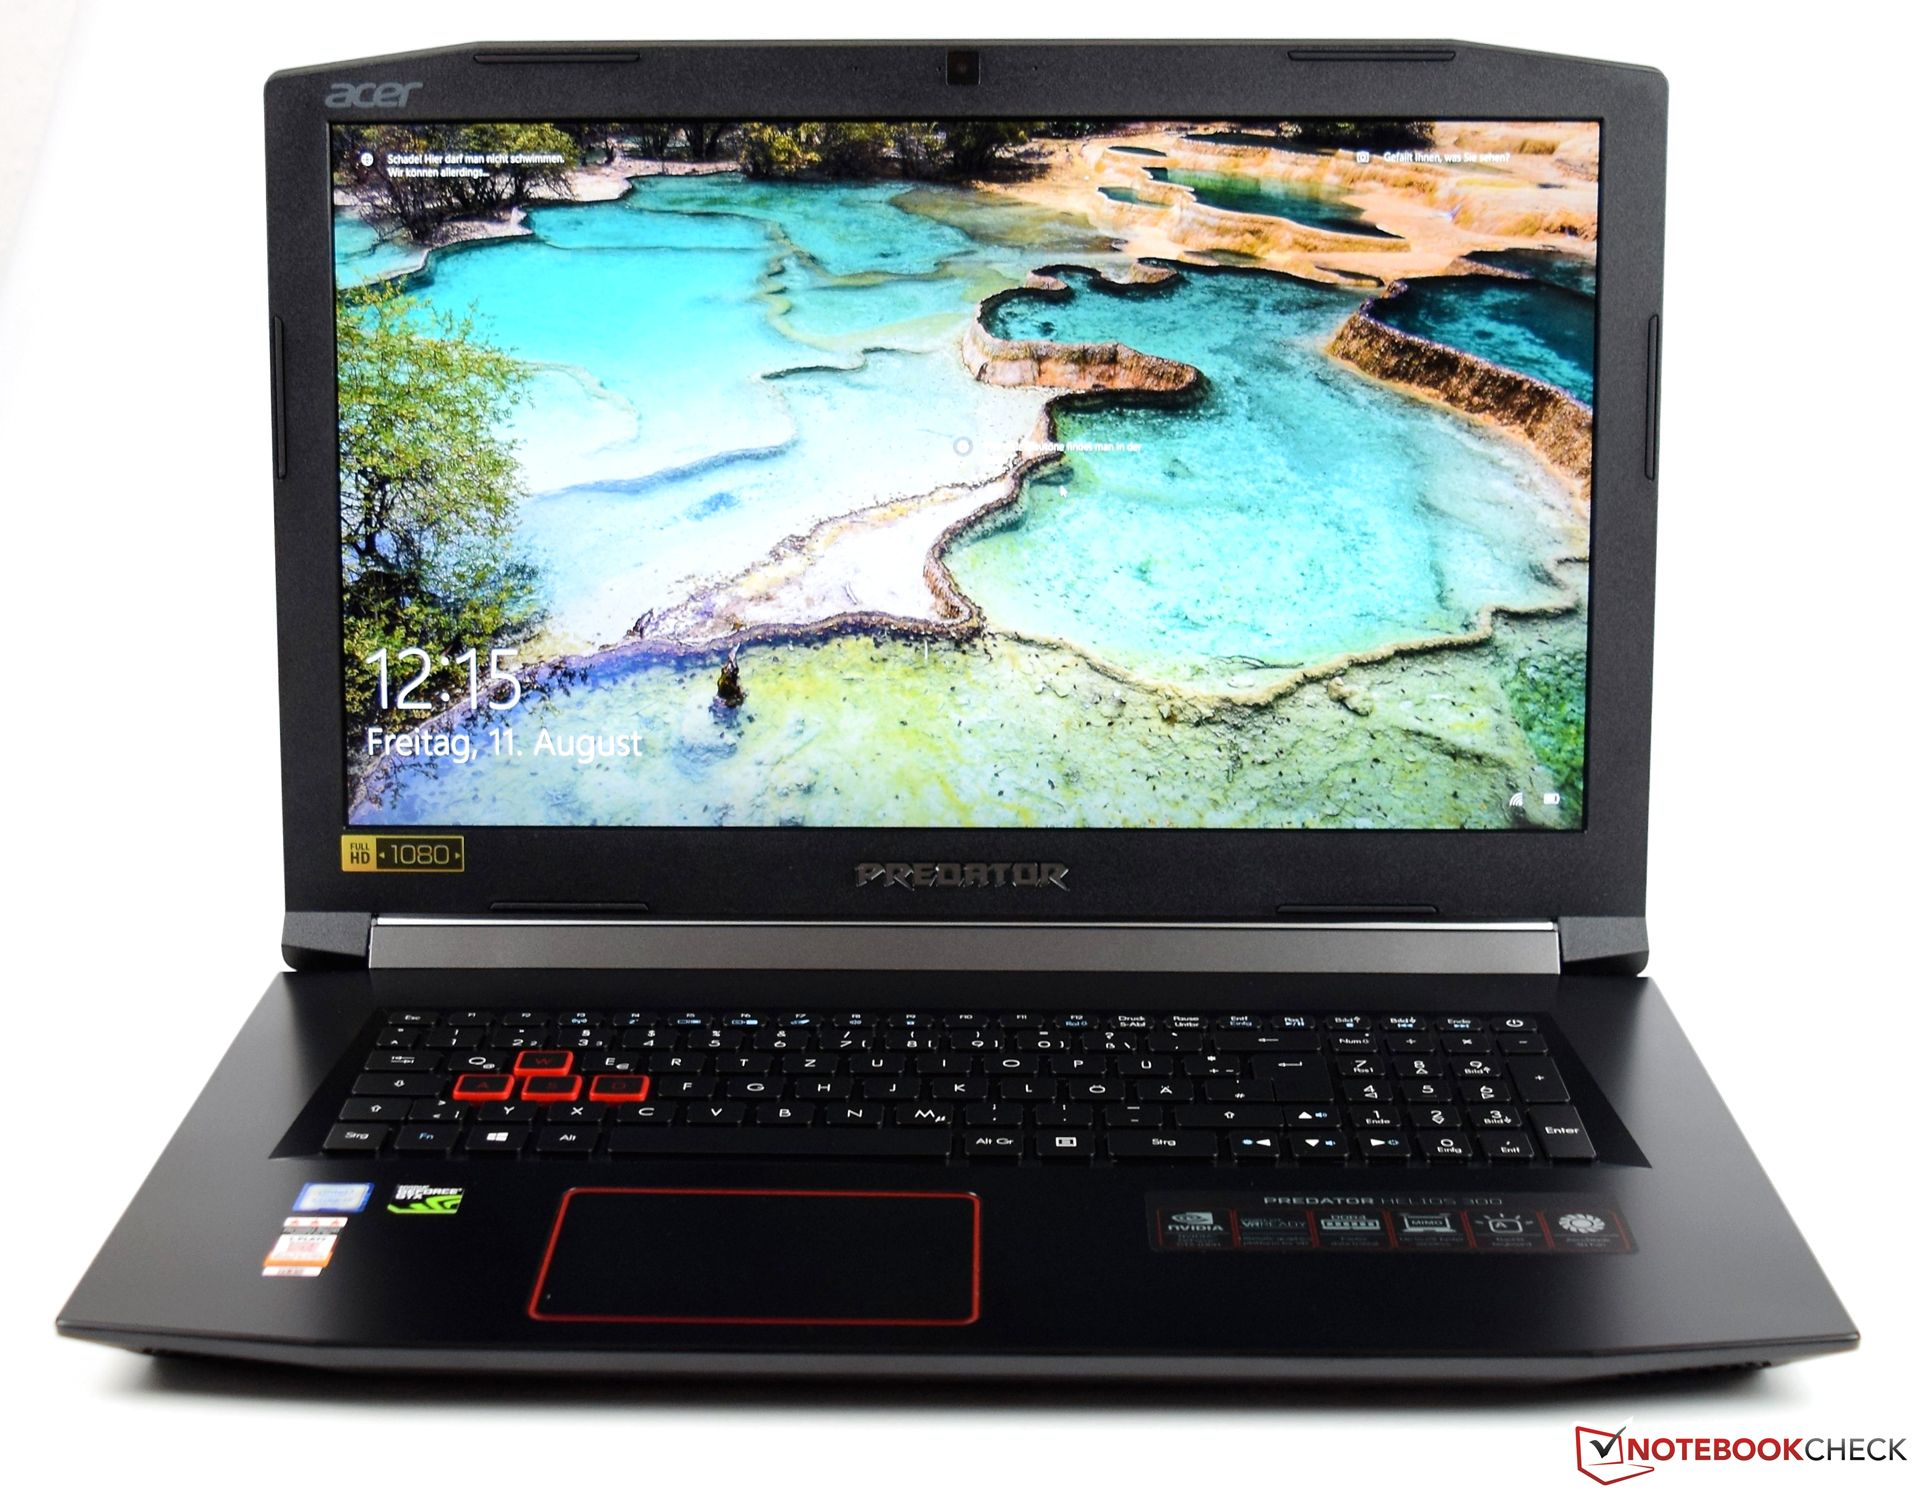
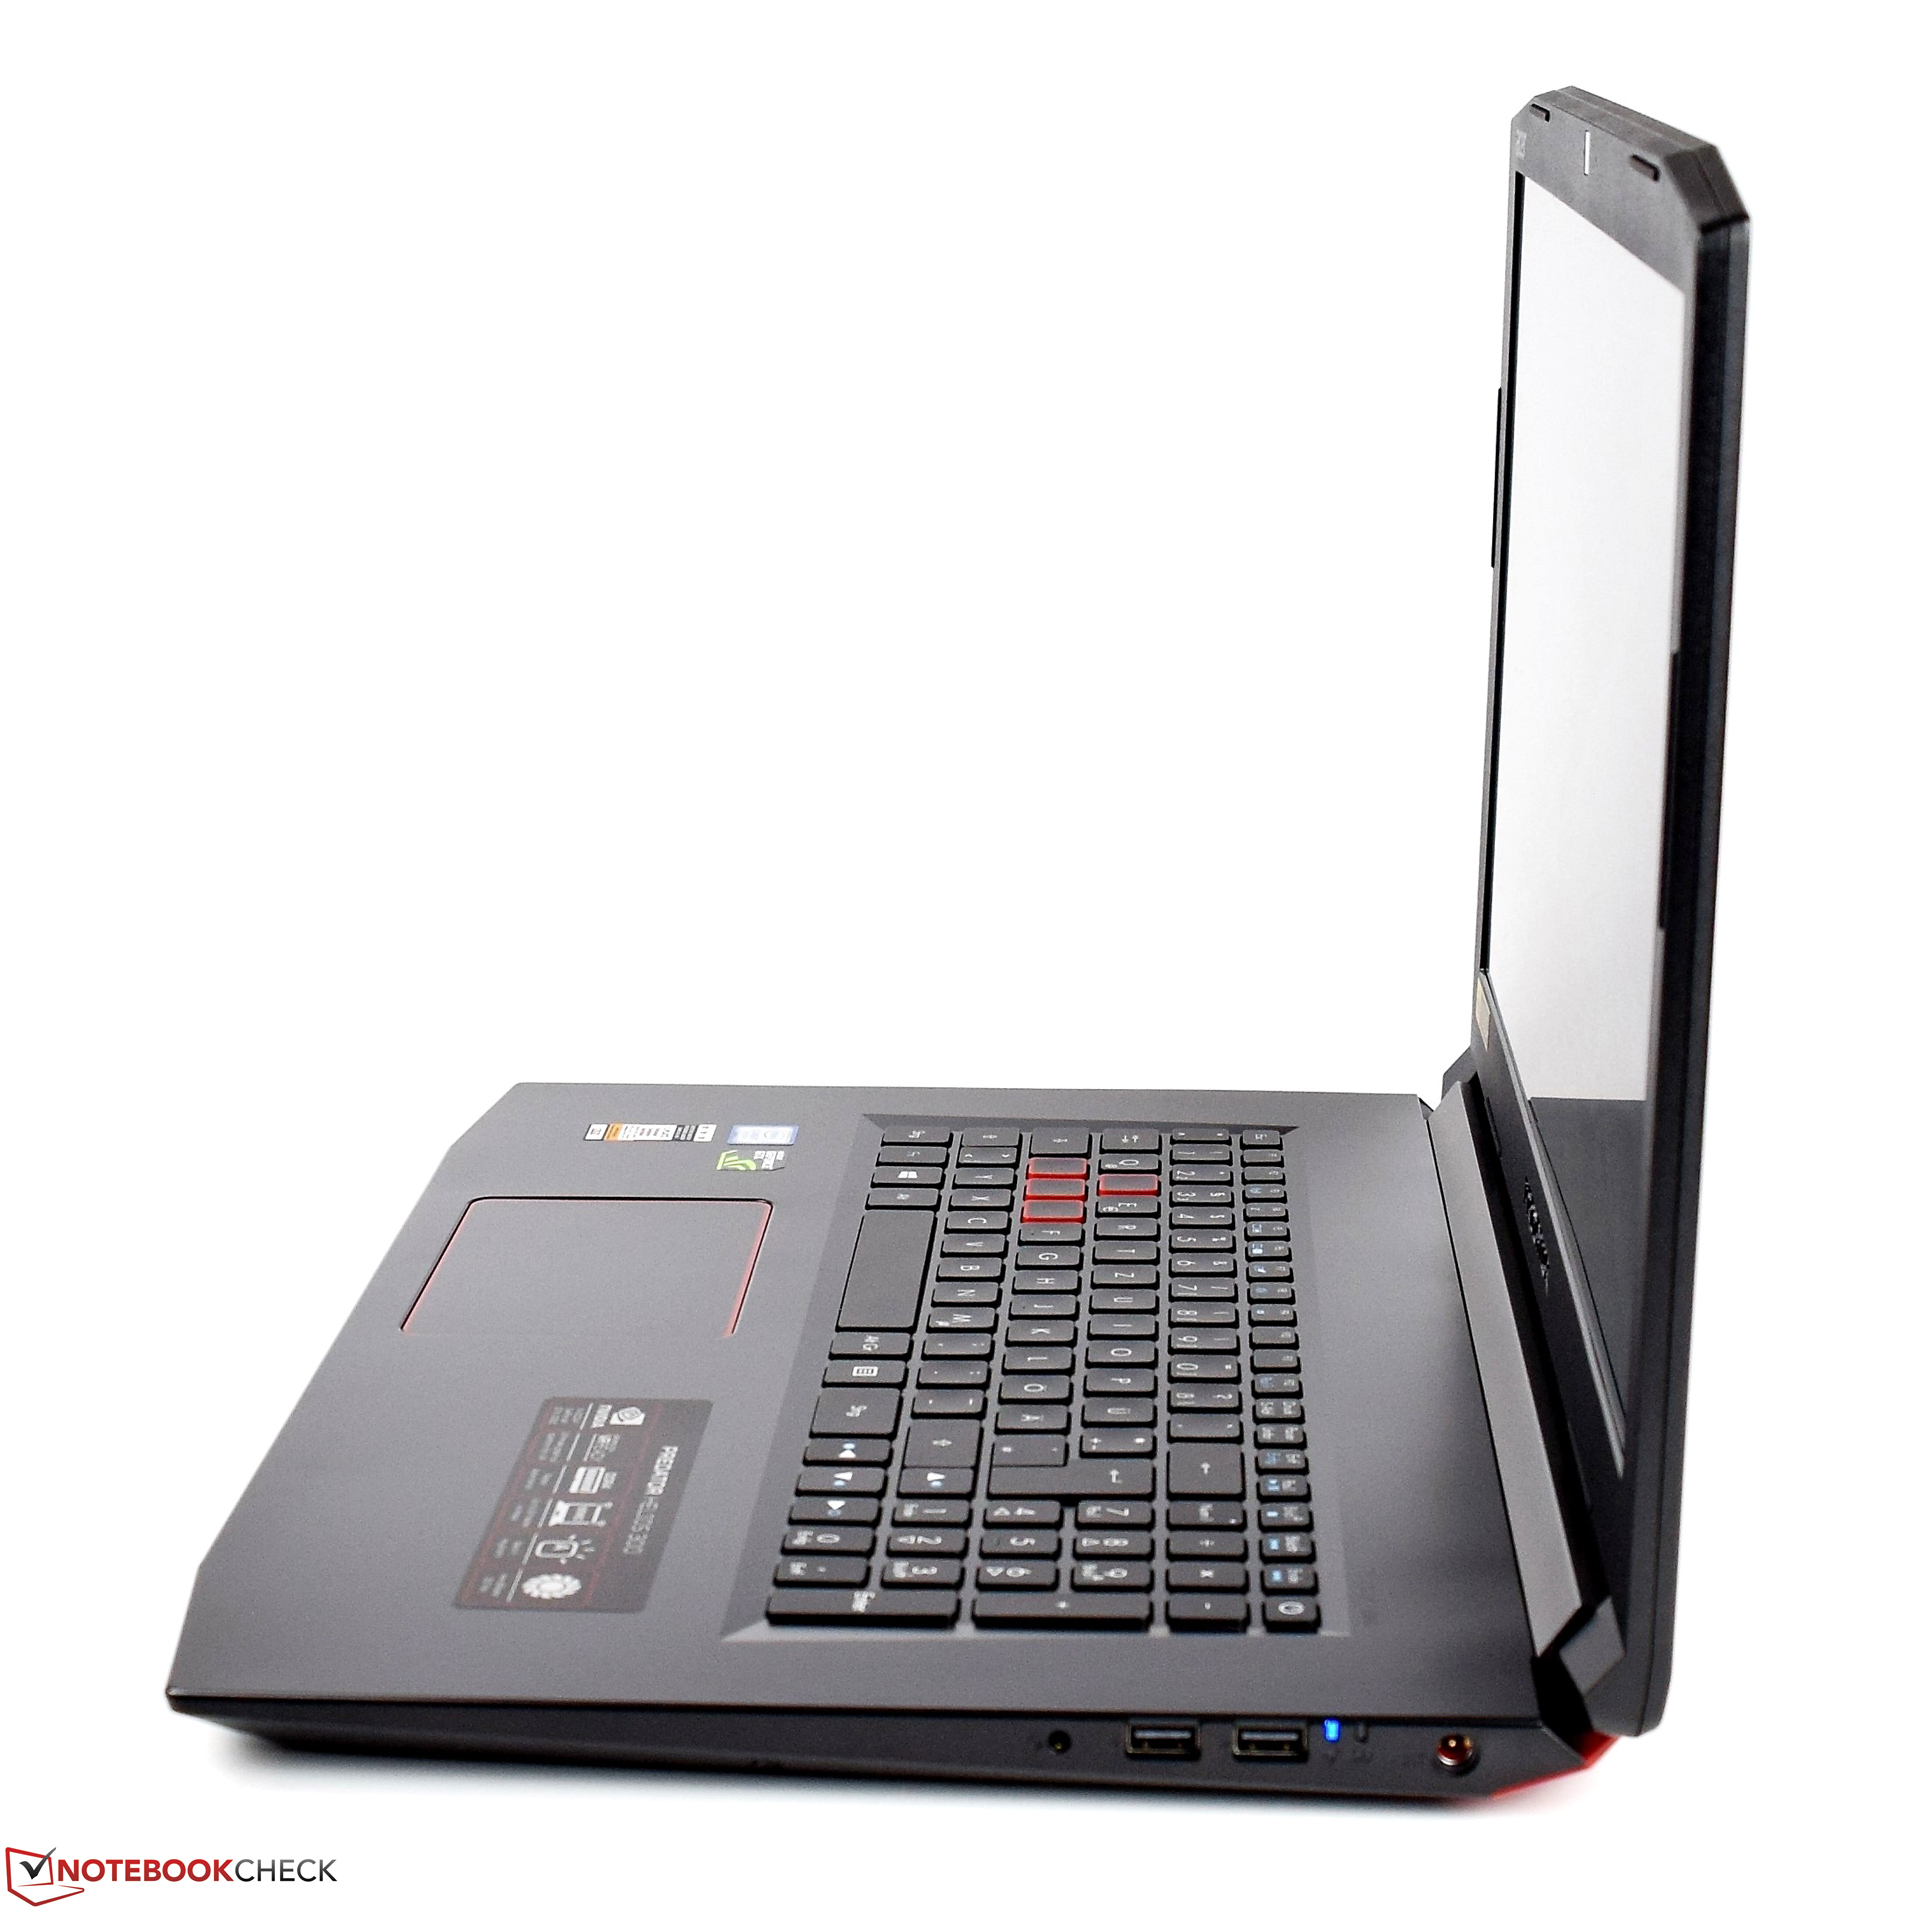
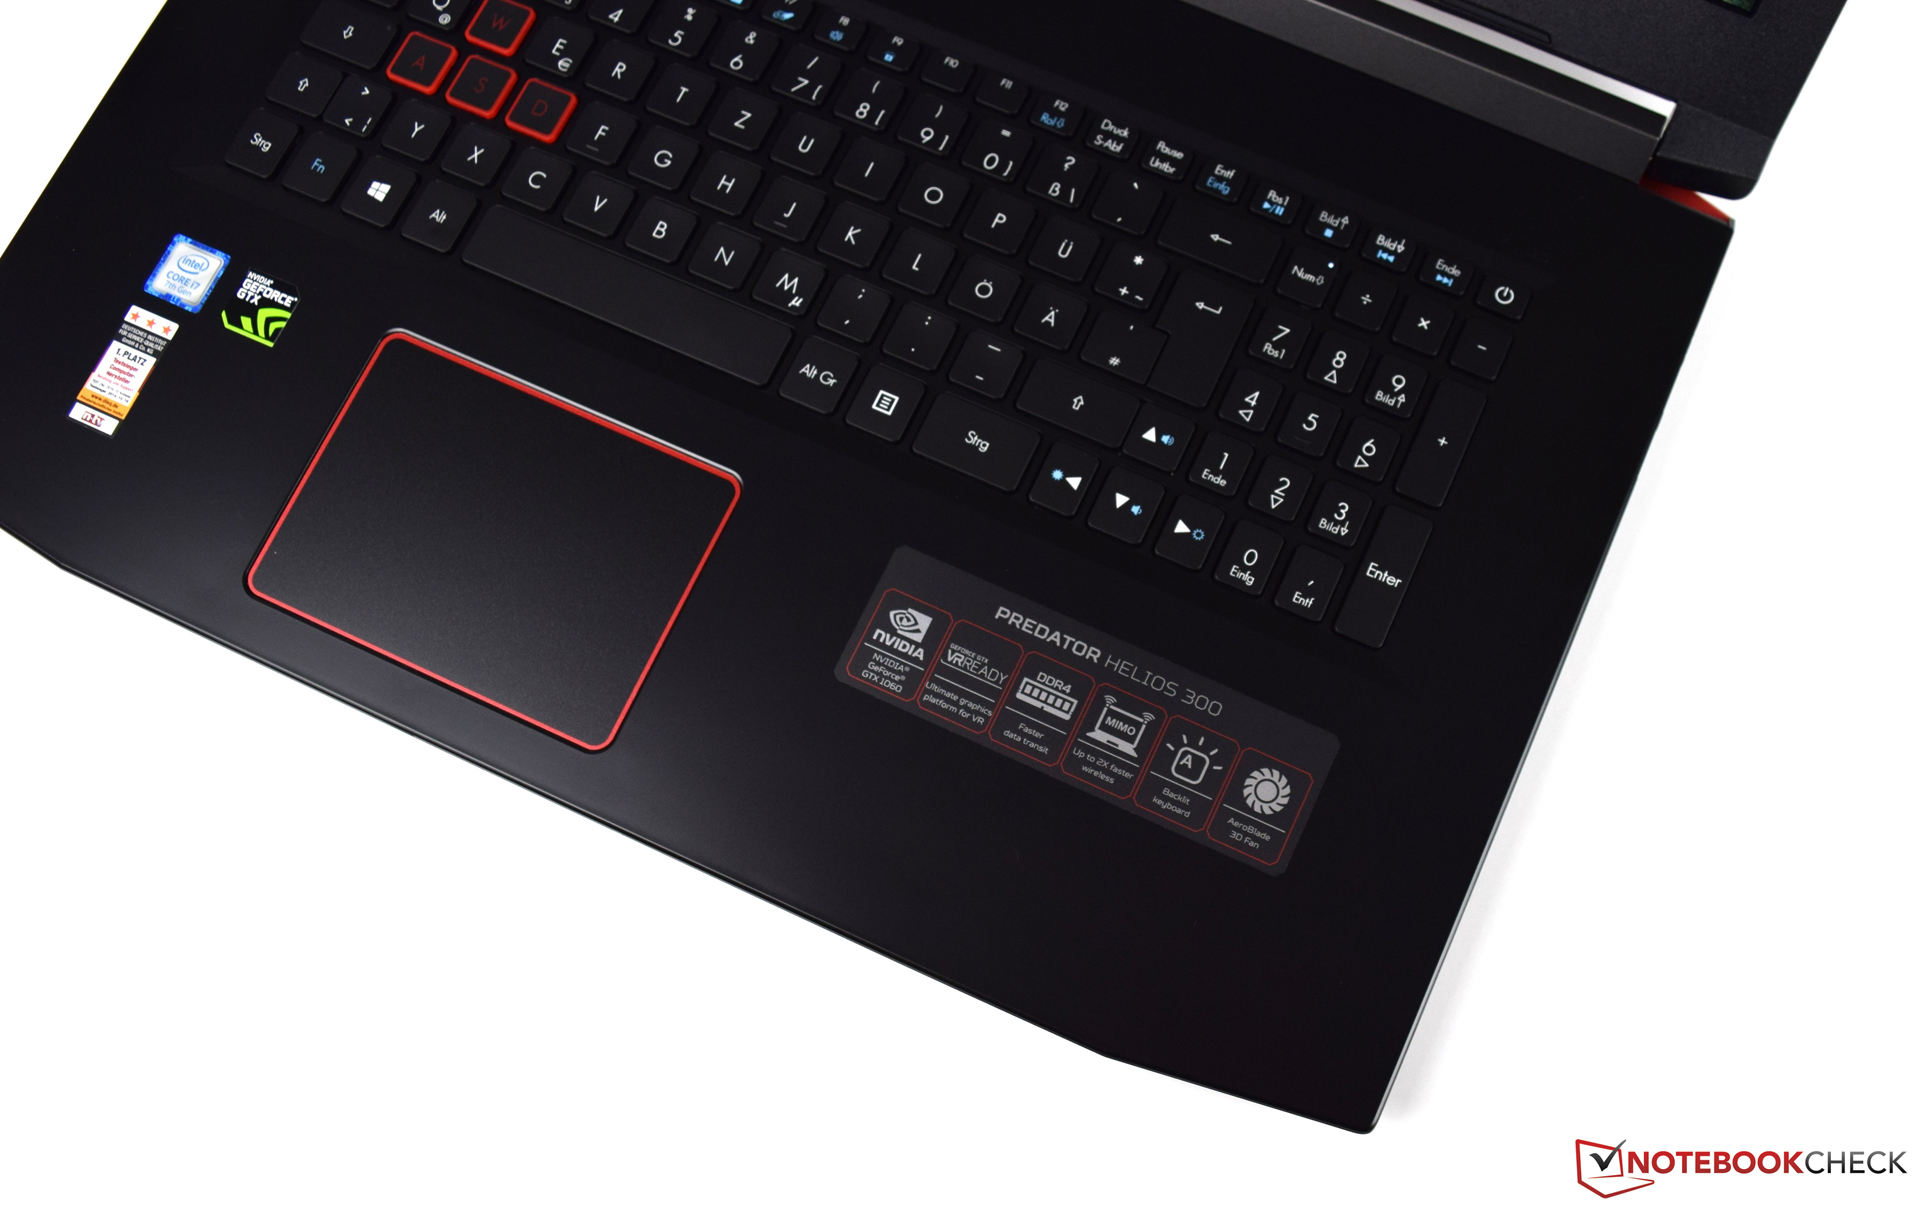
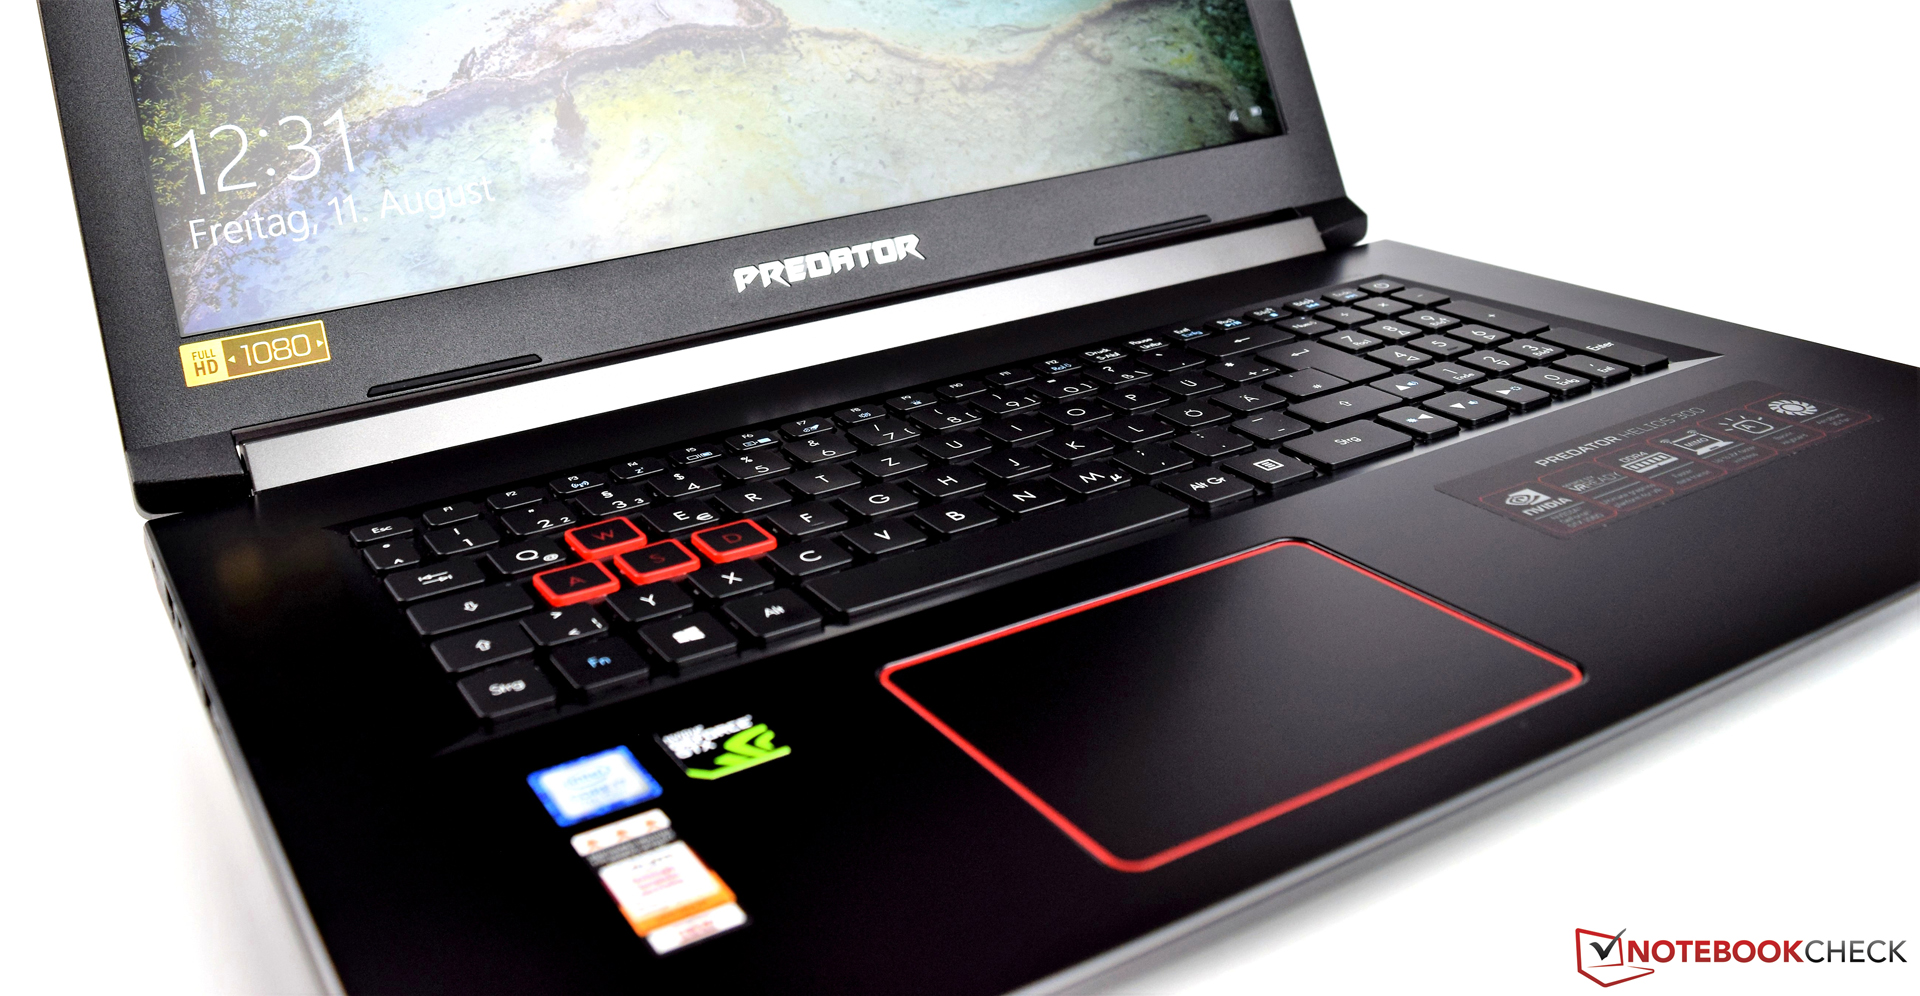
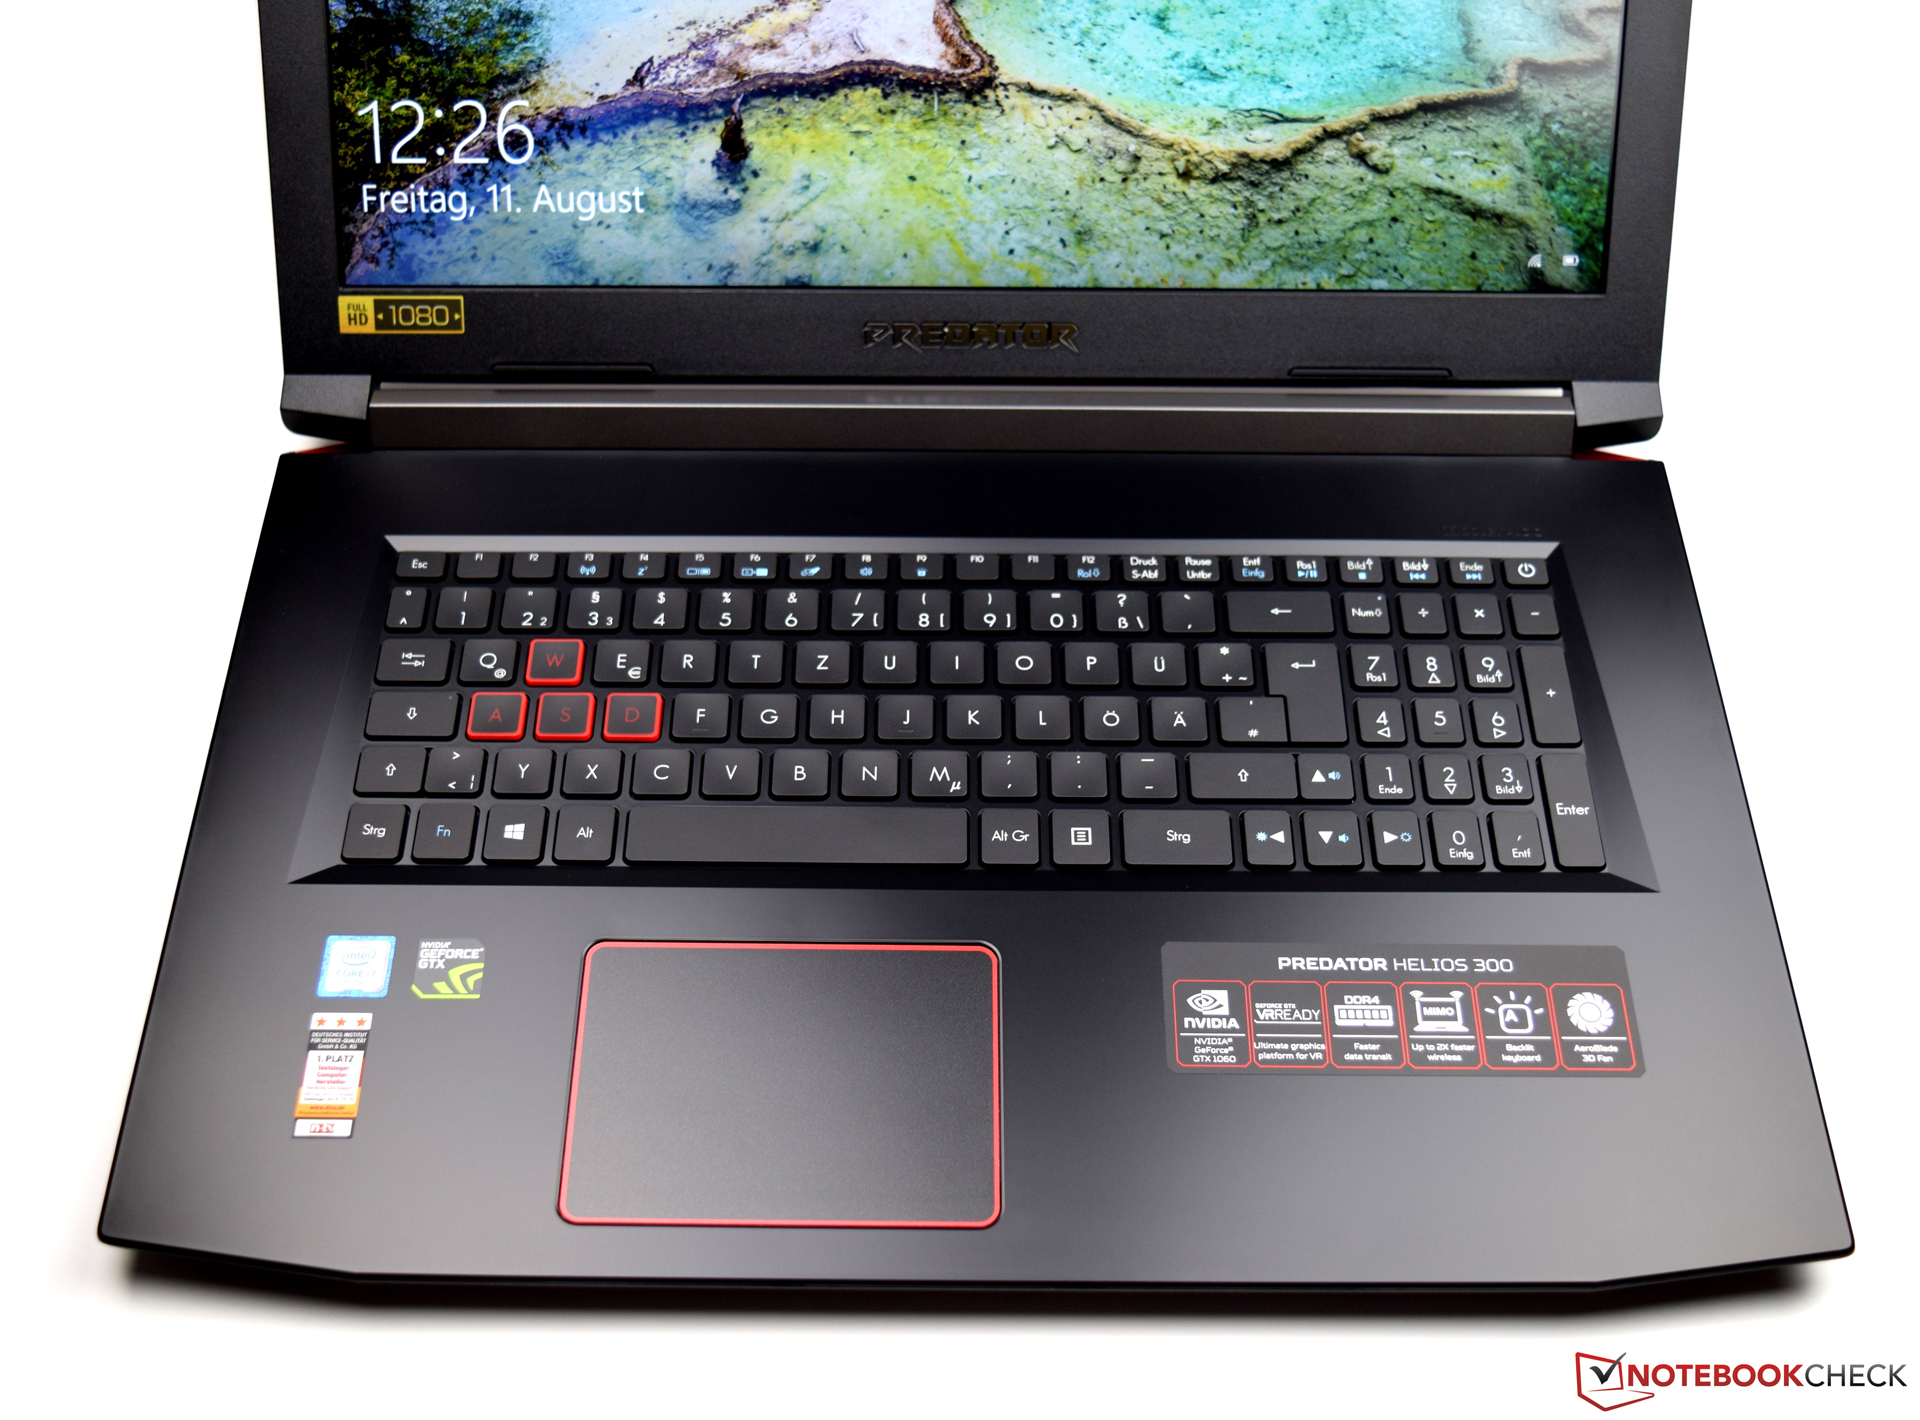
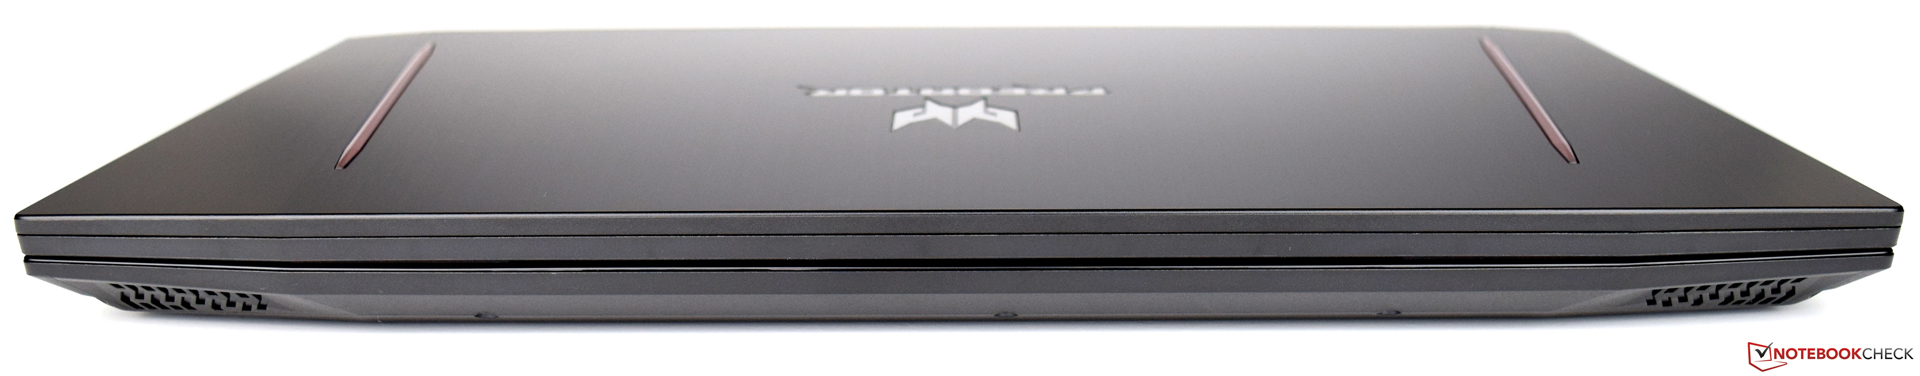
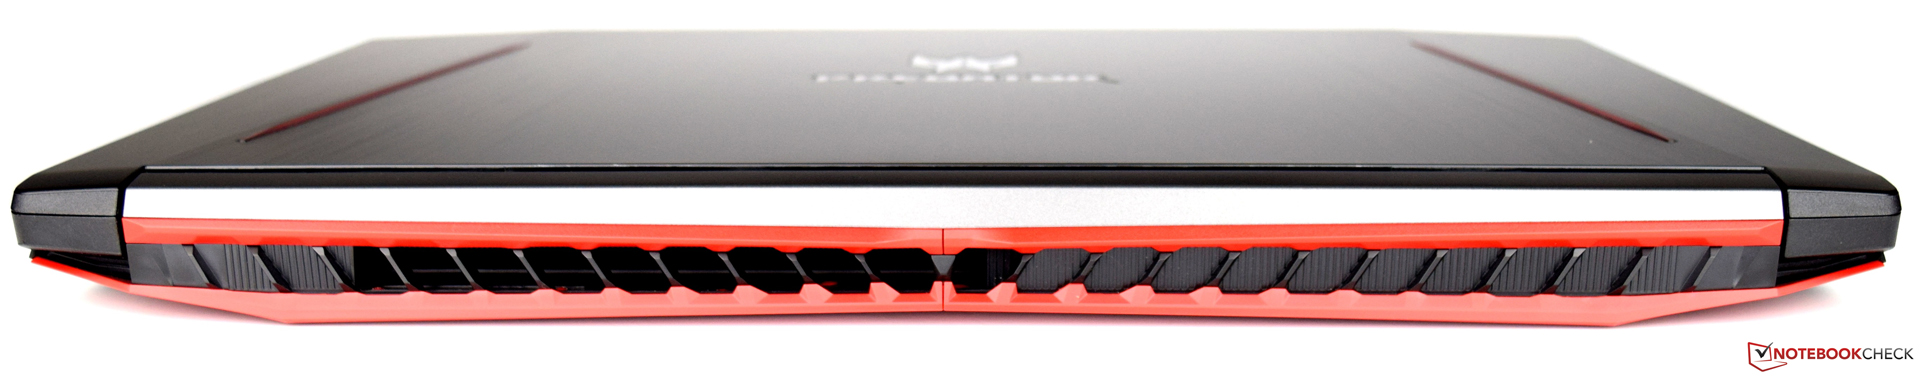
En general, el Acer Predator Helios 300 nos ha dado una buena impresión. La carcasa es muy estable a pesar de su diseño plano y la combinación de colores hace que el dispositivo sea reconocible como un Predator incluso desde lejos. Nos gustaron mucho los dispositivos de entrada, de los que no tenemos casi nada para criticar y Acer también eligió bien la pantalla.
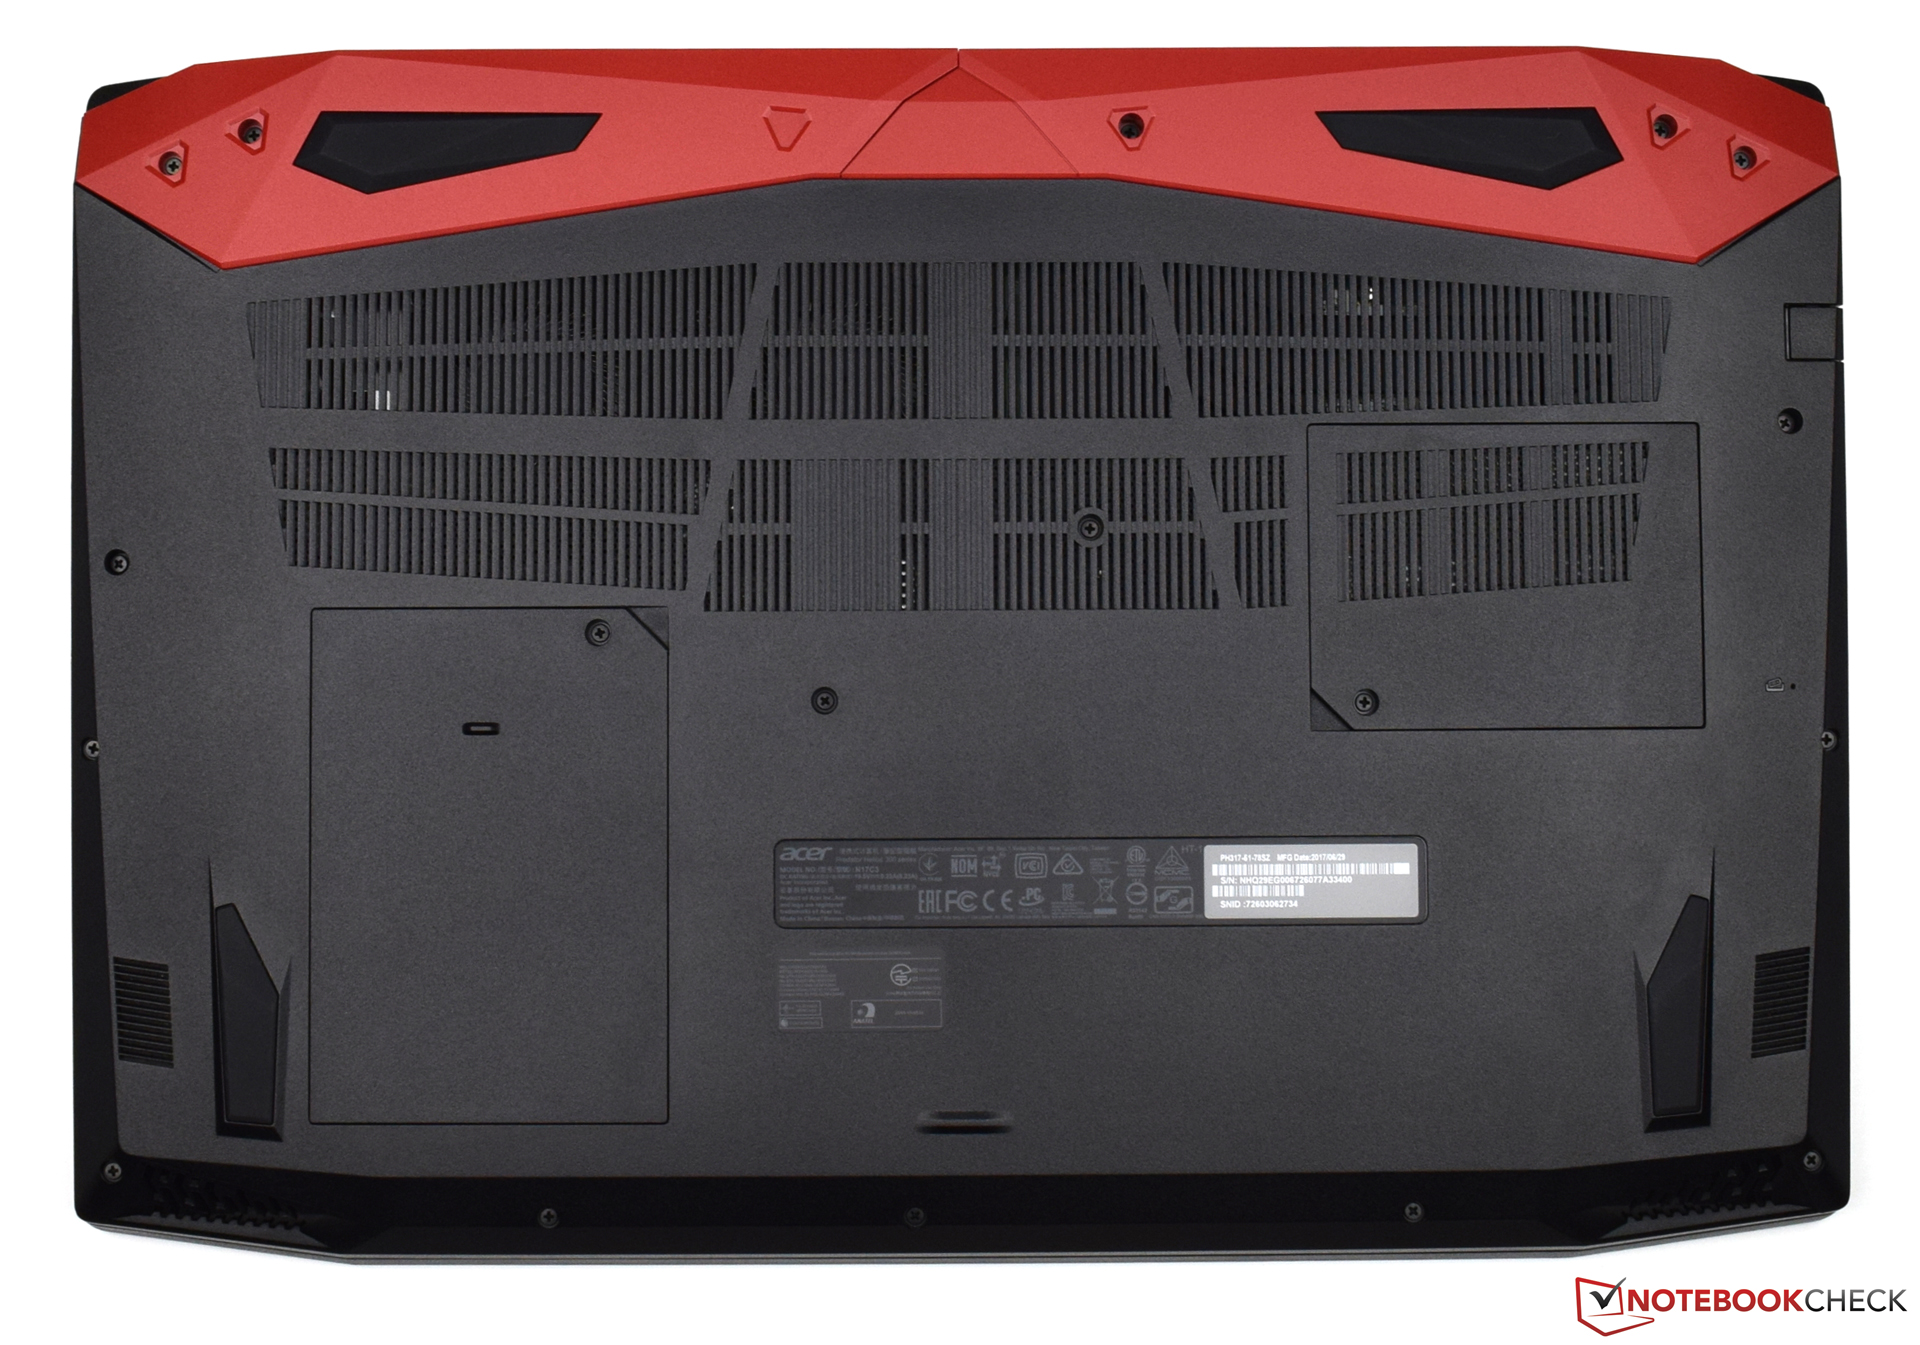
Estábamos un poco decepcionados por el sistema de sonido, que habríamos esperado encontrar en un dispositivo de oficina de gama media, no en uno gaming. El mantenimiento puede ser un poco complicado debido a las pequeñas escotillas de mantenimiento. Una más grande habría sido más adecuada.
Los compradores del Acer Predator Helios 300 se llevarán un buen rendimiento a un precio justo.
Ésta es una versión acortada del análisis original. Puedes leer el análisis completo en inglés aquí.
Acer Predator Helios 300
- 06/01/2018 v6 (old)
Sebastian Bade